
AC Power Systems Handbook, Third Edition - SESCO
405
-
Upload
khangminh22 -
Category
Documents
-
view
2 -
download
0
Transcript of AC Power Systems Handbook, Third Edition - SESCO
ACPower Systems
HandbookThird Edition
Jerry C. WhitakerTechnical Press
Morgan Hill, California
Boca Raton London New York
CRC Press is an imprint of theTaylor & Francis Group, an informa business
© 2007 by Taylor & Francis Group, LLC

4034_Discl.fm Page 1 Friday, August 25, 2006 10:06 AM
Published in 2007 byCRC PressTaylor & Francis Group 6000 Broken Sound Parkway NW, Suite 300Boca Raton, FL 33487-2742
© 2007 by Taylor & Francis Group, LLCCRC Press is an imprint of Taylor & Francis Group
No claim to original U.S. Government worksPrinted in the United States of America on acid-free paper10 9 8 7 6 5 4 3 2 1
International Standard Book Number-10: 0-8493-4034-9 (Hardcover) International Standard Book Number-13: 978-0-8493-4034-5 (Hardcover) Library of Congress Card Number 2006042620
This book contains information obtained from authentic and highly regarded sources. Reprinted material is quoted withpermission, and sources are indicated. A wide variety of references are listed. Reasonable efforts have been made to publishreliable data and information, but the author and the publisher cannot assume responsibility for the validity of all materialsor for the consequences of their use.
No part of this book may be reprinted, reproduced, transmitted, or utilized in any form by any electronic, mechanical, orother means, now known or hereafter invented, including photocopying, microfilming, and recording, or in any informationstorage or retrieval system, without written permission from the publishers.
For permission to photocopy or use material electronically from this work, please access www.copyright.com(http://www.copyright.com/) or contact the Copyright Clearance Center, Inc. (CCC) 222 Rosewood Drive, Danvers, MA01923, 978-750-8400. CCC is a not-for-profit organization that provides licenses and registration for a variety of users. Fororganizations that have been granted a photocopy license by the CCC, a separate system of payment has been arranged.
Trademark Notice: Product or corporate names may be trademarks or registered trademarks, and are used only foridentification and explanation without intent to infringe.
Library of Congress Cataloging-in-Publication Data
Whitaker, Jerry C.AC power systems / Jerry C. Whitaker.--3rd ed.
p. cm.Includes bibliographical references and index.ISBN 0-8493-4034-9 (alk. paper)1. Electric power distribution--Alternating current--Handbooks, manuals, etc. 2. Electric power
systems--Protection--Handbooks, manuals, etc. I. Title.
TK3141.W45 2006621.319’13--dc22 2006042620
Visit the Taylor & Francis Web site at http://www.taylorandfrancis.com
and the CRC Press Web site at http://www.crcpress.com
Taylor & Francis Group is the Academic Division of Informa plc.
© 2007 by Taylor & Francis Group, LLC

For Jenny and Andy,very special people
v
© 2007 by Taylor & Francis Group, LLC

Table of Contents
Preface .................................................................................................................................................xviiAbout the Author ........................................................................................................................... xix
Chapter 1 AC Power Systems 1.1 Introduction ..................................................................................................................1
1.1.1 Defining Terms ...................................................................................................11.1.2 Power Electronics ............................................................................................... 3
1.2 AC Circuit Analysis ......................................................................................................41.2.1 Power Relationship in AC Circuits ................................................................... 41.2.2 Complex Numbers ............................................................................................ 41.2.3 Phasors ................................................................................................................61.2.4 Per Unit System ..................................................................................................6
1.3 Elements of the AC Power System .............................................................................. 71.3.1 Transmission Circuits ........................................................................................ 7
1.3.1.1 Types of Conductors ............................................................................ 81.3.1.2 Overhead Conductors ........................................................................... 81.3.1.3 Underground Cables ........................................................................... 101.3.1.4 Skin Effect ........................................................................................... 10
1.3.2 Dielectrics and Insulators ................................................................................ 111.3.2.1 Insulating Liquids ............................................................................... 121.3.2.2 Insulating Solids .................................................................................. 13
1.3.3 Control and Switching Systems ...................................................................... 141.3.3.1 Fault Protection Devices .................................................................... 151.3.3.2 Lightning Arrester ............................................................................... 16
1.4 Utility AC Power System Architecture ...................................................................... 161.4.1 Power Distribution .......................................................................................... 181.4.2 Distribution Substations .................................................................................. 18
1.4.2.1 Breaker Schemes ................................................................................. 201.4.3 Voltage Analysis ................................................................................................221.4.4 High-Voltage DC Transmission ...................................................................... 22
1.4.4.1 AC vs. DC Transmission .................................................................... 241.4.4.2 DC Circuit Breakers ............................................................................ 25
1.4.5 Utility Company Interfacing ........................................................................... 261.4.5.1 Phase-to-Phase Balance ....................................................................... 27
1.4.6 Load Fault Protection ...................................................................................... 271.4.6.1 Fuses .....................................................................................................281.4.6.2 Circuit Breakers ................................................................................... 281.4.6.3 Semiconductor Fuses .......................................................................... 28
vii
© 2007 by Taylor & Francis Group, LLC

1.4.6.4 Application Considerations ................................................................ 291.4.6.5 Transient Currents .............................................................................. 291.4.6.6 Delay-Trip Considerations ................................................................. 30
1.4.7 Measuring AC Power ....................................................................................... 311.4.7.1 Digital Measurement Techniques ...................................................... 32
1.5 References ....................................................................................................................331.6 Bibliography ................................................................................................................ 34
Chapter 2 Power-Generation Systems 2.1 Introduction ................................................................................................................352.2 Fundamental Concepts .............................................................................................. 35
2.2.1 Operating Principles ........................................................................................ 352.2.2 Control Techniques .......................................................................................... 39
2.3 Power-Generating Systems ......................................................................................... 402.3.1 Fossil Fuel Power Plants .................................................................................. 402.3.2 Nuclear Power Plants ....................................................................................... 442.3.3 Hydroelectric Power Plants ............................................................................. 45
2.4 References ....................................................................................................................482.5 Bibliography ................................................................................................................48
Chapter 3 Power Factor 3.1 Introduction ................................................................................................................493.2 Fundamental Principles ............................................................................................. 493.3 PF Correction Techniques .......................................................................................... 52
3.3.1 On-Site Power Factor Correction ................................................................... 533.3.2 Shunt Reactors .................................................................................................553.3.3 Unwanted Resonance Conditions ................................................................... 553.3.4 Series Capacitor Compensation ...................................................................... 563.3.5 Static Compensation Devices .......................................................................... 57
3.4 References ....................................................................................................................583.5 Bibliography ................................................................................................................58
Chapter 4 Power Transformers 4.1 Introduction ................................................................................................................594.2 Inductive Properties ...................................................................................................59
4.2.1 Coils ..................................................................................................................604.2.2 The Toroid ........................................................................................................614.2.3 Circuit Description of Self-Inductance .......................................................... 614.2.4 Magnetic Materials ........................................................................................... 62
4.3 Basic Principles of the Transformer .......................................................................... 624.3.1 Counter-Electromotive Force .......................................................................... 684.3.2 Full Load Percent Impedance .......................................................................... 684.3.3 Design Considerations ..................................................................................... 694.3.4 The Ideal Transformer ..................................................................................... 714.3.5 Application Considerations ............................................................................. 72
4.4 Transformer Failure Modes ....................................................................................... 754.4.1 Thermal Considerations .................................................................................. 76
viii
© 2007 by Taylor & Francis Group, LLC

4.4.1.1 Life Expectancy and Temperature ..................................................... 764.4.2 Voltage Considerations .................................................................................... 764.4.3 Mechanical Considerations ............................................................................. 77
4.4.3.1 Dry-Type and Liquid-Filled Transformers ....................................... 774.4.3.2 Insulation Materials ............................................................................ 784.4.3.3 Insulating Liquids ............................................................................... 784.4.3.4 Cooling ................................................................................................79
4.5 References ....................................................................................................................794.6 Bibliography .................................................................................................................79
Chapter 5 Capacitors 5.1 Introduction ................................................................................................................815.2 Basic Principles ........................................................................................................... 81
5.2.1 Series and Parallel Connections ...................................................................... 855.2.2 Practical Capacitors ......................................................................................... 86
5.3 Capacitor Failure Modes ............................................................................................ 865.3.1 Electrolytic Capacitors ..................................................................................... 86
5.3.1.1 Mechanical Failure .............................................................................. 885.3.1.2 Temperature Cycling ........................................................................... 895.3.1.3 Electrolyte Failures .............................................................................. 89
5.3.2 Capacitor Life Span .......................................................................................... 905.3.3 Tantalum Capacitor ......................................................................................... 91
5.4 References ....................................................................................................................915.5 Bibliography ................................................................................................................92
Chapter 6 Semiconductors6.1 Introduction ................................................................................................................936.2 Semiconductor Failure Modes ................................................................................... 93
6.2.1 Device Ruggedness ........................................................................................... 936.2.2 Forward Bias Safe Operating Area .................................................................. 946.2.3 Reverse Bias Safe Operating Area ................................................................... 946.2.4 Power-Handling Capability ............................................................................. 956.2.5 Semiconductor Derating ................................................................................. 956.2.6 Failure Mechanisms ......................................................................................... 96
6.2.6.1 Avalanche Breakdown ......................................................................... 966.2.6.2 Alpha Multiplication ........................................................................... 966.2.6.3 Punch-Through ................................................................................... 966.2.6.4 Thermal Runaway ............................................................................... 97
6.3 MOSFET Devices ........................................................................................................976.3.1 Safe Operating Area ......................................................................................... 976.3.2 MOSFET Failure Modes ................................................................................ 1016.3.3 Breakdown Effects .......................................................................................... 101
6.3.3.1 Thermal Second Breakdown ............................................................ 1026.3.3.2 Metallization Failure ......................................................................... 1026.3.3.3 Polarity Reversal ................................................................................ 102
6.4 Thyristor Components ............................................................................................. 1036.4.1 Failure Modes .................................................................................................1046.4.2 Application Considerations ........................................................................... 104
ix
© 2007 by Taylor & Francis Group, LLC

6.5 ESD Failure Modes ...................................................................................................1046.5.1 Failure Mechanisms ....................................................................................... 105
6.5.1.1 Latent Failures ................................................................................... 1076.5.1.2 Case in Point ..................................................................................... 107
6.6 Semiconductor Development .................................................................................. 1076.6.1 Failure Analysis .............................................................................................. 1086.6.2 Chip Protection .............................................................................................. 111
6.7 Effects of Arcing .......................................................................................................1116.7.1 Insulation Breakdown .................................................................................... 112
6.8 References ..................................................................................................................1126.9 Bibliography ..............................................................................................................112
Chapter 7 Rectifier and Filter Circuits 7.1 Introduction ...............................................................................................................1157.2 Power Rectifiers ........................................................................................................116
7.2.1 Operating Rectifiers in Series ........................................................................ 1167.2.2 Operating Rectifiers in Parallel ..................................................................... 1177.2.3 Silicon Avalanche Rectifiers ........................................................................... 1187.2.4 Single-Phase Rectifier Configurations .......................................................... 119
7.2.4.1 Half-Wave Rectifier ........................................................................... 1197.2.4.2 Full-Wave Rectifier ............................................................................ 1207.2.4.3 Bridge Rectifier .................................................................................. 1217.2.4.4 Voltage Multiplier ............................................................................. 122
7.2.5 Polyphase Rectifier Circuits ........................................................................... 122
7.3 Power Supply Filter Circuits .................................................................................... 1257.3.1 Inductive Input Filter .................................................................................... 1257.3.2 Capacitive Input Filter ................................................................................... 127
7.4 References ..................................................................................................................1297.5 Bibliography ..............................................................................................................129
Chapter 8 Power Electronics8.1 Introduction ..............................................................................................................1318.2 Thyristor Devices ......................................................................................................131
8.2.1 Thyristor Servo Systems ................................................................................ 1328.2.1.1 Inductive Loads ................................................................................. 1338.2.1.2 Applications ....................................................................................... 1348.2.1.3 Triggering Circuits ............................................................................ 1378.2.1.4 Control Flexibility ............................................................................. 139
8.2.2 Gate Turn-Off Thyristor ................................................................................ 1398.2.3 Reverse-Conducting Thyristor ...................................................................... 1398.2.4 Asymmetrical Silicon-Controlled Rectifier .................................................. 1408.2.5 Fusing ..............................................................................................................140
8.3 Power Transistors ......................................................................................................1408.3.1 Power MOSFET .............................................................................................. 141
8.3.1.1 Rugged MOSFET .............................................................................. 1418.3.2 Insulated-Gate Bipolar Transistor ................................................................. 1428.3.3 MOS-Controlled Thyristor ........................................................................... 143
8.4 References ..................................................................................................................143
x
© 2007 by Taylor & Francis Group, LLC

8.5 Bibliography ..............................................................................................................143
Chapter 9 Origins of AC Line Disturbances 9.1 Introduction ..............................................................................................................1459.2 Naturally Occurring Disturbances .......................................................................... 145
9.2.1 Sources of Atmospheric Energy .................................................................... 1459.2.2 Characteristics of Lightning .......................................................................... 147
9.2.2.1 Cloud-to-Cloud Activity .................................................................. 1499.2.3 Lightning Protection ...................................................................................... 150
9.2.3.1 Protection Area ................................................................................. 1519.2.4 Electrostatic Discharge ................................................................................... 153
9.2.4.1 Triboelectric Effect ............................................................................ 1549.2.5 EMP Radiation ............................................................................................... 1559.2.6 Coupling Transient Energy ........................................................................... 156
9.3 Equipment-Caused Transient Disturbances ........................................................... 1579.3.1 Utility System Faults ...................................................................................... 1589.3.2 Switch Contact Arcing ................................................................................... 1589.3.3 Telephone System Transients ........................................................................ 1599.3.4 Nonlinear Loads and Harmonic Energy ...................................................... 161
9.3.4.1 Harmonic Sources ............................................................................ 1649.3.5 Carrier Storage ............................................................................................... 1659.3.6 Transient-Generated Noise ............................................................................ 166
9.3.6.1 ESD Noise .......................................................................................... 1669.3.6.2 Contact Arcing .................................................................................. 1669.3.6.3 SCR Switching ................................................................................... 166
9.4 References ..................................................................................................................1679.5 Bibliography ..............................................................................................................167
Chapter 10 Power Disturbance Characterization 10.1 Introduction .............................................................................................................. 16910.2 Standards of Measurement ...................................................................................... 170
10.2.1 Assessing the Threat .................................................................................. 17310.2.2 Fundamental Measurement Techniques .................................................. 173
10.2.2.1 Root-Mean-Square ................................................................. 17310.2.2.2 Average-Response Measurement ........................................... 17410.2.2.3 Peak-Response Measurement ................................................ 17410.2.2.4 Meter Accuracy ....................................................................... 176
10.2.3 Digital Measurement Instruments ............................................................ 17710.2.4 Digital Monitor Features ........................................................................... 178
10.3 Reliability Considerations ........................................................................................ 17910.4 References ..................................................................................................................17910.5 Bibliography .............................................................................................................. 179
Chapter 11 Power System Protection Methods 11.1 Introduction ..............................................................................................................18111.2 The Key Tolerance Envelope .................................................................................... 18111.3 Assessing the Lightning Hazard .............................................................................. 18311.4 FIPS Publication 94 ..................................................................................................18411.5 Protection Alternatives ............................................................................................. 185
xi
© 2007 by Taylor & Francis Group, LLC

11.5.1 Specifying System-Protection Hardware .................................................. 187
11.6 References ..................................................................................................................18911.7 Bibliography .............................................................................................................. 189
Chapter 12 Motor-Generator Set 12.1 Introduction .............................................................................................................. 19112.2 System Configuration ............................................................................................... 191
12.2.1 Motor Design Considerations ................................................................... 19412.2.1.1 Single-Shaft Systems ............................................................... 195
12.2.2 Flywheel Considerations ........................................................................... 19612.2.3 Maintenance Considerations .................................................................... 19712.2.4 Motor-Generator UPS ............................................................................... 19712.2.5 Kinetic Battery Storage System ................................................................. 199
12.3 References ..................................................................................................................20112.4 Bibliography .............................................................................................................. 201
Chapter 13 Uninterruptible Power Systems 13.1 Introduction ..............................................................................................................20313.2 UPS Configuration ...................................................................................................203
13.2.1 Power-Conversion Methods ..................................................................... 20513.2.1.1 Ferroresonant Inverter ........................................................... 20513.2.1.2 Delta Magnetic Inverter ......................................................... 20613.2.1.3 Inverter-Fed L/C Tank ........................................................... 20713.2.1.4 Quasi-Square Wave Inverter .................................................. 20713.2.1.5 Step Wave Inverter ................................................................. 20913.2.1.6 Pulse-Width Modulation Inverter ......................................... 20913.2.1.7 Phase Modulation Inverter .................................................... 209
13.2.2 Redundant Operation ................................................................................ 20913.2.3 Output Transfer Switch ............................................................................. 21213.2.4 Battery Supply ............................................................................................ 213
13.3 References ..................................................................................................................21313.4 Bibliography .............................................................................................................. 213
Chapter 14 Power Conditioning Devices 14.1 Introduction .............................................................................................................. 21514.2 Ferroresonant Transformer ...................................................................................... 215
14.2.1 Magnetic-Coupling-Controlled Voltage Regulator ................................. 216
14.3 Isolation Transformer ............................................................................................... 21714.3.1 Tap-Changing Regulator ........................................................................... 219
14.3.1.1 Variable Ratio Regulator ........................................................ 22014.3.2 Variable Voltage Transformer .................................................................. 221
14.3.2.1 Brush Type .............................................................................. 22214.3.2.2 Induction Type ....................................................................... 222
14.4 Line Conditioner ......................................................................................................22214.4.1 Hybrid Transient Suppressor .................................................................... 22414.4.2 Active Power-Line Conditioner ................................................................ 224
14.4.2.1 Application Considerations ................................................... 226
14.5 References ..................................................................................................................22614.6 Bibliography .............................................................................................................. 226
xii
© 2007 by Taylor & Francis Group, LLC

Chapter 15 Transient-Suppression Devices15.1 Introduction .............................................................................................................. 22715.2 Filter Devices .............................................................................................................22715.3 Crowbar Devices .......................................................................................................229
15.3.1 Characteristics of Arcs ............................................................................... 229
15.4 Voltage-Clamping Devices ....................................................................................... 22915.4.1 Zener Components .................................................................................... 23415.4.2 Hybrid Suppression Circuits ..................................................................... 237
15.5 Selecting Protection Components ........................................................................... 23815.6 References ..................................................................................................................23815.7 Bibliography .............................................................................................................. 239
Chapter 16 Facility Wiring and Transient Protection 16.1 Introduction ..............................................................................................................24116.2 Facility Wiring ..........................................................................................................241
16.2.1 Utility Service Entrance ............................................................................. 243
16.3 Power-System Protection ......................................................................................... 24516.3.1 Staging ........................................................................................................24516.3.2 Design Cautions ......................................................................................... 248
16.3.2.1 Specifications .......................................................................... 24816.3.3 Single-Phasing ............................................................................................ 24916.3.4 Surge Suppressor Selection ....................................................................... 249
16.4 References ..................................................................................................................25116.5 Bibliography .............................................................................................................. 251
Chapter 17 Circuit-Level Transient Suppression 17.1 Introduction ..............................................................................................................25317.2 Protecting Low-Voltage Supplies ............................................................................. 25317.3 Protecting High-Voltage Supplies ............................................................................ 25317.4 RF System Protection ............................................................................................... 25717.5 Protecting Logic Circuits ......................................................................................... 25717.6 Protecting Telco Lines .............................................................................................. 25817.7 Inductive Load Switching ........................................................................................ 26117.8 Bibliography .............................................................................................................. 261
Chapter 18 Grounding Practices18.1 Introduction ..............................................................................................................263
18.1.1 Terms and Codes ....................................................................................... 263
18.2 The Need for Grounding ......................................................................................... 26318.2.1 Equipment Grounding .............................................................................. 26418.2.2 System Grounding ..................................................................................... 26418.2.3 The Grounding Electrode .......................................................................... 26718.2.4 Earth Electrode .......................................................................................... 268
18.3 Establishing an Earth Ground ................................................................................. 26818.3.1 Grounding Interface .................................................................................. 268
18.3.1.1 Ground Electrode Testing ...................................................... 27318.3.2 Chemical Ground Rods ............................................................................. 27318.3.3 Ufer Ground System .................................................................................. 27418.3.4 Bonding Ground-System Elements .......................................................... 277
xiii
© 2007 by Taylor & Francis Group, LLC

18.3.5 Exothermic Bonding .................................................................................. 27718.3.6 Ground-System Inductance ...................................................................... 278
18.4 References ..................................................................................................................28018.5 Bibliography .............................................................................................................. 281
Chapter 19 Grounding Tower Elements19.1 Introduction ..............................................................................................................28319.2 Ground-Wire Dressing ............................................................................................. 28319.3 Facility Ground Interconnection ............................................................................. 284
19.3.1 Personnel Protection ................................................................................. 285
19.4 Grounding on Bare Rock ......................................................................................... 28819.4.1 Rock-Based Radial Elements ..................................................................... 288
19.5 Transmission-System Grounding ............................................................................ 28919.5.1 Transmission Line ..................................................................................... 28919.5.2 Cable Considerations ................................................................................ 28919.5.3 Satellite Antenna Grounding .................................................................... 290
19.6 References ..................................................................................................................292
Chapter 20 Facility Ground-System Design20.1 Introduction ..............................................................................................................29320.2 Bulkhead Grounding ................................................................................................293
20.2.1 Bulkhead Panel .......................................................................................... 29720.2.2 Lightning Protectors .................................................................................. 299
20.2.2.1 Typical Installation ................................................................. 30020.2.3 Checklist for Proper Grounding ............................................................... 302
20.3 AC System Grounding Practices .............................................................................. 30320.3.1 Building Codes ........................................................................................... 303
20.3.1.1 Single-Point Ground .............................................................. 30420.3.2 Isolated Grounding .................................................................................... 30420.3.3 Separately Derived Systems ....................................................................... 30520.3.4 Grounding Terminology ........................................................................... 30520.3.5 Facility Ground System ............................................................................. 306
20.3.5.1 Grounding Conductor Size .................................................... 30920.3.5.2 High-Frequency Effects .......................................................... 311
20.3.6 Power-Center Grounding ......................................................................... 31120.3.6.1 Isolation Transformers ........................................................... 313
20.4 Grounding Equipment Racks .................................................................................. 31420.5 Grounding Signal Cables ......................................................................................... 316
20.5.1 Analyzing Noise Currents ......................................................................... 31620.5.2 Types of Noise ............................................................................................ 31720.5.3 Noise Control ............................................................................................. 318
20.6 Patch-Bay Grounding ............................................................................................... 32020.7 Cable Routing ...........................................................................................................321
20.7.1 Overcoming Ground-System Problems ................................................... 322
20.8 References ..................................................................................................................32220.9 Bibliography .............................................................................................................. 322
Chapter 21 Standby Power Systems 21.1 Introduction ..............................................................................................................325
xiv
© 2007 by Taylor & Francis Group, LLC
21.1.1 Blackout Effects .......................................................................................... 325
21.2 Standby Power Options ............................................................................................ 32621.2.1 Dual-Feeder System ................................................................................... 32621.2.2 Peak Power Shaving ................................................................................... 32821.2.3 Advanced System Protection .................................................................... 32921.2.4 Choosing a Generator ................................................................................ 329
21.2.4.1 Generator Types ...................................................................... 33221.2.5 UPS Systems ............................................................................................... 33321.2.6 Standby Power-System Noise ................................................................... 33321.2.7 Batteries ......................................................................................................334
21.2.7.1 Terms ....................................................................................... 33421.2.7.2 Sealed Lead-Acid Battery ........................................................ 335
21.3 References ..................................................................................................................33621.4 Bibliography .............................................................................................................. 336
Chapter 22 Designing for Fault-Tolerance22.1 Introduction ..............................................................................................................33722.2 Critical System Bus ...................................................................................................337
22.2.1 Power-Distribution Options ..................................................................... 33822.2.2 Plant Configuration ................................................................................... 340
22.3 Plant Maintenance ....................................................................................................34122.3.1 Switchgear Maintenance ........................................................................... 34222.3.2 Ground-System Maintenance ................................................................... 342
22.4 References ..................................................................................................................34422.5 Bibliography ............................................................................................................... 344
Chapter 23 The Efficient Use of Energy 23.1 Introduction ..............................................................................................................34523.2 Energy Usage .............................................................................................................34523.3 Peak Demand ............................................................................................................34623.4 Load Factor ...............................................................................................................34723.5 Power Factor ..............................................................................................................34723.6 References ..................................................................................................................34923.7 Bibliography .............................................................................................................. 349
Chapter 24 Safety and Protection Systems 24.1 Introduction ..............................................................................................................351
24.1.1 Facility Safety Equipment.......................................................................... 351
24.2 Electric Shock ...........................................................................................................35324.2.1 Effects on the Human Body ...................................................................... 35324.2.2 Circuit-Protection Hardware .................................................................... 35524.2.3 Working with High Voltage ...................................................................... 35824.2.4 First Aid Procedures .................................................................................. 358
24.2.4.1 Shock in Progress .................................................................... 36024.2.4.2 Shock No Longer in Progress ................................................. 360
24.3 Polychlorinated Biphenyls ........................................................................................ 36124.3.1 Health Risk .................................................................................................36124.3.2 Governmental Action ................................................................................ 36224.3.3 PCB Components ...................................................................................... 362
xv
© 2007 by Taylor & Francis Group, LLC
24.3.4 Identifying PCB Components ................................................................... 36424.3.5 Labeling PCB Components ....................................................................... 36424.3.6 Record-Keeping ......................................................................................... 36524.3.7 Disposal ...................................................................................................... 36624.3.8 Proper Management .................................................................................. 366
24.4 OSHA Safety Requirements ..................................................................................... 36724.4.1 Protective Covers ....................................................................................... 36824.4.2 Identification and Marking ....................................................................... 36824.4.3 Extension Cords ......................................................................................... 36824.4.4 Grounding ..................................................................................................36824.4.5 Management Responsibility ...................................................................... 369
24.5 References ..................................................................................................................37124.6 Bibliography .............................................................................................................. 371
Chapter 25 Reference Data and Tables 25.1 Standard Electrical Units ......................................................................................... 373
25.1.1 Standard Prefixes ....................................................................................... 37425.1.2 Common Standard Units .......................................................................... 375
25.2 Reference Tables ........................................................................................................37625.2.1 Power Conversion Factors ........................................................................ 37625.2.2 Standing Wave Ratio ................................................................................. 37725.2.3 Specifications of Standard Copper Wire Sizes ......................................... 37825.2.4 Celsius-to-Fahrenheit Conversion Table ................................................. 37925.2.5 Inch-to-Millimeter Conversion Table ...................................................... 38025.2.6 Conversion of Millimeters to Decimal Inches ......................................... 38125.2.7 Conversion of Common Fractions to Decimal and Millimeter Units .... 38225.2.8 Decimal Equivalent Size of Drill Numbers .............................................. 38325.2.9 Decimal Equivalent Size of Drill Letters ................................................... 383
25.2.10 Conversion Ratios for Length ................................................ 38425.2.11 Conversion Ratios for Area .................................................... 38425.2.12 Conversion Ratios for Mass ................................................... 38525.2.13 Conversion Ratios for Volume .............................................. 38525.2.14 Conversion Ratios for Cubic Measure ................................... 38625.2.15 Conversion Ratios for Electrical Quantities .......................... 386
Chapter 26 Units Conversion Table26.1 Quantity Conversion ................................................................................................387
© 2007 by Taylor & Francis Group, LLC

Preface
Disturbances on the ac power line are what headaches are made of. Outages, surges, sags, transients: theycombine to create an environment that can damage or destroy sensitive load equipment. They can takeyour system down and leave you with a complicated and expensive repair job.
Ensuring that the equipment at your facility receives clean ac power has always been important. Butnow, with computers integrated into a wide variety of electronic products, the question of ac powerquality is more critical than ever. The computer-based systems prevalent today can garble or lose databecause of power-supply disturbances or interruptions. And if the operational problems are not enough,there is the usually difficult task of equipment troubleshooting and repair that follows a utility systemfault.
This book examines the key elements of ac power use for commercial and industrial customers. Theroots of ac power-system problems are identified, and effective solutions are detailed. The book followsa logical progression from generating ac energy to the protection of life and property. General topicsinclude:
• Power-System Operation. Every electronic installation requires a steady supply of clean power tofunction properly. The ac power line into a facility is, in fact, the lifeblood of any operation. It is also,however, a frequent source of equipment malfunctions and component failures. This book details theprocess of generating ac energy and distributing it to end-users. The causes of power-system distur-bances are detailed, and the characteristics of common fault conditions are outlined.
• Protecting Equipment Loads. Power quality is a moving target. Utility companies work hard to main-tain acceptable levels of performance. However, the wide variety of loads and unpredictable situationsmake this job difficult. Users cannot expect power suppliers to solve all their problems. Responsibilityfor protecting sensitive loads clearly rests with the end-user. Several chapters are devoted to thisimportant topic. Power-system protection options are outlined, and their relative benefits discussed.Evaluating the many tradeoffs involved in protection system design requires a thorough knowledge ofthe operating principles.
• How Much Protection? The degree of protection afforded a facility is generally a compromisebetween the line abnormalities that will account for most of the expected problems and the amount ofmoney available to spend on that protection. Each installation is unique and requires an assessment ofthe importance of keeping the system up and running at all times, as well as the threat of disturbancesposed by the ac feed to the plant. The author firmly believes that the degree of protection provided apower-distribution system should match the threat of system failure. In this publication, all alterna-tives are examined with an eye toward deciding how much protection really is needed, and how muchmoney can be justified for ac protection hardware.
• Grounding. The attention given to the design and installation of a facility ground system is a key ele-ment in the day-to-day reliability of any plant. A well-planned ground network is invisible to the
xvii
© 2007 by Taylor & Francis Group, LLC

engineering staff. A marginal ground system, however, will cause problems on a regular basis. Although most engineers view grounding primarily as a method to protect equipment from damage or malfunction, the most important element is operator safety. The 120 V or 208 V ac line current that powers most equipment can be dangerous — even deadly — if improperly handled. Grounding of equipment and structures provides protection against wiring errors or faults that could endanger human life. Grounding concepts and practices are examined in detail. Clear, step-by-step guidelines are given for designing and installing an effective ground system to achieve good equipment perfor-mance, and to provide for operator safety.
• Standby Power. Blackouts are, without a doubt, the most troublesome utility company problem that a facility will have to deal with. Statistics show that power failures are, generally speaking, a rare occur-rence in most areas of the country. They also are usually short in duration. Typical failure rates are not normally cause for alarm to commercial users, except where computer-based operations, transporta-tion control systems, medical facilities, and communications sites are concerned. When the continuity of operation is critical, redundancy must be carried throughout the system. All of the practical standby power systems are examined in this book. The advantages and disadvantages of each approach are given, and examples are provided of actual installations.
• Safety. Safety is critically important to engineering personnel who work around powered hardware, and who may work under time pressures. Safety is not something to be taken lightly. The voltages con-tained in the ac power system are high enough to kill through electrocution. The author takes safety seriously. A full chapter is devoted to the topic. Safety requires not only the right equipment, but oper-ator training as well. Safety is, in the final analysis, a state of mind.
The utility company ac feed contains not only the 60 Hz power needed to run the facility, but also a variety of voltage disturbances, which can cause problems ranging from process control interruptions to life-threatening situations. Protection against ac line disturbances is a science that demands attention to detail. This work is not inexpensive. It is not something that can be accomplished overnight. Facilities will, however, wind up paying for protection one way or another, either before or after problems occur. Power protection is a systems problem that extends from the utility company ac input to the circuit boards in each piece of hardware. There is nothing magical about effective systems protection. Distur-bances on the ac line can be suppressed if the protection method used has been designed carefully and installed properly. That is the goal of this book.
Jerry C. Whitaker
xviii
© 2007 by Taylor & Francis Group, LLC

About the Author
Jerry C. Whitaker is vice president of standards development at the Advanced Television Systems Commit-tee (ATSC). Mr. Whitaker supports the work of the various ATSC technology and planning committees andassists in the development of ATSC standards, recommended practices, and related documents. ATSC is aninternational, nonprofit organization developing voluntary standards for digital television.
Mr. Whitaker is a fellow of the Society of Broadcast Engineers and an SBE-certified professional broad-cast engineer. He is also a fellow of the Society of Motion Picture and Television Engineers, and a member ofthe Institute of Electrical and Electronics Engineers.
Mr. Whitaker has been involved in various aspects of the electronics industry for over 30 years. CurrentCRC book titles include:
• The Electronics Handbook, 2nd edition• Electronic System Maintenance Handbook, 2nd edition• Power Vacuum Tubes Handbook, 2nd edition• The RF Transmission Systems Handbook• Microelectronics, 2nd edition
Mr. Whitaker has lectured extensively on the topic of electronic systems design, installation, and mainte-nance. He is the former editorial director and associate publisher of Broadcast Engineering and Video Systemsmagazines, and a former radio station chief engineer and television news producer.
Mr. Whitaker has twice received a Jesse H. Neal Award Certificate of Merit from the Association of Busi-ness Publishers for editorial excellence. He has also been recognized as educator of the year by the Society ofBroadcast Engineers.
Mr. Whitaker resides in Morgan Hill, California.
© 2007 by Taylor & Francis Group, LLC

1
1
AC Power Systems
1.1 Introduction
Every electronic installation requires a steady supply of clean power to function properly. Recent advancesin technology have made the question of alternating current (ac) power quality even more important, asmicrocomputers are integrated into a wide variety of electronic products.
When the subject of power quality is discussed, the mistaken assumption is often made that the topiconly has to do with computers. At one time this may have been true, because data processing (DP) centerswere among the first significant loads that did not always operate reliably on the raw power received fromthe serving electrical utility. With the widespread implementation of control by microprocessor-based sin-gle-board computers (or single-chip computers), however, there is a host of equipment that now operates atvoltage levels and clock speeds similar to that of the desktop or mainframe computer. Equipment as diverseas electronic instrumentation, cash registers, scanners, motor drives, and television sets all depend upononboard computers to give them instructions. Thus, the quality of the power this equipment receives is asimportant as that supplied to a data processing center. The broader category, which covers all such equip-ment, including computers, is perhaps best described as
sensitive electronic equipment
.The heart of the problem that seems to have suddenly appeared is that although the upper limit of cir-
cuit speed of modern digital devices is continuously being raised, the logic voltages have simultaneouslybeen reduced. Such a relationship is not accidental. As more transistors and other devices are packedtogether onto the same surface area, the spacing between them is necessarily reduced. This reduced distancebetween components tends to lower the time the circuit requires to perform its designed function. A reduc-tion in the operating voltage level is a necessary — and from the standpoint of overall performance, particu-larly heat dissipation, desirable — by-product of the shrinking integrated circuit (IC) architectures.
The ac power line into a facility is, of course, the lifeblood of any operation. It is also, however, a fre-quent source of equipment malfunctions and component failures. The utility company ac feed contains notonly the 60 Hz power needed to run the facility, but also a variety of voltage sags, surges, and transients.These abnormalities cause different problems for different types of equipment.
1.1.1 Defining Terms
To explain the ac power-distribution system, and how to protect sensitive loads from damage resulting fromdisturbances, it is necessary first to define key terms:•
active filter
. A switching power processor connected between the line and a nonlinear load, with the pur-pose of reducing the harmonic currents generated by the load.
•
alternator
. An ac generator.•
boost rectifier
. An unfiltered rectifier with a voltage-boosting direct current (dc)/dc converter between it and the load that shapes the line current to maintain low distortion.
•
circular mil
. The unit of measurement for current-carrying conductors. One mil is equal to 0.001 in. (0.025 mm). One circular mil is equal to a circle with a diameter of 0.001 in. The area of a circle with a 1-in. diameter is 1,000,000 circular mils.
•
common-mode noise
. Unwanted signals in the form of voltages appearing between the local ground refer-ence and each of the power conductors, including neutral and the equipment ground.
•
cone of protection
(lightning). The space enclosed by a cone formed with its apex at the highest point of a lightning rod or protecting tower, the diameter of the base of the cone having a definite relationship to
4034_C001.fm Page 1 Monday, August 28, 2006 8:23 AM
© 2007 by Taylor & Francis Group, LLC

2
AC Power Systems Handbook
the height of the rod or tower. When overhead ground wires are used, the space protected is referredto as a
protected zone
.•
cosmic rays
. Charged particles (ions) emitted by all radiating bodies in space.•
Coulomb
. A unit of electric charge. The coulomb is the quantity of electric charge that passes the cross section of a conductor when the current is maintained constant at 1 A.
•
counter-electromotive force
. The effective electromotive force within a system that opposes the passage of current in a specified direction.
•
counterpoise
. A conductor or system of conductors arranged (typically) below the surface of the earth and connected to the footings of a tower or pole to provide grounding for the structure.
•
demand meter
. A measuring device used to monitor the power demand of a system; it compares the peak power of the system with the average power.
•
dielectric
(ideal). An insulating material in which all of the energy required to establish an electric field in the dielectric is recoverable when the field or impressed voltage is removed. A perfect dielectric haszero conductivity, and all absorption phenomena are absent. A complete vacuum is the only knownperfect dielectric.
•
eddy currents
. The currents that are induced in the body of a conducting mass by the time variations of magnetic flux.
•
efficiency
(electric equipment). Output power divided by input power, expressed as a percentage.•
electromagnetic compatibility
(EMC). The ability of a device, piece of equipment, or system to func-tion satisfactorily in its electromagnetic environment without introducing intolerable electromagneticdisturbances.
•
generator
. A machine that converts mechanical power into electrical power. (In this book, the terms
alternator
and
generator
will be used interchangeably.)•
grid stability
. The capacity of a power distribution grid to supply the loads at any node with stable voltages; its opposite is
grid instability
, manifested by irregular behavior of the grid voltages at somenodes.
•
ground loop
. Sections of conductors shared by two different electronic or electric circuits, usually referring to circuit return paths.
•
horsepower
. The basic unit of mechanical power. One horsepower (hp) equals 550 foot-pounds per second or 746 watts.
•
HVAC
. Abbreviation for heating, ventilation, and air-conditioning system.•
hysteresis loss
(magnetic, power, and distribution transformer). The energy loss in magnetic material that results from an alternating magnetic field as the elementary magnets within the material seek toalign themselves with the reversing field.
•
impedance
. A linear operator expressing the relationship between voltage and current. The inverse of impedance is
admittance
.•
induced voltage
. A voltage produced around a closed path or circuit by a time rate of change in a mag-netic flux linking that path when there is no relative motion between the path or circuit and the mag-netic flux.
•
joule
. A unit of energy equal to 1 watt-second.•
life safety system
. System designed to protect life and property, such as emergency lighting, fire alarms, smoke exhaust and ventilating fans, and site security.
•
lightning flash
. An electrostatic atmospheric discharge. The typical duration of a lightning flash is approximately 0.5 scc. A single flash is made up of various discharge components, usually includingthree or four high-current pulses called
strokes
.•
metal-oxide varistor
. A solid-state voltage-clamping device used for transient-suppression applica-tions.
•
normal-mode noise
. Unwanted signals in the form of voltages appearing in line-to-line and line-to-neutral signals.
•
permeability
. A general term used to express relationships between magnetic induction and magnetiz-ing force. These relationships are either (1)
absolute permeability
, which is the quotient of a change in
4034_C001.fm Page 2 Monday, August 28, 2006 8:23 AM
© 2007 by Taylor & Francis Group, LLC

AC Power Systems
3
magnetic induction divided by the corresponding change in magnetizing force, or (2)
specific
(rela-tive)
permeability
, which is the ratio of absolute permeability to the magnetic constant.•
point of common coupling
(PCC). The point at which the utility and the consumer’s power systems are connected (usually where the energy meter is located).
•
power factor (PF)
. The ratio of total watts to the total root-mean-square (rms) volt-amperes in a given circuit. Power factor =
W
/
VA
.•
power quality
. The degree to which the utility voltage approaches the ideal case of a stable, uninter-rupted, zero-distortion, and disturbance-free source.
•
radio frequency interference
. Noise resulting from the interception of transmitted radio frequency energy.
•
reactance
. The imaginary part of impedance.•
reactive power
. The quantity of unused power that is developed by reactive components (inductive or capacitive) in an ac circuit or system.
•
safe operating area
. A semiconductor device parameter, usually provided in chart form, that outlines the maximum permissible limits of operation.
•
saturation
(in a transformer). The maximum intrinsic value of induction possible in a material.•
self-inductance
. The property of an electric circuit whereby a change of current induces an electromo-tive force in that circuit.
•
single-phasing
. A fault condition in which one of the three legs in a three-phase power system becomes disconnected, usually because of an open fuse or fault condition.
•
solar wind
. Charged particles from the sun that continuously bombard the surface of the earth.•
switching power supply
. Any type of ac/ac, ac/dc, dc/ac, or dc/dc power converter using periodically operated switching elements. Energy-storage devices (capacitors and inductors) are usually includedin such supplies.
•
transient disturbance
. A voltage pulse of high energy and short duration impressed upon the ac wave-form. The overvoltage pulse may be 1 to 100 times the normal ac potential (or more in some cases)and may last up to 15 ms. Rise times typically measure in the nanosecond range.
•
uninterruptible power system
(UPS). An ac power-supply system that is used for computers and other sensitive loads to (1) protect the load from power interruptions, and (2) protect the load from tran-sient disturbances.
•
VAR compensator.
A switching power processor, operating at the line frequency, with the purpose of reducing the reactive power being produced by a piece of load equipment.
•
voltage regulation
. The deviation from a nominal voltage, expressed as a percentage of the nominal voltage.
1.1.2 Power Electronics
Power electronics
is a multidisciplinary technology that encompasses power semiconductor devices, con-verter circuits, electrical machines, signal electronics, control theory, microcomputers, very-large-scaleintegration (VLSI) circuits, and computer-aided design techniques. Power electronics in its present statehas been possible as a consequence of a century of technological evolution. In the late 19th and early 20thcenturies, the use of rotating machines for power control and conversion was well known [1]. Popularexamples are the Ward Leonard speed control of dc motors and the Kramer and Scherbius drives ofwound rotor induction motors.
The history of power electronics began with the introduction of the glass bulb mercury arc rectifierin 1900 [2]. Gradually, metal tank rectifiers, grid-controlled rectifiers, ignitions, phanotrons, and thyra-trons were introduced. During World War II, magnetic amplifiers based on saturable core reactors andselenium rectifiers became especially attractive because of their ruggedness, reliability, and radiation-hardened characteristics.
Possibly the greatest revolution in the history of electrical engineering occurred with the inventionof the transistor by Bardeen, Brattain, and Shockley at the Bell Telephone Laboratories in 1948. In 1956,
4034_C001.fm Page 3 Monday, August 28, 2006 8:23 AM
© 2007 by Taylor & Francis Group, LLC
4
AC Power Systems Handbook
the same laboratory invented the PNPN triggering transistor, which later came to be known as the thyris-tor or silicon controlled rectifier (SCR). In 1958, the General Electric Company introduced the first com-mercial thyristor, marking the beginning of the modern era of power electronics. Many different types ofpower semiconductor devices have been introduced since that time, further pushing the limits of operat-ing power and efficiency, and long-term reliability.
It is interesting to note that in modern power electronics systems, there are essentially two types ofsemiconductor elements: the power semiconductors, which can be regarded as the muscle of the equip-ment, and the microelectronic control chips, which make up the brain. Both are digital in nature, exceptthat one manipulates power up to gigawatt levels and the other deals with milliwatts or microwatts.Today's power electronics systems integrate both of these end-of-the-spectrum devices, providing largesize and cost advantages, and intelligent operation.
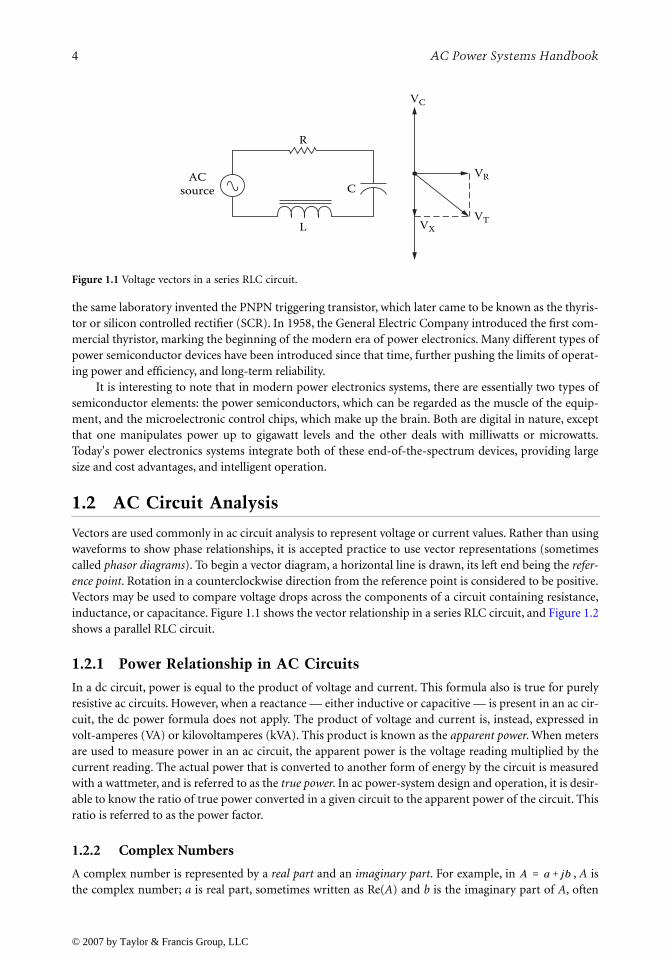
1.2 AC Circuit Analysis
Vectors are used commonly in ac circuit analysis to represent voltage or current values. Rather than usingwaveforms to show phase relationships, it is accepted practice to use vector representations (sometimescalled
phasor diagrams
). To begin a vector diagram, a horizontal line is drawn, its left end being the
refer-ence point
. Rotation in a counterclockwise direction from the reference point is considered to be positive.Vectors may be used to compare voltage drops across the components of a circuit containing resistance,inductance, or capacitance. Figure 1.1 shows the vector relationship in a series RLC circuit, and Figure 1.2shows a parallel RLC circuit.
1.2.1 Power Relationship in AC Circuits
In a dc circuit, power is equal to the product of voltage and current. This formula also is true for purelyresistive ac circuits. However, when a reactance — either inductive or capacitive — is present in an ac cir-cuit, the dc power formula does not apply. The product of voltage and current is, instead, expressed involt-amperes (VA) or kilovoltamperes (kVA). This product is known as the
apparent power
. When metersare used to measure power in an ac circuit, the apparent power is the voltage reading multiplied by thecurrent reading. The actual power that is converted to another form of energy by the circuit is measuredwith a wattmeter, and is referred to as the
true power
. In ac power-system design and operation, it is desir-able to know the ratio of true power converted in a given circuit to the apparent power of the circuit. Thisratio is referred to as the power factor.
1.2.2 Complex Numbers
A complex number is represented by a
real part
and an
imaginary part
. For example, in ,
A
isthe complex number;
a
is real part, sometimes written as Re(
A
) and
b
is the imaginary part of
A
, often
Figure 1.1
Voltage vectors in a series RLC circuit.
ACsource
R
L
C
VXVT
VR
VC
A a jb+=
4034_C001.fm Page 4 Monday, August 28, 2006 8:23 AM
© 2007 by Taylor & Francis Group, LLC

AC Power Systems
5
written as Im(
A
). It is a convention to precede the imaginary component by the letter
j
(or
i
). This formof writing the real and imaginary components is called the
Cartesian form
and symbolizes the complex(or
s
) plane, wherein both the real and imaginary components can be indicated graphically [3]. Toillustrate this, consider the same complex number
A
when represented graphically, as shown in Figure1.3. A second complex number
B
is also shown to illustrate the fact that the real and imaginary compo-nents can take on both positive and negative values. Figure 1.3 also shows an alternate form of representingcomplex numbers. When a complex number is represented by its magnitude and angle, for example,
, it is called the
polar representation
.To see the relationship between the Cartesian and the polar forms, the following equations can be
used:
(1.1)
(1.2)
Figure 1.2
Current vectors in a parallel RLC circuit.
Figure 1.3
The
s
plane representing two complex numbers. (
From
Reference 3.
Used with permission
.)
ACsource
R CL
IL
IR
ITIX
IC
Imaginaryaxis
−−3 −2 −1 1 2 3 40
qB qA
1
2
4B = (−2 + j3)
A = (3 + j2)rA
rB
−
+
+Realaxis
3
A rA θA∠=
rA a2 b2+=
θAba---1–tan=
4034_C001.fm Page 5 Monday, August 28, 2006 8:23 AM
© 2007 by Taylor & Francis Group, LLC

6
AC Power Systems Handbook
Conceptually, a better perspective can be obtained by investigating the triangle shown in Figure 1.4, andconsidering the trigonometric relationships. From this figure, it can be seen that
(1.3)
(1.4)
The well-known
Euler’s identity
is a convenient conversion of the polar and Cartesian forms into anexponential form, given by
exp (
j
θ
) = cos
θ
+
j
sin
θ
(1.5)
1.2.3 Phasors
The ac voltages and currents appearing in distribution systems can be represented by phasors, a conceptuseful in obtaining analytical solutions to one-phase and three-phase system design. A phasor is generallydefined as a transform of sinusoidal functions from the time domain into the complex-number domainand given by the expression
V =
(1.6)
where
V
is the phasor,
V
is the magnitude of the phasor, and
θ
is the angle of the phasor. The conventionused here is to use boldface symbols to symbolize phasor quantities. Graphically, in the time domain, thephasor
V
would be a simple sinusoidal wave shape, as shown in Figure 1.5. The concept of a phasor lead-ing or lagging another phasor becomes very apparent from the figure.
Phasor diagrams are also an effective medium for understanding the relationships between phasors.Figure 1.6 shows a phasor diagram for the phasors represented in Figure 1.5. In this diagram, the conven-tion of positive angles being read counterclockwise is used. The other alternative is certainly possible, aswell. It is quite apparent that a purely capacitive load could result in the phasors shown in Figure 1.5 andFigure 1.6.
1.2.4 Per Unit System
In the per unit system, basic quantities such as voltage and current are represented as certain percentagesof base quantities. When so expressed, these per unit quantities do not need units, thereby makingnumerical analysis in power systems somewhat easier to handle. Four quantities encompass all variablesrequired to solve a power system problem. These quantities are:
• Voltage• Current• Power• Impedance
Out of these, only two base quantities, corresponding to voltage (
V
b
)and power (
S
b
), are required to be defined. The other base quantities canbe derived from these two. Consider the following. Let
V
b
= Voltage base, kV
S
b
= Power base, MVA
Ib = Current base, AZb = Impedance base, Q
Then,
a Re A( ) rA θA( )cos= =
b Im A( ) rA θA( )sin= =
V jθ( )exp P V ω t θ+( )cos{ } V θ∠= =
qA
a
brA = a2 + b2
Figure 1.4 The relationshipbetween Cartesian and polarforms. (From Reference 3. Usedwith permission.)
4034_C001.fm Page 6 Monday, August 28, 2006 8:23 AM
© 2007 by Taylor & Francis Group, LLC

AC Power Systems 7
(1.7)
(1.8)
1.3 Elements of the AC Power System
The process of generating, distributing, and controlling the large amounts of power required for amunicipality or geographic area is highly complex. However, each system, regardless of its complexity, iscomposed of the same basic elements with the same basic goal: deliver ac power where it is needed bycustomers. The primary elements of an ac power system can be divided into the following general areasof technology:
• Power generators• Power transformers• Capacitors• Transmission circuits• Control and switching systems, including voltage regulators, protection devices, and fault isolation
devices
The path that electrical power takes to endusers begins at a power plant, where electricity isgenerated by one of several means and is thenstepped-up to a high voltage (500 kV is com-mon) for transmission on high-tension lines.Step-down transformers reduce the voltage tolevels appropriate for local distribution andeventual use by customers. Figure 1.7 shows howthese elements interconnect to provide ac powerto consumers.
1.3.1 Transmission Circuits
The heart of any utility power-distribution system is the cable used to tie distant parts of the networktogether. Conductors are rated by the American Wire Gauge (AWG) scale. The smallest is no. 36, and thelargest is no. 0000. There are 40 sizes in between. Sizes larger than no. 0000 AWG are specified in thousandcircular mil units, referred to as “MCM” units (M is the Roman numeral expression for 1000). The cross-sectional area of a conductor doubles with each increase of three AWG sizes. The diameter doubles withevery six AWG sizes.
Most conductors used for power transmission are made of copper or aluminum. Copper is the mostcommon. Stranded conductors are used where flexibility is required. Stranded cables usually are moredurable than solid conductor cables of the same AWG size. For long distances, utilities typically use unin-sulated aluminum conductors or aluminum conductor steel-reinforced cables. For shorter distances,insulated copper wire normally is used.
Ampacity is the measure of the ability of a conductor to carry electric current. Although all metalswill conduct current to some extent, certain metals are more efficient than others. The three most com-mon high-conductivity conductors are
• Silver, with a resistivity of 9.8 Ω/circular mil-ft• Copper, with a resistivity of 10.4 Ω/circular mil-ft• Aluminum, with a resistivity of 17.0 Ω/circular mil-ft
ZbVb
Sb------
2Ω=
IbVb103
Zb---------------A=
VI
q
I leads V by 90 degrees or V lags I by 90 degrees
Figure 1.5 Waveforms representing leading and laggingphasors. (From Reference 3. Used with permission.)
4034_C001.fm Page 7 Monday, August 28, 2006 8:23 AM
© 2007 by Taylor & Francis Group, LLC

8 AC Power Systems Handbook
The ampacity of a conductor is determined by the type of material used, the cross-sectional area,and the heat-dissipation effects of the operating environment. Conductors operating in free air willdissipate heat more readily than conductors placed in a larger cable or in a raceway with other conductorswill. Table 1.1 lists the principal parameters of common wire sizes.
1.3.1.1 Types of Conductors
Wire and cable designed for use in a power-distribution system can be roughly divided into two catego-ries:
• Overhead conductors• Underground cables
Each will be examined in the following sections.
1.3.1.2 Overhead Conductors
Many different types of conductors are used on overhead distribution lines [3]. They vary in both sizeand number, depending on the voltage level and the type of circuit. Copper, aluminum, and steel are themost commonly used materials for overhead lines. Copper is used in three forms: hard drawn,medium-hard drawn, and soft drawn or annealed. Hard-drawn copper has the greatest strength and isused for circuits of relatively long spans (200 ft or more). However, its inflexibility makes it harder to
Figure 1.6 Phasor diagram showing phasor representation and phasor operation. (From Reference 3. Used withpermission.)
Figure 1.7 A typical electrical power-generation and distribution system. Although this schematic diagram is linear,in practice power lines branch at each voltage reduction to establish the distribution network. (From [4]. Used withpermission.)
I
V
V = V cos θ = V∠0°
I = I cos (90 + θ) = I∠90°
V2
V1
V1 + V2 = VR
VR
Generatingstation
Distributionstation
Substations Userfacility
23 kV 230 kV 34.5kV
13.8 kV
TIE
TIE 480 V
4160 V
2400 V
120/240 V
4034_C001.fm Page 8 Monday, August 28, 2006 8:23 AM
© 2007 by Taylor & Francis Group, LLC

AC Power Systems 9
work with. The soft-drawn variety is the weakest of the copper conductors. Its use is limited to shortspans. The medium-hard-drawn copper conductor has found widespread use in medium-range distribu-tion circuits.
Steel wire is only about one tenth as good a conductor as copper and, hence, is rarely used alone.However, it offers an economic advantage over the other types of conductors. Also, because steel wire ismuch stronger than copper, it permits longer spans and requires fewer supports.
Aluminum is only 60 to 80% as good a conductor as copper and only half as strong as copper. How-ever, its property of lighter weight, as compared to copper and steel, and its relative advantage in trans-mitting ac power because of reduced skin effect makes it suitable for overhead lines. Usually, thealuminum wires are stranded on a core of steel wire to form what is termed an aluminum conductor steel-reinforced (ACSR) conductor. The more strands in the ACSR conductor, the greater flexibility it will have.Hence, the larger conductors used today are all stranded and twisted in layers concentrically around acentral steel wire.
Table 1.2 lists the characteristics of various conductors that are typically used on overhead distribu-tion lines.
Table 1.1 Characteristics of Copper Wire
Wire Size (AWG) Diameter (mils) Circular Mil AreaOhms/1000 ft
(20ºC)
Current-Carrying Capacity at 700
C.M./A Diameter (mm)
1 289.3 83,690 0.1239 119.6 7.3482 257.6 66,370 0.1563 94.8 6.5443 229.5 52,640 0.1970 75.2 5.8274 204.3 41,740 0.2485 59.6 5.1895 181.9 33,100 0.3133 47.3 4.6216 162.0 26,250 0.3951 37.5 4.1157 144.3 20,820 0.4902 29.7 3.6658 128.5 16,510 0.6282 23.6 3.2649 114.4 13,090 0.7921 18.7 2.906
10 101.9 10,380 0.9989 14.8 2.58811 90.7 8,234 1.260 11.8 2.30512 80.8 6,530 1.588 9.33 2.05313 72.0 5,178 2.003 7.40 1.82814 64.1 4,107 2.525 5.87 1.62815 57.1 3,257 3.184 4.65 1.45016 50.8 2,583 4.016 3.69 1.29117 45.3 2,048 5.064 2.93 1.15018 40.3 1,624 6.385 2.32 1.02419 35.9 1,288 8.051 1.84 0.91220 32.0 1,022 10.15 1.46 0.81221 28.5 810 12.80 1.16 0.72322 25.3 642 16.14 0.918 0.644
Table 1.2 General Characteristics of Overhead Conductors (After [5].)
Conductor Type Resistance (Ω / mi) Diameter (in.) Amperes
1,000,000 AA 0.1050 1.150 698556,500 ACSR 0.1860 0.927 730500,000 AA 0.2060 0.813 483336,400 ACSR 0.3060 0.721 530
4/0 ACSR 0.5920 0.563 3402/0 AA 0.7690 0.414 2301/0 ACSR 1.1200 0.398 2301/0 CU 0.6070 0.368 310#2 AA 1.5400 0.292 156#2 ACSR 1.6900 0.316 180#4 ACSR 2.5500 0.257 140
#10 CU 5.9030 0.102 80#12 CU 9.3750 0.081 75#14 CU 14.8720 0.064 2
4034_C001.fm Page 9 Monday, August 28, 2006 8:23 AM
© 2007 by Taylor & Francis Group, LLC

10 AC Power Systems Handbook
1.3.1.3 Underground Cables
Underground construction of distribution lines is designed mostly for urban areas and is dictated by eco-nomics, congestion, and density of population [3]. Although overhead lines have been ordinarily consid-ered to be less expensive and easier to maintain, developments in underground cable and constructiontechnology have narrowed the cost gap to the point where such systems are competitive in many urbanand suburban residential installations.
The conductors used underground are different from overhead lines in that they are insulated fortheir entire length, and several of them may be combined under one protective sheath. The whole assem-bly is called an electric cable. These cables are either buried directly in the ground, or they may be installedin ducts buried in the ground. The conductors in cables are usually made of copper or aluminum and areusually stranded. They are made of soft-drawn copper because they do not have to support any apprecia-ble weight. Cables can be either single conductor or multiple conductors enclosed in a single sheath foreconomy.
1.3.1.4 Skin Effect
The effective resistance offered by a conductor to high frequencies is considerably greater than the ohmicresistance measured with direct currents (dc). This is because of an action known as the skin effect, whichcauses the currents to be concentrated in certain parts of the conductor and leaves the remainder of thecross section to contribute little toward carrying the applied current.
When a conductor carries an alternating current, a magnetic field is produced that surrounds thewire. This field continually is expanding and contracting as the ac current wave increases from zero to itsmaximum positive value and back to zero, then through its negative half-cycle. The changing magneticlines of force cutting the conductor induce a voltage in the conductor in a direction that tends to retardthe normal flow of current in the wire. This effect is more pronounced at the center of the conductor.Thus, current within the conductor tends to flow more easily toward the surface of the wire. The higherthe frequency, the greater the tendency for current to flow at the surface. The depth of current flow is afunction of frequency and is determined from
(1.9)
whered = Depth of current in milsμ = Permeability (copper = 1, steel = 300)f = Frequency of signal in MHz
It can be calculated that at a frequency of 100 kHz,current flow penetrates a conductor by 8 mils. At 1 MHz,the skin effect causes current to travel in only the top 2.6mils in copper, and even less in almost all other conduc-tors. Therefore, the series impedance of conductors athigh frequencies is significantly higher than at low fre-quencies. Figure 1.8 shows the distribution of current in aradial conductor.
When a circuit is operating at high frequencies, theskin effect causes the current to be redistributed over theconductor cross section in such a way as to make most ofthe current flow where it is encircled by the smallest num-ber of flux lines. This general principle controls the distri-bution of current regardless of the shape of the conductor involved. With a flat-strip conductor, thecurrent flows primarily along the edges, where it is surrounded by the smallest amount of flux.
df
= 2 6.
μ
Figure 1.8 The skin effect on a conductor.
Magnetic flux
Distribution ofcurrent density
4034_C001.fm Page 10 Monday, August 28, 2006 8:23 AM
© 2007 by Taylor & Francis Group, LLC

AC Power Systems 11
It is evident from Equation 1.9 that the skin effect is minimal at power-line frequencies for copperconductors. For steel conductors at high current, however, skin effect considerations are often important.
1.3.2 Dielectrics and Insulators
Dielectrics are materials that are used primarily to isolate components electrically from each other orground or to act as capacitive elements in devices, circuits, and systems [6]. The insulating properties ofdielectrics are directly attributable to their large energy gap between the highest filled valence band andthe conduction band. The number of electrons in the conduction band is extremely low because theenergy gap of a dielectric (5 to 7 eV) is sufficiently large to maintain most of the electrons trapped in thelower band. As a consequence, a dielectric subjected to an electric field will allow only an extremely smallconduction or loss current. This current will be caused by the following:
• The finite number of free electrons available• Other free charge carriers (ions) typically associated with contamination by electrolytic impurities• Dipole orientation losses arising with polar molecules under ac conditions
Often, the two latter effects will tend to obscure the minuscule contribution of the relatively fewfree electrons available. Unlike solids and liquids, vacuum and gases (in their nonionized state) approachthe conditions of a perfect insulator — i.e., they exhibit virtually no detectable loss or leakage current.
Two fundamental parameters that characterize a dielectric material are its conductivity σ and thevalue of the real permittivity or dielectric constant ε'. By definition, σ is equal to the ratio of the leakagecurrent density Jl to the applied electric field E
(1.10)
Because Jl is in A cm–2 and E is in V cm–1, the corresponding units of σ are in S cm–1 or Ω –1 cm–1.Under ac conditions, dielectric losses arise mainly from the movement of free charge carriers (elec-
trons and ions), space charge polarization, and dipole orientation. Ionic, space charge, and dipole lossesare temperature and frequency dependent, a dependency that is reflected in the measured values of σand ε'. This necessitates the introduction of a complex permittivity e defined by ε = ε' – jε'', where ε'' isthe imaginary value of the permittivity.
As the voltage is increased across a dielectric material, a point is ultimately reached beyond whichthe insulation will no longer be capable of sustaining any further rise in voltage and breakdown willensue, causing a short circuit to develop between the electrodes. If the dielectric consists of a gas or liquidmedium, the breakdown will be self-healing in the sense that the gas or liquid will support anew a reap-plication of voltage. In a solid dielectric, however, the initial breakdown will result in a formation of apermanent conductive channel, which cannot support a reapplication of full voltage.
The breakdown strength of a dielectric under dc and impulse conditions tends to exceed that at acfields, thereby suggesting the ac breakdown process is partially of a thermal nature. An additional factor,which may lower the ac breakdown strength, is that associated with the occurrence of partial dischargeseither in void inclusions or at the electrode edges. This leads to breakdown values much lower than theintrinsic value. In practice, breakdown values are generally of an extrinsic nature, and the intrinsic valuesare useful conceptually insofar as they provide an idea of an upper value that can be attained only underideal conditions.
All insulating materials will undergo varying degrees of aging or deterioration under normal operat-ing conditions. The rate of aging will be contingent upon the magnitude of the electrical, thermal, andmechanical stresses to which the material is subjected. It will also be influenced by the composition andmolecular structure of the material itself, as well as the chemical, physical, and radiation environmentunder which the material must operate. The useful life of an insulating system will, thus, be determinedby a given set and subset of aging variables. For example, the subset of variables in the voltage stress
σ = JE
1
4034_C001.fm Page 11 Monday, August 28, 2006 8:23 AM
© 2007 by Taylor & Francis Group, LLC

12 AC Power Systems Handbook
variable are the average and maximum values of the applied voltage, its frequency, and the recurrencerate of superposed impulse or transient voltage surges. For the thermal stress, the upper and lower ambi-ent temperatures, the temperature gradient in the insulation, and the maximum permissible operatingtemperature constitute the subvariable set. In addition, the character of the mechanical stress will differ,depending upon whether torsion, compression, or tension and bending are involved.
Furthermore, the aging rate will be differently affected if all stresses (electrical, thermal, and mechan-ical) act simultaneously, separately, or in some predetermined sequence. The influence exerted on theaging rate by the environment will depend on whether the insulation system will be subjected to corrosivechemicals, petroleum fluids, water or high humidity, air or oxygen, ultraviolet radiation from the sun,and nuclear radiation. Organic insulations, in particular, may experience chemical degradation in thepresence of oxygen. For example, polyethylene under temperature cycle will undergo both physical andchemical changes. These effects will be particularly acute at high operating temperatures (90 to 130°C).At these temperatures, partial or complete melting of the polymer will occur, and the increased diffusionrate will permit the oxygen to migrate to a greater depth into the polymer. Ultimately, the antioxidantwill be consumed, resulting in an embrittlement of the polymer and, in extreme cases, in the formationof macroscopic cracks. Subjection of the polymer to many repeated overload cycles will be accompaniedby repeated melting and recrystallization of the polymer — a process that will inevitably cause theformation of cavities, which, when subjected to sufficiently high voltages, will undergo discharge, leadingeventually to electrical breakdown.
The 60 Hz breakdown strength of a 1 cm gap of air at 25°C at atmospheric pressure is 31.7 kV cm–1.Although this is a relatively low value, air is a most useful insulating medium for large electrode separa-tions, as is the case for overhead transmission lines. The only dielectric losses in the overhead lines arethose resulting from corona discharges at the line conductor surfaces and leakage losses over the insulatorsurfaces. In addition, the highly reduced capacitance between the conductors of the lines ensures a smallcapacitance per unit length, thus rendering overhead lines an efficient means for transmitting largeamounts of power over long distances.
1.3.2.1 Insulating Liquids
Insulating liquids are rarely used by themselves. Rather, they are intended for use mainly as impregnantswith cellulose or synthetic papers [6]. The 60 Hz breakdown strength of practical insulating liquidsexceeds that of gases; for a 1-cm gap separation, it is of the order of about 100 kV cm–1. However, becausethe breakdown strength increases with decreasing gap length and the oils are normally evaluated using agap separation of 0.254 cm, the breakdown strengths normally cited range from approximately 138 to240 kV cm–1 (Table 1.3). The breakdown values are more influenced by the moisture and particle con-tents of the fluids than by their molecular structure.
Mineral oils have been extensively used in high-voltage electrical apparatus. They constitute a cate-gory of hydrocarbon liquids that are obtained by refining crude petroleum. Their composition consists ofparaffinic, naphthenic, and aromatic constituents and is dependent upon the source of the crude as wellas the refining procedure followed. The inclusion of the aromatic constituents is desirable because oftheir gas absorption and oxidation characteristics. Mineral oils used for cable and transformer applica-tions have low polar molecule contents and are characterized by dielectric constants extending fromabout 2.10 to 2.25, with dissipation factors generally between 2 × 10 –5and 6 × 10 –5 at room temperature,depending upon their viscosity and molecular weight. Their dissipation factors increase appreciably athigher temperatures when the viscosities are reduced. Oils may deteriorate in service because of oxida-tion and moisture absorption.
Alkyl benzenes are used as impregnants in high-voltage cables, often as substitutes for the low-vis-cosity mineral oils in self-contained, oil-filled cables. The electrical properties of alkyl benzenes are com-parable to those of mineral oils, and they exhibit good gas inhibition characteristics. Because of theirdetergent character, alkyl benzenes tend to be more susceptible to contamination than mineral oils.
Since the discontinued use of the nonflammable polychlorinated biphenyls (PCBs), a number ofunsaturated synthetic liquids have been developed for use in high-voltage capacitors, where, because of
4034_C001.fm Page 12 Monday, August 28, 2006 8:23 AM
© 2007 by Taylor & Francis Group, LLC
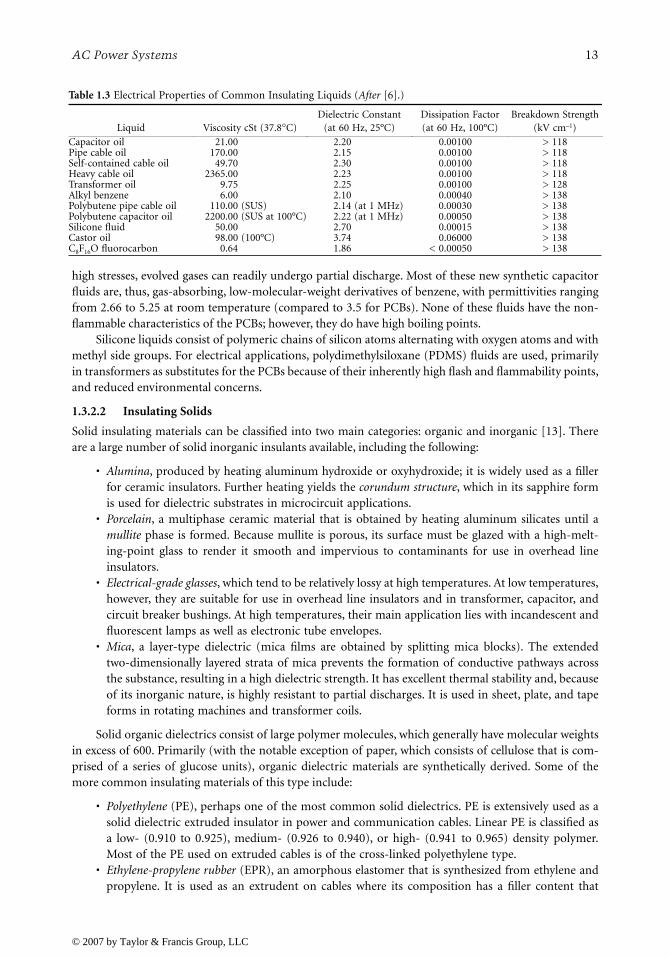
AC Power Systems 13
high stresses, evolved gases can readily undergo partial discharge. Most of these new synthetic capacitorfluids are, thus, gas-absorbing, low-molecular-weight derivatives of benzene, with permittivities rangingfrom 2.66 to 5.25 at room temperature (compared to 3.5 for PCBs). None of these fluids have the non-flammable characteristics of the PCBs; however, they do have high boiling points.
Silicone liquids consist of polymeric chains of silicon atoms alternating with oxygen atoms and withmethyl side groups. For electrical applications, polydimethylsiloxane (PDMS) fluids are used, primarilyin transformers as substitutes for the PCBs because of their inherently high flash and flammability points,and reduced environmental concerns.
1.3.2.2 Insulating Solids
Solid insulating materials can be classified into two main categories: organic and inorganic [13]. Thereare a large number of solid inorganic insulants available, including the following:
• Alumina, produced by heating aluminum hydroxide or oxyhydroxide; it is widely used as a fillerfor ceramic insulators. Further heating yields the corundum structure, which in its sapphire formis used for dielectric substrates in microcircuit applications.
• Porcelain, a multiphase ceramic material that is obtained by heating aluminum silicates until amullite phase is formed. Because mullite is porous, its surface must be glazed with a high-melt-ing-point glass to render it smooth and impervious to contaminants for use in overhead lineinsulators.
• Electrical-grade glasses, which tend to be relatively lossy at high temperatures. At low temperatures,however, they are suitable for use in overhead line insulators and in transformer, capacitor, andcircuit breaker bushings. At high temperatures, their main application lies with incandescent andfluorescent lamps as well as electronic tube envelopes.
• Mica, a layer-type dielectric (mica films are obtained by splitting mica blocks). The extendedtwo-dimensionally layered strata of mica prevents the formation of conductive pathways acrossthe substance, resulting in a high dielectric strength. It has excellent thermal stability and, becauseof its inorganic nature, is highly resistant to partial discharges. It is used in sheet, plate, and tapeforms in rotating machines and transformer coils.
Solid organic dielectrics consist of large polymer molecules, which generally have molecular weightsin excess of 600. Primarily (with the notable exception of paper, which consists of cellulose that is com-prised of a series of glucose units), organic dielectric materials are synthetically derived. Some of themore common insulating materials of this type include:
• Polyethylene (PE), perhaps one of the most common solid dielectrics. PE is extensively used as asolid dielectric extruded insulator in power and communication cables. Linear PE is classified asa low- (0.910 to 0.925), medium- (0.926 to 0.940), or high- (0.941 to 0.965) density polymer.Most of the PE used on extruded cables is of the cross-linked polyethylene type.
• Ethylene-propylene rubber (EPR), an amorphous elastomer that is synthesized from ethylene andpropylene. It is used as an extrudent on cables where its composition has a filler content that
Table 1.3 Electrical Properties of Common Insulating Liquids (After [6].)
Liquid Viscosity cSt (37.8°C)Dielectric Constant
(at 60 Hz, 25°C)Dissipation Factor (at 60 Hz, 100°C)
Breakdown Strength(kV cm–1)
Capacitor oil 21.00 2.20 0.00100 > 118Pipe cable oil 170.00 2.15 0.00100 > 118Self-contained cable oil 49.70 2.30 0.00100 > 118Heavy cable oil 2365.00 2.23 0.00100 > 118Transformer oil 9.75 2.25 0.00100 > 128Alkyl benzene 6.00 2.10 0.00040 > 138Polybutene pipe cable oil 110.00 (SUS) 2.14 (at 1 MHz) 0.00030 > 138Polybutene capacitor oil 2200.00 (SUS at 100°C) 2.22 (at 1 MHz) 0.00050 > 138Silicone fluid 50.00 2.70 0.00015 > 138Castor oil 98.00 (100°C) 3.74 0.06000 > 138C8F16O fluorocarbon 0.64 1.86 < 0.00050 > 138
4034_C001.fm Page 13 Monday, August 28, 2006 8:23 AM
© 2007 by Taylor & Francis Group, LLC

14 AC Power Systems Handbook
usually exceeds 50% (comprising primarily clay, with smaller amounts of added silicate and carbonblack). Dielectric losses are appreciably enhanced by the fillers, and, consequently, EPR is notsuitable for extra-high-voltage applications. Its use is primarily confined to intermediate voltages(< 69 kV) and to applications where high cable flexibility (due to its inherent rubber properties)may be required.
• Polypropylene, which has a structure related to that of ethylene with one added methyl group. Itis a thermoplastic material having properties similar to high-density PE, although because of itslower density, polypropylene has also a lower dielectric constant. Polypropylene has many electricalapplications, both in bulk form as molded and extruded insulations, as well as in film form intaped capacitor, transformer, and cable insulations.
• Epoxy resins, which are characterized by low shrinkage and high mechanical strength. They canalso be reinforced with glass fibers and mixed with mica flakes. Epoxy resins have many applica-tions, including insulation of bars in the stators of rotating machines, solid-type transformers,and spacers for compressed-gas-insulated busbars and cables.
Impregnated-paper insulation is one of the earliest insulating systems employed in electrical powerapparatus and cables. Although many current designs use solid- or compressed-gas insulating systems,the impregnated-paper approach still constitutes one of the most reliable insulating techniques available.Proper impregnation of the paper results in a cavity-free insulating system, thereby eliminating theoccurrence of partial discharges that inevitably lead to deterioration and breakdown of the insulating sys-tem. The liquid impregnants employed are either mineral oils or synthetic fluids.
Low-density cellulose papers have slightly lower dielectric losses, but the dielectric breakdownstrength is also reduced. The converse is true for impregnated systems utilizing high-density papers. If thepaper is heated beyond 200°C, the chemical structure of the paper breaks down, even in the absence ofexternal oxygen, because the latter is readily available from within the cellulose molecule. To prevent thisprocess from occurring, cellulose papers are ordinarily not used at temperatures above 100°C.
1.3.3 Control and Switching Systems
Specialized hardware is necessary to interconnect the elements of a power-distribution system. Utilitycontrol and switching systems operate under demanding conditions, including high voltage and currentlevels, exposure to lightning discharges, and 24-hour-a-day use. For reliable performance, large marginsof safety must be built into each element of the system. The primary control and switching elements arehigh-voltage switches and protection devices.
High-voltage switches are used to manage the distribution network. Most disconnect switches func-tion to isolate failures or otherwise reconfigure the network. Air-type switches are typically larger ver-sions of the common knife switch device. To prevent arcing, air switches are changed only when power isremoved from the circuit. These types of switches can be motor driven or manually operated.
Oil-filled circuit breakers are used at substations to interrupt current when the line is hot. The con-tacts usually are immersed in oil to minimize arcing. Oil-filled circuit breakers are available for operationat 500 kV and higher. Magnetic air breakers are used primarily for low-voltage indoor applications.
Protection devices include fuses and lightning arresters. Depending upon the operating voltage, var-ious types of fuses can be used. Arc suppression is an essential consideration in the design and operationof a high-voltage fuse. A method must be provided to extinguish the arc that develops when the fuse ele-ment begins to open. Lightning arresters are placed at numerous points in a power-distribution system.Connected between power-carrying conductors and ground, they are designed to operate rapidly andrepeatedly if necessary. Arresters prevent flashover faults between power lines and surge-induced trans-former and capacitor failures. The devices are designed to extinguish rapidly, after the lightning dischargehas been dissipated, to prevent power follow-on damage to system components.
A fault in an electrical power system is the unintentional and undesirable creation of a conductingpath (a short circuit) or a blockage of current (an open circuit) [7]. The short-circuit fault is typically themost common and is usually implied when most people use the term “fault.” The causes of faults include
4034_C001.fm Page 14 Monday, August 28, 2006 8:23 AM
© 2007 by Taylor & Francis Group, LLC

AC Power Systems 15
lightning, wind damage, trees falling across lines, vehicles colliding with towers or poles, birds shortingout lines, aircraft colliding with lines, vandalism, small animals entering switchgear, and line breaksresulting from excessive ice loading. Power system faults can be categorized as one of four types:
• Single line-to-ground• Line-to-line• Double line-to-ground• Balanced three-phase
The first three types constitute severe unbalanced operating conditions.It is important to determine the values of system voltages and currents during fault conditions so
that protective devices can be set to detect and minimize their harmful effects. The time constants of theassociated transients are such that sinusoidal steady-state methods can typically be used.
High-voltage insulators permit all of the foregoing hardware to be reliably interconnected. Mostinsulators are made of porcelain. The mechanical and electrical demands placed on high-voltage insula-tors are stringent. When exposed to rain or snow, the devices must hold off high voltages. They also mustsupport the weight of heavy conductors and other components.
1.3.3.1 Fault Protection Devices
Fuses are designed to melt and disconnect the circuit within which they are placed should the current inthe circuit increase above a specified thermal rating [3]. Fuses designed to be used in circuits operatingabove 600 V are classified as fuse cutouts. Oil-filled cutouts are mainly used in underground installationsand contain the fusible elements in an oil-filled tank. Expulsion-type cutouts are the most commondevices used on overhead primary feeders. In this class of device, the melting of the fusible elementcauses heating of a fiber fuse tube, which, in turn, produces deionizing gases to extinguish the arc. Expul-sion-type cutouts are classified as:
• Open-fuse cutouts• Enclosed-fuse cutouts• Open-link-fuse cutouts
The automatic recloser is an overcurrent device that automatically trips and recloses a preset numberof times to clear or isolate faults. The concept of reclosing is derived from the fact that most utility systemfaults are temporary in nature and can be cleared by de-energizing the circuit for a short period of time.Reclosers can be set for a number of operation sequences, depending on the action desired. These typi-cally include instantaneous trip and reclose operation followed by a sequence of time-delayed trip opera-tions prior to lockout of the recloser. The minimum pick-up for most reclosers is typically set to tripinstantaneously at two times the nominal current rating.
An automatic line recloser is constructed of an interrupting chamber and the related contacts thatoperate in oil, a control mechanism to trigger tripping and reclosing, an operator integrator, and a lock-out mechanism. An operating rod is actuated by a solenoid plunger that opens and closes the contacts inoil. Both single-phase and three-phase units are available.
The line sectionalizer is yet another overcurrent device. It is installed in conjunction with backup cir-cuit breakers or reclosers. The line sectionalizer maintains coordination with the backup interruptingdevice and is designed to open after a preset number of tripping operations of the backup element. Linesectionalizers are installed on poles or crossarms in overhead distribution systems. The standard contin-uous current rating for sectionalizers ranges from 10 to 600 A. Sectionalizers also are available for bothsingle-phase and three-phase systems.
The function of a circuit breaker is to protect a circuit from the harmful effects of a fault, in additionto energizing and de-energizing the same circuit during normal operation. Breakers are generallyinstalled on both the incoming subtransmission lines and the outgoing primary feeders of a utility sub-station. These devices are designed to operate as quickly as possible (less than 10 cycles of the power fre-quency) to limit the impact of a fault on the distribution and control system. At the same time, the arc
4034_C001.fm Page 15 Monday, August 28, 2006 8:23 AM
© 2007 by Taylor & Francis Group, LLC

16 AC Power Systems Handbook
that forms between the opening contacts must be quenched rapidly. Several schemes are available toextinguish the arc, the most common being immersion of the contacts in oil. Some circuit breakers haveno oil, but quench the arc by a blast of compressed air. These are referred to as air circuit breakers. Yetanother type encloses the contacts in a vacuum or a gas, such as sulfur hexafluoride (SF6).
Air circuit breakers are typically used when fault currents are relatively small. These devices are char-acteristically simple, are low cost, and require little maintenance. The fault current flows through coils,creating a magnetic field that tends to force the arc into ceramic chutes that stretch the arc, often with theaid of compressed air. When the arc is extinguished through vacuum, the breaker is referred to as a vac-uum circuit breaker. Because a vacuum cannot sustain an arc, it can be an effective medium for this appli-cation. However, owing to imperfections present in a practical vacuum device, a small arc of shortduration can be produced. The construction of vacuum circuit breakers is simple, but the maintenance isusually more complex than with other devices.
1.3.3.2 Lightning Arrester
A lightning arrester is a device that protects electrical apparatus from voltage surges caused by lightning[3]. It provides a path over which the surge can pass to ground before it has the opportunity to passthrough and damage equipment. A standard lightning arrester consists of an air gap in series with a resis-tive element. The resistive element is usually made of a material that allows a low-resistance path to thevoltage surge, but presents a high-resistance path to the flow of line energy during normal operation.This material is known as the valve element. Silicon carbide is a common valve element material. Thevoltage surge causes a spark that jumps across the air gap and passes through the resistive element toground.
1.4 Utility AC Power System Architecture
The details of power distribution vary from one city or country to another, and from one utility companyto another, but the basics are the same. Figure 1.9 shows a simplified distribution network. Power from agenerating station or distribution grid comes into an area substation at 115 kV or higher. The substationconsists of switching systems, step-down transformers, fuses, circuit breakers, reclosers, monitors, andcontrol equipment. The substation delivers output voltages of approximately 60 kV to subtransmissioncircuits, which feed distribution substations. The substations convert the energy to approximately 12 kVand provide voltage regulation and switching provisions that permit patching around a problem. The 12kV lines power pole- and surface-mounted transformers, which supply various voltages to individualloads. Typical end-user voltage configurations include:
• 120/208 V wye• 277/480 V wye• 120/240 V single phase• 480 V delta
The circuits feeding individual customer loads are referred to as the secondary system, whereas theprimary system is the network upstream from the secondary (Figure 1.9c). The secondary system origi-nates at the distribution transformer and ends at the consumer loads. Each secondary main may supplygroups of customers. In some instances, where service reliability is incorporated into the design, thesecondary mains of several adjacent transformers may be connected through a fuse or a recloser. This isreferred to as secondary banking. If an even higher service reliability factor is required, the secondarymains in an area can be connected in a mesh or a network, similar to the networking of the primary.
Fuses and circuit breakers are included at a number of points in the distribution system to minimizefault-caused interruptions of service. Ground-fault interrupters (GFIs) are also included at various pointsin the 12 kV system to open the circuit if excessive ground currents begin to flow on the monitored line.(GFIs are also known as ground-fault current interrupters, or GFCIs.) Reclosers may be included as part
4034_C001.fm Page 16 Monday, August 28, 2006 8:23 AM
© 2007 by Taylor & Francis Group, LLC

AC Power Systems 17
of overcurrent protection of the 12 kV lines. They will open the circuit if excessive currents are detectedand reclose after a preset length of time, as discussed in the previous section.
In some areas, the actions of circuit breakers, pole-mounted switches, and reclosers are controlled bytwo-way radio systems that allow status interrogation and switching of the remotely located devices froma control center. Some utilities use this method sparingly; others make extensive use of it.
Figure 1.9 Simplified block diagram of a basic utility company power distribution system: (2) Overall network. Thedevices shown as fuses could be circuit breakers or reclosers. All circuits shown are three-phase. The capacitorsperform power factor correction duty. (b) System terminology. (c) Distinction between the primary and secondarydistribution systems. (b and c from [3]. Used with permission.)
Generating plants
Transmission line (115 kV or higher) Substation
60 kV
60 kV
60 kV Load select
switches
Load select
Load select
Distribution substation
Back-up line
60 kV Subtransmission
lines
12 kV
12 kV
Voltage regulator
Voltage regulator
Note: All circuitsshown are
three-phase.
To another distribution substation 12 kV Power distribution network
208 V 208 V 208 V 208 V 208 V
Generation Transmission system
Step-up transf.
Power transf.
Subtransmission system
Distribution transf.
Distribution system
Primary feeder
Secondary main
Customer loads
(a)
(b)
(c)
4034_C001.fm Page 17 Monday, August 28, 2006 8:23 AM
© 2007 by Taylor & Francis Group, LLC

18 AC Power Systems Handbook
Depending on the geographic location, varying levels of lightning protection are included as part ofthe ac power-system design. Most service drop transformers (12 kV to 208 V) have integral lightningarresters. In areas of severe lightning, a ground (or shield) wire is strung between the top insulators ofeach pole, diverting the lightning to the ground wire, and away from the hot leads.
Standard transmission voltages are established in the U.S. by the American National Standards Insti-tute (ANSI). There is no clear delineation between distribution, subtransmission, and transmission volt-age levels. Table 1.4 lists the standard voltages given in ANSI Standards C84 and C92.2.
1.4.1 Power Distribution
The distribution of power over a utility company network is a complex process involving a number ofpower-generating plants, transmission lines, and substations. The physical size of a metropolitan power-distribution and control system is immense. Substations use massive transformers, oil-filled circuitbreakers, huge strings of insulators, and high-tension conductors in distributing power to customers.Power-distribution and -transmission networks interconnect generating plants into an area grid, towhich area loads are attached. Most utility systems in the U.S. are interconnected to one extent oranother. In this way, power-generating resources can be shared as needed. The potential for single-pointfailure also is reduced in a distributed system.
A typical power-distribution network is shown in Figure 1.10. Power transmission lines operate atvoltage levels from 2.3 kV for local distribution to 500 kV or more for distribution between cities or gen-erating plants. Long-distance, direct current transmission lines also are used, with potentials of 500 kVand higher. Underground power lines are limited to short runs in urban areas. Increased installation costsand cable heat-management considerations limit the use of high-voltage underground lines. Wide varia-tions in standard voltage levels can be found within any given system. Each link in the network isdesigned to transfer energy with the least I 2R loss, thereby increasing overall system efficiency. The fol-lowing general classifications of power-distribution systems can be found in common use:
• Radial system. The simplest of all distribution networks, a single substation supplies power to allloads in the system. (See Figure 1.11.)
• Ring system. Distribution lines encircle the service area, with power being delivered from one ormore sources into substations near the service area. Power is then distributed from the substationsthrough the radial transmission lines. (See Figure 1.12.)
• Network system. A combination of the radial and ring distribution systems. Although such a system ismore complex than either of the previous configurations, reliability is improved significantly. The net-work system, illustrated in Figure 1.13, is one of the most common power-distribution configurations.
1.4.2 Distribution Substations
Distribution substations serve as the source for primary distribution feeders [3]. They receive bulk elec-tric power at high voltages and reduce the voltage to distribution primary values. Also associated with asubstation are provisions for protection from faults, for voltage regulation, and for data acquisition andmonitoring. The equipment generally installed in a distribution substation includes:
Table 1.4 Standard Utility System Voltages (kV) (After [15].)
Category Nominal Rating Maximum Rating
High voltage 34.5 36.546.0 48.369.0 72.5
115.0 121.0138.0 145.0161.0 169.0230.0 242.0
Extra-high voltage (EHV) 345.0 362.0400.0 (principally in Europe)500.0 550.0765.0 800.0
Ultra-high voltage (UHV) 1100.0 1200.0
4034_C001.fm Page 18 Monday, August 28, 2006 8:23 AM
© 2007 by Taylor & Francis Group, LLC

AC
Pow
er Systems
19
Figure 1.10 Simplified power-distribution architecture.
High-tension
lines
Transformer
High-voltagedistribution substation
Industrial orcommercial customer
Medium-voltagedistribution substation
Street lighting
4,160 or 2,300 VTransformer
Residentialcustomer
Commercialcustomer
Customersubstation
120/240 V
Street lightingtransformer
Transformer
4,160 or 2,300 V 12,500 or 34,500 V
4034_C001.fm Page 19 M
onday, August 28, 2006 8:23 A
M
© 2007 by Taylor & Francis Group, LLC

20 AC Power Systems Handbook
• Power transformers• Oil or air circuit breakers• Voltage regulators• Protective relays• Air break and disconnect switches• Surge arresters• Measuring instruments• Storage batteries and capacitors (in some installations)
Some substations are entirely enclosed in buildings, whereas others are built entirely in the openwith all equipment enclosed in one or more metal-clad units. The final design of the type of substationdepends on economic factors; future load growth; and environmental, legal, and social issues.
1.4.2.1 Breaker Schemes
The circuit breaker scheme used at a substation provides for varying degrees of reliability and maintain-ability on both the input and output sides [3]. Each additional circuit breaker provides greater reliabilityand flexibility in maintaining the bus energized during a fault or during maintenance. However, the costalso increases with each circuit breaker. Hence, the selection of a particular substation scheme dependson safety, reliability, economy, and simplicity. The most commonly used circuit breaker schemes are [9]:
• The single-bus, shown in Figure 1.14a• Double-bus/double-breaker, shown in Figure 1.14b
Figure 1.11 Radial power-transmission system.
Figure 1.12 Ring power-transmission system.
Figure 1.13 Network power-transmission system.
Load 3
Load 4
Load 2
Substation
Load 1
Power lines
Substation Load 4
Load 1 Load 3Load 2
Load 1Substation
Load 3 Load 4
Load 2
Load 5
4034_C001.fm Page 20 Monday, August 28, 2006 8:23 AM
© 2007 by Taylor & Francis Group, LLC

AC Power Systems 21
• Main-and-transfer bus, shown in Figure 1.14c• Breaker-and-a-half, shown in Figure 1.14d• Ring bus, shown in Figure 1.14e
Of these designs, the single-bus scheme costs the least; however, it possesses rather low reliabilitybecause the failure of the bus or any circuit breaker results in a total shutdown of the substation. Themost expensive arrangement is the double-bus/double-breaker scheme. Each circuit is provided with twocircuit breakers, and thus, any breaker can be taken out of service for maintenance without disruptionof service at the substation. In addition, feeder circuits can be connected to either bus. Themain-and-transfer bus requires an extra breaker for the bus tie between the main and the auxiliary buses.The breaker-and-a-half scheme provides the most flexible operation with high reliability. The relayingand automatic reclosing, however, are somewhat complex.
Figure 1.14 Substation bus and breaker arrangements: (a) single-bus; (b) double-bus/double-breaker; (c) main-and-transfer bus; (d) breaker-and-a-half; (e) ring bus. (From [3]. Used with permission.)
Line Line
(a) (b) (c)
(d) (e)
Line
Disconnectswitches
Line
CB
Bus
Line
LineOutgoing
line
Bus tiebreaker
Outgoingline
Transfer bus
Main bus
Line
IncomingLine
IncomingLine
Bus 1
Bus 2
LineLine
Line Line Line
Bus 1
Bus 2
4034_C001.fm Page 21 Monday, August 28, 2006 8:23 AM
© 2007 by Taylor & Francis Group, LLC

22 AC Power Systems Handbook
1.4.3 Voltage Analysis
Distribution systems are designed to maintain service voltages within specified limits during normal andemergency conditions. Typical voltage limits are [3]:
• For service to residential customers, the voltage at the point of delivery shall not exceed 5% aboveor below the nominal voltage. This is equivalent to the band between 114 and 126 V for mostutilities in the United States.
• For service to commercial or industrial customers, the voltage at the point of delivery shall notexceed 7.5% above or below the nominal voltage.
• The maximum allowable voltage imbalance for a three-phase service shall be 2.5%.
The goal of voltage analysis is to determine whether the voltages on different line sections remainwithin the specified limits under varying load conditions. Thus, voltage analysis facilitates the effectiveplacement of capacitors, voltage regulators, and other voltage regulation devices on the distribution sys-tem. Load flow analysis is a computer-aided tool that is typically used in this planning task. Load flowsdetermine feeder voltages under steady-state conditions and at different load conditions.
Voltage analysis begins with an accurate representation, or map, of the feeder circuits, starting at thesubstation. The map generally consists of details and electrical characteristics (such as kVA ratings,impedances, and other parameters) of the conductors and cables on the system, substation and distribu-tion transformers, series and shunt capacitors, voltage regulators, and related devices.
Before the analysis can begin, feeder loading must be known. Several different methods can be usedfor this task. If the utility maintains a database on each customer connected to a distribution transformer,it can use the billing data to determine the kilowatt-hours supplied by each transformer for a givenmonth. Methods can then be used to convert the kilowatt-hours to a noncoincident peak kilovoltamperedemand for all distribution transformers connected on the feeder. If this information is not available, thekilovoltampere rating of the transformer and a representative power factor can be used as the load. Withthe metered demand at the substation, the transformer loads can be allocated, for each phase, such thatthe allocated loads plus losses will equal the metered substation demand.
Accurately representing the load types or models is an important issue in voltage analysis. Severalload models are available, including:
• Spot and distributed loads• Wye and delta connected loads• Constant power, constant current, constant impedance, or a combination of these methods
1.4.4 High-Voltage DC Transmission
High-voltage dc (HVDC) transmission offers several advantages over alternating current for long-dis-tance power transmission and asynchronous interconnection between two ac systems, including the abil-ity to precisely control the power flow without inadvertent loop flows that can occur in an interconnectedac system [9]. HVDC transmission can be classified into one of three broad categories:
• Back-to-back systems• Two-terminal, or point-to-point, systems• Multiterminal systems
In a back-to-back dc system, shown in Figure 1.15, both the rectifier and the inverter are located inthe same station, usually in the same building. The rectifier and inverter are usually integrated with areactor, which is generally an air-core design. A back-to-back dc system is used to tie two asynchronous acsystems (systems that are not in synchronism). The two ac systems can be of different operating frequen-cies, for example, one 50 Hz and the other 60 Hz. Back-to-back dc links are also used to interconnect twoac systems that are of the same frequency but are not operating in synchronism. In North America, forexample, Eastern and Western systems may not be synchronized, and Quebec and Texas may not be
4034_C001.fm Page 22 Monday, August 28, 2006 8:23 AM
© 2007 by Taylor & Francis Group, LLC

AC Power Systems 23
synchronized with their neighboring systems. A dc link offers a practical solution to interconnectingthese nonsynchronous networks.
Two-terminal dc systems can be either bipolar or monopolar. The bipolar configuration, shown inFigure 1.16a, is the commonly used arrangement for systems with overhead lines. In this configuration,there are two conductors, one for each polarity (positive and negative) carrying nearly equal currents.Only the difference of these currents, which is usually small, flows through the ground return. A monop-olar system has one conductor, either of positive or negative polarity, with current returning througheither ground or another metallic return conductor. The monopolar ground return current configura-tion, shown in Figure 1.16b, has been used for undersea cable systems, where current returns through thesea. This configuration can also be used for short-term emergency operation for a two-terminal dc linesystem in the event of a pole outage. However, concerns about corrosion of underground metallic struc-tures and interference with telephone and other utilities restrict the duration of such operation. The totalampere-hour operation per year is usually the restricting criterion. In a monopolar metallic return sys-tem, shown in Figure 1.16c, return current flows through a conductor, thus avoiding the problems associ-ated with ground return current. This method is generally used as a contingency mode of operation for anormal bipolar transmission system in the event of a partial converter (one-pole equipment) outage. Inthe case of outage of a one-pole converter, the conductor of the affected pole will be used as the returncurrent conductor. A metallic return transfer breaker is opened, diverting the return current from theground path and into the pole conductor. This conductor is grounded at one end and insulated at theother end. This system can transmit half the power of the normal bipolar system capacity, and can beincreased if overload capacity is available. However, the percentage of losses will be doubled compared tothe normal bipolar operation.
There are two basic configurations in which dc systems can be operated as multiterminal systems:
• Parallel configuration• Series configuration
The parallel configuration can be either radial-connected (Figure 1.17a) or mesh-connected (Figure1.17b). In a parallel-connected multiterminal dc system, all converters operate at the same nominal dcvoltage, similar to ac system interconnections. In this mode of operation, one converter determines theoperating voltage, and all other terminals operate in a current-controlling mode.
In a series-connected multiterminal dc system, shown in Figure 1.18, all converters operate at thesame current. One converter sets the current that will be common to all converters in the system. Exceptfor the converter that sets the current, the remaining converters operate in a voltage control mode (con-stant firing angle or constant extinction angle). The converters operate almost independently without therequirement for high-speed communication between them. The power output of a noncurrent-control-ling converter is varied by changing its voltage. At all times, the sum of the voltages across the rectifier sta-tions must be larger than the sum of voltages across the inverter stations. Disadvantages of aseries-connected system include the following:
• Reduced efficiency because full line insulation is not used at all times.
Figure 1.15 The back-to-back system of dc transmission. (From [9]. Used with permission.)
ACsystem
1
ACsystem
2
Converterbuilding
4034_C001.fm Page 23 Monday, August 28, 2006 8:23 AM
© 2007 by Taylor & Francis Group, LLC

24 AC Power Systems Handbook
• Operation at higher firing angles leads to high converter losses and higher reactive power require-ments from the ac system.
1.4.4.1 AC vs. DC Transmission
In cases where HVDC is selected on technical considerations, it may be the only practical option, as inthe case of an asynchronous interconnection [9]. However, for long-distance power transmission, whereboth ac and HVDC are practical, the final decision is dependent on the total costs of each alternative. Thetotal cost of a transmission system includes the line costs (conductors, insulators, and towers) plus theright-of-way (R-o-W) costs. A dc line with two conductors can carry almost the same amount of poweras a three-phase ac line with the same size of line conductors. However, dc towers with only two conduc-tors are simpler and cheaper than three-phase ac towers. Hence, the per-mile costs of line and R-o-W willbe lower for a dc line. Power losses in the dc line are also lower than for ac for the same power transmit-ted. However, the HVDC system requires converters at each end of the line; hence, the terminal costs fordc are higher than for ac. The variation of total costs for ac and dc as a function of line length is shown inFigure 1.19. As illustrated, there is a break-even distance beyond which the total costs of the dc option
Figure 1.16 Two-terminal dc transmission systems: (a) bipolar; (b) monopolar ground return; (c) monopolar metallicreturn. (From [9]. Used with permission.)
(a)
ACsystem
ACsystem
+ +
− −
Idc
Idc
ACsystem
ACsystem
Idc
Idc
(b)
ACsystem
ACsystem
(c)
Line
Breaker
Line
4034_C001.fm Page 24 Monday, August 28, 2006 8:23 AM
© 2007 by Taylor & Francis Group, LLC

AC Power Systems 25
will be lower than the ac transmission option. This is in the range of 500 to 800 km for overhead lines,but much shorter for cables. The break-even point is between 20 and 50 km for submarine cables andtwice as far for underground cables.
1.4.4.2 DC Circuit Breakers
The process of interrupting the current in an acsystem is aided by the fact that ac current goesthrough zero every half-cycle, or approximatelyevery 8 ms in a 60 Hz system [9]. The absence ofa natural current zero in dc makes it difficult todevelop a dc circuit breaker. There are threeprincipal problems that must be addressed:
• Forcing current zero in the interruptingelement
• Controlling the overvoltages caused bylarge changes in current as a function oftime (di/dt) in a highly inductive circuit
• Dissipating large amounts of energy (tensof megajoules is not uncommon)
The second and third problems are solvedby the application of zinc oxide varistors con-nected line to ground and across the breakingelement. The first is the major problem, and sev-eral different solutions have been adopted by dif-ferent manufacturers. Basically, current zero isachieved by inserting a counter voltage into thecircuit.
Figure 1.17 Multiterminal dc transmission systems: (a) parallel-connected radial; (b) parallel connected mesh-type.(From [9]. Used with permission.)
Converter 1
Converter 2Converter 3
(a)
(b)
Converter 2Converter 1
Converter 3Converter 4
Figure 1.18 Series connected multiterminal dc system.(From [9]. Used with permission.)
Break-even distance
Distance
Tran
smiss
ion
cost
dc
ac
Figure 1.19 Transmission system cost as a function ofline length for ac and dc systems. (From [9]. Used withpermission.)
4034_C001.fm Page 25 Monday, August 28, 2006 8:23 AM
© 2007 by Taylor & Francis Group, LLC

26 AC Power Systems Handbook
In the circuit shown in Figure1.20, opening CB (an air-blast circuitbreaker) causes current to be commu-tated to the parallel LC tank. The com-mutating circuit will be oscillatory,which creates current zero in the cir-cuit breaker. The opening of CBincreases the voltage across the com-mutating circuit, which will be limitedby the zinc oxide varistor ZnO1 byentering into conduction. The resis-tance R is the closing resistor in serieswith switch S.
1.4.5 Utility Company Interfacing
Most utility company-to-customer connections are the delta-wye type shown in Figure 1.21. This trans-former arrangement usually is connected with the delta side facing the high voltage and the wye side fac-ing the load. This configuration provides good isolation of the load from the utility and somewhatretards the transmission of transients from the primary to the secondary windings. The individual three-phase loads are denoted in the figure by Zl, Z2, and Z3. They carry load currents as shown. For a wye-con-nected system, it is important that the building neutral lead is connected to the midpoint of the trans-former windings, as shown. The neutral line provides a path for the removal of harmonic currents thatmay be generated in the system as a result of rectification of the secondary voltages.
In some areas, an open-delta arrangement is used by the utility company to supply power to custom-ers. The open-delta configuration is shown in Figure 1.22. Users often encounter problems when operat-ing sensitive three-phase loads from such a connection because of poor voltage-regulation characteristicsduring varying load conditions. The open-delta configuration is also subject to high third-harmonic con-tent and transient propagation. The three loads and their respective load currents are shown inthe diagram.
Figure 1.21 Delta-wye transformer configuration for utility company power distribution. This common type ofservice connection transformer provides good isolation of the load from the high-voltage distribution-system line.
ZnO1
ZnO
2
C L
CB
A S
ZnO
2
Figure 1.20 Block diagram of a dc circuit breaker (one module).(From [9]. Used with permission.)
Z1 carryingload current
I1To customer
Secondary
Primary
To utility system
Leg-2
Leg-3 Neutral
Z3 carryingload current
I3
Z2carrying
loadcurrent
I2
Leg-1
4034_C001.fm Page 26 Monday, August 28, 2006 8:23 AM
© 2007 by Taylor & Francis Group, LLC
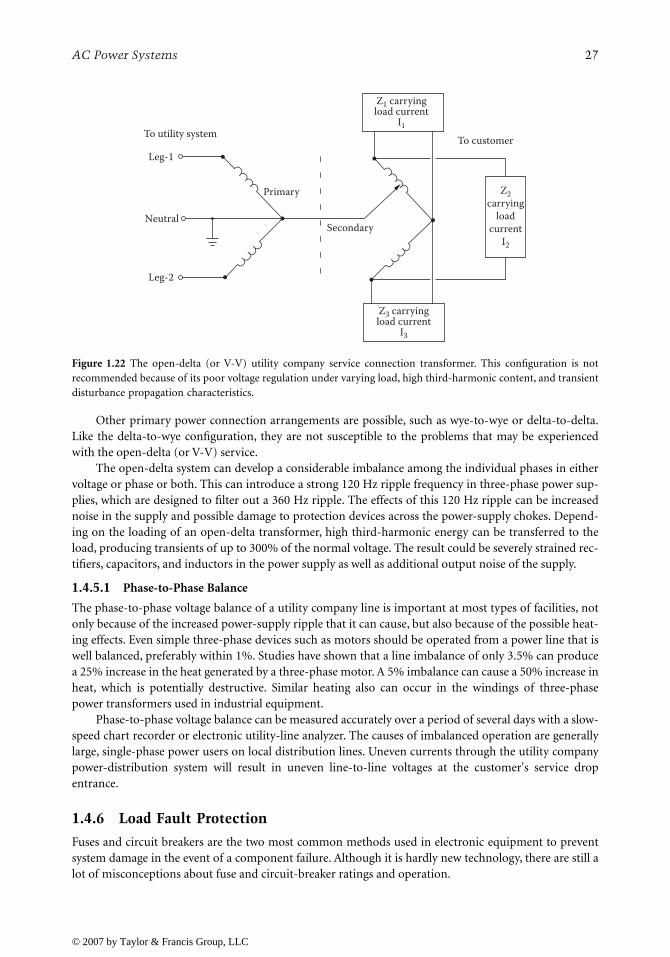
AC Power Systems 27
Other primary power connection arrangements are possible, such as wye-to-wye or delta-to-delta.Like the delta-to-wye configuration, they are not susceptible to the problems that may be experiencedwith the open-delta (or V-V) service.
The open-delta system can develop a considerable imbalance among the individual phases in eithervoltage or phase or both. This can introduce a strong 120 Hz ripple frequency in three-phase power sup-plies, which are designed to filter out a 360 Hz ripple. The effects of this 120 Hz ripple can be increasednoise in the supply and possible damage to protection devices across the power-supply chokes. Depend-ing on the loading of an open-delta transformer, high third-harmonic energy can be transferred to theload, producing transients of up to 300% of the normal voltage. The result could be severely strained rec-tifiers, capacitors, and inductors in the power supply as well as additional output noise of the supply.
1.4.5.1 Phase-to-Phase Balance
The phase-to-phase voltage balance of a utility company line is important at most types of facilities, notonly because of the increased power-supply ripple that it can cause, but also because of the possible heat-ing effects. Even simple three-phase devices such as motors should be operated from a power line that iswell balanced, preferably within 1%. Studies have shown that a line imbalance of only 3.5% can producea 25% increase in the heat generated by a three-phase motor. A 5% imbalance can cause a 50% increase inheat, which is potentially destructive. Similar heating also can occur in the windings of three-phasepower transformers used in industrial equipment.
Phase-to-phase voltage balance can be measured accurately over a period of several days with a slow-speed chart recorder or electronic utility-line analyzer. The causes of imbalanced operation are generallylarge, single-phase power users on local distribution lines. Uneven currents through the utility companypower-distribution system will result in uneven line-to-line voltages at the customer's service dropentrance.
1.4.6 Load Fault Protection
Fuses and circuit breakers are the two most common methods used in electronic equipment to preventsystem damage in the event of a component failure. Although it is hardly new technology, there are still alot of misconceptions about fuse and circuit-breaker ratings and operation.
Figure 1.22 The open-delta (or V-V) utility company service connection transformer. This configuration is notrecommended because of its poor voltage regulation under varying load, high third-harmonic content, and transientdisturbance propagation characteristics.
Z1 carryingload current
I1
To customer
Secondary
Primary
To utility system
Leg-1
Leg-2
Neutral
Z3 carryingload current
I3
Z2carrying
loadcurrent
I2
4034_C001.fm Page 27 Monday, August 28, 2006 8:23 AM
© 2007 by Taylor & Francis Group, LLC

28 AC Power Systems Handbook
1.4.6.1 Fuses
Fuses are rated according to the cur-rent they can pass safely. This maygive the wrong idea — that excessivecurrent will cause a fuse to blow.Rather, the cause is power dissipa-tion in the form of heat. Put in morefamiliar terms, it is the I 2R lossacross the fuse element that causesthe linkage to melt. The current rat-ing of a given device, however, is notthe brick-wall-protection value thatmany service people think it is. Con-sider the graph shown in Figure 1.23,which illustrates the relationship ofrated current across a fuse to theblowing time of the device.
Fuse characteristics can bedivided into three general categories:fast-acting, medium-acting, andslow-blow. Circuit protection foreach type of device is a function of both current and time. For example, a slow-blow fuse will allowapproximately 6 times the rated current through a circuit for a full second before opening. Such delaycharacteristics have the benefit of offering protection against nuisance blowing because of high inrushcurrents during system startup. This feature, however, comes with the price of possible exposure to sys-tem damage in the event of a component failure.
1.4.6.2 Circuit Breakers
Circuit breakers are subject to similar current let-through constraints. Figure 1.24 illustrates device loadcurrent as a percentage of breaker rating vs. time. The A and B curves refer to breaker load capacity prod-uct divisions. Note the variations possible in trip time for the two classifications. The minimum clearingtime for the A group (the higher classification devices) is 1 s for a 400% overload. Similar to fuses, thesedelays are designed to prevent nuisance tripping caused by normally occurring current surges from (pri-marily) inductive loads. Most circuit breakers are designed to carry 100% of their rated load continu-ously without tripping. They normally are specified to trip at between 101 and 135% of rated load after aperiod of time determined by the manufacturer. In this example, the must-trip point at 135% is 1 hour.
Circuit breakers are available in both thermal and magnetic designs. Magnetic protectors offer thebenefit of relative immunity to changes in ambient temperature. Typically, a magnetic breaker will oper-ate over a temperature range of –40°C to +85°C without significant variation of the trip point. Timedelays usually are provided for magnetic breakers to prevent nuisance tripping caused by startup currentsfrom inductive loads. Trip-time delay ratings range from near instantaneous (under 100 ms) to slow (10to 100 s).
1.4.6.3 Semiconductor Fuses
The need for a greater level of protection for semiconductor-based systems led to the development ofsemiconductor fuses. Figure 1.25 shows the clearing characteristics of a typical fuse of this type. The totalclearing time of the device consists of two equal time segments: the melting time and the arcing time. Therate of current decrease during the arcing time must be low enough that high induced voltages, whichcould destroy some semiconductor components, are not generated.
800
700
600
500
Perc
ent o
f rat
ed c
urre
nt
400
300
200
100
00.001 0.01
Blowing time in seconds0.1 1.0 10 100 1,000 10,000
Fast-acting fuses
Medium-actingfuses
“SLO-BLO” fuses
Figure 1.23 The relationship between the rated current of a fuse andits blowing time. Curves are given for three types of devices: fast-acting, medium-acting, and slow-blow.
4034_C001.fm Page 28 Monday, August 28, 2006 8:23 AM
© 2007 by Taylor & Francis Group, LLC

AC Power Systems 29
1.4.6.4 Application Considerations
Although fuses and circuit breakers are akey link in preventing equipment damageduring the occurrence of a system fault,they are not without some built-in disad-vantages. Lead alloy fuses work well andare the most common protection devicefound, but because the current-interrupt-ing mechanism is dependent on the melt-ing of a metal link, their exact blow pointis not constant. The interrupting currentmay vary, depending on the type and sizeof fuse clip or holder, conductor size, phys-ical condition of the fuse element, extentof vibration present, and ambient temper-ature. Figure 1.26 illustrates the effects ofambient temperature on blowing time andcurrent-carrying capacity.
1.4.6.5 Transient Currents
Trip delays for fuses and circuit breakersare necessary because of the high startupor inrush currents that occur when induc-tive loads or tungsten filament lamps are energized. The resistance of a tungsten lamp is high when it ishot, but low when it is cold. A current surge of as much as 15 times the rated steady-state value mayoccur when the lamp is energized (pulse duration approximately 4 ms).
Figure 1.24 The relationship between the rated current of a circuit breaker and its blowing time. Curves A and Brepresent different product current ranges, as shown.
1,000A B
Load
cur
rent
as a
per
cent
of b
reak
er ra
ting
800
600
400
200
00.1 1 10
Time in seconds100 1,000
Overload Trip Times(A) 5A to 50A models (B) 0.5A to 4A models
100%135%200%600%
1,000%
No tripTrip in 1 hour
6–22 sec0.45–1.5 sec0.25–0.6 sec
Overload Trip Times100%135%200%600%
1,000%
No tripTrip in 1 hour
11–30 sec1.0–5.5 sec0.4–2.5 sec
Peak available current
Peak let-through
current
Arc voltage < 1.5 ×nonrepetitive peak
reverse voltage VRBT
Time Melting
time
Clearing time
< 8.3 ms
Fuse melts
I
Arcing time
Figure 1.25 The current let-through characteristics of a semi-conductor fuse. Note that the clearing time of the device is lessthan 8.3 ms in this example.
4034_C001.fm Page 29 Monday, August 28, 2006 8:23 AM
© 2007 by Taylor & Francis Group, LLC

30 AC Power Systems Handbook
Transformer inrush currents can measure as high as 30 times the normal rated current for newertypes of transformers that have grain-oriented high silicon steel cores. These transformer designs areattractive because of their favorable size and weight characteristics. Older transformers of more conven-tional design typically exhibit an inrush current approximately 18 times greater than the steady-statevalue. This transient current surge reaches its peak in the first half-cycle of applied ac power anddecreases with each successive half-cycle. Such transients are relatively insensitive to the load placed onthe secondary. The transient may, in fact, be smaller when the transformer is loaded than unloaded. Aworst-case turn-on current surge will not occur every time the transformer is energized. Among thedetermining factors involved is the magnitude of the applied voltage at the instant the transformer is con-nected. Minimum transient energy occurs when the transformer is switched on at the zero-crossing pointof the sine wave.
The magnitude of the turn-on current surge of an ac-to-dc power supply is determined mainly bythe transformer transient and the capacitive load placed after the rectifier elements. Large filter capacitorscommonly found in low-voltage, high-current supplies can place severe stress on the rectifiers and trans-former. A fully discharged capacitor appears as a virtual short circuit when power is first applied. Someform of surge-limiting circuit often is provided for power supplies containing more than 10,000 μF totalcapacitance.
The surge current of an ac motor is spread over tenths of a second, rather than milliseconds, andvaries considerably with the load connected to the unit. Table 1.5 lists typical motor surge currents forvarious types of devices. Note that the single-phase induction motor has the highest surge rating (7 timesthe running value for a period of 750 ms). Three-phase motors exhibit a relatively low-surge current dur-ing startup (350% for 167 ms).
1.4.6.6 Delay-Trip Considerations
The occurrence of turn-on surges for inductive loads, ac-to-dc power supplies, and tungsten filamentlamps dictates the installation of protective devices that exhibit delayed-trip characteristics that matchthe given load. The problem, however, is that high-surge currents of brief duration — not related to turn-on activities — can occur without tripping the circuit breaker or opening the fuse element. The resultmay be damage to other circuit devices, such as semiconductors. To provide full protection to an elec-tronic system, the overload withstand characteristics of all components should match. This is not alwaysan easy goal to accomplish.
Figure 1.26 The effects of ambient temperature on fuse-blowing time and current-carrying capacity.
150
Perc
ent o
f rat
ing
or b
low
ing
time
140
130
120
110
100
90
80
70
60
50
40
30−60°C −40°C −20°C 0°C
Ambient temperature20°C 40°C 60°C 80°C 100°C
Effect oncurrent-carryingcapacity rating
Effect on blowing time
4034_C001.fm Page 30 Monday, August 28, 2006 8:23 AM
© 2007 by Taylor & Francis Group, LLC

AC Power Systems 31
For example, consider a simple SCR-controlled ac-to-dc power supply. The transformer will set theupper limit on surge current presented to the protective device and the SCR (assuming light capacitiveloading). If that surge is 18 times the normal steady-state current for a period of 8 ms, then a protectivedevice must be selected that will allow the surge to pass without tripping. An SCR must be selected forthe circuit, therefore, that can withstand at least 18 times the normal rated current for 8 ms. If not, theSCR will become the weak link in the system, not the protective device.
1.4.7 Measuring AC Power
Measuring the average power delivered to aload requires measurement of the rms val-ues of voltage and current, as well as thepower factor [10]. This is accomplished byan electro-dynamometer-type wattmeter,shown in Figure 1.27. The current in thehigh-resistance pivoted coil is proportionalto the voltage across the load. The currentto the load and the pivoted coil togetherthrough the energizing coil of the electro-magnet establishes a proportional magneticfield across the cylinder of rotation of the pivoted coil. The torque on the pivoted coil is proportional tothe product of the magnetic field strength and the current in the pivoted coil. If the current in the pivotedcoil is negligible compared to that in the load, then the torque becomes essentially proportional to theproduct of the voltage across the load (equal to that across the pivoted coil) and the current in the load(essentially equal to that through the energizing coil of the electromagnet). The dynamics of the pivotedcoil together with the restraining spring, at ac power frequencies, ensures that the angular displacementof the pivoted coil is proportional to the average of the torque or, equivalently, the average power.
One of the most common electricalinstruments is the induction-type watt-hourmeter, which measures the energy deliveredto a load. In this design, the pivoted coil isreplaced by a rotating conducting (usuallyaluminum) disk, as shown in Figure 1.28. Aninduced eddy current in the disk replaces thepivoted coil current in its interaction with theload-current-established magnetic field. Aftercompensating for the less-than-ideal natureof the electrical elements making up this typeof meter, the result is that the disk rotates at a
Table 1.5 Starting Surge Current Characteristics for Various Types of ac Motors Selected from a Random Test Group
Motor TypeStart Current (peak
amplitude, rms)Duration of Start
Surge (s) Load-s (% I × t s)
Shaded pole 150% 2.000 0.30Split phase no. 1 600% 0.116 0.70Split phase no. 2 425% 0.500 2.00Capacitor (loaded) no. 1 400% 0.600 2.40Capacitor (no load) 300% 0.100 0.30Capacitor (loaded) no. 2 420% 0.500 2.10Induction 700% 0.750 5.00Three phase 350% 0.167 0.60Capacitor-start split-phase run 290% 0.083 0.24
Wattmeter±
±
Pivoted cell
ZL
Figure 1.27 A wattmeter connected to a load. (From [10]. Usedwith permission.)
Disk
Watthour meter
ZL
±
±
Figure 1.28 A watt-hour meter connected to a load. (From[10]. Used with permission.)
4034_C001.fm Page 31 Monday, August 28, 2006 8:23 AM
© 2007 by Taylor & Francis Group, LLC

32 AC Power Systems Handbook
rate proportional to the average power of the load, and the rotational count is proportional to the energydelivered to the load.
At frequencies above the ac power frequency, and — in some instances — at the ac power frequen-cies, electronic instruments are used to measure power and energy. These systems are based on a varietyof basic digital measurement techniques.
1.4.7.1 Digital Measurement Techniques
Figure 1.29 shows a generalized block diagram of a digital voltmeter/ammeter. Conversion of an inputvoltage to a digital equivalent can be accomplished in one of several ways. The dual-slope conversionmethod (also know as double-integration) is one of the more popular techniques. Figure 1.30 illustratesthe dual-slope conversion process. Vin represents the input voltage (the voltage to be measured). VREF is areference voltage with a polarity opposite that of the measured voltage, supplied by the digital conversioncircuit. Capacitor C1 and operational amplifier U1 constitute an integrator. S1 is an electronic switch thatis initially in the position shown. When the meter terminals are first connected to the circuit, the samplevoltage is applied to the input of the integrator for a specified period of time, called the integration period.The integration period is usually related to the 60 Hz line frequency; integration periods of 1/60th of asecond are common. S1 is an electronic switch that is initially in the position shown. When the meter ter-minals are first connected to the circuit, the sample voltage is applied to the input of the integrator for aspecified period of time, called the integration period. The integration period is usually related to the 60Hz line frequency; integration periods of 1/60th of a second and 1/10th of a second are common. Theoutput signal of the integrator is a voltage determined by the resistor-capacitor (RC) time constant of R1and C1. Because of the nature of the integrator, the maximum voltage (the voltage at the end of the inte-gration period) is proportional to the voltage being measured. At the end of the integration period,switch S1 is moved to the other position (VREF) and a voltage of opposite polarity to the measured voltageis applied. The capacitor is then discharged to zero. As shown in the figure, the discharge interval isdirectly proportional to the maximum voltage, which, in turn, is proportional to the applied voltage atthe input terminals.
At the same time that the integration interval ends and the discharge interval begins, a counter in themeter begins counting pulses generated by a clock circuit. When the voltage reaches zero, the counterstops. The number of pulses counted is, therefore, proportional to the discharge period. This count isconverted to a digital number and displayed as the measured quantity. Although this method works well,it is somewhat slow, so many microcomputer-based meters use a variation called multislope integration.
Figure 1.29 Block diagram of a basic digital voltage and current measuring device. It should be noted that advancesin integrated circuit technology have reduced most of the individual elements shown to a single device.
Input selectorand ac-to-dcconversion
VoltageCurrent
Resistance
Probes
Analog-to-digital
conversion
Integratedcircuit
Displaymultiplexrate signal
Clockoscillator
Display
Digitdrivers
On-off signals
Segment drivers(to each
digit’s sevensegments)
Signals toeach segment
4034_C001.fm Page 32 Monday, August 28, 2006 8:23 AM
© 2007 by Taylor & Francis Group, LLC

AC Power Systems 33
1.5 References
1. Bose, B. K., “Recent Advances in Power Electronics,” IEEE Transactions on Power Electronics, IEEE,New York, Vol. 7, No. 1, p. 2, January 1992.
2. Bose, B. K., “Power Electronics — A Technology Review,” Proceedings of the IEEE, IEEE, New York,NY, Vol. 80, No. 8, p. 1303, August 1992.
3. Chowdhury, B., “Power Distribution and Control,” in The Electronics Handbook, J. C. Whitaker(Ed.), p. 1003, CRC Press, Boca Raton, FL, 1996.
4. Sankaran, C., “Transformers,” in The Electrical Engineering Handbook, R. C. Dorf (Ed.), p. 33, CRCPress, Boca Raton, FL, 1993.
5. IEEE Working Group, “Radial Distribution Test Feeders,” IEEE Transactions on Power Systems,IEEE, New York, Vol. 6, No. 3, p. 975, 1996.
6. Bartnikas, R., “Dielectrics and Insulators,” in The Electrical Engineering Handbook, R. C. Dorf (Ed.),p. 1132, CRC Press, Boca Raton, FL, 1993.
7. Gross, C., “Fault Analysis in Power Systems,” in The Electrical Engineering Handbook, R. C. Dorf(Ed.), p. 1252, CRC Press, Boca Raton, FL, 1993.
8. Chen, M.-S., “Transmission,” in The Electrical Engineering Handbook, R. C. Dorf (Ed.), p. 1217,CRC Press, Boca Raton, FL, 1993.
9. Thallam, R. S., “High-Voltage Direct-Current Transmission,” in The Electrical Engineering Hand-book, R. C. Dorf (Ed.), p. 1227, CRC Press, Boca Raton, FL, 1993.
10. Balabanian, N., and T. A. Bickart, “Power and Energy,” in The Electrical Engineering Handbook, R.C. Dorf (Ed.), p. 79, CRC Press, Boca Raton, FL, 1993.
Figure 1.30 The analog-to-digital conversion process: (a) the basic circuitry involved; (b) graph of Vc vs. time. Becausethe slope of the discharge curve is identical regardless of the ultimate voltage reached by the integrator, the dischargeperiod and, therefore, the number of counts recorded by the logic circuitry are proportional to the input voltage.
2x volts
x volts
Integrating period(1/10 sec or 1/60 sec)
Time
Vc
Controllogic
2TT
Referencevoltage Clock Display
Zerodetector
Input
R C
OP-AMP
Integratingcapacitor
4034_C001.fm Page 33 Monday, August 28, 2006 8:23 AM
© 2007 by Taylor & Francis Group, LLC

34 AC Power Systems Handbook
1.6 Bibliography
Davis, W., “Selecting Circuit Protective Devices,” Plant Electrical Systems, PRIMEDIA Intertec, OverlandPark, KS, March 1980.
Fardo, S., and D. Patrick, Electrical Power Systems Technology, Prentice-Hall, Englewood Cliffs, NJ, 1985.Fink D., and D. Christiansen (Eds.), Electronics Engineers' Handbook, 3rd ed., McGraw-Hill, New York,
1989.Jay, F., IEEE Standard Directory of Electrical and Electronics Terms, 3rd ed., IEEE, New York, 1984.Jordan, E. C. (Ed.), Reference Data for Engineers: Radio, Electronics, Computer, and Communications, 7th
ed., Howard W. Sams Company, Indianapolis, IN, 1985.Kramer, R. A., “Analytic and Operational Consideration of Electric System Reliability,” Proceedings of the
Reliability and Maintainability Symposium, IEEE, New York, 1991.Lawrie, R., Electrical Systems for Computer Installations, McGraw-Hill, New York, 1988.Mohan, N., and T. Undeland, Power Electronics: Converters, Applications, and Design, John Wiley, New
York, 1989.Pearman, R., Power Electronics, Reston Publishing Company, Reston, VA, 1980.Stephens, D., “Surge Protection for Electric Motors,” Technical Briefs newsletter, Burns & McDonnell,
Kansas City, MO, February 1991.Technical staff, “The Susceptibility of the Open Delta Connection to Third Harmonic Disturbances,”
Harris Corporation, technical paper, Quincy, IL.
4034_C001.fm Page 34 Monday, August 28, 2006 8:23 AM
© 2007 by Taylor & Francis Group, LLC

35
2
Power-Generation
Systems
2.1 Introduction
Any ac power system begins with a generating source. Electric generators are devices that convert energyfrom a mechanical form into an electrical form. This process, known as
electromechanical energy conversion
,involves magnetic fields that act as an intermediate medium. The input to the generating machine can bederived from a number of energy sources. For example, in the generation of large-scale electric power, coalcan produce steam that drives the shaft of the machine. Typically, for such a thermal process, only about 1/3of the raw energy (i.e., from coal) is converted into mechanical energy. The final step of the energy conver-sion is quite efficient, with efficiency close to 100%.
2.2 Fundamental Concepts
A simplified diagram of a three-phase generator is shown in Figure 2.1. Note that poles
A
',
B
', and
C
' repre-sent the start of each of the phase windings, whereas poles
A
,
B
, and
C
represent the ends of each of thewindings. As with transformers, the windings of the generator can be connected in either of two ways:
•
Wye configuration.
A circuit arrangement in which the schematic diagram of the windings forms a Y.•
Delta configuration.
A circuit arrangement in which the schematic diagram of the windings forms adelta.
Figure 2.2 illustrates the connection arrangements.The generator shown in Figure 2.1 is a rotating-field type of device. A magnetic field is developed by an
external dc voltage. Through electromagnetic induction, a current is induced into each of the stationary(
stator
) coils of the generator. Because each of the phase windings is separated by 120°, the output voltage ofthe generator also is offset for each phase by 120° (Figure 2.3). Three-phase power is used almost exclusivelyfor power distribution because it is an efficient method of transporting electrical energy.
2.2.1 Operating Principles
The operation of a generator is based on Faraday’s law of electromagnetic induction [1]: If a coil (or wind-ing) is linked to a varying magnetic field, then an electromotive force (emf or voltage) is induced across thecoil. Thus, generators have two essential parts: one that creates a magnetic field, and the other where the emfenergies are induced. The magnetic field is typically generated by electromagnets; thus, the field intensitycan be adjusted for control purposes. These windings are referred to as
field windings
or
field circuits
. Thecoils where the emf energies are induced are called
armature windings
or
armature circuits
. One of these twocomponents is stationary (the stator), and the other is a rotational part (the rotor) driven by an externaltorque. Conceptually, it is immaterial which of the two components is intended to rotate because, in eithercase, the armature circuits always experience a varying magnetic field. However, practical considerationslead to the common design that for ac generators, the field windings are mounted on the rotor and thearmature windings on the stator.
Today, most electric power is produced by synchronous generators that rotate at a constant speed (the
synchronous speed
). This speed is dictated by the operating frequency of the system and the machine
© 2007 by Taylor & Francis Group, LLC

36
AC Power Systems Handbook
structure. AC generators are also used that do not necessarily rotate at a fixed speed, such as those foundin windmills (
induction generators
); these generators, however, account for only a small percentage of thepower generated today.
Figure 2.1
Simplified diagram of a three-phase ac generator.
Figure 2.2
Generator circuit configurations: (
a
) wye; (
b
) delta.
Phase A
A
N
S
To dcsource
BC
A′
C′B′ PhaseC
Electromagneticrotor assembly
Phase B
Stator coils(phase windings)
Line 3
Line 2
Line 1
VL
VL
VP
VPVP
A
C
(a)
C′
B′A′
B VLIP
IP
IP
Line 1
Line 2
Line 3
VP
VP
VP
IP IP
(b)
C′
B′
A′
A
C
B
VL
VL
VLIP
© 2007 by Taylor & Francis Group, LLC

Power-Generation Systems
37
For a better understanding of the principles of opera-tion, see Figure 2.4, which shows a cross section of a basicac machine. The rotor consists of a winding wrappedaround a steel body. A dc current is made to flow in therotor winding (or field winding), and this results in a mag-netic field (rotor field). When the rotor is made to rotate ata constant speed, the three stationary windings
aa
',
bb
',and
cc
' experience a periodically varying magnetic field.Thus, an emf is induced across these windings in accor-dance with Faraday’s law. These forces are ac and periodic;each period corresponds to one revolution of the rotor.Thus, for 60 Hz electricity, the rotor must spin at 3600 rev-olutions per minute (rpm); this is the synchronous speedof the machine. Because the windings
aa
',
bb
', and
cc
' aredisplaced equally in space from each other (by 120°), theiremf waveforms are displaced in time by one third of aperiod. In other words, the machine is capable of generat-ing three-phase electricity.
When the stator windings are connected to an exter-nal (electrical) system to form a closed circuit, thesteady-state currents in the windings are also periodic.This revolving field arises from the space displacements ofthe windings and the phase differences of their currents.The combined magnetic field has two poles and rotates atthe same speed and direction as the rotor. It is importantto observe that the armature circuits are in fact exposed totwo rotating fields, one of which (the armature field) iscaused by and tends to counter the effect of the other (therotor field). The end result is that the induced emf in thearmature can be reduced when compared with anunloaded machine (i.e., open-circuited stator windings).This phenomenon is referred to as
armature reaction.
It is possible to build a machine with
p
poles, where
p
= 4, 6, 8, … (even numbers). For example, the cross-sec-tional view of a four-pole machine is illustrated in Figure 2.5. For the specified direction of the (dc) cur-rent in the rotor windings, the rotor field has two pairs of north and south poles, arranged as shown. Theemf induced in a stator winding completes one period for every pair of north and south poles sweepingby; thus, each revolution of the rotor corresponds to two periods of the stator emf. If the machine is tooperate at 60 Hz, then the rotor needs to rotate at 1800 rpm. In general, a
p-
pole machine operating at 60Hz has a rotor speed of 3600/(
p
/2) rpm. That is, the lower the number of poles, the higher the rotor speedmust be. In practice, the number of poles is dictated by the mechanical system (the
prime mover
) thatdrives the rotor. Steam turbines operate best at a high speed; thus, two- or four-pole machines are suit-able. Machines driven by hydro turbines usually have more poles and operate at lower speeds.
The stator windings are typically arranged so that the resulting armature field has the same numberof poles as the rotor field. In practice, there are many possible ways to arrange these windings. The essen-tial idea, however, can be understood by studying the arrangement shown in Figure 2.5. Each phase con-sists of a pair of windings and thus occupies four slots on the stator structure. For example, those forphase
a
are labeled
a
1
a
1
' and
a
2
a
2
'. Geometry suggests that, at any time instant, equal electromotive forcesare induced across the windings of the same phase. If the individual windings are connected in series, asshown in Figure 2.5, their energies add up to form the phase voltage.
PhaseA
PhaseB
PhaseC
30° 90° 150° 270°
60° 120° 180° 240° 300° 360°
0° 210° 330°
Figure 2.3 Output waveform of a three-phase generator.
a a′
b′ c
N
S
+
bc′
Figure 2.4 Cross section of a simple two-polesynchronous machine. (From [1]. Used withpermission.)
© 2007 by Taylor & Francis Group, LLC

38
AC Power Systems Handbook
In addition to the basic components of a synchronous generator (the rotor, stator, and their wind-ings), auxiliary devices are used to help maintain the machine’s operation within acceptable limits. Thesedevices include the following:
•
Governor
. The function of the governor is to control the mechanical power input to the generator.The control is via a feedback loop where the speed of the rotor is constantly monitored. Forinstance, if this speed falls behind the synchronous speed, the input is insufficient and has to beincreased. This is accomplished by opening a valve to increase the amount of steam for turbogen-erators or the flow of water through the penstock for hydrogenerators. Governors are mechanicalsystems and, therefore, usually have some significant time lags (many seconds) compared to otherelectromagnetic parameters associated with the machine.
•
Damper windings
(
armortisseur windings
). These windings are special conducting bars buried innotches on the rotor surface (the rotor resembles a squirrel-cage-rotor induction machine). Thedamper windings provide an additional stabilizing force for the machine during certain periodsof operation. As long as the machine is in a steady state, the stator field rotates at the same speedas the rotor, and no currents are induced in the damper windings. However, when the speeds ofthe stator field and the rotor become different (because of a load disturbance), currents are inducedin the damper windings in such a way as to keep the two speeds from separating.
•
Excitation control system
. Modern excitation systems are fast andefficient. An excitation control system is a feedback loopdesigned to maintain the voltage at the machine terminals at aset level. Figure 2.6 illustrates the mechanisms at work. Assumethat a disturbance occurs in the system, and as a result, themachine terminal voltage
V
t
drops. The excitation system booststhe internal voltage
E
F
.
This action can increase the voltage
V
t
and also tends to increase the reactive power output.
From a system viewpoint, the two controlling mechanisms ofexcitation and the governor rely on local information (the machineterminal voltage and rotor speed). In other words, they are
decen-tralized controls
. For large-scale systems, such designs do not alwaysguarantee stable behavior because the effects of the interconnectionsystem and other elements in the network are not taken into account.An analysis of the operation of centralized control systems is beyondthe scope of this book; however, it is instructive to examine some of
Figure 2.5
A four-pole synchronous machine: (
a
) cross section of the machine; (
b
) schematic diagram for the phase
a
windings. (
From
[1].
Used with permission
.)
a1
a2
a1 +
ν
−
+
ν
−
a2
c1
b1
N
N
S
Sa′1
a′1
a′2
a′2
Ia jXS Ra
EaEF Vt
− −
+ +
Figure 2.6 The per-phase equiva-lent circuit of a round-rotor syn-chronous machine. EF is theinternal voltage (phasor form)and Vt is the terminal voltage.(From [1]. Used with permission.)
© 2007 by Taylor & Francis Group, LLC

Power-Generation Systems
39
the principles of decentralized control systems. Many of these principles apply in a modified form tocentralized control techniques.
2.2.2 Control Techniques
Reliable electric power service implies that the loads are fed at a constant voltage and frequency at alltimes [1]. A stable power system is one in which the synchronous machines, if perturbed, will return totheir original state if there is no net change in power, or stabilize at a new state without loss of synchroni-zation. The machine rotor angle is used to quantify stability; that is, if the difference in the angle betweenmachines increases or oscillates for an extended period of time, the system is considered unstable. The
swing equation,
given by
(2.1)
governs the motion of the machine rotor.
J
is moment of inertia,
δ
m
is mechanical torque angle withrespect to a rotating reference,
ω
m
is shaft angular velocity, and
T
a
is the accelerating torque. Two factorsthat act as criteria for the stability of a generating unit are the angular swing of the machine during andfollowing fault conditions, and the time it takes to clear the transient swing.
The mechanical torque of the prime mover — team or hydraulic — for a large generator depends onrotor speed. In an unregulated machine, the torque speed characteristic is linear over the rated range ofspeeds. The prime mover speed of a machine will drop in response to an increased load, and the valveposition must be opened to increase the speed of the machine. In a regulated machine (governor con-trolled), the speed control mechanism controls the throttle valves to the steam turbine or the gate posi-tion for a water turbine.
Automatic voltage regulation can be used toadjust the field winding current, thus changing
E
g
as the load on the machine is varied (Figure2.7). If the power output of a generator is to beincreased while an automatic voltage regulatorholds the bus voltage at a constant value, thenthe field winding current must be increased. Themaximum voltage output of a machine is limitedby the maximum voltage of the excitor supplyingthe field winding. Figure 2.8 illustrates control ofa power-generating unit.
The performance of a transmission systemcan be improved by reactive compensation of aseries or parallel type. Series compensation consists of banks of capacitors placed in series with eachphase conductor of the line and is used to reduce the series impedance of the line, which is the principalcause of voltage drop. Shunt compensation consists of inductors placed from each line to neutral and isused to reduce the shunt susceptance of the line.
Figure 2.8
Block diagram of a generating control system
(From [1]. Used with permission.)
J J Tm m aδ ω= =
Xload
Rload
XlineRlineXg
Ia
EgSG
VS
Figure 2.7 The basic power circuit of a generating system;. (From [1]. Used with permission.)Vs Eg IaXg–=
Boilerhydraulic
rotorTurbine
GovernorExcitor
Throttleor gate
Setpoint
Generator Power
Voltageregulator
Vrefwref
wm
Σ Σ
© 2007 by Taylor & Francis Group, LLC

40
AC Power Systems Handbook
2.3 Power-Generating Systems
Electrical power can be produced in many ways, including chemical reactions, heat, light, or mechanicalenergy. Most electrical power produced today is through hydroelectric plants and nuclear energy, and byburning coal, oil, or natural gas. Fossil fuel and nuclear-fission plants use steam turbines to deliver themechanical energy required to rotate large three-phase generators, which produce massive quantities ofelectrical power. Generators used in such facilities usually are classified as high-speed units, operating at3600 rpm to produce a 60 Hz output frequency. Hydroelectric systems use hydraulic turbines, mountedvertically to intercept the flow of water to produce electrical energy. Most hydroelectric facilities use low-speed generators, operating at from 120 to 900 rpm to produce 60 Hz. It follows that a larger number ofpoles are required for a low-speed generator.
Fossil fuels, used as a source of heat, are burned to produce steam in a boiler system. The steam thendrives one or more generators. Coal and coke are used commonly to produce energy in this manner.Other fossil fuel sources include oil and natural gas.
A nuclear power plant is basically a fossil fuel facility with a nuclear power source to produce heatand then steam. Nuclear fission is a complex process that results in the division of the nucleus of an atominto two nuclei. This splitting of the atom is initiated by bombardment of the nucleus with neutrons,gamma rays, or other charged particles.
A hydroelectric system is the simplest of all power plants. Flowing water from a reservoir is chan-neled through a control gate that directs water to the blades of a hydraulic turbine. The turbine, in turn,drives one or more generators. Although simple in design and efficient in operation, hydroelectric sys-tems are limited by the availability of a water reservoir.
Concern about the burning of fossil fuels and the safety of nuclear power has led to the developmentof alternative fuel sources for turbine-driven power plants. Power-generating systems now in operationinclude:
• Geothermal systems, which utilize the heat of a molten mass in the interior of the earth to producesteam, which drives a turbine generator. Such systems are efficient and simple, but their placementis limited to areas of geothermal activity.
• Wind systems, which use a number of small generators mounted on supports and attached topropeller-type blades to intercept prevailing winds. Naturally, generator output is determined bywind activity, limiting the use of these systems on any large scale.
Significant variations in load requirements must be satisfied at different times by a generating plant.Because of wide variations in load demands, much of the generating capability of a facility may beunused during low-demand periods. Two mathematical ratios commonly are used to measure utility ser-vice:
•
Load factor
. The average load for a given period divided by the peak load for that same period.•
Capacity factor
. The average load for a given period divided by the output capacity of the powerplant.
Under ideal conditions, both the load factor and the capacity factor are unity (100%). Commercial powersystems use a number of three-phase generators connected in parallel, and synchronized in phase, to sup-ply the load requirements.
Table 2.1 lists general technical details for different types of common power plants.
2.3.1 Fossil Fuel Power Plants
The most frequently used fuels for large-scale power generation are oil, natural gas, and coal [3]. Figure2.9 illustrates the principal elements of a fossil fuel power plant. Fuel handling includes transport by rail,on ships, or through pipelines. A power plant usually maintains several days of fuel reserve at any one
© 2007 by Taylor & Francis Group, LLC

Power-Generation Systems
41
time. Oil and gas are stored in large metal tanks, and coal is kept in open yards. The temperature of thecoal layer must be monitored carefully to avoid self-ignition.
Oil is pumped and gas is fed to the burners of the boiler. Coal is pulverized in large mills, and thepowder is mixed with air and transported by air pressure, through pipes, to the burners. The coal trans-port from the yard to the mills requires automated transporter belts, hoppers, and sometimes manuallyoperated bulldozers.
Two types of boilers are used in modern power plants: the
subcritical
water-tube drum-type and the
supercritical
once-through type. The former operates around 2500 psi, which is below the water criticalpressure of 3208.2 psi. The latter operates above that pressure, at approximately 3500 psi. The super-heated steam temperature is about 1000°F (540°C) because of turbine temperature limitations.
A typical subcritical water-tube drum-type boiler has an inverted-U shape, as illustrated in Figure2.10. On the bottom of the rising part is the furnace where the fuel is burned. The walls of the furnace are
Table 2.1
Power Plant Technical Data (
After
[2].)
Power Generation TypeTypical Size
(MW)Capitalized Plant
Cost ($/kW)Construction Lead
Time (Yr)Heat Rate
(BTU/kWh)
Fuel Type
Nuclear 1,200 2,400 10 10,400 UraniumPulverized coal/steam 500 1,400 6 9,900 CoalAtmospheric fluidized bed 400 1,400 6 9,800 CoalGas turbine 100 350 2 11,200 Natural gasCombined-cycle 300 600 4 7,800 Natural gasCoal-gasification
combined-cycle300 1,500 6 9,500 Coal
Pumped storage hydro 300 1,200 6 – –Conventional hydro 300 1,700 6 – –
Figure 2.9
Primary components of a fossil fuel power plant: (
a
) system block diagram; (
b
) common configurationof turbine/generator system. (
From
[3].
Used with permission.
)
FuelFuel
handling Boiler
(a)
Smokestack
Ash, slurry
Feed water Watertreatment
Turbine
Water/steam
Condenser
Cooling water
Cooling loweror pond, river
Coolingsystem
Generator
Coal, gas, oil SteamMechanical
energyElectrical
energy
Excitation powercomponents
Collectorhousing
Controlled powerrectifier assembly
(b)
Generator
Steamturbine
© 2007 by Taylor & Francis Group, LLC

42
AC Power Systems Handbook
covered by water pipes. The drum and the superheater are at the top of the boiler. The falling part of theU houses the reheaters, economizer (water heater), and air preheater, which is supplied by theforced-draft fan. The induced-draft fan forces the flue gases out of the system and sends them up thestack, which is located behind the boiler. This steam generator has three major systems:
•
Fuel system
.
Fuel is mixed with air and injected into the furnace through burners. The burnersare equipped with nozzles, which are supplied by preheated air and carefully designed to assurethe optimum air-fuel mix. The fuel mix is ignited by oil or gas torches. The furnace temperatureis around 3000°F.
•
Air-flue gas system
.
Ambient air is driven by the forced-draft fan through the air preheater, whichis heated by the high-temperature (600°F) flue gases. The air is mixed with fuel in the burnersand enters the furnace, where it supports the fuel burning. The hot combustion flue gas generatessteam and flows through the boiler to heat the superheater, reheaters, economizer, and otherrelated systems. Induced-draft fans, located between the boiler and the stack, increase the flowand send the 300°F flue gases to the atmosphere through the stack.
•
Water-steam system
.
Large pumps drive the feedwater through the high-pressure heaters andthe economizer, which further increases the water temperature (400 to 500°F). The former isheated by steam removed from the turbine; the latter is heated by the flue gases. The preheatedwater is fed to the steam drum. Insulated tubes called
downcomers are located outside the furnaceand lead the water to a header. The header distributes the hot water among the risers. Thesewater tubes line the furnace walls. The water tubes are heated by the combustion gases throughboth connection and radiation. The steam generated in these tubes flows to the drum, whereit is separated from the water. Circulation is maintained by the density difference between thewater in the downcomer and the water tubes. Saturated steam, collected in the drum, flowsthrough the superheater. The superheater increases the steam temperature to about 1000°F. Drysuperheated steam drives the high-pressure turbine. The exhaust from the high-pressure turbinegoes to the reheater, which again increases the steam temperature. The reheated steam drivesthe low-pressure turbine.
Figure 2.10 Flow diagram of a typical drum-type steam boiler. (From [4]. Used with permission.)
Freewaterregulator
Saturated steam
Steamdrum
SuperheaterAttemperators To high-pressure turbine
From high-pressureturbine
Flue gasto stock
Induced-draft fan
Air
Air preheater
Forceddraft fan
EconomizerReheater
Downcorner
Water
Air
Fuelair
Header
Watertubes
(risers)
Feedwaterfrom
high-pressurefeedwater
heater
To low-pressure turbine
Prim
ary
Seco
ndar
y
© 2007 by Taylor & Francis Group, LLC

Power-Generation Systems 43
The typical supercritical once-through-type boiler conceptis shown in Figure 2.11. The feedwater enters through the econ-omizer to the boiler, which consists of riser tubes that line thefurnace wall. All the water is converted to steam and fed directlyto the superheater. The latter increases the steam temperatureabove the critical temperature of the water and drives the tur-bine. The construction of these steam generators is more expen-sive than the drum-type units but has a higher overall operatingefficiency.
The turbine converts the heat energy of the steam intomechanical energy. Modern power plants typically use onehigh-pressure and one or two lower-pressure turbines.High-pressure steam enters the high-pressure turbine to flowthrough and drive the turbine. The exhaust is reheated in theboiler and returned to the lower-pressure units. Both the rotorand the stationary part of the turbine have blades. The length ofthe blades increases from the steam entrance to the exhaust. Figure 2.12 shows the blade arrangement ofan impulse-type turbine. Steam enters through nozzles and flows through the first set of moving rotorblades. The following stationary blades change the direction of the flow and direct the steam into the nextset of moving blades. The nozzles increase the steam speed and reduce pressure, as shown in the figure.The impact of the high-speed steam, generated by the change of direction and speed in the movingblades, drives the turbine.
In a fossil fuel plant, the generator converts mechanical energy from the turbines into electricalenergy. The stator typically has a laminated and slotted silicon steel iron core. The stacked core isclamped and held together by insulated axial through bolts. The stator winding is placed in the slots andconsists of a copper-strand configuration with woven glass insulation between the strands and micaflakes, mica mat, or mica paper groundwall insulation. To avoid insulation damage caused by vibration,the groundwall insulation is reinforced by asphalt, epoxy-impregnated fiberglass, or Dacron. Most fre-quently, the stator is hydrogen-cooled; however, small units may be air-cooled, and very large units maybe water-cooled. The solid steel rotor has slots milled along the axis. The multiturn copper rotor windingis placed in the slots and cooled by hydrogen. Cooling is enhanced by subslots and axial cooling passages.The rotor winding is restrained by wedges inserted in the slots.
Figure 2.12 Velocity and pressure variation in an impulse turbine. (From [3]. Used with permission.)
Superheater
Economizer
Boiler
Superheatedsteam
Feed water
Figure 2.11 Block diagram of a once-through-type steam generator. (From[3]. Used with permission.)
Movingblade
Nozzle
Pres
sure
Velo
city
Stationaryblade
Movingblade
Stationaryblade
© 2007 by Taylor & Francis Group, LLC

44 AC Power Systems Handbook
The rotor winding is supplied by dc current, either directly by a brushless excitation system orthrough collector rings. The nondrive-end bearing is insulated to avoid shaft current generated by straymagnetic fields. The hydrogen is cooled by a hydrogen-to-water heat exchanger mounted on the genera-tor or installed in a closed-loop cooling system.
The condenser condenses turbine exhaust steam to water, which is pumped back to the steam gener-ator through various water heaters. This condensation produces a vacuum, which is necessary to exhaustthe steam from the turbine. The condenser usually is a shell-and-tube heat exchanger, where steam con-denses on water-cooled tubes. Cold water is obtained from the cooling towers or other cooling systems.The condensed water is fed through a deaerator, which removes absorbed gases from the water. Next, thegas-free water is mixed with the feedwater and returned to the boiler. The gases absorbed in the watermay cause corrosion and increase condenser pressure, adversely affecting efficiency. Older plants use aseparate deaerator heater, whereas deaerators in modern plants are usually integrated in the condenser,where injected steam jets produce a pressure drop and remove absorbed gases.
2.3.2 Nuclear Power Plants
There are approximately 500 nuclear power plants operating around the world [3]. Close to 300 operatepressurized water reactors (PWRs), more than 100 are built with boiling-water reactors (BWRs), about 50use gas-cooled reactors, and the rest are heavy-water reactors. In addition, a few fast breeder reactors are inoperation. These reactors are built for better utilization of uranium fuel. The modern nuclear plant sizevaries from 100 to 1200 MW.
The general arrangement of a PWR power plant is shown in Figure 2.13a. The reactor heats thewater from about 550 to approximately 650°F. High pressure, at about 2235 psi, prevents boiling. Pres-sure is maintained by a pressurizer, and the water is circulated by a pump through a heat exchanger. Theheat exchanger evaporates the feedwater and generates steam, which supplies a system similar to a con-ventional power plant. The advantage of this two-loop system is the separation of the potentially radioac-tive reactor cooling fluid from the water-steam system.
The reactor core consists of fuel and control rods. Grids hold both the control and fuel rods. The fuelrods are inserted in the grid following a predetermined pattern. The fuel elements are Zircaloy-clad rodsfilled with UO2 pellets. The control rods are made of a silver, cadmium, and indium alloy protected bystainless steel. The reactor operation is controlled by the position of the rods. In addition, control rodsare used to shut down the reactor. The rods are released and fall in the core when emergency shutdown isrequired. Cooling water enters the reactor from the bottom, flows through the core, and is heated bynuclear fission.
In the BWR, shown in Figures 2.13b and 2.14, the pressure is low (about 1000 psi). The nuclear reac-tion heats the water directly to evaporate it and produce wet steam at about 545°F. The remaining water isrecirculated and mixed with feedwater. The steam drives a turbine that typically rotates at 1800 rpm. The
Figure 2.13 Types of nuclear power plants: (a) pressurized water reactor; (b) boiling-water reactor. (From [3]. Usedwith permission.)
Pressurizer
Heatexchanger Heater
(a) (b)
Pump Heater Pump
Cond
ense
r
Cond
ense
r
Turbine Turbine
Streamseparator
Reac
tor
Reac
tor
© 2007 by Taylor & Francis Group, LLC
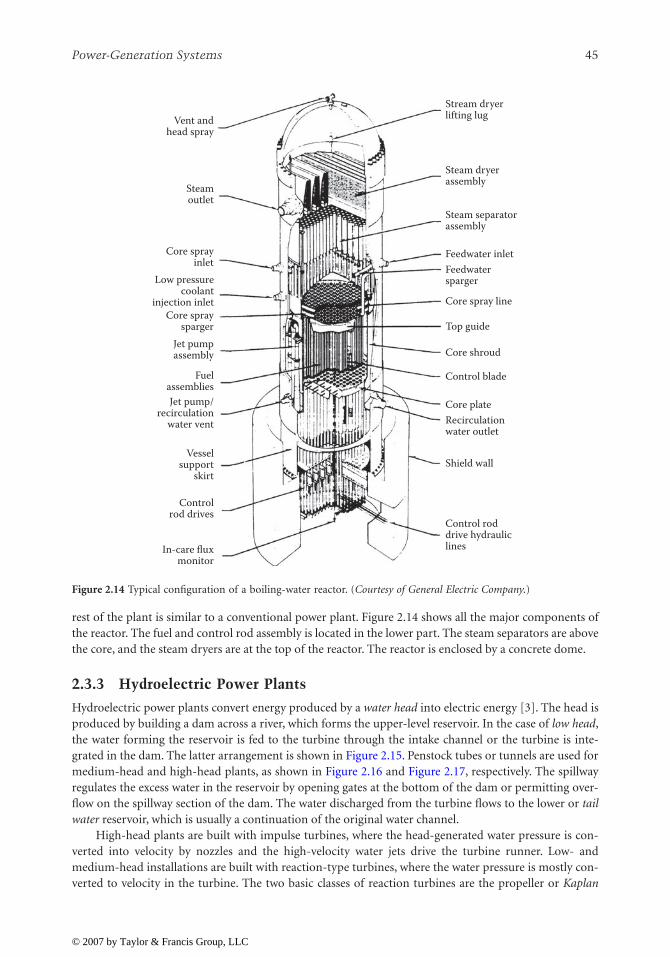
Power-Generation Systems 45
rest of the plant is similar to a conventional power plant. Figure 2.14 shows all the major components ofthe reactor. The fuel and control rod assembly is located in the lower part. The steam separators are abovethe core, and the steam dryers are at the top of the reactor. The reactor is enclosed by a concrete dome.
2.3.3 Hydroelectric Power Plants
Hydroelectric power plants convert energy produced by a water head into electric energy [3]. The head isproduced by building a dam across a river, which forms the upper-level reservoir. In the case of low head,the water forming the reservoir is fed to the turbine through the intake channel or the turbine is inte-grated in the dam. The latter arrangement is shown in Figure 2.15. Penstock tubes or tunnels are used formedium-head and high-head plants, as shown in Figure 2.16 and Figure 2.17, respectively. The spillwayregulates the excess water in the reservoir by opening gates at the bottom of the dam or permitting over-flow on the spillway section of the dam. The water discharged from the turbine flows to the lower or tailwater reservoir, which is usually a continuation of the original water channel.
High-head plants are built with impulse turbines, where the head-generated water pressure is con-verted into velocity by nozzles and the high-velocity water jets drive the turbine runner. Low- andmedium-head installations are built with reaction-type turbines, where the water pressure is mostly con-verted to velocity in the turbine. The two basic classes of reaction turbines are the propeller or Kaplan
Figure 2.14 Typical configuration of a boiling-water reactor. (Courtesy of General Electric Company.)
Vent and head spray
Stream dryer lifting lug
Steam dryer assembly
Steam separator assembly
Feedwater inlet Feedwater sparger
Core spray line
Top guide
Core shroud
Control blade
Core plate
Shield wall
Control rod drive hydraulic lines
Recirculation water outlet
Steam outlet
Core spray inlet
Low pressurecoolant
injection inletCore spray
sparger Jet pump assembly
Fuel assemblies Jet pump/
recirculation water vent
Vessel support
skirt
Control rod drives
In-care flux monitor
© 2007 by Taylor & Francis Group, LLC

46 AC Power Systems Handbook
type, mostly used for low-head plants, and the Francis type, primarily used for medium-head plants. Thecross section of a typical low-head Kaplan turbine is shown in Figure 2.18.
The vertical shaft turbine and generator are supported by a thrust bearing immersed in oil. The gen-erator is in the upper, watertight chamber. The turbine runner has 4 to 10 propeller types and adjustable-pitch blades. The blades are regulated from 5 to 35° by an oil-pressure-operated servomechanism. Thewater is evenly distributed along the periphery of the runner by a concrete spiral case and regulated byadjustable wicket blades. The water is discharged from the turbine through an elbow-shaped draft tube.The conical profile of the tube reduces the water speed from the discharge speed of 10 to 30 ft/s to 1 ft/s toincrease turbine efficiency.
The hydrogenerator is a low-speed (usually 120 to 360 rpm) salient-pole machine with a verticalshaft. The typical number of poles ranges from 20 to 72. They are mounted on a pole spider, which is awelded, spoked wheel. The spider is mounted on the forged steel shaft. The poles are built with a lami-nated iron core and stranded copper winding. Damper bars are built in the pole faces. The stator is builtwith a slotted, laminated iron core that is supported by a welded steel frame. Windings are made ofstranded conductors insulated between the turns by fiberglass or Dacronglass. The ground insulation isformed from multiple layers of mica tape impregnated with epoxy or polyester resins. Older machines useasphalt and mica tape insulation, which is sensitive to corona-discharge-caused insulation deterioration.
Figure 2.15 Low-head hydroelectric power plant. (From[4]. Used with permission.)
Figure 2.16 Medium-head hydroelectric power plant. (From [4]. Used with permission.)
Tail waterHead water
Powerhouse
Spillwayand dam
Controlgates
Dam and spillway
Control gates
Forebay
Gate houseCanal wall
Headwater
Canalinlakegates
Water level
Penstocks
Tailwater
Canalinlakegates
Powerhouse
Powerhouse
Canal
© 2007 by Taylor & Francis Group, LLC

Power-Generation Systems 47
Direct water cooling is used for very large machines, whereas the smaller ones are air- or hydrogen-cooled.Some machines use forced-air cooling with an air-to-water heat exchanger. A braking system is installed inlarger machines to stop the generator rapidly when necessary.
Figure 2.17 High-head hydroelectric power plant. (From [4]. Used with permission.)
Figure 2.18 Typical low-head hydroelectric power plant with a Kaplan turbine. (From [4]. Used with permission.)
Dam andspillway
Pipe line
Pipe line
Pipe lineTunnelPenstock
PenstockRock
tunnel
Intake towerSurge tank Head
water
Tailwater
Power house
H.W.elevation
Surge tank
Intake tower
Tailwater
Wicket gate
Generator
Governor cabinet
Power house Cranes
Gate
Runner
Headwater
Gate
Draft tube
© 2007 by Taylor & Francis Group, LLC

48 AC Power Systems Handbook
2.4 References
1. Sankaran, C., “Transformers,” in The Electrical Engineering Handbook, R. C. Dorf (Ed.), p. 33,CRC Press, Boca Raton, FL, 1993.
2. Stoll, H. G., Least-Cost Electric Utility Planning, John Wiley & Sons, New York, 1989.3. Karady, G., “Conventional Power Generation,” in The Electrical Engineering Handbook, R. C. Dorf
(Ed.), p. 1193, CRC Press, Boca Raton, FL, 1993.4. Fink, D. G., Standard Handbook for Electrical Engineers, McGraw-Hill, New York, 1978.
2.5 Bibliography
Fardo, S., and D. Patrick, Electrical Power Systems Technology, Prentice-Hall, Englewood Cliffs, NJ, 1985.Fink D., and D. Christiansen (Eds.), Electronics Engineers’ Handbook, 3rd ed., McGraw-Hill, New York,
1989.
© 2007 by Taylor & Francis Group, LLC

49
3
Power Factor
3.1 Introduction
Power factor
(PF) is an important, but often misunderstood, element of ac power system design and opera-tion. It is defined as the ratio of
true power
to
apparent power
, generally expressed as a percentage. (PF alsomay be expressed as a decimal value.) Reactive loads (inductive or capacitive) act on power systems to shiftthe current out of phase with the voltage. The cosine of the resulting angle between the current and voltage isthe power factor.
3.2 Fundamental Principles
A utility line that is feeding an inductive load (which is most often the case) is said to have a
lagging
powerfactor, whereas a line feeding a capacitive load has a
leading
power factor. (See Figure 3.1.) A poor power fac-tor will result in excessive losses along utility company feeder lines because more current is required to sup-ply a given load with a low power factor than the same load with a power factor close to unity.
For example, a motor requiring 5 kW from the line is connected to the utility service entrance. If it hasa power factor of 86%, the apparent power demanded by the load will be 5 kW divided by 86%, or morethan 5.8 kW. The true power is 5 kW, and the apparent power is 5.8 kW. The same amount of work is beingdone by the motor, but the closer the power factor is to unity, the more efficient the system. To expand uponthis example, for a single-phase electric motor, the actual power is the sum of several components, namely:
• The work performed by the system, specifically lifting, moving, or otherwise controlling an object• Heat developed by the power that is lost in the motor winding resistance• Heat developed in the motor iron through eddy-current and hysteresis losses• Frictional losses in the motor bearings• Air friction losses in turning the motor rotor
All these values are expressed in watts or kilowatts, and can be measured with a wattmeter. Theyrepresent the actual power. The apparent power is determined by measuring the current and voltage withan ammeter and a voltmeter, then calculating the product of the two. In the single-phase motor example,the apparent power thus obtained is greater than the actual power. The reason for this is the power factor.
The PF reflects the differences that exist between different types of loads. A soldering iron is a purelyresistive load that converts current directly into heat. The current is called actual current because it contrib-utes directly to the production of actual power. On the other hand, single-phase electric motor represents apartially inductive load. The motor current consists of actual current that is converted into actual power anda
magnetizing current
that is used to generate the magnetic field required for operation of the device. Thismagnetizing current corresponds to an exchange of energy between the power source and the motor, but it isnot converted into actual power. This current is identified as the reactive current in the circuit.
As illustrated in Figure 3.2, in a resistive circuit, the current is in phase with the voltage. In a purelyinductive circuit, the current lags the voltage by 90˚. This relationship can be represented graphically by vec-tors, as shown in the figure. For a circuit with both inductive and resistive components, as in the motorexample, the two conditions exist simultaneously. The distribution between the actual power and the reac-tive power is illustrated in Figure 3.3. The power factor, which has been defined previously as the ratiobetween actual power and apparent power, is also the cosine of the angle
θ
. The greater the angle
θ
becomes,the lower the power factor.
© 2007 by Taylor & Francis Group, LLC

50
AC Power Systems Handbook
Determining the power factor for a given elementof a power-distribution system is complicated by thevariety of loads typically connected. Different loadspresent different PF components:
•
Lighting
.
The PF for most incandescent lampsis unity. Fluorescent lamps usually have a lowpower factor; 50% is typical. Fluorescent lampssometimes are supplied with compensationdevices to correct for low power factor. Mercuryvapor lamps have a low PF; 40 to 60% is typical. Again, such devices can be supplied withcompensation devices.
•
Electric motors
.
The PF of an induction motor varies with the load, as shown in Figure 3.4.Unloaded or lightly loaded motors exhibit a low PF. Figure 3.5 illustrates the variation of PF andreactive power for varying loads on a three-phase induction motor. Synchronous motors provide
Figure 3.1
The mathematical relationships of an inductive circuit as they apply to power factor (PF) measurements.Reducing the kVAR component of the circuit causes
θ
to diminish, improving the PF. When kW is equal to kVA,the phase angle is zero and the power factor is unity (100% ).
Figure 3.2
The effects of inductance in a circuit: (
a
) waveforms for resistive and inductive loads; (
b
) vector diagramsof inductive loads.
kW (true power)
kVA
R (r
eact
ive
pow
er)
kVA (apparent power)
θ = The phase angle, a measure of the net amount of inductive reactance in the circuit. kW = The true power that performs the “real work” done by the electrical circuit (measured in kilowatts). kVA = The apparent power drawn by a reactive load (measured in kilowatts). kVAR = The kilovolt-ampers-reactive component of an inductive circuit. The kVAR component (also known as the phantom power) provides the magnetizing force necessary for operation of inductive loads.
θ
Cos θ = kW = PFkVA
Sin θ = kVARkVA
Timea
(a)
b c
ResistanceInduction
motorInductanceVoltage
Resistivecircuit
Voltage
Actualcurrent
Apparentcurrent
Reactivecurrent
Inductionmotor
Inductivecircuit
(b)
Θ
Θ
Actualpower
Apparentpower
Reactivepower
Θ
Figure 3.3 Vector diagram showing that apparentpower is the vector sum of the actual and thereactive power in a circuit.
© 2007 by Taylor & Francis Group, LLC

Power Factor
51
good PF when their excitation is adjusted properly. Synchronous motors also can be
overexcited
to exhibit a leading power factor and, therefore, can be used to improve the power factor of afacility.
•
Heating systems
.
Most heating systemsused in ovens or dryers present a PF ofclose to unity.
•
Welding equipment
.
Electric arc weldersusually have a low PF; 60% is typical.
•
Distribution transformers
.
The PF of atransformer varies considerably as a func-tion of the load applied to the device, aswell as the design of the transformer. Anunloaded transformer would be highlyinductive and, therefore, would exhibit alow PF.
Power factor, in the classical power triadrepresentation presented here, is more appropri-ately referred to as
displacement power factor
(DPF). DPF is that portion of the power factorthat is attributable to phase displacementbetween the source voltage and the load current at the fundamental frequency [1]. The vector diagrampower triangle models real and reactive power at the fundamental frequency of the electrical power sys-tem. Displacement power factor does not consider that portion of the power factor attributable to har-monic load current.
The
total power factor
(TPF) can be derived by revisiting the definition of power factor as a measure-ment of efficiency. TPF, then, is the ratio of real power to total power consumed in the system:
(3.1)
where
TPF
= Total power factor
KW
= Real power consumed by the electrical system
kVA
total
= Total power (composed of real, reactive, and harmonic power)
The TPF in a system can be low because of high reactive power consumption or high harmonicpower consumption, resulting in high apparent power in the denominator. DPF is always greater thanTPF when harmonic load currents exist.
Figure 3.4
Changes in power factor for an induction motor as a function of motor loading.
Unloaded
Load
1/4 2/4 3/4 4/4 5/4
Powerfactor
86%84%80%73%55%17%
kVAR
Pow
er fa
ctor
1
0.8
0.6
0.4
0.2
0 20 40 60Load (kW) in % of rated power
80 100
20
40
60
80
100Powerfactor
Reactivepower
Figure 3.5 The relationship of reactive power and powerfactor to percentage of load for a 100 kW, three-phaseinduction motor.
TPF KWkVAtotal---------------------=
© 2007 by Taylor & Francis Group, LLC

52
AC Power Systems Handbook
3.3 PF Correction Techniques
The term
compensation
is used to describe the intentional insertion of reactive power devices, eithercapacitive or inductive, to achieve one or more desired effects in an electric power system. These effectsinclude improved voltage profiles, enhanced stability, and increased transmission capacity. The devicesare either in series or in shunt (parallel) with the load(s) at one or more points in the power circuit.
To keep the power factor as close as possible to 100%, utility companies place capacitor banks in par-allel with the load at various locations in the distribution system, offsetting the inductive loading (laggingpower factor) of most user equipment. The goal is to create an equal amount of leading PF in the systemto match the lagging PF of the load. When balanced, the power factor is 100%. In practice, this is seldomattainable because loads are switched on and off at random times, but utilities routinely maintain anoverall power factor of approximately 99%. To accomplish this, capacitor banks are switched automati-cally to compensate for changing load conditions. In addition,
static capacitors
are used for power factorcorrection. These devices are similar to conventional oil-filled, high-voltage capacitors. Operating volt-ages range from 230 V to 13.8 kV and higher for pole-mounted applications.
The PF correction capacitors are connected in parallel, with the utility lines as close as practical tothe low-PF loads. The primary disadvantage of static PF correction capacitors is that they cannot beadjusted for changing power factor conditions. Remotely operated relays can be used, however, to switchcapacitor banks in and out of the circuit as required. Synchronous capacitors, on the other hand, can beadjusted to provide varying capacitance to correct for varying PF loads. The capacitive effect of a syn-chronous capacitor is changed by varying the dc excitation voltage applied to the rotor of the device.
Utilities usually pass on to customers the costs of operating low-PF loads. Power factor can be billedas one, or a combination, of the following:
• A penalty for PF below a predetermined value or a credit for PF above a predetermined value• An increasing penalty for decreasing PF• A charge on monthly kVAR hours• A straight charge for the maximum value of kVA used during the month
Aside from direct costs from utility companies forlow-PF operation, the end user experiences a numberof indirect costs, as well. When a facility operates witha low overall PF, the amount of useful electrical energyavailable inside the plant at the distribution trans-former is reduced considerably because of the amountof reactive energy that the transformer(s) must carry.Figure 3.6 illustrates the reduction in available powerfrom a distribution transformer when presented withvarying PF loads. Figure 3.7 illustrates the increase in
I
2
R
losses in feeder and branch circuits with varyingPF loads. These conditions result in the need for over-sized cables, transformers, switchgear, and protectioncircuits.
The
copper losses
in a system are proportional tothe square of the load current. The installation of PFcorrection capacitors near offending low PF loads decreases the reactive power and load current drawnfrom the utility [17]. This reduced load current translates into lower conductor losses throughout theelectrical system. As copper losses are reduced, voltage levels increase throughout the system. This risecan be described by
(3.2)
kW1000
800
600
400
Out
put p
ower
200
01 0.8 0.6 0.4 0.2Power
factorFigure 3.6 The effects of power factor on the out-put of a transmformer.
VRkVARcb Zt×
kVAt--------------------------------=
© 2007 by Taylor & Francis Group, LLC
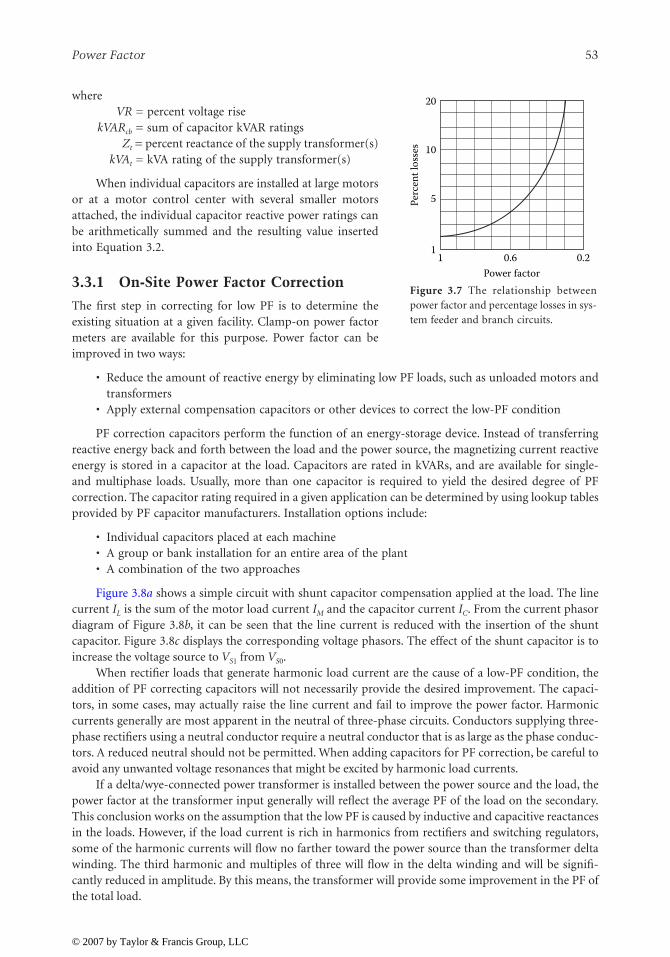
Power Factor
53
where
VR
= percent voltage rise
kVAR
cb
= sum of capacitor kVAR ratings
Z
t
= percent reactance of the supply transformer(s)
kVA
t
= kVA rating of the supply transformer(s)
When individual capacitors are installed at large motorsor at a motor control center with several smaller motorsattached, the individual capacitor reactive power ratings canbe arithmetically summed and the resulting value insertedinto Equation 3.2.
3.3.1 On-Site Power Factor Correction
The first step in correcting for low PF is to determine theexisting situation at a given facility. Clamp-on power factormeters are available for this purpose. Power factor can beimproved in two ways:
• Reduce the amount of reactive energy by eliminating low PF loads, such as unloaded motors andtransformers
• Apply external compensation capacitors or other devices to correct the low-PF condition
PF correction capacitors perform the function of an energy-storage device. Instead of transferringreactive energy back and forth between the load and the power source, the magnetizing current reactiveenergy is stored in a capacitor at the load. Capacitors are rated in kVARs, and are available for single-and multiphase loads. Usually, more than one capacitor is required to yield the desired degree of PFcorrection. The capacitor rating required in a given application can be determined by using lookup tablesprovided by PF capacitor manufacturers. Installation options include:
• Individual capacitors placed at each machine• A group or bank installation for an entire area of the plant• A combination of the two approaches
Figure 3.8
a
shows a simple circuit with shunt capacitor compensation applied at the load. The linecurrent
I
L
is the sum of the motor load current
I
M
and the capacitor current
I
C
. From the current phasordiagram of Figure 3.8
b
, it can be seen that the line current is reduced with the insertion of the shuntcapacitor. Figure 3.8
c
displays the corresponding voltage phasors. The effect of the shunt capacitor is toincrease the voltage source to
V
S
1
from
V
S
0
.When rectifier loads that generate harmonic load current are the cause of a low-PF condition, the
addition of PF correcting capacitors will not necessarily provide the desired improvement. The capaci-tors, in some cases, may actually raise the line current and fail to improve the power factor. Harmoniccurrents generally are most apparent in the neutral of three-phase circuits. Conductors supplying three-phase rectifiers using a neutral conductor require a neutral conductor that is as large as the phase conduc-tors. A reduced neutral should not be permitted. When adding capacitors for PF correction, be careful toavoid any unwanted voltage resonances that might be excited by harmonic load currents.
If a delta/wye-connected power transformer is installed between the power source and the load, thepower factor at the transformer input generally will reflect the average PF of the load on the secondary.This conclusion works on the assumption that the low PF is caused by inductive and capacitive reactancesin the loads. However, if the load current is rich in harmonics from rectifiers and switching regulators,some of the harmonic currents will flow no farther toward the power source than the transformer deltawinding. The third harmonic and multiples of three will flow in the delta winding and will be signifi-cantly reduced in amplitude. By this means, the transformer will provide some improvement in the PF ofthe total load.
20
10
5
11 0.6
Power factor0.2
Perc
ent l
osse
s
Figure 3.7 The relationship betweenpower factor and percentage losses in sys-tem feeder and branch circuits.
© 2007 by Taylor & Francis Group, LLC

54
AC Power Systems Handbook
An economic evaluation of the cost versus benefits, plus a review of any mandatory utility companylimits that must be observed for PF correction, will determine how much power factor correction, if any,may be advisable at a given facility. Figure 3.9 shows a “before” and “after” comparison of a hypotheticalfacility. Correction to 85% will satisfy many requirements. No economic advantage is likely to result fromcorrecting to 95% or greater. Overcorrecting a load by placing too many PF correction capacitors canreduce the power factor after reaching unity and cause uncontrollable overvoltages in low-kVA-capacitypower sources.
PF correcting capacitors usually offer some benefits in absorbing line-voltage impulse-type noisespikes. However, if the capacitors are switched on and off, they will create significant impulses of theirown. Switching can be accomplished with acceptably low disturbance using soft-start or preinsertion
Figure 3.8
Shunt-capacitor compensation: (
a
) schematic diagram; (
b
) current phasor diagram; (
c
) voltage phasordiagram. (
From
[1].
Used with permission
.)
Figure 3.9
Illustration of the results of on-site power factor correction.
Source
(a)
(b) (c)
φ2
φ2
φ1
φ1IM
IM
IC
IC
IL
IL
VR
VS VRZ = R + jX IL
IC
IM
VS1
VS0
jIMXIMR
VR
Inductiveload
Shuntcapacitor
51.54 kVAapparent power(before)
62% pF(before)
95% pF (after)
32 kW actual power essentiallyconstant for same load
40.4 kVarbefore correction
Reactive power
30 kVarcapacitor
10.4 kVarcorrected
© 2007 by Taylor & Francis Group, LLC

Power Factor
55
resistors. Such resistors are connected momentarily in series with the capacitors. After a brief delay (0.5 sor less), the resistors are short-circuited, connecting the capacitors directly across the line.
Installation of PF correction capacitors at a facility is a complicated process that requires a knowl-edgeable consultant and licensed electrician. The local utility company should be contacted before anyeffort is made to improve the PF of a facility.
3.3.2 Shunt Reactors
Shunt reactor compensation is typically required underconditions that are the opposite of those requiringshunt capacitor compensation [1]. Such a case is illus-trated in Figure 3.10. Shunt reactors are usuallyinstalled to remedy utility company power-generationand transmission issues, including the following:
• Overvoltages that occur during low load periodsat utility substations served by long lines as aresult of the inherent capacitance of the line
• Leading power factors at generating plants result-ing in lower transient and steady-state stabilitylimits
• Open-circuit line charging kVA requirements inextra-high-voltage systems that exceed the avail-able generation capabilities
It should also be noted that coupling from nearby energized lines can cause severe resonant over-voltages across the shunt reactors of unenergized compensated lines.
3.3.3 Unwanted Resonance Conditions
At a specific frequency, the inductive reactance of an electrical distribution system will equal the capaci-tive reactance; this is the definition of resonance. Resonance takes on one of two forms, parallel or series,depending upon the circuit configurations. The application of PF correction capacitors at a facility mustbe carefully planned to avoid unwanted harmonic resonances in the ac distribution system [2].
When a system is in parallel resonance, the impedance of the transformer and capacitor is maxi-mized. Harmonic currents at or near the resonant frequency can create high harmonic voltages across thehigh parallel impedance. When a system is in series resonance, the impedance of the transformer andcapacitor is minimized. During series resonance, the only impedance to current flow is the pure resis-tance of the distribution circuit, which is normally quite low.
Nonlinear loads often behave as harmonic current generators, operating on the 60 Hz source voltageand producing harmonic-rich disturbances on the distribution system. By spreading the load currentacross the harmonic spectrum, nonlinear loads significantly increase the likelihood of resonances withina distribution system that includes PF correction capacitors. High harmonic voltages and currents canresult, therefore, from nonlinear load operation that excites a resonant condition.
Harmonic-related problems include overheating of equipment, blown fuses, and equipment failure.Excessive harmonic voltages and current in capacitors results in increased losses in iron, insulation, andconductors, with a corresponding increase in temperature [3].
Simple equations can be used to determine whether the installation of capacitors on an electricaldistribution system might lead to a resonant condition. The short-circuit kVA available from the utilitymust be determined first, and is given by
(3.3)
•
IL
IR
IM
Capacitiveload
Shuntreactor
VR
Figure 3.10 Shunt-reactor-compen-sated load. (From [1]. Used with permission.)
kVAsc3 V I××1000
-------------------------=
© 2007 by Taylor & Francis Group, LLC

56
AC Power Systems Handbook
where
kVA
sc
= The available short-circuit kVA from the utility
V
= System operating voltage
I
= Available short-circuit current
Next, the building or facility distribution system short-circuit capacity must be calculated, as given by
(3.4)
where
kVA
sys
= The short circuit capacity of the secondary electrical system
kVA
t
= kVA rating of the substation transformer(s)
kVA
sc
= Available short-circuit kVA from the utility
Z
t
= Impedance of the substation transformer(s)
The resonant harmonic of the distribution system under analysis is given by
(3.5)
where
h
r
= The resonant harmonic
kVA
sys
= Available short-circuit kVA from the distribution system
kVA
mc
= available short-circuit kVA from motor contribution
kVAR
c
= sum of capacitor kVAR ratings
A resonant harmonic on the order of 50 or greater does not usually represent a potential resonantcondition; because the distribution-system inductive reactance increases proportionally with frequency,higher order harmonic currents are significantly attenuated. Additionally, harmonic analysis may revealnegligible harmonic current magnitudes at or near the resonant frequency. In either case, harmonic mit-igation techniques may not be required to prevent resonance within the distribution system.
When Equation 3.5 indicates a relatively low resonant harmonic, and spectrum analyses indicatethat the magnitude of harmonic currents are significant at or near the resonant frequency, the most likelysolution will be to install harmonic filters. In fact, low total power factor (TPF) can be principally theresult of harmonic currents generated by the load. In such instances, the TPF may be improved by install-ing filters or traps alone [4]. In most cases, a combination of harmonic filters and capacitors designed tooperate at the fundamental frequency are required to improve the TPF to acceptable levels in systems inwhich harmonic currents are present.
Active harmonic filters are available for facility applications that sense the load parameters and injectcurrents onto the distribution system that cancel the harmonics generated by nonlinear loads. In lieu ofactive filters, strategic placement of static filters to trap harmonics near the resonant frequency and toattenuate higher order harmonics can effectively protect the entire electrical system from damaging har-monic current and voltage magnitudes. Capacitor banks can be specified as integral components of aharmonic filter, tuned at or near the resonant frequency. Harmonic filters may provide a single packagethat will mitigate distribution-system resonant frequency problems and simultaneously improve the totalpower factor [4, 5].
3.3.4 Series Capacitor Compensation
Series capacitors are employed to neutralize part of the inductive reactance of a power circuit [1]. (See Figure3.11.) From the phasor diagram of Figure 3.12, it can be seen that the load voltage is higher with the capacitorinserted than without the capacitor. Such application of a series capacitor facilitates an increase in the circuittransmission capacity and enhanced stability of the distribution network. Other useful by-products include:
kVAkVA kVA
kVA kVAsys
t sc
t sc
=×
+ ×( )Z
hrkVAsys kVAmc+
kVARc------------------------------------------=
© 2007 by Taylor & Francis Group, LLC

Power Factor
57
• Improved load distribution• Control of overall transmission losses• Control over reactive power throughout the system
It should be noted, however, that the reduction in the circuitinductive reactance gained through the use of series-capacitor-compensation also increases the short-circuit current levelsover those for the noncompensated system.
Another consideration involves the interaction between aseries-capacitor-compensated ac transmission system in elec-trical resonance and a turbine-generator mechanical system intorsional mechanical resonance. These resonances result in thephenomenon of
subsynchronous resonance
(SSR). In thismode, energy is exchanged between the electrical and mechan-ical systems at one or more natural frequencies of the com-bined system below the synchronous frequency of the system.The resulting mechanical oscillations can increase untilmechanical failure occurs. A number of measures can be takento reduce or eliminate SSR, as described in Reference 1.
3.3.5 Static Compensation Devices
Advances in thyristor technology for power-system applications have led to the development of the
staticVAR compensator
(SVC) [1]. This class of devices contains standard shunt elements (reactors and capaci-tors) that are controlled by thyristors. Static VAR devices are used to address two common problemsencountered in practical power systems:
• Load compensation, where there is a need to reduce or cancel the reactive power demand of largeand fluctuating industrial loads. Because heavy industrial loads are normally concentrated in oneplant and served from one network terminal, they can usually be handled by a local compensatorconnected to the same terminal.
• Balancing the real power drawn from the ac supply lines. This type of compensation is related tothe voltage support of transmission lines at a given terminal in response to disturbances of boththe load and the supply. This voltage support is achieved by rapid control of the SVC reactanceand, thus, its reactive power output.
The main objectives of such VAR compensation schemes are:
• To increase the stability limit of the ac power system• To decrease terminal voltage fluctuations during load changes• To limit overvoltages resulting from large system disturbances
SVCs are essentially thyristor-controlled reactive power devices, usually designed around one of twobasic configurations:
•
Thyristor-switched shunt capacitor
(TSC). As illustrated in Figure 3.13a, this configuration splits acapacitor bank into small steps and switches those steps on and off individually. This approachoffers stepwise control, virtually no transients, and no harmonic generation. The average delayfor executing a command from the regulator is one half-cycle.
• Thyristor-switched shunt reactor (TSR). Shown in Figure 3.13b, the fundamental frequency currentcomponent through the reactor is controlled by delaying the closing of the thyristor switch withrespect to the natural zero crossing of the current. In this case, harmonic currents are generatedfrom the phase-angle-controlled device.
VS
jXL −jXC
I
I
V′R
−Φ
Figure 3.11 A distribution line withseries-capacitor-compensation applied.(From [1]. Used with permission.)
VC
VR
I
(without C)Φ
V′R
VS
jIXL
−jIXC = VC
Figure 3.12 Phasor diagram correspond-ing to the circuit shown in Figure 3.11.(From [7]. Used with permission.)
© 2007 by Taylor & Francis Group, LLC

58 AC Power Systems Handbook
In many applications, the arrangement of the SVC consists of a few large steps of thyristor-switchedcapacitors and one or two thyristor-controlled reactors, as shown in Figure 3.13c.
3.4 References
1. El-Hawary, M. E., “Compensation,” in The Electrical Engineering Handbook, R. C. Dorf (Ed.), p.1244, CRC Press, Boca Raton, FL, 1993.
2. Massey, G. W., “Power Factor Improvement Capacitors: The Balance Between Power Quality andEnergy Efficiency,” in Power Quality Solutions/Alternative Energy, Powersystems World ’96, IntertecInternational, Ventura, CA, p. 34, 1996.
3. Rice, Da. E., “Adjustable Speed Drive and Power Rectifier Harmonics — Their Effect on PowerSystems Components,” IEEE Transactions on Industry Applications, Vol. IA-22, No. 1, IEEE, NewYork, NY, January/February 1986.
4. Lowenstein, M. Z., “Power Factor Improvement for Non-Linear Loads,” 1991 Annual TechnologyConference of the Textile, Fiber, and Film Industry Committee, Industry Applications Society of theIEEE, Greenville, SC, May 1991.
5. Morgan, R. B., “Improving Power Factor for Greater Efficiency — Part 2,” Electrical Construction& Maintenance, PRIMEDIA Intertec, Overland Park, KS, November 1994.
3.5 Bibliography
Acard, C., “Power Factor Measurement and Correction,” Plant Electrical Systems, PRIMEDIA Intertec,Overland Park, KS, March 1981.
Fardo, S., and D. Patrick, Electrical Power Systems Technology, Prentice-Hall, Englewood Cliffs, NJ, 1985.Fink D., and D. Christiansen (Eds.), Electronics Engineers' Handbook, 3rd ed., McGraw-Hill, New York, 1989.Jay, F., IEEE Standard Directory of Electrical and Electronics Terms, 3rd ed., IEEE, New York, 1984.Kramer, R. A., “Analytic and Operational Consideration of Electric System Reliability,” Proceedings of the
Reliability and Maintainability Symposium, IEEE, New York, 1991.Redl, R., P. Tenti, and J. D. Van Wyk, “Power Electronics’ Polluting Effects,” Spectrum, IEEE, New York, p.
33, May 1997.
Figure 3.13 Basic static VAR compensator configurations: (a) thyristor-switched shunt capacitors (TSC); (b) thyristor-switched shunt reactors (TSRs); (c) combined TSC/TSR. (From [1]. Used with permission.)
CB
(a) (b) (c)
CBCB PT
AVR
© 2007 by Taylor & Francis Group, LLC

59
4
Power Transformers
4.1 Introduction
The transformer forms the basis of all ac power-distribution systems. In the most basic definition, a trans-former is a device that magnetically links two or more circuits for time-varying voltage and current. Mag-netic coupling has a number of intrinsic advantages, including:
• DC isolation between the circuits• The ability to match the voltage and current capability of a source to a load• The ability to change the magnitude of the voltage and current from one side of the transformer to the other• The ability to change the phases of voltage and current from one side of the device to the other
4.2 Inductive Properties
1
Inductance is, primarily, a geometrical property of a current-carrying element in an electrical circuit [1]. Acircuit element with this property may be termed an
inductor
. The magnitude and, for that matter, the fre-quency dependence of inductance also depend on the material environment of that element. Similarremarks to these could — of course — be used to define capacitance; inductance and capacitance are invari-ably intimately related in electronic circuits. One reason is that both are (electrical) energy storage devices intime-varying electronic systems. Capacitance is, however, a measure of the capability of a (potential) circuitelement to store charge and, thereby, electric field energy; inductance, by contrast, is a measure of a circuitelement’s ability to store magnetic field energy. Because a magnetic field is derived from current flow, induc-tance is always associated with current-carrying circuit elements. This dichotomy extends also to the matterof frequency dependence. At zero signal frequency, for example, an (ideal) capacitor has infinite impedance,whereas the inductor has zero impedance; at infinite frequency, the opposite is true.
The concept of inductance or, more correctly,
self-inductance
is, perhaps, best illustrated by the exampleof a current-carrying conducting coil of
N
circular turns (see Figure 4.1). When a current
I
flows throughthis circuit, as described, a magnetic field is generated inside and around the coil turns, in accordance withAmpere’s law. Flux linkage
Λ
is defined by how much of the total magnetic flux
φ
threads all of the turns ofthe coil, multiplied by the total numbers of turns
N
. Thus, in simple algebraic terms:
(
≈
N
B
A
) (4.1)
where, because of incomplete linkage by the magnetic flux, in actuality
A
will typically be slightly less thanthe cross-sectional area of the coils. The inductance
L
of this coil is defined as the flux linkage per unit cur-rent and is defined as [2]
(4.2)
1
This section was adapted from Parker, M. R., and W. E. Webb, “Magnetic Materials for Inductive Pro-cesses,” in
The Electronics Handbook
, 2nd ed., J. C. Whitaker (Ed.), CRC Press, Boca Raton, FL, 2005. Usedwith permission.
Λ = = ∫ ∫N N B dAAφ
LI
N B dA
I
A= =
∫ ∫( )Λ
© 2007 by Taylor & Francis Group, LLC

60
AC Power Systems Handbook
The SI unit of inductance is the
henry
(H) if
I
is in amperes,
Λ
in webers,
A
in square meters, and
B
in teslas (webers/square meter). The inductance of some current-carrying elements of comparativelysimple geometry is described in approximate form next.
4.2.1 Coils
The long solenoid is a longer, more tightly wound version of the sim-ple coil shown in Figure 4.1 with a relatively large number of turns, asillustrated in Figure 4.2 [1]. The
B
-field inside a long solenoid is fairlyuniform and given by
(4.3)
where
l
is its length. The inductance is given by
(4.4)
where is the
permeability
of free space.Similarly, for a short solenoid of
N
turns, also of length
l
and of radius
a
, it can be shown that
(4.5)
Once again, from Equation 4.3 and Equation 4.5, it follows that
(4.6)
Note that, in the limit of a becoming vanishingly small, the short solenoid takes on the appearanceof a long solenoid and Equation 4.6 reduces to Equation 4.4.
In the limit of
l
approaching zero in Equation 4.6, we have a flat coil of
N
turns, radius
a
, whoseinductance is approximately
Figure 4.1
A magnetic field produced by a current through a coil. (
After
[2].
From
[1].
Used with permission
.)
I
I
B
I
I
a
l
Figure 4.2 A long solenoid. (From[1]. Used with permission.)
μ0NIl
------------
Lμ0N 2A
l-----------------=
μ074 10= × −p H m/
BNI
l a=
+
μ02 2 1 24( ) /
LN A
l a=
+( )μ0
2
2 2 1 24 /
© 2007 by Taylor & Francis Group, LLC

Power Transformers
61
(4.7)
where
A
(Equation 4.6) has been replaced by
a
. Note that the special case of a single loop is derived fromEquation 4.7, simply by making
N
=
l
, leading to
(4.8)
4.2.2 The Toroid
Another simple classic geometry (Figure 4.3) is the tor-oid [1]. This doughnut-shaped winding is a close rela-tive of the long solenoid. Indeed, it may be viewed as along solenoid whose ends have been joined. Accordingly,the
B
-field inside the toroid may be given, approxi-mately, by Equation 4.4, with the modification that thelength
l
is replaced by 2
r
, where
r
is the (mean) radius ofthe toroid. A crude approximation for the inductance ofthe toroid, when
r
is much greater than the radius of theindividual windings, is, therefore,
(4.9)
When the dimensions of thewindings compare in size with the tor-oid radius, the simple expression ofEquation 4.9 is inadequate. To illus-trate the point, consider the rectangu-larly cross-sectioned toroid of Figure4.4. It is easy to show analytically [4]that, for this geometry,
(4.10)
4.2.3 Circuit Description of Self-Inductance
It is a relatively simple matter to describe the voltagedrop across a simple self-inductance such as the coil ofFigure 4.5. For a steady-state current
I
, in the coils, thevoltage drop is simply
IR
, as dictated by Ohm’s law,where
R
is the coil resistance. On the other hand, if thecurrent
i
(
t
) is time varying, then it follows quite simplyfrom a combination of Faraday’s law of electromagneticinduction and equations for magnetic flux and flux den-sity that the (time-varying) voltage drop
v
across a self-inductance is
(4.11)
Lμ0N 2a
2----------------=
Lμ0a
2---------=
Flux lines
i(t)
Figure 4.3 A toroid inductor. (After [3]. From[1]. Used with permission.)
Lμ0N 2A
2r-----------------=
I
I h
b
ardr
Figure 4.4 A closely wound toroidal coil. (After [4]. From [1]. Usedwith permission.)
LN h lnb a
=μ0
2
2
( /
Flux lines
i(t)
u(t)
+
−
Figure 4.5 A circuit illustrating self-inductance(After [3]. From [1]. Used with permission.)
v L didt----- Ri+=
© 2007 by Taylor & Francis Group, LLC

62
AC Power Systems Handbook
Given that magnetic field energy density is expressible [2] as
(4.12)
it follows that for any of the simple inductive windings described, the total magnetic field energy (that is,the stored energy of any inductor) is
(4.13)
Note that
L
may be defined from Equation 4.13, thus,
(4.14)
4.2.4 Magnetic Materials
All of the preceding described current elements were characterized by air-filled windings [1]. In fact, theformulas of the preceding equations are essentially valid if the windings encompass any condensed mat-ter other than a magnetic (i.e., ferromagnetic/ferrimagnetic, etc.) material. If, however, any of thedescribed windings are constructed around a magnetic material of
permeability
μ
, then in each of the for-mulas of Equation 4.4 through Equation 4.10,
μ
0
is replaced by
μ
. Now, for magnetic materials
μ
is, typi-cally, much greater than
μ
0
. The actual value of
μ
depends crucially on: (1) the current signal frequency,and (2) the chemical identity and temperature of the magnetic material comprising the inductive ele-ment as well as on the details of its microstructure.
In inductive devices, one will typically find
soft
magnetic materials employed as the core medium.Here, a soft magnetic material is one in which the
relative permeability
μ
r
, defined as
(4.15)
is, numerically, >> 1. (See Table 4.1.) For the magnetic materials of Table 4.1 and the like,
μ
r
is: (1) anonanalytical function of magnetic field intensity (see, for example Figure 4.6), and (2) a complex quan-tity of the form
(4.16)
where is, typically, significant only at high frequencies.
4.3 Basic Principles of the Transformer
In 1831, English physicist Michael Faraday demonstrated the phenomenon of electromagnetic induction.The concept is best understood in terms of lines of force, a convention Faraday introduced to describe thedirection and strength of a magnetic field. The lines of force for the field generated by a current in a loopof wire are shown in Figure 4.7. When a second, independent loop of wire is immersed in a changingmagnetic field, a voltage will be induced in the loop. The voltage will be proportional to the time rate ofchange of the number of force lines enclosed by the loop. If the loop has two turns, such induction occursin each turn, and twice the voltage results. If the loop has three turns, three times the voltage results, andso on. The concurrent phenomena of
mutual induction
between the coils and
self-induction
in each coilform the basis of transformer action.
For a power transformer to do its job effectively, the coils must be coupled tightly and musthave high self-induction. That is, almost all the lines of force enclosed by the primary also mustbe enclosed by the secondary, and the number of force lines produced by a given rate of changeof current must be high. Both conditions can be met by wrapping the primary and secondarycoils around an iron core, as Faraday did in his early experiments. Iron increases the number of
w B Hm = ×
Wm12--- Li2=
LW
im=
⎛
⎝⎜⎞
⎠⎟2
2
1 2/
μrμμ0-----=
μ μ′ jμ″+=
μ″
© 2007 by Taylor & Francis Group, LLC
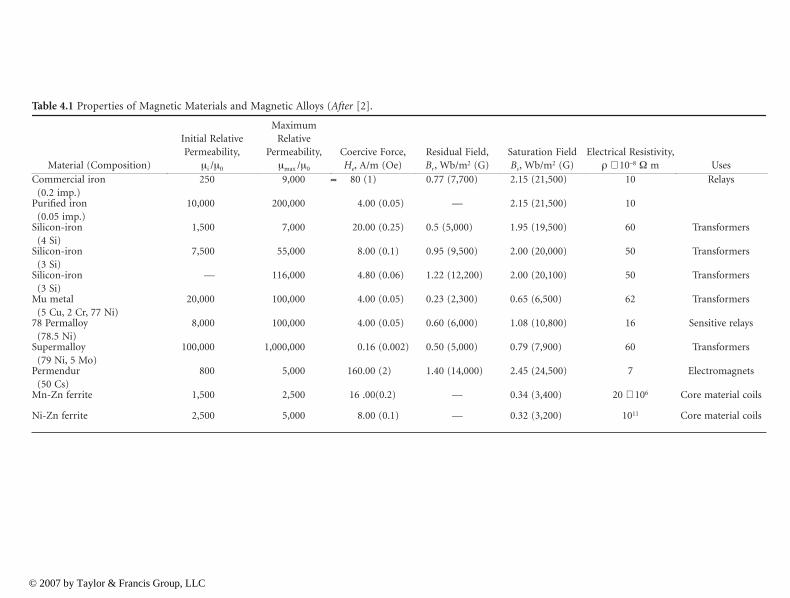
Pow
er Transform
ers63
Table 4.1 Properties of Magnetic Materials and Magnetic Alloys (After [2].
Material (Composition)
Initial Relative Permeability,
μi /μ0
Maximum Relative
Permeability,μmax /μ0
Coercive Force,He, A/m (Oe)
Residual Field,Br, Wb/m2 (G)
Saturation FieldBs, Wb/m2 (G)
Electrical Resistivity,ρ × 10–8 Ω m Uses
Commercial iron(0.2 imp.)
250 9,000 ≈ 80 (1) 0.77 (7,700) 2.15 (21,500) 10 Relays
Purified iron(0.05 imp.)
10,000 200,000 4.00 (0.05) — 2.15 (21,500) 10
Silicon-iron(4 Si)
1,500 7,000 20.00 (0.25) 0.5 (5,000) 1.95 (19,500) 60 Transformers
Silicon-iron(3 Si)
7,500 55,000 8.00 (0.1) 0.95 (9,500) 2.00 (20,000) 50 Transformers
Silicon-iron(3 Si)
— 116,000 4.80 (0.06) 1.22 (12,200) 2.00 (20,100) 50 Transformers
Mu metal(5 Cu, 2 Cr, 77 Ni)
20,000 100,000 4.00 (0.05) 0.23 (2,300) 0.65 (6,500) 62 Transformers
78 Permalloy(78.5 Ni)
8,000 100,000 4.00 (0.05) 0.60 (6,000) 1.08 (10,800) 16 Sensitive relays
Supermalloy(79 Ni, 5 Mo)
100,000 1,000,000 0.16 (0.002) 0.50 (5,000) 0.79 (7,900) 60 Transformers
Permendur(50 Cs)
800 5,000 160.00 (2) 1.40 (14,000) 2.45 (24,500) 7 Electromagnets
Mn-Zn ferrite 1,500 2,500 16 .00(0.2) — 0.34 (3,400) 20 × 106 Core material coils
Ni-Zn ferrite 2,500 5,000 8.00 (0.1) — 0.32 (3,200) 1011 Core material coils
© 2007 by Taylor & Francis Group, LLC

64 AC Power Systems Handbook
lines of force generated in the transformer by a factor of about 10,000. This property of iron isreferred to as permeability. The iron core also contains the lines so that the primary and secondarycoils can be separated spatially and still closely coupled magnetically.
With the principles of the transformer firmly established, American industrialist George Westing-house and his associates made several key refinements that made practical transformers possible. Theiron core was constructed of thin sheets of iron cut in the shape of the letter E. Coils of insulated copperwire were wound and placed over the center element of the core. Straight pieces of iron were laid acrossthe ends of the arms to complete the magnetic circuit. This construction still is common today. Figure 4.8shows a common E-type transformer. Note how the low-voltage and high-voltage windings are stackedon top of each other. An alternative configuration, in which the low-voltage and high-voltage windingsare located on separate arms of a core box, is shown in Figure 4.9.
In an ideal transformer, all lines of force pass through all the turns in both coils. Because a changingmagnetic field produces the same voltage in each turn of the coil, the total voltage induced in a coil is
Figure 4.6 Magnetization curve of commercial iron. Permeability is given by the ratio B/H. (After [2]. From [1]. Usedwith permission.)
Figure 4.7 The basic principles of electromagnetic induction.
1.6
1.2
0.8
0.4
0 200 400 600 800 1000 1200
Slope of μmax
B-H Curve μμ0
= μr
Slope of μinitial
6000
5000
4000
3000
2000
1000 Rela
tive
perm
eabi
lity
π r =π π 0
B, W
/m2
H, A/m
Voltage
Current
© 2007 by Taylor & Francis Group, LLC
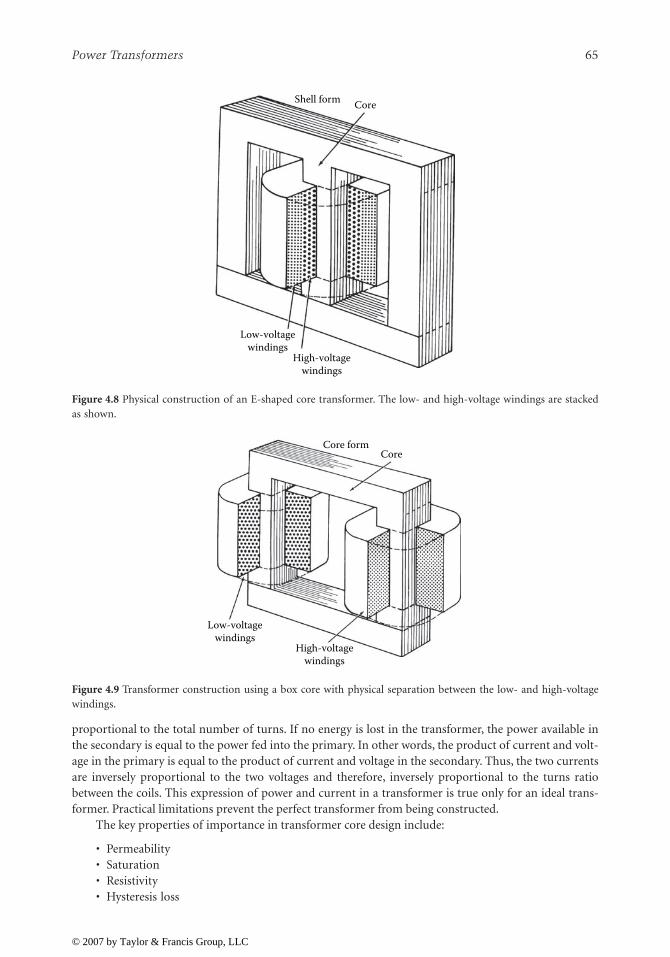
Power Transformers 65
proportional to the total number of turns. If no energy is lost in the transformer, the power available inthe secondary is equal to the power fed into the primary. In other words, the product of current and volt-age in the primary is equal to the product of current and voltage in the secondary. Thus, the two currentsare inversely proportional to the two voltages and therefore, inversely proportional to the turns ratiobetween the coils. This expression of power and current in a transformer is true only for an ideal trans-former. Practical limitations prevent the perfect transformer from being constructed.
The key properties of importance in transformer core design include:
• Permeability• Saturation• Resistivity• Hysteresis loss
Figure 4.8 Physical construction of an E-shaped core transformer. The low- and high-voltage windings are stackedas shown.
Figure 4.9 Transformer construction using a box core with physical separation between the low- and high-voltagewindings.
Shell form Core
Low-voltagewindings
High-voltagewindings
Core formCore
Low-voltagewindings
High-voltagewindings
© 2007 by Taylor & Francis Group, LLC
66 AC Power Systems Handbook
Permeability, as discussed previously, refers to the number of lines of force a material produces inresponse to a given magnetizing influence. Saturation identifies the point at which the ability of the coreto carry a magnetic force reaches a limiting plateau. These two properties define the power-handlingcapability of the core element. Electrical resistivity is desirable in the core because it minimizes energylosses resulting from eddy currents. In contrast, hysteresis undermines the efficiency of a transformer.Because of the interactions among groups of magnetized atoms, losses are incurred as the frequency ofthe changing magnetic field is increased. Throughout the history of transformer development, the goal ofthe design engineer has been to increase permeability, saturation, and resistivity, while decreasing hyster-esis losses. A variety of core materials, including silicon iron in various forms, have been used.
Transformer efficiency is defined as
(4.17)
where:E = Efficiency in percent
Pout = Transformer power output in wattsPin = Transformer power input in watts
Losses in a transformer are the result of copper losses in the windings and core losses. The copperlosses vary with the square of the current; the core losses vary with the input voltage magnitude andfrequency. Because neither of these quantities depend on the power being consumed by the load, powertransformers are rated by the voltamperes (VA) that flow through them.
The regulation specification of a power transformer is a measure of the transformer’s ability tomaintain a constant output voltage under varying loads. The primary voltage is held constant at the valuerequired to produce the rated voltage on the secondary at full load:
(4.18)
whereR = Regulation in percent
Vs0 = Secondary voltage under no loadVsfl = Secondary voltage under full load
Also bearing on transformer performance are electrical insulation and the cooling system used.These two elements are intimately related because the amount of heat that the core and conductors gen-erate determines the longevity of the insulation; the insulation itself — whether solid, liquid, or gas —serves to carry off some portion of the heat produced. Temperatures inside a commercial transformermay reach 100°C, the boiling point of water. Under such conditions, deterioration of insulating materialscan limit the useful lifetime of the device. Although oils are inexpensive and effective as insulators andcoolants, some oils are flammable, making them unacceptable for units placed inside buildings. Chlori-nated hydrocarbon liquids (PCBs) were used extensively from the 1930s to the late 1970s, but evidence oflong-term toxic effects prompted a ban on their use. Some transformers rely on air- or nitrogen-gas-based insulators. Such devices can be installed indoors. The breakdown strength of gas sometimes isenhanced through the addition of small quantities of fluorocarbons. Other dry transformers depend oncast-resin insulation made of polymerizing liquids that harden into high-integrity solids. Progress in heatremoval is largely responsible for reducing the overall size of the transformer assembly.
Modern high-power commercial transformers may operate at voltages of 750 kV or more and canhandle more than 1000 kVA. The expected lifetime of a commercial power transformer ranges from 24 to40 years. A typical three-phase oil-cooled transformer is shown in Figure 4.10.
EP
Pout
in
= ×100
RVs0 Vsfl–
Vsfl---------------------- 100×=
© 2007 by Taylor & Francis Group, LLC

Power Transformers 67
Figure 4.10 Construction of an oil-filled three-phase power transformer used for commercial power distribution:(a) cutaway view; (b) exterior view. (Drawing b from [5]. Used with permission.)
Low-voltage bushingHigh-voltage
bushingTank
Tube coolers
Low-voltage coil
(a)
High-voltage coilCore
Cool-oil flow port
OilHot-oil
flow port
(b)
© 2007 by Taylor & Francis Group, LLC

68 AC Power Systems Handbook
4.3.1 Counter-Electromotive Force
All transformers, generators, and motorsexhibit the property of inductance. Thisproperty is the result of a counter-emf that isproduced when a magnetic field is developedaround a coil of wire. Inductance presents anopposition to the change in current flow in acircuit. This opposition is evident in the dia-gram shown in Figure 4.11. In a purelyinductive circuit (containing no resistance),the voltage will lead the current by 90˚. How-ever, because all practical circuits have resis-tance, the offset will vary from one circuit tothe next. Figure 4.12 illustrates a circuit inwhich voltage leads current by 30°. Theangular separation between voltage and cur-rent is referred to as the phase angle. Thephase angle increases as the inductance ofthe circuit increases. Any inductive circuitexhibits the property of inductance, includ-ing electrical power-transmission and distri-bution lines. The henry is the unit ofmeasurement for inductance. A circuit has a1 H inductance if a current changing at arate of 1 A/s produces an induced counter-emf of 1 V.
In an inductive circuit with ac applied,an opposition to current flow is created bythe inductance. This opposition is known asinductive reactance (Xl). The inductive reac-tance of a given ac circuit is determined bythe inductance of the circuit and the rate ofcurrent change. Inductive reactance can beexpressed as
Xl = 2 π f L (4.19)
whereXl = inductive reactance in ohms
2π = 6.28, the expression for one sine wave of alternating current (0˚ to 360˚)f = frequency of the ac source in hertz
L = inductance of the circuit in henrys
4.3.2 Full Load Percent Impedance
The full load percent impedance (FLPI) of a transformer is an important parameter in power-supply sys-tem design. FLPI is determined by the construction of the core and physical spacing between the primaryand secondary windings. Typical FLPI values range from 1 to 5%. FLPI is a measure of the ability of atransformer to maintain its rated voltage with a varying load. The lower the FLPI, the better the regula-tion. FLPI also determines the maximum fault current that the transformer can deliver. For example, if a5% FLPI transformer supplying 5 A nominal at the secondary is short-circuited, the device can,
AC source
I
V
+
−
Voltage
Power
Current
360°180° Time
0
Volta
ge, c
urre
nt, p
ower
90°
90°
V
(c)
(a)
(b)
I
270°
Inductive load
Figure 4.11 Purelyinductive circuit: (a) circuit diagram; (b) representativewaveforms; (c) vector representation.
© 2007 by Taylor & Francis Group, LLC
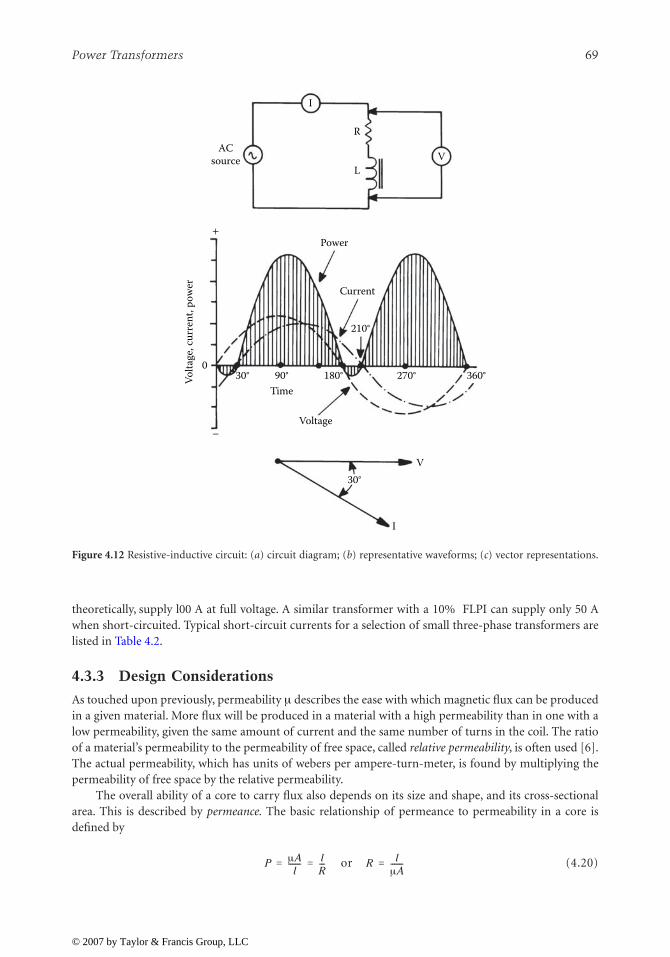
Power Transformers 69
theoretically, supply l00 A at full voltage. A similar transformer with a 10% FLPI can supply only 50 Awhen short-circuited. Typical short-circuit currents for a selection of small three-phase transformers arelisted in Table 4.2.
4.3.3 Design Considerations
As touched upon previously, permeability μ describes the ease with which magnetic flux can be producedin a given material. More flux will be produced in a material with a high permeability than in one with alow permeability, given the same amount of current and the same number of turns in the coil. The ratioof a material’s permeability to the permeability of free space, called relative permeability, is often used [6].The actual permeability, which has units of webers per ampere-turn-meter, is found by multiplying thepermeability of free space by the relative permeability.
The overall ability of a core to carry flux also depends on its size and shape, and its cross-sectionalarea. This is described by permeance. The basic relationship of permeance to permeability in a core isdefined by
or (4.20)
Figure 4.12 Resistive-inductive circuit: (a) circuit diagram; (b) representative waveforms; (c) vector representations.
I
ACsource
R
LV
Power
Current
Voltage
V
0
Volta
ge, c
urre
nt, p
ower
I
210°
360°270°180°90°Time
30°
+
−
30°
P μAl
------- lR---= = R l
μA-------=
© 2007 by Taylor & Francis Group, LLC

70 AC Power Systems Handbook
whereP = Permeanceμ = Permeability of the materialA = The cross-sectional area of the corel = The mean length of the flux path in the core
This equation assumes uniform flux distribution in the core andconstant permeability inside the core. It does not take into accountthe variations in the length of the flux path from the inside of thecore to the outside. The reciprocal of permeance is reluctance.
Figure 4.13 shows the magnetization curve for a typical ferro-magnetic material. Note that the curve follows two different paths,depending on whether the magnetizing force H is increasing ordecreasing. This is called a hysteresis curve. It is caused by the factthat the magnetic particles in the core need to be rotated andrealigned each time the polarity of the magnetizing force changes.This is why the magnetic force must be reversed to reduce the fluxdensity to zero.
As the magnetizing force H increases, the flux density increasesup to a point, and then the curve flattens out. In this flattenedregion, only a small increase in the flux density can be achieved, asillustrated in the figure. The core is said to be saturated. The flatten-ing of the curve indicates that the permeability has decreased fromthe value it had when there was only a small amount of flux passingthrough the core.
To eliminate ambiguity in the voltage and current polarity atthe input and output of the transformer symbol, the dot conventionis commonly used. In circuit diagrams, a small dot is placed nearone end of each coil, as shown in Figure 4.14. The dot indicates a
Table 4.2 Full Load Percent Impedance Short-Circuit Currents for a Selection of Three-Phase Transformers
DC Amps (kVa/kV)Full Load Percent
ImpedanceSymmetrical Short-
Circuit Current
1 A 1 57.71 A 2 28.81 A 3 19.31 A 4 14.41 A 5 11.52 A 1 115.52 A 2 57.72 A 3 38.52 A 4 28.82 A 5 23.13 A 1 173.23 A 2 86.63 A 3 57.73 A 4 43.33 A 5 34.64 A 1 230.94 A 2 115.54 A 3 77.04 A 4 57.74 A 5 46.25 A 1 288.65 A 2 144.35 A 3 96.25 A 4 72.25 A 5 57.7
B
H
Figure 4.13 A typical magnetizationcurve. (From [6]. Used with permis-sion.)
• •+
−
V1
l1 l2
+
−
V2
Figure 4.14 Dotted schematic sym-bol for a transformer. (From [6].Used with permission.)
© 2007 by Taylor & Francis Group, LLC

Power Transformers 71
rise in voltage from the unmarked to the marked terminal on each coil. Under this convention, currentinto the dot on the primary side is labeled as having positive polarity, and current out of the dotted ter-minal on the other side is assigned positive polarity. This means that the power flow must be into thetransformer on one side and out of the transformer on the other side.
4.3.4 The Ideal Transformer
Although no transformer is ideal in its characteristics, transformers approach their ideal characteristicsin the operating range for which they were designed. The ideal transformer has no coil resistance and nocore losses, so that it has no power loss [6]. It also has no leakage inductance, because the permeability ofthe core is infinite, and the core material is able to carry an infinite amount of flux without saturating.Therefore, the mutual inductance is also infinite. The capacitance in an ideal transformer is negligible.The equations for an ideal transformer are given as
(4.21)
(4.22)
(4.23)
(4.24)
wherev1 = Voltage in the primaryv2 = Voltage in the secondaryi1 = Current in the primaryi2 = Current in the secondary
N1 = Turns in the primaryN2 = Turns in the secondaryZ1 = Impedance of the primaryZ2 = Impedance of the secondary
Equation 4.8 describes the effect of the transformer on an impedance on the secondary side (multipliedby the square of the turns ratio). The magnitude of the impedance as seen on the secondary side isreferred to as the reflected impedance.
Equivalent circuits are often used to model the performance of transformers with greater accuracy.Although equivalent circuits are not exact replicas of real transformers, they are close enough to realizeaccurate results for most situations. The complete transformer equivalent circuit is shown in Figure 4.15.
Figure 4.15 Transformer equivalent circuit. (From [6]. Used with permission.)
v1i1 v2i2=
v1
v2-----
N1
N2------=
i1
i2----
N2
N1------=
Z1
Z2-----
N1
N2------⎝ ⎠⎛ ⎞
2=
Cp
CpLp Rp
Lm Rc
Rs/n2
Cs/n2
Ls/n2 I:n
Idealtransformer
Load
© 2007 by Taylor & Francis Group, LLC

72 AC Power Systems Handbook
The leakage inductance of both coils has been modeled by an inductor in series with the load,because the current in the coils also produces the leakage flux. These inductances are labeled Lp and Ls,respectively. Notice that the leakage inductance for the secondary side has been divided by the turns ration2 because it was reflected to the primary side. Resistors Rp and Rs are placed in series with the load to rep-resent the resistance of the conductors used to wind the coils. Again, the secondary resistance is dividedby the square of the turns ratio because it was reflected.
The mutual inductance is represented by shunt inductor Lm, because the magnetizing current is notcoupled to the load. Resistor Rc is also placed in shunt to represent the core loss resulting from hysteresisand eddy currents in the core. The stray capacitances between turns of the coils are represented by acapacitor connected across each pair of terminals. This capacitance is larger for coils with more turns.Although the capacitance is actually distributed, it is lumped for the equivalent circuit, in order to sim-plify the analysis. The capacitance from one coil to the other is represented by another capacitor placed inparallel with the leakage inductance and resistance.
The transfer function of the complete equiva-lent circuit is quite complex. For this reason, theequivalent circuit is often broken up into severalequivalent circuits, each of which is valid only for acertain set of operating conditions. In the low-fre-quency range, the transformer acts like a highpassfilter. (See Figure 4.16.) Above the corner frequency,the output voltage is nearly equal to the input volt-age. Below the corner frequency, the output voltageis substantially smaller than the input voltagebecause of the presence of shunt inductor Lm. Thedistributed capacitances and leakage inductancescan be largely neglected.
4.3.5 Application Considerations
Transformers are the most common pieces of equipment found in utility substations and distributionsystems. Different types of transformers are used for varied purposes, from voltage level changes to phaseangle regulation [7]. Because the primary circuits of distribution systems are designed for high voltages(in order to increase their load-carrying capability), the voltage must be stepped down at the consumerservice entrance.
Transformers can be classified as distribution transformers and power transformers. The former typenormally steps down voltages from primary voltage levels, such as 2,400, 4,160, or 13,800 V, to 120 or 240V. These devices are almost always located outdoors where they are hung from crossarms, mounted onpoles directly, or placed on platforms or in underground vaults. Power transformers are larger in sizethan distribution transformers and usually have auxiliary means for cooling. These transformers are typ-ically installed at distribution substations for stepping down voltages from the subtransmission levels of34.5 and 69 kV to primary distribution levels of up to 13.8 kV.
Single-phase distribution transformers typically have one high-voltage primary winding and twolow-voltage secondary windings, which are rated at a nominal 120 V. The secondary coils may be con-nected in parallel to supply a two-wire 120 V circuit, shown in Figure 4.17a, or in series to supply athree-wire 120/240 V single circuit, shown in Figure 4.17b. As seen in the figures, one leg of the 120 Vtwo-wire system and the middle leg of the 120/240 V three-wire system are grounded to limit the voltageto ground on the secondary side. In general, the 120/240 V three-wire connection is preferred because ithas twice the load capacity of the 120 V system with only a 1.5 times increase in conductor size. Each 120V winding has one half the total kilovoltampere rating of the transformer. The loads on the secondaryside of the transformers are kept as balanced as possible, such that maximum transformer capacity can beutilized, and the neutral current kept to a minimum.
Rp
Lm
Rs/n2 I:n
Idealtransformer
Load
Figure 4.16 Transformer equivalent circuit for low-frequencies. (From [6]. Used with permission.)
© 2007 by Taylor & Francis Group, LLC
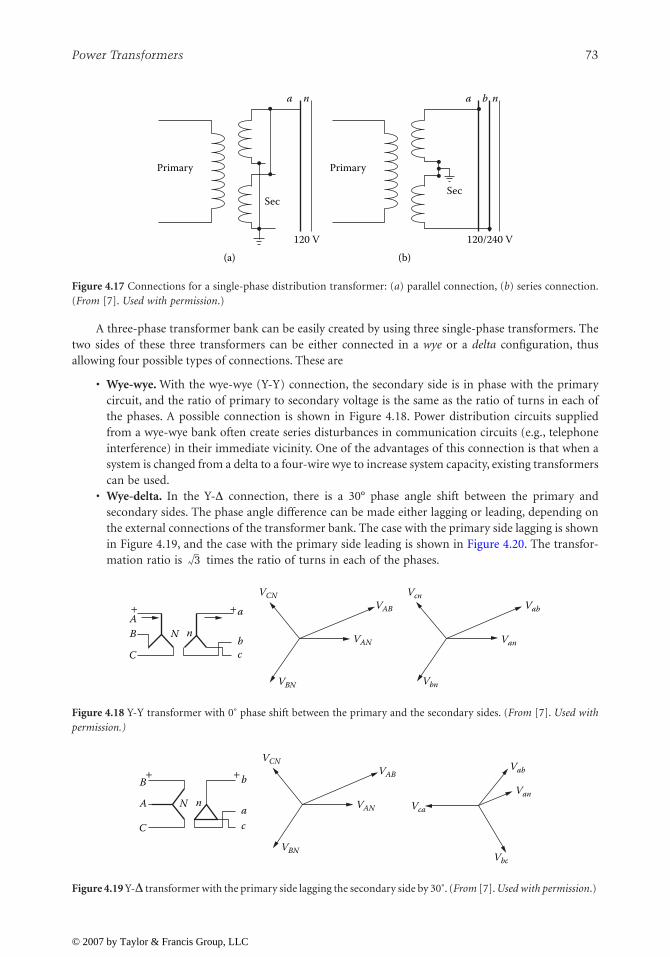
Power Transformers 73
A three-phase transformer bank can be easily created by using three single-phase transformers. Thetwo sides of these three transformers can be either connected in a wye or a delta configuration, thusallowing four possible types of connections. These are
• Wye-wye. With the wye-wye (Y-Y) connection, the secondary side is in phase with the primarycircuit, and the ratio of primary to secondary voltage is the same as the ratio of turns in each ofthe phases. A possible connection is shown in Figure 4.18. Power distribution circuits suppliedfrom a wye-wye bank often create series disturbances in communication circuits (e.g., telephoneinterference) in their immediate vicinity. One of the advantages of this connection is that when asystem is changed from a delta to a four-wire wye to increase system capacity, existing transformerscan be used.
• Wye-delta. In the Y-Δ connection, there is a 30° phase angle shift between the primary andsecondary sides. The phase angle difference can be made either lagging or leading, depending onthe external connections of the transformer bank. The case with the primary side lagging is shownin Figure 4.19, and the case with the primary side leading is shown in Figure 4.20. The transfor-mation ratio is times the ratio of turns in each of the phases.
Figure 4.17 Connections for a single-phase distribution transformer: (a) parallel connection, (b) series connection.(From [7]. Used with permission.)
Figure 4.18 Y-Y transformer with 0˚ phase shift between the primary and the secondary sides. (From [7]. Used withpermission.)
Figure 4.19 Y-Δ transformer with the primary side lagging the secondary side by 30˚. (From [7]. Used with permission.)
Primary Primary
Sec
a
(a) (b)
n a b n
Sec
120 V 120/240 V
3
+ +AB N n
aVcn
Vab
Van
Vbn
bcC
VCN
VBN
VAN
VAB
n
VCN
VBN
VAN Vca
Vbc
Van
VabVABb
ac
+ +B
A N
C
© 2007 by Taylor & Francis Group, LLC

74 AC Power Systems Handbook
• Delta-wye. With the Δ-Y connection, the neutral of the secondary wye can be grounded andsingle-phase loads connected across the phase and the neutral conductor. Three-phase loads areconnected across the phases. The phasor relationship between the primary and the secondary sidesis shown in Figure 4.21. The transformation ratio is 1/ times the ratio of turns in each of thephases.
• Delta-delta. The Δ-Δ connection does not cause a phase shift between the primary and thesecondary sides. The phasor relationship of this transformer is shown in Figure 4.22. The trans-formation ratio is equal to the ratio of the turns in each of the phases. There is no problem fromthird-harmonic overvoltage or telephone interference because such disturbances get trapped inthe delta and do not pass into the lines.
Although these four configurations are the most common ones used, other arrangements are pos-sible, including:
• Open-delta. An advantage of the Δ-Δ connection is that if one of the single-phase transformersbecomes damaged or is removed for maintenance, the remaining two can be operated in a so-calledopen-delta connection. Because the currents in each of the two remaining transformers are thesame as the line current, each transformer carries times the current it was carrying in theclosed-delta connection. The open-delta bank continues to deliver three-phase currents and volt-ages in their correct phase relationship. To keep the transformers from being overloaded, however,it is necessary to reduce the line currents by approximately 1/ .
Figure 4.20 Y-Δ transformer with the primary side leading the secondary side by 30˚. (From [7]. Used with permission.)
Figure 4.21 Δ-Y transformer with the primary side leading the secondary side by 30°. (From [7]. Used with permission.)
Figure 4.22 Δ-Δ transformer with 0° phase shift between the primary and the secondary sides. (From [7]. Used withpermission.)
VBN
VCN
VAN
N na
cb
+ACB
+
Vbc
Vab
Van
Vcn
3
3
3
b
a− n
cVCA
VBC
VAN
VAB Vcn
Vbn
Van
+B +
AC
BVcn
Vbn
Van+ +
An
b
acC
VCA
VBC
VAN
VAB
© 2007 by Taylor & Francis Group, LLC

Power Transformers 75
• Scott or T-connection. The Scott or T-connection isused when a two-phase (or a transformed three-phase)supply is needed from a three-phase system. In general,the T-connection is used for deriving a three-phasetransformation, and the Scott connection is mainly usedfor obtaining a two-phase output. The two connectionsare similar in basic design. Either connection requirestwo specially wound single-phase transformers. Themain transformer has a 50% tap on the primary wind-ing, whereas the other transformer, called the teasertransformer, has an 86.6% tap. The main transformer is connected between two primary lines,whereas the teaser transformer is connected from the center tap of the main transformer to thethird primary line. The secondary sides of the transformers provide two-phase service. A T-connection is shown in Figure 4.23.
4.4 Transformer Failure Modes
The failure of a power transformer is almost always a catastrophic event that will cause the system to fail.The two primary enemies of power transformers are transient overvoltages and heat. Power input to atransformer is not all delivered to the secondary load. Some is expended as copper losses in the primaryand secondary windings. These I 2R losses are practically independent of voltage; the controlling factor iscurrent flow. To keep the losses as small as possible, the coils of a power transformer are wound with wireof the largest cross section that space will permit. A medium-power, three-phase power transformer isshown in Figure 4.24.
A practical transformer also will experience core-related losses, also known as iron losses. Repeatedmagnetizing and demagnetizing of the core (which occurs naturally in an ac waveform) results in powerloss because of the repeated realignment of the magnetic domains. This factor (hysteresis loss) is propor-tional to frequency and flux density. Silicon steel alloy is used for the magnetic circuit to minimize hyster-esis loss. The changing magnetic flux also induces circulating currents (eddy currents) in the corematerial. Eddy current loss is proportional to the square of the frequency and the square of the flux den-sity. To minimize eddy currents, the core is constructed of laminations or layers of steel that are clampedor bonded together to form a single magnetic mass.
Figure 4.24 A medium-power, three-phase transformer.
Aa
b
C
BFigure 4.23 The T-connection for a three-phase to two-phase transformation. (From[7]. Used with permission.)
© 2007 by Taylor & Francis Group, LLC

76 AC Power Systems Handbook
4.4.1 Thermal Considerations
Temperature rise inside a transformer is theresult of power losses in the windings and thecore. The insulation within and between thewindings tends to blanket these heat sources andprevents efficient dissipation of the waste energy,as illustrated in Figure 4.25. Each successive layerof windings (shown as A, B, and C in the figure)acts to prevent heat transfer from the hot core tothe local environment (air).
The hot spot shown in the figure can bedangerously high even though the outside trans-former case and winding are relatively cool tothe touch. Temperature rise is the primary limit-ing factor in determining the power-handlingcapability of a transformer. To ensure reliable operation, a large margin of safety must be designed into atransformer. Design criteria include winding wire size, insulation material, and core size.
4.4.1.1 Life Expectancy and Temperature
The nameplate kVA rating of a transformer represents the kVA that will result in the rated average wind-ing temperature rise when the unit is operated at 100% of rated kVA under normal service conditions[8]. When operating under these conditions, the result should be a normal life expectancy for the trans-former.
A general rule of thumb says that a 30-year life can be expected for a transformer with a 220°C insu-lating system that has a winding hot-spot temperature allowance of 30°C. Operating such a transformerat rated kVA on a continuous basis with a 30°C, 24-hr average ambient (40°C maximum ambient) shouldequate to a normal useful life.
It should be recognized that the life expectancy of transformers operating at varying temperatures isnot accurately known. Fluctuating load conditions and changes in ambient temperatures make it diffi-cult, if not impossible, to arrive at such definitive information. However, if a transformer is operatedunder normal conditions, it could easily last longer. A 40-year life span is not unusual, and some trans-formers have exceeded that.
4.4.2 Voltage Considerations
Transformer failures resulting from transient overvoltages typically occur between layers of windingswithin a transformer. (See Figure 4.26.) At the end of each layer, where the wire rises from one layer to thenext, zero potential voltage exists. However, as the windings move toward the opposite end of the coil in atypical layer-wound device, a potential difference of up to twice the voltage across one complete layerexists. The greatest potential difference, therefore, is found at the far opposite end of the layers.
Figure 4.26 Voltage distribution between the layers of a typical layer-wound power transformer.
ACoolingsurfaces
Hot spot
Core
BC
Windings
Figure 4.25 The dynamic forces of heat generation in apower transformer.
Last turn
Start turn
0 volts
V
V
0 volts
0 volts
End of turnTransformer core
V
SE
SE
ES
ES
© 2007 by Taylor & Francis Group, LLC

Power Transformers 77
This voltage distribution applies to continu-ous 60 Hz signals. When the transformer is firstswitched on or when a transient overvoltage isimpressed upon the device, the voltage distribu-tion from one hot layer to the next can increasedramatically, raising the possibility of arc-over.This effect is caused by the inductive nature ofthe transformer windings and the inherent dis-tributed capacitance of the coil. Insulation break-down can result from one or more of thefollowing:
• Puncture through the insulating material of the device• Tracking across the surface of the windings• Flashing through the air
Any of these modes can result in catastrophic failure. Figure 4.27 illustrates the mechanismsinvolved. A transformer winding can be modeled as a series of inductances and shunt capacitances. Theinterturn and turn-to-ground capacitances are shown by Cs and Cg, respectively. During normal opera-tion, the applied voltage is distributed evenly across the full winding. However, if a steep front wave isimpressed upon the device, the voltage distribution radically changes. For the voltage wave to start dis-tributing itself along the winding, the line-to-ground capacitance (Cg) must be charged. This charging isdependent upon the transformer winding-to-ground capacitance and the impedance of the supply line.
4.4.3 Mechanical Considerations
Current flow through the windings of a transformer applies stress to the coils. The individual turns in anyone coil tend to be crushed together when current flows through them. There also may be large repulsionforces between the primary and secondary windings. These mechanical forces are proportional to thesquare of the instantaneous current; they are, therefore, vibratory in nature under normal operating con-ditions. These forces, if not controlled, can lead to failure of the transformer through insulation break-down. Vibration over a sufficient period of time can wear the insulation off adjacent conductors andcreate a short circuit. To prevent this failure mode, power transformers routinely are coated or dippedinto an insulating varnish to solidify the windings and the core into one element.
4.4.3.1 Dry-Type and Liquid-Filled Transformers
The advantages and disadvantages of dry-type transformers vs. liquid-filled units depend upon the application[9]. Dry-type transformers can usually be located closer to the load, resulting in cost savings because of shortercable runs and lower electrical losses. A liquid-filled transformer, on the other hand, may require special con-struction features for the room in which it will be placed because of fire-safety considerations. This may dictatea location some distance from the load. In addition, periodic testing must be conducted on the fluid to deter-mine its dielectric strength, water content, dissolved gases, and other parameters.
In some applications, there is no option to the use of liquid-filled transformers; dry-types are limitedin size and voltage handling capability. Liquid-filled types are available in almost limitless kVA and volt-age ratings. Also, if requirements call for a transformer to be located outdoors, it may be less expensive topurchase a liquid-filled unit. With oil as the liquid, the cost would be lower than for a dry-type of equiva-lent rating; with low-firepoint fluids, the cost would probably be comparable to a dry-type.
For liquid-filled transformers, the main cooling/insulating mediums used today are mineral oil,high-molecular-weight hydrocarbon, and silicone fluid. If a leak occurs in the transformer tank, firesafety becomes an important issue. Because of hazards associated with tank rupture and the possible igni-tion of the dielectric, a thorough analysis covering fire safety and the possible effects on the environmentshould be carried out well in advance of device installation.
L
CsCg
Figure 4.27 Capacitive distribution along the windingsof a power transformer.
© 2007 by Taylor & Francis Group, LLC

78 AC Power Systems Handbook
Some materials are covered under the Federal Resource Conservation and Recovery Act and theClean Water Act, including requirements for
• Special handling• Spill reporting• Disposal procedures• Record-keeping
These considerations can have an effect on installation costs, long-term operating expenses, andmaintenance procedures.
4.4.3.2 Insulation Materials
Liquid-filled transformers use an insulation system of kraft or aramid paper, pressboard or aramid spac-ers, and a fluid that serves as both an insulating and cooling medium for the transformer [9]. Paper iscommonly used for insulation between layers of winding material. It typically has an diamond-patternedadhesive backing that, when cured, solidly contains the winding. Spacers serve as a form (which can berectangular or cylindrical in shape) for the windings as well as a spacer between layers of the windings.The spacing is necessary to allow the insulating fluid to flow through and cool the windings and the core.Spacers are also used to insulate the windings from the core as well as to support the leads on their pathto the bushings.
Any moisture that is present in the finished core and winding assembly is purged by vacuum andoven drying processes. After removal from the oven and while still hot, all connections are tightened andthe entire assembly is immersed into its liquid-filled tank. This ensures that moisture will not again pen-etrate into the windings and also allows the insulation to absorb the maximum amount of dielectricfluid.
The particular type of insulation used is rarely specified by the customer for other than large utilitysubstation transformers or for unusual applications. More often, it is the transformer manufacturer’s orrebuilder’s choice based upon the operating conditions the transformer must meet.
4.4.3.3 Insulating Liquids
Dielectric liquids of various types are used as an insulating medium as well as a means of cooling liquid-filled transformers [9]. Common insulating liquids include the following:
• Mineral oil. A mineral oil-filled transformer is generally the smallest, lightest, and most econom-ical transformer available. Mineral oil has excellent properties for use in transformers, but it hasthe inherent weakness of being flammable. Its use, therefore, is restricted to outdoor installationsor when the transformer is installed within a vault if used indoors.
• Silicone. A wide variety of synthetic polymer chemicals are referred to by the generic term silicone.Silicone transformer liquids are actually known chemically as polydimethylsiloxane (PDMS). PDMSis a water-clear, odorless, chemically stable, nontoxic liquid.
• High-molecular-weight hydrocarbon (HMWH). HMWH is another high-firepoint dielectric thatis widely used as a transformer liquid. It has similar values for dielectric strength and dielectricconstant, power factor, and thermal conductivity as mineral oil.
Fire properties of dielectric fluids are typically classified by the following characteristics:• Flash point: The temperature at which vapors from a liquid surface will ignite in the presence of
a flame.• Fire point: The temperature at the surface of a liquid that will sustain a fire.• Flame spread: A series of consecutive ignitions.• Ease of ignition: How readily the liquid will generate and maintain a flammable fuel/vapor mixture
at the surface.• Heat release rate: The product of vaporization rate and the heat of combustion of the fluid. The
higher this rate in a large-scale fire, the higher the degree of fire hazard.
© 2007 by Taylor & Francis Group, LLC

Power Transformers 79
Selection of the dielectric liquid depends on the transformer application. Normally, the choice ismineral oil if the device is to be located outdoors. The National Electrical Code (NEC) does, however,specify certain limitations regarding the use of oil-filled transformers in particular outdoor locations.The selection of less-flammable liquids (PDMS and HMWH) often depends upon personal preference,the liquid used in other transformers on the site, or the transformer manufacturer’s recommendation.
4.4.3.4 Cooling
In cooling a liquid-filled transformer, the insulating fluid flows in the transformer through ducts andaround the coil ends within a tank that contains the core and coils [9]. Removal of the heat from the fluidtakes place in external tubes. These radiators consist of headers extending from the bottom and top of thetransformer tank and rows of tubes connected between the two headers. When operating within its self-cooled (OA) rating, natural convection caused by temperature differences within the tank carries the oilup through the windings, down through the cooling tubes, and back into the tank. The transformer fluid,acting as a heat-transfer medium, picks up the heat from the core and coils and dissipates it to the air viathe tubes.
Auxiliary cooling fans can be provided if the transformer is to be operated above its self-cooled rat-ings. This is advisable when the transformer is to operate under occasional heavy overloads or high ambi-ent temperatures, or to accommodate new loads beyond its rating. Liquid-filled transformers, because oftheir double heat-transfer requirement (core/coil-to-liquid and liquid-to-air), have a lower forced air(FA) rating than dry-types. In liquid-filled types, the forced air rating of transformers up to 2500 kVA israised to 115% of its self-cooled kVA rating, and those of larger units to 125% of their self-cooled VA rat-ing.
Cooling fans can be controlled manually or automatically. Fans can be cycled on automatically basedon the top oil temperature, winding temperature, or ambient temperature. Alarm contacts and remoteindication are also available options.
4.5 References
1. Parker, M. R., and W. E. Webb: “Magnetic Materials for Inductive Processes,” in The ElectronicsHandbook, 2nd ed, J. C. Whitaker (Ed.), CRC Press, Boca Raton, FL, 2005.
2. Plonus, M. A.: Applied Electromagnetics, McGraw-Hill, New York, NY, 1978.3. Irwin, J. D.: Basic Engineering Circuit Analysis, 5th ed., Macmillan, New York, 1995.4. Cheng, D. A.: Fundamentals of Engineering Electromagnetics, Addison-Wesley, New York, 1993.5. Gross, C., “Fault Analysis in Power Systems,” in The Electrical Engineering Handbook, R. C. Dorf
(Ed.), p. 1252, CRC Press, Boca Raton, FL, 1993.6. Ula, S., “Transformers,” in The Electronics Handbook, Jerry C. Whitaker (Ed.), p. 927, CRC Press,
Boca Raton, FL, 1996.7. Chowdhury, B., “Power Distribution and Control,” in The Electronics Handbook, J.C. Whitaker
(Ed.), p. 1003, CRC Press, Boca Raton, FL, 1996.8. Berutti, A., “Specifying Dry-Type Transformers,” in Practical Guide to Applying, Installing, and
Maintaining Transformers, Robert Morgan (Ed.), PRIMEDIA Intertec, Overland Park, KS, p. 66–70,1994.
9. Berutti, A., “Specifying Liquid-Filled Transformers,” in Practical Guide to Applying, Installing, andMaintaining Transformers, Robert Morgan (Ed.), PRIMEDIA Intertec, Overland Park, KS, p. 56–58,1994.
4.6 Bibliography
Fink, D., and D. Christiansen (Eds.), Electronics Engineers’ Handbook, 3rd ed., McGraw-Hill, New York,1989.
© 2007 by Taylor & Francis Group, LLC

80 AC Power Systems Handbook
Jordan, Edward C. (Ed.), Reference Data for Engineers: Radio, Electronics, Computer, and Communications,7th ed., Howard W. Sams Company, Indianapolis, IN, 1985.
Lawrie, R., Electrical Systems for Computer Installations, McGraw-Hill, New York, 1988.Lowdon, Eric, Practical Transformer Design Handbook, Howard W. Sams Company, Indianapolis, IN,
1980.Meeldijk, Victor, “Why Do Components Fail?” Electronic Servicing & Technology, Intertec Publishing,
Overland Park, KS, November 1986.Sankaran, C., “Transformers,” in The Electrical Engineering Handbook, R. C. Dorf (Ed.), p. 33, CRC Press,
Boca Raton, FL, 1993.
© 2007 by Taylor & Francis Group, LLC

81
5
Capacitors
5.1 Introduction
A capacitor consists, basically, of two conductors separated by a dielectric. The operation of a capacitor in acircuit is dependent upon its ability to charge and discharge. When a capacitor charges, an excess of electronsis accumulated on one plate, and a deficiency of electrons is created on the other plate. Capacitance is deter-mined by the size of the conductive material (the plates) and their separation (determined by the type andthickness of the dielectric material). Capacitance is directly proportional to plate size and inversely propor-tional to the distance between the plates. The unit of capacitance is the
farad
(F). A capacitance of 1 F resultswhen a potential of 1 V causes an electric charge of 1 coulomb to accumulate on a capacitor.
5.2 Basic Principles
The value of a parallel-plate capacitor can be found from
(5.1)
where
C
= Capacitance (F)
ε
= Dielectric constant of the insulation
d
= Spacing between the plates
N
= Number of plates
A
= Area of the plates
x
= 0.0885 when
A
and
d
are in centimeters
The work necessary to transport a unit charge from one plate to another is
e
=
k g
(5.2)
where
e
= Volts expressing energy per unit charge
k
= Proportionality factor between the work necessary to carry a unit charge between the two plates and the charge already transported
g
= Coulombs of charge already transported
The latter quantity (
k
) is equal to 1/
C
, where
C
is the capacitance in F.The value of a capacitor can now be calculated from
(5.3)
where
q
= charge (C) and
e
is found from Equation 5.2.
The energy stored in a capacitor is
Cx N A
d=
−( )⎡⎣ ⎤⎦ × −ε 1
10 13
C qe---=
© 2007 by Taylor & Francis Group, LLC

82
AC Power Systems Handbook
(5.4)
where
W
= Energy (J)
C
= Capacitance (F)
V
= Applied voltage (V)
If a direct current is applied to a capacitor, the device will charge to the value of the applied voltage.After the capacitor is fully charged, it will block the flow of direct current. However, if an ac voltage isapplied, the changing value of current will cause the device to alternately charge and discharge. In apurely capacitive circuit, the situation shown in Figure 5.1 will exist. The greatest amount of current willflow when the voltage changes most rapidly; that point occurs at the 0 and 180° positions in the sine wavewhere the polarity reverses. At these positions, maximum current is developed in the circuit, as shown. Itis evident by studying the waveform that, in a purely capacitive circuit, voltage will lag current by 90°.Because all practical circuits contain some resistance, a lag of 0 to 90° may be experienced in practice. Fig-ure 5.2 illustrates a case in which voltage lags current by 30º.
Figure 5.1
A purely capacitive circuit: (
a
) circuit diagram; (
b
) representative waveforms; (
c
) vector representation.
W CV 2
2----------=
Capacitiveload V
I
ACsource
(a)
(b)
Voltage
0
Volta
ge, c
urre
nt, p
ower Current
Power
180°90° 270°
360°
(c)V
I
+
_
Time
90°
© 2007 by Taylor & Francis Group, LLC
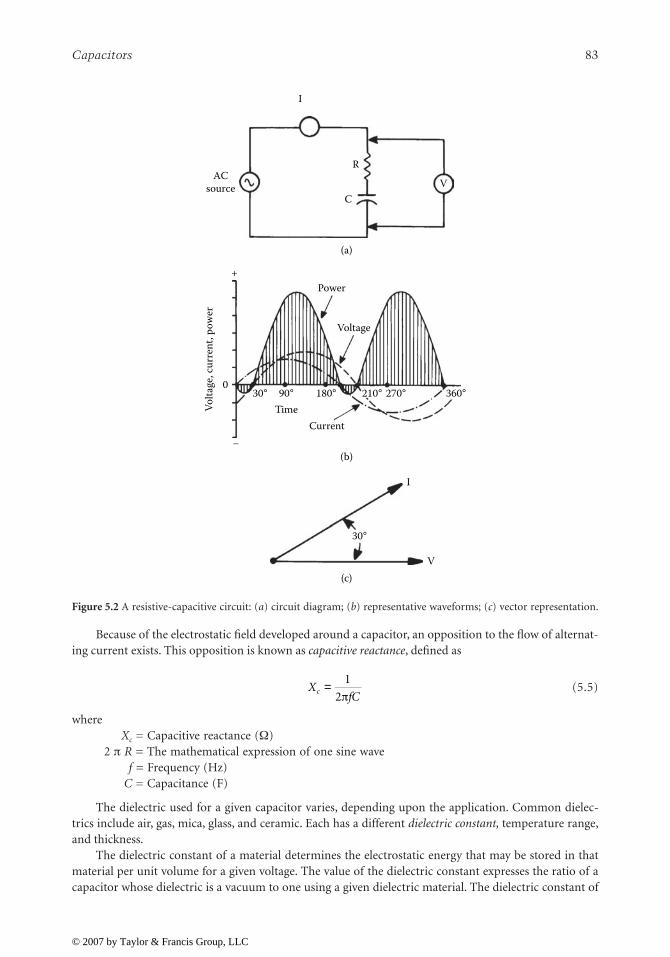
Capacitors
83
Because of the electrostatic field developed around a capacitor, an opposition to the flow of alternat-ing current exists. This opposition is known as
capacitive reactance
, defined as
(5.5)
where
X
c
= Capacitive reactance (
Ω
)2
π
R
= The mathematical expression of one sine wave
f
= Frequency (Hz)
C
= Capacitance (F)
The dielectric used for a given capacitor varies, depending upon the application. Common dielec-trics include air, gas, mica, glass, and ceramic. Each has a different
dielectric constant,
temperature range,and thickness.
The dielectric constant of a material determines the electrostatic energy that may be stored in thatmaterial per unit volume for a given voltage. The value of the dielectric constant expresses the ratio of acapacitor whose dielectric is a vacuum to one using a given dielectric material. The dielectric constant of
Figure 5.2
A resistive-capacitive circuit: (
a
) circuit diagram; (
b
) representative waveforms; (
c
) vector representation.
ACsource
R
CV
I
(a)
(b)
(c)
CurrentTime
Power
Voltage
Volta
ge, c
urre
nt, p
ower
030°
30°
90° 180° 270° 360°
I
V
+
_
210°
XfC
c =1
2π
© 2007 by Taylor & Francis Group, LLC

84
AC Power Systems Handbook
air is 1, the reference unit employed for characterizing this parameter. As the dielectric constant isincreased or decreased, the capacitance will increase or decrease, respectively. Table 5.1 lists the dielectricconstants of various common materials.
The dielectric constant of most materials is affected by both temperature and frequency, except forquartz, Styrofoam, and Teflon, whose dielectric constants remain essentially constant.
In addition to capacitance, a practicalcapacitor has inductance and resistance com-ponents, as shown in Figure 5.3. The stray com-ponents are identified as follows:
•
R
s
= Series resistance of wire leads, con-tact terminations, and electrodes
•
R
p
= Shunt resistance resulting from theresistivity of the dielectric and case mate-rial, and dielectric losses
•
L
= Stray inductance resulting from theleads and the electrodes
The
equivalent series resistance
(ESR) of a capacitor is the ac resistance of the device, reflecting boththe series resistance (
R
s
) and the parallel resistance (
R
p
) at a given frequency. This parameter permits the lossresulting from the foregoing elements to be expressed as a loss in a single resistor in the equivalent circuit.
The
power factor
(PF) of a capacitor defines the electrical losses in the device operating under an acvoltage. In an ideal device, the current will lead the applied voltage by 90°. A practical capacitor, becauseof its dielectric, electrode, and contact termination losses, exhibits a phase angle of less than 90°. Thepower factor of a capacitor is defined as the ratio of the effective series resistance to the impedance of thecapacitor. PF usually is expressed as a percentage.
The
quality factor
(
Q
) of a capacitor is the ratio of the capacitor reactance to the resistance of thedevice at a specified frequency. The
Q
is determined by the equations
(5.6)
(5.7)
where
Q
= Quality factor
f
= Frequency (Hz)
C
= Value of capacitance (F)
R
= Internal resistance (
Ω
)
PF
= Power factor
Table 5.1
Comparison of Capacitor Dielectric Constants (
After
[1].)
Dielectric
K (Dielectric Constant)
Air or vacuum 1.0Paper 2.0 – 6.0Plastic 2.1 – 6.0
Mineral oil 2.2 – 2.3Silicone oil 2.7 – 2.8
Quartz 3.8 – 4.4Glass 4.8 – 8.0
Porcelain 5.1 – 5.9Mica 5.4 – 8.7
Aluminum oxide 8.4Tantalum pentoxide 26.0
Ceramic 12.0 – 400,000.0
C
Rp
RsL
Figure 5.3 The equivalent circuit of a capacitor.
QfCR
=1
2π
Q 1PF------=
© 2007 by Taylor & Francis Group, LLC

Capacitors
85
Other important specifications for capacitors include:
•
Dielectric absorption
(DA): The reluctance of the dielectric to give up stored electrons when thecapacitor is discharged. This is often called
memory
because if a capacitor is discharged througha resistance and the resistance is removed, the electrons that remain in the dielectric will reconveneon the electrode, causing a voltage to appear across the capacitor. DA is usually measured bycharging the capacitor for 5 min, discharging it for 5 s, then having an open circuit for 1 min,after which the recovery voltage is read. The percentage of DA is defined as the ratio of recoveryvoltage to charging voltage times 100.
•
Dissipation factor
(DF): The ratio of the effective series resistance to capacitive reactance. DFnormally is expressed as a percentage.
•
Leakage current:
The current flowing through the capacitor when a dc voltage is applied.•
Insulation resistance:
The ratio of the applied voltage to the leakage current. Insulation resistanceis normally expressed in megohms.
•
Ripple current/voltage:
The rms value of the maximum allowable alternating current or voltage(superimposed on any dc level) at a specific frequency at which the capacitor may be operatedcontinuously at a specified temperature.
•
Surge voltage:
The maximum operating voltage of the capacitor at any temperature.
5.2.1 Series and Parallel Connections
The formulas for series and parallel connection of capacitors can be obtained from the general consider-ation of series and parallel connection of impedances [2]. For series connection
(5.8)
where
C
1
,
C
2
, ... ,
C
n
are the capacitances of the capacitors connected in series. Then, the equivalent capac-itance
C
can be found as
(5.9)
and is always less than the value of the smallest capacitance. This result can be used when the conditionsfor using the impedance concept are valid, that is, the capacitors are discharged.
The series connection of two capacitors has the equivalent capacitance
(5.10)
In a similar way one can obtain the equivalent capacitance of parallel connection as
(5.11)
and is always larger than the largest capacitance.Furthermore, the following two results are useful (for initially discharged capacitors):
• The voltage applied to two capacitors connected in series is divided between these two capacitorsinversely proportionally to their capacitance (thus, the larger part of the voltage is on the smallercapacitance).
1sC------ 1
sC1--------- 1
sC2--------- … 1
sCn---------+ + +=
C 1C1------ 1
C2------ … 1
Cn------+ + +⎝ ⎠
⎛ ⎞ 1–=
CC1C2
C1 C2+------------------=
C C1 C2 … Cn+ + +=
© 2007 by Taylor & Francis Group, LLC

86
AC Power Systems Handbook
• The current applied to two capacitors connected in parallel is divided between these two capacitorsproportionally to their capacitance (thus, the larger part of the current goes through the largercapacitance).
5.2.2 Practical Capacitors
Practical capacitors can be generally divided capacitors in four broad classes [2]:
• The first class includes low-loss capacitors with good capacitance stability. These are (in accordancewith the dielectric) mica, glass, some ceramic, and low-loss plastic film (polypropylene, polysty-rene) capacitors.
• The second class are capacitors of medium loss and medium stability designed to operate over awide range of dc and ac voltages. These are paper (oil and wax impregnated), plastic film, andsome ceramic capacitors. The dc applications include coupling, decoupling, bypass, smoothingand power separating filters, and energy storage. The ac applications include motor start, lightning,interference suppression, and power-line applications (switching and measurement equipment).
• The third class are aluminum and tantalum electrolytic capacitors providing high capacitance ina small size. For the same rated voltage tantalum capacitors have as much as three times largercapacitance per volume unit as aluminum, they are more reliable and have longer service life. Theelectrolytics are designed for dc and polarized voltage applications. Less-expensive aluminumcapacitors are used in radio and television equipment; more expensive tantalum capacitors aredestined for military and harsh environmental applications.
• The fourth class are fixed value capacitors (mica, glass, oil, gas, and vacuum) designed for high-voltage (up to 35 kV peak), high-current (up to 200 A) transmitter and power control applications.
The typical construction of common discrete capacitors is illustrated in Figure 5.4. Table 5.2 lists thecharacteristics of common capacitor types.
5.3 Capacitor Failure Modes
Experience has shown that capacitor failures are second only to semiconductors and vacuum tubes incomponents prone to malfunction in electronic equipment. Capacitors for ac applications range fromhigh-voltage oil-filled devices, such as the one shown in Figure 5.5, to low voltage, high capacitancedevices of the type typically found in power supplies (both linear and switching). Of all the various typesof capacitors used today, it is estimated that electrolytics present the greatest potential for problems toequipment users.
5.3.1 Electrolytic Capacitors
Electrolytic capacitors are popular because they offer a large amount of capacitance in a small physicalsize. They are widely used as filters in low-voltage power supplies and as coupling devices in audio and RFstages. An aluminum electrolytic capacitor consists of two aluminum foil plates separated by a porousstrip of paper (or other material) soaked with a conductive electrolyte solution. Construction of a typicaldevice is illustrated in Figure 5.6. The separating material between the capacitor plates does not form thedielectric but, instead, serves as a spacer to prevent the plates from mechanically short-circuiting. Thedielectric consists of a thin layer of aluminum oxide that is electrochemically formed on the positive foilplate. The electrolyte conducts the charge applied to the capacitor from the negative plate, through thepaper spacer, and into direct contact with the dielectric. This sandwich arrangement of foil-spacer-foil isthen rolled up and encapsulated.
Problems with electrolytic capacitors fall into two basic categories: mechanical failure and failure ofelectrolyte.
© 2007 by Taylor & Francis Group, LLC

Capacitors
87
Table 5.2 Parameters and Characteristics of Discrete Capacitors (After [2].)
Capacitor Type RangeRated Voltage,
VR
TC ppm/
°C Tolerance,
±%
Insulation Resistance,
MΩ μFDissipation
Factor,% Dielectric
Absorption,% Temperature
Range, °C Comments, Applications Cost
Polycarbonate 100 pF – 30 μF 50 – 800 ±50 10 5 × 10⁵ 0.200 0.10 –55/+125 High quality, small, low TC
High
Polyester/Mylar 1000 pF – 50 μF 50 – 600 +400 10 105 0.750 0.30 –55/+125 Good, popular Medium Polypropylene 100 pF – 50 μF 100 – 800 –200 10 105 0.200 0.10 –55/+105 High quality, low
absorptionHigh
Polystyrene 10 pF – 2.7 μF 100 – 600 –100 10 106 0.050 0.04 –55/+85 High quality, large, low TC, signal filters
Medium
Polysulfone 1000 pF – 1 μF — +80 5 105 0.300 0.20 –55/+150 High temperature High Parylene 5000 pF – 1 μF — ±100 10 105 0.100 0.10 –55/+125 High Kapton 1000 pF – 1 μF — +I00 10 105 0.300 0.30 –55/+220 High temperature High Teflon 1000 pF – 2 μF 50 – 200 –200 10 5 × 10⁶ 0.040 0.04 –70/+250 High temperature,
lowest absorptionHigh
Mica 5 pF – 0.01 μF 100 – 600 –50 5 2.5 × 10⁴ 0.001 0.75 –55/+125 Good at RF, low TC High Glass 5 pF – 1000 μF 100 – 600 +I40 5 106 0.001 –55/+125 Excellent long-term
stabilityHigh
Porcelain 100 pF – 0.1 μF 50 – 400 +I20 5 5 × 10⁵ 0.100 4.20 –55/+125 Good long-term stability
High
Ceramic (NPO) 100 pF – 1 μF 50 – 400 ±30 10 5 × 10³ 0.020 0.75 –55/+125 Active filters, low TC Medium Ceramic 10 pF – 1 μF 50 – 30,000 — — — — — –55/+125 Small, very popular,
selectable TCLow
Paper 0.01 – 10 μF 200 – 1,600 ±800 10 5 × 10³ 1.000 2.50 –55/+125 Motor capacitors Low Aluminum 0.1 – 1.6 F 3 – 600 +2500 –10/+100 100 10.000 8.00 –40/+85 Power supply filters
short lifeHigh
Tantalum (Foil) 0.1 – 1000 μF 6 – 100 +800 –10/+100 20 4.000 8.50 –55/+85 High capacitance, small size, low inductance
High
Thin-film 10 – 200 pF 6 – 30 +I00 10 106 0.010 — –55/+125 High Oil 0.1 – 20 μF 200 – 10,000 — — — 0.500 — — High voltage filters,
large, long life—
Vacuum 1 – 1000 pF 2,000 – 3,600 — — — — — — Transmitters —
© 2007 by Taylor & Francis Group, LLC

88 AC Power Systems Handbook
5.3.1.1 Mechanical Failure
Mechanical failures relate to poor bonding of the leads tothe outside world, contamination during manufacture,and shock-induced short-circuiting of the aluminum foilplates. Typical failure modes include short circuits causedby foil impurities, manufacturing defects (such as burrson the foil edges or tab connections), breaks or tears inthe foil, and breaks or tears in the separator paper.
Short circuits are the most frequent failure modeduring the useful life period of an electrolytic capacitor.Such failures are the result of random breakdown of thedielectric oxide film under normal stress. Proper capaci-tor design and processing will minimize such failures.Short circuits also can be caused by excessive stress, wherevoltage, temperature, or ripple conditions exceed speci-fied maximum levels.
Open circuits, although infrequent during normallife, can be caused by failure of the internal connectionsjoining the capacitor terminals to the aluminum foil.Mechanical connections can develop an oxide film at thecontact interface, increasing contact resistance and even-tually producing an open circuit. Defective weld connections also can cause open circuits. Excessivemechanical stress will accelerate weld-related failures.
Figure 5.4 Construction of discrete capacitors. (From [2]. Used with permission.)
(c)Cathode lead
Silver case
Anode lead
ElectrolytePorous anode
Teflon spacer
Teflonbushing
Butt weld O-ring
Soldercoated lead
(b)
CeramicdielectricParallel plate
construction
Silverelectrode
(a)End disk
Lead
Plastic coreExtended foil construction Plastic case
Figure 5.5 An oil-filled, high-voltage capacitor.
© 2007 by Taylor & Francis Group, LLC

Capacitors 89
5.3.1.2 Temperature Cycling
Capacitors are subject to failures induced by thermalcycling. Experience has shown that thermal stress isa major contributor to failure in aluminum electro-lytic capacitors. Dimensional changes between plas-tic and metal materials can result in microscopicruptures at termination joints, possible electrodeoxidation, and unstable device termination (chang-ing series resistance). The highest-quality capacitorwill fail if its voltage or current ratings are exceeded.Appreciable heat rise (20°C during a 2-hour periodof applied sinusoidal voltage) is considered abnor-mal and may be a sign of incorrect application of thecomponent or impending failure of the device.
Figure 5.7 illustrates the effects of high ambienttemperature on capacitor life. Note that operation at33% duty cycle is rated at 10 years when the ambienttemperature is 35°C, but the life expectancy drops tojust 4 years when the same device is operated at55°C. A common rule of thumb is this: Within the range of + 75°C through the full-rated temperature,stress and failure rates double for each 10°C increase in operating temperature. Conversely, the failurerate is reduced by half for every 10°C decrease in operating temperature.
5.3.1.3 Electrolyte Failures
Failure of the electrolyte can be the result of application of a reverse bias to the component or of a dryingof the electrolyte itself. Electrolyte vapor transmission through the end seals occurs on a continuous basisthroughout the useful life of the capacitor. This loss has no appreciable effect on reliability during theuseful life period of the product cycle. When the electrolyte loss approaches 40% of the initial electrolytecontent of the capacitor, however, the electrical parameters deteriorate and the capacitor is considered tobe worn out.
Figure 5.7 Life expectancy of an electrolytic capacitor as a function of operating temperature.
Paper soaked in electrolyte
Positivelead
Negativelead
WeldedconnectionWelded
connection
Aluminumpositive plate
Aluminumnegative plate
Aluminumoxide dielectric
+
+
+
+
+
+
–
–
–
–
–
–
Figure 5.6 The basic design of an aluminum electro-lytic capacitor.
Years operation 33% duty cycle1086420
35
45
55
65
75
85
Am
bien
t deg
rees
cent
igra
de ci
rcul
atin
g ai
r
© 2007 by Taylor & Francis Group, LLC

90 AC Power Systems Handbook
As a capacitor dries out, three failure modes may beexperienced: leakage, a downward change in value, ordielectric absorption. Any one of these can cause a systemto operate out of tolerance or fail altogether.
The most severe failure mode for an electrolytic isincreased leakage, illustrated in Figure 5.8. Leakage cancause loading of the power supply or upset the dc bias ofan amplifier. Loading of a supply line often causes addi-tional current to flow through the capacitor, possiblyresulting in dangerous overheating and catastrophic fail-ure.
A change of device operating value has a less devas-tating effect on system performance. An aluminum elec-trolytic has a typical tolerance range of about ± 20%. Acapacitor suffering from drying of the electrolyte canexperience a drastic drop in value (to just 50% of its ratedvalue, or less). The reason for this phenomenon is thatafter the electrolyte has dried to an appreciable extent, thecharge on the negative foil plate has no way of coming incontact with the aluminum-oxide dielectric. This failuremode is illustrated in Figure 5.9. Remember, it is the alu-minum-oxide layer on the positive plate that gives theelectrolytic capacitor its large rating. The dried-out paperspacer, in effect, becomes a second dielectric, which signif-icantly reduces the capacitance of the device.
5.3.2 Capacitor Life Span
The life expectancy of a capacitor — operating in an idealcircuit and environment — will vary greatly, dependingupon the grade of device selected. Typical operating life,according to capacitor manufacturer data sheets, rangefrom a low of 3 to 5 years for inexpensive electrolyticdevices, to a high of greater than 10 years for computer-grade products. Catastrophic failures aside, expected life isa function of the rate of electrolyte loss by means of vaportransmission through the end seals, and the operating orstorage temperature. Properly matching the capacitor tothe application is a key component in extending the life ofan electrolytic capacitor. The primary operating parame-ters include:
• Rated voltage — the sum of the dc voltage and peakac voltage that can be applied continuously to thecapacitor. Derating of the applied voltage willdecrease the failure rate of the device.
• Ripple current — the rms value of the maximumallowable ac current, specified by product type at120 Hz and +85°C (unless otherwise noted). Theripple current may be increased when the compo-nent is operated at higher frequencies or lowerambient temperatures.
Paper soaked inelectrolyte
Positivelead
Negativelead
Aluminumoxide dielectric
Aluminumoxide
Figure 5.8 Failure mechanism of a leaky alu-minum electrolytic capacitor. As the deviceages, the aluminum oxide dissolves into theelectrolyte, causing the capacitor to becomeleaky at high voltages
Dried paper spacer
Negativelead
Positivelead
+
+
+
+
+
+
–
–
–
–
–
–
Figure 5.9 Failure mechanism of an elec-trolytic capacitor exhibiting a loss ofcapacitance. After the electrolyte dries,the plates can no longer come in contactwith the aluminum oxide. The result isa decrease in capacitor value.
© 2007 by Taylor & Francis Group, LLC

Capacitors 91
• Reverse voltage — the maximum voltage that can be applied to an electrolytic capacitor withoutdamage. Electrolytic capacitors are polarized and must be used accordingly.
5.3.3 Tantalum Capacitor
Tantalum electrolytic capacitors have become the preferred type of device where high reliability and longservice life are primary considerations. The tantalum pentoxide compound possesses high dielectricstrength and a high dielectric constant. As the components are being manufactured, a film of tantalumpentoxide is applied to the electrodes by means of an electrolytic process. The film is applied in variousthicknesses. Figure 5.10 shows the internal construction of a typical tantalum capacitor. Because of thesuperior properties of tantalum pentoxide, tantalum capacitors tend to have as much as three timeshigher capacitance per volume efficiency as an aluminum electrolytic capacitor. This, coupled with thefact that extremely thin films can be deposited during the electrolytic process, makes tantalum capacitorsefficient with respect to the number of microfarads per unit volume.
The capacitance of any device is determined by the surface area of the conducting plates, the distancebetween the plates, and the dielectric constant of the insulating material between the plates. In the tanta-lum capacitor, the distance between the plates is small; it is just the thickness of the tantalum pentoxidefilm. Tantalum capacitors contain either liquid or solid electrolytes.
5.4 References
1. Ballou, G., “Capacitors and Inductors,” in The Electrical Engineering Handbook, R. C. Dorf (Ed.),p. 15, CRC Press, Boca Raton, FL, 1993.
2. Filanovsky, I. M., “Capacitance and Capacitors,” in The Electronics Handbook, 2nd ed., J. C. Whitaker(Ed.), p. 371, CRC Press, Boca Raton, FL, 2005.
Figure 5.10 Basic construction of a tantalum capacitor.
Cathode lead
Bottom vibrationspacer
Gelled sulfuric acidelectrolyte
Sintered tantalumcathode surface
Tantalum caseTantalum anode
Tantalum tube
Tantalumriser wire Butt weld
Anode lead
TIG (tungsten inert gas) weld
Tantalum-to-glass-to-tantalum seal
Top vibration spacer
Closure weld
© 2007 by Taylor & Francis Group, LLC

92 AC Power Systems Handbook
5.5 Bibliography
Meeldijk, V., “Why Do Components Fail?” Electronic Servicing & Technology, Intertec Publishing, OverlandPark, KS, November 1986.
Technical staff, “Aluminum Electrolytic Capacitors: Reliability, Expected Life, and Shelf Capability,”Sprague Applications Guide, Sprague Electric Company, Lansing, NC, 1989.
Technical staff, “Introduction to Tantalum Capacitors,” Sprague Applications Guide, Sprague ElectricCompany, Lansing, NC, 1989.
© 2007 by Taylor & Francis Group, LLC
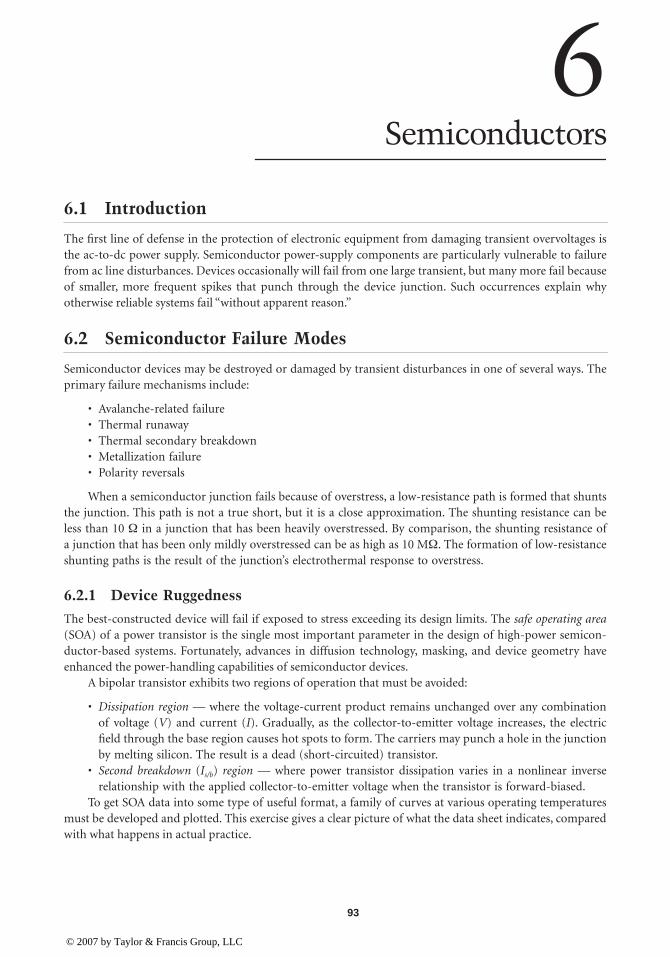
93
6
Semiconductors
6.1 Introduction
The first line of defense in the protection of electronic equipment from damaging transient overvoltages isthe ac-to-dc power supply. Semiconductor power-supply components are particularly vulnerable to failurefrom ac line disturbances. Devices occasionally will fail from one large transient, but many more fail becauseof smaller, more frequent spikes that punch through the device junction. Such occurrences explain whyotherwise reliable systems fail “without apparent reason.”
6.2 Semiconductor Failure Modes
Semiconductor devices may be destroyed or damaged by transient disturbances in one of several ways. Theprimary failure mechanisms include:
• Avalanche-related failure• Thermal runaway• Thermal secondary breakdown• Metallization failure• Polarity reversals
When a semiconductor junction fails because of overstress, a low-resistance path is formed that shuntsthe junction. This path is not a true short, but it is a close approximation. The shunting resistance can beless than 10
Ω
in a junction that has been heavily overstressed. By comparison, the shunting resistance ofa junction that has been only mildly overstressed can be as high as 10 M
Ω
. The formation of low-resistanceshunting paths is the result of the junction’s electrothermal response to overstress.
6.2.1 Device Ruggedness
The best-constructed device will fail if exposed to stress exceeding its design limits. The
safe operating area
(SOA) of a power transistor is the single most important parameter in the design of high-power semicon-ductor-based systems. Fortunately, advances in diffusion technology, masking, and device geometry haveenhanced the power-handling capabilities of semiconductor devices.
A bipolar transistor exhibits two regions of operation that must be avoided:
•
Dissipation region —
where the voltage-current product remains unchanged over any combinationof voltage (
V
) and current (
I
). Gradually, as the collector-to-emitter voltage increases, the electricfield through the base region causes hot spots to form. The carriers may punch a hole in the junctionby melting silicon. The result is a dead (short-circuited) transistor.
•
Second breakdown
(
I
s/b
)
region —
where power transistor dissipation varies in a nonlinear inverserelationship with the applied collector-to-emitter voltage when the transistor is forward-biased.
To get SOA data into some type of useful format, a family of curves at various operating temperaturesmust be developed and plotted. This exercise gives a clear picture of what the data sheet indicates, comparedwith what happens in actual practice.
© 2007 by Taylor & Francis Group, LLC
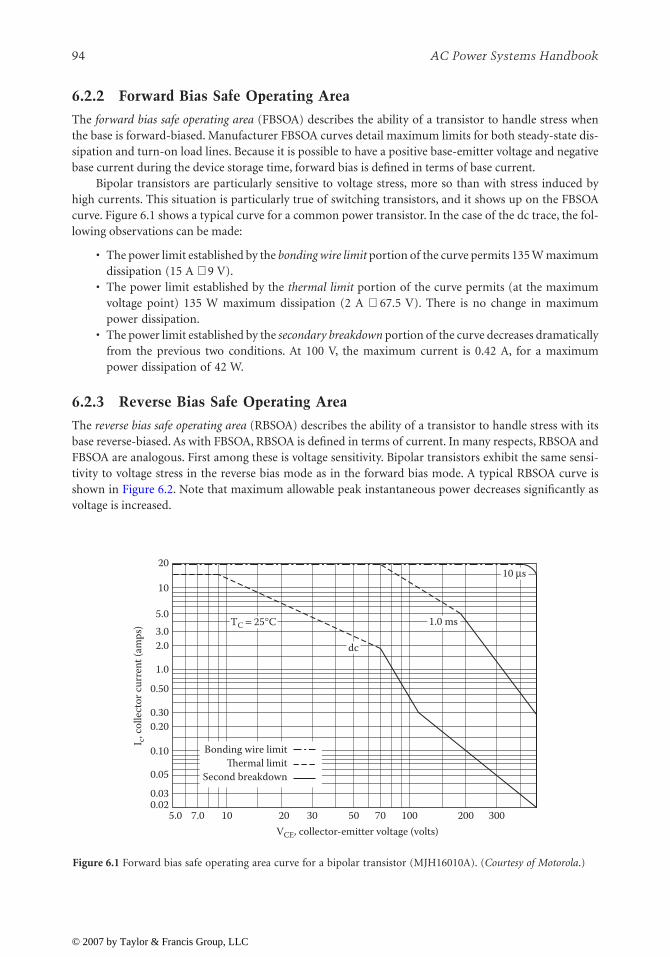
94
AC Power Systems Handbook
6.2.2 Forward Bias Safe Operating Area
The
forward bias safe operating area
(FBSOA) describes the ability of a transistor to handle stress whenthe base is forward-biased. Manufacturer FBSOA curves detail maximum limits for both steady-state dis-sipation and turn-on load lines. Because it is possible to have a positive base-emitter voltage and negativebase current during the device storage time, forward bias is defined in terms of base current.
Bipolar transistors are particularly sensitive to voltage stress, more so than with stress induced byhigh currents. This situation is particularly true of switching transistors, and it shows up on the FBSOAcurve. Figure 6.1 shows a typical curve for a common power transistor. In the case of the dc trace, the fol-lowing observations can be made:
• The power limit established by the
bonding wire limit
portion of the curve permits 135 W maximumdissipation (15 A
×
9 V).• The power limit established by the
thermal limit
portion of the curve permits (at the maximumvoltage point) 135 W maximum dissipation (2 A
×
67.5 V). There is no change in maximumpower dissipation.
• The power limit established by the
secondary breakdown
portion of the curve decreases dramaticallyfrom the previous two conditions. At 100 V, the maximum current is 0.42 A, for a maximumpower dissipation of 42 W.
6.2.3 Reverse Bias Safe Operating Area
The
reverse bias safe operating area
(RBSOA) describes the ability of a transistor to handle stress with itsbase reverse-biased. As with FBSOA, RBSOA is defined in terms of current. In many respects, RBSOA andFBSOA are analogous. First among these is voltage sensitivity. Bipolar transistors exhibit the same sensi-tivity to voltage stress in the reverse bias mode as in the forward bias mode. A typical RBSOA curve isshown in Figure 6.2. Note that maximum allowable peak instantaneous power decreases significantly asvoltage is increased.
Figure 6.1
Forward bias safe operating area curve for a bipolar transistor (MJH16010A). (
Courtesy of Motorola
.)
20
10
5.03.0
TC = 25°C
2.0
0.50
1.0
0.30
I c, co
llect
or c
urre
nt (a
mps
)
0.20
0.10
0.05
0.030.02
5.0 7.0 10 20VCE, collector-emitter voltage (volts)
30 50 70 100 200 300
dc
Bonding wire limitThermal limit
Second breakdown
1.0 ms
10 μs
© 2007 by Taylor & Francis Group, LLC
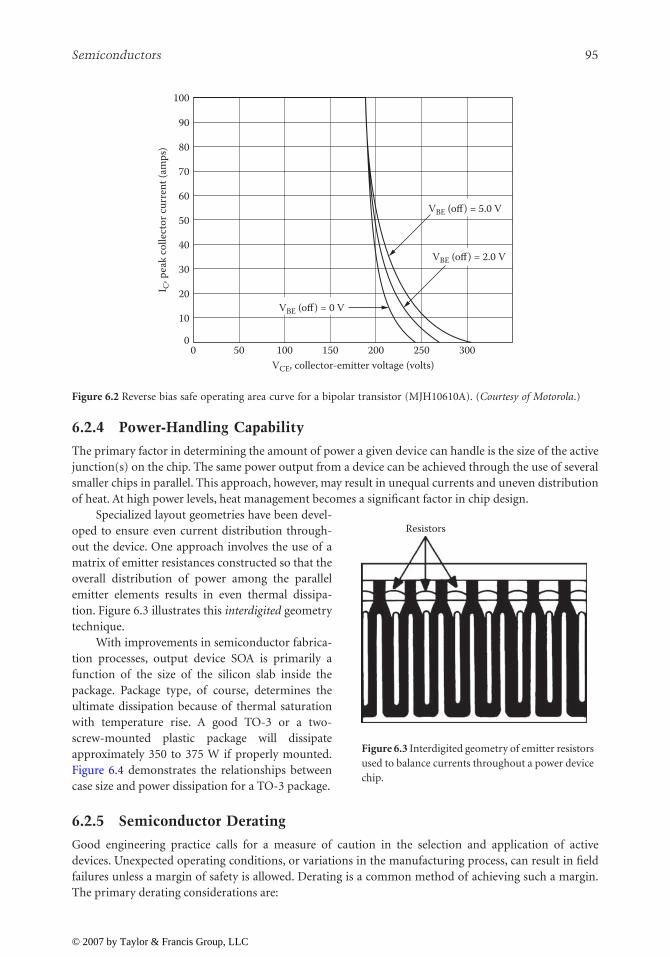
Semiconductors
95
6.2.4 Power-Handling Capability
The primary factor in determining the amount of power a given device can handle is the size of the activejunction(s) on the chip. The same power output from a device can be achieved through the use of severalsmaller chips in parallel. This approach, however, may result in unequal currents and uneven distributionof heat. At high power levels, heat management becomes a significant factor in chip design.
Specialized layout geometries have been devel-oped to ensure even current distribution through-out the device. One approach involves the use of amatrix of emitter resistances constructed so that theoverall distribution of power among the parallelemitter elements results in even thermal dissipa-tion. Figure 6.3 illustrates this
interdigited
geometrytechnique.
With improvements in semiconductor fabrica-tion processes, output device SOA is primarily afunction of the size of the silicon slab inside thepackage. Package type, of course, determines theultimate dissipation because of thermal saturationwith temperature rise. A good TO-3 or a two-screw-mounted plastic package will dissipateapproximately 350 to 375 W if properly mounted.Figure 6.4 demonstrates the relationships betweencase size and power dissipation for a TO-3 package.
6.2.5 Semiconductor Derating
Good engineering practice calls for a measure of caution in the selection and application of activedevices. Unexpected operating conditions, or variations in the manufacturing process, can result in fieldfailures unless a margin of safety is allowed. Derating is a common method of achieving such a margin.The primary derating considerations are:
Figure 6.2
Reverse bias safe operating area curve for a bipolar transistor (MJH10610A). (
Courtesy of Motorola
.)
100
90
80
70
60
50
40
I C, p
eak
colle
ctor
cur
rent
(am
ps)
30
20
10
00 50 100 150
VCE, collector-emitter voltage (volts)200 250 300
VBE (off) = 0 V
VBE (off) = 2.0 V
VBE (off) = 5.0 V
Resistors
Figure 6.3 Interdigited geometry of emitter resistorsused to balance currents throughout a power devicechip.
© 2007 by Taylor & Francis Group, LLC

96
AC Power Systems Handbook
•
Power derating —
designed tohold the worst-case junctiontemperature to a value belowthe normal permissible rating.
•
Junction-temperature derating—
an allowance for the worst-case ambient temperature orcase temperature that thedevice is likely to experience inservice.
•
Voltage derating —
an allow-ance intended to compensatefor temperature-dependentvoltage sensitivity and otherthreats to device reliability as aresult of instantaneous peak-voltage excursions caused by transient disturbances.
6.2.6 Failure Mechanisms
It is estimated that as much as 95% of all transistor failures in the field are directly or indirectly the resultof excessive dissipation or applied voltages in excess of the maximum design limits of the device. Thereare at least four types of voltage breakdown that must be considered in a reliability analysis of discretepower transistors. Although they are not strictly independent, each type can be treated separately. Keep inmind, however, that each is related to the others.
6.2.6.1 Avalanche Breakdown
Avalanche is a voltage breakdown that occurs in the collector-base junction, similar to the
Townsend effect
in gas tubes. This effect is caused by the high dielectric field strength that occurs across the collector-basejunction as the collector voltage is increased. This high-intensity field accelerates the free charge carriersso that they collide with other atoms, knocking loose additional free charge carriers that, in turn, areaccelerated and have more collisions.
This multiplication process occurs at an increasing rate as the collector voltage increases, until atsome voltage,
V
a
(avalanche voltage), the current suddenly tries to go to infinity. If enough heat is gener-ated in this process, the junction will be damaged or destroyed. A damaged junction will result in higher-than-normal leakage currents, increasing the steady-state heat generation of the device, which ultimatelycan destroy the semiconductor junction.
6.2.6.2 Alpha Multiplication
Alpha multiplication is produced by the same physical phenomenon that produces avalanche break-down, but differs in circuit configuration. This effect occurs at a lower potential than the avalanche volt-age and generally is responsible for collector-emitter breakdown when base current is equal to zero.
6.2.6.3 Punch-Through
Punch-through is a voltage breakdown occurring at the collector-base junction because of high collectorvoltage. As collector voltage is increased, the
space charge region
(collector junction width) graduallyincreases until it penetrates completely through the base region, touching the emitter. At this point, theemitter and collector are effectively short-circuited together.
Although this type of breakdown occurs in some PNP junction transistors, alpha multiplicationbreakdown generally occurs at a lower voltage than punch-through. Because this breakdown occursbetween the collector and emitter, punch-through is more serious in the common-emitter or common-collector configuration.
25 K 30 K
400
300
200
100TO-3
tran
sisto
r diss
ipat
ion
35 KDie size in square mils
40 K 45 K
Figure 6.4 Relationship between case (die) size and transistor dis-sipation.
© 2007 by Taylor & Francis Group, LLC
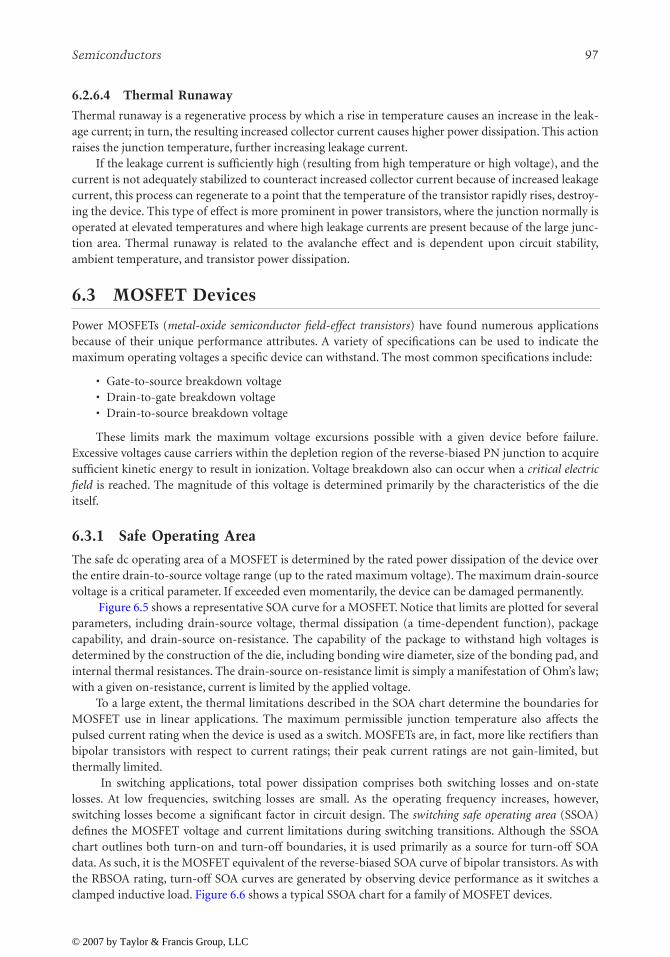
Semiconductors
97
6.2.6.4 Thermal Runaway
Thermal runaway is a regenerative process by which a rise in temperature causes an increase in the leak-age current; in turn, the resulting increased collector current causes higher power dissipation. This actionraises the junction temperature, further increasing leakage current.
If the leakage current is sufficiently high (resulting from high temperature or high voltage), and thecurrent is not adequately stabilized to counteract increased collector current because of increased leakagecurrent, this process can regenerate to a point that the temperature of the transistor rapidly rises, destroy-ing the device. This type of effect is more prominent in power transistors, where the junction normally isoperated at elevated temperatures and where high leakage currents are present because of the large junc-tion area. Thermal runaway is related to the avalanche effect and is dependent upon circuit stability,ambient temperature, and transistor power dissipation.
6.3 MOSFET Devices
Power MOSFETs (
metal-oxide semiconductor field-effect transistors
) have found numerous applicationsbecause of their unique performance attributes. A variety of specifications can be used to indicate themaximum operating voltages a specific device can withstand. The most common specifications include:
• Gate-to-source breakdown voltage• Drain-to-gate breakdown voltage• Drain-to-source breakdown voltage
These limits mark the maximum voltage excursions possible with a given device before failure.Excessive voltages cause carriers within the depletion region of the reverse-biased PN junction to acquiresufficient kinetic energy to result in ionization. Voltage breakdown also can occur when a
critical electricfield
is reached. The magnitude of this voltage is determined primarily by the characteristics of the dieitself.
6.3.1 Safe Operating Area
The safe dc operating area of a MOSFET is determined by the rated power dissipation of the device overthe entire drain-to-source voltage range (up to the rated maximum voltage). The maximum drain-sourcevoltage is a critical parameter. If exceeded even momentarily, the device can be damaged permanently.
Figure 6.5 shows a representative SOA curve for a MOSFET. Notice that limits are plotted for severalparameters, including drain-source voltage, thermal dissipation (a time-dependent function), packagecapability, and drain-source on-resistance. The capability of the package to withstand high voltages isdetermined by the construction of the die, including bonding wire diameter, size of the bonding pad, andinternal thermal resistances. The drain-source on-resistance limit is simply a manifestation of Ohm’s law;with a given on-resistance, current is limited by the applied voltage.
To a large extent, the thermal limitations described in the SOA chart determine the boundaries forMOSFET use in linear applications. The maximum permissible junction temperature also affects thepulsed current rating when the device is used as a switch. MOSFETs are, in fact, more like rectifiers thanbipolar transistors with respect to current ratings; their peak current ratings are not gain-limited, butthermally limited.
In switching applications, total power dissipation comprises both switching losses and on-statelosses. At low frequencies, switching losses are small. As the operating frequency increases, however,switching losses become a significant factor in circuit design. The
switching safe operating area
(SSOA)defines the MOSFET voltage and current limitations during switching transitions. Although the SSOAchart outlines both turn-on and turn-off boundaries, it is used primarily as a source for turn-off SOAdata. As such, it is the MOSFET equivalent of the reverse-biased SOA curve of bipolar transistors. As withthe RBSOA rating, turn-off SOA curves are generated by observing device performance as it switches aclamped inductive load. Figure 6.6 shows a typical SSOA chart for a family of MOSFET devices.
© 2007 by Taylor & Francis Group, LLC

98
AC Power Systems Handbook
Figure 6.7 illustrates a FET device switching an inductive load in a circuit with no protection from
fly-back
(back-emf) voltages. The waveform depicts the turn-off voltage transient resulting from the load andthe parasitic lead and wiring inductance. The device experiences an avalanche condition for about 300 ns atits breakdown voltage of 122 V. Placing a clamping diode across the inductive load suppresses most (but notall) of the transient. (See Figure 6.8.) The drain-to-source (
V
ds
) voltage still will overshoot the supply rail bythe sum of the effects of the diode’s forward recovery characteristics, the diode lead inductance, and the par-asitic series inductances. If the series resistance of the load is small in comparison with its inductance, a sim-ple diode clamp may allow current to circulate through the load-diode loop for a significant period of timeafter the MOSFET is turned off. When this residual current is unacceptable, a resistance can be inserted inseries with the diode at the expense of increasing the peak flyback voltage seen at the drain.
Figure 6.5
Safe operating area curve for a power FET device. (
Courtesy of Motorola
.)
Figure 6.6
Maximum rated switching safe operating area of the MTM8N40 MOSFET. (
Courtesy of Motorola
.)
200
100
40
20
5
10
I D, d
rain
curr
ent (
amps
)
2
1
0.5
0.21 2 4
VDS, drain-to-source voltage (volts)6 10 20 40 60 100
dcrDS (on) limitPackage limitThermal limit
MTM/MTH35N05
MTM/MTH35N06
VGS = 20 VSingle pulseTC = 25°C
1 ms
100 ms
10 ms
100 ms
MTH8N35
50
40
30
20
10
I D, d
rain
cur
rent
(am
ps)
00 100 200
VDS, drain-to-source voltage (volts)300 400 500
MTM/MTH8N40
MTM/MTH7N45
MTM/MTH7N50
TJ ≤ 150°C
© 2007 by Taylor & Francis Group, LLC

Semiconductors
99
Protecting the drain-source from voltage transients with a zener diode (a wideband device) isanother simple and effective solution. Except for the effects of the lead and wiring inductances and thenegligible time required to avalanche, the zener will clip the voltage transient at its breakdown voltage. Aslow-rise-time transient will be clipped completely; a rapid-rise-time transient may momentarily exceedthe zener breakdown. These effects are shown in Figure 6.9.
Figure 6.10 shows an
RC
clamp network that suppresses flyback voltages greater than the potentialacross the capacitor. Sized to sustain nearly constant voltage during the entire switch cycle, the capacitorabsorbs energy only during transients and dumps that energy into the resistance during the remainingportion of the cycle.
A series
RC
snubber circuit is shown in Figure 6.11. Although the circuit effectively reduces the peakdrain voltage, it is not as efficient as a true clamping scheme. Whereas a clamping network dissipatesenergy only during the transient, the
RC
snubber absorbs energy during portions of the switching cyclethat are not overstressing the MOSFET. This configuration also slows turn-on times because of the addi-tional drain-source capacitance that must be charged.
Historically, a MOSFET’s maximum drain-to-source voltage specification prohibited even instanta-neous excursions beyond stated limits; the first power MOSFET devices were never intended to be
Figure 6.7
Drain-source transient resulting from switching off an unclamped inductive load. (
Courtesy of Motorola
.)
Figure 6.8
Drain-source transient with a clamping diode across the inductive load. (
Courtesy of Motorola
.)
20 V/div
0
5.0 μs/div
Dra
in-s
ourc
e vo
ltage
, VD
S (vo
lts)
+V
20 V/div
05.0 μs/div
Dra
in-s
ourc
e vol
tage
, VD
S (vo
lts)
+V
© 2007 by Taylor & Francis Group, LLC

100
AC Power Systems Handbook
Figure 6.9
Drain-source transient with a clamping zener diode. (
Courtesy of Motorola
.)
Figure 6.10
Transient waveforms for a gated
RC
clamp. (
Courtesy of Motorola
.)
Figure 6.11
Drain-source transient with an
RC
snubber circuit. (
Courtesy of Motorola
.)
20 V/div
0
5.0 μs/div
Dra
in-s
ourc
e vo
ltage
, VD
S (vo
lts)
+V
VZ = 82 V
500 ns/div
Clampvoltage, VC
VDS0
20 V/div
Dra
in-s
ourc
e vol
tage
, VD
S (vo
lts)
+V
+
−VC
20 V/div
0
10 μs/div
Dra
in-s
ourc
e vol
tage
, VD
S (vo
lts)
+V
© 2007 by Taylor & Francis Group, LLC

Semiconductors
101
operated in avalanche. As is still the case with most bipolar transistors, avalanche limitations simply werenot specified. Some devices happened to be rugged, whereas others were not. Manufacturers now havedesigned power MOSFET devices that are able to sustain substantial currents in avalanche at elevatedjunction temperatures. As a result, these “ruggedized” devices have replaced older MOSFETs in criticalequipment.
6.3.2 MOSFET Failure Modes
The thermal and electrical stresses that a MOSFET device may experience during switching can be severe,particularly during turn-off when an inductive load is present. When power MOSFETs were introduced,it usually was stated that, because the MOSFET was a majority carrier device, it was immune to second-ary breakdown as observed in bipolar transistors. It must be understood, however, that a parasitic bipolartransistor is inherent in the structure of a MOSFET. This phenomenon is illustrated in Figure 6.12. Theparasitic bipolar transistor can allow a failure mechanism similar to secondary breakdown. Research hasshown that if the parasitic transistor becomes active, the MOSFET may fail. This situation is particularlytroublesome if the MOSFET drain-source breakdown voltage is approximately twice the collector-emit-ter sustaining voltage of the parasitic bipolar transistor. This failure mechanism results, apparently, whenthe drain voltage snaps back to the sustaining voltage of the parasitic device. This
negative resistance char-acteristic
can cause the total device current to constrict to a small number of cells in the MOSFET struc-ture, leading to device failure. The precipitous voltage drop synonymous with secondary breakdown is aresult of avalanche injection and any mechanism, electric or thermal, that can cause the current densityto become sufficiently large for avalanche injection to occur.
6.3.3 Breakdown Effects
The effects of the breakdown modes outlined manifest themselves in various ways on the transistor:
• Avalanche breakdown usually results in destruction of the collector-base junction because ofexcessive currents. This, in turn, results in an open between the collector and base.
• Breakdown due to alpha multiplication and thermal runaway most often results in destruction ofthe transistor because of excessive heat dissipation that shows up electrically as a short circuitbetween the collector and the emitter. This condition, which is most common in transistors thathave suffered catastrophic failure, is not always detected easily. In many cases, an ohmmeter checkmay indicate a normal condition. Only after operating voltages are applied will the failure modebe exhibited.
Figure 6.12
Cross section of a power MOSFET device showing the parasitic bipolar transistor and diode inherent inthe structure.
OxideSilicon gate
Source Body
NNN
Parasitic NPNbipolar transistor Drain-body diode
High-resistivity drain region N<–>
N PPP
Channel region
Source metal
© 2007 by Taylor & Francis Group, LLC

102
AC Power Systems Handbook
• Punch-through breakdown generally does not cause permanent damage to the transistor; it canbe a self-healing type of breakdown. After the overvoltage is removed, the transistor usually willoperate satisfactorily.
6.3.3.1 Thermal Second Breakdown
Junction burnout is a significant failure mechanism for bipolar devices, particularly
junction field-effecttransistor
(JFET) and Schottky devices. The junction between a P-type diffusion and an N-type diffusionnormally has a positive temperature coefficient at low temperatures. Increased temperature will result inincreased resistance. When a reverse-biased pulse is applied, the junction dissipates heat in a narrow
depletion region
, and the temperature in that area increases rapidly. If enough energy is applied in thisprocess, the junction will reach a point at which the temperature coefficient of the silicon will turn nega-tive. In other words, increased temperature will result in decreased resistance. A thermal runaway condi-tion can then ensue, resulting in localized melting of the junction. If sustaining energy is available afterthe initial melt, the hot spot can grow into a
filament short
. The longer the energy pulse, the wider theresulting filament short
. Current filamentation
is a concentration of current flow in one or more narrowregions, which leads to localized heating.
After the transient has passed, the silicon will resolidify. The effect on the device can be catastrophic, orit can simply degrade the performance of the component. With a relatively short pulse, a hot spot can form,but not grow completely across the junction. As a result, the damage may not appear immediately as a shortcircuit, but manifest itself at a later time as a result of
electromigration
or another failure mechanism.
6.3.3.2 Metallization Failure
The smaller device geometry required by high-density integrated circuits has increased the possibility ofmetallization failure resulting from transient overvoltages. Metallization melt is a power-dependent fail-ure mechanism. It is more likely to occur during a short-duration, high-current pulse. Heat generated bya long pulse tends to be dissipated in the surrounding chip die.
Metallization failure also can occur as a side effect of junction melt. The junction usually breaksdown first, opening the way for high currents to flow. The metallization then heats until it reaches themelting point. Metallization failure results in an open circuit. A junction short circuit can, therefore, leadto an open-circuit failure.
6.3.3.3 Polarity Reversal
Transient disturbances typically build rapidly to a peak voltage and then decay slowly. If enough induc-tance or capacitance is present in the circuit, the tail will oscillate as it decays. This concept is illustratedin Figure 6.13. The oscillating tail can subject semiconductor devices to severe voltage polarity reversals,forcing the components into or out of a conducting state. This action can damage the semiconductorjunction or result in catastrophic failure.
.
Figure 6.13
Waveshape of a typical transient disturbance. Note how the tail of the transient oscillates as it decays.
Posit
ive
Neg
ativ
e0
Time
© 2007 by Taylor & Francis Group, LLC

Semiconductors
103
6.4 Thyristor Components
The term
thyristor
identifies a general class of solid-state
silicon controlled rectifiers
(SCRs). These devicesare similar to normal rectifiers, but are designed to remain in a blocking state (in the forward direction)until a small signal is applied to a control electrode (the gate). After application of the control pulse, thedevice conducts in the forward direction and exhibits characteristics similar to those of a common siliconrectifier. Conduction continues after the control signal has been removed and until the current throughthe device drops below a predetermined threshold, or until the applied voltage reverses polarity.
The voltage and current ratings for thyristors are similar to the parameters used to classify standardsilicon rectifiers. Some of the primary device parameters include:•
Peak forward blocking voltage —
the maximum safe value that can be applied to the thyristor whileit is in a blocking state.
•
Holding current —
the minimum anode-to-cathode current that will keep the thyristor conduct-ing after it has been switched on by the application of a gate pulse.
•
Forward voltage drop —
the voltage lossacross the anode-to-cathode currentpath for a specified load current. Becausethe ratio of rms-to-average forward cur-rent varies with the angle of conduction,power dissipation for any average cur-rent also varies with the device angle ofconduction. The interaction of forwardvoltage drop, phase angle, and devicecase temperature generally are specifiedin the form of one or more graphs orcharts.
•
Gate trigger sensitivity —
the minimumvoltage or current that must be appliedto the gate to trigger a specific type ofthyristor into conduction. This valuemust take into consideration variationsin production runs and operating tem-perature. The minimum trigger voltageis not normally temperature sensitive,but the minimum trigger current canvary considerably with thyristor casetemperature.
•
Turn-on time —
the length of timerequired for a thyristor to change from anonconducting state to a conductingstate. When a gate signal is applied to thethyristor, anode-to-cathode currentbegins to flow after a finite delay. A sec-ond switching interval occurs betweenthe point at which current begins to flowand the point at which full anode current(determined by the instantaneousapplied voltage and the load) is reached.The sum of these two times is the turn-on time. The turn-on interval is illustrated in Figure 6.14.
0.9 VDA
node
vol
tage
Ano
de c
urre
nt G
ate
curr
ent
0.1 VD
trtd
ton
Figure 6.14 Turn-on waveforms for an SCR device. Td =delay time interval between a specified point at the begin-ning of a gate pulse and the instant at which the principalvoltage drops to a specified value. Tr = rise time betweenthe principal voltage dropping from one value to a secondlower value when the thyristor turns from off to on.
© 2007 by Taylor & Francis Group, LLC
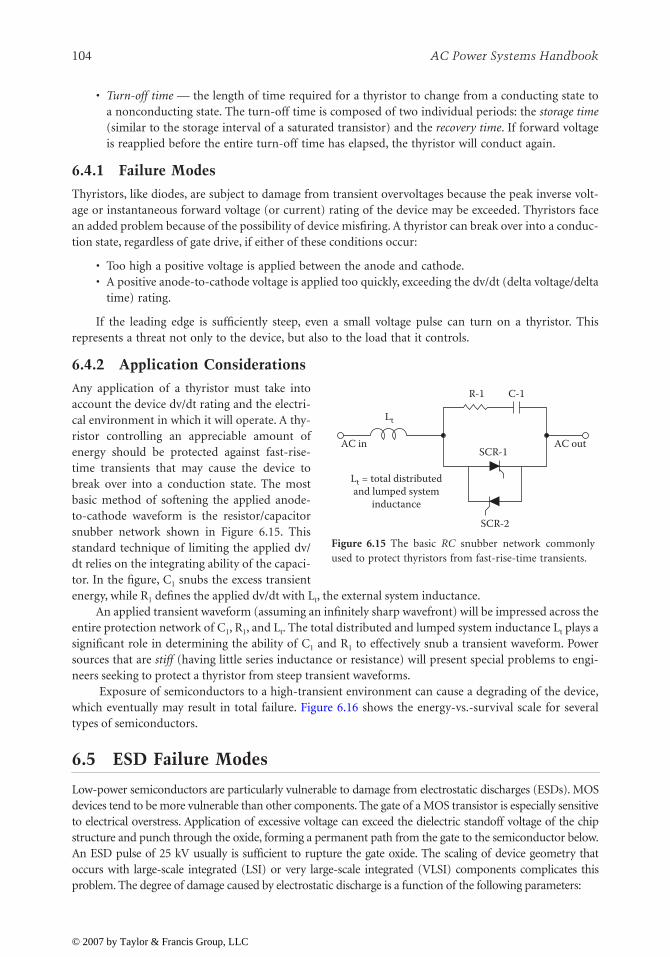
104
AC Power Systems Handbook
•
Turn-off time —
the length of time required for a thyristor to change from a conducting state toa nonconducting state. The turn-off time is composed of two individual periods: the
storage time
(similar to the storage interval of a saturated transistor) and the recovery time. If forward voltageis reapplied before the entire turn-off time has elapsed, the thyristor will conduct again.
6.4.1 Failure Modes
Thyristors, like diodes, are subject to damage from transient overvoltages because the peak inverse volt-age or instantaneous forward voltage (or current) rating of the device may be exceeded. Thyristors facean added problem because of the possibility of device misfiring. A thyristor can break over into a conduc-tion state, regardless of gate drive, if either of these conditions occur:
• Too high a positive voltage is applied between the anode and cathode.• A positive anode-to-cathode voltage is applied too quickly, exceeding the dv/dt (delta voltage/delta
time) rating.
If the leading edge is sufficiently steep, even a small voltage pulse can turn on a thyristor. Thisrepresents a threat not only to the device, but also to the load that it controls.
6.4.2 Application Considerations
Any application of a thyristor must take intoaccount the device dv/dt rating and the electri-cal environment in which it will operate. A thy-ristor controlling an appreciable amount ofenergy should be protected against fast-rise-time transients that may cause the device tobreak over into a conduction state. The mostbasic method of softening the applied anode-to-cathode waveform is the resistor/capacitorsnubber network shown in Figure 6.15. Thisstandard technique of limiting the applied dv/dt relies on the integrating ability of the capaci-tor. In the figure, C1 snubs the excess transientenergy, while R1 defines the applied dv/dt with Lt, the external system inductance.
An applied transient waveform (assuming an infinitely sharp wavefront) will be impressed across theentire protection network of C1, R1, and Lt. The total distributed and lumped system inductance Lt plays asignificant role in determining the ability of C1 and R1 to effectively snub a transient waveform. Powersources that are stiff (having little series inductance or resistance) will present special problems to engi-neers seeking to protect a thyristor from steep transient waveforms.
Exposure of semiconductors to a high-transient environment can cause a degrading of the device,which eventually may result in total failure. Figure 6.16 shows the energy-vs.-survival scale for severaltypes of semiconductors.
6.5 ESD Failure Modes
Low-power semiconductors are particularly vulnerable to damage from electrostatic discharges (ESDs). MOSdevices tend to be more vulnerable than other components. The gate of a MOS transistor is especially sensitiveto electrical overstress. Application of excessive voltage can exceed the dielectric standoff voltage of the chipstructure and punch through the oxide, forming a permanent path from the gate to the semiconductor below.An ESD pulse of 25 kV usually is sufficient to rupture the gate oxide. The scaling of device geometry thatoccurs with large-scale integrated (LSI) or very large-scale integrated (VLSI) components complicates thisproblem. The degree of damage caused by electrostatic discharge is a function of the following parameters:
R-1
SCR-1
SCR-2
Lt = total distributedand lumped system
inductance
C-1
AC outAC in
Lt
Figure 6.15 The basic RC snubber network commonlyused to protect thyristors from fast-rise-time transients.
© 2007 by Taylor & Francis Group, LLC

Semiconductors 105
• Size of the charge, determined by the capac-itance of the charged object
• Rate at which the charge is dissipated, deter-mined by the resistance into which it is dis-charged
Common techniques for controlling staticproblems include the following:
• Humidity control. Relative humidity (RH)of 50% or higher will greatly inhibit elec-trostatic problems. Too much humidity,however, can create corrosion problems andmay make some paper products dimension-ally unstable. Most data processing equip-ment manufacturers recommend 40 to 60%RH.
• Conductive floor coverings. Careful selec-tion of floor surfaces will aid greatly in con-trolling ESD problems. Conductivesynthetic rubber and other special-purposefloor coverings are ideal. Vinyl-asbestos ismarginal. Nylon carpeting usually is unac-ceptable from an ESD standpoint.
• Static drain path. A static drain path fromfloor tiles or mats to the nearest groundedmetal member is recommended in heavytraffic areas. The floor surface-to-groundresistance need not be particularly low; 500kΩ to 20 MΩ is adequate for most applica-tions.
• Ion generators. Localized, chronic static problems can be neutralized through the use of an iongenerator. Such systems commonly are used in semiconductor assembly plants and in the printingindustry to dissipate static charges.
6.5.1 Failure Mechanisms
Destructive voltages or currents from anESD event can result in device failurebecause of thermal fatigue or dielectricbreakdown. MOS transistors normally areconstructed with an oxide layer betweenthe gate conductor and the source-drainchannel region, as illustrated in Figure 6.17for a metal gate device and Figure 6.18 for asilicon gate device. Bipolar transistor con-struction, shown in Figure 6.19, is less sus-ceptible to ESD damage because the oxideis used only for surface insulation.
Low-noise transistors and diodes(most susceptible to failure)
Joules Device failure
Low-power transistors and signal diodes
Medium-power transistors
Zener diodes and rectifiers
Power SCRs and power diodes(least susceptible to failure)
High-speed transistors and ICs
10−6
10−5
10−4
10−3
10−2
10−1
1
High-power transistors
Figure 6.16 An estimate of the susceptibility of semi-conductor devices to failure because of transientenergy. The estimate assumes a transient duration ofseveral microseconds.
Metal
Gate oxide
NN P
Figure 6.17 Construction of a metal gate NMOS transistor.(After [1].)
© 2007 by Taylor & Francis Group, LLC

106 AC Power Systems Handbook
Oxide thickness is the primary factorin MOS ruggedness. A thin oxide is moresusceptible to electrostatic punch-through,which results in a permanent low-resis-tance short-circuit through the oxide.Where pinholes or other weaknesses existin the oxide, damage is possible at a lowercharge level. Semiconductor manufactur-ers have reduced oxide thickness as theyhave reduced device size. This trend hasresulted in a significant increase in sensi-tivity to ESD damage.
Detecting an ESD failure in a complexdevice can present a significant challengefor quality control engineers. For example,erasable programmable read-only memory(EPROM) chips use oxide layers less than100 angstroms, making them susceptibleto single-cell defects that can remain unde-tected until the damaged cell itself isaddressed. An electrostatic charge smallenough that it does not result in oxidebreakdown still can cause lattice damage inthe oxide, lowering its ability to withstandsubsequent ESD exposure. A weakened lat-tice will have a lower breakdown threshold voltage.
Table 6.1 lists the susceptibility of various semiconductor technologies to ESD-induced failure. Table6.2 lists the ESD voltage levels that can result from common workbench operations.
Table 6.1 The Susceptibility of Various Technologies from ESD-Induced Damage (Data courtesy of Motorola.)
Device Type Range of ESD Susceptibility (V)
Power MOSFET 100 to 2,000Power Darlington 20,000 to 40,000JFET 140 to 10,000Zener diode 40,000Schottky diode 300 to 2,500Bipolar transistor 380 to 7,000CMOS 250 to 2,000ECL 500TTL 300 to 2,500
Table 6.2 Electrostatic Voltages That Can Be Developed through Common Workbench Activities (Data courtesy of Motorola.)
Means of Static GenerationElectrostatic Voltages
10–20% RH 65–90% RHWalking across carpet 35,000 1,500Walking on vinyl floor 12,000 250Worker at bench 6,000 100Handling vinyl envelope 7,000 600Handling common polybag 20,000 1,200
MetalPolysiliconGate oxide
PN N
Figure 6.18 Construction of a silicon gate NMOS transistor.(After [1].)
Metal
Oxide Oxide
P
N
N
N
Figure 6.19 Construction of a bipolar transistor. (After [1].)
© 2007 by Taylor & Francis Group, LLC

Semiconductors 107
6.5.1.1 Latent Failures
Immediate failure resulting from ESD exposure is easily determined: the device no longer works. A failedcomponent can be removed from the subassembly in which it is installed, representing no further reli-ability risk to the system. Not all devices exposed to ESD, however, fail immediately. Unfortunately, thereis little data dealing with the long-term reliability of devices that have survived ESD exposure. Someexperts, however, suggest that two to five devices are degraded for every one that fails. Available data indi-cates that latent failures can occur in both bipolar and MOS chips and that there is no direct relationshipbetween the susceptibility of a device to catastrophic failure and its susceptibility to latent failure. Dam-age can manifest itself in one of two primary mechanisms:
• Shortened lifetime, a possible cause of many infant mortality failures seen during burn-in• Electrical performance shifts, many of which can cause the device to fail electrical limit tests
6.5.1.2 Case in Point
Figure 6.20 shows an electron microscope photo of a chip that failed because of an overvoltage condition.An ESD to this MOSFET damaged one of the metallization connection points of the device, resulting incatastrophic failure. Note the spot where the damage occurred. The objects in the photo that look likebent nails are actually gold lead wires with a diameter of 1 mil. By contrast, a typical human hair is about3 mils in diameter. The original photo was shot at ×200 magnification. Figure 6.21 offers another view ofthe MOSFET damage point, but at ×5000. The character of the damage can be observed. Some of the alu-minum metallization has melted and can be seen along the bottom edge of the hole.
6.6 Semiconductor Development
Semiconductor failures caused by high-voltage stresses are becoming a serious concern for engineers,operators, and technical managers as new, high-density integrated circuits are placed into service. Inter-nal IC connection lines that were 1.0 micron a few years ago have been reduced to well below 0.30micron. Spacing between leads has been reduced by a factor of 4 or more. The most common micropro-cessors, and many other ICs, are manufactured using a planar process where a pure silicon wafer is selec-tively masked and diffused with chemicals to make multiple transistors. This combination is thenselectively masked again, and metal is deposited on the wafer to interconnect the transistors [2]. A decadeago, most integrated circuits used only one layer of metal; today, however, advanced microprocessors usemultiple layers of metal to increase the packing density. A cross section of a five-layer microprocessor isshown in Figure 6.22.
Figure 6.20 A scanning electron microscope photo illus-trating ESD damage to the metallization of a MOSFETdevice.
Figure 6.21 The device shown in the previous figure at×5000 magnification. The character of the damage canbe observed.
© 2007 by Taylor & Francis Group, LLC

108 AC Power Systems Handbook
As the geometries of the individual transis-tors are reduced, the propagation delays throughthe devices also become smaller. Unfortunately,as the metalized interconnects get smaller, theirresistance and capacitance increases and, there-fore, the propagation delay through those inter-connects increases. As the semiconductorindustry moves to still smaller geometries, thedelay through the metal will become greaterthan the delay through the transistor itself. Thereare several approaches to this challenge — themost obvious being to use a metal with higherconductivity than aluminum (currently used inchip production). Copper offers some attractivesolutions but is more difficult to process. Alter-native design techniques that use more transis-tors and fewer interconnects are also possible.
As the transistor count goes up, then sodoes the power dissipation. More importantly, however, is the corresponding increase in frequency(power increases as the square of the frequency). The only variable that is changeable in the power equa-tion is the supply voltage — power dissipation also is proportional to the square of the voltage. This oper-ating limitation is the reason for movement to low-voltage microprocessors and other logic devices.
6.6.1 Failure Analysis
In the past, the IC overvoltage peril was primarily to semiconductor substrates. Now, however, the metal-lization itself—the points to which leads connect — is subject to damage. Failures are the result of threeprimary overvoltage sources:
• External human-made — overvoltages coupled into electronic hardware from utility company acpower feeds, or other ac or dc power sources
• External natural — overvoltages coupled into electronic hardware as a result of natural sources• Electrostatic discharge — overvoltages coupled into electronic hardware as a result of static
generation and subsequent discharge
Most semiconductor failures are of arandom nature. That is, different devicesrespond differently to a specific stress. Figure6.23 illustrates how built-in (latent) defectsin a given device affect the time-to-failurepoint of the component. Slight imperfec-tions require greater stress than gross imper-fections to reach a quantifiable failure mode.
Integrated circuits intended for com-puter applications have been a drivingforce in the semiconductor industry. Fig-ure 6.24 shows a simplified cutaway viewof a DIP IC package. Connections betweenthe die itself and the outside world aremade with bonding wires. Figure 6.25shows a cutaway view of a bonding pad.
L-5
L-4
L-3
L-2
L-1
Tungsten plugs
Figure 6.22 Cross section of a five-layer microprocessordevice. (From [2]. Courtesy of Intel.)
Gross
Moderate
Slight
Probable time to failure
Appl
ied
stre
ss
Figure 6.23 Illustration of the likelihood of component failurebased on applied stress and degree of latent defects.
© 2007 by Taylor & Francis Group, LLC

Semiconductors 109
Hybrid microcircuits also have become common in consumer and industrial equipment. A hybridtypically utilizes a number of components from more than one technology to perform a function thatcould not be achieved in monolithic form with the same performance, efficiency, or cost. A simple multi-chip hybrid is shown in Figure 6.26.
Figure 6.24 Cutaway view of a DIP integrated circuit package showing the internal-to-external interface. (After [1].)
Figure 6.25 Cutaway structure of the bonding pad of a semiconductor device. (After [3].)
Figure 6.26 Basic construction of a multichip hybrid device. (After [1].)
Package lid tosolder sealing
mediumPackage sealring to solder
sealing medium
Metal sealring to glass
body
Metal baseto glass body
Kovar packagelead to glass
meniscus
Aluminum bondwire to goldplated
Kovar package lead
Aluminum metalto silicon chip
Silicon dieto metal
package base
Pad
Al-Si (1%)
Thermally grown oxide
Silicon substrate
Protectiveovercoat
Oxide
ResistorBond wire
PostDice
Post
Substrate
Header
© 2007 by Taylor & Francis Group, LLC
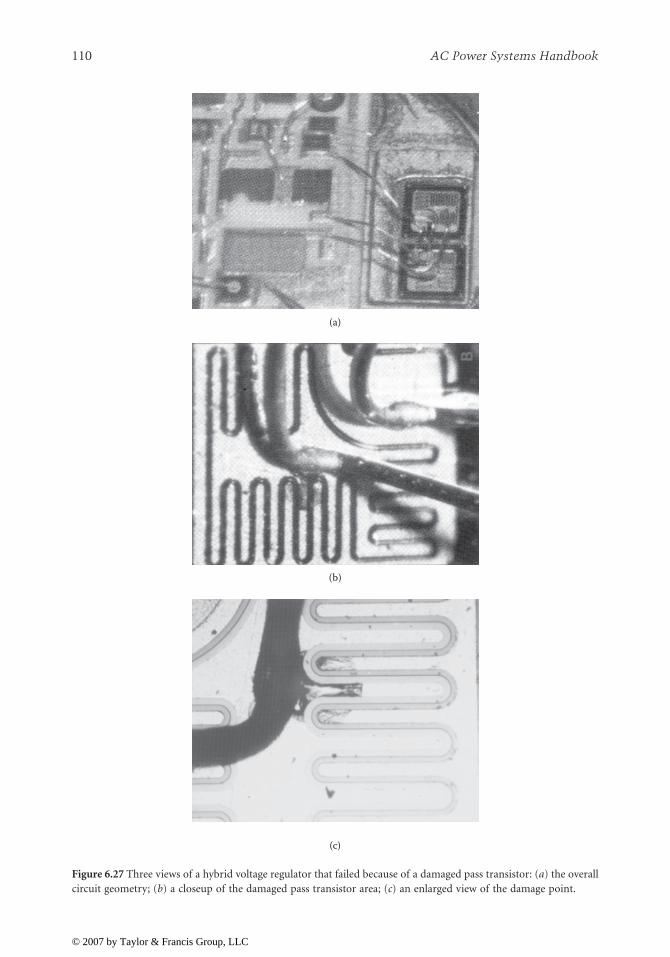
110 AC Power Systems Handbook
Figure 6.27 Three views of a hybrid voltage regulator that failed because of a damaged pass transistor: (a) the overallcircuit geometry; (b) a closeup of the damaged pass transistor area; (c) an enlarged view of the damage point.
(a)
(b)
(c)
© 2007 by Taylor & Francis Group, LLC

Semiconductors 111
The effects of high-voltage breakdown in a hybrid semiconductor chip are illustrated graphically inFigure 6.27a to c. Failure analysis indicated that the pass transistor in this voltage regulator device wasoverstressed because of excessive input/output voltage differential.
6.6.2 Chip Protection
With the push for faster and more complex ICs, it is unlikely that semiconductor manufacturers willreturn to thicker oxide layers or larger junctions. Overvoltage protection must come, instead, from cir-cuitry built into individual chips to shunt transient energy to ground.
Most MOS circuits incorporate protective networks. These circuits can be made quite efficient, butthere is a tradeoff between the amount of protection provided and device speed and packing density. Pro-tective elements, usually diodes, must be physically large if they are to clamp adequately. Such elementstake up a significant amount of chip space. The RC time constants of protective circuits also can placelimits on switching speeds.
Protective networks for NMOS devices typically use MOS transistors as shunting elements, ratherthan diodes. Although diodes are more effective, fewer diffusions are available in the NMOS process, sonot as many forward-biased diodes can be constructed. Off-chip protective measures, including electro-magnetic shielding, filters, and discrete diode clamping, are seldom used because they are bulky andexpensive.
Figure 6.28 shows the protective circuitry used in a 54HC high-speed complementary metal-oxidesilicon (CMOS) device. Polysilicon resistors are placed in series with each input pin, and relatively large-geometry diodes are added as clamps on the IC side of the resistors. Clamping diodes also are used at theoutput. The diodes restrict the magnitude of the voltages that can reach the internal circuitry. Protectivefeatures such as these have allowed CMOS devices to withstand ESD test voltages in excess of 2 kV.
6.7 Effects of Arcing
High voltages often are generated by breaking current to an inductor with a mechanical switch. They can,with time, cause pitting, corrosion, or material transfer of the switch contacts. In extreme cases, the con-tacts even can be welded together. The actual wear (or failure) of a mechanical switch is subject to manyfactors, including:
• Contact construction and the type of metal used• Amount of contact bounce that typically occurs with the switching mechanism• Atmosphere• Temperature• Steady-state and in-rush currents• Whether ac or dc voltages are being switched by the mechanism
Figure 6.28 CMOS transistor with built-in ESD protection circuitry. (After [1].)
+Vcc
Output200 Ω
Input
© 2007 by Taylor & Francis Group, LLC

112 AC Power Systems Handbook
Effective transient suppression can significantly reduce the amount of energy dissipated during theoperation of switch contacts. This reduction will result in a corresponding increase in switch life. Inapplications where relay contacts are acting as power-switching elements, the use of effective transient-suppression techniques will reduce the amount of maintenance (contact cleaning) required for thedevice.
6.7.1 Insulation Breakdown
The breakdown of a solid insulating material usually results in localized carbonization, which may be cat-astrophic, or may result in decreased dielectric strength at the arc-over point. The occurrence of addi-tional transients often will cause a breakthrough at the weakened point in the insulating material,eventually resulting in catastrophic failure of the insulation. Similar problems can occur within the wind-ings of a transformer or coil. Arcing between the windings of an inductor often is caused by self-inducedvoltages with steep wavefronts that are distributed unevenly across the turns of the coil. Repetitive arcingbetween windings can cause eventual failure of the device.
Printed wiring board (PWB) arcing can result in system failure modes in ways outlined for insulat-ing materials and coils. A breakdown induced by high voltage along the surface of a PWB can create aconductive path of carbonized insulation and vaporized metal from the printed wiring traces or compo-nent leads.
The greatest damage to equipment from insulation breakdown caused by transient disturbancesgenerally occurs after the spike has passed. The follow-on steady-state current that can flow through faultpaths created by a transient often cause the actual component damage and system failure.
6.8 References
1. Technical staff, Military/Aerospace Products Division, The Reliability Handbook, National Semi-conductor, Santa Clara, CA, 1987.
2. Technical staff, “Moore’s Law: Changing the PC Platform for Another 20 Years,” Intel CorporationWeb site, www.intel.com, 1998.
3. Ching, T. B., and W. H. Schroen, “Bond Pad Structure Reliability,” Proceedings of the IEEE ReliabilityPhysics Symposium, IEEE, New York, 1988.
6.9 Bibliography
Antinone, R. J., “How to Prevent Circuit Zapping,” IEEE Spectrum, IEEE, New York, April 1987.Benson, K. B., and J. C. Whitaker, Television and Audio Handbook for Engineers and Technicians, McGraw-
Hill, New York, 1989.Blackburn, D. L., “Turn-Off Failure of Power MOSFETs,” IEEE Transactions on Power Electronics, Vol. PE-
2, No. 2, IEEE, New York, April 1987.Boxleitner, W., “How to Defeat Electrostatic Discharge,” IEEE Spectrum, IEEE, New York, August 1989.Crook, D. L., “Evolution of VLSI Reliability Engineering,” Proceedings of the IEEE Reliability Physics
Symposium, IEEE, New York, 1990.Federal Information Processing Standards Publication No. 94, Guideline on Electrical Power for ADP
Installations, U.S. Department of Commerce, National Bureau of Standards, Washington, D.C.,1983.
Frank, D., “Please Keep Your EMC Out of My ESD,” Proceedings, IEEE Reliability and MaintainabilitySymposium, IEEE, New York, 1986.
Gloer, H. N., “Voltage Transients and the Semiconductor,” The Electronic Field Engineer, Vol. 2, 1979.Jordan, E. C. (Ed.), Reference Data for Engineers: Radio, Electronics, Computer, and Communications, 7th
ed., Howard W. Sams Company, Indianapolis, IN, 1985.
© 2007 by Taylor & Francis Group, LLC

Semiconductors 113
Kanarek, J., “Protecting against Static Electricity Damage,” Electronic Servicing & Technology, IntertecPublishing, Overland Park, KS, March 1986.
Koch, T., W. Richling, J. Witlock, and D. Hall, “A Bond Failure Mechanism,” Proceedings, IEEE ReliabilityPhysics Conference, IEEE, New York, April 1986.
Meeldijk, V., “Why Do Components Fail?” Electronic Servicing & Technology, Intertec Publishing, OverlandPark, KS, November 1986.
Motorola TMOS Power MOSFET Data Handbook, Motorola Semiconductor, Phoenix, AZ.Nenoff, L., “Effect of EMP Hardening on System R&M Parameters,” Proceedings, IEEE Reliability and
Maintainability Symposium, IEEE, New York, 1986.SCR Applications Handbook, International Rectifier Corporation, El Segundo, CA, 1977.SCR Manual, 5th ed., General Electric Company, Auburn, NY.Sydnor, A., “Voltage Breakdown in Transistors,” Electronic Servicing & Technology, Intertec Publishing,
Overland Park, KS, July 1986.Technical staff, Bipolar Power Transistor Reliability Report, Motorola Semiconductor, Phoenix, AZ, 1988.Technical staff, MOV Varistor Data and Applications Manual, General Electric Company, Auburn, NY.Voss, M.,“The Basics of Static Control,” Electronic Servicing & Technology, Intertec Publishing, Overland
Park, KS, July 1988.Whitaker, J., Electronic Systems Maintenance Handbook, 2nd ed., CRC Press, Boca Raton, FL, 2002.
© 2007 by Taylor & Francis Group, LLC

115
7
Rectifier and Filter
Circuits
7.1 Introduction
The circuit elements most vulnerable to failure in any given piece of electronic hardware are those exposedto the outside world. In most systems, the greatest threat generally involves the ac-to-dc power supply. Thepower supply is subject to high-energy surges from lightning and other sources. Because power-supplysystems often are exposed to extreme voltage and environmental stresses, derating of individual componentsis a key factor in improving supply reliability. The goal of derating is to reduce the electrical, mechanical,thermal, and other environmental stresses on a component to decrease the degradation rate and to prolonguseful life. Through derating, the margin of safety between the operating stress level and the maximumpermissible stress level for a given part is increased. This consideration provides added protection fromsystem overstress, unforeseen during design.
Experience has demonstrated that types of components tend to fail in predictable ways. Table 7.1 showsthe statistical distribution of failures for a transient-suppression (EMP) protection circuit. Although the datapresented applies only to a specific product, some basic conclusions can be drawn:
• The typical failure mode for a capacitor is a short circuit.• The typical failure mode for a zener diode is a short circuit.• The typical failure mode for a connector pin is an open circuit.• The typical failure mode for a solder joint is an open circuit.
These conclusions present no great surprises, but they point out the predictability of equipment failuremodes. The first step in solving a problem is knowing what is likely to fail and what the typical failure modesare.
Table 7.1
Statistical Distribution of Component Failures in an EMP Protection Circuit
(
After
[1].)
Component
Mode of Failure
Distribution
Capacitor (all types)
Open 0.01Short 0.99
Coil
Open 0.75Short 0.25
Diode (zener)
Open 0.01Short 0.99
GE-MOV
Open 0.01Short 0.99
Transzorb
Open 0.01Short 0.99
Connector pin
Open 0.99Short to ground 0.01
Solder joint Open 1.00Lug connection Open 1.00Surge protector
Open 0.99Short 0.01
© 2007 by Taylor & Francis Group, LLC

116
AC Power Systems Handbook
7.2 Power Rectifiers
Virtually all power supplies use silicon rectifiers as the primary ac-to-dc converting device. Rectifierparameters generally are expressed in terms of reverse-voltage ratings and mean-forward-current ratingsin a
∫
-wave rectifier circuit operating from a 60 Hz supply and feeding a purely resistive load. The threeprimary reverse-voltage ratings are:
•
Peak transient reverse voltage
(
V
rm
) — the maximum value of any nonrecurrent surge voltage. Thisvalue must never be exceeded.
•
Maximum repetitive reverse voltage
[
V
rm
(
rep
)
] — the maximum value of reverse voltage that can beapplied recurrently (in every cycle of 60 Hz power). This includes oscillatory voltages that mayappear on the sinusoidal supply.
•
Working peak reverse voltage
[
V
rm
(
wkg
)
] — the crest value of the sinusoidal voltage of the ac supplyat its maximum limit. Rectifier manufacturers generally recommend a value that has a significantsafety margin, relative to the peak transient reverse voltage (
V
rm
), to allow for transient overvoltageson the supply lines.
There are three forward-current ratings of similar importance in the application of silicon rectifiers:
•
Nonrecurrent surge current
[
I
fm
(
surge
)
] — the maximum device transient current that must not beexceeded at any time.
I
fm
(
surge
)
is sometimes given as a single value, but often is presented in theform of a graph of permissible surge-current values vs. time. Because silicon diodes have a relativelysmall thermal mass, the potential for short-term current overloads must be given careful consid-eration.
•
Repetitive peak forward current
[
I
fm
(
rep
)
] — the maximum value of forward current reached in eachcycle of the 60 Hz waveform. This value does not include random peaks caused by transientdisturbances.
•
Average forward current
[
I
fm
(
av
)
] — the upper limit for average load current through the device.This limit is always well below the repetitive peak forward-current rating to ensure an adequatemargin of safety.
Rectifier manufacturers generally supply curves of the instantaneous forward voltage vs. instanta-neous forward current at one or more specific operating temperatures. These curves establish the for-ward-mode upper operating parameters of the device.
Figure 7.1 shows a typical rectifier application in a bridge rectifier circuit.
7.2.1 Operating Rectifiers in Series
High-voltage power supplies (5 kV and greater) often require rectifier voltage ratings well beyond thosetypically available from the semiconductor industry. To meet the requirements of the application, manu-facturers commonly use silicon diodes in a series configuration to yield the required working peak reversevoltage. For such a configuration to work properly, the voltage across any one diode must not exceed the
Figure 7.1
Conventional capacitor input filter full-wave bridge.
AC
inpu
t12
0 V
AC DC output
2 k to 50 kmFd typical
2 k to 50 kmFd typical
+Vcc
−Vcc
© 2007 by Taylor & Francis Group, LLC
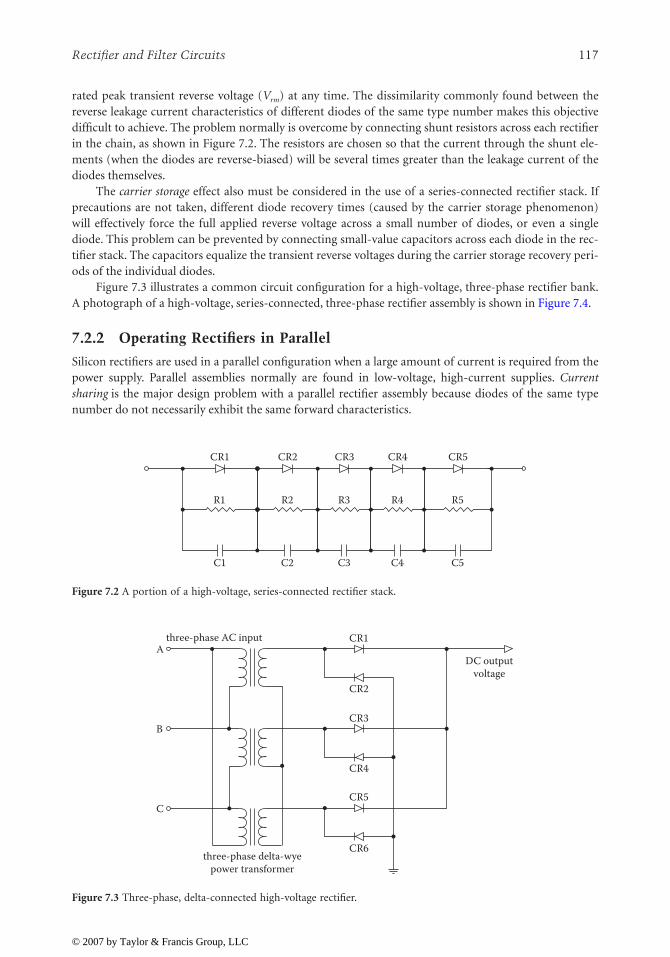
Rectifier and Filter Circuits
117
rated peak transient reverse voltage (
V
rm
) at any time. The dissimilarity commonly found between thereverse leakage current characteristics of different diodes of the same type number makes this objectivedifficult to achieve. The problem normally is overcome by connecting shunt resistors across each rectifierin the chain, as shown in Figure 7.2. The resistors are chosen so that the current through the shunt ele-ments (when the diodes are reverse-biased) will be several times greater than the leakage current of thediodes themselves.
The
carrier storage
effect also must be considered in the use of a series-connected rectifier stack. Ifprecautions are not taken, different diode recovery times (caused by the carrier storage phenomenon)will effectively force the full applied reverse voltage across a small number of diodes, or even a singlediode. This problem can be prevented by connecting small-value capacitors across each diode in the rec-tifier stack. The capacitors equalize the transient reverse voltages during the carrier storage recovery peri-ods of the individual diodes.
Figure 7.3 illustrates a common circuit configuration for a high-voltage, three-phase rectifier bank.A photograph of a high-voltage, series-connected, three-phase rectifier assembly is shown in Figure 7.4.
7.2.2 Operating Rectifiers in Parallel
Silicon rectifiers are used in a parallel configuration when a large amount of current is required from thepower supply. Parallel assemblies normally are found in low-voltage, high-current supplies.
Currentsharing
is the major design problem with a parallel rectifier assembly because diodes of the same typenumber do not necessarily exhibit the same forward characteristics.
Figure 7.2
A portion of a high-voltage, series-connected rectifier stack.
Figure 7.3
Three-phase, delta-connected high-voltage rectifier.
C1
R1
CR1
C2
R2
CR2
C3
R3
CR3
C4
R4
CR4
C5
R5
CR5
three-phase AC input
three-phase delta-wyepower transformer
CR6
CR5
CR4
CR3
CR2
CR1
DC outputvoltage
A
B
C
© 2007 by Taylor & Francis Group, LLC
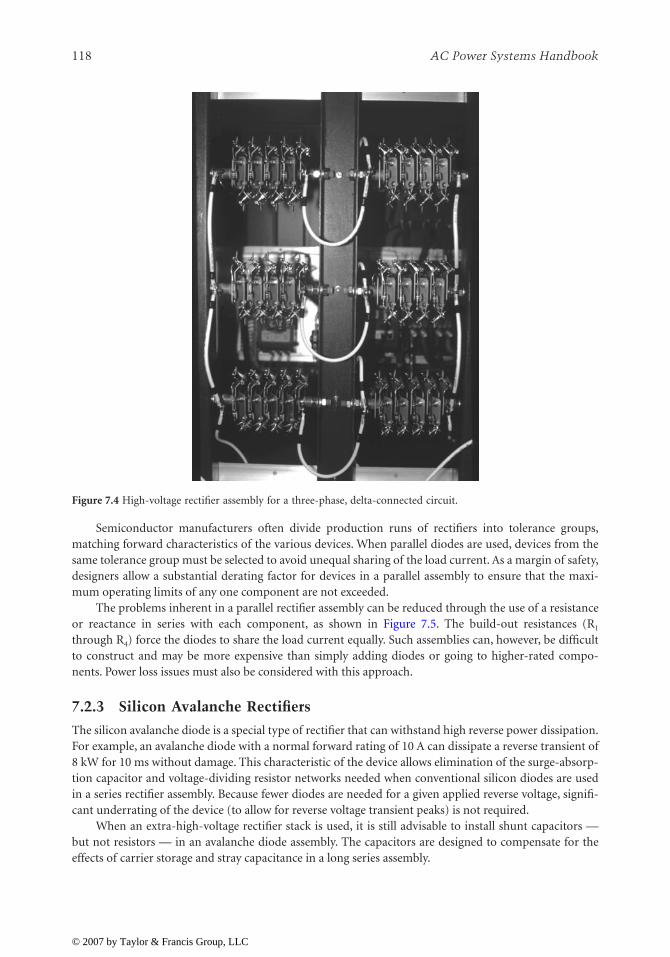
118
AC Power Systems Handbook
Semiconductor manufacturers often divide production runs of rectifiers into tolerance groups,matching forward characteristics of the various devices. When parallel diodes are used, devices from thesame tolerance group must be selected to avoid unequal sharing of the load current. As a margin of safety,designers allow a substantial derating factor for devices in a parallel assembly to ensure that the maxi-mum operating limits of any one component are not exceeded.
The problems inherent in a parallel rectifier assembly can be reduced through the use of a resistanceor reactance in series with each component, as shown in Figure 7.5. The build-out resistances (R
1
through R
4
) force the diodes to share the load current equally. Such assemblies can, however, be difficultto construct and may be more expensive than simply adding diodes or going to higher-rated compo-nents. Power loss issues must also be considered with this approach.
7.2.3 Silicon Avalanche Rectifiers
The silicon avalanche diode is a special type of rectifier that can withstand high reverse power dissipation.For example, an avalanche diode with a normal forward rating of 10 A can dissipate a reverse transient of8 kW for 10 ms without damage. This characteristic of the device allows elimination of the surge-absorp-tion capacitor and voltage-dividing resistor networks needed when conventional silicon diodes are usedin a series rectifier assembly. Because fewer diodes are needed for a given applied reverse voltage, signifi-cant underrating of the device (to allow for reverse voltage transient peaks) is not required.
When an extra-high-voltage rectifier stack is used, it is still advisable to install shunt capacitors —but not resistors — in an avalanche diode assembly. The capacitors are designed to compensate for theeffects of carrier storage and stray capacitance in a long series assembly.
Figure 7.4
High-voltage rectifier assembly for a three-phase, delta-connected circuit.
© 2007 by Taylor & Francis Group, LLC
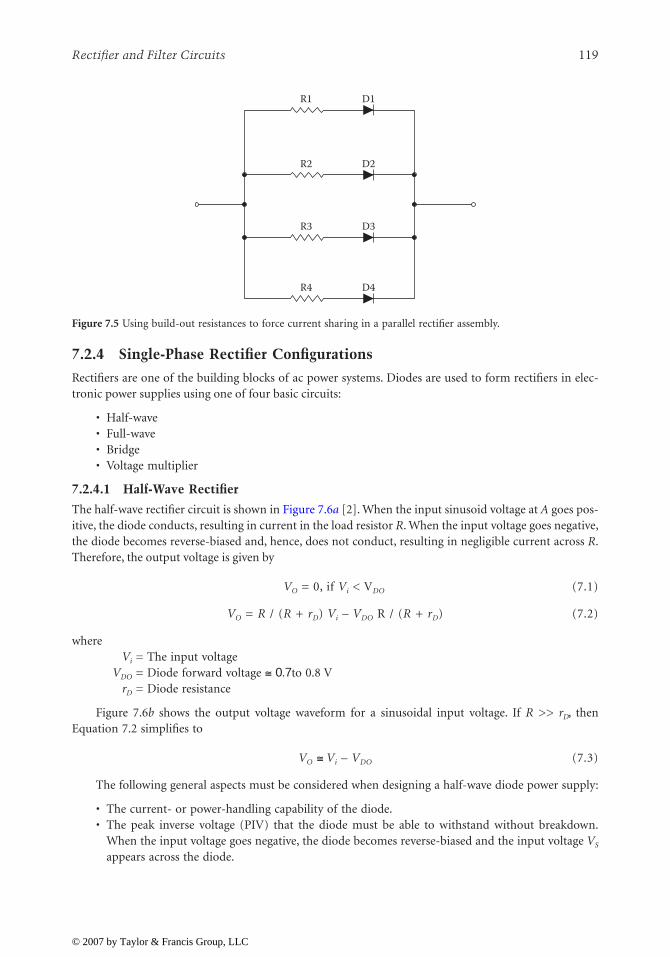
Rectifier and Filter Circuits
119
7.2.4 Single-Phase Rectifier Configurations
Rectifiers are one of the building blocks of ac power systems. Diodes are used to form rectifiers in elec-tronic power supplies using one of four basic circuits:
• Half-wave• Full-wave• Bridge• Voltage multiplier
7.2.4.1 Half-Wave Rectifier
The half-wave rectifier circuit is shown in Figure 7.6
a
[2]. When the input sinusoid voltage at
A
goes pos-itive, the diode conducts, resulting in current in the load resistor
R
. When the input voltage goes negative,the diode becomes reverse-biased and, hence, does not conduct, resulting in negligible current across
R
.Therefore, the output voltage is given by
V
O
= 0, if
V
i
< V
DO
(7.1)
V
O
=
R
/ (
R
+
r
D
)
V
i
–
V
DO
R / (
R
+
r
D
) (7.2)
where
V
i
= The input voltage
V
DO
= Diode forward voltage
≅ 0.7
to 0.8 V
r
D
= Diode resistance
Figure 7.6
b
shows the output voltage waveform for a sinusoidal input voltage. If
R
>>
r
D
, thenEquation 7.2 simplifies to
V
O
≅
V
i
–
V
DO
(7.3)
The following general aspects must be considered when designing a half-wave diode power supply:
• The current- or power-handling capability of the diode.• The peak inverse voltage (PIV) that the diode must be able to withstand without breakdown.
When the input voltage goes negative, the diode becomes reverse-biased and the input voltage
V
S
appears across the diode.
Figure 7.5
Using build-out resistances to force current sharing in a parallel rectifier assembly.
R1 D1
R2 D2
R3 D3
R4 D4
© 2007 by Taylor & Francis Group, LLC

120
AC Power Systems Handbook
7.2.4.2 Full-Wave Rectifier
The full-wave rectifier utilizes both halves of the input sinusoid [2]. One common implementation isshown in Figure 7.7
a
. The full-wave rectifier consists of two half-wave rectifiers connected to a load
R
.The secondary transformer winding is center tapped to provide two equal voltages
V
i
for each half-waverectifier. When the node
A
is at positive polarity,
V
i
with respect to node
B
,
D
1
will be forward-biased and
D
2
will be reverse-biased. Therefore, diode
D
1
will conduct and the current will flow through
R
back tothe center tap of the transformer. When the node
B
is at positive polarity
V
i
with respect to node
A
,
D
2
will be forward-biased and diode
D
1
will be reverse-biased. The current conducted by
D
2
will flowthrough
R
and back to center tap. The current through
R
is always in the same direction, giving rise tounipolar voltage
V
O
across
R
. The input and output voltage waveforms of the full-wave rectifier areshown in Figure 7.7
b
.The output voltage of the full-wave rectifier is given by
(7.4)
where
R
t
= resistance associated with the transformer. The dc value of the output voltage
V
dc
is
(7.5)
(7.6)
where
V
m
= the peak output voltage.
Figure 7.6
Half-wave rectifier circuit: (
a
) schematic diagram, (
b
) input and output waveforms. (From [2]. Used withpermission.)
AC
line
volta
ge A
B
(a)
(b)
Time, t
Volta
ge
V
Vi
Vi
VO
VO VDO
R D
+
_
+
_
+
_
VR
R r RV V
t DS D0 0=
+ +
⎡
⎣⎢
⎤
⎦⎥ −( )
VR
R r R
Vdc
t D
m≅+ +
⎡
⎣⎢
⎤
⎦⎥2π
VV
R r rdcm
D i= >> + +2
πif R
© 2007 by Taylor & Francis Group, LLC
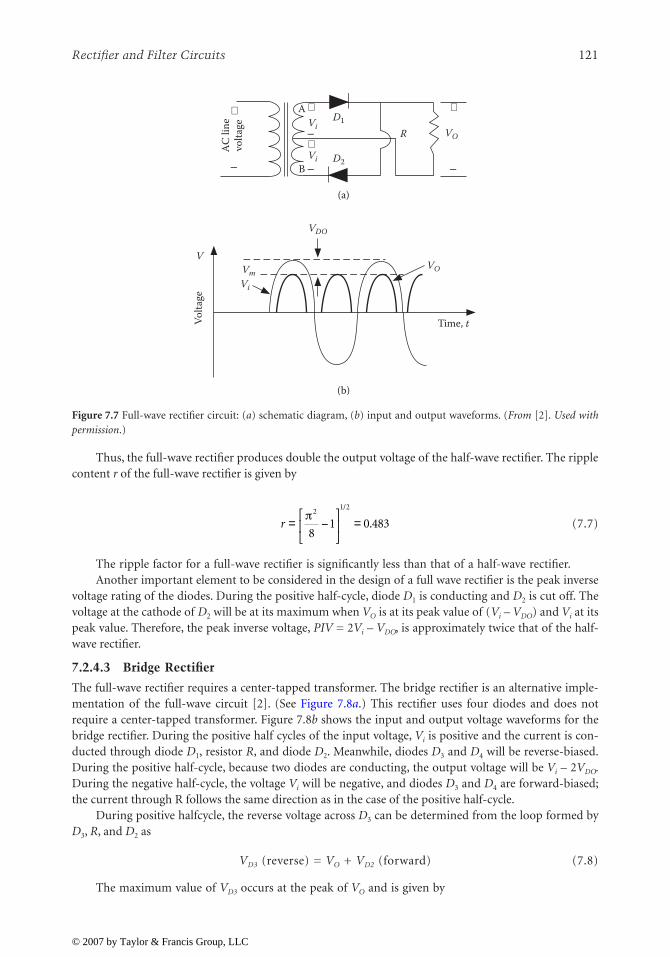
Rectifier and Filter Circuits 121
Thus, the full-wave rectifier produces double the output voltage of the half-wave rectifier. The ripplecontent r of the full-wave rectifier is given by
(7.7)
The ripple factor for a full-wave rectifier is significantly less than that of a half-wave rectifier.Another important element to be considered in the design of a full wave rectifier is the peak inverse
voltage rating of the diodes. During the positive half-cycle, diode D1 is conducting and D2 is cut off. Thevoltage at the cathode of D2 will be at its maximum when VO is at its peak value of (Vi – VDO) and Vi at itspeak value. Therefore, the peak inverse voltage, PIV = 2Vi – VDO, is approximately twice that of the half-wave rectifier.
7.2.4.3 Bridge Rectifier
The full-wave rectifier requires a center-tapped transformer. The bridge rectifier is an alternative imple-mentation of the full-wave circuit [2]. (See Figure 7.8a.) This rectifier uses four diodes and does notrequire a center-tapped transformer. Figure 7.8b shows the input and output voltage waveforms for thebridge rectifier. During the positive half cycles of the input voltage, Vi is positive and the current is con-ducted through diode D1, resistor R, and diode D2. Meanwhile, diodes D3 and D4 will be reverse-biased.During the positive half-cycle, because two diodes are conducting, the output voltage will be Vi – 2VDO.During the negative half-cycle, the voltage Vi will be negative, and diodes D3 and D4 are forward-biased;the current through R follows the same direction as in the case of the positive half-cycle.
During positive halfcycle, the reverse voltage across D3 can be determined from the loop formed byD3, R, and D2 as
VD3 (reverse) = VO + VD2 (forward) (7.8)
The maximum value of VD3 occurs at the peak of VO and is given by
Figure 7.7 Full-wave rectifier circuit: (a) schematic diagram, (b) input and output waveforms. (From [2]. Used withpermission.)
AC
line
volta
ge
A
B
(a)
(b)
Time, t Volta
ge
V
Vi
Vi VO
VO
VDO
Vm Vi
R D1
D2
+
_
+
+
_
_
+
_
r = −⎡
⎣⎢
⎤
⎦⎥ =
π21 2
81 0 483
/
.
© 2007 by Taylor & Francis Group, LLC

122 AC Power Systems Handbook
PIV = Vi – 2VDO + VDO (7.9)
PIV = Vi – VDO (7.10)
The PIV is about half the value for the full-wave rectifier with a center-tapped transformer, whichis an advantage of the bridge rectifier.
7.2.4.4 Voltage Multiplier
The dc output voltage (Vdc) in a rectifier circuit is limited by the peak value of the ac voltage applied (VI)[2]. Figure 7.9a shows the voltage doubler circuit composed of a clamp formed by C1 and D1 and a peakrectifier formed by D2 and C2. When excited by a sinusoid of amplitude Vp, the output of the clampingsection reaches the negative peak value of –2Vp, as shown in Figure 7.9b. By connecting additional diode-capacitor circuits, it is possible to generate rectifier circuits that triple and quadruple the input voltage.
7.2.5 Polyphase Rectifier Circuits
High-voltage power supplies typically used in vacuum tube circuits incorporate multiphase rectificationof the ac line voltage. Common configurations include 3-, 6-, and 12-phase. Three-phase rectification isthe most common. Figure 7.10 illustrates four approaches to three-phase rectification:
• Three-phase half-wave wye, Figure 7.10a. Three half-wave rectifiers are used in each leg of thesecondary Y, forming one phase. In such an arrangement, each diode carries current one third ofeach cycle, and the output wave pulses at three times the frequency of the ac supply. In order toavoid direct-current saturation in the transformer, it is necessary to employ a three-phase trans-former rather than three single-phase transformers.
Figure 7.8 Bridge rectifier circuit: (a) schematic diagram, (b) input and output waveforms. (From [2]. Used withpermission.)
AC
line
volta
ge
(a)
(b)
Time, t Volta
ge
V
Vi
VO
VO
Vi
2VDO
R D4
D2D3
D1+
_
+
+
_
_
© 2007 by Taylor & Francis Group, LLC
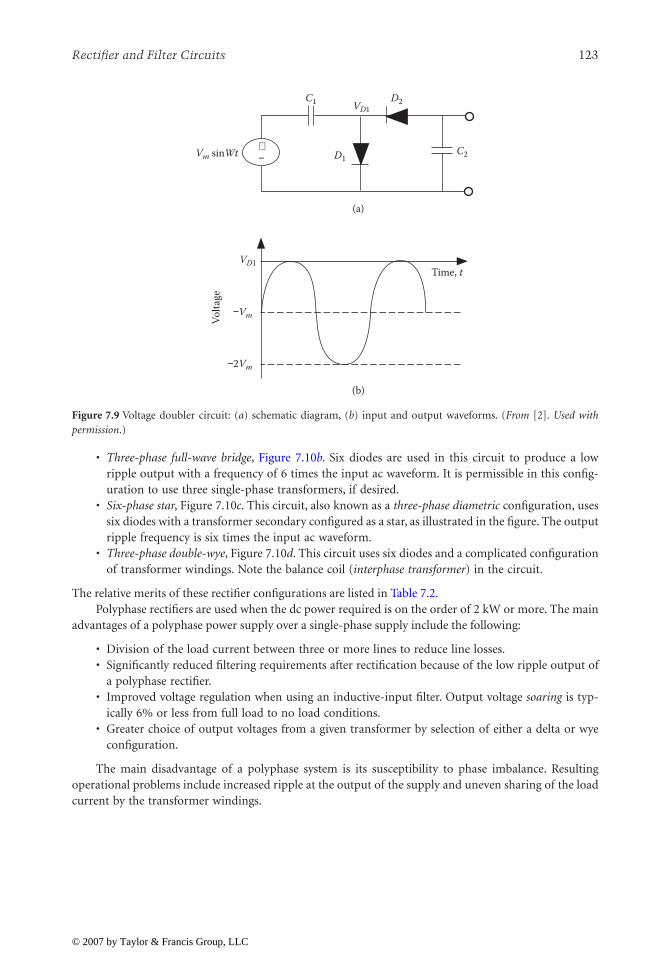
Rectifier and Filter Circuits 123
• Three-phase full-wave bridge, Figure 7.10b. Six diodes are used in this circuit to produce a lowripple output with a frequency of 6 times the input ac waveform. It is permissible in this config-uration to use three single-phase transformers, if desired.
• Six-phase star, Figure 7.10c. This circuit, also known as a three-phase diametric configuration, usessix diodes with a transformer secondary configured as a star, as illustrated in the figure. The outputripple frequency is six times the input ac waveform.
• Three-phase double-wye, Figure 7.10d. This circuit uses six diodes and a complicated configurationof transformer windings. Note the balance coil (interphase transformer) in the circuit.
The relative merits of these rectifier configurations are listed in Table 7.2.Polyphase rectifiers are used when the dc power required is on the order of 2 kW or more. The main
advantages of a polyphase power supply over a single-phase supply include the following:
• Division of the load current between three or more lines to reduce line losses.• Significantly reduced filtering requirements after rectification because of the low ripple output of
a polyphase rectifier.• Improved voltage regulation when using an inductive-input filter. Output voltage soaring is typ-
ically 6% or less from full load to no load conditions.• Greater choice of output voltages from a given transformer by selection of either a delta or wye
configuration.
The main disadvantage of a polyphase system is its susceptibility to phase imbalance. Resultingoperational problems include increased ripple at the output of the supply and uneven sharing of the loadcurrent by the transformer windings.
Figure 7.9 Voltage doubler circuit: (a) schematic diagram, (b) input and output waveforms. (From [2]. Used withpermission.)
Vm sinWt
C1
C2
D2
D1
VD1 Time, t
(a)
(b)
Volta
ge
−Vm
−2Vm
VD1
+ −
© 2007 by Taylor & Francis Group, LLC

124 AC Power Systems Handbook
Figure 7.10 Basic three-phase rectifier circuits: (a) half-wave wye, (b) full-wave bridge, (c) six-phase star, (d) three-phase double-wye.
(a)
Load
+
−
Primary winding
Secondarywinding
Am
plitu
de
Time
Output waveform
One cycle
One cycle
Primary winding
Am
plitu
de
−
Time
(d)
Secondarywinding
Output waveform
Load
+
Secondarywinding
Balance coil
Primary winding
(b)
Secondarywinding
−
Load
+
One cycle
Am
plitu
de
Output waveform
Time(c)
Primary winding
Secondarywinding
One cycle
−
Am
plitu
deOutput waveform
Load
+
Time
© 2007 by Taylor & Francis Group, LLC

Rectifier and Filter Circuits 125
7.3 Power Supply Filter Circuits
A filter network for a high-voltage power supply typically consists of a series inductance and one or moreshunt capacitances [3]. Bleeder resistors are also usually incorporated. Filter systems can be divided intotwo basic types:
• Inductive input, filter circuits that present a series inductance to the rectifier output.• Capacitive input, filter circuits that present a shunt capacitance to the rectifier output.
7.3.1 Inductive Input Filter
An inductive input filter is shown in Figure 7.11, along with typical current waveforms [3]. When theinput inductance is infinite, current through the inductance is constant and is carried at any moment bythe rectifier anode that has the most positive voltage applied to it at that instant. As the alternating volt-age being rectified passes through zero, the current suddenly transfers from one anode to another, pro-ducing square current waves through the individual rectifier devices.
When the input inductance is finite (but not too small), the situation changes to that shown by thesolid lines of Figure 7.11. The current through the input inductance tends to increase when the outputvoltage of the rectifier exceeds the average or dc current value, and to decrease when the rectifier outputvoltage is less than the dc value. This causes the current through the individual anodes to be modified asshown. If the input inductance is too small, the current decreases to zero during a portion of the timebetween the peaks of the rectifier output voltage, and the conditions then correspond to a capacitor inputfilter system.
The output wave of the rectifier can be considered as consisting of a dc component upon which aresuperimposed ac voltages (ripple voltages). To a first approximation, the fluctuation in output currentresulting from a finite input inductance can be considered as the current resulting from the lowest fre-quency component of the ripple voltage acting against the impedance of the input inductance. Thisassumption is permissible because the higher frequency components in the ripple voltage are smaller andat the same time encounter higher impedance. Furthermore, in practical filters, the shunting capacitor
Table 7.2 Operating Parameters of Three-Phase Rectifier Configurations
ParameterThree-Phase
StarThree-Phase
BridgeSix-Phase
StarThree-Phase Double-Wye Multiplier1
Rectifier elements 3 6 6 6rms dc output 1.02 1.00 1.00 1.00 Average dc outputPeak dc output 1.21 1.05 1.05 1.05 Average dc outputPeak reverse volts per rectifier
output 2.09 1.05 2.09 2.42 Average dc output2.45 2.45 2.83 2.83 rms secondary volts per
transformer leg1.41 1.41 1.41 1.41 rms secondary volts line-to-line
Average dc output current per rectifier
0.333 0.333 0.167 0.167 Average dc output current
rms current per rectifier, resistive load
0.587 0.579 0.409 0.293 Average dc output current
rms current per rectifier, inductive load
0.578 0.578 0.408 0.289 Average dc output current
Percent ripple 18.3 4.2 4.2 4.2 —Ripple frequency 3 6 6 6 Line frequencyac line power factor 0.826 0.955 0.955 0.955 —Transformer secondary rms volts
per leg2
0.855 0.428 0.740 0.855 Average dc voltage output
Transformer secondary rms volts line-to-line
1.48 0.740 1.48 (max) 1.71 (max) Average dc voltage outputno load
Secondary line current 0.578 0.816 0.408 0.299 Average dc output currentTransformer secondary VA 1.48 1.05 1.81 1.48 dc watts outputPrimary line current 0.817 1.41 0.817 0.707 (Avg. load I × secondary leg V) ÷
primary line V1 To determine the value of a parameter in any column, multiply the factor shown by the value given in this column.2 For inductive load or large choke input filter.
© 2007 by Taylor & Francis Group, LLC

126 AC Power Systems Handbook
Figure 7.11 Voltage and current waveshapes for an inductive input filter driven by a three-phase supply.
Load
+
−
Primary winding
Secondary winding
Am
plitu
de
Time
Output waveform One cycle
L1
C1
Output ripple
Am
plitu
de
Time
Voltage applied to filter input
Voltage applied to load (substantially constant)
D1
D2
D3
Current in inductance
Am
plitu
de
Time
Finite inductance
Infinite inductance
Current in D1
Am
plitu
de
Infinite inductance
Finite inductance
Time
Am
plitu
de
Current in D2
Time
Current in D3
Am
plitu
de
Time
© 2007 by Taylor & Francis Group, LLC

Rectifier and Filter Circuits 127
following the input inductance has a small impedance at the ripple frequency compared with the reac-tance of the input inductance. The peak current resulting from a finite input inductance is, therefore,given approximately by the relation:
(7.11)
whereIf = Peak current with finite input inductanceIi = Peak current with infinite input inductance
E1/E0 = Ratio of lowest frequency ripple component to the dc voltage in the rectifier outputReff = Effective load resistanceω L1 = Reactance of the incremental value of the input inductance at the lowest ripple frequency
This equation is derived as follows:
• The peak alternating current through the input inductance is approximately E1/ω L1.• The average or dc current is E0/Reff.• The peak current with finite inductance is, therefore, (E1/ω L1) + (E0/Reff). • The current with infinite inductance is E0/Reff.• The effective load resistance value consists of the actual load resistance plus filter resistance plus
equivalent diode and transformer resistances.
The normal operation of an inductive input filter requires that there be a continuous flow of currentthrough the input inductance. The peak alternating current flowing through the input inductance must,therefore, be less than the dc output current of the rectifier. This condition is realized by satisfying theapproximate relation
(7.12)
In the practical case of a 60 Hz single-phase, full-wave rectifier circuit, the foregoing equationbecomes
(7.13)
In a polyphase system, the required value of L1 is significantly less. The higher the load resistance(the lower the dc load current), the more difficult it is to maintain a continuous flow of current, andwith a given L1, the previous equation will not be satisfied when the load resistance exceeds a critical value.
The minimum allowable input inductance (ω L1) is termed the critical inductance. When the induc-tance is less than the critical value, the filter acts as a capacitor input circuit. When the dc drawn from therectifiers varies, it is still necessary to satisfy the ω L1 equation at all times, particularly if good voltage reg-ulation is to be maintained. To accomplish this requirement at small load currents without excessiveinductance, it is necessary to place a bleeder resistance across the output of the filter system in order tolimit Reff to a value corresponding to a reasonable value of L1.
7.3.2 Capacitive Input Filter
When a shunt capacitance rather than a series inductance is presented to the output of a rectifier, thebehavior of the circuit is greatly modified [3]. Each time the positive crest alternating voltage of the trans-former is applied to one of the rectifier anodes, the input capacitor charges up to just slightly less than
I
I
E R
E Lf
i
eff= +11
0 1ω
ωL RE
Eeff1
1
0
=
LLeff
11130
=
© 2007 by Taylor & Francis Group, LLC

128 AC Power Systems Handbook
this peak voltage. The rectifier then ceases to deliver current to the filter until another anode approachesits peak positive potential, when the capacitor is charged again. During the interval when the voltageacross the input capacitor is greater than the potential of any of the anodes, the voltage across the inputcapacitor drops off nearly linearly with time, because the first filter inductance draws a substantially con-stant current from the input capacitor. A typical set of voltage and current waves is illustrated in Figure7.12.
The addition of a shunt capacitor to the input of a filter thus produces fundamental changes inbehavior, including:
• The output voltage is appreciably higher than with an inductance input.• The ripple voltage is lower with a capacitive input filter than an inductive input filter.• The dc voltage across the filter input drops as the load current increases for the capacitive-input
case, instead of being substantially constant, as for the inductive input case.• The ratio of peak-to-average anode current at the rectifiers is higher in the capacitive case.• The utilization factor of the transformer is lower with a capacitive input configuration.
Figure 7.12 Characteristics of a capacitive input filter circuit: (a) schematic diagram, (b) voltage waveshape acrossinput capacitor, (c) waveshape of current flowing through diode.
AC
inpu
t
D1
D2 C1 C2
L1
Load
(a)
(b)
Am
plitu
de
Time
Average voltage
Rectifier output
Am
plitu
de
(c) Time
© 2007 by Taylor & Francis Group, LLC

Rectifier and Filter Circuits 129
Filters incorporating shunt capacitor inputs are generally employed when the amount of dc powerrequired is small. Inductance input filters are used when the amount of power involved is large; thehigher utilization factor and lower peak current result in important savings in rectifier and transformercosts under these conditions. Inductance input systems are almost universally employed in polyphaserectifier applications.
7.4 References
1. Nenoff, L., “Effect of EMP Hardening on System R&M Parameters,” Proceedings, 1986 Reliabilityand Maintainability Symposium, IEEE, New York, 1986.
2. Kalkur, T. S., “Rectifier and Filter Circuits,” in The Electronics Handbook, J. C. Whitaker, (Ed.), CRCPress, Boca Raton, FL, pp. 938–943, 1996.
3. Terman, F. E., Radio Engineering, McGraw-Hill, New York, 1947.
7.5 Bibliography
Fink, D., and D. Christiansen (Eds.), Electronics Engineers’ Handbook, 3rd ed., McGraw-Hill, New York,1989.
Jordan, Edward C. (Ed.), Reference Data for Engineers: Radio, Electronics, Computer, and Communications,7th ed., Howard W. Sams Company, Indianapolis, 1985.
© 2007 by Taylor & Francis Group, LLC

131
8
Power Electronics
8.1 Introduction
The modern age of power electronics began with the introduction of thyristors in the late 1950s [1]. Thereare now a number of power devices available for high-power and high-frequency applications. The mostnotable include:
•
Gate turn-off
(GTO) thyristor• Power Darlington transistor• Power MOSFET•
Insulated-gate bipolar transistor
(IGBP)
These power devices are used primarily as switches to convert energy from one form to another. Theyare used in motor control systems, uninterruptible power supplies, high-voltage dc transmission, ac-to-dcpower supplies, induction heating, and other power-conversion applications.
8.2 Thyristor Devices
The thyristor, also called a
silicon-controlled rectifier
(SCR), is basically a four-layer three-junction pnpndevice [1]. It has three terminals: anode, cathode, and gate. The device is turned on by applying a short pulseacross the gate and cathode. After the device turns on, the gate loses its control to turn off the device. Theturn-off is achieved, instead, by applying a reverse voltage across the anode and cathode. The thyristor voltampere characteristics are shown in Figure 8.1.
There are basically two classifications of thyristors:
converter grade
and
inverter grade
. The differencebetween a converter-grade and an inverter-grade thyristor is the low turn-off time (on the order of a fewmicroseconds) for the latter. Converter-grade thyristors are slower and are used in
natural commutation
(orphase-controlled) applications. Inverter-grade thyristors are used in
forced commutation
applications such asdc-dc choppers and dc-ac inverters. Inverter-grade thyristors are turned off by forcing the current to zerousing an external commutation circuit. This requires additional commutating components, thus resulting inadditional losses in the inverter.
Thyristors are rugged devices in terms of transient currents (
di/dt
and dv/dt capability). The forwardvoltage drop in a thyristor typically is about 1.5 to 2 V; even at high currents on the order of 500 A, it seldomexceeds 3 V. Although the forward voltage determines the on-state power loss of the device at any given cur-rent, the switching power loss becomes a dominating factor affecting the device junction temperature athigh operating frequencies. Thus, the maximum switching frequencies possible using thyristors are limitedin comparison with many other power devices. Thyristors are commonly available at ratings of up to 6000 V,3500 A.
A
triac
is functionally a pair of converter-grade thyristors connected in an antiparallel arrangement.The triac volt-ampere characteristics are shown in Figure 8.2. Because of the physical integration of thedevice, the triac has poor reapplied dv/dt capability, poor gate current sensitivity at turn-on, and a longerturn-off time, relative to a pair of equivalent-rating thyristors. Triacs are mainly used in phase control appli-cations such as ac regulators for lighting and fan control, and in solid-state ac relays.
© 2007 by Taylor & Francis Group, LLC

132
AC Power Systems Handbook
8.2.1 Thyristor Servo Systems
Thyristor control of ac power has become a popularmethod of switching and regulating high-voltage orhigh-current power supplies. The type of servo sys-tem employed depends on the application. Figure8.3 shows a basic single-phase ac control circuitusing discrete thyristors. The rms load current(
I
rms
) at any specific phase delay angle (
θ
) is given interms of the normal full-load rms current at aphase delay of zero (
I
rms-0
):
(8.1)
The load rms voltage at any particular phase-delay angle bears the same relationship to the full-load rms voltage at zero phase delay as the previousequation illustrates for load current. An analysis ofthe mathematics shows that although the theoretical delay range for complete control of a resistive loadis 0 to 180°, a practical span of 20 to 160° gives a power-control range of approximately 99% to 1% ofmaximum output to the load. Figure 8.4 illustrates typical phase-control waveforms.
The circuit shown in Figure 8.3 requires a source of gate trigger pulses that must be isolated fromeach other by at least the peak value of the applied ac voltage. The two gate pulse trains must also bephased 180
°
with respect to each other. Furthermore, the gate pulse trains must shift together withrespect to the ac supply voltage phase when power throughput is adjusted.
Some power-control systems use two identical, but isolated, gate pulse trains operating at a fre-quency of twice the applied supply voltage (120 Hz for a 60 Hz system). Under such an arrangement,the forward-biased thyristor will fire when the gate pulses are applied to the SCR pair. The reverse-biased thyristor will not fire. Normally, it is considered unsafe to drive a thyristor gate positive while its
Figure 8.1
Voltampere characteristics of a thyristor. (
After
[1]
and
[2].)
Forwardconduction
Forwardbreakover
voltage
Forwardleakage
Reverseleakage
Avalanchebreakdown
Holdingcurrent
+IA
–IA
–VA +VA
IG3 > IG2 > IG1
IG3 IG2 IG1 IG = 0
I + mode
III – mode
+I
IG
–V+V
–IG
–IFigure 8.2 Voltampere characteristics of a triac. (After[1] and [2].)
I Irms rms= − − + ( )⎡
⎣⎢
⎤
⎦⎥
−0 1 2 2
1
2
1απ
π πsin
© 2007 by Taylor & Francis Group, LLC

Power Electronics
133
anode-cathode is reverse-biased. In this case, however, it may be permissible because the thyristor thatis fired immediately conducts and removes the reverse voltage from the other device. The gate of thereverse-biased device is then being triggered on a thyristor that essentially has no applied voltage.
8.2.1.1 Inductive Loads
The waveforms shown in Figure 8.5 illustrate effects of phase control on an inductive load. When induc-tive loads are driven at a reduced conduction angle, a sharp transient change of load voltage occurs at theend of each current pulse (or loop). The transients generally have no effect on the load, but they can bedangerous to proper operation of the thyristors. When the conducting thyristor turns off, thereby discon-necting the load from the ac line supply, the voltage at the load rapidly drops to zero. This rapid voltagechange, in effect, applies a sharply rising positive anode voltage to the thyristor opposing the device thathas been conducting. If the thyristor dv/dt rating is exceeded, the opposing device will turn on and con-duction will take place, independent of any gate drive pulse.
A common protective approach involves the addition of a resistor-capacitor (
RC
) snubber circuit tocontrol the rate of voltage change seen across the terminals of the thyristor pair. (See Figure 8.6.) When-ever a thyristor pair is used to drive an inductive load, such as a power transformer, it is critically impor-tant that each device fires at a point in the applied waveform exactly 180
°
relative to the other. If propertiming is not achieved, the positive and negative current loops will differ in magnitude, causing a dc cur-rent to flow through the primary side of the transformer. A common trigger control circuit should, there-fore, be used to determine gate timing for thyristor pairs.
Figure 8.3
Inverse-parallel thyristor ac power control: (
a
) circuit diagram; (
b
) voltage and current waveforms for fulland reduced thyristor control angles. The waveforms apply for a purely resistive load.
1 cycle
(a)
(b)
α = 0°
α
0
0
© 2007 by Taylor & Francis Group, LLC

134
AC Power Systems Handbook
8.2.1.2 Applications
Several approaches are possible for thyristor power control in a three-phase ac system. The circuit shownin Figure 8.7 consists of essentially three independent, but interlocked, single-phase thyristor controllers.This circuit is probably the most common configuration found in industrial equipment.
In a typical application, the thyristor pairs feed a power transformer with multitap primary wind-ings, thereby giving the user an adjustment range to compensate for variations in utility company linevoltages from one location to another. A common procedure specifies selection of transformer tap posi-tions that yield a power output of 105% when nominal utility company line voltages are present. The thy-ristor power-control system then is used to reduce the angle of conduction of the SCR pairs as necessaryto cause a reduction in line voltage to the power transformer to yield 100% rated power output from thepower supply. A servo loop from a sample point at the load can be used to automatically compensate forline-voltage variations. With such an arrangement, the thyristors are kept within a reasonable degree ofretarded-phase operation. Line voltages will be allowed to sag 5% or so without affecting the dc supplyoutput. Utility supply voltage excursions above nominal value simply will result in delayed triggering ofthe SCR pairs.
Figure 8.4
Waveforms in an ac circuit using thyristor power control.
1 cycle
AC
volta
ge
Time
AC
volta
ge
Time
α = 0
α
Source voltage
Voltage acrossSCRs
Voltage across load
AC
volta
ge
Load current
AC
curr
ent
Time
Time
Retarded phaseoperation
© 2007 by Taylor & Francis Group, LLC

Power Electronics
135
The effect of varying the conduction phaseangle of a thyristor on the load current is illus-trated in Figure 8.8. Note how the current
I
avg
decreases as the conduction angle is reduced from180°.
Thyristor control of high-power loads (200kW and above) typically uses special transform-ers that provide 6- or 12-phase outputs. Althoughthey are more complicated and expensive, suchdesigns allow additional operational control, andfiltering requirements are reduced significantly.Figure 8.9 shows a six-phase
boost rectifier
circuit.The configuration consists basically of a full-wave, three-phase SCR bridge connected to awye-configured transformer secondary. A second bridge, consisting of six diodes, is connected to low-voltage taps on the same transformer. When the SCRs are fully on, their output is at a higher voltage thanthe diode bridge. As a result, the diodes are reverse-biased and turned off. When the SCRs are partiallyon, the diodes are free to conduct. The diodes improve the quality of the output waveform during low-voltage (reduced conduction angle) conditions. The minimum output level of the supply is determinedby the transformer taps to which the diodes are connected.
Figure 8.5
Voltage and current waveforms for inverse-parallel thyristor power control with an inductive load: (
a
)full conduction; (
b
) small-angle phase reduction; (
c
) large-angle phase reduction.
Am
plitu
de
Time
(b)
(c)
Am
plitu
de
Time
Voltage
Current
α
Θ
α
Θ
Voltage
Current
1 cycle
Am
plitu
de
Time
(a)Voltage
Current
Θ
AC in AC outSCR-1
R-1 C-1
SCR-2
Lt
Lt = Total distributed and lumped system inductance
Figure 8.6 Protective RC snubber for a thyristor-basedpower controller.
© 2007 by Taylor & Francis Group, LLC

136
AC Power Systems Handbook
Figure 8.7
Modified full-thyristor three-phase ac control of an inductive delta load.
Figure 8.8
The effect of varying the phase angle of a thyristor on the load current
I
avg
: (
a
) applied voltage, (
b
) thyristorswitched on at the zero crossing, (
c
) thyristor switched on at approximately 60° after the zero crossing, (
d
) thyristorswitched on at approximately 90° after the zero crossing.
three-phaseAC input
Delta-connected power transformer
A
B
C
Appliedvoltage
(a)
(b)
(d)
(c)
Loadcurrent
l
t1 t2 t3
Time
t1 t2 t3t1
+
−0
t2 t3
Loadcurrent
Loadcurrent lavg
lavg
lavg
© 2007 by Taylor & Francis Group, LLC

Power Electronics
137
A thyristor-driven, three-phase power-control circuit is shown in Figure 8.10. A single-phase power-control circuit is shown in Figure 8.11.
8.2.1.3 Triggering Circuits
Accurate, synchronized triggering of the gate pulses is a critical element in thyristor control of a three-phase power supply. The gate signal must be synchronized properly with the phase of the ac line that it iscontrolling. The pulse also must properly match the phase angle delay of the gates of other thyristors in thepower-control system. Lack of proper synchronization of gate pulse signals between thyristor pairs canresult in improper current sharing (current hogging) among individual legs of the three-phase supply.
The gate circuit must be protected against electrical disturbances that could make proper operationof the power-control system difficult or unreliable. Electrical isolation of the gate is a common approach.
Figure 8.9
Six-phase boost rectifier circuit.
Figure 8.10
Thyristor-controlled high-voltage servo power supply.
SCRs Diodes
+
−
Transformer secondary
3-phase ac input power
SCR pairs Power transformers
High- voltage rectifier and filter
HV dc output
Voltage sample
Q1
Q2
CR1
Q3
Q4
CR2
Q5
Q6 CR3
Voltage reference
SCR gate driver
circuits
To SCR gates
−
+
© 2007 by Taylor & Francis Group, LLC

138
AC Power Systems Handbook
Standard practice calls for the use of gate pulse transformers in thyristor servo system gating cards. Pulsetransformers are ferrite-cored devices with a single primary winding and (usually) multiple secondarywindings that feed, or at least control, the individual gates of a back-to-back thyristor pair. This conceptis illustrated in Figure 8.12. Newer thyristor designs may use optocouplers (primarily for low-power sys-tems) to achieve the necessary electrical isolation between the trigger circuit and the gate.
It is common practice to tightly twist together the leads from the gate and cathode of a thyristor tothe gating card assembly. This practice provides a degree of immunity to high-energy pulses that mightinadvertently trigger the thyristor gate. The gate circuit must be designed and configured carefully toreduce inductive and capacitive coupling that might occur between power and control circuits. Becauseof the high di/dt conditions commonly found in thyristor-controlled power circuits, power wiring andcontrol (gate) wiring must be separated physically as much as possible. Shielding of gating cards in metalcard cages is advisable.
Figure 8.11
Phase-controlled power supply with primary regulation.
Figure 8.12
Simplified block diagram of the gating circuit for a phase-control system using back-to-back SCRs.
AC inputDC output
+
Common
−Opto
isolation
Erroramplifier
Referencevoltage
Outputvoltagesample
−
+
three-phaseAC input
Plate circuit breaker
Gating assembly fuses
Power control on-off
To gating card #3
To gating card #2
Stepdown transformers
To SCR pairs
Gating assembly Enable Power
control input
Gating card#1
SCR 1 G SCR 1 K SCR 2 G SCR 2 K
A
B
C
© 2007 by Taylor & Francis Group, LLC

Power Electronics
139
Equipment manufacturers use various means to decrease gate sensitivity to transient sources,including placement of a series resistor in the gate circuit or a shunting capacitor between the gate andcathode. A series resistor has the effect of decreasing gate sensitivity, increasing the allowable dv/dt of thethyristor, and reducing the turn-off time, which simultaneously increases the required holding and latch-ing currents. The use of a shunt capacitor between the gate and cathode leads reduces high-frequencynoise components that might be present on the gate lead and increases the dv/dt withstand capability ofthe thyristor. The application of these techniques is the exclusive domain of the design engineer. Usersshould not consider modifying a design without detailed consultation with the engineering departmentof the original equipment manufacturer.
8.2.1.4 Control Flexibility
Thyristor servo control of a high-voltage or high-current power supply is beneficial to the user for anumber of reasons. First is the wide control over ac input voltages that such systems provide. A by-prod-uct of this feature is the capability to compensate automatically for line-voltage variations. Other benefitsinclude the capability to soft-start the dc supply. Thyristor control circuits typically include a ramp gen-erator that increases the ac line voltage to the power transformer from zero to full value within 2 to 5 s.This prevents high-surge currents through rectifier stacks and filter capacitors during system startup.
Although thyristor servo systems are preferred over other power-control approaches from an opera-tional standpoint, they are not without their drawbacks. The control system is complex and can be dam-aged by transient activity on the ac power line. Conventional power contactors are simple andstraightforward. They either make contact or they do not. For reliable operation of the thyristor servosystem, attention must be given to transient suppression at the incoming power lines.
8.2.2 Gate Turn-Off Thyristor
The GTO is a power switching device thatcan be turned on by a short pulse of gatecurrent and turned off by a reverse gatepulse [1]. The required reverse gate cur-rent amplitude is dependent on the anodecurrent to be turned off. Hence, there isno need for an external commutation cir-cuit to turn off the device. Because turn-off is provided by bypassing carriersdirectly to the gate circuit, the turn-offtime is short, thus making the device wellsuited for high-frequency operation. TheGTO turn-off characteristics are shownin Figure 8.13.
For reliable operation, the criticalaspects are proper design of the gate turn-off circuit and the snubber circuit. The GTO has poor turn-offcurrent gain, on the order of 4 to 5. For example, a 2000 A peak current GTO may require as high as 500A of reverse gate current. Also, the GTO has a tendency to latch at high temperatures (above approxi-mately 125ºC). GTO devices are commonly available for operation up to 4500 V at 2500 A.
8.2.3 Reverse-Conducting Thyristor
In typical inverter applications, a diode in antiparallel is connected to the thyristor for commutation/freewheeling purposes. In a
reverse-conducting thyristor
(RCT), the diode is integrated with a fast switch-ing thyristor in a single silicon chip [1]. Thus, the number of power devices in a given circuit can bereduced. This integration yields a substantial improvement in the static and dynamic characteristics ofthe device, as well as improved overall circuit performance.
Anodecurrent
Spikevoltage
0
IA
IGR
Vd
Anodevoltage
Tailcurrent
Time
Figure 8.13 Turn-off characteristics of a GTO. (After [1] and[2].)
© 2007 by Taylor & Francis Group, LLC

140
AC Power Systems Handbook
The RCT is designed mainly for specific applications such as traction drives. The antiparallel diodelimits the reverse voltage across the thyristor to 1 to 2 V. Also, because of the reverse recovery behavior ofthe diodes, the thyristor may see very high reapplied dv/dt when the diode recovers from its reverse volt-age. This necessitates use of large RC snubber networks to suppress the voltage transients. As the range ofapplication of thyristors and diodes extends into higher frequencies, their reverse recovery chargebecomes increasingly important. High reverse recovery charge results in high power dissipation duringswitching.
8.2.4 Asymmetrical Silicon-Controlled Rectifier
The
asymmetrical silicon-controlled rectifier
(ASCR) has a forward blocking capability similar to aninverter-grade thyristor, but a limited reverse blocking capability (about 20 to 30 V) [1]. The ASCR hasan on-state voltage drop of about 25% less than an inverter-grade thyristor of a similar rating. The ASCRfeatures a fast turn-off time, and so it can work at higher frequencies than typical SCRs. Because the turn-off time is reduced by a factor of nearly 2, the size of the commutating components can be halved. Theswitching losses, therefore, also are reduced.
Gate-assisted turn-off techniques can be used to further reduce the turn-off time of an ASCR. Theapplication of a negative voltage to the gate during turn-off helps to evacuate stored charges in the deviceand aids the recovery mechanism. This will — in effect — reduce the turn-off time by a factor of up to 2over the conventional device.
8.2.5 Fusing
Current-limiting is a basic method of protection for thyristors operated from the utility ac line. Thedevice typically used for breaking fault currents is either a fuse or a circuit breaker. Some designs incor-porate both components.
Semiconductor fuses
often are used in conjunction with a circuit breaker to pro-vide added protection. Semiconductor fuses operate more rapidly (typically within 8 ms) and morepredictably than common fuses or circuit breakers. Surge currents caused by a fault can destroy a semi-conductor device, such as a power thyristor, before the ac line circuit breaker has time to act. Manufac-turers of semiconductor fuses and thyristors usually specify in their data sheets the
I
2
t
ratings of eachdevice. Because the thyristor rating normally assumes that the device is operating at maximum rated cur-rent and maximum junction temperature (conditions that do not represent normal operation), a safetyfactor is ensured.
8.3 Power Transistors
Power transistors are used in ac applications ranging up to several hundred kilowatts and switching fre-quencies up to approximately 10 kHz [1]. Devices for power conversion applications are generally npntype. The power transistor is turned on by supplying sufficient base current, which must be maintainedthroughout the conduction period. The device is turned off by removing the base drive and making thebase voltage slightly negative. The
saturation voltage
of the device is normally 0.5 to 2.5 V and increases asthe current increases. The transistor off-state losses are much lower than the on-state losses because theleakage current of the device is of the order of a few milliamperes. Because of relatively long switchingtimes, switching losses significantly increase with switching frequency.
Power transistors do not have
I
2
t
withstand capability. In other words, they can absorb very littleenergy before breakdown. Therefore, they cannot be protected by semiconductor fuses (like thyristorscan), and thus an electronic protection method usually must be provided.
To reduce high base current requirements, Darlington configurations are commonly used. They areavailable in monolithic or in isolated package designs. The basic Darlington configuration is shown sche-matically in Figure 8.14. The Darlington arrangement offers a specific advantage in that it can consider-ably increase the current switched by the transistor for a given base drive.
© 2007 by Taylor & Francis Group, LLC

Power Electronics
141
8.3.1 Power MOSFET
Power MOSFETs are a class of devices marketed under a variety of names by different manufacturers [1].They have unique features that make them particularly attractive for switching applications. Power MOS-FETs are essentially voltage-driven rather than current-driven devices (unlike bipolar transistors).
The gate of a MOSFET is isolated electrically from the source by a layer of silicon oxide. The gatedraws only a minute leakage current on the order of nanoamperes. Hence, the gate drive circuit is simple,and power loss in the gate control circuit is practically negligible. Although in steady-state, the gate drawsvirtually no current, this is not so under transient conditions. The gate-to-source and gate-to-draincapacitances have to be charged and discharged appropriately to obtain the desired switching speed, andthe drive circuit must have a sufficiently low output impedance to supply the required charging and dis-charging currents.
Power MOSFETs are majority carrier devices, and there is no minority carrier storage time. Thisattribute provides for exceptionally fast rise and fall times. Power MOSFETs are essentially resistivedevices when turned on, whereas bipolar transistors present a more or less constant saturation voltage
V
CE(sat)
over the normal operating range. At low currents, therefore, a power MOSFET may have a lowerconduction loss than a comparable bipolar device, but at higher currents, the conduction loss will exceedthat of the bipolar device.
8.3.1.1 Rugged MOSFET
With recent advancements in MOS technology, ruggedized MOSFETs are replacing conventional MOS-FETs in numerous applications [1]. Theoretically, the secondary breakdown mechanism is absent in apower MOSFET. In the real world of
vertical conductive power
MOSFETs, however, secondary breakdownexists because of the presence of a parasitic npn transistor, thus forcing chip designers to develop the rug-gedness concept to thwart such failures. The need to ruggedize power MOSFETs is related to device reli-ability. If a MOSFET is operated within its specification range at all times, its chances for failingcatastrophically are minimal. However, if the absolute maximum ratings are exceeded, failure probabilityincreases dramatically. Under actual operating conditions, a MOSFET may be subjected to transientseither externally from the power bus supplying the circuit or from the circuit itself, caused, for example,by inductive kicks going beyond the absolute maximum ratings. Such conditions are likely in almostevery application and, in many cases, are beyond the control of the designer.
The difference between a ruggedized MOSFET and a conventional device is that the ruggedized ver-sion is rated to withstand a specific amount of unclamped avalanche energy when operated at voltagesabove its maximum drain-to-source breakdown voltage (
BV
DSS
). In effect, the manufacturer guaranteesthat MOSFET will not fail catastrophically up to a specified amount of avalanche energy.
Figure 8.14
A two-stage Darlington transistor with bypass diode. (
After
[1]
and
[2].)
B1
R1 R2
B2 E
T2
C
T1
© 2007 by Taylor & Francis Group, LLC

142
AC Power Systems Handbook
8.3.2 Insulated-Gate Bipolar Transistor
The IGBT combines the high input impedance and high-speed characteristics of a MOSFET with the conductivitycharacteristic (low saturation voltage) of a bipolar transis-tor [1]. The equivalent circuit of an IGBT is shown in Fig-ure 8.15. The IGBT is turned on by applying a positivevoltage between the gate and emitter, and as with theMOSFET, it is turned off by making the gate signal zero orslightly negative. The IGBT has a much lower on-stateresistance than a MOSFET.
In a sense, the device is similar to a thyristor andMOSFET. To illustrate: for a given IGBT, there is a criticalvalue of drain current that will cause a large enough volt-age drop to activate the thyristor element. Hence, devicemanufacturers specify the peak allowable drain currentthat can flow without latch-up occurring. There is also acorresponding gate source voltage that permits this cur-rent to flow, which should not be exceeded. After theIGBT is in latch-up, the gate no longer has any control ofthe drain current. The only way to turn off the IGBT inthis situation is by forced commutation of the current,exactly the same as for a thyristor. If latch-up is not termi-nated quickly, the IGBT will be destroyed by the excessivepower dissipation. Under dynamic conditions, when theIGBT is switching from on to off, it may latch up at draincurrent values less than the values described here (
staticlatch-up current
value). Various improvements to the basic IGBT design have increased the latching cur-rent to workable values.
Like the power MOSFET, the IGBT does not exhibit the secondary breakdown phenomenon com-mon to bipolar transistors. However, care should be taken not to exceed the maximum power dissipationand specified maximum junction temperature of the device under all conditions for guaranteed reliableoperation.
The on-state voltage of the IGBT is heavily dependent on the gate voltage. To obtain a low on-statevoltage, a sufficiently high gate voltage must be applied. The on-state voltage also increases with temper-ature. Compared to a MOSFET structure, the IGBT is generally smaller for the same current rating. Atvoltages above 400 V, an IGBT can be one third the size of a MOSFET. The bipolar action in the IGBT,however, slows down the speed of the device so that it typically operates at a much lower frequency thanthe MOSFET. The switching frequency can be as high as 50 kHz for a standard device; higher frequenciesare achievable at the expense of higher losses.
The IGBTs cannot be as easily paralleled as MOSFETs can. The factors that inhibit current sharing ofparallel-connected IGBTs are:
• The on-state current unbalance, caused by
V
CE(sat)
distribution and main circuit wiring resistancedistribution
• Current unbalance at turn-on and turn-off, caused by the switching time difference of the parallel-connected devices and circuit wiring inductance distribution
If IGBT devices having different turn-on times are paralleled, the current is hogged by the devicehaving the shorter turn-on time. If IGBTs having different turn-off times are paralleled, current is hoggedby the device having the longer turn-off time. The time differences at turn-off must be controlled care-fully because turn-off times are greater than those of turn-on.
Collector
Thyristor
pnp
npn
Gate
Mosfet
Emitter
Figure 8.15 The equivalent circuit of theIGBT device. (After [1] and [2].)
© 2007 by Taylor & Francis Group, LLC

Power Electronics
143
8.3.3 MOS-Controlled Thyristor
The
MOS-controlled thyristor
(MCT) isbasically a thyristor with built-in MOSFETsto turn on and turn off the circuit [1].Device attributes include high-power,high-frequency, low-conduction-drop, andruggedness. The MCT equivalent circuit isshown in Figure 8.16. The MCT has thyris-tor-type junctions and pnpn layers betweenthe anode and cathode.
The MCT is turned on by a negativevoltage pulse at the gate, with respect to theanode, and turned off by a positive voltagepulse. The MCT can operate at higherjunction temperatures than the BJT, IGBT,and MOSFET. The MCT has relatively lowswitching times and storage time. The MCT is capable of high current densities and blocking voltages inboth directions. Because the power gain of an MCT is extremely high, it can be driven directly from alogic gate.
8.4 References
1. Rajashekara, K., A. K. S. Bhat, and B. K. Bose, “Power Electronics,” in
The Electrical EngineeringHandbook
, Richard Dorf (Ed.), CRC Press, Boca Raton, FL, pp. 694–701, 1993.2. Bose, B. K.,
Modern Power Electronics: Evaluation, Technology, and Applications
, IEEE, New York,1992.
8.5 Bibliography
Fink, D., and D. Christiansen (Eds.),
Electronics Engineers’ Handbook,
3
rd
ed., McGraw-Hill, New York,1989.
Jordan, Edward C. (Ed.),
Reference Data for Engineers: Radio, Electronics, Computer, and Communications
,7th ed., Howard W. Sams Company, Indianapolis, IN, 1985.
Pearman, R.,
Power Electronics
, Reston Publishing Company, Reston, VA, 1980.Mohan, N., and T. Undeland,
Power Electronics: Converters, Applications, and Design
, John Wiley, NewYork, 1989.
SCR Applications Handbook
, International Rectifier Corporation, El Segundo, CA, 1977.
SCR Manual,
5th ed., General Electric Company, Auburn, NY.Wojslawowicz, J., “Ruggedized Transistors Emerging as Power MOSFET Standard-Bearers,”
Power Tech-nics
, pp. 29–32, January 1988.
+14V
−7V
GOff
N-FET
C
P-FET
On
A
OffOn
0
Figure 8.16 The equivalent circuit of the MCT device. (After[1] and [2].)
© 2007 by Taylor & Francis Group, LLC

145
9
Origins of AC Line
Disturbances
9.1 Introduction
Transient overvoltages come in a wide variety of forms, from a wide variety of sources. They can, however,be broken down into two basic categories: (1) those generated through natural occurrences, and (2) thosegenerated through the use of equipment, either on-site or elsewhere.
9.2 Naturally Occurring Disturbances
Natural phenomena of interest to facility managers consist mainly of lightning and related disturbances. The
lightning effect
can be compared to that of a capacitor, as shown in Figure 9.1. A charged cloud above theEarth will create an oppositely charged area below it of about the same size and shape. When the voltage dif-ference is sufficient to break down the dielectric (air), the two “plates” of the “capacitor” will arc over andneutralize their respective charges. If the dielectric spacing is reduced, as in the case of a conductive steelstructure (such as a transmitting tower), the arc-over will occur at a lower-than-normal potential and willtravel through the conductive structure.
The typical duration of a lightning flash is approximately 0.5 s. A single flash is made up of various dis-charge components, among which are typically three or four high-current pulses called
strokes
. Each strokelasts about one 1 ms; the separation between strokes is typically several tens of milliseconds. Lightning oftenappears to flicker because the human eye can just resolve the individual light pulses that are produced byeach stroke.
9.2.1 Sources of Atmospheric Energy
Lightning is one of the more visible effects of atmospheric electricity. Stellar events that occurred light-yearsago spray the earth and its atmosphere with atoms that have been stripped of most or all of their electrons.In the process of entering the atmosphere, these particles collide with air molecules, which are knockedapart, creating billions more ion pairs each second. Even though these ions may exist for only about 100 s,they constantly are being replenished from deep space. The existence of ions in the atmosphere is the funda-mental reason for atmospheric electricity. The primary sources of this energy are:
•
Cosmic rays
: Charged particles emitted by all radiating bodies in space. Most of these particles (ions)expend their energy in penetrating the envelope of air surrounding the earth. Through this process,they create more ions by colliding with air atoms and molecules. One high-energy particle may createup to a billion pairs of ions, many of which will become atmospheric electricity.
•
Solar wind
: Charged particles from the sun that continuously bombard the surface of the earth.Because about half of the earth’s surface is always exposed to the sun, variations are experienced fromday to night. Solar wind particles travel at only 200 to 500 miles per second, compared with cosmicparticles that travel at near the speed of light. Because of their slower speed, solar wind particles haveless of an effect on air atoms and molecules.
© 2007 by Taylor & Francis Group, LLC

146
AC Power Systems Handbook
•
Natural radioactive decay
: The natural disintegration of radioactive elements. In the process ofradioactive decay, air molecules are ionized near the surface of the earth. One of the results isradon gas.
•
Static electricity
: Energy generated by the interaction of moving air and the earth.•
Electromagnetic generation
: Energy generated by the movement of air molecules through themagnetic field of the earth.
The combined effects of cosmic rays and solar wind account for most atmospheric electrical energy.Atmospheric energy is present at all times, even during clear weather conditions. This energy takes
the form of a voltage differential of 300 to 400 kV between the surface of the earth and the ionosphere.The voltage gradient is nonlinear; near the surface it may be 150 V/m of elevation, but it diminishes sig-nificantly at higher altitudes. Under normal conditions, the earth is negative with respect to the iono-sphere, and ions flow between the two entities. Because there are fewer free ions near the Earth than theionosphere, the volts/meter value is thought to be greater because of the lower effective conductivity ofthe air. This concept is illustrated in Figure 9.2.
Figure 9.1
The lightning effect and how it can be compared to a more familiar mechanism, the capacitor principle.Also shown are the parameters of a typical lightning strike.
Figure 9.2
The effects of atmospheric conductivity.
Lightning effects:Peak current: 100 kAEnergy: 5000 joules (watts-seconds)Frequency: 10 Hz to 40 kHz Field at 1 mile: 70 V/mRise time: 0.5 μs to 10 μs
Negative terminal
Positive terminalAntenna
Earth Oppositely charged area below storm cloud
Airdielectric
Charged storm cloud
Return strokeStepped leader
Reduceddielectricspacing
3 km
2 km
5 MΩ
Incr
easin
g re
sista
nce
1 MΩ
Iso-electric lines
10 MΩ
Incr
easin
g nu
mbe
r of i
ons
1 km
Alti
tude
Earth’s surface
© 2007 by Taylor & Francis Group, LLC

Origins of AC Line Disturbances
147
Thermodynamic activity in a developing stormcloud causes it to become a powerfully charged cell,usually negatively charged on the bottom and posi-tively charged on the top. (See Figure 9.3.) This volt-age difference causes a distortion in the voltagegradient, and in fact, the polarity inverts, with theearth becoming positive with reference to the bottomof the cloud. This voltage gradient increases to a highvalue, sometimes exceeding 10 kV/m of elevation.The overall charge between the earth and the cloudmay be on the order of 10 to 100 MV, or more. Whensufficient potential difference exists, a lightning flashmay occur.
Figure 9.4 shows the flash waveform for a typicallightning discharge. The rise time is very fast, in themicrosecond range, as the lightning channel is estab-lished. The trailing edge exhibits a slow decay; thedecay curve is known as a
reciprocal double exponential waveform
. The trailing edge is the result of theresistance of the ionized channel depleting energy from the cloud. The path length for a lightning dis-charge is measured in kilometers. The most common source of lightning is cumulonimbus cloud forms,although other types of clouds (such as nimbostratus) occasionally can produce activity.
Although most lightning strikes are negative (the bottom of the cloud is negative with respect to theearth), positive strikes also can occur. Such strikes have been estimated to carry as much as 10 times thecurrent of a negative strike. A positive flash can carry 200 kiloamps (kA) or more of discharge current.Such hot strikes, as they are called, can cause considerable damage. Hot strikes can occur in the winterand are often the aftereffect of a particularly active storm. After a number of discharges, the lower nega-tive portion of the cloud will become depleted. When charged, the lower portion may have functioned asa screen or shield between the earth and the upper, positively charged portion of the cloud. Whendepleted, the shield is removed, exposing the earth to the massive charge in the upper cloud containingpotentials of perhaps 500 MV or more.
9.2.2 Characteristics of Lightning
A typical lightning flash consists of a stepped leader that progresses toward the ground at a velocity thatcan exceed 50 m/
μ
s. When sufficient potential difference between the cloud and the ground exists, arcs
Figure 9.4
Discharge waveform for a typical lightning strike.
Cloud
Lightning
Earth’s surface
PointdischargeRain
++++
+ + + +
+ ++ +
++
++
+
+++
<−> <−>
<−> <−>
<−> <−> <−> <−>
<−> <−> <−> <−><−>
<−> <−> <−>
Figure 9.3 A developing thunderstorm cell.
60
50
40
30
20
E(kV
/m)
101000 200
I (ns)
Reciprocal double exponential
300 400
© 2007 by Taylor & Francis Group, LLC

148
AC Power Systems Handbook
move from the ground to the leader column, completing the ionized column from cloud to ground. Afast and bright return stroke then moves upward along the leader column at about one third the speed oflight. Peak currents from such a lightning flash may exceed 100 kA, with a total charge as high as 100 cou-lombs (C). Although averages are difficult to assess where lightning is concerned, a characteristic flashexhibits a 2
μ
s rise time, and a 10 to 40
μ
s decay to a 50% level. The peak current will average 18 kA forthe first impulse, and about half that for the second and third impulses. Three to four strokes per flash arecommon.
A lightning flash is a constant-current source. Once ionization occurs, the air becomes a conductiveplasma reaching 60,000°F and becomes luminous. The resistance of an object struck by lightning is ofsmall consequence except for the power dissipation on that object, which is equivalent to
I
2
R
. Fifty per-cent of all strikes will have a first discharge of at least 18 kA, 10% will exceed 60 kA, and only 1% willexceed 120 kA.
Four specific types of cloud-to-ground lightning have been identified. They are categorized in termsof the direction of motion (upward or downward) and the sign of the electric charge (positive or nega-tive) of the initiating leader. The categories, illustrated in Figure 9.5, are defined as follows:
•
Category 1
: Negative leader cloud-to-ground discharge. By far the most common form of lightning,such discharges account for 90% or more of the cloud-to-ground flashes worldwide. Such events areinitiated by a downward-moving negatively charged leader.
•
Category 2
: Positive leader ground-to-cloud discharge. This event begins with an upward-initiatedflash from earth, generally from a mountaintop or tall steel structure. Category 2 discharges are rela-tively rare.
•
Category 3
: Positive leader cloud-to-ground discharge. Less than 10% of cloud-to-ground lightningworldwide is of this type. Positive discharges are initiated by leaders that do not exhibit the distinctsteps of their negative counterparts. The largest recorded peak currents are in the 200 to 300 kA range.
•
Category 4
: Negative leader ground-to-cloud discharge. Relatively rare, this form of lightning beginswith an upward leader that exhibits a negative charge. Similar to Category 2 discharges, Category 4discharges occur primarily from a mountaintop or tall steel structure.
An idealized lightning flash is shown in Figure 9.6. The stepped leader initiates the first return strokein a negative cloud-to-ground flash by propagating downward in a series of discrete steps, as shown. Thebreakdown process sets the stage for a negative charge to be lowered to the ground. A fully developedleader lowers 10 C or more of negative cloud charge to near the ground within a few tens of milliseconds.The average return leader current measures from 100 A to 1 kA. During its trip toward earth, the steppedleader branches in a downward direction, producing the characteristic lightning discharge.
The electrical potential difference between the bottom of the negatively charged leader channel andthe earth can exhibit a magnitude in excess of 100 MV. As the leader tip nears ground level, the electricfield at sharp objects on the ground increases until the breakdown strength of the atmosphere isexceeded. At that point, one or more upward-moving discharges are initiated, and the
attachment process
Figure 9.5
Four general types of lightning activity. (
After
[1].)
+ + ++
+++
+ ++ ++ ++ + ++21
++
+
++
++
−
− −
−−
−−−
+ + + +
++ ++
+
+
+ ++ +3
−−
−−
−
−−
−
−
− − − ++ +4
− − −
© 2007 by Taylor & Francis Group, LLC
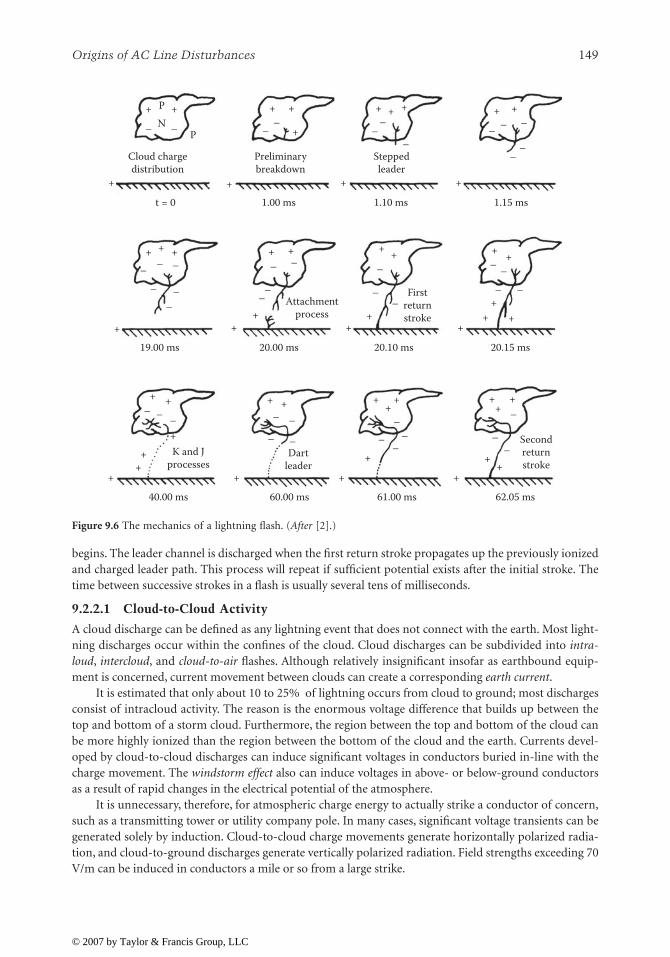
Origins of AC Line Disturbances
149
begins. The leader channel is discharged when the first return stroke propagates up the previously ionizedand charged leader path. This process will repeat if sufficient potential exists after the initial stroke. Thetime between successive strokes in a flash is usually several tens of milliseconds.
9.2.2.1 Cloud-to-Cloud Activity
A cloud discharge can be defined as any lightning event that does not connect with the earth. Most light-ning discharges occur within the confines of the cloud. Cloud discharges can be subdivided into
intra-loud
,
intercloud
, and
cloud-to-air
flashes. Although relatively insignificant insofar as earthbound equip-ment is concerned, current movement between clouds can create a corresponding
earth current
.It is estimated that only about 10 to 25% of lightning occurs from cloud to ground; most discharges
consist of intracloud activity. The reason is the enormous voltage difference that builds up between thetop and bottom of a storm cloud. Furthermore, the region between the top and bottom of the cloud canbe more highly ionized than the region between the bottom of the cloud and the earth. Currents devel-oped by cloud-to-cloud discharges can induce significant voltages in conductors buried in-line with thecharge movement. The
windstorm effect
also can induce voltages in above- or below-ground conductorsas a result of rapid changes in the electrical potential of the atmosphere.
It is unnecessary, therefore, for atmospheric charge energy to actually strike a conductor of concern,such as a transmitting tower or utility company pole. In many cases, significant voltage transients can begenerated solely by induction. Cloud-to-cloud charge movements generate horizontally polarized radia-tion, and cloud-to-ground discharges generate vertically polarized radiation. Field strengths exceeding 70V/m can be induced in conductors a mile or so from a large strike.
Figure 9.6
The mechanics of a lightning flash. (
After
[2].)
P
PN
Cloud chargedistribution
Preliminarybreakdown
Attachmentprocess
Firstreturnstroke
Steppedleader
1.00 mst = 0
19.00 ms
K and Jprocesses
40.00 ms 60.00 ms 61.00 ms 62.05 ms
Dartleader
Secondreturnstroke
20.00 ms 20.10 ms 20.15 ms
1.10 ms 1.15 ms
+
+
+ +
+
++
+ + + +
+ + + + + +
++ +
++
+ +
+ + ++
+ + + +
+− −
−−−
− − −−
− −
−
−
−
+ +
+
+
++
+
++
+
+
−−
−
−
−−
−
−
−−−+ + + +
+
+
−
− −
− −
− −−
− −−
−
+ +−−
−−
−−
© 2007 by Taylor & Francis Group, LLC

150
AC Power Systems Handbook
Figure 9.7 illustrates the mechanisms of lightning damage. Traveling waves of voltage and currentfollow all conductive paths until the flash energy has been dissipated. Reflections occur at discontinuities,such as lightning arresters (points 1, 2, 3, and 5) and transformers (points 4 and 6).
9.2.3 Lightning Protection
Research into the physical properties of lightning and related phenomena has two basic goals: (1) to iden-tify the character and severity of the threat, and (2) to devise methods to prevent damage resulting fromatmospheric activity. Many different approaches have been taken over the years for controlling the dam-aging potential of lightning; some have become widely accepted, others remain controversial. The issue oflightning prevention clearly falls into the second category.
Application of the
point discharge
theory, the basis of lightning prevention schemes, is controversialto begin with. Still, it offers the promise of a solution to a serious problem faced by nearly all telecommu-nications operators. The goal is to dissipate static charges around a given structure at a rate sufficient tomaintain the charge below the value at which a lightning flash will occur. The theory holds that dischargefrom the point of an electrode to a surrounding medium will follow predictable rules of behavior. Thesharper the point, the greater the discharge. The greater the number of discharge points, the more effi-cient the dissipation system. Several static dissipators based on this theory are shown in Figure 9.8. Keydesign elements for such dissipators include:
• Radius of the dissipator electrode. The purpose of the dissipator is to create a high field intensitysurrounding the device. Theory states that the electric field intensity will increase as the electroderadius is reduced. Dissipators, therefore, generally use the smallest-radius electrodes possible, con-sistent with structural integrity. There is, however, disagreement among certain dissipation-arraymanufacturers on this point. The optimum wire size, according to available literature, varies from0.005-in.- to 1/8-in.-thick tapered spikes.
Figure 9.7
The mechanisms of lighting surge on an overhead power-distribution line.
Thunderstorm cloud Thunderstorm cloud
Reflectionpoint
21
3
4
5
6
Power center480 V to 208 V/120 V
Transformer13,800 V/480 V
typical
+ + ++
+ + + + + + + + ++ ++ +
© 2007 by Taylor & Francis Group, LLC

Origins of AC Line Disturbances
151
• Dissipator construction material. Importantqualities include conductivity and durability.The dissipator should be a good conductor toprovide: (1) the maximum discharge of currentduring normal operation, and (2) an efficientpath for current flow in the event of a directstrike.
• Number of dissipator electrodes. Calculatingthe number of dissipator points is, again, thesubject of some debate. However, because thegoal of the system is to provide a low-resistancepath to the atmosphere, it generally is assumedthat the more discharge points, the more effec-tive the system. Dissipator electrode require-ments are determined by the type of structurebeing protected as well as the environmentalfeatures surrounding it.
• Density of dissipator electrodes. Experimenta-tion by some manufacturers has shown that thesmaller the radius of the dissipator electrodes,the more closely they can be arranged withoutreducing the overall efficiency of the dissipator.Although this convention seems reasonable,disagreement exists among dissipation-arraymanufacturers. Some say the points should be close together; others say they should be far apart.
• Configuration of the dissipator on the tower. Disagreement abounds on this point. One school ofthought supports the concept of a dedicated “umbrella-type” structure at the top of the tower as themost efficient method of protecting against a lightning flash (Figure 9.9). Another view holds that thedissipator need not be at the highest point, and that it may be more effective if one or more dissipatorsare placed at natural dissipation points on the structure. Such points include side-mounted antennasand other sharp elements on the tower.
• Size and deployment of grounding electrodes. Some systems utilize an extensive ground system, oth-ers do not. One manufacturer specifies a collector composed of wire radials extending from the baseof the tower and terminated by ground rods. Another manufacturer does not require a ground con-nection to the dissipator.
Available literature indicates that from 10
μ
A to 10 mA flow through a properly designed dissipativesystem into the surrounding air during a lightning storm. Figure 9.10 charts the discharge currentrecorded during a period of storm activity at a protected site. Although a lightning stroke can reach sev-eral hundreds of thousands of amperes, this energy flows for a very short period of time. The concept ofthe dissipative array is to continuously bleed off space charge current to prevent a direct hit.
Proof that static dissipators work as intended is elusive and depends upon the definition of “proof.”Empirical proof is difficult to obtain because successful performance of a static dissipator is evidenced bythe absence of any results. Supporting evidence, both pro and con, is available from end-users of staticdissipators, and from those who have studied this method of reducing the incidence of lightning strikesto a structure.
9.2.3.1 Protection Area
The placement of a tall structure over low-profile structures tends to protect the facilities near the groundfrom lightning flashes. The tall structure, typically a communications tower, is assumed to shield thefacility below it from hits. This
cone of protection
is determined by the following:
Figure 9.8 Various types of static dissipation arrays.
© 2007 by Taylor & Francis Group, LLC

152
AC Power Systems Handbook
• Height of the tall structure• Height of the storm cloud above the earth
The higher the cloud, the larger the radius of the base of the protecting cone. The ratio of radius tobase to height varies approximately from 1 to 2, as illustrated in Figure 9.11.
Conventional wisdom has held that a tower, whether protected with a static dissipation array or sim-ply a tower-top lightning rod, provided a cone of protection stretching out on all sides of the structure atan angle of about 45°. Although this theory held favor for many years, modifications have been proposed.One school of thought suggests that a smaller cone of perhaps 30° from the tower is more realistic.Another suggests that the cone theory is basically flawed and, instead, proposes a “rolling sphere”approach. This theory states that areas enclosed below a 150-ft rolling sphere will enjoy protectionagainst lightning strikes. The concept is illustrated in Figure 9.12. Note that the top of the tower shown in
Figure 9.9
Umbrella-type dissipation array.
Figure 9.10
Measured discharge current of a lightning dissipation array.
Chargedcloud
++
+ ++ +
+ ++++
++++
+ ++
+
+++ +
+
++
+ +
++
++ +
+
+ + +
+
+ + ++
+++ +
+ +
++
+
+
− −−
−−
−− −
− −− −
−−
−− −
−− − −
−− − − −
Coronadischarge
Dissipator
Ground currentcollector
5 p.m.
Time
Disc
harg
e cu
rren
t
6 p.m.
© 2007 by Taylor & Francis Group, LLC

Origins of AC Line Disturbances
153
the figure is assumed to experience limited protection. The concept, as it applies to side-mounted anten-nas, is shown in Figure 9.13. The antenna is protected through the addition of two horizontally mountedlightning rods, one above the antenna and one below.
9.2.4 Electrostatic Discharge
A static charge is the result of an excess or deficiency of electrons on a given surface. The relative level ofelectron imbalance determines the static charge. Simply stated, a charge is generated by physical contactbetween, and then separation of, two materials. One surface loses electrons to the other. The types ofmaterials involved, and the speed and duration of motion between the materials, determine the chargelevel. Electrostatic energy is a stationary charge phenomenon that can build up in either a nonconductivematerial or in an ungrounded conductive material. The charge can occur in one of two ways:
•
Polarization
: Charge buildup when a conductive material is exposed to a magnetic field.
Figure 9.11
Intended protection area for a dissipation array.
Figure 9.12
Protection zone for a tall tower under the “rolling sphere” theory.
Dissipation array
Collectorradials
150' radius
200
200
150
150150
100
100500
50
Not protected
Protected
Distance from mast-feet
Hei
ght a
bove
gro
und-
feet
© 2007 by Taylor & Francis Group, LLC

154
AC Power Systems Handbook
•
Triboelectric effects
: Charge buildup that occurs whentwo surfaces contact and then separate, leaving one pos-itively charged and the other negatively charged.
Friction between two materials increases the triboelectriccharge by increasing the surface area that experiences contact.For example, a person accumulates charge by walking acrossa nylon carpet; discharge occurs when the person touches aconductive surface.
9.2.4.1 Triboelectric Effect
Different materials have differing potentials for charge. Nylon,human and animal hair, wool, and asbestos have high positivetriboelectric potential. Silicon, polyurethane, rayon, and poly-ester have negative triboelectric potentials. Cotton, steel,paper, and wood all tend to be relatively neutral materials. Theintensity of the triboelectric charge is inversely proportional tothe relative humidity (RH). As humidity increases,
electrostaticdischarge
(ESD) problems decrease. For example, a personwalking across a carpet can generate a 1.5 kV charge at 90%RH, but will generate as much as 35 kV at 10% RH.
When a charged object comes in contact with anotherobject, the electrostatic charge will attempt to find a path toground, discharging into the contacted object. The currentlevel is very low (typically less than 0.1 nA), but the voltagecan be high (25 to 50 kV).
ESD also can collect on metallic furnishings, such aschairs and equipment racks. Sharp corners and edges, how-ever, encourage a corona that tends to bleed the charge offsuch objects. The maximum voltage normally expected forfurniture-related ESD is about 6 to 8 kV. Because metallic fur-niture is much more conductive than humans, however, furni-ture-related ESD generally will result in higher peak dischargecurrents. Figure 9.14 shows a discharge waveform of a typicalESD event.
Figure 9.14
Discharge waveform for an ESD event. (After [3].)
Protectedarea
Protectedarea
Nonprotectedarea
Nonprotectedarea
Figure 9.13 Protection zone for a side-mounted antenna under the “rollingsphere” theory.
I or V
t
© 2007 by Taylor & Francis Group, LLC

Origins of AC Line Disturbances
155
9.2.5 EMP Radiation
Electromagnetic pulse
(EMP) radiation is the result of an intense release of electromagnetic waves that fol-lows a nuclear explosion. (See Figure 9.15.) The amount of damaging energy is a function of the altitudeof detonation and the size of the device. A low-altitude or surface burst would generate a strong EMP,covering a few thousand square kilometers. However, the effects of the radiation would be meaningless,because the blast would destroy most structures in the area. A high-altitude burst, on the other hand, pre-sents a real threat to all types of communications and electronic systems. Such an explosion would gener-ate an EMP with a radius of more than 1000 km, a large portion of the U.S.
The sudden release of gamma rays in a nuclear explosion would cause almost instant ionization (theremoval of electrons from atoms) of the atmospheric gases that surround the detonation area. Free elec-trons are driven outward. In a high-altitude event, the gamma rays travel great distances before ionizingthe upper atmosphere. The forced movement of these electrons, which will again recombine with atomsin the atmosphere, creates a pulsed electromagnetic field.
The amplitude and polarization of thefield produced by a high-altitude detonationdepends on the altitude of the burst, the yieldof the device, and the orientation of the burstwith respect to the receiving point. The EMPfield creates a short but intense broadbandradio frequency pulse with significant energyup to 100 MHz. Most of the radiated energy,however, is concentrated below 10 MHz. Fig-ure 9.16 shows the distribution of energy as afunction of frequency. The electric field canbe greater than 50 kV/m, with a rise timemeasured in the tens of nanoseconds. Figure9.17 illustrates the field of a simulated EMPdischarge.
Many times, lightning and other naturaloccurrences cause problems not because theystrike a given site, but because they strikepart of the utility power system and arebrought into the facility via the ac lines. Like-wise, damage that could result from EMP
Figure 9.15
The EMP effect and how it can induce damaging voltages onto utility company lines and antennastructures. The expected parameters of an EMP event also are shown.
High altitudenuclear blast
EMP radiation
Antenna tower
Utility lines
EMP effects:
Far field intensityfrequencyrise time
50 kV/m10 Hz to 100 MHz20 ns
0
−10
−20
−30
−40
−50
dB
−60
−70
−80
−90
101 102 103 104 105 106
Frequency (Hz)107 108 109 1010
−100
Figure 9.16 Normalized EMP spectrum. Approximately99% of the radiated energy is concentrated between 10 kHzand 100 MHz.
© 2007 by Taylor & Francis Group, LLC

156
AC Power Systems Handbook
radiation would be most severe to equipment connected to the primary power source, because it is gener-ally the most exposed part of any facility. Table 9.1 lists the response of various systems to an EMP event.
9.2.6 Coupling Transient Energy
The utility power-distribution system can couple transient overvoltages into a customer’s load throughinduction or direct-charge injection. As stated previously, a lightning flash a mile away from a 12 kV linecan create an electromagnetic field with a strength of 70 V/m or more. Given a sufficiently long line, sub-stantial voltages can be coupled to the primary power system without a direct hit. Likewise, the field cre-ated by EMP radiation can be coupled to the primary power lines, but in this case at a much highervoltage (50 kV/m). Considering the layout of many parts of the utility company power system — longexposed lines over mountaintops and the like — the possibility of a direct lightning flash to one or morelegs of the system is a distinct one.
Lightning is a point charge-injection process, with pulses moving away from the point of injection.The amount of total energy (voltage and current) and the rise and decay times of the energy seen at theload as a result of a lightning flash are functions of the distance between the flash and the load and thephysical characteristics of the power-distribution system. Determining factors include:
• Wire size• Number and sharpness of bends• Types of transformers• Types of insulators• Placement of lightning suppressors
The character of a lightning flash covers a wide range of voltage, current, and rise-time parameters.Making an accurate estimate of the damage potential of a flash is difficult. A direct hit to a utility powerline causes a high-voltage, high-current wave to travel away from the point of the hit in both directionsalong the power line. The waveshape is sawtooth in form, with a rise time measured in microseconds ornanoseconds. The pulse travels at nearly the speed of light until it encounters a significant change in lineimpedance. At this point, a portion of the wave is reflected back down the line in the direction fromwhich it came. This action creates a standing wave containing the combined voltages of the two pulses. Ahigh-energy wave of this type can reach a potential sufficient to arc over to another parallel line, a dis-tance of about 8 ft on a local feeder (typically 12 kV) power pole.
Figure 9.17
Discharge waveform for a nuclear EMP event.
Table 9.1
Effects of an EMP Event on Various Systems
Type of Conductor
Rise Time (s)
Peak Voltage (V)
Peak Current (A)
Long unshielded cable (power line, long antenna) 10
–8
to 10
–7
10
5
to 5
×
10
6
10
3
to 10
4
HF antenna system 10
–8
to 10
–7
10
4
to 10
6
500 to 10
4
VHF antenna system 10
–9
to 10
–8
10
3
to 10
5
100 to 10
3
UHF antenna system 10
–9
to 10
–8
100 to 10
4
10 to 100
63.3
46.7
30.1
13.5
0 10 20 30 40 50 60 70 80 90 1003.1
E (k
V/m
)
1 × 10⁻⁹ sec
© 2007 by Taylor & Francis Group, LLC

Origins of AC Line Disturbances
157
9.3 Equipment-Caused Transient Disturbances
Equipment-caused transients in the utility power system are a consequence of the basic nature of alter-nating current. A sudden change in an electric circuit will cause a transient voltage to be generatedbecause of the stored energy contained in the circuit inductances (
L
) and capacitances (
C
). The size andduration of the transient depend on the values of
L
and
C
and the waveform applied.A large step-down transformer, the building block of any power system, normally will generate tran-
sient waveforms when energized or de-energized. As illustrated in Figure 9.18, the stray capacitances andinductances of the secondary can generate a brief oscillating transient of up to twice the peak secondaryvoltage when the transformer is energized. The length of this oscillation is determined by the values of
L
and
C
in the circuit.A more serious problem can be encountered when energizing a step-down transformer. The load is,
in effect, looking into a capacitive divider from the secondary into the primary. If the interwinding capac-itance is high and the load capacitance is low, a spike of as much as the full primary voltage can beinduced onto the secondary, and thus, onto the load. This spike does not carry much energy because ofits short duration, but sensitive equipment on the load side could be damaged upon reapplication ofpower to a utility company pole transformer, for example, as would occur after a power outage. A typicaltransformer may have 0.002 pF series capacitance from input to output. (See Figure 9.19.) A simple Fara-day shielded isolation transformer can reduce this series capacitance to 30 pF, nearly two orders of mag-nitude lower.
Figure 9.18
The causes of inductor turn-on and turn-off spikes. The waveforms are exaggerated to illustrate the transienteffects. C
1
, C
2
, and C
3
are stray capacitances that form a divider network between the primary and secondary, causingthe turn-on spike shown at point
A
. The oscillation shown at point
B
is caused by the interaction of the inductance ofthe secondary (L
1
) and C
3
. The spike shown at point
C
is the result of power interruption to the transformer primary,which causes the collapsing lines of flux to couple a high-voltage transient into the secondary circuit.
Figure 9.19
Transient produced as a result of transformer capacitance during power-on condition. (
After
[4].)
AC line input
C1
C3
C2
L1
Point “A” (turn-on transient)
Point “C” (turn-off transient)
Point “B” (oscillation)
Tran
sform
er
outp
ut v
olta
ge
+
−
Loadmay have strayinductance orcapacitance
CS
SwitchA
B
VLine
+
+
−
VAB
SwitchclosedVAB −
© 2007 by Taylor & Francis Group, LLC

158
AC Power Systems Handbook
De-energizing a large power transformer also can cause high-voltage spikes to be generated. Inter-rupting the current to the primary windings of a transformer, unless switched off at or near the zero cross-ing, will cause the collapsing magnetic lines of flux in the core to couple a high-voltage transient into thesecondary circuit, as illustrated in Figure 9.20. If a low-impedance discharge path is not present, this spikewill be impressed upon the load. Transients in excess of 10 times the nominal secondary voltage have beenobserved when this type of switching occurs. Such spikes can have damaging results to equipment on-line.For example, the transient produced by interrupting the magnetizing current to a 150 kVA transformercan measure 9 joules (J). Whether these turn-on, turn-off transients cause any damage depends on the sizeof the transformer and the sensitivity of the equipment connected to the transformer secondary.
9.3.1 Utility System Faults
Various utility fault conditions can result in the generation of potentially damaging overvoltage tran-sients. For example, the occurrence of a fault somewhere in the local power-distribution network willcause a substantial increase in current in the step-down transformer at the local area distribution substa-tion. When a fuse located near the fault opens the circuit, the excess stored energy in the magnetic lines offlux of the transformer will cause a large oscillating transient to be injected into the system.
Routine load switching by the utility will have a similar, albeit less serious, effect. Such transient volt-ages can be quite frequent and, in some instances, harmful to equipment rectifier stacks, capacitors, andtransformer. The magnitude of utility company switching transients usually is independent of power-sys-tem voltage ratings, as illustrated in Figure 9.21.
9.3.2 Switch Contact Arcing
Transients generated by contact bounce occur not only because of physical bouncing upon closing oropening, but also because of arcing between contacts, the result of transients that are generated when aninductive load is de-energized. The principle is illustrated in Figure 9.22. When current is interrupted toan inductor, the magnetic lines of flux will try to maintain themselves by charging stray capacitances. Thecurrent will oscillate in the inductance and capacitance at a high frequency. If sufficiently high voltagesare generated in this process, an arc will jump the contacts after they have opened, clearing the oscillatingcurrent. As the contacts separate further, the process is repeated until the voltage generated by the col-lapsing lines of flux is no longer sufficient to jump the widening gap between the contacts. This voltagethen may look for another discharge path, such as interwinding arcing or other components in parallelwith the inductor. Contact arcing also may occur when an inductor is switched on, if the contacts bounceopen after first closing. Figure 9.23 illustrates typical contacting characteristics for energizing a relaymechanism; de-energizing of relay contacts is illustrated in Figure 9.24.
It should be noted that the ringing of an inductive circuit exposed to a transient disturbance pro-duces not only the overshoot that most engineers are familiar with, but also a potentially damagingundershoot. This effect is illustrated in Figure 9.25. Sudden and severe polarity reversals such as the oneillustrated can have damaging effects on semiconductor devices.
Figure 9.20
Transient generated when interrupting the transformer magnetizing current. (After [4].)
LoadIm
Switch
ACline
Secondaryvoltage
Magnetizingcurrent and
flux
Linevoltage
Switchopened
© 2007 by Taylor & Francis Group, LLC

Origins of AC Line Disturbances 159
9.3.3 Telephone System Transients
Overvoltages on telephone loops and data lines generally can be traced to the 60 Hz power system andlightning. Faults, crossed lines, and bad grounding can cause energy to be injected into or coupled ontotelco circuits from utility company power lines when the cables share common poles or routing paths.Direct lightning hits to telco lines will generate huge transients on low-level audio, video, or data circuits.Buried phone company cables also are subject to damaging transients because of charge movements inthe earth resulting from lightning flashes and cloud-to-loud discharge activity. Voltages can be induced incable shield material and in the lines themselves. EMP radiation can penetrate a buried telco line in asimilar manner.
Figure 9.21 The relationship (computed and measured) between utility company system voltage and switchingtransient peaks. Switching transients are plotted as a function of nominal operating voltages for three values of thetransient tail time to half-potential. It can be seen that there is no direct linear increase in transient amplitude as thesystem voltage is increased.
Figure 9.22 The mechanics of contact bounce: (a) measurement configuration; (b) representative waveforms. Thewaveforms shown are exaggerated to illustrate the transient effects. For clarity, the modulating effect of the ac linevoltage is not shown.
6
5
4
3Tr
ansie
nt o
verv
olta
ge (k
V)
2
1
100 200 300Rated voltage of distribution system
400 500
Th = 1000 μs
Th = 50 μs
Th = 5 μs
Oscilloscope
AC
inpu
t
Inductive load(a) (b)
Contacts fully separated
Time
Volta
ge a
cros
ssw
itch
cont
acts
ARC-over points
© 2007 by Taylor & Francis Group, LLC

160 AC Power Systems Handbook
Figure 9.23 The mechanics of relay contact bounce during the energizing period.
Figure 9.24 The mechanics of relay contact bounce during the de-energizing period.
Time
Bounce
Transfer timeon operate
N.O.contactcurrent
N.C.contactcurrent
Coil current
Dynamic contact resistance
Dynamiccontact
resistance
Operate time for N.C. contacts
Operate timefor N.O. contacts
Time
Bounce
Transfer timeon release
N.O.contactcurrent
N.C.contactcurrent
Coil current
Dynamic contact resistance
Dynamiccontact
resistance
Release time for N.C. contacts
Release timefor N.O. contacts
© 2007 by Taylor & Francis Group, LLC

Origins of AC Line Disturbances 161
Lightning or other transient currents usuallytravel along a telephone cable shield until dissi-pated, either through ground connections (in thecase of pole-mounted cables) or throughcable-to-earth arc-overs (in the case of buriedcables). This activity usually does not cause dam-age to the shield material itself, but it can inducetransient voltages on internal conductors, whichmay be harmful to central office equipment orend-user devices and systems. The characteristicsof the transient that can appear at the end of atelco cable are a function of the following vari-ables:
• Distance from the disturbance to the mea-suring point
• Type of cable used, including the jacketthickness, shielding material and thickness,and internal conductor wire size
• Amplitude and waveform of the lightning current in the cable shield
The current-generated potential along the cable shield is capacitively coupled to the internal cablepairs, so the waveform of the transient voltage observed at the measuring point (measured betweenground and either conductor of a pair) closely resembles the waveform of the lightning current. Theinduced spike will propagate as a traveling wave in both directions along the cable from the point ofinjection or region of induction.
9.3.4 Nonlinear Loads and Harmonic Energy
Motors, incandescent lighting, and heating loadsare linear in nature [5]. That is, the load imped-ance is essentially constant regardless of theapplied voltage. As illustrated in Figure 9.26, in accircuits, the current increases proportionately asthe voltage increases, and decreases proportion-ately as the voltage decreases. The current is inphase with the voltage for a resistive circuit with apower factor (PF) of unity. It lags the voltage bysome phase angle for the more typical partiallyinductive circuit (with a PF commonly between0.80 and 0.95) and leads the voltage by some phaseangle in a capacitive circuit. In either case, thiscurrent is always proportional to the voltage. For asinusoidal voltage, the current is also sinusoidal.
A nonlinear load is one in which the loadcurrent is not proportional to the instantaneousvoltage. In this case, illustrated in Figure 9.27,the load current is not continuous. Nonlinearloads typically are switched on for only a portion of the ac cycle — as in a thyristor-controlled circuit— or pulsed — as in a controlled rectifier circuit. Nonlinear load currents are nonsinusoidal, and evenwhen the source voltage is a clean sine wave, the nonlinear load will distort the voltage wave, making itnonsinusoidal.
Overshoot
Undershoot
Time
60 H
z wav
e
Tran
sient
over
volta
ge
Figure 9.25 The “iceberg” effect of many transientwaveforms. The overshoot often is followed by anequally damaging undershoot before leveling off.
Voltage EIn-phase current IR
Leading current IC Leading current IL
Figure 9.26 The relationship of linear current wave-forms: IR is a purely resistive circuit curent, IL is apartically inductive (lagging) circuit current, and Ic isa particially capactive (leading) circuit current. (From[5]. Used with permission.)
© 2007 by Taylor & Francis Group, LLC

162 AC Power Systems Handbook
Certain deviations from the pure sine waveare the equivalent of adding one or more otherpure sine waves of different frequencies. Any wave-shape, in fact, can be reproduced exactly by addingtogether a series of sine waves of particular fre-quency, amplitude, and timing, although it mayrequire an infinite number of these waveforms.Nonsinusoidal waveforms, therefore, consist of(and can be broken down into) some finite num-ber of pure sine waves.
The most common sine waves that distort apower system are whole number multiples of thefundamental 60 Hz power frequency, commonlyknown as harmonics. Although traditional linearloads allow voltages and currents of the funda-mental frequency to appear in the power systemwith little or no harmonic currents, nonlinear loads can introduce significant levels of harmonics into thesystem. Harmonic energies combine with the fundamental to form distorted waveforms of the typeshown in Figure 9.28. The amount of distortion is determined by the frequency and amplitude of theharmonic currents.
In a three-phase, four-wire system, single-phase line-to-neutral load currents flow in each phase conduc-tor and return in the common neutral conductor. The three 60 Hz phase currents are separated by 120°, andfor balanced three-phase linear loads, they are equal. When these currents return in the neutral, they canceleach other, adding up to zero at all points. Thus, for balanced three-phase, 60 Hz loads, neutral current is zero.
For second harmonic currents separated by 120°, cancellation in the neutral also is complete (seeFigure 9.29), resulting in zero neutral current. This is true for all even harmonics.
For third harmonic currents, the return currents from each of the three phases are in phase in theneutral (Figure 9.30), and so the total third harmonic neutral current is the arithmetic sum of the threeindividual third harmonic phase currents. This is also true for all odd multiples of the third harmonic(9th, 15th, 21st, and so on), which are the additive zero sequence currents.
Figure 9.28 The addition of 60 Hz fundamental and 3rd
harmonic waveshapes: (a) individual waveforms, (b)resulting distorted waveshape. (From [5]. Used with per-mission.)
Figure 9.29 Fundamental and 2nd-harmonic currents ina three-phase, four-wire circuit. At any point, the sum ofthe positive (+) and negative (–) currents equals zero forthe fundamental current, the 2nd-harmonic current, and— in similar fashion — all even-harmonic currents.Therefore, for balanced loads on a three-phase, four-wiresystem, no 60 Hz or even-harmonic currents flow in thecommon neutral. (From [5]. Used with permission.)
Sinisodal voltage
Current pulses
Figure 9.27 Typical waveforms of nonlinear load cur-rent. (From [5]. Used with permission.)
Fundamental(a)
(b)
3rdharmonic
øA
ø2A
Sum = 0 Sum = 0
ø2B ø2C
øB øC
© 2007 by Taylor & Francis Group, LLC

Origins of AC Line Disturbances 163
Other odd harmonics (5th, 7th, 11th, 13th, and so on) add in the neutral, but the total neutral-har-monic current is somewhat less than the arithmetic sum of the three harmonic phase currents. Mathe-matically, the total is the vector sum of the three currents. The phase angles between the three phasecurrents result in partial addition and partial cancellation.
The theoretical maximum neutral current with harmonics is at least 1.73 and perhaps as much as3.00 times the phase current. (There is dispute as to the true maximum value between these limits.)
For pulsed loads, the pulses can occur in eachphase at a different time. They will return in thecommon neutral, but they will be separated bytime; therefore, there will be no cancellation. Ifnone of the pulses overlap, the neutral current canbe three times the phase current, as illustrated inFigure 9.31.
The effects of additive harmonics in the neu-tral were first recognized in the National ElectricalCode (NEC) many years ago, when Sec. 230-22prohibited reduced neutral conductor size for thatportion of the load consisting of discharge light-ing. The effects of electronic equipment were rec-ognized in the 1987 NEC when the prohibition inSec. 230-22 against reducing the neutral wasexpanded to include loads from data processingand similar equipment.
Ratings of transformers and generators arebased on the heating created by load currents of anundistorted 60 Hz sine wave. When the load cur-rents are nonlinear and have a substantial harmonic content, they cause considerably more heating thanthe same number of amperes of a pure sine wave. There are several major reasons for this, including:
• Hysteresis• Eddy currents• Skin effects
These parameters were discussed in Section 1.4.As harmonic currents are drawn by various loads, they act on the impedance of the source, causing
harmonic distortion of the source voltage. Although motors are normally linear loads, when the supplyvoltage has harmonic distortion, motors draw harmonic currents. These harmonic currents cause exces-sive motor heating from higher hysteresis and eddy-current losses in the motor laminations and skin
Figure 9.30 Fundamental and 3rd-harmonic currents.Third-harmonic currents are equal and in phase (thecurves are superimposed). At any point, the sum of theharmonic currents equals three times the value of anyone of the currents. This also is true for all odd multiplesof the 3rd-harmonic (9th, 15th, 21st, and so on). Other oddharmonics are also additive, but not fully, because theyare equal but not exactly in phase. The total neutralcurrent for other odd harmonics (5th, 7th, 11th, etc.) ismore than any one harmonic phase current, but less thanthree times any harmonic phase current. (From [5]. Usedwith permission.)
øA
ø3A, ø3B
øB øC
ø3C (superimposed)
øA
PA PB PC
øB øC
Figure 9.31 Fundamental and pulsed currents. Thesum of the pulses in the neutral equals three timesthe rms value of any one phase pulse because there islittle or no overlap or cancellation. The rms currentin the neutral depends on each single-phase pulse rmscurrent, and the pulse shape, frequency, and duration.(From [5]. Used with permission.)
© 2007 by Taylor & Francis Group, LLC
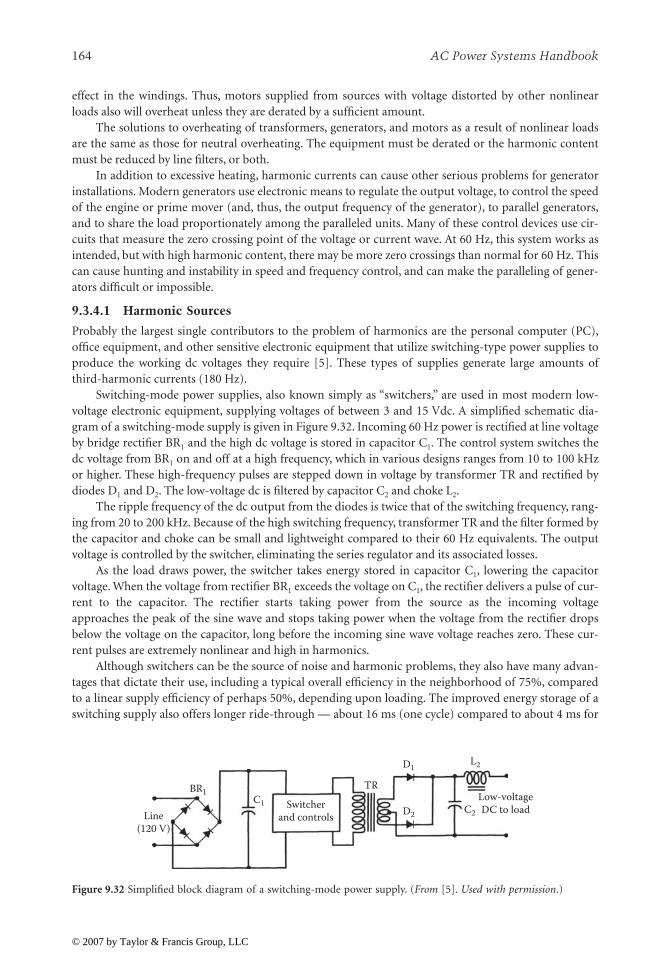
164 AC Power Systems Handbook
effect in the windings. Thus, motors supplied from sources with voltage distorted by other nonlinearloads also will overheat unless they are derated by a sufficient amount.
The solutions to overheating of transformers, generators, and motors as a result of nonlinear loadsare the same as those for neutral overheating. The equipment must be derated or the harmonic contentmust be reduced by line filters, or both.
In addition to excessive heating, harmonic currents can cause other serious problems for generatorinstallations. Modern generators use electronic means to regulate the output voltage, to control the speedof the engine or prime mover (and, thus, the output frequency of the generator), to parallel generators,and to share the load proportionately among the paralleled units. Many of these control devices use cir-cuits that measure the zero crossing point of the voltage or current wave. At 60 Hz, this system works asintended, but with high harmonic content, there may be more zero crossings than normal for 60 Hz. Thiscan cause hunting and instability in speed and frequency control, and can make the paralleling of gener-ators difficult or impossible.
9.3.4.1 Harmonic Sources
Probably the largest single contributors to the problem of harmonics are the personal computer (PC),office equipment, and other sensitive electronic equipment that utilize switching-type power supplies toproduce the working dc voltages they require [5]. These types of supplies generate large amounts ofthird-harmonic currents (180 Hz).
Switching-mode power supplies, also known simply as “switchers,” are used in most modern low-voltage electronic equipment, supplying voltages of between 3 and 15 Vdc. A simplified schematic dia-gram of a switching-mode supply is given in Figure 9.32. Incoming 60 Hz power is rectified at line voltageby bridge rectifier BR1 and the high dc voltage is stored in capacitor C1. The control system switches thedc voltage from BR1 on and off at a high frequency, which in various designs ranges from 10 to 100 kHzor higher. These high-frequency pulses are stepped down in voltage by transformer TR and rectified bydiodes D1 and D2. The low-voltage dc is filtered by capacitor C2 and choke L2.
The ripple frequency of the dc output from the diodes is twice that of the switching frequency, rang-ing from 20 to 200 kHz. Because of the high switching frequency, transformer TR and the filter formed bythe capacitor and choke can be small and lightweight compared to their 60 Hz equivalents. The outputvoltage is controlled by the switcher, eliminating the series regulator and its associated losses.
As the load draws power, the switcher takes energy stored in capacitor C1, lowering the capacitorvoltage. When the voltage from rectifier BR1 exceeds the voltage on C1, the rectifier delivers a pulse of cur-rent to the capacitor. The rectifier starts taking power from the source as the incoming voltageapproaches the peak of the sine wave and stops taking power when the voltage from the rectifier dropsbelow the voltage on the capacitor, long before the incoming sine wave voltage reaches zero. These cur-rent pulses are extremely nonlinear and high in harmonics.
Although switchers can be the source of noise and harmonic problems, they also have many advan-tages that dictate their use, including a typical overall efficiency in the neighborhood of 75%, comparedto a linear supply efficiency of perhaps 50%, depending upon loading. The improved energy storage of aswitching supply also offers longer ride-through — about 16 ms (one cycle) compared to about 4 ms for
Figure 9.32 Simplified block diagram of a switching-mode power supply. (From [5]. Used with permission.)
Line(120 V)
BR1TR
Switcherand controls
Low-voltageDC to load
C1D2 C2
D1L2
© 2007 by Taylor & Francis Group, LLC

Origins of AC Line Disturbances 165
a linear supply. Furthermore, the linear supply usually requires the input voltage to be held to within 10%of nominal, whereas the switcher can tolerate voltage dips of approximately 20%.
Although switchers constitute a major source of harmonic currents, there are many other possiblesources. Depending upon the nature of the loads that predominate in a particular facility, these othersources may actually be the main contributors of harmonic currents. Such loads include:
• Fluorescent ballasts. In fluorescent lighting fixtures with conventional magnetic ballasts, thethird-harmonic current content is typically in the range of 13 to 20% of the fundamental 60 Hzfrequency. Electronic ballasts generate an even higher third-harmonic component, as high as 80% .
• Adjustable speed drives. For power quality considerations, adjustable speed drives can be dividedinto two basic groups: (1) voltage source inverter (VSI) drives, and (2) current source inverter (CSI)drives. VSIs use large capacitors in the dc link to provide constant voltage to the inverter. Theinverter then chops the dc voltage to provide the variable frequency ac voltage to the motor. CSIdrives, on the other hand, are used for larger horsepower applications where custom designs arejustified. The dc link consists of a large choke to keep the dc current relatively constant. Theinverter then chops this current waveform to provide the variable frequency ac signal to the motor.
• Static UPS systems. In static UPS systems, the incoming ac is rectified to dc, which is then invertedby pulsing circuits back to ac to obtain constant-frequency 60 or 415 Hz ac power. The rectifiervoltage control is obtained with thyristors (SCRs). These are gated on (conducting) at any pointin the cycle, turn off automatically as the voltage passes through zero, and are gated on again atthe same point in each subsequent half-cycle. Output distortion of the UPS for a given loaddepends on the UPS design and output impedance. Thus, most UPS manufacturers specify theoutput voltage distortion of their equipment; 5% total harmonic distortion (THD) is typical.However, many add a disclaimer, such as “Based on linear loads.”
• Controlled rectifiers. A characteristic of all controlled rectifiers is that they are nonlinear and drawcurrents of high harmonic content from the source. Phase-controlled rectifiers using thyristorsdo not begin to conduct until gated on; they shut off at or near the zero-crossing.
9.3.5 Carrier Storage
Although the carrier storage phenomenon is rarely a source of serious transient disturbances, its effectsshould be considered in any critical application. When a silicon diode switches from a forward conduc-tion mode to a reverse blocking state, the presence of stored carriers at the device junction can prevent animmediate cessation of current. These stored carriers have the effect of permitting current to flow in thereverse direction during a brief portion of the ac cycle.
The carrier storage current is limited only by the applied voltage and external circuit design. Thecurrent flow is brief, as carriers are removed rapidly from the junction by internal recombination and thesweeping effects of the reverse current. This removal of carriers causes the diode to revert to its blockingcondition, and the sudden cessation of what can be a large reverse current may cause damaging voltagetransients in the circuit if there is appreciable system inductance and if transient suppression has notbeen included in the system design.
The reverse current caused by carrier storage usually is not excessive in normal operation of powerrectifier circuits. Carrier storage does not, in itself, constitute a hazard, especially at ac power-line fre-quencies. The carrier storage effect can, however, lead to complications in certain switching arrange-ments. For example, current will tend to “free-wheel” through rectifier diodes after the supply voltage hasbeen removed in an inductive circuit until the stored energy has been dissipated. If the supply voltage isreapplied while this free-wheeling process is under way, some of the diodes in the circuit will be requiredto conduct in a forward direction, but others will be required to block. While the latter diodes are recov-ering from the carrier storage free-wheeling current, a short-circuit effect will be experienced by thesource, causing potentially damaging surge currents.
© 2007 by Taylor & Francis Group, LLC

166 AC Power Systems Handbook
9.3.6 Transient-Generated Noise
Problems can be caused in a facility by transient overvoltages not only through device failure, but alsobecause of logic state upsets. Studies have shown that an upset in the logic of typical digital circuitry canoccur with transient energy levels as low as 1 × 10⁻⁹ J. Such logic-state upsets can result in microcomputerlatchup, lost or incorrect data, program errors, and control-system shutdown. Transient-induced noise isa major contributor to such problems.
Utility company transients, lightning, and ESD are the primary sources of random, unpredictablenoise. Unless properly controlled, these sources represent a significant threat to equipment reliability.Although more predictable, other disturbance sources, such as switch contact arcing and SCR switching,also present problems for equipment users.
9.3.6.1 ESD Noise
The upper frequency limit for an ESD discharge can exceed 1 GHz. Determining factors include the volt-age level, relative humidity, speed of approach, and shape of the charged object. At such frequencies, cir-cuit board traces and cables function as fairly efficient receiving antennas.
Electrical noise associated with ESD may enter electronic equipment by either conduction or radia-tion. In the near field of an ESD (within a few tens of centimeters), the primary type of radiated couplingcan be either inductive or capacitive, depending on the impedances of the ESD source and the receiver. Inthe far field, electromagnetic field coupling predominates. Circuit operation is upset if the ESD-inducedvoltages or currents exceed typical signal levels in the system. Coupling of an ESD voltage in the near fieldis determined by the impedance of the circuit:
• For a high-impedance circuit, capacitive coupling will dominate and ESD-induced voltages willbe the major problem.
• For a low-impedance circuit, inductive coupling will dominate and ESD-induced currents will bethe major problem.
9.3.6.2 Contact Arcing
Switch contact arcing and similar repetitive transient-generating operations can induce significantbroadband noise into an electrical system. Noise generated in this fashion is best controlled at its source,almost always an inductive load. Noise can travel through power lines and create problems for micro-computer equipment, either through direct injection into the system power supply, or through couplingfrom adjacent cables or printed wiring board (PWB) traces.
9.3.6.3 SCR Switching
SCR power controllers are a potential source of noise-induced microcomputer problems. Each time anSCR is triggered into its active state in a resistive circuit, the load current goes from zero to the load-lim-ited current value in less than a few microseconds. This step action generates a broadband spectrum ofenergy, with an amplitude inversely proportional to frequency. Electronic equipment using full-waveSCR control in a 60 Hz circuit can experience such noise bursts 120 times a second.
In an industrial environment, where various control systems may be spaced closely, electrical noisecan cause latchup problems or incorrect data in microcomputer equipment, or interaction between SCRfiring units in machine controllers. Power-line cables within a facility can couple noise from one area of aplant to another, further complicating the problem. The solution to the SCR noise problem is found bylooking at both the source of the interference and the susceptible hardware. The use of good tran-sient-suppression techniques in the application of SCR power controllers will eliminate noise generationin all but the most critical of applications.
© 2007 by Taylor & Francis Group, LLC

Origins of AC Line Disturbances 167
9.4 References
1. Berger, K., “Blitzstorm-Parameter von Aufwärtsblitzen,” Bull. Schweitz. Electrotech., Ver., Vol. 69,pp. 353–360, 1978.
2. Uman, M. A., “Natural and Artificially Initiated Lightning and Lightning Test Standards,” Proceed-ings of the IEEE, Vol. 76, No. 12, IEEE, New York, December 1988.
3. Technical staff, Military/Aerospace Products Division, The Reliability Handbook, National Semi-conductor, Santa Clara, CA, 1987.
4. Cherniak, S., “A Review of Transients and Their Means of Suppression,” Motorola SemiconductorApplication Note AN843/D, Rev. 1, Motorola, Phoenix, AZ, 1991.
5. DeDad, J. A., et al., “Nonlinear Loads and Harmonics,” in Practical Guide to Quality Power forSensitive Electronic Equipment, PRIMEDIA Intertec, Overland Park, KS, pp. 45–49, 1994.
9.5 Bibliography
Bishop, D., “Lightning Devices Undergo Tests at Florida Airports,” Mobile Radio Technology, PRIMEDIAIntertec, Overland Park, KS, May 1990.
Bishop, D., “Lightning Sparks Debate: Prevention or Protection?” Mobile Radio Technology, PRIMEDIAIntertec, Overland Park, KS, January 1989.
Block, R., “Dissipation Arrays: Do They Work?,” Mobile Radio Technology, PRIMEDIA Intertec, OverlandPark, KS, April 1988.
Block, R., “The Grounds for Lightning and EMP Protection,” PolyPhaser Corp., Gardnerville, NV, 1987.Defense Civil Preparedness Agency, EMP and Electric Power Systems, Publication TR-6l-D, U.S. Depart-
ment of Commerce, National Bureau of Standards, Washington, DC, July 1973.Defense Civil Preparedness Agency, EMP Protection for Emergency Operating Centers, Federal Information
Processing Standards Publication no. 94, Guideline on Electrical Power for ADP Installations, U.S.Department of Commerce, National Bureau of Standards, Washington, DC , 1983.
Drabkin, M., and R. Carpenter, Jr., “Lightning Protection Devices: How Do They Compare?,” MobileRadio Technology, PRIMEDIA Intertec, Overland Park, KS, October 1988.
Fink, D., and D. Christiansen, (Eds.) Electronics Engineers’ Handbook, 3rd ed., McGraw-Hill, New York, 1989.Goldstein, M., and P. D. Speranza, “The Quality of U.S. Commercial AC Power,” Proceedings of the IEEE,
IEEE, New York, 1982.Jay, F., Ed., IEEE Standard Directory of Electrical and Electronics Terms, 3rd ed., IEEE, New York, 1984.Jordan, C. (Ed.), Reference Data for Engineers: Radio, Electronics, Computer, and Communications, 7th
ed., Howard W. Sams, Indianapolis, IN, 1985.Kaiser, B. A., “Can You Really Fool Mother Nature?” Cellular Business, PRIMEDIA Intertec, Overland
Park, KS, March 1989.Kaiser, B. A., “Straight Talk on Static Dissipation,” Proceedings of ENTELEC 1988, Energy Telecommuni-
cations and Electrical Association, Dallas, TX, 1988.Key, Lt. T., “The Effects of Power Disturbances on Computer Operation,” IEEE Industrial and Commercial
Power Systems Conference paper, Cincinnati, OH, June 7, 1978.Martzloff, F. D., “The Development of a Guide on Surge Voltages in Low-Voltage AC Power Circuits,”
14th Electrical/Electronics Insulation Conference, IEEE, Boston, MA, October 1979.Nott, R., “The Sources of Atmospheric Energy,” Proceedings of the SBE National Convention and Broadcast
Engineering Conference, Society of Broadcast Engineers, Indianapolis, IN, 1987.Technical staff, “Voltage Transients and the Semiconductor,” The Electronic Field Engineer, pp. 37–40,
March/April 1979.Technical staff, Military/Aerospace Products Division, The Reliability Handbook, National Semiconductor,
Santa Clara, CA, 1987.Ulman, M. A., The Lightning Discharge, Academic Press, Orlando, FL, 1987.Whitaker, C., Electronic Systems Maintenance Handbook, 2nd ed., CRC Press, Boca Raton, FL, 2001.
© 2007 by Taylor & Francis Group, LLC

169
10
Power Disturbance
Characterization
10.1 Introduction
Short-term ac voltage disturbances can be classified into four major categories, as illustrated in Figure 10.1.The categories are defined according to peak value and duration:
•
Voltage surge
: An increase of l0 to 35% above the nominal line voltage for a period of 16 ms to 30 s.•
Voltage sag
: A decrease of 10 to 35% below the nominal line voltage for a period of 16 ms to 30 s.•
Transient disturbance
: A voltage pulse of high energy and short duration impressed upon the acwaveform. The overvoltage pulse can be 1 to 100 times the nominal ac potential and can last up to15 ms. Rise times measure in the nanosecond range.
•
Momentary power interruption
: A decrease to zero voltage of the ac power-line potential, lasting from33 to 133 ms. Longer-duration interruptions are considered power outages.
Voltage surges and sags occasionally result in operational problems for equipment on-line, but auto-matic protection or correction circuits generally take appropriate actions to ensure that there is no equip-ment damage. Such disturbances can, however, garble computer system data if the disturbance transitiontime (the rise/fall time of the disturbance) is sufficiently fast. System hardware also may be stressed if there isonly a marginal power supply reserve or if the disturbances are frequent.
Momentary power interruptions can cause a loss of volatile memory in computer-driven systems andplace severe stress on hardware components, especially if the ac supply is allowed to surge back automaticallywithout soft-start provisions. Successful system reset may not be accomplished if the interruption is suffi-ciently brief.
Although voltage sags, surges, and momentary interruptions can cause operational problems forequipment used today, the possibility of complete system failure because of one of these mechanisms isrelatively small. The greatest threat to the proper operation of electronic equipment rests with transientovervoltage disturbances on the ac line. Transients are difficult to identify and difficult to eliminate. Manydevices commonly used to correct sag and surge conditions, such as ferroresonant transformers ormotor-driven autotransformers, are of limited value in protecting a load from high-energy, fast-rise-timedisturbances.
In the computer industry, research has shown that a significant number of unexplained problemsresulting in disallowed states of operation actually are caused by transient disturbances on the utility feed.With the increased use of microcomputers in industry, this consideration cannot be ignored. Because of thehigh potential that transient disturbances typically exhibit, they not only cause data and program errors, butalso can damage or destroy electric components. This threat to electronic equipment involves sensitive inte-grated circuits and many other common devices, such as capacitors, transformers, rectifiers, and powersemiconductors. Figure 10.2 illustrates the vulnerability of common components to high-energy pulses. Theeffects of transient disturbances on electronic devices are often cumulative, resulting in gradual deteriora-tion and, ultimately, catastrophic failure.
© 2007 by Taylor & Francis Group, LLC

170
AC Power Systems Handbook
10.2 Standards of Measurement
Various test procedures and standards have been developed to enable system designers to evaluate theeffectiveness of proposed protective measures. These range from simulation of lightning currents, volt-ages, and electric and magnetic fields to the generation of typical lightning-induced current and voltagetransients expected to appear at the terminals of electronic equipment. Damaging effects can be dividedinto two basic categories:
Figure 10.1
The four basic classifications of short-term power-line disturbances.
Figure 10.2
An estimation of the susceptibility of common electric devices to damage from transient disturbances.The vertical line marked “discharge” represents the energy level of a discharge that typically can be generated by aperson who touches a piece of equipment after walking across a carpeted floor.
Power interruption(lasting 33 to 133 ms)
Power factor correction
spike
Nominal voltage
Transient disturbances Momentary power interruption
Transient overvoltage
(1 to 100 times above nominal voltage, lasting
up to 15 ms)
Nominal voltage
SAG (10 to 35% below normal,lasting 16 ms to 30 sec)
Surge (10 to 35% above normal,lasting 16 ms to 30 sec)
Voltage SAG condition Voltage Surge condition
Range of damage threshold
10–6 10–4 10–2 1 100 10–8
Microwave diodes
Integrated circuits
Low-power transistors
Medium- and high-power transistors
Rectifier diodes
Resistors
Relays
Vacuum tubes
Typical static discharge
potential
Joules
© 2007 by Taylor & Francis Group, LLC

Power Disturbance Characterization
171
•
Direct effects:
Damage to metal and insulator surfaces, and ignition of flammable vapors resultingfrom direct lightning attachment.
•
Indirect effects:
Damage resulting from the currents and voltages induced in internal circuits bylightning that has struck the exterior of a structure or a vehicle.
Because it is difficult to assess the threat posed by transient disturbances without guidelines on thenature of transients in ac power systems, a number of separate standards have been developed forindividual component groups. The best known was developed by a working group of the Institute ofElectrical and Electronics Engineers (IEEE) to simulate indirect lightning effects. IEEE suggested twowaveforms, one unidirectional and the other oscillatory, for measuring and testing transient suppressioncomponents and systems in ac power circuits with rated voltages of up to 1 kV rms line-to-ground. Theguidelines also recommend specific source impedance or short-circuit current values for transient analy-sis.
The voltage and current amplitudes, waveshapes, and source impedance values suggested in theAmerican National Standards Institute/IEEE guide (ANSI/IEEE standard C62.41-1980) were designed toapproximate the vast majority of high-level transient disturbances, but were not intended to representworst-case conditions — a difficult parameter to predict. The timing of a transient overvoltage withrespect to the power line waveform is also an important parameter in the examination of ac disturbances.Certain types of semiconductors exhibit failure modes that are dependent on the position of a transienton the sine wave.
Figure 10.3 shows the ANSI/IEEE representative waveform for an indoor-type spike (for 120 to 240Vac systems). Field measurements, laboratory observations, and theoretical calculations have shown thatmost transient disturbances in low-voltage indoor ac power systems have oscillatory waveshapes, insteadof the unidirectional wave most often thought to represent a transient overvoltage. The oscillatory natureof the indoor waveform is the result of the natural resonant frequencies of the ac distribution system.Studies by the IEEE show that the oscillatory frequency range of such disturbances extends from 30 Hz to100 kHz, and that the waveform changes, depending upon where it is measured in the power distributionsystem.
The waveform shown in Figure 10.3 is the result of extensive study by the IEEE and other indepen-dent organizations of various ac power circuits. The representative waveshape for 120 and 240 V systemsis described as a 0.5
μ
s to 100 kHz ring wave. This standard indoor spike has a rise time of 0.5
μ
s, thendecays while oscillating at 100 kHz. The amplitude of each peak is approximately 60% of the precedingpeak.
Figure 10.3
The suggested ANSI/IEEE indoor-type transient overvoltage test waveform (0.5
μ
s to 100 kHz ring wave,open-circuit voltage).
60% peak (–)
10% peak
Peak voltage90% peak
+
(F = 100 kHz)10 ms
0.5 msTime
–
© 2007 by Taylor & Francis Group, LLC

172
AC Power Systems Handbook
Figure 10.4 shows the ANSI/IEEE representative waveforms for an outdoor-type spike. The classiclightning overvoltage pulse has been established at a 1.2/50
μ
s waveshape for a voltage wave and an 8/20
μ
s waveshape for a current wave. Accordingly, the ANSI/IEEE standard waveshape is defined as 1.2/50
μ
sopen-circuit voltage (voltage applied to a high-impedance device), and 8/20
μ
s discharge current (cur-rent in a low-impedance device).
The test waveshapes, although useful in the analysis of components and systems, are not intended torepresent all transient patterns seen in low-voltage ac circuits. Lightning discharges can cause oscillations,reflections, and other disturbances in the utility company power system that can appear at the servicedrop entrance as decaying oscillations.
Unfortunately, most lightning disturbance standard waveforms address one or two characteristics ofa discharge. Furthermore, standard waveforms are intended to represent typical events, not worst-caseevents. In testing to determine the immunity of a system to a direct lightning strike, a conservativeapproach is generally taken, in that the characteristics of a relatively severe flash are adopted. Figure 10.5shows a test waveform specified for aerospace vehicles (MIL-STD-1757A). The current waveformincludes one initial and one subsequent stroke, between which flows continuing current. Peak currentsare 200 kA for the first stroke and 100 kA for the subsequent stroke. The total charge transfer is in excessof 200 C.
Figure 10.4
The unidirectional waveshape for outdoor-type transient overvoltage test analysis based on ANSI Stan-dard C62.1: (
a
) open-circuit waveform, (
b
) discharge current waveform.
Figure 10.5
Lightning test current waveform specified in MIL STD-1757A. (
After
[1].)
Time Time
Peak voltage Peak current
50% peak50%peak
30%peak
90%peak
Volta
ge
50 ms
0 0T1
T2
T1 × 1.67 = 1.2 ms20 ms
T2 × 1.25 = 8 ms
+ +
10%peak
90%peak
Curr
ent
Time 0.25 s ≤ t ≤ 1 s 0.5 ms ≤0.5 ms ≤5 ms
Q = 200 C Q = 10 C
Curr
ent (
not t
o sc
ale)
200 kA
100 kA
2 kA (avg)
200 to 300 A
© 2007 by Taylor & Francis Group, LLC

Power Disturbance Characterization
173
10.2.1 Assessing the Threat
High-speed digital ac line monitoring instruments provide a wealth of information on the quality ofincoming utility power at a facility. Such instruments have changed the business of assessing the threatposed by unprocessed ac from an educated guess to a fine science. Sophisticated monitoring equipmentcan give the user a complete, detailed look at what is coming in from the power company. Such monitor-ing devices provide data on the problems that can be expected when operating data processing, commu-nications, or other sensitive electronic equipment from an unprotected ac line. Power-quality surveys areavailable from a number of consulting firms and power-conditioning companies. The typical procedureinvolves installing a sophisticated voltage-monitoring unit at the site to be used for a period of severalweeks to several months. During that time, data is collected on the types of disturbances the load equip-ment is likely to experience.
The type of monitoring unit used is of critical importance. It must be a high-speed system that storesdisturbance data in memory and delivers a printout of the data on demand. Conventional chart recordersare too slow and lack sufficient sensitivity to accurately show short-duration voltage disturbances. Chartrecorders can confirm the presence of long-term surge and sag conditions, but provide little useful dataon transients.
10.2.2 Fundamental Measurement Techniques
Most power system measurements involve characterizing fundamental parameters. These include volt-age, phase, and frequency. Most other tests consist of measuring these fundamental parameters and dis-playing the results in combination by using some convenient format. Measurements are made onequipment and systems to check performance under specified conditions and to assess suitability for usein a particular application. The measurements can be used to verify specified system performance or as away of comparing several pieces of equipment for use in a system. Measurements can also be used toidentify components in need of adjustment or repair.
Measurement of voltage is fundamental to ac operation. Voltage can be measured either in absoluteterms or in relative terms. Power demand is an example of an absolute level measurement; it does notrequire any reference. Gain and loss are examples of relative, or ratio, measurements.
Distortion measurements are a way of quantifying the amount of unwanted components added to asignal by a piece of equipment. The most common technique is total harmonic distortion (THD), butothers can be used. Distortion measurements express the amount of unwanted signal components rela-tive to the desired signal, usually as a percentage or decibel value. This is another example of multiplelevel measurements that are combined to give a new measurement figure.
The simplest definition of a level measurement is the alternating current amplitude at a particularplace in the system under test. However, in contrast to direct current measurements, there are many waysof specifying ac voltage. The most common methods include:
• Root-mean-square• Average response• Peak
10.2.2.1 Root-Mean-Square
The rms technique measures the effective power of the ac signal. It specifies the value of the dc equivalentthat would dissipate the same power if either were applied to a load resistor. This process is illustrated inFigure 10.6. The input signal is squared, and the average value is found. This is equivalent to finding theaverage power. The square root of this value is taken to transfer the signal from a power value back to avoltage. For the case of a sine wave, the rms value is 0.707 of its maximum value.
Assume that the signal is no longer a sine wave, but rather a sine wave and several harmonics. If therms amplitude of each harmonic is measured individually and added, the resulting value will be the same
© 2007 by Taylor & Francis Group, LLC

174
AC Power Systems Handbook
as an rms measurement on the signals together. Because rms voltages cannot be added directly, it is nec-essary to perform an rms addition. Each voltage is squared, and the squared values are added as follows:
(10.1)
Note that the result is not dependent on the phase relationship of the signal and its harmonics. Therms value is determined completely by the amplitude of the components. This mathematical predictabilityis useful in practical applications of level measurement, enabling measurements made at different placesin a system to be correlated. It is also important in correlating measurements with theoretical calculations.
10.2.2.2 Average-Response Measurement
The average-responding voltmeter measures ac voltage by rectifying it and filtering the resulting wave-form to its average value, as shown in Figure 10.7. This results in a dc voltage that can be read on a stan-dard dc voltmeter. As shown in the figure, the average value of a sine wave is 0.637 of its maximumamplitude. Average-responding meters are usually calibrated to read the same as an rms meter for thecase of a single sine wave signal. This results in the measurement being scaled by a constant
K
of 0.707/0.637, or 1.11. Meters of this type are called
average-responding
,
rms calibrated
. For signals other than sinewaves, the response will be different and hard to predict.
If multiple sine waves are applied, the reading will depend on the phase shift between the compo-nents and will no longer match the rms measurement. A comparison of rms and average-response mea-surements is made in Figure 10.8 for various waveforms. If the average readings are adjusted as describedpreviously to make the average and rms values equal for a sine wave, all the numbers in the
average
col-umn should be increased by 11.1%, whereas the
rms-average
numbers are reduced by 11.1%.
10.2.2.3 Peak-Response Measurement
Peak-responding meters measure the maximum value that the ac signal reaches as a function of time.This approach is illustrated in Figure 10.9. The signal is full-wave-rectified to find its absolute value andthen passed through a diode to a storage capacitor. When the absolute value of the voltage rises above the
Figure 10.6
Root-mean-square (rms) voltage measurements: (
a
) the relationship of rms and average values, (
b
) therms measurement circuit.
(a)
(b)
rms value
Signal (X)
x2
Average of x2
rms value = Úx2
x2 dc = rms valuexSignal input
Vrmstotal V2rms1 V2
rms2 V2rms3 … V2
rmsn+ + + +=
© 2007 by Taylor & Francis Group, LLC

Power Disturbance Characterization
175
value stored on the capacitor, the diode will conduct and increase the stored voltage. When the voltagedecreases, the capacitor will maintain the old value. Some means for discharging the capacitor is requiredto allow measuring a new peak value. In a true peak detector, this is accomplished by a solid-state switch.Practical peak detectors usually include a large value resistor to discharge the capacitor gradually after theuser has had a chance to read the meter.
The ratio of the true peak to the rms value is called the
crest factor
. For any signal but an ideal squarewave, the crest factor will be greater than 1, as demonstrated in Figure 10.10. As the measured signalbecome more peaked, the crest factor increases.
The
peak-equivalent sine
is another method of specifying waveform amplitude. This value is the rmslevel of a sine wave having the same peak-to-peak amplitude as the signal under consideration. This is thepeak value of the waveform scaled by the correction factor 1.414, corresponding to the peak-to-rms ratioof a sine wave. This technique is useful when specifying test levels of waveforms in distortion measure-ment.
Figure 10.7
Average voltage measurements: (
a
) illustration of average detection, (
b
) average measurement circuit.
Figure 10.8
Comparison of rms and average voltage characteristics.
(a)
Absolutevalue
Signal
Average
(b)
DC = average valueSignal input
Average = K Ú signalK = 0.637/0.707
Precisionrectifier
Sine wave
Square wave
Triangular wave or sawtooth wave
Waveform rms Average rms average Crest factor
0.707 Vm
Vm 2
Vm
3 Vm
0.637 Vm
Vm
Vm 2
2 Vm ππ
2 2 = 1.111
1
2 = 1.155 3
2 = 1.414
1
3 = 1.732
Vm
Vm
Vm
© 2007 by Taylor & Francis Group, LLC

176
AC Power Systems Handbook
10.2.2.4 Meter Accuracy
Accuracy is a measure of how well an instrument quantifies a signal at a midband frequency. This sets abasic limit on the performance of the meter in establishing the absolute amplitude of a waveform. It alsois important to look at the flatness specification to see how well this performance is maintained withchanges in frequency. Flatness describes how well the measurements at any other frequency track those atthe reference.
Meters often have a specification on accuracy that changes with voltage range, being most accurateonly in the range in which the instrument was calibrated. A meter with 1% accuracy on the 2 V range and1% accuracy per step would be 3% accurate on the 200 V scale. In many instruments, an additional accu-racy derating is given for readings as a% age of full scale, making readings at less than full scale less accu-rate.
Figure 10.9
Peak voltage measurements: (
a
) illustration of peak detection, (
b
) peak measurement circuit.
Figure 10.10
The crest factor of ac waveforms.
(a)
Absolutevalue
Signal
Peak
(b)
dc = peak valueSignal input
Peak = max signal
Precisionrectifier
Reset switch
Peak value
rms value
CF = Peak valuerms value ≥ 1
© 2007 by Taylor & Francis Group, LLC

Power Disturbance Characterization
177
10.2.3 Digital Measurement Instruments
Power quality monitors are sophisticated instruments that can not only identify ac power problems, butalso provide the following useful supplementary data, including:
• Ambient temperature• Relative humidity• Presence of radio frequency interference (RFI)• Sample voltage monitoring for ac and dc test points• Harmonic distortion content of the ac input signal
Digital technology offers a number of significant advantages beyond the capabilities of analoginstruments. Digital ac line monitors can store in memory the signal being observed, permitting in-depthanalysis impossible with previous technologies. Because the waveform resides in memory, the dataassociated with the waveform can be transferred to a remote computer for real-time processing, or forprocessing at a later time.
The
digital storage oscilloscope
(DSO) is the forerunner of most digital ac line monitors. DSO tech-nology forms the basis for most monitoring instruments. Figure 10.11 shows a block diagram of a DSO.Instead of being amplified and applied directly to the deflection plates of a cathode ray tube (CRT), thewaveform first is converted into a digital representation and stored in memory. To reproduce the wave-form on the CRT, the data is sequentially read and converted back into an analog signal for display.
The analog-to-digital (A/D) converter transforms the input analog signal into a sequence of digitalbits. The amplitude of the analog signal, which varies continuously in time, is sampled at preset intervals.The analog value of the signal at each sample point is converted into a binary number. This
quantization
process is illustrated in Figure 10.12. The sample rate of a digital oscilloscope must be greater than twotimes the highest frequency to be measured. The higher the sampling rate relative to the input signal, thegreater the measurement accuracy. A sample rate ten times the input signal is sufficient for most applica-tions. This rule of thumb applies for single-shot signals, or signals that are changing constantly. The sam-ple rate also can be expressed as the
sampling interval
, or the period of time between samples. The sampleinterval is the inverse of the sampling frequency.
Figure 10.11
Simplified block diagram of a digital storage oscilloscope.
Figure 10.12
Illustration of the quantization process.
A/Dconverter
Digitalmemory
D/Aconverter
CRTAmp
Inputsignal
Time (continuous) analog signal
Sign
al a
mpl
itude
(con
tinuo
us)
8
0 8
Sign
al a
mpl
itude
(disp
ersiv
e)
Time (dispersive) digital signal
8
7
6
5
4
3
3 4 5 6 7 8
2
2
1
10
© 2007 by Taylor & Francis Group, LLC

178
AC Power Systems Handbook
10.2.4 Digital Monitor Features
Advanced components and construction techniques have led to lower costs for digital instruments as wellas higher performance. Digital monitors can capture and analyze transient signals from any number ofsources. Automated features reduce testing and troubleshooting costs through the use of recallableinstrument setups, direct parameter readout, and unattended monitoring. Digital monitors offer the fol-lowing features:
• High resolution (determined by the quality of the analog-to-digital converter).• Memory storage of digitized waveforms.• Automatic setup for repetitive signal analysis. For complex multichannel configurations that are
used often, front-panel storage/recall can save dozens of manual selections and adjustments. Whenmultiple memory locations are available, multiple front-panel setups can be stored to save evenmore time.
• Auto-ranging. Many instruments will adjust automatically for optimum sweep, input sensitivity,and triggering. The instrument’s microprocessor automatically configures the front panel foroptimum display. Such features permit the operator to concentrate on making measurements,rather than adjusting the instrument.
• Instant hardcopy output from printers and plotters.• Remote programmability via GPIB or dial-up modem (including the Internet) for automated test
applications.• Trigger flexibility. Single-shot digitizing monitors capture transient signals and allow the user to
view the waveform that preceded the trigger point. Figure 10.13 illustrates the use of pre-/post-trigger for waveform analysis.
• Signal analysis. Intelligent systems can make key measurements and comparisons. Display capa-bilities include voltage peak, mean voltage, rms value, rise time, fall time, and frequency.
Digital memory storage offers a number of additional benefits, including:
• Reference memory. A previously acquired waveform can be stored in memory and compared witha sampled waveform. This feature is especially useful for identifying the source of a transientdisturbance. Because certain transients have a characteristic “signature” waveform, it is possibleto identify the source of a transient by examining an image of the disturbance on a CRT or suitabledevice. Nonvolatile battery-backed memory permits reference waveforms to be transported to fieldsites.
• Simple data transfers to a host computer for analysis or archive.• Local data analysis through the use of a built-in microprocessor.• Cursors capable of providing a readout of delta and absolute voltage and time.• Full bandwidth capture of long-duration waveforms, thus permitting storage of all the signal
details. The waveform can be expanded after capture to expose the details of a particular section.
Figure 10.13
The use of a pre-/posttrigger function for waveform analysis.
Trace point
All captureddata after
trace point
1/2 aftertrace point
Trace point
1/2 ofdata beforetrace point
Trace point
All captureddata beforetrace point
© 2007 by Taylor & Francis Group, LLC
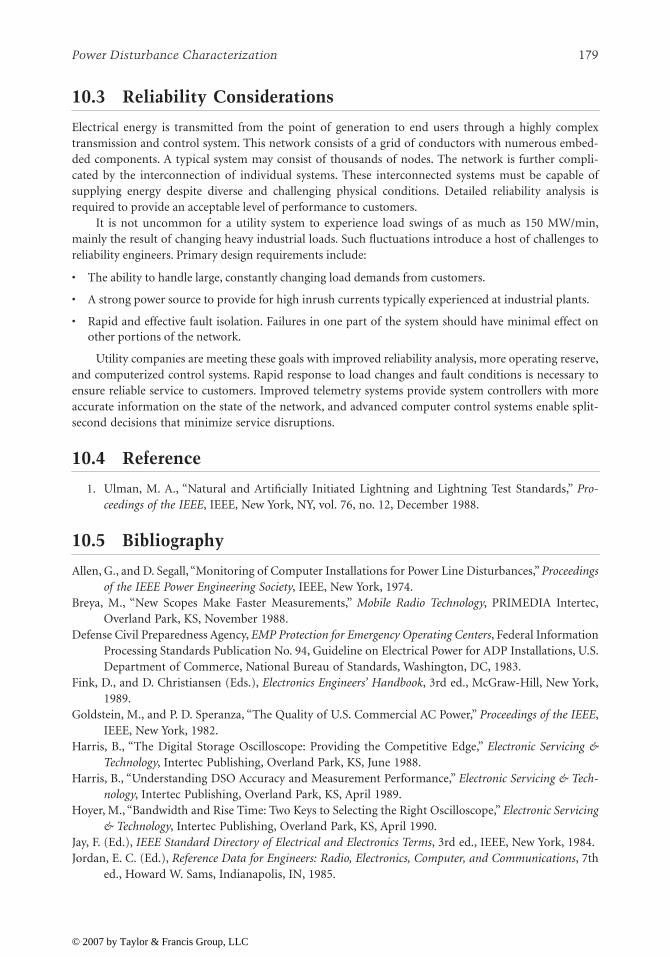
Power Disturbance Characterization
179
10.3 Reliability Considerations
Electrical energy is transmitted from the point of generation to end users through a highly complextransmission and control system. This network consists of a grid of conductors with numerous embed-ded components. A typical system may consist of thousands of nodes. The network is further compli-cated by the interconnection of individual systems. These interconnected systems must be capable ofsupplying energy despite diverse and challenging physical conditions. Detailed reliability analysis isrequired to provide an acceptable level of performance to customers.
It is not uncommon for a utility system to experience load swings of as much as 150 MW/min,mainly the result of changing heavy industrial loads. Such fluctuations introduce a host of challenges toreliability engineers. Primary design requirements include:
• The ability to handle large, constantly changing load demands from customers.
• A strong power source to provide for high inrush currents typically experienced at industrial plants.
• Rapid and effective fault isolation. Failures in one part of the system should have minimal effect onother portions of the network.
Utility companies are meeting these goals with improved reliability analysis, more operating reserve,and computerized control systems. Rapid response to load changes and fault conditions is necessary toensure reliable service to customers. Improved telemetry systems provide system controllers with moreaccurate information on the state of the network, and advanced computer control systems enable split-second decisions that minimize service disruptions.
10.4 Reference
1. Ulman, M. A., “Natural and Artificially Initiated Lightning and Lightning Test Standards,”
Pro-ceedings of the IEEE
, IEEE, New York, NY, vol. 76, no. 12, December 1988.
10.5 Bibliography
Allen, G., and D. Segall, “Monitoring of Computer Installations for Power Line Disturbances,”
Proceedingsof the IEEE Power Engineering Society
, IEEE, New York, 1974.Breya, M., “New Scopes Make Faster Measurements,”
Mobile Radio Technology
, PRIMEDIA Intertec,Overland Park, KS, November 1988.
Defense Civil Preparedness Agency,
EMP Protection for Emergency Operating Centers
, Federal InformationProcessing Standards Publication No. 94, Guideline on Electrical Power for ADP Installations, U.S.Department of Commerce, National Bureau of Standards, Washington, DC, 1983.
Fink, D., and D. Christiansen (Eds.),
Electronics Engineers’ Handbook
, 3rd ed., McGraw-Hill, New York,1989.
Goldstein, M., and P. D. Speranza, “The Quality of U.S. Commercial AC Power,”
Proceedings of the IEEE
,IEEE, New York, 1982.
Harris, B., “The Digital Storage Oscilloscope: Providing the Competitive Edge,”
Electronic Servicing &Technology
, Intertec Publishing, Overland Park, KS, June 1988.Harris, B., “Understanding DSO Accuracy and Measurement Performance,”
Electronic Servicing & Tech-nology
, Intertec Publishing, Overland Park, KS, April 1989.Hoyer, M., “Bandwidth and Rise Time: Two Keys to Selecting the Right Oscilloscope,”
Electronic Servicing& Technology
, Intertec Publishing, Overland Park, KS, April 1990.Jay, F. (Ed.),
IEEE Standard Directory of Electrical and Electronics Terms
, 3rd ed., IEEE, New York, 1984.Jordan, E. C. (Ed.),
Reference Data for Engineers: Radio, Electronics, Computer, and Communications
, 7thed., Howard W. Sams, Indianapolis, IN, 1985.
© 2007 by Taylor & Francis Group, LLC

180
AC Power Systems Handbook
Key, Lt. T., “The Effects of Power Disturbances on Computer Operation,” IEEE Industrial and CommercialPower Systems Conference paper, Cincinnati, OH, June 7, 1978.
Martzloff, F. D., “The Development of a Guide on Surge Voltages in Low-Voltage AC Power Circuits,”14
th
Electrical/Electronics Insulation Conference, IEEE, Boston, MA, October 1979.Montgomery, S., “Advances in Digital Oscilloscopes,”
Broadcast Engineering
, PRIMEDIA Intertec, Over-land Park, KS, November 1989.
© 2007 by Taylor & Francis Group, LLC

181
11
Power System Protection
Methods
11.1 Introduction
Utility companies make a good-faith attempt to deliver clean, well-regulated power to their customers. Mostdisturbances on the ac line are beyond the control of the utility company. Large load changes imposed bycustomers on a random basis, PF correction switching, lightning, and accident-related system faults all com-bine to produce an environment in which tight control over ac power quality is difficult to maintain. There-fore, the responsibility for ensuring ac power quality must rest with the users of sensitive equipment.
The selection of a protection method for a given facility is as much an economic question as it is a tech-nical one. A wide range of power-line conditioning and isolation equipment is available. A logical decisionabout how to proceed can be made only with accurate, documented data on the types of disturbances typi-cally found on the ac power service to the facility. The protection equipment chosen must be matched to theproblems that exist on the line. Using inexpensive basic protectors may not be much better than operatingdirectly from the ac line. Conversely, the use of a sophisticated protector designed to shield the plant fromevery conceivable power disturbance may not be economically justifiable.
Purchasing transient-suppression equipment is only one element in the selection equation. Considerthe costs associated with site preparation, installation, and maintenance. Also consider the operating effi-ciency of the system. Protection units that are placed in series with the load consume a certain amount ofpower and, therefore, generate heat. These considerations may not be significant, but they should be takeninto account. Prepare a complete life-cycle cost analysis of the protection methods proposed. The study mayreveal that the long-term operating expense of one system outweighs the lower purchase price of another.
The amount of money a facility manager is willing to spend on protection from utility company distur-bances generally depends on the engineering budget and how much the plant has to lose. Spending $250,000on systemwide protection for a highly computerized manufacturing center is easily justified. At smalleroperations, justification may not be so easy.
11.2 The Key Tolerance Envelope
The susceptibility of electronic equipment to failure because of disturbances on the ac power line has beenstudied by many organizations. The benchmark study was conducted by the Naval Facilities Engineering Com-mand (Washington, DC). The far-reaching program, directed from 1968 to 1978 by Lt. Thomas Key, identifiedthree distinct categories of recurring disturbances on utility company power systems. As shown in Table 11.1, itis not the magnitude of the voltage, but the duration of the disturbance that determines the classification.
In the study, Key found that most data processing (DP) equipment failure caused by ac line distur-bances occurred during bad weather, as shown in Table 11.2. According to a report on the findings, the inci-dence of thunderstorms in an area can be used to predict the number of failures. The type of power-transmission system used by the utility company also was found to affect the number of disturbancesobserved on power company lines (Table 11.3). For example, an analysis of utility system problems in Wash-ington, DC , Norfolk, VA, and Charleston, SC, demonstrated that underground power-distribution systemsexperienced one-third fewer failures than overhead lines in the same areas. Based on his research, Key devel-oped the “recommended voltage tolerance envelope” shown in Figure 11.1. The design goals illustrated arerecommendations to computer manufacturers for implementation in new equipment.
© 2007 by Taylor & Francis Group, LLC
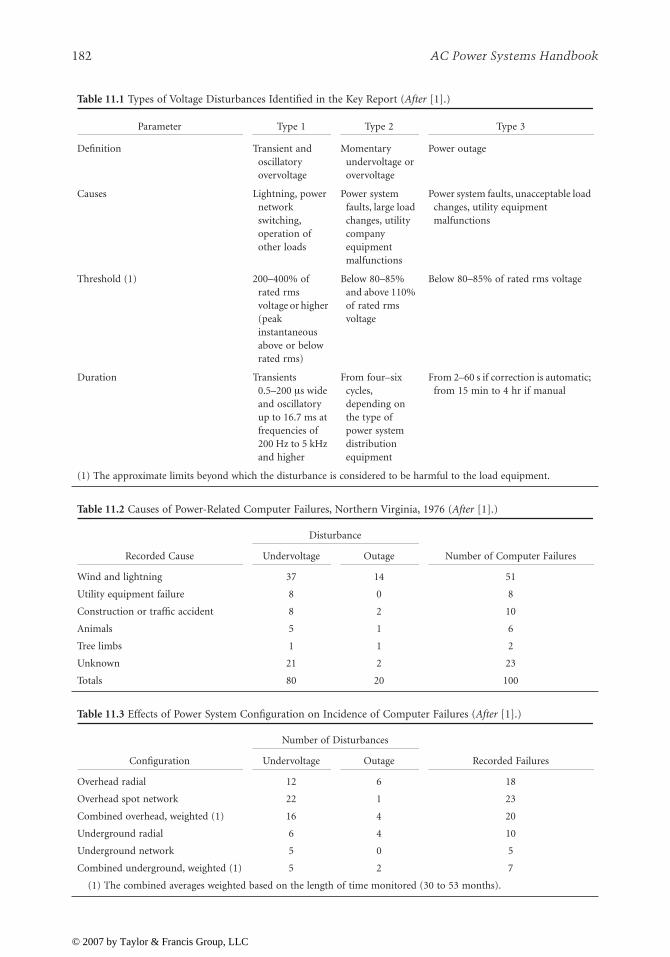
182
AC Power Systems Handbook
Table 11.1
Types of Voltage Disturbances Identified in the Key Report (
After
[1].)
Parameter
Type 1
Type 2
Type 3
Definition Transient and oscillatory overvoltage
Momentary undervoltage or overvoltage
Power outage
Causes Lightning, power network switching, operation of other loads
Power system faults, large load changes, utility company equipment malfunctions
Power system faults, unacceptable load changes, utility equipment malfunctions
Threshold (1) 200–400% of rated rms voltage or higher (peak instantaneous above or below rated rms)
Below 80–85% and above 110% of rated rms voltage
Below 80–85% of rated rms voltage
Duration Transients 0.5–200
μ
s wide and oscillatory up to 16.7 ms at frequencies of 200 Hz to 5 kHz and higher
From four–six cycles, depending on the type of power system distribution equipment
From 2–60 s if correction is automatic; from 15 min to 4 hr if manual
(1) The approximate limits beyond which the disturbance is considered to be harmful to the load equipment.
Table 11.2
Causes of Power-Related Computer Failures, Northern Virginia, 1976 (
After
[1].)
Recorded Cause
Disturbance
Number of Computer Failures
Undervoltage
Outage
Wind and lightning 37 14 51
Utility equipment failure 8 0 8
Construction or traffic accident 8 2 10
Animals 5 1 6
Tree limbs 1 1 2
Unknown 21 2 23
Totals 80 20 100
Table 11.3
Effects of Power System Configuration on Incidence of Computer Failures (
After
[1].)
Configuration
Number of Disturbances
Recorded Failures
Undervoltage
Outage
Overhead radial 12 6 18
Overhead spot network 22 1 23
Combined overhead, weighted (1) 16 4 20
Underground radial 6 4 10
Underground network 5 0 5
Combined underground, weighted (1) 5 2 7
(1) The combined averages weighted based on the length of time monitored (30 to 53 months).
© 2007 by Taylor & Francis Group, LLC

Power System Protection Methods
183
11.3 Assessing the Lightning Hazard
As identified by Key in his Naval Facilities study, the extent of lightning activity in an area significantlyaffects the probability of equipment failure caused by transient activity. The threat of a lightning flash toa facility is determined, in large part, by the type of installation and its geographic location. The type andcharacter of the lightning flash are also important factors.
The
Keraunic number
of a geographic location describes the likelihood of lightning activity in thatarea. Figure 11.2 shows the
Isokeraunic map
of the U.S., which estimates the number of lightning days peryear across the country. On average, 30 storm days occur per year across the continental U.S. This num-ber does not fully describe the lightning threat because many individual lightning flashes occur during asingle storm.
The structure of a facility has a significant effect on the exposure of equipment to potential lightningdamage. Higher structures tend to collect and even trigger localized lightning flashes. Because stormclouds tend to travel at specific heights above the earth, conductive structures in mountainous areas morereadily attract lightning activity. The
plant exposure factor
is a function of the size of the facility and theIsokeraunic rating of the area. The larger the physical size of an installation, the more likely it is to be hitby lightning during a storm. The longer a transmission line (ac or RF), the more lightning flashes it islikely to receive.
The relative frequency of power problems is seasonal in nature. As shown in Figure 11.3, most prob-lems are noted during June, July, and August. These high problem rates can be traced primarily toincreased thunderstorm activity.
Figure 11.1
The recommended voltage tolerance envelope for computer equipment. This chart is based on pioneeringwork done by the Naval Facilities Engineering Command. The study identified how the magnitude
and
duration ofa transient pulse must be considered in determining the damaging potential of a spike. The design goals illustratedin the chart are recommendations to computer manufacturers for implementation in new equipment. (
After
[1].)
Type 1 disturbances
Type 1susceptibility
area
+200%
+100%
+30%
−30%−42%
−70%
−13%
+6%
Steady-statelimits
Rated voltage
Type 2 disturbances Type 3 disturbances
Computer undervoltage“Ride through” limit
Time0.0.1
100 µ 1 M 8.33 M 0.1 0.5 2 (seconds)
0.1 0.5 1.0 10 100 1000 (cycles)
Computer voltagetolerance envelope
Computerover-
voltagewithstand
limit
Volta
ge (%
ove
r or u
nder
rate
d RM
S)
Type 2susceptibility
area
© 2007 by Taylor & Francis Group, LLC

184
AC Power Systems Handbook
11.4 FIPS Publication 94
In 1983, the U.S. Department of Commerce published a guideline summarizing the fundamentals ofpowering, grounding, and protecting sensitive electronic devices [2]. The document, known as FederalInformation Processing Standards (FIPS) Publication Number 94, was first reviewed by governmentalagencies and then was sent to the Computer Business Equipment Manufacturers Association (CBEMA)for review. When the CBEMA group put its stamp of approval on the document, the data processingindustry finally had an overarching guideline for power quality.
FIPS Pub. 94 was written to cover
automatic data processing
(ADP) equipment, which at that timeconstituted the principal equipment that was experiencing difficulty running on normal utility-suppliedpower. Since then, IEEE standard P1100 was issued, which applies to all sensitive electronic equipment.FIPS Pub. 94 is a guideline intended to provide a cost/benefit course of action. As a result, it can be relied
Figure 11.2
The Isokeraunic map of the U.S., showing the approximate number of lightning days per year.
Figure 11.3
The relative frequency of power problems in the U.S., classified by month.
50
5 1020 30
4050 60 70 80
90
60
5040
30
60
70
Jan Feb March April May June July Aug Sept Oct Nov Dec
© 2007 by Taylor & Francis Group, LLC

Power System Protection Methods
185
upon to give the best solution to typical problems that will be encountered, for the least amount ofmoney.
In addition to approving the FIPS Pub. 94 document, the CBEMA group provided a curve that hadbeen used as a guideline for their members in designing power supplies for modern electronic equip-ment. The CBEMA curve from the FIPS document is shown in Figure 11.4. Note the similarity to the Keytolerance envelope shown in Figure 11.1.
The curve is a susceptibility profile. In order to better explain its meaning, the curve has been simpli-fied and redrawn in Figure 11.5. The vertical axis of the graph is the percentage of voltage that is appliedto the power circuit, and the horizontal axis is the time factor involved (in
μ
s to s). In the center of thechart is the acceptable operating area, and on the outside of that area is a danger area on top and bottom.The danger zone at the top is a function of the tolerance of equipment to excessive voltage levels. Thedanger zone on the bottom sets the tolerance of equipment to a loss or reduction in applied power. TheCBEMA guideline states that if the voltage supply stays within the acceptable area given by the curve, thesensitive load equipment will operate as intended.
11.5 Protection Alternatives
A facility can be protected from ac line disturbances in two basic ways: the
systems
approach or the
dis-crete device
approach. Table 11.4 outlines the major alternatives available:
• Uninterruptible power system (UPS) and standby generator• UPS stand-alone system• Secondary ac spot network• Secondary selective ac network• Motor-generator (m-g) set
Figure 11.4
The CBEMA curve from FIPS Pub. 94. (
From
[2].
Used with permission
.)
Short duration impulsesare most frequentlymeasured as maximumvolts deviation from thepower frequency sinewave, or as peak-to-peakvolts measured througha high-pass filter or acoupling capacitor. It issometimes expressed inpercent of nominal peakor peak-to-peak voltage
Noise and voltage breakdown problems
Volta
ge (%
of r
ated
)
0%0.001 0.01
100 µs 1 ms
Duration in cycles at 60 Hz and in seconds
8.33ms
0.1 5 1.00.1 0.5 2
10 100 1000 Cyclesseconds
100%Tolerance envelope
Computer voltage
300%
200%
130%Lack of stored energy in some
manufacturer’s equipment
Energy flowrelated problems
Voltage breakdown concern area
RMS voltage measurements ofvoltage envelope are appropriate
for 1/2 cycle or longer
Peak voltage and volt seconds expressed inpercent of nominal or of slow average value are
appropriate for less than 1/2 cycle
106%
87%70%58%
30%
© 2007 by Taylor & Francis Group, LLC
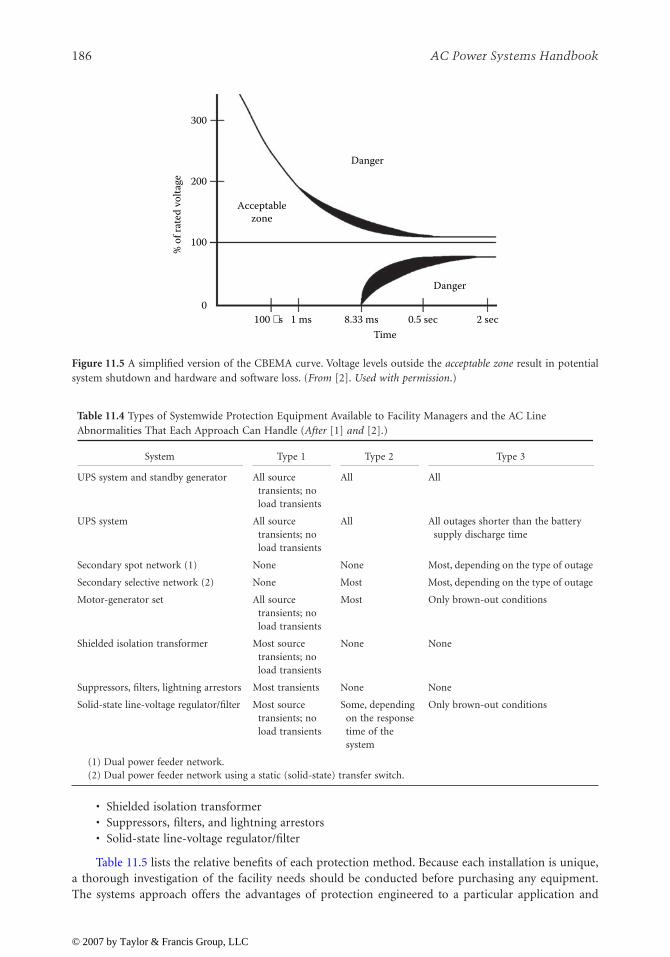
186
AC Power Systems Handbook
• Shielded isolation transformer• Suppressors, filters, and lightning arrestors• Solid-state line-voltage regulator/filter
Table 11.5 lists the relative benefits of each protection method. Because each installation is unique,a thorough investigation of the facility needs should be conducted before purchasing any equipment.The systems approach offers the advantages of protection engineered to a particular application and
Figure 11.5
A simplified version of the CBEMA curve. Voltage levels outside the
acceptable zone
result in potentialsystem shutdown and hardware and software loss. (
From
[2].
Used with permission
.)
Table 11.4
Types of Systemwide Protection Equipment Available to Facility Managers and the AC Line
Abnormalities That Each Approach Can Handle (
After
[1]
and
[2].)
System
Type 1
Type 2
Type 3
UPS system and standby generator All source transients; no load transients
All All
UPS system All source transients; no load transients
All All outages shorter than the battery supply discharge time
Secondary spot network (1) None None Most, depending on the type of outage
Secondary selective network (2) None Most Most, depending on the type of outage
Motor-generator set All source transients; no load transients
Most Only brown-out conditions
Shielded isolation transformer Most source transients; no load transients
None None
Suppressors, filters, lightning arrestors Most transients None None
Solid-state line-voltage regulator/filter Most source transients; no load transients
Some, depending on the response time of the system
Only brown-out conditions
(1) Dual power feeder network.(2) Dual power feeder network using a static (solid-state) transfer switch.
% o
f rat
ed v
olta
ge
300
200
100
0
Acceptablezone
Time100 µs 1 ms 0.5 sec 2 sec8.33 ms
Danger
Danger
© 2007 by Taylor & Francis Group, LLC

Power System Protection Methods
187
need, and (usually) high-level factory support during equipment design and installation. The systemsapproach also means higher costs for the end user.
11.5.1 Specifying System-Protection Hardware
Developing specifications for systemwide power-conditioning/backup hardware requires careful analysisof various factors before a particular technology or a specific vendor is selected. Key factors in this pro-cess relate to the load hardware and load application. The electrical power required by a sensitive loadmay vary widely, depending on the configuration of the system. The principle factors that apply to systemspecification include the following:
• Power requirements, including voltage, current, power factor, harmonic content, and transformerconfiguration
• Voltage-regulation requirements of the load• Frequency stability required by the load, and the maximum permissible
slew rate
(the rate ofchange of frequency per second)
• Effects of unbalanced loading• Overload and inrush current capacity• Bypass capability• Primary/standby path transfer time• Maximum standby power reserve time• System reliability and maintainability• Operating efficiency
An accurate definition of
critical applications
will aid in the specification process for a given site.The potential for future expansion also must be considered in all plans.
Power requirements can be determined either by measuring the actual installed hardware or bychecking the nameplate ratings. Most nameplate ratings include significant safety margins. Moreover, theload normally will include a
diversity factor
; all individual elements of the load will not necessarily beoperating at the same time.
Every load has a limited tolerance to noise and harmonic distortion. Total harmonic distortion(THD) is a measure of the quality of the waveform applied to the load. It is calculated by taking the geo-metric sum of the harmonic voltages present in the waveform and expressing that value as a percentage ofthe fundamental voltage. Critical DP loads typically can withstand 5% THD, where no single harmonicexceeds 3%. The power-conditioning system must provide this high-quality output waveform to theload, regardless of the level of noise or distortion present at the ac input terminals.
If a power-conditioning/standby system does not operate with high reliability, the results often canbe disastrous. In addition to threats to health and safety, there is a danger of lost revenue or inventory,and hardware damage. Reliability must be considered from three different viewpoints:
• Reliability of utility ac power in the area.• Impact of line-voltage disturbances on DP loads.• Ability of the protection system to maintain reliable operation when subjected to expected and
unexpected external disturbances.
The environment in which the power-conditioning system operates will have a significant effect on reli-ability. Extremes of temperature, altitude, humidity, and vibration can be encountered in various appli-cations. Extreme conditions can precipitate premature component failure and unexpected systemshutdown. Most power-protection equipment is rated for operation from 0 to 40°C. During a commer-cial power failure, however, the ambient temperature of the equipment room can easily exceed eithervalue, depending on the exterior temperature. Operating temperature derating typically is required foraltitudes in excess of 1000 ft.
© 2007 by Taylor & Francis Group, LLC
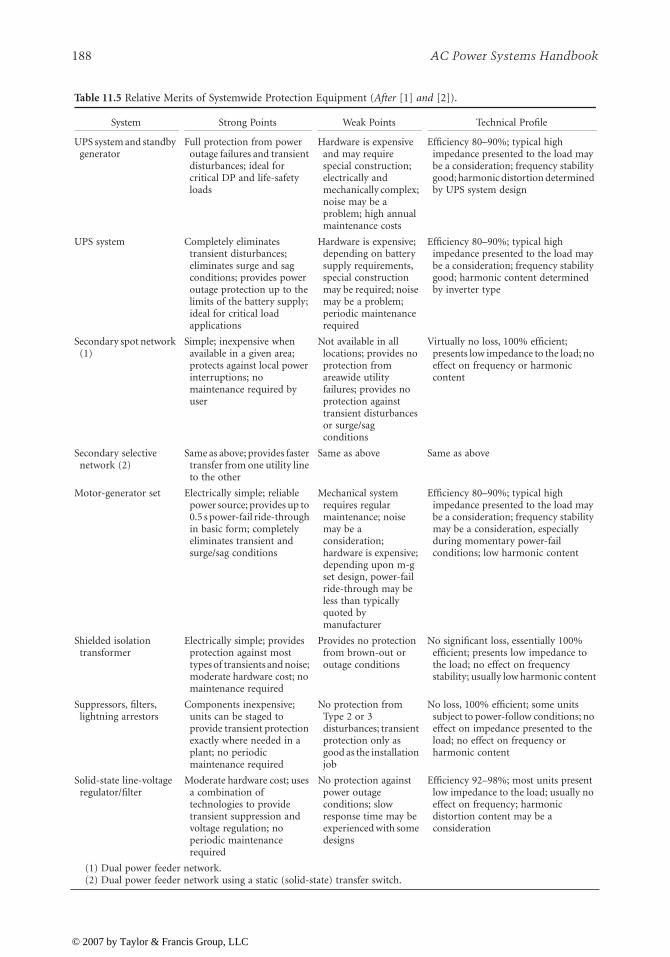
188
AC Power Systems Handbook
Table 11.5
Relative Merits of Systemwide Protection Equipment (
After
[1]
and
[2]).
System
Strong Points
Weak Points
Technical Profile
UPS system and standby generator
Full protection from power outage failures and transient disturbances; ideal for critical DP and life-safety loads
Hardware is expensive and may require special construction; electrically and mechanically complex; noise may be a problem; high annual maintenance costs
Efficiency 80–90%; typical high impedance presented to the load may be a consideration; frequency stability good; harmonic distortion determined by UPS system design
UPS system Completely eliminates transient disturbances; eliminates surge and sag conditions; provides power outage protection up to the limits of the battery supply; ideal for critical load applications
Hardware is expensive; depending on battery supply requirements, special construction may be required; noise may be a problem; periodic maintenance required
Efficiency 80–90%; typical high impedance presented to the load may be a consideration; frequency stability good; harmonic content determined by inverter type
Secondary spot network (1)
Simple; inexpensive when available in a given area; protects against local power interruptions; no maintenance required by user
Not available in all locations; provides no protection from areawide utility failures; provides no protection against transient disturbances or surge/sag conditions
Virtually no loss, 100% efficient; presents low impedance to the load; no effect on frequency or harmonic content
Secondary selective network (2)
Same as above; provides faster transfer from one utility line to the other
Same as above Same as above
Motor-generator set Electrically simple; reliable power source; provides up to 0.5 s power-fail ride-through in basic form; completely eliminates transient and surge/sag conditions
Mechanical system requires regular maintenance; noise may be a consideration; hardware is expensive; depending upon m-g set design, power-fail ride-through may be less than typically quoted by manufacturer
Efficiency 80–90%; typical high impedance presented to the load may be a consideration; frequency stability may be a consideration, especially during momentary power-fail conditions; low harmonic content
Shielded isolation transformer
Electrically simple; provides protection against most types of transients and noise; moderate hardware cost; no maintenance required
Provides no protection from brown-out or outage conditions
No significant loss, essentially 100% efficient; presents low impedance to the load; no effect on frequency stability; usually low harmonic content
Suppressors, filters, lightning arrestors
Components inexpensive; units can be staged to provide transient protection exactly where needed in a plant; no periodic maintenance required
No protection from Type 2 or 3 disturbances; transient protection only as good as the installation job
No loss, 100% efficient; some units subject to power-follow conditions; no effect on impedance presented to the load; no effect on frequency or harmonic content
Solid-state line-voltage regulator/filter
Moderate hardware cost; uses a combination of technologies to provide transient suppression and voltage regulation; no periodic maintenance required
No protection against power outage conditions; slow response time may be experienced with some designs
Efficiency 92–98%; most units present low impedance to the load; usually no effect on frequency; harmonic distortion content may be a consideration
(1) Dual power feeder network.(2) Dual power feeder network using a static (solid-state) transfer switch.
© 2007 by Taylor & Francis Group, LLC

Table 11.6 lists key power-quality attributes that should be considered when assessing the need forpower-conditioning hardware.
11.6 References
1. Key, Lt. Thomas: “The Effects of Power Disturbances on Computer Operation,” IEEE Industrial andCommercial Power Systems Conference, Cincinnati, OH, June 7, 1978.
2. Federal Information Processing Standards Publication No. 94,
Guideline on Electrical Power for ADPInstallations
, U.S. Department of Commerce, National Bureau of Standards, Washington, DC, 1983.
11.7 Bibliography
Lawrie, R.,
Electrical Systems for Computer Installations
, McGraw-Hill, New York, 1988.Martzloff, F. D., “The Development of a Guide on Surge Voltages in Low-Voltage AC Power Circuits,” 14th
Electrical/Electronics Insulation Conference, IEEE, Boston, MA, October 1979.Pettinger, W., “The Procedure of Power Conditioning,”
Microservice Management
, Intertec Publishing, Over-land Park, KS, March 1990.
Smeltzer, D., “Getting Organized about Power,”
Microservice Management
, Intertec Publishing, OverlandPark, KS, March 1990.
Table 11.6
Power-Quality Attributes for Data Processing Hardware (
After
[2].)
Environmental Attribute
Typical Environment
Acceptable Limits for DP Systems
Normal
Critical
Line frequency
±
0.1 to
±
3%
±
1%
±
0.3%
Rate of frequency change 0.5 to 20 Hz/s 1.5 Hz/s 0.3 Hz/s
Over- and under-voltage
±
5 to +6, –13.3% +5 to –10%
±
3%
Phase imbalance 2 to 10% 5% max 3% max
Tolerance to low power factor 0.85 to 0.6 lagging 0.8 lagging less than 0.6 lagging, or 0.9 leading
Tolerance to high steady-state peak current
1.3 to 1.6 peak, rms 1.0 to 2.5 peak, rms
Greater than 2.5 peak, rms
Harmonic voltages 0 to 20% total rms 10 to 20% total,5 to 10% largest
5% max total,3% largest
Voltage deviation from sine wave
5 to 50% 5 to 10% 3 to 5%
Voltage modulation Negligible to 10% 3% max 1% max
Surge/sag conditions +10, –15% +20, –30% +5, –5%
Transient impulses 2 to 3 times nominal peak value (0 to 130% Vs)
Varies; 1.0 to 1.5 kV typical
Varies; 200 to 500 V typical
RFI/EMI normal and common modes
10 V up to 20 kHz, less at high freq.
Varies widely; 3 V typical
Varies widely; 0.3 V typical
Ground currents 0 to 10 A plus impulse noise current
0.001 to 0.5 A or more
0.0035 A or less
© 2007 by Taylor & Francis Group, LLC
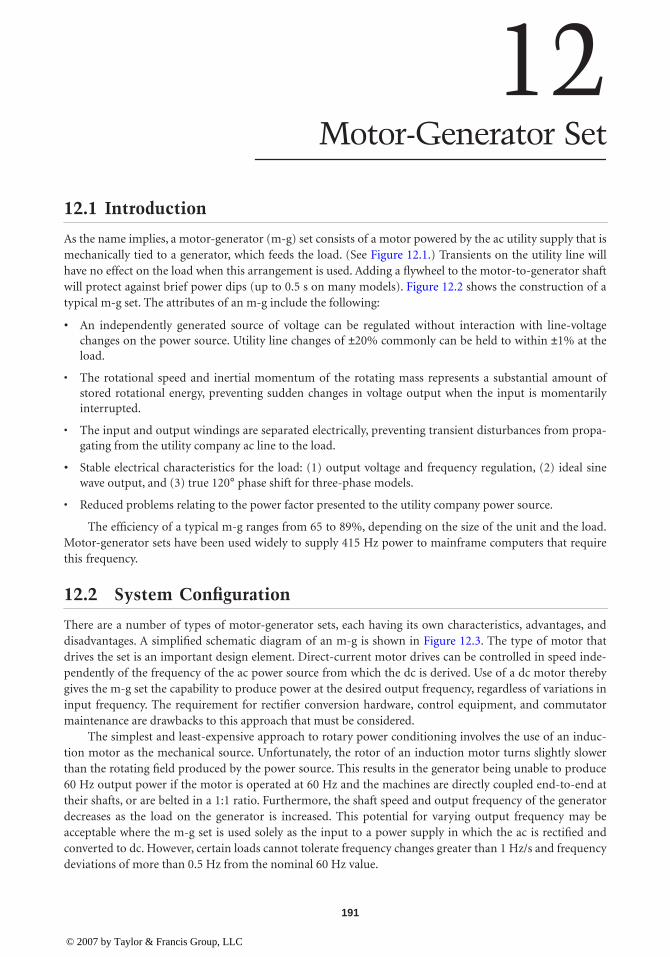
191
12
Motor-Generator Set
12.1 Introduction
As the name implies, a motor-generator (m-g) set consists of a motor powered by the ac utility supply that ismechanically tied to a generator, which feeds the load. (See Figure 12.1.) Transients on the utility line willhave no effect on the load when this arrangement is used. Adding a flywheel to the motor-to-generator shaftwill protect against brief power dips (up to 0.5 s on many models). Figure 12.2 shows the construction of atypical m-g set. The attributes of an m-g include the following:
•
An independently generated source of voltage can be regulated without interaction with line-voltagechanges on the power source. Utility line changes of
±
20% commonly can be held to within
±
1% at theload.
• The rotational speed and inertial momentum of the rotating mass represents a substantial amount ofstored rotational energy, preventing sudden changes in voltage output when the input is momentarilyinterrupted.
• The input and output windings are separated electrically, preventing transient disturbances from propa-gating from the utility company ac line to the load.
•
Stable electrical characteristics for the load: (1) output voltage and frequency regulation, (2) ideal sinewave output, and (3) true 120
°
phase shift for three-phase models.
• Reduced problems relating to the power factor presented to the utility company power source.
The efficiency of a typical m-g ranges from 65 to 89%, depending on the size of the unit and the load.Motor-generator sets have been used widely to supply 415 Hz power to mainframe computers that requirethis frequency.
12.2 System Configuration
There are a number of types of motor-generator sets, each having its own characteristics, advantages, anddisadvantages. A simplified schematic diagram of an m-g is shown in Figure 12.3. The type of motor thatdrives the set is an important design element. Direct-current motor drives can be controlled in speed inde-pendently of the frequency of the ac power source from which the dc is derived. Use of a dc motor therebygives the m-g set the capability to produce power at the desired output frequency, regardless of variations ininput frequency. The requirement for rectifier conversion hardware, control equipment, and commutatormaintenance are drawbacks to this approach that must be considered.
The simplest and least-expensive approach to rotary power conditioning involves the use of an induc-tion motor as the mechanical source. Unfortunately, the rotor of an induction motor turns slightly slowerthan the rotating field produced by the power source. This results in the generator being unable to produce60 Hz output power if the motor is operated at 60 Hz and the machines are directly coupled end-to-end attheir shafts, or are belted in a 1:1 ratio. Furthermore, the shaft speed and output frequency of the generatordecreases as the load on the generator is increased. This potential for varying output frequency may beacceptable where the m-g set is used solely as the input to a power supply in which the ac is rectified andconverted to dc. However, certain loads cannot tolerate frequency changes greater than 1 Hz/s and frequencydeviations of more than 0.5 Hz from the nominal 60 Hz value.
© 2007 by Taylor & Francis Group, LLC

192
AC Power Systems Handbook
Low-slip induction motor-drivengenerators are available that can produce59.7 Hz at full load, assuming 60 Hzinput. During power interruptions, theoutput frequency will drop further,depending upon the length of the inter-ruption. The capability of the inductionmotor to restart after a momentary powerinterruption is valuable. Various systemsof variable-speed belts have been triedsuccessfully. Magnetically controlled slip-ping clutches have been found to belargely unsatisfactory. Other approachesto make the induction motor drive theload at constant speed have producedmixed results.
Using a synchronous motor with direct coupling or a cogged 1:1 ratio belt drive guarantees that theoutput frequency will be equal to the motor input frequency. Although the synchronous motor is moreexpensive, it is more efficient and can be adjusted to provide a unity PF load to the ac source. The startingcharacteristics and the mechanical disturbance following a short line-voltage interruption depend, to alarge extent, on motor design. Many synchronous motors that are not required to start under load haveweak starting torque and may use a
pony motor
to aid in starting. This approach is shown in Figure 12.4.
Figure 12.1
Two-machine motor-generator set with an optional flywheel to increase inertia and carry-throughcapability.
Figure 12.3
Simplified schematic diagram of an m-g set with automatic and secondary bypass capability. (
After
[1].)
Flywheelfor increased
inertia
Alternator
Synchronous motor
Figure 12.2 Construction of a typical m-g set. (Courtesy of Com-puter Power Protection.)
480 V
Startersynchronizer
Secondary bypass
Automatic bypass
Motor AC generator
480 V
Automaticbypassswitch
BPS
480 V
To DP load
Voltageregulator
exciter
© 2007 by Taylor & Francis Group, LLC

Motor-Generator Set
193
Those motors designed to start with a load have starting pole face windings that provide starting torquecomparable to that of an induction motor. Such motors can be brought into synchronism while underload with proper selection of the motor and automatic starter system. Typical utility company ac inter-ruptions are a minimum of six cycles (0.1 s). Depending upon the design and size of the flywheel used,the ride-through period can be as much as 0.5 s or more. The generator will continue to produce outputpower for a longer duration, but the frequency and rate of frequency change will most likely fall outsideof the acceptable range of most DP loads after 0.5 s.
If input power is interrupted and does not return before the output voltage and frequency begin tofall outside acceptable limits, the generator output controller can be programmed to disconnect the load.Before this event, a warning signal is sent to the DP control circuitry to warn of impending shutdown andto initiate an orderly interruption of active computer programs. This facilitates easy restart of the com-puter after the power interruption has passed.
It is important for users to accurately estimate the length of time that the m-g set will continue todeliver acceptable power without input to the motor from the utility company. This data facilitates accu-rate power-fail shutdown routines. It is also important to ensure that the m-g system can handle thereturn of power without operating overcurrent protection devices because of high inrush currents thatmay be required to accelerate and synchronize the motor with the line frequency. Protection against thelatter problem requires proper programming of the synchronous motor controller to correctly discon-nect and then reconnect the field current supply. It may be worthwhile to delay an impending shutdownfor 100 ms or so. This would give the computer time to prepare for the event through an orderly inter-ruption. It also would be useful if the computer were able to resume operation without shutdown, in caseutility power returns within the ride-through period. Control signals from the m-g controller should beconfigured to identify these conditions and events to the DP system.
Generators typically used in m-g sets have substantially higher internal impedance than equivalentkVA-rated transformers. Because of this situation, m-g sets sometimes are supplied with an oversizedgenerator that will be lightly loaded, coupled with a smaller motor that is adequate to drive the actualload. This approach reduces the initial cost of the system, decreases losses in the motor, and provides alower operating impedance for the load.
Motor-generator sets can be configured for either horizontal installation, as shown previously, or forvertical installation, as illustrated in Figure 12.5.
The most common utility supply voltage used to drive the input of an m-g set is 480 V. The genera-tor output for systems rated at about 75 kVA or less is typically 208 Y/120 V. For larger DP systems, themost economical generator output is typically 480 V. A 480 to 208 Y/120 V three-phase isolating trans-former usually is included to provide 208 Y/120 V power to the computer equipment.
12.2.1 Motor Design Considerations
Both synchronous and induction motors have been used successfully to drive m-g sets, and each hasadvantages and disadvantages. The major advantage of the synchronous motor is that while running
Figure 12.4
Use of a pony motor for an m-g set to aid in system starting and restarting. (
After
[1].)
Pony motor
Generator
Synchronousmotor
© 2007 by Taylor & Francis Group, LLC

194
AC Power Systems Handbook
normally, it is synchronized with the supply frequency. An 1800 rpm motor rotates at exactly 1800 rpmfor a supply frequency of exactly 60 Hz. The generator output, therefore, will be exactly 60 Hz. Utility fre-quencies
average
60 Hz; utilities vary the frequency slowly to maintain this average value under changingload conditions. Research has shown that utility operating frequencies typically vary from 58.7 to 60.7Hz. Although frequency tolerances permitted by most computer manufacturers are usually given as
±
0.5Hz on a nominal 60 Hz system, these utility variations are spread over a 24-hour period or longer andgenerally do not result in problems for the load.
The major disadvantage of a synchronous motor is that the device is difficult to start. A synchronousmotor must be started and brought up to
pull-in
speed by an auxiliary winding on the armature, knownas the
armortisseur
winding. The pull-in speed is the minimum speed (close to synchronous speed) atwhich the motor will pull into synchronization if excitation is applied to the field. The armortisseurwinding is usually a squirrel-cage design, although it may be of the wound-rotor type in some cases. Thiswinding allows the synchronous motor to start and come up to speed as an induction motor. When pull-in speed is achieved, automatic sensing equipment applies field excitation, and the motor locks in andruns as a synchronous machine. As discussed previously, some large synchronous motors are brought upto speed by an auxiliary pony motor.
The armortisseur winding can produce only limited torque, so synchronous motors usually arebrought up to speed without a load. This requirement presents no problem for DP systems upon initialstartup. However, in the event of a momentary power outage, problems can develop. When the utility acfails, the synchronous motor must be disconnected from the input immediately, or it will act as a genera-tor and feed power back into the line, thus rapidly depleting its stored (kinetic) rotational energy. Duringa power failure, the speed of the motor rapidly drops below the pull-in speed, and when the ac supplyreturns, the armortisseur winding must reaccelerate the motor under load until the field can be appliedagain. This requires a large winding and a sophisticated control system. When the speed of the m-g set isbelow synchronous operation, the generator output frequency may be too low for proper computer oper-ation.
The induction motor has no startup problems, but it does have
slip
. To produce torque, the rotormust rotate at slightly lower speed than the stator field. For a nominal 1800 rpm motor, the actual speedwill be about 1750 rpm, varying slightly with the load and the applied input voltage. This represents a slipof about 2.8%. The generator, if driven directly or on a common shaft, will have an output frequency ofabout 58.3 Hz. This is below the minimum permissible operating frequency for most computer hard-ware. Special precision-built low-slip induction motors are available with a slip of approximately 0.5% ata nominal motor voltage of 480 V. With 0.5% slip, speed at full load will be about 1791 rpm, and thedirectly driven or common-shaft generator will have an output frequency of 59.7 Hz. This frequency iswithin tolerance, but close to the minimum permissible frequency.
Figure 12.5
Vertical m-g set with an enclosed flywheel. (
After
[1].)
Separate motorand generator
in one enclosure
Flywheelin base
compartment
© 2007 by Taylor & Francis Group, LLC

Motor-Generator Set
195
A belt-and-pulley system adjustable-speed drive is a common solution to this problem. By makingthe pulley on the motor slightly larger in diameter than the pulley on the generator (with the actualdiameters adjustable) the generator can be driven at synchronous speed.
Voltage sags have no effect on the output frequency of a synchronous motor-driven m-g set until thevoltage gets so low that the torque is reduced to a point at which the machine pulls out of synchroniza-tion. Resynchronization then becomes a problem. On an induction motor, when the voltage sags, slipincreases and the machine slows down. The result is a drop in generator output frequency. The adjust-able-speed drive between an induction motor and the generator solves the problem for separatemachines. If severe voltage sags are anticipated at a site, the system can be set so that nominal input volt-age from the utility company produces a frequency of 60.5 Hz, 0.5 Hz on the high side of nominal fre-quency. Figure 12.6 charts frequency vs. motor voltage for three operating conditions:
• Slip compensation set high (curve A)• Slip compensation set for 60 Hz (curve B)• No slip compensation (curve C)
Through proper adjustment of slip compensation, considerable input-voltage margins can beachieved.
12.2.1.1 Single-Shaft Systems
There are two basic m-g set machine mechanical designs used for DP applications: (1) separate motor-generator systems, and (2) single-shaft, single-housing units. Both designs can use either a synchronousor induction motor. In each case, there are advantages and disadvantages. The separate machine design(discussed previously) uses a motor driving a physically separate generator by means of a coupling shaftor pulley. In an effort to improve efficiency and reduce costs, manufacturers also have produced varioustypes of single-shaft systems.
The basic concept of a single-shaft system is to combine the motor and generator elements into asingle unit. A common stator eliminates a number of individual components, making the machine lessexpensive to produce and mechanically more efficient. The common-stator set substantially reducesmechanical energy losses associated with traditional m-g designs, and it improves system reliability, aswell. In one design, the stator is constructed so that alternate slots are wound with input and output
Figure 12.6
Generator output frequency vs. motor input voltage for an induction-motor-based m-g set.
1816
1812
1808
1804
1800
1796
1792
1788
1784
1780
1820
Spee
d (r
pm)
A
B
C
Motor voltage
Minimum computer tolerance59.5
60
60.5
Freq
uenc
y (H
z)
Nominalvoltage
Maximum computer tolerance
520 510 500 490 480 470 460 450 440 430 420 410 400 390 380 370 360 350 340
© 2007 by Taylor & Francis Group, LLC

196
AC Power Systems Handbook
windings. When it is fed with a three-phase supply, a rotating magnetic field is created, causing the dc-excited rotor to spin at a synchronous speed. By controlling the electrical characteristics of the rotor, con-trol of the output at the secondary stator windings is accomplished.
Common-stator machines offer lower working impedance for the load than a comparable two-machine system. For example, a typical 400 kVA machine has approximately an 800 kVA frame size. Thelarger frame size yields a relatively low-impedance power source capable of clearing subcircuit fusesunder fault conditions. The output of the unit typically can supply up to seven times the full-load currentunder fault conditions. Despite the increase in frame size, the set is smaller and lighter than comparablesystems because of the reduced number of mechanical parts.
12.2.2 Flywheel Considerations
In an effort to achieve higher energy and power densities, m-g set designers have devoted considerableattention to the flywheel element itself. New composite materials and power electronics technologieshave resulted in compact flywheel “batteries” capable of high linear velocity at the outside radius of theflywheel (
tip speed
) [2]. The rotational speed of the flywheel is important because the stored energy in aflywheel is proportional to the square of its rotational speed. Therefore, an obvious method for maximiz-ing stored energy is to increase the speed of the flywheel. All practical designs, however, have a limitingspeed, which is determined by the stresses developed within the wheel resulting from inertial loads. Theseloads are also proportional to the square of rotational speed. Flywheels built of composite materialsweigh less and, hence, develop lower inertial loads at a given speed. In addition, composites are oftenstronger than conventional engineering metals, such as steel. This combination of high strength and lowweight enables extremely high tip speeds, relative to conventional wheels.
For a given geometry, the limiting
energy density
(energy per unit mass) of a flywheel is proportionalto the ratio of material strength to weight density, otherwise known as the
specific strength
. Table 12.1illustrates the advantage that composite materials offer in this respect.
Recent advances in composite materials technology may allow nearly an order of magnitude advan-tage in the specific strength of composites when compared to even the best common engineering metals.The result of this continuous research in composites has been flywheels capable of operation at rotationalspeeds in excess of 100,000 rpm, with tip speeds in excess of 1000 m/s.
These high speeds bring with them new challenges. The ultrahigh rotational speeds that are requiredto store significant kinetic energy in these systems virtually rule out the use of conventional mechanicalbearings. Instead, most systems run on magnetic bearings. This relatively recent innovation uses mag-netic forces to levitate a rotor, eliminating the frictional losses inherent in rolling element and fluid filmbearings. Unfortunately, aerodynamic drag losses force most high-speed flywheels to operate in a partialvacuum, which complicates the task of dissipating the heat generated by ohmic losses in the bearing elec-tromagnets and rotor. In addition, active magnetic bearings are inherently unstable and require sophisti-cated control systems to maintain proper levitation.
The integrated generator of these systems is usually a rotating-field design, with the magnetic fieldsupplied by rare-earth permanent magnets. Because the specific strength of these magnets is typically justfractions of that of the composite flywheel, they must spin at much lower tip speeds; in other words, theymust be placed very near the hub of the flywheel. This compromises the power density of the generator.
Table 12.1
Specific Strength of Selected Materials (
After
[3].)
Material
Specific Strength (in.
3
)
Graphite/epoxy 3,509,000Boron/epoxy 2,740,000Titanium and alloys 1,043,000Wrought stainless steel 982,000Wrought high-strength steel 931,0007000 series aluminum alloys 892,000
© 2007 by Taylor & Francis Group, LLC

Motor-Generator Set
197
An alternative is to mount them closer to the outer radius of the wheel, but contain their inertial loadswith the composite wheel itself. Obviously, this forces the designer to either derate the machine speed oroperate closer to the stress limits of the system.
12.2.3 Maintenance Considerations
Because m-g sets require some maintenance that necessitates shutdown, most systems provide bypasscapability so the maintenance work can be performed without having to take the computer out of service.If the automatic bypass contactor, solid-state switch, and control hardware are in the same cabinet asother devices that also need to be de-energized for maintenance, a secondary bypass is recommended.After the automatic bypass path has been established, transfer switching to the secondary bypass can beenabled, taking the m-g set and its automatic bypass system out of the circuit completely. Some auto-matic bypass control arrangements are designed to transfer the load of the generator to the bypass routewith minimum disturbance. This requires the generator output to be synchronized with the bypasspower before closing the switch and opening the generator output breaker. However, with the load takenoff the generator, bypass power no longer will be synchronized with it. Consequently, retransfer of theload back to the generator may occur with some disturbance. Adjustment for minimum disturbance ineither direction requires a compromise in phase settings, or a means to shift the phase before and afterthe transfer.
The use of rotating field exciters has eliminated the need for slip rings in most m-g designs. Brushinspection and replacement, therefore, are no longer needed. However, as with any rotating machinery,bearings must be inspected and periodically replaced.
12.2.4 Motor-Generator UPS
Critical DP applications that cannot tolerate even brief ac power interruptions can use the m-g set as thebasis for an uninterruptible source of power through the addition of a battery-backed dc motor to theline-driven ac motor shaft. This concept is illustrated in Figure 12.7. The ac motor normally suppliespower to drive the system from the utility company line. The shafts of the three devices all are intercon-nected, as shown in the figure. When ac power is present, the dc motor serves as a generator to charge the
Figure 12.7
Uninterruptible m-g set with ac and dc motor drives. (
After
[1].)
AC motorcontroller
DC motorand charger
control
AC generatorvoltage
regulator
To critical loadA, B and C are control circuitsensing paths to synchronizesystem to normal or bypass
power (if present) whileoperating on battery power
Battery
C
BA
Normalpowersource
Bypass power source Bypass
Flywheeloptional
AC motor DC motor Alternator
Tachometergenerator
© 2007 by Taylor & Francis Group, LLC

198
AC Power Systems Handbook
battery bank. When line voltage is interrupted, the dc motor is powered by the batteries. Figure 12.8shows a modified version of this basic m-g UPS using only a dc motor as the mechanical power source.This configuration eliminates the inefficiency involved in having two motors in the system. Power fromthe utility source is rectified to provide energy for the dc motor, plus power for charging the batteries. Acomplex control system to switch the ac motor off and the dc motor on in the event of a utility power fail-ure is not needed in this design.
The m-g UPS also can be built around a synchronous ac motor, as illustrated in Figure 12.9. Utilityac energy is rectified and used to drive an inverter, which provides a regulated frequency source to powerthe synchronous motor. The output from the dc-to-ac inverter need not be a well-formed sine wave, or awell-regulated source. The output from the generator will provide a well-regulated sine wave for the load.The m-g set also can be operated in a bypass mode that eliminates the rectifier, batteries, and inverterfrom the current path, operating the synchronous motor directly from the ac line.
An m-g UPS set using a common-stator machine is illustrated in Figure 12.10. A feedback controlcircuit adjusts the firing angle of the inverter to compensate for changes in input power. This concept istaken a step further in the system shown in Figure 12.11. A solid-state inverter bypass switch is added toimprove efficiency. During normal operation, the bypass route is enabled, eliminating losses across the
Figure 12.8
Uninterruptible m-g set using a single dc drive motor. (
After
[1].)
Figure 12.9
Uninterruptible m-g set using a synchronous ac motor. (
After
[1].)
DC motorcontrol and
regulator
AC generatorvoltage
regulator
DC motor Alternator
Tachometergenerator
To critical load
Battery
Bypass BypassswitchPower from
utilitypower source
AC
Rectifiercharger
Optional flywheel
DC
Utilitypowersource AC
DC
Rectifiercharger
Controlledfrequency,
unregulatedvoltage
output inverter
Motorcontrol
BatteryBypasssource
Motorbypassswitch
Synchronousac motor
Rotary filter
Alternator
AC generatorvoltage
regulator
Output
Bypassswitch
© 2007 by Taylor & Francis Group, LLC

Motor-Generator Set
199
rectifier diodes. When the control circuitry senses a drop in utility voltage, the inverter is switched on,and the bypass switch is deactivated. A simplified installation diagram of the inverter/bypass system isshown in Figure 12.12. Magnetic circuit breakers and chokes are included as shown. An isolation trans-former is inserted between the utility input and the rectifier bank. The static inverter is an inherently sim-ple design; commutation is achieved via the windings. Six thyristors are used. Under normal operatingconditions, 95% of the ac power passes through the static switch; 5% passes through the inverter. Thisarrangement affords maximum efficiency, while keeping the battery bank charged and the rectifiers andinverter thyristors preheated. Preheating extends the life of the components by reducing the extent ofthermal cycling that occurs when the load suddenly switches to the battery backup supply. The staticswitch allows for fast disconnect of the input ac when the utility power fails.
12.2.5 Kinetic Battery Storage System
As outlined previously, one of the parameters that limits the ride-through period of an m-g set is thespeed decay of the flywheel/generator combination. As the flywheel slows down, the output frequency
Figure 12.10
Common-stator UPS m-g set. The firing angle of the SCR inverters is determined by a feedback voltagefrom the generator output.
Figure 12.11
Common-stator UPS m-g set with a solid-state inverter bypass switch.
Rectifier Inverter
DC contactor
Common-stator generator-motor
Motor Generator
Load
V F
Battery Battery charger
AC
mai
ns
~ −
Inverter bypass switch
Rectifier
DC contactor
Motor Generator
VF
Common-statorgenerator-motor
Load
BatteryBattery charger
AC
mai
ns
Inverter
~−
© 2007 by Taylor & Francis Group, LLC
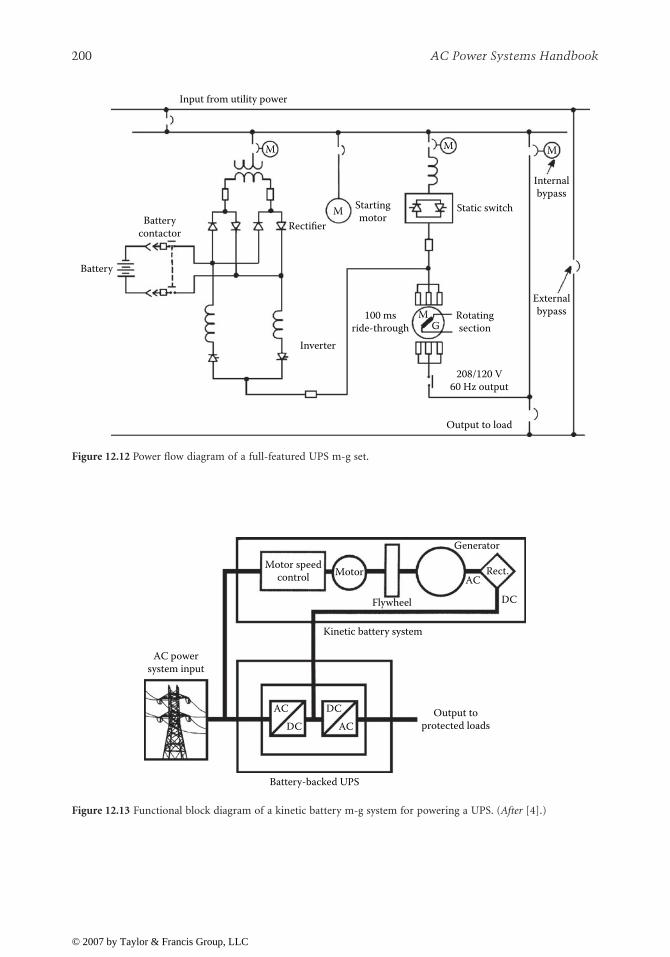
200
AC Power Systems Handbook
Figure 12.12
Power flow diagram of a full-featured UPS m-g set.
Figure 12.13
Functional block diagram of a kinetic battery m-g system for powering a UPS. (
After
[4].)
Input from utility power
Batterycontactor Rectifier
M Startingmotor
Static switch
100 msride-through
MG
Rotatingsection
Externalbypass
Internalbypass
M
208/120 V60 Hz output
Output to load
Battery
Inverter
M M
AC powersystem input
ACDC
Battery-backed UPS
DCAC
Output toprotected loads
Kinetic battery system
Motor speedcontrol Motor
Flywheel
Generator
Rect.AC
DC
© 2007 by Taylor & Francis Group, LLC

Motor-Generator Set
201
drops. This limits the useful ride-through period to 0.5 s or so. Figure 12.13 shows an ingenious modifi-cation of the classic power conditioning template that extends the potential ride-through considerably.As shown in the figure, an m-g set is used in a UPS-based system as an element of the dc supply grid. Themajor components of the system include:
• Steel flywheel for energy storage• Small drive motor, sized at 15 to 20% of the rated system output, to start the flywheel and maintain
its normal operating speed• Variable speed drive (VSD) to slowly ramp the flywheel up to speed and maintain it at the desired
rpm• Generator to convert the kinetic energy stored in the flywheel into electrical energy• Diode bridge rectifier to convert the ac generator output to dc for use by the UPS bus, which
continues to draw usable energy essentially independent of flywheel rpm
Because the ac output of the generator is converted to dc, frequency is no longer a limiting factor,which allows the dc voltage output to be maintained over a much greater range of the flywheel’s rpmenvelope.
In operation, the small drive motor spins the flywheel while the variable speed drive maintains theproper motor speed [4]. Because the amount of stored kinetic energy increases by the square of the fly-wheel rpm, it is possible to greatly increase stored energy, and thus ride-through, by widening the fly-wheel’s usable energy output range. These factors permit typical ride-through times from 10 s to severalminutes, depending on loading and other operating conditions. The benefits of this approach include thereduced cycling of battery supplies and engine-generator systems.
12.3 References
1. Federal Information Processing Standards Publication No. 94,
Guideline on Electrical Power forADP Installations
, U.S. Department of Commerce, National Bureau of Standards, Washington, DC,1983.
2. Plater, B. B., and J. A. Andrews, “Advances in Flywheel Energy Storage Systems,”
Power Quality ’97
,Intertec International, Ventura, CA, pp. 460–469, 1997.
3. “Materials Selector,
Materials Engineering
, Penton Publishing, 1987.4. Weaver, E. J., “Dynamic Energy Storage System,”
Power Quality Solutions/Alternative Energy
, Inter-tec International, Ventura, CA, pp. 373–380, 1996.
12.4 Bibliography
“How to Correct Power Line Disturbances,” Dranetz Technologies, Edison, NJ, 1985.Lawrie, R.,
Electrical Systems for Computer Installations
, McGraw-Hill, New York, 1988.Pettinger, W., “The Procedure of Power Conditioning,”
Microservice Management
, Intertec Publishing,Overland Park, KS, March 1990.
Smeltzer, D., “Getting Organized About Power,”
Microservice Management
, Intertec Publishing, OverlandPark, KS, March 1990.
© 2007 by Taylor & Francis Group, LLC

203
13
Uninterruptible Power
Systems
13.1 Introduction
Uninterruptible power systems have become a virtual necessity for powering large or small computer sys-tems where the application serves a critical need. Computers and data communications systems are no morereliable than the power from which they operate. The difference between UPS and
emergency standby power
is that the UPS is always in operation. It reverts to an alternative power source, such as the utility company,only if the UPS fails or needs to be deactivated for maintenance. Even then, the transfer of power occurs soquickly (within milliseconds) that it does not interrupt proper operation of the load.
Emergency standby power is normally off and does not start (manually or automatically) until the util-ity ac feed fails. A diesel generator can be started within 10 to 30 s if the system has been maintained prop-erly. Such an interruption, however, is far too long for DP hardware. Most DP systems cannot ride throughmore than 8 to 22 ms of power interruption. Systems that can successfully ride through short-durationpower breaks, as far as energy continuity is concerned, still may enter a fault condition because of electricalnoise created by the disturbance.
UPS hardware is available in a number of different configurations. All systems, however, are variationsof two basic designs:
•
Forward-transfer mode
: The load normally is powered by the utility power line, and the inverter isidle. If a commercial power failure occurs, the inverter is started and the load is switched. Thisconfiguration is illustrated in Figure 13.1. The primary drawback of this approach is the lack of loadprotection from power-line disturbances during normal (utility-powered) operation.
•
Reverse-transfer mode
: The load normally is powered by the inverter. In the event of an inverter failure,the load is switched directly to the utility line. This configuration is illustrated in Figure 13.2. Thereverse-transfer mode is, by far, the most popular type of UPS system in use for large-scale systems.
The type of load-transfer switch used in the UPS system is another critical design parameter. The conti-nuity of ac power service to the load is determined by the type of switching circuit used. An electromechani-cal transfer switch, shown in Figure 13.3, is limited to switch times of 20 to 50 ms. This time delay can causesensitive load equipment to malfunction and perhaps shut down. A control circuit actuates the relay whenthe sensed output voltage falls below a preset value, such as 94% of nominal. A static transfer switch, shownin Figure 13.4, can sense a failure and switch the load in about 4 ms. Most loads will ride through this shortdelay without any malfunction. To accomplish a smooth transition, the inverter output must be synchro-nized with the power line.
13.2 UPS Configuration
The basic uninterruptible power system is built around a battery-driven inverter, with the batteriesrecharged by the utility ac line. As shown in Figure 13.5, ac from the utility feed is rectified and applied torecharge or
float
a bank of batteries. This dc power drives a single- or multiphase closed-loop inverter, whichregulates output voltage and frequency. The output of the inverter is generally a sine wave or pseudo sinewave (a stepped square wave). If the utility voltage drops or disappears, current is drawn from the batteries.When ac power is restored, the batteries are recharged. Many UPS installations incorporate a standby diesel
© 2007 by Taylor & Francis Group, LLC

204
AC Power Systems Handbook
Figure 13.1
Forward-transfer UPS system.
Figure 13.2
Reverse-transfer UPS system.
Figure 13.3
Electromechanical load-transfer switch.
Figure 13.4
Static load-transfer switch.
Normal power line
Inverter Load
Automatictransferswitch
Powerline
Batterybank
Rectifiercharger
Emergency bypass line
Inverter Load
Automatictransferswitch
Powerline
Batterybank
Rectifirercharger
Load
Power line
Inverteroutput
Voltage sense
Current senseControlcircuits
Inverteroutput
Transferlogicsignal
SCRDrive Load
SCRs
SCRsPower
line
© 2007 by Taylor & Francis Group, LLC

Uninterruptible Power Systems
205
generator that starts as soon as the utility company feed is interrupted. With this arrangement, the batter-ies are called upon to supply operating current for only 30 s or so, until the generator gets up to speed. AUPS system intended to power a computer center is illustrated in Figure 13.6.
13.2.1 Power-Conversion Methods
Solid-state UPS systems that do not employ rotating machinery utilize one of several basic concepts. Thedesign of an inverter is determined primarily by the operating power level. The most common circuitconfigurations include:
• Ferroresonant inverter• Delta magnetic inverter• Inverter-fed
L/C
tank• Quasi-square wave inverter• Step wave inverter• Pulse-width modulation (PWM) inverter• Phase modulation inverter
In the following sections an overview of common inverter technologies is given.
13.2.1.1 Ferroresonant Inverter
Illustrated in Figure 13.7, the ferroresonant inverter is popular for low- to medium-power applications. Aferroresonant transformer can be driven with a distorted, unregulated input voltage and deliver a regu-lated, sinusoidal output when filtered properly. The ferroresonant transformer core is designed so thatthe secondary section is magnetically saturated at the desired output voltage. As a result, the output levelremains relatively constant over a wide range of input voltages and loads. Capacitors, connected across
Figure 13.5
Block diagram of an uninterruptible power system using ac rectification to float the battery supply. Aclosed-loop inverter draws on this supply and delivers clean ac power to the protected load.
Figure 13.6
Installation details for a computer-room UPS power conditioner.
dc power busRectifier
UPS batteryback-up supply
Note: This circuit is duplicatedas needed for multiphase systems.
Utilityac feed
Closed-loopinverter
Clean UPSac ouput
Outputtransformer
© 2007 by Taylor & Francis Group, LLC
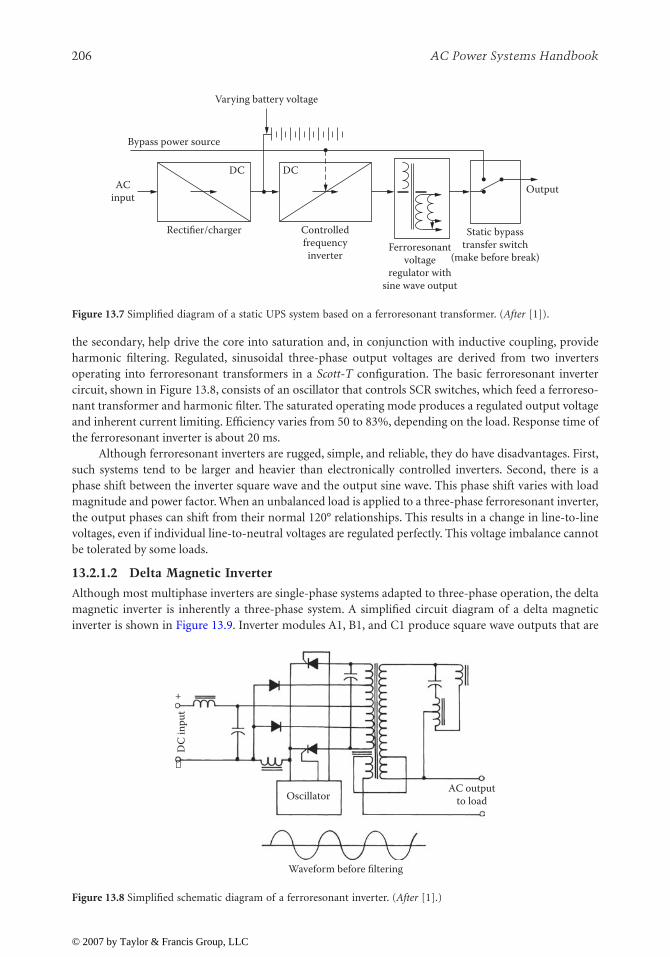
206
AC Power Systems Handbook
the secondary, help drive the core into saturation and, in conjunction with inductive coupling, provideharmonic filtering. Regulated, sinusoidal three-phase output voltages are derived from two invertersoperating into ferroresonant transformers in a
Scott-T
configuration. The basic ferroresonant invertercircuit, shown in Figure 13.8, consists of an oscillator that controls SCR switches, which feed a ferroreso-nant transformer and harmonic filter. The saturated operating mode produces a regulated output voltageand inherent current limiting. Efficiency varies from 50 to 83%, depending on the load. Response time ofthe ferroresonant inverter is about 20 ms.
Although ferroresonant inverters are rugged, simple, and reliable, they do have disadvantages. First,such systems tend to be larger and heavier than electronically controlled inverters. Second, there is aphase shift between the inverter square wave and the output sine wave. This phase shift varies with loadmagnitude and power factor. When an unbalanced load is applied to a three-phase ferroresonant inverter,the output phases can shift from their normal 120° relationships. This results in a change in line-to-linevoltages, even if individual line-to-neutral voltages are regulated perfectly. This voltage imbalance cannotbe tolerated by some loads.
13.2.1.2 Delta Magnetic Inverter
Although most multiphase inverters are single-phase systems adapted to three-phase operation, the deltamagnetic inverter is inherently a three-phase system. A simplified circuit diagram of a delta magneticinverter is shown in Figure 13.9. Inverter modules A1, B1, and C1 produce square wave outputs that are
Figure 13.7
Simplified diagram of a static UPS system based on a ferroresonant transformer. (
After
[1]).
Figure 13.8
Simplified schematic diagram of a ferroresonant inverter. (
After
[1].)
Ferroresonantvoltage
regulator withsine wave output
Static bypasstransfer switch
(make before break)
Output
Controlledfrequencyinverter
Rectifier/charger
ACinput
DC DC
Bypass power source
Varying battery voltage
AC outputto load
DC
inpu
t
+
−
Oscillator
Waveform before filtering
© 2007 by Taylor & Francis Group, LLC

Uninterruptible Power Systems
207
phase-shifted relative to each other by 120°. The waveforms are coupled to the primaries of transformerT1 through linear inductors. T1 is a conventional three-phase isolation transformer. The primaries of thedevice are connected in a delta configuration, reducing the third harmonic and all other harmonics thatare odd-order multiples of the third. The secondaries of T1 are connected in a wye configuration to pro-vide a four-wire three-phase output. Inductors L4 to L9 form a network connected in a delta configura-tion to high-voltage taps on the secondary windings of T1. Inductors L4 to L6 are single-windingsaturating reactors, and L7 to L9 are double-winding saturating reactors. Current drawn by this saturat-ing reactor network is nearly sinusoidal and varies in magnitude, in a nonlinear manner, with voltagevariations. For example, if an increase in load tended to pull the inverter output voltages down, thereduced voltage applied to the reactor network would result in a relatively large decrease in current drawnby the network. This, in turn, would decrease the voltage drop across inductors L1 to L3 to keep theinverter output voltage at the proper level. The delta magnetic regulation technique is essentially a three-phase shunt regulator. Capacitors C1–C3 help drive the reactor network into saturation, as well as pro-vide harmonic filtering in conjunction with the primary inductors.
13.2.1.3 Inverter-Fed L/C Tank
An inductor/capacitor tank is driven by a dc-to-ac inverter, as illustrated in Figure 13.10. The tank circuitacts to reconstruct the sine wave at the output of the system. Regulation is accomplished by varying thecapacitance or the inductance to control partial resonance or power factor. Some systems of this type usea saturable reactor in which electronic voltage-regulator circuits control the dc current in the reactor.Other systems, shown in Figure 13.11, use a dc-to-variable-dc inverter/converter to control the UPS out-put through adjustment of the boost voltage. This feature permits compensation for changes in batterylevel.
13.2.1.4 Quasi-Square Wave Inverter
Shown in Figure 13.12, the quasi-square wave inverter produces a variable-duty waveshape that must befiltered by tuned series and parallel inductive-capacitive networks to reduce harmonics and form a sinu-soidal output. Because of the filter networks present in this design, the inverter responds slowly to loadchanges; response time in the range of 150 to 200 ms is common. Efficiency is about 80%. This type ofinverter requires voltage-regulating and current-limiting networks, which increase circuit complexityand make it relatively expensive.
Figure 13.9
Simplified schematic diagram of the delta magnetic regulation system.
A1 L1
L2
L3
B1
C1C2
C1
C3
L5 L8 L9
L4T1
L7 L8
L6 L9 L7
B
C
N
A
3ø A
C ou
tput
DC
inpu
t
© 2007 by Taylor & Francis Group, LLC

208
AC Power Systems Handbook
Figure 13.10
Static UPS system using saturable reactor voltage control. (
After
[1].)
Figure 13.11
Static UPS system with dc boost voltage control. (
After
[1].)
Figure 13.12
Simplified schematic diagram of a quasi-square wave inverter.
Voltageregulator
Static bypassswitch
(make beforebreak)
Output
Controlledfrequencyinverter
Rectifier/charger
ACinput
DC DC
Bypasspower source
Varying battery voltage
To DPload
Controlledboosted
dc outputDC boostvariablevoltage
Boost voltageac inverter
DC to acinverter
DCUnregulated
dc input
AC bypass
Varying battery voltage
Voltage regulatorboost
power supply
Synchronizingsignal from bypass
Voltage feedback Current feedback
AC
outp
ut to
load
Current transformer
Oscillator and
control
DC
inpu
t
+
−
Waveform before filtering
© 2007 by Taylor & Francis Group, LLC

Uninterruptible Power Systems
209
13.2.1.5 Step Wave Inverter
A multistep inverter drives a combining transformer, which feeds the load. The general concept is illus-trated in Figure 13.13. The purity of the output sine wave is a function of the number of discrete stepsproduced by the inverter. Voltage regulation is achieved by a
boost
dc-to-dc power supply in series withthe battery. Figure 13.14 and Figure 13.15 show two different implementations of single-phase units.Each system uses a number of individual inverter circuits, typically three or multiples of three. Theinverters are controlled by a master oscillator; their outputs are added in a manner that reduces harmon-ics, producing a near-sinusoidal output. These types of systems require either a separate voltage regulatoron the dc bus or a phase shifter. Response time is about 20 ms. Little waveform filtering is required, andefficiency can be as high as 85%. The step wave inverter, however, is complex and expensive. It usually isfound only in large three-phase UPS systems.
13.2.1.6 Pulse-Width Modulation Inverter
Illustrated in Figure 13.16, the pulse-width modulation circuit incorporates two inverters that regulatethe output voltage by varying the pulse width. The output closely resembles a sine wave. Reduced filteringrequirements result in good voltage-regulation characteristics. Response times close to 100 ms are typical.The extra inverter and feedback networks make the PWM inverter complex and expensive. Such systemsusually are found at power levels greater than 50 kVA.
13.2.1.7 Phase Modulation Inverter
Illustrated in Figure 13.17, this system uses dc-to-ac conversion through phase modulation of two squarewave high-frequency signals to create an output waveform. The waveform then is filtered to remove thecarrier signal and feed the load.
13.2.2 Redundant Operation
UPS systems can be configured as either a single, large power-conditioning/backup unit, or as severalsmaller systems arranged in a
parallel redundant
or
isolated redundant
mode. In the parallel redundantmode, the UPS outputs are connected together and share the total load. (See Figure 13.18.) The power-output ratings of the individual UPS systems are selected to provide for operation of the entire load withany one UPS unit out of commission. In the event of expansion of the DP facility, additional UPS unitscan be added to carry the load. The parallel system provides the ability to cope with the failure of any sin-gle unit.
An isolated redundant system, illustrated in Figure 13.19, divides the load among several UPS units.If one of the active systems fails, a static bypass switch will connect the affected load to a standby UPS sys-tem dedicated to that purpose. The isolated redundant system does not permit the unused capacity ofone UPS unit to be utilized on a DP system that is loading another UPS to full capacity. The benefit of theisolated configuration is its immunity to systemwide failures.
Figure 13.13
Static UPS system using a stepped wave output. (
After
[1].)
Combiningtransformer
Output step wave (each phase) requires filters forharmonics where 11th harmonic is the lowest
Square wavegenerator30° phase
Square wavegenerator0° phaseRegulated
dc
Regulateddc
© 2007 by Taylor & Francis Group, LLC

210
AC Power Systems Handbook
Figure 13.14
Step wave inverter schematic diagram.
Figure 13.15
Step wave inverter and output waveform.
Variousfrequencies
Voltage feedback
Current feedback
Output waveform before filtering
Powerregulator
Oscillatorand
control
DCinput
+
−AC
outputto load
Currenttransformer
Output
Voltage senseamplifier
Current limitamplifier
Oscillator
Input
Etc.
Etc.
Waveshape
© 2007 by Taylor & Francis Group, LLC

Uninterruptible Power Systems
211
Figure 13.16
Simplified diagram of a pulse-width modulation inverter.
Figure 13.17
Static UPS using a phase modulated carrier. (
After
[1].)
Figure 13.18
Configuration of a parallel redundant UPS system. (
After
[1].)
VoltagefeedbackCurrentfeedback
Oscillatorand
control
Variousfrequencies
DC
inpu
t
Output waveform before filtering
AC
outp
ut to
load
Currenttransformer
(One is phase-modulated with respect to the other)
Two square wave outputs from dc to ac inverters Add Filter
Output
UPS No. 1DC
UPS No. 2DC DC
UPS No. 3
To additionalunits
Powerinput
Bypass Static switch Manualbypass
To DPloads
DC DC
DC
© 2007 by Taylor & Francis Group, LLC

212
AC Power Systems Handbook
13.2.3 Output Transfer Switch
Fault conditions, maintenance operations, and system reconfiguration require the load to be switchedfrom one power source to another. This work is accomplished with an output transfer switch. As dis-cussed previously, most UPS systems use electronic (static) switching. Electromechanical or motor-driven relays operate too slowly for most DP loads. Static transfer switches can be configured as either ofthe following:
•
Break-before-make
: Power output is interrupted before transfer is made to the new source.•
Make-before-break
: The two power sources are overlapped briefly so as to prevent any interruptionin ac power to the load.
Figure 13.20 illustrates each approach to load switching.
Figure 13.19
Configuration of an isolated redundant UPS system. (
After
[1].)
Figure 13.20
Static transfer switch modes.
UPS No. 1DCDC To DP
group 1
To DPgroup 2
UPS No. 2
Powerinput
DC
Bypass
DC
Spare or backupredundant UPS
DCDC
Break before make:
Power source No. 1 Power source No. 2
No power source
Power source No. 1
Make before break:
Power source No. 2
Power source paralleled
Completion of transferStart of transfer
Time
Time
© 2007 by Taylor & Francis Group, LLC

Uninterruptible Power Systems
213
For critical-load applications, a make-before-break transfer is necessary. For the switchover to beaccomplished with minimum disturbance to the load, both power sources must be synchronized. TheUPS system must, therefore, be capable of synchronizing to the utility ac power line (or other appropriatepower source).
13.2.4 Battery Supply
UPS systems typically are supplied with sufficient battery capacity to carry a DP load for periods rangingfrom 5 min to 1 h. Long backup time periods usually are handled by a standby diesel generator. Batteriesrequire special precautions. For large installations, they almost always are placed in a room dedicated tothat purpose. Proper temperature control is important for long life and maximum discharge capacity.
Most rectifier/charger circuits operate in a
constant-current
mode during the initial charge periodand automatically switch to a
constant-voltage
mode near the end of the charge cycle. This provides max-imum battery life consistent with rapid recharge. It also prevents excessive battery outgassing and waterconsumption. The charger provides a
float voltage level
for maintaining the normal battery charge andsometimes a higher voltage to equalize certain devices.
Four battery types typically are found in UPS systems:
•
Semisealed lead calcium
. A gel-type electrolyte is used that does not require the addition of water.There is no outgassing or corrosion. This type of battery is used when the devices are integral tosmall UPS units, or when the batteries must be placed in occupied areas. The life span of asemisealed lead calcium battery, under ideal conditions, is about 5 years.
•
Conventional lead calcium
. The most common battery type for UPS installations, these unitsrequire watering and terminal cleaning about every 6 months. Expected lifetime ranges up to 20years. Conventional lead-calcium batteries outgas hydrogen under charge conditions and must belocated in a secure, ventilated area.
•
Lead-antimony
. The traditional lead-acid batteries, these devices are equivalent in performance tolead-calcium batteries. Maintenance is required every 3 months. Expected lifetime is about 10years. To retain their capacity, lead-antimony batteries require a monthly equalizing charge.
•
Nickel-cadmium
. Advantages of the nickel-cadmium battery includes small size and low weightfor a given capacity. These devices offer excellent high- and low-temperature properties. Lifeexpectancy is nearly that of a conventional lead-calcium battery. Nickel-cadmium batteries requirea monthly equalizing charge, as well as periodic discharge cycles to retain their capacity. Nickel-cadmium batteries are the most expensive of the devices typically used for UPS applications.
13.3 Reference
1. Federal Information Processing Standards Publication No. 94,
Guideline on Electrical Power forADP Installations
, U.S. Department of Commerce, National Bureau of Standards, Washington, DC,1983.
13.4 Bibliography
Lawrie, R.,
Electrical Systems for Computer Installations
, McGraw-Hill, New York, 1988.Newman, P., “UPS Monitoring: Key to an Orderly Shutdown,”
Microservice Management
, Intertec Pub-lishing, Overland Park, KS, March 1990.
Nowak, S., “Selecting a UPS,”
Broadcast Engineering
, Intertec Publishing, Overland Park, KS, April 1990.Pettinger, W., “The Procedure of Power Conditioning,”
Microservice Management
, Intertec Publishing,Overland Park, KS, March 1990.
Smeltzer, D., “Getting Organized about Power,”
Microservice Management
, Intertec Publishing, OverlandPark, KS, March 1990.
© 2007 by Taylor & Francis Group, LLC

215
14
Power Conditioning
Devices
14.1 Introduction
A wide variety of power-protection technologies are available to solve specific problems at a given facility.Various levels of protection can be provided using the following devices:
• Ferroresonant transformer• Isolation transformer• Tap-changing regulator• Line conditioner
14.2 Ferroresonant Transformer
Ferroresonant transformers exhibit unique voltage-regulation characteristics that have proven valuable in awide variety of applications. Voltage output is fixed by the size of the core, which saturates each half-cycle, andby the turns ratio of the windings. Voltage output is determined at the time of manufacture and cannot beadjusted. The secondary circuit resonance depends upon capacitors, which work with the saturating inductanceof the device to keep the resonance active. A single-phase ferroresonant transformer is shown in Figure 14.1.
Load currents tend to demagnetize the core, so output current is automatically limited. A ferroresonanttransformer typically cannot deliver more than 125 to 150% of its full-load rated output without going intoa current-limiting mode. Such transformers cannot support the normal starting loads of motors without asignificant dip in output voltage.
Three-phase versions consisting of single-phase units connected in delta-delta, delta-wye, or wye-wyecan be unstable when working into unbalanced loads. Increased stability for three-phase operation can beachieved with zigzag and other special winding configurations.
Shortcomings of the basic ferroresonant transformer have been overcome in advanced designs intendedfor low-power (2 kVA and below) voltage-regulator applications for DP equipment. Figure 14.2 illustratesone of the more common regulator designs. Two additional windings are included:
•
Compensating winding
(
W
c
), which corrects for minor flux changes that occur after saturation hasbeen reached.
•
Neutralizing winding
(
W
n
), which cancels out most of the harmonic content of the output voltage.Without some form of harmonic reduction, the basic ferroresonant transformer would be unsuitablefor sensitive DP loads.
A unique characteristic of the ferroresonant regulator is its ability to reduce normal-mode impulses.Because the regulating capability of the device is based on driving the secondary winding into saturation,transients and noise bursts are clipped, as illustrated in Figure 14.3.
The typical ferroresonant regulator has a response time of about 25 ms. Because of the tuned circuit atthe output, the ferroresonant regulator is sensitive to frequency changes. A 1% frequency change will result(typically) in a 1.5% change in output voltage. Efficiency of the device is about 90% at full rated load, andefficiency declines as the load is reduced. The ferroresonant regulator is sensitive to leading and laggingpower factors, and exhibits a relatively high output impedance.
© 2007 by Taylor & Francis Group, LLC

216
AC Power Systems Handbook
14.2.1 Magnetic-Coupling-Controlled Voltage Regulator
An electronic magnetic regulator uses dc to adjust theoutput voltage through magnetic saturation of the core.The direct current-fed winding changes the saturationpoint of the transformer. This action, in turn, controlsthe ac flux paths through boost or buck coils to raise orlower the output voltage in response to an electronic cir-cuit that monitors the output of the device. A block dia-gram of the magnetic-coupling-controlled voltageregulator is shown in Figure 14.4. Changes in outputvoltage are smooth, although the typical response time of5 to 10 cycles is too slow to prevent surge and sag condi-tions from reaching the load.
Figure 14.5 illustrates an electromechanical version of a saturable regulating transformer. Outputvoltage is controlled by varying the impedance of the saturable reactor winding in series with a step-upautotransformer. Response to sag and surge conditions is 5 to 10 cycles. Such devices usually exhibit highoutput impedance and are sensitive to lagging load power factor.
Figure 14.2
Improved ferroresonant transformer design incorporating a compensating winding and a neutralizingwinding. (
Adapted from documentation provided by Dranetz Technologies
.)
Figure 14.3
Clipping characteristics of a ferroresonant transformer.
Out
put
Inpu
t
Figure 14.1 Basic design of a ferroresonanttransformer. (After [1].)
Pow
er li
ne WCWP
Primarywinding
Neutralizingwinding
Secondarywinding
Compensatingwinding
WNWS
Capacitor
Load
Inputvoltage
Clipping action
© 2007 by Taylor & Francis Group, LLC

Power Conditioning Devices
217
14.3 Isolation Transformer
Transients as well as noise (RF and low-levelspikes) can pass through transformers, not only byway of the magnetic lines of flux between the pri-mary and the secondary, but through resistive andcapacitive paths between the windings, as well.There are two basic types of noise signals withwhich transformer designers must cope:
•
Common-mode
noise. Unwanted signals in theform of voltages appearing between the localground reference and each of the power con-ductors, including neutral and the equipmentground.
•
Normal-mode
noise. Unwanted signals in theform of voltages appearing in line-to-line andline-to-neutral signals.
Increasing the physical separation of the primary and secondary windings will reduce the resistiveand capacitive coupling. However, it also will reduce the inductive coupling and decrease power transfer.
A better solution involves shielding the primary and secondary windings from each other to divertmost of the primary noise current to ground. This leaves the inductive coupling basically unchanged. Theconcept can be carried a step further by placing the primary winding in a shielding box that shunts noisecurrents to ground and reduces the capacitive coupling between the windings.
One application of this technology is shown in Figure 14.6, in which transformer noise decoupling istaken a step further by placing the primary and secondary windings in their own wrapped foil boxshields. The windings are separated physically as much as possible for the particular power rating and areplaced between Faraday shields. This gives the transformer high noise attenuation from the primary tothe secondary, and from secondary to the primary. Figure 14.7 illustrates the mechanisms involved.Capacitances between the windings, and between the windings and the frame, are broken into smallercapacitances and shunted to ground, thus minimizing the overall coupling. The interwinding capacitanceof a typical transformer using this technique ranges from 0.001 to 0.0005 pF. Common-mode noiseattenuation is generally in excess of 100 dB. This high level of attenuation prevents common-modeimpulses on the power line from reaching the load. Figure 14.8 illustrates how an isolation transformercombines with the ac-to-dc power supply to prevent normal-mode noise impulses from affecting theload.
Figure 14.4
Block diagram of an electronic magnetic regulator. (
After
[1].)
Buck
Boost
Controlwinding
Solid-stateregularcontrolcircuit
ACinput
voltage
Regulatedoutputvoltage
Pow
er li
ne
Autotransformer
Sensing andcontrol circuits
Saturablereactor
Load
Figure 14.5 Autotransformer/saturable reactor volt-age regulator.
© 2007 by Taylor & Francis Group, LLC

218
AC Power Systems Handbook
Figure 14.6
The shielding arrangement used in a high-performance isolation transformer. The design goal of thismechanical design is high common-mode and normal-mode noise attenuation.
Figure 14.7
The elements involved in a noise-suppression isolation transformer: (
a
) conventional transformer withcapacitive coupling as shown; (
b
) the addition of an electrostatic shield between the primary and the secondary; (
c
)transformer with electrostatic box shields surrounding the primary and secondary windings.
Primarywinding
Secondarywinding AC
AC
GND
AC
AC
GND
Wrapped foilbox shield
Metallic enclosureFaradayshield
Primary SecondaryLoadLine
LoadLine
Electrostatic shield
LoadLineBox
electrostaticshield
CL
CL
CL
CL
(a)
(b)
(c)
© 2007 by Taylor & Francis Group, LLC

Power Conditioning Devices
219
A 7.5 kVA noise-suppression isolationtransformer is shown in Figure 14.9. High-quality isolation transformers are available insizes ranging from 125 VA single-phase to 125kVA (or more) three-phase. Usually, theinput winding is tapped at 2.5% intervals toprovide the rated output voltage, despite highor low average input voltages. The total tapadjustment range is typically from 5% abovenominal to 10% below nominal. For three-phase devices, typical input-voltage nominalratings are 600, 480, 240, and 208 V line-to-line for 15 kVA and larger.
14.3.1 Tap-Changing Regulator
The concept behind a tap-changing regulatoris simple: adjust the transformer input voltageto compensate for ac line-voltage variations. Atap-changing regulator is shown in Figure 14.10. Although simple in concept, the actual implementation ofthe system can become complex because of the timing waveforms and pulses necessary to control the SCRbanks. Because of the rapid response time of SCRs, voltage adjustment can be made on a cycle-by-cyclebasis in response to changes in both the utility input and the load. Tap steps are typically 2 to 3%. Such sys-tems create no objectionable switching transients in unity power factor loads. For low-PF loads, however,small but observable transients can be generated in the output voltage at the moment the current isswitched. This noise usually has no significant effect on DP loads. Other operating characteristics include:
• Low-internal impedance (similar to an equivalent transformer)• High efficiency from full load to 25% or less• Rapid response time (typically one to three cycles) to changes in the input ac voltage or load current• Low acoustic noise level
An autotransformer version of the tap-changing regulator is shown in Figure 14.11.
Figure 14.8
How the normal-mode noise attenuation of an isolation transformer combines with the filtering char-acteristics of the ac-to-dc power supply to prevent noise propagation to the load.
0
<−>10
<−>20At
tenu
atio
n in
dec
ibel
s, dB
<−>30
<−>40
<−>50
<−>60
<−>70
<−>80
Isolation transformer
DCpowersupply
Resultantperformance
of both
100 1000Frequency in hertz
10 K 100 K10
Figure 14.9 A 7.5 kVA noise-suppression isolation trans-former. (Courtesy of Topaz.)
© 2007 by Taylor & Francis Group, LLC
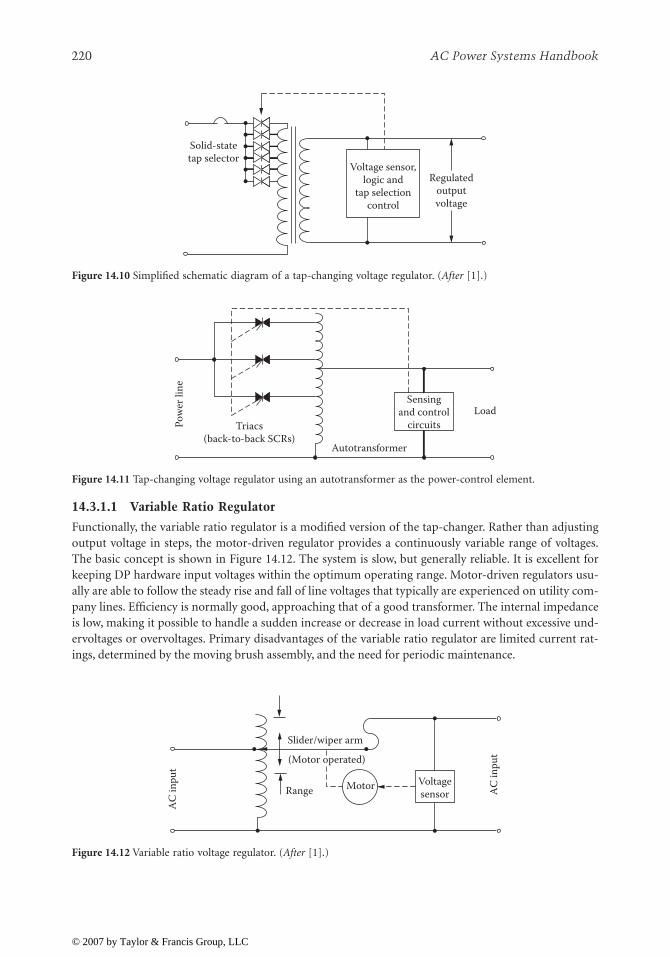
220
AC Power Systems Handbook
14.3.1.1 Variable Ratio Regulator
Functionally, the variable ratio regulator is a modified version of the tap-changer. Rather than adjustingoutput voltage in steps, the motor-driven regulator provides a continuously variable range of voltages.The basic concept is shown in Figure 14.12. The system is slow, but generally reliable. It is excellent forkeeping DP hardware input voltages within the optimum operating range. Motor-driven regulators usu-ally are able to follow the steady rise and fall of line voltages that typically are experienced on utility com-pany lines. Efficiency is normally good, approaching that of a good transformer. The internal impedanceis low, making it possible to handle a sudden increase or decrease in load current without excessive und-ervoltages or overvoltages. Primary disadvantages of the variable ratio regulator are limited current rat-ings, determined by the moving brush assembly, and the need for periodic maintenance.
Figure 14.10
Simplified schematic diagram of a tap-changing voltage regulator. (
After
[1].)
Figure 14.11
Tap-changing voltage regulator using an autotransformer as the power-control element.
Figure 14.12
Variable ratio voltage regulator. (
After
[1].)
Regulatedoutputvoltage
Voltage sensor,logic and
tap selectioncontrol
Solid-statetap selector
LoadTriacs
(back-to-back SCRs)Autotransformer
Sensingand control
circuitsPow
er li
neA
C in
put
Slider/wiper arm
Range AC
inpu
t
Motor Voltagesensor
(Motor operated)
© 2007 by Taylor & Francis Group, LLC

Power Conditioning Devices
221
Variations on the basic design have been marketed, including the system illustrated in Figure 14.13.A motor-driven brush moves across the exposed windings of an autotransformer, causing the seriestransformer to buck or boost voltage to the load. The correction motor is controlled by a voltage-sensingcircuit at the output of the device.
The induction regulator, shown in Figure 14.14, is still another variation on the variable ratio trans-former. Rotation of the rotor in one direction or the other varies the magnetic coupling and raises or low-ers the output voltage. Like the variable ratio transformer, the induction regulator is slow, but it has nobrushes and requires little maintenance. The induction regulator has higher inductive reactance and isslightly less efficient than the variable ratio transformer.
14.3.2 Variable Voltage Transformer
Because of their application in voltage control systems, it is worthwhile to discuss the operation of vari-able voltage transformers in greater detail. A number of conventional transformers can have — to a lim-ited degree — their primary/secondary ratio changed through the use of taps located (usually) on theprimary windings [2]. To obtain a greater degree of flexibility in changing the ratio between the primaryand secondary coils, and thus allow greater secondary voltage changes, a variable voltage transformer isused. The amount of voltage change depends upon the basic construction of the device, which typicallydivides into one of two categories:
• Brush type• Induction type
Figure 14.13
Motor-driven line-voltage regulator using an autotransformer with a buck/boost series transformer.
Figure 14.14
Rotary induction voltage regulator.
Pow
er li
ne
Correctionmotor
LoadOutputvoltagesensor
AutotransformerSeries
transformer
Pow
er li
ne
Correctionmotor
LoadOutputvoltagesensor
Serieswinding
Rotor
Shunt windings
Serieswinding
Stator
© 2007 by Taylor & Francis Group, LLC

222
AC Power Systems Handbook
14.3.2.1 Brush Type
To achieve a variable output voltage, one tap on the transformer secondary is fixed and the other tap isconnected to a brush that slides along an uninsulated section of the transformer coil [2]. One way ofaccomplishing this objective is to have the coil wrapped around a toroidal-shaped core. The voltage ratiorelates to the location of the brush as it rides against the coil and depends upon where on the coil thebrush is allowed to make contact.
Limited ratio
variable transformers are available, as well as full-rangeunits that can adjust the output voltage from 0 to about 120% of the incoming line voltage. When theoutput voltage exceeds the input voltage, it means that there are extra turns on the coil that extendbeyond the windings that lie between the incoming power terminals (in effect, the unit becomes a step-up transformer).
Ratings start at less than 1 kVA for a 120 V, single-phase variable transformer. Basic units are wiredin parallel or in series to obtain higher power capacity. Two units in parallel have double the current andkVA rating. The individual units are stacked on top of each other, bolted together, and operated from acommon shaft that rotates the brushes. Operating in a configuration that combines parallel and seriesconnections, with several units stacked together, this type of variable voltage transformer, at 480 V, canhave a rating exceeding 200 kVA. Sometimes, a control mechanism is attached to the rotor that turns thebrushes, allowing automatic adjustment of the output voltage.
An important characteristic of this type of transformer relates to brush contact and the amount ofcurrent flowing through the carbon brush. A rating based solely on output kVA can cause serious opera-tional problems because, for a given kVA load, the current drawn depends on the output voltage. Becausethe output voltage is variable, a load of a given kVA value can draw a safe current at 100% voltage, but at25% voltage, the current required to serve a load of the same kVA value would require four times as muchcurrent, which could cause the brush to overheat.
14.3.2.2 Induction Type
The induction type variable transformer does not use brushes [2]. The usual voltage change for theseunits is ±10%, but it can be greater. The device is essentially a variable-ratio autotransformer that usestwo separate windings, a primary and a secondary. There is a laminated steel stator on which is wound awinding that serves as a secondary coil. This winding is connected in series with the load. The primarycoil is connected across the supply line. The shunt winding is wound around a rotor. Construction is sim-ilar to that of a motor except that, in this case, the rotor can only turn 180 mechanical and electricaldegrees.
As the primary core is rotated, the amount of primary flux passing through the secondary winding isdecreased until the core reaches a position at right angles to the secondary winding. In this position, noprimary flux passes through the secondary windings and the induced voltage in the coil is zero. The con-tinued rotation of the core in the same direction again increases the amount of flux passing through thesecondary, but it is now in the opposite direction and so reverses the direction of the induced voltage.Thus, the output voltage can be varied by adding or subtracting from it the voltage induced in the sec-ondary winding.
Both single- and three-phase transformers are available. Ratings of these types of transformers varyfrom 8 kVA, 120 V single-phase to 1500 kVA, 480 V three-phase.
14.4 Line Conditioner
A line conditioner combines the functions of an isolation transformer and a voltage regulator in one unit.The three basic types of line conditioners for DP applications are
•
Linear amplifier correction system
. As illustrated in Figure 14.15, correction circuitry compares theac power output to a reference source, derived from a 60 Hz sine wave generator. A correctionvoltage is developed and applied to the secondary power winding to cancel noise and voltagefluctuations. A box shield around the primary winding provides common-mode impulse rejection
© 2007 by Taylor & Francis Group, LLC

Power Conditioning Devices
223
(80 to 100 dB typical). The linear amplifier correction system is effective and fast, but the overallregulating range is limited.
•
Hybrid ferroresonant transformer
. As shown in Figure 14.16, this system consists of a ferroresonanttransformer constructed using the isolation techniques discussed in Section 15.4.2. The box andFaraday shields around the primary and compensating windings give the transformer essentiallythe characteristics of a noise-attenuating device, while preserving the voltage-regulating charac-teristics of a ferroresonant transformer.
•
Electronic tap-changing, high-isolation transformer
. This system is built around a high-attenuationisolation transformer with a number of primary winding taps. SCR pairs control voltage input toeach tap, as in a normal tap-changing regulator. Tap changing also can be applied to the secondary,as shown in Figure 14.17. The electronic tap-changing, high-isolation transformer is an efficientdesign that effectively regulates voltage output and prevents noise propagation to the DP load.
Figure 14.15
Power-line conditioner using linear amplifier correction.
Figure 14.16
Line conditioner built around a shielded-winding ferroresonant transformer.
Box electrostaticshield
Pow
er li
ne
Voltageselectorswitch
Power winding
Overloadcircuits
Current transformer
Load
Erroroutput
Poweramplifier
Low-distortion60 Hz
sine wavegenerator
Low-voltagerectifiercircuits
Syncinput
Box and Faradayelectrostatic fields
Primarywinding
Pow
er li
ne
Compensatingwinding
Load
© 2007 by Taylor & Francis Group, LLC
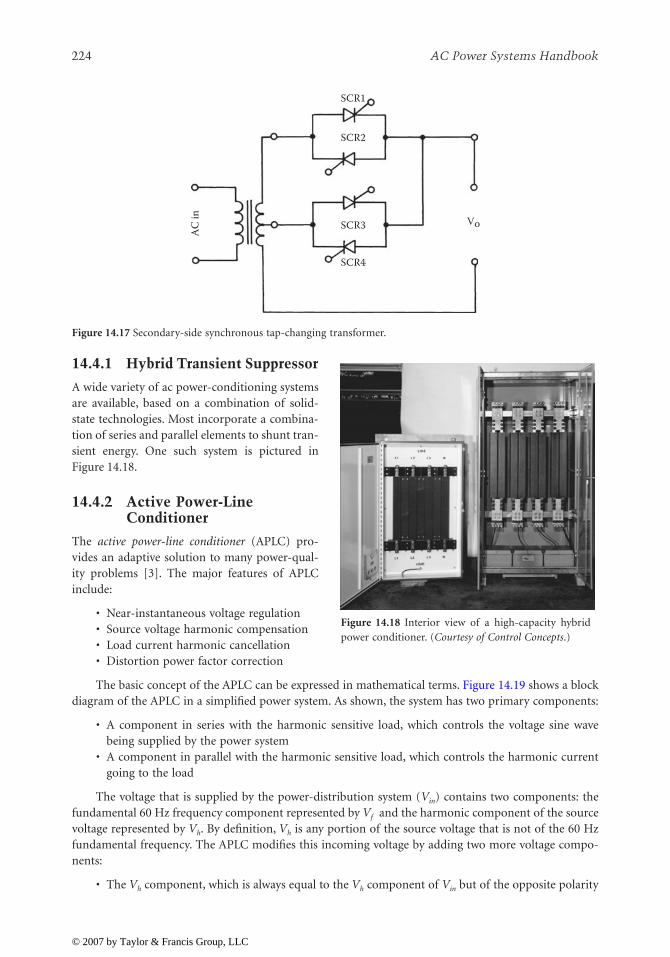
224
AC Power Systems Handbook
14.4.1 Hybrid Transient Suppressor
A wide variety of ac power-conditioning systemsare available, based on a combination of solid-state technologies. Most incorporate a combina-tion of series and parallel elements to shunt tran-sient energy. One such system is pictured inFigure 14.18.
14.4.2 Active Power-Line Conditioner
The
active power-line conditioner
(APLC) pro-vides an adaptive solution to many power-qual-ity problems [3]. The major features of APLCinclude:
• Near-instantaneous voltage regulation• Source voltage harmonic compensation• Load current harmonic cancellation• Distortion power factor correction
The basic concept of the APLC can be expressed in mathematical terms. Figure 14.19 shows a blockdiagram of the APLC in a simplified power system. As shown, the system has two primary components:
• A component in series with the harmonic sensitive load, which controls the voltage sine wavebeing supplied by the power system
• A component in parallel with the harmonic sensitive load, which controls the harmonic currentgoing to the load
The voltage that is supplied by the power-distribution system (
V
in
) contains two components: thefundamental 60 Hz frequency component represented by
V
f
and the harmonic component of the sourcevoltage represented by
V
h
. By definition,
V
h
is any portion of the source voltage that is not of the 60 Hzfundamental frequency. The APLC modifies this incoming voltage by adding two more voltage compo-nents:
• The
V
h
component, which is always equal to the
V
h
component of
V
in
but of the opposite polarity
Figure 14.17
Secondary-side synchronous tap-changing transformer.
SCR1
SCR2
SCR3
SCR4
AC
in Vo
Figure 14.18 Interior view of a high-capacity hybridpower conditioner. (Courtesy of Control Concepts.)
© 2007 by Taylor & Francis Group, LLC
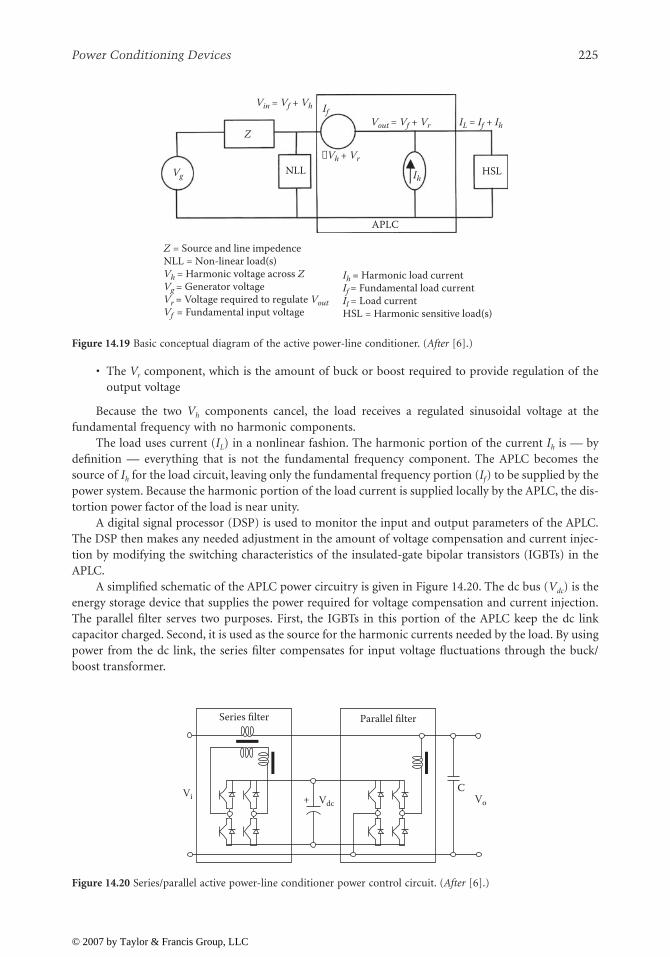
Power Conditioning Devices
225
• The
V
r
component, which is the amount of buck or boost required to provide regulation of theoutput voltage
Because the two
V
h
components cancel, the load receives a regulated sinusoidal voltage at thefundamental frequency with no harmonic components.
The load uses current (
I
L
) in a nonlinear fashion. The harmonic portion of the current
I
h
is — bydefinition — everything that is not the fundamental frequency component. The APLC becomes thesource of
I
h
for the load circuit, leaving only the fundamental frequency portion (
I
f
) to be supplied by thepower system. Because the harmonic portion of the load current is supplied locally by the APLC, the dis-tortion power factor of the load is near unity.
A digital signal processor (DSP) is used to monitor the input and output parameters of the APLC.The DSP then makes any needed adjustment in the amount of voltage compensation and current injec-tion by modifying the switching characteristics of the insulated-gate bipolar transistors (IGBTs) in theAPLC.
A simplified schematic of the APLC power circuitry is given in Figure 14.20. The dc bus (
V
dc
) is theenergy storage device that supplies the power required for voltage compensation and current injection.The parallel filter serves two purposes. First, the IGBTs in this portion of the APLC keep the dc linkcapacitor charged. Second, it is used as the source for the harmonic currents needed by the load. By usingpower from the dc link, the series filter compensates for input voltage fluctuations through the buck/boost transformer.
Figure 14.19
Basic conceptual diagram of the active power-line conditioner. (
After
[6].)
Figure 14.20
Series/parallel active power-line conditioner power control circuit. (
After
[6].)
Vin = Vf + Vh
Z
NLL −Vh + Vr
If
Ih
Vout = Vf + Vr IL = If + Ih
HSL
APLC
Vg
Z = Source and line impedence NLL = Non-linear load(s) Vh = Harmonic voltage across Z Vg = Generator voltage Vr = Voltage required to regulate Vout Vf = Fundamental input voltage
Ih = Harmonic load currentIf = Fundamental load currentIl = Load currentHSL = Harmonic sensitive load(s)
VdcVi +
Series filter Parallel filter
CVo
© 2007 by Taylor & Francis Group, LLC

226
AC Power Systems Handbook
14.4.2.1 Application Considerations
In a conventional power control system, voltage regulation is performed by using either ferroresonanttransformers or tap switching transformers. The fastest response times for either of these solutions isabout one half-cycle (8 ms). This response time is the result of the tap-switching transformer's need for azero crossing of the waveform to make a change. The use of IGBTs in the APLC allows full power to beswitched at any point on the sine wave. Combining these high-speed power transistors with a fast digitalsignal processor, the voltage can be regulated in less than 1 ms [3]. Furthermore, the input voltage canexhibit up to 10% total harmonic distortion (THD), but output of the APLC to the load will typically seea voltage waveform with less than 1.0% THD [3].
As discussed previously, a switching power supply requires current in a nonlinear fashion. Theseload currents may have significant harmonic components. The APLC can cancel up to 100% load currentTHD at full load. The source current being supplied by the power-distribution system will see a purelylinear load with no more than 3% current THD [3].
14.5 References
1. Federal Information Processing Standards Publication No. 94,
Guideline on Electrical Power forADP Installations
, U.S. Department of Commerce, National Bureau of Standards, Washington, DC,1983.
2. Berutti, A.,
Practical Guide to Applying, Installing and Maintaining Transformers
, R. B. Morgan(ed.), Intertec Publishing, Overland Park, KS, p. 13, 1994.
3. Petrecca, R. M., “Mitigating the Effects of Harmonics and Other Distrubances with an Active PowerLine Conditioner,”
Power Quality Solutions,
Intertec International, Ventura, CA, 1997.
14.6 Bibliography
“How to Correct Power Line Disturbances,” Dranetz Technologies, Edison, NJ, 1985.Lawrie, R.,
Electrical Systems for Computer Installations
, McGraw-Hill, New York, 1988.
Noise Suppression Reference Manual,
Topaz Electronics, San Diego, CA.
Pettinger, W., “The Procedure of Power Conditioning,”
Microservice Management
, Intertec Publishing,Overland Park, KS, March 1990.
Smeltzer, D., “Getting Organized about Power,”
Microservice Management
, Intertec Publishing, OverlandPark, KS, March 1990.
© 2007 by Taylor & Francis Group, LLC

227
15
Transient-Suppression
Devices
15.1 Introduction
The performance of discrete transient-suppression components available to engineers has greatly improvedwithin the past 10 years. The variety of reasonably priced devices now available makes it possible to exercisetight control over unwanted voltage excursions and allows the complicated electronic equipment beingmanufactured today to work as intended. Much of the credit for transient-suppression work goes to thecomputer industry, which has been dealing with this problem for more than 2 decades.
Discrete transient-suppression hardware can be divided into three basic categories:
• Filters• Crowbar devices• Voltage-clamping components
15.2 Filter Devices
Filters are designed to pass power-line frequency energy and reject unwanted harmonics and noise. The sim-plest type of ac power-line filter is a capacitor placed across the voltage source. The impedance of the capac-itor forms a voltage divider with the impedance of the source, resulting in attenuation of high-frequencytransients. This simple approach has definite limitations in transient-suppression capability and can intro-duce unwanted resonances with inductive components in the power-distribution system. The addition of aseries resistance will reduce the undesirable resonant effects, but also will reduce the effectiveness of thecapacitor in attenuating transient disturbances.
The conducting enclosure of an electronic device is required to be grounded for reasons of safety. How-ever, this conductor often creates a path for noise currents. Any noise current flowing in a ground loop cancreate noise by electromagnetic coupling or direct connection through stray capacitances. Such noise volt-ages and currents are associated with the potential differences that appear throughout a large interconnectedsystem of grounding conductors. It usually is impossible to eliminate all common-mode noise voltages in apractical ac power-distribution system. It is possible, however, to exert control over where ground loops willoccur and the noise current paths that might result.
Filters intended for ac power applications are usually low-pass devices that remove high-frequencycommon-mode electrical noise. Figure 15.1 illustrates a common filter, known as a
balun
. The balun passesthe flow of normal-mode current without significant voltage drop because the power conductors, wound ona common core, are wound in opposition. Load current does not saturate the core. High-frequency noise orimpulse signals appearing between the equipment ground conductor and the DP load are attenuated by thedevice because of the high impedance presented to the noise signals. The ground voltage offset appearsacross the device, where it will do no harm. Almost identical voltages also appear across the neutral and lineconductor coils, thereby offsetting their voltage-to-equipment ground by the same amount as the frame-to-ground offset.
© 2007 by Taylor & Francis Group, LLC
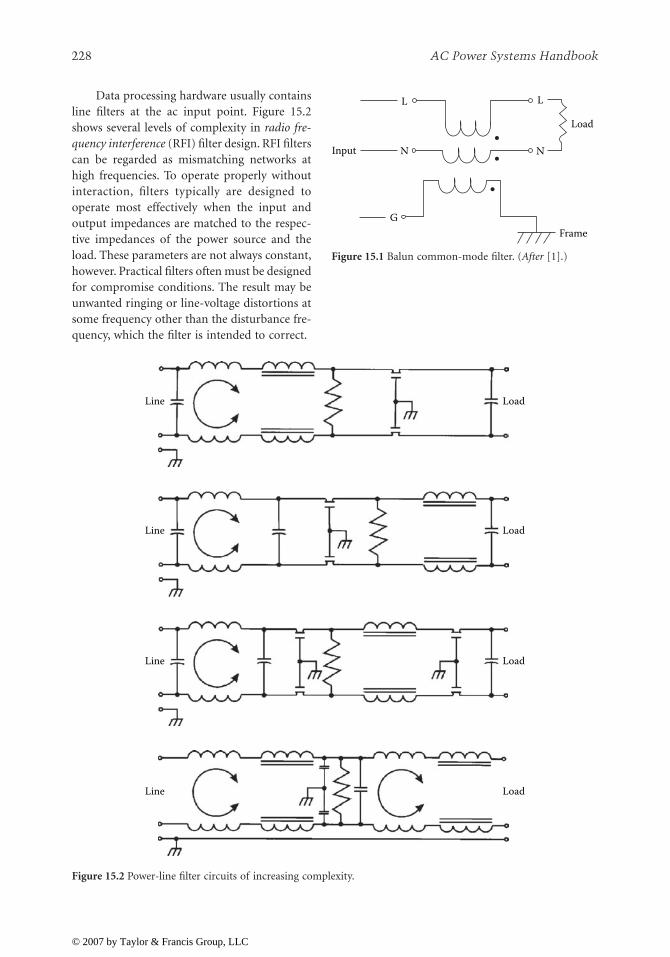
228
AC Power Systems Handbook
Data processing hardware usually containsline filters at the ac input point. Figure 15.2shows several levels of complexity in
radio fre-quency interference
(RFI) filter design. RFI filterscan be regarded as mismatching networks athigh frequencies. To operate properly withoutinteraction, filters typically are designed tooperate most effectively when the input andoutput impedances are matched to the respec-tive impedances of the power source and theload. These parameters are not always constant,however. Practical filters often must be designedfor compromise conditions. The result may beunwanted ringing or line-voltage distortions atsome frequency other than the disturbance fre-quency, which the filter is intended to correct.
Figure 15.2
Power-line filter circuits of increasing complexity.
G
N N
L L
Frame
Load
Input
Figure 15.1 Balun common-mode filter. (After [1].)
LoadLine
LoadLine
Line Load
Line Load
© 2007 by Taylor & Francis Group, LLC

Transient-Suppression Devices
229
Filters can be composed of lumped, distributed, or dissipative elements; the type used is primarilya function of frequency. Filters, in general, are classified according to the band of frequencies to betransmitted or attenuated. The basic types illustrated in Figure 15.3 are low-pass, high-pass, bandpass,and bandstop (reject).
15.3 Crowbar Devices
Crowbar devices include gas tubes (also known as spark-gaps or
gas-gaps
) and semiconductor-based
active crowbar
protection circuits. Although these devices and circuits can shunt a substantial amount oftransient energy, they are subject to
power-follow
problems. Once a gas tube or active crowbar protectioncircuit has fired, the normal line voltage
and
the transient voltage are shunted to ground. This power-fol-low current may open protective fuses or circuit breakers if a method of extinguishing the crowbar clampis not provided. For example, if a short-duration impulse of a fraction of a millisecond triggers a crowbardevice, the shunting action essentially would short-circuit the ac line to which it is connected for at leasta half-cycle, and possibly longer. The transient created by short-circuiting the power conductor may begreater than the event that triggered it. The power-follow effect of a crowbar device is illustrated in Figure15.4. The arc in most gas tube crowbar devices will extinguish at 20 to 30 V. It is fair to point out, how-ever, that crowbar devices are well-suited to low source current applications, such as telco and data lines.
The most common crowbar components include pellet-type and gas-discharge-type surge arrestors.These devices usually are capable of handling high currents because the voltage drop through thembecomes very low when the units are conducting.
The selection of a crowbar device, the location(s) where it can be most effective, and applicablesafety precautions require a solid understanding of surge voltages and the nature of traveling pulse waves.In general, crowbar devices are most appropriate where current in an inductive circuit element can beinterrupted. They also may be warranted where long cables interconnect widely separated ac systems.
15.3.1 Characteristics of Arcs
Defined very broadly, an arc can be described as a discharge of positive ions and electrons between elec-trodes in air, vapor, or both, which has a potential drop at the cathode on the order of magnitude of theminimum ionizing potential of the air, vapor, or both. A unique characteristic of an arc is the
negativeresistance
effect; increasing current reduces the arc resistance. Consequently, in a given circuit, the arcvoltage drop remains fairly constant, regardless of the current magnitude. Larger currents reduce theimpedance, but the voltage drop remains the same. Arcs extinguish themselves at the ac zero crossing,requiring a voltage much greater than the arc voltage drop to reignite.
15.4 Voltage-Clamping Devices
Voltage-clamping components are not subject to the power-follow problems common in crowbar sys-tems. Clamping devices include selenium cells, zener diodes, and varistors of various types. Zener diodes,using improved silicon rectifier technology, provide an effective voltage clamp for the protection of sensi-tive electronic circuitry from transient disturbances. On the other hand, power dissipation for zener unitsis usually somewhat limited, compared with other suppression methods.
Selenium cells and varistors, although entirely different in construction, act similarly on a circuitexposed to a transient overvoltage. Figure 15.5 illustrates the variable nonlinear impedance exhibited by avoltage-clamping device. The figure also shows how these components can reduce transient overvoltagesin a given circuit. The voltage-divider network established by the source impedance
Z
s
and the clamping-device impedance
Z
c
attenuates voltage excursions at the load. It should be understood that the transientsuppressor depends upon the source impedance to aid the clamping effect. A protection device cannot befully effective in a circuit that exhibits a low source impedance because the voltage-divider ratio isreduced proportionately. It also must be recognized that voltage-clamp components divert surge
© 2007 by Taylor & Francis Group, LLC

230
AC Power Systems Handbook
Figure 15.3
Common filter circuits, classified by function. (
From
[2].
Used with permission
.)
Frequency
Frequency Frequency
Frequency
Atte
nuat
ion
Atte
nuat
ion
Atte
nuat
ion
Atte
nuat
ion
Stopbandattenuates allfrequencies inthis section
Passbandpasses all
frequenciesin this section
Stopbandattenuates allfrequencies in
this section
fc1
fc fc
fc2 fc1 fc2
Band-pass filter Band-reject filter
Pass
band
pass
es a
ll fre
quen
cies
in th
is se
ctio
n
Pass
band
pass
es a
ll fre
quen
cies
in th
is se
ctio
n
Pass
es a
ll fre
quen
cies
in th
is se
ctio
n
Pass
es a
ll fre
quen
cies
in th
is se
ctio
n
Stopbandattenuates
all frequenciesin this section
R1
RL
RLRL
RL
RL
RL
RL
RL
L1 L1
L
(R)
(R) (R)
L
L L
L
L L
L
L
L
RL
C1
C1
C1
C1
R1
R1
R1
R1
R1
R1
R1
R1 R1
L1 L1
L2L2
C2
C2RL
Attenuates allfrequencies in
this section
Attenuates allfrequencies in this section
StopbandStopbandPassband
Passband
Cuto
ff fre
quen
cy
Cuto
ff fre
quen
cy
Filtertype Low-pass filter High-pass filter
C
C
C
C
C C
CC
C
C
C
C
T
or
R Cπ
π
© 2007 by Taylor & Francis Group, LLC

Transient-Suppression Devices
231
Figure 15.4
The power-follow effect of a crowbar device.
Figure 15.5
The mechanics of transient suppression using a voltage-clamping device.
Sine wave
Normal wave
Sine wave with surge
0 V
0 V
0 V
20 to 30 V “arc voltage”
Missing power (follow-on current)
Y
Y
Y
dv/dt of gas tube crowbar
Variable impedance
transient suppressor
Tran
sient
volta
ge so
urce
Systeminductance
Z5
Transient suppression usinga voltage divider network
Voltageacross load
Straycapacitance
Leadinductance Leakage
resistance
Variable impedanceclamping element
Clamping-typing suppressorequivalent circuit
Lead/junctionresistance
Zc
© 2007 by Taylor & Francis Group, LLC

232
AC Power Systems Handbook
currents; they do not absorb them. Care must be taken to ensure that the diversion path does not createnew problems for the ac power system.
A typical voltage-vs.-current curve for a voltage-clamping device is shown in Figure 15.6. When thedevice is exposed to a high-voltage transient, the impedance of the component changes from a highstandby value to a low conductive value, clamping the voltage at a specified level. The clamping effectcommon with this class of devices is illustrated in Figure 15.7.
A selenium thyrector device, intended for low- to medium-power applications, is shown in Figure15.8. Voltage-clamping components are available in a variety of configurations, from high-power chassis-mount units to surface-mount devices designed for use on printed wiring boards. Selenium-cell transientsuppressors can handle high-energy transients and repeated hits very well, but have poor voltage-clamp-ing ability. Combination units are available, however, that use selenium devices, custom-fabricated tominimize the undesirable characteristics and to take advantage of the desirable ones. Table 15.1 comparesthe attributes of a variety of transient-suppression technologies.
At the clamping voltage, the clamping-device impedance goes low, but it does not fall to nearly zero,as occurs with crowbar devices [3]. There is, therefore, essentially no short-circuit magnitude follow cur-rent. Clamping voltage is maintained on the system load. The lower the source impedance, however, themore difficult it is for the clamping device to maintain system voltage without drawing excessive current.
Clamping devices operate in the nanosecond range, thousands of times faster than crowbar devices,but are generally capable of dissipating considerably less transient energy. They effectively clamp voltagespikes to a maximum level but have no effect on notches or brief dropouts.
Figure 15.6
The current-vs.-voltage transfer curve for a clamping device. Note the
conduction knee
.
Figure 15.7
The clamping action of an MOV: (
a
) an oscillatory transient on the ac waveform, (
b
) the same waveformclamped by an MOV on the ac circuit. (
From
[3].
Used with permission
.)
Standby current
Voltage +Voltage –
Current Conduction
current
Conduction knee
BA
Clampingvoltage
© 2007 by Taylor & Francis Group, LLC

Transien
t-Suppression
Devices
233
Table 15.1
Comparison of Various Transient Suppression Technologies
Device Type
Leakage
Follow Current
Clamping Voltage
Energy Capability
Capacitance
Response Time
Ideal device Zero to low No Low High Low or high Fast
Metal-oxide varistor Low No Moderate to low High Moderate to high Fast
Zener diode Low No Low Low Low Fast
Gas discharge tube Zero YesHigh ignition voltage
Low clampHigh Low Slow
© 2007 by Taylor & Francis Group, LLC

234
AC Power Systems Handbook
Metal-oxide varistors
(MOVs), the mostcommon of the clamping devices, are availablefor use at a wide range of voltages and cur-rents. The range of parameters includes
:
• Voltages as low as 4 V for data lines upto several thousand volts for power sys-tems
• Peak pulse currents from a few amperesup to tens of thousands of amperes
• Energy dissipation from less than 1 toover 10,000 joules
MOVs are low in cost, compact in size,and easy to apply, and are among the mostfrequently used devices for transient protec-tion. One disadvantage of the MOV is that its operating characteristics deteriorate with repeated tran-sients. Although this problem has been reduced with improved technologies, MOV life under frequenttransient conditions must be considered.
Silicon-carbide varistors have high power-handling capability and are used in high-voltage surge(lightning) arresters. The devices tend to draw considerable current in the normal state, and so they arecommonly used in series with a gap that provides an open circuit until a surge occurs. This propertymakes silicon-carbide varistors unsatisfactory for low-voltage clamping operation. Newer zinc-oxidelightning arresters have better nonlinear characteristics and can be used without a gap. They are essen-tially crowbar devices, but perform almost like clamping devices.
15.4.1 Zener Components
Zener diodes exhibit high impedance below the zener or avalanche voltage (
V
Z
), and very low impedanceabove
V
Z
. Because of these clipping characteristics, the zener diode is often used to suppress transients[4]. Zeners are intolerant of excessive stress, and so it is important to know the power-handling capabilityfor short pulse durations.
Most zeners handle less than their rated power during normal applications and are designed to oper-ate most effectively at this low level. Zener transient suppressors (such as the Motorola 1N6267 MoSorbseries), sometimes known as
silicon avalanche diodes
(SADs), typically are designed to withstand rela-tively large, short-duration power pulses. This is accomplished by enlarging the chip and the effectivejunction area to withstand high-energy surges. Figure 15.9 charts the short-pulse surge capability of thesedevices. This data applies for nonrepetitive conditions with a lead temperature of 25°C.
It is necessary to determine the pulse width and peak power of the transient being suppressed whenusing Figure 15.9. This can be done by taking whatever waveform the transient is and approximating itwith a rectangular pulse with the same peak power. For example, an exponential discharge with a 1 mstime constant can be approximated by a rectangular pulse 1 ms wide that has the same peak power as thetransient. This would be a better approximation than a rectangular pulse 10 ms wide with a correspond-ingly lower amplitude because the heating effects of different pulse widths affect the power handlingcapability of the device, as can be observed in Figure 15.9. Such an approximation also represents a con-servative approach because the exponential discharge will contain approximately one-half the energy of arectangular pulse with the same pulse width and amplitude.
When used in repetitive applications, the peak power must be reduced as indicated by the curvesgiven in Figure 15.10. Average power also must be derated as the lead or ambient temperature exceeds25°C. The power derating curve normally given on data sheets can be normalized and used for this pur-pose.
Figure 15.8 Selenium thyrector voltage-clamping device.
© 2007 by Taylor & Francis Group, LLC

Transient-Suppression Devices
235
The clamping characteristics of zeners and MOVs are best compared by measuring their voltagesunder transient conditions. The waveform traces of Figure 15.11 are the result of a bench test performedto compare the clamping characteristics of a zener with those of a common MOV; both were 27 Vdevices. Waveform 6.11
a
shows the pulse generator output voltage, which synthesizes a common type oftransient pulse. Waveforms 6.11
b
and
c
show the clamping voltages of the MOV and zener, respectively,with a surge source impedance of 500
Ω
. As shown in the waveform traces, the zener suppressor has sig-nificantly better voltage-clamping characteristics than the MOV. The major tradeoff with using a zener-type suppressor is its cost-vs.-power handling capability.
If a transient is impressed on the circuit that exceeds the capabilities of the particular zener or MOVused, the load will still be protected because both devices fail in a short circuit. The theoretical reaction
Figure 15.9
Peak power ratings of common zener diodes. (
Courtesy of Motorola.
)
Figure 15.10
Typical derating factor for zener duty cycle. (
Courtesy of Motorola.
)
0.05
0.05
0.01 0.01
0.02
0.02
Pulse width (ms) 0.1
0.1
2
5
1
0.2
0.5
100
10
20
50
0.2 0.5 1 2 5 10
5 Watt types
250 mW to 1 W types Glass do–35 and glass do–41
1 to 3 W types Plastic do–41
1N6267 Series
D, duty cycle (%)0.50.20.1
0.01
0.02
0.03
0.050.07
0.1
0.2
0.3
0.50.7
1
1 2 5 50 10010 20
Der
atin
g fa
ctor Pulse width
10 ms
1 ms
100 µs
10 µs
© 2007 by Taylor & Francis Group, LLC

236
AC Power Systems Handbook
Figure 15.11
Voltage clamping performance comparison: (
a
) open-circuit transient pulse, vert. = 20 V/div, horiz. =0.5 ms/div, V
peak
= 90 V; (
b
) transient pulse with 27 V MOV applied, vert. = 10 V/div, horiz. = 0.5 ms/div, transientsource impedance = 500
Ω
, V
peak
= 39.9 V; (
c
) transient pulse with 27 V zener applied, vert. = 10 V/div, horiz. = 0.5ms/div, transient source impedance = 500
Ω
, V
peak
= 27 V. (
Courtesy Motorola.
)
(a)
(c)
(b)
10090
100%
10090
100%
10090
100%
© 2007 by Taylor & Francis Group, LLC

Transient-Suppression Devices
237
time for a zener device is in the picosecond range, but this is slowed somewhat because of lead and pack-age inductance. For very fast rising transients, it is important, therefore, to minimize external induc-tances (resulting from wiring and other factors), which will minimize overshoot.
Connecting zeners in a back-to-back arrangement will enablebidirectional voltage-clamping characteristics, as illustrated in Figure15.12. If devices
A
and
B
are of the same voltage rating, a transient ofeither polarity will be clamped at approximately that voltage (onezener will be reverse-bias mode while the other will be in the forward-bias mode). When clamping low voltages, it may be necessary to con-sider the forward voltage drop of the forward-biased zener. Bipolarzener devices also are available as packaged components.
In almost every application, the transient suppression device isplaced in parallel with the load, or in parallel with the component tobe protected. Because the main purpose of the circuit is to clamp thevoltage appearing across the load, the suppressor should be placed asclose to the load as possible to minimize overshoot resulting from wir-ing (or other inductive) effects. Figure 15.13 illustrates the results ofinductive overshoot.
When the zener is in the breakdownmode of operation (e.g., when suppressing atransient), its effective capacitance increasesdrastically from what it was in the off-state.This makes the zener ideal for parallel pro-tection schemes because, during transientsuppression, its large effective capacitancewill tend to hold the voltage across the pro-tected element constant, while in the off-state (normal conditions, no transientpresent), its low off-state capacitance willnot attenuate high-frequency signals.
15.4.2 Hybrid Suppression Circuits
Any of the elements discussed so far in this chapter can be combined into a single hybrid unit to gain thebest elements of each technology. A hybrid protector can be designed that will respond to several types ofline disturbances. As shown in Figure 15.14, a gas tube commonly is combined with a silicon clampingdevice to provide two-stage suppression. When a transient hits, the clamping device will initially limit thevoltage because of its faster response time, relative to the gas tube. The tube will then fire and crowbar thebulk of the energy. Proper matching of the gas tube and the clamping device is an important designparameter. If, for example, the tube is not presented with sufficient voltage to ensure that it fires, the sili-con device will have to take the full surge energy, and may be destroyed in the process. The series imped-ance shown in the diagram can be a resistor or an inductor, or simply the interconnection impedance ofthe wiring system. It is sized to pass the full load current while still providing sufficient impedance toensure that the tube will fire.
A multistage suppressor is shown in Figure 15.15. The circuit is composed primarily of metal-oxidevaristors. V
R1
and V
R2
are the primary devices, and they absorb most of the overvoltage transients. Induc-tors L
1
and L
2
work with V
R3
to exercise tight control over voltage excursions.The response time of voltage-clamping devices is significantly affected by lead inductance. For this
reason, lead lengths for all devices in a protection unit should be kept to a minimum.
or
A
BB
A
Figure 15.12 Zener arrange-ment for bidirectional clamp-ing. (Courtesy of Motorola.)
Peak voltageDue to overshoot
Transientinput
Zenervoltage
Figure 15.13 Transient clamp overshoot resulting from induc-tive effects of the wiring system. (Courtesy of Motorola.)
© 2007 by Taylor & Francis Group, LLC

238
AC Power Systems Handbook
15.5 Selecting Protection Components
Selecting a transient-suppression device for a given application is a complicated procedure that must takeinto account the following factors:
• The steady-state working voltage, including normal tolerances of the circuit• The transient energy to which the device is likely to be exposed• The voltage-clamping characteristics required in the application• Circuit-protection devices (such as fuses or circuit breakers) present in the system• The consequences of protection-device failure in a short-circuit mode• The sensitivity of load equipment to transient disturbances
Most transient-suppression equipment manufacturers offer detailed application handbooks. Consultsuch reference data whenever planning to use a protection device. The specifications and ratings ofsuppression components are not necessarily interchangeable from one manufacturer to another. Carefullyexamine all variables in any planned addition of transient-suppression devices to a piece of equipmentor ac power-distribution system. Make allowances for operation of the circuit under all reasonableconditions.
15.6 References
1. Federal Information Processing Standards Publication No. 94
, Guideline on Electrical Power forADP Installations
, U.S. Department of Commerce, National Bureau of Standards, Washington, DC,1983.
Figure 15.14
A two-stage hybrid protection circuit.
Figure 15.15
A multistage hybrid protection circuit utilizing MOVs, inductors, and capacitors.
Isolatingimpedance(R, L, or RL)
Gastube
Limitingimpedance
Lineinput Clamp Protected
line
Lineinput
VR2
VR1
VR3
C1 C2
L2
L1
Protectedline
© 2007 by Taylor & Francis Group, LLC

Transient-Suppression Devices
239
2. Hemming, L. H., et al., “Compatibility,” in
The Electrical Engineering Handbook
, Richard Dorf(Ed.), CRC Press, Boca Raton, FL, p 914, 1993.
3. DeDad, J. A., “Surge and Transient Protection,” in
Practical Guide to Quality Power for SensitiveElectronic Equipment
, A. Berutti and R. M. Waggoner (Eds.), PRIMEDIA Intertec, Overland Park,KS, pp. 39–44, 1996.
4. Motorola Application Note AN843, Motroloa Semiconductor, Phoenix, AZ.
15.7 Bibliography
Belling, M., “Judging Surge Suppressor Performance,”
Microservice Management
, Intertec Publishing,Overland Park, KS, March 1990.
Block, R., “The Grounds for Lightning and EMP Protection,” PolyPhaser Corporation, Gardnerville, NV,1987.
Fardo, S., and D. Patrick,
Electrical Power Systems Technology
, Prentice-Hall, Englewood Cliffs, NJ, 1985.
Fink, D., and D. Christiansen (eds.),
Electronics Engineers' Handbook
, 3rd ed., McGraw-Hill, New York,NY, 1989.
MOV Varistor Data and Applications Manual
, General Electric Company, Auburn, NY, 1976.
© 2007 by Taylor & Francis Group, LLC

241
16
Facility Wiring and
Transient Protection
16.1 Introduction
Most transient disturbances that a facility will experience enter the plant through the utility company acpower line. Effective transient suppression, therefore, begins with proper installation of the ac power-systemwiring. If possible, arrange with the local utility to have a separate transformer feed the facility. The initialcost may be higher, but it will reduce the chances that transient disturbances from nearby operations willaffect sensitive equipment. Do not allow the placement of noisy loads on the facility power line. Devices suchas arc-welders, heavy electric motors, elevators, and other large loads can create an electrical environmentthat is prone to equipment malfunctions. It should be noted, however, that because transient disturbances,by definition, are high-frequency events, they will capacitively couple from the primary to the secondary of atypical utility company transformer. Simply installing a dedicated transformer that is not equipped with aFaraday shield (utility transformers generally do not have such shields) will not, in itself, protect equipmentfrom potential damage. Installation of a dedicated utility transformer, however, will reduce the likelihood ofproblems and permit the establishment of a facility ground system independent of other users.
16.2 Facility Wiring
All ac wiring within a facility should be performed by an experienced electrical contractor and always fullywithin the local electrical code. Confirm that all wiring is sized properly for the load current. Table 16.1 liststhe physical characteristics for various wire sizes. The current-carrying capability (ampacity) of single con-ductors in free air is listed in Table 16.2. The ampacity of conductors in a raceway or cable (three or fewerconductors) is listed in Table 16.3.
Synthetic insulation for wire and cable is classified into two broad categories: (1)
thermosetting
, and (2)
thermoplastic
. A wide variety of chemical mixtures can be found within each category. Most insulation is com-posed of compounds made from synthetic rubber polymers (thermosetting) and from synthetic materials(thermoplastics). Various materials are combined to provide specific physical and electrical properties. Ther-mosetting compounds are characterized by their ability to be stretched, compressed, or deformed within rea-sonable limits under mechanical stress and then to return to their original shape when the stress is removed.Thermoplastic insulation materials are best known for their electrical characteristics and relatively low cost.Thermoplastics permit insulation thickness to be reduced while maintaining good electrical properties.
Many different types of insulation are used for electric conductors. The operating conditions determinethe type of insulation used. Insulation types are identified by abbreviations established in the National Elec-trical Code (NEC). The most popular types are
•
R
: Rubber, rated for 140°F•
RH
: Heat-resistant rubber, rated for 167°F•
RHH
: Heat-resistant rubber, rated for 194°F•
RHW
: Moisture- and heat-resistant rubber, rated for 167°F•
T
: Thermoplastic, rated for 140°F•
THW
: Moisture- and heat-resistant thermoplastic, rated for 167°F•
THWN
: Moisture- and heat-resistant thermoplastic with nylon, rated for 194°F
© 2007 by Taylor & Francis Group, LLC

242
AC Power Systems Handbook
Table 16.1
Physical Characteristics of Standard Sizes of Copper Cable (at 25
°
C)
Wire Size
(AWG/MCM)
Area
(cmil)Number of
ConductorsDiameter Each
Conductor
DC Resistance
Ω
/1000 ft
Copper
Aluminum
12 6,530 1 0.0808 1.6200 2.660010 10,380 1 0.1019 1.0180 1.6700
8 16,510 1 0.1285 0.6404 1.05006 26,240 7 0.0612 0.4100 0.67404 41,740 7 0.0772 0.2590 0.42403 52,620 7 0.0867 0.2050 0.33602 66,360 7 0.0974 0.1620 0.26601 83,690 19 0.0664 0.1290 0.21100 105,600 19 0.0745 0.1020 0.1680
00 133,100 19 0.0837 0.0811 0.1330000 167,800 19 0.0940 0.0642 0.1050
0000 211,600 19 0.1055 0.0509 0.0836250 250,000 37 0.0822 0.0431 0.0708300 300,000 37 0.0900 0.0360 0.0590350 350,000 37 0.0973 0.0308 0.0505400 400,000 37 0.1040 0.0270 0.0442500 500,000 37 0.1162 0.0216 0.0354600 600,000 61 0.0992 0.0180 0.0295700 700,000 61 0.1071 0.0154 0.0253750 750,000 61 0.1109 0.0144 0.0236800 800,000 61 0.1145 0.0135 0.0221900 900,000 61 0.1215 0.0120 0.0197
1000 1,000,000 61 0.1280 0.0108 0.0177
Table 16.2
Permissible Ampacities of Single Conductors in Free Air
Wire Size
Copper Wire with
Aluminum Wire with
R, T, TW
InsulationRH, RHW, TH,
THW InsulationR, T, TW
InsulationRH, RHW, TH, THW
Insulation
12 25 25 20 2010 40 40 30 30
8 55 65 45 556 80 95 60 754 105 125 80 1003 120 145 95 1152 140 170 110 1351 165 195 130 1550 195 230 150 180
00 225 265 175 210000 260 310 200 240
0000 300 360 230 280250 340 405 265 315300 375 445 290 350350 420 505 330 395400 455 545 355 425500 515 620 405 485600 575 690 455 545700 630 755 500 595750 655 785 515 620800 680 815 535 645900 730 870 580 700
1000 780 935 625 750
© 2007 by Taylor & Francis Group, LLC

Facility Wiring and Transient Protection
243
16.2.1 Utility Service Entrance
Figure 16.1 shows a typical service entrance, with the neutral line from the utility company tied toground and to a ground rod at the meter panel. Where permitted by the local code, this should be theonly point at which neutral is tied to ground in the ac distribution system.
Figure 16.2 shows a three-phase power-distribution panel. Note that the neutral and ground con-nections are kept separate. Most ac distribution panels give the electrical contractor the ability to lift theneutral from ground by removing a short-circuiting screw in the breaker-panel chassis. Where permittedby local code, insulate the neutral lines from the cabinet. Bond the ground wires to the cabinet for safety.Always run a separate, insulated green wire for ground. Never rely on conduit or other mechanical struc-tures to provide an ac system ground to electric panels or equipment.
A single-phase power-distribution panel is shown in Figure 16.3. Note that neutral is insulated fromground and that the insulated green ground wires are bonded to the panel chassis.
Table 16.3
Permissible Ampacities of Conductors in a Raceway or Cable (three or fewer conductors total)
Wire Size
Copper Wire with
Aluminum Wire with
R, T, TW
InsulationRH, RHW, TH,
THW InsulationR, T, TW
InsulationRH, RHW, TH, THW
Insulation
12 20 20 15 1510 30 30 25 25
8 40 45 30 406 55 65 40 504 70 85 55 653 80 100 65 752 95 115 75 901 110 130 85 1000 125 150 100 120
00 145 175 115 135000 165 200 130 155
0000 195 230 155 180250 215 255 170 205300 240 285 190 230350 260 310 210 250400 280 335 225 270500 320 380 260 310600 355 420 285 340700 385 460 310 375750 400 475 320 385800 410 490 330 395900 435 520 355 425
1000 455 545 375 445
Figure 16.1
Connection arrangement for a three-phase utility company service panel.
Service ground on customer
premises
Power company ground at
transformer
120/280 V three-phasefour-wire transformer
secondaryL1 L2
L3 N
Service panel
Main disconnect Main
fuses or CB
BK BK BK
WH
GN
Tothree-phasedistribution
panel
Meter
Neutral
Ground
© 2007 by Taylor & Francis Group, LLC

244
AC Power Systems Handbook
Figure 16.2
Connection arrangement of the neutral and green-wire ground system for a three-phase ac distributionpanel.
Figure 16.3
Connection arrangement of the neutral and green-wire ground system for a single-phase ac distributionpanel.
Ground
Neutral
From service panel
To si
ngle
-pha
se lo
ads
three-phase distribution panel
To 3
-pha
se lo
ad
BK BK BK
BK BK BK
BK WH
WH WH GN
GN
GN
BK WH GN
BK WH GN
This ground is thesystem star ground point.
Ground
Conduitfrom distribution
system
BKWH WH
GNGN
AC power distribution panel
Neutral
BK
WH
WH
GN
GN
BK
BK
© 2007 by Taylor & Francis Group, LLC

Facility Wiring and Transient Protection
245
Conduit runs often are a source of noise. Corrosion of the steel-to-steel junctions can act as an RFdetector. Conduit feeding sensitive equipment may contact other conduit runs powering noisy devices,such as elevators or air conditioners. Where possible (and permitted by the local code), eliminate thisproblem by using PVC pipe, Romex, or jacketed cable. If metal pipe must be used, send the noise to thepower ground rods by isolating the green ground wire from the conduit with a ground-isolating (orange)receptacle. When using an orange receptacle, a second ground wire is required to bond the enclosure tothe ground system, as shown in Figure 16.4. In a new installation, isolate the conduit from building metalstructures or other conduit runs. Consult the local electrical code and an experienced electrical contrac-tor before installing or modifying any ac power-system wiring. Make sure to also secure any necessarybuilding permits for such work.
16.3 Power-System Protection
Transient-protection methods for a commercial/industrial facility vary considerably, depending on thesize and complexity of the plant, the sensitivity of equipment at the facility, and the extent of transientactivity present on the primary power lines. Figure 16.5 shows one approach to transient suppression fora transmission facility. Lightning arresters are built into the 12 kV-to-208 V, three-phase, pole-mountedtransformer. The service drop comes into the meter panel and is connected to a
primary lightning arrester
and a
primary varistor
. The circuit shown is duplicated three times for a three-wire wye (208 V phase-to-phase, 120 V phase-to-neutral) power system.
The primary arrester and varistor are placed at the service drop input point to protect the main cir-cuit breaker and power-system wiring from high-voltage transients that are not clipped by the lightningarrester at the pole or by the varistors later in the circuit path. The primary varistor has a higher maxi-mum clamp voltage than the varistors located after the main breaker, causing the devices downstream tocarry most of the clamp-mode current when a transient occurs (assuming low system inductance). If themain circuit breaker opens during a transient disturbance, the varistor at the service drop entrance willkeep the voltage below a point that could damage the breaker or system wiring.
Placing overvoltage protection before the main service breaker can be considered only when the ser-vice drop transformer feeds a single load and when the transformer has transient protection of its own,including lightning arresters and primary-side fuses. Consult the local power company before placingany transient-suppression devices ahead of the main breaker.
Transient protection immediately after the main breaker consists of a
secondary varistor
and a capac-itor between each leg and neutral. A 47
Ω,
10 W series resistor protects the circuit if the capacitor fails. Italso reduces the resonant effects of the capacitor and ac distribution-system inductance. The varistorclips overvoltages as previously described, and the resistor-capacitor network helps eliminate high-fre-quency transients on the line. The capacitor also places higher capacitive loading on the secondary of theutility company step-down transformer, reducing the effects of turn-on spikes caused by capacitive cou-pling between the primary and the secondary of the pole- or surface-mounted transformer.
As an extra measure of protection, a
supplemental varistor
and
RC
snubber are placed at the primarypower input to the load. Transient suppressors are placed as needed at the ac power-distribution paneland circuit-breaker box.
16.3.1 Staging
The transient-suppression system shown in Figure 16.5 uses a technique known as
staging
of protectioncomponents. An equivalent circuit of the basic system is shown in Figure 16.6. The staging approachtakes advantage of the series resistance and impedance of the ac wiring system of a facility to aid in tran-sient suppression.
When appreciable inductance or resistance exists in an ac distribution system, the protection com-ponents located at the utility company service drop entrance (the primary suppressors) will carry most ofthe suppressed-surge current in the event of a lightning strike or major transient disturbance. The
© 2007 by Taylor & Francis Group, LLC
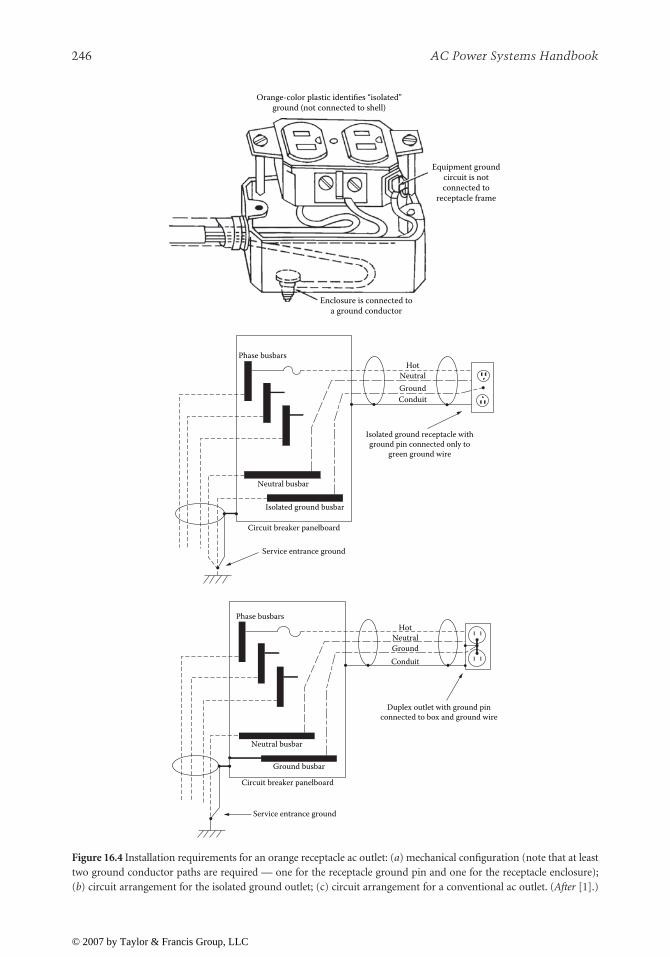
246
AC Power Systems Handbook
Figure 16.4
Installation requirements for an orange receptacle ac outlet: (
a
) mechanical configuration (note that at leasttwo ground conductor paths are required — one for the receptacle ground pin and one for the receptacle enclosure);(
b
) circuit arrangement for the isolated ground outlet; (c) circuit arrangement for a conventional ac outlet. (
After
[1].)
Enclosure is connected toa ground conductor
Equipment groundcircuit is notconnected to
receptacle frame
Orange-color plastic identifies “isolated”ground (not connected to shell)
Service entrance ground
Circuit breaker panelboard
Isolated ground busbar
Neutral busbar
NeutralGround
Isolated ground receptacle withground pin connected only to
green ground wire
Conduit
HotPhase busbars
Service entrance ground
Circuit breaker panelboard
Ground busbar
Neutral busbar
NeutralGround
Duplex outlet with ground pinconnected to box and ground wire
Conduit
HotPhase busbars
© 2007 by Taylor & Francis Group, LLC

Facility Wiring and Transient Protection
247
varistors and
RC
networks downstream (the secondary and supplemental suppressors) are rated forclamp voltages lower than the primary protection devices. With the assistance of the ac circuit seriesresistance and impedance, the secondary and supplemental devices exercise tight control over voltageexcursions.
The staged arrangement also protects the system from exposure caused by a transient-suppressiondevice that — for whatever reason — becomes ineffective. The performance of an individual suppressioncomponent is more critical in a system that is protected at any one point than it is in a system protected atseveral points. The use of staged suppression also helps prevent transients generated by load equipmentfrom being distributed to other sections of a facility, because suppressors can be located near offendingmachines.
Figure 16.5
The application of transient-suppression components in a systemwide protection plan. Install suchhardware with extreme care and only after consultation with the local utility company and an electrical contractor.
Figure 16.6
The use of ac system series inductance and resistance to aid transient suppressors in controlling linedisturbances. This technique is known as
staging
.
AC power distribution and circuit breaker box
120V AC to equipment racks (protect as needed)
Note: Protection design is shown for only one of the three phase AC utility company inputs.
Neutral
Primary lightning arrester
Leg-1 (of 3)
three-phasepower inputfrom utility
(four-wire WYE) Main circuit breaker (200A)
Transmitter circuit breaker
(125A)
Primary varistor
Secondary varistor
Transmitte
R-1 47Ω, 10W
R-2 47 Ω, 10 W
C-1 0.1μF 5kV
C-2 0.1 μF 5 kV
Utility company
meter
Supplemental varistor
Note:Only one ACphase is shownfor simplicity.
Neutral
AC input
Utilitycompany
meter Series inductanceand resistance
Maincircuitbreaker Series inductance
and resistance
Transmittercircuitbreaker
Straycapacitance
Straycapacitance
Supplementalvaristor and R-C
network
Secondaryvaristor and R-C
network
Primary varistorand lightning
arrester
Load
© 2007 by Taylor & Francis Group, LLC
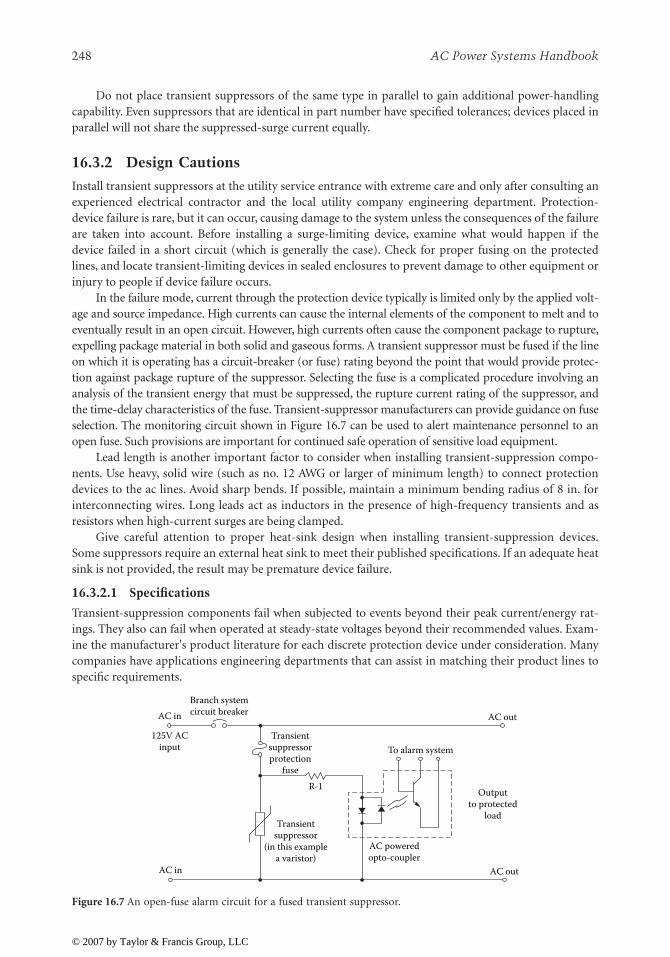
248
AC Power Systems Handbook
Do not place transient suppressors of the same type in parallel to gain additional power-handlingcapability. Even suppressors that are identical in part number have specified tolerances; devices placed inparallel will not share the suppressed-surge current equally.
16.3.2 Design Cautions
Install transient suppressors at the utility service entrance with extreme care and only after consulting anexperienced electrical contractor and the local utility company engineering department. Protection-device failure is rare, but it can occur, causing damage to the system unless the consequences of the failureare taken into account. Before installing a surge-limiting device, examine what would happen if thedevice failed in a short circuit (which is generally the case). Check for proper fusing on the protectedlines, and locate transient-limiting devices in sealed enclosures to prevent damage to other equipment orinjury to people if device failure occurs.
In the failure mode, current through the protection device typically is limited only by the applied volt-age and source impedance. High currents can cause the internal elements of the component to melt and toeventually result in an open circuit. However, high currents often cause the component package to rupture,expelling package material in both solid and gaseous forms. A transient suppressor must be fused if the lineon which it is operating has a circuit-breaker (or fuse) rating beyond the point that would provide protec-tion against package rupture of the suppressor. Selecting the fuse is a complicated procedure involving ananalysis of the transient energy that must be suppressed, the rupture current rating of the suppressor, andthe time-delay characteristics of the fuse. Transient-suppressor manufacturers can provide guidance on fuseselection. The monitoring circuit shown in Figure 16.7 can be used to alert maintenance personnel to anopen fuse. Such provisions are important for continued safe operation of sensitive load equipment.
Lead length is another important factor to consider when installing transient-suppression compo-nents. Use heavy, solid wire (such as no. 12 AWG or larger of minimum length) to connect protectiondevices to the ac lines. Avoid sharp bends. If possible, maintain a minimum bending radius of 8 in. forinterconnecting wires. Long leads act as inductors in the presence of high-frequency transients and asresistors when high-current surges are being clamped.
Give careful attention to proper heat-sink design when installing transient-suppression devices.Some suppressors require an external heat sink to meet their published specifications. If an adequate heatsink is not provided, the result may be premature device failure.
16.3.2.1 Specifications
Transient-suppression components fail when subjected to events beyond their peak current/energy rat-ings. They also can fail when operated at steady-state voltages beyond their recommended values. Exam-ine the manufacturer's product literature for each discrete protection device under consideration. Manycompanies have applications engineering departments that can assist in matching their product lines tospecific requirements.
Figure 16.7
An open-fuse alarm circuit for a fused transient suppressor.
AC out
AC out
Outputto protected
load
AC poweredopto-coupler
To alarm systemTransient
suppressorprotection
fuse
Transientsuppressor
(in this examplea varistor)
R-1
AC in
AC in
125V ACinput
Branch systemcircuit breaker
© 2007 by Taylor & Francis Group, LLC

Facility Wiring and Transient Protection
249
Consider using hybrid protection devices thatprovide increased product lifetime. For example, avaristor normally exhibits some leakage current.This leakage can lead to device heating and even-tual failure. Hybrid devices are available that com-bine a varistor with a gas-filled spark-gap device tohold the leakage current to zero during standbyoperation, extending the expected product lifetime.During a transient, the spark-gap fires and thevaristor clamps the pulse in the normal way. Such adevice is shown in Figure 16.8. Hybrid devices ofthis type are immune to power-follow problemsdiscussed in Section 6.1.2.
16.3.3 Single-Phasing
Any load using a three-phase ac power source issubject to the problem of
single-phasing
, the loss ofone of the three legs from the primary power-dis-tribution system. Single-phasing is usually a utility company problem, caused by a downed line or ablown pole-mounted fuse. The loss of one leg of a three-phase line results in a particularly dangerous sit-uation for three-phase motors, which will overheat and sometimes fail. Figure 16.9 shows a simple pro-tection scheme that has been used to protect industrial equipment from damage caused by single-phasing. At first glance, the system appears capable of easily handling the job, but operational problemscan result.
The loss of one leg of a three-phase line rarely results in zero (or near-zero) voltages in the legs asso-ciated with the problem line. Instead, a combination of leakage currents caused by
regeneration
of themissing legs in inductive loads and the system load distribution usually results in voltages of some sort onthe fault legs of the three-phase supply. It is possible, for example, to have phase-to-phase voltages of 220V, 185 V, and 95 V on the legs of a three-phase, 208 Vac line experiencing a single-phasing problem. Thesevoltages may change, depending upon what equipment is switched on at the facility.
Integrated circuit technology has provided a cost-effective solution to this common design problem.Phase-loss protection modules are available from several manufacturers that provide a contact closurewhen voltages of proper magnitude and phase are present on the monitored line. The relay contacts canbe wired into the logic control ladder of the protected load to prevent the application of primary acpower during a single-phasing condition. Figure 16.10 shows the recommended connection method for ahigh-power transmitter. Note that the input to the phase monitor module is taken from the final set ofthree-phase blower motor fuses. In this way, any failure inside the system that might result in a single-phasing condition is taken into account. The phase-loss protector shown in the figure includes a sensitiv-ity adjustment for various nominal line voltages. The unit is physically small and relatively inexpensive.
Protection against single-phasing is particularly important when transient-suppression devices areplaced at the utility company service entrance. The action of suppressors can cause one or more of thefuses at the service drop transformer to open, creating a fault condition. Positive protection against con-tinued operation of the load under such circumstances is necessary to prevent equipment failure.
16.3.4 Surge Suppressor Selection
Surge suppressors and lightning arresters come in all shapes, sizes, and types; a complete discussion ofapplication methods and evaluation is beyond the scope of this chapter. Contacting surge suppressormanufacturers, however, can be confusing because of the myriad of choices available. Instead, considercontacting members of referenced IEEE, Underwriters Laboratories (UL), and IEC standard committees
Metal oxidevaristors
High-speedspark gaps
Cable connectors
Figure 16.8 A hybrid voltage-protection deviceincorporating a gas-tube spark-gap and varistor ineach suppression element. The design goal is toextend the life of the varistors.
© 2007 by Taylor & Francis Group, LLC

250
AC Power Systems Handbook
for help in understanding the application issues. In any event, the following general guidelines should behelpful [2]:
• Select suppressors and arresters based on IEEE C62.41 categories (A, B, or C).• Check that the suppressors are UL 1449 tested, approved, and labeled.• Ask for published proof of testing to back up claims, especially clamping levels, energy-handling
capabilities (joules, watts, or current), and speed of response.• Look for 3- to 5-year unconditional warranties on the products.• Review and compare the six major performance characteristics: response time, voltage protection
level, power dissipation, disturbance-free operation, reliability, and operating life. Make sure thatthe maximum power dissipation and voltage protection levels use specified waveforms and arestated at the same point to avoid misinterpretation.
• Talk to similar users for advice and recommendations.• Consult industry standards for performance requirements.
Figure 16.9
Phase-loss protection using relay logic.
Figure 16.10
Phase-loss protection using a solid-state sensor. This circuit, used for a high-power transmitter, illustratesthe importance of proper placement of the sensing device.
three-phasemotors
andtransformers
A
B
C three-phase
AC input Relays shown energized
Fault control system input
NC NC NC To fault
control ladder
three-phase AC inputto transmitter
Main circuit breaker
PA blower circuit breaker
Cabinet blower fuses
SLA-230 -ASA
module
Cabinet blower motor
Filament circuit interlock
PA blower motor
To other sections of the transmitter
A
B
C
© 2007 by Taylor & Francis Group, LLC

Facility Wiring and Transient Protection
251
16.4 References
1. Federal Information Processing Standards Publication No. 94
, Guideline on Electrical Power forADP Installations
, U.S. Department of Commerce, National Bureau of Standards, Washington, DC,1983.
2. Lobnitz, E. A., “Lightning Protection for Tower Structures,” in
NAB Engineering Handbook
, J. C.Whitaker (Ed.), National Association of Broadcasters, Washington, DC, 1998.
16.5 Bibliography
Belling, M., “Judging Surge Suppressor Performance,”
Microservice Management
, Intertec Publishing,Overland Park, KS, March 1990.
Block, R., “The Grounds for Lightning and EMP Protection,” PolyPhaser Corporation, Gardnerville, Nev.,1987.
Fardo, S., and D. Patrick,
Electrical Power Systems Technology
, Prentice-Hall, Englewood Cliffs, NJ, 1985.Fink, D., and D. Christiansen (Eds.),
Electronics Engineers' Handbook
, 3rd ed., McGraw-Hill, New York,1989.
McPartland, J., and B. McPartland,
National Electrical Code Handbook
, 20th ed., McGraw-Hill, New York,1990.
MOV Varistor Data and Applications Manual
, General Electric Company, Auburn, NY, 1976.Schneider, J., “Surge Protection and Grounding Methods for AM Broadcast Transmitter Sites,”
Proceedingsof the SBE National Convention and Broadcast Engineering Conference
, Society of Broadcast Engi-neers, Indianapolis, IN, 1987.
© 2007 by Taylor & Francis Group, LLC

253
17
Circuit-Level Transient
Suppression
17.1 Introduction
The transient-suppression provisions built into professional and industrial equipment have improved dra-matically over the past few years. This trend is driven by both the increased availability of high-quality tran-sient-suppression devices and the increased need for clean power. Computer-based equipment is known forits intolerance of transient disturbances.
The transient-suppression applications presented in this section are intended only as examples of waysthat protection can be built into equipment to increase reliability. End users should not attempt to modifyexisting equipment to provide increased transient-suppression capabilities. Such work is the domain of theequipment manufacturer. Transient suppression must be engineered into products during design and con-struction, not added on later in the field.
17.2 Protecting Low-Voltage Supplies
Figure 17.1 shows the recommended transient protection for a typical low-voltage series-regulated powersupply. MOV1 to MOV3 clip transients on the incoming ac line. C1 aids in shunting turn-on/turn-off andfault-related disturbances on the secondary of T1. Resistor R1 protects diode bridge D1 by limiting theamount of current through D1 during turn-on, when capacitor C2 (the main filter) is fully discharged.MOV4 protects series regulator Q1 and the load from damage resulting from transients generated by faultconditions and load switching. The varistor is chosen so that it will conduct current when the voltage acrossL1 is greater than would be encountered during normal operation. Diode D2 protects Q1 from back-emfkicks from L1.
Three-terminal integrated circuit voltage regulator U1 is protected from excessive back-current becauseof a short circuit on its input side by diode D3. Capacitors C3 to C7 provide filtering and protect against RFpickup on the supply lines. Diode D4 protects U1 from back-emf kicks from an inductive load, and zenerdiode D5 protects the load from excessive voltage in case U1 fails (possibly impressing the full input voltageonto the load). D5 also protects U1 from overvoltages caused by transients generated through inductive loadswitching or fault conditions. D6 performs a similar function for the input side of U1.
17.3 Protecting High-Voltage Supplies
A number of circuit configurations can be used for a high-voltage power supply. The most common incor-porates a three-phase delta-to-wye transformer feeding a full-wave rectifier bridge, as shown in Figure 17.2.This arrangement provides high efficiency and low ripple content. With a well-balanced ac input line, theripple component of the dc output is 4.2%, at a frequency six times the ac input frequency (360 Hz for a 60Hz input). The dc output voltage is approximately 25% higher than the phase voltage, and each arm of thesix-element rectifier must block only the phase voltage. The rms current through each rectifier element is57% of the total average dc current of the load. The rectifier peak current is approximately equal to the valueof the average dc output current. The typical power factor presented to the ac line is 95%.
© 2007 by Taylor & Francis Group, LLC

254
AC Power Systems Handbook
Figure 17.3 illustrates the application of device staging to protect a high-voltage power supply fromtransient disturbances. As detailed previously for ac distribution systems, staging takes advantage of theseries resistance and inductance of interconnecting wiring to assist in suppressing transient disturbances.The circuit includes two sets of varistors: primary and secondary units. The secondary set is rated for alower clamp voltage and, together with the primary varistor groups, exercises tight control over distur-bances entering the supply from the ac utility input.
Additional transient-suppression devices (CR1 to CR3) and three sets of
RC
snubbers (R1/C1 to R3/C3) clip transients generated by the power transformer during retarded-phase operation. On the trans-former secondary, three groups of
RC
snubbers (R4/C4a-b to R6/C6a-b) provide additional protection tothe load from turn-on/turn-off spikes and transient disturbances on the utility line.
Figure 17.1
Transient-overvoltage protection for a low-voltage power supply. A circuit such as this will survive wellin the field despite frequent transient disturbances.
Figure 17.2
Three-phase full-wave bridge rectifier circuit.
AC power XFMR
36 V ac
AC Pos
ACAC input
Externalfusingused
MOV-1MOV-2
MOV-3
Regulatedoutput #1
Regulatedoutput #2
Gnd
D-1
C-1.1 μF
C-6.001 μF
C-7.1 μF
C-310 μF
D-6 +C-5
.1 μFC-4
10 μFD-4
IN4004
C-23000 μF
D-2IN4004
Voltageregulator
driverMOV-4
L-1
D-3IN4004
IC voltageregulator
Q-1
R-227
R-110, 5 W
+
Neg
Diodebridge
D-5+
three-phase AC inputA
B
C
three-phase delta-wyepower transformer
CR1
DC output voltage
CR2
CR3
CR4
CR5
CR6
© 2007 by Taylor & Francis Group, LLC

Circu
it-Level Tran
sient Su
ppression
255
Figure 17.3
The use of ac system series inductance and resistance to aid transient suppressors in controlling line disturbances in a high-power transmitter.
NeutralPrimaryvaristor
suppressors
three-phaseac input
to transmitter
A
B
C
Maincircuitbreaker
To other sections
Platecircuitbreaker
R1 C1
C4, A + B
R4
To platerectifiers
R5
R6
C5, A + B
C6, A + B
CR1
R2 C2
CR2
R3 C3
CR3Secondary varistor suppressors
© 2007 by Taylor & Francis Group, LLC

Figure 17.4
High-voltage power supply incorporating transient-suppression devices.
AC in
AC in
AC in
Remoteplate
current
C7C8
0.01 mF0.01 mF
0.01 mF
30 mF
C2
0.05 mF
C1
4HL1
CR7
K1
75 K
75 K
75 K
R8
R7
R6 A1
+ 8 KV DC outputto PA stageA2
0.01 mF
0.01 mF
4.7 K1.2 K
1.2 K
Remoteplate
voltage
R20.25 Ω
R24 Ω
0.01mF
4.7 K
0.01 mF
0.01 mF
10 K
1.2 K
1.2 K
R12.5 Ω
X1Plate current
To transmitterlogic ladder
Plate voltageR0 50 Ω
−
0.01 mF
10 K
R12
CC6
R11
0.01 mF
0.01 mF
CR2
CR3
CR4
CR5
CR6
CR1
10 K
C3C4
R10
15 Ω
RR4
© 2007 by Taylor & Francis Group, LLC
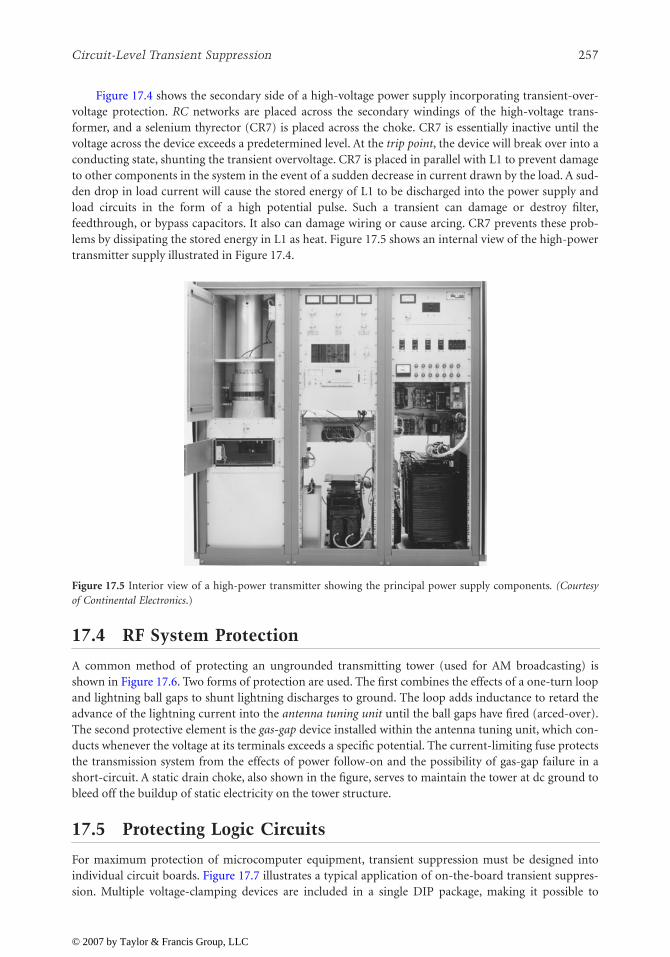
Circuit-Level Transient Suppression
257
Figure 17.4 shows the secondary side of a high-voltage power supply incorporating transient-over-voltage protection.
RC
networks are placed across the secondary windings of the high-voltage trans-former, and a selenium thyrector (CR7) is placed across the choke. CR7 is essentially inactive until thevoltage across the device exceeds a predetermined level. At the
trip point
, the device will break over into aconducting state, shunting the transient overvoltage. CR7 is placed in parallel with L1 to prevent damageto other components in the system in the event of a sudden decrease in current drawn by the load. A sud-den drop in load current will cause the stored energy of L1 to be discharged into the power supply andload circuits in the form of a high potential pulse. Such a transient can damage or destroy filter,feedthrough, or bypass capacitors. It also can damage wiring or cause arcing. CR7 prevents these prob-lems by dissipating the stored energy in L1 as heat. Figure 17.5 shows an internal view of the high-powertransmitter supply illustrated in Figure 17.4.
17.4 RF System Protection
A common method of protecting an ungrounded transmitting tower (used for AM broadcasting) isshown in Figure 17.6. Two forms of protection are used. The first combines the effects of a one-turn loopand lightning ball gaps to shunt lightning discharges to ground. The loop adds inductance to retard theadvance of the lightning current into the
antenna tuning unit
until the ball gaps have fired (arced-over).The second protective element is the
gas-gap
device installed within the antenna tuning unit, which con-ducts whenever the voltage at its terminals exceeds a specific potential. The current-limiting fuse protectsthe transmission system from the effects of power follow-on and the possibility of gas-gap failure in ashort-circuit. A static drain choke, also shown in the figure, serves to maintain the tower at dc ground tobleed off the buildup of static electricity on the tower structure.
17.5 Protecting Logic Circuits
For maximum protection of microcomputer equipment, transient suppression must be designed intoindividual circuit boards. Figure 17.7 illustrates a typical application of on-the-board transient suppres-sion. Multiple voltage-clamping devices are included in a single DIP package, making it possible to
Figure 17.5
Interior view of a high-power transmitter showing the principal power supply components
. (Courtesyof Continental Electronics
.)
© 2007 by Taylor & Francis Group, LLC

258
AC Power Systems Handbook
conveniently include protection on individual printed wiring boards. Figure 17.8 shows the applicationof transient suppressors in a voltage-follower circuit, common in many data-acquisition systems. Notethe use of suppression devices at the power-supply pins of the circuits shown in the figures.
17.6 Protecting Telco Lines
Communication lines that travel from the telephone company (telco) central office (CO) to customersites require transient protection. Furthermore, lines that travel from one building to another, or fromone floor to another, also may be exposed to a transient threat. Problems can result whether the lines aretwisted pairs or coaxial cable.
Figure 17.6
Common lightning protection methods for an ungrounded transmitting tower.
Figure 17.7
Application of transient-suppression devices to microcomputer circuits.
COAXfrom
transmitter
L-1
F-1
C-1Gasgap
Antenna tuning unit
Currentlimit/fuse Base current
meter
1 turnloop
AM antenna
Ground radial system
Ballgaps
Staticdrainchoke
V+ V−
Continue as shownfor other lines
Programmable interface
Databus
Microprocessor unit
Card edge connector
© 2007 by Taylor & Francis Group, LLC

Circuit-Level Transient Suppression
259
The
gas tube
is the traditional protection element installed at the telco central office. The primarypurpose of the gas tube (and its carbon predecessor) is to protect CO personnel from injury and COequipment from damage in the event of a lightning flash to exposed lines or accidental contact with high-voltage utility company cables. Protection devices usually are included at the telco service entrance pointon the customer's premises. Telco providers do their best to ensure that disturbances do not reach cus-tomers, but the final responsibility for transient protection lies with the equipment user.
Solid-state voltage-clamping devicesgenerally are used to protect audio anddata lines. The transient-clipping devicesshown in Figure 17.9 are selected based onthe typical voltage levels (including head-room) used on the loop. Figure 17.10 illus-trates another protection arrangement,which prevents the introduction of noiseinto audio or data lines because of a com-mon-mode imbalance that may resultfrom transient suppressors being tied toground. The use of a low-capacitance sup-pressor ensures minimum capacitive load-ing on the circuit.
For balanced telco lines, critical tran-sient considerations include both the above-ground voltage of the two conductors (the common-modevoltage) and the voltage between the two conductors (the normal-mode voltage). When individualclamping devices are used on each conductor, as shown in Figure 17.9, one device will inevitably clampbefore the other. This action can create a significant voltage differential that can damage sensitive equip-ment on the line. A common solution is the three-element gas tube. The device has a single gas chamber
Figure 17.8
Application of transient-suppression devices to an analog voltage sampling circuit.
Figure 17.10
Application of a transient-suppression device to a telephone company audio or data line.
Input R1
R2
V+
+ V−
−
Output
Audi
o ou
t
CR-1 CR-2
Telc
o lin
e aud
io in
put
Figure 17.9 Application of transient-suppression devices to anaudio distribution circuit.
Studio audiooutput
IsolationXFMR
CR-1 To telcoline
© 2007 by Taylor & Francis Group, LLC

260
AC Power Systems Handbook
with two gaps, one for each side of the line. When one side reaches the ionization potential, both sides firesimultaneously to ground.
Transient-suppression devices for low-voltage telco and data circuits are available from a number ofmanufacturers in a variety of configurations. Figure 17.11 illustrates some of the more common imple-mentations.
Figure 17.11
Telco and low-voltage surge protection: (
a
) telco service entrance device, (
b
) connection block protectiondevice. (
Courtesy of Control Concepts
.)
Net series groundwire connects to theprimary protector’s
ground lug.
ETC.
ETC.
ETC.
Net series module #3
Net series module #2
Net series module #1
Customer side
Primary protection DEMARC
Test points
Protected side
COHP-015 Unprotected side
MGB
89D stand offM1-50 block
© 2007 by Taylor & Francis Group, LLC

Circuit-Level Transient Suppression
261
17.7 Inductive Load Switching
Any transistor that switches an inductive load must be provided with transient protection. Figure 17.12shows the most common approach. Protection also is required for switches that control an appreciableamount of power, as illustrated in Figure 17.13. The use of a transient suppressor across switch or relaycontacts will also extend the life of the switching elements.
17.8 Bibliography
Fardo, S., and D. Patrick,
Electrical Power Systems Technology
, Prentice-Hall, Englewood Cliffs, NJ, 1985.Fink, D., and D. Christiansen (Eds.),
Electronics Engineers' Handbook
, 3rd ed., McGraw-Hill, New York,1989.
McPartland, J., and B. McPartland,
National Electrical Code Handbook
, 20th ed., McGraw-Hill, New York,1990.
MOV Varistor Data and Applications Manual
, General Electric Company, Auburn, NY, 1976.Schneider, J., “Surge Protection and Grounding Methods for AM Broadcast Transmitter Sites,”
Proceedingsof the SBE National Convention and Broadcast Engineering Conference
, Society of Broadcast Engi-neers, Indianapolis, IN, 1987.
Figure 17.12
Transient suppression of a switched inductive load.
Figure 17.13
Transient suppression of switch arcing.
1N4004
Controlinput
R-1Q-1
MOV
K-1
(24V)
AC input120 V
On-off
Motor
© 2007 by Taylor & Francis Group, LLC

263
18
Grounding Practices
18.1 Introduction
The attention given to the design and installation of a facility ground system is a key element in the day-to-day reliability of the plant. A well-designed and -installed ground network is invisible to the engineeringstaff. A marginal ground system, however, will cause problems on a regular basis. Grounding schemes canrange from simple to complex, but any system serves three primary purposes:
• Provides for operator safety• Protects electronic equipment from damage caused by transient disturbances• Diverts stray radio frequency energy from sensitive audio, video, control, and computer equipment
Most engineers view grounding mainly as a method to protect equipment from damage or malfunction.However, the most important element is operator safety. The 120 or 208 Vac line current that powers mostequipment can be dangerous — even deadly — if handled improperly. Grounding of equipment andstructures provides protection against wiring errors or faults that could endanger human life.
Proper grounding is basic to protection against ac line disturbances. This applies whether the source ofthe disturbance is lightning, power-system switching activities, or faults in the distribution network. Propergrounding is also a key element in preventing radio frequency interference in transmission or computerequipment. A facility with a poor ground system can experience RFI problems on a regular basis. Imple-menting an effective ground network is not an easy task. It requires planning, quality components, andskilled installers. It is not inexpensive. However, proper grounding is an investment that will pay dividendsfor the life of the facility.
Any ground system consists of two key elements: (1) the earth-to-grounding electrode interface outsidethe facility, and (2) the ac power and signal-wiring systems inside the facility.
18.1.1 Terms and Codes
A
facility
can be defined as something that is built, installed, or established to serve a particular purpose [1].A facility is usually thought of as a single building or group of buildings. The National Electrical Code(NEC) uses the term
premises
to refer to a facility when it defines premises wiring as the interior and exterior(facility) wiring, such as power, lighting, control, and signal systems. Premises wiring includes the serviceand all permanent and temporary wiring between the service and the load equipment. Premises wiring doesnot include wiring internal to any load equipment.
18.2 The Need for Grounding
The Institute of Electrical and Electronics Engineers (IEEE) defines
grounding
as a conducting connection,whether intentional or accidental, by which an electric circuit or equipment is connected to the earth or tosome conducting body of relatively large extent that serves in place of the earth. It is used for establishingand maintaining the potential of the earth (or of the conducting body) or approximately that potential, onconductors connected to it, and for conducting ground current to and from the earth (or the conductingbody) [2]. Based on this definition, the reasons for grounding can be identified as:
• Personnel safety by limiting potentials between all noncurrent-carrying metal parts of an electricaldistribution system
© 2007 by Taylor & Francis Group, LLC

264
AC Power Systems Handbook
• Personnel safety and control of electrostatic discharge (ESD) by limiting potentials between allnoncurrent-carrying metal parts of an electrical distribution system and the Earth
• Fault isolation and equipment safety by providing a low-impedance fault return path to the powersource to facilitate the operation of overcurrent devices during a ground fault
The IEEE definition makes an important distinction between
ground
and
earth
.
Earth
refers tomother earth, and
ground
refers to the equipment grounding system, which includes equipment ground-ing conductors, metallic raceways, cable armor, enclosures, cabinets, frames, building steel, and all othernoncurrent-carrying metal parts of the electrical distribution system.
There are other reasons for grounding not implicit in the IEEE definition. Overvoltage control haslong been a benefit of proper power-system grounding and is described in IEEE Standard 142, alsoknown as the
Green Book
[3]. With the increasing use of electronic computer systems, noise control hasbecome associated with the subject of grounding and is described in IEEE Standard 1100, the
EmeraldBook
. [4].
18.2.1 Equipment Grounding
Personnel safety is achieved by interconnecting all noncurrent-carrying metal parts of an electrical distri-bution system and then connecting the interconnected metal parts to the earth [5]. This process of inter-connecting metal parts is called
equipment grounding
and is illustrated in Figure 18.1, where theequipment grounding conductor is used to interconnect the metal enclosures. Equipment groundinginsures that there is no difference of potential, and thus no shock hazard, between noncurrent-carryingmetal parts anywhere in the electrical distribution system. Connecting the equipment grounding systemto earth insures that there is no difference of potential between the earth and the equipment groundingsystem. It also prevents static charge buildup.
18.2.2 System Grounding
System grounding, which is also illustrated in Figure 18.1, is the process of intentionally connecting one ofthe current-carrying conductors of the electrical distribution system to ground [5]. The figure shows theneutral conductor intentionally connected to ground and the earth. This conductor is called the
grounded
conductor because it is intentionally grounded. The purpose of system grounding is overvoltage controland equipment safety through fault isolation. An ungrounded system is subject to serious overvoltagesunder conditions such as intermittent ground faults, resonant conditions, and contact with higher voltagesystems. Fault isolation is achieved by providing a low-impedance return path from the load back to thesource, which will ensure operation of overcurrent devices in the event of a ground fault. The systemground connection makes this possible by connecting the equipment grounding system to the low side ofthe voltage source. Methods of system grounding include solidly grounded, ungrounded, and impedance-grounded.
Solidly grounded
means that an intentional zero-impedance connection is made between a cur-rent-carrying conductor and ground. The single-phase (1
φ
) system shown in Figure 18.1 is solidlygrounded. A solidly grounded, three-phase, four-wire, wye system is illustrated in Figure 18.2. Theneutral is connected directly to ground with no impedance installed in the neutral circuit. The NECpermits this connection to be made at the service entrance only [6]. The advantages of a solidlygrounded wye system include reduced magnitude of transient overvoltages, improved fault protection,and faster location of ground faults. There is one disadvantage of the solidly grounded wye system. Forlow-level arcing ground faults, the application of sensitive, properly coordinated, ground-fault protec-tion (GFP) devices is necessary to prevent equipment damage from arcing ground faults. The NECrequires arcing ground-fault protection at 480 Y/277 V services, and a maximum sensitivity limit of1200 A is permitted. Severe damage is less frequent at the lower voltage 208 V systems, where the arcmay be self-extinguishing.
© 2007 by Taylor & Francis Group, LLC

Grounding Practices
265
Ungrounded
means that there is no intentional connection between a current-carrying conductorand ground. However, charging capacitance will create unintentional capacitive coupling from eachphase to ground, making the system essentially a capacitance-grounded system. A three-phase, three-wiresystem from an ungrounded delta source is illustrated in Figure 18.3. The most important advantage ofan ungrounded system is that an accidental ground fault in one phase does not require immediateremoval of power. This allows for continuity of service, which made the ungrounded delta system popu-lar in the past. However, ungrounded systems have serious disadvantages. Because there is no fixed sys-tem ground point, it is difficult to locate the first ground fault and to sense the magnitude of faultcurrent. As a result, the fault is often permitted to remain on the system for an extended period of time. Ifa second fault should occur before the first one is removed, and the second fault is on a different phase,the result will be a double line-to-ground fault, causing serious arcing damage. Another problem with theungrounded delta system is the occurrence of high transient overvoltages from phase-to-ground. Tran-sient overvoltages can be caused by intermittent ground faults, with overvoltages capable of reaching a
Figure 18.1
Equipment grounding and system grounding. (
From
[5].
Used with permission
.)
Figure 18.2
Solidly grounded wye power system. (
From
[5].
Used with permission
.)
Ground
Earth
Earth electrode
Grounding electrode conductor
Load equipments 1φ service
panel board
Main bonding jumper and
system ground connection
Neutral
Ground
Grounded conductor
Equipment grounding conductor
Utilitytransformer
Servicepanelboard Sub-panel
4W load
Ground
Earth
ABC ABC
N
G
N
G
System groundconnection atservice only
© 2007 by Taylor & Francis Group, LLC

266
AC Power Systems Handbook
phase-to-ground voltage of from six to eight times the phase-to-neutral voltage. Sustained overvoltagescan ultimately result in insulation failure and thus moreground faults
Impedance-grounded
means that an intentional impedance connection is made between a current-carrying conductor and ground. The high-resistance grounded wye system, illustrated in Figure 18.4, isan alternative to solidly grounded and ungrounded systems. High-resistance grounding will limitground-fault current to a few amperes, thus removing the potential for arcing damage inherent in solidlygrounded systems. The ground reference point is fixed, and relaying methods can locate first faults beforedamages from second faults occur. Internally generated transient overvoltages are reduced because theneutral-to-ground resistor dissipates any charge that may build up on the system-charging capacitances.
Table 18.1 compares the three most common methods of system grounding. There is no one bestsystem grounding method for all applications. In choosing among the various options, the designer mustconsider the requirements for safety, continuity of service, and cost. Generally, low-voltage systemsshould be operated solidly grounded. For applications involving continuous processes in industrialplants or where shutdown might create a hazard, a high-resistance grounded wye system, or a solidlygrounded wye system with an alternate power supply, may be used. The high-resistance grounded wyesystem combines many of the advantages of the ungrounded-delta system and the solidly grounded wyesystem. IEEE Standard 142 recommends that medium-voltage systems less than 15 kV be low-resistance
Figure 18.3
Ungrounded delta power system. (
From
[5].
Used with permission
.)
Figure 18.4
High-resistance grounded wye power system. (
From
[5].
Used with permission
.)
Utilitytransformer
Servicepanel board Sub-panel
Earth
3W load
Ground
A B C A B C
G G
Utilitytransformer
Servicepanelboard Sub-panel
Ground
Earth
A B C A B C
Neutralresistor
3W load
GG
© 2007 by Taylor & Francis Group, LLC

Grounding Practices
267
grounded to limit ground fault damage yet permit sufficient current for detection and isolation ofground-faults. Standard 142 also recommends that medium-voltage systems over 15 kV be solidlygrounded. Solid grounding should include sensitive ground-fault relaying in accordance with the NEC.
18.2.3 The Grounding Electrode
The process of connecting the grounding system to earth is called
earthing
and consists of immersing ametal electrode or system of electrodes into the earth [5]. The conductor that connects the groundingsystem to earth is called the
grounding electrode conductor
. The function of the grounding electrode con-ductor is to keep the entire grounding system at earth potential (i.e., voltage equalization during light-ning and other transients) rather than for conducting ground-fault current. Therefore, the NEC allowsreduced sizing requirements for the grounding electrode conductor when connected to
made
electrodes.The basic measure of effectiveness of an earth electrode system is called
earth electrode resistance
.Earth electrode resistance is the resistance, in ohms, between the point of connection and a distant pointon the earth called
remote earth
. Remote earth, about 25 ft from the driven electrode, is the point whereearth electrode resistance does not increase appreciably when this distance is increased. Earth electroderesistance consists of the sum of the resistance of the metal electrode (negligible) plus the contact resis-tance between the electrode and the soil (negligible) plus the soil resistance itself. Thus, for all practicalpurposes, earth electrode resistance equals the soil resistance. The soil resistance is nonlinear, with mostof the earth resistance contained within several feet of the electrode. Furthermore, current flows onlythrough the electrolyte portion of the soil, not the soil itself. Thus, soil resistance varies as the electrolytecontent (moisture and salts) of the soil varies. Without electrolyte, soil resistance would be infinite.
Soil resistance is a function of soil resistivity. A 1-cubic-meter sample of soil with a resistivity
ρ
of 1ohm-meter will present a resistance
R
of 1 ohm between opposite faces. A broad variation of soil resistiv-ity occurs as a function of soil types, and soil resistivity can be estimated or measured directly. Soil resis-tivity is usually measured by injecting a known current into a given volume of soil and measuring theresulting voltage drop. When soil resistivity is known, the earth electrode resistance of any given configu-ration (single rod, multiple rods, or ground ring) can be determined by using standard equations devel-oped by Sunde [7], Schwarz [8], and others.
Earth resistance values should be as low as practicable, but are a function of the application. TheNEC approves the use of a single made electrode if the earth resistance does not exceed 25
Ω
. IEEE Stan-dard 1100 reports that the very low earth resistance values specified for computer systems in the past arenot necessary. Methods of reducing earth resistance values include the use of multiple electrodes in paral-lel, the use of ground rings, increased ground rod lengths, installation of ground rods to the permanentwater level, increased area of coverage of ground rings, and the use of concrete-encased electrodes,ground wells, and electrolytic electrodes.
Table 18.1
Comparison of System Grounding Methods (
After
[3].)
Characteristic Assuming No Fault
Escalation
System Grounding Method
Solidly Grounded
Ungrounded
High Resistance
Operation of overcurrent device on first ground fault
Yes No No
Control of internally generated transient overvoltages
Yes No Yes
Control of steady-state overvoltages Yes No YesFlash hazard Yes No NoEquipment damage from arcing ground
faultsYes No No
Overvoltage (on unfaulted phases) from ground-fault
1
L-N Voltage >> L-L Voltage L-L Voltage
Can serve line-to-neutral loads Yes No No
1
L = line, N = neutral.
© 2007 by Taylor & Francis Group, LLC

268
AC Power Systems Handbook
18.2.4 Earth Electrode
Earth electrodes may be made electrodes,
natural
electrodes, or
special-purpose
electrodes [5]. Made elec-trodes include driven rods, buried conductors, ground mats, buried plates, and ground rings. The elec-trode selected is a function of the type of soil and the available depth. Driven electrodes are used wherebedrock is 10 ft or more below the surface. Mats or buried conductors are used for lesser depths. Buriedplates are not widely used because of the higher cost when compared to rods. Ground rings employequally spaced driven electrodes interconnected with buried conductors. Ground rings are used aroundlarge buildings, around small unit substations, and in areas having high soil resistivity.
Natural electrodes include buried water pipe electrodes and concrete-encased electrodes. The NEClists underground metal water piping, available on the premises and not less than 10 ft in length, as partof a preferred grounding electrode system. Because the use of plastic pipe in new water systems willimpair the effectiveness of water pipe electrodes, the NEC requires that metal underground water pipingbe supplemented by an additional approved electrode. Concrete below ground level is a good electricalconductor. Thus, metal electrodes encased in such concrete will function as excellent grounding elec-trodes. The application of concrete-encased electrodes is covered in IEEE Standard 142.
18.3 Establishing an Earth Ground
The grounding electrode is the primary element of any ground system. The electrode can take manyforms. In all cases, its purpose is to interface the electrode (a conductor) with the earth (a semiconduc-tor). Grounding principles have been refined to a science. Still, however, many misconceptions existregarding grounding. An understanding of proper grounding procedures begins with the basic earth-interface mechanism.
18.3.1 Grounding Interface
The grounding electrode (or ground rod) interacts with theearth to create a hemisphere-shaped volume, as illustrated inFigure 18.5. The size of this volume is related to the size of thegrounding electrode. The length of the electrode has a muchgreater effect than the diameter. Studies have demonstratedthat the earth-to-electrode resistance from a driven groundrod increases exponentially with the distance from that rod.At a given point, the change becomes insignificant. It hasbeen found that for maximum effectiveness of the earth-to-electrode interface, each ground rod requires a hemisphere-shaped volume with a diameter that is approximately 2.2times the rod length [9].
The constraints of economics and available real estateplace practical limitations on the installation of a ground sys-tem. It is important, however, to keep the 2.2 rule in mindbecause it allows the facility design engineer to use the avail-able resources to the best advantage. Figure 18.6 illustratesthe effects of locating ground rods too close (less than 2.2times the rod length). An overlap area is created that effec-tively wastes some of the earth-to-electrode capabilities of thetwo ground rods. Research has shown, for example, that two10-ft ground rods driven only 1 ft apart provide about thesame resistivity as a single 10-ft rod.
Electrode interfacehemisphere
Groundingconductor
22 feet
11 feet10 feet
Figure 18.5 The effective earth-interfacehemisphere resulting from a singledriven ground rod. The 90% effectivearea of the rod extends to a radius ofapproximately 1.1 times the length of therod. (After [10].)
© 2007 by Taylor & Francis Group, LLC

Grounding Practices
269
There are three schools of thought with regard toground-rod length. The first approach states thatextending ground-rod length beyond about 10 ft is oflittle value for most types of soil. The reasoning behindthis conclusion is presented in Figure 18.7
a
, whereground resistance is plotted as a function of ground-rodlength. Beyond 10 ft in length, a point of diminishingreturns is reached.
The second school of thought concludes that opti-mum earth-to-electrode interface is achieved with long(40 ft or greater) rods, driven to penetrate the localwater table. When planning this type of installation,consider the difficulty that may be encountered whenattempting to drive long ground rods. The foregoingdiscussion assumes that the soil around the groundingelectrode is reasonably uniform in composition.Depending upon the location, however, this assumptionmay not hold true.
The third school of thought concludes that theoptimum ground-rod installation is achieved by usingthe longest possible rod depth (length). Data to supportthis conclusion is given in Figure 18.7
b
, which plotsground-rod performance as a function of depth in soilof uniform resistivity. This curve does not take into account seasonal moisture content, changing chemi-cal composition at different soil layers, and frozen soil conditions.
Given these three conflicting approaches, the benefits of hiring an experienced, licensed professionalengineer to design the ground system can be readily appreciated.
Horizontal grounding electrodes provide essentially the same resistivity as an equivalent-length ver-tical electrode, given uniform soil conditions. As Figure 18.8 demonstrates, the difference between a 10-ftvertical and a 10-ft horizontal ground rod is negligible (275 vs. 250
Ω
). This comparison includes theeffects of the vertical connection element from the surface of the ground to the horizontal rod. Taken byitself, the horizontal ground rod provides an earth-interface resistivity of approximately 308
Ω
when bur-ied at a depth of 36 in.
Ground rods come in many sizes and lengths. The more popular sizes are 1/2, 5/8, 3/4, and 1 in. The1/2-in. size is available in steel with stainless-clad, galvanized, or copper-clad rods. All-stainless-steel rodsalso are available. Ground rods can be purchased in unthreaded or threaded (sectional) lengths. The sec-tional sizes are typically 9/16- or 1/2-in. rolled threads. Couplers are made from the same materials as therods. Couplers can be used to join 8- or 10-ft-length rods together. A 40-ft ground rod, for example, isdriven one 10-ft section at a time.
The type and size of ground rod used is determined by how many sections are to be connected andhow hard or rocky the soil is. Copper-clad 5/8-in.
×
10-ft rods are probably the most popular. Coppercladding is designed to prevent rust. The copper is not primarily to provide better conductivity. Althoughthe copper certainly provides a better conductor interface to earth, the steel that it covers is also an excel-lent conductor when compared with ground conductivity. The thickness of the cladding is importantonly insofar as rust protection is concerned.
Wide variations in soil resistivity can be found within a given geographic area, as documented inTable 18.2. The wide range of values shown results from differences in moisture content, mineral content,and temperature.
Temperature is a major concern in shallow grounding systems because it has a significant effect onsoil resistivity [11]. During winter months, the ground system resistance can rise to unacceptable levelsbecause of freezing of liquid water in the soil. The same shallow grounding system can also suffer from
Grounding electrodeoverlap area
Figure 18.6 The effect of overlapping earth-interface hemispheres by placing two groundrods at a spacing less than 2.2 times the lengthof either rod. The overlap area representswasted earth-to-grounding electrode interfacecapability. (After [10].)
© 2007 by Taylor & Francis Group, LLC

270
AC Power Systems Handbook
Figure 18.7
Charted grounding resistance as a function of ground-rod length: (
a
) data demonstrating that ground-rod length in excess of 10 ft produces diminishing returns (1-in.-diameter rod) [10], (
b
) data demonstrating thatground system performance continues to improve as depth increases. (
Chart
b
from
[12].
Used with permission
.)
Figure 18.8
The effectiveness of vertical ground rods compared with horizontal ground rods. (
After
[10].)
160
Resis
tanc
e to
ear
th in
ohm
s
120
80
40
0
30
20
10
00 20 40 60 80
Depth of rod–ft100
0.30
0.20
0.10
0
Cond
ucta
nce–
mho
s
Resis
tanc
e–oh
ms
0 2 4Depth (feet)
(a)
(b)
6 8 10
Resistance
Conductance
Soil = 1000 Ω<–>M
10′
10′R = 250 Ω
R = 275 Ω
ConnectionConnection
© 2007 by Taylor & Francis Group, LLC

Grounding Practices
271
high resistance in the summer as moisture is evaporated from soil. It is advisable to determine the naturalfrost line and moisture profile for an area before attempting design of a ground system.
Figure 18.9 describes a four-point method for in-place measurement of soil resistivity. Four uni-formly spaced probes are placed in a linear arrangement and connected to a ground resistance test meter.An alternating current (at a frequency other than 60 Hz) is passed between the two most distant probes,resulting in a potential difference between the center potential probes. The meter display in ohms ofresistance can then be applied to determine the average soil resistivity in ohm-centimeters for the hemi-spherical area between the C1 and P2 probes.
Soil resistivity measurements should be repeated at a number of locations to establish a resistivityprofile for the site. The depth of measurement can be controlled by varying the spacing between theprobes. In no case should the probe length exceed 20% of the spacing between probes.
After the soil resistivity for a site is known, calculations can be made to determine the effectiveness ofa variety of ground system configurations. Equations for several driven rod and radial cableconfigurations are given in Reference 11, which — after the solid resistivity is known — can be used forthe purpose of estimating total system resistance. Generally, driven rod systems are appropriate wheresoil resistivity continues to improve with depth or where temperature extremes indicate seasonal frozenor dry soil conditions. Figure 18.10 shows a typical soil resistivity map for the U. S..
Table 18.2
Typical Resistivity of Common Soil Types
Type of Soil Resistivity in
Ω
/cm
Average
Minimum
Maximum
Filled land, ashes, salt marsh 2,400 600 7,000Top soils, loam 4,100 340 16,000Hybrid soils 6,000 1,000 135,000Sand and gravel 90,000 60,000 460,000
Figure 18.9
The four-point method for soil resistivity measurement. (
From
[11].
Used with permission
.)
B B B B
A A
D
A
C1 P1 P2 C2
Terminal C1
Terminal P1
Terminal P2
TerminalC2
Ground resistance meter
A = Electrode spacing in centimeters B = Resistance indicated by meter Notes: (1) Depth of test probes (B) must be less than A/20 (2) Dimension D is the depth at which resisticity is determined. This depth changes with probe spacing.(3) Probe spacing (A) must be equal (4) One foot equals 30.5 centimeters
© 2007 by Taylor & Francis Group, LLC

272
AC
Pow
er Systems H
and
book
Figure 18.10
Typical soil resistivity map for the U.S. (
From
[11].
Used with permission
.)
125
2505001000
125250
1000
500
500
250125
250
250
500500
250 250
2000
67
125
1000
500
2000
1000500
25012567
250500125
67
67
125
250
12567
33
125
33 67
33
33
12567
33
67
125
25067
125
250
500
250
12567
125
500
250
500
67
500
67
67125
125
125
1060
125
250
125
125
250
125
500125
67
67
67
33
500
67125
125
33
33
125
67
125
67125125
250
125
67
6733
125
67
33250
125
125
250
67
33
33 67Note:
(1) Numbers on map are resitivity in ohms-meters
© 2007 by Taylor & Francis Group, LLC

Grounding Practices
273
18.3.1.1 Ground Electrode Testing
Testing of all ground electrodes before they are connected to form a complex network is a fairly simpleprocess that is well described in the documentation included with ground electrode meters. This instruc-tional process, therefore, will not be described here. Also, the system as a whole should be tested after allinterconnections are made, providing a benchmark for future tests.
At a new site, it is often advisable to perform ground-system tests before the power company ground/neutral conductor is attached to the system. Conduct a before-and-after test with probes in the same positionto determine the influence of the power company attachment [11]. It is also worthwhile to install permanentelectrodes and marker monuments at the original probe positions to ensure the repeatability of future tests.
18.3.2 Chemical Ground Rods
A chemically activated ground system is an alternative to the conventional ground rod. The idea behindthe chemical ground rod is to increase the earth-to-electrode interface by conditioning the soil surround-ing the rod. Experts have known for many years that the addition of ordinary table salt (NaCl) to soil willreduce the resistivity of the earth-to-ground electrode interface. With the proper soil moisture level (4 to12%),
salting
can reduce soil resistivity from perhaps 10,000
Ω
/m to less than 100
Ω
/m. Salting the areasurrounding a ground rod (or group of rods) follows a predictable life-cycle pattern, as illustrated in Fig-ure 18.11. Subsequent salt applications are rarely as effective as the initial salting.
Various approaches have been tried over the years to solve this problem. One such product is shownin Figure 18.12. This chemically activated grounding electrode consists of a 2-1/2-in.-diameter copperpipe filled with rock salt. Breathing holes are provided on the top of the assembly, and seepage holes arelocated at the bottom. The theory of operation is simple. Moisture is absorbed from the air (when avail-able) and is then absorbed by the salt. This creates a solution that seeps out of the base of the device andconditions the soil in the immediate vicinity of the rod.
Another approach is shown in Figure 18.13. This device incorporates a number of ports (holes) inthe assembly. Moisture from the soil (and rain) is absorbed through the ports. The metallic salts subse-quently absorb the moisture, forming a saturated solution that seeps out of the ports and into the earth-to-electrode hemisphere. Tests have shown that if the moisture content is within the required range, earthresistivity can be reduced by as much as 100:1. Figure 18.14 shows the measured performance of a typicalchemical ground rod in three types of soil.
Figure 18.11
The effect of soil salting on ground-rod resistance with time. The expected resalting period, shown hereas 2 years, varies depending on the local soil conditions and the amount of moisture present. (
After
[10].)
Rainseason
Resalting
1st year4
1200 Ω
1000
800
600
400
Resis
tanc
e
200
8 12 4 8 12 4 8 122nd year 3rd year
© 2007 by Taylor & Francis Group, LLC
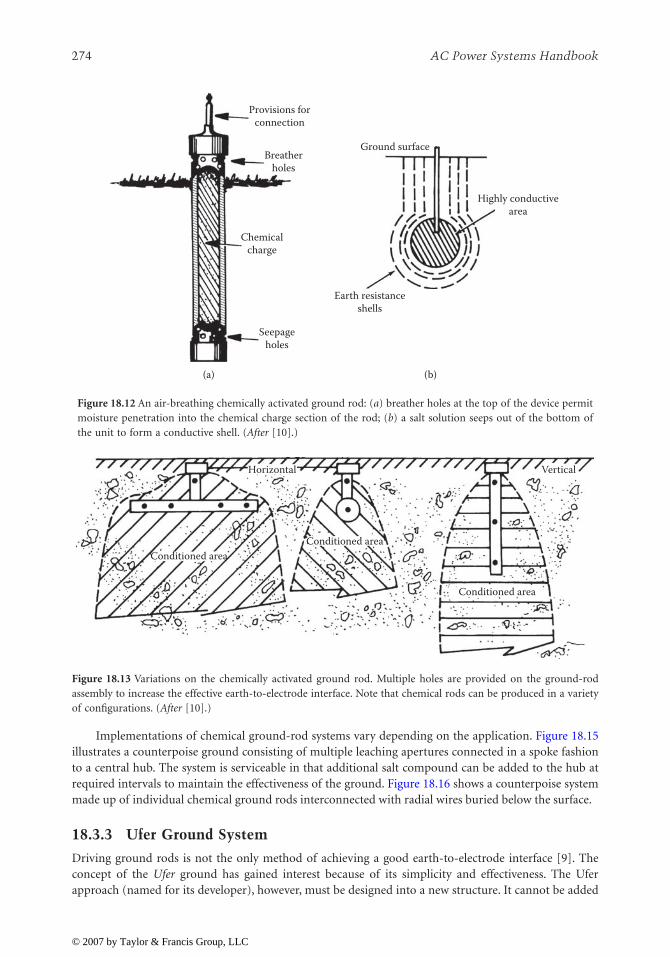
274
AC Power Systems Handbook
Implementations of chemical ground-rod systems vary depending on the application. Figure 18.15illustrates a counterpoise ground consisting of multiple leaching apertures connected in a spoke fashionto a central hub. The system is serviceable in that additional salt compound can be added to the hub atrequired intervals to maintain the effectiveness of the ground. Figure 18.16 shows a counterpoise systemmade up of individual chemical ground rods interconnected with radial wires buried below the surface.
18.3.3 Ufer Ground System
Driving ground rods is not the only method of achieving a good earth-to-electrode interface [9]. Theconcept of the
Ufer
ground has gained interest because of its simplicity and effectiveness. The Uferapproach (named for its developer), however, must be designed into a new structure. It cannot be added
Figure 18.12
An air-breathing chemically activated ground rod: (
a
) breather holes at the top of the device permitmoisture penetration into the chemical charge section of the rod; (
b
) a salt solution seeps out of the bottom ofthe unit to form a conductive shell. (
After
[10].)
Figure 18.13
Variations on the chemically activated ground rod. Multiple holes are provided on the ground-rodassembly to increase the effective earth-to-electrode interface. Note that chemical rods can be produced in a varietyof configurations. (
After
[10].)
Provisions for connection
Seepage holes
(a) (b)
Breather holes
Chemical charge
Earth resistance shells
Ground surface
Highly conductivearea
Vertical
Conditioned areaConditioned area
Conditioned area
Horizontal
© 2007 by Taylor & Francis Group, LLC

Grounding Practices
275
on later. The Ufer ground takes advantage of the natural chemical- and water-retention properties ofconcrete to provide an earth ground. Concrete typically retains moisture for 15 to 30 days after a rain.The material has a ready supply of ions to conduct current because of its moisture-retention properties,mineral content, and inherent pH. The large mass of any concrete foundation provides a good interfaceto ground.
A Ufer system, in its simplest form, is made by routing a solid-copper wire (no. 4 gauge or larger)within the foundation footing forms before concrete is poured. Figure 18.17 shows one such installation.The length of the conductor run within the concrete is important. Typically a 20-ft run (10 ft in eachdirection) provides a 5
Ω
ground in 1000
Ω
/m soil.As an alternative, steel reinforcement bars (rebar) can be welded together to provide a rigid, conductive
structure. A ground lug is provided to tie equipment to the ground system in the foundation. The rebarmust be welded, not tied, together. If it is only tied, the resulting poor connections between rods can resultin arcing during a current surge. This can lead to deterioration of the concrete in the affected areas.
The design of a Ufer ground is not to be taken lightly. Improper installation can result in a groundsystem that is subject to problems. The grounding electrodes must be kept a minimum of 3 in. from thebottom and sides of the concrete to avoid the possibility of foundation damage during a large lightning
Figure 18.14
Measured performance of a chemical ground rod. (
After
[10].)
Figure 18.15
Hub-and-spoke counterpoise ground system. (
After
[10].)
5
4
4 5 6
1. Diatomaceous earth2. Coarse gravel and sand3. Clay
3
3
3
Elapsed time (months)
2
2
2
1
1
1Initi
al re
sista
nce
(ohm
s)
Leachingapertures
© 2007 by Taylor & Francis Group, LLC

276 AC Power Systems Handbook
surge. If an electrode is placed too near the edge of the concrete, a surge could turn the water inside theconcrete to steam and break the foundation apart.
The Ufer approach also can be applied to guy-anchor points or a tower base, as illustrated in Figure18.18. Welded rebar or ground rods sledged in place after the rebar cage is in position can be used. Byprotruding below the bottom concrete surface, the ground rods add to the overall electrode length tohelp avoid thermal effects that can crack the concrete. The maximum length necessary to avoid breakingthe concrete under a lightning discharge is determined by the following:
• Type of concrete (density, resistivity, and other factors)• Water content of the concrete• How much of the buried concrete surface area is in contact with the ground
Figure 18.16 Tower grounding scheme using buried copper radials and chemical ground rods. (After [10].)
Figure 18.17 The basic concept of a Ufer ground system, which relies on the moisture-retentive properties of concreteto provide a large earth-to-electrode interface. Design of such a system is critical. Do not attempt to build a Uferground without the assistance of an experienced contractor. (After [9].)
Chemicalground rods
Copperradials
Concrete foundationfooting
Ufer ground systemaccess point
Bare copperconductor
© 2007 by Taylor & Francis Group, LLC

Grounding Practices 277
• Ground resistivity• Groundwater content• Size and length of the ground rod• Size of lightning flash
The last variable is a bit of a gamble. The 50% mean occurrence of lightning strikes is 18 A, butsuperstrikes can occur that approach 100 to 200 kA.
Before implementing a Ufer ground system, consult a qualified contractor. Because the Ufer groundsystem will be the primary grounding element for the facility, it must be done correctly.
18.3.4 Bonding Ground-System Elements
A ground system is only as good as the methods used to interconnect the component parts [9]. Do notuse soldered-only connections outside the equipment building. Crimped/brazed and exothermic (Cad-welded) connections are preferred. (Cadweld is a registered trademark of Erico Corp.) To make a properbond, all metal surfaces must be cleaned, any finish removed to bare metal, and surface preparation com-pound applied. Protect all connections from moisture by appropriate means, usually sealing compoundand heat-shrink tubing.
It is not uncommon for an untrained installer to use soft solder to connect the elements of a ground sys-tem. Such a system is doomed from the start. Soft-soldered connections cannot stand up to the acid andmechanical stress imposed by the soil. The most common method of connecting the components of a groundsystem is silver soldering. The process requires the use of brazing equipment, which may be unfamiliar tomany facility engineers. The process uses a high-temperature/high-conductivity solder to complete the bond-ing process. For most grounding systems, however, the best approach to bonding is the exothermic process.
18.3.5 Exothermic Bonding
Exothermic bonding is the preferred method of connecting the elements of a ground system [9]. Molten cop-per is used to melt connections together, forming a permanent bond. This process is particularly useful injoining dissimilar metals. In fact, if copper and galvanized cable must be joined, exothermic bonding is theonly acceptable means. The completed connection will not loosen or corrode and will carry as much currentas the cable connected to it. Figure 18.19 illustrates the bonding that results from the exothermic process.
Figure 18.18 The Ufer ground system as applied to a transmission-tower base or guy-wire anchor point. When usingthis type of ground system, bond all rebar securely to prevent arcing in the presence of large surge currents. (After [9].)
Connectingcable cadwelded
to rebar
Welded rebar assembly
© 2007 by Taylor & Francis Group, LLC

278 AC Power Systems Handbook
The bond is accomplished by dumping powdered metals (copper oxide and aluminum) from a con-tainer into a graphite crucible and igniting the material by means of a flint lighter. Reduction of the cop-per oxide by the aluminum produces molten copper and aluminum-oxide slag. The molten copper flowsover the conductors, bonding them together. The process is illustrated in Figure 18.20. Figure 18.21shows a typical mold. A variety of special-purpose molds are available to join different-size cables andcopper strap. Figure 18.22 shows the bonding process for a copper-strap-to-ground-rod interface.
18.3.6 Ground-System Inductance
Conductors interconnecting sections or components of an earth ground system must be kept as short aspossible to be effective [9]. The inductance of a conductor is a major factor in its characteristic imped-ance to surge energy. For example, consider a no. 6 AWG copper wire 10 m in length. The wire has a dcresistance of 0.013 Ω and an inductance of 10 μH. For a 1000 A lightning surge with a 1 μs rise time, theresistive voltage drop will be 13 V, but the reactive voltage drop will be 10 kV. Furthermore, any bends inthe conductor will increase its inductance and further decrease the effectiveness of the wire. Bends inground conductors should be gradual. A 90° bend is electrically equivalent to a 1/4-turn coil. The sharperthe bend, the greater the inductance.
Figure 18.19 The exothermic bonding process. (After [9].)
Figure 18.20 Exothermic bonding is the preferred method of joining the elements of a ground system. This photosequence illustrates the procedure: (a) the powdered copper oxide and aluminum compound are added to the moldafter the conductors have been mechanically joined; (b) final preparation of the bond before igniting; (c) the chemicalreaction that bonds the materials together.
Cadweld metal
Molecular bond ofcable strand ends to
cadweld metalCable sleeved bycadweld metal beyondweld for mechanical
strength
(a) (b) (c)
© 2007 by Taylor & Francis Group, LLC

Grounding Practices 279
Because of the fast rise time of most lightning discharges and power-line transients, the skin effectplays an important role in ground-conductor selection. When planning a facility ground system, view theproject from an RF standpoint.
The effective resistance offered by a conductor to radio frequencies is considerably higher than theohmic resistance measured with direct currents. This is because of an action known as the skin effect,
Figure 18.21 Typical exothermic bonding mold for connecting a cable to a ground rod. (After [9].)
Figure 18.22 Cadweld mold for connecting a copper strap to a ground rod. (After [9].)
Startingmaterial
Cadweldweld metal
Steel disk
Tap hole
Weldcavity
Ground rod
Cable
Mold
Cover
Crucible
#2 solidcopper wire
Two C110 copperbars 1/2 hard
0.086
1
Cadweld mold
Cadweld mold
3″ × .0159″ copper strap
5/8″ ground rod
5″
© 2007 by Taylor & Francis Group, LLC

280 AC Power Systems Handbook
which causes the currents to be concentrated in certain parts of the conductor and leaves the remainderof the cross section to contribute little or nothing toward carrying the applied current.
When a conductor carries an alternating current, a magnetic field is produced that surrounds thewire. This field continually is expanding and contracting as the ac current wave increases from zero to itsmaximum positive value and back to zero, then through its negative half-cycle. The changing magneticlines of force cutting the conductor induce a voltage in the conductor in a direction that tends to retardthe normal flow of current in the wire. This effect is more pronounced at the center of the conductor.Thus, current within the conductor tends to flow more easily toward the surface of the wire. The higherthe frequency, or the faster the rise time of the applied waveform, the greater the tendency for current toflow at the surface. Figure 18.23 shows the distribution of current in a radial conductor.
When a circuit is operating at high frequencies, the skin effect causes the current to be redistributedover the conductor cross section in such a way as to make most of the current flow where it is encircled bythe smallest number of flux lines. This general principle controls the distribution of current regardless ofthe shape of the conductor involved. With a flat-strip conductor, the current flows primarily along theedges, where it is surrounded by the smallest amount of flux
18.4 References
1. Webster's New Collegiate Dictionary.2. IEEE Standard 100, Definitions of Electrical and Electronic Terms, IEEE, New York,. 3. IEEE Standard 142, “Recommended Practice for Grounding Industrial and Commercial Power
Systems,” IEEE, New York, 1982.4. IEEE Standard 1100, “Recommended Practice for Powering and Grounding Sensitive Electronics
Equipment,” IEEE, New York, 1992.5. DeWitt, W. E., “Facility Grounding Practices,” in The Electronics Handbook, Jerry C. Whitaker
(Ed.), CRC Press, Boca Raton, FL, pp. 2218–2228, 1996.6. NFPA Standard 70, “The National Electrical Code,” National Fire Protection Association, Quincy,
MA, 1993.7. Sunde, E. D., Earth Conduction Effects in Transmission Systems, Van Nostrand Co., New York, 1949.
Figure 18.23 Skin effect on an isolated round conductor carrying a moderately high-frequency signal.
Distribution ofcurrent density
Magnetic flux
© 2007 by Taylor & Francis Group, LLC

Grounding Practices 281
8. Schwarz, S. J., “Analytical Expression for Resistance of Grounding Systems,” AIEE Transactions,Vol. 73, Part III-B, pp. 1011–1016, 1954.
9. Block, R., “The Grounds for Lightning and EMP Protection,” PolyPhaser Corporation, Gardner-ville, NV, 1987.
10. Carpenter, R. B., “Improved Grounding Methods for Broadcasters,” Proceedings, SBE NationalConvention, Society of Broadcast Engineers, Indianapolis, IN, 1987.
11. Lobnitz, E. A., “Lightning Protection for Tower Structures,” in NAB Engineering Handbook, 9th ed.,J. C. Whitaker (Ed.), National Association of Broadcasters, Washington, DC, 1998.
12. DeDad, J. A., (Ed.), “Basic Facility Requirements,” in Practical Guide to Power Distribution forInformation Technology Equipment, PRIMEDIA Intertec, Overland Park, KS, pp. 24, 1997.
18.5 Bibliography
Benson, K. B., and J. C. Whitaker, Television and Audio Handbook for Engineers and Technicians, McGraw-Hill, New York, 1989.
Block, R., “How to Ground Guy Anchors and Install Bulkhead Panels,” Mobile Radio Technology, PRI-MEDIA Intertec, Overland Park, KS, February 1986.
Fardo, S., and D. Patrick, Electrical Power Systems Technology, Prentice-Hall, Englewood Cliffs, NJ, 1985.Hill, M., “Computer Power Protection,” Broadcast Engineering, PRIMEDIA Intertec, Overland Park, KS,
April 1987.Little, R., “Surge Tolerance: How Does Your Site Rate?” Mobile Radio Technology, Intertec Publishing,
Overland Park, KS, June 1988.Mullinack, H. G., “Grounding for Safety and Performance,” Broadcast Engineering, PRIMEDIA Intertec,
Overland Park, KS, October 1986.Schneider, J., “Surge Protection and Grounding Methods for AM Broadcast Transmitter Sites,” Proceed-
ings, SBE National Convention, Society of Broadcast Engineers, Indianapolis, 1987.Technical Reports LEA-9-1, LEA-0-10, and LEA-1-8, Lightning Elimination Associates, Santa Fe Springs,
CA.
© 2007 by Taylor & Francis Group, LLC

283
19
Grounding Tower
Elements
19.1 Introduction
Guyed towers are better than self-supporting towers at dissipating lightning surge currents [1]. This is true,however, only if the guy anchors are grounded properly. Use of the Ufer technique is one way of effectivelygrounding the anchors. For anchors not provided with a Ufer ground during construction, other, more con-ventional techniques can be used. For guyed towers whose guy lines are not electrically continuous betweenthe tower and the base, such as sectionalized towers (certain FM and TV broadcast towers and AM broadcasttowers), surge current dissipation is essentially equivalent to a self-supporting tower.
Never rely on the turnbuckles of a guy anchor as a path for lightning energy. The current resulting froma large flash can weld the turnbuckles in position. If the turnbuckles are provided with a safety loop of guycable (as they should be), the loop can be damaged where it contacts the guys and turnbuckle. Figure 19.1shows the preferred method of grounding guy wires: tie them together above the loop and turnbuckles. Donot make these connections with copper wire, even if they are Cadwelded. During periods of precipitation,water shed from the top copper wire will carry ions that may react with the lower galvanized (zinc) guywires. This reaction washes off the zinc coating, allowing rust to develop.
The best way to make the connection is with all-galvanized materials. This includes the grounding wire,clamps, and ground rods. It may not be possible to use all galvanized materials because, at some point, aconnection to copper conductors will be required.
Battery action
caused by the dissimilar metal junctionmay allow the zinc to act as a sacrificial anode. The zinc eventually will disappear into the soil, leaving a baresteel conductor that can fall victim to rust.
Ruling out an all-galvanized system, the next best scheme uses galvanized wire (guy-wire material) totie the guy wires together. Just above the soil, Cadweld the galvanized wire to a copper conductor that pene-trates below grade to the perimeter ground system. The height above grade for the connection is determinedby the local snowfall or flood level. The electric conductivity of snow, although low, can cause battery actionfrom the copper through the snow to the zinc. The Cadwelded joint should be positioned above the usualsnow or flood level.
19.2 Ground-Wire Dressing
Figure 19.2 illustrates the proper way to bond the tower base ground leads to the buried ground system [1].Dress the leads close to the tower from the lowest practical structural element at the base. Keep the conduc-tors as straight and short as possible. Avoid any sharp bends. Attach the ground wires to the tower only atone or more existing bolts (or holes). Do not drill any holes into the tower. Do not loosen any bolts to makethe ground-wire attachment. Use at least two 3- to 4-in. copper straps between the base of the tower and theburied ground system. Position the straps next to the concrete pier of the tower base. For towers more than200 ft in height, use four copper straps, one on each side of the pier.
Figure 19.3 illustrates the proper way to bond guy wires to the buried ground system. The lead isdressed straight down from the topmost to the lowest guy. It should conform as close to vertical as possibleand be dressed downward from the lower side of each guy wire after connecting to each wire (Figure 19.1).To ensure that no arcing will occur through the turnbuckle, a connection from the anchor plate to theperimeter ground circle is recommended. No. 2 gauge copper wire is recommended. This helps minimize
© 2007 by Taylor & Francis Group, LLC

284
AC Power Systems Handbook
the unavoidable inductance created by the conductor being in the air. Interconnect leads that are sus-pended in air must be dressed so that no bending radius is less than 8 in.
A
perimeter
ground — a circle of wire connected at several points to ground rods driven into theearth — should be installed around each guy-anchor point. The perimeter system provides a goodground for the anchor and, when tied together with the tower base radials, acts to rapidly dissipate light-ning energy in the event of a flash. Tower base radials are buried wires interconnected with the tower baseground that extend away from the center point of the structure.
The required depth of the perimeter ground and the radials depends upon soil conductivity. Gener-ally speaking, however, about 8 in. below grade is sufficient. In soil with good conductivity, the perimeterwire may be as small as no. 10 gauge. Because no. 2 gauge is required for the segment of conductor sus-pended in air, it may be easier to use no. 2 throughout. An added advantage is that the same size Cadweldmolds may be used for all bonds.
19.3 Facility Ground Interconnection
Any radial that comes within 2 ft of a conductive structure must be tied into the ground system [1]. Burythe interconnecting wire, if possible, and approach the radial at a 45° angle, pointing toward the expectedsurge origin (usually the tower). Cadweld the conductor to the radial and to the structure.
For large-base, self-supporting towers, the radials should be split among each leg pad, as shown inFigure 19.4. The radials may be brought up out of the soil (in air) and each attached at spaced locationsaround the foot pad. Some radials may have to be tied together first and then joined to the foot pad.Remember, if space between the radial lines can be maintained, less mutual inductance (coupling) willexist, and the system surge impedance will be lower.
It is desirable to have a continuous one-piece ring with rods around the equipment building. Con-nect this ring to one, and only one, of the tower radials, thus forming no radial loops. (See Figure 19.5.)Bury the ring to the same depth as the radials to which it interconnects. Connect power-line neutral tothe ring.
Warning
: Substantial current may flow when the power-line neutral is connected to the ring.Follow safety procedures when making this connection.
Figure 19.1
Recommended guy-anchor grounding procedure. (
After
[1].)
¼” galvanizedguy wire
#2 AWGsolid copper
Cadweld
CadweldRadialPerimeter ground wire
U-bolt clamps
Copper cladground rod
© 2007 by Taylor & Francis Group, LLC
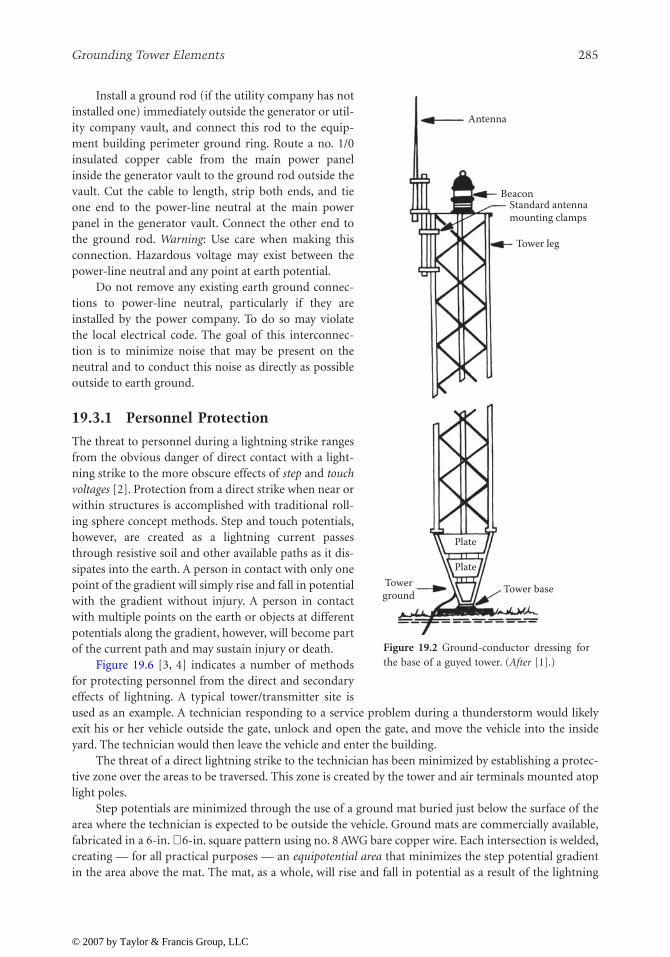
Grounding Tower Elements
285
Install a ground rod (if the utility company has notinstalled one) immediately outside the generator or util-ity company vault, and connect this rod to the equip-ment building perimeter ground ring. Route a no. 1/0insulated copper cable from the main power panelinside the generator vault to the ground rod outside thevault. Cut the cable to length, strip both ends, and tieone end to the power-line neutral at the main powerpanel in the generator vault. Connect the other end tothe ground rod.
Warning
: Use care when making thisconnection. Hazardous voltage may exist between thepower-line neutral and any point at earth potential.
Do not remove any existing earth ground connec-tions to power-line neutral, particularly if they areinstalled by the power company. To do so may violatethe local electrical code. The goal of this interconnec-tion is to minimize noise that may be present on theneutral and to conduct this noise as directly as possibleoutside to earth ground.
19.3.1 Personnel Protection
The threat to personnel during a lightning strike rangesfrom the obvious danger of direct contact with a light-ning strike to the more obscure effects of
step
and
touchvoltages
[2]. Protection from a direct strike when near orwithin structures is accomplished with traditional roll-ing sphere concept methods. Step and touch potentials,however, are created as a lightning current passesthrough resistive soil and other available paths as it dis-sipates into the earth. A person in contact with only onepoint of the gradient will simply rise and fall in potentialwith the gradient without injury. A person in contactwith multiple points on the earth or objects at differentpotentials along the gradient, however, will become partof the current path and may sustain injury or death.
Figure 19.6 [3, 4] indicates a number of methodsfor protecting personnel from the direct and secondaryeffects of lightning. A typical tower/transmitter site isused as an example. A technician responding to a service problem during a thunderstorm would likelyexit his or her vehicle outside the gate, unlock and open the gate, and move the vehicle into the insideyard. The technician would then leave the vehicle and enter the building.
The threat of a direct lightning strike to the technician has been minimized by establishing a protec-tive zone over the areas to be traversed. This zone is created by the tower and air terminals mounted atoplight poles.
Step potentials are minimized through the use of a ground mat buried just below the surface of thearea where the technician is expected to be outside the vehicle. Ground mats are commercially available,fabricated in a 6-in.
×
6-in. square pattern using no. 8 AWG bare copper wire. Each intersection is welded,creating — for all practical purposes — an
equipotential area
that minimizes the step potential gradientin the area above the mat. The mat, as a whole, will rise and fall in potential as a result of the lightning
Antenna
Beacon
Tower leg
Standard antennamounting clamps
Plate
Plate
Tower baseTowerground
Figure 19.2 Ground-conductor dressing forthe base of a guyed tower. (After [1].)
© 2007 by Taylor & Francis Group, LLC

286
AC Power Systems Handbook
Figure 19.3
Top view of proper guy-anchor grounding techniques. A properly dressed and installed ground wireprevents surge currents from welding turnbuckles and damaging safety loops. The perimeter ground connects to thetower base by way of a radial wire. (
After
[1].)
Figure 19.4
Interconnecting a self-supporting tower to the buried ground system.
Cadweld
8′ to 10′ Cadweld
Cadweld
Guy wires
Note: depth of all interconnections is8” minimum
Cadweld radial to tower
Perimeter wire#2 AWG solid copper
Groundelectrode
Groundelectrode
Groundelectrode
Groundlevel
© 2007 by Taylor & Francis Group, LLC
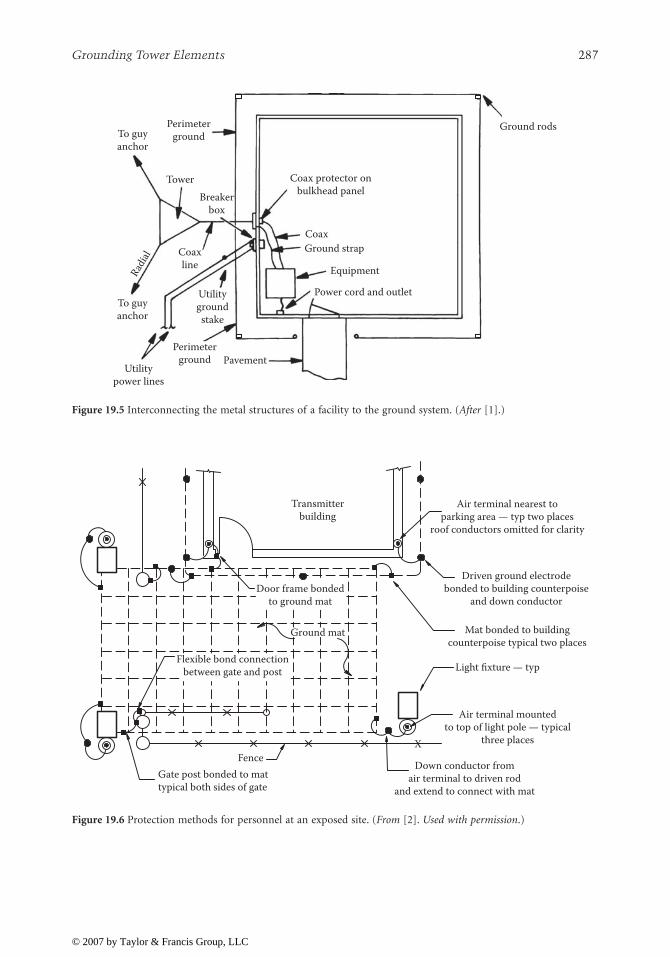
Grounding Tower Elements
287
Figure 19.5
Interconnecting the metal structures of a facility to the ground system. (
After
[1].)
Figure 19.6
Protection methods for personnel at an exposed site. (
From
[2].
Used with permission
.)
Perimeterground
To guyanchor
Tower
Radia
l
CoaxCoaxline
Pavement
Perimeterground
To guyanchor
Utilitypower lines
Utilitygroundstake
Ground strap
Equipment
Power cord and outlet
Breakerbox
Coax protector onbulkhead panel
Ground rods
X
Air terminal nearest toparking area — typ two places
roof conductors omitted for clarity
Driven ground electrode bonded to building counterpoise
and down conductor
Mat bonded to building counterpoise typical two places
Light fixture — typ
Air terminal mountedto top of light pole — typical
three places
Down conductor from air terminal to driven rod
and extend to connect with mat Gate post bonded to mat typical both sides of gate
Ground mat
Transmitter building
Fence
Door frame bonded to ground mat
Flexible bond connection between gate and post
© 2007 by Taylor & Francis Group, LLC

288
AC Power Systems Handbook
current discharges; however, there will be very little difference in potential between the technician's feet.Mats should be covered with 6 in. of crushed stone or pavement.
The threat of dangerous touch potentials is minimized by bonding the following elements to theground system:
• Personnel ground mat• Fence at each side of the gate opening• Door frame of the transmitter building• Flexible bonding connection between the swing gate and its terminal post
Such bonding will ensure that the object being touched by the technician is at or near the samepotential as his or her feet.
Bonding both sides of the gate opening to the mat helps to ensure that the technician and both sidesof the gate are at approximately the same potential while the gate is being handled. The flexible bondbetween the gate and its support post can be accomplished using a commercially available kit or by Cad-welding a short length of flexible no. 2/0 AWG welding cable between the two elements.
19.4 Grounding on Bare Rock
A bare rock mountaintop location provides special challenges to the facility design engineer [1]. There isno soil, thus there are no ground rods. Radials are the only means to develop a ground system. Install alarge number of radials, laid straight, but not too taut. The portions not in contact with the rock are in airand form an inductance that will choke the surge current. Because rock is not conductive when it is dry,keep the radials short. Only a test measurement will determine how short the radials should be. A con-ventional earth-resistance tester will tell only half the story (besides, ground rods cannot be placed inrock for such a measurement). A dynamic ground tester offers the only way to obtain the true surgeimpedance of the system.
19.4.1 Rock-Based Radial Elements
On bare rock, a radial counterpoise will conduct and spread the surge charge over a large area. In essence,it forms a leaky capacitor with the more conductive earth on or under the mountain [1]. The conductiv-ity of the rock will be poor when dry, but quite good when wet. If the site experiences significant rainfallbefore a lightning flash, protection will be enhanced. The worst case, however, must be assumed: an earlystrike under dry conditions.
The surge impedance, measured by a dynamic ground tester, should be 25
Ω
or less. This upper-limit number is chosen so that less stress will be placed on the equipment and its surge protectors. Withan 18 kA strike to a 25
Ω
ground system, the entire system will rise 450 kV above the rest of the world atpeak current. This voltage has the potential to jump almost 15.75 in. (0.35 in./10 kV at standard atmo-spheric conditions of 25°C, 30 in. of mercury and 50% relative humidity).
For nonsoil conditions, tower anchor points should have their own radial systems or be encapsu-lated in concrete. Configure the encapsulation to provide at least 3 in. of concrete on all sides around theembedded conductor. The length will depend on the size of the embedded conductor. Rebar shouldextend as far as possible into the concrete. The dynamic ground impedance measurements of the anchorgrounds should each be less than 25
Ω
.The size of the bare conductor for each tower radial (or for an interconnecting wire) will vary,
depending on soil conditions. On rock, a bare no. 1/0 or larger wire is recommended. Flat, solid-copperstrap would be better, but may be blown or ripped if not covered with soil. If some amount of soil is avail-able, no. 6 cable should be sufficient. Make the interconnecting radial wires continuous, and bury themas deep as possible; however, the first 6 to 10 in. will have the most benefit. Going below 18 in. will not becost-effective, unless in a dry, sandy soil where the water table can be reached and ground-rod penetra-tion is shallow. If only a small amount of soil exists, use it to cover the radials to the extent possible. It is
© 2007 by Taylor & Francis Group, LLC

Grounding Tower Elements
289
more important to cover radials in the area near the tower than at greater distances. If, however, soil existsonly at the outer distances and cannot be transported to the inner locations, use the soil to cover theouter portions of the radials.
If soil is present, install ground rods along the radial lengths. Spacing between ground rods isaffected by the depth that each rod is driven; the shallower the rod, the closer the allowed spacing.Because the ultimate depth a rod can be driven cannot always be predicted by the first rod driven, use amaximum spacing of 15 ft when selecting a location for each additional rod. Drive rods at building cor-ners first (within 24 in. but not closer than 6 in. to a concrete footer unless that footer has an encapsu-lated Ufer ground), then fill in the space between the corners with additional rods.
Drive the ground rods in place; do not auger; set in place, then back-fill. The soil compactness isnever as great on augured-hole rods when compared with driven rods. The only exception is when a holeis augured or blasted for a ground rod or rebar and then back-filled in concrete. Because concrete con-tains lime (alkali base) and is porous, it absorbs moisture readily, giving it up slowly. Electron carriers arealmost always present, making the substance a good conductor.
If a Ufer ground is not being implemented, the radials may be Cadwelded to a subterranean ring,with the ring interconnected to the tower foot pad via a minimum of three no. 1/0 wires spaced at 120°angles and Cadwelded to the radial ring.
19.5 Transmission-System Grounding
Nature can devastate a communications site. Lightning can seriously damage an unprotected facility withlittle or no warning, leaving an expensive and time-consuming repair job. The first line of defense isproper grounding of the communications system.
19.5.1 Transmission Line
All coax and waveguide lines must include grounding kits for bonding the transmission line at theantenna [1]. On conductive structures, this can be accomplished by bonding the tail of the grounding kitto the structure itself. Remove all nonconductive paint and corrosion before attachment. Do not drillholes, and do not loosen any existing tower member bolts. Antenna clamping hardware can be used, oran all-stainless-steel hose clamp of the appropriate size can be substituted. The location of the tower-topground is not as critical as the bottom grounding kit.
On nonconductive structures, a no. 1/0 or larger wire must be run down the tower [1]. Bond thetransmission-line grounding kit to this down-run. Keep the wire as far away from all other conductiveruns (aviation lights, coax, and waveguide) as possible. Separation of 2 ft is preferred; 18 in. is the mini-mum. If any other ground lines, conduit, or grounded metallic-structure members must be traversed thatare closer than 18 in., they too must be grounded to the down-lead ground line to prevent flashover.
At the point where the coax or waveguide separates from the conductive structure (metal tower), acoax or waveguide grounding kit must be installed. Secure the connection to a large vertical structuremember with a small number of joints. Attach to a structural member as low as possible on the tower.
Dress the grounding kit tails in a nearly straight 45° downward angle to the tower member. On non-conductive structures, a metal busbar must be used. Ground the bar to one or more of the vertical down-conductors and as close to ground level as possible.
Coaxial cables, lighting conduit, and other lines on the tower must be secured properly to the struc-ture. Figure 19.7 illustrates several common attachment methods.
19.5.2 Cable Considerations
Ground-strap connections must withstand weathering and maintain low electrical resistance betweenthe grounded component and earth [1]. Corrosion impairs ground-strap performance. Braided-wireground straps should not be used in outside installations. Through capillary action resembling that ofa wick, the braid conveys water, which accelerates corrosion. Eventually, advancing corrosion erodes
© 2007 by Taylor & Francis Group, LLC
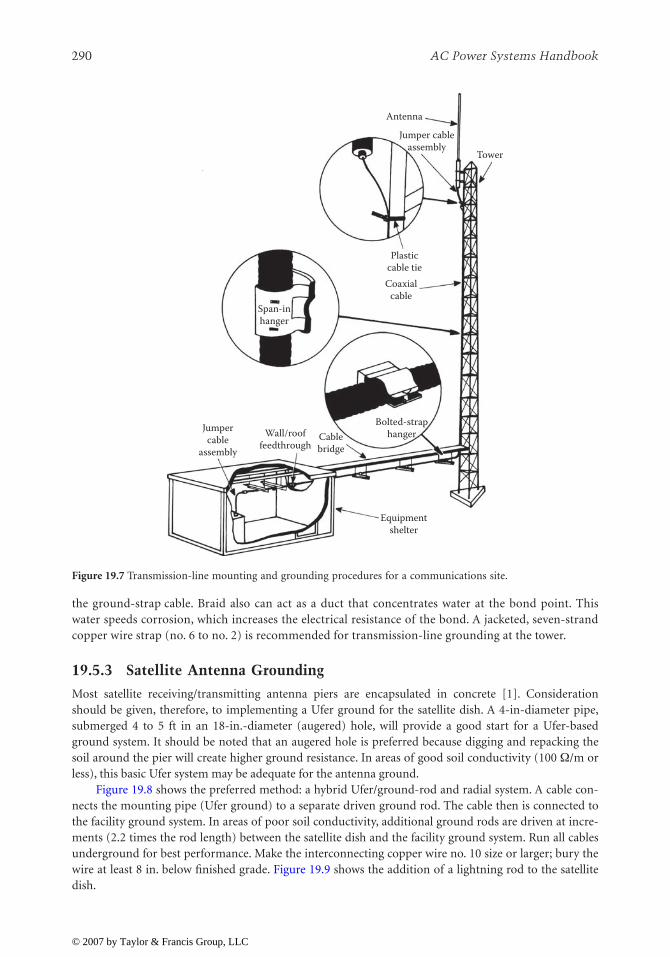
290
AC Power Systems Handbook
the ground-strap cable. Braid also can act as a duct that concentrates water at the bond point. Thiswater speeds corrosion, which increases the electrical resistance of the bond. A jacketed, seven-strandcopper wire strap (no. 6 to no. 2) is recommended for transmission-line grounding at the tower.
19.5.3 Satellite Antenna Grounding
Most satellite receiving/transmitting antenna piers are encapsulated in concrete [1]. Considerationshould be given, therefore, to implementing a Ufer ground for the satellite dish. A 4-in-diameter pipe,submerged 4 to 5 ft in an 18-in.-diameter (augered) hole, will provide a good start for a Ufer-basedground system. It should be noted that an augered hole is preferred because digging and repacking thesoil around the pier will create higher ground resistance. In areas of good soil conductivity (100
Ω
/m orless), this basic Ufer system may be adequate for the antenna ground.
Figure 19.8 shows the preferred method: a hybrid Ufer/ground-rod and radial system. A cable con-nects the mounting pipe (Ufer ground) to a separate driven ground rod. The cable then is connected tothe facility ground system. In areas of poor soil conductivity, additional ground rods are driven at incre-ments (2.2 times the rod length) between the satellite dish and the facility ground system. Run all cablesunderground for best performance. Make the interconnecting copper wire no. 10 size or larger; bury thewire at least 8 in. below finished grade. Figure 19.9 shows the addition of a lightning rod to the satellitedish.
Figure 19.7
Transmission-line mounting and grounding procedures for a communications site.
Antenna
Jumper cableassembly
Plasticcable tieCoaxial
cableSpan-inhanger
Bolted-straphangerCable
bridgeWall/roof
feedthrough
Tower
Equipmentshelter
Jumpercable
assembly
© 2007 by Taylor & Francis Group, LLC

Grounding Tower Elements
291
Figure 19.8
Grounding a satellite receiving antenna. (
After
[1].)
Figure 19.9
Addition of a lightning rod to a satellite antenna ground system. (
After
[9].)
Cadweld
Cadweld
Coupler
Cables
#10 or largercable
5/8″-10′ copper cladsteel ground rod
3′ lightning rod
Lightning roddown conductor#2 solid copper
CadweldTVRO electronics package
© 2007 by Taylor & Francis Group, LLC

292
AC Power Systems Handbook
19.6 References
1. Block, R., “The Grounds for Lightning and EMP Protection,” PolyPhaser Corporation, Gardner-ville, NV, 1987.
2. Lobnitz, E. A., “Lightning Protection for Tower Structures,” in
NAB Engineering Handbook
, 9
th
ed.,J. C. Whitaker (Ed.), National Association of Broadcasters, Washington, DC, 1998.
3. Military Handbook 419A, “Grounding, Bonding, and Shielding for Electronic Systems,” U.S. Gov-ernment Printing Office, Philadelphia, PA, December 1987.
4. IEEE 142 (Green Book), “Grounding Practices for Electrical Systems,” IEEE, New York.
© 2007 by Taylor & Francis Group, LLC

293
20
Facility Ground-System
Design
20.1 Introduction
After the required grounding elements have been determined, they must be connected into a unified system[1]. Many different approaches can be taken, but the goal is the same: establish a low-resistance, low-induc-tance path to surge energy. Figure 20.1 shows a building ground system using a combination of ground rodsand buried bare-copper radial wires. This design is appropriate when the building is large or located in anurban area. This approach also can be used when the facility is located in a high-rise building that requires aseparate ground system. Most newer office buildings have ground systems designed into them. If a compre-hensive building ground system is provided, use it. For older structures (constructed of wood or brick), aseparate ground system will be needed.
Figure 20.2 shows another approach in which a perimeter ground strap is buried around the buildingand ground rods are driven into the earth at regular intervals (2.2 times the rod length). The ground ringconsists of a one-piece copper conductor that is bonded to each ground rod.
If a transmission or microwave tower is located at the site, connect the tower ground system to the mainground point via a copper strap. The width of the strap must be at least 1% of the length and, in any event,not less than 3 in. wide. The building ground system is not a substitute for a tower ground system, no matterwhat the size of the tower. The two systems are treated as independent elements, except for the point atwhich they interconnect.
Connect the utility company power-system ground rod to the main facility ground point as required bythe local electrical code. Do not consider the building ground system to be a substitute for the utility com-pany ground rod. The utility rod is important for safety reasons and must not be disconnected or moved. Donot remove any existing earth ground connections to the power-line neutral connection. To do so may vio-late local electrical code.
Bury all elements of the ground system to reduce the inductance of the overall network. Do not makesharp turns or bends in the interconnecting wires. Straight, direct wiring practices will reduce the overallinductance of the system and increase its effectiveness in shunting fast-rise-time surges to earth. Figure 20.3illustrates the interconnection of a tower and building ground system. In most areas, soil conductivity ishigh enough to permit rods to be connected with no. 6 or larger bare-copper wire. In areas of sandy soil, usecopper strap. A wire buried in low-conductivity, sandy soil tends to be inductive and less effective in dealingwith fast-rise-time current surges. As stated previously, make the width of the ground strap at least 1% of itsoverall length. Connect buried elements of the system as shown in Figure 20.4.
For small installations with a low physical profile, a simplified grounding system can be implemented,as shown in Figure 20.5. A grounding plate is buried below grade level, and a ground wire ties the plate to themicrowave tower mounted on the building.
20.2 Bulkhead Grounding
The bulkhead panel is the cornerstone of an effective facility grounding system [1]. The concept of the bulk-head is simple: establish one reference point to which all cables entering and leaving the equipment buildingare grounded and to which all transient-suppression devices are mounted. Figure 20.6 shows a typicalbulkhead installation for a broadcast or communications facility. The panel size depends on the spacing,
© 2007 by Taylor & Francis Group, LLC

294
AC Power Systems Handbook
Figure 20.1
A facility ground system using the hub-and-spoke approach. The available real estate at the site willdictate the exact configuration of the ground system. If a tower is located at the site, the tower ground system isconnected to the building ground as shown.
Figure 20.2
Facility ground using a perimeter ground-rod system. This approach works well for buildings with limitedavailable real estate
Ground rods
Main station ground point (Bulkhead)
Studio facility
22 feet
22 feet
22 feet
22 feet
Tower (if used)Ground strap (3″ minimum)
Utility ground rod
Tower ground system
Notes: 1. All ground rods are 10 feet long and 1 inch in diameter.
2. Bury all components of the ground system.
130 feet
22 feet 22 feet 22 feet Perimeter ground system
Main station ground point (Bulkhead)
140 feet
Utility AC ground
Ground strap (3″ minimum)
Tower ground system
Tower (if used)
Notes: 1. All ground rods are 10 feet long and
1 inch in diameter. 2. Bury all components
of the ground system.
© 2007 by Taylor & Francis Group, LLC

Facility Ground-System Design
295
Figure 20.3
A typical guy-anchor and tower-radial grounding scheme. The radial ground is no. 6 copper wire. Theground rods are 5/8 in.
×
10 ft. (
After
[1].)
Figure 20.4
Preferred bonding method for below-grade elements of the ground system. (
After
[1].)
Ground rodsRadial ground
Radial groundGuy wire
Guy wire
40′
#2 AWG copper(Solid #2 preferred)
Cable to groundrod exothermicweld connection
Ground rod toground rod
exothermic weldconnection
Copper clad steel groundrod 5/8′′ × 10′ long, 40%conductivity copperweld
© 2007 by Taylor & Francis Group, LLC

296
AC Power Systems Handbook
number, and dimensions of the coaxial lines, power cables, and other conduit entering or leaving thebuilding.
To provide a weatherproof point for mounting transient-suppression devices, the bulkhead can bemodified to accept a subpanel, as shown in Figure 20.7. The subpanel is attached so that it protrudesthrough an opening in the wall and creates a secondary plate on which transient suppressors aremounted and grounded. A typical cable/suppressor-mounting arrangement for a communications site isshown in Figure 20.8. To handle the currents that may be experienced during a lightning strike or largetransient on the utility company ac line, the bottommost subpanel flange (which joins the subpanel tothe main bulkhead) must have a total surface-contact area of at least 0.75 in.
2
per transient suppressor.Because the bulkhead panel will carry significant current during a lightning strike or ac line distur-
bance, it must be constructed of heavy material. The recommended material is 1/8-in. C110 (solid cop-per) 1/2-hard. This type of copper stock weighs nearly 5-1/2 lb/ft
2
and is rather expensive. Installing abulkhead, although sometimes difficult and costly, will pay dividends for the life of the facility. Use 18-8stainless-steel mounting hardware to secure the subpanel to the bulkhead.
Figure 20.5
Grounding a small microwave transmission tower.
5 point lighting rod. It must be so high to cover the parabola with its safety cone.
Receiving antenna tower.
Faraday shield (bus bar or round section bar).
Connecting clips for Faraday shield.
Connecting clips forvalleys or gutters.
Faraday shielddescending cable(connected to the water tube stirrupsand to any other iron object).
Grounding of the internalelectrical system and ground of theequipment (copper round section bar).
Bar leading to ground(heat galvanized iron).
Bonding plates ofseveral conductors(cadmium plated steel).
Bar-bus bar clip.
Zinc plated steel busbar or stranded wire for dis-charge connections and dispersions.It may be buried in the earth orcovered with mass concrete.Grounding ring for descendingcable bonding (zinc plated steel busbar or stranded wire. It may be buriedin the earth or covered with massconcrete.
A
B C
D
F
F E
I G H
H
L
L N
M
M 5/15 m.
2.5 m.
2.3 m.
A
BC
D
E
F
G
H
I
L
M
N
© 2007 by Taylor & Francis Group, LLC

Facility Ground-System Design
297
Because the bulkhead panel establishes the central grounding point for all equipment within thebuilding, it must be tied to a low-resistance (and low-inductance) perimeter ground system. The bulk-head establishes the
main facility ground point
, from which all grounds inside the building are referenced.A typical bulkhead installation for a small communications site is shown in Figure 20.9.
20.2.1 Bulkhead Panel
A properly installed bulkhead panel will exhibit lower impedance and resistance to ground than anyother equipment or cable grounding point at the facility [1]. Waveguide and coax line grounding kitsshould be installed at the bulkhead panel as well as at the tower. Dress the kit tails downward at a straight45° angle using 3/8-in. stainless-steel hardware to the panel. Position the stainless-steel lug at the tail end,
Figure 20.6
The basic design of a bulkhead panel for a facility. The bulkhead establishes the grounding referencepoint for the plant.
Figure 20.7
The addition of a subpanel to a bulkhead as a means of providing a mounting surface for transient-suppression components. To ensure that the bulkhead is capable of handling high surge currents, use the hardwareshown. (
After
[1].)
TowerTransmission lines
Bulkheadpanel
Perimeterground system
Control lines
AC distribution panel
Utility AC power cableEquipment building
Transmitter
Equipmentrack
Telephone company lines
Outside equipment
building
Inside equipment
building
Subplate C110 copper for mounting
transient suppressors
Note: Install subplate after bulkhead is in place
1/4″ × 3/4″ threaded studs (10)use 18-8 stainless steelhardware
To ground system
Cable entrance holes with weather boots
© 2007 by Taylor & Francis Group, LLC

298
AC Power Systems Handbook
flat against a cleaned spot on the panel. Joint compound will be needed for aluminum and is recom-mended for copper panels.
Because the bulkhead panel will be used as the central grounding point for all the equipment insidethe building, the lower the inductance to the perimeter ground system, the better. The best arrangementis to simply extend the bulkhead panel down the outside of the building, below grade, to the perimeterground system. This will give the lowest resistance and the smallest inductive voltage drop. This approachis illustrated in Figure 20.10.
If cables are used to ground the bulkhead panel, secure the interconnection to the outside groundsystem along the bottom section of the panel. Use multiple no. 1/0 or larger copper wire or several solid-copper straps. If using strap, attach with stainless-steel hardware, and apply joint compound for alumi-num bulkhead panels. Clamp and Cadweld, or silver-solder for copper/brass panels. If no. 1/0 or larger
Figure 20.8
Mounting-hole layout for a communications site bulkhead subpanel.
Figure 20.9
Bulkhead installation at a small communications site. (
After
[1].)
Halo Exterior cable tray
Coax surge arrester footprint
Individual base station groundsInside cable tray
Outside ground
Outside ground
Telcoline
protectors
AC powerdistribution
panel
Telephone lineprotector
Power lineprotector
To telco
Interiorfloor level Exterior
perimeter ground
Power
Telco
Coax
Coax perimeter1½″ copper strap
© 2007 by Taylor & Francis Group, LLC

Facility Ground-System Design
299
wire is used, employ crimp lug and stainless-steel hardware. Measure the dc resistance. It should be lessthan 0.01
Ω
between the ground system and the panel. Repeat this measurement on an annual basis.If the antenna feed lines do not enter the equipment building via a bulkhead panel, treat them in the
following manner:
• Mount a feed-line ground bar on the wall of the building approximately 4 in. below the feed-lineentry point.
• Connect the outer conductor of each feed line to the feed-line ground bar using an appropriategrounding kit.
• Connect a no. 1/0 cable or 3- to 6-in.-wide copper strap between the feed-line ground bar andthe external ground system. Make the joint a Cadweld or silver-solder connection.
• Mount coaxial arrestors on the edge of the bar.• Weatherproof all connections.
20.2.2 Lightning Protectors
A variety of lightning arrestors are available for use on coaxial transmission lines, utility ac feeds, andtelephone cables. The protector chosen must be carefully matched to the requirements of the application.Do not use air-gap protectors because these types are susceptible to air pollution, corrosion, temperature,humidity, and manufacturing tolerances. The turn-on speed of an air gap device is a function of all of theforegoing elements. A simple gas-tube-type arrestor is an improvement, but neither of these devices willoperate reliably to protect shunt-fed cavities, isolators, or receivers that include static drain inductors toground (which most have). Such voltage-sensitive crowbar devices are short-circuited by the dc path toground found in these circuits. The inductive change in current per unit time (
Δ
di
/
dt
) voltage drop isusually not enough to fire the protector, but it can be sufficient to destroy the inductor and then thereceiver front end. Instead, select a protector that does not have dc continuity on the coaxial center pinfrom input to output. Such units have a series capacitor between the gas tube and the equipment centerpin that will allow the voltage to build up so that the arrestor can fire properly.
Figure 20.10
The proper way to ground a bulkhead panel and provide a low-inductance path for surge currentsstripped from cables entering and leaving the facility. The panel extends along the building exterior to below grade.It is silver-soldered to a no. 2/0 copper wire that interconnects with the outside ground system. (
After
[1].)
Inside floor Silversolder
Detail A
Detail A
Solder
© 2007 by Taylor & Francis Group, LLC

300
AC Power Systems Handbook
20.2.2.1 Typical Installation
Figure 20.11 illustrates a common grounding arrangement for a remotely located grounded-tower (FM,TV, or microwave radio) transmitter plant. The tower and guy wires are grounded using 10-ft-long cop-per-clad ground rods. The antenna is bonded to the tower, and the transmission line is bonded to thetower at the point where it leaves the structure and begins the horizontal run into the transmitter build-ing. Before entering the structure, the line is bonded to a ground rod through a connecting cable. Thetransmitter itself is grounded to the transmission line and to the ac power-distribution system ground.This, in turn, is bonded to a ground rod where the utility feed enters the building. The goal of thisarrangement is to strip all incoming lines of damaging overvoltages before they enter the facility. One ormore lightning rods are mounted at the top of the tower structure. The rods extend at least 10 ft abovethe highest part of the antenna assembly.
Such a grounding configuration, however, has built-in problems that can make it impossible to pro-vide adequate transient protection to equipment at the site. Look again at the example. To equipmentinside the transmitter building, two grounds actually exist: the utility company ground and the antennaground. One ground will have a lower resistance to earth, and one will have a lower inductance in theconnecting cable or copper strap from the equipment to the ground system.
Using the Figure 20.11 example, assume that a transient overvoltage enters the utility companymeter panel from the ac service line. The overvoltage is clamped by a protection device at the meterpanel, and the current surge is directed to ground. But
which ground
, the utility ground or the antennaground?
The utility ground surely will have a lower inductance to the current surge than the antenna ground,but the antenna probably will exhibit a lower resistance to ground than the utility side of the circuit.Therefore, the surge current will be divided between the two grounds, placing the transmission equip-ment in series with the surge suppressor and the antenna ground system. A transient of sufficient poten-tial will damage the transmission equipment.
Transients generated on the antenna side because of a lightning discharge are no less troublesome.The tower is a conductor, and any conductor is also an inductor. A typical 150-ft self-supporting tower
Figure 20.11
A common, but not ideal, grounding arrangement for a transmission facility using a grounded tower.A better configuration involves the use of a bulkhead panel through which all cables pass into and out of the equipmentbuilding.
Lightningrod(s)
Antenna tower Radiating elements
Bond toground line
Bondto tower
Transmission lineTransmitter building
RF output AC line Ground line
Transmitter
Circuit breaker
box
Ground rod
Utility company
meter panel
AC power input
Tower ground system
Ground rod
Ground rods
Bond to tower
© 2007 by Taylor & Francis Group, LLC

Facility Ground-System Design
301
may exhibit as much as 40
μ
H inductance. During a fast-rise-time lightning strike, an instantaneous volt-age drop of 360 kV between the top of the tower and the base is not unlikely. If the coax shield is bondedto the tower 15 ft above the earth (as shown in the previous figure), 10% of the tower voltage drop (36kV) will exist at that point during a flash. Figure 20.12 illustrates the mechanisms involved.
The only way to ensure that damaging voltages are stripped off all incoming cables (coax, ac power,and telephone lines) is to install a bulkhead entrance panel and tie all transient-suppression hardware toit. Configuring the system as shown in Figure 20.13 strips away all transient voltages through the use of asingle-point ground. The bulkhead panel is the ground reference for the facility. With such a design, sec-ondary surge current paths do not exist, as illustrated in Figure 20.14.
Figure 20.12
The equivalent circuit of the facility shown in Figure 20.23. Note the discharge current path throughthe electronic equipment.
Figure 20.13
The preferred grounding arrangement for a transmission facility using a bulkhead panel. With thisconfiguration, all damaging transient overvoltages are stripped off the coax, power, and telephone lines before theycan enter the equipment building.
Coax
Bulkhead panel
Equipment current
Electronicequipment
Cable tray
Entry plate
Coax arrester
To equipment
Perimeter ground
Stakes
Tower ground system
© 2007 by Taylor & Francis Group, LLC

302
AC Power Systems Handbook
Protecting the building itself is another important element of lightning surge protection. Figure20.15 shows a common system using multiple lightning rods. As specified by NFPA 78, the dimensionsgiven in the figure are as follows:
• A = 50-ft maximum spacing between air terminals• B = 150-ft maximum length of a coursing conductor permitted without connection to a main
perimeter or downlead conductor• C = 20- or 25-ft maximum spacing between air terminals along an edge
20.2.3 Checklist for Proper Grounding
A methodical approach is necessary in the design of a facility ground system. Consider the followingpoints:
1. Install a bulkhead panel to provide mechanical support, electric grounding, and lightning protec-tion for coaxial cables, power feeds, and telephone lines entering the equipment building.
Figure 20.14
The equivalent circuit of the facility shown in Figure 20.25. Discharge currents are prevented fromentering the equipment building.
Figure 20.15
Conduction lightning-protection system for a large building. (
From
[5].
Used with permission
.)
Coax
Bulkheadpanel with
suppressors
Electronicequipment
Air terminals(lightning rods)
Coursing(interconnecting)conductor
Groundingelectrode
Downconductor
C
A B
A
A
© 2007 by Taylor & Francis Group, LLC

Facility Ground-System Design
303
2. Install an internal ground bus using no. 2 or larger solid-copper wire. (At transmission facilities,use copper strap that is at least 3 in. wide.) Form a
star
grounding system. At larger installations,form a
star-of-stars
configuration. Do not allow ground loops to exist in the internal ground bus.Connect the following items to the building internal ground system:• Chassis racks and cabinets of all hardware• All auxiliary equipment• Battery charger• Switchboard• Conduit• Metal raceway and cable tray
3. Install a tower earth ground array by driving ground rods and laying radials as required to achievea low earth ground impedance at the site.
4. Connect outside metal structures to the earth ground array (towers, metal fences, metal buildings,and guy-anchor points).
5. Connect the power-line ground to the array. Follow local electrical code to the letter.6. Connect the bulkhead to the ground array through a low-inductance, low-resistance bond.7. Do not use soldered-only connections outside the equipment building. Crimped, brazed, and
exothermic (Cadwelded) connections are preferable. For a proper bond, all metal surfaces mustbe cleaned, any finish removed to bare metal, and surface preparation compound applied (wherenecessary). Protect all connections from moisture by appropriate means (sealing compound andheat-sink tubing).
20.3 AC System Grounding Practices
Installing an effective ground system to achieve a good earth-to-grounding-electrode interface is onlyhalf the battle for a facility designer. The second, and equally important, element of any ground system isthe configuration of grounding conductors inside the building. Many different methods can be used toimplement a ground system, but some conventions always should be followed to ensure a low-resistance(and low-inductance) layout that will perform as required. Proper grounding is important whether ornot the facility is located in a high-RF field.
20.3.1 Building Codes
As outlined previously in this chapter, the primary purpose of grounding electronic hardware is to pre-vent electric shock hazard. The National Electrical Code (NEC) and local building codes are designed toprovide for the safety of the workplace. Local codes always should be followed. Occasionally, code sec-tions are open to some interpretation. When in doubt, consult a field inspector. Codes constantly arebeing changed or expanded because new situations arise that were not anticipated when the codes werewritten. Sometimes, an interpretation will depend upon whether the governing safety standard applies tobuilding wiring or to a factory-assembled product to be installed in a building. Underwriters Laborato-ries (UL) and other qualified testing organizations examine products at the request and expense of man-ufacturers or purchasers, and list products if the examination reveals that the device or system presentsno significant safety hazard when installed and used properly.
Municipal and county safety inspectors generally accept UL and other qualified testing laboratorycertification listings as evidence that a product is safe to install. Without a listing, the end user might notbe able to obtain the necessary wiring permits and inspection sign-off. On-site wiring must conform withlocal wiring codes. Most codes are based on the NEC. Electrical codes specify wiring materials, wiringdevices, circuit protection, and wiring methods.
© 2007 by Taylor & Francis Group, LLC

304
AC Power Systems Handbook
20.3.1.1 Single-Point Ground
Single-point grounding is the basis of any properly designed facility ground network. Fault currents andnoise should have only one path to the facility ground. Single-point grounds can be described as
star
sys-tems in which radial elements circle out from a central hub. A star system is illustrated in Figure 20.16.Note that all equipment grounds are connected to a
main ground point
, which is then tied to the facilityground system. Multiple ground systems of this type can be cascaded as needed to form a
star-of-stars
facility ground system. The key element in a single-point ground is that each piece of equipment has oneground reference. Fault energy and noise then are efficiently drained to the outside earth ground system.The single-point ground is basically an extension of the bulkhead panel discussed previously.
20.3.2 Isolated Grounding
Isolated grounding schemes, where the signal reference plane is isolated from equipment ground butconnected to an
isolated
electrode in the earth, do not work, are unsafe, and violate the NEC [2]. It isthought by some people that the isolated earth connection is
clean
because there is no connectionbetween it and the
dirty
system ground connection at the service entrance. The clean, isolated earth con-nection is also viewed (incorrectly) as a point where noise currents can flow into the earth and be dissi-pated. Kirchoff 's current law teaches that any current flowing into the isolated ground must return to thesource through another earth connection. Current cannot be dissipated. It must always return to itssource. Even lightning current is not dissipated into the earth. It must have a return path (i.e., the electro-static and electromagnetic fields that created the charge buildup and the lightning strike in the firstplace).
Consider what might happen if such a system were subjected to a lightning strike. Assume that atransient current of 2000 A flows into the earth and through an earth resistance of 5
Ω
between the sys-tem ground electrode and the isolated electrode. A more realistic resistance might be even higher, per-haps 25
Ω;
2000 A flowing through 5
Ω
results in a voltage drop or transient potential of 10,000 Vbetween the two electrodes. Because this potential is impressed between the equipment frame (systemground electrode) and the signal reference plane (isolated electrode), it could result in equipment dam-age and personnel hazard. Dangerous potential differences between grounding subsystems can bereduced by bonding together all earth electrodes at a facility.
A facility ground system, then, can be defined as an electrically interconnected system of multipleconducting paths to the earth electrode or system of electrodes. The facility grounding system includes allelectrically interconnected grounding subsystems such as:
• The equipment grounding subsystem• Signal reference subsystem• Fault protection subsystem• Lightning protection subsystem
Figure 20.16
Typical facility grounding system. The
main facility ground point
is the reference from which allgrounding is done at the plant. If a bulkhead entrance panel is used, it will function as the main ground point.
Controlboard 1
Rack1
Rack2
Rack3
Rack4
ComputerCPU
3- to 4-inchground strap
Controlboard 2
I/O gauge cable or larger
Main ground point
© 2007 by Taylor & Francis Group, LLC

Facility Ground-System Design
305
Isolated ground (IG) receptacles, which are a version of single-point grounding, are permitted bythe NEC. Proper application of IG receptacles is very important. They must be used with an insulatedequipment grounding conductor, not a bare conductor. Also, only metallic conduit should be used.
20.3.3 Separately Derived Systems
A separately derived system is a premises wiring system whose power is derived from generator, trans-former, or converter windings and that has no direct electrical connection, including a solidly connectedgrounded circuit conductor, to supply conductors originating in another system [3]. Solidly grounded,wye-connected, isolation transformers used to supply power to computer room equipment are examplesof separately derived systems [2]. Figure 20.17 illustrates the bonding and grounding requirements ofseparately derived systems. NEC 250-26 permits the bonding and grounding connections to be made atthe source of the separately derived system or at the first disconnecting means. Other examples of sepa-rately derived systems include generators and UPS systems. Note that all earth electrodes are bondedtogether via the equipment grounding conductor system. This is consistent with the recommendationslisted in NEC 250-86.
20.3.4 Grounding Terminology
•
Grounded conductor
. A system or circuit conductor that is intentionally grounded [3].•
Equipment grounding conductor
. The conductor used to connect the non-current-carrying metalparts of equipment, raceways, and other enclosures to the system grounded conductor, the ground-ing electrode conductor, or both, at the service equipment or at the source of a separately derivedsystem [3].
•
Main bonding jumper
. The connection between the grounded circuit conductor and the equipmentgrounding conductor at the service [3].
•
Grounding electrode conductor
. The conductor used to connect the grounding electrode to theequipment grounding conductor, to the grounded conductor, or to both, of the circuit at theservice equipment or at the source of a separately derived system [3].
•
Service
. The conductors and equipment for delivering energy from the electricity supply systemto the wiring system of the premises served [3].
Figure 20.17
Basic scheme of the separately derived power system. (
From
[2].
Used with permission
.)
Subpanel A B C
Dry-type transformer From the service G C B A
Connections at 1st disconnect
Connections at source
3φ 4W load
NG
© 2007 by Taylor & Francis Group, LLC

306
AC Power Systems Handbook
•
Service conductors
. The supply conductors that extend from the street main or from transformersto the service equipment of the premises supplied [3].
•
Service equipment
. The necessary equipment, usually consisting of a circuit breaker or switch andfuses, and their accessories, located near the point of entrance of supply conductors to a buildingor other structure, or an otherwise defined area, and intended to constitute the main control andmeans of cutoff of the supply [3].
•
Equipotential plane
. A mass of conducting material that offers a negligible impedance to currentflow, thus producing zero volts (equipotential) between points on the plane.
•
Floating signal grounding
. A nongrounding system in which all electronic signal references areisolated from ground.
•
Single-point grounding
. A grounding system in which all electronic signal references are bondedtogether and grounded at a single point.
•
Multipoint grounding
. A grounding system in which all electronic signal references are groundedat multiple points.
20.3.5 Facility Ground System
Figure 20.18 illustrates a star grounding system as applied to an ac power-distribution transformer andcircuit-breaker panel. Note that a central ground point is established for each section of the system: onein the transformer vault and one in the circuit-breaker box. The breaker ground ties to the transformervault ground, which is connected to the building ground system. Figure 20.19 shows single-pointgrounding applied to a data processing center. Note how individual equipment groups are formed into astar grounding system, and how different groups are formed into a star-of-stars configuration. A similarapproach can be taken for a data processing center using multiple modular power center (MPC) units, asshown in Figure 20.20. The terminal mounting wall is the reference ground point for the room.
Grounding extends to all conductive elements of the data processing center. As illustrated in Figure20.21, the raised-floor supports are integrated into the ground system, in addition to the metal work ofthe building. The flooring is bonded to form a mesh grounding plane that is tied to the central groundreference point of the room. This is another natural extension of the bulkhead concept discussed previ-ously. Figure 20.22 shows connection detail for the raised-floor supports. Make sure to use a flooring sys-tem that can be bolted together to form secure electrical — as well as mechanical — connections.
Figure 20.18
Single-point grounding applied to a power-distribution system. (
After
[6].)
H1H2H3GG
ShieldTransformer
enclosureX1
X2
X3
N
Core
Main outputbreaker123NG
Buildingground
Localground
Loadcircuit breakers
To DP units that require a neutral
“Green” safetyequipment groundconductors routedwith power conductors toeach DP unit
Ground bus connected(bolted) to frame
© 2007 by Taylor & Francis Group, LLC

Facility Ground-System Design
307
Figure 20.23 shows the recommended grounding arrangement for a typical communications facility.The building ground system is constructed using heavy-gauge copper wire (no. 4 or larger) if the studio isnot located in an RF field, or a wide copper strap (3-in. minimum) if the facility is located near an RFenergy source. Figure 20.24 gives a functional view of the plan shown in Figure 20.23. Note the bulkheadapproach.
Run the strap or cable from the perimeter ground to the main facility ground point. Branch outfrom the main ground point to each major piece of equipment and to the various equipment rooms.Establish a
local ground point
in each room or group of racks. Use a separate ground cable for each pieceof equipment (no. 12 gauge or larger). Figure 20.25 shows the grounding plan for a facility incorporating
Figure 20.19
Configuration of a star-of-stars grounding system at a data processing facility. (
After
[6].)
Utility480 VMG
480 VUPS2480 V To air
conditioning
To other computer systemsor peripherals
DP
DP
DP
DP
Put power centersclose to their loads to
keep leads short
Conduit isconnected toraised floor
support structure
Powercenter Box under floor
Exit
UPS1480 V
© 2007 by Taylor & Francis Group, LLC

308
AC Power Systems Handbook
a grounding halo. Equipment grounding is handled by separate conductors tied to the bulkhead panel(entry plate). A
halo
ground is constructed around the perimeter of the room. Cable trays are tied intothe halo. All electronic equipment is grounded to the bulkhead to prevent ground-loop paths. In thisapplication, the halo serves essentially the same function as the raised-floor ground plane in the data pro-cessing center.
The ac line ground connection for individual pieces of equipment often presents a built-in problemfor the system designer. If the equipment is grounded through the chassis to the equipment-roomground point, a ground loop can be created through the green-wire ground connection when the equip-ment is plugged in. The solution to this problem involves careful design and installation of the ac power-distribution system to minimize ground-loop currents, while at the same time providing the required
Figure 20.20
Establishing a star-based, single-point ground system using multiple modular power centers. (
After
[6].)
Figure 20.21
Grounding plan for a raised-floor support system.
UPS2
UPS1MG
MPC
MPC
MPC
MPC
UtilityTelephone
cableFirehalon
Exit
Input groundsinterconnected
by copper straps
Stringer
Tiles
Groundring
Raceway
Conduit
© 2007 by Taylor & Francis Group, LLC

Facility Ground-System Design
309
protection against ground faults. Some equipment manufacturers provide a convenient solution to theground-loop problem by isolating the signal ground from the ac and chassis ground. This feature offersthe user the best of both worlds: the ability to create a signal ground system and ac ground system that areessentially free of interaction and ground loops. Do not confuse this isolated signal ground with theisolated ground system described previously. In this context,
isolated
refers only to the equipment input/output (signal) connections, not the equipment chassis; there is still only one integrated ground systemfor the facility, and all equipment is tied to it.
It should be emphasized that the designof a ground system must be considered as anintegrated package. Proper procedures mustbe used at all points in the system. It takes onlyone improperly connected piece of equipmentto upset an otherwise perfect ground system.The problems generated by a single groundingerror can vary from trivial to significant,depending upon where in the system the errorexists. This consideration leads, naturally, tothe concept of ground-system maintenance fora facility. Check the ground network fromtime to time to ensure that no faults or errorshave occurred. Anytime new equipment isinstalled, or old equipment is removed fromservice, careful attention must be given to thepossible effects that such work will have on theground system.
20.3.5.1 Grounding Conductor Size
The NEC and local electrical codes specify theminimum wire size for grounding conductors.The size varies, depending upon the rating ofthe current-carrying conductors. Code typi-cally permits a smaller ground conductor thanhot conductors. It is recommended, however,that the same size wire be used for bothground lines and hot lines. The additional cost
Figure 20.23
Typical grounding arrangement for individual equipment rooms at a communications facility. Theground strap from the main ground point establishes a
local ground point
in each room, to which all electronicequipment is bonded.
Aluminum pedestal assembly
#6 Braided copperwire to building
ground
3/16″ × 1–1/2″ Machine bolts
3/16″ × 1/2″ Machine bolt
Zinc plated grounding clamp
Figure 20.22 Bonding detail for the raised-floor supportsystem.
Equipment room
AC power panel
Perimeter ground system
RF equipment rack
Rack no. 1
Rack no. 2
Rack no. 3
Rack no. 4
Bulkhead panel
3- to 4-inch ground straps
Production room
AC control room
FM control room
Main station ground point 3- to 4-inch ground straps
© 2007 by Taylor & Francis Group, LLC

310
AC Power Systems Handbook
involved in the larger ground wire often is offset by the use of a single size of cable. Furthermore, bettercontrol over noise and fault currents is achieved with a larger ground wire.
It is recommended that separate insulated ground wires be used throughout the ac distribution sys-tem. Do not rely on conduit or raceways to carry the ground connection. A raceway interface thatappears to be mechanically sound may not provide the necessary current-carrying capability in the eventof a phase-to-ground fault. Significant damage can result if a fault occurs in the system. When the electri-cal integrity of a breaker panel, conduit run, or raceway junction is in doubt, fix it. Back up the mechani-cal connection with a separate ground conductor of the same size as the current-carrying conductors.Loose joints have been known to shower sprays of sparks during phase-to-ground faults, creating a firehazard. Secure the ground cable using appropriate hardware. Clean attachment points of any paint ordirt accumulation. Properly label all cables.
Figure 20.24
Physical implementation of the facility shown in Figure 20.23.
Figure 20.25
Bulkhead-based ground system including a grounding halo.
Audio console no. 1
Audio, ACand ground
lines
Audioconsole
no. 2
Production room
Air studio
AC utilitycompany line
Telco andaudio lines
Transmissionlines and coax
AC distributionpanel
Perimeterground system
Equipmentracks
Audio, AC andground lines
Halo AC power panel
AC
Conduit
Ground wire
Coaxlines
Entry plate
To lower
Arresters
Floor meshbonds
© 2007 by Taylor & Francis Group, LLC

Facility Ground-System Design
311
Structural steel, compared with copper, is a poor conductor at any frequency. At dc, steel has a resis-tivity 10 times that of copper. As frequency rises, the skin effect is more pronounced because of the mag-netic effects involved. A no. 6 copper wire can have less RF impedance than a 12-in. steel “I” beam.Furthermore, because of their bolted, piecemeal construction, steel racks and building members shouldnot be depended upon alone for circuit returns.
20.3.5.2 High-Frequency Effects
A significant amount of research has been conducted into why the 60 Hz power grounding system isincapable of conducting RF signals to the common reference point, thereby equalizing existing differ-ences in potential [4]. A properly designed power grounding system is of sufficiently low impedance at 60Hz to equalize any potential differences so that enclosures, raceways, and all grounded metal elements areat the same reference (ground) potential. However, at higher frequencies, equalization is preventedbecause of increased impedance.
The impedance of a conductor consists of three basic components: resistance, capacitive reactance,and inductive reactance. Although the inductance L (in Henrys) will be constant for a conductor of agiven length and cross-sectional area, the inductive reactance XL will vary according to the frequency f ofthe applied voltage as follows:
(20.2)
Therefore, at 60 Hz, the inductive reactance will be 377 × L; at 30 MHz, it will be (188.5 × 10⁶) × L. It isevident, then, that at 60 Hz the equipment grounding conductor is a short circuit, but at 30 MHz, it iseffectively an open circuit.
In addition to increased inductive reactance at higher frequencies, there are also stray capacitanceand stray inductance between adjacent conductors or between conductors and adjacent grounded metal,as well as resonance effects. These factors combine to yield an increase in apparent conductor impedanceat higher frequencies.
If conductors are connected in a mesh or grid to form a multitude of low-impedance loops in paral-lel, there will be little voltage difference between any two points on the grid at all frequencies from 60 Hzup to a frequency where the length of one side of the square represents about 1/10 wavelength. A gridmade up of 2-ft squares (such as a raised computer-room floor) will at any point provide an effectiveequipotential ground reference point for signals up to perhaps 30 MHz.
20.3.6 Power-Center Grounding
A modular power center, commonly found in computer-room installations, provides a comprehensivesolution to ac power-distribution and ground-noise considerations. Such equipment is available fromseveral manufacturers, with various options and features. A computer power-distribution center gener-ally includes an isolation transformer designed for noise suppression, distribution circuit breakers,power-supply cables, and a status-monitoring unit. The system concept is shown in Figure 20.26. Inputpower is fed to an isolation transformer with primary taps to match the ac voltage required at the facility.A bank of circuit breakers is included in the chassis, and individual preassembled and terminated cablessupply ac power to the various loads. A status-monitoring circuit signals the operator if any condition isdetected outside normal parameters.
The ground system is an important component of the MPC. A unified approach, designed to pre-vent noise or circulating currents, is taken to grounding for the entire facility. This results in a cleanground connection for all equipment on-line.
The use of a modular power center can eliminate the inconvenience associated with rigid conduitinstallations. Distribution systems also are expandable to meet future facility growth. If the plant ever isrelocated, the power center can move with it. MPC units usually are expensive. However, considering thecosts of installing circuit-breaker boxes, conduit, outlets, and other hardware on-site by a licensed electri-
X fLL = 2π
© 2007 by Taylor & Francis Group, LLC

312 AC Power Systems Handbook
Figure 20.26 The basic concept of a computer-room modular power center: (a) basic line drawing of system, (b)typical physical implementation, (c) functional block diagram. Both single- and multiphase configurations areavailable. When ordering an MPC, the customer can specify cable lengths and terminations, making installationquick and easy. (After [7].)
AC input
Power distribution system
Isolation transformerVoltage
taps
Monitoringsystem
Circuit breakers
Interconnectingcables and hardware AC
outlet 1
ACoutlet 2
ACoutlet 3
ACoutlet 4
A typical computer room application
InputJ-box
Inputbreaker
Shunt trip
Isolationtransformer
Surgesuppression
Singlepoint
ground
Monitoringsystem
Localdisplay
Outputpanelboard
Surgearrestor
ControlJ-box
(a)
(b)
(c)
© 2007 by Taylor & Francis Group, LLC

Facility Ground-System Design 313
cian, the power-center approach may be economically viable. The use of a power center also will make iteasier to design a standby power system for the facility. Many computer-based operations do not have astandby generator on-site. Depending on the location of the facility, it might be difficult or even impossi-ble to install a generator to provide standby power in the event of a utility company outage. However, byusing the power-center approach to ac distribution for computer and other critical load equipment, anuninterruptible power system can be installed easily to power only the loads that are required to keep thefacility operating. With a conventional power-distribution system — where all ac power to the building,or a floor of the building, is provided by a single large circuit-breaker panel — separating the criticalloads from other nonessential loads (such as office equipment, lights, and heating equipment) can be anexpensive detail.
20.3.6.1 Isolation Transformers
One important aspect of an MPC is the isolation transformer. The transformer serves to:
• Attenuate transient disturbances on the ac supply lines• Provide voltage correction through primary-side taps• Permit the establishment of a local ground reference for the facility served
Whether or not an MPC is installed at a facility, consideration should be given to the appropriateuse of an isolation transformer near a sensitive load.
The ac power supply for many buildings origi-nates from a transformer located in a basementutility room. In large buildings, the ac power foreach floor can be supplied by transformers closer tothe loads they serve. Most transformers are 208 Y/120 V three-phase. Many fluorescent lighting cir-cuits operate at 277 V, supplied by a 408 Y/277 Vtransformer. Long feeder lines to DP systems andother sensitive loads raise the possibility of voltagefluctuations based on load demand and ground-loop-induced noise.
Figure 20.27 illustrates the preferred methodof power distribution in a building. A separate ded-icated isolation transformer is located near the DPequipment, providing good voltage regulation andpermitting the establishment of an effective single-point star ground in the data processing center.Note that the power-distribution system voltageshown in the figure (480 V) is maintained until theDP step-down isolation transformer. Use of thishigher voltage provides more efficient transfer ofelectricity throughout the plant. At 480 V, the linecurrent is about 43% of the current in a 208 V sys-tem for the same conducted power.
There are a number of tradeoffs with regard tofacility ac power-system design. An experienced,licensed electrical contractor or registered profes-sional engineer should be consulted during theearly stages of any renovation or new constructionproject.
480 V
480 V
A/C units DP units
480 V
208 V120 V
Figure 20.27 Preferred power-distribution con-figuration for a data processing site. (After [6].)
© 2007 by Taylor & Francis Group, LLC
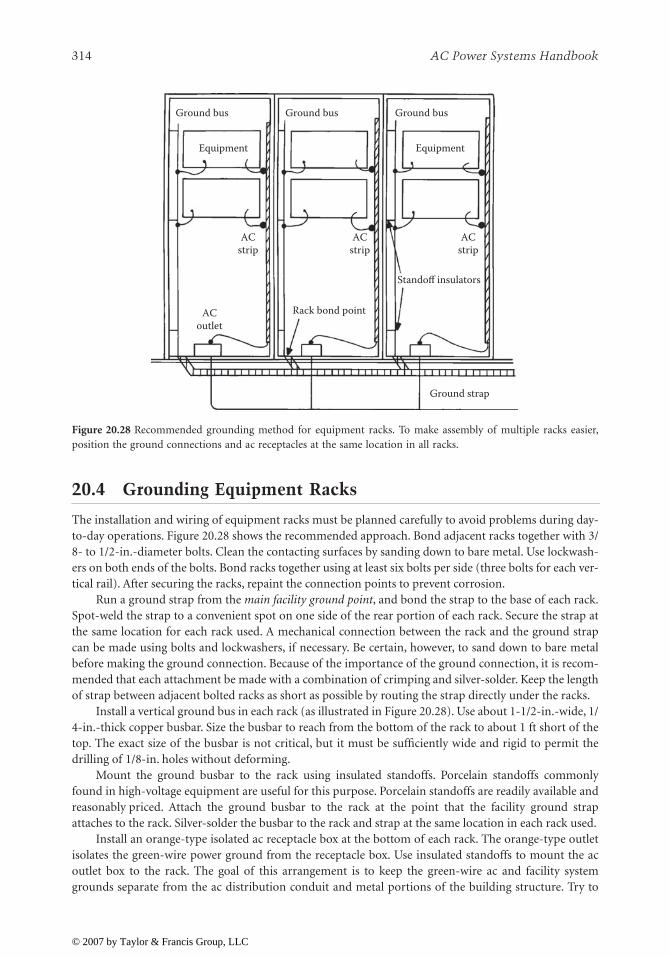
314 AC Power Systems Handbook
20.4 Grounding Equipment Racks
The installation and wiring of equipment racks must be planned carefully to avoid problems during day-to-day operations. Figure 20.28 shows the recommended approach. Bond adjacent racks together with 3/8- to 1/2-in.-diameter bolts. Clean the contacting surfaces by sanding down to bare metal. Use lockwash-ers on both ends of the bolts. Bond racks together using at least six bolts per side (three bolts for each ver-tical rail). After securing the racks, repaint the connection points to prevent corrosion.
Run a ground strap from the main facility ground point, and bond the strap to the base of each rack.Spot-weld the strap to a convenient spot on one side of the rear portion of each rack. Secure the strap atthe same location for each rack used. A mechanical connection between the rack and the ground strapcan be made using bolts and lockwashers, if necessary. Be certain, however, to sand down to bare metalbefore making the ground connection. Because of the importance of the ground connection, it is recom-mended that each attachment be made with a combination of crimping and silver-solder. Keep the lengthof strap between adjacent bolted racks as short as possible by routing the strap directly under the racks.
Install a vertical ground bus in each rack (as illustrated in Figure 20.28). Use about 1-1/2-in.-wide, 1/4-in.-thick copper busbar. Size the busbar to reach from the bottom of the rack to about 1 ft short of thetop. The exact size of the busbar is not critical, but it must be sufficiently wide and rigid to permit thedrilling of 1/8-in. holes without deforming.
Mount the ground busbar to the rack using insulated standoffs. Porcelain standoffs commonlyfound in high-voltage equipment are useful for this purpose. Porcelain standoffs are readily available andreasonably priced. Attach the ground busbar to the rack at the point that the facility ground strapattaches to the rack. Silver-solder the busbar to the rack and strap at the same location in each rack used.
Install an orange-type isolated ac receptacle box at the bottom of each rack. The orange-type outletisolates the green-wire power ground from the receptacle box. Use insulated standoffs to mount the acoutlet box to the rack. The goal of this arrangement is to keep the green-wire ac and facility systemgrounds separate from the ac distribution conduit and metal portions of the building structure. Try to
Figure 20.28 Recommended grounding method for equipment racks. To make assembly of multiple racks easier,position the ground connections and ac receptacles at the same location in all racks.
Ground bus Ground bus Ground bus
Equipment Equipment
ACstrip
ACoutlet
ACstrip
ACstrip
Rack bond point
Standoff insulators
Ground strap
© 2007 by Taylor & Francis Group, LLC

Facility Ground-System Design 315
route the power conduit and facility ground cable or strap via the same physical path. Keep metallic con-duit and building structures insulated from the facility ground line, except at the bulkhead panel (maingrounding point). Carefully check the local electrical code before proceeding.
Although the foregoing procedure is optimum from a signal-grounding standpoint, it should bepointed out that under a ground-fault condition, performance of the system can be unpredictable if highcurrents are being drawn in the current-carrying conductors supplying the load. Vibration of ac circuitelements resulting from the magnetic field effects of high-current-carrying conductors is insignificant aslong as all conductors are within the confines of a given raceway or conduit. A ground fault will placereturn current outside of the normal path. If sufficiently high currents are being conducted, the conse-quences can be devastating. Sneak currents from ground faults have been known to destroy wiring sys-tems that were installed exactly to code. As always, consult an experienced electrical contractor.
Mount a vertical ac strip inside each rack to powerthe equipment. Insulate the power strip from the rackusing porcelain standoffs or use a strip with an insu-lated (plastic) housing. Such a device is shown in Fig-ure 20.29. Power equipment from the strip usingstandard three-prong grounding ac plugs. Do notdefeat the safety ground connection. Equipment man-ufacturers use this ground to drain transient energy.Furthermore, defeating the safety ground will violatelocal electrical codes.
Mount equipment in the rack using normal metalmounting screws. If the location is in a high-RF field,clean the rack rails and equipment-panel connectionpoints to ensure a good electrical bond. This is impor-tant because in a high-RF field, detection of RF energycan occur at the junctions between equipment chassisand the rack.
Connect a separate ground wire from each pieceof equipment in the rack to the vertical ground busbar.Use no. 12 or larger stranded copper wire (insulated).Connect the ground wire to the busbar by drilling ahole in the busbar at a convenient elevation near theequipment. Fit one end of the ground wire with anenclosed-hole solderless terminal connector (no. 10-sized hole or larger). Attach the ground wire to thebusbar using no. 10 (or larger) hardware. Use an inter-nal-tooth lockwasher between the busbar and the nut. Fit the other end of the ground wire with a termi-nal that will be accepted by the ground terminal at the equipment. If the equipment has an isolated signalground terminal, tie it to the ground busbar, as well.
Whenever servicing equipment in the rack, make certain to disconnect the ac power cord beforeremoving the unit from the rack or disconnecting the rack ground wire. During any service work, makethe first step removal of the ac power plug; when reassembling the unit, make the last step reinsertion ofthe plug. Do not take chances.
Figure 20.30 shows each of the grounding elements discussed in this section integrated into one dia-gram. This approach fulfills the requirements of personnel safety and equipment performance.
Follow similar grounding rules for simple one-rack equipment installations. Figure 20.31 illustratesthe grounding method for a single open-frame equipment rack. The vertical ground bus is supported byinsulators, and individual jumpers are connected from the ground rail to each chassis.
Frame side strut
Plug-in strip
Snap onmounting clip
Entrance and fitting
Figure 20.29 Rack mounting detail for an insu-lated-shell ac power strip.
© 2007 by Taylor & Francis Group, LLC

316 AC Power Systems Handbook
20.5 Grounding Signal Cables
Proper ground-system installation is the key to minimizing noisecurrents on signal-carrying cables. Audio, video, and data linesare often subject to ac power noise currents and RFI. The longerthe cable run, the more susceptible it is to disturbances. Unlesscare is taken in the layout and installation of such cables, unac-ceptable performance of the overall system can result.
20.5.1 Analyzing Noise Currents
Figure 20.32 shows a basic source and load connection. Nogrounds are present, and both the source and the load float. Thisis the optimum condition for equipment interconnection. Eitherthe source or the load can be tied to ground with no problems,provided only one ground connection exists. Unbalanced sys-tems are created when each piece of equipment has one of itsconnections tied to ground, as shown in Figure 20.33. This con-dition occurs if the source and load equipment have unbalanced(single-ended) inputs and outputs. This type of equipment uti-lizes chassis ground (or common) for one of the conductors.Problems are compounded when the equipment is separated by asignificant distance.
As shown in Figure 20.34, a difference in ground potentialcauses current flow in the ground wire. This current develops avoltage across the wire resistance. The ground-noise voltage addsdirectly to the signal itself. Because the ground current is usually
Figure 20.30 Equivalent ground circuit diagram for a medium-sized commercial/industrial facility.
Utilitytransformer Service panel Bulkhead
panel
Masterdistribution panel
To ACoutlets
Customerground rodUtility ground
System star ground pointGround bus
Computersystem
Controlroom
Equipmentroom 1
Equipmentracks
Equipmentroom 2
Tobulkhead
panel
Figure 20.31 Ground bus for an open-frame equipment rack.
© 2007 by Taylor & Francis Group, LLC

Facility Ground-System Design 317
the result of leakage in power transformers and line filters, the 60 Hz signal gives rise to hum of one formor another. Reducing the wire resistance through a heavier ground conductor helps the situation, butcannot eliminate the problem.
By amplifying both the high side and the ground side of the source and subtracting the two to obtaina difference signal, it is possible to cancel the ground-loop noise. This is the basis of the differential inputcircuit, illustrated in Figure 20.35. Unfortunately, problems still can exist with the unbalanced-source-to-balanced-load system. The reason centers on the impedance of the unbalanced source. One side of theline will have a slightly lower amplitude because of impedance differences in the output lines. By creatingan output signal that is out of phase with the original, a balanced source can be created to eliminate thiserror. (See Figure 20.35.) As an added benefit, for a given maximum output voltage from the source, thesignal voltage is doubled over the unbalanced case.
20.5.2 Types of Noise
Two basic types of noise can appear on ac power, audio, video, and computer data lines within a facility:normal mode and common mode. Each type has a particular effect on sensitive load equipment. The nor-mal-mode voltage is the potential difference that exists between pairs of power (or signal) conductors.This voltage also is referred to as the transverse-mode voltage. The common-mode voltage is a potentialdifference (usually noise) that appears between the power or signal conductors and the local ground ref-erence. The differences between normal-mode and common-mode noise are illustrated in Figure20.36.
Figure 20.32 A basic source and load connection. Nogrounds are indicated, and both the source and the loadfloat.
Figure 20.33 An unbalanced system in which each pieceof equipment has one of its connections tied to ground.
Figure 20.34 Ground-loop noise can be canceled byamplifying both the high side and the ground side of thesource and subtracting the two signals.
Figure 20.35 A balanced source configuration where theinherent amplitude error of the system shown in Figure20.34 is eliminated.
Source LoadRS/2
RS/2
VS RL VL
Ideal source and load
+
−
RS
RWire
VGroundIGround
VS RL VL
+
+
−
−21
VL = VS + VGround
RS
RL2 RL1
VS
RWire
VGround+
++
−
− −
V1 = VS + VGroundV2 = VGroundV1 − V2 = VS
1 2
V2 V1RL1
RL2
VS
VS
RWire
VGround
+
+
−
+
+
+
−
−
− −
V1 − V2 = 2VS
RS/2
1 2V2
V1
© 2007 by Taylor & Francis Group, LLC

318 AC Power Systems Handbook
The common-mode noise voltage will change, depending upon what is used as the ground referencepoint. It is often possible to select a ground reference that has a minimum common-mode voltage withrespect to the circuit of interest, particularly if the reference point and the load equipment are connectedby a short conductor. Common-mode noise can be caused by electrostatic or electromagnetic induction.
In practice, a single common-mode or normal-mode noise voltage is rarely found. More often thannot, load equipment will see both common-mode and normal-mode noise signals. In fact, unless thefacility wiring system is unusually well-balanced, the noise signal of one mode will convert some of itsenergy to the other mode.
Common-mode and normal-mode noise disturbances typically are caused by momentary impulsevoltage differences among parts of a distribution system that have differing ground potential references.If the sections of a system are interconnected by a signal path in which one or more of the conductorsare grounded at each end, the ground offset voltage can create a current in the grounded signal conductor.If noise voltages of sufficient potential occur on signal-carrying lines, normal equipment operation canbe disrupted. (See Figure 20.37.)
20.5.3 Noise Control
Noise control is an important aspect of computer and electronic system design and maintenance[2]. The process of noise control through proper grounding techniques is more correctly called referencing.For this discussion, electronic systems can be viewed as a multiplicity of signal sources transmittingsignals to a multiplicity of loads. Practically speaking, the impedance of the signal return path is never
Figure 20.36 The principles of normal-mode and common-mode noise voltages as they apply to ac power circuits.
Figure 20.37 An illustration of how noise currents can circulate within a system because of the interconnection ofvarious pieces of hardware.
Normalmode
voltage
Commonmode voltage
ACIn
−
ACIn
GroundLoad
Ground
Ground Noisecurrent
Signaloutput
Signalinput
Noisecurrent
AC In
AC In
Load 2
Load 1
Circulatingnoise currents
on signalcarrying linesAC power
distributionpanel
ACAC
GND
© 2007 by Taylor & Francis Group, LLC

Facility Ground-System Design 319
zero, and dedicated return paths for each source-load pair are not always practical. Packaged electronicssystems typically incorporate a common signal reference plane that serves as a common return path fornumerous source-load pairs. (See Figure 20.38a.) The signal reference plane may be a large dedicatedarea on a circuit board, the metal chassis or enclosure of the electronic equipment, or the metal frameor mounting rack that houses several different units. Ideally, the signal reference plane offers zeroimpedance to the signal current. Practically, however, the signal reference plane has a finite impedance.The practical result is illustrated in Figure 20.38b and is called common-impedance or conductive coupling.
Because a practical signal reference plane has a finite impedance, current flow in the plane willproduce potential differences between various points on the plane. Source-load pairs referenced to theplane will, therefore, experience interference as a result. ZR is common to both circuits referenced to theplane in Figure 20.38b. Thus, I1 and I2 returning to their respective sources will produce interferencevoltages by flowing through ZR. The total interference voltage drop seen across ZR causes the sourcereference A to be at a different potential than the load reference B. This difference in potential is oftencalled ground voltage shift (even though ground may not even be involved) and is a major source of noiseand interference in electronic circuits.
Ground voltage shifts can also be caused by electromagnetic or electrostatic fields in close proximityto the source-load pairs. The interference source induces interference voltages into any closed loop byantenna action. This loop is called a ground loop (even though ground may not be involved). Interferencevoltages can be minimized by reducing the loop area as much as possible. This can be very difficult ifthe loop includes an entire room. The interference voltage can be eliminated entirely by breaking the loop.
Within individual electronic equipments, the signal reference plane consists of a metal plate or themetal enclosure or a rack assembly, as previously discussed. Between units of equipment that are locatedin different rooms, on different floors, or even in different buildings, the signal reference planes of eachunit must be connected together via interconnected wiring such as coax shields or separate conductors.This action, of course, increases the impedance between signal reference planes and makes noise controlmore difficult. Reducing noise caused by common-impedance coupling is a matter of reducing theimpedance of the interconnected signal reference planes.
Figure 20.38 The equipotential plane: (a) individual signal sources, (b) net effect on the signal reference plane. (From[2]. Used with permission.)
ZR
ES1ES2 ZL2ZL1
I2
I1
I1 + I2
Signal reference plane(b)
(a)
Circuit 4
Circuit 3
Circuit 2
Signa
l refe
renc
e plan
e
Circuit 1
A B
© 2007 by Taylor & Francis Group, LLC

320 AC Power Systems Handbook
Regardless of the configuration encountered (i.e., circuit board, individual electronic equipment, orequipment remotely located within a facility or in separate buildings), the next question to be answeredis, Should the signal reference be connected to ground? Floating signal grounding, single-point grounding,and multipoint grounding are methods of accomplishing this signal-reference-to-ground connection.
IEEE Standard 1100 recommends multipoint grounding for most computers. For effective multi-point grounding, conductors between separate points desired to be at the same reference potential shouldbe less than 0.1 wavelength (λ/10) of the interference or noise-producing signal. Longer conductor lengthswill exhibit significant impedance because of the antenna effect and become ineffective as equalizingconductors between signal references. On printed circuit cards or within individual electronics equip-ments, short conductor lengths are usually easy to achieve. For remotely located equipments, however,short equalizing conductor lengths may be impossible. Equipment in relatively close proximity can beequalized by cutting bonding conductors to an odd multiple of λ/2 at the noise frequency. The distributionof standing waves on bonding conductors is illustrated in Figure 20.39. The impedance, Z, is minimumfor odd multiples of λ/2 but maximum for odd multiples of λ/4.
For remotely located electronics equipment within the same room, equalizing potential betweenrespective signal reference systems may have to be accomplished with an equipotential plane. An idealequipotential signal reference plane is one that has zero volts (thus zero impedance) between any twopoints on the plane. Because an ideal equipotential plane is not attainable, a nominal equipotential planeis accepted. Multipoint grounding connections are made to the plane, which insures minimum groundvoltage shift between signal reference systems connected to the plane. Collectively, the current flow in anequipotential plane can be quite large. Between any two equipments however, the current flow should below because of the many current paths available.
Practical versions of an equipotential plane include the following:
• Bolted stringer system of a raised computer-room floor• Flat copper strips bonded together at 2-ft centers• Copper conductors bonded together at 2-ft centers• Single or multiple, flat copper strips connected between equipment
20.6 Patch-Bay Grounding
Patch panels for audio, video, and data circuits require careful attention to planning to avoid built-ingrounding problems. Because patch panels are designed to tie together separate pieces of equipment,often from remote areas of a facility, the opportunity exists for ground loops. The first rule of patch-baydesign is to never use a patch bay to switch low-level (microphone) signals. If mic sources must bepatched from one location to another, install a bank of mic-to-line amplifiers to raise the signal levels to 0
Figure 20.39 Standing waves on a bonding conductor resulting from the antenna effect. (From [2]. Used withpermission.)
EEZ Z
I I
Equip 1 Equip 2
= 2ℓ λ
=ℓ λ4
Bonding conductor
© 2007 by Taylor & Francis Group, LLC
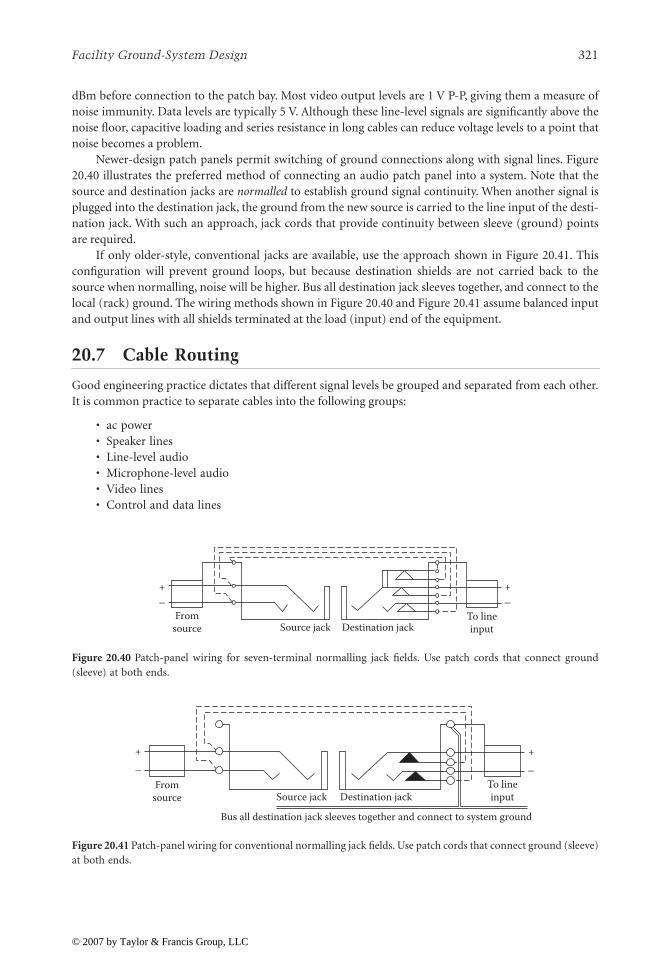
Facility Ground-System Design 321
dBm before connection to the patch bay. Most video output levels are 1 V P-P, giving them a measure ofnoise immunity. Data levels are typically 5 V. Although these line-level signals are significantly above thenoise floor, capacitive loading and series resistance in long cables can reduce voltage levels to a point thatnoise becomes a problem.
Newer-design patch panels permit switching of ground connections along with signal lines. Figure20.40 illustrates the preferred method of connecting an audio patch panel into a system. Note that thesource and destination jacks are normalled to establish ground signal continuity. When another signal isplugged into the destination jack, the ground from the new source is carried to the line input of the desti-nation jack. With such an approach, jack cords that provide continuity between sleeve (ground) pointsare required.
If only older-style, conventional jacks are available, use the approach shown in Figure 20.41. Thisconfiguration will prevent ground loops, but because destination shields are not carried back to thesource when normalling, noise will be higher. Bus all destination jack sleeves together, and connect to thelocal (rack) ground. The wiring methods shown in Figure 20.40 and Figure 20.41 assume balanced inputand output lines with all shields terminated at the load (input) end of the equipment.
20.7 Cable Routing
Good engineering practice dictates that different signal levels be grouped and separated from each other.It is common practice to separate cables into the following groups:
• ac power• Speaker lines• Line-level audio• Microphone-level audio• Video lines• Control and data lines
Figure 20.40 Patch-panel wiring for seven-terminal normalling jack fields. Use patch cords that connect ground(sleeve) at both ends.
Figure 20.41 Patch-panel wiring for conventional normalling jack fields. Use patch cords that connect ground (sleeve)at both ends.
+
Fromsource
To lineinputSource jack Destination jack
−+−
+
Fromsource
To lineinputSource jack
Bus all destination jack sleeves together and connect to system ground
Destination jack
−
+
−
© 2007 by Taylor & Francis Group, LLC

322 AC Power Systems Handbook
Always use two-conductor shielded cable for all audio signal cables. This includes both balancedand unbalanced circuits, and microphone-level and line-level cables. On any audio cable connecting twopieces of equipment, tie the shield at one end only. Connect at the receiving end of signal transmission.On video coaxial cables running to outlet jacks mounted on plates, isolate the connector from the plate.The shield should connect to ground only at the equipment input/output or patch panel. For data cables,carefully follow the recommendations of the equipment manufacturer. The preferred interconnectionmethod for long data cables is fiber optics, which eliminates ground-loop problems altogether.
20.7.1 Overcoming Ground-System Problems
Although the concept of equipment grounding seems rather basic, it can become a major headache if notdone correctly. Even if all of the foregoing guidelines are followed to the letter, there is the possibility ofground loops and objectionable noise on audio, video, or data lines. The larger the physical size of thefacility, the greater the potential for problems. An otherwise perfect ground system can be degraded by asingle wiring error. An otherwise clean signal ground can be contaminated by a single piece of equipmentexperiencing a marginal ground fault condition.
If problems are experienced with a system, carefully examine all elements to track down the wiringerror or offending load. Do not add ac line filters or signal line filters to correct a problem system. In aproperly designed system, even one in a high-RF field, proper grounding and shielding techniques willpermit reliable operation. Adding filters merely hides the problem. Instead, correct the problem at itssource. In a highly complex system such as a data processing facility, the necessity to interconnect a largenumber of systems may require the use of fiber-optic transmitters and receivers.
20.8 References
1. Block, R., “The Grounds for Lightning and EMP Protection,” PolyPhaser Corporation, Gardner-ville, NV, 1987.
2. DeWitt, W. E., “Facility Grounding Practices,” in The Electronics Handbook, J. C. Whitaker (Ed.),CRC Press, Boca Raton, FL, pp. 2218–2228, 1996.
3. NFPA Standard 70, “The National Electrical Code,” National Fire Protection Association, Quincy,MA, 1993.
4. DeDad, J. A. (Ed.), “ITE Room Grounding and Transient Protection,” in Practical Guide to PowerDistribution for Information Technology Equipment, PRIMEDIA Intertec, Overland Park, KS, pp.83–84, 1997.
5. DeDad, J. A. (Ed.), “Basic Facility Requirements,” in Practical Guide to Power Distribution forInformation Technology Equipment, PRIMEDIA Intertec, Overland Park, KS, p. 24, 1997.
6. Federal Information Processing Standards Publication No. 94, Guideline on Electrical Power forADP Installations, U.S. Department of Commerce, National Bureau of Standards, Washington, DC,1983.
7. Gruzs, T. M., “High Availability, Fault-Tolerant AC Power Distribution Systems for Critical Loads,Proceedings, Power Quality Solutions/Alternative Energy, Intertec International, Ventura, CA, p. 22,September 1996.
20.9 Bibliography
Benson, K. B., and J. C. Whitaker, Television and Audio Handbook for Engineers and Technicians, McGraw-Hill, New York, 1989.
Block, R., “How to Ground Guy Anchors and Install Bulkhead Panels,” Mobile Radio Technology, PRI-MEDIA Intertec, Overland Park, KS, February 1986.
Davis, G., and R. Jones, Sound Reinforcement Handbook, Yamaha Music Corporation, Hal LeonardPublishing, Milwaukee, WI, 1987.
© 2007 by Taylor & Francis Group, LLC

Facility Ground-System Design 323
Fardo, S., and D. Patrick, Electrical Power Systems Technology, Prentice-Hall, Englewood Cliffs, NJ, 1985.Hill, M., “Computer Power Protection,” Broadcast Engineering, PRIMEDIA Intertec, Overland Park, KS,
April 1987.IEEE 142 (Green Book), “Grounding Practices for Electrical Systems,” IEEE, New York.Lanphere, J., “Establishing a Clean Ground,” Sound & Video Contractor, PRIMEDIA Intertec, Overland
Park, KS., August 1987.Lawrie, R., Electrical Systems for Computer Installations, McGraw-Hill, New York, 1988.Little, R., “Surge Tolerance: How Does Your Site Rate?” Mobile Radio Technology, Intertec Publishing,
Overland Park, KS, June 1988.Midkiff, J., “Choosing the Right Coaxial Cable Hanger,” Mobile Radio Technology, Intertec Publishing,
Overland Park, KS, April 1988.Mullinack, H. G., “Grounding for Safety and Performance,” Broadcast Engineering, PRIMEDIA Intertec,
Overland Park, KS, October 1986.Sullivan, T., “How to Ground Coaxial Cable Feedlines,” Mobile Radio Technology, PRIMEDIA Intertec,
Overland Park, KS, April 1988.Technical Reports LEA-9-1, LEA-0-10, and LEA-1-8, Lightning Elimination Associates, Santa Fe Springs,
CA.
© 2007 by Taylor & Francis Group, LLC

325
21
Standby Power Systems
21.1 Introduction
When utility company power problems are discussed, most people immediately think of blackouts. Thelights go out, and everything stops. With the facility down and in the dark, there is nothing to do but sit andwait until the utility company finds the problem and corrects it. This process generally takes only a few min-utes. There are times, however, when it can take hours. In some remote locations, it can even take days.
Blackouts are, without a doubt, the most troublesome utility company problem that a facility will haveto deal with. Statistics show that power failures are, generally speaking, a rare occurrence in most areas of thecountry. They are also short in duration. Studies have shown that 50% of blackouts last 6 s or less, and 35%are less than 11 min long. These failure rates usually are not cause for concern to commercial users, exceptwhere computer-based operations, transportation control systems, medical facilities, and communicationssites are concerned.
When continuity of operation is critical, redundancy must be carried throughout the system. The sitenever should depend upon one critical path for ac power. For example, if the facility is fed by a single step-down transformer, a lightning flash or other catastrophic event could result in a transformer failure thatwould bring down the entire site. A replacement could take days or even weeks.
21.1.1 Blackout Effects
A facility that is down for even 5 min can suffer a significant loss of productivity or data that may take hoursor days to rebuild. A blackout affecting a transportation or medical center could be life-threatening. Coupledwith this threat is the possibility of extended power-service loss due to severe storm conditions. Many broad-cast and communications relay sites are located in remote, rural areas or on mountaintops. Neither of thesekinds of locations are well-known for their power reliability. It is not uncommon in mountainous areas forutility company service to be out for extended periods after a major storm. Few operators are willing to takesuch risks with their business. Most choose to install standby power systems at appropriate points in theequipment chain.
The cost of standby power for a facility can be substantial, and an examination of the possible alterna-tives should be conducted before any decision on equipment is made. Management must clearly define thedirect and indirect costs and weigh them appropriately. Include the following items in the cost-vs.-risk anal-ysis:
• Standby power-system equipment purchase and installation cost• Exposure of the system to utility company power failure• Alternative operating methods available to the facility• Direct and indirect costs of lost uptime because of blackout conditions
A distinction must be made between
emergency
and
standby
power sources. Strictly speaking, emer-gency systems supply circuits legally designated as being essential for safety to life and property. Standbypower systems are used to protect a facility against the loss of productivity resulting from a utility companypower outage.
© 2007 by Taylor & Francis Group, LLC

326
AC Power Systems Handbook
21.2 Standby Power Options
To ensure the continuity of ac power, many commercial/industrial facilities depend upon either two sep-arate utility services or one utility service plus on-site generation. Because of the growing complexity ofelectrical systems, attention must be given to power-supply reliability.
The engine-generator shown in Figure 21.1 is the classic standby power system. An automatic trans-fer switch monitors the ac voltage coming from the utility company line for power failure conditions.Upon detection of an outage for a predetermined period of time (generally 1 to 10 s), the standby gener-ator is started; after the generator is up to speed, the load is transferred from the utility to the local gener-ator. Upon return of the utility feed, the load is switched back, and the generator is stopped. This basictype of system is used widely in industry and provides economical protection against prolonged poweroutages (5 min or more).
The transfer device shown in Figure 21.1 is a contactor-type, break-before-make unit. By replacingthe simple transfer device shown with an automatic overlap (static) transfer switch, as shown in Figure21.2, additional functionality can be gained. The overlap transfer switch permits the on-site generator tobe synchronized with the load, making a clean switch from one energy source to another. This function-ality offers the following benefits:
• Switching back to the utility feed from the generator can be accomplished without interruptionin service.
• The load can be cleanly switched from the utility to the generator in anticipation of utility lineproblems (such as an approaching severe storm).
• The load can be switched to and from the generator to accomplish
load shedding
objectives(discussed later in this chapter).
21.2.1 Dual-Feeder System
In some areas, usually metropolitan centers, two utility company power drops can be brought into a facil-ity as a means of providing a source of standby power. As shown in Figure 21.3, two separate utility ser-vice drops — from separate power-distribution systems — are brought into the plant, and an automatictransfer switch changes the load to the backup line in the event of a main-line failure. The dual-feedersystem provides an advantage over the auxiliary diesel arrangement in that power transfer from main to
Figure 21.1
The classic standby power system using an engine-generator set. This system protects a facility fromprolonged utility company power failures.
Power distributionsystem
Utility servicedrop transformer
Main servicebreaker
Circuitbreaker
Sensorinput
Sensorinput
ControlPower to
protected load
Automatictransferswitch
Systemcontrol
Dieselgenerator
© 2007 by Taylor & Francis Group, LLC

Standby Power Systems
327
standby can be made in a fraction of a second if a static transfer switch is used. Time delays are involvedin the diesel generator system that limit its usefulness to power failures lasting more than several minutes.
The dual-feeder system of protection is based on the assumption that each of the service dropsbrought into the facility is routed via different paths. This being the case, the likelihood of a failure onboth power lines simultaneously is remote. The dual-feeder system will not, however, protect againstareawide power failures, which can occur from time to time.
The dual-feeder system is limited primarily to urban areas. Rural or mountainous regions generallyare not equipped for dual redundant utility company operation. Even in urban areas, the cost of bringinga second power line into a facility can be high, particularly if special lines must be installed for the feed. Iftwo separate utility services are available at or near the site, redundant feeds generally will be less expen-sive than engine-driven generators of equivalent capacity.
Figure 21.4 illustrates a dual-feeder system that utilizes both utility inputs simultaneously at thefacility. Notice that during normal operation, both ac lines feed loads, and the “tie” circuit breaker is
Figure 21.2
The use of a static transfer switch to transfer the load from the utility company to the on-site generator.
Figure 21.3
The dual-utility-feeder system of ac power loss protection. An automatic transfer switch changes theload from the main utility line to the standby line in the event of a power interruption.
Critical powergeneration system
AOTS
Utility
Diesel/turbinegenerator
AOTS-automatic overlap transfer switch
Primarypower distribution
system
Utility servicedrop transformer
Circuitbreaker
Secondarypower distribution
system
Utility servicedrop transformer
Circuitbreaker
Sensorinput
Sensorinput
ControlSystemcontrol Power to
protected load
Dual supplyfast transfer
switcher
© 2007 by Taylor & Francis Group, LLC

328
AC Power Systems Handbook
open. In the event of a loss of either line, the circuit-breaker switches reconfigure the load to place theentire facility on the single remaining ac feed. Switching is performed automatically; manual control isprovided in the event of a planned shutdown on one of the lines.
21.2.2 Peak Power Shaving
Figure 21.5 illustrates the use of a backup diesel generator for both standby power and
peak power shaving
applications. Commercial power customers often can realize substantial savings on utility company billsby reducing their energy demand during certain hours of the day. An automatic overlap transfer switch isused to change the load from the utility company system to the local diesel generator. The changeover isaccomplished by a static transfer switch that does not disturb the operation of load equipment. Thisapplication of a standby generator can provide financial return to the facility, whether or not the unit isever needed to carry the load through a commercial power failure.
Figure 21.4
A dual-utility-feeder system with interlocked circuit breakers.
Figure 21.5
The use of a diesel generator for standby power and peak power shaving applications. The automaticoverlap (static) transfer switch changes the load from the utility feed to the generator instantly so that no disruptionof normal operation is encountered.
Load center
Tie CB
CBCBInterlocks
Utilitysource 2
Utilitysource 1
Load center
Power distributionsystem
Utility servicedrop transformer
Circuitbreaker
Circuitbreaker
Dieselgenerator
Synchronizercontrol
Systemcontrol
Cont
rol
Sensorinput
Sensorinput
Automaticoverlaptransferswitch
Power toprotected load
© 2007 by Taylor & Francis Group, LLC

Standby Power Systems
329
21.2.3 Advanced System Protection
A more sophisticated power-control system is shown in Figure 21.6, where a dual feeder supply is cou-pled with a motor-generator set to provide clean, undisturbed ac power to the load. The m-g set willsmooth over the transition from the main utility feed to the standby, often making a commercial powerfailure unnoticed by on-site personnel. A conventional m-g set typically will give up to 0.5 s of power failride-through, more than enough to accomplish a transfer from one utility feed to the other. This standbypower system is further refined in the application illustrated in Figure 21.7, where a diesel generator hasbeen added to the system. With the automatic overlap transfer switch shown at the generator output, thisarrangement also can be used for peak demand power shaving.
Figure 21.8 shows a simplified schematic diagram of a 220 kW UPS system utilizing dual utilitycompany feed lines, a 750 kVA gas-engine generator, and five dc-driven motor-generator sets with a 20-min battery supply at full load. The five m-g sets operate in parallel. Each is rated for 100 kW output.Only three are needed to power the load, but four are on-line at any given time. The fifth machine pro-vides redundancy in the event of a failure or for scheduled maintenance work. The batteries are alwayson-line under a slight charge across the 270 V dc bus. Two separate natural-gas lines, buried along differ-ent land routes, supply the gas engine. Local gas storage capacity also is provided.
21.2.4 Choosing a Generator
Engine-generator sets are available for power levels ranging from less than 1 kVA to several thousand kVAor more. Machines also can be paralleled to provide greater capacity. Engine-generator sets typically areclassified by the type of power plant used:
• Diesel. Advantages: rugged and dependable, low fuel costs, low fire or explosion hazard. Disad-vantages: somewhat more costly than other engines, heavier in smaller sizes.
• Natural and liquefied petroleum gas. Advantages: quick starting after long shutdown periods, longlife, low maintenance. Disadvantage: availability of natural gas during areawide power failuresubject to question.
Figure 21.6
A dual feeder standby power system using a motor-generator set to provide power fail ride-through andtransient-disturbance protection. Switching circuits allow the m-g set to be bypassed, if necessary.
Primarypower distribution
system
Utility servicedrop transformer
Secondarypower distribution
system
Utility servicedrop transformer
Circuitbreaker
Circuitbreaker
ACinput
ACoutput
Motor generator unit
Dualsupply
transferswitch
Bypass
NormalPower toprotected
load
MGU bypassswitch
System controlunit
Controloutputs
Sensorinputs
M G
© 2007 by Taylor & Francis Group, LLC

330
AC Power Systems Handbook
Figure 21.7
A premium power-supply backup and conditioning system using dual utility company feeds, a dieselgenerator, and a motor-generator set. An arrangement such as this would be used for critical loads that require asteady supply of clean ac.
Figure 21.8
Simplified installation diagram of a high-reliability power system incorporating dual utility feeds, astandby gas-engine generator, and five battery-backed dc m-g sets. (
After
[1].)
Utility servicedrop transformer
Secondarypowersource
Dieselgenerator
Primarypowersource
Utility servicedrop transformer
Circuitbreaker
Circuitbreaker Automatic
overlaptransferswitch
AC outAC in
Motor generator unit
Dualsupply fast
transferswitcher
Bypass
NormalPower toprotected
load
MGU bypassswitch
System controlunit
Controloutputs
Sensorinputs
Circuitbreaker
M G
Emergency source
Main breaker Circuit breaker
Gas-engine generatorthree phase
750 kVA, 480 V
Circuit breaker
480− 120.208 V
480 V, three phase
480 V, three phase busCircuit breakers
Static converters
Auto transfer switches 270 V dc
Breakers
Starters
M-G sets 125 kVA
20 min at 250 kW
Battery
Bypass switches
Uninterruptible power bus
Regulated 120/208 V three phase
750 kVA
V
V A
A Meters Starter Radiator
fan
Meters
To HVAC loads Key interlocks
Normal source
© 2007 by Taylor & Francis Group, LLC
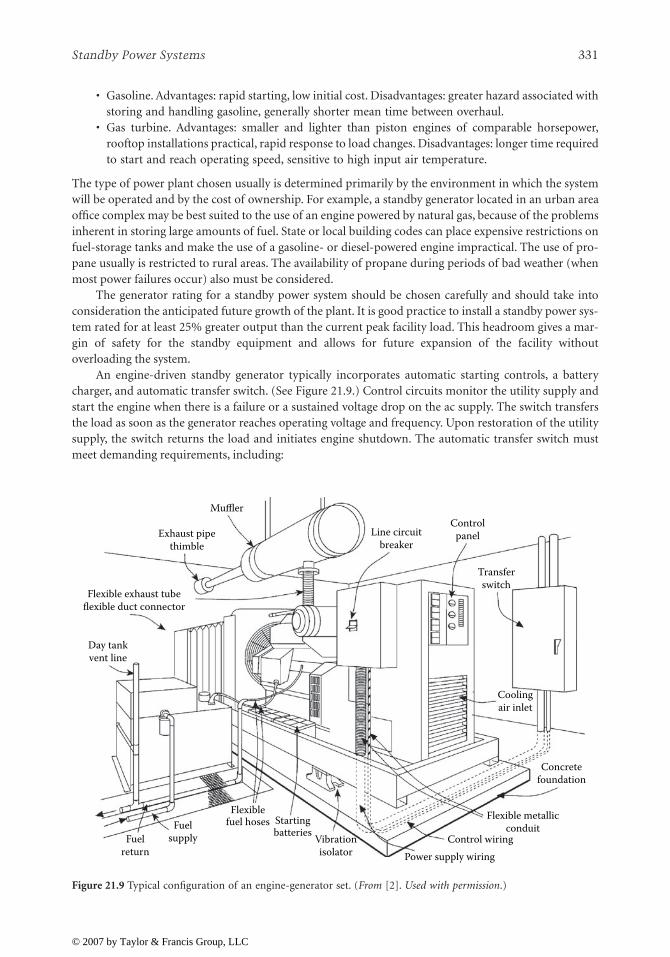
Standby Power Systems
331
• Gasoline. Advantages: rapid starting, low initial cost. Disadvantages: greater hazard associated withstoring and handling gasoline, generally shorter mean time between overhaul.
• Gas turbine. Advantages: smaller and lighter than piston engines of comparable horsepower,rooftop installations practical, rapid response to load changes. Disadvantages: longer time requiredto start and reach operating speed, sensitive to high input air temperature.
The type of power plant chosen usually is determined primarily by the environment in which the systemwill be operated and by the cost of ownership. For example, a standby generator located in an urban areaoffice complex may be best suited to the use of an engine powered by natural gas, because of the problemsinherent in storing large amounts of fuel. State or local building codes can place expensive restrictions onfuel-storage tanks and make the use of a gasoline- or diesel-powered engine impractical. The use of pro-pane usually is restricted to rural areas. The availability of propane during periods of bad weather (whenmost power failures occur) also must be considered.
The generator rating for a standby power system should be chosen carefully and should take intoconsideration the anticipated future growth of the plant. It is good practice to install a standby power sys-tem rated for at least 25% greater output than the current peak facility load. This headroom gives a mar-gin of safety for the standby equipment and allows for future expansion of the facility withoutoverloading the system.
An engine-driven standby generator typically incorporates automatic starting controls, a batterycharger, and automatic transfer switch. (See Figure 21.9.) Control circuits monitor the utility supply andstart the engine when there is a failure or a sustained voltage drop on the ac supply. The switch transfersthe load as soon as the generator reaches operating voltage and frequency. Upon restoration of the utilitysupply, the switch returns the load and initiates engine shutdown. The automatic transfer switch mustmeet demanding requirements, including:
Figure 21.9
Typical configuration of an engine-generator set. (
From
[2].
Used with permission
.)
Exhaust pipethimble
Flexible exhaust tubeflexible duct connector
Day tankvent line
Muffler
Fuelreturn
Fuelsupply
Flexiblefuel hoses Starting
batteries Vibrationisolator Power supply wiring
Control wiring
Flexible metallicconduit
Concretefoundation
Coolingair inlet
Transferswitch
ControlpanelLine circuit
breaker
© 2007 by Taylor & Francis Group, LLC

332
AC Power Systems Handbook
• Carrying the full rated current continuously• Withstanding fault currents without contact separation• Handling high inrush currents• Withstanding many interruptions at full load without damage
The nature of most power outages requires a sophisticated monitoring system for the engine-gener-ator set. Most power failures occur during periods of bad weather. Most standby generators are unat-tended. More often than not, the standby system will start, run, and shut down without any humanintervention or supervision. For reliable operation, the monitoring system must check the status of themachine continually to ensure that all parameters are within normal limits. Time-delay periods usuallyare provided by the controller that require an outage to last from 5 to 10 s before the generator is startedand the load is transferred. This prevents false starts that needlessly exercise the system. A time delay of 5to 30 min usually is allowed between the restoration of utility power and return of the load. This delaypermits the utility ac lines to stabilize before the load is reapplied.
The transfer of motor loads may require special consideration, depending upon the size and type ofmotors used at a plant. If the residual voltage of the motor is out of phase with the power source to whichthe motor is being transferred, serious damage can result to the motor. Excessive current draw also maytrip overcurrent protective devices. Motors above 50 hp with relatively high load inertia in relation totorque requirements, such as flywheels and fans, may require special controls. Restart time delays are acommon solution.
Automatic starting and synchronizing controls are used for multiple-engine-generator installations.The output of two or three smaller units can be combined to feed the load. This capability offers addi-tional protection for the facility in the event of a failure in any one machine. As the load at the facilityincreases, additional engine-generator systems can be installed on the standby power bus.
21.2.4.1 Generator Types
Generators for standby power applications can be induction or synchronous machines. Most engine-gen-erator systems in use today are of the synchronous type because of the versatility, reliability, and capabil-ity of operating independently that this approach provides [2]. Most modern synchronous generators areof the
revolving field alternator
design. Essentially, this means that the armature windings are held station-ary and the field is rotated. Therefore, generated power can be taken directly from the stationary arma-ture windings. Revolving armature alternators are less popular because the generated output power mustbe derived via slip rings and brushes.
The exact value of the ac voltage produced by a synchronous machine is controlled by varying thecurrent in the dc field windings, whereas frequency is controlled by the speed of rotation. Power output iscontrolled by the torque applied to the generator shaft by the driving engine. In this manner, the synchro-nous generator offers precise control over the power it can produce.
Practically all modern synchronous generators use a brushless exciter. The exciter is a small ac gener-ator on the main shaft; the ac voltage produced is rectified by a three-phase rotating rectifier assemblyalso on the shaft. The dc voltage thus obtained is applied to the main generator field, which is also on themain shaft. A voltage regulator is provided to control the exciter field current, and in this manner, thefield voltage can be precisely controlled, resulting in a stable output voltage.
The frequency of the ac current produced is dependent on two factors: the number of poles builtinto the machine, and the speed of rotation (rpm). Because the output frequency must normally bemaintained within strict limits (60 or 50 Hz), control of the generator speed is essential. This is accom-plished by providing precise rpm control of the
prime mover
, which is performed by a governor. There are many types of governors; however, for auxiliary power applications, the
isochronous gover-nor
is normally selected. The isochronous governor controls the speed of the engine so that it remainsconstant from no-load to full load, assuring a constant ac power output frequency from the generator. Amodern system consists of two primary components: an electronic speed control and an actuator thatadjusts the speed of the engine. The electronic speed control senses the speed of the machine and
© 2007 by Taylor & Francis Group, LLC

Standby Power Systems
333
provides a feedback signal to the mechanical/hydraulic actuator, which in turn positions the enginethrottle or fuel control to maintain accurate engine rpm.
The National Electrical Code provides guidance for safe and proper installation of on-site engine-generator systems. Local codes may vary and must be reviewed during early design stages.
21.2.5 UPS Systems
An uninterruptible power system is an elegant solution to power outage concerns. The output of the UPSinverter can be a sine wave or pseudosine wave. When shopping for a UPS system, consider the following:
• Power reserve capacity for future growth of the facility.• Inverter current surge capability (if the system will be driving inductive loads, such as motors).• Output voltage and frequency stability over time and with varying loads.• Required battery supply voltage and current. Battery costs vary greatly, depending upon the type
of units needed.• Type of UPS system (forward-transfer type or reverse-transfer type) required by the particular
application. Some sensitive loads may not tolerate even brief interruptions of the ac power source.• Inverter efficiency at typical load levels. Some inverters have good efficiency ratings when loaded
at 90% of capacity, but poor efficiency when lightly loaded.• Size and environmental requirements of the UPS system. High-power UPS equipment requires a
large amount of space for the inverter/control equipment and batteries. Battery banks often requirespecial ventilation and ambient temperature control.
21.2.6 Standby Power-System Noise
Noise produced by backup power systems can be a serious problem if not addressed properly. Standbygenerators, motor-generator sets, and UPS systems produce noise that can disturb building occupantsand irritate neighbors or landlords.
The noise associated with electrical generation usually is related to the drive mechanism, most com-monly an internal combustion engine. The amplitude of the noise produced is directly related to the sizeof the engine-generator set. First, consider whether noise reduction is a necessity. Many building ownershave elected to tolerate the noise produced by a standby power generator because its use is limited toemergency situations. During a crisis, when the normal source of power is unavailable, most people willtolerate noise associated with a standby generator.
If the decision is made that building occupants can live with the noise of the generator, care must betaken in scheduling the required testing and exercising of the unit. Whether testing occurs monthly orweekly, it should be done on a regular schedule.
If it has been determined that the noise should be controlled, or at least minimized, the easiest wayto achieve this objective is to physically separate the machine from occupied areas. This may be easier saidthan done. Because engine noise is predominantly low-frequency in character, walls and floor/ceilingconstruction used to contain the noise must be massive. Lightweight construction, even though it mayinvolve several layers of resiliently mounted drywall, is ineffective in reducing low-frequency noise.Exhaust noise is a major component of engine noise but, fortunately, it is easier to control. When select-ing an engine-generator set, select the highest-quality exhaust muffler available. Such units often areidentified as
hospital-grade
mufflers.Engine-generator sets also produce significant vibration. The machine should be mounted securely
to a slab-on-grade or an isolated basement floor, or it should be installed on vibration isolation mounts.Such mounts usually are specified by the manufacturer.
Because a UPS system or motor-generator set is a source of continuous power, it must run continu-ously. Noise must be adequately controlled. Physical separation is the easiest and most effective methodof shielding occupied areas from noise. Enclosure of UPS equipment usually is required, but noise con-trol is significantly easier than for an engine-generator because of the lower noise levels involved.
© 2007 by Taylor & Francis Group, LLC

334
AC Power Systems Handbook
Nevertheless, the low-frequency 120 Hz fundamental of a UPS system is difficult to contain adequately;massive constructions may be necessary. Vibration control also is required for most UPS and m-g gear.
21.2.7 Batteries
Batteries are the lifeblood of most UPS systems. Important characteristics include the following:
• Charge capacity — how long the battery will operate the UPS• Weight• Charging characteristics• Durability/ruggedness
Additional features that add to the utility of the battery include:
• Built-in status/temperature/charge indicator or data output port• Built-in overtemperature/overcurrent protection with auto-reset capabilities• Environmental friendliness
The last point deserves some attention. Many battery types must be recycled or disposed of throughsome prescribed means. Proper disposal of a battery at the end of its useful life is, thus, an importantconsideration. Be sure to check the original packaging for disposal instructions. Failure to follow theproper procedures could have serious consequences.
Research has brought about a number of different battery chemistries, each offering distinct advan-tages. Today’s most common and promising rechargeable chemistries include the following:
•
Nickel cadmium
(NiCd) — used for portable radios, cellular phones, video cameras, laptop com-puters, and power tools. NiCds have good load characteristics, are economically priced, and aresimple to use.
•
Lithium ion
(Li-Ion) — typically used for video cameras and laptop computers. This battery hasreplaced some NiCds for high energy-density applications.
•
Sealed lead-acid
(SLA) — used for uninterruptible power systems, video cameras, and otherdemanding applications where the energy-to-weight ratio is not critical and low battery cost isdesirable.
•
Lithium polymer
(Li-Polymer) — when commercially available, this battery will have the highestenergy density and lowest self-discharge of common battery types, but its load characteristics willlikely only suit low-current applications.
•
Reusable alkaline —
used for light-duty applications. Because of its low self-discharge, this batteryis suitable for portable entertainment devices and other noncritical appliances that are usedoccasionally.
No single battery offers all the answers; rather, each chemistry is based on a number of compromises. A battery, of course, is only as good as its charger. Common attributes for the current generation of
charging systems include quick-charge capability and automatic battery condition analysis and subse-quent
intelligent
charging.
21.2.7.1 Terms
The following terms are commonly used to specify and characterize batteries:
•
Energy density
.
The storage capacity of a battery measured in
watt-hours per kilogram
(Wh/kg).•
Cycle life
.
The typical number of charge-discharge cycles for a given battery before the capacitydecreases from the nominal 100% to approximately 80%, depending upon the application.
•
Fast-charge time
.
The time required to fully charge an empty battery.•
Self-discharge
.
The discharge rate when the battery is not in use.•
Cell voltage
.
The output voltage of the basic battery element. The cell voltage multiplied by thenumber of cells provides the battery terminal voltage.
© 2007 by Taylor & Francis Group, LLC

Standby Power Systems
335
•
Load current
.
The maximum recommended current the battery can provide.•
Current rate
.
The
C
-rate is a unit by which charge and discharge times are scaled. If dischargedat 1
C
, a 100 Ah battery provides a current of 100 A; if discharged at 0.5
C
, the available current is50 A.
•
Exercise requirement
.
This parameter indicates the frequency that the battery needs to be exercisedto achieve maximum service life.
21.2.7.2 Sealed Lead-Acid Battery
The lead-acid battery is a commonly used chemistry. The
flooded
version is found in automobiles andlarge UPS battery banks. Most smaller, portable systems use the
sealed
version, also referred to as
gelcell
orSLA.
The lead-acid chemistry is commonly used when high power is required, weight is not critical, andcost must be kept low [3]. The typical current range of a medium-sized SLA device is 2 Ah to 50 Ah.Because of its minimal maintenance requirements and predictable storage characteristics, the SLA hasfound wide acceptance in the UPS industry, especially for
point-of-application
systems.The SLA is not subject to memory. No harm is done by leaving the battery on float charge for a pro-
longed time. On the negative side, the SLA does not lend itself well to fast charging. Typical charge timesare 8 to 16 hours. The SLA must always be stored in a charged state because a discharged SLA will sul-phate. If left discharged, a recharge may be difficult or even impossible.
Unlike the common NiCd, the SLA prefers a shallow discharge. A full discharge reduces the numberof times the battery can be recharged, similar to a mechanical device that wears down when placed understress. In fact, each discharge-charge cycle reduces (slightly) the storage capacity of the battery. This wear-down characteristic also applies to other chemistries, including the NiMH.
The charge algorithm of the SLA differs from that of other batteries in that a
voltage-limit
ratherthan
current-limit
is used. Typically, a multistage charger applies three charge stages consisting of a
con-stant-current charge
,
topping-charge
, and
float-charge
. (See Figure 21.10.) During the constant-currentstage, the battery charges to 70% in about 5 hours; the remaining 30% is completed by the topping-charge. The slow topping-charge, lasting another 5 hours, is essential for the performance of the battery.If not provided, the SLA eventually loses the ability to accept a full charge, and the storage capacity of thebattery is reduced. The third stage is the float-charge that compensates for self-discharge after the batteryhas been fully charged.
During the constant-current charge, the SLA battery is charged at a high current, limited by thecharger itself. After the voltage limit is reached, the topping charge begins and the current starts to grad-ually decrease. Full-charge is reached when the current drops to a preset level or reaches a low-endplateau.
Figure 21.10
The charge states of an SLA battery. (
From
[3].
Used with permission
.)
Constant currentcharge
Toppingcharge
Maximum chargecurrent is applieduntil the set cellvoltage limit is
reached.
Charge currentstarts to dropas the batterygets saturated.
Float charge currentcompensates for theself-discharge afterthe battery is fully
charged.
Stage 1 Stage 2 Stage 3
1 2 3 4 570% charged 100% charged
6 7 8 9 10 11 12
Cell voltage risesto voltage limit
Cell voltageis constant
Cell voltageis reduced
Floatcharge
Hour Charge
© 2007 by Taylor & Francis Group, LLC

336
AC Power Systems Handbook
The proper setting of the cell voltage limit is critical and is related to the conditions under which thebattery is charged. A typical voltage limit range is from 2.30 to 2.45 V. If a slow charge is acceptable, or ifthe room temperature can exceed 30°C (86°F), the recommended voltage limit is 2.35 V/cell. If a fastercharge is required and the room temperature remains below 30°C, 2.40 or 2.45 V/cell can be used. Table21.1 compares the advantages and disadvantages of the different voltage settings.
21.3 References
1. Lawrie, R.,
Electrical Systems for Computer Installations
, McGraw-Hill, New York, 1988.2. DeDad, J. A., “Auxiliary Power,” in
Practical Guide to Power Distribution for Information TechnologyEquipment
, PRIMEDIA Intertec, Overland Park, KS, pp. 31–39, 1997.3. Buchmann, I., “Batteries,” in
The Electronics Handbook
, J. C. Whitaker (Ed.), p. 1058, CRC Press,Boca Raton, FL, 1996.
21.4 Bibliography
Angevine, E., “Controlling Generator and UPS Noise,”
Broadcast Engineering
, PRIMEDIA Intertec, Over-land Park, KS, March 1989.
Baietto, R., “How to Calculate the Proper Size of UPS Devices,”
Microservice Management
, PRIMEDIAIntertec, Overland Park, KS, March 1989.
Federal Information Processing Standards Publication No. 94,
Guideline on Electrical Power for ADPInstallations
, U.S. Department of Commerce, National Bureau of Standards, Washington, DC, 1983.Smith, M., “Planning for Standby AC Power,”
Broadcast Engineering
, PRIMEDIA Intertec, Overland Park,KS, March 1989.
Table 21.1
Recommended Charge Voltage Limit for the SLA Battery (
After
[3].)
2.30 to 2.35 V/cell
2.40 to 2.45 V/cell
Advantage Maximum service life; battery remains cool on charge; battery can be charged at ambient temperature exceeding 30°C (86°F).
Faster charge times; higher and more consistent capacity readings; less subject to damage because of undercharge condition.
Disadvantage Slow charge time; capacity readings may be low and inconsistent. Produces undercharge condition that can cause sulphation and capacity loss if the battery is not periodically cycled.
Battery life may be reduced because of elevated battery temperature while charging. A hot battery may fail to reach the cell voltage limit, causing harmful overcharge.
© 2007 by Taylor & Francis Group, LLC

337
22
Designing for
Fault-Tolerance
22.1 Introduction
To achieve high levels of power-system reliability — with the ultimate goal being 24-hour-per-day availabil-ity, 365 days per year — some form of power-system redundancy is required, regardless of how reliable theindividual power-system components may be [1]. Redundancy, if properly implemented, also providespower-distribution flexibility. By providing more than one path for power flow to the load, the key elementsof a system can be shifted from one device or branch to another as required for load balancing, system reno-vations or alterations, or equipment failure isolation. Redundancy also provides a level of fault tolerance.Fault tolerance can be divided into three basic categories:
• Rapid recovery from failures• Protection against “slow” power system failures, where there is enough warning of the condition to
allow intervention• Protection against “fast” power system failures, where no warning of the power failure is given
As with many corrective and preventive measures, the increasing costs must be weighed against thebenefits.
For example, recent developments in large UPS system technologies have provided the capability tooperate two independent UPS systems in parallel, either momentarily or continuously. The ability tomomentarily connect two UPS systems allows critical loads to be transferred from one UPS system to theother without placing the UPS systems in bypass, thereby maintaining continuous UPS protection of theloads. Continuous paralleling of the two UPS systems, on the other hand, can be used to create a singleredundant UPS system from two otherwise nonredundant systems when multiple UPS modules are out ofservice (because of failures or maintenance). Figure 22.1 illustrates one such implementation.
22.2 Critical System Bus
Many facilities do not require the operation of all equipment during a power outage. Rather than use onelarge standby power system, key pieces of equipment can be protected with small, dedicated, uninterruptiblepower systems. Small UPS units are available with built-in battery supplies for computer systems and otherhardware. If cost prohibits the installation of a systemwide standby power supply (using generator or solid-state UPS technologies), consider establishing a
critical load bus
that is connected to a UPS system or gener-ator via an automatic transfer switch. This separate power supply is used to provide ac to critical loads, thuskeeping the protected systems up and running. The concept is illustrated in Figure 22.2. Unnecessary loadsare dropped in the event of a power failure.
A standby system built on the critical load principle can be a cost-effective answer to the power-failurethreat. The first step in implementing a critical load bus is to accurately determine the power requirementsfor the most important equipment. Typical power consumption figures can be found in most equipmentinstruction manuals. If the data is not listed or available from the manufacturer, it can be measured using awattmeter.
When planning a critical load bus, be certain to identify accurately which loads are critical and whichcan be dropped in the event of a commercial power failure. If air-conditioning is interrupted but the
© 2007 by Taylor & Francis Group, LLC
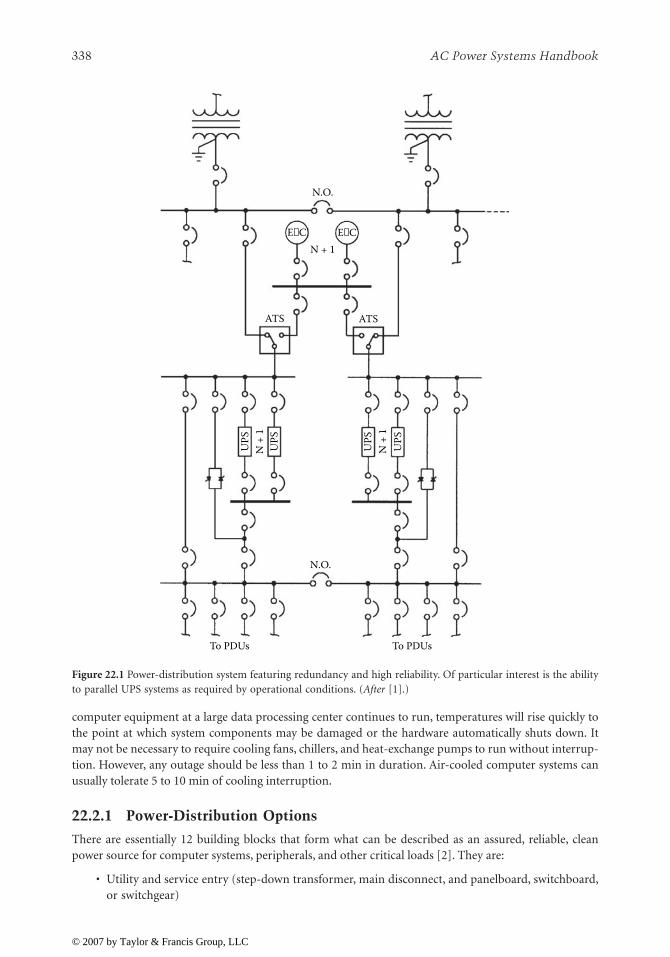
338
AC Power Systems Handbook
computer equipment at a large data processing center continues to run, temperatures will rise quickly tothe point at which system components may be damaged or the hardware automatically shuts down. Itmay not be necessary to require cooling fans, chillers, and heat-exchange pumps to run without interrup-tion. However, any outage should be less than 1 to 2 min in duration. Air-cooled computer systems canusually tolerate 5 to 10 min of cooling interruption.
22.2.1 Power-Distribution Options
There are essentially 12 building blocks that form what can be described as an assured, reliable, cleanpower source for computer systems, peripherals, and other critical loads [2]. They are:
• Utility and service entry (step-down transformer, main disconnect, and panelboard, switchboard,or switchgear)
Figure 22.1
Power-distribution system featuring redundancy and high reliability. Of particular interest is the abilityto parallel UPS systems as required by operational conditions. (
After
[1].)
N.O.
N.O.
To PDUs
N + 1
ATS ATS
UPS
UPS
N +
1
UPS
UPS
N +
1
To PDUs
E−C E−C
© 2007 by Taylor & Francis Group, LLC

Designing for Fault-Tolerance
339
• Lightning protection• Power bus• Facility power distribution• Grounding• Power conditioning equipment• Critical load air-conditioning• Frequency converter (if required)• Batteries for dc backup power• Emergency engine-generator• Critical load power-distribution network• Emergency readiness planning
Figure 22.2
An application of the critical-load power bus concept. In the event of a power failure, all equipmentnecessary for continued operation is powered by the UPS equipment. Noncritical loads are dropped until commercialac returns.
NoncriticalAC loads
Emergency bypass
Automaticbypassswitch
UPS System
InverterRectifier
Batteryplant
Centralprocessing
unit
High-speed printers
38 3 2 1
4 3 2 1
2
A/CAir-conditioningunit
Modems 1
Power Co.AC
distribution
Municipal power company(Back-up AC distribution)
Modems to receive datafrom remote unit
Critical ACload
distribution
2 1
Video display terminals
© 2007 by Taylor & Francis Group, LLC
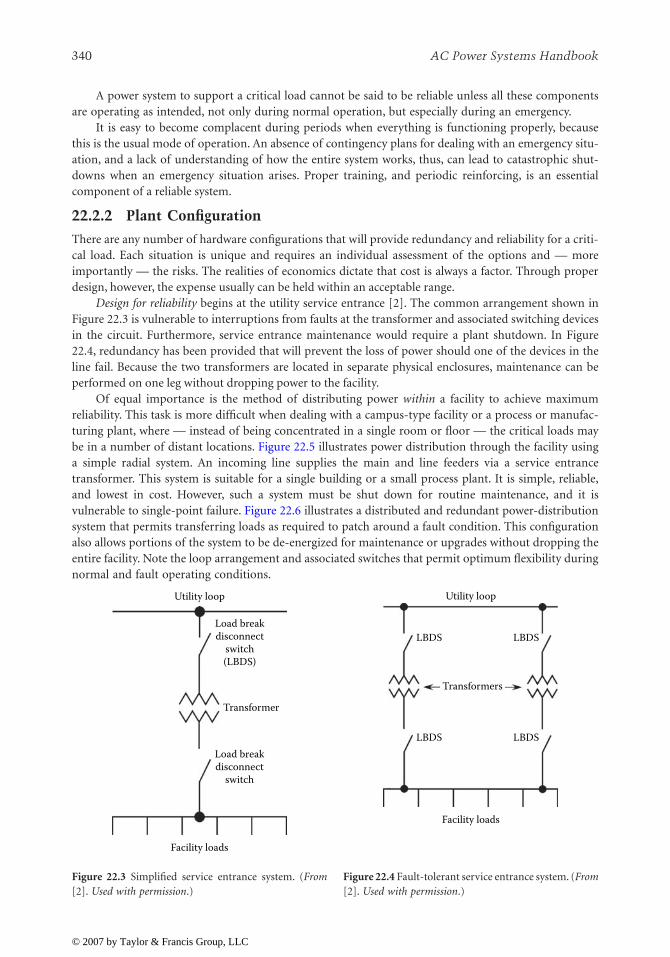
340
AC Power Systems Handbook
A power system to support a critical load cannot be said to be reliable unless all these componentsare operating as intended, not only during normal operation, but especially during an emergency.
It is easy to become complacent during periods when everything is functioning properly, becausethis is the usual mode of operation. An absence of contingency plans for dealing with an emergency situ-ation, and a lack of understanding of how the entire system works, thus, can lead to catastrophic shut-downs when an emergency situation arises. Proper training, and periodic reinforcing, is an essentialcomponent of a reliable system.
22.2.2 Plant Configuration
There are any number of hardware configurations that will provide redundancy and reliability for a criti-cal load. Each situation is unique and requires an individual assessment of the options and — moreimportantly — the risks. The realities of economics dictate that cost is always a factor. Through properdesign, however, the expense usually can be held within an acceptable range.
Design for reliability
begins at the utility service entrance [2]. The common arrangement shown inFigure 22.3 is vulnerable to interruptions from faults at the transformer and associated switching devicesin the circuit. Furthermore, service entrance maintenance would require a plant shutdown. In Figure22.4, redundancy has been provided that will prevent the loss of power should one of the devices in theline fail. Because the two transformers are located in separate physical enclosures, maintenance can beperformed on one leg without dropping power to the facility.
Of equal importance is the method of distributing power
within
a facility to achieve maximumreliability. This task is more difficult when dealing with a campus-type facility or a process or manufac-turing plant, where — instead of being concentrated in a single room or floor — the critical loads maybe in a number of distant locations. Figure 22.5 illustrates power distribution through the facility usinga simple radial system. An incoming line supplies the main and line feeders via a service entrancetransformer. This system is suitable for a single building or a small process plant. It is simple, reliable,and lowest in cost. However, such a system must be shut down for routine maintenance, and it isvulnerable to single-point failure. Figure 22.6 illustrates a distributed and redundant power-distributionsystem that permits transferring loads as required to patch around a fault condition. This configurationalso allows portions of the system to be de-energized for maintenance or upgrades without dropping theentire facility. Note the loop arrangement and associated switches that permit optimum flexibility duringnormal and fault operating conditions.
Figure 22.3
Simplified service entrance system. (
From
[2].
Used with permission
.)
Figure 22.4
Fault-tolerant service entrance system. (
From
[2].
Used with permission
.)
Utility loop
Load breakdisconnect
switch(LBDS)
Load breakdisconnect
switch
Facility loads
Transformer
Utility loop
LBDS
Facility loads
LBDS
LBDS LBDS
Transformers
© 2007 by Taylor & Francis Group, LLC

Designing for Fault-Tolerance
341
22.3 Plant Maintenance
Maintenance of the facility electrical system is a key part of any seri-ous energy-management effort. Perform the following steps on aregular basis:
• Measure the current drawn on distribution cables. Documentthe measurements so that a history of power demand can becompiled.
• Check terminal and splice connections to make sure they aretight.
• Check power-system cables for excessive heating.• Check cables for insulation problems.• Clean switchboard and circuit-breaker panels.• Measure the phase-to-phase load balance at the utility service
entrance. Load imbalance can result in inefficient use of acpower.
• Measure and chart the power factor of the load. Develop andpost a simplified one-line schematic of the entire power net-work as well as other building systems, including heating, air-conditioning, security, and alarm functions. A
mimic board
ishelpful in this process. Construct the mimic board controlpanel so that it depicts the entire ac power-distribution system.The board should have active indicators that show what loadsor circuit breakers are turned on or off, what functions havebeen disabled, and key operating parameters, including inputvoltage, load current, and total kVA demand. Safety consider-ations require that machinery not be activated from the mimicboard. Permit machinery to be energized only at the appara-tus. As an alternative, remote control of machines can be provided, if a
remote/local
control switchis provided at the apparatus.
Environmental control systems should be monitored closely. Air-conditioning, heating, and ventila-tion systems often represent a significant portion of the power load of a facility. Computer-based data-logging equipment with process control capability can be of considerable help in monitoring the condi-tion of the equipment. The logger can be programmed to record all pertinent values periodically and toreport abnormal conditions.
Figure 22.6
A redundant, fault-tolerant secondary plant distribution system. (
From
[2].
Used with permission
.)
Facility loads
Figure 22.5 Secondary plant dis-tribution using a simple radialconfiguration. (From [2]. Usedwith permission.)
Circuitbreakers(typical)
Transformer(typical)
Breaker(typical)
Facility loads
Switches(typical)
© 2007 by Taylor & Francis Group, LLC

342
AC Power Systems Handbook
22.3.1 Switchgear Maintenance
All too often, ac power switchgear is installed at a facility and forgotten — until a problem occurs. A care-less approach to regular inspection and cleaning of switchgear has resulted in numerous failures, includ-ing destructive fires. The most serious fault in any switchgear assembly is arcing involving the mainpower bus. Protective devices may fail to open, or open only after a considerable delay. The arcing dam-age to busbars and enclosures can be significant. Fire often ensues, compounding the damage.
Moisture, combined with dust and dirt, is the greatest deteriorating factor insofar as insulation isconcerned. Dust or moisture are thought to account for as much as half of switchgear failures. Initialleakage paths across the surface of bus supports result in flashover and sustained arcing. Contact over-heating is another common cause of switchgear failure. Improper circuit-breaker installation or looseconnections can result in localized overheating and arcing.
An arcing fault is destructive because of the high temperatures present (more than 6000
°
F). An arc isnot a stationary event. Because of the ionization of gases and the presence of vaporized metal, an arc cantravel along bare busbars, spreading the damage and sometimes bypassing open circuit breakers. It hasbeen observed that most faults in three-phase systems involve all phases. The initial fault that triggers theevent may involve only one phase, but because of the traveling nature of an arc, damage quickly spreadsto the other lines.
Preventing switchgear failure is a complicated discipline, but consider the following general guide-lines:
• Install insulated busbars for both medium-voltage and low-voltage switchgear. Each phase of thebus and all connections should be enclosed completely by insulation with electrical, mechanical,thermal, and flame-retardant characteristics suitable for the application.
• Establish a comprehensive preventive maintenance program for the facility. Keep all switchboardhardware clean from dust and dirt. Periodically check connection points for physical integrity.
• Maintain control over environmental conditions. Switchgear exposed to contaminants, corrosivegases, moist air, or high ambient temperatures may be subject to catastrophic failure. Conditionsfavorable to moisture condensation are particularly perilous, especially when dust and dirt arepresent.
• Accurately select overcurrent trip settings, and check them on a regular basis. Adjust the trip pointsof protection devices to be as low as possible, consistent with reliable operation.
• Divide switchgear into compartments that isolate different circuit elements. Consider addingvertical barriers to bus compartments to prevent the spread of arcing and fire.
• Install ground-fault protection devices at appropriate points in the power-distribution system.• Adhere to all applicable building codes.
22.3.2 Ground-System Maintenance
Out of sight, out of mind does not — or, at least,
should
not — apply to a facility ground system.Grounding is a crucial element in achieving reliable operation of electronic equipment. If a ground sys-tem has been buried for 10 years or more, it is due for an inspection. Soil conditions vary widely, but fewareas have soil that permits a radial- or screen-based ground system to last much more than 15 years.
The method of construction and bonding of the ground network also can play a significant role inthe ultimate life expectancy of the system. For example, ground conductors secured only by mechanicalmeans (screws and bolts, crimping, and rivets) can quickly break down when exposed to even mild soilconditions. Unless silver-soldered or bonded using an exothermic method, such connections soon will beuseless for all practical purposes.
The inspection process involves uncovering portions of the ground system to check for evidence offailure. Pay particular attention to interconnection points, where the greatest potential for problemsexists. In some cases, a good metal detector will help identify portions of the ground system. It will not,however, identify breaks in the system. Portions of the ground system still will need to be uncovered to
© 2007 by Taylor & Francis Group, LLC
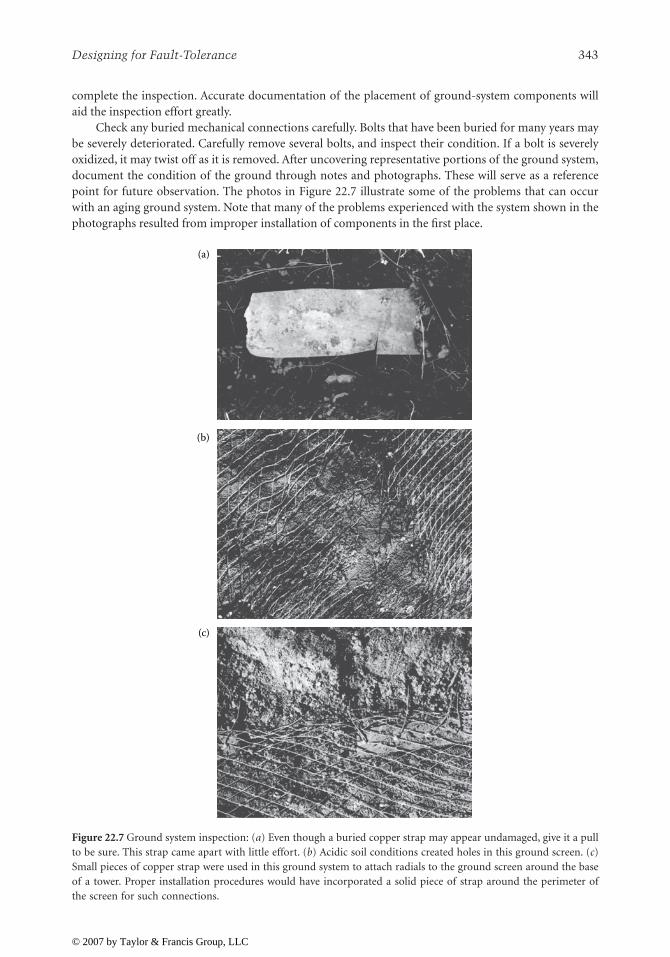
Designing for Fault-Tolerance
343
complete the inspection. Accurate documentation of the placement of ground-system components willaid the inspection effort greatly.
Check any buried mechanical connections carefully. Bolts that have been buried for many years maybe severely deteriorated. Carefully remove several bolts, and inspect their condition. If a bolt is severelyoxidized, it may twist off as it is removed. After uncovering representative portions of the ground system,document the condition of the ground through notes and photographs. These will serve as a referencepoint for future observation. The photos in Figure 22.7 illustrate some of the problems that can occurwith an aging ground system. Note that many of the problems experienced with the system shown in thephotographs resulted from improper installation of components in the first place.
Figure 22.7
Ground system inspection: (
a
) Even though a buried copper strap may appear undamaged, give it a pullto be sure. This strap came apart with little effort. (
b
) Acidic soil conditions created holes in this ground screen. (
c
)Small pieces of copper strap were used in this ground system to attach radials to the ground screen around the baseof a tower. Proper installation procedures would have incorporated a solid piece of strap around the perimeter ofthe screen for such connections.
(a)
(b)
(c)
© 2007 by Taylor & Francis Group, LLC

344
AC Power Systems Handbook
22.4 References
1. Gruzs, T. M., “High Availability, Fault-Tolerant AC Power Distribution Systems for Critical Loads,
Proceedings
,
Power Quality Solutions/Alternative Energy
, Intertec International, Ventura, CA, pp.20–22, September 1996.
2. DeDad, J. A., “Considerations in Designing a Reliable Power Distribution System,” in
PracticalGuide to Power Distribution for Information Technology Equipment
, PRIMEDIA Intertec, OverlandPark, KS, pp. 4–8, 1997.
22.5 Bibliography
Angevine, E., “Controlling Generator and UPS Noise,”
Broadcast Engineering
, PRIMEDIA Intertec, Over-land Park, KS, March 1989.
Baietto, R., “How to Calculate the Proper Size of UPS Devices,”
Microservice Management
, PRIMEDIAIntertec, Overland Park, KS, March 1989.
Federal Information Processing Standards Publication No. 94,
Guideline on Electrical Power for ADPInstallations
, U.S. Department of Commerce, National Bureau of Standards, Washington, DC, 1983.
Highnote, R. L.,
The IFM Handbook of Practical Energy Management
, Institute for Management, Old Say-brook, CT, 1979.
Smith, M., “Planning for Standby AC Power,”
Broadcast Engineering
, PRIMEDIA Intertec, Overland Park,KS, March 1989.
Stuart, B., “Maintaining an Antenna Ground System,”
Broadcast Engineering
, PRIMEDIA Intertec, Over-land Park, KS, October 1986.
© 2007 by Taylor & Francis Group, LLC
345
23
The Efficient Use of
Energy
23.1 Introduction
Utility company power bills are usually a large part of the operating expenses of a facility. To reduce theamount of money spent each month on electricity, engineers must understand the billing methods used bythe utility. Saving energy is more complicated than simply turning off unnecessary lights. The amount ofmoney that can be saved through a well-planned energy conservation effort is often substantial. Reductionsof 20% are not uncommon, depending upon the facility layout and the extent of energy conservation effortsalready under way. Regardless of any monetary savings that might be realized from a power-use-reductionprogram, the items discussed here should be considered for any well-run facility.
The rate structures of utility companies vary widely from one area of the country to another. Some gen-eralizations can be made, however, with respect to the basic rate-determining factors. The four primaryparameters used to determine a customer’s bill are
• Energy usage• Peak demand• Load factor• Power factor
These items often can be controlled, to some extent, by the customer.
23.2 Energy Usage
The kilowatt-hour (kWh) usage of a facility can be reduced by turning off loads such as heating and air-conditioning systems, lights, and office equipment when they are not needed. The installation of timers,photocells, or sophisticated computer-controlled energy-management systems can make substantial reduc-tions in facility kWh demand each month. Common sense will dictate the conservation measures applica-ble to a particular situation. Obvious items include reducing the length of time high-power equipment is inoperation, setting heating and cooling thermostats to reasonable levels, keeping office equipment turnedoff during the night, and avoiding excessive amounts of indoor or outdoor lighting.
Although energy conservation measures should be taken in every area of facility operation, the greatestsavings generally can be found where the largest energy users are located. Transmitter plants, large machin-ery, and process drying equipment consume a huge amount of power, so particular attention should begiven to such hardware. Consider the following:
• Use the waste heat from equipment at the site for other purposes, if practical. In the case of high-power RF generators or transmitters, room heating can be accomplished with a logic-controlled poweramplifier exhaust-air recycling system.
• Have a knowledgeable consultant plan the air-conditioning and heating system at the facility forefficient operation.
• Check thermostat settings on a regular basis, and consider installing time-controlled thermostats.• Inspect outdoor-lighting photocells regularly for proper operation.
© 2007 by Taylor & Francis Group, LLC

346
AC Power Systems Handbook
• Examine carefully the efficiency of high-power equipment used at the facility. New designs mayoffer substantial savings in energy costs.
The efficiency of large power loads, such as mainframe computers, transmitters, or industrial RFheaters, is an item of critical importance to energy conservation efforts. Most systems available today aresignificantly more efficient than their counterparts of just 10 years ago. Plant management often can findeconomic justification for updating or replacing an older system on the power savings alone. In virtuallyany facility, energy conservation can best be accomplished through careful selection of equipment,thoughtful system design, and conscientious maintenance practices.
23.3 Peak Demand
Conserving energy is a big part of the power bill reduction equation, but it is not the whole story. The
peak demand
of the customer load is an important criterion in the utility company's calculation of ratestructures. The peak demand figure is a measure of the maximum load placed on the utility company sys-tem by a customer during a predetermined billing cycle. The measured quantities may be kilowatts, kilo-volt-amperes, or both. Time intervals used for this measurement range from 15 to 60 min. Billing cyclesmay be annual or semiannual. Figure 23.1 shows an example of varying peak demand.
If a facility operated at basically the same power consumption level from one hour to the next andone day to the next, the utility company could predict accurately the demand of the load, and then size itsequipment (including the allocation of energy reserves) for only the amount of power actually needed.For the example shown in the figure, however, the utility company must size its equipment (includingallocated energy reserves) for the peak demand. The area between the peak demand and the actual usageis the margin of inefficiency that the customer forces upon the utility. The peak demand factor is amethod used by utility companies to assess penalties for such operation, thereby encouraging the cus-tomer to approach a more efficient state of operation (from the utility's viewpoint).
Figure 23.1
The charted power consumption of a facility not practicing energy-management techniuqes. note theinefficiency that the utility company must absorb when faced with a load such as this.
Inefficiency Inefficiency
100
80
60
40
Kilo
wat
t dem
and
20
12 2 4 6 8 10 12 2N
AM Time PM
M M4 6 8 10 12
Measured powerconsumption
© 2007 by Taylor & Francis Group, LLC

The Efficient Use of Energy
347
Load shedding
is a term used to describe the practice of trimming peak power demand to reducehigh-demand penalties. The goal of load shedding is to schedule the operation of nonessential equipmentso as to provide a uniform power load to the utility company and, thereby, a better kWh rate. Nearly anyoperation has certain electric loads that can be rescheduled on a permanent basis or deferred as powerdemand increases during the day. Figure 23.2 illustrates the results of a load-shedding program. Thismore efficient operation has a lower overall peak demand and a higher average demand.
Peak demand reduction efforts can cover a wide range of possibilities. It would be unwise from anenergy standpoint, for example, to test high-power standby equipment on a summer afternoon, whenair-conditioning units may be in full operation. Morning or evening hours would be a better choice,when the air-conditioning is off and the demand of office equipment is reduced. Each operation isunique and requires an individual assessment of load-shedding options.
An automated power-demand controller provides an effective method of managing peak demand. Acontroller can analyze the options available and switch loads as needed to maintain a relatively constantpower demand from the utility company. Such systems are programmed to recognize which loads havepriority and which loads are nonessential. Power demand then is automatically adjusted by the system,based upon the rate schedule of the utility company. Many computerized demand control systems alsoprovide the customer a printout of the demand profile of the plant, further helping managers analyze andreduce power costs. Figure 23.3 shows one such printout. Note that both energy demand and the costs forthat energy are provided.
23.4 Load Factor
The load factor on an electric utility company bill is a product of the peak demand and energy usage. Itusually is calculated and applied to the customer's bill each month. Reducing either the peak demand orenergy usage levels, or both, will decrease this added cost factor. Reducing power factor penalties also willhelp to reduce load factor charges.
23.5 Power Factor
Power factor charges are the result of heavy inductive loading of the utility company system. A poor PFwill result in excessive losses along utility company feeder lines because more current is required to
Figure 23.2
An example of the successful application of a load-shedding program. Energy usage has been spreadmore evenly throughout the day, resulting in reduced demand and, consequently, a better rate from the utilitycompany.
Inefficiency Demand savings100
80
60
40
Kilo
wat
t dem
and
20
12 2 4 6 8 10 12 2N
AM Time PM
M M4 6 8 10 12
Charted energyusage
Charted energyusage
12 2 4 6 8 10 12 2N
AM Time PM
M M4 6 8 1012
© 2007 by Taylor & Francis Group, LLC
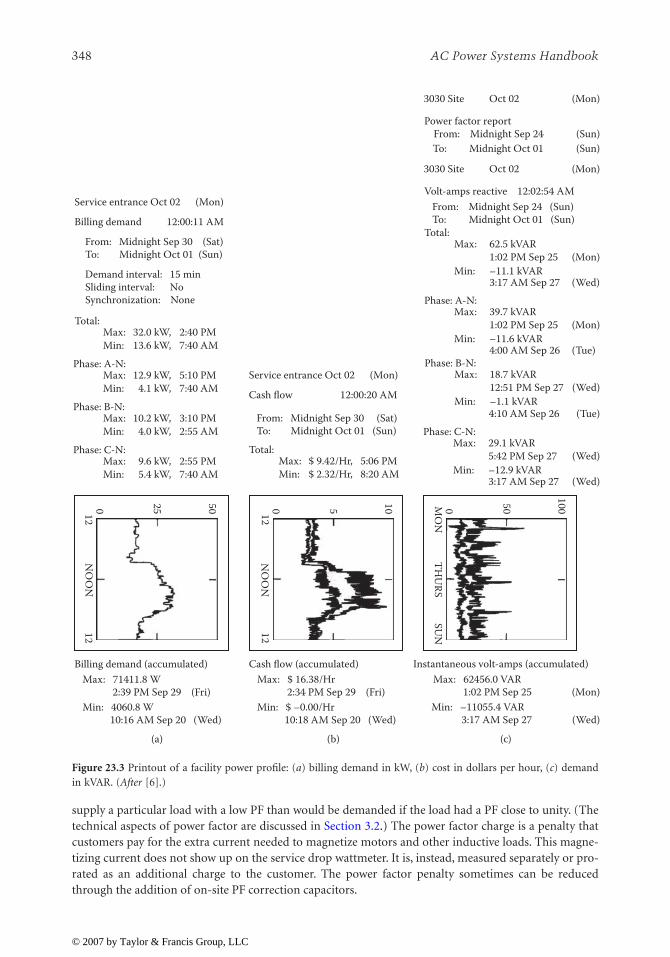
348
AC Power Systems Handbook
supply a particular load with a low PF than would be demanded if the load had a PF close to unity. (Thetechnical aspects of power factor are discussed in Section 3.2.) The power factor charge is a penalty thatcustomers pay for the extra current needed to magnetize motors and other inductive loads. This magne-tizing current does not show up on the service drop wattmeter. It is, instead, measured separately or pro-rated as an additional charge to the customer. The power factor penalty sometimes can be reducedthrough the addition of on-site PF correction capacitors.
Figure 23.3
Printout of a facility power profile: (
a
) billing demand in kW, (
b
) cost in dollars per hour, (
c
) demandin kVAR. (
After
[6].)
1212
NO
ON
NO
ON
1212
25 500 5 100
THU
RSSU
NM
ON
50
1000
Billing demand (accumulated)Max: 71411.8 W 2:39 PM Sep 29 (Fri)Min: 4060.8 W 10:16 AM Sep 20 (Wed)
Service entrance Oct 02 (Mon)
Billing demand 12:00:11 AM
From: Midnight Sep 30 (Sat)To: Midnight Oct 01 (Sun)
Service entrance Oct 02 (Mon)
Cash flow 12:00:20 AM
From: Midnight Sep 30 (Sat)To: Midnight Oct 01 (Sun)
Demand interval: 15 minSliding interval: NoSynchronization: None
3030 Site Oct 02 (Mon)
3030 Site Oct 02 (Mon)
Volt-amps reactive 12:02:54 AM
Power factor report
(a)
Cash flow (accumulated)Max: $ 16.38/Hr 2:34 PM Sep 29 (Fri)Min: $ –0.00/Hr 10:18 AM Sep 20 (Wed)
(b)
Instantaneous volt-amps (accumulated)Max: 62456.0 VAR 1:02 PM Sep 25 (Mon)Min: –11055.4 VAR 3:17 AM Sep 27 (Wed)
(c)
Total:Max: 32.0 kW, 2:40 PMMin: 13.6 kW, 7:40 AM
Total:Max: $ 9.42/Hr, 5:06 PMMin: $ 2.32/Hr, 8:20 AM
Max: 12.9 kW, 5:10 PMMin: 4.1 kW, 7:40 AM
Phase: A-N:
Max: 10.2 kW, 3:10 PMMin: 4.0 kW, 2:55 AM
Phase: B-N:
Max: 9.6 kW, 2:55 PMMin: 5.4 kW, 7:40 AM
Phase: C-N: Max: 29.1 kVAR5:42 PM Sep 27 (Wed)
3:17 AM Sep 27 (Wed)Min: –12.9 kVAR
Phase: C-N:4:10 AM Sep 26 (Tue)
Max: 18.7 kVAR12:51 PM Sep 27 (Wed)
Min: –1.1 kVAR
Phase: B-N:
Max: 39.7 kVAR1:02 PM Sep 25 (Mon)
4:00 AM Sep 26 (Tue)Min: –11.6 kVAR
Phase: A-N:
Max: 62.5 kVAR1:02 PM Sep 25 (Mon)
3:17 AM Sep 27 (Wed)Min: –11.1 kVAR
Total:
To: Midnight Oct 01 (Sun)From: Midnight Sep 24 (Sun)
From: Midnight Sep 24 (Sun)To: Midnight Oct 01 (Sun)
© 2007 by Taylor & Francis Group, LLC

The Efficient Use of Energy
349
Power factor meters are available for measurement of a given load. It is usually less expensive in thelong run, however, to hire a local electrical contractor to conduct a PF survey and recommend correctionmethods. Possible sources of PF problems include transmitters, blowers, air conditioners, heating equip-ment, and fluorescent and high-intensity discharge lighting-fixture ballasts.
23.6 Reference
1. Lawrie, R. H.,
Practical Guide to Electrical Energy Efficiency and Reduced Costs
, PRIMEDIA Intertec,Overland Park, KS, 1994.
23.7 Bibliography
Federal Information Processing Standards Publication No. 94,
Guideline on Electrical Power for ADPInstallations
, U.S. Department of Commerce, National Bureau of Standards, Washington, DC ,1983.
Highnote, R. L.,
The IFM Handbook of Practical Energy Management
, Institute for Management, OldSaybrook, CT, 1979.
© 2007 by Taylor & Francis Group, LLC

351
24
Safety and Protection
Systems
24.1 Introduction
Safety is critically important to engineering personnel who work around powered hardware, especially ifthey work under considerable time pressures. Safety is not something to be taken lightly.
Life safety
systemsare those designed to protect life and property. Such systems include emergency lighting, fire alarms, smokeexhaust and ventilating fans, and site security.
24.1.1 Facility Safety Equipment
Personnel safety is the responsibility of the facility manager. Proper life safety procedures and equipmentmust be installed. Safety-related hardware includes the following:
•
Emergency power off
(EPO) button. EPO pushbuttons are required by safety code for various typesof facilities, including data processing (DP) centers. One must be located at each principal exit fromthe room. Other EPO buttons may be located near operator workstations. The EPO system, intendedonly for emergencies, disconnects all power to the room, except for lighting.
• Smoke detector. Two basic types of smoke detectors commonly are available. The first compares thetransmission of light through air in the room with light through a sealed optical path into whichsmoke cannot penetrate. Smoke causes a differential or
backscattering
effect that, when detected,triggers an alarm after a preset threshold has been exceeded. The second type of smoke detector sensesthe ionization of combustion products rather than visible smoke. A mildly radioactive source, usuallynickel, ionizes the air passing through a screened chamber. A charged probe captures ions and detectsthe small current that is proportional to the rate of capture. When combustion products or materialother than air molecules enter the probe area, the rate of ion production changes abruptly, generatinga signal that triggers the alarm.
• Flame detector. The flame sensor responds not to heated surfaces or objects, but to infrared when itflickers with the unique characteristics of a fire. Such detectors, for example, will respond to a lightedmatch, but not to a cigarette. The ultraviolet light from a flame also is used to distinguish betweenhot, glowing objects and open flame.
• Halon. The Halon fire-extinguishing agent is a low-toxicity, compressed gas that is contained inpressurized vessels. Discharge nozzles in data processing rooms and other types of equipment roomsare arranged to dispense the entire contents of a central container or of multiple smaller containersof Halon when actuated by a command from the fire control system. The discharge is sufficient toextinguish flame and stop combustion of most flammable substances. Halon is one of the morecommon fire-extinguishing agents used for DP applications. Halon systems usually are not practical,however, in large, open-space facilities.
• Water sprinkler. Although water is an effective agent against a fire, activation of a sprinkler systemwill often cause damage to the equipment it is meant to protect. Interlock systems must drop allpower (except for emergency lighting) before the water system is discharged. Most water systems usea two-stage alarm. Two or more fire sensors, often of different design, must signal an alarm condition
© 2007 by Taylor & Francis Group, LLC

352
AC Power Systems Handbook
before water is discharged into the protected area. Where sprinklers are used, floor drains andEPO controls must be provided.
• Fire damper. Dampers are used to block ventilating passages in strategic parts of the system whena fire is detected. This prevents fire from spreading through the passages and keeps fresh air fromfanning the flames. A fire damper system, combined with the shutdown of cooling and ventilatingair, enables Halon to be retained in the protected space until the fire is extinguished.
Many life safety system functions can be automated. The decision of what to automate and what tooperate manually requires considerable thought. If the life safety control panels are accessible to a largenumber of site employees, most functions should be automatic. Alarm-silencing controls should bemaintained under lock and key. A mimic board can be used to readily identify problem areas. Figure24.1 illustrates a well-organized life safety control system. Note that fire, HVAC (heating, ventilation, andair-conditioning), security, and EPO controls all are readily accessible. Note also that operating instruc-tions are posted for life safety equipment, and an evacuation route is shown. Important telephonenumbers are posted, and a direct-line telephone (not via the building switchboard) is provided. Allequipment is located adjacent to a lighted emergency exit door.
Life safety equipment must be maintained just as diligently as the systems that it protects. Conductregular tests and drills. It is, obviously, not necessary or advisable to discharge Halon or water during adrill.
Configure the life safety control system to monitor not only the premises for dangerous conditions,but also the equipment designed to protect the facility. Important monitoring points include HVAC
Figure 24.1
A well-organized life safety control station. (
After
[1].)
Local fire alarm
Fire
Pull
Halon
Operatinginstructions
Evacuationand floor plam
Exit
Telephone
Telephonenumber
Manual haton “abort”button prevents
haton releasewhile held down
Manual halonrelease
(guarded)Smoke removalcycle start-stop
Lighted “panic” (guarded)for power/HVAC shutoff
© 2007 by Taylor & Francis Group, LLC

Safety and Protection Systems
353
machine parameters, water or Halon pressure, emergency battery-supply status, and other elements ofthe system that could compromise the ability of life safety equipment to carry out its functions. Basicguidelines for life safety systems include the following:
• Carefully analyze the primary threats to life and property within the facility. Develop contingencyplans to meet each threat.
• Prepare a life safety manual, and distribute it to all employees at the facility. Require them to read it.• Conduct drills for employees at random times without notice. Require acceptable performance
from employees.• Prepare simple, step-by-step instructions on what to do in an emergency. Post the instructions in
a conspicuous place.• Assign after-hours responsibility for emergency situations. Prepare a list of supervisors that oper-
ators should contact if problems arise. Post the list with phone numbers. Keep the list accurateand up-to-date. Always provide the names of three individuals who can be contacted in anemergency.
• Work with a life safety consultant to develop a coordinated control and monitoring system forthe facility. Such hardware will be expensive, but it must be provided. The facility may be able tosecure a reduction in insurance rates if comprehensive safety efforts can be demonstrated.
• Interface the life safety system with automatic data-logging equipment so that documentation canbe assembled on any event.
• Insist upon complete, up-to-date schematic diagrams for all hardware at the facility. Insist thatthe diagrams include any changes made during installation or subsequent modification.
• Provide sufficient emergency lighting.• Provide easy-access emergency exits.
The importance of providing standby power for sensitive loads at commercial and industrial facili-ties has been outlined previously. It is equally important to provide standby power for life safety systems.A lack of ac power must not render the life safety system inoperative. Sensors and alarm control unitsshould include their own backup battery supplies. In a properly designed system, all life safety equipmentwill be fully operational despite the loss of all ac power to the facility, including backup power for sensi-tive loads.
Place cables linking the life safety control system with remote sensors and actuators in separate con-duit containing only life safety conductors. Study the National Electrical Code and all applicable localand federal codes relating to safety. Follow them to the letter.
24.2 Electric Shock
It takes surprisingly little current to injure a person. Studies at Underwriters Laboratories (UL) show thatthe electrical resistance of the human body varies with the amount of moisture on the skin, the muscularstructure of the body, and the applied voltage. The typical hand-to-hand resistance ranges from 500
Ω
to600 k
Ω
, depending on the conditions. Higher voltages have the capability to break down the outer layersof the skin, which can reduce the overall resistance value. UL uses the lower value, 500
Ω
, as the standardresistance between major extremities, such as from the hand to the foot. This value generally is consid-ered the minimum that would be encountered. In fact, it may not be unusual because wet conditions or acut or other break in the skin significantly reduces human body resistance.
24.2.1 Effects on the Human Body
Table 24.1 lists some effects that typically result when a person is connected across a current source with ahand-to-hand resistance of 2.4 k
Ω
. The table shows that a current of 50 mA will flow between the hands,if one hand is in contact with a 120 V ac source and the other hand is grounded. The table also indicatesthat even the relatively small current of 50 mA can produce
ventricular fibrillation
of the heart, and
© 2007 by Taylor & Francis Group, LLC

354
AC Power Systems Handbook
maybe even cause death. Medical literature describes ventricular fibrillation as very rapid, uncoordinatedcontractions of the ventricles of the heart, resulting in loss of synchronization between heartbeat andpulse beat. The electrocardiograms shown in Figure 24.2 compare a healthy heart rhythm with one inventricular fibrillation. Unfortunately, once ventricular fibrillation occurs, it will continue. Barring resus-citation techniques, death will ensue within a few minutes.
The route taken by the current through the body greatly affects the degree of injury. Even a smallcurrent, passing from one extremity through the heart to another extremity, is dangerous and capable ofcausing severe injury or electrocution. There are cases in which a person has contacted extremely highcurrent levels and lived to tell about it. However, when this happens, it is usually because the currentpasses only through a single limb and not through the entire body. In these instances, the limb is oftenlost but the person survives.
Current is not the only factor in electrocution. Figure 24.3 summarizes the relationship betweencurrent and time on the human body. The graph shows that 100 mA flowing through an adult humanbody for 2 s will cause death by electrocution. An important factor in electrocution, the
let-go range
, alsois shown on the graph. This point marks the amount of current that causes
freezing
, or the inability to letgo of a conductor. At 10 mA, 2.5% of the population would be unable to let go of a live conductor; at 15mA, 50% of the population would be unable to let go of an energized conductor. It is apparent from thegraph that even a small amount of current can freeze someone to a conductor. The objective for those
Table 24.1
The Effects of Current on the Human Body
1 mA or less
No sensation, not felt
More than 3 mA Painful shock
More than 10 mA Local muscle contractions, sufficient to cause “freezing” to the circuit for 2.5% of the population
More than 15 mA Local muscle contractions, sufficient to cause “freezing” to the circuit for 50% of the population
More than 30 mA Breathing is difficult, can cause unconsciousness
50 to 100 mA Possible ventricular fibrillation of the heart
100 to 200 mA Certain ventricular fibrillation of the heart
More than 200 mA Severe burns and muscular contractions; heart more apt to stop than to go into fibrillation
More than a few amperes Irreparable damage to body tissues
Figure 24.2
Electrocardiogram traces: (
a
) healthy heart rhythm, (
b
) ventricular fibrillation of the heart.
Healthy rhythm(a)
(b)Ventricular fibrillation
© 2007 by Taylor & Francis Group, LLC

Safety and Protection Systems
355
who must work around electric equipment is to protect themselves from electric shock. Table 24.2 listsrequired precautions for maintenance personnel working near high voltages.
24.2.2 Circuit-Protection Hardware
A common primary panel or equipment circuit breaker or fuse will not protect an individual from elec-trocution. However, the
ground-fault current interrupter
(GFCI), used properly, can help prevent electro-cution. Shown in Figure 24.4, the GFCI works by monitoring the current being applied to the load. It
Figure 24.3
Effects of electric current and time on the human body. Note the “let-go” range.
Table 24.2
Required Safety Practices for Engineers Working around High-Voltage Equipment
✓
Remove all ac power from the equipment. Do not rely on internal contactors or SCRs to remove dangerous ac.
✓
Trip the appropriate power-distribution circuit breakers at the main breaker panel.
✓
Place signs as needed to indicate that the circuit is being serviced.
✓
Switch the equipment being serviced to the
local control
mode as provided.
✓
Discharge all capacitors using the discharge stick provided by the manufacturer.
✓
Do not remove, short-circuit, or tamper with interlock switches on access covers, doors, enclosures, gates, panels, or shields.
✓
Keep away from live circuits.
✓
Allow any component to cool completely before attempting to replace it.
✓
If a leak or bulge is found on the case of an oil-filled or electrolytic capacitor, do not attempt to service the part until it has cooled completely.
✓
Know which parts in the system contain PCBs. Handle them appropriately.
✓
Minimize exposure to RF radiation.
✓
Avoid contact with hot surfaces within the system.
✓
Do not take chances.
10
0.8
0.1 0.08 0.06
0.04 0.03 0.02
0.01 0 20 40 60 80 100 120
Maximum permitted byUL for class A GFCI
Electrocution threshold for typical adult
“Let-go” range
140 160 Current in milliamperes
180 200 220 240 260
0.6 0.4
0.2
1
8 6 4
2
Tim
e in
seco
nds
© 2007 by Taylor & Francis Group, LLC

356
AC Power Systems Handbook
uses a differential transformer that senses an imbalance in load current. If a current (typically 5 mA,
±
1mA on a low-current 120 V ac line) begins flowing between the neutral and ground or between the hotand ground leads, the differential transformer detects the leakage and opens the primary circuit (typicallywithin 2.5 ms).
Occupational Safety and Health Administration (OSHA) rules specify that temporary receptacles(those not permanently wired) and receptacles typically used on construction sites be equipped withGFCI protection. Receptacles on two-wire, single-phase portable and vehicle-mounted generators of notmore than 5 kW, where the generator circuit conductors are insulated from the generator frame and allother grounded surfaces, need not be equipped with GFCI outlets.
GFCIs will not protect a person from every type of electrocution. If you become connected to boththe neutral and the hot wire, the GFCI will treat you as if you are merely a part of the load and will notopen the primary circuit.
For large, three-phase loads, detecting ground currents and interrupting the circuit before injury ordamage can occur is a more complicated proposition. The classic method of protection involves the useof a zero-sequence current transformer (CT). Such devices are basically an extension of the single-phaseGFCI circuit shown in Figure 24.4. Three-phase CTs have been developed to fit over bus ducts, switch-board buses, and circuit-breaker studs. Rectangular core-balanced CTs are able to detect leakage currentsas small as several milliamperes when the system carries as much as 4 kA. “Doughnut-type” toroidalzero-sequence CTs also are available in varying diameters.
The zero-sequence current transformer is designed to detect the magnetic field surrounding a groupof conductors. As shown in Figure 24.5, in a properly operating three-phase system, the current flowingthrough the conductors of the system, including the neutral, goes out and returns along those same con-ductors. The net magnetic flux detected by the CT is zero. No signal is generated in the transformerwinding, regardless of current magnitudes — symmetrical or asymmetrical. If one phase conductor isfaulted to ground, however, the current balance will be upset. The ground-fault-detection circuit thenwill trip the breaker and open the line.
For optimum protection in a large facility, GFCI units are placed at natural branch points of the acpower system. It is, obviously, preferable to lose only a small portion of a facility in the event of a groundfault than it is to have the entire plant dropped. Figure 24.6 illustrates such a distributed system. Sensorsare placed at major branch points to isolate any ground fault from the remainder of the distribution net-work. In this way, the individual GFCI units can be set for higher sensitivity and shorter time delays thanwould be practical with a large, distributed load. The technology of GFCI devices has improved
Figure 24.4
Basic design of a ground-fault current interrupter (GFCI).
Differential transformer continuously monitors circuit to ensure that all current that flows out to motor or appliances returns to the source via
the circuit conductors. If any current leaks to a fault, the sensing circuit opens the circuit breaker and stops all current flow.
Source 5 A
5 A 4 A 4 A
1 A 1 A
1 A Ground
fault
Sensing circuit — the 1Adifference between the currentgoing out and that returning is
sensed, and the GFCI trips.
5 A
© 2007 by Taylor & Francis Group, LLC

Safety and Protection Systems
357
significantly within the past few years. New integrated circuit devices and improved CT designs have pro-vided improved protection components at a lower cost.
Sophisticated GFCI monitoring systems are available that analyze ground-fault currents and isolatethe faulty branch circuit. This feature prevents needless tripping of GFCI units up the line toward theutility service entrance. For example, if a ground fault is sensed in a fourth-level branch circuit, the GFCIsystem controller automatically locks out first-, second-, and third-level devices from operating to clear
Figure 24.5
Ground-fault detection in a three-phase ac system.
Figure 24.6
Ground-fault protection system for a large, multistory building.
Building ground
Circuit breaker
Ground relay
To shunt trip
Neutral
Neutral
Load
øC
øC
øB
øB
øA
øA
Zero-sequencecurrent
transformer
Mechanical equipment busway
One takeoff per floor similar to above
200 A switch
5000 A
1200 A
3000 A busway
riser
Subdistribution busway
Typical for each circuit Building
ground Neutral bus
Utility company vault
Utility metering GFI data
inputs GFI system controller
Typical for eachcircuit GFI control
outputsService protector
Service protector C
Service protector B
Service protector A
GR
GR Ground fault relay
Ratio type current transformer
Zero sequence ground-sensing transformer around all
circuit conductors
GR
GR
GR GR
GR
480–208 V transformer
120 V lighting panel
277 V lighting panel
Typical busway takeoff
GR
M M M M
© 2007 by Taylor & Francis Group, LLC

358
AC Power Systems Handbook
the fault. The problem, therefore, is safely confined to the fourth-level branch. The GFCI control systemis designed to operate in a fail-safe mode. In the event of a control-system shutdown, the individual GFCItrip relays would operate independently to clear whatever fault currents may exist.
Any facility manager would be well-advised to hire an experienced electrical contractor to conduct afull ground-fault protection study. Direct the contractor to identify possible failure points and to recom-mend corrective actions.
An extensive discussion of GFCI principals and practices can be found in Reference 2.
24.2.3 Working with High Voltage
Rubber gloves are a common safety measure used by engineers working on high-voltage equipment.These gloves are designed to provide protection from hazardous voltages when the wearer is working on“hot” circuits. Although the gloves may provide some protection from these hazards, placing too muchreliance on them poses the potential for disastrous consequences. There are several reasons why glovesshould be used only with a great deal of caution and respect. A common mistake made by engineers is toassume that the gloves always provide complete protection. The gloves found in some facilities may beold and untested. Some may even have been “repaired” by users, perhaps with electrical tape. Few toolscould be more hazardous than such a pair of gloves.
Know the voltage rating of the gloves. Gloves are rated differently for ac and dc voltages. Forinstance, a
class 0
glove has a minimum dc breakdown voltage of 35 kV; the minimum ac breakdown volt-age, however, is only 6 kV. Furthermore, high-voltage rubber gloves are not tested at RF frequencies, andRF can burn a hole in the best of them. Working on live circuits involves much more than simply wearinga pair of gloves. It involves a frame of mind — an awareness of everything in the area, especially groundpoints.
Gloves alone may not be enough to protect an individual in certain situations. Recall the axiom ofkeeping one hand in your pocket while working on a device with current flowing? The axiom actually isbased on simple electricity. It is not just the hot connection that causes the problem; it is the ground con-nection that permits current flow. Studies have showed that more than 90% of electric equipment fatali-ties occurred when the grounded person contacted a live conductor. Line-to-line electrocution accountedfor less than 10% of the deaths.
When working around high voltages, always look for grounded surfaces — and keep away fromthem. Even concrete can act as a ground if the voltage is high enough. If work must be conducted in livecabinets, consider using — in addition to rubber gloves — a rubber floor mat, rubber vest, and rubbersleeves. Although this may seem to be a lot of trouble, consider the consequences of making a mistake. Ofcourse, the best troubleshooting methodology is never to work on any circuit unless you are sure no haz-ardous voltages are present. In addition, any circuits or contactors that normally contain hazardous volt-ages should be grounded firmly before work begins.
Another important safety rule is to never work alone. Even if a trained assistant is not available whenmaintenance is performed, someone should accompany you and be available to help in an emergency.
24.2.4 First Aid Procedures
Be familiar with first aid treatment for electric shock and burns. Always keep a first aid kit on hand at thefacility. Figure 24.7 illustrates the basic treatment for electric shock victims. Copy the information, andpost it in a prominent location. Better yet, obtain more detailed information from your local heart asso-ciation or Red Cross chapter. Personalized instruction on first aid usually is available locally. Table 24.3lists basic first aid procedures for burns.
For electric shock, the best first aid is prevention. In the event that an individual has sustained or issustaining an electric shock at the work place, several guidelines are suggested, as detailed next.
© 2007 by Taylor & Francis Group, LLC

Safety and Protection Systems
359
Figure 24.7
Basic first aid treatment for electric shock.
A Airway If unconscious open airway
Treatment of electrical shock 1. If victim is not responsive, follow the A-B-Cs of basic life support.
2. If victim is responsive, keep him warm and quiet, loosen clothing and place in reclining position.
Place victim flat on his back on a hard surface call for medical assistance as soon as possible.
B Breathing If not breathing begin artificial breathing
C CirculationDepress sternum1 ½ to 2 inches
• Lift up neck • Push forehead back • Clear out mouth if necessary • Observe for breathing
• Tilt head • Pinch nostrils • Make airtight seal • 4 quick full breaths
Check carotid pulse.If pulse absent.Begin artificialcirculation.
Remember, mouth to mouth resuscitation must be commenced as soon as possible
One rescuer:15 compressions. 2 quickbreaths approx. Rate of
compressions — 80 per minute
Two rescuers:5 compressions. 1 breath
approx. Rate of compressions— 60 per minute
Do not interrupt the rhythm ofcompressions when a second person is giving breath
Press here
© 2007 by Taylor & Francis Group, LLC

360
AC Power Systems Handbook
24.2.4.1 Shock in Progress
For the case when a co-worker is receiving an electric shock and cannot let go of the electrical source, thesafest action is to trip the circuit breaker that energizes the circuit involved, or to pull the power-line plugon the equipment involved if the latter can be accomplished safely [2]. Under no circumstances shouldthe rescuer touch the individual who is being shocked, because the rescuer’s body may then also be in thedangerous current path. If the circuit breaker or equipment plug cannot be located, then an attempt canbe made to separate the victim from the electrical source through the use of a nonconducting object suchas a wooden stool or a wooden broom handle. Use only an
insulating
object and nothing that containsmetal or other electrically conductive material. The rescuer must be very careful not to touch the victimor the electrical source and thus become a second victim.
If such equipment is available, hot sticks
used in conjunction with lineman’s gloves
may be applied topush or pull the victim away from the electrical source. Pulling the hot stick normally provides the great-est control over the victim’s motion and is the safest action for the rescuer. After the electrical source hasbeen turned off, or the victim can be reached safely, immediate first aid procedures should be imple-mented.
24.2.4.2 Shock No Longer in Progress
If the victim is conscious and moving about, have the victim sit down or lie down. Sometimes there is adelayed reaction to an electrical shock that causes the victim to collapse. Call 911 or the appropriateplant-site paramedic team immediately. If there is a delay in the arrival of medical personnel, check forelectrical burns. In the case of severe shock, there will normally be burns at a minimum of two sites: theentry point for the current and the exit point(s). Cover the burns with dry (and sterile, preferably) dress-ings. Check for possible bone fractures if the victim was violently thrown away from the electrical sourceand possibly impacted objects in the vicinity. Apply splints as required if suitable materials are availableand you have appropriate training. Cover the victim with a coat or blanket if the environmental tempera-ture is below room temperature, or the victim complains of feeling cold.
If the victim is unconscious, call 911 or the appropriate plant-site paramedic team immediately. Inthe interim, check to see if the victim is breathing and if a pulse can be felt at either the inside of a wristabove the thumb joint (radial pulse) or in the neck above and to either side of the Adam’s apple (carotid
Table 24.3
Basic First Aid Procedures
For extensively burned and broken skin:
✓
Cover affected area with a clean sheet or cloth.
✓
Do not break blisters, remove tissue, remove adhered particles of clothing, or apply any salve or ointment.
✓
Treat victim for shock as required.
✓
Arrange for transportation to a hospital as quickly as possible.
✓
If victim's arms or legs are affected, keep them elevated.
✓
If medical help will not be available within an hour and the victim is conscious and not vomiting, prepare a weak solution of salt and soda. Mix 1 teaspoon of salt and 1/2-teaspoon of baking soda to each quart of tepid water. Allow the victim to sip slowly about 4 oz (half a glass) over a period of 15 min. Discontinue fluid intake if vomiting occurs. (Do not allow alcohol consumption.)
For less severe burns (first- and second-degree):
✓
Apply cool (not ice-cold) compresses using the cleanest available cloth article.
✓
Do not break blisters, remove tissue, remove adhered particles of clothing, or apply salve or ointment.
✓
Apply clean, dry dressing if necessary.
✓
Treat victim for shock as required.
✓
Arrange for transportation to a hospital as quickly as possible.
✓
If victim's arms or legs are affected, keep them elevated.
© 2007 by Taylor & Francis Group, LLC

Safety and Protection Systems
361
pulse). It is usually easier to feel the pulse in the neck as opposed to the wrist pulse, which may be weak.The index and middle finger should be used to sense the pulse, and not the thumb. Many individualshave an apparent thumb pulse that can be mistaken for the victim’s pulse. If a pulse can be detected butthe victim is not breathing, begin mouth-to-mouth respiration if you know how to do so. If no pulse canbe detected (presumably the victim will not be breathing), carefully move the victim to a firm surface andbegin cardiopulmonary resuscitation if you have been trained in the use of CPR. Respiratory arrest andcardiac arrest are crisis situations. Because of loss of the oxygen supply to the brain, permanent braindamage can occur after several minutes even if the victim is successfully resuscitated.
Ironically, the treatment for cardiac arrest induced by an electric shock is a massive countershock,which causes the entire heart muscle to contract. The random and uncoordinated ventricular fibrillationcontractions (if present) are thus stilled. Under ideal conditions, normal heart rhythm is restored oncethe shock current ceases. The countershock is generated by a cardiac defibrillator, various portable mod-els of which are available for use by emergency medical technicians and other
trained
personnel.Although portable defibrillators may be available at industrial sites where there is a high risk of electricalshock to plant personnel, they should be used only by
trained
personnel. Application of a defibrillator toan unconscious subject whose heart is beating can induce cardiac standstill or ventricular fibrillation, justthe conditions that the defibrillator was designed to correct.
24.3 Polychlorinated Biphenyls
Polychlorinated biphenyls
(PCBs) belong to a family of organic compounds known as
chlorinated hydro-carbons
. Virtually all PCBs in existence today have been synthetically manufactured. PCBs are of a heavy,oil-like consistency and have a high boiling point, a high degree of chemical stability, low flammability,and low electrical conductivity. These characteristics led to the past widespread use of PCBs in high-volt-age capacitors and transformers. Commercial products containing PCBs were distributed widely from1957 to 1977 under several trade names, including:
• Aroclor• Pyroclor• Sanotherm• Pyranol• Askarel
Askarel also is a generic name used for nonflammable dielectric fluids containing PCBs. Table 24.4lists some common trade names for Askarel. These trade names typically are listed on the nameplate ofa PCB transformer or capacitor.
24.3.1 Health Risk
PCBs are harmful because, once they are released into the environment, they tend not to break apart intoother substances. Instead, PCBs persist, taking several decades to slowly decompose. By remaining in theenvironment, they can be taken up and stored in the fatty tissues of all organisms, from which they arereleased slowly into the bloodstream. Therefore, because of the storage in fat, the concentration of PCBsin body tissues can increase with time, even though PCB exposure levels may be quite low. This process is
Table 24.4
Commonly Used Names for PCB Insulating Material
Apirolio Abestol Askarel Aroclor B Chlorextol Chlophen
Chlorinol Clorphon Diaclor DK Dykanol EEC-18
Elemex Eucarel Fenclor Hyvol Inclor Inerteen
Kanechlor No-Flamol Phenodlor Pydraul Pyralene Pyranol
Pyroclor Sal-T-Kuhl Santothern FR Santovac Solvol Therminal
© 2007 by Taylor & Francis Group, LLC
362
AC Power Systems Handbook
called
bioaccumulation
. Furthermore, as PCBs accumulate in the tissues of simple organisms, which areconsumed by progressively higher organisms, the concentration increases. This process is referred to as
biomagnification
. These two factors are especially significant because PCBs are harmful even at low levels.Specifically, PCBs have been shown to cause chronic (long-term) toxic effects in some species of animalsand aquatic life. Well-documented tests on laboratory animals show that various levels of PCBs can causereproductive effects, gastric disorders, skin lesions, and cancerous tumors.
PCBs can enter the body through the lungs, the gastrointestinal tract, and the skin. After absorption,PCBs are circulated in the blood throughout the body and stored in fatty tissues and skin, as well as in avariety of organs, including the liver, kidneys, lungs, adrenal glands, brain, and heart.
The health risk lies not only in the PCB itself, but also in the chemicals developed when PCBs areheated. Laboratory studies have confirmed that PCB by-products, including
polychlorinated dibenzo-furans
(PCDFs) and
polychlorinated dibenzo-p-dioxins
(PCDDs), are formed when PCBs or chloroben-zenes are heated to temperatures ranging from approximately 900 to 1300°F. Unfortunately, theseproducts are more toxic than PCBs themselves.
24.3.2 Governmental Action
The U.S. Congress took action to control PCBs in October 1975, by passing the Toxic Substances ControlAct (TSCA). A section of this law specifically directed the EPA to regulate PCBs. Three years later, the EPAissued regulations to implement a congressional ban on the manufacture, processing, distribution, anddisposal of PCBs. Since that time, several revisions and updates have been issued by the EPA. One of theserevisions, issued in 1982, specifically addressed the type of equipment used in industrial plants. Failure toproperly follow the rules regarding the use and disposal of PCBs has resulted in high fines and some jailsentences.
Although PCBs no longer are being produced for electric products in the U. S., significant numbersstill exist. The threat of widespread contamination from PCB fire-related incidents is one reason behindthe EPA's efforts to reduce the number of PCB products in the environment. The users of high-powerequipment are affected by the regulations primarily because of the widespread use of PCB transformersand capacitors. These components usually are located in older (pre-1979) systems, so this is the first placeto look for them. However, some facilities also maintain their own primary power transformers. Unlessthese transformers are of recent vintage, it is possible they too contain a PCB dielectric. Table 24.5 liststhe primary classifications of PCB devices.
24.3.3 PCB Components
The two most common PCB components are transformers and capacitors. A PCB transformer is onecontaining at least 500 parts per million (ppm) PCBs in the dielectric fluid. An Askarel transformer gen-erally has 600,000 ppm or more. A PCB transformer can be converted to a
PCB-contaminated device
(50to 500 ppm) or a
nonPCB device
(less than 50 ppm) by being drained, refilled, and tested. The testingmust not take place until the transformer has been in service for a minimum of 90 days. Note that this is
not
something that a maintenance technician can do. It is the exclusive domain of specialized remanufac-turing companies.
PCB transformers must be inspected quarterly for leaks. However, if an impervious dike (sufficientto contain all the liquid material) is built around the transformer, the inspections can be conductedyearly. Similarly, if the transformer is tested and found to contain less than 60,000 ppm, a yearly inspec-tion is sufficient. Failed PCB transformers cannot be repaired; they must be disposed of properly.
If a leak develops, it must be contained and daily inspections must begin. A cleanup must be initi-ated as soon as possible, but no later than 48 hours after the leak is discovered. Adequate records must bekept of all inspections, leaks, and actions taken for 3 years after disposal of the component. Combustiblematerials must be kept a minimum of 5 m from a PCB transformer and its enclosure.
© 2007 by Taylor & Francis Group, LLC

Safety and Protection Systems
363
As of October 1, 1990, the use of PCB transformers (500 ppm or greater) was prohibited in or nearcommercial buildings with secondary voltages of 480 Vac or higher. The use of radial PCB transformerswas allowed if certain electrical protection was provided.
The EPA regulations also require that the operator notify others of the possible dangers. All PCBtransformers (including those in storage for reuse) must be registered with the local fire department.Supply the following information:
• The location of the PCB transformer(s).• Address(es) of the building(s). For outdoor PCB transformers, provide the outdoor location.• Principal constituent of the dielectric fluid in the transformer(s).• Name and telephone number of the contact person in the event of a fire involving the equipment.
Any PCB transformers used in a commercial building must be registered with the building owner.All owners of buildings within 30 m of such PCB transformers also must be notified. In the event of afire-related incident involving the release of PCBs, immediately notify the Coast Guard National SpillResponse Center at 1-800-424-8802. Also take appropriate measures to contain and control any possiblePCB release into water.
Table 24.5
Definition of PCB Terms as Identified by the EPA
Term Definition
PCB Any chemical substance that is limited to the biphenyl molecule that has been chlorinated to varying degrees, or any combination of substances that contain such substances.
PCB dielectric fluids, PCB heat-transfer fluids, PCB hydraulic fluids, 2,2',4-trichlorobiphenyl
PCB article Any manufactured article, other than a PCB container, that contains PCBs and whose surface has been in direct contact with PCBs.
Capacitors, transformers, electric motors, pumps, pipes
PCB container A device used to contain PCBs or PCB articles, and whose surface has been in direct contact with PCBs.
Packages, cans, bottles, bags, barrels, drums, tanks
PCB article container A device used to contain PCB articles or equipment, and whose surface has not been in direct contact with PCBs.
Packages, cans, bottles, bags, barrels, drums, tanks
PCB equipment Any manufactured item, other than a PCB container or PCB article container, which contains a PCB article or other PCB equipment.
Microwave ovens, fluorescent light ballasts, electronic equipment
PCB item Any PCB article, PCB article container, PCB container, or PCB equipment that deliberately or unintentionally contains, or has as a part of it, any PCBs.
See PCB article, PCB article container, PCB container, and PCB equipment
PCB transformer Any transformer that contains PCBs in concentrations of 500 ppm or greater.
High-power transformers
PCB contaminated Any electric equipment that contains more than 50 ppm, but less than 500 ppm, of PCBs. (Oil-filled electric equipment other than circuit breakers, reclosers, and cable whose PCB concentration is unknown must be assumed to be PCB-contaminated electric equipment.)
Transformers, capacitors, circuit breakers, reclosers, voltage regulators, switches, cable, electromagnets
© 2007 by Taylor & Francis Group, LLC

364
AC Power Systems Handbook
Capacitors are divided into two size classes:
large
and
small
. The following are guidelines for classifi-cation:
• A PCB small capacitor contains less than 1.36 kg (3 lb) dielectric fluid. A capacitor having lessthan 100 in
3
also is considered to contain less than 3 lb dielectric fluid.• A PCB large capacitor has a volume of more than 200 in
3
and is considered to contain more than3 lb dielectric fluid. Any capacitor having a volume from 100 to 200 in
3
is considered to contain3 lb dielectric, provided the total weight is less than 9 lb.
• A PCB large low-voltage capacitor contains 3 lb or more dielectric fluid and operates below 2 kV.• A PCB large high-voltage capacitor contains 3 lb or more dielectric fluid and operates at 2 kV or
greater voltages.
The use, servicing, and disposal of PCB small capacitors is not restricted by the EPA unless there isa leak. In that event, the leak must be repaired or the capacitor disposed of. Disposal can be performedby an approved incineration facility, or the component can be placed in a specified container and buriedin an approved chemical waste landfill. Currently, chemical waste landfills are only for disposal of liquidscontaining 50 to 500 ppm PCBs and for solid PCB debris. Items such as capacitors that are leaking oilcontaining greater than 500 ppm PCBs should be taken to an EPA-approved PCB disposal facility.
24.3.4 Identifying PCB Components
The first task for the facility manager is to identify any PCB items on the premises. Equipment built after1979 probably does not contain any PCB-filled devices. Even so, inspect all capacitors, transformers, andpower switches to be sure. A call to the manufacturer also may help. Older equipment (pre-1979) is morelikely to contain PCB transformers and capacitors. A liquid-filled transformer usually has cooling fins,and the nameplate may provide useful information about its contents. If the transformer is unlabeled orthe fluid is not identified, it must be treated as a PCB transformer. Untested (not analyzed) mineral-oil-filled transformers are assumed to contain at least 50 ppm, but less than 500 ppm, PCBs. This placesthem in the category of PCB-contaminated electric equipment, which has different requirements thanPCB transformers. Older high-voltage systems are likely to include both large and small PCB capacitors.Equipment rectifier panels, exciter/modulators, and power-amplifier cabinets may contain a significantnumber of small capacitors. In older equipment, these capacitors often are Askarel-filled. Unless leaking,these devices pose no particular hazard. If a leak does develop, follow proper disposal techniques. Also,liquid-cooled rectifiers may contain Askarel. Even though their use is not regulated, treat them as a PCBarticle, as if they contain at least 50 ppm PCBs. Never make assumptions about PCB contamination;check with the manufacturer to be sure.
Any PCB article or container being stored for disposal must be date-tagged when removed andinspected for leaks every 30 days. It must be removed from storage and disposed of within 1 year from thedate it was placed in storage. Items being stored for disposal must be kept in a storage facility meeting therequirements of 40 Code of Federal Regulations (CFR), Part 761.65(b)(1) unless they fall under alterna-tive regulation provisions. There is a difference between PCB items stored for disposal and those storedfor reuse. Once an item has been removed from service and tagged for disposal, it cannot be returned toservice.
24.3.5 Labeling PCB Components
After identifying PCB devices, proper labeling is the second step that must be taken by the facility man-ager. PCB article containers, PCB transformers, and large high-voltage capacitors must be marked with astandard 6-in.
×
6-in. large marking label (ML) as shown in Figure 24.8. Equipment containing thesetransformers or capacitors also should be marked. PCB large low-voltage (less than 2 kV) capacitors neednot be labeled until removed from service. If the capacitor or transformer is too small to hold the largelabel, a smaller 1-in.
×
2-in. label is approved for use. Labeling each PCB small capacitor is not required.
© 2007 by Taylor & Francis Group, LLC

Safety and Protection Systems
365
However, any equipment containing PCB small capacitors should be labeled on the outside of the cabinetor on access panels. Properly label any spare capacitors and transformers that fall under the regulations.Identify with the large label any doors, cabinet panels, or other means of access to PCB transformers. Thelabel must be placed so that it can be read easily by firefighters. All areas used to store PCBs and PCBitems for disposal must be marked with the large (6-in.
×
6-in.) PCB label.
24.3.6 Record-Keeping
Inspections are a critical component in the management of PCBs. EPA regulations specify a number ofsteps that must be taken and the information that must recorded. Table 24.6 summarizes the schedulerequirement, and Table 24.7 can be used as a checklist for each transformer inspection. This record mustbe retained for 3 years. In addition to the inspection records, some facilities may need to maintain anannual report. This report details the number of PCB capacitors, transformers, and other PCB items onthe premises. The report must contain the dates when the items were removed from service, their dispo-sition, and detailed information regarding their characteristics. Such a report must be prepared if thefacility uses or stores at least one PCB transformer containing greater than 500 ppm PCBs, 50 or morePCB large capacitors, or at least 45 kg of PCBs in PCB containers. Retain the report for 5 years after thefacility ceases using or storing PCBs and PCB items in the prescribed quantities. Table 24.8 lists the infor-mation required in the annual PCB report.
Figure 24.8 Marking label (ML) used to identify PCB transformers and PCB large capacitors.
Table 24.6 The Inspection Schedule Required for PCB Transformers and Other Contaminated Devices
PCB Transformers Standard PCB transformer Quarterly
If full-capacity impervious dike is added
Annually
If retrofitted to < 60,000 ppm PCB Annually
If leak is discovered, clean up ASAP (retain these records for 3 years)
Daily
PCB article or container stored for disposal (remove and dispose of within 1 year) Monthly
Retain all records for 3 years after disposing of transformers.
© 2007 by Taylor & Francis Group, LLC

366 AC Power Systems Handbook
24.3.7 Disposal
Disposing of PCBs is not a minor consideration. Before contracting with a company for PCB disposal,verify its license with the area EPA office. That office also can supply background information on thecompany’s compliance and enforcement history.
The fines levied for improper disposal are not mandated by federal regulations. Rather, the local EPAadministrator, usually in consultation with local authorities, determines the cleanup procedures andcosts. Civil penalties for administrative complaints issued for violations of the PCB regulations are deter-mined according to a matrix provided in the PCB penalty policy. This policy, published in the FederalRegister, considers the amount of PCBs involved and the potential for harm posed by the violation.
24.3.8 Proper Management
Properly managing the PCB risk is not difficult. The keys are to understand the regulations and to followthem carefully. A PCB management program should include the following steps:
Table 24.7 Inspection Checklist for PCB Components
Transformer location:
Date of visual inspection:
Leak discovered? (Yes/No):
If yes, date discovered (if different from inspection date):
Location of leak:
Person performing inspection:
Estimate of the amount of dielectric fluid released from leak:
Date of cleanup, containment, repair, or replacement:
Description of cleanup, containment, or repair performed:
Results of any containment and daily inspection required for uncorrected active leaks:
Table 24.8 Required Information for PCB Annual Report
I. PCB device background information:
a. Dates when PCBs and PCB items are removed from service.
b. Dates when PCBs and PCB items are placed into storage for disposal and are placed into transport for disposal.
c. The quantities of the items removed from service, stored, and placed into transport are to be indicated using the following breakdown:
(1) Total weight, in kilograms, of any PCB and PCB items in PCB containers, including identification of container contents (such as liquids and capacitors).
(2) Total number of PCB transformers and total weight, in kilograms, of any PCBs contained in the transformers.
(3) Total number of PCB large high- or low-voltage capacitors.
II. The location of the initial disposal or storage facility for PCBs and PCB items removed from service, and the name of the facility owner or operator.
III. Total quantities of PCBs and PCB items remaining in service at the end of calendar year per the following breakdown:
a. Total weight, in kilograms, of any PCB and PCB items in PCB containers, including the identification of container contents (such as liquids and capacitors).
b. Total number of PCB transformers and total weight, in kilograms, of any PCBs contained in the transformers.
c. Total number of PCB large high- or low-voltage capacitors.
© 2007 by Taylor & Francis Group, LLC

Safety and Protection Systems 367
• Locate and identify all PCB devices. Check all stored or spare devices.• Properly label PCB transformers and capacitors according to EPA requirements.• Perform the required inspections, and maintain an accurate log of PCB items, their location,
inspection results, and actions taken. These records must be maintained for 3 years after disposalof the PCB component.
• Complete the annual report of PCBs and PCB items by July 1 of each year. This report must beretained for 5 years.
• Arrange for any necessary disposal through a company licensed to handle PCBs. If there are anydoubts about the company’s license, contact the EPA.
• Report the location of all PCB transformers to the local fire department and owners of any nearbybuildings.
The importance of following the EPA regulations cannot be overstated.
24.4 OSHA Safety Requirements
The federal government has taken a number of steps to help improve safety within the workplace. OSHA,for example, helps industries to monitor and correct safety practices. The agency's records show that elec-trical standards are among the most frequently violated of all safety standards. Table 24.9 lists 16 of themost common electrical violations, which include these areas:
• Protective covers• Identification and marking• Extension cords• Grounding
Table 24.9 Sixteen Common OSHA Violations (After [3].)
Fact Sheet No. Subject NEC Reference
1 Guarding of live parts 110-17
2 Identification 110-22
3 Uses allowed for flexible cord 400-7
4 Prohibited uses of flexible cord 400-8
5 Pull at joints and terminals must be prevented 400-10
6-1 Effective grounding, Part 1 250-51
6-2 Effective grounding, Part 2 250-51
7 Grounding of fixed equipment, general 250-42
8 Grounding of fixed equipment, specific 250-43
9 Grounding of equipment connected by cord and plug 250-45
10 Methods of grounding, cord and plug-connected equipment 250-59
11 AC circuits and systems to be grounded 250-5
12 Location of overcurrent devices 240-24
13 Splices in flexible cords 400-9
14 Electrical connections 110-14
15 Marking equipment 110-21
16 Working clearances about electric equipment 110-16
© 2007 by Taylor & Francis Group, LLC

368 AC Power Systems Handbook
24.4.1 Protective Covers
Exposure of live conductors is a common safety violation. All potentially dangerous electric conductorsshould be covered with protective panels. The danger is that someone can come into contact with theexposed, current-carrying conductors. It also is possible for metallic objects such as ladders, cable, ortools to contact a hazardous voltage, creating a life-threatening condition. Open panels also present a firehazard.
24.4.2 Identification and Marking
Properly identify and label all circuit breakers and switch panels. The labels for breakers and equipmentswitches may be years old and may no longer describe the equipment that is actually in use. This confu-sion poses a safety hazard. Improper labeling of the circuit panel can lead to unnecessary damage — orworse, casualties — if the only person who understands the system is unavailable in an emergency. Ifthere are a number of devices connected to a single disconnect switch or breaker, provide a diagram ordrawing for clarification. Label with brief phrases, and use clear, permanent, and legible markings.
Equipment marking is a closely related area of concern. This is not the same thing as equipmentidentification. Marking equipment means labeling the equipment breaker panels and ac disconnectswitches according to device rating. Breaker boxes should contain a nameplate showing the manufacturername, rating, and other pertinent electrical factors. The intent of this rule is to prevent devices frombeing subjected to excessive loads or voltages.
24.4.3 Extension Cords
Extension (flexible) cords often are misused. Although it may be easy to connect a new piece of equip-ment with a flexible cord, be careful. The National Electrical Code lists only eight approved uses for flexi-ble cords.
The use of a flexible cord where the cable passes through a hole in the wall, ceiling, or floor is anoften-violated rule. Running the cord through doorways, windows, or similar openings also is prohib-ited. A flexible cord should not be attached to building surfaces or concealed behind building walls orceilings. These common violations are illustrated in Figure 24.9.
Along with improper use of flexible cords, failure to provide adequate strain relief on connectors is acommon problem. Whenever possible, use manufactured cable connections.
24.4.4 Grounding
OSHA regulations describe two types of grounding: system grounding and equipment grounding. Systemgrounding actually connects one of the current-carrying conductors (such as the terminals of a supplytransformer) to ground. (See Figure 24.10.) Equipment grounding connects all the noncurrent-carryingmetal surfaces together and to ground. From a grounding standpoint, the only difference between agrounded electrical system and an ungrounded electrical system is that the main-bonding jumper fromthe service equipment ground to a current-carrying conductor is omitted in the ungrounded system.
The system ground performs two tasks:
• It provides the final connection from equipment-grounding conductors to the grounded circuitconductor, thus completing the ground-fault loop.
• It solidly ties the electrical system and its enclosures to their surroundings (usually earth, structuralsteel, and plumbing). This prevents voltages at any source from rising to harmfully high voltage-to-ground levels.
It should be noted that equipment grounding — bonding all electric equipment to ground — isrequired whether or not the system is grounded. System grounding should be handled by the electricalcontractor installing the power feeds.
© 2007 by Taylor & Francis Group, LLC

Safety and Protection Systems 369
Equipment grounding serves two important functions:
• It bonds all surfaces together so that there can be no voltage differences among them.• It provides a ground-fault current path from a fault location back to the electrical source, so that
if a fault current develops, it will operate the breaker, fuse, or GFCI.
The National Electrical Code is complex, and it contains numerous requirements concerning electri-cal safety. If the facility electric wiring system has gone through many changes over the years, have theentire system inspected by a qualified consultant. The fact sheets listed in Table 24.9 provide a good start-ing point for a self-evaluation. The fact sheets are available from any local OSHA office.
24.4.5 Management Responsibility
The key to operating a safe facility is diligent management. A carefully thought-out plan ensures a coor-dinated approach to protecting staff members from injury and the facility from potential litigation. Facil-ities that have effective accident-prevention programs follow seven basic guidelines. Although the detailsand overall organization may vary from workplace to workplace, these practices — summarized in Table24.10 — still apply.
If managers are concerned about safety, it is likely that employees also will be. Display safety pam-phlets, and recruit employee help in identifying hazards. Reward workers for good safety performance.
Figure 24.9 Flexible cord uses prohibited under NEC rules.
Figure 24.10 Even though regulations have been in place for many years, OSHA inspections still uncover violationsin the grounding of primary electrical service systems.
Newoutlet
Existingoutlet
As a substitutefor fixed wiring
Through walls, ceilings,floors, doors or windows
Where concealed
Where attachedto building surface
120 V
Transformer secondary (typical)
120 V 120 V
120 V
System ground ∗Main bonding jumpers required in grounded systems
Equipment ground (system not grounded)
three-phase 208 V
Sevice equipment (typical)
three-phase 240 V or 480 V
∗MBJ
120 V
∗MBJ
© 2007 by Taylor & Francis Group, LLC

370 AC Power Systems Handbook
Often, an incentive program will help to encourage safe work practices. Eliminate any hazards identified,and obtain OSHA forms and any first aid supplies that would be needed in an emergency. The OSHAHandbook for Small Business outlines the legal requirements imposed by the Occupational Safety andHealth Act of 1970. The handbook, which is available from OSHA, also suggests ways in which a com-pany can develop an effective safety program.
Free on-site consultations also are available from OSHA. A consultant will tour the facility andoffer practical advice about safety. These consultants do not issue citations, propose penalties, or rou-tinely provide information about workplace conditions to the federal inspection staff. Contact thenearest OSHA office for additional information. Table 24.11 provides a basic checklist of safety pointsfor consideration.
Table 24.10 Major Points to Consider when Developing a Facility Safety Program
✓ Management assumes the leadership role regarding safety policies.
✓ Responsibility for safety- and health-related activities is clearly assigned.
✓ Hazards are identified, and steps are taken to eliminate them.
✓ Employees at all levels are trained in proper safety procedures.
✓ Thorough accident/injury records are maintained.
✓ Medical attention and first aid is readily available.
✓ Employee awareness and participation is fostered through incentives and an ongoing, high-profile approach to workplace safety.
Table 24.11 Sample Checklist of Important Safety Items
Refer regularly to this checklist to maintain a safe facility. For each category shown, be sure that:
Electrical Safety
✓ Fuses of the proper size have been installed.
✓ All ac switches are mounted in clean, tightly closed metal boxes.
✓ Each electrical switch is marked to show its purpose.
✓ Motors are clean and free of excessive grease and oil.
✓ Motors are maintained properly and provided with adequate overcurrent protection.
✓ Bearings are in good condition.
✓ Portable lights are equipped with proper guards.
✓ All portable equipment is double-insulated or properly grounded.
✓ The facility electrical system is checked periodically by a contractor competent in the NEC.
✓ The equipment-grounding conductor or separate ground wire has been carried all the way back to the supply ground connection.
✓ All extension cords are in good condition, and the grounding pin is not missing or bent.
✓ Ground-fault interrupters are installed as required.
Exits and Access
✓ All exits are visible and unobstructed.
✓ All exits are marked with a readily visible, properly illuminated sign.
✓ There are sufficient exits to ensure prompt escape in the event of an emergency.
Fire Protection
✓ Portable fire extinguishers of the appropriate type are provided in adequate numbers.
✓ All remote vehicles have proper fire extinguishers.
✓ Fire extinguishers are inspected monthly for general condition and operability, which is noted on the inspection tag.
✓ Fire extinguishers are mounted in readily accessible locations.
✓ The fire alarm system is tested annually.
© 2007 by Taylor & Francis Group, LLC

Safety and Protection Systems 371
Maintaining safety standards is difficult in any size organization. A written safety manual that hasspecific practices and procedures for normal workplace hazards as well as the emergency-related hazardsyou identify is a good idea and may lower your insurance rates [4]. If outside workers set foot in yourfacility, prepare a special Safety Manual for Contractors. Include in it installation standards, compliancewith Lock-Out/Tag-Out, and emergency contact names, and phone numbers. Lock-Out/Tag-Out is a set ofstandard safety policies that assure that energy is removed from equipment during installation and main-tenance. It assures that every member of a work detail is clear before power is reapplied. Make sure out-side contractors carry proper insurance and are qualified, licensed, or certified to do the work for whichyou contract.
24.5 References
1. Federal Information Processing Standards Publication No. 94, Guideline on Electrical Power forADP Installations, U.S. Department of Commerce, National Bureau of Standards, Washington, DC,1983.
2. Practical Guide to Ground Fault Protection, PRIMEDIA Intertec, Overland Park, KS, 1995.3. National Electrical Code, NFPA no. 70.4. Rudman, R., “Disaster Planning and Recovery,” in The Electronics Handbook, 2nd ed., J. C. Whitaker
(Ed.), CRC Press, Boca Raton, FL, 2005.
24.6 Bibliography
Code of Federal Regulations, 40, Part 761.“Current Intelligence Bulletin #45,” National Institute for Occupational Safety and Health Division of
Standards Development and Technology Transfer, February 24, 1986.“Electrical Standards Reference Manual,” U.S. Department of Labor, Washington, DC.Hammar, W., Occupational Safety Management and Engineering, Prentice-Hall, New York.Lawrie, R., Electrical Systems for Computer Installations, McGraw-Hill, New York, 1988.Pfrimmer, J., “Identifying and Managing PCBs in Broadcast Facilities,” NAB Engineering Conference
Proceedings, National Association of Broadcasters, Washington, DC, 1987.“Occupational Injuries and Illnesses in the United States by Industry,” OSHA Bulletin 2278, U.S. Depart-
ment of Labor, Washington, DC, 1985.OSHA, “Handbook for Small Business,” U.S. Department of Labor, Washington, DC. OSHA, “Electrical Hazard Fact Sheets,” U.S. Department of Labor, Washington, DC, January 1987.
© 2007 by Taylor & Francis Group, LLC

373
25
Reference Data and
Tables
25.1 Standard Electrical Units
Name
Symbol
Quantity
ampere A electric current
ampere per meter A/m magnetic field strength
ampere per square meter A/m
2
current density
becquerel Bg activity (of a radionuclide)
candela cd luminous intensity
coulomb C electric charge
coulomb per kilogram C/kg exposure (x and gamma rays)
coulomb per square meter C/m
2
electric flux density
cubic meter m
3
volume
cubic meter per kilogram m
3
/kg specific volume
degree Celsius °C Celsius temperature
farad F capacitance
farad per meter F/m permittivity
henry H inductance
henry per meter H/m permeability
hertz Hz frequency
joule J energy, work, quantity of heat
joule per cubic meter J/m
3
energy density
joule per Kelvin J/K heat capacity
joule per kilogram K J/(kg•K) specific heat capacity
joule per mole J/mol molar energy
Kelvin K thermodynamic temperature
kilogram kg mass
kilogram per cubic meter kg/m
3
density, mass density
lumen lm luminous flux
lux lx luminance
meter m length
meter per second m/s speed, velocity
meter per second squared m/s
2
acceleration
mole mol amount of substance
newton N force
newton per meter N/m surface tension
ohm
Ω
electrical resistance
pascal Pa pressure, stress
pascal second Pa•s dynamic viscosity
radian rad plane angle
radian per second rad/s angular velocity
radian per second squared rad/s
2
angular acceleration
second s time
siemens S electrical conductance
© 2007 by Taylor & Francis Group, LLC

374
AC Power Systems Handbook
25.1.1 Standard Prefixes
square meter m
2
area
steradian sr solid angle
tesla T magnetic flux density
volt V electrical potential
volt per meter V/m electric field strength
watt W power, radiant flux
watt per meter Kelvin W/(m•K) thermal conductivity
watt per square meter W/m
2
heat (power) flux density
weber Wb magnetic flux
Multiple
Prefix
Symbol
10
18
exa E
10
15
peta P
10
12
tera T
10
9
giga G
10
6
mega M
10
3
kilo k
10
2
hecto h
10 deka da
10
-1
deci d
10
-2
centi c
10
-3
milli m
10
-6
micro
μ
10
-9
nano n
10
-12
pico p
10
-15
femto f
10
-18
atto a
Name
Symbol
Quantity
© 2007 by Taylor & Francis Group, LLC

Reference Data and Tables
375
25.1.2 Common Standard Units
Unit
Symbol
centimeter cm
cubic centimeter cm
3
cubic meter per second m
3
/s
gigahertz GHz
gram g
kilohertz kHz
kilohm k
Ω
kilojoule kJ
kilometer km
kilovolt kV
kilovoltampere kVA
kilowatt kW
megahertz MHz
megavolt MV
megawatt MW
megohm M
Ω
microampere
μ
A
microfarad
μ
F
microgram
μ
g
microhenry
μ
H
microsecond
μ
s
microwatt
μ
W
milliampere mA
milligram mg
millihenry mH
millimeter mm
millisecond ms
millivolt mV
milliwatt mW
nanoampere nA
nanofarad nF
nanometer nm
nanosecond ns
nanowatt nW
picoampere pA
picofarad pF
picosecond ps
picowatt pW
© 2007 by Taylor & Francis Group, LLC

376
AC Power Systems Handbook
25.2 Reference Tables
25.2.1 Power Conversion Factors
dBm
dBw
Watts
Multiple
Prefix
+150 +120 1,000,000,000,000 10
12
1 terawatt+140 +110 100,000,000,000 10
11
100 gigawatts+130 +100 10,000,000,000 10
10
10 gigawatts+120 +90 1,000,000,000 10
9
1 gigawatt+110 +80 100,000,000 10
8
100 megawatts+100 +70 10,000,000 10
7
10 megawatts+90 +60 1,000,000 10
6
1 megawatt+80 +50 100,000 10
5
100 kilowatts+70 +40 10,000 10
4
10 kilowatts+60 +30 1,000 10
3
1 kilowatt+50 +20 100 10
2
1 hectrowatt+40 +10 10 10 1 decawatt+30 0 1 1 1 watt+20 –
10
0.1 10
–1
1 deciwatt+10 –
20
0.01 10
–2
1 centiwatt0 –
30
0.001 10
–3
1 milliwatt–10 –
40
0.0001 10
–4
100 microwatts–20 –
50
0.00001 10
–5
10 microwatts–30 –
60
0.000,001 10
–6
1 microwatt–40 –
70
0.0,000,001 10
–7
100 nanowatts–50 –
80
0.00,000,001 10
–8
10 nanowatts–60 –
90
0.000,000,001 10
–9
1 nanowatt–70 –
100
0.0,000,000,001 10
–10
100 picowatts–80 –
110
0.00,000,000,001 10
–11
10 picowatts–90 –
120
0.000,000,000,001 10
–12
1 picowatt
© 2007 by Taylor & Francis Group, LLC

Reference Data and Tables
377
25.2.2 Standing Wave Ratio
SWRReflection
Coefficient
Return Loss
Power Ratio
Percent Reflected
1.01:1 0.0050 46.1 dB 0.00002 0.0021.02:1 0.0099 40.1 dB 0.00010 0.0101.04:1 0.0196 34.2 dB 0.00038 0.0381.06:1 0.0291 30.7 dB 0.00085 0.0851.08:1 0.0385 28.3 dB 0.00148 0.1481.10:1 0.0476 26.4 dB 0.00227 0.2271.20:1 0.0909 20.8 dB 0.00826 0.8261.30:1 0.1304 17.7 dB 0.01701 1.7001.40:1 0.1667 15.6 dB 0.02778 2.8001.50:1 0.2000 14.0 dB 0.04000 4.0001.60:1 0.2308 12.7 dB 0.05325 5.3001.70:1 0.2593 11.7 dB 0.06722 6.7001.80:1 0.2857 10.9 dB 0.08163 8.2001.90:1 0.3103 10.2 dB 0.09631 9.6002.00:1 0.3333 9.5 dB 0.11111 11.1002.20:1 0.3750 8.5 dB 0.14063 14.1002.40:1 0.4118 7.7 dB 0.16955 17.0002.60:1 0.4444 7.0 dB 0.19753 19.8002.80:1 0.4737 6.5 dB 0.22438 22.4003.00:1 0.5000 6.0 dB 0.25000 25.0003.50:1 0.5556 5.1 dB 0.30864 30.9004.00:1 0.6000 4.4 dB 0.36000 36.0004.50:1 0.6364 3.9 dB 0.40496 40.5005.00:1 0.6667 3.5 dB 0.44444 44.4006.00:1 0.7143 2.9 dB 0.51020 51.0007.00:1 0.7500 2.5 dB 0.56250 56.3008.00:1 0.7778 2.2 dB 0.60494 60.5009.00:1 0.8000 1.9 dB 0.64000 64.000
10.00:1 0.8182 1.7 dB 0.66942 66.90015.00:1 0.8750 1.2 dB 0.76563 76.60020.00:1 0.9048 0.9 dB 0.81859 81.90030.00:1 0.9355 0.6 dB 0.87513 97.50040.00:1 0.9512 0.4 dB 0.90482 90.50050.00:1 0.9608 0.3 dB 0.92311 92.300
© 2007 by Taylor & Francis Group, LLC

378
AC Power Systems Handbook
25.2.3 Specifications of Standard Copper Wire Sizes
Wire Size
(AWG)Diameter
(mils)Circular
mil Area
Turns per Linear Inch
1
Ohms per
100 ft
2
Current-Carrying
Capacity
3
Diameter
(mm)
Enamel
SCE
DCC
1 289.3 83810 — — — 0.1239 119.600 7.3482 257.6 05370 — — — 0.1563 94.800 6.5443 229.4 62640 — — — 0.1970 75.200 5.8274 204.3 41740 — — — 0.2485 59.600 5.1895 181.9 33100 — — — 0.3133 47.300 4.6216 162.0 26250 — — — 0.3951 37.500 4.1157 144.3 20820 — — — 0.4982 29.700 3.6658 128.5 16510 7.6 — 7.1 0.6282 23.600 3.2649 114.4 13090 8.6 — 7.8 0.7921 18.700 2.906
10 101.9 10380 9.6 9.1 8.9 0.9989 14.800 2.58811 90.7 8234 10.7 — 9.8 1.2600 11.800 2.30512 80.8 6530 12.0 11.3 10.9 1.5880 9.330 2.06313 72.0 5178 13.5 — 12.8 2.0030 7.400 1.82814 64.1 4107 15.0 14.0 13.8 2.5250 5.870 1.62815 57.1 3257 16.8 — 14.7 3.1840 4.650 1.45016 50.8 2583 18.9 17.3 16.4 4.0160 3.690 1.29117 45.3 2048 21.2 — 18.1 5.0640 2.930 1.15018 40.3 1624 23.6 21.2 19.8 6.3860 2.320 1.02419 35.9 1288 26.4 — 21.8 8.0510 1.840 0.91220 32.0 1022 29.4 25.8 23.8 10.1500 1.460 0.81221 28.5 810 33.1 — 26.0 12.8000 1.160 0.72322 25.3 642 37.0 31.3 30.0 16.1400 0.918 0.64423 22.6 510 41.3 — 37.6 20.3600 0.728 0.57324 20.1 404 46.3 37.6 35.6 25.6700 0.577 0.51125 17.9 320 51.7 — 38.6 32.3700 0.458 0.45526 15.9 254 58.0 46.1 41.8 40.8100 0.363 0.40627 14.2 202 64.9 — 45.0 51.4700 0.288 0.36128 12.6 160 72.7 54.6 48.5 64.9000 0.228 0.32129 11.3 127 81.6 — 51.8 81.8300 0.181 0.28630 10.0 101 90.5 64.1 55.5 103.2000 0.144 0.25531 8.9 50 101.0 — 59.2 130.1000 0.114 0.22732 8.0 63 113.0 74.1 61.6 164.1000 0.090 0.20233 7.1 50 127.0 — 66.3 206.9000 0.072 0.18034 6.3 40 143.0 86.2 70.0 260.9000 0.057 0.16035 5.6 32 158.0 — 73.5 329.0000 0.045 0.14336 5.0 25 175.0 103.1 T7.0 414.8000 0.036 0.12737 4.5 20 198.0 — 80.3 523.1000 0.028 0.11338 4.0 16 224.0 116.3 83.6 659.6000 0.022 0.10139 3.5 12 248.0 — 86.6 831.8000 0.018 0.090
1. Based on 25.4 mm.2. Ohms per 1000 ft measured at 20°C.3. Current-carrying capacity at 700 cm/amp.
© 2007 by Taylor & Francis Group, LLC
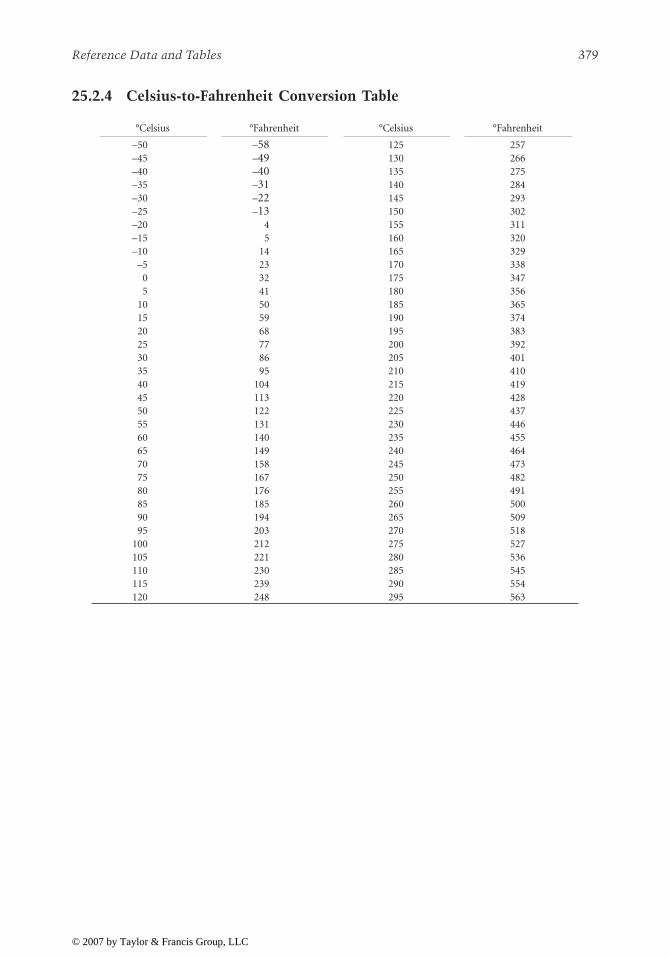
Reference Data and Tables
379
25.2.4 Celsius-to-Fahrenheit Conversion Table
°Celsius
°Fahrenheit
°Celsius
°Fahrenheit
–50 –
58
125 257–45 –
49
130 266–40 –
40
135 275–35 –
31
140 284–30 –
22
145 293–25 –
13
150 302–20 4 155 311–15 5 160 320–10 14 165 329
–5 23 170 3380 32 175 3475 41 180 356
10 50 185 36515 59 190 37420 68 195 38325 77 200 39230 86 205 40135 95 210 41040 104 215 41945 113 220 42850 122 225 43755 131 230 44660 140 235 45565 149 240 46470 158 245 47375 167 250 48280 176 255 49185 185 260 50090 194 265 50995 203 270 518
100 212 275 527105 221 280 536110 230 285 545115 239 290 554120 248 295 563
© 2007 by Taylor & Francis Group, LLC

380
AC Power Systems Handbook
25.2.5 Inch-to-Millimeter Conversion Table
Inch
0
1/8
1/4
3/8
1/2
5/8
3/4
7/8
Inch
0 0.00 3.18 6.35 9.52 12.70 15.88 19.05 22.22 01 25.40 28.58 31.75 34.92 38.10 41.28 44.45 47.62 12 50.80 53.98 57.15 60.32 63.50 66.68 69.85 73.02 23 76.20 79.38 82.55 85.72 88.90 92.08 95.25 98.42 34 101.60 104.80 108.00 111.10 114.30 117.50 120.60 123.80 45 127.00 130.20 133.40 136.50 139.70 142.90 146.00 149.20 56 152.40 155.60 158.80 161.90 165.10 168.30 171.40 174.60 67 177.80 181.00 184.20 187.30 190.50 193.70 196.80 200.00 78 203.20 206.40 209.60 212.70 215.90 219.10 222.20 225.40 89 228.60 231.80 235.00 238.10 241.30 244.50 247.60 250.80 9
10 254.00 257.20 260.40 263.50 266.70 269.90 273.00 276.20 1011 279.00 283.00 286.00 289.00 292.00 295.00 298.00 302.00 1112 305.00 308.00 311.00 314.00 317.00 321.00 324.00 327.00 1213 330.00 333.00 337.00 340.00 343.00 346.00 349.00 352.00 1314 356.00 359.00 362.00 365.00 368.00 371.00 375.00 378.00 1415 381.00 384.00 387.00 391.00 394.00 397.00 400.00 403.00 1516 406.00 410.00 413.00 416.00 419.00 422.00 425.00 429.00 1617 432.00 435.00 438.00 441.00 445.00 448.00 451.00 454.00 1718 457.00 460.00 464.00 467.00 470.00 473.00 476.00 479.00 1819 483.00 486.00 489.00 492.00 495.00 498.00 502.00 505.00 1920 508.00 511.00 514.00 518.00 521.00 524.00 527.00 530.00 20
© 2007 by Taylor & Francis Group, LLC

Reference Data and Tables
381
25.2.6 Conversion of Millimeters to Decimal Inches
mm
Inches
mm
Inches
mm
Inches
1 0.039370 46 1.811020 91 3.5826702 0.078740 47 1.850390 92 3.6220403 0.118110 48 1.889760 93 3.6614104 0.157480 49 1.929130 94 3.7007805 0.196850 50 1.968500 95 3.7401506 0.236220 51 2.007870 96 3.7795207 0.275590 52 2.047240 97 3.8188908 0.314960 53 2.086610 98 3.8582609 0.354330 54 2.125980 99 3.897630
10 0.393700 55 2.165350 100 3.93700011 0.433070 56 2.204720 105 4.13384812 0.472440 57 2.244090 110 4.33070013 0.511810 58 2.283460 115 4.52755014 0.551180 59 2.322830 120 4.72440015 0.590550 60 2.362200 125 4.92125016 0.629920 61 2.401570 210 8.26770017 0.669290 62 2.440940 220 8.66140018 0.708660 63 2.480310 230 9.05510019 0.748030 64 2.519680 240 9.44880020 0.787400 65 2.559050 250 9.84250021 0.826770 66 2.598420 260 10.23620022 0.866140 67 2.637790 270 10.62990023 0.905510 68 2.677160 280 11.03260024 0.944880 69 2.716530 290 11.41730025 0.984250 70 2.755900 300 11.81100026 1.023620 71 2.795270 310 12.20470027 1.062990 72 2.834640 320 12.59840028 1.102360 73 2.874010 330 12.99210029 1.141730 74 2.913380 340 13.38580030 1.181100 75 2.952750 350 13.77950031 1.220470 76 2.992120 360 14.17320032 1.259840 77 3.031490 370 14.56690033 1.299210 78 3.070860 380 14.96060034 1.338580 79 3.110230 390 15.35430035 1.377949 80 3.149600 400 15.74800036 1.417319 81 3.188970 500 19.68500037 1.456689 82 3.228340 600 23.62200038 1.496050 83 3.267710 700 27.55900039 1.535430 84 3.307080 800 31.49600040 1.574800 85 3.346450 900 35.43300041 1.614170 86 3.385820 1000 39.37000042 1.653540 87 3.425190 2000 78.74000043 1.692910 88 3.464560 3000 118.11000044 1.732280 89 3.503903 4000 157.48000045 1.771650 90 3.543300 5000 196.850000
© 2007 by Taylor & Francis Group, LLC

382
AC Power Systems Handbook
25.2.7 Conversion of Common Fractions to Decimal and Millimeter Units
Common
FractionsDecimal
Fractions
mm (approx.)Common
FractionsDecimal
Fractions
mm (appox.)
1/128 0.008 0.20 1/2 0.500 12.70 1/64 0.016 0.40 33/64 0.516 13.101/32 0.031 0.79 17/32 0.531 13.493/64 0.047 1.19 35/64 0.547 13.891/16 0.063 1.59 9/16 0.563 14.295/64 0.078 1.98 37/64 0.578 14.683/32 0.094 2.38 19/32 0.594 15.087/64 0.109 2.78 39/64 0.609 15.481/8 0.125 3.18 5/8 0.625 15.88
9/64 0.141 3.57 41/64 0.641 16.275/32 0.156 3.97 21/32 0.656 16.67
11/64 0.172 4.37 43/64 0.672 17.073/16 0.188 4.76 11/16 0.688 17.46
13/64 0.203 5.16 45/64 0.703 17.867/32 0.219 5.56 23/32 0.719 18.26
15/64 0.234 5.95 47/64 0.734 18.651/4 0.250 6.35 3/4 0.750 19.05
17/64 0.266 6.75 49/64 0.766 19.459/32 0.281 7.14 25/32 0.781 19.84
19/64 0.297 7.54 51/64 0.797 20.245/16 0.313 7.94 13/16 0.813 20.64
21/64 0.328 8.33 53/64 0.828 21.0311/32 0.344 8.73 27/32 0.844 21.4323/64 0.359 9.13 55/64 0.859 21.83
3/8 0.375 9.53 7/8 0.875 22.2325/64 0.391 9.92 57/64 0.891 22.6213/32 0.406 10.32 29/32 0.906 23.0227/64 0.422 10.72 59/64 0.922 23.427/16 0.438 11.11 15/16 0.938 23.81
29/64 0.453 11.51 61/64 0.953 24.2115/32 0.469 11.91 31/32 0.969 24.6131/64 0.484 12.30 63/64 0.984 25.00
© 2007 by Taylor & Francis Group, LLC

Reference Data and Tables
383
25.2.8 Decimal Equivalent Size of Drill Numbers
25.2.9 Decimal Equivalent Size of Drill Letters
Drill NumberDecimal
Equivalent
Drill NumberDecimal
Equivalent
Drill NumberDecimal
Equivalent
80 0.0135 53 0.0595 26 0.147079 0.0145 52 0.0635 25 0.149578 0.0160 51 0.0670 24 0.152077 0.0180 50 0.0700 23 0.154076 0.0200 49 0.0730 22 0.157075 0.0210 48 0.0760 21 0.159074 0.0225 47 0.0785 20 0.161073 0.0240 46 0.0810 19 0.166072 0.0250 45 0.0820 18 0.169571 0.0260 44 0.0860 17 0.173070 0.0280 43 0.0890 16 0.177069 0.0292 42 0.0935 15 0.180068 0.0310 41 0.0960 14 0.182067 0.0320 40 0.0980 13 0.185066 0.0330 39 0.0995 12 0.189065 0.0350 38 0.1015 11 0.191064 0.0360 37 0.1040 10 0.193563 0.0370 36 0.1065 9 0.196062 0.0380 35 0.1100 8 0.199061 0.0390 34 0.1110 7 0.201060 0.0400 33 0.1130 6 0.204059 0.0410 32 0.1160 5 0.205558 0.0420 31 0.1200 4 0.209057 0.0430 30 0.1285 3 0.213056 0.0465 29 0.1360 2 0.221055 0.0520 28 0.1405 1 0.228054 0.0550 27 0.1440
Letter DrillDecimal
Equivalent
Letter DrillDecimal
Equivalent
Letter DrillDecimal
Equivalent
A 0.234 J 0.277 S 0.348B 0.238 K 0.281 T 0.358C 0.242 L 0.290 U 0.368D 0.246 M 0.295 V 0.377E 0.250 N 0.302 W 0.386F 0.257 O 0.316 X 0.397G 0.261 P 0.323 Y 0.404H 0.266 Q 0.332 Z 0.413I 0.272 R 0.339
© 2007 by Taylor & Francis Group, LLC

384
AC Power Systems Handbook
25.2.10 Conversion Ratios for Length
25.2.11 Conversion Ratios for Area
Known Quantity
Multiply by
Quantity to Find
inches (in) 2.54 centimeters (cm)feet (ft) 30 centimeters (cm)yards (yd) 0.9 meters (m)miles (mi) 1.6 kilometers (km)millimeters (mm) 0.04 inches (in.)centimeters (cm) 0.4 inches (in.)meters (m) 3.3 feet (ft)meters (m) 1.1 yards (yd)kilometers (km) 0.6 miles (mi)centimeters (cm) 10 millimeters (mm)decimeters (dm) 10 centimeters (cm)decimeters (dm) 100 millimeters (mm)meters (m) 10 decimeters (dm)meters (m) 1000 millimeters (mm)dekameters (dam) 10 meters (m)hectometers (hm) 10 dekameters (dam)hectometers (hm) 100 meters (m)kilometers (km) 10 hectometers (hm)kilometers (km) 1000 meters (m)
Known Quantity
Multiply by
Quantity to Find
square inches (in.
2
) 6.5 square centimeters (cm
2
)square feet (ft
2) 0.09 square meters (m2)square yards (yd2) 0.8 square meters (m2)square miles (mi2) 2.6 square kilometers (km2)acres 0.4 hectares (ha)square centimeters
(cm2)0.16 square inches (in.2)
square meters (m2) 1.2 square yards (yd2)square kilometers
(km2)0.4 square miles (mi2)
hectares (ha) 2.5 acressquare centimeters
(cm2)100 square millimeters (mm2)
square meters (m2) 10,000 square centimeters (cm2)square meters (m2) 1,000,000 square millimeters (mm2)ares (a) 100 square meters (m2)hectares (ha) 100 ares (a)hectares (ha) 10,000 square meters (m2)square kilometers
(km2)100 hectares (ha)
square kilometers (km2)
1,000 square meters (m2)
© 2007 by Taylor & Francis Group, LLC

Reference Data and Tables 385
25.2.12 Conversion Ratios for Mass
25.2.13 Conversion Ratios for Volume
Known Quantity Multiply by Quantity to Find
ounces (oz) 28 grams (g)pounds (lb) 0.45 kilograms (kg)tons 0.9 tonnes (t)grams (g) 0.035 ounces (oz)kilograms (kg) 2.2 pounds (lb)tonnes (t) 100 kilograms (kg)tonnes (t) 1.1 tonscentigrams (cg) 10 milligrams (mg)decigrams (dg) 10 centigrams (cg)decigrams (dg) 100 milligrams (mg)grams (g) 10 decigrams (dg)grams (g) 1000 milligrams (mg)dekagram (dag) 10 grams (g)hectogram (hg) 10 dekagrams (dag)hectogram (hg) 100 grams (g)kilograms (kg) 10 hectograms (hg)kilograms (kg) 1000 grams (g)
Known Quantity Multiply by Quantity to Find
milliliters (ml) 0.03 fluid ounces (fl oz)liters (l) 2.1 pints (pt)liters (l) 1.06 quarts (qt)liters (l) 0.26 gallons (gal)gallons (gal) 3.8 liters (l)quarts (qt) 0.95 liters (l)pints (pt) 0.47 liters (l)cups (c) 0.24 liters (l)fluid ounces (fl oz) 30 milliliters (ml)teaspoons (tsp) 5 milliliters (ml)tablespoons (tbsp) 15 milliliters (ml)liters (l) 100 milliliters (ml)
© 2007 by Taylor & Francis Group, LLC

386 AC Power Systems Handbook
25.2.14 Conversion Ratios for Cubic Measure
25.2.15 Conversion Ratios for Electrical Quantities
Known Quantity Multiply by Quantity to Find
cubic meters (m3) 35 cubic feet (ft3)cubic meters (m3) 1.3 cubic yards (yd3)cubic yards (yd3) 0.76 cubic meters (m3)cubic feet (ft3) 0.028 cubic meters (m3)cubic centimeters (cm3) 1000 cubic millimeters (mm3)cubic decimeters (dm3) 1000 cubic centimeters (cm3)cubic decimeters (dm3) 1,000,000 cubic millimeters (mm3)cubic meters (m3) 1000 cubic decimeters (dm3)cubic meters (m3) 1 sterescubic feet (ft3) 1728 cubic inches (in.3)cubic feet (ft3) 28.32 liters (l)cubic inches (in.3) 16.39 cubic centimeters (cm3)cubic meters (m3) 264 gallons (gal)cubic yards (yd3) 27 cubic feet (ft3)cubic yards (yd3) 202 gallons (gal)gallons (gal) 231 cubic inches (in.3)
Known Quantity Multiply by Quantity to Find
Btu per minute 0.024 horsepower (hp)Btu per minute 17.57 watts (W)horsepower (hp) 33,000 foot-pounds per min (ft-lb/min)horsepower (hp) 746 watts (W)kilowatts (kW) 57 Btu per minutekilowatts (kW) 1.34 horsepower (hp)
© 2007 by Taylor & Francis Group, LLC

387
26
Units Conversion Table
26.1 Quantity Conversion
To Convert
Into
Multiply by
abcoulomb statcoulombs 2.998
×
10
10
acre sq. chain (Gunters) 10acre rods 160acre square links (Gunters) 1
×
10
5
acre Hectare or sq. hectometer 0.4047acre-feet cubic feet 43,560acre-feet gallons 3.259
×
10
5
acres sq. feet 43,560acres sq. meters 4,047acres sq. miles 1.562
×
10
–3
acres sq. yards 4,840ampere-hours coulombs 3,600ampere-hours faradays 0.03731amperes/sq. cm amps/sq. in. 6.452amperes/sq. cm amps/sq. meter 10
4
amperes/sq. in. amps/sq. cm 0.1550amperes/sq. in. amps/sq. meter 1,550amperes/sq. meter amps/sq. cm 10
–4
amperes/sq. meter amps/sq. in. 6.452
×
10
–4
ampere-turns gilberts 1.257ampere-turns/cm amp-turns/in. 2.540ampere-turns/cm amp-turns/meter 100ampere-turns/cm gilberts/cm 1.257ampere-turns/in. amp-turns/cm 0.3937ampere-turns/in. amp-turns/m 39.37ampere-turns/in. gilberts/cm 0.4950ampere-turns/meter amp-turns/cm 0.01ampere-turns/meter amp-turns/in. 0.0254ampere-turns/meter gilberts/cm 0.01257Angstrom unit in. 3937
×
10
–9
Angstrom unit meters 1
×
10
–10
Angstrom unit micron or (Mu) 1
×
10
–4
are acres (U.S.) 0.02471ares sq. yards 119.60ares acres 0.02471ares sq. meters 100astronomical unit kilometers 1.495
×
10
8
atmospheres ton/sq. in. 0.007348atmospheres cm of mercury 76.0atmospheres ft of water (at 4°C) 33.90atmospheres in. of mercury (at 0°C) 29.92atmospheres kg/sq. cm 1.0333atmospheres kg/sq. m 10,332atmospheres pounds/sq. in. 14.70atmospheres tons/sq. ft 1.058barrels (U.S., dry) cubic in. 7056barrels (U.S., dry) quarts (dry) 105
© 2007 by Taylor & Francis Group, LLC

388
AC Power Systems Handbook
barrels (U.S., liquid) gallons 31.5barrels (oil) gallons (oil) 42.0bars atmospheres 0.9869bars dynes/sq. cm 10
4
bars kg/sq. m 1.020
×
10
4
bars pounds/sq. ft 2,089bars pounds/sq. in. 14.50baryl dyne/sq. cm 1.000bolt (U.S. cloth) meters 36.576Btu liter-atmosphere 10.409Btu ergs 1.0550
×
10
10
Btu foot-pounds 778.3Btu gram-calories 252.0Btu horsepower-hr 3.931
×
10
–4
Btu joules 1,054.8Btu kilogram-calories 0.2520Btu kilogram-meters 107.5Btu kilowatt-hr 2.928
×
10
–4
Btu/hr foot-pounds/s 0.2162Btu/hr gram-calories/s 0.0700Btu/hr horsepower-hr 3.929
×
10
–4
Btu/hr watts 0.2931Btu/min foot-lb/s 12.96Btu/min horsepower 0.02356Btu/min kilowatts 0.01757Btu/min watts 17.57Btu/sq. ft/min watts/sq. in. 0.1221bucket (br. dry) cubic cm 1.818
×
10
4
bushels cubic ft 1.2445bushels cubic in. 2,150.4bushels cubic m 0.03524bushels liters 35.24bushels pecks 4.0bushels pints (dry) 64.0bushels quarts (dry) 32.0calories, gram (mean) Btu (mean) 3.9685
×
10
–3
candle/sq. cm Lamberts 3.142candle/sq. in. Lamberts 0.4870centares (centiares) sq. meters 1.0Centigrade Fahrenheit (C˚
×
9/5) + 32centigrams grams 0.01centiliter ounce fluid (U.S.) 0.3382centiliter cubic in. 0.6103centiliter drams 2.705centiliter liters 0.01centimeter feet 3.281
×
10
–2
centimeter inches 0.3937centimeter kilometers 10
–5
centimeter meters 0.01centimeter miles 6.214
×
10
–6
centimeter millimeters 10.0centimeter mils 393.7centimeter yards 1.094
×
10
–2
centimeter-dynes cm-grams 1.020
×
10
–3
centimeter-dynes meter-kg 1.020
×
10
–8
centimeter-dynes pound-ft 7.376
×
10
–8
centimeter-grams cm-dynes 980.7centimeter-grams meter-kg 10
–5
centimeter-grams pound-ft 7.233
×
10
–5
To Convert
Into
Multiply by
© 2007 by Taylor & Francis Group, LLC

Units Conversion Table
389
centimeters of mercury atmospheres 0.01316centimeters of mercury feet of water 0.4461centimeters of mercury kg/sq. meter 136.0centimeters of mercury pounds/sq. ft 27.85centimeters of mercury pounds/sq. in. 0.1934centimeters/sec feet/min 1.9686centimeters/sec feet/sec 0.03281centimeters/sec kilometers/hr 0.036centimeters/sec knots 0.1943centimeters/sec meters/min 0.6centimeters/sec miles/hr 0.02237centimeters/sec miles/min 3.728
×
10
–4
centimeters/sec/sec feet/sec/sec 0.03281centimeters/sec/sec km/hr/sec 0.036centimeters/sec/sec meters/sec/sec 0.01centimeters/sec/sec miles/hr/sec 0.02237chain in. 792.00chain meters 20.12chains (surveyor’s or Gunter’s) yards 22.00circular mils sq. cm 5.067
×
10
–6
circular mils sq. mils 0.7854circular mils sq. in. 7.854
×
10
–7
circumference radians 6.283cord feet cubic feet 16cords cord feet 8coulomb statcoulombs 2.998
×
10
9
coulombs faradays 1.036
×
10
–5
coulombs/sq. cm coulombs/sq. in. 64.52coulombs/sq. cm coulombs/sq. meter 10
4
coulombs/sq. in. coulombs/sq. cm 0.1550coulombs/sq. in. coulombs/sq. meter 1,550coulombs/sq. meter coulombs/sq. cm 10
–4
coulombs/sq. meter coulombs/sq. in. 6.452
×
10
–4
cubic centimeters cubic feet 3.531
×
10
–5
cubic centimeters cubic in. 0.06102cubic centimeters cubic meters 10
–6
cubic centimeters cubic yards 1.308
×
10
–6
cubic centimeters gallons (U.S. liq.) 2.642
×
10
–4
cubic centimeters liters 0.001cubic centimeters pints (U.S. liq.) 2.113
×
10
–3
cubic centimeters quarts (U.S. liq.) 1.057
×
10
–3
cubic feet bushels (dry) 0.8036cubic feet cubic cm 28,320.0cubic feet cubic in. 1,728.0cubic feet cubic meters 0.02832cubic feet cubic yards 0.03704cubic feet gallons (U.S. liq.) 7.48052cubic feet liters 28.32cubic feet pints (U.S. liq.) 59.84cubic feet quarts (U.S. liq.) 29.92cubic feet/min cubic cm/sec 472.0cubic feet/min gallons/sec 0.1247cubic feet/min liters/sec 0.4720cubic feet/min pounds of water/min 62.43cubic feet/sec million gal/day 0.646317cubic feet/sec gallons/min 448.831cubic in. cubic cm 16.39cubic in. cubic feet 5.787
×
10
–4
cubic in. cubic meters 1.639
×
10
–5
To Convert
Into
Multiply by
© 2007 by Taylor & Francis Group, LLC

390
AC Power Systems Handbook
cubic in. cubic yards 2.143
×
10
–5
cubic in. gallons 4.329
×
10
–3
cubic in. liters 0.01639cubic in. mil-feet 1.061
×
10
5
cubic in. pints (U.S. liq.) 0.03463cubic in. quarts (U.S. liq.) 0.01732cubic in. bushels (dry) 28.38cubic in. cubic cm 10
6
cubic in. cubic feet 35.31cubic in. cubic in. 61,023.0cubic in. cubic yards 1.308cubic in. gallons (U.S. liq.) 264.2cubic in. liters 1,000cubic in. pints (U.S. liq.) 2,113cubic in. quarts (U.S. liq.) 1,057cubic yards cubic cm 7.646
×
10
5
cubic yards cubic feet 27.0cubic yards cubic in. 46,656.0cubic yards cubic meters 0.7646cubic yards gallons (U.S. liq.) 202.0cubic yards liters 764.6cubic yards pints (U.S. liq.) 1,615.9cubic yards quarts (U.S. liq.) 807.9cubic yards/min cubic ft/sec 0.45cubic yards/min gallons/sec 3.367cubic yards/min liters/sec 12.74Dalton grams 1.650
×
10
–24
days seconds 86,400decigrams grams 0.1deciliters liters 0.1decimeters meters 0.1degrees (angle) quadrants 0.01111degrees (angle) radians 0.01745degrees (angle) seconds 3,600degrees/sec radians/sec 0.01745degrees/sec revolutions/min 0.1667degrees/sec revolutions/sec 2.778
×
10
–3
dekagrams grams 10dekaliters liters 10dekameters meters 10drams (apothecaries or troy) ounces (avdp.) 0.1371429drams (apothecaries or troy) ounces (troy) 0.125drams (U.S., fluid or apothecaries) cubic cm 3.6967drams grams 1.7718drams grains 27.3437drams ounces 0.0625dyne/cm erg/sq. millimeter 0.01dyne/sq. cm atmospheres 9.869
×
10
–7
dyne/sq. cm in. of mercury at 0°C 2.953
×
10
–5
dyne/sq. cm in. of water at 4°C 4.015
×
10
–4
dynes grams 1.020
×
10
–3
dynes joules/cm 10
–7
dynes joules/meter (newtons) 10
–5
dynes kilograms 1.020
×
10
–6
dynes poundals 7.233
×
10
–5
dynes pounds 2.248
×
10
–6
dynes/sq. cm bars 10
–6
ell cm 114.30ell in. 45
To Convert
Into
Multiply by
© 2007 by Taylor & Francis Group, LLC

Units Conversion Table
391
em, pica in. 0.167em, pica cm 0.4233erg/sec Dyne-cm/sec 1.000ergs Btu 9.480
×
10
–11
ergs dyne-centimeters 1.0ergs foot-pounds 7.367
×
10
–8
ergs gram-calories 0.2389
×
10
–7
ergs gram-cm 1.020
×
10
–3
ergs horsepower-hr 3.7250
×
10
–14
ergs joules 10
–7
ergs kg-calories 2.389
×
10
–11
ergs kg-meters 1.020
×
10
–8
ergs kilowatt-hr 0.2778
×
10
–13
ergs watt-hr 0.2778
×
10
–10
ergs/sec Btu/min 5,688
×
10
–9
ergs/sec ft-lb/min 4.427
×
10
–6
ergs/sec ft-lb/sec 7.3756
×
10
–8
ergs/sec horsepower 1.341
×
10
–10
ergs/sec kg-calories/min 1.433
×
10
–9
ergs/sec kilowatts 10
–10
farad microfarads 10
6
faraday/sec ampere (absolute) 9.6500
×
10
4
faradays ampere-hr 26.80faradays coulombs 9.649
×
10
4
fathom meters 1.828804fathoms feet 6.0feet centimeters 30.48feet kilometers 3.048
×
10
–4
feet meters 0.3048feet miles (naut.) 1.645
×
10
–4
feet miles (stat.) 1.894
×
10
–4
feet millimeters 304.8feet mils 1.2
×
10
4
feet of water atmospheres 0.02950feet of water in. of mercury 0.8826feet of water kg/sq. cm 0.03048feet of water kg/sq. meter 304.8feet of water pounds/sq. ft 62.43feet of water pounds/sq. in. 0.4335feet/min cm/sec 0.5080feet/min feet/sec 0.01667feet/min km/hr 0.01829feet/min meters/min 0.3048feet/min miles/hr 0.01136feet/sec cm/sec 30.48feet/sec km/hr 1.097feet/sec knots 0.5921feet/sec meters/min 18.29feet/sec miles/hr 0.6818feet/sec miles/min 0.01136feet/sec/sec cm/sec/sec 30.48feet/sec/sec km/hr/sec 1.097feet/sec/sec meters/sec/sec 0.3048feet/sec/sec miles/hr/sec 0.6818feet/100 feet per centigrade 1.0foot-candle lumen/sq. meter 10.764foot-pounds Btu 1.286
×
10–3
foot-pounds ergs 1.356 × 10⁷
foot-pounds gram-calories 0.3238
To Convert Into Multiply by
© 2007 by Taylor & Francis Group, LLC

392 AC Power Systems Handbook
foot-pounds hp-hr 5.050 × 10⁻⁷
foot-pounds joules 1.356foot-pounds kg-calories 3.24 × 10⁻⁴
foot-pounds kg-meters 0.1383foot-pounds kilowatt-hr 3.766 × 10⁻⁷
foot-pounds/min Btu/min 1.286 × 10⁻³
foot-pounds/min foot-pounds/sec 0.01667foot-pounds/min horsepower 3.030 × 10⁻⁵
foot-pounds/min kg-calories/min 3.24 × 10⁻⁴
foot-pounds/min kilowatts 2.260 × 10⁻⁵
foot-pounds/sec Btu/hr 4.6263foot-pounds/sec Btu/min 0.07717foot-pounds/sec horsepower 1.818 × 10⁻³
foot-pounds/sec kg-calories/min 0.01945foot-pounds/sec kilowatts 1.356 × 10⁻³
furlongs miles (U.S.) 0.125furlongs rods 40.0furlongs feet 660.0gallons cubic cm 3,785.0gallons cubic feet 0.1337gallons cubic in. 231.0gallons cubic meters 3.785 × 10⁻³
gallons cubic yards 4.951 × 10⁻³
gallons liters 3.785gallons (liq. Br. Imp.) gallons (U.S. liq.) 1.20095gallons (U.S.) gallons (Imp.) 0.83267gallons of water pounds of water 8.3453gallons/min cubic ft/sec 2.228 × 10⁻³
gallons/min liters/sec 0.06308gallons/min cubic ft/hr 8.0208gausses lines/sq. in. 6.452gausses webers/sq. cm 10–8
gausses webers/sq. in. 6.452 × 10⁻⁸
gausses webers/sq. meter 10–4
gilberts ampere-turns 0.7958gilberts/cm amp-turns/cm 0.7958gilberts/cm amp-turns/in. 2.021gilberts/cm amp-turns/meter 79.58gills liters 0.1183gills pints (liq.) 0.25gills (British) cubic cm 142.07grade radian 0.01571grains drams (avdp.) 0.03657143grains (troy) grains (avdp.) 1.0grains (troy) grams 0.06480grains (troy) ounces (avdp.) 2.0833 × 10⁻³
grains (troy) pennyweight (troy) 0.04167grains/Imp. gal parts/million 14.286grains/U.S. gal parts/million 17.118grains/U.S. gal pounds/million gal 142.86gram-calories Btu 3.9683 × 10⁻³
gram-calories ergs 4.1868 × 10⁷
gram-calories foot-pounds 3.0880gram-calories horsepower-hr 1.5596 × 10⁻⁶
gram-calories kilowatt-hr 1.1630 × 10⁻⁶
gram-calories watt-hr 1.1630 × 10⁻³
gram-calories/sec Btu/hr 14.286gram-centimeters Btu 9.297 × 10⁻⁸
gram-centimeters ergs 980.7
To Convert Into Multiply by
© 2007 by Taylor & Francis Group, LLC

Units Conversion Table 393
gram-centimeters joules 9.807 × 10⁻⁵
gram-centimeters kg-calories 2.343 × 10⁻⁸
gram-centimeters kg-meters 10–5
grams dynes 980.7grams grains 15.43grams joules/cm 9.807 × 10⁻⁵
grams joules/meter (newtons) 9.807 × 10⁻³
grams kilograms 0.001grams milligrams 1,000grams ounces (avdp.) 0.03527grams ounces (troy) 0.03215grams poundals 0.07093grams pounds 2.205 × 10⁻³
grams/cm pounds/in. 5.600 × 10⁻³
grams/cubic cm pounds/cubic ft 62.43grams/cubic cm pounds/cubic in. 0.03613grams/cubic cm pounds/mil-foot 3.405 × 10⁻⁷
grams/liter grains/gal 58.417grams/liter pounds/1,000 gal 8.345grams/liter pounds/cubic ft 0.062427grams/liter parts/million 1,000.0grams/sq. cm pounds/sq. ft 2.0481hand cm 10.16hectares acres 2.471hectares sq. feet 1.076 × 10⁵
hectograms grams 100hectoliters liters 100hectometers meters 100hectowatts watts 100henrys millihenrys 1,000horsepower Btu/min 42.44horsepower foot-lb/min 33,000horsepower foot-lb/sec 550horsepower kg-calories/min 10.68horsepower kilowatts 0.7457horsepower watts 745.7horsepower (boiler) Btu/hr 33.479horsepower (boiler) kilowatts 9.803horsepower, metric (542.5 ft lb./sec) horsepower (550 ft lb./sec) 0.9863horsepower (550 ft lb./sec) horsepower, metric (542.5 ft lb./sec) 1.014horsepower-hr Btu 2,547horsepower-hr ergs 2.6845 × 10¹³
horsepower-hr foot-lb 1.98 × 10⁶
horsepower-hr gram-calories 641,190horsepower-hr joules 2.684 × 10⁶
horsepower-hr kg-calories 641.1horsepower-hr kg-meters 2.737 × 10⁵
horsepower-hr kilowatt-hr 0.7457hours days 4.167 × 10⁻²
hours weeks 5.952 × 10⁻³
hundredweights (long) pounds 112hundredweights (long) tons (long) 0.05hundredweights (short) ounces (avdp.) 1,600hundredweights (short) pounds 100hundredweights (short) tons (metric) 0.0453592hundredweights (short) tons (long) 0.0446429in. centimeters 2.540in. meters 2.540 × 10⁻²
in. miles 1.578 × 10⁻⁵
To Convert Into Multiply by
© 2007 by Taylor & Francis Group, LLC

394 AC Power Systems Handbook
in. millimeters 25.40in. mils 1,000.0in. yards 2.778 × 10⁻²
in. of mercury atmospheres 0.03342in. of mercury feet of water 1.133in. of mercury kg/sq. cm 0.03453in. of mercury kg/sq. meter 345.3in. of mercury pounds/sq. ft 70.73in. of mercury pounds/sq. in. 0.4912in. of water (at 4°C) atmospheres 2.458 × 10⁻³
in. of water (at 4°C) in. of mercury 0.07355in. of water (at 4°C) kg/sq. cm 2.540 × 10⁻³
in. of water (at 4°C) ounces/sq. in. 0.5781in. of water (at 4°C) pounds/sq. ft 5.204in. of water (at 4°C) pounds/sq. in. 0.03613international ampere amperes (absolute) 0.9998international Volt volts (absolute) 1.0003international volt joules (absolute) 1.593 × 10⁻¹⁹
international volt joules 9.654 × 10⁴
joules Btu 9.480 × 10⁻⁴
joules ergs 107
joules foot-pounds 0.7376joules kg-calories 2.389 × 10⁻⁴
joules kg-meters 0.1020joules watt-hr 2.778 × 10⁻⁴
joules/cm grams 1.020 × 10⁴
joules/cm dynes 107
joules/cm joules/meter (newtons) 100.0joules/cm poundals 723.3joules/cm pounds 22.48kilogram-calories Btu 3.968kilogram-calories foot-pounds 3,088kilogram-calories hp-hr 1.560 × 10⁻³
kilogram-calories joules 4,186kilogram-calories kg-meters 426.9kilogram-calories kilojoules 4.186kilogram-calories kilowatt-hr 1.163 × 10⁻³
kilogram meters Btu 9.294 × 10⁻³
kilogram meters ergs 9.804 × 10⁷
kilogram meters foot-pounds 7.233kilogram meters joules 9.804kilogram meters kg-calories 2.342 × 10⁻³
kilogram meters kilowatt-hr 2.723 × 10⁻⁶
kilograms dynes 980,665kilograms grams 1,000.0kilograms joules/cm 0.09807kilograms joules/meter (newtons) 9.807kilograms poundals 70.93kilograms pounds 2.205kilograms tons (long) 9.842 × 10⁻⁴
kilograms tons (short) 1.102 × 10⁻³
kilograms/cubic meter grams/cubic cm 0.001kilograms/cubic meter pounds/cubic ft 0.06243kilograms/cubic meter pounds/cubic in. 3.613 × 10⁻⁵
kilograms/cubic meter pounds/mil-foot 3.405 × 10⁻¹⁰
kilograms/meter pounds/ft 0.6720kilograms/sq. cm dynes 980,665kilograms/sq. cm atmospheres 0.9678kilograms/sq. cm feet of water 32.81
To Convert Into Multiply by
© 2007 by Taylor & Francis Group, LLC

Units Conversion Table 395
kilograms/sq. cm in. of mercury 28.96kilograms/sq. cm pounds/sq. ft 2,048kilograms/sq. cm pounds/sq. in. 14.22kilograms/sq. meter atmospheres 9.678 × 10⁻⁵
kilograms/sq. meter bars 98.07 × 10⁻⁶
kilograms/sq. meter feet of water 3.281 × 10⁻³
kilograms/sq. meter in. of mercury 2.896 × 10⁻³
kilograms/sq. meter pounds/sq. ft 0.2048kilograms/sq. meter pounds/sq. in. 1.422 × 10⁻³
kilograms/sq. mm kg/sq. meter 106
kilolines maxwells 1,000kiloliters liters 1,000kilometers centimeters 105
kilometers feet 3,281kilometers in. 3.937 × 10⁴
kilometers meters 1,000kilometers miles 0.6214kilometers millimeters 104
kilometers yards 1,094kilometers/hr cm/sec 27.78kilometers/hr feet/min 54.68kilometers/hr feet/sec 0.9113kilometers/hr knots 0.5396kilometers/hr meters/min 16.67kilometers/hr miles/hr 0.6214kilometers/hr/sec cm/sec/sec 27.78kilometers/hr/sec feet/sec/sec 0.9113kilometers/hr/sec meters/sec/sec 0.2778kilometers/hr/sec miles/hr/sec 0.6214kilowatt-hr Btu 3,413kilowatt-hr ergs 3.600 × 10¹³
kilowatt-hr foot-lb 2.655 × 10⁶
kilowatt-hr gram-calories 859,850kilowatt-hr horsepower-hr 1.341kilowatt-hr joules 3.6 × 10⁶
kilowatt-hr kg-calories 860.5kilowatt-hr kg-meters 3.671 × 10⁵
kilowatt-hr pounds of water raised from 62° to 212°F 22.75kilowatts Btu/min 56.92kilowatts foot-lb/min 4.426 × 10⁴
kilowatts foot-lb/sec 737.6kilowatts horsepower 1.341kilowatts kg-calories/min 14.34kilowatts watts 1,000.0knots feet/hr 6,080knots kilometers/hr 1.8532knots nautical miles/hr 1.0knots statute miles/hr 1.151knots yards/hr 2,027knots feet/sec 1.689league miles (approx.) 3.0light year miles 5.9 × 10¹²
light year kilometers 9.4637 × 10¹²
lines/sq. cm gausses 1.0lines/sq. in. gausses 0.1550lines/sq. in. webers/sq. cm 1.550 × 10⁻⁹
lines/sq. in. webers/sq. in. 10–8
lines/sq. in. webers/sq. meter 1.550 × 10⁻⁵
links (engineer’s) in. 12.0
To Convert Into Multiply by
© 2007 by Taylor & Francis Group, LLC

396 AC Power Systems Handbook
links (surveyor’s) in. 7.92liters bushels (U.S. dry) 0.02838liters cubic cm 1,000liters cubic feet 0.03531liters cubic in. 61.02liters cubic meters 0.001liters cubic yards 1.308 × 10⁻³
liters gallons (U.S. liq.) 0.2642liters pints (U.S. liq.) 2.113liters quarts (U.S. liq.) 1.057liters/min cubic ft/sec 5.886 × 10⁻⁴
liters/min gal/sec 4.403 × 10⁻³
lumen spherical candle power 0.07958lumen watts 0.001496lumens/sq. ft foot-candles 1.0lumens/sq. ft lumen/sq. meter 10.76lux foot-candles 0.0929maxwells kilolines 0.001maxwells webers 10–8
megalines maxwells 106
megohms microhms 1012
megohms ohms 106
meter-kilograms cm-dynes 9.807 × 10⁷
meter-kilograms cm-grams 105
meter-kilograms pound-feet 7.233meters centimeters 100meters feet 3.281meters in. 39.37meters kilometers 0.001meters miles (naut.) 5.396 × 10⁻⁴
meters miles (stat.) 6.214 × 10⁻⁴
meters millimeters 1,000meters yards 1.094meters varas 1.179meters/min cm/sec 1,667meters/min feet/min 3.281meters/min feet/sec 0.05468meters/min km/hr 0.06meters/min knots 0.03238meters/min miles/hr 0.03728meters/sec feet/min 196.8meters/sec feet/sec 3.281meters/sec kilometers/hr 3.6meters/sec kilometers/min 0.06meters/sec miles/hr 2.237meters/sec miles/min 0.03728meters/sec/sec cm/sec/sec 100meters/sec/sec ft/sec/sec 3.281meters/sec/sec km/hr/sec 3.6meters/sec/sec miles/hr/sec 2.237microfarad farads 10–6
micrograms grams 10–6
microhms megohms 10–12
microhms ohms 10–6
microliters liters 10–6
microns meters 1 × 10⁻⁶
miles (naut.) feet 6,080.27miles (naut.) kilometers 1.853miles (naut.) meters 1,853
To Convert Into Multiply by
© 2007 by Taylor & Francis Group, LLC

Units Conversion Table 397
miles (naut.) miles (statute) 1.1516miles (naut.) yards 2,027miles (statute) centimeters 1.609 × 10⁵
miles (statute) feet 5,280miles (statute) in. 6.336 × 10⁴
miles (statute) kilometers 1.609miles (statute) meters 1,609miles (statute) miles (naut.) 0.8684miles (statute) yards 1,760miles/hr cm/sec 44.70miles/hr feet/min 88miles/hr feet/sec 1.467miles/hr km/hr 1.609miles/hr km/min 0.02682miles/hr knots 0.8684miles/hr meters/min 26.82miles/hr miles/min 0.1667miles/hr/sec cm/sec/sec 44.70miles/hr/sec feet/sec/sec 1.467miles/hr/sec km/hr/sec 1.609miles/hr/sec meters/sec/sec 0.4470miles/min cm/sec 2,682miles/min feet/sec 88miles/min km/min 1.609miles/min knots/min 0.8684miles/min miles/hr 60mil-feet cubic in. 9.425 × 10⁻⁶
milliers kilograms 1,000milligrams grains 0.01543236milligrams grams 0.001milligrams/liter parts/million 1.0millihenrys henrys 0.001milliliters liters 0.001millimeters centimeters 0.1millimeters feet 3.281 × 10⁻³
millimeters in. 0.03937millimeters kilometers 10–6
millimeters meters 0.001millimeters miles 6.214 × 10⁻⁷
millimeters mils 39.37millimeters yards 1.094 × 10⁻³
millimicrons meters 1 x 10⁻⁹
million gal/day cubic ft/sec 1.54723mils centimeters 2.540 × 10⁻³
mils feet 8.333 × 10⁻⁵
mils in. 0.001mils kilometers 2.540 × 10⁻⁸
mils yards 2.778 × 10⁻⁵
miner’s inches cubic ft/min 1.5minims (British) cubic cm 0.059192minims (U.S., fluid) cubic cm 0.061612minutes (angles) degrees 0.01667minutes (angles) quadrants 1.852 × 10⁻⁴
minutes (angles) radians 2.909 × 10⁻⁴
minutes (angles) seconds 60myriagrams kilograms 10myriameters kilometers 10myriawatts kilowatts 10nepers decibels 8.686
To Convert Into Multiply by
© 2007 by Taylor & Francis Group, LLC

398 AC Power Systems Handbook
Newton dynes 1 × 10⁵ohms (international) ohm (absolute) 1.0005ohms megohms 10–6
ohms microhms 106
ounces drams 16.0ounces grains 437.5ounces grams 28.349527ounces pounds 0.0625ounces ounces (troy) 0.9115ounces tons (long) 2.790 × 10⁻⁵
ounces tons (metric) 2.835 × 10⁻⁵
ounces (fluid) cubic in. 1.805ounces (fluid) liters 0.02957ounces (troy) grains 480.0ounces (troy) grams 31.103481ounces (troy) ounces (avdp.) 1.09714ounces (troy) pennyweights (troy) 20.0ounces (troy) pounds (troy) 0.08333ounces/sq. in. dynes/sq. cm 4,309ounces/sq. in. pounds/sq. in. 0.0625parsec miles 19 × 1012
parsec kilometers 3.084 × 10¹³
parts/million grains/U.S. gal 0.0584parts/million grains/Imp. gal 0.07016parts/million pounds/million gal 8.345pecks (British) cubic in. 554.6pecks (British) liters 9.091901pecks (U.S.) bushels 0.25pecks (U.S.) cubic in. 537.605pecks (U.S.) liters 8.809582pecks (U.S.) quarts (dry) 8pennyweights (troy) grains 24.0pennyweights (troy) ounces (troy) 0.05pennyweights (troy) grams 1.55517pennyweights (troy) pounds (troy) 4.1667 × 10⁻³
pints (dry) cubic in. 33.60pints (liq.) cubic cm 473.2pints (liq.) cubic feet 0.01671pints (liq.) cubic in. 28.87pints (liq.) cubic meters 4.732 × 10⁻⁴
pints (liq.) cubic yards 6.189 × 10⁻⁴
pints (liq.) gallons 0.125pints (liq.) liters 0.4732pints (liq.) quarts (liq.) 0.5Planck’s quantum erg-second 6.624 × 10⁻²⁷
poise gram/cm sec 1.00poundals dynes 13,826poundals grams 14.10poundals joules/cm 1.383 × 10⁻³
poundals joules/meter (newtons) 0.1383poundals kilograms 0.01410poundals pounds 0.03108pound-feet cm-dynes 1.356 × 10⁷
pound-feet cm-grams 13,825pound-feet meter-kg 0.1383pounds drams 256pounds dynes 44.4823 × 10⁴
pounds grains 7,000pounds grams 453.5924
To Convert Into Multiply by
© 2007 by Taylor & Francis Group, LLC

Units Conversion Table 399
pounds joules/cm 0.04448pounds joules/meter (newtons) 4.448pounds kilograms 0.4536pounds ounces 16.0pounds ounces (troy) 14.5833pounds poundals 32.17pounds pounds (troy) 1.21528pounds tons (short) 0.0005pounds (avdp.) ounces (troy) 14.5833pounds (troy) grains 5,760pounds (troy) grams 373.24177pounds (troy) ounces (avdp.) 13.1657pounds (troy) ounces (troy) 12pounds (troy) pennyweights (troy) 240pounds (troy) pounds (avdp.) 0.822857pounds (troy) tons (long) 3.6735 × 10⁻⁴
pounds (troy) tons (metric) 3.7324 × 10⁻⁴
pounds (troy) tons (short) 4.1143 × 10⁻⁴
pounds of water cubic ft 0.01602pounds of water cubic in. 27.68pounds of water gallons 0.1198pounds of water/min cubic ft/sec 2.670 × 10⁻⁴
pounds/cubic ft grams/cubic cm 0.01602pounds/cubic ft kg/cubic meter 16.02pounds/cubic ft pounds/cubic in. 5.787 × 10⁻⁴
pounds/cubic ft pounds/mil-foot 5.456 × 10⁻⁹
pounds/cubic in. gm/cubic cm 27.68pounds/cubic in. kg/cubic meter 2.768 × 10⁴
pounds/cubic in. pounds/cubic ft 1,728pounds/cubic in. pounds/mil-foot 9.425 × 10⁻⁶
pounds/ft kg/meter 1.488pounds/in. gm/cm 178.6pounds/mil-foot gm/cubic cm 2.306 × 10⁶
pounds/sq. ft atmospheres 4.725 × 10⁻⁴
pounds/sq. ft feet of water 0.01602pounds/sq. ft inches of mercury 0.01414pounds/sq. ft kg/sq. meter 4.882pounds/sq. ft pounds/sq. in. 6.944 × 10⁻³
pounds/sq. in. atmospheres 0.06804pounds/sq. in. feet of water 2.307pounds/sq. in. in. of mercury 2.036pounds/sq. in. kg/sq. meter 703.1pounds/sq. in. pounds/sq. ft 144quadrants (angle) degrees 90quadrants (angle) minutes 5,400.0quadrants (angle) radians 1.571quadrants (angle) seconds 3.24 x 10⁵
quarts (dry) cubic in. 67.20quarts (liq.) cubic cm 946.4quarts (liq.) cubic feet 0.03342quarts (liq.) cubic in. 57.75quarts (liq.) cubic meters 9.464 × 10⁻⁴
quarts (liq.) cubic yards 1.238 × 10⁻³
quarts (liq.) gallons 0.25quarts (liq.) liters 0.9463radians degrees 57.30radians minutes 3,438radians quadrants 0.6366radians seconds 2.063 × 10⁵
To Convert Into Multiply by
© 2007 by Taylor & Francis Group, LLC

400 AC Power Systems Handbook
radians/sec degrees/sec 57.30radians/sec revolutions/min 9.549radians/sec revolutions/sec 0.1592radians/sec/sec revolutions/min/min 573.0radians/sec/sec revolutions/min/sec 9.549radians/sec/sec revolutions/sec/sec 0.1592revolutions degrees 360revolutions quadrants 4.0revolutions radians 6.283revolutions/min degrees/sec 6.0revolutions/min radians/sec 0.1047revolutions/min revolutions/sec 0.01667revolutions/min/min radians/sec/sec 1.745 × 10⁻³
revolutions/min/min revolutions/min/sec 0.01667revolutions/min/min revolutions/sec/sec 2.778 × 10⁻⁴
revolutions/sec degrees/sec 360.0revolutions/sec radians/sec 6.283revolutions/sec revolutions/min 60revolutions/sec/sec radians/sec/sec 6.283revolutions/sec/sec revolutions/min/min 3,600revolutions/sec/sec revolutions/min/sec 60.0rod chain (Gunter’s) 0.25rod meters 5.029rods feet 16.5rods (surveyors’ meas.) yards 5.5scruples grains 20seconds (angle) degrees 2.778 × 10⁻⁴
seconds (angle) minutes 0.01667seconds (angle) quadrants 3.087 × 10⁻⁶
seconds (angle) radians 4.848 × 10⁻⁶
slug kilogram 14.59slug pounds 32.17sphere steradians 12.57square centimeters circular mils 1.973 × 10⁵
square centimeters sq. feet 1.076 × 10⁻³
square centimeters sq. in. 0.1550square centimeters sq. meters 0.0001square centimeters sq. miles 3.861 × 10⁻¹¹
square centimeters sq. millimeters 100.0square centimeters sq. yards 1.196 × 10⁻⁴
square feet acres 2.296 × 10⁻⁵
square feet circular mils 1.833 × 10⁸
square feet sq. cm 929.0square feet sq. in. 144.0square feet sq. meters 0.09290square feet sq. miles 3.587 × 10⁻⁸
square feet sq. millimeters 9.290 × 10⁴
square feet sq. yards 0.1111square in. circular mils 1.273 × 10⁶
square in. sq. cm 6.452square in. sq. feet 6.944 × 10⁻³
square in. sq. millimeters 645.2square in. sq. mils 106
square in. sq. yards 7.716 × 10⁻⁴
square kilometers acres 247.1square kilometers sq. cm 1010
square kilometers sq. feet 10.76 × 10⁶
square kilometers sq. in. 1.550 × 10⁹
square kilometers sq. meters 106
To Convert Into Multiply by
© 2007 by Taylor & Francis Group, LLC

Units Conversion Table 401
square kilometers sq. miles 0.3861square kilometers sq. yards 1.196 × 10⁶
square meters acres 2.471 × 10⁻⁴
square meters sq. cm 104
square meters sq. feet 10.76square meters sq. in. 1,550square meters sq. miles 3.861 × 10⁻⁷
square meters sq. millimeters 106
square meters sq. yards 1.196square miles acres 640.0square miles sq. feet 27.88 × 10⁶
square miles sq. km 2.590square miles sq. meters 2.590 × 10⁶
square miles sq. yards 3.098 × 10⁶
square millimeters circular mils 1,973square millimeters sq. cm 0.01square millimeters sq. feet 1.076 × 10⁻⁵
square millimeters sq. in. 1.550 × 10⁻³
square mils circular mils 1.273square mils sq. cm 6.452 × 10⁻⁶
square mils sq. in. 10–6
square yards acres 2.066 × 10⁻⁴
square yards sq. cm 8,361square yards sq. feet 9.0square yards sq. in. 1,296square yards sq. meters 0.8361square yards sq. miles 3.228 × 10⁻⁷
square yards sq. millimeters 8.361 × 10⁵
temperature (°C) + 273 absolute temperature (°C) 1.0temperature (°C) + 17.78 temperature (°F) 1.8temperature (°F) + 460 absolute temperature (°F) 1.0temperature (°F) – 32 temperature (°C) 5/9tons (long) kilograms 1,016tons (long) pounds 2,240tons (long) tons (short) 1.120tons (metric) kilograms 1,000tons (metric) pounds 2,205tons (short) kilograms 907.1848tons (short) ounces 32,000tons (short) ounces (troy) 29,166.66tons (short) pounds 2,000tons (short) pounds (troy) 2,430.56tons (short) tons (long) 0.89287tons (short) tons (metric) 0.9078tons (short)/sq. ft kg/sq. meter 9,765tons (short)/sq. ft pounds/sq. in. 2,000tons of water/24 hr pounds of water/hr 83.333tons of water/24 hr gallons/min 0.16643tons of water/24 hr cubic ft/hr 1.3349volt (absolute) statvolts 0.003336volts/in. volts/cm 0.39370watt-hours Btu 3.413watt-hours ergs 3.60 × 10¹⁰
watt-hours foot-pounds 2,656watt-hours gram-calories 859.85watt-hours horsepower-hr 1.341 × 10⁻³
watt-hours kilogram-calories 0.8605watt-hours kilogram-meters 367.2watt-hours kilowatt-hr 0.001
To Convert Into Multiply by
© 2007 by Taylor & Francis Group, LLC

402 AC Power Systems Handbook
watts (international) watts (absolute) 1.0002watts Btu/hr 3.4129watts Btu/min 0.05688watts ergs/sec 107watts foot-lb/min 44.27watts foot-lb/sec 0.7378watts horsepower 1.341 × 10⁻³
watts horsepower (metric) 1.360 × 10⁻³
watts kg-calories/min 0.01433watts kilowatts 0.001watts (Abs.) Btu (mean)/min 0.056884watts (Abs.) joules/sec 1webers maxwells 108
webers kilolines 105
webers/sq. in. gausses 1.550 × 10⁷
webers/sq. in. lines/sq. in. 108
webers/sq. in. webers/sq. cm 0.1550webers/sq. in. webers/sq. meter 1,550webers/sq. meter gausses 104
webers/sq. meter lines/sq. in. 6.452 × 10⁴
webers/sq. meter webers/sq. cm 10–4
webers/sq. meter webers/sq. in. 6.452 × 10⁻⁴
yards centimeters 91.44yards kilometers 9.144 × 10⁻⁴
yards meters 0.9144yards miles (naut.) 4.934 × 10⁻⁴
yards miles (stat.) 5.682 × 10⁻⁴
yards millimeters 914.4
To Convert Into Multiply by
© 2007 by Taylor & Francis Group, LLC