Material Matters Louise Bourgeois and the Question of Materiality
Upload
khangminh22Category
view
0download
0
ABSTRACT
BURTCH, HALEY LOUISE. Adaptation of an Existing In Vitro Digestion Model for High Throughput Phenolic Bioaccessibility Phenotyping within Cultivated (Highbush) Blueberry Varieties. (Under the Direction of Dr. Mario Ferruzzi).
The 2015 Dietary Guidelines for Americans (DGA) based recommendations for fruit and
vegetable consumption on evidence supporting the role of nutrients and bioactives
(phytochemicals) in meeting nutritional requirements. Intake of phytochemicals, defined as
secondary plant metabolites (such as carotenoids and polyphenols), has widely been associated
with a decreased risk of chronic and degenerative diseases. However, according to the USDA
approximately 13% of US residents consume the recommended amount of vegetables, while 25%
consume the recommended amount of fruit. Therefore, novel strategies are needed to address the
gap in delivery of fruit and vegetable benefits to consumers. Given that the associated health
impacts from fruits and vegetables are ultimately dependent on their phytochemical density and
their absorption and metabolism (bioavailability), it has been suggested that advanced phenotyping
combined with genetic techniques can be leveraged to breed fruits and vegetables with enhanced
nutritive content and bioavailability.
Modern breeding strategies have advanced our knowledge of factors influencing
polyphenol content in plant foods, such as polyphenol-rich highbush (HB) blueberries. However,
potential traits related to phenolic bioavailability remain unknown due to limitations in
phenotyping methods. While nutrient and bioactive bioavailability is most accurately measured by
in vivo models, they are often costly, time-consuming, and constitute a bottleneck for high-
throughput analysis. Alternatively, in vitro digestion models have proven useful in the estimation
of factors impacting polyphenol digestive release and availability for absorption (bioaccessibility),
a precursor of bioavailability. However, these models remain inefficient for screening large
germplasm collections. Therefore, high throughput (HT) models suitable for screening of larger
HB blueberry populations are needed to advance our knowledge of genotypes and genetic factors
influencing phenolic density and bioavailability.
An established static, relatively low throughput (LT), three stage in vitro gastrointestinal
digestion model previously used for fruit phenolics was adapted to reduce tissue amounts,
digestion volume and modified enzyme concentrations allowing for compatibility with a robotic
fluid handling system (TECAN EVO 150) for HT. Bioaccessibility of phenolics from commercial
HB blueberries was optimized for HT and validated against the LT model. The HT model was
then used to screen phenolic bioaccessibility in a subset of 33 individual blueberry genotypes
from a mapping population derived from a cross between two elite cultivars, Draper and Jewel
(DxJ).
Bioaccessibility of anthocyanins (ANC), flavonols (FLAV), flavan-3-ols (F3L) and
phenolic acids (PA) were well correlated (r=0.98) between HT and LT methods. Calculated CV
ranged from 2.7-21.9%for HT and for LT 0.1-23.2%, respectively suggesting good reproducibility.
The sum of total phenolic content within the DxJ subset ranged from 31.7– 81.1 mg/100g fresh
weight (f.w.). Approximately 60% of the phenolics were ANC, followed by PA, predominately
chlorogenic acid, representing 28%, while FLAV (<1%) and F3L (12%) accounted for the rest.
Variation in relative bioaccessibility (%) was observed among all phenolic classes with ANC (0.3-
11.7; P<0.0001), Acylated ANC (7.9-27.9; P<0.0001), FLAV (10.7-54.1; P<0.0001), FL3(1.0-
49.1; P<0.0001) and PA (0.3-2.1; P<0.0001). Similarly, significant variation in absolute
bioaccessibility (mg/100g f.w.) was noted among all phenolic classes with ANC (0.1-2.6 ;
P<0.0001), acylated ANC (1.2-4.3; P<0.0001), PA (0.03-0.9; P<0.0001), FLAV (0.8-5.5;
P<0.0001), and F3L (0.001-0.05; P<0.0001).
Therefore, the adapted HT in vitro digestion model provides a novel tool for phenotyping
phenolic bioaccessibility in blueberry fruit. Application to a subset of DxJ genotypes, further
establishes the need for continued screening of diverse blueberry germplasms and other plant
materials in combination with genomic approaches. This will allow for greater understanding of
specific genetic factors that influence polyphenolic density and bioavailability.
Adaptation of an Existing In Vitro Digestion Model for High Throughput Phenolic Bioaccessibility Phenotyping within Cultivated (Highbush) Blueberry Varieties.
by Haley Louise Burtch
A thesis submitted to the Graduate Faculty of North Carolina State University
in partial fulfillment of the requirements for the degree of
Master of Science
Food Science
Raleigh, North Carolina
2020
APPROVED BY:
Dr. Mario Ferruzzi Committee Chair
Dr. Massimo Iorizzo
Dr. Edward Foegeding
Dr. Gabriel Harris
ii
DEDICATION
To my family for their encouragement.
iii
BIOGRAPHY
Haley Louise Burtch was born on November 27th, 1993 in Rockford, Ohio. Upon
completion of her Bachelor of Science degree in Nutrition, Fitness and Health and Dietetics from
Purdue University in the Spring of 2016, she chose to further her education by pursuing a Master’s
degree from North Carolina State University in the field of Food Science. In June of 2017, Haley
began her research, under the direction of Dr. Mario Ferruzzi, on polyphenol bioaccessibility in
blueberries at the Plants for Human Health Institute in Kannapolis, North Carolina. Following
completion of her graduate studies, Haley plans to apply her degree within the food industry.
iv
ACKNOWLEDGEMENTS
There are many people that deserve recognition for making the completion of my Master’s
degree possible. First and foremost, I would like to extend my great appreciation and gratitude to
Mario for his accountability and guidance over the past few years. I would also like to thank my
committee members, Dr. Edward Foegeding, Dr. Keith Harris, and Dr. Massimo Iorizzo for their
assistance and direction. I am also so incredibly grateful for my labmates for the gross amounts of
laughter and friendship and willingness to always lend a helping hand. Finally, I am thankful for
my family, my mom and dad, Todd and Misti, and my abundance of siblings: Edward, Claire,
Elise, Brooklyn, Beckett, Ricki and Sam.
v
TABLE OF CONTENTS
LIST OF TABLES ...................................................................................................................... vii
LIST OF FIGURES ................................................................................................................... viii
CHAPTER 1. REVIEW OF RELEVANT LITERATURE ...................................................... 1
1.1. Introduction ............................................................................................................................ 1
1.2. Introduction to Polyphenols .................................................................................................. 7
1.3. Flavonoids ............................................................................................................................... 9
1.3.1. Flavonols ........................................................................................................................... 9
1.3.2. Flavones .......................................................................................................................... 10
1.3.3. Isoflavones ...................................................................................................................... 10
1.3.4. Flavanones ....................................................................................................................... 10
1.3.5. Anthocyanidins ................................................................................................................ 11
1.3.6. Flavan-3-ols ..................................................................................................................... 12
1.4. Nonflavonoids ....................................................................................................................... 12
1.4.1. Phenolic Acids ................................................................................................................. 12
A. Hydroxycinnamic acids ................................................................................................ 13
B. Hydroxybenzoic acids ................................................................................................... 13
1.4.2. Stilbenes .......................................................................................................................... 13
1.5. Blueberry polyphenols and intake of polyphenolic-rich blueberries .............................. 14
1.6. Bioavailability of polyphenols ............................................................................................. 19
1.6.1. Digestion, absorption and metabolism of polyphenols ................................................... 20
1.7. Current models for assessing bioavailability ..................................................................... 23
1.7.1. In vivo approaches to measure polyphenol bioavailability (Human Clinical and Preclinical Animal models) ....................................................................................................... 24
1.7.2. In vitro screening of bioaccessibility as a surrogate for bioavailability .......................... 26
A. Multicompartmental static gastrointestinal models .......................................................... 28
B. TNO Gastrointestinal model (TIM) .............................................................................. 32
C. Bioaccessibility as a phenotypic trait and potential of existing models for screening germplasm collections ........................................................................................................... 35
1.8. Research Objectives ............................................................................................................. 37
1.9. REFERENCES ..................................................................................................................... 39
vi
CHAPTER 2. DEVELOPING A HIGH THROUGHPUT IN VITRO DIGESTION MODEL TO PHENOTYPE BIOACCESSIBILITY OF HIGHBUSH BLUEBERRIES .... 56
2.1. Introduction .......................................................................................................................... 56
2.2. Materials and Methods ........................................................................................................ 59
2.2.1. Chemicals, solutions and standards ................................................................................. 59
2.2.2. Blueberry material ........................................................................................................... 60
2.2.3. Blueberry processing for digestions ................................................................................ 60
2.2.4. Established, low throughput (LT) in vitro gastrointestinal digestion .............................. 61
2.2.5. High throughput (HT) in vitro gastrointestinal digestion ................................................ 61
2.2.6 Low throughput (LT) phenolic extraction ........................................................................ 63
2.2.7. High Throughput (HT) Phenolic Extraction ................................................................... 64
2.2.8. Analysis of polyphenolic compounds by LC-MS ........................................................... 65
2.3. Data Analysis ........................................................................................................................ 66
2.4. Results and Discussion ......................................................................................................... 67
2.4.1. Phenolic profiles of commercial blueberries ................................................................... 67
2.4.2. Comparison of Manual (LT) Model vs Automated (HT) Tecan Model ......................... 68
2.4.3. Variability in bioaccessibility among a blueberry mapping population ......................... 77
2.4.4. Genotypic effect on phenolic bioaccessibility as determined by HT in vitro digestion . 85
within DxJ blueberry subset ...................................................................................................... 85
2.5. Conclusions ........................................................................................................................... 88
2.6. REFERENCES ..................................................................................................................... 89
CHAPTER 3. CONCLUSIONS AND FUTURE CONSIDERATIONS ................................ 96
3.1. REFERENCES ................................................................................................................... 101
APPENDICES ............................................................................................................................ 102
Appendix A. Supplemental Materials for Chapter 2 ............................................................... 103
vii
LIST OF TABLES
Chapter 1
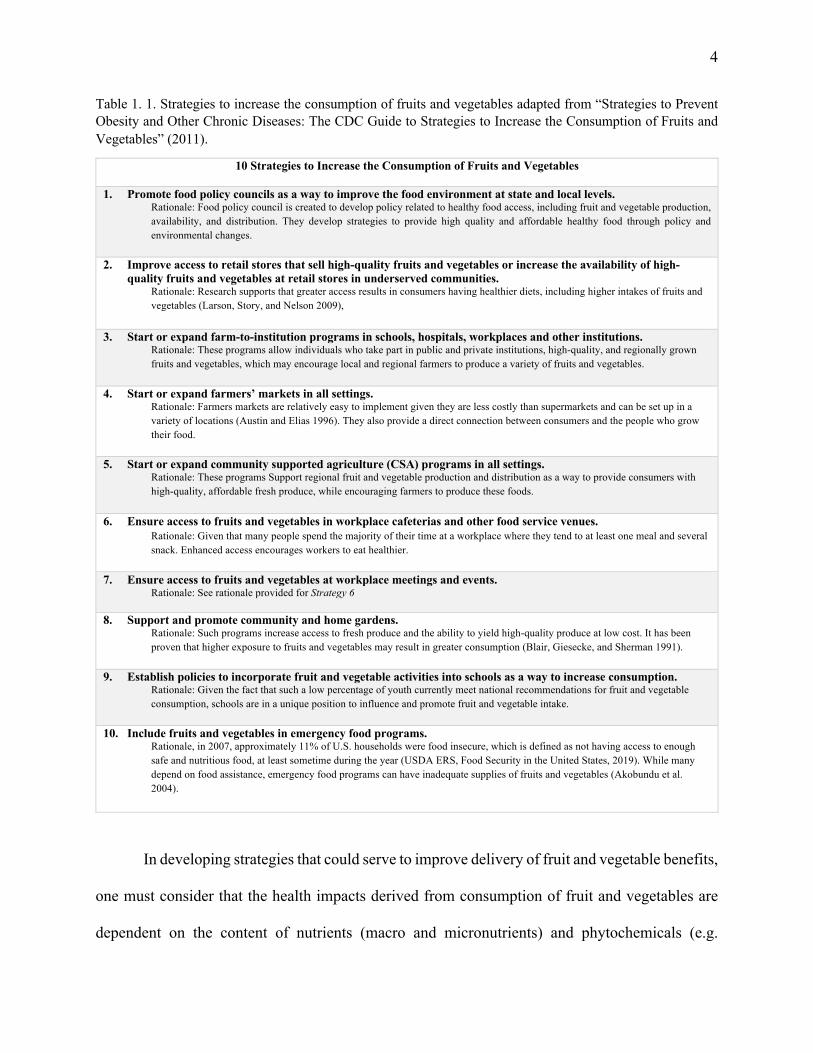
Table 1. 1. Strategies to increase the consumption of fruits and vegetables adapted from
“Strategies to Prevent Obesity and Other Chronic Diseases: The CDC Guide to
Strategies to Increase the Consumption of Fruits and Vegetables” (2011). ....................... 4
Table 1. 2. Various polyphenol sources subjected to a static, in-vitro gastrointestinal model. .... 30
Table 1. 3. Comparison of two in vitro models- static versus dynamic ...................................... 35
Chapter 2
Table 2. 1. Representative blueberry phenolics targeted for bioaccessibility screening .............. 66
Table 2. 2. Content (mg/100g f.w.) of individual marker (poly)phenolic compound in
commercial store- bought blueberries used for method adaptation and validation. ........ 68
Table 2. 3. Comparison of absolute (mg/100g) and relative (%) bioaccessibility of individual
phenolics from commercial blueberries determined by LT and HT models. .................. 71
viii
LIST OF FIGURES
Chapter 1
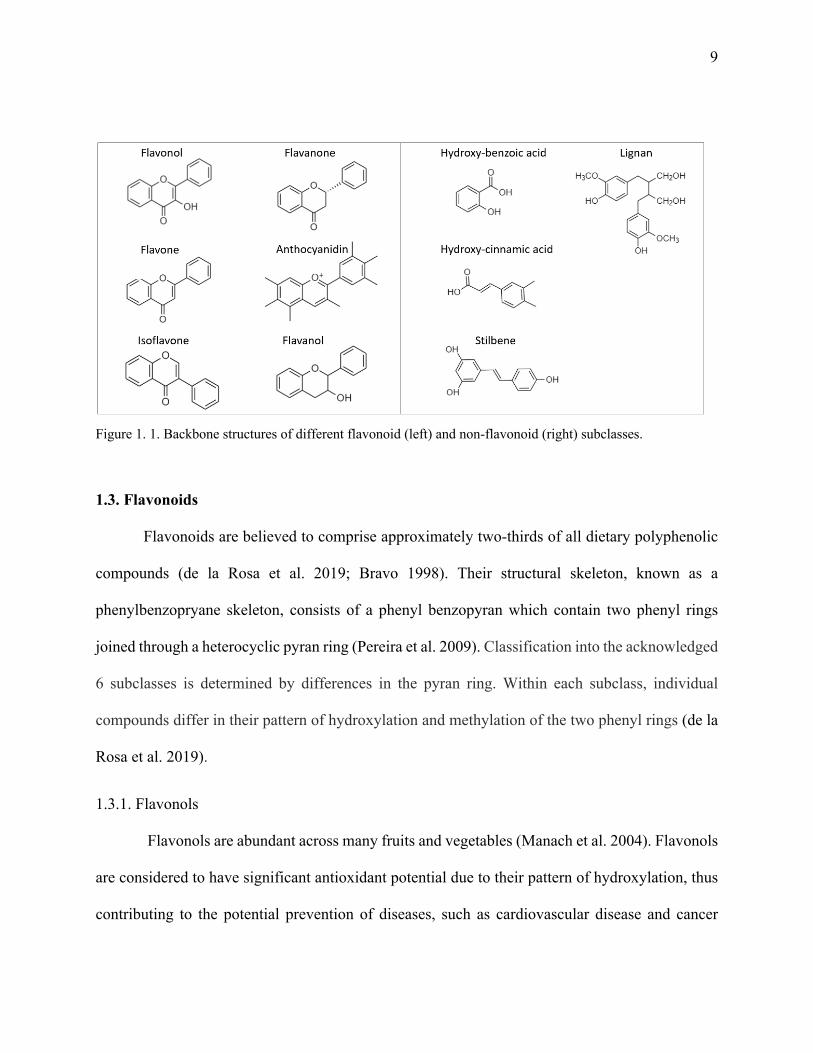
Figure 1. 1. Backbone structures of different flavonoid (left) and non-flavonoid (right)
subclasses. ................................................................................................................................. 9
Figure 1. 2. Representative polyphenols found in blueberries. .................................................... 16
Figure 1. 3. Schematic of the processes that affect systemic bioavailability and metabolism
adapted from Ferruzzi and Neilson (2011). 1 .......................................................................... 21
Figure 1. 4. Diagram of static, 3-stage in vitro gastrointestinal model adapted from Garrett et al.
(1999) by Moser et al. (2016) for polyphenols. ...................................................................... 32
Figure 1. 5. Schematic presentation of TIM-1 adapted from (Minekus 2015). 1 ......................... 33
Chapter 2
Figure 2. 1. Correlation between model throughput (LT v. HT) in terms of average inter-day
bioaccessibility (relative (%) v. absolute (mg/100g f.w.). Circular markers indicate all
targeted phenolic compounds within the varying phenolic classes (ANC, PA, FLAV, F3L). 76
Figure 2. 2. Blueberry phenolic composition (%) based on the average of 33 individual
selected genotypes within the Draper x Jewel (DxJ) mapping population. ........................... 78
Figure 2. 3. Range of (poly)phenolic content (mg/100g f.w.), by class, found within 33
individual blueberry genotypes within the Draper x Jewel (DxJ) mapping population. ....... 79
Figure 2. 4. Range of relative bioaccessibility (%) values observed for phenolic classes
following HT digestion of 33 blueberries derived from Draper x Jewel (DxJ). ..................... 79
Figure 2. 5. Mean phenolic content (mg/100g f.w.) and absolute bioaccessible phenolic content
(mg/100g f.w.), by phenolic class, as seen in 33 selected blueberry genotypes from Draper x
Jewel (DxJ) mapping population. .......................................................................................... 81
1
CHAPTER 1. REVIEW OF RELEVANT LITERATURE
1.1. Introduction
Fruits and vegetables have held a central place in dietary guidance by virtue of their density
of vitamins, minerals, dietary fiber and, of more recent interest, their phytochemical content
(Slavin and Lloyd 2012). Phytochemicals are broadly defined as secondary plant metabolites with
putative human health benefits (R. H. Liu 2003). Intake of phytochemical rich fruits and vegetables
has been associated with a decreased risk of chronic and degenerative diseases in humans including
cardiovascular disease (Bazzano et al. 2002; Arai et al. 2000; Appel et al. 1997; Hertog et al. 1993),
a multitude of cancers (lung, colon, breast, cervix, esophagus, oral cavity, stomach, bladder,
pancreas, and ovary) (Bunea et al. 2013; Bagchi et al. 2004; Damianaki et al. 2000; Yi et al. 2005;
Agudelo et al. 2018), diabetes (Marles and Farnsworth 1995; van Dam and Feskens 2002; Grace
et al. 2009; Fan et al. 2013), obesity (Stull et al. 2010; Prior et al. 2010; Vuong et al. 2009), and
neurodegenerative disorders (Joseph et al. 1999; Tavares et al. 2012; Papandreou et al. 2009;
Krikorian et al. 2010).
Given the significant health benefits associated with fruit and vegetable nutrients and
phytochemicals, the 2015 Dietary Guidelines for Americans (DGA) recommends consuming 2
cups of fruit and 2.5 cups of vegetables daily (USDA Dietary Guidelines for Americans 2015-
2020) to meet daily nutrient needs and provide associated health benefits. While modest in levels,
consumption of fruits and vegetables by the average American remains significantly below the
recommended amounts. Specifically, in the 2015 DGA it was reported that only approximately
13% of the United States population was consuming fruits and vegetables at the recommended
serving levels (USDA Dietary Guidelines for Americans 2015-2020). With such poor adherence
to existing guidelines, novel strategies are required to improve the delivery of fruit and vegetable
benefits.
2
Several factors have been linked to the low intake of fruits and vegetables including
difficulty of modifying long-term consumer behavior, cost and lack of consistent access to fresh
fruits and vegetables for low income consumers and the lack of alignment between current fruit
and vegetable products and consumer lifestyles (Rekhy and McConchie 2014). Addressing both
the production and consumption side of this equation has required collaborations amongst various
disciplines with a focus on agriculture, food science and production, nutrition scientist and policy
and consumer scientist.
In 2011, the Centers for Disease Control and Prevention published a guide titled,
“Strategies to Prevent Obesity and Other Chronic Diseases: The CDC Guide to Strategies to
Increase the Consumption of Fruits and Vegetables” to address 10 strategies (Table 1.1) designed
to increase access to and improve the availability of fruits and vegetables, with the expectations
that these changes will lead to increased consumption (CDC 2011). The strategies were focused
on both policy and environmental changes and were selected on the best available evidence, as
well as the knowledge and expertise of the authors and CDC partners. In short, the CDC
encouraged all state and local levels to improve access and incorporate fruits and vegetables into
more public settings, such as schools and places of employment. Similarly, the USDA suggests
attainable options such as increasing the vegetable content of mixed dishes while decreasing the
amounts of other food components that are often overconsumed, such as refined grains or meats
high in saturated fat and/or sodium and including a salad or vegetable side dish along with
incorporating more vegetables in general into meals and snacks. Additionally, the USDA also
recommended incorporating more whole fruits into snacks, salads, side dishes and desserts (USDA
Dietary Guidelines for Americans 2015-2020), thereby enhancing consumption opportunities.
3
While such strategies seek to improve consumer consumption of fruits and vegetables are
in place, there has generally been no significant change in consumer behavior and fruit and
vegetable intake over time (Casagrande et al. 2007; Lee-Kwan et al. 2017). Given the difficulty in
changing consumer behavior and the challenges in addressing this challenge solely by increasing
production of fruits and vegetables new strategies are needed to address the gap in delivery of fruit
and vegetable benefits to American consumers.
4
Table 1. 1. Strategies to increase the consumption of fruits and vegetables adapted from “Strategies to Prevent Obesity and Other Chronic Diseases: The CDC Guide to Strategies to Increase the Consumption of Fruits and Vegetables” (2011).
10 Strategies to Increase the Consumption of Fruits and Vegetables
1. Promote food policy councils as a way to improve the food environment at state and local levels. Rationale: Food policy council is created to develop policy related to healthy food access, including fruit and vegetable production,
availability, and distribution. They develop strategies to provide high quality and affordable healthy food through policy and
environmental changes.
2. Improve access to retail stores that sell high-quality fruits and vegetables or increase the availability of high-quality fruits and vegetables at retail stores in underserved communities.
Rationale: Research supports that greater access results in consumers having healthier diets, including higher intakes of fruits and
vegetables (Larson, Story, and Nelson 2009),
3. Start or expand farm-to-institution programs in schools, hospitals, workplaces and other institutions. Rationale: These programs allow individuals who take part in public and private institutions, high-quality, and regionally grown
fruits and vegetables, which may encourage local and regional farmers to produce a variety of fruits and vegetables.
4. Start or expand farmers’ markets in all settings. Rationale: Farmers markets are relatively easy to implement given they are less costly than supermarkets and can be set up in a
variety of locations (Austin and Elias 1996). They also provide a direct connection between consumers and the people who grow
their food.
5. Start or expand community supported agriculture (CSA) programs in all settings. Rationale: These programs Support regional fruit and vegetable production and distribution as a way to provide consumers with
high-quality, affordable fresh produce, while encouraging farmers to produce these foods.
6. Ensure access to fruits and vegetables in workplace cafeterias and other food service venues. Rationale: Given that many people spend the majority of their time at a workplace where they tend to at least one meal and several
snack. Enhanced access encourages workers to eat healthier.
7. Ensure access to fruits and vegetables at workplace meetings and events. Rationale: See rationale provided for Strategy 6
8. Support and promote community and home gardens.
Rationale: Such programs increase access to fresh produce and the ability to yield high-quality produce at low cost. It has been
proven that higher exposure to fruits and vegetables may result in greater consumption (Blair, Giesecke, and Sherman 1991).
9. Establish policies to incorporate fruit and vegetable activities into schools as a way to increase consumption. Rationale: Given the fact that such a low percentage of youth currently meet national recommendations for fruit and vegetable
consumption, schools are in a unique position to influence and promote fruit and vegetable intake.
10. Include fruits and vegetables in emergency food programs. Rationale, in 2007, approximately 11% of U.S. households were food insecure, which is defined as not having access to enough
safe and nutritious food, at least sometime during the year (USDA ERS, Food Security in the United States, 2019). While many
depend on food assistance, emergency food programs can have inadequate supplies of fruits and vegetables (Akobundu et al.
2004).
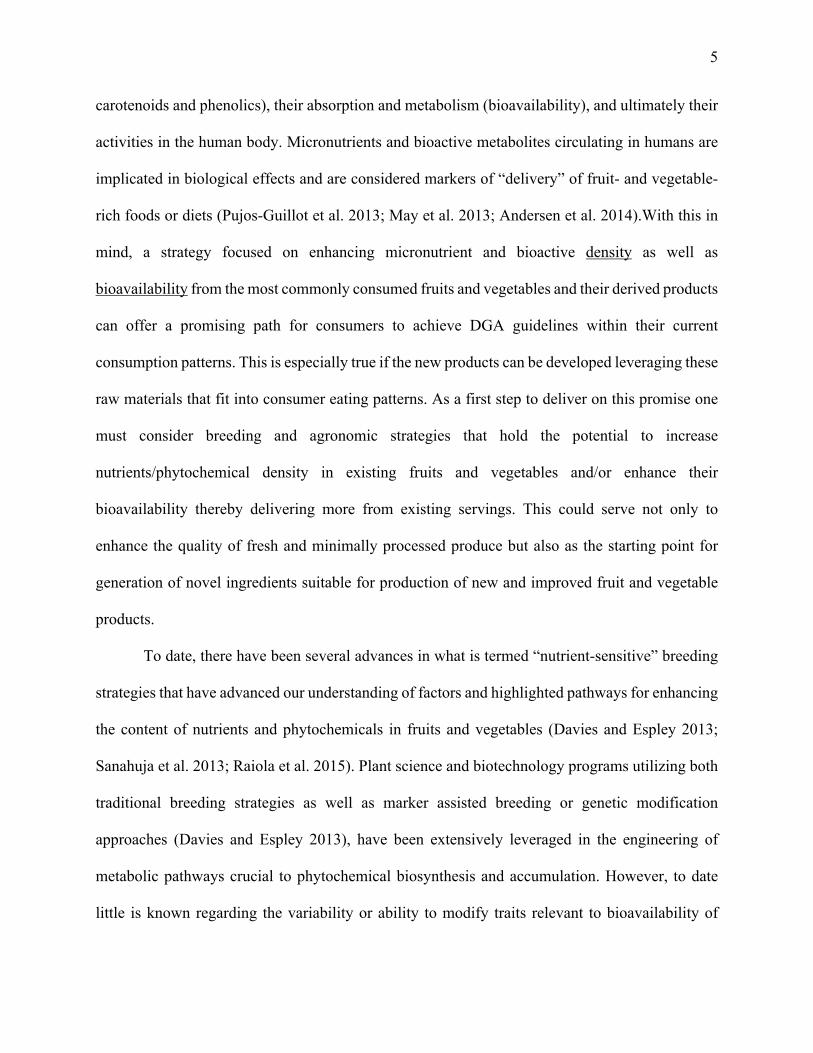
In developing strategies that could serve to improve delivery of fruit and vegetable benefits,
one must consider that the health impacts derived from consumption of fruit and vegetables are
dependent on the content of nutrients (macro and micronutrients) and phytochemicals (e.g.
5
carotenoids and phenolics), their absorption and metabolism (bioavailability), and ultimately their
activities in the human body. Micronutrients and bioactive metabolites circulating in humans are
implicated in biological effects and are considered markers of “delivery” of fruit- and vegetable-
rich foods or diets (Pujos-Guillot et al. 2013; May et al. 2013; Andersen et al. 2014).With this in
mind, a strategy focused on enhancing micronutrient and bioactive density as well as
bioavailability from the most commonly consumed fruits and vegetables and their derived products
can offer a promising path for consumers to achieve DGA guidelines within their current
consumption patterns. This is especially true if the new products can be developed leveraging these
raw materials that fit into consumer eating patterns. As a first step to deliver on this promise one
must consider breeding and agronomic strategies that hold the potential to increase
nutrients/phytochemical density in existing fruits and vegetables and/or enhance their
bioavailability thereby delivering more from existing servings. This could serve not only to
enhance the quality of fresh and minimally processed produce but also as the starting point for
generation of novel ingredients suitable for production of new and improved fruit and vegetable
products.
To date, there have been several advances in what is termed “nutrient-sensitive” breeding
strategies that have advanced our understanding of factors and highlighted pathways for enhancing
the content of nutrients and phytochemicals in fruits and vegetables (Davies and Espley 2013;
Sanahuja et al. 2013; Raiola et al. 2015). Plant science and biotechnology programs utilizing both
traditional breeding strategies as well as marker assisted breeding or genetic modification
approaches (Davies and Espley 2013), have been extensively leveraged in the engineering of
metabolic pathways crucial to phytochemical biosynthesis and accumulation. However, to date
little is known regarding the variability or ability to modify traits relevant to bioavailability of
6
micronutrients and phytochemicals. This remains a critical piece of knowledge needed to enhance
the potential impact of a single fruit or vegetable serving. This gap in the science is also connected
to a general lack of a physiologically relevant model for “phenotyping” bioavailability across the
large germplasm collections of individual fruits and vegetables required for such genetic and
breeding programs. Such a phenotypic method is required to connect the nutritional impact of
fruits and vegetables to the broader “omics” leveraged in advance breeding programs.
While nutrient and phytochemical bioavailability are best measured in vivo and in clinical
settings, in vitro models of the gastrointestinal tract have proven useful in the estimation of factors
impacting micronutrient and phytochemical digestive release and availability for absorption
(bioaccessibility) (Peters et al. 2010; Reboul et al. 2006). Relying on predetermined physiological
parameters that mimic the oral, gastric and small intestinal phases of digestion, such in vitro
models have been effectively used to estimate food matrix and processing factors impacting
micronutrient and phytochemical bioavailability (Neilson and Ferruzzi 2011; Neilson et al. 2009).
In the case of screening relevant plant germplasm collections for nutritional delivery traits, iron
bioaccessibility was proposed as a genetically variable trait in maize (Šimić et al. 2009). This, as
well as vitamin A bioaccessibility, has been proposed as a target for breeding biofortified grains
and other staple foods for at risk population (J. Aragón et al. 2018; Lipkie et al. 2013; Pixley,
Palacios-Rojas, and Glahn 2011). However, the broader application of such methods has been
challenged by logistical and practical considerations that limit overall throughput. Simply put,
these labor-intensive models, while more efficient than clinical assessments, still have challenges
to the broad application. This includes plant material sample size requirements, high level of
manual processing, and overall analytical sensitivity. Overcoming these challenges and advancing
throughput from dozens of samples per day to hundred would make it possible to leverage these
7
models for the full array of phytochemicals critical to fruit and vegetable benefits. The potential
to develop a platform for this type of “functional phenotyping” of key fruit and vegetable
germplasm collections will allow for us to leverage genomic approaches and facilitate
identification of genetic factors that influence both density and bioavailability of micronutrients
and/or phytochemicals from fruits and vegetables.
With this in mind, the focus of this thesis research was to generate a high throughput in
vitro digestion model by adapting existing in vitro digestion conditions that have been traditionally
applied to screen the impact of food matrix and formulation factors on polyphenol bioaccessibility
from berries. This work will ultimately lead to a new functional high throughput method applicable
to large blueberry germplasm collections designed to support future genomic studies. Utilizing
said method will allow for efficient investigation of blueberry traits that influence nutrient density
and bioavailability of target compounds. In support of this effort, the focus of this literature review
is to provide an overview into blueberry polyphenols, with insight into their bioavailability and
current models used to determine their bioaccessibility. This will include a comparison of the
methods and models considered in the development of the current high throughput system.
1.2. Introduction to Polyphenols
Polyphenols are regarded as one of the most abundant and highly distributed classes of
phytochemicals in nature with high concentrations found in plant foods and beverages including
fruits and vegetables, tea, coffee and cocoa. They are defined as secondary metabolites generated
through the shikimate pathway and the phenylpropanoid pathways in higher plants (Ben Haj Yahia
et al. 2019; Harborne 1989).While not classified as essential nutrients, polyphenols are viewed as
highly fundamental components of both human and animal diets (Bravo 1998). Interest in
polyphenol is derived from their wide array of functions within plants, including their contribution
8
to natural pigmentation, flavor, reproduction and growth, and as natural defense against disease
and pest (Bravo 1998). However, more recent interest stems from the association between
polyphenol intake and bioactive properties and health-protective effects, including potential effects
and antioxidant and free-radical scavenging abilities (Manach et al. 2004; Bravo 1998; R. H. Liu
2003).
Structurally, polyphenols are characterized by having at least one phenol unit (Gan et al.
2019) or an aromatic ring bearing one or more hydroxyl groups, including functional derivatives
(Naczk and Shahidi 2006). The majority of polyphenols occur in nature as conjugates with sugars.
Glycosidic forms include those where one or more sugar units are linked to hydroxyl groups.
However, simpler forms exist consisting of direct linkage of the sugar residues to an aromatic
carbon atom (Tsao 2010; Harborne 1989).
More than 8000 individual polyphenols exist(de la Rosa et al. 2019), and have been
classified broadly according to their source of origin, biological function, and chemical structure
(Tsao 2010). In the simplest terms, phenolic compounds can be classified into two main groups:
flavonoids and nonflavonoids (Figure 1.1). Whereas flavonoids, which constitute the most
important single group and most abundant form of polyphenols in fruits and vegetables, can be
further subdivided into 6 classes, including flavonols, flavones, isoflavones, flavanones,
anthocyanidins, and flavanols (catechins and proanthocyanins). Meanwhile, nonflavonoids are
primarily composed of phenolic acids, but additionally consist of stilbenes and lignans (Manach
et al. 2004).
9
Figure 1. 1. Backbone structures of different flavonoid (left) and non-flavonoid (right) subclasses.
1.3. Flavonoids
Flavonoids are believed to comprise approximately two-thirds of all dietary polyphenolic
compounds (de la Rosa et al. 2019; Bravo 1998). Their structural skeleton, known as a
phenylbenzopryane skeleton, consists of a phenyl benzopyran which contain two phenyl rings
joined through a heterocyclic pyran ring (Pereira et al. 2009). Classification into the acknowledged
6 subclasses is determined by differences in the pyran ring. Within each subclass, individual
compounds differ in their pattern of hydroxylation and methylation of the two phenyl rings (de la
Rosa et al. 2019).
1.3.1. Flavonols
Flavonols are abundant across many fruits and vegetables (Manach et al. 2004). Flavonols
are considered to have significant antioxidant potential due to their pattern of hydroxylation, thus
contributing to the potential prevention of diseases, such as cardiovascular disease and cancer
10
(Hollman and Katan 1999). The most common flavonol forms are kaempferol, quercetin, and
myricetin and their associated derivatives. Major dietary sources of flavonols include apples (van
der Sluis et al. 2001), onions (K. R. Price and Rhodes 1997), broccoli (Keith R. Price et al. 1998)
and tomato (Crozier et al. 1997).
1.3.2. Flavones
Apigenin and luteolin are two of the most prevalent flavones found in nature. Apigenin is
primarily in herbs like sage, oregano (W. Zheng and Wang 2001), and dried marjoram (Proestos
and Komaitis 2006), while luteolin is similarly observed in herbs, as well as in artichokes (Romani
et al. 2006). Similar to other flavonoid subclasses, evidence has supported the anti-inflammatory,
anti-microbial, and anti-cancer effects of flavones (Jiang, Doseff, and Grotewold 2016).
1.3.3. Isoflavones
Isoflavones are a class of flavonoids that act as phytoestrogens, that is they have structural
similarities with estradiol and the ability to initiate estrogenic-like effects (Manach et al. 2004).
Common isoflavones include daidzein, genistein and glycitein. In general, isoflavones are found
in leguminous plants, mainly soy-based, including soy paste, tempe and tofu (Murphy et al. 1999;
T. Song et al. 1998)(Murphy et al. 1999). Interest regarding isolflavones revolves around their
estrogenic properties and their potential role in the prevention of breast cancer and osteoporosis
(Adlercreutz and Mazur 1997).
1.3.4. Flavanones
Despite being a relatively small group of compounds, flavanones contribute significantly
to overall phenolic, specifically flavonoid, intake due to their widespread consumption (Manach
et al. 2004). Naringin, found in grapefruit juice (Ho et al. 2000) and hesperidin, found in lemon
(Miyake et al. 1998) and orange juice (Pupin, Dennis, and Toledo 1998), are considered the most
11
common of the flavanones and are found in high concentrations within citrus fruits and juices (Brat
et al. 2006). Given their strong antioxidant and radical scavenging activity, they appear to be
associated with the prevention of several chronic diseases. In addition to this potential, flavanones
display antiviral, antimicrobial, anti-inflammatory, and anti-allergenic properties (Maria Tomas-
Navarro 2014).
1.3.5. Anthocyanidins
Anthocyanins, the glycosides of anthocyanidins, are the compounds in plants responsible
for their red, blue, and purple pigmentation (Martinez, Mackert, and McIntosh 2017)(Martinez,
Mackert, and McIntosh 2017). Aside from giving fruits their signature red and blue hues,
anthocyanins are associated with inhibiting various forms of cancer, cardiovascular disease,
neurodegenerative disease, and diabetes (Kong et al. 2003; Bagchi et al. 2004; Andres-Lacueva et
al. 2005; Guo and Xia 2014). Almost all anthocyanins are glycosylated derivatives of six common
anthocyanidins including: delphinidin, cyanidin, peonidin, petunidin, malvidin, and pelargonidin
(de la Rosa et al. 2019). The differences between individual anthocyanins relate to the number of
hydroxyl groups, the nature and number of sugars attached to the molecule, the position of this
attachment, and the nature and number of aliphatic or aromatic acids attached to sugars in the
molecule (Kong et al. 2003). Anthocyanins are commonly found in blueberries, blackberries , red
onion, grapes, red wine (Manach et al. 2004; Mazza 2018). Within fruits, anthocyanin content is
typically found within the skin, the flesh of certain types of red fruit (Kayesh et al. 2013).
Anthocyanins have been widely studied due to their association to their potential effects on health,
such as reducing risk of cardiovascular disease, cancer, hyperlipidemia and other insulin-
resistance-related diseases, like type-2-diabetes (Guo and Xia 2014; Bagchi et al. 2004; Kong et
al. 2003).
12
1.3.6. Flavan-3-ols
Flavan-3-ols exist in two forms: monomeric (catechins) and polymeric
(proanthocyanidins) (Manach et al. 2004). Common catechins include catechin, epicatechin and
epigallocatechin which are found in cocoa (K. B. Miller et al. 2006), green tea (Khokhar and
Magnusdottir 2002), fruit (Arts, van de Putte, and Hollman 2000) and red wine (Burns et al. 2000).
Catechins are associated with high antioxidant functions that contribute to the prevention of
chronic disease such as cancer and cardiovascular disease (Higdon and Frei 2003).
Proanthocyaninidins, known as condensed tannins, are dimers, oligomers, and polymers of
catechins (Manach et al. 2004) that are responsible, when combined with salivary proteins, for the
astringency in fruit, beverages, and chocolate (Santos‐Buelga and Scalbert 2000). Additionally,
their intake is associated with inhibition of LDL oxidation and platelet aggregation, therefore they
are shown to contribute to cardiovascular disease prevention (Santos‐Buelga and Scalbert 2000).
1.4. Nonflavonoids
Compared to flavonoids, nonflavonoids are smaller and simpler in terms of structure (de la
Rosa et al. 2019). Nonflavonoids can be divided into 3 separate subclasses including phenolic
acids, stilbenes, and lignans.
1.4.1. Phenolic Acids
Phenolic acids account for approximately one-third of all dietary polyphenolics are divided
into two classes: derivatives of cinnamic acid and benzoic acid (Manach et al. 2004; de la Rosa et
al. 2019). They consist of a single phenyl group substituted by one carboxylic group and at least
one hydroxyl group, however are differentiated by the varying length of the chain containing the
carboxylic group (de la Rosa et al. 2019).
13
A. Hydroxycinnamic acids
Hydroxycinnamic acids, the more common of the two classes, is generally found in fresh
fruits and vegetables such as blueberries, kiwi, apple, artichokes, herbs, potatoes, as well as coffee
(Naczk and Shahidi 2006; Schuster and Herrmann 1985; Manach et al. 2004). The main
representatives of these acids include p-coumaric acid, ferulic, caffeic, sinapic, and chlorogenic
(combination of quinic acid) acids (Manach et al. 2004). While caffeic acid is the main constituent
within fruits and vegetables (Haghi and Hatami 2010), chlorogenic composes a majority of the
phenolic acid profile in coffee (Farah and Donangelo 2006). Research in cell and animal studies
suggests that hydroxycinnamic acids may help modulate inflammation, obesity, and diabetes
(Maurya and Devasagayam 2010).
B. Hydroxybenzoic acids
Hydroxybenzoic acids are rarely found in their free form. Instead, they are generally
glycosylated, linked to small organic acids, or attached to physical components of the plant cells
(Manach et al. 2004). Gallic, vanillic, and syringic acid are amongst the most common
hydroxybenzoic acids (de la Rosa et al. 2019). While their content is generally low,
hydroxybenzoic acid can be found within berries, tea, and herbs (Schuster and Herrmann 1985;
Tomás‐Barberán and Clifford 2000). Given their relatively low content and availability, limited
nutritional studies have been conducted on hydroxybenzoic acid.
1.4.2. Stilbenes
Structurally, stilbenes consist of two benzene rings joined by a molecule of ethanol or
ethylene (Moreno and Peinado 2012). Resveratrol, a popular derivative of stilbenes, is a naturally
occurring antioxidant found in grapes, red wine, berries, and peanuts and is by far the most
extensively studied stilbene given its associated beneficial health effects (Maru et al. 2014; Ren
14
and Lien 1997). The greatest dietary source of resveratrol is fresh grape skin and therefore its
associated form of red wine (Bianchini and Vainio 2003; Y. Wang et al. 2006). Many studies have
concluded anticarcinogenic effects by resveratrol intake (Damianaki et al. 2000; Chang, Lee, and
Ko 2000; Y. Wang et al. 2006).
1.5. Blueberry polyphenols and intake of polyphenolic-rich blueberries
A prime example of a polyphenolic rich fruit is the blueberry. Blueberries can be divided
into 3 predominate cultivated species within the genus Vaccinium section (or sub-genus)
Cyanococcus (Ericaceae family), including highbush (Vaccinium corymbosum L.), rabbiteye
(Vaccinium virgatum Ait.), and lowbush “wild” (Vaccinium angustifolium Ait.) (Retamales and
Hancock 2018). Most commercial production, however, consists primarily of highbush and
lowbush blueberries, while rabbiteye are of more importance in the southeast regions of North
America (Retamales and Hancock 2018).
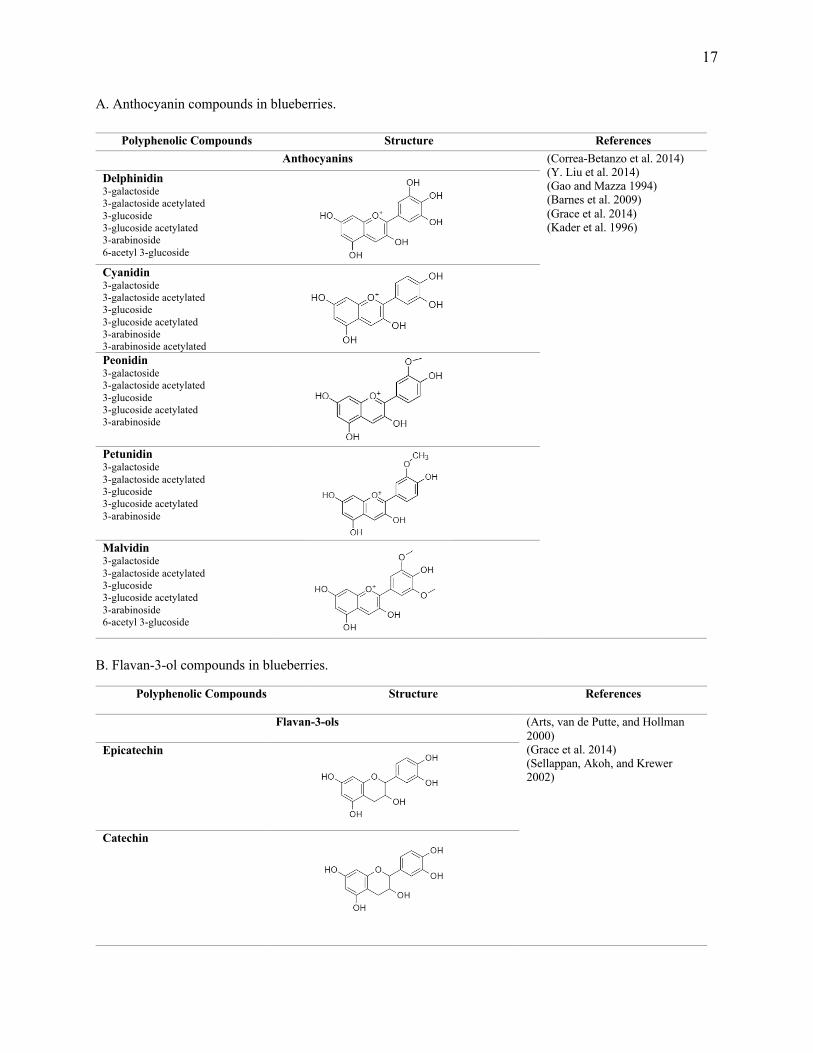
Blueberries are well known for their diverse array and relatively high concentration of
phenolic compounds (Figure 1.2), including anthocyanins, phenolic acids, flavanols, and flavan-
3-ols. Five major anthocyanins (delphinidin, cyanidin, petunidin, peonidin, and malvidin) and their
associated glycosides have been commonly identified in blueberries. Regarding phenolic acids,
chlorogenic acid, p-coumaric acid, caffeic acid, ferulic acid have been identified. Quercetin,
syringetin, kaempferol, myricetin derivatives comprise the flavanol profile, epicatechin and
catechin contribute to the flavan-3-ol content. Polyphenol content within blueberries has been seen
to vary according to several factors including growing location, year, species and specific genotype
(Connor et al. 2002), harvest stage (degree of maturation and ripeness) (Castrejón et al. 2008), and
post-harvest storage conditions (Kalt et al. 1999).
15
In recent years, blueberries have been deemed a “superfood” by the emergence of
supportive scientific research concluding associated health benefits (Kalt, Joseph, and Shukitt-
Hale 2007). Specifically, the abundance of polyphenols found in blueberries have been highly
regarded for their antioxidant and anti-inflammatory potential (Wei Zheng and Wang 2003; He
and Liu 2006; Cirico and Omaye 2006; Duthie, Gardner, and Kyle 2003), as a result of these
compounds interacting either independently or synergistically (Seeram et al. 2004). Such effects
have been determined to contribute to the prevention and improvement of several chronic diseases,
including type 2 diabetes (Martineau et al. 2006; Grace et al. 2009), neurodegenerative diseases
(ie. Alzheimers) (Brewer et al. 2010; Joseph et al. 1999; Papandreou et al. 2009), cancer (Bunea
et al. 2013; Kraft et al. 2005), and heart disease (Basu et al. 2010; Curtis et al. 2019).
While blueberry consumption specifically is associated with a reduced risk of such
diseases, less is known regarding the individual differences in potential health benefits between
unique blueberry genotypes. With interest in understanding underlying mechanism by which
blueberries deliver on these benefits has grown, phenotyping including phenolic and micronutrient
phenotyping have been conducted on select germplasm collections (Howard, Clark, and
Brownmiller 2003; Kalt et al. 2001; Connor et al. 2002; Bunea et al. 2013; Grace et al. 2014). Such
insights have proven useful to breeding programs interested in enhancing phenolic content and
potential health benefits.
Rising interest in fruits such as the blueberry has resulted in growth of global blueberry
production by 40% between the years 2012 and 2016 (North American Blueberry Council (NABC
2017), as did blueberry consumption per capita within the United States. According to the USDA
Economic Research Service (ERS), consumption of blueberries increased by 599% from 1994-
2014, which was the greatest growth of any other fruit or vegetable.
16
Figure 1. 2. Representative polyphenols found in blueberries.
17
A. Anthocyanin compounds in blueberries.
B. Flavan-3-ol compounds in blueberries.
Polyphenolic Compounds Structure References Anthocyanins (Correa-Betanzo et al. 2014)
(Y. Liu et al. 2014) (Gao and Mazza 1994) (Barnes et al. 2009) (Grace et al. 2014) (Kader et al. 1996)
Delphinidin 3-galactoside
3-galactoside acetylated
3-glucoside
3-glucoside acetylated
3-arabinoside
6-acetyl 3-glucoside
Cyanidin 3-galactoside
3-galactoside acetylated
3-glucoside
3-glucoside acetylated
3-arabinoside
3-arabinoside acetylated
Peonidin 3-galactoside
3-galactoside acetylated
3-glucoside
3-glucoside acetylated
3-arabinoside
Petunidin 3-galactoside
3-galactoside acetylated
3-glucoside
3-glucoside acetylated
3-arabinoside
Malvidin 3-galactoside
3-galactoside acetylated
3-glucoside
3-glucoside acetylated
3-arabinoside
6-acetyl 3-glucoside
Polyphenolic Compounds Structure References
Flavan-3-ols (Arts, van de Putte, and Hollman 2000) (Grace et al. 2014) (Sellappan, Akoh, and Krewer 2002)
Epicatechin
Catechin
18
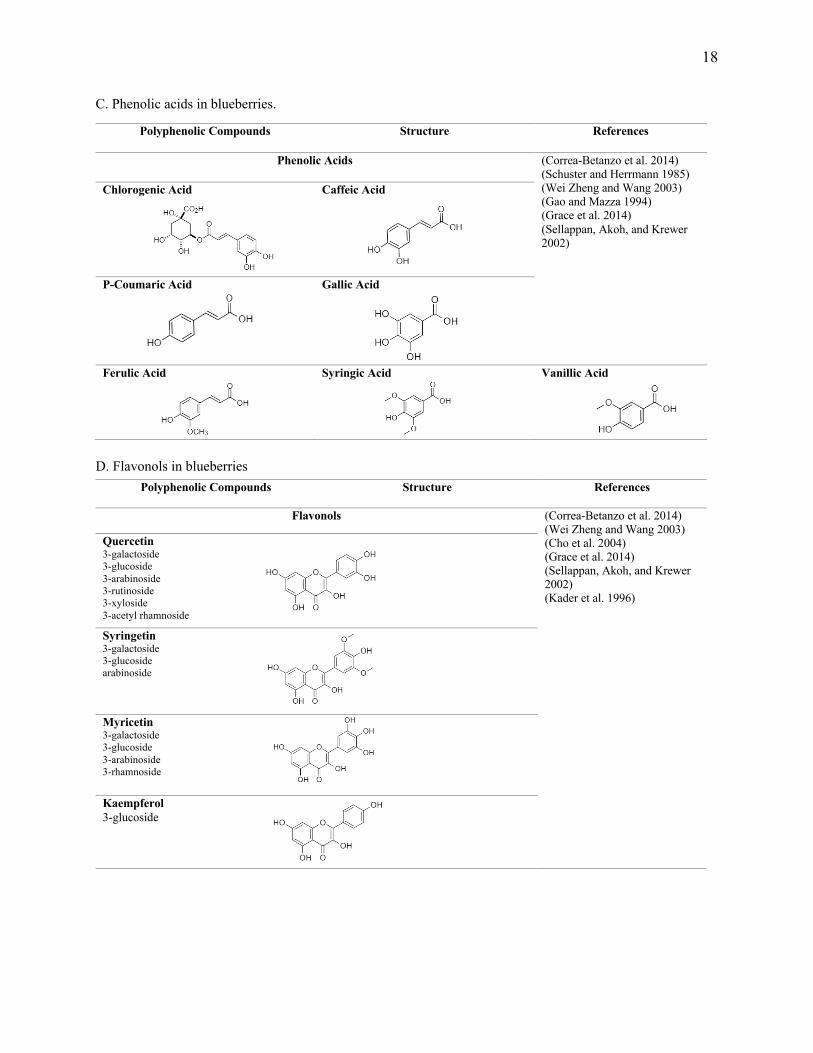
C. Phenolic acids in blueberries.
D. Flavonols in blueberries
Polyphenolic Compounds Structure References
Phenolic Acids (Correa-Betanzo et al. 2014) (Schuster and Herrmann 1985) (Wei Zheng and Wang 2003) (Gao and Mazza 1994) (Grace et al. 2014) (Sellappan, Akoh, and Krewer 2002)
Chlorogenic Acid Caffeic Acid
P-Coumaric Acid Gallic Acid
Ferulic Acid Syringic Acid Vanillic Acid
Polyphenolic Compounds Structure References
Flavonols (Correa-Betanzo et al. 2014) (Wei Zheng and Wang 2003) (Cho et al. 2004) (Grace et al. 2014) (Sellappan, Akoh, and Krewer 2002) (Kader et al. 1996)
Quercetin 3-galactoside
3-glucoside
3-arabinoside
3-rutinoside
3-xyloside
3-acetyl rhamnoside
Syringetin 3-galactoside
3-glucoside
arabinoside
Myricetin 3-galactoside
3-glucoside
3-arabinoside
3-rhamnoside Kaempferol 3-glucoside
19
With interest in enhancing the potential of polyphenols to deliver on these benefits,
phenotyping, including phenolic and micronutrient phenotyping, have been conducted on select
germplasm collections (Kader et al. 1996; Howard, Clark, and Brownmiller 2003; Kalt et al. 1999;
Connor et al. 2002; Timmers et al. 2017; Grace et al. 2014). Such insights have proven useful to
blueberry breeding programs, a relatively modern field, which has developed great interest as of
late. Common breeding objectives revolve around producing higher yields by improving overall
plant strength, in terms of disease resistance and inclement weather, as well as expanding the
harvest season. In addition to improving plant vigor, blueberry breeders aim to enhance
characteristics like flavor, size, and overall fruit quality (Moore 1965; Retamales and Hancock
2018; Prodorutti et al. 2007; Hancock et al. 2008). However, more recent strategies have narrowed
their focus on consumer-oriented fruit quality with the primary goal of improving the nutritional
value (Brennan 2008; Graham et al. 2004). Such an objective requires the in-depth investigation
of varied germplasms of blueberries to identify traits related to enhanced bioactivity (Scalzo et al.
2005; G. J. McDougall et al. 2005).
1.6. Bioavailability of polyphenols
Given the potential impacts of internal and external factors on the ultimate biological
activity of any dietary polyphenol, it would be inaccurate to assume that the most commonly
consumed polyphenols or foods that are the highest in polyphenol concentration are the most
biologically relevant (Bravo 1998). In this regard, it is critical to consider the ultimate delivery of
polyphenols from foods and as such introduce the concept of bioavailability as a factor when
considering fruit, vegetables and other polyphenol rich foods and associations to health.
Bioavailability, in regards to phytochemicals from the diet, is defined as the rate and extent
to which the active ingredient or active moiety is absorbed from the ingested matrix and becomes
20
available at the site of action (Neilson and Ferruzzi 2013). In the case of polyphenols
bioavailability is reportedly influenced by several factors including both food and host related
factors. While an individual’s genetics, microbiota, background diet and nutritional and
pathophysiological status have all been shown to impact bioavailability of polyphenols
(Fairweather-Tait and Southon 2003), food related factors are also critical to consider as they are
perhaps most modifiable. In the case of food, factors influencing bioavailability include fruit and
vegetable genetics (van der Sluis et al. 2001; DuPont et al. 2000), food formulation (Neilson and
Ferruzzi 2011; Tamura et al. 2007; Lesser, Cermak, and Wolffram 2004), as well as type and extent
of food processing (Ferracane et al. 2008; Miglio et al. 2008). Additionally, polyphenol chemical
structure, intestinal pH, interaction with other compounds, food matrix, environmental factors and
availability of digestive enzymes further impact potential release from the food matrix, stability to
the gastrointestinal conditions and ultimate absorption and metabolism (Scholz and Williamson
2013; Holst and Williamson 2008). In this context, bioaccessibility is defined as the fraction of
polyphenols released from the food matrix by normal digestion, are solubilized and recovered in
the intestinal lumen and thereby made available for absorption in the intestine (Saura-Calixto,
Serrano, and Goñi 2007). This metric encompasses release, stability and absorption potential of
polyphenols and is often used as a surrogate for bioavailability in the context of describing food
and matrix influences on bioavailability.
1.6.1. Digestion, absorption and metabolism of polyphenols
An overview of polyphenol bioaccessibility and bioavailability/metabolism adapted from
Ferruzzi and Neilson (2011) (Neilson and Ferruzzi 2011) can be seen in Figure 1.3. The process
of absorption of polyphenols from foods begins with mastication of the food within the oral cavity
and the initiation of the digestion process. The combination of chewing (mechanical tissue
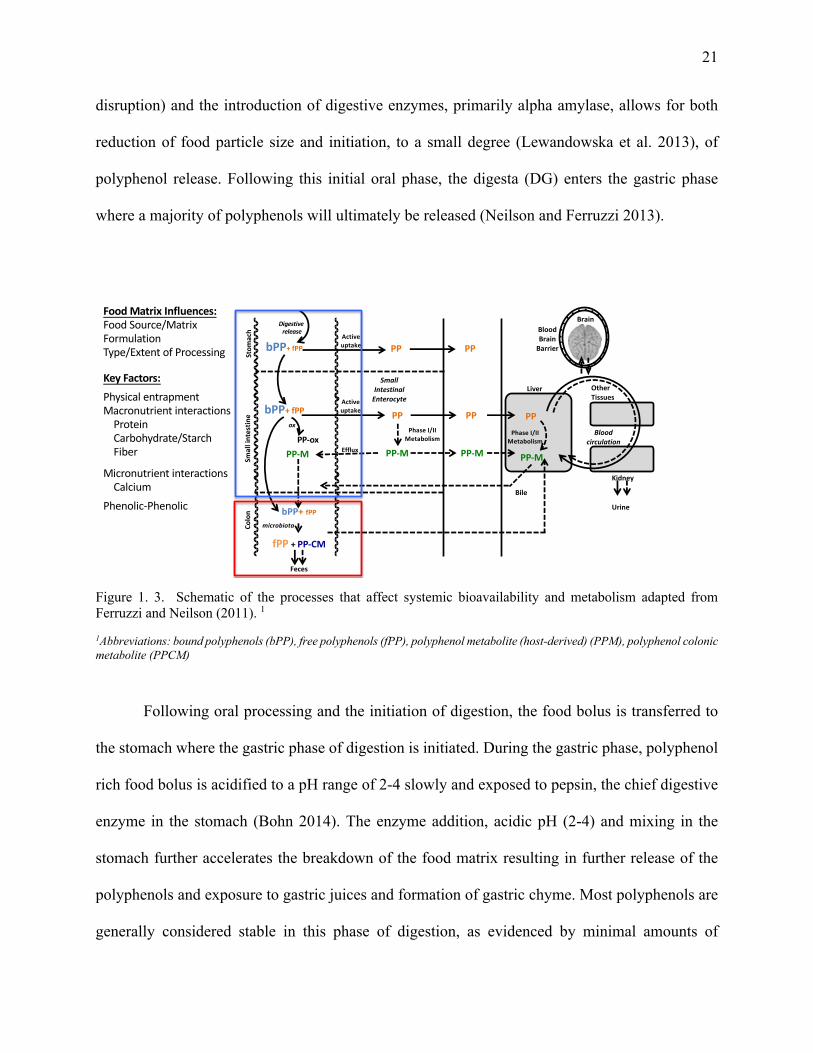
21
disruption) and the introduction of digestive enzymes, primarily alpha amylase, allows for both
reduction of food particle size and initiation, to a small degree (Lewandowska et al. 2013), of
polyphenol release. Following this initial oral phase, the digesta (DG) enters the gastric phase
where a majority of polyphenols will ultimately be released (Neilson and Ferruzzi 2013).
Figure 1. 3. Schematic of the processes that affect systemic bioavailability and metabolism adapted from Ferruzzi and Neilson (2011). 1
1Abbreviations: bound polyphenols (bPP), free polyphenols (fPP), polyphenol metabolite (host-derived) (PPM), polyphenol colonic metabolite (PPCM)
Following oral processing and the initiation of digestion, the food bolus is transferred to
the stomach where the gastric phase of digestion is initiated. During the gastric phase, polyphenol
rich food bolus is acidified to a pH range of 2-4 slowly and exposed to pepsin, the chief digestive
enzyme in the stomach (Bohn 2014). The enzyme addition, acidic pH (2-4) and mixing in the
stomach further accelerates the breakdown of the food matrix resulting in further release of the
polyphenols and exposure to gastric juices and formation of gastric chyme. Most polyphenols are
generally considered stable in this phase of digestion, as evidenced by minimal amounts of
PP
PP-M
PPActiveuptake
PP-M
Phase I/IIMetabolism
PP
PP-M
Phase I/IIMetabolism
Liver
Urine
Bile
PP-ox
ox
Colo
nSm
all i
ntes
tine
OtherTissues
Kidney
Bloodcirculation
bPP+ fPP
fPP + PP-CM
microbiota
Feces
PP-M Efflux
Stom
ach
Digestive release
bPP+ fPP
bPP+ fPP
Small Intestinal
Enterocyte
Activeuptake PP PP
BrainBloodBrain
Barrier
Adapted from Ferruzzi & Neilson Annual Review of Food Science and Technology. 2:125–151. 2011.
Food Matrix Influences:Food Source/MatrixFormulationType/Extent of Processing
Key Factors:Physical entrapmentMacronutrient interactions
ProteinCarbohydrate/StarchFiber
Micronutrient interactionsCalcium
Phenolic-Phenolic
22
degradation present in the literature (Y. Liu et al. 2014; Bermúdez-Soto, Tomás-Barberán, and
García-Conesa 2007; Tagliazucchi et al. 2010; Pérez-Vicente, Gil-Izquierdo, and García-Viguera
2002).
Following gastric digestion, the polyphenol rich gastric chyme is slowly released through
the pyloric sphincter to the upper small intestine (duodenum) where small intestinal phase of
digestion is initiated, including neutralization of the environment to pH of 5.5-7.4. At this stage
the largest extent of food disintegration takes place by the actions of enzymes secreted by the
pancreas and the liver including phospholipase, sterol esterase, amylase, carboxypeptidase,
trypsinogen, chymotrypsinogen, lipase, and bile salts (Bohn 2014). With complete digestion of
the food matrix to absorbable macronutrient units, further release of polyphenols will follow, as
will increased exposure to the elevated pH of the small intestinal lumen. Within the small intestine,
factors regarding chemical structure, degree of glycosylation acylation, derivative type,
conjugation with other phenolic acid, molecular size, degree of polymerization, and solubility will
heavily influence the stability of polyphenols, their release from undigested plant materials (e.g.
cell walls), and their ultimate rate of intestinal absorption (Bravo 1998).
Polyphenols, anthocyanins in particular, are noted to be highly unstable in the intestinal
phase, due to the weakly alkaline environment (Correa-Betanzo et al. 2014; Tagliazucchi et al.
2010; Bermúdez-Soto, Tomás-Barberán, and García-Conesa 2007). According to Liu et al. (2014),
blueberry anthocyanin content decreased by approximately 42% during simulated small intestinal
phase (Y. Liu et al. 2014). Notably, degree of glycosylation impacts potential absorption by
affecting chemical, physical and biological properties of the polyphenol. While aglycones can be
readily absorbed in the small intestine, most flavonoids are glycosylated or attached to sugars
(Tsao 2010). Here the glycosides must be hydrolyzed or cleaved from their sugar-portion to their
23
corresponding aglycones. Once in a simpler form, polyphenols may be taken up into the
enterocytes of either the small or large intestine by means of passive diffusion or facilitated
transport (Neilson and Ferruzzi 2013). This process is rather inefficient with typical absorption
rates ranging from 0.3-43% (Manach et al. 2005), while a significant portion of polyphenols from
fruits and vegetables remain in the gut lumen. The remaining unabsorbed phenolics continue to
the lower intestinal compartments (colon), where they are subject to interactions with native
microbiota which are capable of metabolizing polyphenols to a broad series of metabolites
including smaller molecular weight phenolic derivatives that are readily absorbed and
metabolized.
Once absorbed either in the upper or lower intestines, polyphenols or their microbial
metabolites, can be further metabolized by host systems to form conjugates including methyl,
glycine, glucuronic acid, or sulfate (Manach et al. 2004). The formation of metabolic conjugates
can dramatically alter the biological properties of the circulating metabolites. These metabolites
can move within bloodstream or be transported to reach target tissues via plasma proteins (Dangles
et al. 2001), or lipoproteins (Meng et al. 1999). Following transport in the bloodstream,
polyphenols can be distributed in most tissues and can cross the blood-brain barrier (Andres-
Lacueva et al. 2005). Ultimately, phenolic metabolites are excreted by means of the urinary route
or the biliary route. As such urine is a common target to assess ultimate flux of polyphenols through
humans.
1.7. Current models for assessing bioavailability
Various techniques to evaluate the bioavailability of polyphenols are leveraged today.
However, the best estimate is likely derived by combining the results from several different reliable
methods (Fairweather-Tait and Southon 2003). In order to precisely evaluate bioavailability
24
directly, researchers utilize human subjects and clinical testing as part of a comprehensive in vivo
approach. However, given their associated high cost and logistical challenges or
experimental/mechanistic questions not possible or ethical to conduct in humans, investigators do
choose alternative animal models as they have repeatedly proven valuable as a predictive measure
of bioavailability, metabolism and tissue distribution of polyphenols within humans.
In vivo bioavailability studies commonly incorporate pharmacokinetic (PK) analyses,
which encompass the absorption, distribution, metabolism, and excretion of a compound over time
(Turfus et al. 2017). Common parameters of PK are utilized in bioavailability research include
maximal plasma concentration (Cmax), time to reach Cmax, area under the plasma concentration-
time curve, elimination half-life, and relative urinary excretion (Manach et al. 2005). Many
researchers have investigated the combination of PK and extent of polyphenol absorption by
assessing direct measurements of a specific compound or its metabolites after the ingestion of a
single dose, provided as pure compound, plant extract, or whole food/beverage (Manach et al.
2005; Fairweather-Tait and Southon 2003).
1.7.1. In vivo approaches to measure polyphenol bioavailability (Human Clinical and Preclinical
Animal models)
Human clinical studies remain the “gold standard” for assessment of polyphenol
bioavailability and metabolism. In assessing bioavailability, human clinical trial designs leverage
two general approaches that rely on assessing response to an oral challenge in an acute or chronic
paradigm followed by collection and assessment of polyphenol metabolites in blood or urine
(Fairweather-Tait and Southon 2003; Manach et al. 2005). This allows for acute (0-48h)
pharmacokinetic responses to oral challenges to be constructed facilitating comparisons between
food matrices and formulations (Manach et al. 2005). Longer more chronic feeding trials offer the
25
possibility to assess changes in pharmacokinetics as well as metabolism through monitoring of
blood or urinary responses to long term feeding. Tissue distribution is not commonly seen in
human clinical trials, although reports of phenolics in human tissues beyond blood and urinary
include: human milk (Franke, Custer, and Tanaka 1998; B. J. Song, Jouni, and Ferruzzi 2013),
prostate tissue (Henning et al. 2006), breast tissue (Maubach et al. 2003), and colorectal tissue
(Garcea et al. 2005). In many trials, participants are often controlled in terms of factors that can
impact absorption and metabolism. These factors include nutrition status, body weight, presence
of disease or other metabolic disorder, typical polyphenol dietary exposure, supplement and drug
use as well as exercise (Ting et al. 2015). While clinical trials are regarded as the best method of
assessing human bioavailability, they remain expensive and time consuming. Furthermore, in the
context of screening large germplasm collections and proving phenotypic data on bioavailability,
they remain limited in their practical application as only a small number of samples can effectively
be run at a time without complicating the study design and eventual statistical comparisons.
As an alternative to human clinical settings, animal models remain widely applicable and
relevant as a model for human bioavailability and metabolism of polyphenols (Hunt and Roughead
2003). The literature is rich in animal models for polyphenol bioavailability studies, most
commonly including rodents (rat or mice), pig, dog, and rabbits (KARAKAYA 2004; Crespy et
al. 2002; Breinholt et al. 2000; Demrow, Slane, and Folts 1995; Nielsen et al. 2003; Wu et al.
2005; Hole et al. 2013; Cladis et al. 2019; Janle et al. 2014; Lesser, Cermak, and Wolffram 2004;
Chen et al. 2015; Ferruzzi et al. 2009; Pawlowski et al. 2014). Of these the rodent and porcine
models are most often used to assess both pharmacokinetic and tissue distribution of polyphenol
metabolites (KARAKAYA 2004; Janle et al. 2014). Animals offer the advantages of highly
defined nutritional and pathophysiological status, genetic uniformity and full control of
26
background and challenge diets (Hunt and Roughead 2003). Their relevance to humans and human
systems for absorption and metabolism, including digestive processing and transport/metabolism
of polyphenols is critical to consider. While the correlation between animals and human trials can
be tenuous at times (Shanks, Greek, and Greek 2009), valuable insights into tissue distribution
including to liver, brain, intestinal tract and other relevant targets remain perhaps one of the most
important aspects of animal research models as they place polyphenol metabolites at the target
tissues enabling mechanistic linkages between phenolic forms and disease prevention (Ferruzzi et
al. 2009; J. Wang et al. 2013; Chen et al. 2015). Therefore, advantages of animal models include
the fact that they offer a living system imitating the full dynamic physiological and physiochemical
events during the absorption, distribution, metabolism, and elimination of ingested polyphenols
without the cost associated with human clinical trials (Ting et al. 2015). However, differences in
body weight, organ size, hepatic/renal blood low, metabolism, distribution and elimination rate
have caused significant variation amongst these different animal species that must be accounted
for (Ting et al. 2015; Hunt and Roughead 2003). Further, while relevant animal models such as
rodents have been used to screen for genotypic differences in bioavailability including for
blueberries (Maiz et al. 2016), these models are still limited in throughput, similarly to human
clinal trials. While cost may not be as high, ethical considerations in the use of animals must be
included as a limitation.
1.7.2. In vitro screening of bioaccessibility as a surrogate for bioavailability
As previously mentioned, a prerequisite for bioavailability of phenolics is their
bioaccessibility. Consideration of their release from a food matrix by the actions of normal
digestion and stability/solubility in the gut lumen is both predictive of ultimate absorption in the
27
small intestine and also potential availability for interaction by gut microbial communities and
conversion to relevant metabolites in the lower gastrointestinal tract.
Unlike bioavailability, bioaccessibility of polyphenols can and is often determined by use
of in vitro methods. In particular, in vitro digestion models are designed to simulate the conditions
of the human gastrointestinal tract as they provide a valuable tool for characterization and
prediction of release, solubility and stability to physiological/digestive conditions that are relevant
to in vivo pharmacokinetics (Hur et al. 2011). Based on predetermined conditions of the upper and
lower gastrointestinal tract, these models range from relatively simple to complex, static to
dynamic, and inexpensive to expensive. However, relative to animal or human studies these
models are generally rapid, reproducible, and allow for comparative screening of food matrix and
formulation effects (Bohn et al. 2015). Additionally, their design makes them well suited to
screening larger sample throughput. However, as is the case with most models, the relevance to
bioavailability in humans always requires some level of validation (Fairweather-Tait and Southon
2003).
In general, in vitro digestion models fall under two categories, static/compartmental and
dynamic models. For the context of this review we will consider two common in vitro models
used to measure bioaccessibility of phenolics, including a multicompartmental static model and
the dynamic TNO gastrointestinal model (TIM-1). These models focus on the upper (oral, gastric
and small intestinal phases of digestion and do not include microbial fermentation. While several
in vitro models do focus on or include the lower intestinal phase of digestion (e.g. TIM-2, SHIME)
(Van de Wiele et al. 2015), they will not be the focus of this review.
28
A. Multicompartmental static gastrointestinal models
Several multicompartmental static in vitro digestion models have been proposed for the
investigation of micronutrient bioaccessibility. These models simulate the physiochemical
condition commonly beginning within the mouth, followed by the stomach, and ending in the small
intestine (Thakkar et al. 2007). Historically, a static in vitro model was developed and utilized to
assess the bioavailability of minerals, such as iron (D. D. Miller et al. 1981; Gangloff et al. 1996)
and phosphorous (J. Liu, Ledoux, and Veum 1998) from foods. To evaluate iron bioaccessibility,
Miller et al. (1981) relied on gastric and small intestinal digestion followed by dialysis of digestate
to resolve bioaccessible iron (as dialyzable iron (D. D. Miller et al. 1981). Having found good
correlation to in vivo iron bioavailability (r=0.93-0.99) (D. D. Miller et al. 1981) interest in
adaptation of these models to other micronutrients and phytochemicals expanded. In 1999, Garrett
et al. adapted conditions in the model of Miller et al. (1981) to characterize bioaccessibility of fat-
soluble carotenoids from fruits and vegetables (Garrett, Failla, and Sarama 1999). In their model,
Garrett et al. (1999) focused on mimicking gastric and small intestinal conditions to digest fruits
and vegetables in the presence of added dietary lipid to facilitate release and transfer of fat-soluble
carotenoids to bile salt lipid micelles. This process of micellarization is key to solubilization of
carotenoids in the small intestinal lumen and allows for easy determination of their fractional
bioaccessibility (Garrett, Failla, and Sarama 1999). The model was further validated against human
clinical responses and found to be highly correlated to the bioavailability of α- and γ-tocopherol,
β-carotene, lycopene, and lutein (r=0.98) in humans (Reboul et al. 2006), therefore suggesting its
potential use as a predictive tool to assess food matrix and formulation factors that could influence
bioavailability of these fat solubles.
29
Over the years, the model has been further refined and adapted to successfully evaluate
bioavailability of various sources (Table 1.2) of polyphenols. Parameters of the Garrett et al.
(1999), model were successfully modified by our group to screen the effects of formulation factors
on the bioaccessibility of flavan-3-ols from green tea (Green, Murphy, and Ferruzzi 2007).
Compared to solubility, the main driver of bioaccessibility was observed to be modification of the
chemical stability of flavan-3-ols to elevated pH in small intestinal phases that fostered auto-
oxidative reactions even under low oxygen tensions (Neilson et al. 2007). These findings led to a
comparative assessment in vitro and in vivo (in a rodent model) of green tea formulation factors
whereby the in vitro model showed high predictability to in vivo plasma pharmacokinetics (Peters
et al. 2010).
Subsequent adaptation of our manual three compartment static in vitro model (Figure 1.4,
Table 1.3), described by our group to assess phenolics from fruits and juices was further adapted
by Moser et al. (2016) (Moser et al. 2016). This model is essentially a derivative of previous
models, including that of Garrett et al. (1999), but adapted for consideration of digestion of high
carbohydrate foods and beverages. The models rely on commercially available enzyme sources
and are executed in 15 or 50 mL test tubes. Inclusion of an oral phase and amylase treatment was
a critical adaptation applied for assessment of starchy foods (Thakkar et al. 2007), such as cereal
grains (Kean, Hamaker, and Ferruzzi 2008), and continued in the Moser et al. (2016) model. This
ultimately provided a broader model suitable for screening of solid and liquid foods to assess the
impact of food structure/form as well as formulation on polyphenol bioaccessibility (Moser et al.
2016).This model has been applied by our group for the assessment of these factors across a wide
array of foods including tea (Moser et al. 2014; Green, Murphy, and Ferruzzi 2007), wholegrains
(Li et al. 2016), and grape juice (Moser et al. 2016).
30
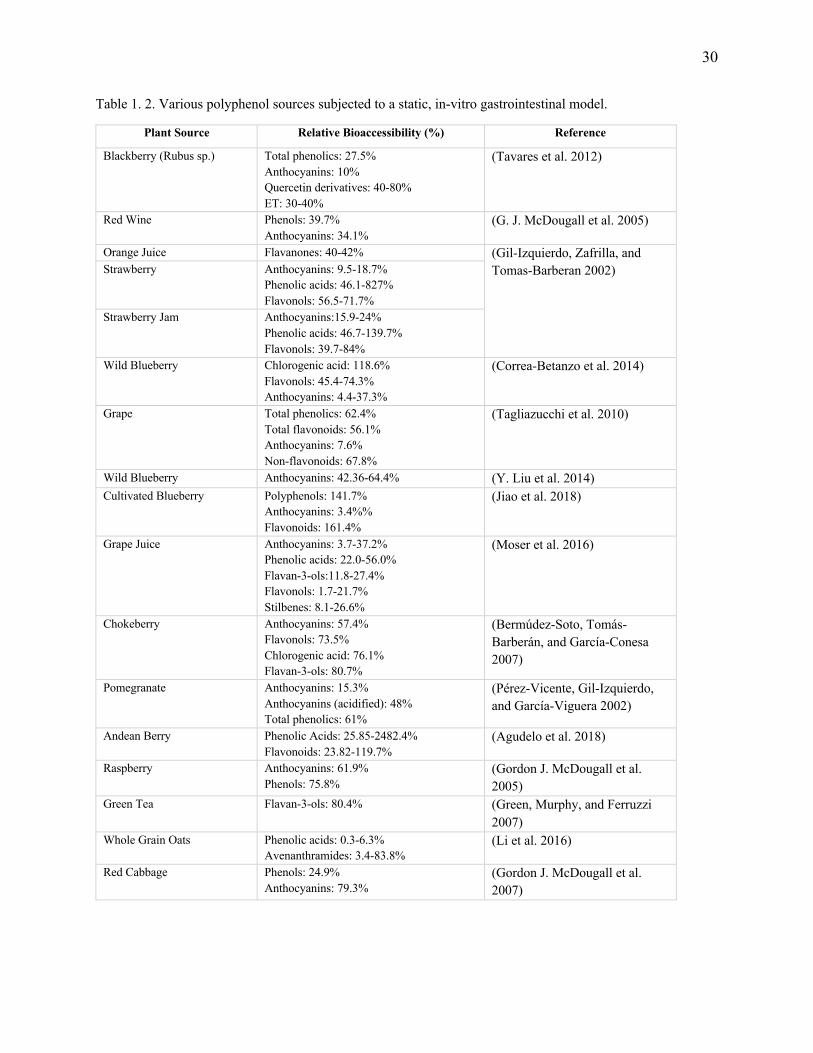
Table 1. 2. Various polyphenol sources subjected to a static, in-vitro gastrointestinal model.
Plant Source Relative Bioaccessibility (%) Reference
Blackberry (Rubus sp.) Total phenolics: 27.5% Anthocyanins: 10% Quercetin derivatives: 40-80% ET: 30-40%
(Tavares et al. 2012)
Red Wine Phenols: 39.7% Anthocyanins: 34.1%
(G. J. McDougall et al. 2005)
Orange Juice Flavanones: 40-42% (Gil-Izquierdo, Zafrilla, and Tomas-Barberan 2002) Strawberry Anthocyanins: 9.5-18.7%
Phenolic acids: 46.1-827% Flavonols: 56.5-71.7%
Strawberry Jam Anthocyanins:15.9-24% Phenolic acids: 46.7-139.7% Flavonols: 39.7-84%
Wild Blueberry Chlorogenic acid: 118.6% Flavonols: 45.4-74.3% Anthocyanins: 4.4-37.3%
(Correa-Betanzo et al. 2014)
Grape Total phenolics: 62.4% Total flavonoids: 56.1% Anthocyanins: 7.6% Non-flavonoids: 67.8%
(Tagliazucchi et al. 2010)
Wild Blueberry Anthocyanins: 42.36-64.4% (Y. Liu et al. 2014) Cultivated Blueberry Polyphenols: 141.7%
Anthocyanins: 3.4%% Flavonoids: 161.4%
(Jiao et al. 2018)
Grape Juice Anthocyanins: 3.7-37.2% Phenolic acids: 22.0-56.0% Flavan-3-ols:11.8-27.4% Flavonols: 1.7-21.7% Stilbenes: 8.1-26.6%
(Moser et al. 2016)
Chokeberry Anthocyanins: 57.4% Flavonols: 73.5% Chlorogenic acid: 76.1% Flavan-3-ols: 80.7%
(Bermúdez-Soto, Tomás-Barberán, and García-Conesa 2007)
Pomegranate Anthocyanins: 15.3% Anthocyanins (acidified): 48% Total phenolics: 61%
(Pérez-Vicente, Gil-Izquierdo, and García-Viguera 2002)
Andean Berry Phenolic Acids: 25.85-2482.4% Flavonoids: 23.82-119.7%
(Agudelo et al. 2018)
Raspberry Anthocyanins: 61.9% Phenols: 75.8%
(Gordon J. McDougall et al. 2005)
Green Tea Flavan-3-ols: 80.4% (Green, Murphy, and Ferruzzi 2007)
Whole Grain Oats Phenolic acids: 0.3-6.3% Avenanthramides: 3.4-83.8%
(Li et al. 2016)
Red Cabbage Phenols: 24.9% Anthocyanins: 79.3%
(Gordon J. McDougall et al. 2007)
31
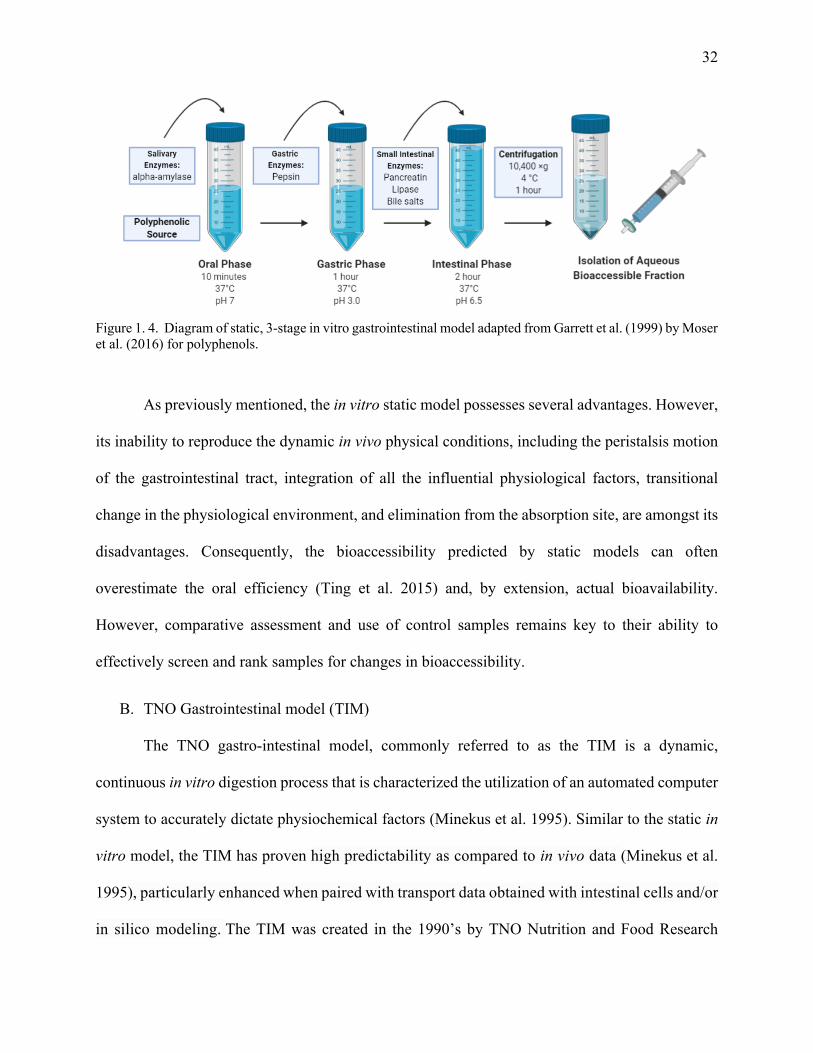
Introduction to this model begins with the selection and processing of the polyphenol
source, such as a fruit, vegetable, or beverage (ie. tea, wine, coffee, etc.). In the case of whole
foods, they can either be mechanically processed orally (Walsh et al. 2003) or foods can be
homogenized and introduced as semi solid or liquid aliquots to the oral phase of digestion. The
oral phase includes exposure to the enzyme alpha-amylase, but also includes exposure to simulated
saliva containing electrolytes and mucin (Oomen et al. 2003). The combination of oral phase and
test material is then subjected to gentle mixing in a temperature-controlled incubator for 10 min to
ensure proper exposure. The primary goal of this phase is not to mimic fully the conditions of the
mouth, but rather the broader extent of oral digestion which continues with amylase activity
following transit to the stomach for a period of time (Oomen et al. 2003; Thakkar et al. 2007).
Following oral digestion, the gastric phase is initiated by adjustment of the bolus pH to
between 2 and 3.5 and addition of a porcine pepsin solution. Gastric digestion marks the beginning
of protein breakdown and the initial disintegration of whole food matrices. Gastric phase can be
adjusted to last between 30-120min, however 60 minutes is considered a standard by most models
(Garrett, Failla, and Sarama 1999; Green, Murphy, and Ferruzzi 2007). Following gastric
digestion, the small intestinal phase is initiated by pH adjustment of the chyme to 5.5-7.4 with
NaHCO3. After, a cocktail containing small intestinal enzymes (pancreatin, lipase, and porcine
bile salts) is added to the reaction. Sample volume is then standardized, and the intestinal phase of
digestion is continued under gentle mixing for 2 hours at 370C. Following completion of the oral,
gastric and small intestinal digestion, finished digesta is typically centrifuged and filtered to isolate
the aqueous bioaccessible fractions. Bioaccessibility is then determined by quantification of the
phenolics in the aqueous fraction relative to the starting content in the raw material (Green,
Murphy, and Ferruzzi 2007).
32
Figure 1. 4. Diagram of static, 3-stage in vitro gastrointestinal model adapted from Garrett et al. (1999) by Moser et al. (2016) for polyphenols.
As previously mentioned, the in vitro static model possesses several advantages. However,
its inability to reproduce the dynamic in vivo physical conditions, including the peristalsis motion
of the gastrointestinal tract, integration of all the influential physiological factors, transitional
change in the physiological environment, and elimination from the absorption site, are amongst its
disadvantages. Consequently, the bioaccessibility predicted by static models can often
overestimate the oral efficiency (Ting et al. 2015) and, by extension, actual bioavailability.
However, comparative assessment and use of control samples remains key to their ability to
effectively screen and rank samples for changes in bioaccessibility.
B. TNO Gastrointestinal model (TIM)
The TNO gastro-intestinal model, commonly referred to as the TIM is a dynamic,
continuous in vitro digestion process that is characterized the utilization of an automated computer
system to accurately dictate physiochemical factors (Minekus et al. 1995). Similar to the static in
vitro model, the TIM has proven high predictability as compared to in vivo data (Minekus et al.
1995), particularly enhanced when paired with transport data obtained with intestinal cells and/or
in silico modeling. The TIM was created in the 1990’s by TNO Nutrition and Food Research
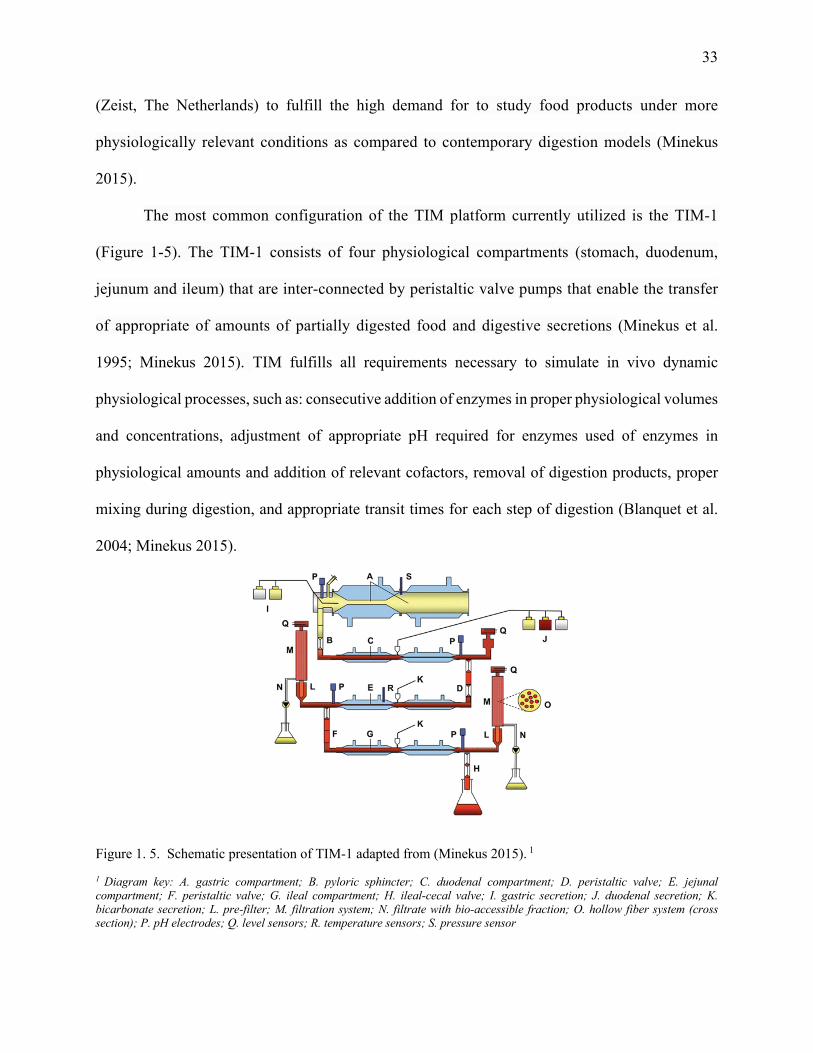
33
(Zeist, The Netherlands) to fulfill the high demand for to study food products under more
physiologically relevant conditions as compared to contemporary digestion models (Minekus
2015).
The most common configuration of the TIM platform currently utilized is the TIM-1
(Figure 1-5). The TIM-1 consists of four physiological compartments (stomach, duodenum,
jejunum and ileum) that are inter-connected by peristaltic valve pumps that enable the transfer
of appropriate of amounts of partially digested food and digestive secretions (Minekus et al.
1995; Minekus 2015). TIM fulfills all requirements necessary to simulate in vivo dynamic
physiological processes, such as: consecutive addition of enzymes in proper physiological volumes
and concentrations, adjustment of appropriate pH required for enzymes used of enzymes in
physiological amounts and addition of relevant cofactors, removal of digestion products, proper
mixing during digestion, and appropriate transit times for each step of digestion (Blanquet et al.
2004; Minekus 2015).
Figure 1. 5. Schematic presentation of TIM-1 adapted from (Minekus 2015). 1
1 Diagram key: A. gastric compartment; B. pyloric sphincter; C. duodenal compartment; D. peristaltic valve; E. jejunal compartment; F. peristaltic valve; G. ileal compartment; H. ileal-cecal valve; I. gastric secretion; J. duodenal secretion; K. bicarbonate secretion; L. pre-filter; M. filtration system; N. filtrate with bio-accessible fraction; O. hollow fiber system (cross section); P. pH electrodes; Q. level sensors; R. temperature sensors; S. pressure sensor
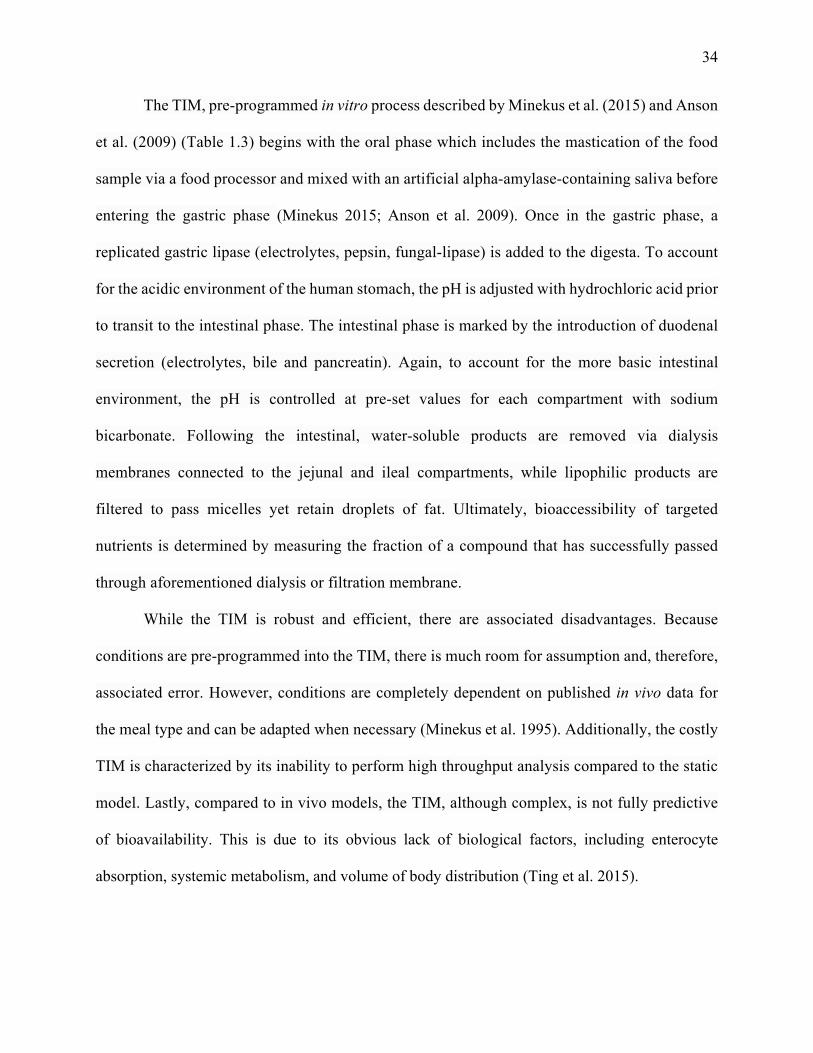
34
The TIM, pre-programmed in vitro process described by Minekus et al. (2015) and Anson
et al. (2009) (Table 1.3) begins with the oral phase which includes the mastication of the food
sample via a food processor and mixed with an artificial alpha-amylase-containing saliva before
entering the gastric phase (Minekus 2015; Anson et al. 2009). Once in the gastric phase, a
replicated gastric lipase (electrolytes, pepsin, fungal-lipase) is added to the digesta. To account
for the acidic environment of the human stomach, the pH is adjusted with hydrochloric acid prior
to transit to the intestinal phase. The intestinal phase is marked by the introduction of duodenal
secretion (electrolytes, bile and pancreatin). Again, to account for the more basic intestinal
environment, the pH is controlled at pre-set values for each compartment with sodium
bicarbonate. Following the intestinal, water-soluble products are removed via dialysis
membranes connected to the jejunal and ileal compartments, while lipophilic products are
filtered to pass micelles yet retain droplets of fat. Ultimately, bioaccessibility of targeted
nutrients is determined by measuring the fraction of a compound that has successfully passed
through aforementioned dialysis or filtration membrane.
While the TIM is robust and efficient, there are associated disadvantages. Because
conditions are pre-programmed into the TIM, there is much room for assumption and, therefore,
associated error. However, conditions are completely dependent on published in vivo data for
the meal type and can be adapted when necessary (Minekus et al. 1995). Additionally, the costly
TIM is characterized by its inability to perform high throughput analysis compared to the static
model. Lastly, compared to in vivo models, the TIM, although complex, is not fully predictive
of bioavailability. This is due to its obvious lack of biological factors, including enterocyte
absorption, systemic metabolism, and volume of body distribution (Ting et al. 2015).
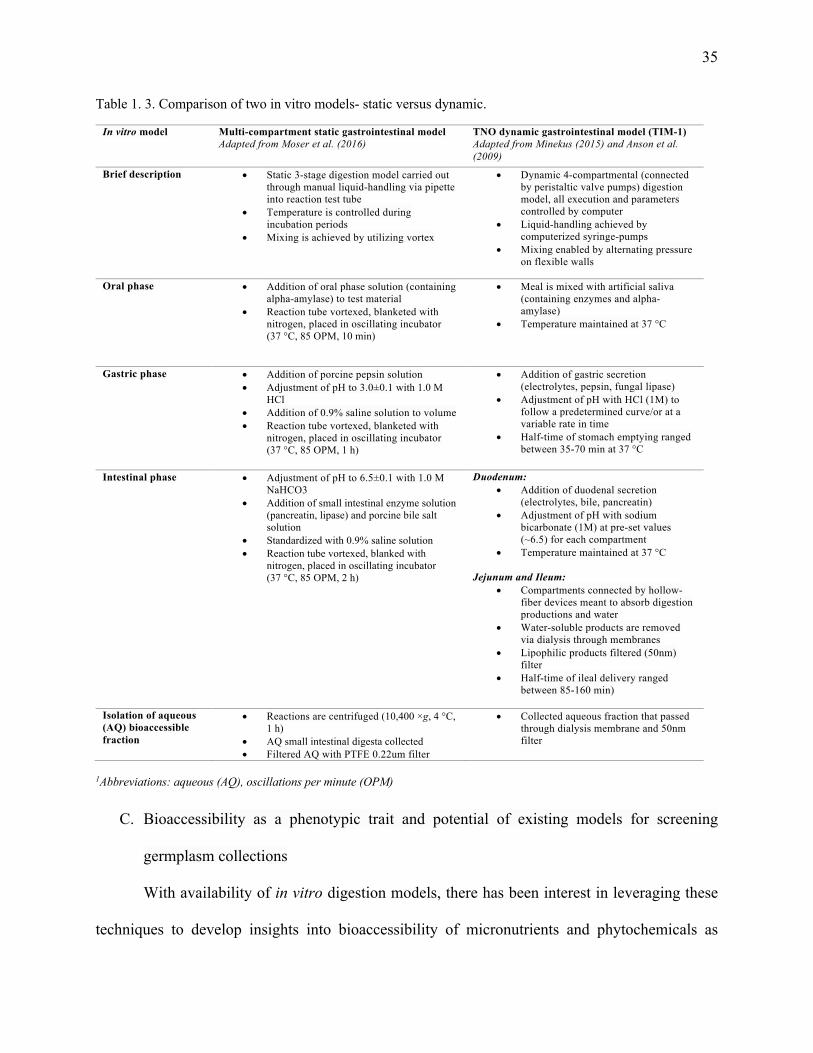
35
Table 1. 3. Comparison of two in vitro models- static versus dynamic.
In vitro model Multi-compartment static gastrointestinal model Adapted from Moser et al. (2016)
TNO dynamic gastrointestinal model (TIM-1) Adapted from Minekus (2015) and Anson et al. (2009)
Brief description • Static 3-stage digestion model carried out
through manual liquid-handling via pipette
into reaction test tube
• Temperature is controlled during
incubation periods
• Mixing is achieved by utilizing vortex
• Dynamic 4-compartmental (connected
by peristaltic valve pumps) digestion
model, all execution and parameters
controlled by computer
• Liquid-handling achieved by
computerized syringe-pumps
• Mixing enabled by alternating pressure
on flexible walls
Oral phase • Addition of oral phase solution (containing
alpha-amylase) to test material
• Reaction tube vortexed, blanketed with
nitrogen, placed in oscillating incubator
(37 °C, 85 OPM, 10 min)
• Meal is mixed with artificial saliva
(containing enzymes and alpha-
amylase)
• Temperature maintained at 37 °C
Gastric phase • Addition of porcine pepsin solution
• Adjustment of pH to 3.0±0.1 with 1.0 M
HCl
• Addition of 0.9% saline solution to volume
• Reaction tube vortexed, blanketed with
nitrogen, placed in oscillating incubator
(37 °C, 85 OPM, 1 h)
• Addition of gastric secretion
(electrolytes, pepsin, fungal lipase)
• Adjustment of pH with HCl (1M) to
follow a predetermined curve/or at a
variable rate in time
• Half-time of stomach emptying ranged
between 35-70 min at 37 °C
Intestinal phase • Adjustment of pH to 6.5±0.1 with 1.0 M
NaHCO3
• Addition of small intestinal enzyme solution
(pancreatin, lipase) and porcine bile salt
solution
• Standardized with 0.9% saline solution
• Reaction tube vortexed, blanked with
nitrogen, placed in oscillating incubator
(37 °C, 85 OPM, 2 h)
Duodenum: • Addition of duodenal secretion
(electrolytes, bile, pancreatin)
• Adjustment of pH with sodium
bicarbonate (1M) at pre-set values
(~6.5) for each compartment
• Temperature maintained at 37 °C
Jejunum and Ileum: • Compartments connected by hollow-
fiber devices meant to absorb digestion
productions and water
• Water-soluble products are removed
via dialysis through membranes
• Lipophilic products filtered (50nm)
filter
• Half-time of ileal delivery ranged
between 85-160 min)
Isolation of aqueous (AQ) bioaccessible fraction
• Reactions are centrifuged (10,400 ×g, 4 °C,
1 h)
• AQ small intestinal digesta collected
• Filtered AQ with PTFE 0.22um filter
• Collected aqueous fraction that passed
through dialysis membrane and 50nm
filter
1Abbreviations: aqueous (AQ), oscillations per minute (OPM)
C. Bioaccessibility as a phenotypic trait and potential of existing models for screening
germplasm collections
With availability of in vitro digestion models, there has been interest in leveraging these
techniques to develop insights into bioaccessibility of micronutrients and phytochemicals as
36
phenotypic traits appropriate to guide breeding and processing practices that could enhance
bioavailability. Application of static models to screen variation in bioaccessibility has been noted
in the identification of iron bioaccessibility as a genetically variable trait in maize (Šimić et al.
2009) as well as variations in beta-carotene bioaccessibility between biofortified cassava
genotypes (J. Aragón et al. 2018). Similarly, Lipkie et al. (2013) assessed the delivery of
provitamin A carotenoids from a limited set transgenic biofortified sorghum genotypes (Lipkie et
al. 2013). These efforts served as a support to scientist breeding biofortified grains for at risk
populations. Regarding polyphenols, such a model has recently been utilized to classify phenolic
bioaccessibility as a genetically variable trait amongst 10 different oat cultivars (Li et al. 2016).
Of these studies, the extent of throughput was seen to be relatively limited and not suitable for
broader genomic work. The greatest application was observed within the assessment of phenolics
in oats and the beta-carotene in the biofortified cassava as they both examined 10 different
genotypes (Li et al. 2016; J. Aragón et al. 2018). Therefore, to gain a more comprehensive
understanding of bioaccessibility as a genetically variable trait, more genotypes will need to be
analyzed. Additionally, when observing variation in bioaccessibility, it is difficult to attribute
variation to genotype solely, as processing and nutrient composition influence bioaccessibility as
well.
While having proved promising for relatively limited comparisons and sample sizes,
interest to expand to phenotyping of large germplasm collection suitable for genomic studies
(100’s to 1000’s of genotypes) has grown. However, in practice, limitations of current digestion
models remain. Specifically, while dynamic models such as the previously discussed TIM are most
similar to humans, they remain very limited in throughput and high in cost. Considering the need
for low cost, rapid, high-throughput models, the static models offers the potential for adaptation to
37
high throughput workflows. However as currently designed, they remain reliant on manual
execution and are time-consuming. Furthermore, they typically require large quantities of sample
and associated materials, thus constituting a challenge for germplasm collections and creating a
bottleneck for high-throughput analysis (Hansen et al. 2009). While such models are considered
relatively high-throughput, low cost system (Beiseigel et al. 2007), the turn-out of several hundred
samples over a few months is limiting the potential to leverage variation of traits related to
bioavailability. Therefore, to develop insights into genetic influences of bioaccessibility, a model
able to screen larger germplasm collections is necessary.
1.8. Research Objectives
To advance our ability to improve delivery of fruit and vegetable bioactives, our overall
objective is to develop high throughput in vitro digestion model suitable for screening of large
germplasm collections of target plant foods for phytochemical bioaccessibility. We propose to
develop and validate an automated static three compartment in vitro gastrointestinal model that
has high correlation to established models and in vivo bioavailability with a focus on blueberry
and blueberry phenolics.
Aim 1: Adapt an existing in vitro digestion model for high throughput screening of polyphenol
bioaccessibility from blueberry fruit.
Working Hypothesis: In vitro digestive conditions previously developed for the screening of
polyphenols by Moser et al. (2016) can be adapted to semi-automation by use of a liquid-handling
robot (Tecan Evo 150) and sample size and volume reductions to increase throughput from
approximately a maximum of 24 samples per day to 96+ samples per day while maintaining similar
predictive bioaccessibility capacity.

38
General approach: Bioaccessibility of blueberry polyphenols will be assessed using a three-stage
in vitro digestion with compartmental oral, gastric and small intestinal conditions previously
described by Moser et al. (2016).This model will be adapted for automation and volumes using
the Tecan EVO 150 fluid handling robot for semi-automation and enhanced throughput.
Current static model throughput is typically in the 10’s per day, while our goal is to automate
100+ per day.
Aim 2: Assess the potential for variation in phenolic bioaccessibility from a limited selection
(n=33) of blueberry genotypes derived form a mapping population DraperXJewel (DxJ).
Working hypothesis: The developed adapted model will serve as an efficient method for
screening large populations of blueberry enabling the potential to leverage variation of traits
related to bioavailability.
General Approach: Phenotyping of bioaccessibility traits will be analyzed in a small population
(n=33) of blueberries chosen from a select mapping population (DXJ) by applying the best
developed modified high-throughput method, based on the information discussed in Aim 1.
Variation between blueberry genotypes as well as differences in phenolic profile and
bioaccessibility data (relative and absolute) will be assessed.
39
1.9. REFERENCES
Adlercreutz, Herman, and Witold Mazur. 1997. “Phyto-Oestrogens and Western Diseases.” Annals of Medicine 29 (2): 95–120. https://doi.org/10.3109/07853899709113696.
Agudelo, Carlos D., Ivan Luzardo-Ocampo, Rocio Campos-Vega, Guadalupe Loarca-Piña, and María E. Maldonado-Celis. 2018. “Bioaccessibility during In Vitro Digestion and Antiproliferative Effect of Bioactive Compounds from Andean Berry (Vaccinium Meridionale Swartz) Juice.” Journal of Agricultural and Food Chemistry 66 (28): 7358–66. https://doi.org/10.1021/acs.jafc.8b01604.
Akobundu, Ucheoma O., Nancy L. Cohen, Mary J. Laus, Marsha J. Schulte, and Margaret N. Soussloff. 2004. “Vitamins A and C, Calcium, Fruit, and Dairy Products Are Limited in Food Pantries.” Journal of the American Dietetic Association 104 (5): 811–13. https://doi.org/10.1016/j.jada.2004.03.009.
Andersen, Maj-Britt Schmidt, Mette Kristensen, Claudine Manach, Estelle Pujos-Guillot, Sanne Kellebjerg Poulsen, Thomas Meinert Larsen, Arne Astrup, and Lars Dragsted. 2014. “Discovery and Validation of Urinary Exposure Markers for Different Plant Foods by Untargeted Metabolomics.” Analytical and Bioanalytical Chemistry 406 (7): 1829–44. https://doi.org/10.1007/s00216-013-7498-5.
Andres-Lacueva, Cristina, Barbara Shukitt-Hale, Rachel L. Galli, Olga Jauregui, Rosa M. Lamuela-Raventos, and James A. Joseph. 2005. “Anthocyanins in Aged Blueberry-Fed Rats Are Found Centrally and May Enhance Memory.” Nutritional Neuroscience 8 (2): 111–20. https://doi.org/10.1080/10284150500078117.
Anson, Nuria Mateo, Emilia Selinheimo, Rob Havenaar, Anna-Marja Aura, Ismo Mattila, Pekka Lehtinen, Aalt Bast, Kaisa Poutanen, and Guido R. M. M. Haenen. 2009. “Bioprocessing of Wheat Bran Improves in Vitro Bioaccessibility and Colonic Metabolism of Phenolic Compounds.” Journal of Agricultural and Food Chemistry 57 (14): 6148–55. https://doi.org/10.1021/jf900492h.
Appel, Lawrence J., Thomas J. Moore, Eva Obarzanek, William M. Vollmer, Laura P. Svetkey, Frank M. Sacks, George A. Bray, et al. 1997. “A Clinical Trial of the Effects of Dietary Patterns on Blood Pressure.” New England Journal of Medicine 336 (16): 1117–24. https://doi.org/10.1056/NEJM199704173361601.
Arai, Yusuke, Shaw Watanabe, Mitsuru Kimira, Kayoko Shimoi, Rika Mochizuki, and Naohide Kinae. 2000. “Dietary Intakes of Flavonols, Flavones and Isoflavones by Japanese Women and the Inverse Correlation between Quercetin Intake and Plasma LDL Cholesterol Concentration.” The Journal of Nutrition 130 (9): 2243–50. https://doi.org/10.1093/jn/130.9.2243.
Arts, I. C., B. van de Putte, and P. C. Hollman. 2000. “Catechin Contents of Foods Commonly Consumed in The Netherlands. 1. Fruits, Vegetables, Staple Foods, and Processed Foods.” Journal of Agricultural and Food Chemistry 48 (5): 1746–51. https://doi.org/10.1021/jf000025h.
Austin, James E., and Jaan Elias. 1996. “Supermarkets in Inner Cities,” March. https://www.hbs.edu/faculty/Pages/item.aspx?num=23923.
Bagchi, D., C. K. Sen, M. Bagchi, and M. Atalay. 2004. “Anti-Angiogenic, Antioxidant, and Anti-Carcinogenic Properties of a Novel Anthocyanin-Rich Berry Extract Formula.” Biochemistry (Moscow) 69 (1): 75–80. https://doi.org/10.1023/B:BIRY.0000016355.19999.93.
40
Barnes, Jeremy S., Hien P. Nguyen, Sijia Shen, and Kevin A. Schug. 2009. “General Method for Extraction of Blueberry Anthocyanins and Identification Using High Performance Liquid Chromatography–Electrospray Ionization-Ion Trap-Time of Flight-Mass Spectrometry.” Journal of Chromatography A 1216 (23): 4728–35. https://doi.org/10.1016/j.chroma.2009.04.032.
Basu, Arpita, Mei Du, Misti J. Leyva, Karah Sanchez, Nancy M. Betts, Mingyuan Wu, Christopher E. Aston, and Timothy J. Lyons. 2010. “Blueberries Decrease Cardiovascular Risk Factors in Obese Men and Women with Metabolic Syndrome.” The Journal of Nutrition 140 (9): 1582–87. https://doi.org/10.3945/jn.110.124701.
Bazzano, Lydia A., Jiang He, Lorraine G. Ogden, Catherine M. Loria, Suma Vupputuri, Leann Myers, and Paul K. Whelton. 2002. “Fruit and Vegetable Intake and Risk of Cardiovascular Disease in US Adults: The First National Health and Nutrition Examination Survey Epidemiologic Follow-up Study.” The American Journal of Clinical Nutrition 76 (1): 93–99. https://doi.org/10.1093/ajcn/76.1.93.
Beiseigel, Jeannemarie M., Janet R. Hunt, Raymond P. Glahn, Ross M. Welch, Abebe Menkir, and Bussie B. Maziya-Dixon. 2007. “Iron Bioavailability from Maize and Beans: A Comparison of Human Measurements with Caco-2 Cell and Algorithm Predictions.” The American Journal of Clinical Nutrition 86 (2): 388–96. https://doi.org/10.1093/ajcn/86.2.388.
Ben Haj Yahia, Imen, Yosr Zaouali, Maria Letizia Ciavatta, Alessia Ligresti, Rym Jaouadi, Mohamed Boussaid, and Adele Cutignano. 2019. “Polyphenolic Profiling, Quantitative Assessment and Biological Activities of Tunisian Native Mentha Rotundifolia (L.) Huds.” Molecules 24 (13): 2351. https://doi.org/10.3390/molecules24132351.
Bermúdez-Soto, M. -J., F. -A. Tomás-Barberán, and M. -T. García-Conesa. 2007. “Stability of Polyphenols in Chokeberry (Aronia Melanocarpa) Subjected to in Vitro Gastric and Pancreatic Digestion.” Food Chemistry 102 (3): 865–74. https://doi.org/10.1016/j.foodchem.2006.06.025.
Bianchini, F., and H. Vainio. 2003. “Wine and Resveratrol: Mechanisms of Cancer Prevention?” European Journal of Cancer Prevention 12 (5): 417.
Blair, Dorothy, Carol C. Giesecke, and Sandra Sherman. 1991. “A Dietary, Social and Economic Evaluation of the Philadelphia Urban Gardening Project.” Journal of Nutrition Education 23 (4): 161–67. https://doi.org/10.1016/S0022-3182(12)81191-5.
Blanquet, Stéphanie, Evelijn Zeijdner, Erick Beyssac, Jean-Philippe Meunier, Sylvain Denis, Robert Havenaar, and Monique Alric. 2004. “A Dynamic Artificial Gastrointestinal System for Studying the Behavior of Orally Administered Drug Dosage Forms Under Various Physiological Conditions.” Pharmaceutical Research 21 (4): 585–91. https://doi.org/10.1023/B:PHAM.0000022404.70478.4b.
Bohn, Torsten. 2014. “Dietary Factors Affecting Polyphenol Bioavailability.” Nutrition Reviews 72 (7): 429–52. https://doi.org/10.1111/nure.12114.
Bohn, Torsten, Gordon J. McDougall, Amparo Alegría, Marie Alminger, Eva Arrigoni, Anna-Marja Aura, Catarina Brito, et al. 2015. “Mind the Gap—Deficits in Our Knowledge of Aspects Impacting the Bioavailability of Phytochemicals and Their Metabolites—a Position Paper Focusing on Carotenoids and Polyphenols.” Molecular Nutrition & Food Research 59 (7): 1307–23. https://doi.org/10.1002/mnfr.201400745.
Brat, Pierre, Stéphane Georgé, Annick Bellamy, Laure Du Chaffaut, Augustin Scalbert, Louise Mennen, Nathalie Arnault, and Marie Josèphe Amiot. 2006. “Daily Polyphenol Intake in
41
France from Fruit and Vegetables.” The Journal of Nutrition 136 (9): 2368–73. https://doi.org/10.1093/jn/136.9.2368.
Bravo, Laura. 1998. “Polyphenols: Chemistry, Dietary Sources, Metabolism, and Nutritional Significance.” Nutrition Reviews 56 (11): 317–33. https://doi.org/10.1111/j.1753-4887.1998.tb01670.x.
Breinholt, V, A Hossaini, G. W Svendsen, C Brouwer, and S. E Nielsen. 2000. “Estrogenic Activity of Flavonoids in Mice. The Importance of Estrogen Receptor Distribution, Metabolism and Bioavailability.” Food and Chemical Toxicology 38 (7): 555–64. https://doi.org/10.1016/S0278-6915(00)00046-6.
Brennan, R.M. 2008. “Currants and Gooseberries.” In Temperate Fruit Crop Breeding: Germplasm to Genomics, edited by James F. Hancock, 177–96. Dordrecht: Springer Netherlands. https://doi.org/10.1007/978-1-4020-6907-9_6.
Brewer, Gregory J., John R. Torricelli, Amanda L. Lindsey, Elizabeth Z. Kunz, A. Neuman, Derek R. Fisher, and James A. Joseph. 2010. “Age-Related Toxicity of Amyloid-Beta Associated with Increased PERK and PCREB in Primary Hippocampal Neurons: Reversal by Blueberry Extract.” The Journal of Nutritional Biochemistry 21 (10): 991–98. https://doi.org/10.1016/j.jnutbio.2009.08.005.
Bunea, Andrea, Dumitriţa Rugină, Zoriţa Sconţa, Raluca M. Pop, Adela Pintea, Carmen Socaciu, Flaviu Tăbăran, Charlotte Grootaert, Karin Struijs, and John VanCamp. 2013. “Anthocyanin Determination in Blueberry Extracts from Various Cultivars and Their Antiproliferative and Apoptotic Properties in B16-F10 Metastatic Murine Melanoma Cells.” Phytochemistry 95 (November): 436–44. https://doi.org/10.1016/j.phytochem.2013.06.018.
Burns, J., P. T. Gardner, J. O’Neil, S. Crawford, I. Morecroft, D. B. McPhail, C. Lister, et al. 2000. “Relationship among Antioxidant Activity, Vasodilation Capacity, and Phenolic Content of Red Wines.” Journal of Agricultural and Food Chemistry 48 (2): 220–30. https://doi.org/10.1021/jf9909757.
Casagrande, Sarah Stark, Youfa Wang, Cheryl Anderson, and Tiffany L. Gary. 2007. “Have Americans Increased Their Fruit and Vegetable Intake?: The Trends Between 1988 and 2002.” American Journal of Preventive Medicine 32 (4): 257–63. https://doi.org/10.1016/j.amepre.2006.12.002.
Castrejón, Alejandro David Rodarte, Ines Eichholz, Sascha Rohn, Lothar W. Kroh, and Susanne Huyskens-Keil. 2008. “Phenolic Profile and Antioxidant Activity of Highbush Blueberry (Vaccinium Corymbosum L.) during Fruit Maturation and Ripening.” Food Chemistry 109 (3): 564–72. https://doi.org/10.1016/j.foodchem.2008.01.007.
Centers for Disease Control and Prevention. Strategies to Prevent Obesity and Other Chronic Diseases: The CDC Guide to Strategies to Increase the Consumption of Fruits and Vegetables [Internet]. Atlanta: U.S. Department of Health and Human Services; 2011
Chang, Thomas KH, Wendy BK Lee, and Hin Hin Ko. 2000. “Trans-Resveratrol Modulates the Catalytic Activity and MRNA Expression of the Procarcinogen-Activating Human Cytochrome P450 1B1.” Canadian Journal of Physiology and Pharmacology 78 (11): 874–81. https://doi.org/10.1139/y00-067.
Chen, Tzu-Ying, Janice Kritchevsky, Katherine Hargett, Kathryn Feller, Ryan Klobusnik, Brian J. Song, Bruce Cooper, Zeina Jouni, Mario G. Ferruzzi, and Elsa M. Janle. 2015. “Plasma Bioavailability and Regional Brain Distribution of Polyphenols from Apple/Grape Seed
42
and Bilberry Extracts in a Young Swine Model.” Molecular Nutrition & Food Research 59 (12): 2432–47. https://doi.org/10.1002/mnfr.201500224.
Cho, Mi Jin, Luke R. Howard, Ronald L. Prior, and John R. Clark. 2004. “Flavonoid Glycosides and Antioxidant Capacity of Various Blackberry, Blueberry and Red Grape Genotypes Determined by High-Performance Liquid Chromatography/Mass Spectrometry.” Journal of the Science of Food and Agriculture 84 (13): 1771–82. https://doi.org/10.1002/jsfa.1885.
Cirico, Tatiana L., and Stanley T. Omaye. 2006. “Additive or Synergetic Effects of Phenolic Compounds on Human Low Density Lipoprotein Oxidation.” Food and Chemical Toxicology: An International Journal Published for the British Industrial Biological Research Association 44 (4): 510–16. https://doi.org/10.1016/j.fct.2005.08.025.
Cladis, Dennis, Hawi Debelo, Mario Ferruzzi, and Connie Weaver. 2019. “Colonic Metabolism of Blueberry Polyphenols in Ovariectomized Rats Increases in a Dose-Response Fashion (OR34-06-19).” Current Developments in Nutrition 3 (Supplement_1). https://doi.org/10.1093/cdn/nzz031.OR34-06-19.
Connor, Ann Marie, James J. Luby, Cindy B. S. Tong, Chad E. Finn, and James F. Hancock. 2002. “Genotypic and Environmental Variation in Antioxidant Activity, Total Phenolic Content, and Anthocyanin Content among Blueberry Cultivars.” Journal of the American Society for Horticultural Science 127 (1): 89–97. https://doi.org/10.21273/JASHS.127.1.89.
Correa-Betanzo, J., E. Allen-Vercoe, J. McDonald, K. Schroeter, M. Corredig, and G. Paliyath. 2014. “Stability and Biological Activity of Wild Blueberry (Vaccinium Angustifolium) Polyphenols during Simulated in Vitro Gastrointestinal Digestion.” Food Chemistry 165 (December): 522–31. https://doi.org/10.1016/j.foodchem.2014.05.135.
Crespy, Vanessa, Christine Morand, Catherine Besson, Claudine Manach, Christian Demigne, and Christian Remesy. 2002. “Quercetin, but Not Its Glycosides, Is Absorbed from the Rat Stomach.” Journal of Agricultural and Food Chemistry 50 (3): 618–21. https://doi.org/10.1021/jf010919h.
Crozier, Alan, Michael E. J. Lean, Morag S. McDonald, and Christine Black. 1997. “Quantitative Analysis of the Flavonoid Content of Commercial Tomatoes, Onions, Lettuce, and Celery.” Journal of Agricultural and Food Chemistry 45 (3): 590–95. https://doi.org/10.1021/jf960339y.
Curtis, Peter J., Vera van der Velpen, Lindsey Berends, Amy Jennings, Martin Feelisch, A. Margot Umpleby, Mark Evans, et al. 2019. “Blueberries Improve Biomarkers of Cardiometabolic Function in Participants with Metabolic Syndrome—Results from a 6-Month, Double-Blind, Randomized Controlled Trial.” The American Journal of Clinical Nutrition 109 (6): 1535–45. https://doi.org/10.1093/ajcn/nqy380.
Dam, Rob M. van, and Edith J. M. Feskens. 2002. “Coffee Consumption and Risk of Type 2 Diabetes Mellitus.” Lancet (London, England) 360 (9344): 1477–78. https://doi.org/10.1016/S0140-6736(02)11436-X.
Damianaki, Athina, Efstathia Bakogeorgou, Marilenna Kampa, George Notas, Anastassia Hatzoglou, Simone Panagiotou, Claudia Gemetzi, Elias Kouroumalis, Pierre-Marie Martin, and Elias Castanas. 2000. “Potent Inhibitory Action of Red Wine Polyphenols on Human Breast Cancer Cells.” Journal of Cellular Biochemistry 78 (3): 429–41. https://doi.org/10.1002/1097-4644(20000901)78:3<429::AID-JCB8>3.0.CO;2-M.
43
Dangles, Olivier, Claire Dufour, Claudine Manach, Christine Morand, and Christian Remesy. 2001. “Binding of Flavonoids to Plasma Proteins.” In Methods in Enzymology, 335:319–33. Flavonoids and Other Polyphenols. Academic Press. https://doi.org/10.1016/S0076-6879(01)35254-0.
Davies, Km, and Rv Espley. 2013. “Opportunities and Challenges for Metabolic Engineering of Secondary Metabolite Pathways for Improved Human Health Characters in Fruit and Vegetable Crops.” New Zealand Journal of Crop and Horticultural Science 41 (3): 154–77. https://doi.org/10.1080/01140671.2013.793730.
Demrow, H. S., P. R. Slane, and J. D. Folts. 1995. “Administration of Wine and Grape Juice Inhibits in Vivo Platelet Activity and Thrombosis in Stenosed Canine Coronary Arteries.” Circulation 91 (4): 1182–88. https://doi.org/10.1161/01.cir.91.4.1182.
DuPont, M. Susan, Zofia Mondin, Gary Williamson, and Keith R. Price. 2000. “Effect of Variety, Processing, and Storage on the Flavonoid Glycoside Content and Composition of Lettuce and Endive.” Journal of Agricultural and Food Chemistry 48 (9): 3957–64. https://doi.org/10.1021/jf0002387.
Duthie, Garry G., Peter T. Gardner, and Janet A. M. Kyle. 2003. “Plant Polyphenols: Are They the New Magic Bullet?” The Proceedings of the Nutrition Society 62 (3): 599–603. https://doi.org/10.1079/PNS2003275.
Fairweather-Tait, S. J., and S. Southon. 2003. “BIOAVAILABILITY OF NUTRIENTS.” In Encyclopedia of Food Sciences and Nutrition (Second Edition), edited by Benjamin Caballero, 478–84. Oxford: Academic Press. https://doi.org/10.1016/B0-12-227055-X/00096-1.
Fan, Junfeng, Michelle H. Johnson, Mary Ann Lila, Gad Yousef, and Elvira Gonzalez de Mejia. 2013. “Berry and Citrus Phenolic Compounds Inhibit Dipeptidyl Peptidase IV: Implications in Diabetes Management.” Research article. Evidence-Based Complementary and Alternative Medicine. 2013. https://doi.org/10.1155/2013/479505.
Farah, Adriana, and Carmen Marino Donangelo. 2006. “Phenolic Compounds in Coffee.” Brazilian Journal of Plant Physiology 18 (1): 23–36. https://doi.org/10.1590/S1677-04202006000100003.
Ferracane, Rosalia, Nicoletta Pellegrini, Attilio Visconti, Giulia Graziani, Emma Chiavaro, Cristiana Miglio, and Vincenzo Fogliano. 2008. “Effects of Different Cooking Methods on Antioxidant Profile, Antioxidant Capacity, and Physical Characteristics of Artichoke.” Journal of Agricultural and Food Chemistry 56 (18): 8601–8. https://doi.org/10.1021/jf800408w.
Ferruzzi, Mario G., Jessica K. Lobo, Elsa M. Janle, Bruce Cooper, James E. Simon, Qing-Li Wu, Cara Welch, Lap Ho, Connie Weaver, and Giulio M. Pasinetti. 2009. “Bioavailability of Gallic Acid and Catechins from Grape Seed Polyphenol Extract Is Improved by Repeated Dosing in Rats: Implications for Treatment in Alzheimer’s Disease.” Journal of Alzheimer’s Disease: JAD 18 (1): 113–24. https://doi.org/10.3233/JAD-2009-1135.
Franke, A. A., L. J. Custer, and Y. Tanaka. 1998. “Isoflavones in Human Breast Milk and Other Biological Fluids.” The American Journal of Clinical Nutrition 68 (6): 1466S-1473S. https://doi.org/10.1093/ajcn/68.6.1466S.
Gan, Ren-You, Chak-Lun Chan, Qiong-Qiong Yang, Hua-Bin Li, Dan Zhang, Ying-Ying Ge, Anil Gunaratne, Jiao Ge, and Harold Corke. 2019. “9 - Bioactive Compounds and Beneficial Functions of Sprouted Grains.” In Sprouted Grains, edited by Hao Feng, Boris
44
Nemzer, and Jonathan W. DeVries, 191–246. AACC International Press. https://doi.org/10.1016/B978-0-12-811525-1.00009-9.
Gangloff, Mary Beth, Raymond P. Glahn, Dennis D. Miller, and Darrell R. Van Campen. 1996. “Assessment of Iron Availability Using Combined in Vitro Digestion and Caco-2 Cell Culture.” Nutrition Research 16 (3): 479–87. https://doi.org/10.1016/0271-5317(96)00029-2.
Gao, L., and G. Mazza. 1994. “Quantitation and Distribution of Simple and Acylated Anthocyanins and Other Phenolics in Blueberries.” Journal of Food Science 59 (5): 1057–59. https://doi.org/10.1111/j.1365-2621.1994.tb08189.x.
Garcea, Giuseppe, David P. Berry, Donald J. L. Jones, Raj Singh, Ashley R. Dennison, Peter B. Farmer, Ricky A. Sharma, William P. Steward, and Andreas J. Gescher. 2005. “Consumption of the Putative Chemopreventive Agent Curcumin by Cancer Patients: Assessment of Curcumin Levels in the Colorectum and Their Pharmacodynamic Consequences.” Cancer Epidemiology, Biomarkers & Prevention: A Publication of the American Association for Cancer Research, Cosponsored by the American Society of Preventive Oncology 14 (1): 120–25.
Garrett, Dean A., Mark L. Failla, and Robert J. Sarama. 1999. “Development of an in Vitro Digestion Method To Assess Carotenoid Bioavailability from Meals.” Journal of Agricultural and Food Chemistry 47 (10): 4301–9. https://doi.org/10.1021/jf9903298.
Gil-Izquierdo, A., P. Zafrilla, and F. A. Tomas-Barberan. 2002. “An in Vitro Method to Simulate Phenolic Compound Release from the Food Matrix in the Gastrointestinal Tract.” European Food Research and Technology 214 (2): 155–59. https://doi.org/10.1007/s00217-001-0428-3.
Grace, Mary H., Debora Esposito, Kriya L. Dunlap, and Mary Ann Lila. 2014. “Comparative Analysis of Phenolic Content and Profile, Antioxidant Capacity, and Anti-Inflammatory Bioactivity in Wild Alaskan and Commercial Vaccinium Berries.” Journal of Agricultural and Food Chemistry 62 (18): 4007–17. https://doi.org/10.1021/jf403810y.
Grace, Mary H., David M. Ribnicky, Peter Kuhn, Alexander Poulev, Sithes Logendra, Gad G. Yousef, Ilya Raskin, and Mary Ann Lila. 2009. “Hypoglycemic Activity of a Novel Anthocyanin-Rich Formulation from Lowbush Blueberry, Vaccinium Angustifolium Aiton.” Phytomedicine 16 (5): 406–15. https://doi.org/10.1016/j.phymed.2009.02.018.
Graham, J., K. Smith, K. MacKenzie, L. Jorgenson, C. Hackett, and W. Powell. 2004. “The Construction of a Genetic Linkage Map of Red Raspberry (Rubus Idaeus Subsp. Idaeus) Based on AFLPs, Genomic-SSR and EST-SSR Markers.” Theoretical and Applied Genetics 109 (4): 740–49. https://doi.org/10.1007/s00122-004-1687-8.
Green, Rodney J, Angus S Murphy, and Mario G Ferruzzi. 2007. “Uptake and Retention of Catechins by Caco-2 Human Intestinal Cells Is Modulated by Tea Formulation Following Simulated Digestion.” The FASEB Journal 21 (5): A730–A730. https://doi.org/10.1096/fasebj.21.5.A730-b.
Guo, Honghui, and Min Xia. 2014. “Chapter 8 - Anthocyanins and Diabetes Regulation.” In Polyphenols in Human Health and Disease, edited by Ronald Ross Watson, Victor R. Preedy, and Sherma Zibadi, 83–93. San Diego: Academic Press. https://doi.org/10.1016/B978-0-12-398456-2.00008-6.
Haghi, Ghasem, and Alireza Hatami. 2010. “Simultaneous Quantification of Flavonoids and Phenolic Acids in Plant Materials by a Newly Developed Isocratic High-Performance
45
Liquid Chromatography Approach.” Journal of Agricultural and Food Chemistry 58 (20): 10812–16. https://doi.org/10.1021/jf102175x.
Hancock, J.F., P. Lyrene, C.E. Finn, N. Vorsa, and G.A. Lobos. 2008. “Blueberries and Cranberries.” In Temperate Fruit Crop Breeding: Germplasm to Genomics, edited by James F. Hancock, 115–50. Dordrecht: Springer Netherlands. https://doi.org/10.1007/978-1-4020-6907-9_4.
Hansen, Thomas H., Kristian H. Laursen, Daniel P. Persson, Pai Pedas, Søren Husted, and Jan K. Schjoerring. 2009. “Micro-Scaled High-Throughput Digestion of Plant Tissue Samples for Multi-Elemental Analysis.” Plant Methods 5 (1): 12. https://doi.org/10.1186/1746-4811-5-12.
Harborne, J. B. 1989. “Methods in Plant Biochemistry. Volume 1. Plant Phenolics.” Methods in Plant Biochemistry. Volume 1. Plant Phenolics. https://www.cabdirect.org/cabdirect/abstract/19910304248.
He, Xiangjiu, and Rui Hai Liu. 2006. “Cranberry Phytochemicals: Isolation, Structure Elucidation, and Their Antiproliferative and Antioxidant Activities.” Journal of Agricultural and Food Chemistry 54 (19): 7069–74. https://doi.org/10.1021/jf061058l.
Henning, Susanne M., William Aronson, Yantao Niu, Francisco Conde, Nicolas H. Lee, Navindra P. Seeram, Ru-Po Lee, et al. 2006. “Tea Polyphenols and Theaflavins Are Present in Prostate Tissue of Humans and Mice after Green and Black Tea Consumption.” The Journal of Nutrition 136 (7): 1839–43. https://doi.org/10.1093/jn/136.7.1839.
Hertog, M. G. L, E. J. M Feskens, D Kromhout, M. G. L Hertog, P. C. H Hollman, M. G. L Hertog, and M. B Katan. 1993. “Dietary Antioxidant Flavonoids and Risk of Coronary Heart Disease: The Zutphen Elderly Study.” The Lancet, Originally published as Volume 2, Issue 8878, 342 (8878): 1007–11. https://doi.org/10.1016/0140-6736(93)92876-U.
Higdon, Jane V., and Balz Frei. 2003. “Tea Catechins and Polyphenols: Health Effects, Metabolism, and Antioxidant Functions.” Critical Reviews in Food Science and Nutrition 43 (1): 89–143. https://doi.org/10.1080/10408690390826464.
Ho, P. C., D. J. Saville, P. F. Coville, and S. Wanwimolruk. 2000. “Content of CYP3A4 Inhibitors, Naringin, Naringenin and Bergapten in Grapefruit and Grapefruit Juice Products.” Pharmaceutica Acta Helvetiae 74 (4): 379–85.
Hole, Anastasia S., Nils Petter Kjos, Stine Grimmer, Achim Kohler, Per Lea, Bård Rasmussen, Lene R. Lima, Judith Narvhus, and Stefan Sahlstrøm. 2013. “Extrusion of Barley and Oat Improves the Bioaccessibility of Dietary Phenolic Acids in Growing Pigs.” Journal of Agricultural and Food Chemistry 61 (11): 2739–47. https://doi.org/10.1021/jf3045236.
Hollman, P. C., and M. B. Katan. 1999. “Health Effects and Bioavailability of Dietary Flavonols.” Free Radical Research 31 Suppl (December): S75-80. https://doi.org/10.1080/10715769900301351.
Holst, Birgit, and Gary Williamson. 2008. “Nutrients and Phytochemicals: From Bioavailability to Bioefficacy beyond Antioxidants.” Current Opinion in Biotechnology, Food biotechnology / Plant biotechnology, 19 (2): 73–82. https://doi.org/10.1016/j.copbio.2008.03.003.
Howard, Luke R., John R. Clark, and Cindi Brownmiller. 2003. “Antioxidant Capacity and Phenolic Content in Blueberries as Affected by Genotype and Growing Season.” Journal of the Science of Food and Agriculture 83 (12): 1238–47. https://doi.org/10.1002/jsfa.1532.
46
Hunt, J. R., and Z. K. Roughead. 2003. “ANIMAL MODELS OF HUMAN NUTRITION.” In Encyclopedia of Food Sciences and Nutrition (Second Edition), edited by Benjamin Caballero, 232–38. Oxford: Academic Press. https://doi.org/10.1016/B0-12-227055-X/00047-X.
Hur, Sun Jin, Beong Ou Lim, Eric A. Decker, and D. Julian McClements. 2011. “In Vitro Human Digestion Models for Food Applications.” Food Chemistry 125 (1): 1–12. https://doi.org/10.1016/j.foodchem.2010.08.036.
Janle, Elsa, Tzu-Ying Chen, Janice Kritchevsky, Katherine Hargett, Kathryn Feller, Ryan Klobusnik, Olivia Tabaczyk, Mario Ferruzzi, and Zeina Jouni. 2014. “Pharmacokinetics and Brain Distribution of Polyphenols from Fruit Extracts in Young Pigs (270.2).” The FASEB Journal 28 (1_supplement): 270.2. https://doi.org/10.1096/fasebj.28.1_supplement.270.2.
J. Aragón, Ingrid, Hernán Ceballos, Dominique Dufour, and Mario G. Ferruzzi. 2018. “Pro-Vitamin A Carotenoids Stability and Bioaccessibility from Elite Selection of Biofortified Cassava Roots ( Manihot Esculenta , Crantz) Processed to Traditional Flours and Porridges.” Food & Function 9 (9): 4822–35. https://doi.org/10.1039/C8FO01276H.
Jiang, Nan, Andrea I. Doseff, and Erich Grotewold. 2016. “Flavones: From Biosynthesis to Health Benefits.” Plants 5 (2). https://doi.org/10.3390/plants5020027.
Jiao, Xinyao, Bin Li, Qi Zhang, Ningxuan Gao, Xiuyan Zhang, and Xianjun Meng. 2018. “Effect of in Vitro-Simulated Gastrointestinal Digestion on the Stability and Antioxidant Activity of Blueberry Polyphenols and Their Cellular Antioxidant Activity towards HepG2 Cells.” International Journal of Food Science & Technology 53 (1): 61–71. https://doi.org/10.1111/ijfs.13516.
Joseph, James A., Barbara Shukitt-Hale, Natalia A. Denisova, Donna Bielinski, Antonio Martin, John J. McEwen, and Paula C. Bickford. 1999. “Reversals of Age-Related Declines in Neuronal Signal Transduction, Cognitive, and Motor Behavioral Deficits with Blueberry, Spinach, or Strawberry Dietary Supplementation.” Journal of Neuroscience 19 (18): 8114–21. https://doi.org/10.1523/JNEUROSCI.19-18-08114.1999.
Kader, F., B. Rovel, M. Girardin, and M. Metche. 1996. “Fractionation and Identification of the Phenolic Compounds of Highbush Blueberries (Vaccinium Corymbosum, L.).” Food Chemistry 55 (1): 35–40. https://doi.org/10.1016/0308-8146(95)00068-2.
Kalt, Wilhelmina, Charles F. Forney, Antonio Martin, and Ronald L. Prior. 1999. “Antioxidant Capacity, Vitamin C, Phenolics, and Anthocyanins after Fresh Storage of Small Fruits.” Journal of Agricultural and Food Chemistry 47 (11): 4638–44. https://doi.org/10.1021/jf990266t.
Kalt, Wilhelmina, James A. Joseph, and Barbara Shukitt-Hale. 2007. “Blueberries and Human Health: A Review of Current Reseach.” Journal of the American Pomological Society; University Park 61 (3): 151–60.
Kalt, Wilhelmina, Daniel A. J. Ryan, Joanna C. Duy, Ronald L. Prior, Mark K. Ehlenfeldt, and S. P. Vander Kloet. 2001. “Interspecific Variation in Anthocyanins, Phenolics, and Antioxidant Capacity among Genotypes of Highbush and Lowbush Blueberries (Vaccinium Section Cyanococcus Spp.).” Journal of Agricultural and Food Chemistry 49 (10): 4761–67. https://doi.org/10.1021/jf010653e.
KARAKAYA, SIBEL. 2004. “Bioavailability of Phenolic Compounds.” Critical Reviews in Food Science and Nutrition 44 (6): 453–64. https://doi.org/10.1080/10408690490886683.
47
Kayesh, Emrul, Lingfei Shangguan, Nicholas Kibet Korir, Xin Sun, Nadira Bilkish, Yanping Zhang, Jian Han, Changnian Song, Zong-Ming Cheng, and Jinggui Fang. 2013. “Fruit Skin Color and the Role of Anthocyanin.” Acta Physiologiae Plantarum 35 (10): 2879–90. https://doi.org/10.1007/s11738-013-1332-8.
Kean, Ellie G., Bruce R. Hamaker, and Mario G. Ferruzzi. 2008. “Carotenoid Bioaccessibility from Whole Grain and Degermed Maize Meal Products.” Journal of Agricultural and Food Chemistry 56 (21): 9918–26. https://doi.org/10.1021/jf8018613.
Khokhar, S., and S. G. M. Magnusdottir. 2002. “Total Phenol, Catechin, and Caffeine Contents of Teas Commonly Consumed in the United Kingdom.” Journal of Agricultural and Food Chemistry 50 (3): 565–70. https://doi.org/10.1021/jf010153l.
Kong, Jin-Ming, Lian-Sai Chia, Ngoh-Khang Goh, Tet-Fatt Chia, and R. Brouillard. 2003. “Analysis and Biological Activities of Anthocyanins.” Phytochemistry 64 (5): 923–33. https://doi.org/10.1016/S0031-9422(03)00438-2.
Kraft, Tristan F. Burns, Barbara M. Schmidt, G. G. Yousef, Christopher T. G. Knight, Muriel Cuendet, Young-Hwa Kang, John M. Pezzuto, David S. Seigler, and Mary Ann Lila. 2005. “Chemopreventive Potential of Wild Lowbush Blueberry Fruits in Multiple Stages of Carcinogenesis.” Journal of Food Science 70 (3): S159–66. https://doi.org/10.1111/j.1365-2621.2005.tb07151.x.
Krikorian, Robert, Marcelle D. Shidler, Tiffany A. Nash, Wilhelmina Kalt, Melinda R. Vinqvist-Tymchuk, Barbara Shukitt-Hale, and James A. Joseph. 2010. “Blueberry Supplementation Improves Memory in Older Adults.” Journal of Agricultural and Food Chemistry 58 (7): 3996–4000. https://doi.org/10.1021/jf9029332.
Kruger, Johanita, John R. N. Taylor, Xiaogu Du, Fabiana F. De Moura, Bo Lönnerdal, and André Oelofse. 2013. “Effect of Phytate Reduction of Sorghum, through Genetic Modification, on Iron and Zinc Availability as Assessed by an in Vitro Dialysability Bioaccessibility Assay, Caco-2 Cell Uptake Assay, and Suckling Rat Pup Absorption Model.” Food Chemistry 141 (2): 1019–25. https://doi.org/10.1016/j.foodchem.2013.01.105.
Larson, Nicole I., Mary T. Story, and Melissa C. Nelson. 2009. “Neighborhood Environments: Disparities in Access to Healthy Foods in the U.S.” American Journal of Preventive Medicine 36 (1): 74–81. https://doi.org/10.1016/j.amepre.2008.09.025.
Lee-Kwan, Seung Hee, Latetia V. Moore, Heidi M. Blanck, Diane M. Harris, and Deb Galuska. 2017. “Disparities in State-Specific Adult Fruit and Vegetable Consumption — United States, 2015.” MMWR. Morbidity and Mortality Weekly Report 66 (45): 1241–47. https://doi.org/10.15585/mmwr.mm6645a1.
Lesser, Stephanie, Rainer Cermak, and Siegfried Wolffram. 2004. “Bioavailability of Quercetin in Pigs Is Influenced by the Dietary Fat Content.” The Journal of Nutrition 134 (6): 1508–11. https://doi.org/10.1093/jn/134.6.1508.
Lewandowska, Urszula, Karolina Szewczyk, Elżbieta Hrabec, Anna Janecka, and Sylwia Gorlach. 2013. “Overview of Metabolism and Bioavailability Enhancement of Polyphenols.” Journal of Agricultural and Food Chemistry 61 (50): 12183–99. https://doi.org/10.1021/jf404439b.
Li, Min, Katie Koecher, Laura Hansen, and Mario G. Ferruzzi. 2016. “Phenolic Recovery and Bioaccessibility from Milled and Finished Whole Grain Oat Products.” Food & Function 7 (8): 3370–81. https://doi.org/10.1039/C6FO00760K.
48
Lipkie, Tristan E., Fabiana F. De Moura, Zuo-Yu Zhao, Marc C. Albertsen, Ping Che, Kimberly Glassman, and Mario G. Ferruzzi. 2013. “Bioaccessibility of Carotenoids from Transgenic Provitamin A Biofortified Sorghum.” Journal of Agricultural and Food Chemistry 61 (24): 5764–71. https://doi.org/10.1021/jf305361s.
Liu, Jiazhong, David R. Ledoux, and Trygve L. Veum. 1998. “In Vitro Prediction of Phosphorus Availability in Feed Ingredients for Swine.” Journal of Agricultural and Food Chemistry 46 (7): 2678–81. https://doi.org/10.1021/jf9801421.
Liu, Rui Hai. 2003. “Health Benefits of Fruit and Vegetables Are from Additive and Synergistic Combinations of Phytochemicals.” The American Journal of Clinical Nutrition 78 (3): 517S-520S. https://doi.org/10.1093/ajcn/78.3.517S.
Liu, Yixiang, Di Zhang, Yongpei Wu, Dan Wang, Ying Wei, Jiulin Wu, and Baoping Ji. 2014. “Stability and Absorption of Anthocyanins from Blueberries Subjected to a Simulated Digestion Process.” International Journal of Food Sciences & Nutrition 65 (4): 440–48.
Maiz, Maria, Dennis P. Cladis, Pamela J. Lachcik, Elsa M. Janle, Mary Ann Lila, Mario G. Ferruzzi, and Connie M. Weaver. 2016. “Acute Bioavailability of (Poly)Phenolic Content of Different Varieties of Vaccinium Spp. in Ovariectomized Rats.” The FASEB Journal 30 (1_supplement): 690.20-690.20. https://doi.org/10.1096/fasebj.30.1_supplement.690.20.
Manach, Claudine, Augustin Scalbert, Christine Morand, Christian Rémésy, and Liliana Jiménez. 2004. “Polyphenols: Food Sources and Bioavailability.” The American Journal of Clinical Nutrition 79 (5): 727–47. https://doi.org/10.1093/ajcn/79.5.727.
Manach, Claudine, Gary Williamson, Christine Morand, Augustin Scalbert, and Christian Rémésy. 2005. “Bioavailability and Bioefficacy of Polyphenols in Humans. I. Review of 97 Bioavailability Studies.” The American Journal of Clinical Nutrition 81 (1): 230S-242S. https://doi.org/10.1093/ajcn/81.1.230S.
Maria Tomas-Navarro. 2014. “Bioavailability and Metabolism of Citrus Fruit Beverage Flavanones in Humans.” Polyphenols in Human Health and Disease, January, 537–51. https://doi.org/10.1016/B978-0-12-398456-2.00040-2.
Marles, R. J., and N. R. Farnsworth. 1995. “Antidiabetic Plants and Their Active Constituents.” Phytomedicine 2 (2): 137–89. https://doi.org/10.1016/S0944-7113(11)80059-0.
Martineau, Louis C., Audrey Couture, Danielle Spoor, Ali Benhaddou-Andaloussi, Cory Harris, Bouchra Meddah, Charles Leduc, et al. 2006. “Anti-Diabetic Properties of the Canadian Lowbush Blueberry Vaccinium Angustifolium Ait.” Phytomedicine 13 (9): 612–23. https://doi.org/10.1016/j.phymed.2006.08.005.
Martinez, Kristina B., Jessica D. Mackert, and Michael K. McIntosh. 2017. “Chapter 18 - Polyphenols and Intestinal Health.” In Nutrition and Functional Foods for Healthy Aging, edited by Ronald Ross Watson, 191–210. Academic Press. https://doi.org/10.1016/B978-0-12-805376-8.00018-6.
Maru, G. B., G. Kumar, S. Ghantasala, and P. Tajpara. 2014. “Chapter 87 - Polyphenol-Mediated In Vivo Cellular Responses during Carcinogenesis.” In Polyphenols in Human Health and Disease, edited by Ronald Ross Watson, Victor R. Preedy, and Sherma Zibadi, 1141–79. San Diego: Academic Press. https://doi.org/10.1016/B978-0-12-398456-2.00088-8.
Maubach, Julie, Marc E. Bracke, Arne Heyerick, Herman T. Depypere, Rudolphe F. Serreyn, Marc M. Mareel, and Denis De Keukeleire. 2003. “Quantitation of Soy-Derived Phytoestrogens in Human Breast Tissue and Biological Fluids by High-Performance
49
Liquid Chromatography.” Journal of Chromatography. B, Analytical Technologies in the Biomedical and Life Sciences 784 (1): 137–44. https://doi.org/10.1016/s1570-0232(02)00789-4.
Maurya, Dharmendra Kumar, and Thomas Paul Asir Devasagayam. 2010. “Antioxidant and Prooxidant Nature of Hydroxycinnamic Acid Derivatives Ferulic and Caffeic Acids.” Food and Chemical Toxicology 48 (12): 3369–73. https://doi.org/10.1016/j.fct.2010.09.006.
May, Damon H., Sandi L. Navarro, Ingo Ruczinski, Jason Hogan, Yuko Ogata, Yvonne Schwarz, Lisa Levy, Ted Holzman, Martin W. McIntosh, and Johanna W. Lampe. 2013. “Metabolomic Profiling of Urine: Response to a Randomised, Controlled Feeding Study of Select Fruits and Vegetables, and Application to an Observational Study.” The British Journal of Nutrition 110 (10): 1760–70. https://doi.org/10.1017/S000711451300127X.
Mazza, Giuseppe. 2018. Anthocyanins in Fruits, Vegetables, and Grains. CRC Press. https://doi.org/10.1201/9781351069700.
McDougall, G. J., S. Fyffe, P. Dobson, and D. Stewart. 2005. “Anthocyanins from Red Wine – Their Stability under Simulated Gastrointestinal Digestion.” Phytochemistry 66 (21): 2540–48. https://doi.org/10.1016/j.phytochem.2005.09.003.
McDougall, Gordon J., Patricia Dobson, Pauline Smith, Alison Blake, and Derek Stewart. 2005. “Assessing Potential Bioavailability of Raspberry Anthocyanins Using an in Vitro Digestion System.” Journal of Agricultural and Food Chemistry 53 (15): 5896–5904. https://doi.org/10.1021/jf050131p.
McDougall, Gordon J., Stewart Fyffe, Pat Dobson, and Derek Stewart. 2007. “Anthocyanins from Red Cabbage – Stability to Simulated Gastrointestinal Digestion.” Phytochemistry, Reports on Structure Elucidation, 68 (9): 1285–94. https://doi.org/10.1016/j.phytochem.2007.02.004.
Meng, Qing-He, Philip Lewis, Kristiina Wähälä, Herman Adlercreutz, and Matti J. Tikkanen. 1999. “Incorporation of Esterified Soybean Isoflavones with Antioxidant Activity into Low Density Lipoprotein.” Biochimica et Biophysica Acta (BBA) - Molecular and Cell Biology of Lipids 1438 (3): 369–76. https://doi.org/10.1016/S1388-1981(99)00062-1.
Miglio, Cristiana, Emma Chiavaro, Attilio Visconti, Vincenzo Fogliano, and Nicoletta Pellegrini. 2008. “Effects of Different Cooking Methods on Nutritional and Physicochemical Characteristics of Selected Vegetables.” Journal of Agricultural and Food Chemistry 56 (1): 139–47. https://doi.org/10.1021/jf072304b.
Miller, D. D., B. R. Schricker, R. R. Rasmussen, and D. Van Campen. 1981. “An in Vitro Method for Estimation of Iron Availability from Meals.” The American Journal of Clinical Nutrition 34 (10): 2248–56. https://doi.org/10.1093/ajcn/34.10.2248.
Miller, Kenneth B., David A. Stuart, Nancy L. Smith, Chang Y. Lee, Nancy L. McHale, Judith A. Flanagan, Boxin Ou, and W. Jeffrey Hurst. 2006. “Antioxidant Activity and Polyphenol and Procyanidin Contents of Selected Commercially Available Cocoa-Containing and Chocolate Products in the United States.” Journal of Agricultural and Food Chemistry 54 (11): 4062–68. https://doi.org/10.1021/jf060290o.
Minekus, Mans. 2015. “The TNO Gastro-Intestinal Model (TIM).” In The Impact of Food Bioactives on Health: In Vitro and Ex Vivo Models, edited by Kitty Verhoeckx, Paul Cotter, Iván López-Expósito, Charlotte Kleiveland, Tor Lea, Alan Mackie, Teresa Requena, Dominika Swiatecka, and Harry Wichers, 37–46. Cham: Springer International Publishing. https://doi.org/10.1007/978-3-319-16104-4_5.
50
Minekus, Mans, Philippe Marteau, Robert Havenaar, and Jos Veld. 1995. “A Multicompartmental Dynamic Computer-Controlled Model Simulating the Stomach and Small Intestine. ATLA Altern Lab Anim.” Alternatives to Laboratory Animals: ATLA 23 (January): 197–209.
Miyake, Yoshiaki, Kanefumi Yamamoto, Nobuko Tsujihara, and Toshihiko Osawa. 1998. “Protective Effects of Lemon Flavonoids on Oxidative Stress in Diabetic Rats.” Lipids 33 (7): 689. https://doi.org/10.1007/s11745-998-0258-y.
Moore, J. N. 1965. “Improving Highbush Blueberries by Breeding and Selection.” Euphytica 14 (1): 39–48. https://doi.org/10.1007/BF00032812.
Moreno, Juan, and Rafael Peinado, eds. 2012. “Chapter 5 - Polyphenols.” In Enological Chemistry, 53–76. San Diego: Academic Press. https://doi.org/10.1016/B978-0-12-388438-1.00005-4.
Moser, Sydney, Mohammad Chegeni, Andrea Liceaga, Owen Jones, and Mario Ferruzzi. 2014. “The Effect of Individual Milk Proteins on Bioaccessibility of Green Tea Flavan-3-Ols (1044.12).” The FASEB Journal 28 (1_supplement): 1044.12. https://doi.org/10.1096/fasebj.28.1_supplement.1044.12.
Moser, Sydney, Jongbin Lim, Mohammad Chegeni, JoLynne D. Wightman, Bruce R. Hamaker, and Mario G. Ferruzzi. 2016. “Concord and Niagara Grape Juice and Their Phenolics Modify Intestinal Glucose Transport in a Coupled in Vitro Digestion/Caco-2 Human Intestinal Model.” Nutrients 8 (7): 414. https://doi.org/10.3390/nu8070414.
Murphy, P. A., T. Song, G. Buseman, K. Barua, G. R. Beecher, D. Trainer, and J. Holden. 1999. “Isoflavones in Retail and Institutional Soy Foods.” Journal of Agricultural and Food Chemistry 47 (7): 2697–2704. https://doi.org/10.1021/jf981144o.
Naczk, Marian, and Fereidoon Shahidi. 2006. “Phenolics in Cereals, Fruits and Vegetables: Occurrence, Extraction and Analysis.” Journal of Pharmaceutical and Biomedical Analysis, Nutraceuticals Analysis, 41 (5): 1523–42. https://doi.org/10.1016/j.jpba.2006.04.002.
Neilson, Andrew P., and Mario G. Ferruzzi. 2011. “Influence of Formulation and Processing on Absorption and Metabolism of Flavan-3-Ols from Tea and Cocoa.” Annual Review of Food Science and Technology 2 (1): 125–51. https://doi.org/10.1146/annurev-food-022510-133725.
———. 2013. “Chapter 22 - Bioavailability and Metabolism of Bioactive Compounds from Foods.” In Nutrition in the Prevention and Treatment of Disease (Third Edition), edited by Ann M. Coulston, Carol J. Boushey, and Mario G. Ferruzzi, 407–23. Academic Press. https://doi.org/10.1016/B978-0-12-391884-0.00022-6.
Neilson, Andrew P., Judy C. George, Elsa M. Janle, Richard D. Mattes, Ralf Rudolph, Nathan V. Matusheski, and Mario G. Ferruzzi. 2009. “Influence of Chocolate Matrix Composition on Cocoa Flavan-3-Ol Bioaccessibility In Vitro and Bioavailability in Humans.” Journal of Agricultural and Food Chemistry 57 (20): 9418–26. https://doi.org/10.1021/jf902919k.
Neilson, Andrew P., Amber S. Hopf, Bruce R. Cooper, Michael A. Pereira, Joshua A. Bomser, and Mario G. Ferruzzi. 2007. “Catechin Degradation with Concurrent Formation of Homo- and Heterocatechin Dimers during in Vitro Digestion.” Journal of Agricultural and Food Chemistry 55 (22): 8941–49. https://doi.org/10.1021/jf071645m.
Nielsen, Inge Lise F., Lars O. Dragsted, Gitte Ravn-Haren, Riitta Freese, and Salka E. Rasmussen. 2003. “Absorption and Excretion of Black Currant Anthocyanins in Humans
51
and Watanabe Heritable Hyperlipidemic Rabbits.” Journal of Agricultural and Food Chemistry 51 (9): 2813–20. https://doi.org/10.1021/jf025947u.
Oomen, A. G., C. J. M. Rompelberg, M. A. Bruil, C. J. G. Dobbe, D. P. K. H. Pereboom, and A. J. A. M. Sips. 2003. “Development of an In Vitro Digestion Model for Estimating the Bioaccessibility of Soil Contaminants.” Archives of Environmental Contamination and Toxicology 44 (3): 0281–87. https://doi.org/10.1007/s00244-002-1278-0.
Papandreou, Magdalini A., Andriana Dimakopoulou, Zacharoula I. Linardaki, Paul Cordopatis, Dorothy Klimis-Zacas, Marigoula Margarity, and Fotini N. Lamari. 2009. “Effect of a Polyphenol-Rich Wild Blueberry Extract on Cognitive Performance of Mice, Brain Antioxidant Markers and Acetylcholinesterase Activity.” Behavioural Brain Research 198 (2): 352–58. https://doi.org/10.1016/j.bbr.2008.11.013.
Pawlowski, Jessica W., Berdine R. Martin, George P. McCabe, Mario G. Ferruzzi, and Connie M. Weaver. 2014. “Plum and Soy Aglycon Extracts Superior at Increasing Bone Calcium Retention in Ovariectomized Sprague Dawley Rats.” Journal of Agricultural and Food Chemistry 62 (26): 6108–17. https://doi.org/10.1021/jf403310q.
Pereira, David M., Patrícia Valentão, José A. Pereira, and Paula B. Andrade. 2009. “Phenolics: From Chemistry to Biology.” Molecules 14 (6): 2202–11. https://doi.org/10.3390/molecules14062202.
Pérez-Vicente, Antonio, Angel Gil-Izquierdo, and Cristina García-Viguera. 2002. “In Vitro Gastrointestinal Digestion Study of Pomegranate Juice Phenolic Compounds, Anthocyanins, and Vitamin C.” Journal of Agricultural and Food Chemistry 50 (8): 2308–12. https://doi.org/10.1021/jf0113833.
Peters, Catrina M., Rodney J. Green, Elsa M. Janle, and Mario G. Ferruzzi. 2010. “Formulation with Ascorbic Acid and Sucrose Modulates Catechin Bioavailability from Green Tea.” Food Research International 43 (1): 95–102. https://doi.org/10.1016/j.foodres.2009.08.016.
Pixley, Kevin V., Natalia Palacios-Rojas, and Raymond P. Glahn. 2011. “The Usefulness of Iron Bioavailability as a Target Trait for Breeding Maize (Zea Mays L.) with Enhanced Nutritional Value.” Field Crops Research 123 (2): 153–60. https://doi.org/10.1016/j.fcr.2011.05.011.
Price, K. R., and M. J. C. Rhodes. 1997. “Analysis of the Major Flavonol Glycosides Present in Four Varieties of Onion (Allium Cepa) and Changes in Composition Resulting from Autolysis.” Journal of the Science of Food and Agriculture 74 (3): 331–39. https://doi.org/10.1002/(SICI)1097-0010(199707)74:3<331::AID-JSFA806>3.0.CO;2-C.
Price, Keith R., Francesco Casuscelli, Ian J. Colquhoun, and Michael J. C. Rhodes. 1998. “Composition and Content of Flavonol Glycosides in Broccoli Florets (Brassica Olearacea) and Their Fate during Cooking.” Journal of the Science of Food and Agriculture 77 (4): 468–72. https://doi.org/10.1002/(SICI)1097-0010(199808)77:4<468::AID-JSFA66>3.0.CO;2-B.
Prior, Ronald L., Samuel E. Wilkes, Theodore R. Rogers, Ramesh C. Khanal, Xianli Wu, and Luke R. Howard. 2010. “Purified Blueberry Anthocyanins and Blueberry Juice Alter Development of Obesity in Mice Fed an Obesogenic High-Fat Diet.” Journal of Agricultural and Food Chemistry 58 (7): 3970–76. https://doi.org/10.1021/jf902852d.
Prodorutti, Daniele, bullet, Ilaria Pertot, Lara bullet, Giongo, Cesare bullet, and Gessler. 2007. “Highbush Blueberry: Cultivation, Protection, Breeding and Biotechnology.” The European Journal of Plant Science and Biotechnology 1 (January).
52
Proestos, Charalampos, and Michael Komaitis. 2006. “Ultrasonically Assisted Extraction of Phenolic Compounds from Aromatic Plants: Comparison with Conventional Extraction Technics.” Journal of Food Quality 29 (October): 567–82. https://doi.org/10.1111/j.1745-4557.2006.00096.x.
Pujos-Guillot, Estelle, Jane Hubert, Jean-François Martin, Bernard Lyan, Mercedes Quintana, Sylvain Claude, Bruno Chabanas, et al. 2013. “Mass Spectrometry-Based Metabolomics for the Discovery of Biomarkers of Fruit and Vegetable Intake: Citrus Fruit as a Case Study.” Journal of Proteome Research 12 (4): 1645–59. https://doi.org/10.1021/pr300997c.
Pupin, A. M, M. J Dennis, and M. C. F Toledo. 1998. “Flavanone Glycosides in Brazilian Orange Juice.” Food Chemistry 61 (3): 275–80. https://doi.org/10.1016/S0308-8146(97)00093-9.
Raiola, Assunta, Gian Carlo Tenore, Amalia Barone, Luigi Frusciante, and Maria Manuela Rigano. 2015. “Vitamin E Content and Composition in Tomato Fruits: Beneficial Roles and Bio-Fortification.” International Journal of Molecular Sciences 16 (12): 29250–64. https://doi.org/10.3390/ijms161226163.
Reboul, Emmanuelle, Myriam Richelle, Eloïse Perrot, Christiane Desmoulins-Malezet, Victor Pirisi, and Patrick Borel. 2006. “Bioaccessibility of Carotenoids and Vitamin E from Their Main Dietary Sources.” Journal of Agricultural and Food Chemistry 54 (23): 8749–55. https://doi.org/10.1021/jf061818s.
Rekhy, Reetica, and Robyn McConchie. 2014. “Promoting Consumption of Fruit and Vegetables for Better Health. Have Campaigns Delivered on the Goals?” Appetite 79 (August): 113–23. https://doi.org/10.1016/j.appet.2014.04.012.
Ren, Shijun, and Eric J. Lien. 1997. “Natural Products and Their Derivatives as Cancer Chemopreventive Agents.” In Progress in Drug Research / Fortschritte Der Arzneimittelforschung / Progrès Des Recherches Pharmaceutiques, edited by Eric J. Lien, Arima Das, Partha Nandy, Shijun Ren, Horst Kleinkauf, Hans von Döhren, Iradj Hajimohamadreza, et al., 147–71. Progress in Drug Research / Fortschritte Der Arzneimittelforschung / Progrès Des Recherches Pharmaceutiques. Basel: Birkhäuser Basel. https://doi.org/10.1007/978-3-0348-8861-5_6.
Retamales, Jorge B., and James F. Hancock. 2018. Blueberries, 2nd Edition. CABI. Romani, A., P. Pinelli, C. Cantini, A. Cimato, and D. Heimler. 2006. “Characterization of
Violetto Di Toscana, a Typical Italian Variety of Artichoke (Cynara Scolymus L.).” Food Chemistry 95 (2): 221–25.
Rosa, Laura A. de la, Jesús Omar Moreno-Escamilla, Joaquín Rodrigo-García, and Emilio Alvarez-Parrilla. 2019. “Chapter 12 - Phenolic Compounds.” In Postharvest Physiology and Biochemistry of Fruits and Vegetables, edited by Elhadi M. Yahia, 253–71. Woodhead Publishing. https://doi.org/10.1016/B978-0-12-813278-4.00012-9.
Sanahuja, Georgina, Gemma Farré, Judit Berman, Uxue Zorrilla-López, Richard M. Twyman, Teresa Capell, Paul Christou, and Changfu Zhu. 2013. “A Question of Balance: Achieving Appropriate Nutrient Levels in Biofortified Staple Crops.” Nutrition Research Reviews 26 (2): 235–45. https://doi.org/10.1017/S0954422413000176.
Santos‐Buelga, Celestino, and Augustin Scalbert. 2000. “Proanthocyanidins and Tannin-like Compounds – Nature, Occurrence, Dietary Intake and Effects on Nutrition and Health.” Journal of the Science of Food and Agriculture 80 (7): 1094–1117.
53
https://doi.org/10.1002/(SICI)1097-0010(20000515)80:7<1094::AID-JSFA569>3.0.CO;2-1.
Saura-Calixto, Fulgencio, José Serrano, and Isabel Goñi. 2007. “Intake and Bioaccessibility of Total Polyphenols in a Whole Diet.” Food Chemistry 101 (2): 492–501. https://doi.org/10.1016/j.foodchem.2006.02.006.
Scalzo, Jessica, Alessia Politi, Nicoletta Pellegrini, Bruno Mezzetti, and Maurizio Battino. 2005. “Plant Genotype Affects Total Antioxidant Capacity and Phenolic Contents in Fruit.” Nutrition 21 (2): 207–13. https://doi.org/10.1016/j.nut.2004.03.025.
Scholz, and Williamson. 2013. “Interactions Affecting the Bioavailability of Dietary Polyphenols in Vivo.” International Journal for Vitamin and Nutrition Research, March. http://econtent.hogrefe.com/doi/abs/10.1024/0300-9831.77.3.224.
Schuster, Bernhard, and Karl Herrmann. 1985. “Hydroxybenzoic and Hydroxycinnamic Acid Derivatives in Soft Fruits.” Phytochemistry 24 (11): 2761–64. https://doi.org/10.1016/S0031-9422(00)80722-0.
Seeram, Navindra P., Lynn S. Adams, Mary L. Hardy, and David Heber. 2004. “Total Cranberry Extract versus Its Phytochemical Constituents: Antiproliferative and Synergistic Effects against Human Tumor Cell Lines.” Journal of Agricultural and Food Chemistry 52 (9): 2512–17. https://doi.org/10.1021/jf0352778.
Sellappan, Subramani, Casimir C. Akoh, and Gerard Krewer. 2002. “Phenolic Compounds and Antioxidant Capacity of Georgia-Grown Blueberries and Blackberries.” Journal of Agricultural and Food Chemistry 50 (8): 2432–38. https://doi.org/10.1021/jf011097r.
Shanks, Niall, Ray Greek, and Jean Greek. 2009. “Are Animal Models Predictive for Humans?” Philosophy, Ethics, and Humanities in Medicine : PEHM 4 (January): 2. https://doi.org/10.1186/1747-5341-4-2.
Šimić, Domagoj, Rezica Sudar, Tatjana Ledenčan, Antun Jambrović, Zvonimir Zdunić, Ivan Brkić, and Vlado Kovačević. 2009. “Genetic Variation of Bioavailable Iron and Zinc in Grain of a Maize Population.” Journal of Cereal Science, Special Section: Enzymes in Grain Processing, 50 (3): 392–97. https://doi.org/10.1016/j.jcs.2009.06.014.
Slavin, Joanne L., and Beate Lloyd. 2012. “Health Benefits of Fruits and Vegetables1.” Advances in Nutrition 3 (4): 506–16. https://doi.org/10.3945/an.112.002154.
Sluis, Addie A. van der, Matthijs Dekker, Anton de Jager, and Wim M. F. Jongen. 2001. “Activity and Concentration of Polyphenolic Antioxidants in Apple: Effect of Cultivar, Harvest Year, and Storage Conditions.” Journal of Agricultural and Food Chemistry 49 (8): 3606–13. https://doi.org/10.1021/jf001493u.
Song, Brian J., Zeina E. Jouni, and Mario G. Ferruzzi. 2013. “Assessment of Phytochemical Content in Human Milk during Different Stages of Lactation.” Nutrition (Burbank, Los Angeles County, Calif.) 29 (1): 195–202. https://doi.org/10.1016/j.nut.2012.07.015.
Song, T., K. Barua, G. Buseman, and P. A. Murphy. 1998. “Soy Isoflavone Analysis: Quality Control and a New Internal Standard.” The American Journal of Clinical Nutrition 68 (6 Suppl): 1474S-1479S. https://doi.org/10.1093/ajcn/68.6.1474S.
Stull, April J., Katherine C. Cash, William D. Johnson, Catherine M. Champagne, and William T. Cefalu. 2010. “Bioactives in Blueberries Improve Insulin Sensitivity in Obese, Insulin-Resistant Men and Women.” The Journal of Nutrition 140 (10): 1764–68. https://doi.org/10.3945/jn.110.125336.
54
Tagliazucchi, Davide, Elena Verzelloni, Davide Bertolini, and Angela Conte. 2010. “In Vitro Bio-Accessibility and Antioxidant Activity of Grape Polyphenols.” Food Chemistry 120 (2): 599–606. https://doi.org/10.1016/j.foodchem.2009.10.030.
Tamura, M., H. Nakagawa, T. Tsushida, K. Hirayama, and K. Itoh. 2007. “Effect of Pectin Enhancement on Plasma Quercetin and Fecal Flora in Rutin-Supplemented Mice.” Journal of Food Science 72 (9): S648–51. https://doi.org/10.1111/j.1750-3841.2007.00557.x.
Tavares, Lucélia, Inês Figueira, Diana Macedo, Gordon J. McDougall, Maria Cristina Leitão, Helena L. A. Vieira, Derek Stewart, Paula M. Alves, Ricardo B. Ferreira, and Cláudia N. Santos. 2012. “Neuroprotective Effect of Blackberry (Rubus Sp.) Polyphenols Is Potentiated after Simulated Gastrointestinal Digestion.” Food Chemistry 131 (4): 1443–52. https://doi.org/10.1016/j.foodchem.2011.10.025.
Thakkar, Sagar K., Bussie Maziya-Dixon, Alfred G. O. Dixon, and Mark L. Failla. 2007. “β-Carotene Micellarization during in Vitro Digestion and Uptake by Caco-2 Cells Is Directly Proportional to β-Carotene Content in Different Genotypes of Cassava.” The Journal of Nutrition 137 (10): 2229–33. https://doi.org/10.1093/jn/137.10.2229.
Timmers, Michael A., Mary H. Grace, Gad G. Yousef, and Mary Ann Lila. 2017. “Inter- and Intra-Seasonal Changes in Anthocyanin Accumulation and Global Metabolite Profiling of Six Blueberry Genotypes.” Journal of Food Composition and Analysis 59 (June): 105–10. https://doi.org/10.1016/j.jfca.2017.02.019.
Ting, Yuwen, Qin Zhao, Chunxin Xia, and Qingrong Huang. 2015. “Using in Vitro and in Vivo Models To Evaluate the Oral Bioavailability of Nutraceuticals.” Journal of Agricultural and Food Chemistry 63 (5): 1332–38. https://doi.org/10.1021/jf5047464.
Tomás‐Barberán, Francisco A., and Michael N. Clifford. 2000. “Dietary Hydroxybenzoic Acid Derivatives – Nature, Occurrence and Dietary Burden.” Journal of the Science of Food and Agriculture 80 (7): 1024–32. https://doi.org/10.1002/(SICI)1097-0010(20000515)80:7<1024::AID-JSFA567>3.0.CO;2-S.
Tsao, Rong. 2010. “Chemistry and Biochemistry of Dietary Polyphenols.” Nutrients 2 (12): 1231–46. https://doi.org/10.3390/nu2121231.
Turfus, S. C., R. Delgoda, D. Picking, and B. J. Gurley. 2017. “Chapter 25 - Pharmacokinetics.” In Pharmacognosy, edited by Simone Badal and Rupika Delgoda, 495–512. Boston: Academic Press. https://doi.org/10.1016/B978-0-12-802104-0.00025-1.
U.S. Department of Health and Human Services and U.S. Department of Agriculture. 2015 – 2020 Dietary Guidelines for Americans. 8th Edition. December 2015.
Van de Wiele, Tom, Pieter Van den Abbeele, Wendy Ossieur, Sam Possemiers, and Massimo Marzorati. 2015. “The Simulator of the Human Intestinal Microbial Ecosystem (SHIME®).” In The Impact of Food Bioactives on Health: In Vitro and Ex Vivo Models, edited by Kitty Verhoeckx, Paul Cotter, Iván López-Expósito, Charlotte Kleiveland, Tor Lea, Alan Mackie, Teresa Requena, Dominika Swiatecka, and Harry Wichers, 305–17. Cham: Springer International Publishing. https://doi.org/10.1007/978-3-319-16104-4_27.
Vuong, T., A. Benhaddou-Andaloussi, A. Brault, D. Harbilas, L. C. Martineau, D. Vallerand, C. Ramassamy, C. Matar, and P. S. Haddad. 2009. “Antiobesity and Antidiabetic Effects of Biotransformed Blueberry Juice in KKA y Mice.” International Journal of Obesity 33 (10): 1166–73. https://doi.org/10.1038/ijo.2009.149.
Walsh, Kelly R., Yu Chu Zhang, Yael Vodovotz, Steven J. Schwartz, and Mark L. Failla. 2003. “Stability and Bioaccessibility of Isoflavones from Soy Bread during In Vitro Digestion.”

55
Journal of Agricultural and Food Chemistry 51 (16): 4603–9. https://doi.org/10.1021/jf0342627.
Wang, Jun, Cheuk Tang, Mario G. Ferruzzi, Bing Gong, Brian J. Song, Elsa M. Janle, Tzu-Ying Chen, et al. 2013. “Role of Standardized Grape Polyphenol Preparation as a Novel Treatment to Improve Synaptic Plasticity through Attenuation of Features of Metabolic Syndrome in a Mouse Model.” Molecular Nutrition & Food Research 57 (12): 2091–2102. https://doi.org/10.1002/mnfr.201300230.
Wang, Yun, Kai Woo Lee, Franky L. Chan, Shiuan Chen, and Lai K. Leung. 2006. “The Red Wine Polyphenol Resveratrol Displays Bilevel Inhibition on Aromatase in Breast Cancer Cells.” Toxicological Sciences 92 (1): 71–77. https://doi.org/10.1093/toxsci/kfj190.
Wu, Xianli, Hoy E. Pittman, Steve Mckay, and Ronald L. Prior. 2005. “Aglycones and Sugar Moieties Alter Anthocyanin Absorption and Metabolism after Berry Consumption in Weanling Pigs.” The Journal of Nutrition 135 (10): 2417–24. https://doi.org/10.1093/jn/135.10.2417.
Yi, Weiguang, Joan Fischer, Gerard Krewer, and Casimir C. Akoh. 2005. “Phenolic Compounds from Blueberries Can Inhibit Colon Cancer Cell Proliferation and Induce Apoptosis.” Journal of Agricultural and Food Chemistry 53 (18): 7320–29. https://doi.org/10.1021/jf051333o.
Zheng, W., and S. Y. Wang. 2001. “Antioxidant Activity and Phenolic Compounds in Selected Herbs.” Journal of Agricultural and Food Chemistry 49 (11): 5165–70. https://doi.org/10.1021/jf010697n.
Zheng, Wei, and Shiow Y. Wang. 2003. “Oxygen Radical Absorbing Capacity of Phenolics in Blueberries, Cranberries, Chokeberries, and Lingonberries.” Journal of Agricultural and Food Chemistry 51 (2): 502–9. https://doi.org/10.1021/jf020728u.
56
CHAPTER 2. DEVELOPING A HIGH THROUGHPUT IN VITRO DIGESTION MODEL TO PHENOTYPE BIOACCESSIBILITY OF HIGHBUSH BLUEBERRIES
2.1. Introduction
The Dietary Guidelines for Americans has consistently based recommendations for
consumption of plant foods including fruit and vegetable on evidence for their role in meeting
nutrient needs and based on the growing evidence of their association with chronic disease
prevention (USDA. 2015 – 2020 Dietary Guidelines for Americans. 8th Edition, 2015). While
micronutrient content of fruits and vegetables is critical to meeting select nutrient needs,
phytochemicals including (poly)phenolics found in many plant foods have also been associated
with prevention of cardiovascular disease (Basu et al. 2010; Bazzano et al. 2002; Curtis et al.
2019), neurodegenerative disorders (Joseph et al. 1999; Tavares et al. 2012; Papandreou et al.
2009; Krikorian et al. 2010), cancer (Bagchi et al. 2004; Bunea et al. 2013; Damianaki et al. 2000;
Yi et al. 2005), obesity (Stull et al. 2010; Prior et al. 2010; Vuong et al. 2009), and diabetes (van
Dam and Feskens 2002; Grace et al. 2009; Fan et al. 2013). Interest in so called “superfoods” has
been driven by a combination of micronutrient and phytochemical content and the notion that
phytochemicals, such as phenolics, may have the ability to alter both oxidative and inflammatory
stress associated with these disorders (Triebel, Trieu, and Richling 2012; Zheng and Wang 2003;
Ghosh et al. 2006).
Blueberries (Vaccinium Sp.) are one such “superfood” that have received much attention
by virtue of their diverse array and relatively high concentration of phenolic compounds including
anthocyanins (ANC), phenolic acids (PA), flavonols (FLAV) and flavan-3ols (F3L) (Wilhelmina
Kalt, Joseph, and Shukitt-Hale 2007; Smith et al. 2000; Kong et al. 2003; W. Kalt, McDonald, and
Donner 2000). Blueberries belong to three distinct species within the genus Vaccinium section (or
sub-genus) Cyanococcus (Ericaceae family); the vaccinium angustifolium (lowbush blueberry),
57
the vaccinium virgatum (rabbiteye blueberry) and the vaccinium corymbosum (northern highbush
blueberry) (Retamales and Hancock 2018). All species are native to North American and have
been commercially produced for many years (Retamales and Hancock 2018) Specifically, lowbush
blueberries are produced mostly in eastern Canada and the northeastern United States (US),
rabbiteye are localized in the southern parts of the US, while highbush are found in temperate
regions throughout North America (Retamales and Hancock 2018). Lowbush “wild” blueberries
are composed of many genetically and phenotypically different varieties (W. Kalt, McDonald, and
Donner 2000) and are known to have a greater antioxidant capacity and a naturally smaller and
more compact (less moisture) composition compared to its cultivated counterpart (Wild
Blueberries of North American, 2019).
While blueberry consumption specifically is associated with a reduced risk of diabetes
(Martineau et al. 2006; Grace et al. 2009), cardiovascular disease (Basu et al. 2010; Curtis et al.
2019), cancer (Bunea et al. 2013; Kraft et al. 2005), as well as Alzheimer’s disease and other
neurodegenerative processes (Papandreou et al. 2009; Brewer et al. 2010), less is known regarding
the individual differences in potential health benefits between unique blueberry genotypes. With
growing interest in understanding the underlying mechanisms by which blueberries deliver on
these benefits, phenotyping including phenolic and micronutrient phenotyping have been
conducted on select germplasm collections (Howard, Clark, and Brownmiller 2003; Wilhelmina
Kalt et al. 2001; Connor et al. 2002; Bunea et al. 2013; Grace et al. 2014). In general, insight
provided from phenotyping select germplasms have proven useful to breeding programs interested
in enhancing the phenolic content and potential health benefits of various plant materials, including
berries (Brennan 2008; Graham et al. 2004).
58
While promising, health benefits from polyphenol consumption are dependent not only on
the qualitative and quantitative profiles in the fruit, but perhaps most critically on their efficiency
of absorption and metabolism (bioavailability) by the human body. Enhancement of phenolic
content does not always translate to higher bioavailability (Scalzo et al. 2005; G. J. McDougall et
al. 2005). Maiz et al. (2016), recently reported that bioavailability of phenolics differed
significantly between nine individual blueberry genotypes in a preclinical rodent model (Maiz et
al. 2016). The reason for these differences remains unclear but could be critical to understanding
distinct bioactivity differences between these berries.
While existing breeding programs seek to enhance our understanding of factors impacting
fruit phenolic profiles and content (Prodorutti et al. 2007), little is known regarding traits that are
associated with phenolic bioavailability. One reason for this remains the notion that bioavailability
is a “trait” best screened using costly and time-consuming in vivo models that can compare only
small numbers of genotypically distinct fruits (G. J. McDougall et al. 2005). Therefore, the
potential to leverage variation in traits related to bioavailability remains untapped due to a lack of
physiologically relevant phenotyping methods appropriate for screening large populations.
The use of in vitro digestion models to estimate nutrient and phytochemical bioavailability
from foods has been previously established by our group and others (Lipkie et al. 2013; Moser et
al. 2016; G. J. McDougall et al. 2005; Tagliazucchi et al. 2010; Bermúdez-Soto, Tomás-Barberán,
and García-Conesa 2007). Relying on predetermined human physiological conditions, these in
vitro models measure bioaccessibility, the digestive release and solubilization of individual
micronutrients or phytochemicals (Garrett, Failla, and Sarama 1999; Miller et al. 1981). In this
fashion they estimate the amount of micronutrient or phytochemical made available for absorption
and have demonstrated high correlation to bioavailability in humans (Reboul et al. 2006; Peters et
59
al. 2010). With the potential to screen matrix and processing factors that impact on digestion and
intestinal absorption of nutrients and bioactives (Neilson and Ferruzzi 2011; Neilson et al. 2009),
these models have more recently been used to identify iron bioaccessibility as a genetically
variable trait in maize (Šimić et al. 2009) and variations in beta-carotene bioaccessibility among
biofortified cassava genotypes (J. Aragón et al. 2018). These efforts served as a support to scientist
breeding biofortified grains for at risk populations (J. Aragón et al. 2018; Lipkie et al. 2013; Pixley,
Palacios-Rojas, and Glahn 2011).
While promising, current digestion models remain dependent on manual processing with
larger sample volumes, thus making them somewhat inefficient for screening larger germplasm
collections required to develop insights into genetic influences of bioaccessibility. Therefore,
given the interest in developing a bioaccessibility phenotype across larger germplasm collections,
a need exists to improve the throughput of existing in vitro digestion models. With this in mind,
the main objective of the current study was to adapt and semi-automate an existing static three-
compartment in vitro gastrointestinal digestion model for high throughput (HT) phenotyping of
the bioaccessibility of blueberry phenolics. Following validation of the HT model against the
standard, low throughput in vitro digestion models (LT), the HT model was applied to a subset of
33 individual blueberry genotypes from a mapping population currently used in phenolic research.
2.2. Materials and Methods
2.2.1. Chemicals, solutions and standards
Chromatography solvents (acetonitrile, methanol, water and formic acid) and phenolic
standards (cyanidin 3-O-glucoside, delphinidin 3-O-glucoside, peonidin 3-O-glucoside, petunidin
3-O-glucoside, malvidin 3-O-glucoside, catechin, epicatechin, caffeic acid, vanillic acid,
chlorogenic acid, syringetin and quercetin 3-O-glucoside) were purchased from Sigma Aldrich (St.
60
Louis, MO, USA). Additional standards, ethyl gallate and taxifolin, utilized for control purposes
were purchased from TCI (Portland, OR, USA) and Selleckchem (Houston, TX, USA),
respectively. Materials required for the simulated digestion including mucin (M2378), a-amylase
(A3176), pepsin (P7125), lipase (L3126), pancreatin (P7545), bile (B8631) were purchased from
Sigma Aldrich, while urea (U15-500) and uric acid (A13346-14) were purchased from Fisher
Chemical (Fair Lawn, NJ, USA). Materials used for adjusting pH during in vitro digestion model,
including HCl and NaHCO3 were purchased from Fisher Chemical. NaCl for adjusting volume
throughout the digestion was purchased from Fisher Chemical.
2.2.2. Blueberry material
Initial in vitro digestion method adaptation and validation was completed with commercial
store-bought, cultivated blueberries obtained from a local market in Kannapolis, NC. Following
adaptation and validation, the HT method was applied to a subset of 33 individual blueberry
genotypes derived from a mapping population generated by crosses of two elite, highbush
blueberry cultivars, Draper and Jewel (DxJ). Select DxJ genotypes were harvested in June of 2017
(Corvallis, Oregon) and shipped frozen to the North Carolina State University Plants for Human
Health Institute in Kannapolis, NC. All materials were stored frozen at -80oC until further
processing prior to digestion.
2.2.3. Blueberry processing for digestions
Frozen blueberries (85-100g) were thawed for approximately 30 minutes and coarsely
blended (Waring Commercial Laboratory) for 2 minutes followed by a more complete
homogenization using a VWR 250 homogenizer equipped with a VWR 20mmx200mm Saw-Tooth
Generator Probe for 1.5 minutes to generate a smooth puree-like consistency. Once processed,
blueberry purees were aliquoted stored at −80 °C until further analysis.
61
2.2.4. Established, low throughput (LT) in vitro gastrointestinal digestion
Phenolic bioaccessibility of fresh weight (f.w.), frozen blueberry plant material was
assessed utilizing a modified version of a traditional, static, LT three-phase in vitro digestion
model as described by Moser et al (2016) (Moser et al. 2016). Briefly, a simulated saliva or oral
phase solution (6 mL) was added to the processed blueberry aliquots (3.3 g/50 mL reaction tube).
The reactions were individually vortexed and blanketed with nitrogen prior to being placed in an
oscillating incubator (37 °C, 85 opm, 10 min). Following, samples were diluted to a volume of 30
mL with 0.9% saline. Gastric phase was then initiated by the addition of porcine pepsin solution
(2 mL, 20 mg/mL in 0.1 M HCl). The reactions were adjusted to pH 2.5.0 ± 0.1 with 1.0 M HCl
and brought to 40 mL with saline solution before being vortexed, blanketed with nitrogen and
placed into the incubator (37 °C, 85 opm, 1 h). The small intestinal phase began with pH
adjustment of gastric digesta to 6.5 ± 0.1 with 1.0 M NaHCO3. Small intestinal enzymes (2 mL,
20 mg/mL pancreatin, 10 mg/mL lipase in 0.1 M NaHCO3) and porcine bile salts (3 mL, 30 mg/mL
bile extract in 0.1 M NaHCO3) were added and samples were ultimately standardized to a final
volume of 50 mL with saline. Each reaction was finally vortexed, blanketed with nitrogen and
placed within the incubator (37 °C, 85 opm, 2 h). Following the intestinal phase, samples were
centrifuged (10,400×g, 4 °C, 1 h). The centrifuged aqueous (AQ), or bioaccessible fraction, was
collected, filtered (0.22 um; (Macherery Nagel, Bethlehem, PA, USA)) and stored (−80 °C). until
further analysis.
2.2.5. High throughput (HT) in vitro gastrointestinal digestion
Development of a HT in vitro digestion model required manipulation of parameters set by
the aforementioned “gold standard” model. Such modifications included proportionally reducing
starting material and total digestion volume, as similarly conducted by Lipkie et al. (2014) where
62
carotenoid bioaccessibility with slight overall volume reduction accurately replicated that of in
vivo analysis (Lipkie et al. 2014). Additional adaptations included modified mixing conditions,
filtering enzyme solutions to avoid particulate, as well as integrating the adjusted model with an
automated liquid-handling robot (Tecan EVO 150, Tecan; Mannedorf, Switzerland). Utilizing the
Tecan as opposed to manual execution promoted increased speed while providing more precise
reagent distribution, throughput and walkaway time. Aliquots (1.1 g/15 mL reaction tube) of
processed blueberries were placed into Tecan sample racks (16 tubes/rack) and loaded into
defined Tecan columns. Reaction tubes were subjected to a simulated 1.8mL oral phase
containing a-amylase that had been previously centrifuged at 10,600 x g for 10 minutes to
remove any potential coagulates that may disrupt aspiration of the fine-tipped Tecan syringes.
Tube racks were removed from Tecan and reaction tubes were individually vortexed, placed
back within racks and blanketed with nitrogen. Tube racks were then stacked into a closed,
oscillating incubator (37 °C, 155 OPM, 10 min). Once removed from the incubator, reactions
were diluted with 0.9% saline solution and introduced to the gastric phase by the addition of 0.6
mL porcine pepsin solution (10 mg/mL in 0.1 M HCl). A control sample (wild blueberry freeze-
dried powder or 2% coffee solution) and a random blueberry sample were selected and removed
from each Tecan rack and adjusted to desired pH (pH 2.5 ± 0.1 with 1.0 M HCl). Control samples
were expected to be consistent to evaluate consistency of enzyme solution preparation and Tecan
function between separate runs. HCl addition to randomly selected blueberry samples was
averaged, determining the appropriate amount of the 1.0 M HCl for application to the entire
blueberry subset. Following pH adjustment, 0.9% saline solution was added to sample tubes
bringing the volume total to 12 mL prior to blanketing with nitrogen and incubating (37 °C, 155
OPM, 1 hr). The intestinal phase was initiated by the sequential addition of a combination of 0.6
63
mL small intestinal enzymes (20 mg/mL of pancreatin and 10mg/mL of lipase in 0.1M NaHCO3
centrifuged at 10,400xg rpm for 10 minutes) and 0.9 mL porcine bile salts (30mg/mL bile extract
in 0.1M NaHCO3). Reactions were ultimately adjusted to pH 6.5 ± 0.1 with 1M NaHCO3, brought
up to ultimate digestion volume of 15 mL with 0.9% saline solution, blanketed with nitrogen and
incubated (37 °C, 155 OPM, 2 h). Following intestinal incubation, racks were immediately
removed from the incubator and placed back in the Tecan where the robot aspirated a total of 3
mL of the digested material sample, known as digesta (DG), from each reaction tube and dispensed
1.5 mL into 2 separate 96-well (2 mL) collection plates (Waters US, Milford, MA, USA),
consecutively, the second plate intended as a back-up. Plates were blanketed with nitrogen and
covered with 96-well square plug silicone/PTFE cap-mats (Waters US, Milford, MA, USA) and
secured within the centrifuge (2988xg, 1hr). Post-centrifugation, the 96-well plates are
immediately placed on ice where the separated aqueous (AQ) fraction was removed, filtered (0.45
um PTFE; (Macherery Nagel, Bethlehem, PA, USA)) and stored in a −80 °C freezer until further
analysis.
2.2.6 Low throughput (LT) phenolic extraction
Extraction for the initial method adaptation and validation was completed by combining
500 mg of processed blueberry with 5 mL of 2% formic acid in 80% methanol. The combination
was vortexed for approximately 1 minute before being centrifuged at 3600 x g for 4 minutes. The
supernatant was removed and dried under nitrogen. This was repeated a total of 3 times, however,
the second and third round utilized 2% formic acid in methanol as the primary extraction solvent.
Dried supernatant was further resolubilized in 5 mL of 0.1% formic acid in 50:50 methanol and
water and filtered through a 0.22 um PTFE membrane. After samples were resolubilized, they
were vortexed for a period of 2 minutes per sample until all residue was removed from sides of
64
test tube. Samples were further extracted by means of solid phase extraction (SPE) to additionally
concentrate and purify samples, prior to analysis, using a modified method previously reported by
Song et al. (2013) (Song et al. 2013). Briefly, cartridges were conditioned first with 1% formic
acid in methanol followed by 1% formic acid in water. Once conditioned, 1 mL of sample was
loaded onto the SPE cartridge (Oasis® HLB 1cc (30 mg)). Samples were spiked with 50 ul of an
internal standard (200uM ethyl gallate) to determine extraction recovery. Samples were then rinsed
with 0.1% formic acid in water and 1% formic acid in water. Elution of phenolics was completed
with 0.1% formic acid in methanol. Eluates were completely dried down under nitrogen manifold.
Extracted samples were then resolubilized with 0.1% formic acid in 50:50 methanol and water
before being filtered through .45 um PTFE membrane and analysis by LC-MS.
2.2.7. High Throughput (HT) Phenolic Extraction
For analysis of the DxJ genotypes, a similar extraction method by (de Ferrars et al. 2014)
was modified to account for the increase in throughput using a polymeric reversed-phase, 96-well
plate (Phenomenex, Strata™-X 33 um, 10 mg/well). While cartridge preparation remained the
same, sample loading volume was decreased to 500 ul sample (750 uL raw extracted sample
diluted in 750 ul of 1% formic acid in water, loaded 1 mL) and approximately 583 ul aqueous
fraction (700 ul filtered aqueous fraction diluted in 500 ul of 1% formic acid in water, loaded 1
mL) accounting for the smaller cartridge size. Simultaneously, samples were spiked with a reduced
volume of ethyl gallate (200 uM) to later determine extraction recovery. Once rinsed, samples
were reconstituted in 0.1% formic acid in methanol into a 96-round well, polypropylene 350 ul
collection plate (Waters). Because this extraction procedure did not require a dry-down step
following elution, taxifolin (200 uM) was utilized as a volume control to adjust for any variation
65
in volume between wells following SPE. Once spiked with taxifolin, the 96-well collection plate
was placed into the LC-MS for analysis.
2.2.8. Analysis of polyphenolic compounds by LC-MS
Blueberry samples were characterized by LC-MS using a method adapted from that of
Song et al., (2013) (Song et al. 2013). Samples were injected into a Waters ACQUITY UPLC® H-
Class equipped with an ACQUITY UPLC® BEH C18 column (1.7 um, 2.1 mm x 150 mm).
Phenolic compounds were separated using a gradient elution using a binary mobile phase
composed by 0.1% formic acid in acetonitrile as solvent A and 2% formic acid in water as solvent
B. Following separation, individual phenolics were detected using a QDA mass selective detector
by means of individual single ion response (SIR) in both negative (phenolics and flavonoids) and
positive ion (ANCs). A total of 28 phenolic compounds found to be representative of blueberry,
based on previous literature (Grace et al. 2014; Correa-Betanzo et al. 2014; Sellappan, Akoh, and
Krewer 2002), were targeted for analysis (Table 2.1). Authentic standards of each compound, with
limited exception, were used to determine existing compounds within samples and were further
used to quantify such compounds via calibration curves. Concentration of all ANC compounds
were based upon the -3-O glucosidic form of each parent compound, while other glycoside peaks
(galactoside, arabinoside, “other”) were identified based off elution order determined by previous
reports (Kader et al. 1996; Wu et al. 2005; Wilhelmina Kalt et al. 1999; Grace et al. 2014).
Furthermore, all quercetin glycosides were estimated utilizing only quercetin-3-O- glucoside.
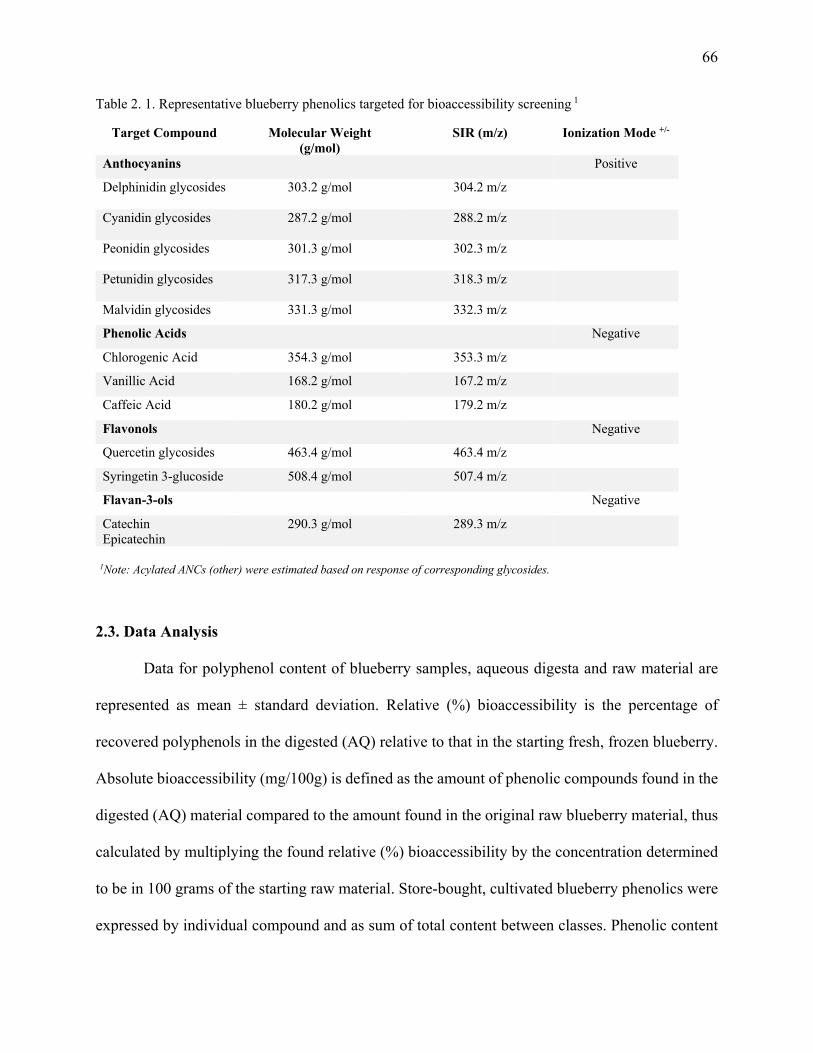
66
Table 2. 1. Representative blueberry phenolics targeted for bioaccessibility screening 1
Target Compound Molecular Weight (g/mol)
SIR (m/z) Ionization Mode +/-
Anthocyanins
Positive
Delphinidin glycosides
303.2 g/mol 304.2 m/z
Cyanidin glycosides
287.2 g/mol 288.2 m/z
Peonidin glycosides
301.3 g/mol 302.3 m/z
Petunidin glycosides
317.3 g/mol 318.3 m/z
Malvidin glycosides 331.3 g/mol 332.3 m/z
Phenolic Acids
Negative
Chlorogenic Acid 354.3 g/mol 353.3 m/z
Vanillic Acid 168.2 g/mol 167.2 m/z
Caffeic Acid 180.2 g/mol 179.2 m/z
Flavonols
Negative
Quercetin glycosides 463.4 g/mol 463.4 m/z
Syringetin 3-glucoside 508.4 g/mol 507.4 m/z
Flavan-3-ols
Negative
Catechin Epicatechin
290.3 g/mol 289.3 m/z
1Note: Acylated ANCs (other) were estimated based on response of corresponding glycosides.
2.3. Data Analysis
Data for polyphenol content of blueberry samples, aqueous digesta and raw material are
represented as mean ± standard deviation. Relative (%) bioaccessibility is the percentage of
recovered polyphenols in the digested (AQ) relative to that in the starting fresh, frozen blueberry.
Absolute bioaccessibility (mg/100g) is defined as the amount of phenolic compounds found in the
digested (AQ) material compared to the amount found in the original raw blueberry material, thus
calculated by multiplying the found relative (%) bioaccessibility by the concentration determined
to be in 100 grams of the starting raw material. Store-bought, cultivated blueberry phenolics were
expressed by individual compound and as sum of total content between classes. Phenolic content
67
of DxJ blueberries were solely expressed by class due to their minimal overall content. To assess
variation between models and blueberry genotypes as well as differences in phenolic profile and
bioaccessibility data (relative and absolute) JMP (version Pro 14, SAS Institute, Cary, NC, USA)
was utilized. Statistical analysis was done with one-way analysis of variance (ANOVA) and Tukey
test or t-test.
2.4. Results and Discussion
2.4.1. Phenolic profiles of commercial blueberries
Phenolic content including ANCs and non-ANC phenolics in commercial, cultivated
blueberries obtained locally in Kannapolis, NC can be seen in Table 2.2. Among the ANCs (ANC)
in the blueberry raw material, malvidin glycosides were shown to be the main compounds
contributing approximately 43% of the total ANC content which is comparable to previous reports
(Liu et al. 2014; Grace et al. 2014; Yousef et al. 2013). In addition, petunidin and cyanidin
glycosides accounted for about 24% and 16% of the total ANC content, respectively. Delphinidin
and peonidin contributed the lowest at approximately 12% and 11% of the sum-total ANC content.
Chlorogenic acid was found to be the major phenolic acid (PA) found in blueberries, contributing
significantly to the total sum of phenolic acids. These results were consistent with previous reports
(Howard, Clark, and Brownmiller 2003; Grace et al. 2014; Gao and Mazza 1994; Correa-Betanzo
et al. 2014; Yousef et al. 2013). Low amounts (0.2 and 0.3 mg/100g f.w.) of vanillic acid and
caffeic acid (<1%) were also noted, similarly reported by (Willy Kalt and McDonald 1996).
Relatively low levels of epicatechin and catechin (0.3 and 0.2 mg/100g f.w.) were observed
resulting in low overall content of F3Ls (F3L). Comparable to that previously reported (Grace et
al. 2014) quercetin was found to be the predominant FLAV (FLAV) contributing roughly 77% of
the sum-total FLAV content, while syringetin contributed approximately 23%.
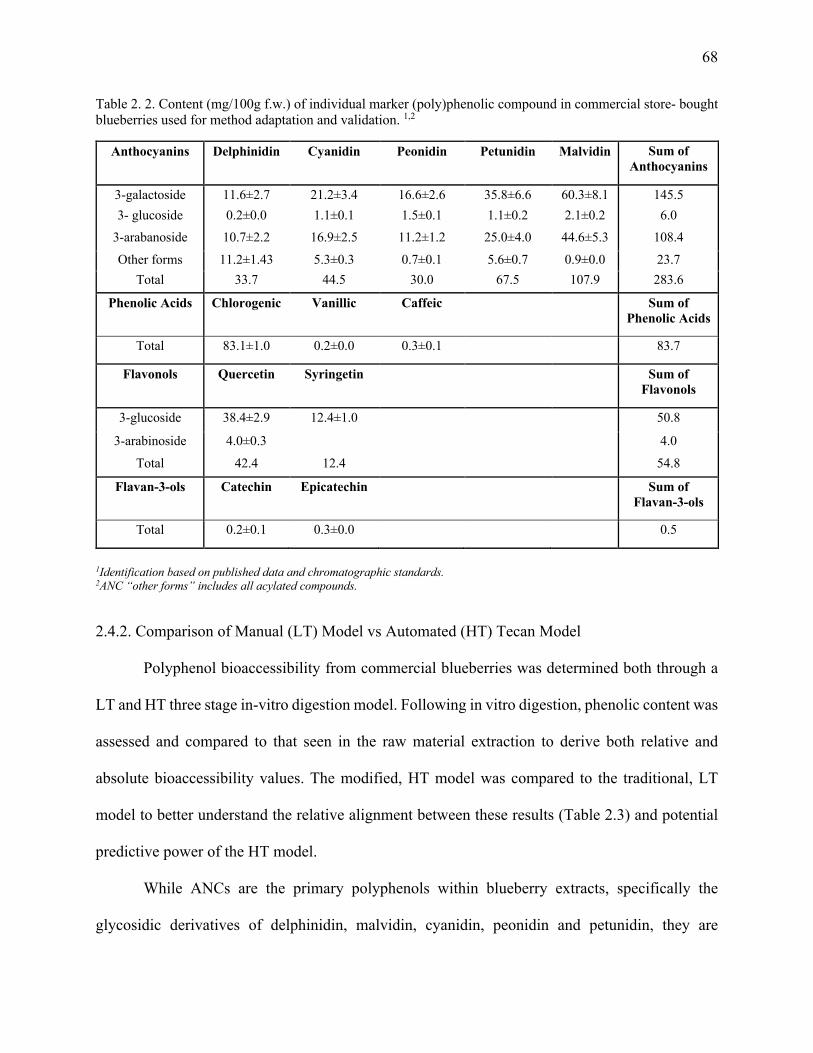
68
Table 2. 2. Content (mg/100g f.w.) of individual marker (poly)phenolic compound in commercial store- bought blueberries used for method adaptation and validation. 1,2
Anthocyanins Delphinidin Cyanidin Peonidin Petunidin Malvidin Sum of Anthocyanins
3-galactoside 11.6±2.7 21.2±3.4 16.6±2.6 35.8±6.6 60.3±8.1 145.5 3- glucoside 0.2±0.0 1.1±0.1 1.5±0.1 1.1±0.2 2.1±0.2 6.0
3-arabanoside 10.7±2.2 16.9±2.5 11.2±1.2 25.0±4.0 44.6±5.3 108.4 Other forms 11.2±1.43 5.3±0.3 0.7±0.1 5.6±0.7 0.9±0.0 23.7
Total 33.7 44.5 30.0 67.5 107.9 283.6
Phenolic Acids Chlorogenic Vanillic Caffeic
Sum of Phenolic Acids
Total 83.1±1.0 0.2±0.0 0.3±0.1
83.7
Flavonols Quercetin Syringetin
Sum of Flavonols
3-glucoside 38.4±2.9 12.4±1.0
50.8
3-arabinoside 4.0±0.3
4.0 Total 42.4 12.4
54.8
Flavan-3-ols Catechin Epicatechin
Sum of Flavan-3-ols
Total 0.2±0.1 0.3±0.0
0.5
1Identification based on published data and chromatographic standards. 2ANC “other forms” includes all acylated compounds.
2.4.2. Comparison of Manual (LT) Model vs Automated (HT) Tecan Model
Polyphenol bioaccessibility from commercial blueberries was determined both through a
LT and HT three stage in-vitro digestion model. Following in vitro digestion, phenolic content was
assessed and compared to that seen in the raw material extraction to derive both relative and
absolute bioaccessibility values. The modified, HT model was compared to the traditional, LT
model to better understand the relative alignment between these results (Table 2.3) and potential
predictive power of the HT model.
While ANCs are the primary polyphenols within blueberry extracts, specifically the
glycosidic derivatives of delphinidin, malvidin, cyanidin, peonidin and petunidin, they are
69
generally considered to be very chemically unstable compounds susceptible to in vitro digestive
conditions (Correa-Betanzo et al. 2014; Liu et al. 2014; Tagliazucchi et al. 2010; Bermúdez-Soto,
Tomás-Barberán, and García-Conesa 2007; G. J. McDougall et al. 2005). In the current study,
ANCs were noted to compose roughly 67% of the total phenolic profile of the analyzed
commercial blueberry. When assessed following digestion, the greatest absolute bioaccessibility
in ANCs was observed in malvidin glycosides (LT; 41.1mg/100g, (43.3%), HT; 61.2mg/100g,
(64.0%)). Following malvidin, the highest bioaccessible content was noted within peonidin
glycosides (LT; 12.7mg/100g, (45.0%) HT; 19.2mg/100g, (60.8%)) cyanidin glycosides (LT;
11.8mg/100g, (32.0%), HT; 18.2mg/100g, (43.8%) and petunidin glycosides (LT; 7.3mg/100g,
(20.0%), HT; 11.4mg/100g, (26.4%)). Of the ANCs analyzed, delphinidin glycosides exhibited
the lowest absolute bioaccessibility (LT; 5.6mg/100g, HT; 56.9%, 6.4mg/100g). Detectable peaks
consisted solely of acylated forms of delphinidin, while delphinidin 3-galactoside, 3-glucoside and
3-arabinoside proved too unstable for detection following digestion. Regarding relative
bioaccessibility, LT and HT were consistent in terms of their rank order of highest to lowest
bioaccessibility apart from peonidin having a slightly greater relative bioaccessibility compared to
malvidin in the LT method.
Overall, the total sum of ANCs experienced a total digestive loss of 64.6% (LT) and 51.5%
(HT), respectively, noting relative bioaccessibility ranging from 6.0-61.6% (average 35.4%) (LT)
and 12.1-75.4% (average 48.5%) (HT). A similar study, conducted by Liu et al. (2014),
investigated the stability of blueberry ANCs throughout a successive in vitro gastric and pancreatic
digestion model and observed an average loss of 46% in ANC content (Liu et al. 2014). Likewise,
additional consistencies in bioaccessibility were noted in chokeberry (57.4%) (Bermúdez-Soto,
Tomás-Barberán, and García-Conesa 2007), grape juice (3.7—37.2%) (Moser et al. 2016),
70
pomegranate juice (48%) (Pérez-Vicente, Gil-Izquierdo, and García-Viguera 2002), red wine
(34.1%) (G. J. McDougall et al. 2005) and raspberries (61.9%). Interestingly, in agreement with
the current study, a study investigating wild blueberry (Vaccinium angustifolium) saw a range of
bioaccessibility (4.4-37.3%) with an average around 17% following digestion (Correa-Betanzo et
al. 2014), while significantly lower recovery was noted in a study conducted by Jiao et al. (2018)
which found ANC bioaccessibility in cultivated blueberries to be only 3.4% (Jiao et al. 2018). In
the same way, researchers determining the bioaccessibility of maqui berry detected very low ANC
content, approximately 0.5-0.6% following the intestinal phase (Lucas-Gonzalez et al. 2016).
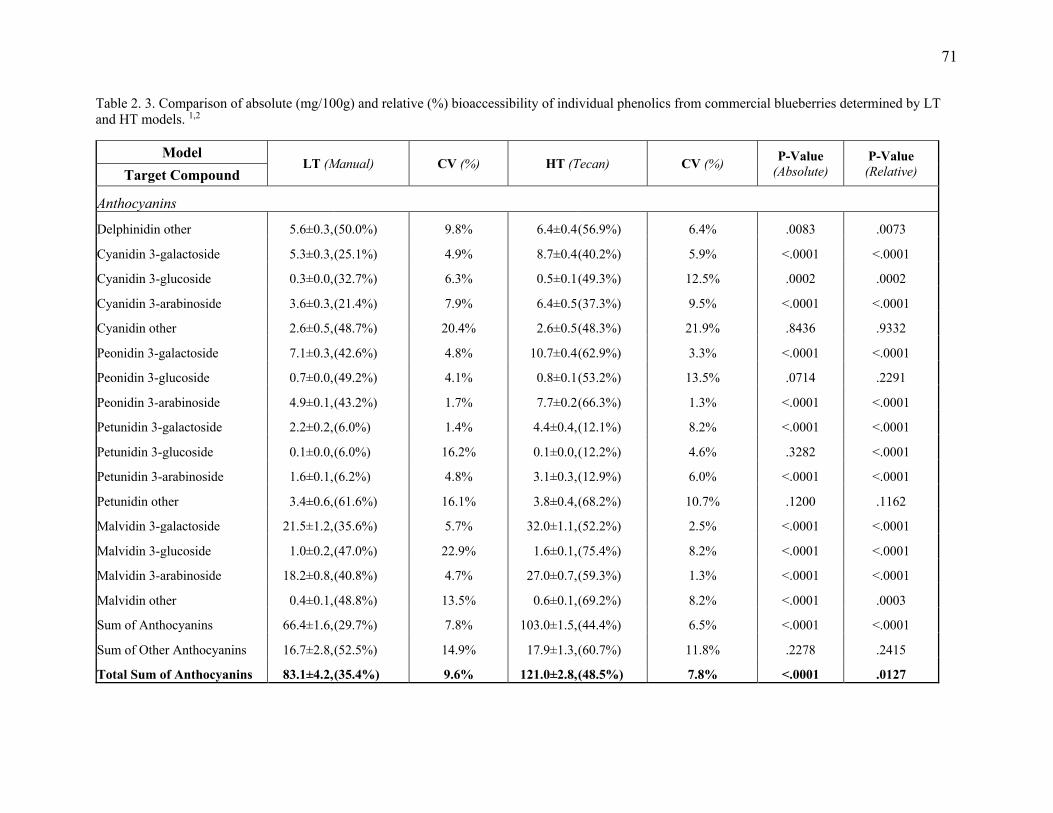
71
Table 2. 3. Comparison of absolute (mg/100g) and relative (%) bioaccessibility of individual phenolics from commercial blueberries determined by LT and HT models. 1,2
Model LT (Manual) CV (%) HT (Tecan) CV (%) P-Value
(Absolute) P-Value (Relative) Target Compound
Anthocyanins
Delphinidin other 5.6±0.3, (50.0%) 9.8% 6.4±0.4 (56.9%) 6.4% .0083 .0073
Cyanidin 3-galactoside 5.3±0.3, (25.1%) 4.9% 8.7±0.4 (40.2%) 5.9% <.0001 <.0001
Cyanidin 3-glucoside 0.3±0.0, (32.7%) 6.3% 0.5±0.1 (49.3%) 12.5% .0002 .0002
Cyanidin 3-arabinoside 3.6±0.3, (21.4%) 7.9% 6.4±0.5 (37.3%) 9.5% <.0001 <.0001
Cyanidin other 2.6±0.5, (48.7%) 20.4% 2.6±0.5 (48.3%) 21.9% .8436 .9332
Peonidin 3-galactoside 7.1±0.3, (42.6%) 4.8% 10.7±0.4 (62.9%) 3.3% <.0001 <.0001
Peonidin 3-glucoside 0.7±0.0, (49.2%) 4.1% 0.8±0.1 (53.2%) 13.5% .0714 .2291
Peonidin 3-arabinoside 4.9±0.1, (43.2%) 1.7% 7.7±0.2 (66.3%) 1.3% <.0001 <.0001
Petunidin 3-galactoside 2.2±0.2, (6.0%) 1.4% 4.4±0.4, (12.1%) 8.2% <.0001 <.0001
Petunidin 3-glucoside 0.1±0.0, (6.0%) 16.2% 0.1±0.0, (12.2%) 4.6% .3282 <.0001
Petunidin 3-arabinoside 1.6±0.1, (6.2%) 4.8% 3.1±0.3, (12.9%) 6.0% <.0001 <.0001
Petunidin other 3.4±0.6, (61.6%) 16.1% 3.8±0.4, (68.2%) 10.7% .1200 .1162
Malvidin 3-galactoside 21.5±1.2, (35.6%) 5.7% 32.0±1.1, (52.2%) 2.5% <.0001 <.0001
Malvidin 3-glucoside 1.0±0.2, (47.0%) 22.9% 1.6±0.1, (75.4%) 8.2% <.0001 <.0001
Malvidin 3-arabinoside 18.2±0.8, (40.8%) 4.7% 27.0±0.7, (59.3%) 1.3% <.0001 <.0001
Malvidin other 0.4±0.1, (48.8%) 13.5% 0.6±0.1, (69.2%) 8.2% <.0001 .0003
Sum of Anthocyanins 66.4±1.6, (29.7%) 7.8% 103.0±1.5, (44.4%) 6.5% <.0001 <.0001
Sum of Other Anthocyanins 16.7±2.8, (52.5%) 14.9% 17.9±1.3, (60.7%) 11.8% .2278 .2415
Total Sum of Anthocyanins 83.1±4.2, (35.4%) 9.6% 121.0±2.8, (48.5%) 7.8% <.0001 .0127
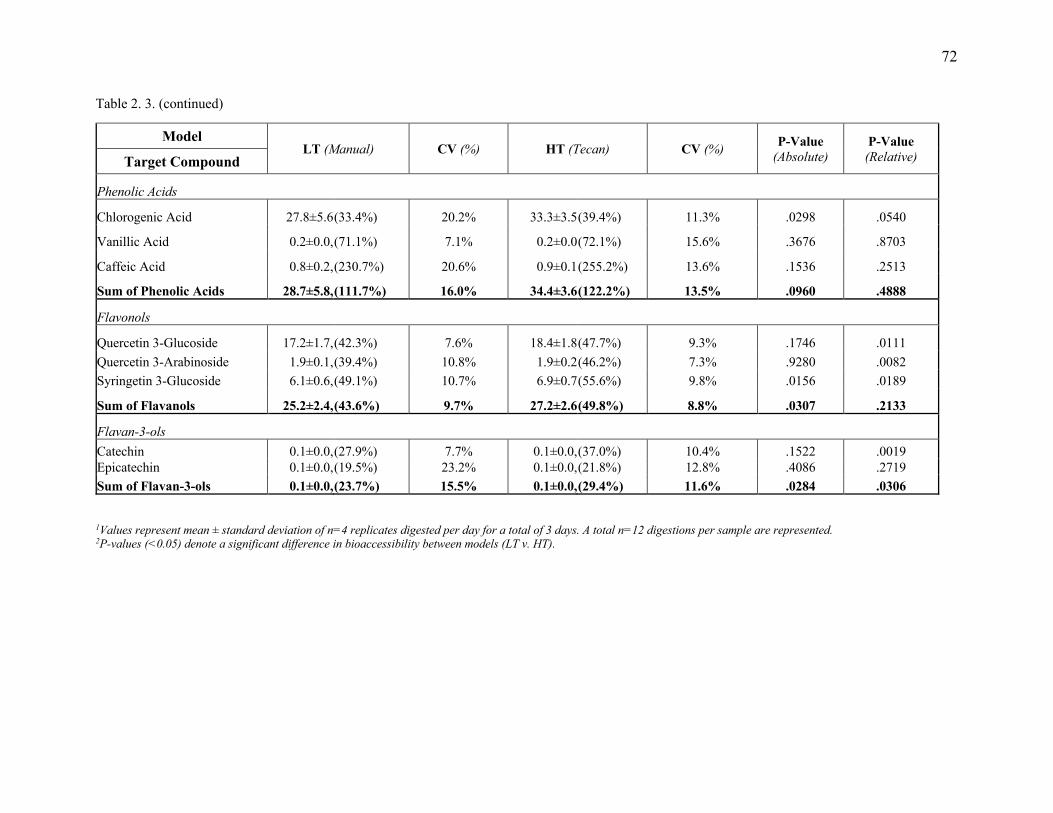
72
Table 2. 3. (continued)
Model LT (Manual) CV (%) HT (Tecan) CV (%) P-Value
(Absolute) P-Value (Relative) Target Compound
Phenolic Acids
Chlorogenic Acid 27.8±5.6 (33.4%) 20.2% 33.3±3.5 (39.4%) 11.3% .0298 .0540
Vanillic Acid 0.2±0.0, (71.1%) 7.1% 0.2±0.0 (72.1%) 15.6% .3676 .8703
Caffeic Acid 0.8±0.2, (230.7%) 20.6% 0.9±0.1 (255.2%) 13.6% .1536 .2513
Sum of Phenolic Acids 28.7±5.8, (111.7%) 16.0% 34.4±3.6 (122.2%) 13.5% .0960 .4888
Flavonols
Quercetin 3-Glucoside 17.2±1.7, (42.3%) 7.6% 18.4±1.8 (47.7%) 9.3% .1746 .0111 Quercetin 3-Arabinoside 1.9±0.1, (39.4%) 10.8% 1.9±0.2 (46.2%) 7.3% .9280 .0082 Syringetin 3-Glucoside 6.1±0.6, (49.1%) 10.7% 6.9±0.7 (55.6%) 9.8% .0156 .0189
Sum of Flavanols 25.2±2.4, (43.6%) 9.7% 27.2±2.6 (49.8%) 8.8% .0307 .2133
Flavan-3-ols Catechin 0.1±0.0, (27.9%) 7.7% 0.1±0.0, (37.0%) 10.4% .1522 .0019 Epicatechin 0.1±0.0, (19.5%) 23.2% 0.1±0.0, (21.8%) 12.8% .4086 .2719 Sum of Flavan-3-ols 0.1±0.0, (23.7%) 15.5% 0.1±0.0, (29.4%) 11.6% .0284 .0306 1Values represent mean ± standard deviation of n=4 replicates digested per day for a total of 3 days. A total n=12 digestions per sample are represented. 2P-values (<0.05) denote a significant difference in bioaccessibility between models (LT v. HT).
73
According to previous reports (Correa-Betanzo et al. 2014; Bermúdez-Soto, Tomás-
Barberán, and García-Conesa 2007; Liu et al. 2014; Tagliazucchi et al. 2010) a majority of ANC
loss can be attributed to their structural instability and ring cleavage within the weakly alkaline
(pH 6.5) environment of the intestinal phase most likely initiated by the ionization of the hydroxyl
groups. In general, the overall stability of ANCs is highly dependent on their chemical structure.
It has been reported that ANCs containing aromatic acyl groups are more stable than non-acylated
ANCs (Gordon J. McDougall et al. 2005; Stintzing et al. 2002; Mazza 2018; Giusti and Wrolstad
2003). This is evident in the current study as average ANC acylated form (LT; 52.5%, HT; 60.7%)
reported higher relative bioaccessibility compared to the average of the ANC glycosides
(galactoside, glucoside, arabinoside) (LT; 29.7%, HT; 44.4%). Additional factors of degradation
include exposure to light, high temperatures, oxygen, as well as method and duration of storage
(Patras et al. 2010; Alighourchi and Barzegar 2009; Reque et al. 2014; Rubinskiene et al. 2005;
Buckow et al. 2010). However, in the current study, preventative measures were taken to limit
such effects, including covering light sources with UV protective shields, blanketing the reactions
with nitrogen prior to incubation periods, keeping samples on ice during pH adjustment periods,
and storing samples within a -80oC freezer prior to extraction and digestion.
Following digestion, it was noted that phenolic acid bioaccessible content exceeded 100%
in both models (LT; 111.7%, HT; 122.2%), similarly seen in Andean berry (Agudelo et al. 2018).
Such values can be attributed to the high relative bioaccessibility of caffeic acid (LT; 230.7%, HT;
255.2%). A possible explanation for the high relative bioaccessibility can be a result of possible
caffeic acid derivatives, such as neochlorogenic acid or chlorogenic acid. In fact, high levels of
chlorogenic acid were seen in chokeberry and Andean berry (Bermúdez-Soto, Tomás-Barberán,
and García-Conesa 2007; Agudelo et al. 2018). Whereas much lower bioaccessible content of
74
caffeic acid was observed in grape juice which was noted at ranging from 24.8-44.7% (Moser et
al. 2016), as well as Andean berry which was 26.9% (Agudelo et al. 2018). Though, according to
a study by Tagliazucchi et al. (2010), homogenized red grapes were found to have a
bioaccessibility of 75.1% (Tagliazucchi et al. 2010). In the current study, chlorogenic acid
contributed to over 95% of the total PA content and approximately 20% of the sum-total
polyphenolic content. This was in agreement with previous work on blueberries which found
chlorogenic acid to be the predominant phenolic acid (96.5%) across several blueberry genotypes
(Yousef et al. 2013; Connor et al. 2002; Willy Kalt and McDonald 1996). In general, blueberries
have highest chlorogenic content of all fruits containing 0.5-2 g/kg f.w. (Macheix et al. 1990).
Within the targeted FLAVs, syringetin reported the highest relative bioaccessibility (LT;
49.1%, HT; 55.6%), followed by quercetin 3-glucoside and quercetin 3-arabanoside (LT; 42.3%,
39.4%, HT; 47.7%, 46.2%), comparable to that previously reported in blackberry, chokeberry and
wild blueberry (Tavares et al. 2012; Bermúdez-Soto, Tomás-Barberán, and García-Conesa 2007;
Correa-Betanzo et al. 2014). Additionally, quercetin 3-glucoside contributed the highest
bioaccessible content (LT; 17.3mg/100g, HT; 18.4mg/100g). Catechin had the greatest relative
bioaccessibility (LT; 27.9%, HT; 37.0%) within the targeted F3Ls, while the combined absolute
bioaccessibility (0.2mg/100g) insignificantly contributed to the total sum of phenolics. Results
obtained for F3L stability are similar to that observed in grape juice and chokeberry (Moser et al.
2016; Bermúdez-Soto, Tomás-Barberán, and García-Conesa 2007).
Higher absolute bioaccessibility was consistently observed within the HT method, not
including acylated forms of cyanidin which showed higher absolute bioaccessibility content within
the LT method compared to HT. Equivalent values noted in petunidin 3-glucoside, acylated forms
of cyanidin, vanillic, quercetin 3-arabinoside and all targeted F3Ls (catechin and epicatechin).
75
While mechanisms are unclear, consistently higher bioaccessibility within the HT, Tecan samples
could be attributed to a couple of reasons including: the smaller surface area of the 15 mL digestion
test tubes as opposed to the 50 mL test tubes, more thorough mixing of the Tecan digestions by
means of higher oscillation speeds and more compact rack placement within the incubator.
Despite differences in the bioaccessibility values obtained for the 24 targeted phenolic
compounds between HT and LT models, ultimately the two models of in vitro digestion were
determined to be highly correlated in both relative (r=0.97) and absolute bioaccessibility (r=0.98),
as shown in figure 2.1. While highly correlated, model (LT v. HT) proved to have a significant
effect on bioaccessibility values. Significant differences were observed in all compounds as a
result of assessment by differing model with the exception of the sum-total of acylated forms of
cyanidin and petunidin (p=0.84, p=0.12), petunidin and peonidin 3-glucoside (p=0.33, p=0.07),
vanillic and caffeic acid (p=0.37, p=0.15), quercetin glycosides (3-glucoside; p=0.17, 3-
arabinoside p=0.93), and catechin and epicatechin (p=0.15, p=0.41) where model-type did not
significantly influence bioaccessibility. By class, the sum of ANCs (p=<.0001), FLAVs (p=0.03)
and F3Ls (p=0.03) were all significantly affected by throughput of model. Conversely, model did
not significantly affect sum of acylated ANCs (p=0.23) or phenolic acids (p=0.96). LT and HT
models were analyzed for intra-day where two sets (n=4/set) of digestions were ran consecutively
to analyze consistency and variation amongst sets. Similarly, both models were tested for inter-
day variation, where digestion methods were tested across 3 different days to ensure consistency
and account for variation of the LT and HT between days. Both models proved to have good
reproducibility and relatively low coefficient of variance (CV%) both between sets and between
days. Intra-day showed the HT model to be slightly more consistent (CV; 1.3-19.5%, mean 7.5%)
compared to the LT model (CV; 3.2-39.3%, mean 9.4). HT model was shown to be more consistent
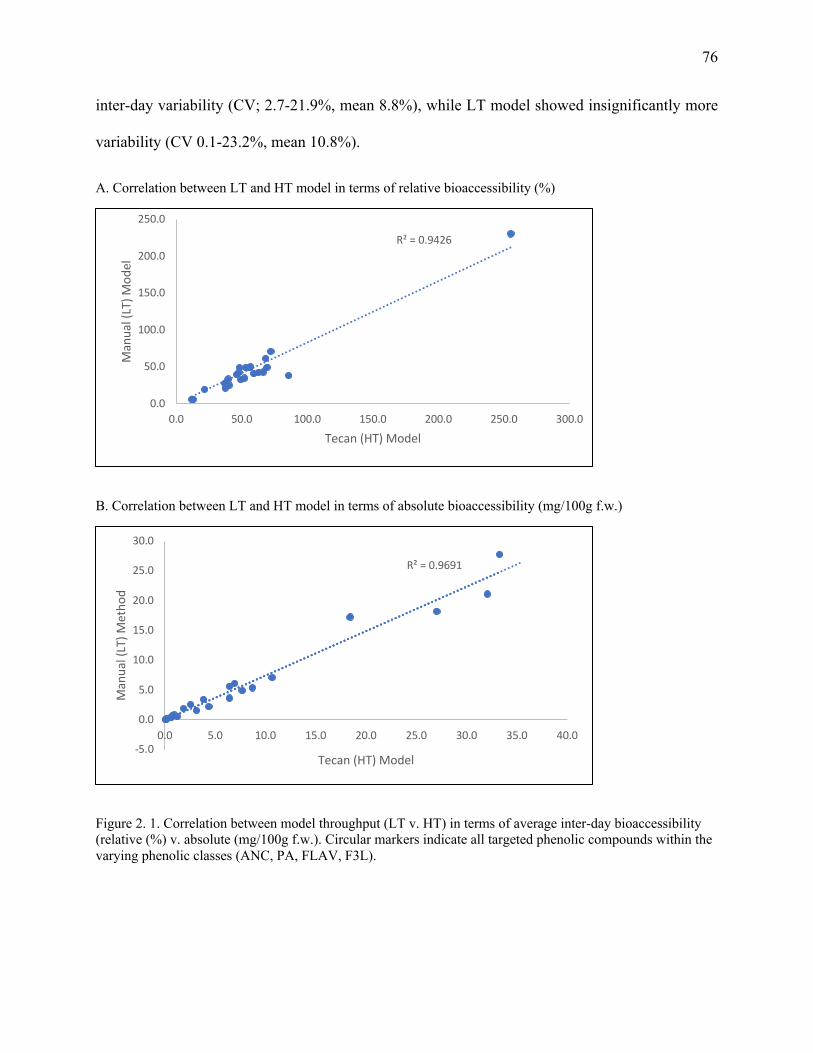
76
inter-day variability (CV; 2.7-21.9%, mean 8.8%), while LT model showed insignificantly more
variability (CV 0.1-23.2%, mean 10.8%).
A. Correlation between LT and HT model in terms of relative bioaccessibility (%)
B. Correlation between LT and HT model in terms of absolute bioaccessibility (mg/100g f.w.)
Figure 2. 1. Correlation between model throughput (LT v. HT) in terms of average inter-day bioaccessibility (relative (%) v. absolute (mg/100g f.w.). Circular markers indicate all targeted phenolic compounds within the varying phenolic classes (ANC, PA, FLAV, F3L).
R² = 0.9426
0.0
50.0
100.0
150.0
200.0
250.0
0.0 50.0 100.0 150.0 200.0 250.0 300.0
Man
ual (
LT) M
odel
Tecan (HT) Model
R² = 0.9691
-5.0
0.0
5.0
10.0
15.0
20.0
25.0
30.0
0.0 5.0 10.0 15.0 20.0 25.0 30.0 35.0 40.0
Man
ual (
LT) M
etho
d
Tecan (HT) Model
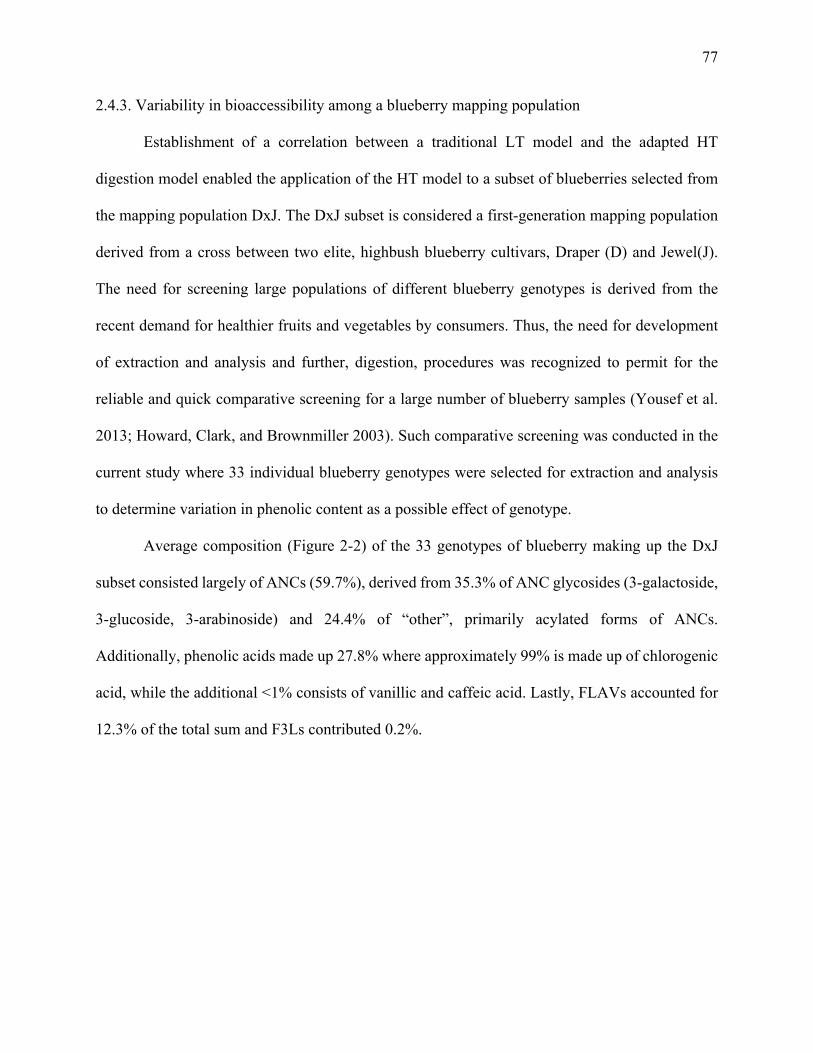
77
2.4.3. Variability in bioaccessibility among a blueberry mapping population
Establishment of a correlation between a traditional LT model and the adapted HT
digestion model enabled the application of the HT model to a subset of blueberries selected from
the mapping population DxJ. The DxJ subset is considered a first-generation mapping population
derived from a cross between two elite, highbush blueberry cultivars, Draper (D) and Jewel(J).
The need for screening large populations of different blueberry genotypes is derived from the
recent demand for healthier fruits and vegetables by consumers. Thus, the need for development
of extraction and analysis and further, digestion, procedures was recognized to permit for the
reliable and quick comparative screening for a large number of blueberry samples (Yousef et al.
2013; Howard, Clark, and Brownmiller 2003). Such comparative screening was conducted in the
current study where 33 individual blueberry genotypes were selected for extraction and analysis
to determine variation in phenolic content as a possible effect of genotype.
Average composition (Figure 2-2) of the 33 genotypes of blueberry making up the DxJ
subset consisted largely of ANCs (59.7%), derived from 35.3% of ANC glycosides (3-galactoside,
3-glucoside, 3-arabinoside) and 24.4% of “other”, primarily acylated forms of ANCs.
Additionally, phenolic acids made up 27.8% where approximately 99% is made up of chlorogenic
acid, while the additional <1% consists of vanillic and caffeic acid. Lastly, FLAVs accounted for
12.3% of the total sum and F3Ls contributed 0.2%.
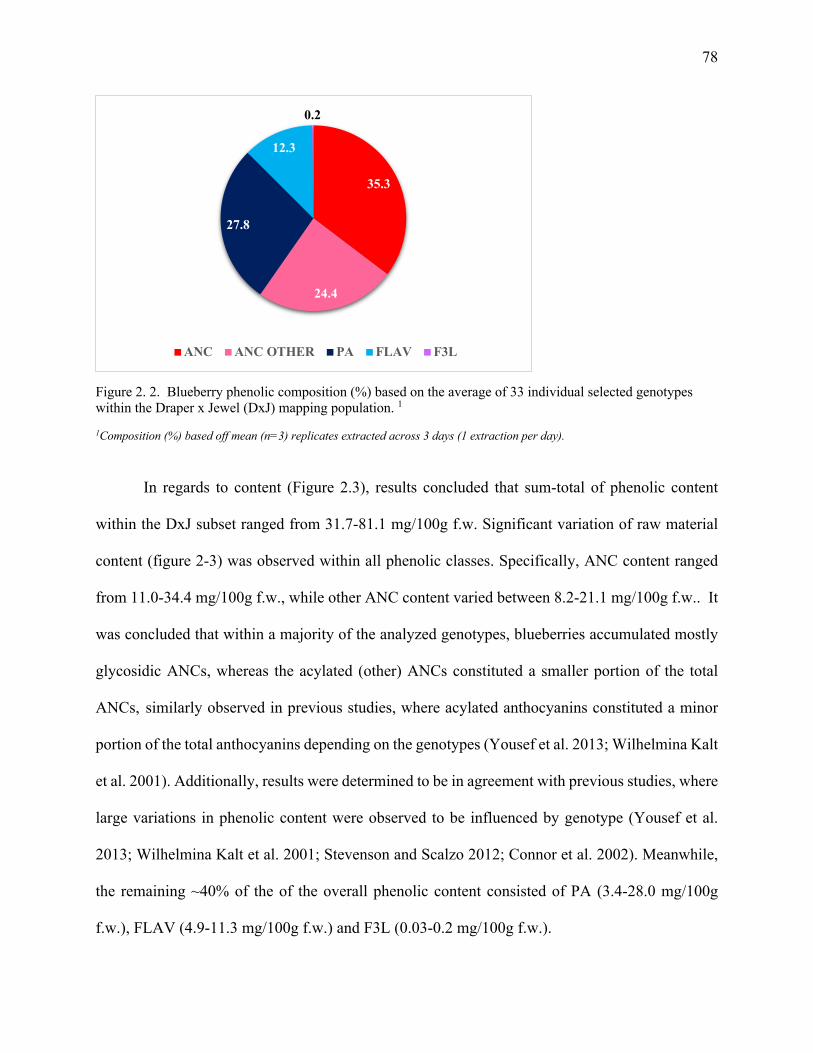
78
Figure 2. 2. Blueberry phenolic composition (%) based on the average of 33 individual selected genotypes within the Draper x Jewel (DxJ) mapping population. 1
1Composition (%) based off mean (n=3) replicates extracted across 3 days (1 extraction per day).
In regards to content (Figure 2.3), results concluded that sum-total of phenolic content
within the DxJ subset ranged from 31.7-81.1 mg/100g f.w. Significant variation of raw material
content (figure 2-3) was observed within all phenolic classes. Specifically, ANC content ranged
from 11.0-34.4 mg/100g f.w., while other ANC content varied between 8.2-21.1 mg/100g f.w.. It
was concluded that within a majority of the analyzed genotypes, blueberries accumulated mostly
glycosidic ANCs, whereas the acylated (other) ANCs constituted a smaller portion of the total
ANCs, similarly observed in previous studies, where acylated anthocyanins constituted a minor
portion of the total anthocyanins depending on the genotypes (Yousef et al. 2013; Wilhelmina Kalt
et al. 2001). Additionally, results were determined to be in agreement with previous studies, where
large variations in phenolic content were observed to be influenced by genotype (Yousef et al.
2013; Wilhelmina Kalt et al. 2001; Stevenson and Scalzo 2012; Connor et al. 2002). Meanwhile,
the remaining ~40% of the of the overall phenolic content consisted of PA (3.4-28.0 mg/100g
f.w.), FLAV (4.9-11.3 mg/100g f.w.) and F3L (0.03-0.2 mg/100g f.w.).
35.3
24.4
27.8
12.3
0.2
ANC ANC OTHER PA FLAV F3L
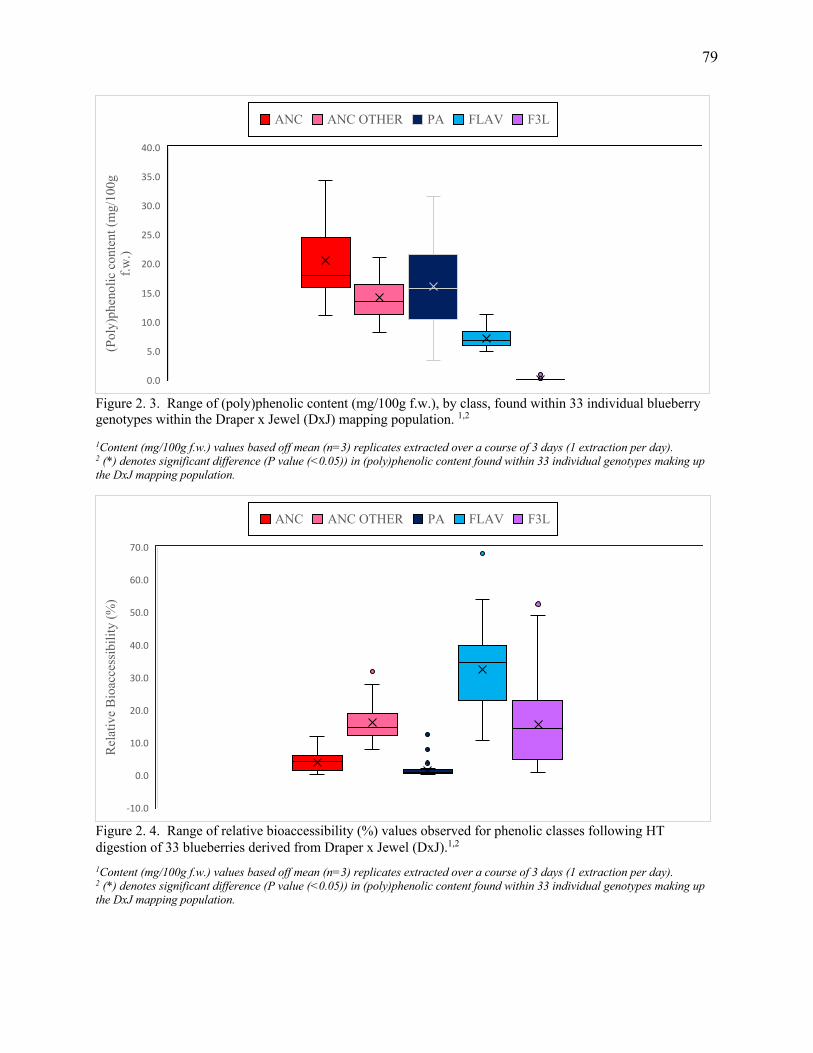
79
Figure 2. 3. Range of (poly)phenolic content (mg/100g f.w.), by class, found within 33 individual blueberry genotypes within the Draper x Jewel (DxJ) mapping population. 1,2
1Content (mg/100g f.w.) values based off mean (n=3) replicates extracted over a course of 3 days (1 extraction per day). 2 (*) denotes significant difference (P value (<0.05)) in (poly)phenolic content found within 33 individual genotypes making up the DxJ mapping population.
Figure 2. 4. Range of relative bioaccessibility (%) values observed for phenolic classes following HT digestion of 33 blueberries derived from Draper x Jewel (DxJ).1,2 1Content (mg/100g f.w.) values based off mean (n=3) replicates extracted over a course of 3 days (1 extraction per day). 2 (*) denotes significant difference (P value (<0.05)) in (poly)phenolic content found within 33 individual genotypes making up the DxJ mapping population.
(Pol
y)ph
enol
ic c
onte
nt (m
g/10
0g
f.w.)
0.0
5.0
10.0
15.0
20.0
25.0
30.0
35.0
40.0
ANC ANC OTHER PA FLAV F3LRe
lativ
e Bi
oacc
essib
ility
(%)
-10.0
0.0
10.0
20.0
30.0
40.0
50.0
60.0
70.0
ANC ANC OTHER PA FLAV F3L
80
The wide range exhibited in ANC and phenolic acid concentrations observed in this study,
suggests a possible direct correlation to in vivo bioactivity and therefore proposes a strong potential
for selectively breeding blueberry for improved ANC and phenolic acid content. However, a recent
study by Maiz et al. (2016), highlights the importance of the relation between total phenolic content
and bioavailability as a result of varying genotype (Maiz et al. 2016). Within the study,
investigators sought to characterize the phenolic content of 9 blueberry varieties of Vaccinium spp.
in addition to determining whether there is a difference in their bioavailability after an acute dose
in 84 ovariectomized rats. Urine and blood analysis revealed that total (poly)phenolic content and
bioavailability of individual phenolics varied widely among blueberry varieties. Notably, varieties
with significantly higher total phenolic content than other varieties did not have the highest have
the highest bioavailability (Maiz et al. 2016), thus indicating that blueberry content may not be
directly correlated to bioavailability, and by association, bioaccessibility. Therefore, to determine
the blueberry genotype(s) with the highest bioactivity, it is essential to not only assess berry
content, but the bioaccessible content following berry digestion.
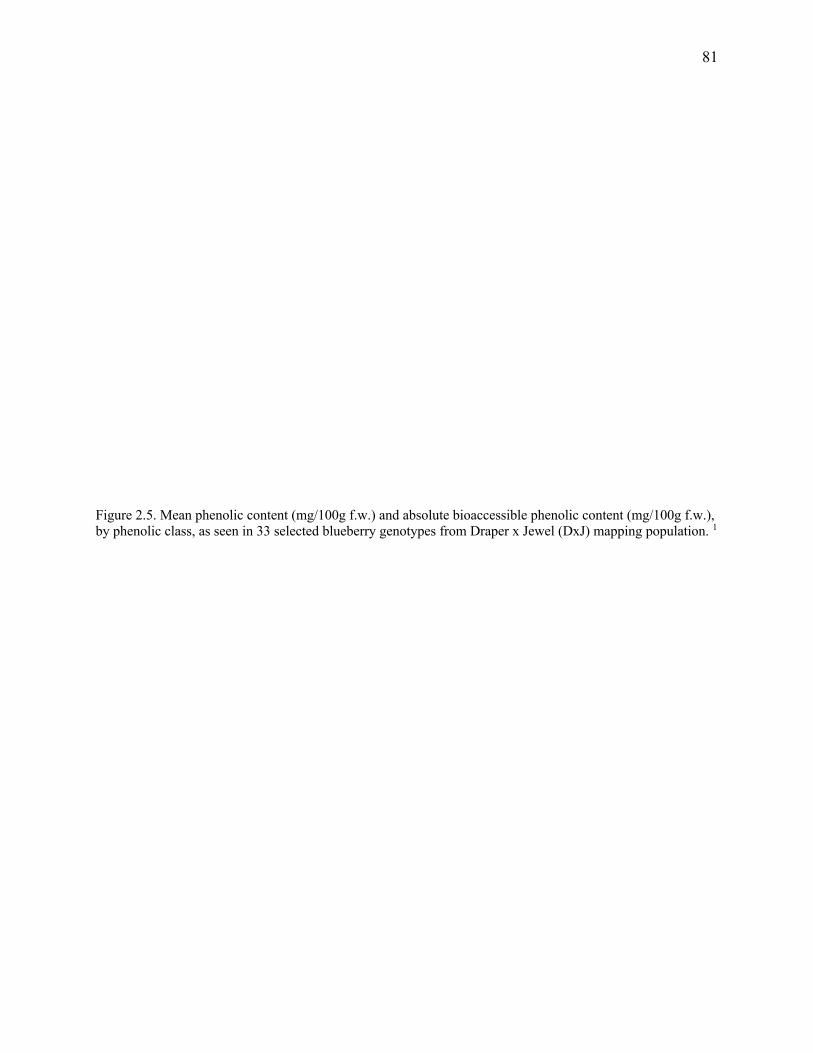
81
Figure 2.5. Mean phenolic content (mg/100g f.w.) and absolute bioaccessible phenolic content (mg/100g f.w.), by phenolic class, as seen in 33 selected blueberry genotypes from Draper x Jewel (DxJ) mapping population. 1
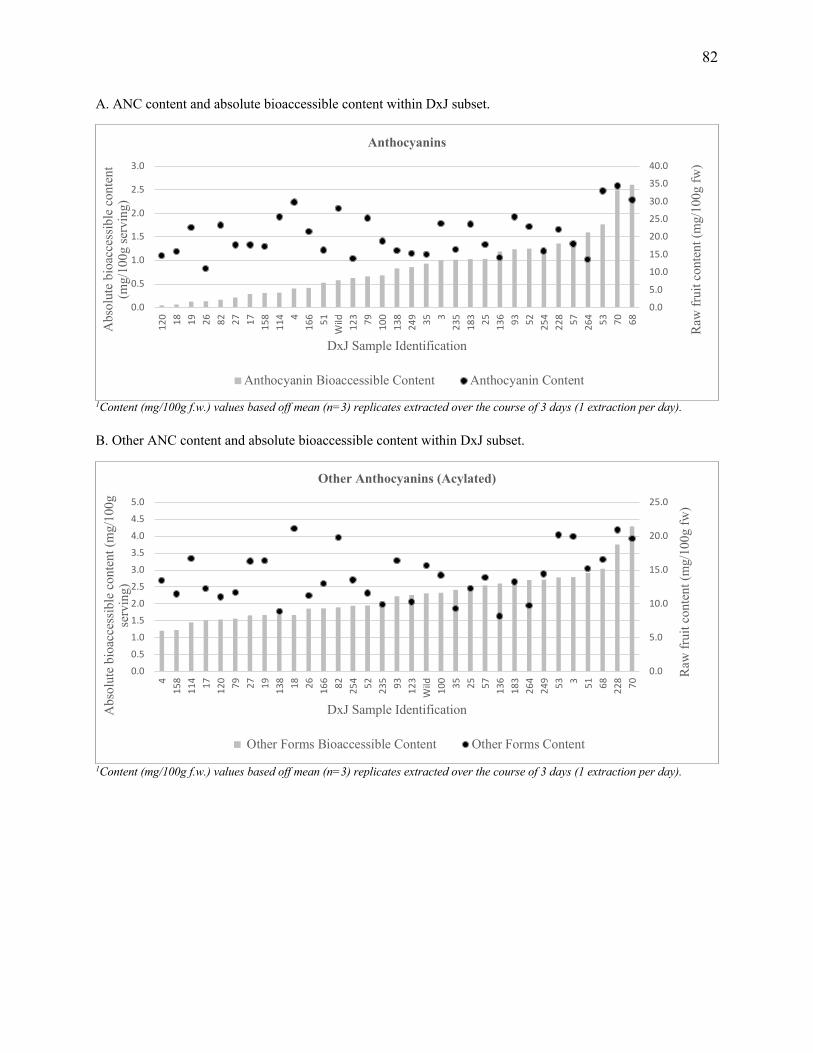
82
A. ANC content and absolute bioaccessible content within DxJ subset.
1Content (mg/100g f.w.) values based off mean (n=3) replicates extracted over the course of 3 days (1 extraction per day). B. Other ANC content and absolute bioaccessible content within DxJ subset.
1Content (mg/100g f.w.) values based off mean (n=3) replicates extracted over the course of 3 days (1 extraction per day).
0.05.0
10.015.0
20.025.030.0
35.040.0
0.0
0.5
1.0
1.5
2.0
2.5
3.012
0 18 19 26 82 27 17 158
114 4
166 51
Wild 123 79 100
138
249 35 3
235
183 25 136 93 52 254
228 57 264 53 70 68Abs
olut
e bi
oacc
essib
le c
onte
nt
(mg/
100g
serv
ing)
Raw
frui
t con
tent
(mg/
100g
fw)
DxJ Sample Identification
Anthocyanins
Anthocyanin Bioaccessible Content Anthocyanin Content
0.0
5.0
10.0
15.0
20.0
25.0
0.00.51.01.52.02.53.03.54.04.55.0
415
811
4 17 120 79 27 19 138 18 26 166 82 254 52 235 93 123
Wild 100 35 25 57 136
183
264
249 53 3 51 68 228 70
Abs
olut
e bi
oacc
essib
le c
onte
nt (m
g/10
0g
serv
ing)
Raw
frui
t con
tent
(mg/
100g
fw)
DxJ Sample Identification
Other Anthocyanins (Acylated)
Other Forms Bioaccessible Content Other Forms Content
83
C. PA content and absolute bioaccessible content within DxJ subset.
1Content (mg/100g f.w.) values based off mean (n=3) replicates extracted over the course of 3 days (1 extraction per day). D. FLAV content and absolute bioaccessible content within DxJ subset.
1Content (mg/100g f.w.) values based off mean (n=3) replicates extracted over the course of 3 days (1 extraction per day).
0.0
5.0
10.0
15.0
20.0
25.0
30.0
35.0
0.0
0.5
1.0
1.5
2.0
2.5
3.0
3.5
4.0
4.510
013
8 79 249
158 26 183
228 93 18 57 235 51 19 254
136 35 27 4
166 68 53 82 25 70 17 264 3
120
123 52 114
Wild
Ab
solu
te b
ioace
ssib
le c
on
ten
t (m
g/1
00g
serv
ing)
Raw
fru
it c
on
ten
t (m
g/1
00g f
w)
DxJ Sample Identification
Phenolic Acids
Phenolic Acid Bioaccessible Content Phenolic Acid Content
0.0
2.0
4.0
6.0
8.0
10.0
12.0
0.0
1.0
2.0
3.0
4.0
5.0
6.0
Wild 4 27 158
120 26 82 79 17 254
138
123
114 19 18 51 70 235 68 166
136
100 93 264 57 52 25 228
249
183 3 35 53
Raw
frui
t con
tent
(mg/
100g
fw)
Abs
olut
e bi
oacc
essib
le c
onte
nt (m
g/10
0g
serv
ing)
DxJ Sample Identification
Flavonols
Flavanol Bioaccessible Content Flavanol Content
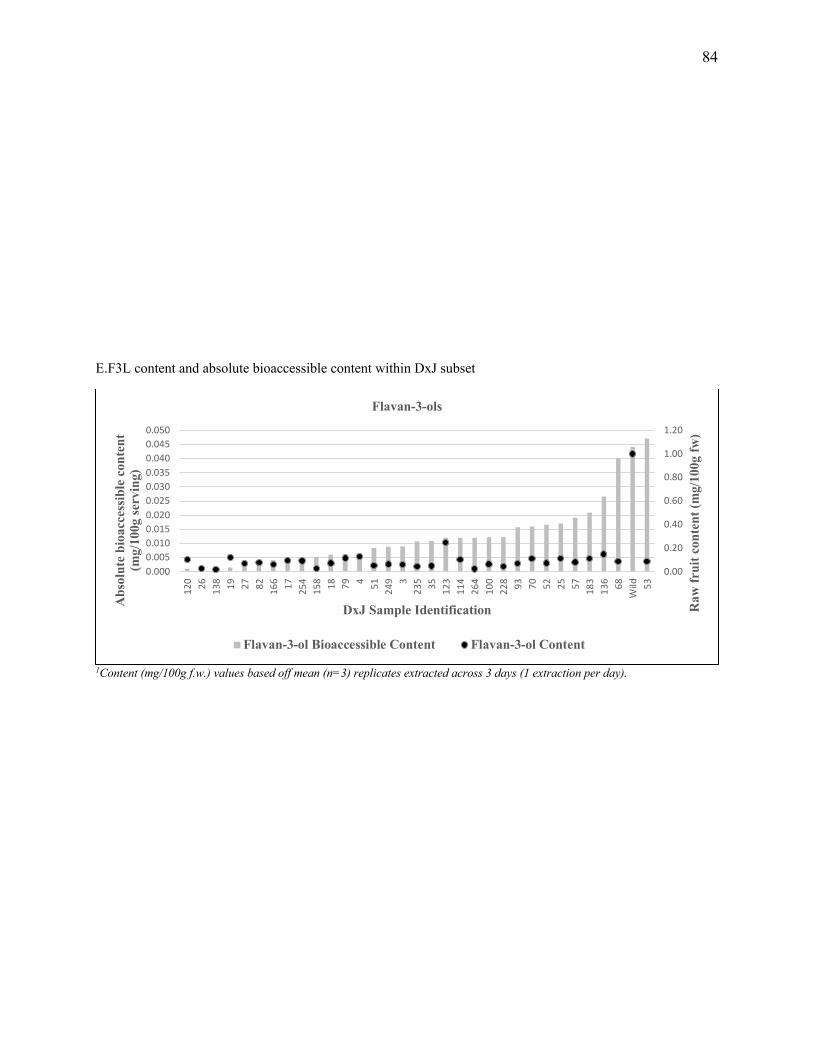
84
E.F3L content and absolute bioaccessible content within DxJ subset
1Content (mg/100g f.w.) values based off mean (n=3) replicates extracted across 3 days (1 extraction per day).
0.00
0.20
0.40
0.60
0.80
1.00
1.20
0.0000.0050.0100.0150.0200.0250.0300.0350.0400.0450.050
120 26 138 19 27 82 166 17 254
158 18 79 4 51 249 3
235 35 123
114
264
100
228 93 70 52 25 57 183
136 68
Wild 53
Raw
fru
it c
on
ten
t (m
g/1
00g f
w)
Ab
solu
te b
ioacc
essi
ble
con
ten
t (m
g/1
00g s
ervin
g)
DxJ Sample Identification
Flavan-3-ols
Flavan-3-ol Bioaccessible Content Flavan-3-ol Content
85
2.4.4. Genotypic effect on phenolic bioaccessibility as determined by HT in vitro digestion
within DxJ blueberry subset
With this in mind, in the current study, 33 individual blueberry genotypes were applied to
the 3 stage HT in vitro digestion model to characterize variation in the phenolic bioaccessibility
amongst the germplasm. Following digestion, significant variation was noted in bioaccessibility,
both relative (Figure 2.4) and absolute (Figure 2.5), within all phenolic classes.
Amongst the 33 genotypes, ANC relative bioaccessibility ranged from 0.3-11.7% (p
<0.0001), while absolute bioaccessibility ranged from 0.1-2.6 mg/100g f.w. (p <0.0001).
Association between (poly)phenolic content and bioaccessible content was noted in DxJ sample:
070, 053 and 068 where individual samples were ranked in the top 15% within both ANC content
within raw material and ANC content in the measured bioaccessible fraction. Conversely, DxJ
sample: 026 and 120 were considered to be in the bottom 15%. While association between ANC
content did exist, majority of the samples were assorted randomly with no observed relationship
between content before and after digestion. Notably, DxJ 264 had the highest relative
bioaccessibility (11.7%) of all digested samples as well as ranked within the top 15%, regarding
greatest bioaccessible content (1.6mg/100g f.w.). Given its high bioaccessibility ranking, DxJ 264
had the second lowest ANC content in terms of undigested, raw material.
The relative bioaccessibility of other forms of ANC noted significant variation ranging
from 7.9-27.9% (p <0.0001), whereas DxJ 136 was observed as a statistical outlier (31.8%).
Similar variability was noted in absolute bioaccessibility (1.2-4.3 mg/100g f.w., p <0.0001).
Sample association between raw material content and absolute bioaccessibility included DxJ 228
and 003, which were both found to be in the top 15%. Similar association were observed between
86
DxJ 114 and 004 in terms of relative and absolute bioaccessibility. Both were noted to be within
the bottom 15% of both bioaccessibility values.
Phenolic acids exhibited relative bioaccessibility values that ranged from 0.3-2.1% (p
<0.0001) with outliers including DxJ 114 (3.8%), 264 (7.9%), and the freeze-dried blueberry
control (12.4%). Absolute bioaccessibility ranged from 0.03-0.9 mg/100g f.w. (p <0.0001).
Specifically, DxJ 114 was highly ranked (top 15%) amongst all samples within absolute and
relative bioaccessibility as well as raw material content. Likewise, DxJ 120 was ranked highly
within absolute and raw material content, however not in relative bioaccessibility, while DxJ 138
was observed in both the bottom 15% of both raw material content and bioaccessible content.
Looking into the relationship between relative and absolute bioaccessibility, DxJ 123 ranked was
found to be highly ranked amongst all samples. Rankings for lowest relative bioaccessibility and
absolute bioaccessibility were determined to be closely related as 80% of the bottom 15% were
the same, including DxJ 100, 079, 249 and 158.
Bioaccessibility for FLAVs ranged from 10.7-54.1%, 0.8-5.5 mg/100g f.w. (p <0.0001).
In terms of relative bioaccessibility, DxJ 035 was noted to be an outlier (68.1%). Noteworthy
samples include DxJ 053, 035 (top 15%) and 004, as they all were found to be associated between
bioaccessible and raw material content, while DxJ 027 and 120 reported association between
relative and absolute bioaccessibility only. Specifically, DxJ 053 and 035 are both ranked in the
top 2 highest relative and absolute bioaccessibility where as DxJ 027 and 120 were observed to be
within the lowest 15%. However, DxJ 053 is noted to be highly ranked in FLAV raw material
content, while DxJ 035 is seen in to be the lowest ranking of all the samples. DxJ 004 had the
lowest bioaccessibility (both relative and absolute) and was similarly ranked in the bottom 15% of
FLAV raw material content.
87
Significant variation was observed amongst F3Ls relative bioaccessibility ranging from
1.0-49.1% (p <0.0001), while DxJ 053 was deemed a statistical outlier at 52.5%. Specifically, DxJ
136 was found to rank highly in both raw material content and absolute bioaccessibility, while DxJ
138 and 026 fell into the bottom 15%. Majority of the lowest ranking samples in terms of relative
bioaccessibility (lowest to greatest; DxJ 026, 120, 019, 027) were also found within the lowest
15% of absolute bioaccessibility. Additionally, DxJ 019 was observed to be highly ranked in raw
material content, while DxJ 026 was considered one of the bottom 15% of raw material content.
Both DxJ 053 and 068 are ranked in the top 15% for both absolute and relative bioaccessibility.
Conversely, DxJ 235 was ranked in the bottom 15% in terms of relative bioaccessibility and raw
material content.
Amongst the 33 individual genotypes, significant variation was noted in raw material
content and both absolute and relative bioaccessibility. Although natural variation was expected,
observed variability between days could potentially be attributed to points in the harvesting and
processing steps prior to digestion. Specifically, during processing blueberry samples were
blended separately, dependent on day rather than in bulk per genotype. It has been shown that
reproducibility was significantly increased during bulk homogenization (Barnes et al. 2009).
Similarly, studies have demonstrated the use of lyophilized or freeze-dried ground samples as they
were shown to increase reproducibility as compared to ground fresh berries (Barnes et al. 2009;
Grace et al. 2014) similar to those used in the current study. Additionally, prior to processing, the
blueberries were photographed, post-harvest, to observe color and shape differences amongst
varying blueberry cultivars. During this photographing process, blueberries were partially thawed
and placed under bright lighting for different amounts of time before they were re-frozen.
Similarly, during processing, the blueberries were thawed again for blending purposes. Likewise,
88
to prepare for digestion, the processed blueberries were thawed to be aliquoted for digestion.
Ultimately, the aliquoted blueberries were thawed a last time the day of the digestion. Therefore,
on average the blueberries were frozen and rethawed around four times throughout the entire
process. Stability is greatly impacted by such influences and therefore could result in decrease in
overall content (Patras et al. 2010; Alighourchi and Barzegar 2009; Reque et al. 2014; Rubinskiene
et al. 2005; Buckow et al. 2010). Considering these are challenges often observed in a first-time
application, it is expected that streamlining of these post-harvest processing and phenotyping
would reduce the potential for this variability.
2.5. Conclusions
Overall, it was determined that the adapted HT in vitro digestion model does provide a new
tool for phenotyping phenolic bioaccessibility in blueberry fruit germplasm collections as it was
observed to be highly correlated to the existing model described by Moser et al. (2016).
Application to a subset of 33 different blueberry genotypes further suggest that variation in
phenolic bioaccessibility exist as a potential result of individual genetic makeup. Therefore, this
supports the notion of broader application to diversity panels and other collections to inform for
breeding programs and aid in the development of strategies to enhance the nutritional quality of
fruits.
89
2.6. REFERENCES
Agudelo, Carlos D., Ivan Luzardo-Ocampo, Rocio Campos-Vega, Guadalupe Loarca-Piña, and María E. Maldonado-Celis. 2018. “Bioaccessibility during In Vitro Digestion and Antiproliferative Effect of Bioactive Compounds from Andean Berry (Vaccinium Meridionale Swartz) Juice.” Journal of Agricultural and Food Chemistry 66 (28): 7358–66. https://doi.org/10.1021/acs.jafc.8b01604.
Alighourchi, Hamidreza, and Mohsen Barzegar. 2009. “Some Physicochemical Characteristics and Degradation Kinetic of Anthocyanin of Reconstituted Pomegranate Juice during Storage.” Journal of Food Engineering 90 (2): 179–85. https://doi.org/10.1016/j.jfoodeng.2008.06.019.
Bagchi, D., C. K. Sen, M. Bagchi, and M. Atalay. 2004. “Anti-Angiogenic, Antioxidant, and Anti-Carcinogenic Properties of a Novel Anthocyanin-Rich Berry Extract Formula.” Biochemistry (Moscow) 69 (1): 75–80. https://doi.org/10.1023/B:BIRY.0000016355.19999.93.
Barnes, Jeremy S., Hien P. Nguyen, Sijia Shen, and Kevin A. Schug. 2009. “General Method for Extraction of Blueberry Anthocyanins and Identification Using High Performance Liquid Chromatography–Electrospray Ionization-Ion Trap-Time of Flight-Mass Spectrometry.” Journal of Chromatography A 1216 (23): 4728–35. https://doi.org/10.1016/j.chroma.2009.04.032.
Basu, Arpita, Mei Du, Misti J. Leyva, Karah Sanchez, Nancy M. Betts, Mingyuan Wu, Christopher E. Aston, and Timothy J. Lyons. 2010. “Blueberries Decrease Cardiovascular Risk Factors in Obese Men and Women with Metabolic Syndrome.” The Journal of Nutrition 140 (9): 1582–87. https://doi.org/10.3945/jn.110.124701.
Bazzano, Lydia A., Jiang He, Lorraine G. Ogden, Catherine M. Loria, Suma Vupputuri, Leann Myers, and Paul K. Whelton. 2002. “Fruit and Vegetable Intake and Risk of Cardiovascular Disease in US Adults: The First National Health and Nutrition Examination Survey Epidemiologic Follow-up Study.” The American Journal of Clinical Nutrition 76 (1): 93–99. https://doi.org/10.1093/ajcn/76.1.93.
Bermúdez-Soto, M. -J., F. -A. Tomás-Barberán, and M. -T. García-Conesa. 2007. “Stability of Polyphenols in Chokeberry (Aronia Melanocarpa) Subjected to in Vitro Gastric and Pancreatic Digestion.” Food Chemistry 102 (3): 865–74. https://doi.org/10.1016/j.foodchem.2006.06.025.
Brennan, R.M. 2008. “Currants and Gooseberries.” In Temperate Fruit Crop Breeding: Germplasm to Genomics, edited by James F. Hancock, 177–96. Dordrecht: Springer Netherlands. https://doi.org/10.1007/978-1-4020-6907-9_6.
Brewer, Gregory J., John R. Torricelli, Amanda L. Lindsey, Elizabeth Z. Kunz, A. Neuman, Derek R. Fisher, and James A. Joseph. 2010. “Age-Related Toxicity of Amyloid-Beta Associated with Increased PERK and PCREB in Primary Hippocampal Neurons: Reversal by Blueberry Extract.” The Journal of Nutritional Biochemistry 21 (10): 991–98. https://doi.org/10.1016/j.jnutbio.2009.08.005.
Buckow, Roman, Anja Kastell, Netsanet Shiferaw Terefe, and Cornelis Versteeg. 2010. “Pressure and Temperature Effects on Degradation Kinetics and Storage Stability of Total Anthocyanins in Blueberry Juice.” Journal of Agricultural and Food Chemistry 58 (18): 10076–84. https://doi.org/10.1021/jf1015347.
90
Bunea, Andrea, Dumitriţa Rugină, Zoriţa Sconţa, Raluca M. Pop, Adela Pintea, Carmen Socaciu, Flaviu Tăbăran, Charlotte Grootaert, Karin Struijs, and John VanCamp. 2013. “Anthocyanin Determination in Blueberry Extracts from Various Cultivars and Their Antiproliferative and Apoptotic Properties in B16-F10 Metastatic Murine Melanoma Cells.” Phytochemistry 95 (November): 436–44. https://doi.org/10.1016/j.phytochem.2013.06.018.
Connor, Ann Marie, James J. Luby, Cindy B. S. Tong, Chad E. Finn, and James F. Hancock. 2002. “Genotypic and Environmental Variation in Antioxidant Activity, Total Phenolic Content, and Anthocyanin Content among Blueberry Cultivars.” Journal of the American Society for Horticultural Science 127 (1): 89–97. https://doi.org/10.21273/JASHS.127.1.89.
Correa-Betanzo, J., E. Allen-Vercoe, J. McDonald, K. Schroeter, M. Corredig, and G. Paliyath. 2014. “Stability and Biological Activity of Wild Blueberry (Vaccinium Angustifolium) Polyphenols during Simulated in Vitro Gastrointestinal Digestion.” Food Chemistry 165 (December): 522–31. https://doi.org/10.1016/j.foodchem.2014.05.135.
Curtis, Peter J., Vera van der Velpen, Lindsey Berends, Amy Jennings, Martin Feelisch, A. Margot Umpleby, Mark Evans, et al. 2019. “Blueberries Improve Biomarkers of Cardiometabolic Function in Participants with Metabolic Syndrome—Results from a 6-Month, Double-Blind, Randomized Controlled Trial.” The American Journal of Clinical Nutrition 109 (6): 1535–45. https://doi.org/10.1093/ajcn/nqy380.
Dam, Rob M. van, and Edith J. M. Feskens. 2002. “Coffee Consumption and Risk of Type 2 Diabetes Mellitus.” Lancet (London, England) 360 (9344): 1477–78. https://doi.org/10.1016/S0140-6736(02)11436-X.
Damianaki, Athina, Efstathia Bakogeorgou, Marilenna Kampa, George Notas, Anastassia Hatzoglou, Simone Panagiotou, Claudia Gemetzi, Elias Kouroumalis, Pierre-Marie Martin, and Elias Castanas. 2000. “Potent Inhibitory Action of Red Wine Polyphenols on Human Breast Cancer Cells.” Journal of Cellular Biochemistry 78 (3): 429–41. https://doi.org/10.1002/1097-4644(20000901)78:3<429::AID-JCB8>3.0.CO;2-M.
Fan, Junfeng, Michelle H. Johnson, Mary Ann Lila, Gad Yousef, and Elvira Gonzalez de Mejia. 2013. “Berry and Citrus Phenolic Compounds Inhibit Dipeptidyl Peptidase IV: Implications in Diabetes Management.” Research article. Evidence-Based Complementary and Alternative Medicine. 2013. https://doi.org/10.1155/2013/479505.
Ferrars, Rachel M. de, Charles Czank, Shikha Saha, Paul W. Needs, Qingzhi Zhang, K. Saki Raheem, Nigel P. Botting, Paul A. Kroon, and Colin D. Kay. 2014. “Methods for Isolating, Identifying, and Quantifying Anthocyanin Metabolites in Clinical Samples.” Analytical Chemistry 86 (20): 10052–58. https://doi.org/10.1021/ac500565a.
Gao, L., and G. Mazza. 1994. “Quantitation and Distribution of Simple and Acylated Anthocyanins and Other Phenolics in Blueberries.” Journal of Food Science 59 (5): 1057–59. https://doi.org/10.1111/j.1365-2621.1994.tb08189.x.
Garrett, Dean A., Mark L. Failla, and Robert J. Sarama. 1999. “Development of an in Vitro Digestion Method To Assess Carotenoid Bioavailability from Meals.” Journal of Agricultural and Food Chemistry 47 (10): 4301–9. https://doi.org/10.1021/jf9903298.
Ghosh, Dilip, Tony K. McGhie, Jingli Zhang, Aselle Adaim, and Margot Skinner. 2006. “Effects of Anthocyanins and Other Phenolics of Boysenberry and Blackcurrant as Inhibitors of Oxidative Stress and Damage to Cellular DNA in SH-SY5Y and HL-60 Cells.” Journal of the Science of Food and Agriculture 86 (5): 678–86. https://doi.org/10.1002/jsfa.2409.
91
Giusti, M. Mónica, and Ronald E. Wrolstad. 2003. “Acylated Anthocyanins from Edible Sources and Their Applications in Food Systems.” Biochemical Engineering Journal, Advance in Plant Anthocyanin Research and Development, 14 (3): 217–25. https://doi.org/10.1016/S1369-703X(02)00221-8.
Grace, Mary H., Debora Esposito, Kriya L. Dunlap, and Mary Ann Lila. 2014. “Comparative Analysis of Phenolic Content and Profile, Antioxidant Capacity, and Anti-Inflammatory Bioactivity in Wild Alaskan and Commercial Vaccinium Berries.” Journal of Agricultural and Food Chemistry 62 (18): 4007–17. https://doi.org/10.1021/jf403810y.
Grace, Mary H., David M. Ribnicky, Peter Kuhn, Alexander Poulev, Sithes Logendra, Gad G. Yousef, Ilya Raskin, and Mary Ann Lila. 2009. “Hypoglycemic Activity of a Novel Anthocyanin-Rich Formulation from Lowbush Blueberry, Vaccinium Angustifolium Aiton.” Phytomedicine 16 (5): 406–15. https://doi.org/10.1016/j.phymed.2009.02.018.
Graham, J., K. Smith, K. MacKenzie, L. Jorgenson, C. Hackett, and W. Powell. 2004. “The Construction of a Genetic Linkage Map of Red Raspberry (Rubus Idaeus Subsp. Idaeus) Based on AFLPs, Genomic-SSR and EST-SSR Markers.” Theoretical and Applied Genetics 109 (4): 740–49. https://doi.org/10.1007/s00122-004-1687-8.
Howard, Luke R., John R. Clark, and Cindi Brownmiller. 2003. “Antioxidant Capacity and Phenolic Content in Blueberries as Affected by Genotype and Growing Season.” Journal of the Science of Food and Agriculture 83 (12): 1238–47. https://doi.org/10.1002/jsfa.1532.
J. Aragón, Ingrid, Hernán Ceballos, Dominique Dufour, and Mario G. Ferruzzi. 2018. “Pro-Vitamin A Carotenoids Stability and Bioaccessibility from Elite Selection of Biofortified Cassava Roots ( Manihot Esculenta , Crantz) Processed to Traditional Flours and Porridges.” Food & Function 9 (9): 4822–35. https://doi.org/10.1039/C8FO01276H.
Jiao, Xinyao, Bin Li, Qi Zhang, Ningxuan Gao, Xiuyan Zhang, and Xianjun Meng. 2018. “Effect of in Vitro-Simulated Gastrointestinal Digestion on the Stability and Antioxidant Activity of Blueberry Polyphenols and Their Cellular Antioxidant Activity towards HepG2 Cells.” International Journal of Food Science & Technology 53 (1): 61–71. https://doi.org/10.1111/ijfs.13516.
Joseph, James A., Barbara Shukitt-Hale, Natalia A. Denisova, Donna Bielinski, Antonio Martin, John J. McEwen, and Paula C. Bickford. 1999. “Reversals of Age-Related Declines in Neuronal Signal Transduction, Cognitive, and Motor Behavioral Deficits with Blueberry, Spinach, or Strawberry Dietary Supplementation.” Journal of Neuroscience 19 (18): 8114–21. https://doi.org/10.1523/JNEUROSCI.19-18-08114.1999.
Kader, F., B. Rovel, M. Girardin, and M. Metche. 1996. “Fractionation and Identification of the Phenolic Compounds of Highbush Blueberries (Vaccinium Corymbosum, L.).” Food Chemistry 55 (1): 35–40. https://doi.org/10.1016/0308-8146(95)00068-2.
Kalt, W., J. E. McDonald, and H. Donner. 2000. “Anthocyanins, Phenolics, and Antioxidant Capacity of Processed Lowbush Blueberry Products.” Journal of Food Science 65 (3): 390–93. https://doi.org/10.1111/j.1365-2621.2000.tb16013.x.
Kalt, Wilhelmina, Charles F. Forney, Antonio Martin, and Ronald L. Prior. 1999. “Antioxidant Capacity, Vitamin C, Phenolics, and Anthocyanins after Fresh Storage of Small Fruits.” Journal of Agricultural and Food Chemistry 47 (11): 4638–44. https://doi.org/10.1021/jf990266t.
92
Kalt, Wilhelmina, James A. Joseph, and Barbara Shukitt-Hale. 2007. “Blueberries and Human Health: A Review of Current Reseach.” Journal of the American Pomological Society; University Park 61 (3): 151–60.
Kalt, Wilhelmina, Daniel A. J. Ryan, Joanna C. Duy, Ronald L. Prior, Mark K. Ehlenfeldt, and S. P. Vander Kloet. 2001. “Interspecific Variation in Anthocyanins, Phenolics, and Antioxidant Capacity among Genotypes of Highbush and Lowbush Blueberries (Vaccinium Section Cyanococcus Spp.).” Journal of Agricultural and Food Chemistry 49 (10): 4761–67. https://doi.org/10.1021/jf010653e.
Kalt, Willy, and Jane E. McDonald. 1996. “Chemical Composition of Lowbush Blueberry Cultivars.” Journal of the American Society for Horticultural Science 121 (1): 142–46. https://doi.org/10.21273/JASHS.121.1.142.
Kong, Jin-Ming, Lian-Sai Chia, Ngoh-Khang Goh, Tet-Fatt Chia, and R. Brouillard. 2003. “Analysis and Biological Activities of Anthocyanins.” Phytochemistry 64 (5): 923–33. https://doi.org/10.1016/S0031-9422(03)00438-2.
Kraft, Tristan F. Burns, Barbara M. Schmidt, G. G. Yousef, Christopher T. G. Knight, Muriel Cuendet, Young-Hwa Kang, John M. Pezzuto, David S. Seigler, and Mary Ann Lila. 2005. “Chemopreventive Potential of Wild Lowbush Blueberry Fruits in Multiple Stages of Carcinogenesis.” Journal of Food Science 70 (3): S159–66. https://doi.org/10.1111/j.1365-2621.2005.tb07151.x.
Krikorian, Robert, Marcelle D. Shidler, Tiffany A. Nash, Wilhelmina Kalt, Melinda R. Vinqvist-Tymchuk, Barbara Shukitt-Hale, and James A. Joseph. 2010. “Blueberry Supplementation Improves Memory in Older Adults.” Journal of Agricultural and Food Chemistry 58 (7): 3996–4000. https://doi.org/10.1021/jf9029332.
Kruger, Johanita, John R. N. Taylor, Xiaogu Du, Fabiana F. De Moura, Bo Lönnerdal, and André Oelofse. 2013. “Effect of Phytate Reduction of Sorghum, through Genetic Modification, on Iron and Zinc Availability as Assessed by an in Vitro Dialysability Bioaccessibility Assay, Caco-2 Cell Uptake Assay, and Suckling Rat Pup Absorption Model.” Food Chemistry 141 (2): 1019–25. https://doi.org/10.1016/j.foodchem.2013.01.105.
Lipkie, Tristan E., Dattatreya Banavara, Bhavini Shah, Ardythe L. Morrow, Robert J. McMahon, Zeina E. Jouni, and Mario G. Ferruzzi. 2014. “Caco-2 Accumulation of Lutein Is Greater from Human Milk than from Infant Formula despite Similar Bioaccessibility.” Molecular Nutrition & Food Research 58 (10): 2014–22. https://doi.org/10.1002/mnfr.201400126.
Lipkie, Tristan E., Fabiana F. De Moura, Zuo-Yu Zhao, Marc C. Albertsen, Ping Che, Kimberly Glassman, and Mario G. Ferruzzi. 2013. “Bioaccessibility of Carotenoids from Transgenic Provitamin A Biofortified Sorghum.” Journal of Agricultural and Food Chemistry 61 (24): 5764–71. https://doi.org/10.1021/jf305361s.
Liu, Yixiang, Di Zhang, Yongpei Wu, Dan Wang, Ying Wei, Jiulin Wu, and Baoping Ji. 2014. “Stability and Absorption of Anthocyanins from Blueberries Subjected to a Simulated Digestion Process.” International Journal of Food Sciences & Nutrition 65 (4): 440–48.
Lucas-Gonzalez, Raquel, Sergio Navarro-Coves, José A. Pérez-Álvarez, Juana Fernández-López, Loreto A. Muñoz, and Manuel Viuda-Martos. 2016. “Assessment of Polyphenolic Profile Stability and Changes in the Antioxidant Potential of Maqui Berry (Aristotelia Chilensis (Molina) Stuntz) during in Vitro Gastrointestinal Digestion.” Industrial Crops and Products 94 (December): 774–82. https://doi.org/10.1016/j.indcrop.2016.09.057.
93
Maiz, Maria, Dennis P. Cladis, Pamela J. Lachcik, Elsa M. Janle, Mary Ann Lila, Mario G. Ferruzzi, and Connie M. Weaver. 2016. “Acute Bioavailability of (Poly)Phenolic Content of Different Varieties of Vaccinium Spp. in Ovariectomized Rats.” The FASEB Journal 30 (1_supplement): 690.20-690.20. https://doi.org/10.1096/fasebj.30.1_supplement.690.20.
Martineau, Louis C., Audrey Couture, Danielle Spoor, Ali Benhaddou-Andaloussi, Cory Harris, Bouchra Meddah, Charles Leduc, et al. 2006. “Anti-Diabetic Properties of the Canadian Lowbush Blueberry Vaccinium Angustifolium Ait.” Phytomedicine 13 (9): 612–23. https://doi.org/10.1016/j.phymed.2006.08.005.
Mazza, Giuseppe. 2018. Anthocyanins in Fruits, Vegetables, and Grains. CRC Press. https://doi.org/10.1201/9781351069700.
McDougall, G. J., S. Fyffe, P. Dobson, and D. Stewart. 2005. “Anthocyanins from Red Wine – Their Stability under Simulated Gastrointestinal Digestion.” Phytochemistry 66 (21): 2540–48. https://doi.org/10.1016/j.phytochem.2005.09.003.
McDougall, Gordon J., Patricia Dobson, Pauline Smith, Alison Blake, and Derek Stewart. 2005. “Assessing Potential Bioavailability of Raspberry Anthocyanins Using an in Vitro Digestion System.” Journal of Agricultural and Food Chemistry 53 (15): 5896–5904. https://doi.org/10.1021/jf050131p.
Miller, D. D., B. R. Schricker, R. R. Rasmussen, and D. Van Campen. 1981. “An in Vitro Method for Estimation of Iron Availability from Meals.” The American Journal of Clinical Nutrition 34 (10): 2248–56. https://doi.org/10.1093/ajcn/34.10.2248.
Moser, Sydney, Jongbin Lim, Mohammad Chegeni, JoLynne D. Wightman, Bruce R. Hamaker, and Mario G. Ferruzzi. 2016. “Concord and Niagara Grape Juice and Their Phenolics Modify Intestinal Glucose Transport in a Coupled in Vitro Digestion/Caco-2 Human Intestinal Model.” Nutrients 8 (7): 414. https://doi.org/10.3390/nu8070414.
Neilson, Andrew P., and Mario G. Ferruzzi. 2011. “Influence of Formulation and Processing on Absorption and Metabolism of Flavan-3-Ols from Tea and Cocoa.” Annual Review of Food Science and Technology 2 (1): 125–51. https://doi.org/10.1146/annurev-food-022510-133725.
Neilson, Andrew P., Judy C. George, Elsa M. Janle, Richard D. Mattes, Ralf Rudolph, Nathan V. Matusheski, and Mario G. Ferruzzi. 2009. “Influence of Chocolate Matrix Composition on Cocoa Flavan-3-Ol Bioaccessibility In Vitro and Bioavailability in Humans.” Journal of Agricultural and Food Chemistry 57 (20): 9418–26. https://doi.org/10.1021/jf902919k.
Papandreou, Magdalini A., Andriana Dimakopoulou, Zacharoula I. Linardaki, Paul Cordopatis, Dorothy Klimis-Zacas, Marigoula Margarity, and Fotini N. Lamari. 2009. “Effect of a Polyphenol-Rich Wild Blueberry Extract on Cognitive Performance of Mice, Brain Antioxidant Markers and Acetylcholinesterase Activity.” Behavioural Brain Research 198 (2): 352–58. https://doi.org/10.1016/j.bbr.2008.11.013.
Patras, Ankit, Nigel. P. Brunton, Colm O’Donnell, and B. K. Tiwari. 2010. “Effect of Thermal Processing on Anthocyanin Stability in Foods; Mechanisms and Kinetics of Degradation.” Trends in Food Science & Technology 21 (1): 3–11. https://doi.org/10.1016/j.tifs.2009.07.004.
Pérez-Vicente, Antonio, Angel Gil-Izquierdo, and Cristina García-Viguera. 2002. “In Vitro Gastrointestinal Digestion Study of Pomegranate Juice Phenolic Compounds, Anthocyanins, and Vitamin C.” Journal of Agricultural and Food Chemistry 50 (8): 2308–12. https://doi.org/10.1021/jf0113833.
94
Peters, Catrina M., Rodney J. Green, Elsa M. Janle, and Mario G. Ferruzzi. 2010. “Formulation with Ascorbic Acid and Sucrose Modulates Catechin Bioavailability from Green Tea.” Food Research International 43 (1): 95–102. https://doi.org/10.1016/j.foodres.2009.08.016.
Pixley, Kevin V., Natalia Palacios-Rojas, and Raymond P. Glahn. 2011. “The Usefulness of Iron Bioavailability as a Target Trait for Breeding Maize (Zea Mays L.) with Enhanced Nutritional Value.” Field Crops Research 123 (2): 153–60. https://doi.org/10.1016/j.fcr.2011.05.011.
Prior, Ronald L., Samuel E. Wilkes, Theodore R. Rogers, Ramesh C. Khanal, Xianli Wu, and Luke R. Howard. 2010. “Purified Blueberry Anthocyanins and Blueberry Juice Alter Development of Obesity in Mice Fed an Obesogenic High-Fat Diet.” Journal of Agricultural and Food Chemistry 58 (7): 3970–76. https://doi.org/10.1021/jf902852d.
Prodorutti, Daniele, bullet, Ilaria Pertot, Lara bullet, Giongo, Cesare bullet, and Gessler. 2007. “Highbush Blueberry: Cultivation, Protection, Breeding and Biotechnology.” The European Journal of Plant Science and Biotechnology 1 (January).
Reboul, Emmanuelle, Myriam Richelle, Eloïse Perrot, Christiane Desmoulins-Malezet, Victor Pirisi, and Patrick Borel. 2006. “Bioaccessibility of Carotenoids and Vitamin E from Their Main Dietary Sources.” Journal of Agricultural and Food Chemistry 54 (23): 8749–55. https://doi.org/10.1021/jf061818s.
Reque, Priscilla M., Rosana S. Steffens, André Jablonski, Simone H. Flôres, Alessandro de O. Rios, and Erna V. de Jong. 2014. “Cold Storage of Blueberry (Vaccinium Spp.) Fruits and Juice: Anthocyanin Stability and Antioxidant Activity.” Journal of Food Composition and Analysis 33 (1): 111–16. https://doi.org/10.1016/j.jfca.2013.11.007.
Retamales, Jorge B., and James F. Hancock. 2018. Blueberries, 2nd Edition. CABI. Rubinskiene, M., P. Viskelis, I. Jasutiene, R. Viskeliene, and C. Bobinas. 2005. “Impact of
Various Factors on the Composition and Stability of Black Currant Anthocyanins.” Food Research International, Third International Congress on Pigments in Food, 38 (8): 867–71. https://doi.org/10.1016/j.foodres.2005.02.027.
Scalzo, Jessica, Alessia Politi, Nicoletta Pellegrini, Bruno Mezzetti, and Maurizio Battino. 2005. “Plant Genotype Affects Total Antioxidant Capacity and Phenolic Contents in Fruit.” Nutrition 21 (2): 207–13. https://doi.org/10.1016/j.nut.2004.03.025.
Sellappan, Subramani, Casimir C. Akoh, and Gerard Krewer. 2002. “Phenolic Compounds and Antioxidant Capacity of Georgia-Grown Blueberries and Blackberries.” Journal of Agricultural and Food Chemistry 50 (8): 2432–38. https://doi.org/10.1021/jf011097r.
Šimić, Domagoj, Rezica Sudar, Tatjana Ledenčan, Antun Jambrović, Zvonimir Zdunić, Ivan Brkić, and Vlado Kovačević. 2009. “Genetic Variation of Bioavailable Iron and Zinc in Grain of a Maize Population.” Journal of Cereal Science, Special Section: Enzymes in Grain Processing, 50 (3): 392–97. https://doi.org/10.1016/j.jcs.2009.06.014.
Smith, M. a. L., K. A. Marley, D. Seigler, K. W. Singletary, and B. Meline. 2000. “Bioactive Properties of Wild Blueberry Fruits.” Journal of Food Science 65 (2): 352–56. https://doi.org/10.1111/j.1365-2621.2000.tb16006.x.
Song, Brian J., Teryn N. Sapper, Claire E. Burtch, Karen Brimmer, Mark Goldschmidt, and Mario G. Ferruzzi. 2013. “Photo- and Thermodegradation of Anthocyanins from Grape and Purple Sweet Potato in Model Beverage Systems.” Journal of Agricultural and Food Chemistry 61 (6): 1364–72. https://doi.org/10.1021/jf3044007.
95
Stevenson, David, and Jessica Scalzo. 2012. “Anthocyanin Composition and Content of Blueberries from around the World.” Journal of Berry Research 2 (4): 179–89. https://doi.org/10.3233/JBR-2012-038.
Stintzing, Florian C., Angela S. Stintzing, Reinhold Carle, Balz Frei, and Ronald E. Wrolstad. 2002. “Color and Antioxidant Properties of Cyanidin-Based Anthocyanin Pigments.” Journal of Agricultural and Food Chemistry 50 (21): 6172–81. https://doi.org/10.1021/jf0204811.
Stull, April J., Katherine C. Cash, William D. Johnson, Catherine M. Champagne, and William T. Cefalu. 2010. “Bioactives in Blueberries Improve Insulin Sensitivity in Obese, Insulin-Resistant Men and Women.” The Journal of Nutrition 140 (10): 1764–68. https://doi.org/10.3945/jn.110.125336.
Tagliazucchi, Davide, Elena Verzelloni, Davide Bertolini, and Angela Conte. 2010. “In Vitro Bio-Accessibility and Antioxidant Activity of Grape Polyphenols.” Food Chemistry 120 (2): 599–606. https://doi.org/10.1016/j.foodchem.2009.10.030.
Tavares, Lucélia, Inês Figueira, Diana Macedo, Gordon J. McDougall, Maria Cristina Leitão, Helena L. A. Vieira, Derek Stewart, Paula M. Alves, Ricardo B. Ferreira, and Cláudia N. Santos. 2012. “Neuroprotective Effect of Blackberry (Rubus Sp.) Polyphenols Is Potentiated after Simulated Gastrointestinal Digestion.” Food Chemistry 131 (4): 1443–52. https://doi.org/10.1016/j.foodchem.2011.10.025.
Triebel, Sven, Hai-Linh Trieu, and Elke Richling. 2012. “Modulation of Inflammatory Gene Expression by a Bilberry (Vaccinium Myrtillus L.) Extract and Single Anthocyanins Considering Their Limited Stability under Cell Culture Conditions.” Journal of Agricultural and Food Chemistry 60 (36): 8902–10. https://doi.org/10.1021/jf3028842.
U.S. Department of Health and Human Services and U.S. Department of Agriculture. 2015 – 2020 Dietary Guidelines for Americans. 8th Edition. December 2015.
Vuong, T., A. Benhaddou-Andaloussi, A. Brault, D. Harbilas, L. C. Martineau, D. Vallerand, C. Ramassamy, C. Matar, and P. S. Haddad. 2009. “Antiobesity and Antidiabetic Effects of Biotransformed Blueberry Juice in KKA y Mice.” International Journal of Obesity 33 (10): 1166–73. https://doi.org/10.1038/ijo.2009.149.
Wu, Xianli, Hoy E. Pittman, Steve Mckay, and Ronald L. Prior. 2005. “Aglycones and Sugar Moieties Alter Anthocyanin Absorption and Metabolism after Berry Consumption in Weanling Pigs.” The Journal of Nutrition 135 (10): 2417–24. https://doi.org/10.1093/jn/135.10.2417.
Yi, Weiguang, Joan Fischer, Gerard Krewer, and Casimir C. Akoh. 2005. “Phenolic Compounds from Blueberries Can Inhibit Colon Cancer Cell Proliferation and Induce Apoptosis.” Journal of Agricultural and Food Chemistry 53 (18): 7320–29. https://doi.org/10.1021/jf051333o.
Yousef, Gad G., Allan F. Brown, Yayoi Funakoshi, Flaubert Mbeunkui, Mary H. Grace, James R. Ballington, Ann Loraine, and Mary A. Lila. 2013. “Efficient Quantification of the Health-Relevant Anthocyanin and Phenolic Acid Profiles in Commercial Cultivars and Breeding Selections of Blueberries (Vaccinium Spp.).” Journal of Agricultural and Food Chemistry 61 (20): 4806–15. https://doi.org/10.1021/jf400823s.
Zheng, Wei, and Shiow Y. Wang. 2003. “Oxygen Radical Absorbing Capacity of Phenolics in Blueberries, Cranberries, Chokeberries, and Lingonberries.” Journal of Agricultural and Food Chemistry 51 (2): 502–9. https://doi.org/10.1021/jf020728u.
96
CHAPTER 3. CONCLUSIONS AND FUTURE CONSIDERATIONS
The consumption of fruits and vegetables is based upon the wide array of evidence
promoting the role of these nutrient and phytochemical dense foods (i.e. carotenoids and
polyphenols) in satisfying nutritional requirements and in the prevention of select chronic diseases.
However, intake of fruits and vegetables by the average American remains significantly below the
recommended amounts. Novel strategies are needed to address the gap in delivery of fruit and
vegetable benefits to consumers. Given that the associated health impacts from fruits and
vegetables are ultimately dependent on their phytochemical density and their absorption and
metabolism (bioavailability), it has been suggested that advances in breeding programs can be
leveraged to provide fruits and vegetables with higher levels of these nutrients and phytochemicals.
However, factors driving bioavailability of these compounds is equally as critical to consider in
breeding for more effective fruits and vegetables. Critical to this goal is the development and
implementation of novel phenotyping methods for functional traits including bioavailability that
can in fact be combined with other “omic” technics techniques in a manner consistent with
enhancement of existing breeding programs.
While existing breeding programs seeking to enhance our understanding of factors
impacting nutrient and phytochemical profiles and content in fruits and vegetables, little is known
regarding specific traits that are associated with bioavailability of target nutrients/phytochemicals.
To date, it is known that nutrient and phytochemical bioavailability are best evaluated by in vivo
models, including human clinal trials and animal studies. However, given the high cost, extensive
time required, associated ethical considerations, and bottleneck for high throughput analysis, in
vitro models of the gastrointestinal tract have proven valuable in the estimating the availability of
nutrients and phytochemical for absorption, known as bioaccessibility, a precursor and predictor
97
of bioavailability. These models have demonstrated some practical applicability to screening of
limited numbers of genotypes (J. Aragón et al. 2018). While promising, the implementation of
current digestion models to screening of large germplasm collections and thereby enhancing the
value of the “bioaccessibility phenotype” remains challenged by throughput constraints, due their
dependence on manual processing and need for larger tissue samples/digestion volumes.
As a primary outcome of this thesis and associated work we aimed to adapt a current 3
stage in vitro digestion model used extensively in determination of food matrix factors impacting
nutrient and phytochemical bioaccessibility from fruits and vegetables through semi-automation
and sample reduction in the development of a new model suitable for higher throughput but
without loss of predictive power. This required extensive consideration of the advantages and
logistics of the existing model and consideration of the limitations, and potential for modification
to allow for semi-automation an existing static three compartment in vitro gastrointestinal
digestion model for high throughput (HT) phenotyping of the bioaccessibility of blueberry
polyphenols. Following validation of the HT model against the standard in vitro digestion models
(ST), the HT model was then applied to a subset of 33 individual blueberry genotypes from a
mapping population currently used in polyphenolic research.
As described in Chapter 1 and 2, blueberries were selected as our target fruit based on their
diverse array and relatively high concentration of polyphenols and wide variety of associated
health benefits. Additionally, there are diverse public germplasm available as the US is the largest
producer and processors of the fruit, therefore are broadly available. Utilizing previously frozen
blueberries that underwent further processing, we were able to successfully adapt an existing in
vitro digestion model adapted for polyphenol analysis, previously described 3 stage in vitro
digestion model by Moser et al. (2016) (Moser et al. 2016). Specific modifications were applied
98
to make the model compatible with semi-automation and the limited tissue samples typical of
germplasm collections. Initially, we established that scaling the protocol to lower digestion
volumes was necessary to enable high throughput analysis. This meant reducing the overall
volume from a total of 50 mL to 15 mL. By doing this, we further proportionally decreased the
amount of blueberry starting material to be digested as well as volume of enzymes and saline
solutions by a factor of 3.3x. Additionally, we adjusted enzyme concentrations to better apply to
digestion of blueberries. A small but key adaptation in this case was the added step of enzyme
solution clarification. Enzyme solutions required clarification by centrifugation in order not to
clog the fine-tipped syringes of the Tecan. To further enhance efficiency of the HT model, we
programmed a liquid-handling robot (Tecan Evo 150) to distribute all liquid solutions (enzyme
solutions, 0.9% saline, pH altering solutions (HCl and NaHCO3) throughout the digestion. This
semi-automation improved overall precision and allowed for streamlining of the process compared
to manual digestions.
Comparison of the LT model to the adapted HT model showed significant differences in a
majority of polyphenolic subclasses and individual compounds in both relative and absolute
bioaccessibility. However, while statistically significant, these differences were mostly modest.
Higher bioaccessibility values were consistent amongst blueberries applied to the HT model
relative to the LT model. While the reason for this is unclear, we propose that the differing levels
may be attributed the smaller surface area of the 15 mL digestion test tubes as opposed to the 50
mL test tubes, more thorough mixing of the Tecan digestions by means of higher oscillation speeds
and more compact rack placement within the incubator. A second explanation could be the higher
stability of the phenolics in the lower volumes. Despite a lack of headspace and flushing with N2
in both systems, the potential for higher levels of dissolved oxygen in the 50 mL digestions could
99
be responsible, in part, for the outcomes observed. Despite these differences, the two models were
found to be highly correlated in both relative and absolute bioaccessibility across all compound
classes. While future work must consider validation by in vivo models to truly ensure the predictive
nature of this model, our findings provided us the validation needed to move forward with applying
the HT model to a subset of 33 individual blueberry genotypes from a mapping population in hopes
of detecting variability in the bioaccessibility as a trait.
The DxJ mapping population was selected for our initial application because of their
established diversity in anthocyanin profiles (Hancock et al. 2018). Consistent with these previous
reports, the DxJ blueberries on average were found be largely composed of anthocyanins, followed
by phenolic acids, flavonols, and insignificant amounts of flavan-3-ols. Initial analysis of the
polyphenol profile and content of the 33 genotypes making up the DxJ subset showed significant
variation amongst all targeted polyphenolic classes. This was in agreement with previously
published literature where large variations in polyphenols as a result of different genotypes (Kalt
et al. 2001; Yousef et al. 2013). Similar variation was noted in terms of both relative and absolute
bioaccessibility. Flavonols were observed to consistently have the highest relative bioaccessibility,
while the greatest average bioaccessible content was similarly noted within flavonols. When
analyzing potential correlation between raw material content and bioaccessible content, it was
concluded that few samples were determined to be correlated, thus confirming the importance of
absorption (bioavailability) studies as the berries with the highest phenolic content were not always
the most bioaccessible.
In conclusion the HT in vitro gastrointestinal digestion model adapted in the current work
was determined to be novel tool for phenotyping phenolic bioaccessibility in blueberry fruit. This
further establishes the need for continued screening of diverse blueberry germplasms and other
100
plant materials in combination with genomic approaches. This work is currently underway by our
group with multi-year phenotyping to be completed by 2020 and subsequent alignment of this
phenotypic data set with other “omic” datasets (genomic and metabolomic) expected to yield
valuable insights in the genetic control of both polyphenol levels and their bioaccessibility.
Overall, this will allow for greater understanding and investigation of specific genetic factors that
influence polyphenolic density and bioavailability. The information gained from such advanced
phenotyping and genetic techniques will ultimately allow for breeding of fruits and vegetables
with higher nutritive content and bioavailability.
101
3.1. REFERENCES
Hancock, James F., James W. Olmstead, Rachel A. Itle, Peter W. Callow, Stuart Neils-Kraft,
Edmund J. Wheeler, Jozer Mangandi, et al. 2018. “Performance of an Elite, Hybrid Family of a Northern × Southern Highbush Cross (‘Draper’ × ‘Jewel’).” Euphytica 214 (6): 95. https://doi.org/10.1007/s10681-018-2173-8.
J. Aragón, Ingrid, Hernán Ceballos, Dominique Dufour, and Mario G. Ferruzzi. 2018. “Pro-Vitamin A Carotenoids Stability and Bioaccessibility from Elite Selection of Biofortified Cassava Roots ( Manihot Esculenta , Crantz) Processed to Traditional Flours and Porridges.” Food & Function 9 (9): 4822–35. https://doi.org/10.1039/C8FO01276H.
Kalt, Wilhelmina, Daniel A. J. Ryan, Joanna C. Duy, Ronald L. Prior, Mark K. Ehlenfeldt, and S. P. Vander Kloet. 2001. “Interspecific Variation in Anthocyanins, Phenolics, and Antioxidant Capacity among Genotypes of Highbush and Lowbush Blueberries (Vaccinium Section Cyanococcus Spp.).” Journal of Agricultural and Food Chemistry 49 (10): 4761–67. https://doi.org/10.1021/jf010653e.
Moser, Sydney, Jongbin Lim, Mohammad Chegeni, JoLynne D. Wightman, Bruce R. Hamaker, and Mario G. Ferruzzi. 2016. “Concord and Niagara Grape Juice and Their Phenolics Modify Intestinal Glucose Transport in a Coupled in Vitro Digestion/Caco-2 Human Intestinal Model.” Nutrients 8 (7): 414. https://doi.org/10.3390/nu8070414.
Yousef, Gad G., Allan F. Brown, Yayoi Funakoshi, Flaubert Mbeunkui, Mary H. Grace, James R. Ballington, Ann Loraine, and Mary A. Lila. 2013. “Efficient Quantification of the Health-Relevant Anthocyanin and Phenolic Acid Profiles in Commercial Cultivars and Breeding Selections of Blueberries (Vaccinium Spp.).” Journal of Agricultural and Food Chemistry 61 (20): 4806–15. https://doi.org/10.1021/jf400823s.

102
APPENDICES
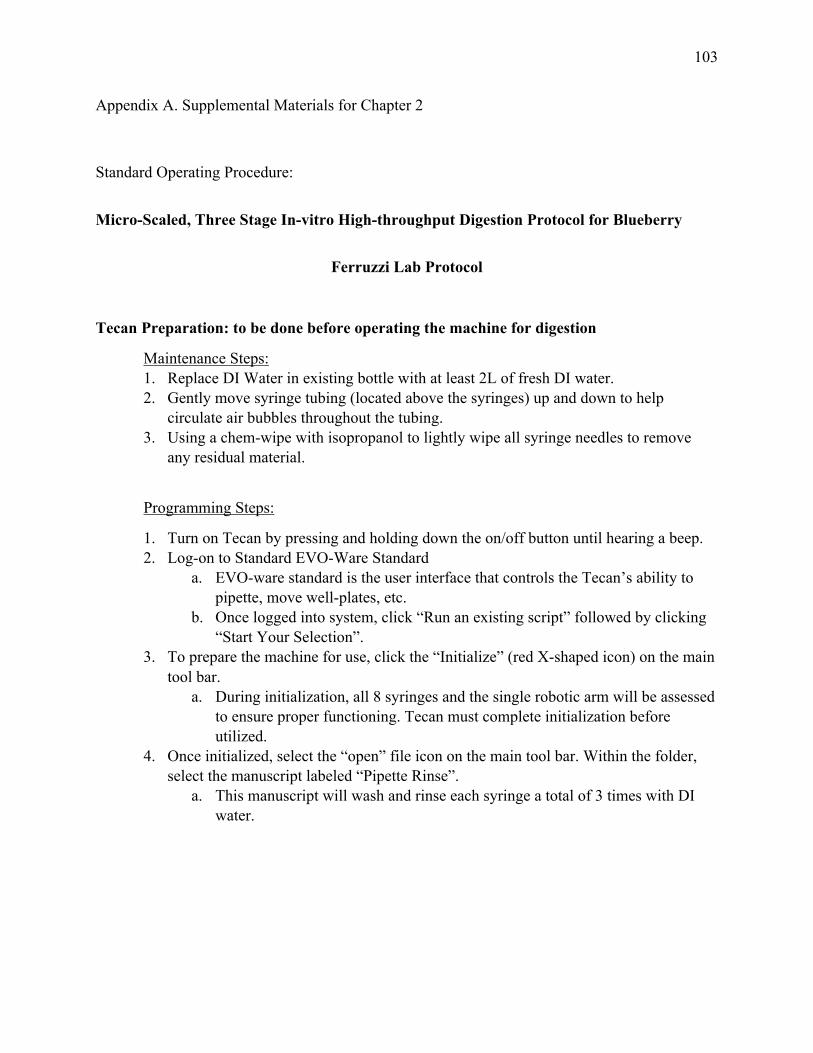
103
Appendix A. Supplemental Materials for Chapter 2
Standard Operating Procedure:
Micro-Scaled, Three Stage In-vitro High-throughput Digestion Protocol for Blueberry
Ferruzzi Lab Protocol
Tecan Preparation: to be done before operating the machine for digestion
Maintenance Steps: 1. Replace DI Water in existing bottle with at least 2L of fresh DI water. 2. Gently move syringe tubing (located above the syringes) up and down to help
circulate air bubbles throughout the tubing. 3. Using a chem-wipe with isopropanol to lightly wipe all syringe needles to remove
any residual material.
Programming Steps:
1. Turn on Tecan by pressing and holding down the on/off button until hearing a beep. 2. Log-on to Standard EVO-Ware Standard
a. EVO-ware standard is the user interface that controls the Tecan’s ability to pipette, move well-plates, etc.
b. Once logged into system, click “Run an existing script” followed by clicking “Start Your Selection”.
3. To prepare the machine for use, click the “Initialize” (red X-shaped icon) on the main tool bar.
a. During initialization, all 8 syringes and the single robotic arm will be assessed to ensure proper functioning. Tecan must complete initialization before utilized.
4. Once initialized, select the “open” file icon on the main tool bar. Within the folder, select the manuscript labeled “Pipette Rinse”.
a. This manuscript will wash and rinse each syringe a total of 3 times with DI water.
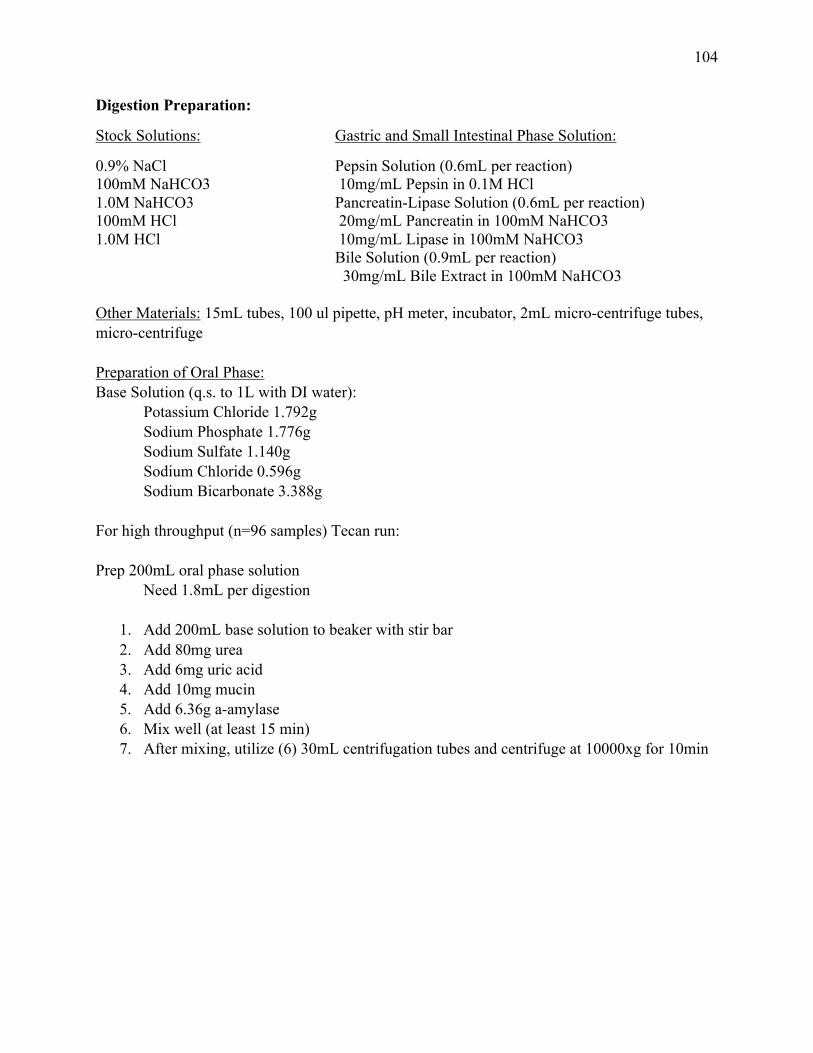
104
Digestion Preparation:
Stock Solutions: Gastric and Small Intestinal Phase Solution:
0.9% NaCl Pepsin Solution (0.6mL per reaction) 100mM NaHCO3 10mg/mL Pepsin in 0.1M HCl 1.0M NaHCO3 Pancreatin-Lipase Solution (0.6mL per reaction) 100mM HCl 20mg/mL Pancreatin in 100mM NaHCO3 1.0M HCl 10mg/mL Lipase in 100mM NaHCO3 Bile Solution (0.9mL per reaction) 30mg/mL Bile Extract in 100mM NaHCO3 Other Materials: 15mL tubes, 100 ul pipette, pH meter, incubator, 2mL micro-centrifuge tubes, micro-centrifuge Preparation of Oral Phase: Base Solution (q.s. to 1L with DI water): Potassium Chloride 1.792g Sodium Phosphate 1.776g Sodium Sulfate 1.140g Sodium Chloride 0.596g Sodium Bicarbonate 3.388g For high throughput (n=96 samples) Tecan run: Prep 200mL oral phase solution Need 1.8mL per digestion
1. Add 200mL base solution to beaker with stir bar 2. Add 80mg urea 3. Add 6mg uric acid 4. Add 10mg mucin 5. Add 6.36g a-amylase 6. Mix well (at least 15 min) 7. After mixing, utilize (6) 30mL centrifugation tubes and centrifuge at 10000xg for 10min
105
Start Up
1. Weigh out 1.0g of blended berry to be digested into 15mL tubes 2. Insert tubes into Tecan tube racks (n=16 tubes per rack) 3. Slide racks into appropriate columns within Tecan. 4. Pour oral phase (post-centrifugation) into labeled plastic Tecan troughs
a. Place into appropriate well location, as indicated on Tecan Worktable visual Oral Phase
1. Select “Open” file icon on the main tool bar. Within the folder, select the manuscript labeled “HLB_OralPhasePICollection”. Select “Run” (green triangle icon) on the main tool bar.
a. 1.8 mL of oral phase will be aspirated and dispensed into sample tubes according to location
2. Remove Tecan racks and begin capping samples. Once capped, vortex for 10 seconds and carry all racks to incubation. Insert into Lego rack holders within incubator.
a. Let samples incubate at 37 degrees Celsius at 150 opm for 10 minutes. 3. Meanwhile, prepare pepsin solution and calibrate pH meter.
Gastric Phase
1. Remove all sample racks from incubation and uncap all samples. Slide back into appropriate columns within Tecan.
2. Pour saline and pepsin solution into individual labeled troughs. a. Place into well location.
3. Select “Open” file icon on the main tool bar. Within the folder, select the manuscript labeled “HLB_GastricPhasePICollection”. Select “Run”.
a. 6.2 mL of saline will be aspirated and dispensed into sample tubes, bringing volume to 9 mL.
b. 0.6 mL of pepsin will be aspirated and dispensed into sample tubes 4. Remove samples from Tecan and begin to cap. Once capped, invert each rack 3 times
to mix and place immediately on ice. 5. Adjust pH to equal 2.5 +/- 0.1 1M using 1.0 M HCl.
a. Adjust 1 sample out of each Tecan rack (column). Average adjustment volumes should be applied to the remaining samples. Refer to step 6 to implement specific acid and calculated Saline volume on Tecan. Saline addition should bring volume to 12mL.
6. Select “Open” file icon on the main tool bar. Within the folder, select the manuscript labeled “HLB_HClAdjust_SalineAdd_PICollcetion”.
a. To edit adjustment volume, right click the “aspirate” command within the established script labeled “HCl”. Type in the selected HCl volume, click “Ok”. Similarly, right click the “dispense” command within the established script labeled “HCl”. Adjust the volume to reflect the aspiration volume, click “Ok”.
b. Repeat with Saline.

106
7. Uncap samples and place back in appropriate racks. Slide into Tecan columns. 8. Select “Run” to initiate adjustments.
a. HCl will be aspirated and dispensed, followed by saline aspiration and dispensing.
9. Remove Tecan racks and begin capping samples. Once capped, invert each rack 3 times to mix and carry all racks to incubation. Insert into rack holders within incubator.
a. Let samples incubate at 37 degrees Celsius at 150 opm for 1 hour. 10. Meanwhile, prepare bile extract. 30 minutes into incubation, prepare pancreatin-lipase
solution and let stir for 12 minutes. a. Post-stirring, utilize 30mL centrifugation tubes and centrifuge at 10000xg for
10min Intestinal Phase
1. Pour bile and pancreatin-lipase solutions into labeled plastic Tecan troughs a. Place into appropriate well location, as indicated on Tecan Worktable
visual 2. Select “Open” file icon on the main tool bar. Within the folder, select the
manuscript labeled “HLB_IntestinalPhasePICollcetion”. Select “Run”. a. 0.6 mL of (centrifuged) pancreatin-lipase solution will be aspirated and
dispensed into sample tubes b. 0.9 mL of bile will be aspirated and dispensed into sample tubes
3. Remove samples from Tecan and begin to cap. Invert each rack 3 times to mix. Place immediately on ice.
4. Adjust pH to equal 6.5 +/- 0.1 1M using 1.0 M NaHCO3. Adjust 1 sample out of each Tecan rack (column). Average adjustment volumes should be applied to the remaining samples. Refer to step 6 of “Gastric Phase” to implement specific base addition and calculated Saline volume on Tecan. Saline addition should bring volume to a final total of 15mL.
5. Remove Tecan racks and begin capping samples. Once capped, invert each rack 3 times to mix and carry all racks to incubation. Insert into rack holders within incubator.
a. Let samples incubate at 37 degrees Celsius at 150 opm for 2 hours. Separation of Aqueous Fraction
1. Remove from incubation and uncap all samples. Slide back into appropriate
columns within Tecan. 2. Place two 2mL 96-well microcentrifuge plates onto appropriate rack within
Tecan. 3. Select “Open” file icon on the main tool bar. Within the folder, select the
manuscript labeled “HLB_PreCentifugationPICollection”. Select “Run”.
107
a. 3mL of each sample will be aspirated and 1.5 mL will be dispensed into each 2 mL 96-well microcentrifuge plate for centrifugation.
b. Cap both 96-well plates and centrifuge at 4100 RPM for 1 hour. 4. Following centrifugation, syringe filter aqueous fraction into two new 2mL 96-
well microcentrifuge plates through 0.45 mm filters.
Copyright © 2022 FDOKUMEN