about us - St. Francis Institute Of Management And Research
127
-
Upload
khangminh22 -
Category
Documents
-
view
1 -
download
0
Transcript of about us - St. Francis Institute Of Management And Research


ABOUT US
The Congregation of Franciscan Brothers was established in Mumbai in 1908, and now has branches in over
84 centres in India and 22 centres abroad in various Asian, European, American and African countries. The
Congregation‘s main purpose is to render service to all strata of humanity especially the vulnerable sections
of the society in order to empower them, help them, attain integral development and to live a free, dignified
and truthful life.
St. Francis Institute of Management & Research (SFIMAR) was established in 2002 by ―The Society of the
Congregation of Franciscan Brothers‖; to impart quality education in the field of Business Management
(MMS/PGDM/MMM/MFM). It is recognized by AICTE, New Delhi and has been granted permanent
affiliation by the University of Mumbai. It is also recognized under Section 2 (f) & 12 (B) of UGC Act 1956.
SFIMAR is an ISO 9001:2015 Certified Institute and received Grade 'A' from the National Assessment and
Accreditation Council (NAAC) in 2016. It has won several accolades at National level such as 'Most
Upcoming B-School' Award 2015 from ASSOCHAM, 'Best Educational Quality Enhancement Team'
Award 2014 from National Centre for Quality Management. It has also earned recognition from the
University of Mumbai's Department of Lifelong Learning and Extension for being the best participating B-
School in Extension and Community Development Projects. SFIMAR is proud to be a part of the St. Francis
Group of Institutions which is run by the Congregation of Franciscan Missionary Brothers having a 118-year
old legacy of 'Service through Enterprise'.
At SFIMAR, we have leveraged the benefits of technology by building up an enviable storehouse of
knowledge for our students through our on-going investments in pedagogical resources, a well-developed

library as well as in IT solutions that speed up our student services and help us implement useful feedback
from all the stakeholders. Our students are aware of current issues and industry trends and have acquired
advanced skills by participating in knowledge and skill enhancement programmes such as ‗Thought Leader‘
and ‗Lead by Example‘. Students develop their leadership skills, improve their concentration, creative
thinking and innovation and the ability to lead and mentor others. These are conducted through various
Clubs such as Nirmiti (Marketing), Finatics (Finance), Prerna (Entrepreneurship), Institute Social
Responsibility (ISR), Green- Environment, Mindfulness Training and Personality Development programmes.
Our well-qualified and experienced faculty are supported by competent and dedicated programme
coordinators and staff, who ensure that programme delivery adheres to the Institute's strict quality, security
and business continuity standards.
We focus on applied research and vital topics such as corporate social responsibility and governance,
financial inclusion, investment strategy and asset allocation with forward-looking indicators, digital
marketing and so on. SFIMAR facilitates industry (management)-academia (student) interaction through its
Eminent Speaker Series, Management Development Programmes, Regular Guest Lectures, Summer
Xcellence and Prakalpa (project competitions), Alumni Connect etc. We run a number of certification
programmes for our students to make them job-ready.
We also promote interaction between academic institutions through our Visiting Faculty Programme and the
Annual Research Conference 'Pathh' and 'Anveshi'. We have recently set up an Entrepreneurship and
Business Incubation Zone (SFIMARebiz) to encourage self-employment and empower entrepreneurs to
chart successful business ventures, by providing training, networking and cost-efficient solutions for setting
up their businesses.
We have a consistent track record of 100% placement. We have started Corporate On-boarding Programme
very successfully in which recruiters invest valuable resources in familiarizing our students with their
organizational values, goals, roles, norms, and overall work environment. They also provide them job-
specific training so that they have the necessary skills to get absorbed into their mainstream roles easily and
become effective organizational members. This Corporate On-Boarding is a win-win programme for all, as
it leads to positive outcomes for new employees, such as higher job satisfaction, better job performance ,
greater organizational commitment, reduction in occupational stress and intent to quit.
It's our constant endeavour at SFIMAR to bring up our students holistically with high moral values, ethical
standards and an inclination towards societal good. Concepts such as compassion and stewardship are
ingrained among our students so that they can adopt ethical business practices and build sustainable
businesses. The Franciscan values continue to be a guiding beacon leading SFIMAR to higher standards in
teaching, research and community service.

ABOUT THE FOUNDER
St. Francis Group of Institutions are run by the Franciscan Missionary Brothers, an International
Congregation headquartered at Borivali (West), Mumbai.
Rev. Brother Paulus Moritz of Germany started the Congregation of the Franciscan Brothers in the year
1901 with the vision of reaching out to the poor and the less privileged.
St. Francis Group of Institutions in Mumbai is a chain of Catholic Minority Educational Institutions located
in the western suburb of India's Financial Capital Mumbai. St. Francis Group of Institutions have today
become a pride of Mumbai and India's most sought academic community for its focus on excellence in value
based education and beneficial and educative extracurricular activities.
Today, after 118 years of its inception the Franciscan Brothers continue their commitment of training young
minds and finding solutions to address tomorrow's challenges.

Vision
To flourish as a seat of learning of international standards for
developing an entrepreneurial class of value-based industrial
leaders empowered with techno-managerial competence to
sustain innovation for building global business of the future.
Mission
To enter the realm of globally successful B-schools by
imparting value-based education for creating responsible and
thoughtful citizens who would lead the word by example and
excel through innovation, an entrepreneurial spirit and a
humanitarian attitude.

FOREWORD
SFIMAR‘s students research and project publication ‘Spandan’ which
contains a series of select research work chosen over 200 projects
conducted by our students in various fields of management during
their summer internships
These summer internships offer students a platform to work closely
with professionals and to develop knowledge, competencies, and
experience related directly to their career goals. The efforts taken by
the students, their work supervisors from the organizations and the
expert faculty guides from SFIMAR for taking it as a challenging task.
It has been our constant endeavor to maintain a strong relationship with
industry which has helped our students to find suitable internships of
their choice. We remain grateful to the organizations for their unfailing support in this regard.
Developing conceptual skills, Technical skills and Leadership skills is the objectives of Management
education. Research, creativity and innovation are key elements of any higher education curricula and
students need to develop these aspects, apply them in real-life situations so that they can adapt to the fast-
changing nature of businesses and become successful managers or entrepreneurs in future. This Journal is an
integral part of a broader research and project-based study agenda pursued at SFIMAR
Publishing a journal of this nature requires a lot of enthusiasm and strong involvement of various
stakeholders. I thank all the student contributors, the Editorial Board, Student Editorial team, faculty
reviewers, staff and SFIMAR's library team for their commitment, patience and timely revisions, which led
to the successful creation of this Issue. We are thankful to the organizations that provided SFIMAR the
opportunity to partner with them on these assignments, and above all also appreciate our alumni who
act as a constant catalyst in bringing out the best in our students.
The variety of subjects and diversity of ideas showcased in this Journal set the stage for subsequent Issues,
where we hope to attract articles with more theoretical, experimental and analytical content. I am confident
that our Institute‘s strong focus on research will help our students to build on these efforts and maintain this
impressive trajectory over coming years.

I trust that this year's volume of Spandan serves as a platform that brings industry and academia, inquiring
minds and new ideas together to bring innovative practices in the industry in particular and also contribute
to the well being of the society at large.
Dr.D. Henry
Director

EDITORIAL
Spandan is a student's research journal @ SFIMAR. Over the years, it has provided platform to students to
get recognition for their quality research work. SFIMAR has always put great emphasis on qualitative and
quantitative research in various areas of management. Students with the help of faculty members have
constantly tried to improve the standard of research work.
Spandan is completely managed by student‘s right from the process of data collection to publishing and
disseminating the copies. The editorial team works efficiently in the areas of content management and
literature of the journal.
We are delighted to witness Spandan 2020 take its ultimate shape of distinctiveness. We express our
gratitude to the members of the editorial board for their continuous involvement in the publication of the
journal. We are grateful to the management for their unstinted assistance and support. We acknowledge the
contributions of SFIMAR faculty members and the corporate guides that have aided the students towards the
successful completion of their research projects.
Spandan 2020 Editorial Team

EDITORIAL
Prof. (Dr.) Simeon S Simon.
Associate Professor
Dept.: Marketing
Qualification: MBA, PhD
(E-mail: [email protected])
Prof. Shilpa Peswani
Assistant Professor
Dept.: Finance
Qualification: FCMA, MCom
(Banking and Finance),
PGDFM, MAH-SET (Commerce)
E-mail: [email protected]
Prof. (Dr.) Dipaali
Pulekar
Associate Professor
Dept.: Human Resources
Qualification: Ph.D
(Management),
MHRDM, DBM
E-mail: [email protected]
Prof. Kiran Rodrigues
Assistant Professor
Dept.: Finance
Qualification: B.Com, MMS
(Finance), UGC-NET
E-mail: [email protected]
Prof. Pushkar Dilip Parulekar
Assistant Professor
Dept.: Finance
Qualification: B.E. (EXTC), MMS
(Finance), UGC- NET
(Management)
E-mail: [email protected]

STUDENT COORDINATORS
Mr. Henson Martis Mr. Lords Dias
MMS I - Operations MMS I - Operations
Ms. Isha Gandhi Mr. Shivam Gite Ms. Shreya Poojary
MMS I - Finance MMS I- Marketing MMS I - H.R
INDEX
Sr no.
Table of contents
1 Equity research on Bajaj Finance
- Mr. Movil Joyson Mathias (MMS II – Finance )
2 Analysis of Indian Cement Industry with special reference to Heidelberg
Cement India Ltd.
– Mr. Sanmay Dinesh Tribhuvan (MMS II – Finance )
3 A case study on L&T Mindtree hostile takeover
- Ms.Mayuri Gawad (MFM IIIrd year – Finance )
4 A report on Generation X & Generation Y’s attitude towards social media a
solution development
– Mr. Zenior Ricky Borges (PGDM II – Marketing )
5 Market penetration strategies for Arihant Industries for the most favourable
western European country
– Ms. Sayali Dnyandev Sawant ( MMS II – Marketing )
6 Negative influencing factors affecting customer buying behaviour in regards to
real estate / property in the western suburbs of Mumbai (Bandra to Dahisar)
– Mr. Dinto Antony Chungath ( MMM IIIrd year – Marketing )
7 A study on employees perspective about engagement practices and measuring
engagement level at Unitile India
– Ms. Danica Ernestine Lobo ( PGDM II – HR )
8 A study on recruitment life cycle and lead time analysis at prompt personnel
consultancy services
- Ms. Shweta Sharad Chaugle ( MMS II – HR )
9 Evaluation of digital radiography for quality improvement in QC Dept. at
Mazagon Dock Ltd. ( MDL )
– Mr. Siddesh SugandhTawde ( MMS II – Operations )
10 A project report on time and motion study, capacity utilization and terminal
operations at HPCL Mumbai
– Ms. Sonali Sanjay Mhatre ( MMS II – Operations )

Equity research on Bajaj Finance Mr. Movil Mathias
MMS II – Finance
INTRODUCTION:
Retail Banking involves lending transactions which are directly executed with consumers rather
than with large corporates. It offering includes transactional accounts, personal loans, mortgages,
Credit cards and Debit cards. The Retail Lending Market has a huge potential considering the
emerging Facilities like Online Banking. The Indian Economy is on a positive path on the
amount of organized credit deployed, driven by increase in consumer disposable income and
tranquil accessibility to credit; Credit Deployment has grown at CAGR of 11% in the Past 10
years, led by Private sector and Public-Sector Banks. The Growth in retail lending can be
credited to favorable Demographic Profile, Development of Technology, favorable Environment,
Micro level Demand and Supply Side Factors, Capital Market Reforms. This all has led to a
paradigm shift in credit lending strategies of the Banks nonetheless, Despite Overall increase in
the growth of Credit, Retail lending still remains under-served, India‘s retail debt to GDP ratio
holdups behind several Developed and Emerging Economies.
This opportunity has led many Non-Banks especially the NBFC‘s to enter the retail lending
market, Using various customized financial products and innovative credit lending models. In
the past years, Non-Banking Financial institutions have outpaced Formal Banks in Fresh
Credit deployment, leveraging technology to cater the under-served segments, Non-Banking
Financial institutions have exploited the incapability of the Banks to customize rigid policies
and rapidly scale up its operations and NBFC‘s have seen a tremendous increase in new credit
Disbursals at the expense of Public Sector Banks. The Share of Non-Banks in the total credit
market has gone up from 26% in FY-2015 to 35% in FY-2018. In the light of the above facts
this sector has great opportunity to grow in future and hence many investors who want to
invest in these companies. Thus, equity research is done for Bajaj Finance Ltd which is one
leader when it comes to retail lending. This report would include in-depth research of Retail
Lending Industry and detailed coverage of Bajaj Finance Ltd.
The study will analyze the financial strength and financial health of Bajaj Finance Ltd using
Du-Pont Analysis, Beneish M Score Model and Ratio Analysis. The study also aims to find

the true and intrinsic value of the stock of Bajaj Finance Ltd by using Dividend Discount
Model and Excess Return Model. It would also use Relative valuation technique to value the
above companies. As financial markets sustain on information, it is one of the most asset, this
paper will help in filling the information gap in the minds of investors interested in Bajaj
Finance Ltd, so they can make well informed and sound investment decision.
LITERATURE REVIEW:
Equity Research is a division within either a buy-side or sell-side firm which is responsible
for the research used by the firm and its clients. The purpose of an equity researcher is to
provide insight and detailed analysis into a company, entity or sector and this information is
then used by investors to decide how to allocate their funds and by Private Equity firms and
investment banks to value companies for mergers, LBOs, IPOs etc. (Becker ton , 2015)
Valuation studies and exercises, by their nature, cannot be considered completely scientific
and objective ways to find out true values of assets (Damodaran 2012).
Fernández (2007) points out the importance of valuation from a corporate finance standpoint
and states that ―for anyone involved in the field of corporate finance, understanding the
mechanisms of company valuation is an indispensable requisite‖. Mergers, acquisitions,
restructurings, investment evaluations, initial public offerings, credit processes, accounting
and taxation procedures can be counted amongst the major reasons that require valuation
assignments. Valuation exercises include various assumptions and subjectivity; therefore,
there is not an absolute correct way of performing them.
Booth (2007) has a parallel opinion with Fernández on the idea of being conceptually correct
and indicates that although there are numerous ways of calculating the value of a firm, it is
possible to claim a conceptually correct value. The fundamental argument of relative
valuation proposes that; it is possible to estimate value of most assets considering how
market values the similar assets (Damodaran 2012). It can be regarded an easy and fast
method to implement and revise, and it reflects the conditions in the marketplace accurately
on the time of valuation. On the other hand, issues on the depth and efficiency of markets, or
difficulties during obtaining the multiples and applying the method to the companies tend to
grow can set drawbacks of relative valuation. A relative valuation involves a multiples
analysis, of which comparing a firm‘s multiples with other companies alike and can provide
an examination of robustness of DCF valuations as well as explaining performance
mismatches of a company compared to the marketplace (Goedhart et al. 2010). According to

the same authors, ―Using the right multiple‖, ―calculating the multiple in a consistent
manner‖, and ―using the right peer group‖ are key requirements for a well-structured
multiples analysis. Regarding finding the identical companies‘ issue, Damodaran (2005)
thinks that it is not an easy task to find enough comparable firms in a sector, or to define
firms as comparable in a sector if their profiles (risk, growth, cash flows) are different.
Damodaran (2005) adds that, if the market is not systematically overpricing or under-pricing
the whole sector or an asset group, relative valuations and DCF valuations would converge to
each other.
NEED FOR STUDY:
Bajaj Finance Ltd achieved its highest growth rate in the last 5 years and keeping in mind the
favorable macro-economic factors and the demography, this Company has excellent growth
opportunities in the future. Hence, given its current contribution to the Retail lending sector
and the potential future growth it is a lucrative company for the investors. Thus, the need for
this study is to provide information to the potential investors who want to invest in the Bajaj
Finance Ltd and to the investors already invested in Bajaj Finance so that they can make a
sound investment decision.
OBJECTIVES:
To analyze the financial strength and performance of Bajaj Finance Ltd.
To compute the intrinsic value of the stock of Bajaj Finance Ltd
using Dividend Discount Model and Excess Return Method.
To justify the period of High Growth for the retail lending industry.
To determine the value of the above companies based on relative valuation technique.
To give target price of Bajaj Finance Ltd and give ratings of Buy, Sell or
Hold for the share.
RESEARCH METHODOLOGY:
Bajaj Finance Ltd was selected for the study. This company showed a phenomenal growth
rate in the past 5 years. Despite of the Tailwinds in the sector, it became the second company
sector to cross 2 trillion in terms of market cap.
Period of consideration of the same was from March 2009 to March 2019.

Passenger
vehicle 14%
Personal credit 9%
Gold
Loans 8%
Others
2% 2/3 wheeler
4%
Microfinance Tracto
r
4
5%
LAP+SME 25%
Commercial vehicle 21%
DATA COLLECTION AND ANALYSIS:
Secondary data is used for this study. It was collected from the Annual and
Quarterly reports of the respective companies from their official website. Also,
the data is being taken from authenticated websites like BSE & NSE. The data
for the Retail Lending industry is taken from RBI, ICRA and CMIE research
database.
Period of consideration of the same was from March 2009 to March 2019.
For Part I –Financial strength - Ratio Analysis, ALM Analysis, ECL Analysis
and Du-Pont Analysis on Return on Equity is used.
For Part II – Dividend Discount Model and Excess Return Model is used.
Cost of Equity is calculated by using Capital Asset Pricing Model (CAPM),
Beta is calculated using regression analysis.
For Part III – Taking Retail Debt/GDP and China as a peer country for
comparison Justified the Period of High Growth.
For Part IV – Operational Performance by comparing the profitability ratios
and Valuation based on PE ratio.
For Part V– Target price will be given by assigning a PE multiple to the
company and recommendations will be given based on the following criteria.
BUY- the Stock expected to deliver more than 10% return
HOLD - The Stock expected to deliver between -10% to 10% return
SELL - The Stock expected to deliver less than -10% returns.
DATA ANALYSIS:
Retail Credit Mix share of Non-Banking Companies increased from 29% to 34% in
the last two years.

Retail NBFC Credit in 2018 stood at Rs.8.3 trillion. Personal credit including
Microfinance witnessed Growth whereas NBFC‘s started losing it share in some key
segments like passenger and new commercial vehicles to banks.
NBFC‘s pursued to focus on LAP+SME credit to avert pressures and diversified their
lending Mix aiming on lower ticket lending (<Rs.10 Million).
Competitive Pricing Pressures from Banks constrained funding Availability leading to
an expected uptick in delequencies which can restrict the overall growth in the near
term.
Blow to NBFC’s Sector in Mid-FY19
Timeline of events
IL&FS Defaults :- IL&FS one of the India‘s biggest infrastructure devolopement
and financial institution known as a prime example of public-private partnership the
group went aground when its subsidary ITNL defaulted on payment of inter-corporate
deposits to small industrial bank of india.Also on 28th
August IL&FS financial
services postponed payment on its commercial papers.In september 2018 IL&FS
defaulted on payment of rs 10 billion term loan which it owed to SIDBI.This was
trailed with constant rating Downgrades by the rating Agencies and even more
Defaults. IL&FS was registered as an Investment Company,a type of NBFC‘s.
DHFL Bond Sale :- DSP Mutual Funds sold DHFL‘s non convertible Debentures at
a very discounted price,while mutual fund cited reduction in porfolio duration and
intrest rate movement as the reason , this triggered risk for the investor resulting in
plummenting DHFL‘s share price, inspite company commenting that it had suffiecent
funds for liquidity. All NBFC‘s were put in the same bucket overnight amidst the
fears of liquidity
Horizon of Raw Return
Companies Week 1 Month 3 Months 6 Months
IL&FS Transportation Networks -5.80% -18.10% -47.40% -74.90%
IL&FS Investment Managers -7.00% -5.20% -47.50% -69.30%
Dewan HF -23.00% -39.50% -70.40% -68.80%
Gruh Finance -1.00% -10.20% -17.20% -52.70%
IndiaBulls HF -12.70% -26.20% -47.20% -50.60%
Repco HF -0.40% -25.20% -45.10% -45.60%
Shriram transport finance 4.40% -11.40% -33.80% -44.80%
PNB HF -17.20% -32.20% -43.70% -44.60%
Bajaj Finance 8.40% 1.30% -13.70% 39.10%
Sundaram Finance 4.20% -6.20% -5.60% -24.30%
L&T Finance -3.30% -11.70% -36.50% -32.20%
HDFC -3.10% -8.10% -8.60% -6.30%
Table-Performance of Share Price of NBFCs ,as on 25-October-2018

I. Deewan housing share price performance
DHFL shares sinked by 55% which is the biggest fall in the past 21 years, the Fall had
rippling effect on share price performance of other companies like Indiabulls housing finance
Limited Plummenting by 16.77% .LIC(HFCs) tanked almost by 14.1% .Can finance Homes
by 6.82% on that particular day.
II. Increase in Cost of Funds
NBFCs AAA -AA+ AA AA-
Apr-18 8.35 9.24 9.38 8.98
May-18 8.79 8.62 9.21 9.22
Jun-18 8.92 9.09 9.2 9.6
Jul-18 8.72 9.26 9.71 10.28
Aug-18 8.74 9.18 9.59 10.37
Sep-18 8.46 8.76 10.04 11.05
Oct-18 9.24 9.38 9.98 11.5
Nov-18 9.15 8.68 9.5 11.17
Post the Crisis and default of IL&FS and Sale of DHFL Bonds the cost of funds increased,
this led to liquidity crisis and increase in the interest rates of the loans given to customers.the
cost of funds increased across all the different rated NBFCs.The cost of funds showed a
declining trend before the default.
Regulatory Action-
After the IL&FS fiasco it became extremely difficult For NBFCs and HFCs to raise funds
from the commercial paper market.Funding from sources like banks began to slowdown.In
order to avoid liquidity Crisis the Reserve bank of India and National Housing Board
undertook various actions to enable Shadow banks to raise funds from other sources
Timeline-
Date Action
Sep-18 to
Dec-18
The Frequency of OMO auction Purchase was increased by the RBI dramatically between
September 2018 to jan 2019 .RBI has infused liquidity to the extent of rs 2.06trn.The volume of credit available to the NBFCs depends on the willingnes of the banks to lend them
8 Oct-18 The National Housing Board Extended the refinance limits to Housing Financial institution from rs 240bn to rs 300bn
19 Oct-18 RBI indicated the banks that they will be able to acknowledge governement securities held by them equal to the amount of the credit outstanding to NBFCs

19 Oct-18 Revision of NBFCs exposure limit to single borrowers which are not enagaged in in
infrastrucutre Finance to 15% from 10%
29 Nov18 Minimisation Minimum holding period by the RBI for loans having maturity of more then 5 years as an admissibility criteria for loans which are to be securitised to banks
24 May 19 RBI announced for all the deposit and non deposit taking NBFCs having asset worth rs 5000 crore and more should maintain a LCR ratio of 60% from April 2020 gradually moving to 100%
liquidity Coverage ratio by April 2024.
OMO Auction Volume Data-
Source-Reserve Bank Of India
The Open Market Operations purchase in volume increased Rapidly from Sepetember
2018 to with collective auction volume standing at Rs 2.06trn between September-
2018 to Janurary 2019.
The purchased volume of Open Market Operations rose to their highest monthly
levels since March-16.
The Reserve Bank of India had carefully selected the measures to ensure that Non-
Banking Financial Institutions and Housing Finance Companies get liquidity through
banks which will enable the RBI to exercise indirectly control over them.
The Reserve Bank of India has oblique similar measures of Open Market Operation
transactions throughout the year.
Objective I -To analyze the share performance and financial
strength of Bajaj Finance Ltd
Three step Du-Pont Analysis breaks down ROE into 3 components.
Operating Efficiency- measured by net profit margin
Asset usage Efficiency- measured by asset turnover ratio
Financial leverage- measured by equity multiplier

3 STEP DuPont Analysis
Year
Return on Equity
Net income/ Revenue/ Average Total Assets/
Revenue Average Total Assets Equity
(ROE)
Net Profit Margin
Asset Usage
Efficiency
Equity Multiplier
2009 3.11% 0.06 0.15 3.71
2010 7.76% 0.10 0.19 4.19
2011 18.18% 0.18 0.17 6.27
2012 19.99% 0.19 0.17 6.36
2013 17.56% 0.19 0.17 5.29
2014 18.02% 0.18 0.17 6.17
2015 18.71% 0.17 0.17 6.84
2016 17.46% 0.17 0.16 6.34
2017 19.13% 0.18 0.16 6.64
2018 16.16% 0.20 0.16 5.25
2019 20.28% 0.22 0.15 6.31
Asset liability Management Mix
Particulars 1m >1 to 2m
>3 to 6m
>6m to 1 yr
>1 to 3 Yr
>3 to 5 yr >5 yr Total
Cash & Cash Equivalents
5524 2 7 10 344 510 4181 10580
Loan repayments 7,642 5,263 12,203 17,014 31,771 12,409 5,991 97,492
Other inflows 2,150 63 590 445 2,726 544 1,136 7,868
Total Inflows (A) 15,316 5,328 12,800 17,469 34,840 13,462 11,308 1,15,940
Cumulative Total Inflows (B)
15,316 20,644 38,860 56,330 91,170 1,04,632 1,15,940
Borrowings 5,361 430 3,638 10,045 27,182 14,616 11,422 75,039
Other Outflows 4,752 463 2,619 4,179 4,690 1,122 469 20,354
Capital and Reserves and Surplus
- - - - - - 20,547 20,547
Total Outflows (C) 10,113 893 6,257 14,225 31,872 15,738 32,438 1,15,940
Cumulative Total Outflows (D)
10,113 11,006 21,667 35,892 67,765 83,502 1,15,940
E. Mismatch (A-C) 5,203 4,435 6,543 3,244 2,968 -2,276 -21,130

Earnings and Return Ratios
Objective II -To compute the intrinsic value of the stock of Bajaj Finance ltd by using
Dividend Discount Model and Excess Return Model
1. Cost of Equity -
The cost of Equity will be calculated using the Capital Asset Pricing Model (CAPM)
Required Rate = Risk Free Rate + Beta (Risk Premium)
Risk Free rate:4.66%,Beta:1.1
{(10 year Government Bond Yield (6.81%) – Default Spread (2.15%)}
Expected Market Return:12.65% (Nifty Last 5 year Returns)
Cost of Equity-13.27%
High Growth Phase
Year
Expected
Growth
Rate
EPS Payout
ratio
DPS Cost of
Equity
Cumulative
Cost of Equity
Present Value
1 35.00% ₹ 93.60 8.65% ₹ 8.10 13.39% 113.39% ₹ 7.14
2 35.00% ₹ 126.35 8.65% ₹ 10.94 13.39% 128.57% ₹ 8.50
3 35.00% ₹ 170.58 8.65% ₹ 14.76 13.39% 145.79% ₹ 10.13
4 35.00% ₹ 230.28 8.65% ₹ 19.93 13.39% 165.31% ₹ 12.06
5 35.00% ₹ 310.88 8.65% ₹ 26.90 13.39% 187.44% ₹ 14.35
Transition Phase
6 29.20% ₹ 401.65 20.22% ₹ 81.20 13.36% 212.50% ₹ 38.21

7 23.40% ₹ 495.64 31.78% ₹ 157.50 13.34% 240.84% ₹ 65.40
8 17.60% ₹ 582.87 43.34% ₹ 252.61 13.31% 272.90% ₹ 92.57
9 11.80% ₹ 651.65 54.90% ₹ 357.76 13.29% 309.16% ₹ 115.72
10 6.00% ₹ 690.75 66.46% ₹ 459.09 13.26% 350.15% ₹ 131.11
Growth Rate in Stable Phase = 6.00%
Pay-out Ratio in Stable Phase = 66.46%
Cost of Equity in Stable Phase = 13.26%
Price at the end of growth phase = ₹6,702.91
Present Value of dividends in high growth phase = ₹495.19
Present Value of Terminal Price = ₹1,914.30
Value of the stock = ₹2,409.49
Current Market Price 3489.5
Upside/ (Downside) -31%
Excess return Model
Equity Invested = 19697.02
PV of Equity Excess Return = 21561.14692
Value of Equity = 41258.16692
T.V of Excess Return 43942.4196
Value Per Share = 2461.70447
Current Market Price 3489.5
Upside/ (Downside) -29%
Objective III – To Justify the period of high Growth of the Retail Lending
Industry in the future
APPROACH
Estimation of the potential size of the India Consumer/retail lending industry on a rupee basis
through cross-country comparisons of income and debt.
0.59 Retail Debt Correlation 0.56
0.56
GDP Per Capita Life Expectancy Household Financial
Assets
Source--BANK OF ITALY, ECONOMICS AND STATISTICS DEPARTMENT

Per-Capita GDP-PPP USD
8000
6000
4000
2000 YEAR 1 YEAR 2 YEAR 3 YEAR 4 YEAR 5 YEAR 6 YEAR 7 YEAR 8 YEAR 9 YEAR 10 YEAR
11
CHINA (1997-2007)
INDIA (2007-2017)
DEBT ( INR TRILLIONS)
78.25 86.9 93.7
37
2017 2022 ( 50 % SCENARIO) 2022 ( 75 % SCENARIO) 2022 ( 100 %
SCENARIO)
China is a good comparison, as India’s per capita GDP growth lags China’s by a decade
Estimation Of India's Retail debt
China India
Year Growth Year 100% Growth 75% Growth 50% Growth
2008 17.85% 2018 21% 21% 22%
2009 23.89% 2019 28% 27% 25%
2010 27.29% 2020 32% 30% 27%
2011 27.81% 2021 33% 30% 27%
2012 29.61% 2022 34.9% 31.4% 28.1%
2013 32.97% 2023 39% 34% 30%
2014 35.41% 2024 42% 36% 31%
2015 38.23% 2025 45% 38% 32%
2016 44.19% 2026 52% 43% 34%
2017 49.21% 2027 58% 46% 36%
FINDINGS AND INTERPRETATIONS:
Part 1-
The company has focused on portfolio granularity across geographies and products to
augment profitability and reduce risk.it is reflected in lower operating expenses better
risk metrics and better operating margin
Focus on expanding Fee revenue pool and better cost management improved opex to
net interest income by 35.3%
The company has a strong customer franchise base which rose up to 32% to 34.48
million from 26.22 million adding 8.27 new customers
The portfolio quality of Bajaj Finance remains best in the last quarter as it was
adjusted for IL&FS exposure with improvement in quality of portfolio the business is
deemed to grow in a strong manner

The company has a strong liquidity profile having a liquidity buffer of 6612cr as of
31st March 2019
Part 2 –
Company Market Price DDM Upside / (Downside) Excess Return Model Upside / (Downside)
Bajaj Finance 3,489.50 2409.9 -31% 2461.704 29%
Bajaj Finance Ltd based on Dividend Discount Model and Excess Return Model is
overvalued
This doesn‘t imply that one must sell the stock because perceptions and opinions
about the company and the market play an important role in which influences the
market price of the stock
Part 3 –
Cross-country comparison with other emerging market peers indicates likely
substantial growth over at least next 5 years
China is the best comparable country in terms of the likely evolution of the per-capita
income (and hence retail lending growth), with a temporal lag of a decade
On a conservative basis, the potential market size is estimated to increase INR 78
trillion- a CAGR of 16.1%
A more aggressive estimate implies a potential market size of INR 94 trillion by 2022,
a CAGR of 20.5%
The approach speaks about growth, not the limits of market itself.
Part 4 –

Parameters Movement
Revenue Growth
EPS Growth
Operating Profit Margin
Net Profit Margin
P / E Ratio
The above table indicates that although the P/E ratio for the company is high they also
have better operative margins and growth prospects than the industry
Bajaj Finance Limited though overvalued it doesn‘t mean one should sell the
company‘s stock as the company is backed by strong operative and growth statistics
Part 5 –
Company Assigned P/E Forward EPS Target Price CMP Returns Rating
Bajaj Finance 42.29 89.95 3803.99 3489.05 9.03% HOLD
LIMITATIONS:
The market behavior if irrational may give rise to – under-valuation for extended
periods; Over-valuation from unjustified optimism and misplaced enthusiasm for
unreasonable length of time. The slow correction of under and over valuation poses
threat to analysis.
Future changes are largely unpredictable; more so when the economic and
environment is buffeted by winds of change. The analysis is based on my own
interpretation from the data available from the best possible source however this may
defer with other analyst as they may have different perception about the company
Forecasting of the company is based on assumptions
Lack of Availability of data
FUTURE SCOPE:
The study can be extended to value companies across different sector
Relative Valuation can be done by taking all the diversified financial companies
across the world
The same Valuation can be matched with Asset Valuation Model and Cash Flow to
Equity Model and results can be compared

RECOMMENDATIONS:
The study recommends investors to Hold - Bajaj Finance Ltd.
CONCLUSION:
It is evident from the study that the historical financial performance & strength of
Bajaj Finance Ltd has been above average based on the Ratio Analysis and Du-Pont
Analysis. Thus, based on past performance Bajaj Finance Ltd is favorable for the
investors to invest as the return ratios are healthy.
The true and intrinsic value of the company is less than the market value based on the
DDM model and Excess Return Model. This concludes that the company is
overvalued.
However, this doesn‘t mean that investors should not invest in the company, when
valued Bajaj Finance through relative valuation technique Bajaj Finance Ltd is
overvalued. It has strong operative and growth statistics as compared to the industry
BOOKS:
John Burr Williams 1938. Theory of Investment Value
Prasanna Chandra 2011. Security Analysis and Portfolio Management.
Ashwath Damodaran 2006. Damodaran on Valuation: Security Analysis for
Investment and Corporate Finance.
Annual Reports and Quarterly results of Bajaj Finance Ltd
Internal Reports of Finnovate Financial Service Ltd
DATA BASE:
Investment Information and Credit Rating Agency of India Ltd (ICRA)
Reserve bank of India
Capitaline
Bloomberg Terminal
Centre for Monitoring Indian Economy (CMIE)

ACKNOWLEDGEMENT:
I express my deepest gratitude to Prof. Vaibhav Shah (Faculty Guide) and Hardik Mer
(Industry Guide), I would also like to acknowledge Prof. Pushkar Parulekar (Mentor) for their
co-operation and inputs throughout the course of this project.

Analysis of Indian Cement Industry with special reference
to Heidelberg Cement India Ltd.
Mr. Sanmay Tribhuvan
MMS II – Finance
INTRODUCTION:
Cement is one of the most important commodity which helps an economy to grow and develop from
roads to railways & from House to factories are incomplete without cement. India currently has
480MT of cement production capacity. India is the second largest cement producer as well as
consumer. Heidelberg Group is a leader in aggregate production, No.2 in cement and No.3 in ready-
mixed concrete. Heidelberg Cement operates in 60 different countries and has a total cement capacity
of ~200 MT. Heidelberg Group entered India in 2006 by taking stake in Maysor Cement and in 2008
Heidelberg cement fully acquired Maysor cement and named it as Heidelberg Cement India Ltd.
Heidelberg Cement India ltd currently has 5.4 MT of cement production capacity. With two major
plant one at Damoh and other at Jhansi. It‘s one of the strong player in the central region (Madhya
Pradesh & Uttar Pradesh) of India. As per management declaration it has 10% of market share in the
central region. Heidelberg cement India ltd Management discussed in the earning conference call that
the lead distance time for the company is 390 Km. The management also discussed about various
initiative taken by the firm to control its freight and power cost. Freight cost is controlled by
agreement with Indian railways to solve the wagon issue. And the waste Heat Recovery System set up
at Damoh plant can produce ~38% of the total power requirement of the plant. This initiative is
helping the firm to keep control on fuel and power cost. Heidelberg cement India has shown a
constant growth over the last 5 years the company also achieved its all-time high sales volume of
4.9MT and also trying to improve further. After running relative valuation the valuation for
companies share price can reach Rs 239 BY FY 21E with upside of 25% from current price of Rs 192.
NEED FOR STUDY:
Cement Industry plays an important role in the Indian economy. India is the second largest cement
producers as well as consumer in the word. Housing and Infrastructure sector are key consumers of
cement as more than 80% of total cement demand is consumed by these 2 sectors. Given that the
government of India has launched various schemes, like ‗Housing For All‘, ‗Bharatmala pariyojana‘
etc.; cement demand prospects are quite high. So looking at the potential of the cement industry to
grow in the future, need is to analyze how the cement industry is performing currently and may
perform in the near future.
OBJECTIVES:
• To understand the demand-supply pattern of the Indian cement industry.
• To analysis, the financial performance of Heidelberg cements India Ltd.
• To forecast the financial performance of Heidelberg Cement India Ltd for investors
recommendations.
RESEARCH METHODOLOGY:
The research design is descriptive research where secondary data is collected and analyzed. The
analysis is done on one of the well-known cement company operating in central India which is

Heidelberg Cement India Ltd. It‘s a subsidiary company of a global cement producing giant
Heidelberg Cement.
DATA COLLECTION & ANALYSIS:
Secondary data: It was collected from the annual reports, transcripts of the earnings conference call,
Investor relation presentation from the company‘s official websites. Also, the data was taken from
Authenticated websites of BSE & NSE. The data of Heidelberg Cement India Ltd financial
performance included balance sheet, Profit and loss statement and Cash flow statement was collected
for the last 6 years from the Financial year 2013 to financial year 2018 The tool used to Analysis: In
order to evaluate or compare the financial performance of the company on a year on year basis
Industrial analysis and Relative valuation technique was used to give recommendation to the investor.
Primary Data: Calling Local Retail Dealers in the major states of Madhya Pradesh & Uttar Pradesh.
To Collect data of Demand and Supply of cement in the region. 24 Retailers were called.
Objective 1: Cement is a bulky commodity and hence cement is generally sold near the location of
the plant. Typically, in India the distance between the plant and consumer market for cement, called
‗lead distance‘, is 300-400kms. If the material is dispatched through railways, then the lead distance
can be higher. Therefore, it is essential to study the location of the plants and the addressable market it
can cater to. For Heidelberg cement, its two key plants are located in the states of Madhya Pradesh
and Uttar Pradesh and here we have taken a look at the addressable market from these locations.
Madhya Pradesh: Heidelberg has an integrated unit in Damoh, Madhya Pradesh. Based on the
management‘s comments during the earnings conference call hosted by the company, its average lead
distance is 390 km. Based on its location and lead distance, we have looked at the key cities or
districts that Heidelberg‘s MP unit can target.

Uttar Pradesh: Heidelberg has a grinding unit in Jhansi, Uttar Pradesh. Based on the management‘s
comments during the earnings conference call hosted by the company, its average lead distance is 390
km. Based on its location and lead distance, we have looked at the key cities or districts that
Heidelberg‘s UP unit can target.
Geographical Breakup of Volume: The company mainly operates in central India in the state of
Madhya Pradesh and Uttar Pradesh and some parts of Bihar. Company has a 10% market share in
central India. The company said the major volume driver was increased in infrastructural activities
and Rural Housing In central India. Given the uptick in infrastructure investments in the state of Uttar
Pradesh like Purvanchal Expressway, Bundelkhand expressway, etc., the demand in the state is
expected to move up.
Trade & Non-Trade Mix: As per the management discussion through conference call company
discussed that Heidelberg is focused on Trade sales as 85% of the total sales is trade sales and the rest
is nontrade sales.
Composition Fuel Mix: As on fourth Quarter of FY 19, the Coal and Pet coke mix is 40% coal and
60% pet coke, but as per the management discussion, this proportion of coal and pet coke varies as the
price of coal and pet coke changes. Heidelberg only uses Domestic coal for production and it is
mainly sourced from Coal India.
Pricing of Premium Cement: Heidelberg sells its premium cement under the brand name Mycem
power. The price gap between the premium product and the normal product is Rs30. The sales volume
of the premium product is also increasing by 4% on a YOY basis.
Logistics: Out of the total distribution of cement 54% of
the total sales volume is been transported through Road.
The company has also signed long-term agreement on
traffic with the Indian railway to optimize the logistical
cost. Heidelberg has also set up Over Land Belt Conveyor
(OLBC) this is a 19Km conveyor set up at Narsingarh
(Damoh) plant and it's also one of the longest Over Land
Conveyor (OLBC) in the country.
Cement Pricing in Major cities of Central India:

Dealer Interaction: In order to gauge the recent pricing and demand trend in the region, we
interacted with several cement dealers across the two states. Key cities targeted during the call were
Bhopal, Jabalpur, Gwalior, Agara, Kanpur, Lucknow, Rebarly & Allahabad. the overall pricing
feedback through the primary channel check is that cement pricing which had increased this region
over the past two months is currently stable. However, given the advent of monsoon season, which is
generally a weak season for construction, cement prices are expected to marginally come down from
current levels.
Financial Analysis:
Increase in Sales over a period:
Heidelberg Cement India Ltd has increased its sales
volume on year on year basis also it is expected that
the volume will grow further as well due to strong
demand from housing and infrastructure projects &
government also trying to boost affordable housing by
planning to build ~40 Million House in rural India and
~20 Million house in urban. We can see the sales
volume has grown by 26% over FY 14 to FY19 and it
is also expected to grow 10% By FY 21E.
Growth Seen in Profit After Tax:
As the company is able to improve its Top line
numbers the effect can be seen on the bottom line
as well. During FY2014, the company had
reported a loss of Rs836mn. From thereon, we
can see continuous improvement in profits every
year. In the current year, Heidelberg has reported
record profits of Rs2207mn. Based on strong
pricing scenario and a further improvement in
operating efficiency, we expect the company to
report PAT CAGR of 68% over FY19-21E.
Consistent Growth in EBITDA per Tonne:
Heidelberg Cement India was successfully
able to improve its EBITDA per tonne
from Rs302 in FY 2013-14 to Rs1057 in
FY2018-19. The company was able to
improve its EBITDA per tonne by
controlling cost. One of the Initiative is the
Waste Heat Recovery System which was
installed in FY 2015-16 to reduce the
power consumption cost. This WHRS
system now efficiently produce ~30% of
the total power requirement by the
company.
Profitability Ratios:
1) Net Profit Margin
2) EBITDA Margin

1) Net Profit Margin:
As we can see above the company has
improved its top line on a year on year
basis this has also helped company to
work on its bottom line as a result we
can clearly see that company has grown
from -7.1% to 10.3 % Net profit Margin.
Formula = PAT
Net Sale
2) EBITDA Margin:
EBITDA Margin is the percentage of
operating profit of the company from the
net sales. EBITDA stands for net profit
before Interest Depreciation and TAX.
EBITDA margin is consider to be one of
the important major to evaluate a
company‘s financial performance.
Formula: EBITDA
Total Income
RETURN RATIOS:
1) Return on Assets
2) Return on capital Employed
1) Return on Assets:
As we can see in 2013-14 there is a
negative return on asset this is because
during the FY 2013- 14 Company had a
Net Loss of 863.6 million and return on
asset was low majorly due to capacity
expansion and company installed WHRS in
the production units. But after FY 2013- 14
company has contently improved its return
on assets numbers.
Formula: Net Income
Total Assets

2) Return on Capital Employed:
Company is continuously improving its
revenue from operations on a year on year
basis which is also reflecting in the returns
generated against capital employed as we
see the company has improved its ROCE
from 1% in FY 14 to 21% in FY 19 and it
is also expected to grow up to 31% By FY
21E.
Leverage:
1) Debt to Equity
2) Debt to Asset
1) Debt to Equity
Debt to Equity ratio tells us how much debt a
company has over its shareholders fund. As we
said, that the standard debt to equity ratio is
2:1 But all companies try to become debt free
as a debt free company gives investor more
confidence while making an investment. So,
Heidelberg Cement India is also reducing its
debt to equity ratio on a year on year basis
from 1.55 to 0.29.
Formula: Debt
Shareholders‘ Funds
2) Debt to Asset:
Debt to Asset ratio is one an indicator which
helps an inverter or manager understand those
company has enough amount of assets against
the debt. As per the standard lower the Debt to
asset Ratio better it is. Heidelberg Cement
India ltd is paying off its loans and reducing its
debt on the same side their asset value is also
increasing due to which the debt to asset ratio
is under control.
Formula: Total Debt
Total Assets
Working Capital Ratios:
1) Current Ratio
2) Quick Ratio.

1) Current Ratio:
As we see the company has worked on its
current ratio number Were in FY 16 it was
0.58 but after FY 16 its increasing over
the year and it has reached 0.97 in the year
FY 19 and it is predicted that it will reach
1 in the FY 21E. Which indicates that the
company will be efficient enough to pay
its short term debt with its current assets.
Formula: Current Assets
Current Liability
2) Quick Ratio:
As we see that company is constantly
trying to improve its Quick Ratio number
ever Since FY 16.But in FY 19
Company‘s quick ratio passed 1 which
indicates company can efficiently pay off
its short term liability with its quick cash
flow available.
Formula: Quick Assets
Quick Liabilities
Self-Sustainable Growth Rate (SSGR):
Self-Sustainable Growth Rate tells us the rate at which a company can grow without taking
external financing and if a company shows growth over its SSGR then its internal resources
would not be enough to fund its growth. As a result, the company has to take help of external
financings like debt or equity dilution to meet the cash requirement and to generate target
growth.
Formula: Self Sustainable Growth Rate = NFAT*NPM*(1-DPR)-DEP
NFAT = Net fixed asset turnover
NPM = Net profit margin as % of sales
DPR = Dividend paid as % of net profit after
tax
DEP = Depreciation rate as a % of net fixed
asset

While analyzing the SSGR of Heidelberg Cement India Ltd, we can clearly notice that the
company has a constant low SSGR (-10% - 2%) over the years. However, the company has
shown a growth rate of 13% over the years.
Dupont Analysis:
Dupont Analysis helps us to understand the factor which is helping to generate growth in
Return on Equity (ROE).
While conduction Dupont Analysis on Heidelberg Cement India Ltd. We can clearly see
currently the company has a ~19% Return on Equity which is expected to grow to ~27% the
reasons for growth in ROE over the year is seen mainly due to improvement in Asset Turn
over, EBIT margin, Interest burden.
Key Financial Highlights of Heidelberg Cement:
2014-15
• The company changed its financial year from January to December TO April to March
because of which company had a financial year of 15 months in the 2014- 15
• In this year company sold a cement grinding facility in Raigad, Maharashtra to JSW Steel
Ltd.
• From this net gain of ~603.10 million is disclosed as an Exceptional Item in the statement of
profit and loss.
2015-16
• The government imposed a ban on sand mining in the state of Uttar Pradesh and some parts
of Madhya Pradesh.
• As there was a ban on sand mining the construction and infrastructure in the central region
was slow downed due to which the demand for cement in that region was also down.
• The monsoon for the year was also not the up to the mark. Basically, there was a drought in
U.P and M.P region in 2015-2016.

2016-17
• In this year there wear state elections and the newly elected government removed the
majority of the ban on sand mining late this year (March 2017)
• This year also experienced a good monsoon.
• And as the ban situation was resolving the company faced raw material problem in the 2Q
& 3Qand since region also experienced a good monsoon due to which various new
infrastructure activities in the region were initiated.
• And which also led to an increase in sales volume for the year by ~3%.
2017-18
• The newly elected government solved the soil ban issue to a large extent.
• The result of which sand was available for infrastructure which also leads to new projects in
the U.P and M.P regions.
• Also received an interest-free loan up to 69 Cr.
• The company paid 10 million debt in this year which also led to reducing interest for the
year.
• But there was a slight increase in the fright cost which is due to the railway issue of lack of
rack storage.
• During the year the sales volume increased by 6%.
2018-19
• The fuel prices were controlled due to power generated from the waste heat recovery system.
• The company achieved the highest sales volume of 4.9 million tonnes mainly due to the
increase in construction activities in Uttar Pradesh
• The company operated at a capacity utilization of 90%.

Income Statement:

Balance Sheet:

Compounded Annual Expected Growth Rate:
Revenue from Operations: Heidelberg
Cement India is expected to grow its
Revenue from Operations By 9% in the
next couple of years. The prediction is
based on looking at its expansion strategy.
Source: Bloomberg
EBITDA: As we look at the EBITDA we
are expecting a growth rate of 19% over
the next two years. The growth can be seen
mainly due to company‘s efforts to control
cost. By increasing the use age of WHRS
Source: Bloomberg
Net Income: In terms of Net Income, we
expect a growth of 33% over the years.
This is because the company is constantly
reducing its debt and improvement in the
top line the effect can be seen on Net
Income
Source: Bloomberg
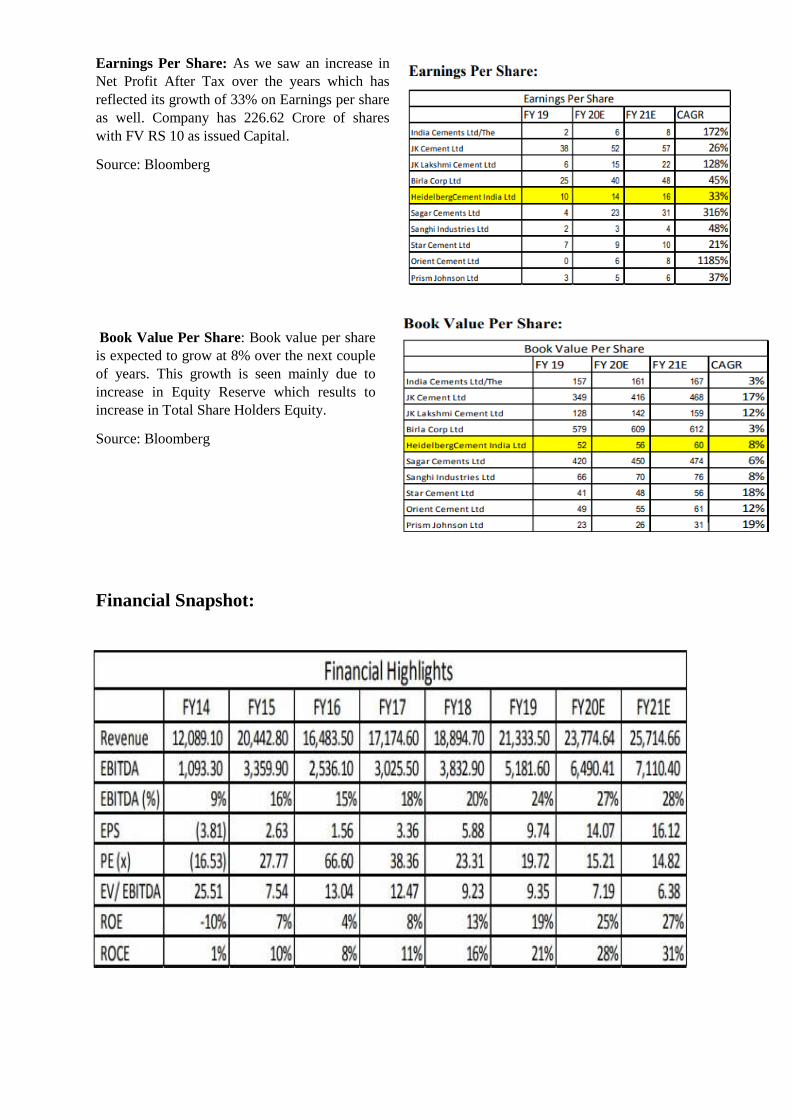
Earnings Per Share: As we saw an increase in
Net Profit After Tax over the years which has
reflected its growth of 33% on Earnings per share
as well. Company has 226.62 Crore of shares
with FV RS 10 as issued Capital.
Source: Bloomberg
Book Value Per Share: Book value per share
is expected to grow at 8% over the next couple
of years. This growth is seen mainly due to
increase in Equity Reserve which results to
increase in Total Share Holders Equity.
Source: Bloomberg
Financial Snapshot:

Relative Valuation Summary:
Relative valuation model is a business valuation model which helps
the investor to compare a companies value to its competitors or
industry peers to assess the financial worth. The valuation is done on
EV/EBITDA multiple. This multiple was taken as an average
EV/EBITDA of other competitors in the same industry.
So according to my analysis by taking an average EV / EBITDA as 8 (x) for prediction of the
share price. So according to me, the stock shows an upside of 25% by FY 21E (Target Price=
239).
And as we see Heidelberg Cement India Ltd is valued at 6.9 which is less as compared to the
industry Average of 7.9 so it shows there is a growth potential in the stock by FY 21E.
FINDINGS:
As we see the growth potential of cement sector mainly due to increasing demand from
government infrastructure as well as Housing development in the country. We also found that
cement producing companies are also expecting grown in demand in the coming future due to
stable government in central. Government Scheme like Housing for all under which
government has planned to make 20 million Urban Affordable house and 40 Million Rural
affordable house by 2022 will also drive the demand for cement. We also found that the
cement sector sustains its growth rate of 5-7 percent over the last ten years and it is expected
that it will grow further as well. In case of Heidelberg Cement India ltd the company has
shown a two digit growth (13%) During interaction with the dealers operating in the state of
Madhya Pradesh & Utter Pradesh it was clearly seen that Heidelberg Cement is one of the
strong player in the central region.
RECOMMENDATION:
By Relative Valuation I predict that company‘s share price will hit RS 239 By FY 2021 whit
an upside of 25% from the current Market price of Rs.192 per share.

CONCLUSION:
The lead distance for Heidelberg cement India ltd is 390 Km. and during interaction with the
retail sellers of cement in the central region of India said they are feeling that the demand for
cement will be less during monsoon but the demand will increase after monsoon. Heidelberg
cement India Ltd has shown a constant growth over the years. According to predicted that the
company will cross 90% of cement utilization in the current year. It was also see that
Heidelberg cement India‘s EV / EBITA was 6.75 which is below the industrial average of 8
which shows potential of the company. As company has constantly improving on sales
volume as well as operational efficiency and after considering this continuous improvement
and conducting Relative Valuation shows that company‘s share price will hit RS 239 By FY
2021 whit an upside of 25% from the current Market price of Rs192 per share(25th June
2019).
ACKNOWLEDEMNT:
Before we get into thick of things, I would like to add a few words of appreciation for the
people who have been a part of this project right from its inception. The writing of this
project has been one of the significant academic challenges I have faced and without the
support, patience, and guidance of the people involved, this task would not have been
completed. It is to them I owe my deepest gratitude. Firstly, I extend my gratitude to my
college guide Mr.Pushkar Parulekar for giving me right direction to write this report his
inputs were truly valuable. It gives me immense pleasure in presenting this project report on
―Analysis of Indian Cement Industry and its Operations with special reference to Heidelberg
Cement India Ltd‖. It has been my privilege to have such a supportive project guide who have
assisted me from the commencement of this project. The success of this project is a result of
sheer hard work, and determination put in by me with the help of my project guide. I hereby
take this opportunity to add a special note of thanks for Mr. Mangesh Bhadang, who
undertook to act as my mentor despite his many other academic and professional
commitments. His wisdom, knowledge, and commitment to the highest standards inspired
and motivated me. Without his insight, support, and energy, this project wouldn‘t have kick-
started and neither would have reached fruitfulness. Finally, I would also like to take this
opportunity to thank my parents and friends who have directly and indirectly played a major
role in supporting and motivating me during the course of this project completion.

A case study on L&T- Mindtree hostile takeover
Ms.Mayuri Gawad
MFM III - Finance
INTRODUCTION:
In the business world mergers, acquisitions, takeovers are the common occurrence.
Even being regular these activities are the most toughest and complex when they take place
in real. The concept of M & A was introduced for mutual benefits of the companies, but
when it‘s a Takeover or to be more specific hostile takeover, it‘s a special form of acquisition
which occurs without permission of the other company. The most dynamic hostile takeover
occurred first time in the history of IT industry i.e. L&T-Mindtree. The project is about the
IT‘s first ever hostile takeover in India. Hostile takeover happens when one company
forcefully acquires another company to achieve its financial goals. The hostile takeover was
done by one of the giant company i.e. Larsen & Tourbro, which played tactfully to takeover
another growing IT company i.e. Mindtree. The takeover is driven with the objectives of
leveraging the synergies expected to arise out of the consolidation. This takeover was planned
for the optimum utilization of cash reserves available with L&T. The whole process of
takeover was dramatic but eventually it was a successful takeover.
The project deeply speaks about the strategies used by the acquirer company – L&T
to make sure takeover happens quickly and smooth and all possible actions taken by the
acquired company- Mindtree Ltd. to resist the takeover. The changes that took place before
and after takeover with respect to management, financial status etc.
This project is all about the factors involved for hostile takeover, stages of the takeover & its
post- merger impact on both companies & people involved.
NEED FOR STUDY:
The study of M&A is highly relevant, as M&A represent a fundamental tool for
corporate restructuring. M&A has much more impact on companies, staff, market status,

goodwill, share price, ratios etc. Hence studying overall impact of IT‘s very first hostile
takeover is much needed. The L&T case study is an interesting example of how one can use
the strategy efficiently in takeover bids or in placing investment bids based on smart
predictions and forecasts of the capital markets.
OBJECTIVES:
1. To analyze the complete process of takeover between L&T and Mindtree
Since this is its first ever hostile takeover, it becomes very much important to study
the steps involved during this case so that one can use such strategy in future to
accomplish their business goal in the area of Mergers and Acquisition.
2. To analyze the overall impact of merger
To conclude this takeover, studying pre and post i.e. overall of impact of this hostile
takeover becomes necessary.
RESEARCH METHODOLOGY:
For the purposes of this research combination of both primary & secondary data has
been used.
Primary Data:
Questionnaires were chosen for this research because they are a reliable and quick
method to collect information from multiple respondents in an efficient and timely manner.
Questionnaires were a quick and effective way to reach multiple respondents within several
weeks.
Sampling Strategy:
The questionnaires distributed among managers and higher leaders from several companies
who all aware about the IT industry and familiar with M&A or takeovers. All of the
participants were approached via email/ WhatsApp, and the questionnaires were distributed
through Google form tool, then completed by the participant and updated on the same. This
took place in the course of four weeks. The range of working experience of interviewees is
varying from 3 year to 20 years. The total participant were 60.
Secondary data:
For secondary data, the main source was websites, News Paper which provided detailed
information about this merger, daily updates and review of people who were familiar with
this matter. Online sites which provided all financial information, ups and downs in finance
world during and after takeover.
Pre-Merger Scenario:
Larsen & Toubro is a major, construction, technology, manufacturing engineering and
financial services conglomerate, with global operations. L&T addresses critical needs in key
sectors - Hydrocarbon, Power, Process Industries Infrastructure and Defense - for customers
in over 30 countries around the world.
The country was viewer to the startup mania of 2014. Mindtree was set up by 10 friends,
who came from Wipro Ltd, Cambridge Technology Partners Inc. and Lucent Technologies in
1999. Ashok Soota, who was then the vice-chairman of Wipro‘s IT services business, had

started discussions with VG Siddhartha, the firm‘s first investor. Over the next five-and-a-
half months, 8 other co-founders joined Soota.
A hostile takeover plan by L&T:
Larsen and Toubro is ready to purchase V.G. Siddhartha's 20.41% stake in Mindtree for Rs.
3,269 crore. L&T planned that it would buy an additional 15% share in Mindtree from open
market and initiate an open offer for 31% more, at Rs. 980/share
A 26% shareholding gives L&T the ability to block special resolutions and triggers a
mandatory open offer. With that objective, L&T will also make open market purchases of up
to 15% of Mindtree‘ s share capital. Once they reach 26% shareholding, L&T will make an
open offer, triggered by the SEBI takeover code, to acquire another 31% shareholding at @
Rs.980 a share. At this share price, the cost of the hostile takeover is @ Rs.10,733 crore. The
acquisition will be fully funded from L&T‘s internal resources.
L&T takeover bid Vs Mind tree’s fight back:
Mindtree had total paid-up capital plus free reserves of Rs.3,165 crore. A company can buy
back shares only 10% of this capital without shareholders‘ consent. It can buy up to 25% of
the capital with 75% shareholder approval. This means that Mindtree can buy shares worth
only around Rs.317 crore without any shareholder nod, or shares worth up to Rs.791 crore
with shareholder approval.
But following L&T‘s open offer proposal, Mindtree cannot buy back any shares without a 75%
shareholder approval, according to the Companies Act, 2013.
―Even if Mindtree promoters offer Rs.1000 apiece and get a majority shareholder approval to
buy shares worth 25% of the company‘s total capital, they will be able to buy back a
maximum of 7.9 million shares, or 0.68% of Mindtree vis-à-vis the 31% shares L&T has
proposed to buy in the open offer," a person directly aware of the recent developments at
Mindtree said on condition of anonymity.
Also, under Section 77 of the Companies Act, 2013, if any entity (in this case L&T)
announces an open offer to acquire control in a company (in this case Mindtree), the
company cannot conduct a share buyback, or alter the company‘s capital structure in any
manner unless it secures 75% shareholder approval.
The company does not have enough money in its balance sheet to fund the buyback and, even
if the promoters pledge their entire 13.32% holding, which is rare, they may be able to raise
around Rs.1,000 crore (which is 50% of the market value of their holding as per the standard
loan-to-equity valuation practice).
Mindtree announced the special dividend to shareholders may well be another tactic to ward off the alarming hostile takeover bid by Larsen and Toubro Ltd (L&T).
Mindtree announced a special dividend of @20 per share. It will also pay an interim dividend
of @3 per share and a final dividend of @4 per share for year 2019. In total, the company
will pay a dividend of @27 per share, subject to approval by shareholders at the annual
general meeting in July. This is the highest ever dividend announced by Mindtree since
The special dividend was to celebrate Mindtree‘s twin achievements of exceeding $1 billion
annual revenue and 20th anniversary of the company.
Completion of Hostile takeover:
Almost all the large institutional investors in Mindtree have sold their stakes to L&T
in the open offer. They include Nalanda Capital (10.61%), UTI Mutual Fund (2.97%),

Amansa Holdings Pvt. Ltd (2.77%), Arohi Asset Management (2.74%), Franklin Templeton
Asset Management (India) Pvt Ltd (1.06%), alternative investment funds (1.49%) and a few
more mutual funds. Mindtree‘s promoters N. Krishnakumar, N.S. Parthasarathy, Subroto
Bagchi and Rostow Ravanan, along with their families, own 13.32% in Mindtree.
Post- merger impact:
L&T‘s shares fell down about 5% this year, even though the Nifty 50 index has risen by over
8%. Investors have also supposed the decision to acquire Mindtree Ltd as a negative in the
near term because of a worry about using cash in non-core businesses. It can weigh on near-
term return on equity (RoE) of the company. Investors are not happy with L&T‘s capital
allocation to Mindtree, in context of RoE being -5% at the acquired valuation multiple (of
about 20 times).
Larsen and Toubro‘s shares have returned just 1% over a year as macroeconomic concerns and the recent non-core acquisition of Mindtree weigh on investor sentiment.
Within few days of L&T gaining control of Mindtree Ltd, the IT firm on 5th July,
Krishnakumar Natarajan (Executive Chairman), Parthasarathy NS (Executive Vice Chairman
and Chief Operating Officer) and Rostow Ravanan (CEO and Managing Director) have
submitted their resignations as the board members of Mindtree and as employees of the
company. The Mindtree stock now trades at @772, about 21% lower than the price at which
L&T had offered to buy shares from the former‘s shareholders.
FINDINGS:
L&T has been motivated to carry out such hostile takeover on account of following reasons
as mentioned:-
i) Acquisition for Scale
L&T was looking for a optimal usage of cash reserves to bring value the business. Mindtree
was an exceptionally best opportunity to compete the aim of L&T. The presence of L&T
Infotech is restricted to Banking, Insurance and Financial Services. This could be a best
arrangement to provide synergy benefits in and thereby increasing the diversified customer
base. The acquisition of Mindtree ltd will add value to the group's hi-tech, retail, Consumer
Packaged Goods and travel verticals.
ii) Increasing Wealth of Shareholder
The cash and cash equivalents of L&T stands at RS 15,000 crores. Further, the management
endeavors to diversify the business to an asset-light model, which means low capital
expenditure in its traditional infrastructure business. It was exploring alternative options to
generate value for shareholders after the Securities & Exchange Board of India rejected its
plan for RS 9,000-crore buyback. Mindtree Ltd is financially vibrant which could boost the
vision of L&T for expansion in the domain of Information Technology.
iii) Rework the missed opportunity
Back in 2009, L&T had made a hostile move to acquire the Satyam Computer Services.
However, it missed the opportunity. Rather than repenting on the loss, they lashed upon to
acquire Mindtree Ltd as in when the opportunity presented and provided adequate stimulus to
L&T Infotech for further scaling the business.

iv) Future plans
L&T has no plans to merge its subsidiary which is L&T Infotech with Mindtree, advisories
like Elara Capital and Motilal Oswal advice that a merger of the two companies will create a
lot of synergies for L&T.
v) Concern from Mindtree promoters
What kind of a message was being sent to start-ups and credible entrepreneurs with the first
hostile takeover attempt in the Indian technology sector? Why L&T could not build a great
technology business on its own.
SUGGESTIONS:
L&T already has subsidiary i.e. L&T InfoTech and now this new company i.e.
Mindtree. Hence merger of both companies is suggested for more profit in future.
Combination of two will result into good synergy. Sharing of knowledge and techniques will
result prosperous future for L&T. Below is a data of combined revenue of T&T InfoTech and
Mindtree of quarter 3 annualized revenues which clears that combination would turn into
great future.
The combined entity would have to trail 12-month (TTM) revenue of $837 million in BFSI,
$520 million in hi-tech and media and $554 million in manufacturing, retail and CPG. This
implies a scale larger than Tech Mahindra in Banking Financial Service and Insurance, hi-
tech and media verticals.
CONCLUSION:
Hostile Takeover in IT service business is an unprecedented event, and such a
transaction may send a shockwave to the corporate governance and takeover norms in our
country. Only time will justify whether service business will be integrated successfully in the
industry or not. This hostile takeover may compel to protect the promoter group from the
likes of sharks/ corporate raider/ opportunistic company in the future.
L&T has offered a good exit opportunity to Mindtree shareholders as the valuations
are on the higher side. L&T‘s plans of using its cash reserves for an acquisition in a non-core
business, raises questions about judicious capital allocation. Shareholders might have
concerns on whether their value be enhanced by buying a non-core business. Alternatively,
by acquiring Mindtree, L&T might be looking to smoothen the cash flows of L&T Infotech
by increasing the scope of their offering in the InfoTech space. If L&T can handle the
cultural issues of the takeover and are able to manage the product portfolio, the shareholders
may actually gain.
Mindtree‘ s promoters had called L&T bid as hostile and raised corporate governance
issues at L&T and culture difference between the two companies.

BIBLIOGRAPHY:
http://www.business-standard.com/india/news/hdfc-bank-centurion-boards-okay-
merger/314806/
http://money.cnn.com/1998/12/01/deals/exxon/
http://www.dnaindia.com/money/report_jsw-steel-siscol-merger-ratio-at-1-22_1155301
http://papers.ssrn.com/sol3/papers.cfm?abstract_id=954912
http://www.financialexpress.com/news/hdfc-cbop-ok-129-swap-ratio-for-merger/276925/
http://www.thehindubusinessline.com/2007/05/02/stories/2007050202290200
http://www.livemint.com
http://www.moneycontrol.com
https://imarticus.org/knowledge-center-capital-market-lt-and-mindtree-hostile-takeover-or-
investment-strategy/
https://www.researchgate.net/publication/328646936_Mergers_and_Acquisitions_A_Researc
h_Overview
https://www.edupristine.com/blog/mergers-acquisitions
https://economictimes.indiatimes.com/tech/ites/pursuit-of-scale-has-taken-larsen-toubro-to-mindtrees-
doors/articleshow/68474217.cms
https://economictimes.indiatimes.com/markets/stocks/news/lt-infotechs-hostile-bid-what-does-it-
mean-to-mindtree-investors/articleshow/68465958.cms?from=mdr
https://imarticus.org/knowledge-center-capital-market-lt-and-mindtree-hostile-takeover-or-
investment-strategy/
ACKNOWLEDGEMENT:
I would like to use this opportunity to express my gratitude to everyone who supported me
throughout the course of this MBA project. I am thankful for their aspiring guidance,
invaluably constructive criticism and friendly advice during the project work. I am sincerely
obliged to them for sharing their truthful and illuminating views on a number of issues related
to the project.
I would also like to thank my project guide Dr. Natika Poddar Associate Professor-
Finance from the St. Francis Institute of Management and Research, all the people who
provided me with the facilities being required and conductive conditions for my MBA project.

Report Generation X and Generation Y’s attitude towards social
media a solution development for Web box Studios
INTRODUCTION:
Mr. Zenior Ricky Borges
PGDM II – Marketing
If you are unfamiliar with the terms Generation X and Generation Y, generation X is the
group of people who were born between the years of 1961 – 1980 i.e. currently people
belonging to the age group of 38 – 57 years old. Gen Xers are currently juggling child care,
homeownership, and reaching the peak of their careers and is now working in green energy
and has little kids to contend with. This generation remembers how video took over the radio
star and are more pessimistic about having enough money to retire.
Gen Xers are a very busy group! They‘re dealing with children, paying mortgages and
tuition, and working most of their time. Turns out, they‘re also online more than the current
generation; they are on Facebook, Twitter and now even Instagram. They are more on par
with technology adoption and use just like the millennial, and are more likely to be politically
loyal throughout their lives than baby boomers or millennial. Gen Xers claim to be the most
dedicated to lists while shopping, but also are making the most unplanned purchases on their
shopping excursions. When it comes to marketing, Generation X is a true hybrid. They grew
up without the online shopping experience, so they still enjoy a trip in store, but have now
fully embraced online shopping as well.
While on the other hand generation Y also known as millennial are the group of people who
were born between the years of 1981-1999 i.e. currently people belonging to the age group of
20 – 37 years old. This generation is most widely talked to and about on social media and in
pop culture. When millennial begin their career the economy had crashed, and as a result, are
the largest generation of entrepreneurs. Generation Y are notoriously soft-hearted and soft-
shelled, valuing social issues far ahead of economics. Millennial would rather earn less at a
job they love than earn more at a job they think is boring.

Generation Y is an economic force having a high annual buying power, smart marketers is
turning to new channels to hook this generation. They are the least frequent in-store shoppers
but tend to spend large amounts when they do shop. This generation is more responsive to
online shopping opportunities, recommendations from friends and family, and is motivated
by shopping ease. Millennials are reshaping the way that products and services are being
marketed by staying unresponsive to traditional marketing tactics. This generation likes to
decide where to eat based on Instagram pictures, chooses hair stylists from Facebook and has
their groceries delivered to their door.
As we can see both these generations are very diverse and use social media in a different
ways and consume different things as well. This project will help understand what both the
generation needs so that marketers can cater to them.
NEED FOR STUDY:
Webbox Studios has many clients whose social media handles are operated by Webbox. Thus
it is now an important part to consider Gen Xers as well. Gen Xers are still gradually
accepting online shopping and have yet not fully accepted it as they still prefer the offline
shopping experience. Thus, not many purchase intentions are being made online by Gen Xers
via social media. With the increasing numbers of Gen Xers joining social media platforms
this study will help Webbox and other similar companies understand Gen Xers and Yers
attitude towards social media thus being able to find out the commonalties and differences in
opinions, and be able to cater to their needs, thus making content that‘s relevant and relatable
to the target audience and persuade to like their brand pages which will eventually lead to
purchase intentions, as well increase brand loyalty and brand image.
OBJECTIVES:
To understand the use of social media marketing and its usage pattern.
To study the social media perception and usage behaviour of generation X and
generation Y; and analyse the commonalities and differences between them.
To suggest strategies for Webbox Studios based on the findings.
RESEARCH METHODOLOGY:
This is a qualitative and descriptive research conducted through a survey collecting primary
data in the form of a questionnaire having 50 respondents from each group that in
Generation X a d

Generation Y comprising a total of 100 responses from urban and suburban areas of Mumbai
derived through convenient sampling.
DATA INTERPRETATION & FINDINGS:
Weight assignment
Options Never Rarely Once in a while Sometimes Almost always
Weights 1 2 3 4 5
Generation X
Particulars Never Rarely Once in a while Sometimes Almost always Total Weighted
Average
Facebook 8 10 9 6 17 50 3.28
LinkedIn 30 3 6 9 2 50 2
Instagram 37 2 4 1 6 50 1.74
Snapchat 45 1 1 3 0 50 1.24
Pinterest 44 1 4 1 0 50 1.24
Twitter 41 3 2 4 0 50 1.38
YouTube 9 6 5 13 17 50 3.46
WhatsApp 3 3 6 6 32 50 4.22
Generation Y
Particulars Never Rarely Once in a
while Sometimes Almost always Total
Weighted
Average
Facebook 6 6 7 13 18 50 3.62
LinkedIn 13 8 11 12 6 50 2.8
Instagram 2 1 4 8 35 50 4.46
Snapchat 14 5 9 10 12 50 3.02
Pinterest 15 9 8 11 7 50 2.72
Twitter 27 8 7 6 2 50 1.96
YouTube 1 1 4 8 36 50 4.54
WhatsApp 0 0 2 1 47 50 4.9

Gen Xers are mostly active on WhatsApp than any of the other social media platforms, they
are moderately very active on Facebook and YouTube as well, but are almost inactive on
Instagram, Snapchat, Pinterest and Twitter. On the other hand, Gen Yers have an high
average on most of the platforms, Instagram, YouTube and WhatsApp being the most active
hubs. Gen Yers are similar to Gen Xers is not that active on Twitter.
More than 50% of Gen Xers now consume social media for 1 hour and above, meaning many
Gen Xers are slowly accepting social media and are gradually increasing there consumption.
Gen Yers consume heavy doses of social media as a majority spends 3 hour or more on social
media daily, making Gen Yers still the massive population consuming social media.
Gen Xers like to consume social media mostly during free time and at times whenever they
get any spare moment. On the other hand Gen Yers like to cease every opportunity they get to
consume social media.
From Highest to Lowest
Gen X Gen Y
Posts Checklist
Rating Posts
Checklist
Rating
Global News 34 Movies and TV show updates 36
Cooking/ Food posts 30 Humour 35
Movies and TV show updates 23 Music updates 33
Political updates 22 Global News 30
Humour 19 Meme 29
Recent updates around you 16 Recent updates around you 28
Sports updates/ highlights 16 Cooking/ Food posts 26
Arts and Craft/ DIY's 12 Sports updates/ highlights 25
Music updates 12 Arts and Craft/ DIY's 24
Current trends/fabs etc 10 Current trends/fabs etc 24
Meme 5 Gaming updates 19
Advertisement 4 Political updates 13
Gaming updates 0 Advertisement 11

There are certain commonalities between Gen X and Gen Y in terms on preferred post as it
can be seen that both like to view content related to Global news, Cooking/ Food posts,
Movies and TV show updates and Humour and similarly both dislike Advertisements while
consuming social media content. Also, there some contradicting preferred posts as well; while
Gen Xers like Political updates Gen Yers do not; similarly Gen Yers like to view posts
related to Music updates, Memes, Current Trends/fabs etc and Gaming updates while Gen
Xers do not. To study the influence of social media on the purchase behavior for the two
different generations, Chi-square test was used to check whether they have similarity or not.
Chi-square test is done to determine whether two categorial variables from a single population
have any relationship between them. The two variables are the type of Generation and
Purchase decision
Hypothesis:
Null Hypothesis H0: Purchase decision based on brand page from a social media platform is
independent of the Generation type
Alternative Hypothesis Ha: Purchase decision based on brand page from a social media
platform is not independent of the Generation type
Table of observations (Chi-square)
Purchase Decision
Particulars Yes No Maybe Total
Type of Generation Gen X ( 39-58 years) 16 29 5 50
Gen X ( 20-38 years) 27 17 6 50
Total 43 46 11 100
Test of independence between the rows and the columns (Chi-square):
Chi-square (Observed value) 6.035
Chi-square (Critical value) 5.991
DF 2
p-value 0.049
Alpha 0.05
Fisher's exact test:
p-value (Two-tailed) 0.045
Alpha 0.05

Chi-square has been rechecked using Fisher‘s exact test using alpha 0.05 thus having 95%
confidence meaning if p-value is <0.5 null hypothesis (H0) will get rejected. Therefore,
Alternative hypothesis is true meaning purchase decision based on brand page from a social
media platform is not independent of the Generation type. Purchase decision based on brand
page from a social media platform is independent of the Generation type is rejected as p-
value is 0.045, as generations do play an important role in purchase decision with influence of
social media.To study my second objective the perceptions the two generations have on
social media, factor analysis is used to reduce the data and get the latent variables that
influence the perception development of the population. Kaiser-Meyer-Olkin measure
(KMO) of sampling adequacy has been used to determine the factorability of the matrix as
whole. The Kaiser-Meyer-Olkin measure (KMO) is 0.911, which is greater than 0.6. If
Kaiser-Meyer-Olkin measure (KMO) is greater than 0.6, then factorability is assumed. Thus
on the basis of Kaiser-Meyer-Olkin measure (KMO) result, it is appropriate to proceed with
factor analysis. The reliability of the data after using factor analysis states that Cronbach‘s
alpha was 0.951. Having a Cronbach alpha value of above 0.7 ensures internal consistency
and reliability of the data, The table below shows the factor pattern after varimax rotation for
the questionnaire. After using this varimax rotation method, using extracting method of
Principle Component Factor 1 (D1) consists of 8 items with factor loading ranging from
0.522 to 0.838. Factor 2 (D2) consists of 6 items with factor loading ranging from 0.450 to
0.754. Factor 3 (D3) consists of 5 items with factor loading ranging from 0.471 to 0.828.
Factor pattern after Varimax rotation: D1 D2 D3
You use Social media for Social Interactions 0.437 0.250 0.471
You use Social media for Information Seeking (About sales, deals, products, events, parties, businesses)
0.359 0.450 0.432
You use Social media to Pass Time 0.331 0.174 0.810
You use Social media for Entertainment 0.372 0.206 0.828
You use Social media for Relaxation 0.220 0.357 0.674
You use Social media for Communication Utility (Get topics to talk on online and/or offline)
0.610 0.314 0.243
You use Social media for Convenience Utility (Accessible anytime and anywhere)
0.569 0.575 0.241
You use Social media for Expressing your Opinions (Commenting on updates, and sharing comments on others postings)
0.376 0.754 0.123
You use Social media for Information Sharing (to share information about you with others)
0.389 0.672 0.149
You use Social media for Surveillance / Knowledge of others 0.486 0.605 0.220
Knowledge or awareness of the brand on social media can influence your purchase decision
0.725 0.353 0.320
Previous experience of social media shopping can influence your purchase decision
0.793 0.279 0.316
Information from social media platforms can influence your purchase Decision
0.763 0.308 0.367
Brand Reputation can influence your purchase decision to shop online 0.696 0.337 0.347
Review by other customers on social media can influence your purchase decision
0.838 0.094 0.214

You consider social media to be more trustworthy as compared to many of the mass vehicles
0.695 0.187 0.175
You still love to watch tv ads -0.152 0.625 0.369
Varying contents of social media ads are very persuasive 0.282 0.508 0.539
In modern life brands cannot survive without social media campaigns 0.552 0.039 0.480
Values in bold correspond for each variable to the factor for which the
squared cosine is the largest
So, 3 new factors are formed using factor analysis. The following table shows the names of the
new factors
New Constructs Construct Name Cronbach's alpha
D1 Social Media Perception 0.928
D2 Information Network 0.849
D3 Enjoyment 0.870
Thus to understand the perception to social media, a marketer can know focus on these latent features
when developing strategies for their campaigns. Latent features being Social media perception,
Information network and Enjoyment.
LIMITATIONS:
Time frame would be one of limitations because if were given a more time frame I would be able to
gather more responses which would give a better understanding of the characteristics of Gen X and Gen
Y. Certain Factors may have been missed out by me as only 2 people of my survey did not have any
social media handles but in some responses many have utilized the not applicable option. Since I have
adopted Convenient sampling my responses might show some bias results.
RECOMMENDATIONS:
With the help of this research I would recommend that:
Webbox Studios should continue their campaigns on Facebook and LinkedIn as Gen X do have
accounts on them and also try to convince their clients to opt for Webbox‘s WhatsApp Blast serve
which will help them target customers through WhatsApp as well , as WhatsApp too is a platform

where many Gen Xers have an account.
Since Gen Xers roughly access social media for an average of more than 1hour+ a day, Webbox should
carefully plan when the post need to be uploaded so as to get a higher reach, which can be achieved
with the help of analysis of the campaigns.
Gen Xers do not follow many brands as per the results found and those who do prefer product centric
posts so Webbox having Clients whose target audience is mostly Gen X could opt for more of product
centric posts.
When it comes to Gen Yers Instagram is a very good platform to sell on, so Webbox should target Gen
Y on Insta (as it has a high weighted average rating from Gen Y)
Gen Yers like to view almost all types of content on social media so brands could post content that
relates to their product (for example: a brand that does interior designing can have posts on DIYs for
home décor, current trends in interior designing, new furniture spotlights, etc) also have fun,
entertaining posts, relatable trendy posts.
Webbox and any marketer planning on creating a content bank should consider these 3 factors while
doing so; Social Media Perception, Information Network and Enjoyment. For example Enjoyment
can include posts like Memes, Humour, Current trend, etc. Information network is not only about
uploading posts about the product/brand but also gathering information from the audience (For
Example a coffee shop asking its audience to suggest what new flavors they should introduce,
Youtubers asking their audience if they liked their video and suggestions to what else they want the
youtubers to upload). Social Media Perceptions posts are those posts which encourage engagement
and also purchase influence.
CONCLUSION:
In conclusion, the results obtained from the survey shows that there are certain commonalities and
differences between Gen X and Gen Y, and companies having both as target audience can focus more
on the commonalities when creating content campaigns. Gen X population is definitely gradually
increasing on social media and is also beginning to consume as much social media as Gen Yers do, thus
even making brands that focus only on Gen Xers to have a Social media presence a must. But when it
comes to shopping online rather from any brand page on any social media platform Gen X is still
hesitant unlike Gen Y, a research on the following can better help the situation and give a better
understanding which can help companies increase their sales.

REFERENCES:
Joanna Fountain, Charles Jame (1998 and again in 2008) Generation Y as young wine
consumers in New Zealand: how do they differ from Generation X?
AnkieHoefnagels, NanneMigchels, SertanKabadayi, Ruth N. Bolton, A. Parasuraman, Thorsten
Gruber, Yuliya Kemerovo Loureiro and David Solnet (2013) Understanding Generation Y and
their use of social media: a review and research agenda
Rodney Graeme Duffett (2016) Influence of social media marketing communications on young
consumers‘ attitudes
Stella Ngozi Anasi (2017) Influence of gender on attitude towards the use of social media for
continuing professional development among academic librarians in Nigeria
Manel Hamouda (2018) Understanding social media advertising effect on consumers‘
responses An empirical investigation of tourism advertising on Facebook
Anita Whiting and David Williams (2013) Why people use social media: a uses and
gratifications approach
Manfred Bruhn, Verena Schoenmueller and Daniela B. Scha ¨fer (2012) are social media
replacing traditional media in terms of brand equity creation?
Alexander Muk (2013) what factors influence millennials to like brand pages?
NiyaziGümüş and DilberNilayKütahyali (2016) Perceptions of Social Media by Small and
Medium Enterprises (SMEs) in Turkey
Uttera Choudhary, Priya Jhamb and Surinder Sharma (2019) Perception of consumers
towards social media practices used by marketers for creating brand loyalty
Eran Ketter and Eli Avraham (2012) The social revolution of place marketing: The growing
power of users in social media campaigns
Dr. Kamini Khanna and Mr. Sujeet Mishra (2011) Social Media as a Marketing
Tool:Opportunities and Challenges

ACKNOWLEDGEMENT:
I express my deepest gratitude to Prof. Sanchaiyta Banerjee (Faculty Guide) and Mohsin
KaziDinware (Industry Guide) for supporting and guiding me throughout the course of this
research, without cooperation and guidance of these people this success would not be possible.

Market Penetration Strategies For Arihant Industries For
The Most Favourable Estern European Countries
Ms. Sayali D. Sawant
MMS II – Marketing
INTRODUCTION
Arihant Industrial Corporation Limited, Incorporated in 1984 has been serving the Indian as
well as the global marketplace with ground-breaking products and services in the Attractions
Industry. They are engaged in manufacturing and supply of Water Park equipment and
Children Play Ground equipment for 3 decades. Arihant has evolved into a one stop solution
for providing comprehensive quality services by designing, manufacturing, and suppling
children playground equipment and water park equipment in India and internationally. They
have exceled in serving the hotels & resorts industry too. Arihant Industrial Corporation also
operates a water park under the name The Great Escape. Each and every member of Arihant‘s
team is highly experienced and believes in teamwork. With the collective efforts of
developing experts, quality investigators, engineers, managers, and associates they have been
able to achieve more than required till date. By having a vast experience of 3 decades, Arihant
has managed to successfully accomplish more than 500 projects in 53 countries. However,
they have finished more than 85 projects in Europe. They have transformed themselves into an
Indian market leader and had also become successful in grabbing a prime position in the
industry with their meticulous planning, designing which is as per international standards
accompanied by commitment to quality and attention to detail. With deep understanding of
the client‘s vision they have rooted themselves in every market they enter. They entitle each
Arihantite as ―Happy Moments Maker‖ who is the mother of fulfilling their purpose ―We
Exist To Create Happy Moments‖. Arihant now aims for a goal of being globally preferred
brand in the world of happiness, excitement and thrill titled as Amusment Industry.

Figure 1: Arihant’s Worldwide Projects
Services provided:
1. Conceptualization: Even though Arihant is a manufacturing company and manufacturing the
required water park equipment is its foremost service to be provided, it offers four
additional services prior to manufacturing. The first one of it is conceptualizing. When a
client comes to Arihant with a moto of building a Water Park Arihant tries to understand the
vision of client and by adding his own skilled ideas and concepts they conceptualize the
entire project in such a way that it not just meets but exceeds the client‘s expectations.
2. Planning: The next service provided is planning, that is conceptualized. This step also
includes market research to understand the market and decide whom to target and then
based on the target market, which slides to be added in the park is planned. Every minutest
need, want and demand of the clients are taken care of. At planning stage, it is ensured that
every product is customized as client‘s every desire, preference and constraints are met.
3. Thematization: This service is a part of planning in which Arihant also offer customized
themes for products. Thematization in nothing but adding a WOW factor to the ride which
makes the entire project look differently. Arihant has capability to transform any slide to
any theme that strikes to client‘s mind.
4. Design: Arihant‘s product designs adhere to international standards (EN 1069: European
Standard which is applicable to all water slides installed in swimming pools of public use
and ASTM: American Society for Testing and Materials). At this stage accuracy, safety and
durability are the three key focus areas of which most care is taken.

5. Manufacturing: The principle service for which Arihant is known for its Manufacturing.
Arihant is 9001:2015 certified. It uses Light Resin Transfer Moulding, also called as LRTM
process for manufacturing the equipment which gives a shiny transparent finish to the slides
on both the sides that lasts for around 10 years. Arihant also manufactures the moulds of
slides on its own. The technologies and machineries that are used by Arihant for
manufacturing the Water Slides are the ones which are followed by industry giants and are
hardly followed by any other player in Indian as well as International Market.
6. Completion and trials: All the manufactured products are installed at the company‘s
manufacturing plant and trails are also executed before installing them at client‘s location to
ensure operation safety before the rides are made open for visitors. Whenever it is possible
for client, they visit the plant during trails.
7. After sales service: The customer service team helps in accomplishing this by competently
assisting the clients in their post installation queries. A periodic service of the slides as well
as second phase development assistance if required is provided without fail.
8. Providing Solution for improving sales: As Arihant also runs a water park under the name
―The Grate Escape‖ they also have a team that always works for grabbing people at the
water park. The same team helps the client who is the owner of park to improve his sales by
studying the targeted market and their behaviour.
Unique selling propositions of Arihant:
1. Unmatched product quality and Advanced technology: Arihant‘s product
manufacturing process is adhering to international standards – ISO 9000:2015, European
Standard which is applicable to all water slides installed in swimming pools of public use
& ASTM: American Society for Testing and Materials. Their both manufacturing units,
one at Vasai and another at Manor, are spread over an area of 360,000 sq. feet are equipped
with modern machinery, tools and techniques. The labs are equipped with Universal
Testing Machines and each of the products follows stringent quality checks. Every product
pass through 3 quality checks that includes two internal and one external. The products are

made with the use of LRTM (Light Resin Transfer Mould) technology. Use of LRTM
technique has various advantages that make Arihant different from its competitors. The
product manufactured with use of latest automated technology ensure premium finish and
accuracy with minimum scope of human error. Provides superior product quality, Gives
perfect tightness and durable, Longer lifetime of the slide, Efficient structure of the slide,
Environment-friendly technology, Stronger and lighter water slides, Easy maintenance.
2. Customization and Theming: Every client is different and special for Arihant. Following
this they try to satisfy every customer, by giving priority to their demand while
manufacturing a product. Hence the idiom you imagine we creates applies to Arihant.
3. Start to end support: Right from conceptualization to installation assistance is provided
and after sales service trails are followed thereafter.
4. Providing Solution for improving sales: No other manufacturing company provides
assistance to a park owner for improving sales. Arihant can provide this service as they also
run a water park therefore a skilled team is allotted especially for this work, which can also
help the park owner.
PROBLEM STATEMENT
Arihant Industrial Corporation Limited is dominating the Indian Market in manufacturing the
Water park equipments. It has done more than 500 projects in 53 countries in the last three
decades. The company has also made a remarkable presence in Europe by completing more
than 85 projects. However, there are various other companies leading the global market place
and are creating a barrier for Arihant‘s growth in the international market. The company wants
to penetrate the Western European market as well and increase in volume in those regions and
win against the international players.
NEED FOR STUDY
Theme parks and attractions will continue growing globally. Thus, there must be many
internal and external driving reasons/factors associated with the success of theme parks and
attractions. Being a manufacturer of water slides, which is the most essential element of this
industry, it is necessary to understand these driving forces well and then come up with

strategies that would help in penetrating the Western European countries.
OBJECTIVES
1. To study and understand the Western European market and find the most favourable
country for penetration.
2. To identify the factors in the most favourable country through SWOT and competitor
analysis which would help Arihant in Market Penetration.
3. To develop strategic ways to penetrate the market identified earlier.
RESEARCH METHODOLOGY
This research is qualitative in nature using exploratory study with secondary data from
Company Websites, Broachers, Catalogues along with Official Government Websites,
Research Articles, Industry Reports, etc. with a comparative analysis of the same.
DATA FINDING AND OBSERVATION
Increasing urban population, international tourism, and rising disposable income of the
countries middle-class population are the growth drivers of water park industry. This research
paper analysis the Western European countries where Arihant is already present, based on the
growth factors, so that the country which is most favourable will be considered for
penetration. The Western European Countries that are considered for research, with the
number of projects completed in the respective country are as follows:
Ireland (1) and United Kingdom (11) - Northwestern European Region
Netherland(2), France(13), Germany(5), Belgium(6), Switzerland(3) - Western Europe &
Spain (7) and Portugal (9) - Southwestern Europe
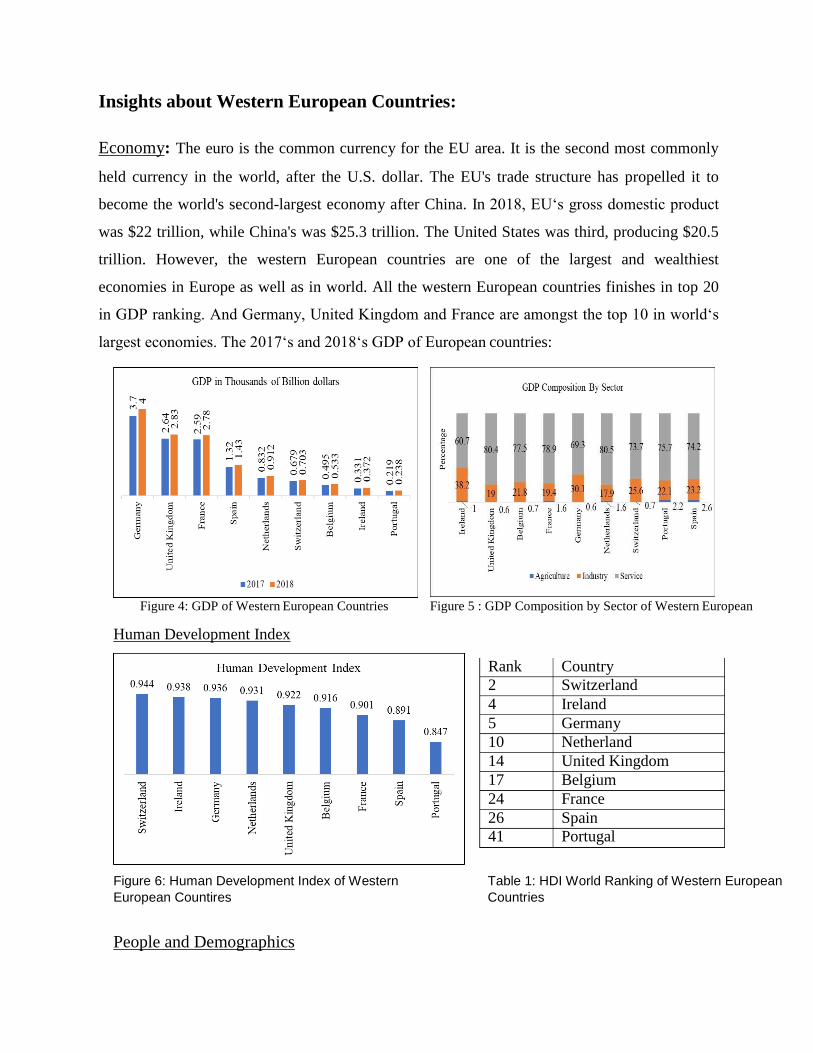
Rank Country
2 Switzerland
4 Ireland
5 Germany
10 Netherland
14 United Kingdom
17 Belgium
24 France
26 Spain
41 Portugal
Insights about Western European Countries:
Economy: The euro is the common currency for the EU area. It is the second most commonly
held currency in the world, after the U.S. dollar. The EU's trade structure has propelled it to
become the world's second-largest economy after China. In 2018, EU‘s gross domestic product
was $22 trillion, while China's was $25.3 trillion. The United States was third, producing $20.5
trillion. However, the western European countries are one of the largest and wealthiest
economies in Europe as well as in world. All the western European countries finishes in top 20
in GDP ranking. And Germany, United Kingdom and France are amongst the top 10 in world‘s
largest economies. The 2017‘s and 2018‘s GDP of European countries:
Figure 4: GDP of Western European Countries Figure 5 : GDP Composition by Sector of Western European
Human Development Index
Figure 6: Human Development Index of Western
European Countires
People and Demographics
Table 1: HDI World Ranking of Western European
Countries

Figure 8: Population growth of Western European Countries Figure 9: Urban Population of 2018 of WEC
Unemployment Rate Household Net-Adjusted Disposable Income
Per Capita
Figure 20: Unemployment Rate of Figure 21: Average Household Net-
Adjusted Western European Countries Disposable Income Per Capita of WEC
Time devoted to leisure International Tourist Arrivals
Figure 22: Time Devoted to Leisure in a week Figure 26: Number of International Tourist Arrival 2017

International Tourism:
Figure 23: Arrivals Share World Wide in Percentage Figure 25 : Purpose of Travel to Europe
European countries welcomed more than 712.6 million international visitors in year 2017, more
than half of the global market i.e. 51% of global market, and 5 of the 10 most visited countries
are European nations.

FINDINGS
In previous sections the Western European countries were analysed based on some
economical, demographical parameters. In the below table, the countries are given ratings
from 1 to 9 based on their ranks among each other (1st ranker has given 9 rating and the last
ranker has given 1 rating). The ratings were then totalled up and the totals are as follows:
Countries/
Parameters
Ireland United
Kingdom
Netherland France Germany Belgium Switzerland Spain Portugal
GDP 2 8 5 7 9 3 4 6 1
Tourism 2 7 4 9 6 1 3 8 5
HDI 8 5 6 3 7 4 9 2 1
Population 1 8 5 7 9 4 2 6 3
Urban
Population 1 7 8 6 4 9 3 5 2
Un-
employment
Rate
5
6
7
2
8
4
9
1
3
Disposable
Income 3 4 5 8 9 6 7 2 1
Leisure
Time 4 2 8 9 5 6 3 7 1
Total 26 47 48 51 57 37 40 37 17
Table 4: Table of Ratings
As per the interpretation of the data analysed in this entire section and the final comparative
table Germany, France, Netherlands, Switzerland, United Kingdom are found to be the most
potential countries for Water park industry followed by Spain and Belgium. Ireland and
Portugal scored very less numbers interprets that these countries are having very less driving
factors necessary for a water park industry. But it can be also interpreted as the top five
countries that these countries local population is capable of visiting a water park as well as
their tourism is also high. Whereas, in case of Spain the tourism is high but the countries
people are not capable hence the ranking went low. And in case of Belgium, tourism factor
has the least rating and the local people also have moderate ratings. Therefore, while thinking
for expanding the market in Western European region Arihant should focus on Germany,
France, Netherlands, Switzerland, United Kingdom and Spain the most. Also, the European
water parks which are in the list of world‘s top 20 parks and water parks are also from these
countries.
The European countries are looked as a potential market for Entertainment industry as they
are densely populated as well as due to increase in tourism, per capita spending, higher
disposable income etc. Within Europe the Western European countries are highly developed
and ranking high in population, GDP, tourism than other European countries. The important
aspect is European countries were always inclined and was enthusiastic about leisure
activities. They love spending time with family, friends and relatives. Therefore, these
countries were already having a very high number of Theme, Amusements and Water Parks.
Whereas, US is the largest and most concentrated market in terms of water parks number.
Every year around 30-35 water parks are built in USA and Canada. All these advancements
that are seen in this industry is first brought up by companies that are situated in USA or
Canada. As of now the developers have realized that the USA market is saturated now and
waterparks in Europe have not evolved and innovated as much as USA‘s over the past 20
years. Therefore, in Europe marketers and park owners are more focusing on expansion of
existing one and adding a water park to their theme park. They are focusing on bringing and
incorporating all the new advancement in European water park market. All market giants are
majorly focusing on Western European market as well as the European marketers are focusing
on local as well as entire Europe. Therefore, a huge competition among the players is being
seen in European Region.
Therefore, it is necessary to know the trends in the industry and the competitors in the higher-
ranking countries as per this study i.e. Germany, France, Netherland, UK and Switzerland so
that based on the insights obtained will be helpful in designing the strategies. This report
therefore further studies Germany which is the most favourable country for penetration.
GERMANY
WATER PARK INDUSTRY IN GERMANY:
―Physical fitness" is a fundamental cornerstone of the German culture. Most Germans do not
belong to a gym and their sports activities are likely to be as part of a club, a Verein, on a

weekly or biweekly basis. In fact, according to the German Sports Federation, one in three
Germans plays sports in a club. A place to this is the Turnverein, which is a tumbling or a
gymnastics club, found in almost any village of Germany. Most of these offer mother/toddler
tumbling classes, gymnastics for boys and girls, and various aerobics classes for women,
swimming, horseback riding, etc. Urban Sports Club is a flexible sports association that
enables one to choose independently between above sports disciplines and venues in 26 cities
in Germany. There are more than 1500 clubs in Germany with swimming pools.
Germans love to swim! Pools are everywhere in Germany - everything from a village outdoor
pool, where children still walk or ride their bikes to spend every possible minute of summer
break with friends, to indoor, amusement park-like pools, etc. Many of them are combination
of indoor and outdoor pools with additional in-house spa facilities. Today, Germany has one
of the most comprehensive spa cultures in Europe. In Germany, regular users of saunas
increased by 6% to 25% over the last 20 years and they have effectively integrated it with
water parks to better customer experience. The Thermenwelt Erding in Munich is the largest
indoor thermal spa worldwide, which is also a waterpark. Thermenwelt Erding, Therme Bad
Wörishofen, Badeparadies Schwarzwald, are some of the biggest spas with water slides in
them. However, Badewelt Sinsheim, Cologne-Euskirchen are also some of the biggest spas in
Germany but these are not having any slides installed within them. There are many such
special spas and saunas everywhere in Germany.
In the list of world‘s top 20 water parks two water parks are from Western European
Countries which is Therme Erding, Erding, Germany and it is at 8th position which showed
13.6% growth in attendance during 2017-2018 taking the number from 1,500,000 (2017) to
1,320,000 (2018). Also, Tropical Islands, Krausnick, Germany is at 17th
place and has shown
2.7% growth in attendance during 2017- 2018 and the changed numbers are 1,200,000 (2017)
to 1,168,000 (2018). Amusement parks are very much popular among Germans. German
theme park operators continue to see the value of developing rides based on popular
intellectual properties (IP) to drive growth and profit. These themed IP attractions, created
around stories and characters from the television shows and movies provide familiar appeal to
park visitors, generate increased visitation, longer stays. Water parks too are having slides
which has some prints on themselves or may be paying a role of a character in a water park.

Along with these a complete water park playing at theme is also evolving in the market. Such
theme-based water parks are now really catching up very fast and are being praised and loved
by people a lot. Water-parks are seen playing catch-up with theme parks in terms of overall
look, feel and theming. Buyers are more sophisticated, wanting to create meaningfully
immersive experiences.
Also, a biggest recent trend that is seen in the German market is that instead of opening a new
water park at totally new location marketers are extending their existing water park and
opening new gate for the theme park which is for water park. So that they will retain their
customers and can satisfy more by giving something more also attracting new customers who
are water park lovers. The temperature in Germany is comparatively lower due to which
indoor water parks are also very popular. Such water park is having a controlled temperature
so that people can enjoy the water park in winter too. Also, some of them are having a dome
shaped Retractable roofs which can be closed in winters and opened in summers. Also, in
some water parks some slides are build in such a way that half part of them is indoor and some
transparent part is outside the park giving both indoor and outdoor experience.
In earlier days hotels and resorts were including just a swimming pool or some may have at
maximum a baby slide or some water spray equipment but now a day if we see German hotels
and resorts, they have included a complete water park within them. Also, camping is a great
outdoor activity that Germans enjoy by buying tents and caravans on rent and staying at a
clam relaxed placed far away from city with natures company. Even this picture is being
changes the camping grounds are also now having a water parks included in them.
The market players are also seen focusing, especially on the integration of technology and
interactivity into attractions. That means the rides will incorporate more media-based elements
such as lighting effects and full-sensory stimuli, synchronised VR and AR displays that
change throughout the ride, 5D cinematic experiences, smart phone integration and interactive
competitions. Slide design will become more complex, as more turns, drops and accelerations
are added. The dynamic waterpark market in Europe provides a host of opportunities.
However, European Waterpark Association insists on the fact that it is useless to copy
concepts already taken. One must stand out in the crowd by risking proposing something
different!

About the competitors present in Western European Countries:
During the analysis of Germany with respect to competition it is found that the market is
majorly being served and dominated by three major manufacturing companies which are
White Water, Canada, Proslide, Canada and Poline Waterparks, Turkey. These three
companies not only have their presence in Western European countries but also have a
remarkable present in overall world. Along with these market giants 18 other companies were
found to be serving the market place. After analysing all the competitors, they were divided
into two categories category 1 major competitors‘ category 2 minor competitors and all falling
in one category were judge on same parameters.
The major competitors are having a wide range of products and more importantly different
product line except the traditional slides. All the major competitors are having their unique
identity with respect to the products that they are offering to their customers. Every company
out of the three have done their own nomenclature for their slides, they have many
trademarked slides too. White water has given a unique icon to each of their slides. They have
a smaller version of their every slide for the kids as the slides designed for youth may be
dangerous for them. That proves that they are taking caking care of children‘s health as well
as caring for their emotions and happiness. Their recent development of the rotating slide is a
very big advancement in the industry as never before a rotating slide was built. They have
water adventure play, wave pools and surfing and has given their own touch in the sub
categories of these that makes them different form others. Proslide at the other hand have
trademarked they‘re each and every slide, and Poline have a section of Poline Game
Technologies. However, even these two have multiple categories of slides given birth to again
number of sub categories which have their own flavour. The manufacturing technology, the
basic formula of a slide, the moto is all same for all companies. All have integrated the latest
technologies with their products even though they are different form each other and they are
always taking steps to differentiate among each other and other competitors in the market,
letting no one cross them and no new member to enter in the market, No one is following any
other and no one is copying any other. And therefore, they have their own market place and
their own followers. White water is still little ahead of the other two as their creativity, that
they have shown in their product line, the network that they have built proves it all.

SWOT ANALYSIS
SWOT Strength
S1 Theming
S2 Provides Solution to
client for increasing sales
S3 Manufacturing Process,
safety std.
S4 Clients are invited at
manufacturing plant
Weaknesses
W1 No overseas sales office,
small network of suppliers
W2 Lacking in digital marketing
W3 Narrow product Line
W4 Less integration of
technological trends with products
Opportunity
O1 No. of attendees at water
park, Hotels and resorts is
increasing in Germany
O2 Expansion programs in
existing Water, Theme and
Amusement parks and
camping grounds.
O3 Toddlers and Differently
abled peoples also visits water
parks
O4 Number of Spa centres and
clubs are present in Germany
SO Strategies
WO Strategies
Threat
T1 Excited and adventurous
customer
T2 Long lasting product, Last
for 10-12 years.
T3 Client judges the past
projects
T4 Proactive and creative
competitors as well as new
entries assimilates things
faster.
ST Strategies
WT Strategies

LIMITATIONS
1. This research doesn‘t consider cost factor.
2. The data was completely secondary because of which there was a limitation in getting
the actual picture of the market, competitors etc.
3. It is very difficult to understand the developer of a park in the region as the park‘s
website doesn‘t have such information.
FUTURE SCOPE
All other Western European Countries as per ranking need to be analysed for penetration. As
well as every country can be analysed state, city or province wise on the bases of all the
factors used in this research. By dividing a country in smaller parts will give more detailed
picture of the existing competitors in the market, existing number of water parks, entities
needing renovation, expansion, which will give a potential market that has been skipped by
competitors. It will also be helpful to implement strategies suggested in this research paper.
CONCLUSION AND RECOMMENDATION
1) SO Strategy:
S1O2 Strategy: Theming, One of the major strengths
One of the major Strength of Arihant is they are very aggressive in theming. The opportunity is
that the market is showing continuous growth also during the market study it is seen that at all
possible venues a water slide is installed
S3O3 Strategy: Happiness for all:
In western European market a waterpark is having slides and pools for people of all segments.
They also have small pools and slides which are for toddlers and kids. Along with these they
have separate pool for differently abled people too.
2) WO Strategy:
W1O1 Strategy: Having sales office overseas:

Looking at all various opportunity it is necessary for Arihant to have sales offices present in
one of the potential markets. Staying overseas Arihant can‘t understand customers‘ needs and
wants and even can‘t address them as quickly as someone who is close to them.
W3O4: Hotels and Resorts with smaller pools
Arihant‘s current product line consists of mostly traditional slides they have not integrated
water slides with technology yet. Therefor such slides can be installed at hotels and resorts
which have bigger swimming pools or have place for expansion and don‘t want to develop it
entirely as a water park but are interested in installing few slides.
3) ST strategy:
S3T4 Strategy: Memberships
Arihant is one of the founder members of The Indian Association of Amusement Parks and Industries
(IAAPI) and an active member of The International Association of Amusement Parks and Attractions
as well as world water park associations.
4) WT strategy
W2T4 Strategy: Digital Marketing
While targeting a market that is overseas and can‘t personally come and check what a company has and
what a company can do. In such cases a company should have a very appealing website.
W4T1 Strategy: Innovation is the Key
Be it any industry, today‘s customers want to see new things each day. Customer‘s both expected and
unexpected needs and wants are fulfilled by the marketers. Whereas, when it comes to leisure products
and more over amusement industry people wants something that will amaze them and manufacturers
are doing so by manufacturing something new that now one has done yet.
W3T2 Strategy: Inflatable Slides
In western European countries the places where there are small lakes and ponds are also developed for
leisure activities and such places are converted into water parks. It‘s a little different to the usual water
park experience, too. It‘s not all brightly-coloured half pipes and lazy rivers, this is more like a giant,
inflatable, floating, bouncy obstacle course.

REFERENCES
https://study.com/academy/lesson/the-economy-of-europe.html
http://worldpopulationreview.com/countries/#popTable
http://hdr.undp.org/en/data
https://data.worldbank.org/indicator/ny.gdp.mktp.cd
https://www.thebalance.com/what-is-the-european-union-how-it-works-and-history-3306356
https://wikitravel.org/en/Europe
ACKNOWLEDGEMENT
In the preparation of this internship report, I would like to acknowledge my faculty guide, Prof.
Jackson John, for his co-operation and inputs throughout the course of this project. It was
largely due to his help, support, esteemed guidance and encouragement that this project could
take shape and be completed. I thank him for giving direction to this project and imbibing in an
organized approach towards tackling the relevant problems.
I am thankful to Arihant Industrial Corporation Ltd., Marketing Division, Andheri for
giving me an opportunity to get familiarised with Marketing operations and overall functioning
of the business. I would, in particular, like to thank the staff of Arihant Industrial Corporation
Ltd, Marketing Division for their co-operation and help during my training period.
I express my deepest gratitude to my industry guide, Mr. Nilesh Mistry– Chief Marketing
Officer for his constant support and valuable guidance towards the project.

Negative Influencing Factors Affecting Customer Buying Behavior
in Regards to Real Estate / Property in the Western Suburbs of
Mumbai (Bandra to Dahisar)
Mr. Dinto Antony Chungath
MMM III – Marketing
INTRODUCTION:
The real estate market has been a considered as one of the most important aspect of an individual concerning
his / her lifestyle. For a consumer, the process of selecting a home has always been a complicated process,
whether is it for self-use or as an investment. There hasn‘t been a clear system or a procedure for a consumer
through which one identifies his / her home as the one. The consumer usually faces a number of problems /
fears while buying a property, through this thesis, I am trying to identifies the major negative contributing
factors which affect the buying behaviour of the consumer.
BACKGROUND:
The aspect of real estate also known initially as royal estate, started with the introduction of the printing
press, the industrial revolution, before the printing press the land as a resource was considered the property
of the princely states or under a monarchy system, the monarch used to share the piece of their land to the
public for development. The Printing press and the technology requirements made the need for large scale
industrial setups, which later generated the need for labour housing schemes around the industrial setup. The
need for these Housing schemes gave birth to the aspect of real estate. The later then was classified as per
the requirements based on the users generated over the period of time, Industries created jobs , which
created labour, creating homes, homes generating family income needed grocery and other products which
created commercial shops etc, Large settlements generated need for larger demand, which created the idea
of whole seller between farmers or manufacturers to consumers, which lead to real estate of warehousing
and more industries. The Following thesis is been conducted only for Residential Category of users
pertaining to the city of Mumbai
Mumbai (originally Known as Bombay) was a set of seven islands, situated on India‘s west coast was
originally developed as a port, a centre of trade between the west and the east. Geographically, Bombay was
not suitable to be developed as a centre to hold a large population as it had a limited land as a resource.
Bombay was later transformed by the British by converting these seven islands into one land form to be the
present known city of Mumbai. With the Boom of Textile industry later the Entertainment industry and the

now Financial District, a large number of migrations has been observed from the 1860‘s onwards and now
holds around 1.8 crore population according to 2011 census. With respect to the rising Population and real
estate property, development control regulation came into effect stating Development Control Regulation for
greater Mumbai – 1972. Over the period various new regulations were added upon and changed to fulfil the
ever-changing requirements of the city, The Latest Known Regulation followed today is the DCPR 2034 for
Greater Mumbai release in the year 2016.
NEED FOR STUDY:
The Real estate market of Mumbai has faced major 3 storms
in the present Decade, the first being Demonetization,
November 2016. The real estate market leaders (developers
and builders) depended on the speculators (Hundi system)
and their bonds, as they would buy a large amount of area /
property through cash or bonds and then sell it to the
concerned consumer for a large price attaining huge
margins. With the demonetization, the hundi system was out
of the market, the developers now had to directly look out
for their investment directly from the consumers. For the
first time, the developers now had to lookout for the interest
of the consumers. The adverse effect the demonetization
had, was on the resale market, as shortage of cash was been
observed, the property value in the resale market had almost
crashed, which created a domino effect over the new
properties being built.
Development Control and Promotion regulation for greater Mumbai (DCPR 2034) and the Real Estate
Regulation Act (RERA) 2016, has been the two major changes in the regulation reform which has
terraformed the real estate market completely. A transparent system has been setup which helps potential
customers to know the real time status of work and its financial and legal counter parts. A costumer can
identify when the project deadline is, how many flats are occupied, booked or vacant, the parking and other
amenities. Thus, with the age of information inside the palm of an individual, the costumer has truly become
the king.
Goods and Service Tax, which came into force on 1st April 2019, created a differential tax system. The GST
for affordable housing has been lowered down to 1%, while for other projects the GST is at 5%. In Case of
Flats purchased under construction period, 12% GST is applicable, until Occupancy Certificate of the
premises has been issued by the Concerned Authority. However, in most cases, the benefits of Input Tax

Credit were not passed on to the consumers by the developers, thus the change in pricing methodology has
been unchanged, post occupancy.
With Demonetization, New Regulation on Real Estate and New taxation norms, the developer now has a
symbiotic relationship with the home buyers today. Hence it is has become more important to understand the
consumer needs and their buying behaviour with respect to real estate.
OBJECTIVES:
The purpose of the paper is to present partial results of a survey conducted in Mumbai suburban region
(Bandra to Dahisar) of Mumbai City, India. Its aim is to understand the negative influencing factors, other
than the positive attributes responsible for a possible sale output.
To understand the dynamics of these negative factors effecting customer‘s attitude towards buying property
three major questions need to be asked: the why, the whom and how?
The objectives of the study are
To identify the gap between consumers‘ willingness to buy and actual sale acted upon.
Where does this gap exist over the demographics of the consumers?
What contribute to this gap and identify the factors responsible for the gap?
LITERATURE REVIEW:
The Literature reviewed enlists various factors of purchase decisions influenced by the various determinates
in the real estate. The extensive survey of available literature which were examined from a wide range of
journals, research papers, newspaper articles, real estate consultants and other similar sources. The
Literature reviewed various factors such as Price, Location, Amenities, Aesthetics, Neighbourhood Factors,
Attitude, Subject Norms, Perceived Behavioral Control, Intentions, Income, Project Delivery Time,
Confidence Emotion, Intuitional, Socialization, Optimism, Self-Attribution Bias etc
Other factor reviewed based on Online Journals and newspapers are :
Loss of Confidence in Real Estate
(https://www.hindustantimes.com/mumbai-news/over-5k-mumbai-homebuyers-cheated-of-rs-3-683-cr-in-
frauds-since-2016/)
Job Insecurity
(https://economictimes.indiatimes.com/wealth/earn/how-to-manage-your-finances-and-get-your-career-
back-on-track-on-losing-job/articleshow/56151700.cms)
Negative ROI
(https://www.morningstar.in/posts/54373/whats-causing-slow-real-estate.aspx).
Unfavourable Loan-to-value Ratio
(https://www.morningstar.in/posts/54373/whats-causing-slow-real-estate.aspx)

High Taxation on Under-construction Homes
(https://www.morningstar.in/posts/54373/whats-causing-slow-real-estate.aspx)
RESEARCH METHODOLOGY & APPROACH:
The study will investigate the negative factors influencing Mumbaikars while purchasing real estate. The
study examines the effect of attitude, perceived fears and demographics on the intention to purchase real
estate. Taking into consideration that demographics as a moderator, a total of 100 questionnaires were
distributed to respondents in Mumbai, through various method i.e. online google based survey and offline
face to face interview through various passengers. The questionnaires made for Mumbaikars consists of two
main components, the 1st section asks about the respondent‘s demographics and the 2
nd section consists of
asking about theirs attitude and behavioural attributes. A five-point Likert scale is been used ranging from 1-
Strongly Disagree to 5-Strongly Agree to examine the effect of attitude and perceived fears on the intention
to purchase real estate.
The Data has been collected from the region of study in the month of October 2019.
Demographical qualifiers for Data Collection:
Population for this study people living in Mumbai and who are above 24 years old. The sample selected are
random and are being distributed directly to the respondents strategically based on location.
The Respondents have been purely on the basis of convenience with an intention to obtain completed
questionnaires quickly and efficiently.
Variable factors asked in the questionnaire are: Age Group, Location, Intention of Purchase, Willingness to
buy, Self-esteem, Trust issues, Tolerance, Investment Opinion, Market Fluctuations, Awareness, Biased
Opinions,
Price and Premium.
OBSERVATIONS & INTERPRETATIONS:
It is been noticed that the trust as an issue is irrelevant for 42% of the respondents, which may be due to the
increase in awareness and other activities, one tends to spend before finalizing a property. With the
increasing market instability and fear of joblessness, almost the decision-making effecting ones buying
behaviour is affected
Around 63% of respondent‘s decision making gets affected due to the overall market instability and the fear
of job loss. However, 12% of respondent‘s decision making does not gets affected due to the market
fluctuation. The differential statements may exist due to the difference in the source of funding the project,
which could be self-funding or private loan or bank loan or through resale of the previous property or shares
and bonds.
Around 61% of the respondents expect a positive return on investment over a short course of time.
Comparing the trends of expectation from region to region, respondents from Andheri To Bandra is greater
with respect to other regions, it might be due to the high investment cost over these regions. Around 47% of
the respondents do not mind paying premium and wish to acquire the property without waiting for a long
time for projects to get completed.
As observed above, trust factor and project delay effects one‘s buying preference, consumers consider
buying a property ready to move in ow, rather than getting under the struggle of bank loan and rentals. As
most of the respondents are looking for a home to reside (self-use), consumer may think that rather than
spending on rentals, it‘s better to spend on the premium, and acquire the home in the present tense rather
than wasting time and money. And avoiding the feeling of homelessness.
By comparing the statistics between the trust factor variable and Awareness Variable, a similar kind of trend
can be observed with regards to the respondents interested in buying a property in Andheri to Vileparle.
A consumer‘s Mistrust, Delay in project and Kind of investments all are been determined by Knowledge of
the Project, RERA has been able to fulfil consumers requirements to most extend in making them aware of
the project status and all other related details.
Around 63% of respondents have being using RERA provided data to help them in their decision-making
Process.
As observed before, 11% of Respondents are not worried about market fluctuations and 13% of respondents
trust their builders and agents, similarly a 11% of respondents do not rely on RERA data, which can also be
interpreted as they trust their developers and their agents completely
However, few regions show a varied characteristic as mentioned below:
Dahisar to Kandivali:
Trust Factor is extremely low in the region from Dahisar, Borivali and Kandivali. Willingness to buy a
property comparably is high in the region of Dahisar to Kandivali. This may be due to the intention of
purchse, maximum respondents in the survey of this region have shown an interest to purchase a property
for self-use, rather than just investment purposes
Malad to Jogeshwari:

Respondents interested in property of Malad, Goregoan & Jogeshwari show a high willingness to purchase
property, but haven‘t been able to finalize on one yet.
Respondents intending to buy a property in these regions are buying with a primary intention of self-use.
With its vicinity just 15 – 20 mins from the commercial hub and high differential communal bases, these
regions show a high level of interest in residential as well as commercial convenient shopping premises also.
Andheri to VileParle:
Respondents interested in property of Andheri to Vileparle show a high level of interest in buying a property
but also show a high level of discomfort in buying property in the present scenario.
These Respondents are purchasing a property with an intention to use it as an investment rather than just
self-use, which maybe because Andheri is an upcoming commercial centre, with its vicinity to airport.
Tolerance level among the respondents is at extremes than the rest.
Around 47% of the respondents think that the builders or their agents are biased towards having consumers
based on socio-economic basis, Unbiased Opinion directly leads high consumer enquiries also. These factors
directly affect the trust variability of the developers and their agents.
Santacruz to Bandra:
Respondents interested in property of Santacruz, to Bandra show a reasonable low level of discomfort with
investment in property
Although majority of the respondents show a high sign of mistrust upon builders and their agents, a
considerable positive side in seen these regions.
However, they show absolute almost no tolerance in the matter of Delay in Project.
-Ve Factor Contribution 10
0
90
80
70
60
50
40
30
20
10
0 Dahisar - Borivali - Kandivali
Malad - Goregoan -
Jogeshwari
Andheri - Vileparle
Santacruz - Bandra
Attitude Trust Tolerance Market Instability ROI Biased Opinion

Data Analysis
Reliability Test:
The Reliability test of the data acquired as a Alpha value above 0.50, which can be considered permissible
for further analysis, however a 0.70 is an appropriate value for further analysis, which would have been
achieved with a seven point Likert Scale.
Willingness to buy 40
35
30
25
20
15
10
5
0
Dahisar - Borivali - Kandivali
Malad - Goregoan Jogeshwari
Andheri - Vileparle
Santacruz - Bandra
Willingness to buy

Pearson’s Correlation Matrix
Attitud
e
Intenti
on
Trust Delay Mark
Et
ROI Premiu
m
Awa
re
Optimis
m
Will
Attitude 1 -.168 .252*
*
-.016 .135 -.064 -.035 -
.217*
.092 -
.220*
Intentio
n
-.168 1 -.023 .004 -.174 .080 .132 .067 -.112 .065
Trust .252**
-.023 1 .294*
*
.287*
*
.088 .036 -.001 .210* -
.311*
*
Delay -.016 .004 .294*
*
1 .298*
*
.452*
*
.079 .368*
*
.182 -.050
Market .135 -.174 .287*
*
.298*
*
1 .085 -.099 .062 .268**
-
.379*
*
ROI -.064 .080 .088 .452*
*
.085 1 .162 .590*
*
-.147 .271*
*
Premiu
m
-.035 .132 .036 .079 -.099 .162 1 .320*
*
.101 .159
Aware -.217* .067 -.001 .368
*
*
.062 .590*
*
.320**
1 .022 .261*
*
Optimis
m
.092 -.112 .210* .182 .268
*
*
-.147 .101 .022 1 -.154
Will -.220* .065 -
.311*
*
-.050 -
.379*
*
.271*
*
.159 .261*
*
-.154 1
Significance Value (two tailed): above 0.20

(Note: The Matrix is been analysed by rejecting the data below the age group of 23 and also rejecting
the data of respondents whose are of interest is not under the region of study.
So Total No of Respondents Qualified for analyses = 109 respondents)
OBSERVATIONS:
The Highest level of significance is observed (.590) between awareness and return of Investment.
Which we can interpret as respondents with an investment intention check all data under the RERA
before taking a decision.
Significant factors effecting Willingness to buy the most are Attitude of purchase, trust Market
Instability, Return on Investment and Awareness of the Project.
It can also be observed that Trust of the developer is depend on various factors such as Delay in project
competition, Opinion of biased Builders, Attitude of purchase. Intention of purchase whether it is for
self-use or investment or both, does not have any significance of other variables.
Factor Analysis
Deducted Factors are as follows:
Risk (Explains 26.10% of the Variance)
Insecure (Explains 24.62% of the Variance)
Price (Explains 14.36% of the Variance)

LIMITATIONS:
The No of respondents involved in the sample study is comparatively low than required, however it is
able to provide a framework for futher scope into the topic.
Maximum respondents in the survey are under the age group of 24 – 34 years old and under 35 – 54.
The study does not take into consideration the funding matrix of the respondents, whether it is self-
funded or private loan or bank loan. However, 56.6% of respondents have enquired for loan to check
their eligibility, however the Financial mixtures also plays an important role.
Study is divided upon various regions based on their differential RR rates; however, few rarer cases do
exist, which may have not been considered.
Various Other Limitations are as Follows:
Unproportionate number of respondents among the region of study.
Category of project types not a part of study.
Economic status of Respondents.
Neighbourhood Factors and Social Political Factors.
Amenities, Aesthetics and lifestyle as a factor.
Differential RR rates from Plot to Plot.
CONCLUSION:
The Study can be used to develop a developer‘s image and decision making, whether in making the
project phrase wise or try attaining full commencement certification from the concerned authorities.
Major trust factor if achieved by the developers, then the attitude of consumers is going to change
remarkably. This research paper establishes among the survey taken that consumers‘ willingness to
purchase is restricted by a number of variables.
As Mahatma Gandhi Rightly Said ―A customer is the most important visitor on our premises. He is
not dependent on us. We are dependent on him. He is not an interruption of our work. He is the
purpose of it. He is not an outsider of our business. He is part of it. We are not doing him a
favour by serving him. He is doing us a favour by giving us the opportunity to do so.”

REFERENCES:
(property.magicbricks.com/microsite/buy/propindex/mumbai.html)
(https://www.hindustantimes.com/mumbai-news/over-5k-mumbai-homebuyers-cheated-of-rs-3-
683-cr-in-frauds-since-2016/)
(https://economictimes.indiatimes.com/wealth/earn/how-to-manage-your-finances-and-get-
your-career-back-on-track-on-losing-job/articleshow/56151700.cms)
https://www.morningstar.in/posts/54373/whats-causing-slow-real-estate.aspx
Knight Frank‘s India Real Estate
Factors influencing home-purchase decision of buyers of different types of apartments in India
Research on Determinants of Property Purchases - IJITEE (2019)
Positive impact of real estate act, 2016 on developers with reference to Sivaganga district,
Tamil Nadu
Rational and Irrational Factors affecting real estate‘s buying Behaviour of Different
Nationalities with special reference of Dubai: A Survey (IJBQEAMR)
Housing Ownership decision Making in the framework of Household Portfolio Choice
ACKNOWLEDGEMENT:
I am using this opportunity to express my gratitude to everyone who supported me throughout the
project. I am thankful for their aspiring guidance, invaluably constructive criticism and friendly advice
during the project work. I am sincerely grateful to them for sharing their truthful and illuminating views
on a number of issues related to the project.
I would also like to thank my project guide Prof.Subhashini Naikar and Dr. G. Ramesh who gave me
the encouragement to complete the project and supporting throughout the project.

A Study on Employees Perspective about engagement
practices and measuring Engagement Level at Unitile India
Ms. Danica Ernestine Lobo,
PGDM II - HR
INTRODUCTION:
Employee Engagement is a workplace approach where the right conditions are created by the
organization for each employee that allows them to make the most of each day and gives them a
sense of purpose and commitment to the organization. Every employee is motivated and
emotionally invested in the organization and therefore gives their best.
David Mcleod once said, ―This is about how we create the conditions in which employees offer
more of their capability and potential.”
Employee engagement is one of the hottest HR trends for 2019. Employee engagement is
described as the enthusiasm that employees feel with regards to their work. Engaged employees
are more inclined to go the extra mile for their organization. Engagement is when employees
work and express themselves in a physical and emotional manner.
Engagement is an important function of Human Resources as it enables the highest performance
levels, gives meaning to the employees working in an organization and influences the attrition
rates in an organization. Engaged employees become ambassadors of the organization. They are
motivated and encouraged as they feel that their efforts are contributing to the success of the
organization and are challenged to use all their abilities at work.
Employee engagement is often misunderstood by both employees and senior management. It is
often looked upon as boring, unnecessary and a waste of time. This study aims to understand the
perspective that the employees have regarding the engagement activities that are carried on at
Unitile and to measure the engagement level based on Herzberg’s Two Factor Theory.
NEED FOR STUDY:
Employee engagement activities were not as frequently conducted at Unitile as they are now.
Only major festivals and national observance days were conducted one day prior.

These activities are gaining importance in this organization for three major reasons:
The Company wants to portray a positive workplace environment for prospective
employees and other stakeholders.
There exists employee turnover as over 7 people have left the organization in a span of 6
months.
The new HR Manager is looking to interact with all the employees as the current
observation is one of the closed-off teams and lack of inter-department communication.
Generally, employees feel that these engagement activities are a waste of time and often just
something that HR has to do for the sake of doing it.
The need of this study is to find out the level of engagement that these activities have on the
employees at Unitile, what are the underlying problems, if any and what do they expect from
these engagement initiatives.
OBJECTIVES:
To study the perception of employee about employee engagement
To apply Herzberg‘s‘ Motivation Theory to measure the level of engagement at Unitile
To analyze the feedback of events conducted for further improvements.
To design employee engagement events at Unitile
RESEARCH METHODOLOGY:
Type of Research
Descriptive – Descriptive research is defined as a research method that describes the
characteristics of the population or phenomenon that is being studied. This methodology focuses
more on the ―what of the research subject rather than the ―why of the research subject.
The research involves studying the current level of engagement among the employees and what
are their expectations of the same.
Exploratory Research – As the name suggests, exploratory research is conducted to explore the
research questions and may or may not offer a conclusion to the research conducted. It is
directed to handle new problematic areas which haven‘t been discovered before. Exploratory

Research lays the footing for more definite research and data collection. This research aims to
study the employee‘s attitude towards the current engagement activities taking place in the
organization. The data collected cannot be easily analyzed numerically.
Based on research design this research can be classified as exploratory research as it is
investigative in nature and topic-specific. It relates to employee engagement alone and cannot be
applied in other aspects of Human Resource or otherwise.
• Sample size -55 out of 120 white-collar employees
• Sampling Technique -Non-Probability – Judgement / Purposive
• Data collection - Primary data and Secondary data
• Data Collection Tool -Structured Questionnaire
Applying Herzberg’s Two Factor Theory on the Four Levels of Engagement
The Four States
In a general sense, there are four states an organization or team can find themselves in when it
comes to Two Factor Theory.
1. High Hygiene and High Motivation
This is the ideal situation and the one which every manager should strive for. Here, all
employees are motivated and have very few grievances.
2. High Hygiene and Low Motivation
In this situation, employees have few grievances, but they are not highly motivated. An example
of this situation is where company policies and the work environment is favorable but the work
isn‘t very interesting.
3. Low Hygiene and High Motivation
In this situation, employees are highly motivated but they have a lot of grievances. A typical
example of this situation is where the work is challenging and really interesting but the pay scale
is below industry standards.
4. Low Hygiene and Low Motivation
This is a bad situation for an organization or team to find itself in. Here, employees aren‘t
motivated and the hygiene factors are not up to mark.

The Four Levels of Employee Engagement
There are four levels of employee engagement as identified by Effectory, Europe‘s leading
provider of employee engagement solutions. They facilitate some of the world‘s biggest
employee survey programs in over 35 languages across 70 countries. These levels are
responsible for affecting your organization's business outcomes in various ways -
‘Engaged and committed'
These employees consider the organization‘s goals as their own and commit to their work. They
love their work and are emotionally attached to the organization.
‘Engaged but not committed’
Employees who engage in their labor but are not devoted to the organization and vice versa.
These are people who like their job but aren‘t motivated to actually perform the tasks.
'Neither engaged, nor committed'
They are neither engaged in their labor nor devoted to the company. They are neither
emotionally attached to their work or the organization.
'Actively Disengaged’
These are employees that detest their work and try to create a negative atmosphere in the office.
They can also hamper the productivity of high performing employees.
DATA ANALYSIS:
• Perspective – 33 Productive, 16 Fun
• Frequency of events – Once a month
• Neutral and disagree responses below 25% - Work challenges, job requirements, growth
opportunities, belonging, information from leaders, a great place to work
• Neutral and disagree responses above 25% - Recognition, freedom to take decisions,
achievements, job security, approachability of superiors, pay structure
• Greater the expenses, greater the satisfaction
• The more the planning and efforts are taken, the less popular
• Concerns regarding the participation of employees and refreshments provided

FINDINGS:
Of the 55 respondents, 33 employees viewed engagement activities as productive, 16 viewed it
as fun whereas a total of 6 employees perceived engagement as unproductive and boring. In
terms of any change in the quality of events, an equal number of respondents were indifferent to
any changes there may or may not have been, an equal number of employees agreed there was a
change whereas the remainder felt there was no change.
Currently, there are activities practically every week in a month. In terms of frequency of these
events, 21 employees wanted them to be held once a month and 16 felt they should take place
once in three months. The remaining respondents were divided between having engagement
activities occasionally or twice a month.
A total of 46 respondents felt that their work challenged them to perform better, 41 respondents
believed that had everything required to do their jobs effectively while 43 employees agreed that
there are growth opportunities in the organization. Employees have a sense of belonging at this
organization with 42 of them agreeing with this statement whereas 13 respondents did not share
the same sentiment. Almost all respondents felt that the leaders and top management kept them
informed about the happenings of the organization. While employees are recognized and
appreciated here, 17 respondents did not feel the same or were indifferent. When it comes to
freedom to make decisions regarding their work, 30 respondents felt they were given freedom
though 18 respondents were neutral about the fact. 34 respondents felt that all employees‘
achievements were celebrated while 21 respondents were neutral or did not agree. Job security
and self-belief in an employee‘s capabilities is something that 38 of respondents agreed to in the
survey. 39 respondents believed that their HR and HOD were approachable in terms of
difficulties faced and working conditions issues. 31 of the 55 respondents were either neutral or
disagreed with the adequacy of the pay structure and benefits that were provided to them.
Considering all things, the majority of the employees would recommend this organization as a
great place to work.
LIMITATIONS:
Strength of workforce – As there are only 120 white-collar employees within the
organization the sample size is restricted.
Co-operation from employees – Several reminders were given after individual emails were sent to all employees. Even then responses to the survey were sluggish.
Scattered workforce – Personal interaction was limited to only the employees at the Head
Office.
Hesitation to respond – Many of the employees were hesitant to respond as they felt the information would be shared with the HR department. This also possibly lead to a
skewed response.
Family-run organization – Chances of personal bias may occur that cannot be avoided in
these types of organizations.
FUTURE SCOPE:
Employee Engagement should not be looked at as a trend that comes and goes but as a
vital function ingrained in Human Resource Management.
Between millennials constantly jumping from job to job and the senior employees with
their traditional mindset of how work should be carried out, the engagement process must
be updated on a regular basis to capture the attention of these segments.
Engagement should not be looked at as a routine activity conducted by HR but as
something deeply engraved in the organization‘s culture.
RECOMMENDATIONS:
Reduction in the number of events – Ideally there should be an engagement activity at
least once a month. The purpose may be either educational, fun, wellness or social
responsibility. As feedback is collected after every activity, it is cumbersome for
employees to fill out feedback forms continuously.
Personal Interaction with all branches – While communications are sent to all the
branches it would be preferable that HR personally meet with employees from other
branches in a formal manner and discuss their grievances if any.
Increase in Motivational factors -While there appears to be a good balance between
hygiene and motivational factors at the workplace it would be better to encourage more
motivational activities like celebrating employees achievements, professionally and
otherwise, freedom to make more decisions regarding work and attention to not only the
employee but their families as well.
Awareness behind the motives of Employee Engagement – Despite defining employee
engagement, employees still had doubts as to what it meant. All employees including top
management need to understand the purpose of these activities. Often managers
discourage their team from participating because their task comes first and they are more
concerned with the repercussions of keeping their task on hold.
CONCLUSION:
Employee engagement is here to stay and with that being said it is important for HR to
understand this concept clearly and communicate the same to their employees. This
communication can bridge the gap between employers and employees.
Pay structure is often a factor to the attrition rates in organizations and is unfortunately not a
situation that can be easily changed. If employees are made to feel valued and important in the
organization and are given a voice, they would be less inclined to leave even with the pay they
currently receive.
Attention needs to be given primarily to the current workforce demographic of millennials who
are looking to make a quick buck in a more relaxed work environment. Engaging these
employees to be more loyal to an organization is the current challenge for any HR.
This research shows that even though the employees here at Unitile are currently Engaged and
Committed, nothing is set in stone. In this VUCA environment, HR cannot afford to be

complacent and should constantly be on their toes to find innovative and inspiring ways to keep
the current workforce engaged. Ultimately it‘s about the human touch in Human Resources.
REFERENCES:
https://www.effectory.com/knowledge/themes/what-is-employee-engagement/
https://engageforsuccess.org/what-is-employee-engagement
https://expertprogrammanagement.com/2018/04/herzbergs-two-factor-theory/
https://blog.vantagecircle.com/employee-engagement-concept-re-defined/
https://hbr.org/2016/08/the-dark-side-of-high-employee-engagement
The 2012 International Conference on Asia Pacific Business Innovation & Technology
Management, Pattaya, Thailand
Individual Factors and Work Outcomes of Employee Engagement Ologbo C. Andrew a, Saudah
Sofian b, a and bFaculty of Management and Human Resource Development, Universiti
Teknologi Malaysia (UTM), 81310 Skudai, Johor, Malaysia
Study on Employee Engagement Level
Dr Reeves Wesley J Professor, VIT Business School, VIT University – Chennai Campus,
Chennai –600 127. (T.N.), India. & Gokula Krishnan S Research Scholar, Karunya School of
Business, Leadership & Management, Karunya University, Coimbatore – 641 114. (T.N.), India.
www.theinternationaljournal.org > RJSSM: Volume: 03, Number: 07, November-2013
Developing and Sustaining Employee Engagement: The Strategic Perspective in Telecom
Company
Surekha Rana Gurukula Kangri Vishwavidyalaya, India Priyanka Chopra Gurukula Kangri
Vishwavidyalaya, India. Title: Management techniques for employee engagement in
contemporary organizations / Naman Sharma, Narendra Chaudhary, and Vinod Kumar Singh,
editors. Description: Hershey, PA : Business Science Reference, [2019] Identifiers: LCCN
2018036411| ISBN 9781522577997 (hardcover) | ISBN 9781522578000 (ebook) Subjects:
LCSH: Employee motivation. | Personnel management. Classification: LCC HF5549.5.M63
M355 2019 | DDC 658.3/14--dc23 LC record available at https://lccn.loc. gov/2018036411
DOI: 10.4018/978-1-5225-7799-7.ch009

Engaging for success: Enhancing performance through employee engagement
A report to Government
David MacLeod Nita Clarke
Department for Business, Innovation and Skills www.bis.gov.uk
First published in July 2009. Crown Copyright. BIS/Pub 8859/07/09NP. URN09/1075
Rochester Institute of Technology RIT Scholar Works
Presentations and other scholarship
2008 Fostering Employee Engagement: A Critical Competency for HR Practitioners Donna
Dickson Rochester Institute of Technology
Int. J. Human Resources Development and Management, Vol. 18, Nos. 1/2, 2018 5
Copyright © 2018 Inderscience Enterprises Ltd.
Enablers of employee engagement and its subsequent impact on job satisfaction
R. Monica* and R. Krishnaveni Department of Management Studies, PSG Institute of
Management, Coimbatore-641004, Tamilnadu, India Email: [email protected] Email:
[email protected] *Corresponding author
Intrinsic Motivation at Work: What Really Drives Employee Engagement, Second Edition by
Kenneth W. Thomas. Published by Berrett-Koehler Publishers. Copyright © 2009, All Rights
Reserved
ASIAN JOURNAL OF MANAGEMENT RESEARCH Online Open Access publishing platform
for Management Research
© Copyright 2010 all rights reserved Integrated Publishing association Research Article
ISSN 2229–3795
ASIAN JOURNAL OF MANAGEMENT RESEARCH 81
A Study on employee engagement in two Indian businesses Malavika Desai1 , Bishakha
Majumdar2 , Ganapathy P.Prabhu
3 1 • Faculty, Organizational Behavior, Rajiv Gandhi Indian In
stitute of Management, Shillong 2• Project Fellow, University of Calcutta,

Department of Applied Psychology 3• Staffing Lead•EMEA(Europe, Middle East, Africa) md
@iimshillong.in
EXAMINING BLUE-COLLAR WORKER LEADERSHIP BEHAVIOR AND
WORKPLACE ENGAGEMENT
By Timothy R. Muckey
December 2012
ACKNOWLEDGEMENT:
I am very grateful for the opportunity to work at Unitile India during my Summer Internship. I
learned a great deal in terms of the HR function, character development as well as an insight into
the Raised Access Flooring Industry. I consider myself very fortunate to have met and worked
with talented, passionate professionals who have guided me throughout my internship. I am
thankful for the platform I have been given to share my skills and interests.
I would like to express my deep thanks to Ms. Freeda Brown, Manager – Human Resources
and Ms. Arundhati Sawant (Asst. Manager – Human Resources) for all their guidance,
mentoring and support.
I appreciate the guidance and support of Prof. S C Kalia and Dr. Vaishali Kulkarni for
shedding light on the practical aspects of Human Resources and for pushing me to apply the
knowledge I have learned during this course.
Further, I would like to extend my thanks to St. Francis Institute of Management and
Research specifically the Career Management Council for the preparation and efforts put to
secure this organization for an internship and for encouraging students to take up research.
Finally, this project would not exist without the valuable contributions from the Employees at
Unitile India and all the people who have directly or indirectly helped me with the completion
of this project. I appreciate you!

A Study on Recruitment Life Cycle and Lead Time
Analysis at Prompt Personnel Consultancy Services Pvt.
Ltd.
Ms. Shweta Chaugle
MMS II - HR
INTRODUCTION:
Recruitment is the base of a selection procedure and is currently going through drastic
changes in the industry. The core function of an organization is recruitment because an
organization doesn‘t want to recruit people who might not have potential which would
indirectly spoil the company‘s goodwill and corporate image. The process is of finding and
hiring the best-qualified candidates (from within or outside of an organization) for a job
opening, in a timely and cost-effective manner. The recruitment process includes analyzing
the requirements of a job, attracting employees to that job, screening and selecting applicants,
hiring and integrating the new employee to the organization. A process of finding and
attracting capable applicants for employment. The process begins when the new recruits are
sought and ends when their applications are submitted. The result is a pool of application
from which new employees are selected. Selection on the other hand, is the process of
picking individuals who have relevant qualifications to fill jobs in an organization. The
purpose of selection is to get the best suitable candidates for the job that fits in an
organization and would meet the requirements basically to get the right person for the right
job which will benefit the organization for a longer period. A responsibility of recruiters is to
find out the ways through which they can easily source the candidates and close the position
within the allotted time by the manger. Also, to find out loopholes in the process and plan
strategies to recruit effectively. Recruiters must bring responsible candidates who are ready to
learn as well as give inputs to the organizations which will help them to grown and succeed.
NEED FOR STUDY:
Understand various HR functions including the recruitment process at Prompt
Personnel Consultancy Services Pvt. Ltd.

Evaluation of the Lead Time - Recruitment Process followed in the company
OBJECTIVES:
To Study the Recruitment Life Cycle of Prompt Consultancy
To Evaluate the Lead Time for completing the recruitment process
RESEARCH METHODOLOGY:
Research design: Descriptive Research
Descriptive Research design is used to understand the recruitment life of the
Prompt.
Data Collection Method:
Primary: The data collected is purely based on observation and interview was taken
of one HR Manager
Secondary: Data collected is from online articles journals, published articles and surveys.

FINDINGS:
Background Verification:
Background verification forms at prompt include the details about to be filled by the
candidate‘s previous employer regarding his work performance and attitude towards work.
The details which are provided are sometimes not useful to get a complete record of the
candidate because some of their previous employers don‘t even recognize them, this can
happen in case where the candidate has taken break from his career. Sometimes the
candidates reporting manager in previous company has already left. In such case, the new
person is not able to give valuable feedback of that candidate.
Follow up on 30-60-90:
It was found that the HR team was not following up with the newly joined employees to give
feedback after completion of 30days, 60days and 90days in Prompt. This was the major
drawback for Prompt because employees did not have any modes to communicate their
problems to the HR manager. As a result, the problem faced by the Payroll team was not
known to the HR Team and it resulted in employee alteration. Since 2018 there was no stable
team for Payroll because of late sitting and various other issues as a result 60% of employees
left prompt by finding better opportunities.

Employee Records:
Each employee‘s documents and records are maintained only in file, there are no evidences
about the employees if the file is lost or any of the documents are misplaced. Even the pre-
joining forms are made to fill manually which results into grammatical errors, unable to read
due to poor handwriting which results into inaccurate information passing on to various
departments where the personal formation and other bank details are required to send or
intimated.
Commitments from Candidates :
Commitments from candidates are the biggest challenge that I had faced during working on
different profiles. Candidates give confirmation regarding the interview timings but don't turn
up for the personal interview round or don't answer the phone calls in case the telephonic
round is schedule, this not only creates a bad impression about the candidate but also the
time, energy and the efforts are wasted which could otherwise be utilized to source the
candidates who are eagerly waiting for that opportunities.
Candidates with high expectations:
Candidates offer a long list of expectations the consultants find hard to meet. We had limited
resources through we were trying to place the candidates, so if they come up with some
unexpected demands then it proves to be a big challenge for us. Also, some candidates are not
ready to work because it‘s a consultancy firm, they think that it will not give value additions
to their CV‘s
Centralization Process :
Prompt is a pan India based company having its branches in Kolkata, Bangalore, Chennai,
Hyderabad, Pune along with a corporate office at Ghatkopar but even if there is a vacancy in
any of these branches the recruitment process is done from HO only. Induction of any new
employee joining promptly is taken from my HO – HR Manager only as a result the work
pressure increases.
LIMITATIONS:
Some information that was needed for the project was not provided by the company stating
that it was confidential in nature and cannot be disclosed.
Short span of time to study all the aspects of recruitment in depth.
It was difficult to take appointment of the HR Manager to understand different aspects of
work.

RECOMMENDATION:
Candidate‘s background verification checks should be done before releasing an offer
to them. This will help to evaluate the employees much before they join the
organization. In case, if a negative feedback is received from their previous employer
the same candidate cannot be hired and therefore efforts, time and energy of the
recruiter is wasted and he/she must again go back to the step of sourcing.
30-60-90 Form is valuable feedback from employees and suggestions from them will
help to make improvisations. Employee‘s feedback should be taken even if they are
performing well. This is an opportunity for them to share their work-related problems
with the HR Team. This feedback if are honest can solve the issues going on with the
company and it also results into employee retention since this may give them a sense
of belonging to the organization.
Feedback forms should not contain employees details it should be anonymous, such
details should only be known by HR. As a result, the employees would be in a better
position to give honest feedback without reliving their identity.
Feedback should be taken from new joiners regarding their interview experiences
which will certainly be fruitful in improving the process if required.
Paper work should be transformed into maintaining digital records. Rather than asking
candidates to carry hardcopy at the timing of joining, they can be asked to send
scanned copies which in turn can be maintained in various department folders.
Candidates should follow up after the interview even if they are rejected, this would
create a good impression in the minds of applicants and the company can also call
them back if in future, suitable positions opens in the company.
Facebook is not used as a medium of sourcing. It is an inexpensive medium to reach a
large mass of audiences in a fraction of seconds. Prompt can do a job posting on
Facebook & can tag all its employees, when the employees are tagged their friends &
relatives can see this post and can directly approach Prompt without employee
referral. In this way company can save money there are spending on employee
referral.
Decentralization should be adopted branches should be given liberty to take
interviews, conduct induction and do the onboarding process of new joiners at their

locations as a result the work burden on HO will be reduced and time can be utilised
in doing another important task.
Greenhouse Software is an Applicant Tracking System designed to make recruitment
extremely simple for recruiters.
CONCLUSION:
The recruitment process at Prompt Personnel Consultancy Services Pvt. Ltd. is quite
organized can be more effective with the help of proposed technological up-gradation.
Suggestions provided if taken into consideration can lead the company to improve its process.
Manual work should be converted into automation so that time can be invested in solving
important issues currently happening in company. Minimizing the lead time and closing the
respective positions is a concern area for the company.
The performance of the organization depends on the efficiency that its employee exhibits.
Hence it is crucial that an employee of the best suit must be selected for the organization, this
is where the process of recruitment plays an important role that is finding ―The Right
Candidate for the Right Job‖. HR specialists are no longer able to focus solely on recruitment
due to global competition hence outsourcing the recruitment functions has become dominant
in the allocation of human resources.
REFERENCE:
https://www.peoplematters.in/article/hr-industry/the-turning-point-a-promising-
outlook-for-the-indian-hr-industry-2367
https://archive.india.gov.in/business/outsourcing/index.php
https://economictimes.indiatimes.com/tech/ites/indias-technology-vendors-paddling-
shaky-boats/articleshow/56543653.cms
https://www.outsourcinginsight.com/outsourcing-trends/
https://www.talentnow.com/recruitment-statistics-2018-trends-insights-hiring-
talented-candidates/
https://economictimes.indiatimes.com/tech/ites/indias-technology-vendors-paddling-
shaky-boats/articleshow/56543653.cms

Essential of human resource management and industrial relations, subbarao Mumbai,
Himalaya publishing house, 1996 Edward E. Lawler Iii; John W. Boudreau. Stanford Business
Books, 2009.
Reinventing Human Resources Management: Challenges and New Directions ,Ronald J.
Burke; Cary L. Cooper. Routledge, 2005
Understanding Human Resource Management ,Ken N. Kamoche. Open University
Press, 2001
Organizational Success through Effective Human Resources Management Ronald R.
Sims. Quorum Books, 2002
How to Develop Essential HR Policies and Procedures ,John H.McConnell. AMACOM,
2005
Krishnan, Sandeep K.; Singh, Manjari. South Asian Journal of Management, Vol. 18, No.
1, January-March 2011
A Balanced Approach to Understanding the Shaping of Human Resource Management in
organisations** Boselie, Paul. Management Revue, Vol. 20, No. 1, January 1, 2009 Hargis,
Michael B.; Bradley, Don B.,, III. Academy of Strategic Management Journal, Vol. 10, No. 2, July
2011 Nehles, Anna C.; van Riemsdijk, Maarten; Kok, Irene; Looise, Jan Kees. Management
Revue, Vol. 17, No. 3, July 1, 2006
ACKNOWLEDGEMENT:
I am grateful to all those who have contributed in every way in the completion of my project.
With a deep sense of gratitude, I would like to thank my family and friends who have
constantly supported and assisted me throughout the completion of my project. Without them,
this would not have been possible.
I would like to thank my project guide Prof. Vasudha Rao who assisted me throughout the
project.
I take this opportunity to express my profound gratitude and deep regards to my Industry
guide Ms. Melissa D’Souza, HR Manager of Prompt Personnel Consultancy Services
Pvt. Ltd. for giving me an opportunity to work and learn new things and guiding me during
my internship in Prompt.
My sincere thanks to my colleagues at Prompt who contributed their valuable inputs and
providing information required to enrich my project.
Lastly, I sincerely would like to thank everyone who has directly and indirectly helped in the
completion of my project.

EVALUATION OF DIGITAL RADIOGRAPHY FOR
QUALITY IMPROVEMENT IN QC DEPT AT
MAZAGON DOCK LIMITED (MDL)
Mr. Siddhesh Sugandh Tawde
MMS II – Operations
INTRODUCTION:
Mazagon Dock Limited, Mumbai, an ISO 9001: 2008 Company is one of the leading shipbuilding and
offshore fabrication yards in India. The Yard was established in the 18th century, and over the 200 odd
eventful years, has earned a reputation for quality work and established a tradition of skilled and resourceful
service to the shipping world in general and the Indian Navy, Coast Guard & ONGC in particular. In its varied
history, MDL passed through various ownerships like the P&O lines and the British India Steam Navigation
Company. It was incorporated as a Public Limited Company in 1934.
After its takeover by the Government in 1960, Mazagon Dock grew rapidly to become the premier war-
shipbuilding yard in India, producing sophisticated warships for the Navy and offshore structures for the
ONGC. It has grown from a single unit, small ship repair company, into a multi-unit and multi-product
company, with significant rise in production, use of modern technology and sophistication of products. The
company‘s current portfolio of designs spans a wide range of products for both domestic and overseas clients.
QUALITY CONTROL (QC)
Quality as Quality Assurance in Ship building, or repair is all about preventing mistakes or defects in the
process of manufacturing thereby ensuring that the end product meets the requirements and avoid problems
when delivering ships or marine products to our customers. There are procedural as well as administrative
activities that try to ensure the above objective in QA. The goals of QA are two in number - namely to
produce a product which is "fit for purpose" and second in doing it "Right the first time" so that costly rework
and mistakes can be avoided. On the other hand, Quality as Quality control (QC) is focused on the final
product and focuses on defect identification. Quality control fails if Quality Assurance does not work.

SHIPBUILDING QUALITY CONTROL (SQC)
SQC established in 1980 to meet the Quality requirement for activities performed by
YARD during construction of commercial ships & also hull and third party for naval ships. The department is
equipped with qualified engineers, experienced inspectors & radiographers.
LITERATURE REVIEW:
The options for radiography embody not solely film, however with recent technological advances, it is now
possible to fulfill a good vary of NDT review applications with digital solutions that square measure reliable
and price effective. Digital radiography or computed radiography by use of reusable storage phosphor screens,
offers a convenient and reliable thanks to replace film, additionally to the reduced price on consumables, the
come back on investment of computed radiography systems is powerfully determined by savings in exposure
time, processing times and repository times. what is more, intangible prices like plant conclusion, atmosphere
safety and longer usability of isotopes square measure more and more vital once considering commutation
film by storage phosphor systems. More and additional applications may be lined by rising the image quality
of digital radiography systems. Digital pictures provide plenty of benefits in terms of image manipulation and
progress. Film scanning, Computed Radiography and Direct Radiography by mistreatment completely
different reasonably flat panel detectors all have their specific application fields. For the aim of this
presentation, the digital applications examined square measure primarily computed radiography and to a lesser
extent direct digital radiography mistreatment flat panel. The choice to travel digital depends on price, quality
demand, progress output. (R.J. Patel,2005) One of the explanations of exploitation electromagnetic wave is its
ability to penetrate pipes that have terribly thick walls. pictures created with film need long exposure periods
because of the long integration time this technology needs. This exposure time is unsafe to the operator and to
the exposed environment. once several pictures are needed the operating rate is additionally augmented
because of the long exposure. Combining atom on web site testing with digital X-ray systems permits making
a top-quality image whereas exploitation short exposure time. (R. PINCU,2008)
Advanced Software Features
This software package in Digital RT replaces conventional film with phosphor imaging plates and uses a high-
resolution digital laser scanner instead of wet chemical processing. The scanned image is displayed on a high-
resolution monitor, and simply yet sophisticated software tool can be used to quickly adjust to the image for
optimal viewing. This software offers icon-driven operation, with single button filters for instant image
optimization. The advance pipe wall thickness measurement tool automatically makes multiple thickness
measurements along a single line drawn along the pipe wall.
Simple icon driven operations
• Intuitive Image classification database
• Original image is never compromised or changed
• Brightness, Contrast and Gamma adjustment
• Image flip rotate zoom
• Image pseudo color tool
• One-touch filter and preset

• Roving magnifying glasses
• Line area and angle measurement
• Advance pipe wall thickness measurement tool
• Text and region of interest annotation
ADVANTAGES OF DIGITAL RADIOGRAPHY
Immediate observation of radiographic images
If this were the only positive aspect of digital radiography, one still would choose it over conventional
radiography. Keep in mind that only some digital radiography devices provide immediate viewing. Charge-
coupled devices, or CCDs, provide immediate viewing. However, phosphorous-plate technology requires
placement of the irradiated sensor in a processing device to scan it and put the information into a computer so
that the image can be viewed.
Ability to enhance image
Many times, we looked at a radiographic image and thought that it needed to be lighter or darker, or that you
would like the image to be somewhat larger? Digital radiography allows the observer to change contrast (to
lighter or darker), enlarge images, place color enhancements or superimpose various textures on images.
Data storage
Pulling up specific stored radiographic images from a computer database is easy because of the highly
organized nature of computer file storage. When using conventional radiography, all of us have had times
when we have looked unsuccessfully for the paper chart and radiographs of a welding work carried on some
years ago. With similar frustration, we have misplaced active welding charts and radiographs, sometimes
never finding them.
Developing solutions and conventional film developers
One of the less desirable tasks in RT is maintaining and changing the radiographic developing and fixing
solutions and keeping the often-unreliable developing devices in a functional state. In digital radiography,
those tasks are eliminated, along with the dark-room that still is present in some offices that do not use
automatic film processors. The problems of odors and stains from the developing and fixing solutions and the
space occupied by the developing devices are eliminated when digital radiography is incorporated into a
practice.
Communication
One of the most useful advantages of digital radiography is the ability it gives other to send images in a matter
of minutes, even while talking on the telephone. There are various ways to send an image, but the commonly
used e-mail method is one of the easiest.
Less radiation
When using conventional radiography, we often have been hesitant to make a radiograph because it exposes
the human body to radiation. The reduction in radiation offered by digital radiography—usually 70 to 80
percent, and at times even more—allows multiple periapical images for the same radiation exposure involved
in a single periapical image obtained via conventional radiography.

Loss of conventional films
Most practices have relatively efficient ways to store conventional radiographs in their respective places, but
occasionally a critical film comes loose from its holder, and it is lost without the possibility of retrieval.
Assuming adequate back-up procedures
are observed, there is no reason to lose stored digital radiographic images.
Ease of use
Some practitioners who are not comfortable with computers may debate this point. However, after a short
learning period, accompanied with frequent use, the simple software necessary for use of digital radiography
is easily mastered. The new wireless digital radiography concept has simplified the RT procedure even more.
DISADVANTAGES OF DIGITAL RADIOGRAPHY
Cost of devices
At the present time, the cost of purchasing a digital radiography setup is considerable, ranging from $6,200 to
$9,800 per operatory for a wired system $10,500 to $12,500 for a wireless system Practitioners must be aware
of the initial cost as they consider the advantages and disadvantages of the concept. In my opinion, this
technology is far more important and necessary than other highly touted technologies that cost significantly
more. After due consideration, the advantages of digital radiography appear to justify the high initial cost.
Cost of converting previous records to digital
The cost of employee time to scan and convert previous conventionally made radiographs into digital form is
no small task. I suggest that previous radiographs be converted gradually, as clients/requisition come in. In
this manner, the labor costs are spread over many months and can be absorbed by a typical practice without
difficulty.
The cost of converting conventional radiographs all at once is formidable.
Learning to use the concept
After receiving initial education to begin using digital radiography, staff members still will require significant
time to master the use of the software. Mature staff members can learn the techniques rapidly, but every new
staff member who is hired must go through the learning process. In my opinion, manufacturers should strive
to simplify the software for these devices further to allow an easier and faster learning period.
Thickness of the sensor
CCD sensors vary in thickness, from more than 3 millimeters to more than 5 mm.
Although this seems to be a major disadvantage, it is surprising to note the relative ease of use of CCD sensors
in spite of their thickness. Wired sensors are not thinner than wireless sensors. Phosphorus sensors are thinner
than CCD sensors, but they do not offer the advantage of immediate observation of the radiographic image.
IDENTIFICATION OF PROBLEMS:
The main outcome of the Problem Identification stage is to set the overall purpose and objectives of the
project and to determine the likely data requirements.
This step followed:

• Clearly identify what aspect of the RA needs to be addressed;
• Set the objectives of the RA (what will and will not be considered), and
• Identify what information needs to be collected, analyzed and assessed.
Sr
No. Problem Description
1 DELAY IN ISSUING OF SAFETY SHOES /
HELMET / BOILER / SUIT / TORCH
2 AMBIENCE
3 CONVENTIONAL METHODS
4 DISPOSAL OF UNWANTED DOCUMENT
5 MOTIVATION
Note:
On the basis of above-mentioned problem in Problem Category chart, problem no 3 “Conventional Method”
was selected for the project.
DEFINITION OF PROBLEM:
CONVENTIONAL INSTRUMENTS/TECHONOLOGY:
Instruments used for inspection are as per industry standards. But using instruments with new
technology will allow QC department to complete requisition more efficiently and accurately.
Radiography NDT Testing: is the use of ionizing radiation to view objects in a way that
cannot be seen otherwise. It is not to be confused with the use of ionizing radiation to change
or modify objects; radiography's purpose is strictly viewing. Industrial
radiography has grown out of engineering, and is a major element of nondestructive testing. It is a
method of inspecting materials for hidden flaws by using the ability of short X-rays and Gamma rays
to penetrate various materials.
NEED FOR STUDY:
Improvement in business process should be done to adopt newer technologies to handle the
unexpected rising costs incurred by following the conventional methods. This study aims to explore
the benefits of adopting new technology like digital radiography used in ship building process at
MDL.
OBJECTIVES:
1. To understand the Ship Building Process adopted at MDL
2. To evaluate the adoption of Digital Radiography used in Ship Building Process.

Shipbuilding manufacturing techniques
Shipbuilding is the construction of ships and floating vessels. It normally takes place in a
specialized facility known as a shipyard. Shipbuilders, also called shipwrights, follow a specialized
occupation that traces its roots to before recorded history. Shipbuilding and ship repairs, both
commercial and military, are referred to as the ―naval engineer". The construction of boats is a
similar activity called boat building.
The dismantling of ships is called ship breaking.
Modern shipbuilding makes considerable use of prefabricated sections. Entire multi-deck segments
of the hull or superstructure will be built elsewhere in the yard, transported to the building dock or
slipway, then lifted into place. This is known as
"block construction". The most modern shipyards pre-install equipment, pipes, electrical cables, and
any other components within the blocks, to minimize the effort needed to assemble or install
components deep within the hull once it is welded
together. Generally shipbuilding process may take one year to 8-10 years which wholly
dependent on the requirements of the customer and the technology you are using.
Process mapping of NDT test (Quality Control)
NDT (Non-Destructive test) test is carried out for weld test of various parts during shipbuilding.
NDT requirements based on contract and specification is provided to the NDT team. Based on the
specification requisition is raised. The raised requisition is inspected by control inspector for clarity
and completeness of it. If satisfied then he gives acknowledgement for further process but if any
shortfall in the requisition the feedback is given for it. E.g. If any area difficult to access and
scaffolding is required to reach and is not mentioned then the requisition is raised again by arranging
scaffolding structure. The inspector verifies the requisition again and then acknowledges if ok.
Based on the area to be tested detailed drawing is made for NDT to be carried on. Markings are
made on the drawing and at actual site where the test will be done. Once the markings are done NDT
takes place and results are evaluate. Sometimes while evaluating result, it may be noticed that the
image quality is not good which can be due to human or equipment error. If the image quality not
good and can‘t be evaluated the test is carried out again. Once the test is successful then the reports
are prepared for detail analysis and suggestion or corrective action to be taken for the weld. The
reports generated are finally distributed to the concern department.
DATA COLLECTION & ANALYSIS:
Analysis of cost of Dark Room which is used for Film Developing of Radiography test including
solution and film costing which is required for the procedure is as given below:
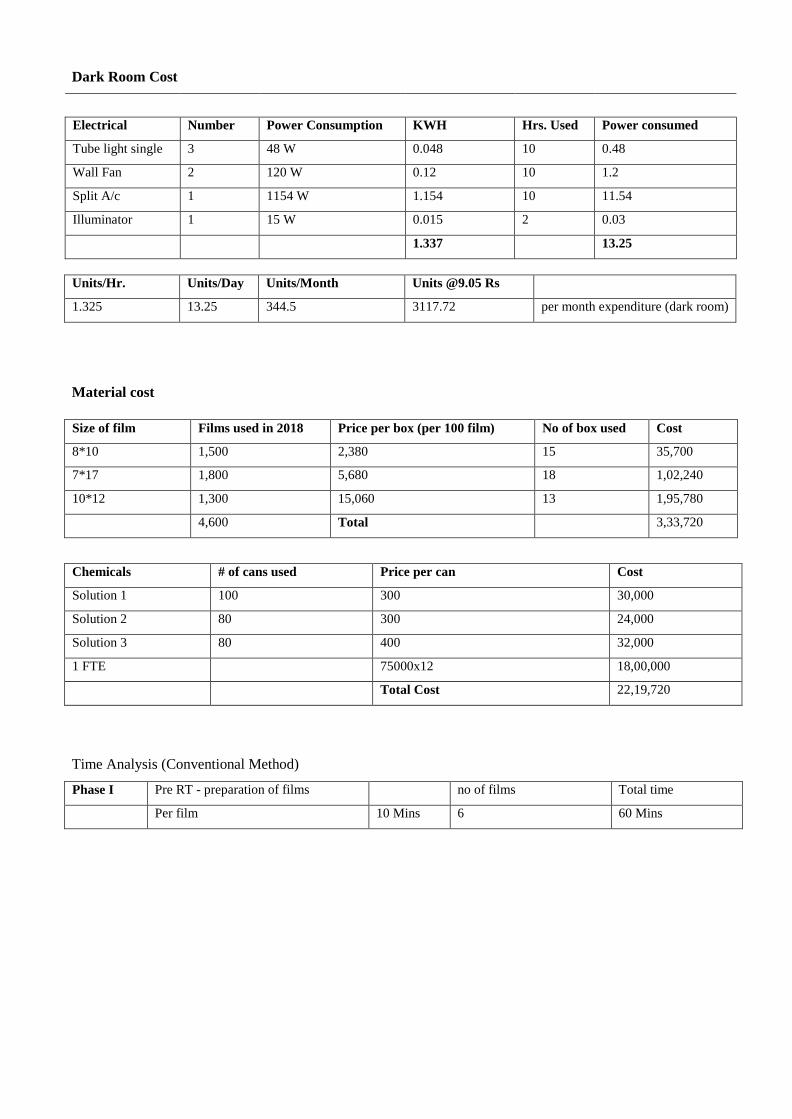
Dark Room Cost
Electrical Number Power Consumption KWH Hrs. Used Power consumed
Tube light single 3 48 W 0.048 10 0.48
Wall Fan 2 120 W 0.12 10 1.2
Split A/c 1 1154 W 1.154 10 11.54
Illuminator 1 15 W 0.015 2 0.03
1.337 13.25
Units/Hr. Units/Day Units/Month Units @9.05 Rs
1.325 13.25 344.5 3117.72 per month expenditure (dark room)
Material cost
Size of film Films used in 2018 Price per box (per 100 film) No of box used Cost
8*10 1,500 2,380 15 35,700
7*17 1,800 5,680 18 1,02,240
10*12 1,300 15,060 13 1,95,780
4,600 Total 3,33,720
Chemicals # of cans used Price per can Cost
Solution 1 100 300 30,000
Solution 2 80 300 24,000
Solution 3 80 400 32,000
1 FTE 75000x12 18,00,000
Total Cost 22,19,720
Time Analysis (Conventional Method)
Phase I Pre RT - preparation of films no of films Total time
Per film 10 Mins 6 60 Mins

Phase II Dark Room Operations per film Chemical Process (Min.) For 6 Films
Solution 1 5
Solution 2 10
Solution 3 10
Drying 45
Total Minutes 70 – 80 150 Mins. (Approx.)
Phase III Post Darkroom Activity
Reading and Report Writing 10 Mins each Total time
60 Mins for 6 reports 60 Mins
Total 6 films
Pre RT 60 Time for 6 films
Development Film 150 Worst case 270
Post RT 60 Best case 190
Total time for 6 films 270
Time analysis
Time utilization chart 2018-19
Month Tests Time consumed (mins) Error
Apr-18 276 12,420 22
May-18 309 13,905 31
Jun-18 270 12,150 27
Jul-18 389 17,505 31
Aug-18 381 17,145 38
Sep-18 394 17,730 39
Oct-18 392 17,640 39
Nov-18 410 18,450 33
Dec-18 413 18,585 41
Jan-19 365 16,425 37
Feb-19 491 22,095 49
Mar-19 450 20,250 45
FINDINGS:
As X-ray and Gamma radiation are invisible to the naked eye only suitable trainer and qualified person
is allowed to do testing as it can have serious health and safety issue.
It is a slow process and developing a film after testing is very time consuming.
The testing is usually carried out during night time as require safe working area to be established
while creating the images. All area near testing needs to be evacuated which hamper other ongoing
process.

Film can come loose from holder while performing test which can affect the image captured.
Storage of films can be an issue and finding them for welding carried out some years ago can be a task
sometimes never finding them.
INTERPRETATION:
The following data summarize the requirements and constraints associated with implementation of digital
radiographic systems.
Costs
The digital radiography system described costs approximately 700000 INR (including the Image Share
software) and has a projected useful life of approximately 5 years. The projected lifespan of the existing
conventional system is 3 to 4 years.
The shorter lifespan of the conventional system is largely due to the corrosive effects of the developer and
fixer used to process exposed film. As per research carried out by US defense the annual operating costs of
the digital radiography system are projected to be approximately one-sixth of the conventional system.
Such reductions are possible because the digital system reduces labor demands, does not require film or
hazardous developing materials and eliminates hazardous waste from the process.
Environmental, Safety and Health Issues
Conventional radiography at Mazagon Dock Ltd. used approximately 30 gallons of developer and fixer per
year. The environmental personnel handled and disposed of approximately 24 gallons of these materials
each year as hazardous waste.
The digital radiography system uses no chemicals to process the x-ray images. Since the digital
radiography system replaces conventional film, the hazardous materials and hazardous waste associated
with the film development are eliminated.
Impact Analysis
The impact analysis compares the annual economic and environmental
considerations of using the digital radiography system versus conventional
radiography.
The analysis incorporates:
Initial cost of the new equipment
Recurring costs for both options
Labor savings from process changes
Savings from x-ray film and developing chemicals purchases
Reduced hazardous waste disposal costs
Benefits of Digital Radiography versus
Conventional Radiography
1) Environmental, Safety and Health Benefits

Total Annual Costs
25,00,000
20,00,000
15,00,000
10,00,000
Conventional Radiography
Digital Radiography
Hazardous Materials Reduction (Gallons/year) 30
Hazardous Waste Reduction (Gallons /year) 24
2) Annual Operating Cost Elements
Cost of Elements Conventional Radiography Digital Radiography
Materials & Electricity(INR) 4,57,000 (Approx.) 5,000
Labour (INR) 1,800,000 2,88,000
Disposal (INR) X
Total Annual Costs 22,57,000 2,93,000
X: Disposal Amount is variable
Annual Cost Savings 19,64,000 INR Minimum
3) Annual Operating Time Elements (4540 Tests per year i.e. 15 per day approx.)
Time Elements Conventional Radiography Digital Radiography
Per film For 6 films (Mins) For 6 films (Mins)
Pre RT-preparation of films 10 60 80-90 Dark Room Operations per film 70-80 150
Post Darkroom Activity 10 60
Total 90-100 270 85 mins (Average)
Time Saving per 6 films
Method Pre Photo Post Total
Conventional 60 150 60 270
Digital 18 45 18 81

Derived Optimized Time Saving chart for a Year
Month
Tests
Conventional
Time consumed
(mins)
Expected
Digital
Time
Cumulated
Conventional
Cumulated
Digital
18-Apr 276 12,420 3,864 12,420 3,864
18-May 309 13,905 4,326 26,325 8,190
18-Jun 270 12,150 3,780 38,475 11,970
18-Jul 389 17,505 5,446 55,980 17,416
18-Aug 381 17,145 5,334 73,125 22,750
18-Sep 394 17,730 5,516 90,855 28,266
18-Oct 392 17,640 5,488 108,495 33,754
18-Nov 410 18,450 5,740 126,945 39,494
18-Dec 413 18,585 5,782 145,530 45,276
19-Jan 365 16,425 5,110 161,955 50,386
19-Feb 491 22,095 6,874 184,050 57,260
19-Mar 450 20,250 6,300 204,300 63,560
SUGGESTION:
➢ For Digital Radiography no need for certified personnel only a qualified trainer with good
software knowledge will be able to do testing as it is easy to use.
➢ Exposure time is reduced by 70-80% which reduces the health safety issue.
➢ It is real time process and image can be viewed on laptop/computers while testing no need to develop
film.
➢ The film used for capturing image can be used again and again.
➢ DR test can be done during day time which can save lot of time and cost.
➢ Easier to store captured image in computer database and retrieve as when required.
LIMITATIONS:
➢ No access to most of the areas of production to know the procedure. (E.g.: Warships, Submarines)
➢ Data highly secured so availability of data was limited for the project.
➢ No in-depth knowledge sharing by senior members.
➢ Only observation was allowed but no hands-on experience was given on equipment‘s.

FUTURE SCOPE:
➢ Computed Tomography (CT) technique requires large amount of data storage which provides 3D
radiographic image for viewing. This method can be
implemented after 5-6 years as it is currently very expensive.
CONCLUSION:
Compared to conventional radiography, digital radiography eliminates the generation of hazardous
waste in the process and saves time and money. Also, it will help to improve the error detection ratio,
which will eventually lead to improve the quality of inspection
REFERENCES
https://www.microdatamarine.com/
https://mazagondock.in/
https://en.wikipedia.org/wiki/Mazagon_Dock_Shipbu
ilders https://www.duerr-ndt.com/
http://www.dphu.org/uploads/attachements/books/books_47
_0.pdf https://www.ndt.net/article/wcndt2008/papers/5.pdf
ACKNOLEDGEMENT:
No endeavor achieves success without the help & co-operation of others. Behind the successful
and fruitful project of students lie the guidance, help, efforts and co-operation of number of
people. I would like to seize this opportunity to thank all those people who made my project at
―MAZAGON DOCK LTD.‖ through its vendor ―Patel Microdata Marine Group‖ a vibrant
success. I am deeply indebted to Mr.V.J.Phansekar and Mr. W.Rodrigues who gave me an
opportunity to work and learn in their organization. I would like to thank every person in my
department (QA & QC) & all other people working in it. The guidance and the encouragement
given by them all stages have been a great help. My heartfelt thanks to Prof. Vasudha Rao
(Operations) for unending efforts and support throughout my project. Lastly, a word of thanks to
those people who are left unmentioned here, but helped me a lot during the project period and
made it wonderful experience to remember.

A Project Report on Time and Motion Study, Capacity
Utilization and Terminal Operations at HPCL, Mumbai
Ms. Sonali Mhatre
MMS II – Operations
INTRODUCTION:
This project deals with the time and motion study of the lubricants production operating in
the HPCL Sewree II terminal. Sewree II terminal mainly carries out the blending and
production of different lubricant variants. The main operations that the terminal handles are
blending, receipt, production and dispatch of lubricants. The lube production operates in a
single shift from 8:00 to 15:00.
Time study is a work measurement method to record working times and rates for the
components of a specified job performed under specified circumstances and to analyze the
information to determine the time needed to perform the job at a given results rate.
Motion research involves dividing the work into basic components or basic activities of a job
or process to eliminate unnecessary or faulty components in a job. It discovers the most
science and systematic technique of performing the procedure or finishing the task after
researching all motions in a job, process or operation.
Thus, time study fixes the standard time for a job or a process while motion study eliminates
wasteful motions or the movement of a worker on the job. Both are complimentary to each
other. And so, it was necessary to conduct a time and motion study in the terminal to increase
the efficiency of production.
NEED FOR STUDY:
Understanding the manufacturing of Lubricants in the Sewree Plant,
Identifying the factors causing delay in the packaging of the Lubricants
Identifying the areas where extra manpower is used.
Capacity Utilization of the machines involved in Lubricant Manufacturing to be explored.

OBJECTIVES:
1. To understand the Terminal Operations of Sewree Plant of HPCL
2. To undertake Time and Motion Study of Lubricants manufactured at Sewree Plant
To assess the Capacity Utilization of Machines used in Manufacturing of Lubricants
RESEARCH METHODOLOGY:
The methodology used is a descriptive as well as exploratory research methodology. The study
involves in-depth study of data and their interpretations. The required data was collected by
interviewing the company employees and the contract workers as well as staying physically on the
field and observing the production process.
Primary data collection was through interviewing the operations officers, supervisors and operators to
achieve correct information related to the processes, the manpower and the time required for the
processes. Most of the data was collected by being physically present on the production field and
monitoring the activities of the workers and supervisors and measuring the cycle time of each process.
Secondary data was collected through the company‘s manuals, SOP‘s, websites, documents, etc.
Lubricants:
Lubricants are substances that are used for lubricating an engine or a component, such as oil or grease.
Lubricants produced in HPCL are used in the engine oils of vehicles, steamers, ships etc.
Lubricants are produced in the HPCL Sewree II Terminals which are then packed and transported to
HPCL warehouses and direct customers all over India.
The lube oils consist of 3 types:
1. Gear Drive EP 90
2. Milcy Turbo (15W 40)
3. Racer 4 (20W 40)
Gear Drive (GD) is blended and produced in the Sewree Terminal II whereas Milcy Turbo and Racer
4 are bought from the Mazgaon Terminal of HPCL.
Application areas are manual transmissions of automobiles requiring this type of extreme pressure oils
HP GEAR OIL EP are multi-purpose gear oils with extreme pressure additives for mild circumstances
of service.
HP MILCY TURBO is a multi-grade diesel engine oil of premium quality intended to provide
outstanding engine lubrication in both turbo-charged and natural-aspirated diesel engines. Formulated

with extremely hydro-processed base oils and thoroughly chosen additive chemistry, HP MILCY
TURBO is intended to provide outstanding viscosity / temperature features, unmatched engine safety,
great load carrying capacity
HP RACER 4 grade is premium motorcycle engine oil designed to meet the extremely challenging
lubrication demands of contemporary 4-Stroke geared motorcycles.
Flowcharts:
1 litre flowchart:
Sr.
no
Variant Quantity
1 Racer 4 900 ml
2 Racer 4 1 L
3 Gear Drive 1 L
4 Milcy Turbo 1 L
5 Gear Drive 5 L
6 Milcy Turbo 5 L
7 Milcy Turbo 7.5 L
8 Milcy Turbo 10 L
9 Gear Drive 10 L
10 Milcy Turbo 15 L
11 Milcy Turbo 20 L
12 Gear Drive 20 L
13 Milcy Turbo 26 L
14 Gear Drive 26 L
15 Racer 4 50 L
16 Gear Drive 210 L

5 litres flowchart:


Comparison
250.00
200.00
150.00
100.00
50.00
0.00
1 litre 5 litre
DATA ANALYSIS & INTERPRETATION:
1) The total time a bottle takes to fill from the starting of the production process i.e. from dropping the
bottles into the hooper to placing the cartons onto the palette is observed and calculated as follows:
8 cycles are observed at an interval of half an hour and their total cycle time is calculated individually.
Comparison of 1 and 5 litres:
The carton filling machine should be installed which costs Rs. 2, 50,000. This will reduce the time
taken for producing each bottle and will in turn increase the daily production. Currently the carton
filling step requires 2 mandatory workers to continuously fill the bottles into the cartons. So,
automating this particular process will also reduce the cost of 2 labors.
1 labor cost = Rs. 710/day
2 laborers cost = Rs.1420/day
Monthly cost= Rs. 1420*26(working days) = Rs. 36,920
Yearly = Rs. 4, 43,040
The machine installation cost including all the expenses is Rs. 3,07,500
The cost of investment is recovered in the first year itself considering the labor cost which is saved. If
along with the labor cost saved, the daily production of 1 litre is considered, the cost will be recovered
within months.

2) Increase the productivity of assembly line by introducing changes in the existing coupon
system for promo production:
The promo packaging of lubes is done manually wherein promo packages are produced on 1 litre and
5 litres assembly line. This includes pasting of stickers on containers and then inserting coupon in
each container. This process is done manually. 4 laborers are required for placing the coupons and
stickers in the bottles for each machine. Since, it is done manually; it results in increase in cycle time
and thus decreases the productivity of both the machines. This problem can be solved by introducing a
new methodology for coupon/promo packaging of lube containers.
To increase the productivity and to make the assembly line more cost effective a new methodology
can be used wherein the coupon shall be replaced by the serial number on caps. To bring in the
changes the serial number and coupon code shall be printed in the bottle caps itself by the cap vendors
as this will reduce the production time of the promo packaging of the bottles. On implementing this
technique, cost reduction will be as follows:
Cost reduction:
The labor cost would reduce as follows:
Each labor costs Rs.710/day
i.e. Rs. 2,840 for 4 laborers
Which comes out to 2,840*26(working days) = Rs. 73,840/month would be the cost reduction.
3) Machine Capacity Utilization
Calculation for machine capacity:
1 litre
7-3 shift hrs:
min
7:30-9:00 1:30
9:30-12:30 3:00
1:00-2:30 1:30
Total 6:00
tea breaks 0:10
total
machine
run time
5:50

1 litre bottles/min
Rpm 60
per hour 3600
per shift 21000
2100 cartons per shift
FINDINGS:
The carton filling process of 1 litre production consumes a lot of time due to which the cycle
time of the bottles increases and results in less production daily.
During the promo packaging production, extra manpower is needed to place the stickers and
insert the coupons in the bottles due to which the production efficiency decreases and there is
increase in the cost of 4 extra laborers.
The 1 litre production machine is underutilized due to which there is decrease in the daily
production.
The 5 litre production machine faces a lot of breakdowns daily, due to which there is a
significant wastage in time, thus leading to low production and idle manpower.

SUGGESTIONS:
Since the carton filling process in 1 litre production takes the maximum time, the carton
filling machine must be installed which will reduce the cost of 2 laborers and will increase the
daily production.
For the promo packaging production, the coupon code and the serial number should be
printed on the bottle cap itself by the cap vendor which will reduce the cost of 4 laborers and
increase the efficiency of production.
The production machines are underutilized mainly due the constant machine breakdowns
which leads to wastage of time and idle manpower which is a loss for the company, so to
avoid the breakdowns; the machines should have a proper maintenance at least twice in a
month. This will increase the daily production by utilizing the machines according to the
capacity and won‘t lead to any idle manpower. The daily production of 1 litre should increase
from 1800 cartons to 2000 cartons.
Machine maintenance must be carried out twice a month.
LIMITATIONS:
Though all the efforts were made for an in-depth study, but in course of doing so, there were some
limitations involved.
Breakdowns have caused slight variation in the time.
Data collection was restricted since access to some important data required for the project was
not allowed.
Shift in the study locations.
FUTURE SCOPE:
The carton filling machine which is suggested to be installed in the Sewree terminal can also
be implemented in the Mazgaon terminal. HPCL‘s Mazgaon terminal manufactures a lot of
product variants and is carries out larger operations than the Sewree terminal. So,
implementing this would be very beneficial for the terminal.
The blending process of Milcy Turbo and Racer 4 can be introduced in the Sewree terminal.
CONCLUSION:
On checking of the capacity utilization of the machines, it can be concluded that the machines are not
fully utilized as per their capacity. The current run time of the machine is 5 hours and 50 minutes
excluding all the break times. This includes the constant machine breakdown, such as non-printing,

cap fitting, carton filling and many such other issues which tends to slow down the production to
almost an hour which can be avoided. On the other hand, even if the machine takes less than 10
minutes to get the machine working back, sometimes it takes more than half an hour. In this case there
is more loss of production leading to idle manpower and low production rate of that date.
Thus, on maintaining the machine at least twice a month or when the machine is not in use will ensure
a clear and smooth production without any severe breakdown.
REFERENCES:
https://www.hindustanpetroleum.com/aboutus
https://www.hindustanpetroleum.com/webelieve
https://www.hplubricants.in/
https://www.researchgate.net/publication/275540053_Overall_Equipment_Efficiency_Improvement_
Using_Time_Study_in_an_Aerospace_Industry
https://www.researchgate.net/publication/4902069_Capacity_Utilization
ACKNOWLEDGEMENT:
It is indeed a matter of great honor for me to express my sincere gratitude towards the
organization – Hindustan Petroleum Corporation Limited for providing me this important
opportunity to learn and train myself using the best resources available.
I take this opportunity to express my profound gratitude and deep regards to my company
mentor Mr. Amit Kumar Malviya, Mr. Rajat Sharma and Mr. Prashant Shirsode – Hindustan
Petroleum Corporation Limited for their exemplary guidance, monitoring and constant
encouragement throughout the course of this project, which helped me in completing this task.
The help and guidance given by them time to time shall carry me a long way in the journey of
life on which I am about to embark.
I am obliged to members of – Hindustan Petroleum Corporation Limited for the patiently
guiding me through my training period and without whose support this training would not
been successfully completed. I heartily thank my faculty supervisor Prof. Vasudha Rao, her
guidance and suggestions during the project work.

SUMMER XCELLENCE 2019
PRAKALPA 2019