ABJ ISS-92(PG1-47).indd - The Asian Banker
96
1 ISSUE 92 The Asian Banker Sustainability strained The annual definitive ranking and survey of Asia Pacific’s largest and strongest banks The Asian Banker 300 2009-2010 Edition www.theasianbanker.com SPECIAL EDITION ISSUE 92 SEPTEMBER 2009
-
Upload
khangminh22 -
Category
Documents
-
view
0 -
download
0
Transcript of ABJ ISS-92(PG1-47).indd - The Asian Banker

1 ISSUE 92 The Asian Banker
Sustainability strainedThe annual defi nitive ranking and survey of Asia Pacifi c’s largest and strongest banks
The Asian Banker 3002009-2010 Edition
w w w . t h e a s i a n b a n k e r . c o m
S P E C I A L E D I T I O N I S S U E 9 2 S E P T E M B E R 2 0 0 9
ABJ ISS-92(PG1-47).indd 1ABJ ISS-92(PG1-47).indd 1 8/28/09 1:02:49 AM8/28/09 1:02:49 AM

2 ISSUE 92The Asian Banker
THE ASIAN BANKERStreamlined Corporate Actions Processingdelivered by best of breed components forthe complete event management lifecycle,from golden record creation to entitlements.
Isn’t it time to drive down the cost of your operations?
TLM® Corporate Actions is the award-winning solution used by the world’s mostdemanding financial institutions to deliver complete, timely and accurate eventprocessing. It reduces the need for manual intervention, to greatly reduce theoperational risk inherent in processing corporate actions and create more efficient and proactive operations through:
• The rapid capture, cleansing and distribution of data, regardless of source or format, to create a normalised and reliable golden record
• Workflow-based validation and processing of mandatory events and fullyintegrated Diary to efficiently manage voluntary events
• Unique, thin client, Election Management capability enabling fund managers to determine their action in real time
Contact us today to discover how to deliver clarity and predictability across theentire event management process.
+1 (866) 603-1893 (Americas)+44 (0)800 279 5465 (UK)+65 6 224 76 89 (Asia Pacific)
smartstream-stp.com
Account Reconciliations
Cash & Liquidity Management
Compliance Management
Corporate Actions Processing
Hosted Reconciliations (SaaS)
OTC Derivatives Processing
Reconciliations
Trade Finance
Trade Process Management
Treasury Confirmations
Utilities Data Management
ABJ ISS-92(PG1-47).indd 2ABJ ISS-92(PG1-47).indd 2 8/28/09 1:03:03 AM8/28/09 1:03:03 AM

3 ISSUE 92 The Asian Banker
CONTENTSThe Asian Banker Journal is published ten times a year by
Incorporated in Singapore as T.A.B. International Pte Ltd
12
The Asian Banker 300Chinese banks have surged while Japanese banks are in decline
57
Asia Pacifi c’s Strongest BanksBanks in emerging markets are in a better positionto pull in deposits and push out loans
72
Country CapsulesWe assess the performance of the banking markets in14 countries in the Asia Pacifi c region
Founder and PresidentEmmanuel Daniel [email protected]
DirectorCharmaine [email protected]
Director and PublisherCaroline Grimont [email protected]
Managing EditorPeter Hofl ich phofl [email protected]
Writer David Hendrickson [email protected]
Research ManagersChristian Kapfer [email protected] Liu [email protected]
ResearchersNancy Duan [email protected] Yuandong [email protected] Zink [email protected]
Research AnalystAldo Joson [email protected]
Graphics & LayoutValen Siew Tel: (65) 6236 [email protected]
Sales & AdvertisingEunice Foong Tel: (65) 6236 [email protected]
Marie Aquino Tel: (65) 6236 [email protected]
Circulation & Subscription SalesJerome Ong Tel: (65) 6236 [email protected]
Production CoordinatorJanet Chan Tel: (65) 6236 [email protected]
Printed in Singapore byPrint & Print Pte Ltd
MICA (P) 071/07/2009 (Singapore)KDN PPS 1301/09/2009 (028064) (Malaysia)ISSN 02189615
Copyright and ReprintsCopyright Protected. Reproduction of any material in The Asian Banker Journal in any form is prohibited except with written permission from the publisher.
For reprints, please e-mail: [email protected]
Head Offi ce:10 Hoe Chiang Road, #14-06 Keppel Towers Singapore 089315Tel: (65) 6236 6522 (Editorial); (65) 6236 6509/12 (Sales/Marketing); (65) 6236 6175 (Subscriptions); Fax: (65) 6236 6530
Sales Offi ces and Representatives:
ChinaJoanna Woo Tel: (86) 10 5869 [email protected]
#2805 Tower 12, Jianwai SOHO, 39 Dong San Huan Zhong Road, Chaoyang District, Beijing 100022Tel: (86) 10 5869 3492 Fax: (86) 10 5869 3491
Europe & North AmericaJenny A. Swift [email protected]
10 The Beanlands, Wanborough,Wiltshire, SN4 OEJ, United KingdomTel: (44) 179 379 0926 (London) Tel: (1) 917 210 8064 (New York)Mobile: (44) 7788 416 938
MalaysiaNo. 55-6, The Boulevard, Mid Valley City,Lingkaran Syed Putra, 59200 Kuala Lumpur, MalaysiaTel: (6) 03 2284 7110 Fax: (6) 03 2284 5300
Middle EastNicholas [email protected]
PO BOX 124628 DubaiUnited Arab EmiratesTel: (971) 50 452 1800Fax: (971) 4 361 7930
The Asian Banker 3002009-2010 EditionSustainability strainedThe annual defi nitive ranking and survey of Asia Pacifi c’s largest and strongest banks
ABJ ISS-92(PG1-47).indd 3ABJ ISS-92(PG1-47).indd 3 8/28/09 5:05:59 PM8/28/09 5:05:59 PM

4 ISSUE 92The Asian Banker
THE ASIAN BANKER
❏ Subscribe to THE ASIAN BANKER JOURNAL I will get:
I WOULD LIKE TO
To receive our e-newsletters, sign up at www.theasianbanker.com
Please fax your subscription to +65 6236 6530
For enquiries, please contact:Tel: +65 6236 6175, E-mail: [email protected] to: T.A.B. International Pte Ltd 10 Hoe Chiang Road, #14-06 Keppel Towers, Singapore 089315
Cancellation Policy: No refunds for cancellation of The Asian Banker subscriptions, although
credit for other products can be arranged.
Ten issues of THE ASIAN BANKER JOURNAL Online access to web edition for up to fi ve executives
(subscribed issues)
Name:
Job Title:
Organisation:
Address:
Postal Code: Country:
Direct Tel: Fax:
E-mail:
❏ Amex ❏ Diners Club ❏ MasterCard ❏ Visa ❏ JCB
Card No: Expiry Date:
Cardholder’s Name:
(if different from the above)
❏ Non-negotiable cheque made payable to: “TAB International Pte Ltd”
❏ Bank transfer to: Development Bank of Singapore Suntec City Branch, 3 Temasek Boulevard,
Singapore 038983 Account No: 074-001420-8 Account Name: T.A.B. International Pte Ltd
❏ Invoice me (only for corporate account). Payment must be made within 5 working days upon receipt of invoice.
Signature: Date:(as in credit card, if applicable.)
I WISH TO PAY BY (PLEASE COMPLETE THIS SECTION)
❏ US$360 per year
❏ US$330 per year on auto-renewal. Save US$30!
❏ US$520 for 2 years on auto-renewal at US$260 per year. Save US$200!
The Asian Banker (incorporated as TAB Inter-national Pte Ltd in Singapore) is a research and intelligence company dedicated to providing com-plete and up-to-date information on strategic de-velopments in the fi nancial services industry in the Asia Pacifi c region. The company offers a unique combination of the skills of researchers and writers to develop a keen perspective on strategic issues and drivers in the industry through three key divi-sion entities:
The Asian Banker Journal is the fl agship regional pub-lication covering industry best practices. The publication has become the defi nitive commentator on develop-ments in Asia Pacifi c’s fi nancial services industry.
Asian Banker Research offers a wide range of in-telligence-based reports and research products for the banking and fi nancial services community. It is designed to provide senior management with critical business intelligence to secure a market leader posi-tion in the industry.
Asian Banker Forums organises conferences and roundtables for senior executives on key areas of development in the industry. Many of these events are conducted by invitation only. The company’s fl agship event is The Asian Banker Summit, inau-gurated in 2000 and attended by delegates from around the region.
WHO WE ARE
SUBSCRIPTION FORM6 An important note Metamorphosis now
8 Trendwatch Honing the edge
17 List of Asia Pacifi c’s largest banks
22 Ranking of Asia Pacifi c’s largest banks
48 The largest banks in Greater China
50 The largest banks in South and Southeast Asia
51 Performance rankings
54 List of Asia Pacifi c’s strongest banks
60 Ranking of Asia Pacifi c’s strongest banks
94 The Final Word
ABJ ISS-92(PG1-47).indd 4ABJ ISS-92(PG1-47).indd 4 8/28/09 5:12:07 PM8/28/09 5:12:07 PM

5 ISSUE 92 The Asian Banker
It all adds up to better value!With our tailored solutions, we can help you optimize yourbranch processes and substantially reduce branch costs. Our flexible tools make it easyfor you to create and manage a customer-oriented portfolio with attractive value-addedservices. And our comprehensive consulting, innovative IT solutions and first-class out-sourcing services offer you results for better customer care and maximum efficiency inyour branches. As one of the world’s leading providers of multichannel solutions, we canhelp you move beyond the boundaries of your branch network. Call us at +65 6740 2610or visit our website at www.wincor-nixdorf.com
EXPERIENCE MEETS VISION.
BANK ON SUCCESS.BANK ON OPTIMIZED BRANCHES.
ABJ ISS-92(PG1-47).indd 5ABJ ISS-92(PG1-47).indd 5 8/28/09 1:03:07 AM8/28/09 1:03:07 AM

THE ASIAN BANKER
6 ISSUE 92The Asian Banker
AN IMPORTANT NOTE
Metamorphosis now
It gives me great pleasure to announce that Peter Hoflich has been appointed the managing editor
for all of The Asian Banker publications businesses. He also carries the prestigious title of editor
of The Asian Banker Journal. Peter takes over from Elena Torrijos, who saw the print publication
through the most recent phase of its development as the leading banking publication representing
the Asia Pacific region, and definitely one of the leading publications of its kind—this is not what
we say about ourselves, this is what our readers and the industry at large say about us.
Peter takes over the publication business at a momentous time in the revolution taking place in
the publication industry as a whole. When we say “all of The Asian Banker’s publications,” we refer
not just to The Asian Banker Journal, but to The Asian Banker Interactive, The Banking Conversation
and a host of data-driven publications we are driving online. The format of The Asian Banker Journal
is already being changed to accommodate this transformation that is taking place in the way readers
procure and access intelligence in the industry.
We have also become great users of Twitter, LinkedIn and even Facebook to keep our community
highly personal, informing readers of upcoming interviews with leading personalities around the
world. Visitors to our main website www.theasianbanker.com would immediately recognise how The
Asian Banker brand name has grown, and the fact that we have unparalleled access to leaders from
around the world.
Peter is, of course, no stranger to the industry. He has been with The Asian Banker since 2003 and
I am the first to recognise that he has become the most connected person in the industry, surpass-
ing the goodwill that even I had in the early years. I depend on him for insights on the background
of personalities he knows personally, as well as on trends in the industry.
His incredible sense of organisation (derived from his German heritage) and his affability (being
Canadian, of course) makes him a great journalist. It prepares him uniquely for this new phase in
the publication industry, where foundation work is more crucial than ever before when the publica-
tion industry was just print. I enjoy working with him and have a tremendous regard for his sense
of ownership over the information that he provides his readers.
In the meantime, my own role in the publication business is limited to being the anchor of the world-
wide interviews we do on a new initiative you can visit on www.thebankingconversation.com. Even here,
Peter plays a crucial role in selecting the people we choose to interview. I would encourage readers to
visit our related sites to see how we have transformed and how the new media is confirming something
that we suspected all along—that The Asian Banker is a world class publication, and now with a world
class editor. Please join me in congratulating Peter in this new phase in his professional life!
6 ISSUE 92The Asian Banker
ABJ ISS-92(PG1-47).indd 6ABJ ISS-92(PG1-47).indd 6 8/28/09 6:12:07 PM8/28/09 6:12:07 PM

7 ISSUE 92 The Asian Banker
As leading technology providers of financial services solutions, IBM and
ACI Worldwide have helped financial institutions worldwide build some of
the most sophisticated and flexible payment systems in use today.
Drawing on decades of experience
in application software and
infrastructure optimisation, IBM
and ACI have formed a strategic
relationship to ensure customers
can adapt to changing payment
requirements.
To learn more, visit www.ibm.com or www.aciworldwide.com.
Agile payment solutions from IBM and ACI
Agile Payment Solutions: Wholesale Payments . Financial Crime Management . Retail Payments . Merchant Retail
A unified solution that initiates, manages, secures and operates payments.
Visit us at stand 1E12 inExhibit Hall 1.
www.ibm.com www.aciworldwide.com
ABJ ISS-92(PG1-47).indd 7ABJ ISS-92(PG1-47).indd 7 8/28/09 1:03:14 AM8/28/09 1:03:14 AM
THE ASIAN BANKER
8 ISSUE 92The Asian Banker
The Asian Banker 300 (AB300) has been a product for The Asian Banker for eight years, and this
is the fifth that I’ve seen it assembled. Every year the process is an amazing thing to behold,
as the research team brings the numbers together, gives them a life of their own—and then forces
them to tell their stories.
But this year the experience has been different in many ways. Externally, we are seeing the first
set of mid-crisis performance numbers for Asian banks that can help us assess the state of Asia’s
banks relative to that of their suffering peers in the US and Europe, and gauge their strengths and
weaknesses. Internally, we are also seeing a new AB300 team forming around senior research analyst
Yi Yuandong, who has not only designed powerful analytical tools to
crunch the numbers with, but is gearing up to expand the list to 500
banks for a new online edition that will for the first time compare
the banks of Australia, East Asia, South Asia and Southeast Asia
with the banks of the Middle East and Central Asia. The expanded
ranking will also include countries like Bangladesh, Cambodia
and Sri Lanka, whose largest banks have always been too small to
make it onto our traditional list of 300 banks, but whose inclusion
allows us to apply them to our strength formula and evaluate them
alongside the other banks.
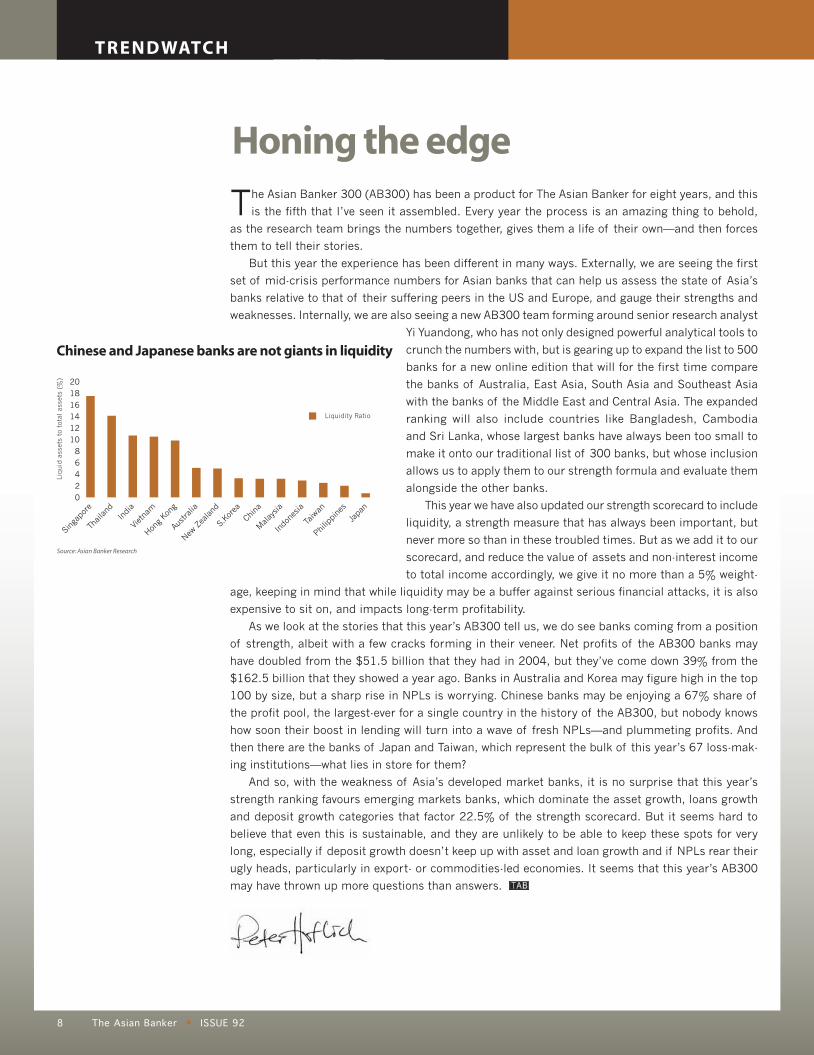
This year we have also updated our strength scorecard to include
liquidity, a strength measure that has always been important, but
never more so than in these troubled times. But as we add it to our
scorecard, and reduce the value of assets and non-interest income
to total income accordingly, we give it no more than a 5% weight-
age, keeping in mind that while liquidity may be a buffer against serious financial attacks, it is also
expensive to sit on, and impacts long-term profitability.
As we look at the stories that this year’s AB300 tell us, we do see banks coming from a position
of strength, albeit with a few cracks forming in their veneer. Net profits of the AB300 banks may
have doubled from the $51.5 billion that they had in 2004, but they’ve come down 39% from the
$162.5 billion that they showed a year ago. Banks in Australia and Korea may figure high in the top
100 by size, but a sharp rise in NPLs is worrying. Chinese banks may be enjoying a 67% share of
the profit pool, the largest-ever for a single country in the history of the AB300, but nobody knows
how soon their boost in lending will turn into a wave of fresh NPLs—and plummeting profits. And
then there are the banks of Japan and Taiwan, which represent the bulk of this year’s 67 loss-mak-
ing institutions—what lies in store for them?
And so, with the weakness of Asia’s developed market banks, it is no surprise that this year’s
strength ranking favours emerging markets banks, which dominate the asset growth, loans growth
and deposit growth categories that factor 22.5% of the strength scorecard. But it seems hard to
believe that even this is sustainable, and they are unlikely to be able to keep these spots for very
long, especially if deposit growth doesn’t keep up with asset and loan growth and if NPLs rear their
ugly heads, particularly in export- or commodities-led economies. It seems that this year’s AB300
may have thrown up more questions than answers.
TRENDWATCH
Honing the edge
Chinese and Japanese banks are not giants in liquidity
Source: Asian Banker Research
02
468
10121416
1820
Sing
apor
e
Thailand
Indi
a
Viet
nam
Hong
Kong
Austra
lia
New Z
ealand
S.Ko
rea
China
Malay
sia
Indo
nesia
Taiw
an
Philip
pine
s
Japa
n
Liquid
ass
ets
to t
otal
ass
ets
(%)
Liquidity Ratio
ABJ ISS-92(PG1-47).indd 8ABJ ISS-92(PG1-47).indd 8 8/28/09 1:03:15 AM8/28/09 1:03:15 AM

9 ISSUE 92 The Asian Banker
Software inf rastructure for rapid change. customers ears of e perience asda
Learn more at www.tibco.com
Software nc. rights reser ed.
The Moment of Truth
ver customer interaction – hether it s through the call center branch o ce email or eb – is a moment o opportunit . chance to buil or ero e the compan s relationship ith that customer.
s Predictive Customer Interaction Management solution – evelope in collaboration ith Fortune 100 customers in the retail banking sector – uses real-time events to anticipate customer nee s. his improves the e ectiveness o outboun marketing inboun marketing customer service an other relationship management activities. earn more at .tibco.com solutionsin ustr nance
ABJ ISS-92(PG1-47).indd 9ABJ ISS-92(PG1-47).indd 9 8/28/09 1:03:17 AM8/28/09 1:03:17 AM

CO - PUBL I SHED ART ICLE
ISSUE 92The Asian Banker10
Enabling client success with value-added services in a challenging environmentBy leveraging Deutsche Bank’s FX4Cash, fi nancial institutions are able to benefi t from increased business and revenue opportunities by offering value-added services to their corporate clients.
With weak market fundamentals and profi tability, many banks have been scaling back on investments in new product innovation and technology. FI clients are also
reassessing their strategic investments in technology and infrastructure to determine whether they can sustain ongoing investments or consider the option of outsourcing to a strong global provider. However, Deutsche Bank is bucking the trend and continues to invest in the latest technology to expand its suite of innovative cash management prod-ucts globally while ensuring that onshore clients across 17 markets in Asia have access to bespoke services and solutions. “We need to stay on top of clients’ requirements and Deutsche Bank has been proactive in addressing recent challenges with increased focus on technological advancements,” says John Ball, Head of Cash Management Financial Institutions, Asia-Pacifi c.
One product which has been gaining popularity among FI clients is the bank’s cross- currency payment platform, FX4Cash. Launched in the second half of 2008, the solution was designed to enable FI clients to transact large numbers of cross-currency transactions with ease. The FX4Cash platform has recently been enhanced to include 50 additional currencies. “This allows our clients to effect payments in more than 125 currencies via one base account,” says Ball.
Leveraging on its Global Markets’ foreign exchange and Global Transaction Bank-ing’s payments processing expertise, the FX4Cash platform - which is integrated with autobahnFX, the bank’s proprietary foreign exchange trading platform, and the bank’s award-winning Money Transfer New Architecture (MTNA) - was designed to offer cost and effi ciency benefi ts to corporate and FI clients. “FX4Cash is a marriage of Deutsche Bank’s leadership in foreign exchange and its leading cash management capabilities,” said Kefei Chang, Head of FX4Cash, Asia-Pacifi c.
Deutsche Bank’s leadership in foreign exchange further enhances this value proposi-tion. The bank was recently named leading FX bank globally by Euromoney for the fi fth consecutive year, accounting for 20.96% of all market turnover.
In the cash management space where competition is intense, Deutsche Bank is quick to access the potential growth in Asia’s payment space - where local currencies are increas-ingly gaining importance in transaction settlement. The bank is also acutely aware of the multiple regulatory jurisdictions governing FI client requirements across Asia. “FX4Cash is positioned to help our clients increase effi ciencies and minimise costs in cross-currency
John BallHead of Cash Management
- Financial Institutions,
Asia Pacifi c
ABJ ISS-92(PG1-47).indd 10ABJ ISS-92(PG1-47).indd 10 8/28/09 1:03:17 AM8/28/09 1:03:17 AM

ISSUE 92 The Asian Banker 11
settlements across geographies. As a one-stop solution for cross-border currency pay-ments worldwide, clients are drawn to the solution’s benefi ts as it streamlines, automates and controls payables, simplifi es the number of accounts maintained, and minimises as-sociated costs and reconciliation efforts. Clearly, this solution offers clients access to FX price transparency and reduces manual intervention,” added Chang.
Since the launch of FX4Cash in the third quarter of 2008, more than 100 clients have gone live on the platform and have used the solution. One of the early adopters of the FX4Cash platform is Bank CIMB Niaga (CIMB Niaga). With over 655 branches across Indonesia, CIMB Niaga is one of the country’s largest banks and serves a wide range of corporate and retail clients. “FX4Cash has enabled CIMB Niaga to generate additional business and revenue opportunities, reduce costs, create new effi ciencies and gain access to greater choices in managing their cross-currency payments. The benefi ts of FX4Cash will now be available to more corporates through CIMB Niaga’s broad network across Indonesia,” says Chang.
To this end, technological capabilities, scale and network reach remain key success factors for cash management banks. Deutsche Bank’s market leadership has also been confi rmed by recent award wins: Asian Banker Achievement Award for Cash Management and Treasury Services for
Banks and Corporates in The Asian Banker Leadership Awards 2009 Best Overall Cash Management Bank in Asia (2003-2008) as voted by fi nancial institu-
tions in the 2009 Asiamoney Cash Management Poll of Polls.Beyond meeting clients’ requirements, Ball believes in exercising due diligence to iden-
tify opportunities for them in this challenging environment. “FX4Cash will help our clients optimise the effi ciencies in their value chain. Starting last year, clients have been seeking alternative revenue sources with shrinking retail and trading activities. One of their primary concerns is managing thinner margins in the current market environment. By leveraging FX4Cash, our clients stand to benefi t from increased business and revenue opportunities by offering value-added services to their corporate clients,” says Ball.
Kefei ChangHead of FX4Cash Asia Pacifi c
FX4Cash improves effi ciency, saves cost and mitigates risk.
ABJ ISS-92(PG1-47).indd 11ABJ ISS-92(PG1-47).indd 11 8/28/09 1:03:21 AM8/28/09 1:03:21 AM
THE ASIAN BANKER
12 ISSUE 92The Asian Banker
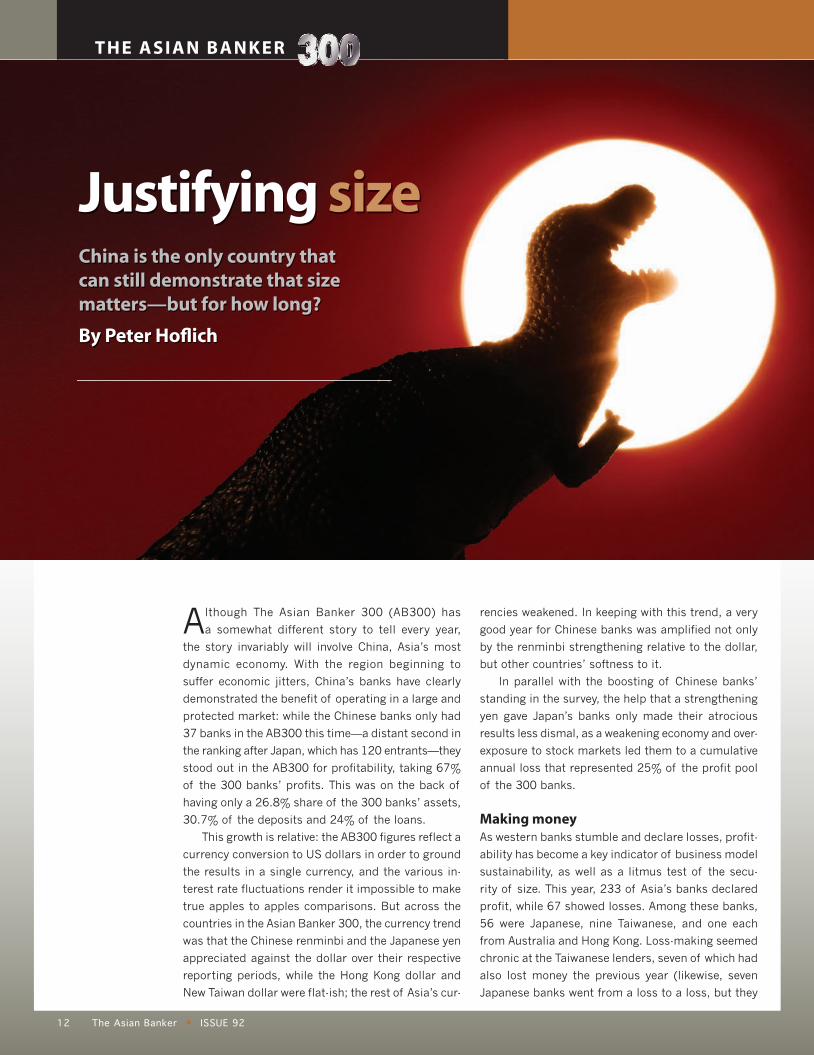
Although The Asian Banker 300 (AB300) has
a somewhat different story to tell every year,
the story invariably will involve China, Asia’s most
dynamic economy. With the region beginning to
suffer economic jitters, China’s banks have clearly
demonstrated the benefit of operating in a large and
protected market: while the Chinese banks only had
37 banks in the AB300 this time—a distant second in
the ranking after Japan, which has 120 entrants—they
stood out in the AB300 for profitability, taking 67%
of the 300 banks’ profits. This was on the back of
having only a 26.8% share of the 300 banks’ assets,
30.7% of the deposits and 24% of the loans.
This growth is relative: the AB300 figures reflect a
currency conversion to US dollars in order to ground
the results in a single currency, and the various in-
terest rate fluctuations render it impossible to make
true apples to apples comparisons. But across the
countries in the Asian Banker 300, the currency trend
was that the Chinese renminbi and the Japanese yen
appreciated against the dollar over their respective
reporting periods, while the Hong Kong dollar and
New Taiwan dollar were flat-ish; the rest of Asia’s cur-
rencies weakened. In keeping with this trend, a very
good year for Chinese banks was amplified not only
by the renminbi strengthening relative to the dollar,
but other countries’ softness to it.
In parallel with the boosting of Chinese banks’
standing in the survey, the help that a strengthening
yen gave Japan’s banks only made their atrocious
results less dismal, as a weakening economy and over-
exposure to stock markets led them to a cumulative
annual loss that represented 25% of the profit pool
of the 300 banks.
Making moneyAs western banks stumble and declare losses, profit-
ability has become a key indicator of business model
sustainability, as well as a litmus test of the secu-
rity of size. This year, 233 of Asia’s banks declared
profit, while 67 showed losses. Among these banks,
56 were Japanese, nine Taiwanese, and one each
from Australia and Hong Kong. Loss-making seemed
chronic at the Taiwanese lenders, seven of which had
also lost money the previous year (likewise, seven
Japanese banks went from a loss to a loss, but they
Justifying sizeChina is the only country that can still demonstrate that size matters—but for how long?
By Peter Hofl ich
ABJ ISS-92(PG1-47).indd 12ABJ ISS-92(PG1-47).indd 12 8/28/09 1:03:23 AM8/28/09 1:03:23 AM

13 ISSUE 92 The Asian Banker
are anomalies as the 49 other loss-making banks had
at least been profitable in 2007). Nevertheless, for
banks that declared losses in 2007 at the height of
the economic cycle, continuing losses in 2008 may
indicate the start of a death spiral. This is particularly
worrisome for Taiwan, which has already seen a round
of failing lenders sold to foreign banks.
Keeping it all relativeThe long-term trends in the AB300 show what a roller
coaster Asia’s banks have been on. In 2007, Japan
and Australia were close in their profitability, exceeded
somewhat by China, while in 2006 and 2005, Japa-
nese banks had been the most profitable by a clear
margin (Australia, China, Hong Kong and Japan are
the only countries that have ever seen their share of
profits in the double digits).
Although Japanese financial institutions will be
the largest for some time to come—the 120 Japanese
banks in the listing hold 43% of the region’s assets, the
only country in the listing besides China to have ever
held a double-digit percentile—they may never again
have the percentage of profitability that they once
had. Even with their disadvantaged currencies, and the
heavy profitability of the Chinese banks, most of the
other countries in Asia gained ground in profitability in
this year’s ranking. Exceptions were South Korea, which
suffered a mini funding and currency crisis, Pakistan,
which suffered severe political problems in a year rife
with political assassination and unrest, and New Zea-
land, which went into recession earlier than any other
country in the Asia Pacific region. Japanese banks also
trail all of the countries in terms of its liquidity as well
as percentage of non-interest income.
But it is not just Japan that has suffered, the
entire region has seen total profits stagger, dropping
to only $99 billion, a level not seen since 2004. And
while assets and deposits continue to grow, loans
have fallen too. With the drop in lending, and with
margins tightening in aggressive lending markets
such as China, profits in 2009 will probably continue
to weaken.
What is The Asian Banker 300?Now in its eighth year, The Asian Banker 300 (AB300) is an annual study of the financial and business per-
formance of the commercial banking industry in the Asia Pacific region. The study comprises two different
lists: the first ranks the top 300 banks in the region by asset size, while the second ranks the same 300 banks
by strength—an evaluation that is based on a belief that a strong bank demonstrates long-term profitability
from its core businesses.
Which banks are included?The Asian Banker ranks financial institutions by asset size and focuses on Asia Pacific banks east of Iran. We
publish online an expanded version of this list, The Asian Banker 500, which includes banks from the Middle
East and Central Asia as well. The focus of the list is on commercial banks and financial holding companies
with a significant proportion of activity in commercial banking; the AB300 does not include central banks,
policy banks or finance companies.
How do we collect and treat the data? Bank annual reports and statistics provided by central banks or industry associations are our main sources
of data. In the absence of up-to-date annual reports, we contact banks directly to source financial results.
Consolidated figures are used for banking groups, except when non-banking activities account for a substantial
portion of the consolidated figures. All figures are converted into US dollars using rates current at the end
of the banks’ respective financial years.
Who puts The AB300 together? The team of researchers who created the AB300 is led by Yi Yuandong. With quantitative
analytical skills honed by a background in consulting, Yuandong has guided the team in
scouring a broad range of data sources for robust figures, while also constructing a powerful
analytical platform that will be expanded to all of the 500 banks in the ranking’s interactive
online version.
(Continued on page 16)
ABJ ISS-92(PG1-47).indd 13ABJ ISS-92(PG1-47).indd 13 8/28/09 1:03:27 AM8/28/09 1:03:27 AM

CO - PUBL I SHED ART ICLE
ISSUE 92The Asian Banker14
Banks that have spent large amounts of money acquiring new customers report that up to 30% of these are lost in the fi rst year. Given that acquiring new customers is a
far more expensive process than keeping existing ones, the key question must be: “Why do people change banks and how can you minimise the chances of them leaving?”
A recent Forrester report highlights the importance of consistent, high quality customer service when it states that “each interaction represents an opportunity to keep or lose your most important customers”.
For a bank, those interactions could be with real people (at the branch or call centre) or with self-service channels (ATMs and online). At the branch, a bad experience could mean a rude member of staff or having to wait in line. At an ATM, it could be the machine being ‘down’ or a particular service not being available.
In all cases, the frustrated customer leaves with a lower opinion of the bank and will be more receptive to a competitor’s timely piece of marketing. With a lost opportunity goes an entire customer relationship with all the cross-selling opportunities involved.
The bottom line is that a large bank could experience a swing in revenue by as much as $242 million, depending on the level of customer experience it provides.
The good news is that the channel through which banks can most easily differentiate themselves is also the most visible and most likely to attract the customers of other fi nancial institutions—the ATM network.
Other banks’ customers may never walk into your branches, visit your website or ring your call centre. But they may use your ATMs once a week or more, making them the public face of your brand.
The average customer uses an ATM fi ve times a month. That’s fi ve opportunities to impress. For banks that have failed to keep pace with the latest technology developments, it could also represent fi ve situations where the customer will leave dissatisfi ed, either with the range of services, the speed of the transaction or with the availability of the ATM to complete the transaction they require.
Today’s ‘iPhone lifestyles’ mean consumers expect quick, slick services to be available wherever and whenever they want them.
For an institution that wishes to differentiate itself from the competition the message is simple: your self-service channel needs to do more, be more attractive, easier to use, faster and more reliable.
A recent Aite study demonstrated that “the age of banks’ ATMs affects ATM channel service performance.” They found 75% of bank executives who managed a network with an average ATM age of less than fi ve years ranked their network in the top quartile, whereas only 55% of bankers with an ATM channel more than six years old did so.
Our own latest generation of ATMs—NCR SelfServ—provides banks with a key com-petitive advantage in delivering the services customers require. Whether it’s in terms of functionality, delivery, ease of use, speed, reliability or enhanced security, the new ATMs have incorporated customer needs into the design.
Retaining customers with modern self-service
The latest generation of ATMs delivers the key services sought by banks’ customers
“Each interaction
represents an
opportunity to keep
or lose your most
important customers”.
Forrester
ABJ ISS-92(PG1-47).indd 14ABJ ISS-92(PG1-47).indd 14 8/28/09 1:03:32 AM8/28/09 1:03:32 AM
ISSUE 92 The Asian Banker 15
Functionality. Adding new features and functionality are of key importance. As well as providing the services customers increasingly require, such as automated deposit and bill payment, another key ele-ment of customer service is personalisation of ATM transactions. Speed to market for new ATMs and new transactions is vital to ensuring best in class service. Looking forward, as new payment mechanisms evolve, it is also important that developments such as contactless cards and mobile payments can be integrated.
Availability. Availability is about delivering transactions that are 100% successful every time and thereby ensuring satisfi ed customers. Equally important is ensuring this is done in a cost-effective manner, using com-prehensive performance information to enable best practice management of the self service network.
In order to ensure maximum ATM availability remote servicing is key, avoiding time consuming call-outs. Firmware updates and ‘soft’ upgrades are downloadable to the ATM without the need for a site visit. And these days that’s not all—NCR SelfServ is the only ATM to offer self-healing capabilities, providing an automatic return to service for ‘soft’ failures, reducing downtime from two to three hours, to 10 to 15 minutes. In busy locations, where every minute counts, this is a massive advance.
An examination of ATM downtime reveals that over half of all downtime is due to low-level maintenance tasks such as clearing card or paper jams. With NCR SelfServ, this has been addressed by the introduction of interactive full motion video allowing on-the-spot training and speeding up the process.
“Our ATM channel plays a key part in how our customers perceive us, and maintaining the highest levels of availability is key to providing exceptional customer service” says Fatih Bektasoglu, business unit manager at Garanti Bank in Turkey. “With unique technologies, NCR has enabled us to provide 24/7 availability and provide superior service to our customers”.
Confi dence. It is essential that customers are confi dent in using the ATMs. The intro-duction of superior security features limits customer exposure to fraud and, for the bank, lessens the possibility of being targeted for attack, with the attendant negative publicity. The latest generation of NCR ATMs has a unique portfolio of security features to protect the ATM at every possible point of compromise.
Convenience and Speed. Though such measures are not always clear to customers, one more obvious benefi t is improvements in the ease of use and speed of transactions. China Bank’s SelfServ ATMs in the Philippines have cut cash withdrawal times by a third, to about 30 seconds, reducing queues and improving the customer experience.
Carol L. Chua, assistant vice president and head of China Bank’s ATM center division, says, “This new technology from NCR is already enhancing our customers’ experience. Almost immediately after we installed our fi rst SelfServ machine, we got customer feedback saying this machine was far, far faster than its predecessor. We’re very pleased.”
Responsibility. One other thing that customers increasingly expect from their banks is a sense of corporate responsibility, adopting policies to reduce environmental impact. SelfServ ATMs deploy dual-roll two-sided thermal printing technology (2ST). This is patented to print on both sides of a thermal paper receipt, reducing paper consumption up to 45%. The dual roll also means no more ‘out of paper’ calls and eliminates up to 20% waste per roll.
In the current environment, customer loyalty is paramount, and at a time when only exceptional service will suffi ce, NCR’s technologically advanced SelfServ ATMs exceed expectations, enabling broad functionality, high levels of availability, fast, secure transac-tions and low operating costs. Smart capital expenditure can generate the exceptional service that will help your customers remain your customers.
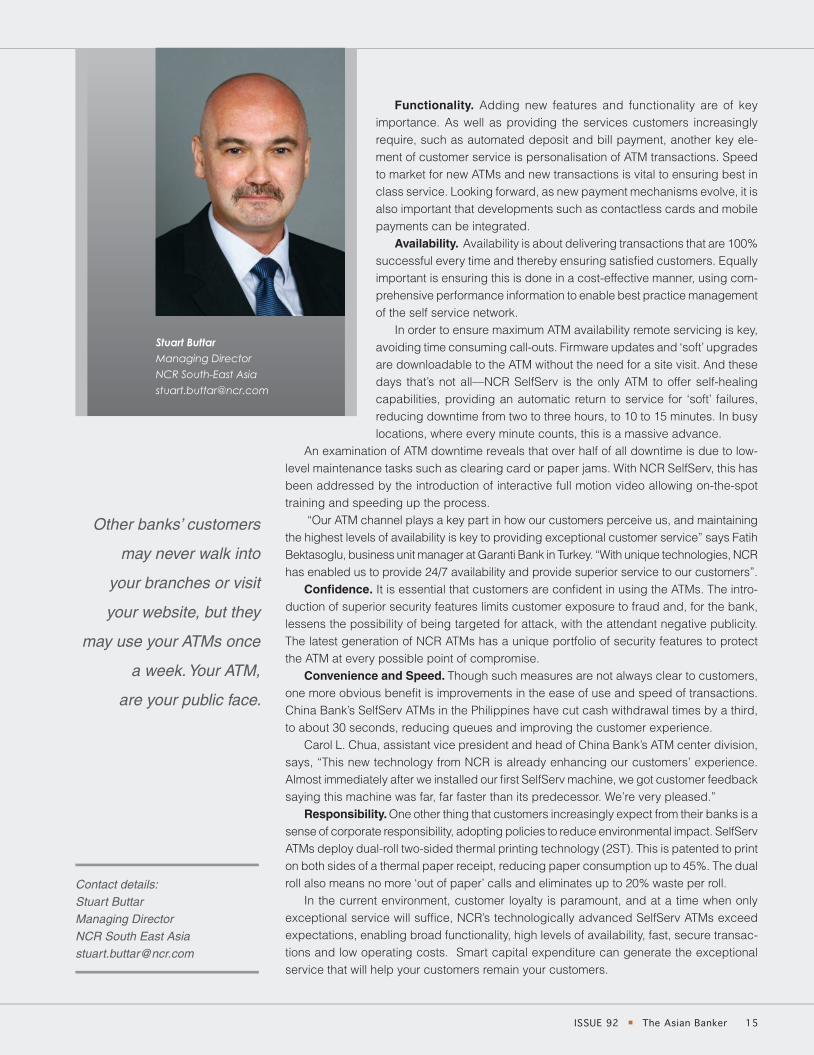
Stuart ButtarManaging Director
NCR South-East Asia
Contact details: Stuart ButtarManaging DirectorNCR South East [email protected]
Other banks’ customers
may never walk into
your branches or visit
your website, but they
may use your ATMs once
a week. Your ATM,
are your public face.
ABJ ISS-92(PG1-47).indd 15ABJ ISS-92(PG1-47).indd 15 8/28/09 1:03:33 AM8/28/09 1:03:33 AM

THE ASIAN BANKER
16 ISSUE 92The Asian Banker
THE ASIAN BANKER
16 ISSUE 92The Asian Banker
Chinese banks were the most profi table by far
1,858.4
6,697.2
1,074.3
956.9
115.3
10,951.8
391.4
108.3
27.8
55.1
465.3
1,187.7
851.3
228.9
56.2
25,026
12.6%
67.5%
11.1%
9.5%
1.9%
-25.3%
4.7%
1.1%
0.5%
0.4%
4.6%
6.3%
2.0%
2.4%
0.6%
100%
12.5
66.9
11.0
9.4
1.9
-25.1
4.7
1.1
0.5
0.4
4.5
6.2
2.0
2.4
0.6
99
4.3%
30.7%
4.3%
4.0%
0.5%
44.0%
1.6%
0.3%
0.1%
0.2%
1.6%
3.4%
3.6%
1.0%
0.2%
100%
748.50
5,313.71
749.05
696.55
93.28
7,619.51
285.64
59.62
20.22
43.01
282.01
593.97
619.51
171.81
39.25
17,336
9.1%
24.0%
3.0%
4.0%
0.5%
44.0%
1.7%
0.6%
0.1%
0.2%
1.6%
5.8%
3.9%
1.2%
0.3%
100%
1,214.3
3,194.3
403.5
538.1
61.3
5,871.9
226.7
86.6
15.8
24.5
219.8
772.5
514.2
155.2
36.2
13,335
7.4%
26.8%
4.3%
3.8%
0.5%
43.8%
1.6%
0.4%
0.1%
0.2%
1.9%
4.7%
3.4%
0.9%
0.2%
100%
Australia
China
Hong Kong
India
Indonesia
Japan
Malaysia
New Zealand
Pakistan
Philippines
Singapore
S.Korea
Taiwan
Thailand
Vietnam
TOTAL
13
37
15
27
6
120
16
2
3
4
4
14
26
9
4
300
CountryNumber of banks in AB300
Total Assets ($bn)
Share of Total Assets
Total Loans ($bn)
Share of Total Loans
Share of Total Deposits
Total Net Profit ($bn)
Share of TotalNet Profit
Total Deposits ($bn)
Source: Asian Banker Research
Getting realIn 2008, it was typically banks in emerging markets
that focussed on the fundamentals of banking: taking
deposits and dispersing loans. This makes greater
sense these days anyway, now that the call for “back-
to-basics, boring” banking has become deafening.
The highest-growing banks in deposits were typi-
cally the Chinese banks, and 39 of the fifty fastest-
growing banks are from emerging markets. Among the
developed market banks, Korean institutions were the
most aggressive in gathering deposits, with several
large Korean banks such as Standard Chartered Korea
and Woori Financial Group engaged in significant de-
posit-gathering exercises. Standard Chartered Bank
also aggressively sought deposits in Hong Kong, its
second-largest market after South Korea.
(Continued from page 13)
AB300 online version will expand coverage to 500 banksw w w . t h e a s i a n b a n k e r . c o m
The story is even more polarised in the case of
loans, where developed market banks hold only six
of the top fifty positions, and where Indian banks like
HDFC Bank—which took over Centurion Bank of Pun-
jab—and Central Bank of India, Indian Bank, Axis Bank
and Bank of Baroda pushed out loans at percentages
from 34% to 56% greater than the previous year.
With banks in developed markets laying low in
lending, it remains to be seen where aggressive lend-
ing will lead Asia’s emerging market banks in this era
of economic uncertainty. But this will surely start to
become apparent by next year’s AB300.
ABJ ISS-92(PG1-47).indd 16ABJ ISS-92(PG1-47).indd 16 8/28/09 1:03:35 AM8/28/09 1:03:35 AM

17 ISSUE 92 The Asian Banker
A Affi n Bank Malaysia 267Agricultural Bank of Taiwan Taiwan 227Agricultural Bank of China China 6Aichi Bank Japan 139Akita Bank Japan 154Allahabad Bank India 177Alliance Financial Group Malaysia 294AMMB Holdings Malaysia 147Andhra Bank India 248ANZ National Bank New Zealand 60Aomori Bank Japan 159Aozora Bank4 Japan 65Ashikaga Bank Japan 92Australia and New Zealand Banking Group Australia 14Awa Bank Japan 138AXIS Bank India 133
B Banco de Oro Unibank Philippines 195Bangkok Bank Thailand 89Bank Central Asia Indonesia 168Bank CIMB Niaga5 Indonesia 268Bank Danamon Indonesia 263Bank for Investment and Development of Vietnam Vietnam 217Bank Kerjasama Rakyat Malaysia Malaysia 241Bank Mandiri Indonesia 129Bank Negara Indonesia Indonesia 185Bank of Ayudhya Thailand 171Bank of Beijing China 74Bank of Baroda India 90Bank of Communications China 12Bank of China China 7Bank of Dalian China 235Bank of East Asia Hong Kong 80Bank of East Asia (China) China 191Bank of Fukuoka Japan 49Bank of Hangzhou China 212Bank of Ikeda Japan 140Bank of India India 93Bank of Iwate Japan 144Bank of Jiangsu China 123Bank of Kochi Japan 265Bank of Kyoto Japan 59Bank of Maharashtra India 239Bank of Nagoya Japan 124Bank of Nanjing China 224Bank of New Zealand New Zealand 114Bank of Ningbo China 208Bank of Okinawa Japan 199Bank of Queensland Australia 174Bank of Saga Japan 170Bank of Shanghai China 78Bank of Taiwan Taiwan 40Bank of the Philippine Islands Philippines 220Bank of the Ryukyus Japan 196Bank of Tianjin China 209Bank of Western Australia2 Australia 94Bank of Yokohama Japan 30Bank Rakyat Indonesia Indonesia 167Beijing Rural Commercial Bank China 142Bank SinoPac Taiwan 131Bendigo and Adelaide Bank1 Australia 125BIMB Holdings Malaysia 296
List of Asia Pacifi c’s Largest Banks
Biwako Bank Japan 243BOC Hong Kong Holdings Hong Kong 29Bumiputra-Commerce Holdings Malaysia 76Busan Bank S.Korea 166
C Canara Bank India 96Cathay United Bank Taiwan 104Central Bank of India India 150Chang Hwa Commercial Bank Taiwan 100Changsha City Commercial Bank China 292Chiba Kogyo Bank Japan 161Chiba Bank Japan 39China Bohai Bank China 272China CITIC Bank China 25China Construction Bank China 5China Development Financial Holding Taiwan 253China Everbright Bank China 34China Merchants Bank China 20China Minsheng Banking Corporation China 27China Zheshang Bank China 238Chinatrust Commercial Bank Taiwan 84Chinese Mercantile Bank China 270Chong Hing Bank Hong Kong 277Chugoku Bank Japan 69Chukyo Bank Japan 186Chuo Mitsui Trust Holdings Japan 26Citibank (Australia) Australia 225Citibank (Hong Kong) Hong Kong 211Citibank (India) India 193Citibank (Japan) Japan 62Citibank (Korea) S.Korea 87Citibank (Malaysia) Malaysia 226Citibank (Singapore) Singapore 122CITIC Ka Wah Bank Hong Kong 202Commonwealth Bank of Australia2 Australia 13Corporation Bank India 188
D Daegu Bank S.Korea 173Dah Sing Banking Group Hong Kong 214Daisan Bank Japan 182Daishi Bank Japan 91DBS Group Singapore 24Dena Bank India 261Deutsche Bank (Australia) Australia 189Dongguan City Commercial Bank China 271
E eBANK Japan 276Ehime Bank Japan 187Eighteenth Bank Japan 149EnTie Commercial Bank Taiwan 282EON Capital Malaysia 234Evergrowing Bank China 203E. Sun Commercial Bank Taiwan 155
F Far Eastern International Bank Taiwan 254First Bank of Toyama Japan 251First Commercial Bank Taiwan 82Fubon Bank (Hong Kong) Hong Kong 281
Name Country Rank Name Country Rank
ABJ ISS-92(PG1-47).indd 17ABJ ISS-92(PG1-47).indd 17 8/28/09 1:03:36 AM8/28/09 1:03:36 AM

18 ISSUE 92The Asian Banker
THE ASIAN BANKER
List of Asia Pacifi c’s Largest BanksName Country Rank Name Country Rank
Fukui Bank Japan 160Fukuoka Financial Group Japan 35
G Gifu Bank Japan 279Guangdong Development Bank China 53Gunma Bank Japan 68
H Habib Bank Pakistan 266Hachijuni Bank Japan 66Hana Financial Group S.Korea 33Hang Seng Bank Hong Kong 48HDFC Bank6 India 109Higashi-Nippon Bank Japan 179Higo Bank Japan 106Hiroshima Bank Japan 64Hokkaido Bank Japan 101Hokkoku Bank Japan 121Hokuetsu Bank Japan 158Hokuhoku Financial Group Japan 42Hokuriku Bank Japan 73Hokuto Bank Japan 246Hokuyo Bank Japan 61Hong Leong Financial Group Malaysia 157Hongkong and Shanghai Banking Corporation Hong Kong 9HSBC Bank (China) China 165HSBC Bank (India) India 204HSBC Bank (Malaysia) Malaysia 206Hua Nan Commercial Bank Taiwan 85Hua Xia Bank China 41Huishang Bank China 181Hyakugo Bank Japan 98Hyakujushi Bank Japan 105
I Ibaraki Bank Japan 285Ibarakiken Credit Cooperative Japan 244ICICI Bank India 46Indian Bank India 213Indian Overseas Bank India 153Industrial and Commercial Bank of China China 3Industrial and Commercial Bank of China (Asia) Hong Kong 152Industrial Bank China 28Industrial Bank of Korea S.Korea 38Industrial Bank of Taiwan Taiwan 275ING Bank (Australia) Australia 126Iyo Bank Japan 79
J Japan Trustee Services Bank Japan 228Jammu and Kashmir Bank India 300Jiangnan Rural Credit Cooperatives of Wuhan China 284Joyo Bank Japan 52Juroku Bank Japan 95
K Kagawa Bank Japan 223Kagoshima Bank Japan 119
Kansai Urban Banking Corporation Japan 110Kanto Tsukuba Bank Japan 219Kasikornbank Thailand 113Keiyo Bank Japan 116Kirayaka Bank Japan 237Kita-Nippon Bank Japan 231Kiyo Holdings Japan 107Kookmin Bank S.Korea 21Korea Exchange Bank S.Korea 50Korean Federation of Community Credit Cooperatives S.Korea 247Kotak Mahindra Bank India 287Krung Thai Bank Thailand 108Kumamoto Family Bank Japan 232Kwangju Bank S.Korea 236Kyongnam Bank S.Korea 197
L Land Bank of the Philippines Philippines 289Land Bank of Taiwan Taiwan 72
M Macquarie Group Australia 43Maybank Malaysia 55Mega International Commercial Bank Taiwan 70Metropolitan Bank and Trust Philippines 198Michinoku Bank Japan 178MIE Bank Japan 192Minato Bank Japan 132Mitsubishi UFJ Financial Group Japan 1Miura Fujisawa Shinkin Bank Japan 295Miyazaki Bank Japan 175Mizuho Financial Group Japan 2Momiji Bank Japan 135Musashino Bank Japan 111
N Nagano Bank Japan 264Nagano Shinkin Bank Japan 293Naganoken Credit Cooperative Japan 288Nanto Bank Japan 86Nanyang Commercial Bank Hong Kong 201National Bank of Pakistan Pakistan 258National Australia Bank Australia 10Nishi-Nippon City Bank Japan 57Norinchukin Bank Japan 8
O OCBC Bank (Malaysia) Malaysia 222Ogaki Kyoritsu Bank Japan 102Oita Bank Japan 136Oriental Bank of Commerce India 162Orix Corporation Japan 47Oversea-Chinese Banking Corporation Singapore 32
P Ping An Bank China 172Public Bank Malaysia 77Punjab and Sind Bank India 280Punjab National Bank India 83
ABJ ISS-92(PG1-47).indd 18ABJ ISS-92(PG1-47).indd 18 8/28/09 1:03:37 AM8/28/09 1:03:37 AM

19 ISSUE 92 The Asian Banker
The branch as the key delivery channel for retail banks
Integrating the branch into Wincor Nixdorf’s ProClassic/Enterprise Retail Banking Solution Suite creates a versatile service platform for innovative retail banks
CO - PUBL I SHED ART ICLE
ISSUE 92 The Asian Banker 19
Contact details: Kasten KemnaRegional Marketing DirectorBanking Division Asia Pacifi cWincor Nixdorf2 Kallang SectorSingapore 349277Phone (65) [email protected]
Innovative Wincor Nixdorf branch design
Case Study: In May 2009, Baden-Württembergische Bank (BW-Bank), deployed ProClassic/Enter-prise Retail Banking Solution Suite (PC/E) in its 200 branches. The bank also rolled out new software to tailor offers to customers’ individual needs via its self-service, online banking and telephone banking channels.
BW-Bank has been operating 330 self-service terminals with PC/E since 2003. In 2006, the bank asked Wincor Nixdorf to extend its use of PC/E to include management of its ATS that will emulate front-offi ce processes . The bank plans to use the Teller Operations solution to handle processes such as teller account management and account transactions.
The use of standard software means that the bank will be able to implement fur-ther developments and changes resulting from legal stipulations or process changes at greater speed than before. In late 2009, BW-Bank will pilot one-to-one marketing software, PC/E Direct Marketing, to establish and personalise contact with customers across all its delivery channels.
Source: Wincor Nixdorf, press release, “BW-Bank adds direct marketing and front-offi ce processes to ProClassic Enterprise”
ProClassic/Enterprise (PC/E) Retail Banking Solution Suite is a modular software suite that focuses on sales and service processes in retail banks. It combines channel delivery,
security, management and optimization, and banking business capabilities, and allows banks to render themselves future-proof and expandable by transforming their IT architectures.
The suite’s net-centric concept ensures that new services and functions are quickly implemented and centrally managed. The packages are based on a service-oriented multi-channel concept that allows individual functions and services to be reused across all delivery channels. Focussing on branches, the following innovative modules are available to optimize processes and maximize return on investment: Teller Operations: Caters to transactions around cash-handling and account-related
services at the counter. This solution makes customer transactions leaner and more effi cient, and eases processes in the branch, such as end-of-day teller closing.
ATS Manager: Smoothly connects the automated teller safe (ATS, also known as TAU or TCR) device with the teller application to ensure secure cash-in and -out transactions at the teller to streamline cash processes in the branch. The software consolidates all cash transactions, linking them to individual customers and teller operators.
Peripheral Management: Optimizes the connection and management of the multiple peripherals that typically exist in a branch, such as card readers, document printers or signature pads. From a central management console, the software can react fl exibly when devices are out of order and provides alternative access.These three software products help banks streamline teller operations and maximize
customer service levels, providing bank staff a seamless and modern user interface to allow time for sales and consulting services.
ABJ ISS-92(PG1-47).indd 19ABJ ISS-92(PG1-47).indd 19 8/28/09 1:03:39 AM8/28/09 1:03:39 AM

20 ISSUE 92The Asian Banker
THE ASIAN BANKER
List of Asia Pacifi c’s Largest BanksName Country Rank Name Country Rank
R Resona Holdings Japan 11RHB Capital Malaysia 134Rokinren Bank Japan 88Rural Credit Cooperatives Union of Shunde China 259
S Saikyo Bank Japan 291San-In Godo Bank Japan 103Sapporo Hokuyo Holdings Japan 54Sendai Bank Japan 283Senshu Bank Japan 156Shanghai Commercial and Savings Bank Taiwan 130Shanghai Commercial Bank Hong Kong 218Shanghai Rural Commercial Bank China 151Shanghai Pudong Development Bank China 23Shenzhen Development Bank China 63Shiga Bank Japan 97Shikoku Bank Japan 143Shimizu Bank Japan 210Shinhan Financial Group S.Korea 22Shinkin Central Bank Japan 16Shinkumi Federation Bank Japan 99Shinsei Bank4 Japan 36Shinwa Bank Japan 169Shizuoka Bank Japan 45Shoko Chukin Bank Japan 37Shonai Bank Japan 260Siam City Bank Thailand 242Siam Commercial Bank Thailand 117Sony Bank Japan 205St George Bank3 Australia 44Standard Chartered Bank (China) China 216Standard Chartered Bank (India) India 207Standard Chartered Bank (Korea) S.Korea 75Standard Chartered Bank (Malaysia) Malaysia 233Standard Chartered Bank (Taiwan) Taiwan 215Standard Chartered Bank (Thailand) Thailand 286Standard Chartered Bank (Hong Kong) Hong Kong 56State Bank of India India 17Suhyup Bank S.Korea 200Sumitomo Mitsui Financial Group Japan 4Sumitomo Trust and Banking Japan 18Suncorp-Metway Australia 67Suruga Bank Japan 120Syndicate Bank India 141
T Ta Chong Bank Taiwan 262Taichung Commercial Bank Taiwan 278
Taiko Bank Japan 221Taipei Fubon Commercial Bank Taiwan 115Taishin International Bank Taiwan 148Taiwan Business Bank Taiwan 118Taiwan Cooperative Bank Taiwan 58Taiwan Shin Kong Commercial Bank Taiwan 240Tajima Bank Japan 273Takinogawa Shinkin Bank Japan 297Thanachart Bank Thailand 255TMB Bank Thailand 194Tochigi Bank Japan 146Toho Bank Japan 128Tokushima Bank Japan 229Tokyo Shinkin Bank Japan 298Tokyo Star Bank Japan 180Tokyo Tomin Bank Japan 145Tomato Bank Japan 269Tottori Bank Japan 274Towa Bank Japan 184Trust and Custody Services Bank Japan 290
U UCO Bank India 164Union Bank of India India 127Union Bank of Taiwan Taiwan 256United Bank Pakistan 299United Bank of India India 252United Overseas Bank (Malaysia) Malaysia 245United Overseas Bank Singapore 31
V Vietnam Bank for Agriculture and Rural Development Vietnam 183Vietnam Bank for Foreign Trade Vietnam 249Vietnam Bank for Industry and Trade Vietnam 250
W Westpac Banking Corporation3 Australia 15Wing Hang Bank Hong Kong 190Wing Lung Bank Hong Kong 230Woori Financial Group S.Korea 19
Y Yachiyo Bank Japan 163Yamagata Bank Japan 176Yamaguchi Financial Group Japan 51Yamanashi Chuo Bank Japan 137Yuanta Commercial Bank Taiwan 257
77 Bank Japan 71
Bank-specifi c footnotes: • 1. Adelaide Bank and Bendigo Bank merged in November, 2008. • 2. Bank of Western Australia was acquired by Commonwealth Bank of Australia in December, 2008. • 3. Westpac Banking Corporation and St George Bank will complete their merger in late 2009. • 4. Aozora Bank and Shinsei Bank will merge in early 2010. • 5. Lippo Bank and Bank Niaga have been merged into Bank CIMB Niaga. • 6. HDFC Bank acquired Centurion Bank of Punjab.
ABJ ISS-92(PG1-47).indd 20ABJ ISS-92(PG1-47).indd 20 8/28/09 1:03:45 AM8/28/09 1:03:45 AM

21 ISSUE 92 The Asian Banker
ABJ ISS-92(PG1-47).indd 21ABJ ISS-92(PG1-47).indd 21 8/28/09 1:03:46 AM8/28/09 1:03:46 AM
22 ISSUE 92The Asian Banker
THE ASIAN BANKER
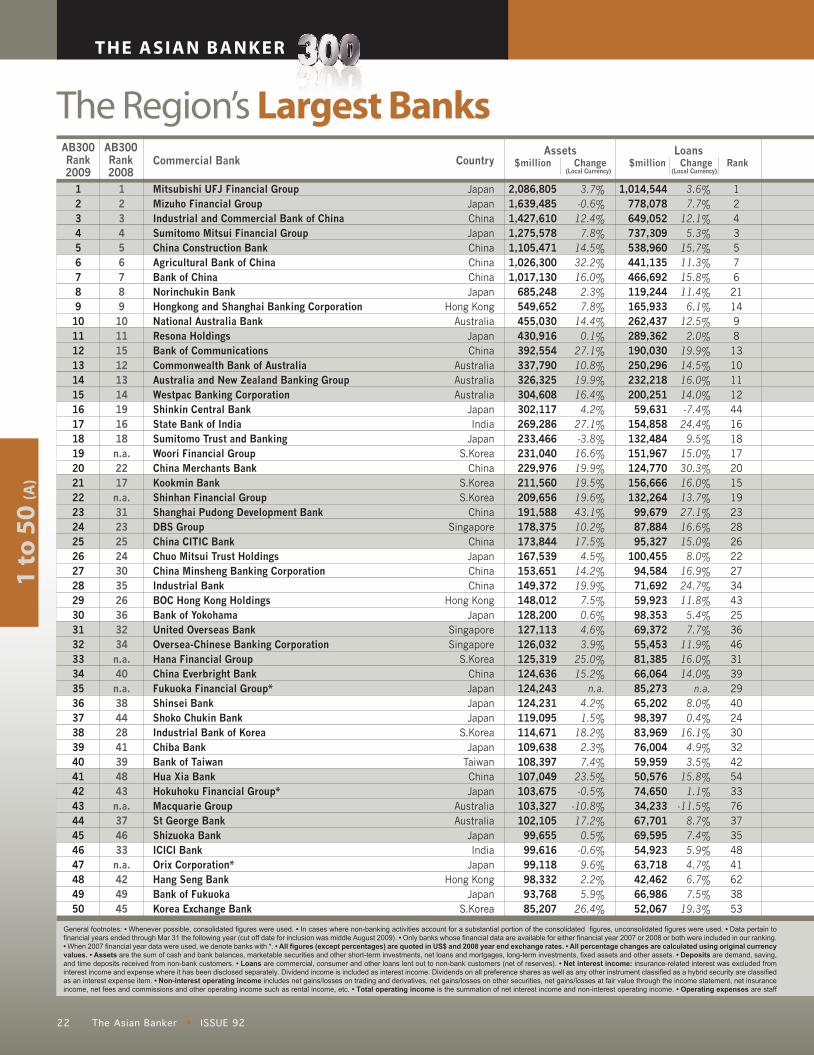
The Region’s Largest Banks
1 t
o 5
0 (A
)
2,086,8051,639,4851,427,6101,275,5781,105,4711,026,3001,017,130
685,248549,652455,030430,916392,554337,790326,325304,608302,117269,286233,466231,040229,976211,560209,656191,588178,375173,844167,539153,651149,372148,012128,200127,113126,032125,319124,636124,243124,231119,095114,671109,638108,397107,049103,675103,327102,105
99,65599,61699,11898,33293,76885,207
1,014,544778,078649,052737,309538,960441,135466,692119,244165,933262,437289,362190,030250,296232,218200,251
59,631154,858132,484151,967124,770156,666132,264
99,67987,88495,327
100,45594,58471,69259,92398,35369,37255,45381,38566,06485,27365,20298,39783,96976,00459,95950,57674,65034,23367,70169,59554,92363,71842,46266,98652,067
3.7%-0.6%12.4%7.8%14.5%32.2%16.0%2.3%7.8%14.4%0.1%27.1%10.8%19.9%16.4%4.2%27.1%-3.8%16.6%19.9%19.5%19.6%43.1%10.2%17.5%4.5%14.2%19.9%7.5%0.6%4.6%3.9%25.0%15.2%n.a.
4.2%1.5%18.2%2.3%7.4%23.5%-0.5%-10.8%17.2%0.5%-0.6%9.6%2.2%5.9%26.4%
3.6%7.7%12.1%5.3%15.7%11.3%15.8%11.4%6.1%12.5%2.0%19.9%14.5%16.0%14.0%-7.4%24.4%9.5%15.0%30.3%16.0%13.7%27.1%16.6%15.0%8.0%16.9%24.7%11.8%5.4%7.7%11.9%16.0%14.0%n.a.
8.0%0.4%16.1%4.9%3.5%15.8%1.1%
-11.5%8.7%7.4%5.9%4.7%6.7%7.5%19.3%
1243576
211498
131011124416181720151923282622273443253646313929402430324254337637354841623853
JapanJapanChinaJapanChinaChinaChinaJapan
Hong KongAustralia
JapanChina
AustraliaAustraliaAustralia
JapanIndia
JapanS.Korea
ChinaS.KoreaS.Korea
ChinaSingapore
ChinaJapanChinaChina
Hong KongJapan
SingaporeSingapore
S.KoreaChinaJapanJapanJapan
S.KoreaJapan
TaiwanChinaJapan
AustraliaAustralia
JapanIndia
JapanHong Kong
JapanS.Korea
General footnotes: • Whenever possible, consolidated figures were used. • In cases where non-banking activities account for a substantial portion of the consolidated figures, unconsolidated figures were used. • Data pertain to financial years ended through Mar 31 the following year (cut off date for inclusion was middle August 2009). • Only banks whose financial data are available for either financial year 2007 or 2008 or both were included in our ranking.• When 2007 financial year data were used, we denote banks with *. • All figures (except percentages) are quoted in US$ and 2008 year end exchange rates. • All percentage changes are calculated using original currency values. • Assets are the sum of cash and bank balances, marketable securities and other short-term investments, net loans and mortgages, long-term investments, fixed assets and other assets. • Deposits are demand, saving, and time deposits received from non-bank customers. • Loans are commercial, consumer and other loans lent out to non-bank customers (net of reserves). • Net interest income: insurance-related interest was excluded from interest income and expense where it has been disclosed separately. Dividend income is included as interest income. Dividends on all preference shares as well as any other instrument classified as a hybrid security are classified as an interest expense item. • Non-interest operating income includes net gains/losses on trading and derivatives, net gains/losses on other securities, net gains/losses at fair value through the income statement, net insurance income, net fees and commissions and other operating income such as rental income, etc. • Total operating income is the summation of net interest income and non-interest operating income. • Operating expenses are staff
Mitsubishi UFJ Financial GroupMizuho Financial GroupIndustrial and Commercial Bank of ChinaSumitomo Mitsui Financial GroupChina Construction BankAgricultural Bank of ChinaBank of ChinaNorinchukin BankHongkong and Shanghai Banking CorporationNational Australia BankResona HoldingsBank of CommunicationsCommonwealth Bank of AustraliaAustralia and New Zealand Banking GroupWestpac Banking CorporationShinkin Central BankState Bank of IndiaSumitomo Trust and BankingWoori Financial GroupChina Merchants BankKookmin BankShinhan Financial GroupShanghai Pudong Development BankDBS GroupChina CITIC BankChuo Mitsui Trust HoldingsChina Minsheng Banking CorporationIndustrial BankBOC Hong Kong HoldingsBank of YokohamaUnited Overseas BankOversea-Chinese Banking CorporationHana Financial GroupChina Everbright BankFukuoka Financial Group*Shinsei BankShoko Chukin BankIndustrial Bank of KoreaChiba BankBank of TaiwanHua Xia BankHokuhoku Financial Group*Macquarie GroupSt George BankShizuoka BankICICI BankOrix Corporation*Hang Seng BankBank of FukuokaKorea Exchange Bank
123456789
1011121314151617181920212223242526272829303132333435363738394041424344454647484950
123456789
101115121314191618n.a.2217n.a.31232524303526363234n.a.40n.a.38442841394843n.a.374633n.a.424945
AB300Rank2009
AB300Rank2008
Commercial Bank CountryAssets
$million ChangeLoans
$million Change Rank(Local Currency)(Local Currency)
ABJ ISS-92(PG1-47).indd 22ABJ ISS-92(PG1-47).indd 22 8/28/09 1:03:47 AM8/28/09 1:03:47 AM

23 ISSUE 92 The Asian Banker
123456789
1011121314151617181920212223242526272829303132333435363738394041424344454647484950
35,92019,69845,38623,74939,46830,87433,491-5,40316,032
8,5967,728
11,3079,5377,8947,543-467
10,4164,8225,4448,1266,5339,2125,0574,1735,9072,8085,0854,3533,2932,6283,6202,8682,2953,6141,9632,1101,4523,3331,688
8242,5772,0894,1442,3891,7317,7735,3093,0781,4582,724
23,19113,14316,31711,71814,33613,81516,721
1,2746,7434,9524,2373,7964,5593,8213,565
4945,4842,3263,2062,9763,5125,9761,8871,8861,9451,6402,2051,5402,6681,2271,4321,2831,8451,2181,2402,199
8451,383
959541
1,0681,0662,669
982953
5,8172,930
877892
1,113
-7.0%8.9%21.2%2.4%22.2%17.7%17.4%
-316.1%1.6%
-20.1%-4.7%23.1%8.3%5.8%7.7%
-144.3%19.4%7.6%-7.2%35.3%-9.3%-1.5%33.6%-2.2%44.4%-12.1%37.9%35.2%-6.3%1.5%7.9%0.5%
-20.3%23.2%n.a.
-22.3%-6.6%2.1%
-13.2%-80.5%23.5%1.1%
-14.7%7.3%9.0%10.1%-1.4%-6.3%-2.1%11.2%
3716254
3008
13179
111518
2981025211419122427203723263240293544305448733162
11342492843601622337139
-2.5%6.1%19.8%8.5%12.0%57.2%29.0%1.6%10.8%-0.6%-0.4%19.9%14.7%11.9%13.7%-5.3%11.0%4.0%9.0%41.7%5.1%89.8%32.4%-5.8%36.2%6.9%28.8%30.1%108.8%8.7%1.5%9.4%18.8%29.8%n.a.
16.5%4.1%5.4%0.9%
-85.8%26.6%3.4%
-27.9%4.3%4.3%4.2%7.0%2.2%6.1%5.6%
1,323,963850,463
1,203,208832,722932,888892,141746,702413,144348,630155,454353,805271,526182,696137,983119,944207,215203,653131,229127,924182,988128,820
83,496138,603118,023138,389
98,118114,976
92,530104,698111,936
82,11065,36974,21388,545
108,40766,25234,29932,36793,67881,41871,01491,91015,15039,79678,24650,626
n.a.76,37377,33343,425
-1.0%1.3%19.0%4.0%19.4%15.3%16.0%-3.4%4.5%10.2%1.5%20.4%20.4%13.9%13.6%1.0%30.7%0.3%38.2%32.5%14.2%20.1%23.4%11.1%20.2%9.0%17.1%25.3%1.5%1.9%10.5%6.0%16.9%11.9%n.a.
15.0%17.2%8.2%1.5%21.1%10.6%-0.4%38.6%18.9%1.3%-7.0%n.a.
8.3%3.2%36.4%
15263478
10169
1115192312132022142134172418292531282635474033274699
10330364432
174833762n.a.393872
21,62611,56638,48614,63132,90928,36223,840
-81110,047
7,4685,6079,6495,5055,4074,963
8355,9961,9184,9196,8605,8785,8434,6142,9955,2811,2434,4253,8322,6172,1022,5011,9432,4073,2681,6582,2371,3112,7731,624
7141,9741,488
6301,6961,4292,0151,3322,1051,2742,001
7.0%0.6%17.2%10.9%16.7%23.1%6.7%
-135.4%16.9%13.8%-2.6%22.1%12.9%7.4%14.4%17.2%23.3%7.6%19.2%38.3%4.8%11.7%30.4%4.6%37.9%8.8%33.9%25.6%4.5%3.4%20.4%23.7%11.6%25.7%n.a.
48.1%-8.3%13.6%4.4%38.3%20.0%-0.7%10.3%12.6%8.3%17.2%0.2%10.4%5.3%17.7%
5716234
3008
10159
161719891238201113142125186422232733283729244331582644
1043648
11442513455326135
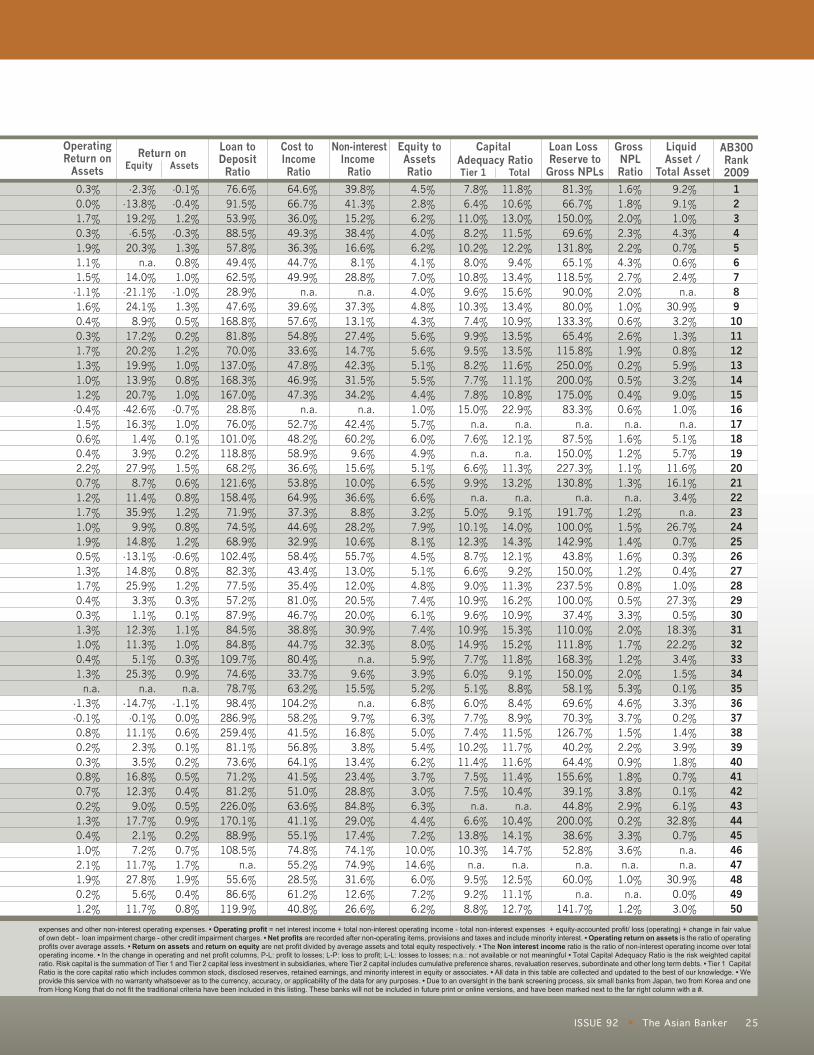
expenses and other non-interest operating expenses. • Operating profit = net interest income + total non-interest operating income - total non-interest expenses + equity-accounted profit/ loss (operating) + change in fair value of own debt - loan impairment charge - other credit impairment charges. • Net profits are recorded after non-operating items, provisions and taxes and include minority interest. • Operating return on assets is the ratio of operating profits over average assets. • Return on assets and return on equity are net profit divided by average assets and total equity respectively. • Τhe Non interest income ratio is the ratio of non-interest operating income over total operating income. • In the change in operating and net profit columns, P-L: profit to losses; L-P: loss to profit; L-L: losses to losses; n.a.: not available or not meaningful • Total Capital Adequacy Ratio is the risk weighted capital ratio. Risk capital is the summation of Tier 1 and Tier 2 capital less investment in subsidiaries, where Tier 2 capital includes cumulative preference shares, revaluation reserves, subordinate and other long term debts. • Tier 1 Capital Ratio is the core capital ratio which includes common stock, disclosed reserves, retained earnings, and minority interest in equity or associates. • All data in this table are collected and updated to the best of our knowledge. • Weprovide this service with no warranty whatsoever as to the currency, accuracy, or applicability of the data for any purposes. • Due to an oversight in the bank screening process, six small banks from Japan, two from Korea and one from Hong Kong that do not fit the traditional criteria have been included in this listing. These banks will not be included in future print or online versions, and have been marked next to the far right column with a #.
AB300Rank2009
Operating Expenses$million Change
Deposits$million Change Rank
Total Operating Income$million Change Rank
Net Interest Income$million Change Rank
94,44246,13388,75950,81868,41142,51071,67727,46926,48919,49224,00121,96117,25417,79213,490
2,88315,40013,92911,36111,67313,83113,871
6,10214,04713,997
7,5867,8737,173
10,9067,8699,429
10,1437,3844,8626,4268,4577,5075,7295,9256,7444,0123,0936,5434,5107,1909,914
14,4265,9216,7865,307
162547389
1210111413228315192423212042171833313725322826355341303447433963764054362716443849
Shareholder’s Equity$million Rank
(Local Currency) (Local Currency) (Local Currency) (Local Currency)
ABJ ISS-92(PG1-47).indd 23ABJ ISS-92(PG1-47).indd 23 8/28/09 1:03:49 AM8/28/09 1:03:49 AM

24 ISSUE 92The Asian Banker
THE ASIAN BANKER
The Region’s Largest Banks
1 t
o 5
0 (B
)
6,372656
23,7273,556
19,8289,553
14,312-7,3738,7331,7711,4885,9474,3342,9743,332
-1,2403,6941,396
8864,5221,4162,4082,6261,7953,019
8671,9362,339
540368
1,6981,278
4501,476
402-1,611
-119869263256792714288
1,206396
1,0252,0131,807
143948
-46.6%-80.7%24.9%-63.2%19.8%-26.3%-0.3%P-L
-8.6%-66.0%-53.7%16.9%-4.4%-23.1%-5.6%P-L
28.0%-33.8%-63.3%31.3%-57.8%-57.1%42.2%-12.1%35.7%-44.9%17.5%29.8%-76.8%-70.4%-9.7%-23.5%-66.0%1.6%n.a.P-LP-L
-31.9%-70.4%-35.2%9.5%-1.2%-67.9%3.8%
-33.3%19.3%-19.2%-23.2%-72.1%-19.7%
6521
11243
2995
222479
1412
2951027388
261615211341191759812329662573
29627640
1091124548983076321820
15935
JapanJapanChinaJapanChinaChinaChinaJapan
Hong KongAustralia
JapanChina
AustraliaAustraliaAustralia
JapanIndia
JapanS.Korea
ChinaS.KoreaS.Korea
ChinaSingapore
ChinaJapanChinaChina
Hong KongJapan
SingaporeSingapore
S.KoreaChinaJapanJapanJapan
S.KoreaJapan
TaiwanChinaJapan
AustraliaAustralia
JapanIndia
JapanHong Kong
JapanS.Korea
General footnotes: • Whenever possible, consolidated figures were used. • In cases where non-banking activities account for a substantial portion of the consolidated figures, unconsolidated figures were used. • Data pertain to financial years ended through Mar 31 the following year (cut off date for inclusion was middle August 2009). • Only banks whose financial data are available for either financial year 2007 or 2008 or both were included in our ranking.• When 2007 financial year data were used, we denote banks with *. • All figures (except percentages) are quoted in US$ and 2008 year end exchange rates. • All percentage changes are calculated using original currency values. • Assets are the sum of cash and bank balances, marketable securities and other short-term investments, net loans and mortgages, long-term investments, fixed assets and other assets. • Deposits are demand, saving, and time deposits received from non-bank customers. • Loans are commercial, consumer and other loans lent out to non-bank customers (net of reserves). • Net interest income: insurance-related interest was excluded from interest income and expense where it has been disclosed separately. Dividend income is included as interest income. Dividends on all preference shares as well as any other instrument classified as a hybrid security are classified as an interest expense item. • Non-interest operating income includes net gains/losses on trading and derivatives, net gains/losses on other securities, net gains/losses at fair value through the income statement, net insurance income, net fees and commissions and other operating income such as rental income, etc. • Total operating income is the summation of net interest income and non-interest operating income. • Operating expenses are staff
Operating Profit$million Change RankCountry
Mitsubishi UFJ Financial GroupMizuho Financial GroupIndustrial and Commercial Bank of ChinaSumitomo Mitsui Financial GroupChina Construction BankAgricultural Bank of ChinaBank of ChinaNorinchukin BankHongkong and Shanghai Banking CorporationNational Australia BankResona HoldingsBank of CommunicationsCommonwealth Bank of AustraliaAustralia and New Zealand Banking GroupWestpac Banking CorporationShinkin Central BankState Bank of IndiaSumitomo Trust and BankingWoori Financial GroupChina Merchants BankKookmin BankShinhan Financial GroupShanghai Pudong Development BankDBS GroupChina CITIC BankChuo Mitsui Trust HoldingsChina Minsheng Banking CorporationIndustrial BankBOC Hong Kong HoldingsBank of YokohamaUnited Overseas BankOversea-Chinese Banking CorporationHana Financial GroupChina Everbright BankFukuoka Financial Group*Shinsei BankShoko Chukin BankIndustrial Bank of KoreaChiba BankBank of TaiwanHua Xia BankHokuhoku Financial Group*Macquarie GroupSt George BankShizuoka BankICICI BankOrix Corporation*Hang Seng BankBank of FukuokaKorea Exchange Bank
123456789
1011121314151617181920212223242526272829303132333435363738394041424344454647484950
123456789
101115121314191618n.a.2217n.a.31232524303526363234n.a.40n.a.38442841394843n.a.374633n.a.424945
-2,199-6,42016,274-3,48013,555
7,5289,641
-6,3067,0931,928
9804,1683,3412,2732,674
-2,0552,306
201467
3,0651,1581,6081,8311,4721,954-969
1,1461,666
38889
1,3371,251
3841,070
20-1,427
-9607141246449411621814159697
1,6621,819
320621
P-LP-L
35.2%P-L
34.0%17.5%6.2%P-L
-15.8%-47.4%-68.1%39.6%7.2%
-20.9%11.8%
P-L21.3%-79.2%-73.3%37.5%-46.1%-18.2%127.6%-12.9%60.5%
P-L23.6%32.6%-81.0%-88.5%-9.8%-16.0%-63.2%45.2%n.a.P-LP-L
-35.1%-72.6%-33.6%46.1%-4.6%-50.3%0.9%
-60.6%8.5%
-20.6%-24.2%54.9%-18.6%
295300
1298
243
2995
132567
119
2941097478
2218141912
292231657
16520215824
20629323838
1228251543627
1153117156835
Net Profit$million Change Rank
AB300Rank2009
AB300Rank2008
Commercial Bank(Local Currency) (Local Currency)
ABJ ISS-92(PG1-47).indd 24ABJ ISS-92(PG1-47).indd 24 8/28/09 1:03:50 AM8/28/09 1:03:50 AM
25 ISSUE 92 The Asian Banker
123456789
1011121314151617181920212223242526272829303132333435363738394041424344454647484950
-2.3%-13.8%19.2%-6.5%20.3%
n.a.14.0%
-21.1%24.1%
8.9%17.2%20.2%19.9%13.9%20.7%
-42.6%16.3%
1.4%3.9%
27.9%8.7%
11.4%35.9%
9.9%14.8%
-13.1%14.8%25.9%
3.3%1.1%
12.3%11.3%
5.1%25.3%
n.a.-14.7%
-0.1%11.1%
2.3%3.5%
16.8%12.3%
9.0%17.7%
2.1%7.2%
11.7%27.8%
5.6%11.7%
76.6%91.5%53.9%88.5%57.8%49.4%62.5%28.9%47.6%
168.8%81.8%70.0%
137.0%168.3%167.0%
28.8%76.0%
101.0%118.8%
68.2%121.6%158.4%
71.9%74.5%68.9%
102.4%82.3%77.5%57.2%87.9%84.5%84.8%
109.7%74.6%78.7%98.4%
286.9%259.4%
81.1%73.6%71.2%81.2%
226.0%170.1%
88.9%108.5%
n.a.55.6%86.6%
119.9%
4.5%2.8%6.2%4.0%6.2%4.1%7.0%4.0%4.8%4.3%5.6%5.6%5.1%5.5%4.4%1.0%5.7%6.0%4.9%5.1%6.5%6.6%3.2%7.9%8.1%4.5%5.1%4.8%7.4%6.1%7.4%8.0%5.9%3.9%5.2%6.8%6.3%5.0%5.4%6.2%3.7%3.0%6.3%4.4%7.2%
10.0%14.6%
6.0%7.2%6.2%
64.6%66.7%36.0%49.3%36.3%44.7%49.9%
n.a.39.6%57.6%54.8%33.6%47.8%46.9%47.3%
n.a.52.7%48.2%58.9%36.6%53.8%64.9%37.3%44.6%32.9%58.4%43.4%35.4%81.0%46.7%38.8%44.7%80.4%33.7%63.2%
104.2%58.2%41.5%56.8%64.1%41.5%51.0%63.6%41.1%55.1%74.8%55.2%28.5%61.2%40.8%
39.8%41.3%15.2%38.4%16.6%
8.1%28.8%
n.a.37.3%13.1%27.4%14.7%42.3%31.5%34.2%
n.a.42.4%60.2%
9.6%15.6%10.0%36.6%
8.8%28.2%10.6%55.7%13.0%12.0%20.5%20.0%30.9%32.3%
n.a.9.6%
15.5%n.a.
9.7%16.8%
3.8%13.4%23.4%28.8%84.8%29.0%17.4%74.1%74.9%31.6%12.6%26.6%
7.8%6.4%
11.0%8.2%
10.2%8.0%
10.8%9.6%
10.3%7.4%9.9%9.5%8.2%7.7%7.8%
15.0%n.a.
7.6%n.a.
6.6%9.9%
n.a.5.0%
10.1%12.3%
8.7%6.6%9.0%
10.9%9.6%
10.9%14.9%
7.7%6.0%5.1%6.0%7.7%7.4%
10.2%11.4%
7.5%7.5%
n.a.6.6%
13.8%10.3%
n.a. 9.5%9.2%8.8%
11.8%10.6%13.0%11.5%12.2%
9.4%13.4%15.6%13.4%10.9%13.5%13.5%11.6%11.1%10.8%22.9%
n.a.12.1%
n.a.11.3%13.2%
n.a.9.1%
14.0%14.3%12.1%
9.2%11.3%16.2%10.9%15.3%15.2%11.8%
9.1%8.8%8.4%8.9%
11.5%11.7%11.6%11.4%10.4%
n.a.10.4%14.1%14.7%
n.a. 12.5%11.1%12.7%
81.3%66.7%
150.0%69.6%
131.8%65.1%
118.5%90.0%80.0%
133.3%65.4%
115.8%250.0%200.0%175.0%
83.3%n.a.
87.5%150.0%227.3%130.8%
n.a.191.7%100.0%142.9%
43.8%150.0%237.5%100.0%
37.4%110.0%111.8%168.3%150.0%
58.1%69.6%70.3%
126.7%40.2%64.4%
155.6%39.1%44.8%
200.0%38.6%52.8%
n.a.60.0%
n.a.141.7%
1.6%1.8%2.0%2.3%2.2%4.3%2.7%2.0%1.0%0.6%2.6%1.9%0.2%0.5%0.4%0.6%
n.a.1.6%1.2%1.1%1.3%
n.a.1.2%1.5%1.4%1.6%1.2%0.8%0.5%3.3%2.0%1.7%1.2%2.0%5.3%4.6%3.7%1.5%2.2%0.9%1.8%3.8%2.9%0.2%3.3%3.6%n.a.
1.0%n.a.
1.2%
-0.1%-0.4%1.2%
-0.3%1.3%0.8%1.0%
-1.0%1.3%0.5%0.2%1.2%1.0%0.8%1.0%
-0.7%1.0%0.1%0.2%1.5%0.6%0.8%1.2%0.8%1.2%
-0.6%0.8%1.2%0.3%0.1%1.1%1.0%0.3%0.9%
n.a.-1.1%0.0%0.6%0.1%0.2%0.5%0.4%0.5%0.9%0.2%0.7%1.7%1.9%0.4%0.8%
0.3%0.0%1.7%0.3%1.9%1.1%1.5%
-1.1%1.6%0.4%0.3%1.7%1.3%1.0%1.2%
-0.4%1.5%0.6%0.4%2.2%0.7%1.2%1.7%1.0%1.9%0.5%1.3%1.7%0.4%0.3%1.3%1.0%0.4%1.3%
n.a.-1.3%-0.1%0.8%0.2%0.3%0.8%0.7%0.2%1.3%0.4%1.0%2.1%1.9%0.2%1.2%
expenses and other non-interest operating expenses. • Operating profit = net interest income + total non-interest operating income - total non-interest expenses + equity-accounted profit/ loss (operating) + change in fair value of own debt - loan impairment charge - other credit impairment charges. • Net profits are recorded after non-operating items, provisions and taxes and include minority interest. • Operating return on assets is the ratio of operating profits over average assets. • Return on assets and return on equity are net profit divided by average assets and total equity respectively. • Τhe Non interest income ratio is the ratio of non-interest operating income over total operating income. • In the change in operating and net profit columns, P-L: profit to losses; L-P: loss to profit; L-L: losses to losses; n.a.: not available or not meaningful • Total Capital Adequacy Ratio is the risk weighted capital ratio. Risk capital is the summation of Tier 1 and Tier 2 capital less investment in subsidiaries, where Tier 2 capital includes cumulative preference shares, revaluation reserves, subordinate and other long term debts. • Tier 1 Capital Ratio is the core capital ratio which includes common stock, disclosed reserves, retained earnings, and minority interest in equity or associates. • All data in this table are collected and updated to the best of our knowledge. • Weprovide this service with no warranty whatsoever as to the currency, accuracy, or applicability of the data for any purposes. • Due to an oversight in the bank screening process, six small banks from Japan, two from Korea and one from Hong Kong that do not fit the traditional criteria have been included in this listing. These banks will not be included in future print or online versions, and have been marked next to the far right column with a #.
Return onEquity Assets
Loan toDepositRatio
Equity toAssetsRatio
Cost to IncomeRatio
Non-interestIncome
Ratio
Loan Loss Reserve toGross NPLs
Gross NPLRatio
9.2%9.1%1.0%4.3%0.7%0.6%2.4%
n.a.30.9%
3.2%1.3%0.8%5.9%3.2%9.0%1.0%
n.a.5.1%5.7%
11.6%16.1%
3.4%n.a.
26.7%0.7%0.3%0.4%1.0%
27.3%0.5%
18.3%22.2%
3.4%1.5%0.1%3.3%0.2%1.4%3.9%1.8%0.7%0.1%6.1%
32.8%0.7%
n.a.n.a.
30.9%0.0%3.0%
LiquidAsset /
Total Asset
Capital Adequacy RatioTier 1 Total
OperatingReturn on
Assets
AB300Rank2009
ABJ ISS-92(PG1-47).indd 25ABJ ISS-92(PG1-47).indd 25 8/28/09 1:03:52 AM8/28/09 1:03:52 AM

26 ISSUE 92The Asian Banker
THE ASIAN BANKER
The Region’s Largest Banks
51
to
10
0 (A
)
82,31881,38579,89079,00677,68577,23875,70175,60973,50371,10670,73969,73769,41768,14366,66366,42465,24065,00664,62461,84461,80761,73261,20561,01660,11059,68156,62953,80553,78253,57453,56053,24752,33550,99050,60550,52250,08649,85748,04347,94447,79147,77646,71545,81445,71545,43145,06244,49043,01742,127
54,80854,09043,65353,32447,57527,55053,29855,43739,45756,50745,024
4,11141,21948,34337,18244,98937,86441,97737,06039,31336,62246,69945,89627,46228,78233,88634,17624,52136,69029,73336,67535,00132,70127,79833,85631,05722,970
1,74032,21630,19227,05835,15429,57840,16432,88028,55429,61626,899
4,36929,497
2.4%0.4%24.7%-2.9%4.8%24.3%0.8%3.1%0.7%14.0%7.0%n.a.
34.6%2.6%
-16.2%-0.3%11.2%-0.6%1.9%5.3%-0.2%6.9%0.1%n.a.
42.0%13.1%12.6%19.0%1.8%5.4%3.2%6.7%24.8%6.3%3.0%1.0%33.2%7.6%5.1%26.8%5.7%2.5%26.3%12.4%0.9%21.7%0.2%2.1%1.2%6.5%
4.9%6.8%23.8%2.7%17.0%19.0%2.4%6.0%5.0%11.2%5.3%n.a.
31.0%2.1%
-20.3%6.5%21.9%8.6%5.3%9.1%7.4%7.9%1.7%n.a.
6.8%22.4%19.2%14.9%3.9%5.6%4.5%8.3%30.3%5.2%6.5%6.7%3.4%
-46.0%15.0%34.7%6.1%1.9%26.0%14.0%5.0%28.6%6.4%8.5%
-15.4%7.7%
4950615156985247664559
2806455696068637067735758
100957877
1127187727581977983
1182938284
101749065809689
10327592
JapanJapanChinaJapan
MalaysiaHong Kong
JapanTaiwanJapan
New ZealandJapanJapanChinaJapanJapanJapan
AustraliaJapanJapan
TaiwanJapan
TaiwanJapanChina
S.KoreaMalaysiaMalaysia
ChinaJapan
Hong KongJapan
TaiwanIndia
TaiwanTaiwanJapan
S.KoreaJapan
ThailandIndia
JapanJapanIndia
AustraliaJapanIndia
JapanJapanJapan
Taiwan
General footnotes: • Whenever possible, consolidated figures were used. • In cases where non-banking activities account for a substantial portion of the consolidated figures, unconsolidated figures were used. • Data pertain to financial years ended through Mar 31 the following year (cut off date for inclusion was middle August 2009). • Only banks whose financial data are available for either financial year 2007 or 2008 or both were included in our ranking.• When 2007 financial year data were used, we denote banks with *. • All figures (except percentages) are quoted in US$ and 2008 year end exchange rates. • All percentage changes are calculated using original currency values. • Assets are the sum of cash and bank balances, marketable securities and other short-term investments, net loans and mortgages, long-term investments, fixed assets and other assets. • Deposits are demand, saving, and time deposits received from non-bank customers. • Loans are commercial, consumer and other loans lent out to non-bank customers (net of reserves). • Net interest income: insurance-related interest was excluded from interest income and expense where it has been disclosed separately. Dividend income is included as interest income. Dividends on all preference shares as well as any other instrument classified as a hybrid security are classified as an interest expense item. • Non-interest operating income includes net gains/losses on trading and derivatives, net gains/losses on other securities, net gains/losses at fair value through the income statement, net insurance income, net fees and commissions and other operating income such as rental income, etc. • Total operating income is the summation of net interest income and non-interest operating income. • Operating expenses are staff
Yamaguchi Financial Group*Joyo BankGuangdong Development BankSapporo Hokuyo HoldingsMaybankStandard Chartered Bank (Hong Kong)Nishi-Nippon City Bank*Taiwan Cooperative BankBank of KyotoANZ National BankHokuyo Bank*Citibank (Japan)*Shenzhen Development BankHiroshima BankAozora BankHachijuni BankSuncorp-MetwayGunma Bank Chugoku Bank Mega International Commercial Bank77 Bank Land Bank of TaiwanHokuriku Bank*Bank of BeijingStandard Chartered Bank (Korea)Bumiputra-Commerce HoldingsPublic BankBank of ShanghaiIyo BankBank of East AsiaYamaguchi Bank*First Commercial BankPunjab National BankChinatrust Commercial BankHua Nan Commercial BankNanto BankCitibank (Korea)Rokinren Bank*Bangkok BankBank of BarodaDaishi BankAshikaga Bank*Bank of IndiaBank of Western AustraliaJuroku BankCanara BankShiga BankHyakugo BankShinkumi Federation Bank*Chang Hwa Commercial Bank
51525354555657585960616263646566676869707172737475767778798081828384858687888990919293949596979899
100
n.a.536351525956505747n.a.5880615460556466626865n.a.7867697489797277737582768471
10281839187867090859296
11394
AB300Rank2009
AB300Rank2008
Commercial Bank CountryAssets
$million ChangeLoans
$million Change Rank(Local Currency)(Local Currency)
ABJ ISS-92(PG1-47).indd 26ABJ ISS-92(PG1-47).indd 26 8/28/09 1:03:53 AM8/28/09 1:03:53 AM

27 ISSUE 92 The Asian Banker
515253545556575859606162636465666768697071727374757677787980
81#
828384858687888990919293949596979899
100
1,375919
2,591-964
2,7802,0401,5111,0521,0501,9101,113
8072,1191,091
-791,1242,8161,0971,008
801903726
1,1581,7981,5332,2351,5991,432
890862862946
2,0871,671
962624
1,604317
2,0191,698
7531,0001,6801,043
7811,458
673601160623
936822962885
1,228979921567606835687604764690529743
2,340658646427682384564423909
1,217517545547796530435877878440585826206986766539457649629579673550510
58360
28.1%-18.2%43.2%
-171.1%8.8%-2.1%-5.3%-0.3%1.0%7.0%
-12.5%n.a.
33.5%-10.2%-119.0%-11.1%15.4%-4.5%-7.5%-26.4%-10.4%-3.5%-2.4%n.a.
34.1%-14.2%8.4%27.8%-7.6%-29.5%7.3%-4.5%31.4%2.0%
-11.9%9.6%17.5%-11.1%6.2%30.9%-0.5%-0.9%27.5%32.4%-13.6%16.0%-3.8%-9.3%48.0%-9.4%
7510441
29938516989905582
1164786
29681368595
117106127805868466674
107109110100506499
14865
2205261
125966392
12072
136154276150
25.8%3.7%17.5%4.7%12.3%7.6%-1.6%3.8%2.4%8.5%5.6%n.a.
24.2%-1.3%-7.9%6.6%66.9%4.2%1.4%-2.9%-1.8%-2.9%2.9%n.a.
20.8%-1.2%5.8%48.1%5.4%34.1%-2.6%1.7%19.4%-2.7%-1.7%9.0%5.1%8.1%6.8%21.6%2.1%18.4%15.5%18.2%-0.1%13.5%4.1%11.1%-1.9%2.9%
72,07872,14858,02971,02554,01661,51467,17658,02960,91344,62361,15158,59551,15057,99328,93258,92014,95857,96455,64339,29553,57249,74453,78146,21225,69844,29146,84738,97346,14541,77645,62841,73742,30026,21441,75843,90318,70942,52937,89036,95042,44846,44037,62334,91741,13737,78340,27339,92740,69133,620
3.0%3.3%15.4%0.6%14.3%33.0%2.5%5.2%9.9%10.1%3.2%n.a.
27.9%1.7%11.0%1.8%13.6%0.1%3.2%7.5%2.0%7.9%-0.3%n.a.
47.6%20.9%16.9%20.6%3.3%13.9%5.1%9.9%25.3%-26.7%6.7%1.2%6.5%8.2%3.5%26.6%3.0%-1.4%26.0%9.8%2.8%21.8%1.7%3.4%2.6%9.5%
4241534358484554506949526155
11551
17656578460635966
1237064856776687875
1217771
156738791746590957989818280
100
1,1571,1582,3001,0921,8041,2941,276
823968
1,3271,093
4001,843
978613967
1,457964876808843548844
1,6221,1371,3661,2511,358
831876728741
1,486890771699
1,131159
1,5171,110
616798
1,144813688980633572144553
18.8%-2.1%38.8%-14.7%5.0%-0.9%-5.4%11.6%11.6%1.8%4.5%n.a.
31.1%-4.5%6.1%-3.8%48.3%1.1%-2.2%19.4%-2.4%6.8%-1.5%n.a.
17.9%4.8%15.1%23.9%-0.8%11.8%-1.8%9.6%26.3%-7.8%0.7%-2.6%16.6%-14.3%12.6%29.9%3.7%-3.1%30.3%37.0%-2.0%24.4%-2.5%-1.4%-19.1%5.5%
6766307440596091785673
1773977
119795080849388
1338745695363549083
103102498296
10670
2684772
118946892
10776
113128273132
expenses and other non-interest operating expenses. • Operating profit = net interest income + total non-interest operating income - total non-interest expenses + equity-accounted profit/ loss (operating) + change in fair value of own debt - loan impairment charge - other credit impairment charges. • Net profits are recorded after non-operating items, provisions and taxes and include minority interest. • Operating return on assets is the ratio of operating profits over average assets. • Return on assets and return on equity are net profit divided by average assets and total equity respectively. • Τhe Non interest income ratio is the ratio of non-interest operating income over total operating income. • In the change in operating and net profit columns, P-L: profit to losses; L-P: loss to profit; L-L: losses to losses; n.a.: not available or not meaningful • Total Capital Adequacy Ratio is the risk weighted capital ratio. Risk capital is the summation of Tier 1 and Tier 2 capital less investment in subsidiaries, where Tier 2 capital includes cumulative preference shares, revaluation reserves, subordinate and other long term debts. • Tier 1 Capital Ratio is the core capital ratio which includes common stock, disclosed reserves, retained earnings, and minority interest in equity or associates. • All data in this table are collected and updated to the best of our knowledge. • Weprovide this service with no warranty whatsoever as to the currency, accuracy, or applicability of the data for any purposes. • Due to an oversight in the bank screening process, six small banks from Japan, two from Korea and one from Hong Kong that do not fit the traditional criteria have been included in this listing. These banks will not be included in future print or online versions, and have been marked next to the far right column with a #.
AB300Rank2009
Operating Expenses$million Change
Deposits$million Change Rank
Total Operating Income$million Change Rank
Net Interest Income$million Change Rank
4,3194,1312,8682,5695,8004,3142,9153,2634,0245,6732,6132,9892,4002,9425,8364,4818,5673,6323,8244,2733,3272,9901,8194,9472,8475,2432,9532,7573,6044,1913,7022,6983,2403,4652,3521,7923,7732,7225,0322,7502,372
-3,7102,8402,1012,2252,5682,4132,3071,4842,431
566184964657827262489578
103814555296864597177
1245285508089696066927470
10612965915190
10529986
11611097
102107146101
Shareholder’s Equity$million Rank
(Local Currency) (Local Currency) (Local Currency) (Local Currency)
ABJ ISS-92(PG1-47).indd 27ABJ ISS-92(PG1-47).indd 27 8/28/09 1:03:55 AM8/28/09 1:03:55 AM

28 ISSUE 92The Asian Banker
THE ASIAN BANKER
The Region’s Largest Banks
51
to
10
0 (B
)
434-67625
-2,4241,319
898385286312964331202285145
-2,078110434351212176
60228378
1,107323796918606119
-6332332
1,000413368-85438110845494121509877
-15917
400-143977
214
L-PP-L
-26.4%P-L
4.7%-21.3%-31.6%-21.3%-20.2%-2.3%-31.8%
n.a.-57.5%-48.3%
L-L-61.0%-59.1%-15.6%-38.2%-64.1%-69.9%-1.2%-4.6%n.a.
8.8%-25.2%5.8%-2.2%-66.4%
P-L28.1%-29.7%41.9%-4.3%0.7%P-L
-13.8%-33.8%3.3%1.5%
-24.1%-4.7%60.6%
P-L-79.7%7.7%L-L
-74.9%268.4%-35.5%
7026454
29828377899933488
1281011572971806985
124139202120793191443656
1732478786337182
26668
1794362
1706139
28522674
248211190123
JapanJapanChinaJapan
MalaysiaHong Kong
JapanTaiwanJapan
New ZealandJapanJapanChinaJapanJapanJapan
AustraliaJapanJapan
TaiwanJapan
TaiwanJapanChina
S.KoreaMalaysiaMalaysia
ChinaJapan
Hong KongJapan
TaiwanIndia
TaiwanTaiwanJapan
S.KoreaJapan
ThailandIndia
JapanJapanIndia
AustraliaJapanIndia
JapanJapanJapan
Taiwan
General footnotes: • Whenever possible, consolidated figures were used. • In cases where non-banking activities account for a substantial portion of the consolidated figures, unconsolidated figures were used. • Data pertain to financial years ended through Mar 31 the following year (cut off date for inclusion was middle August 2009). • Only banks whose financial data are available for either financial year 2007 or 2008 or both were included in our ranking.• When 2007 financial year data were used, we denote banks with *. • All figures (except percentages) are quoted in US$ and 2008 year end exchange rates. • All percentage changes are calculated using original currency values. • Assets are the sum of cash and bank balances, marketable securities and other short-term investments, net loans and mortgages, long-term investments, fixed assets and other assets. • Deposits are demand, saving, and time deposits received from non-bank customers. • Loans are commercial, consumer and other loans lent out to non-bank customers (net of reserves). • Net interest income: insurance-related interest was excluded from interest income and expense where it has been disclosed separately. Dividend income is included as interest income. Dividends on all preference shares as well as any other instrument classified as a hybrid security are classified as an interest expense item. • Non-interest operating income includes net gains/losses on trading and derivatives, net gains/losses on other securities, net gains/losses at fair value through the income statement, net insurance income, net fees and commissions and other operating income such as rental income, etc. • Total operating income is the summation of net interest income and non-interest operating income. • Operating expenses are staff
Operating Profit$million Change RankCountry
Yamaguchi Financial Group*Joyo BankGuangdong Development BankSapporo Hokuyo HoldingsMaybankStandard Chartered Bank (Hong Kong)Nishi-Nippon City Bank*Taiwan Cooperative BankBank of KyotoANZ National BankHokuyo Bank*Citibank (Japan)*Shenzhen Development BankHiroshima BankAozora BankHachijuni BankSuncorp-MetwayGunma Bank Chugoku Bank Mega International Commercial Bank77 Bank Land Bank of TaiwanHokuriku Bank*Bank of BeijingStandard Chartered Bank (Korea)Bumiputra-Commerce HoldingsPublic BankBank of ShanghaiIyo BankBank of East AsiaYamaguchi Bank*First Commercial BankPunjab National BankChinatrust Commercial BankHua Nan Commercial BankNanto BankCitibank (Korea)Rokinren Bank*Bangkok BankBank of BarodaDaishi BankAshikaga Bank*Bank of IndiaBank of Western AustraliaJuroku BankCanara BankShiga BankHyakugo BankShinkumi Federation Bank*Chang Hwa Commercial Bank
51525354555657585960616263646566676869707172737475767778798081828384858687888990919293949596979899
100
n.a.536351525956505747n.a.5880615460556466626865n.a.7867697489797277737582768471
10281839187867090859296
11394
29259
407-2,363
867742165223119673274271
9090
-2,69614
383133
98103
82183238793245581757450133
13227270646380301
-243338100582494
85547636-96-91401
-1705058
146
L-P-62.1%3.8%P-L
-7.7%-22.0%-44.1%-24.3%-49.3%6.5%-9.7%n.a.
-76.8%-64.0%
P-L-93.6%-47.4%-42.5%-52.9%-75.6%-40.4%-4.8%13.3%n.a.
10.1%-30.9%19.1%4.9%
-35.8%-97.5%10.2%-25.5%47.0%13.4%15.2%
P-L-9.0%-8.1%5.1%53.7%-25.1%-36.3%57.0%
P-LP-L
7.7%P-L
-50.6%17.8%-32.8%
7218155
2962630
11290
139327375
16316429721359
130157154173106862883402950
1292148876336071
28366
1563944
1694134
26726456
279188182120
Net Profit$million Change Rank
AB300Rank2009
AB300Rank2008
Commercial Bank(Local Currency) (Local Currency)
ABJ ISS-92(PG1-47).indd 28ABJ ISS-92(PG1-47).indd 28 8/28/09 1:03:56 AM8/28/09 1:03:56 AM

29 ISSUE 92 The Asian Banker
515253545556575859606162636465666768697071727374757677787980
81#
828384858687888990919293949596979899
100
6.4%1.3%
15.8%-80.0%14.9%18.0%
5.5%7.0%2.5%
12.5%8.3%
n.a.4.2%2.9%
-44.0%0.3%4.5%3.5%2.5%2.4%2.2%6.1%
13.1%n.a.
9.5%11.8%26.1%18.3%
3.4%0.3%5.9%
10.0%22.0%11.4%12.1%
-11.9%10.1%
3.8%11.9%19.6%
3.4%n.a.
25.3%-5.0%-3.7%16.6%-6.5%2.0%3.8%6.9%
76.0%75.0%75.2%75.1%88.1%44.8%79.3%95.5%64.8%
126.6%73.6%
7.0%80.6%83.4%
128.5%76.4%
253.1%72.4%66.6%
100.0%68.4%93.9%85.3%59.4%
112.0%76.5%73.0%62.9%79.5%71.2%80.4%83.9%77.3%
106.0%81.1%70.7%
122.8%4.1%
85.0%81.7%63.7%75.7%78.6%
115.0%79.9%75.6%73.5%67.4%10.7%87.7%
5.2%5.1%3.6%3.3%7.5%5.6%3.9%4.3%5.5%8.0%3.7%4.3%3.5%4.3%8.8%6.7%
13.1%5.6%5.9%6.9%5.4%4.8%3.0%8.1%4.7%8.8%5.2%5.1%6.7%7.8%6.9%5.1%6.2%6.8%4.6%3.5%7.5%5.5%
10.5%5.7%5.0%
-7.8%6.1%4.6%4.9%5.7%5.4%5.2%3.5%5.8%
68.1%89.5%37.1%
n.a.44.2%47.9%61.0%53.9%57.7%42.3%61.7%74.9%36.1%63.2%
n.a.66.1%82.9%60.0%64.1%51.9%75.5%52.9%48.7%23.5%59.3%54.5%32.3%38.0%61.5%92.4%61.5%46.0%42.0%52.5%45.8%93.7%51.5%64.9%48.8%44.8%71.5%45.7%38.3%60.4%74.1%45.9%81.7%84.9%36.6%56.7%
15.8%n.a.
11.3%n.a.
35.1%36.6%15.5%21.8%
7.8%30.6%
1.8%50.4%13.0%10.4%
n.a.14.0%48.3%12.1%13.1%
n.a.6.6%
24.5%27.2%
9.8%25.8%38.9%21.8%
5.2%6.6%
n.a.15.5%21.7%28.8%46.8%19.9%
n.a.29.5%50.0%24.9%34.6%18.3%20.2%31.9%22.0%11.9%32.7%
6.0%4.8%9.7%
11.3%
8.0%11.6%
6.7%6.5%
10.6%n.a.
5.9%6.5%8.6%8.1%6.9%
14.6%5.3%7.1%
12.6%12.2%
8.0%9.5%
12.0%9.0%
12.6%7.5%7.1%
16.4%n.a.
11.4%8.3%9.1%9.3%9.1%
10.5%7.1%9.2%
19.8%6.1%8.6%
10.6%20.5%11.2%
n.a. 10.8%
-11.6%9.0%7.5%7.4%n.a.
8.7%8.8%
17.3%7.5%
10.5%12.9%11.6%
9.8%14.5%
n.a.9.2%
10.6%12.0%11.7%
8.4%14.6%
8.6%11.0%11.6%12.8%10.4%11.3%12.0%11.2%13.1%10.8%10.3%19.7%
n.a.n.a.
13.7%11.3%10.6%13.8%10.7%10.9%14.3%16.2%10.2%10.1%12.7%20.3%13.8%12.9%12.7%
-11.7%13.1%11.1%10.1%
n.a. 10.3%11.0%13.3%10.6%
63.9%29.4%
148.3%56.2%
100.0%n.a.
32.0%n.a.
35.2%233.3%
44.9%93.1%
100.0%36.1%75.5%55.7%42.9%55.3%63.7%93.8%45.1%
128.6%33.2%
175.0%145.5%
89.8%160.0%135.2%
46.6%n.a.
59.4%53.7%82.4%82.8%57.9%37.9%
138.5%n.a.
109.5%n.a.
31.6%48.2%70.6%
n.a.51.0%
n.a.43.8%37.5%10.8%81.5%
3.8%2.5%2.9%4.1%3.8%
n.a.4.8%
n.a.3.3%0.3%3.3%0.3%0.7%2.7%4.9%4.7%0.7%2.9%3.1%1.0%3.9%0.8%3.8%1.6%1.1%4.9%1.0%2.3%2.5%
n.a.3.2%1.5%1.7%1.5%1.7%3.4%1.3%n.a.
4.7%n.a.
3.6%4.5%1.7%n.a.
3.9%n.a.
2.2%3.2%3.7%1.7%
0.4%0.1%0.6%
-3.0%1.2%1.1%0.2%0.3%0.2%1.0%0.4%
n.a.0.1%0.1%
-3.7%0.0%0.6%0.2%0.2%0.2%0.1%0.3%0.4%
n.a.0.5%1.0%1.4%0.9%0.3%0.0%0.4%0.5%1.4%0.8%0.6%
-0.5%0.8%0.2%1.2%1.2%0.2%1.2%1.5%
-0.2%-0.2%1.0%
-0.4%0.1%0.1%0.4%
0.5%-0.1%0.9%
-3.0%1.8%1.3%0.5%0.4%0.4%1.5%0.5%
n.a.0.5%0.2%
-2.8%0.2%0.7%0.5%0.3%0.3%0.1%0.4%0.6%
n.a.0.6%1.4%1.7%1.2%0.2%0.0%0.6%0.7%2.1%0.8%0.7%
-0.2%1.0%0.2%1.8%1.2%0.3%1.1%2.1%
-0.4%0.0%1.0%0.0%0.1%0.2%0.5%
expenses and other non-interest operating expenses. • Operating profit = net interest income + total non-interest operating income - total non-interest expenses + equity-accounted profit/ loss (operating) + change in fair value of own debt - loan impairment charge - other credit impairment charges. • Net profits are recorded after non-operating items, provisions and taxes and include minority interest. • Operating return on assets is the ratio of operating profits over average assets. • Return on assets and return on equity are net profit divided by average assets and total equity respectively. • Τhe Non interest income ratio is the ratio of non-interest operating income over total operating income. • In the change in operating and net profit columns, P-L: profit to losses; L-P: loss to profit; L-L: losses to losses; n.a.: not available or not meaningful • Total Capital Adequacy Ratio is the risk weighted capital ratio. Risk capital is the summation of Tier 1 and Tier 2 capital less investment in subsidiaries, where Tier 2 capital includes cumulative preference shares, revaluation reserves, subordinate and other long term debts. • Tier 1 Capital Ratio is the core capital ratio which includes common stock, disclosed reserves, retained earnings, and minority interest in equity or associates. • All data in this table are collected and updated to the best of our knowledge. • Weprovide this service with no warranty whatsoever as to the currency, accuracy, or applicability of the data for any purposes. • Due to an oversight in the bank screening process, six small banks from Japan, two from Korea and one from Hong Kong that do not fit the traditional criteria have been included in this listing. These banks will not be included in future print or online versions, and have been marked next to the far right column with a #.
Return onEquity Assets
Loan toDepositRatio
Equity toAssetsRatio
Cost to IncomeRatio
Non-interestIncome
Ratio
Loan Loss Reserve toGross NPLs
Gross NPLRatio
0.1%0.1%0.6%0.1%0.3%2.9%0.1%
n.a.n.a.
5.5%0.1%3.4%
n.a.0.5%6.2%0.5%6.0%0.1%0.1%1.6%0.7%0.2%0.1%4.0%2.0%5.0%5.8%1.9%0.0%1.4%0.1%1.5%
n.a.10.0%
2.0%0.1%0.5%
n.a.13.5%
n.a.0.1%0.1%
n.a.8.7%0.0%
n.a.0.0%0.0%
n.a.1.0%
LiquidAsset /
Total Asset
Capital Adequacy RatioTier 1 Total
OperatingReturn on
Assets
AB300Rank2009
ABJ ISS-92(PG1-47).indd 29ABJ ISS-92(PG1-47).indd 29 8/28/09 1:03:58 AM8/28/09 1:03:58 AM

30 ISSUE 92The Asian Banker
THE ASIAN BANKER
The Region’s Largest Banks
10
1 t
o 1
50
(A)
42,06541,96141,26541,20440,23040,08938,43238,12237,85037,79637,78137,49837,35337,14537,03735,84735,57435,05034,71234,58034,23033,76733,70133,50033,27033,26233,22233,00232,73432,05331,60331,45830,48130,17729,03328,61328,60228,35527,91927,82526,88226,72826,64526,59926,54326,00825,95125,87425,68725,613
29,26529,50223,07424,71825,67424,74624,51328,99220,43730,08129,69825,87525,09430,06822,73524,19625,14426,76522,47525,98123,312
7,06019,30622,44627,51927,01819,92222,20914,85316,12820,42224,38916,83117,49318,68317,69616,52017,98916,93018,074
n.a.13,83317,85415,30317,42016,89516,44015,50313,89115,091
-1.3%2.6%2.9%4.8%1.0%2.5%5.8%9.7%38.1%2.6%0.7%-2.0%31.1%13.9%11.6%4.5%6.5%5.4%0.9%1.2%0.7%4.6%26.4%1.2%
182.5%14.0%29.8%5.1%12.3%5.5%0.0%2.3%34.8%-0.6%0.8%0.5%0.2%4.1%0.9%-6.4%21.6%18.1%-0.5%1.9%-0.3%0.9%8.1%-4.0%-0.5%33.3%
0.1%6.9%0.2%6.8%-0.6%4.0%8.0%9.6%56.1%0.2%3.4%5.6%18.7%10.2%14.7%5.6%6.5%6.2%1.6%3.0%0.7%7.5%27.3%3.8%
188.4%13.8%30.0%9.8%29.6%13.1%4.8%0.3%37.1%11.1%5.2%0.9%0.8%2.5%3.4%3.9%n.a.
33.8%3.2%4.7%-0.2%3.2%8.6%-8.0%-4.8%40.7%
9391
11711110711011394
1238588
10610986
11911510810412010511622812612199
102125122154144124114139134128132141130137129n.a.164131148136138142145163150
JapanJapanJapan
TaiwanJapanJapanJapan
ThailandIndia
JapanJapanJapan
ThailandNew Zealand
TaiwanJapan
ThailandTaiwanJapanJapanJapan
SingaporeChinaJapan
AustraliaAustralia
IndiaJapan
IndonesiaTaiwanTaiwanJapanIndia
MalaysiaJapanJapanJapanJapanJapanJapanIndia
ChinaJapanJapanJapanJapan
MalaysiaTaiwanJapanIndia
General footnotes: • Whenever possible, consolidated figures were used. • In cases where non-banking activities account for a substantial portion of the consolidated figures, unconsolidated figures were used. • Data pertain to financial years ended through Mar 31 the following year (cut off date for inclusion was middle August 2009). • Only banks whose financial data are available for either financial year 2007 or 2008 or both were included in our ranking.• When 2007 financial year data were used, we denote banks with *. • All figures (except percentages) are quoted in US$ and 2008 year end exchange rates. • All percentage changes are calculated using original currency values. • Assets are the sum of cash and bank balances, marketable securities and other short-term investments, net loans and mortgages, long-term investments, fixed assets and other assets. • Deposits are demand, saving, and time deposits received from non-bank customers. • Loans are commercial, consumer and other loans lent out to non-bank customers (net of reserves). • Net interest income: insurance-related interest was excluded from interest income and expense where it has been disclosed separately. Dividend income is included as interest income. Dividends on all preference shares as well as any other instrument classified as a hybrid security are classified as an interest expense item. • Non-interest operating income includes net gains/losses on trading and derivatives, net gains/losses on other securities, net gains/losses at fair value through the income statement, net insurance income, net fees and commissions and other operating income such as rental income, etc. • Total operating income is the summation of net interest income and non-interest operating income. • Operating expenses are staff
Hokkaido Bank*Ogaki Kyoritsu BankSan-In Godo BankCathay United BankHyakujushi Bank*Higo BankKiyo Holdings*Krung Thai BankHDFC BankKansai Urban Banking CorporationMusashino BankKiyo BankKasikornbankBank of New ZealandTaipei Fubon Commercial BankKeiyo BankSiam Commercial BankTaiwan Business BankKagoshima BankSuruga BankHokkoku BankCitibank (Singapore)*Bank of JiangsuBank of NagoyaBendigo and Adelaide BankING Bank (Australia)Union Bank of IndiaToho BankBank MandiriShanghai Commercial and Savings BankBank SinoPacMinato BankAXIS BankRHB CapitalMomiji Bank*Oita BankYamanashi Chuo BankAwa BankAichi BankBank of IkedaSyndicate BankBeijing Rural Commercial Bank*Shikoku BankBank of IwateTokyo Tomin BankTochigi BankAMMB HoldingsTaishin International BankEighteenth BankCentral Bank of India*
101102103104105106107108109110111112113114115116117118119120121122123124125126127128129130131132133134135136137138139140141142143144145146147148149150
n.a.97
1009599
101n.a.10311211110710412488
109116106108115117119n.a.141122n.a.98
120125110118114126129n.a.135137136142139130133140144146145148151128147121
AB300Rank2009
AB300Rank2008
Commercial Bank CountryAssets
$million ChangeLoans
$million Change Rank(Local Currency)(Local Currency)
ABJ ISS-92(PG1-47).indd 30ABJ ISS-92(PG1-47).indd 30 8/28/09 1:03:59 AM8/28/09 1:03:59 AM

31 ISSUE 92 The Asian Banker
101102103104105106107108109110111
112#
113114115116117118119120121122123124125126127128129130131132133134135136137138139140141142143144145146147148149150
845661821655675634692
1,5952,239
727576570
1,7451,109
772682
1,903471608821527982
1,063507533318
1,099522
1,821632400646
1,3631,008
487483442514408342715681241264490294944764486624
449473452435533439430852
1,166407412410886443382389896285429475394397383388359129457409862257364388593437354341315336313321354325330312419299493463389361
1.3%-2.0%27.6%-17.7%4.2%-0.3%6.9%2.7%42.6%-8.7%-10.6%-15.8%15.2%5.3%-5.6%1.3%11.9%-15.0%-4.3%-11.0%-12.8%28.3%49.0%-3.7%49.6%17.3%28.5%-0.2%23.4%-20.2%-22.7%-1.8%50.2%1.5%
-10.0%-2.5%-12.2%-4.6%-9.0%n.a.
16.9%28.0%-48.6%-33.5%-19.6%-29.3%-3.4%-13.5%-14.2%2.2%
1121371141391351451316745
1261571605983
12213356
1831521151689888
17516721984
17157
1461961437694
179181187172194212129134250239178231102123180149
3.5%1.8%-2.0%1.6%1.0%0.7%-2.0%7.9%47.6%4.7%3.8%-0.1%20.3%3.5%2.3%3.7%2.9%-3.1%7.8%4.8%0.8%19.4%38.0%7.5%45.5%24.0%39.0%0.3%14.9%-2.2%0.1%2.7%32.6%-6.3%1.6%2.1%5.1%2.1%2.4%9.1%14.8%12.6%-2.5%0.9%3.1%5.7%1.8%0.9%-5.0%3.6%
38,44537,78536,63833,20234,39436,53034,42830,46628,94531,22934,93034,31327,73714,99529,18033,21026,11830,71330,77932,07230,69516,50929,24130,30116,37813,02527,69630,07126,40325,47625,57428,85224,22021,35226,48625,04925,34324,64725,36524,780
n.a.24,79724,71923,62524,33024,57214,61519,07522,25622,208
-0.4%4.1%2.6%5.5%4.5%2.2%4.5%6.3%42.7%3.1%4.3%-0.4%23.5%7.2%18.5%4.6%7.2%7.7%1.5%0.9%2.3%4.8%23.3%2.8%95.3%-6.9%33.6%4.7%16.9%11.5%1.1%2.6%41.3%-2.4%-0.6%1.3%1.7%4.9%2.4%2.8%n.a.
27.3%1.1%2.4%0.5%1.6%6.0%-4.8%0.3%33.1%
868892
102979396
1091141059498
117175113101122107106104108168112110169192118111120125124116135143119128127132126130n.a.129131136134133182154137138
623579617639538566573
1,3131,529
659578586
1,216769542626
1,270415513867477478
1,013444379310787473
1,396469444515760643423425413456388460537662390387392409513427401460
-5.0%4.2%-1.7%-2.5%-0.4%3.5%2.3%4.0%41.7%1.4%-0.4%3.6%13.4%10.4%4.6%3.3%13.1%6.8%-1.7%0.7%-2.1%21.1%57.1%-3.0%51.4%19.1%33.6%0.8%19.5%-4.2%-6.7%0.2%42.4%5.7%
-11.5%1.5%-2.6%0.4%-0.9%33.8%25.5%33.3%-5.3%-0.5%-7.5%0.7%8.9%
-12.4%-2.0%-10.1%
1161251171121351301275746
1101261246597
13411562
16713885
14514475
15718720995
14652
14815813799
111164163168153182152136109180184178173139161176150
expenses and other non-interest operating expenses. • Operating profit = net interest income + total non-interest operating income - total non-interest expenses + equity-accounted profit/ loss (operating) + change in fair value of own debt - loan impairment charge - other credit impairment charges. • Net profits are recorded after non-operating items, provisions and taxes and include minority interest. • Operating return on assets is the ratio of operating profits over average assets. • Return on assets and return on equity are net profit divided by average assets and total equity respectively. • Τhe Non interest income ratio is the ratio of non-interest operating income over total operating income. • In the change in operating and net profit columns, P-L: profit to losses; L-P: loss to profit; L-L: losses to losses; n.a.: not available or not meaningful • Total Capital Adequacy Ratio is the risk weighted capital ratio. Risk capital is the summation of Tier 1 and Tier 2 capital less investment in subsidiaries, where Tier 2 capital includes cumulative preference shares, revaluation reserves, subordinate and other long term debts. • Tier 1 Capital Ratio is the core capital ratio which includes common stock, disclosed reserves, retained earnings, and minority interest in equity or associates. • All data in this table are collected and updated to the best of our knowledge. • Weprovide this service with no warranty whatsoever as to the currency, accuracy, or applicability of the data for any purposes. • Due to an oversight in the bank screening process, six small banks from Japan, two from Korea and one from Hong Kong that do not fit the traditional criteria have been included in this listing. These banks will not be included in future print or online versions, and have been marked next to the far right column with a #.
AB300Rank2009
Operating Expenses$million Change
Deposits$million Change Rank
Total Operating Income$million Change Rank
Net Interest Income$million Change Rank
7791,6572,8322,5432,6662,1601,2342,9693,1241,2921,6291,1613,2572,0152,3951,8163,6651,1902,5062,0701,9822,1521,8131,6802,1351,3431,8041,2732,7892,6841,732
9782,1042,2641,2211,1861,6171,6061,593
635n.a.
1,028854
1,340850
1,1242,2841,1821,0021,237
220138879894
1111707975
16214018073
12010412567
17499
1171211121261361131551271648893
132198115109172175141142143239n.a.191209157210182108177194169
Shareholder’s Equity$million Rank
(Local Currency) (Local Currency) (Local Currency) (Local Currency)
ABJ ISS-92(PG1-47).indd 31ABJ ISS-92(PG1-47).indd 31 8/28/09 1:04:00 AM8/28/09 1:04:00 AM

32 ISSUE 92The Asian Banker
THE ASIAN BANKER
The Region’s Largest Banks
10
1 t
o 1
50
(B)
33062
304203
98149171451685
-371-54180636618245151865
8173286-22560526111176179484
75722285
-128-90376411131
-222126
7477
-127212194
-204-112-146-107352
-168-57134
-6.7%-54.8%
2114.2%-19.5%8.8%10.1%28.8%110.5%44.7%
P-LP-L
2.3%3.6%4.5%63.7%-44.0%21.1%-77.5%23.4%-32.5%
P-L37.4%83.2%20.3%48.2%6.3%26.2%-16.7%27.3%-40.8%
L-LP-L
10.4%25.1%
L-PP-L
214.6%-57.3%-27.1%
L-L2.0%42.6%
P-LP-LP-LP-L
2.0%P-LL-L
12.0%
8919996
1271851541436550
2932581375355
11515242
2351411002505860
17814013864
19247
1022782688072
16428916819319127712513228827228327183
287259162
JapanJapanJapan
TaiwanJapanJapanJapan
ThailandIndia
JapanJapanJapan
ThailandNew Zealand
TaiwanJapan
ThailandTaiwanJapanJapanJapan
SingaporeChinaJapan
AustraliaAustralia
IndiaJapan
IndonesiaTaiwanTaiwanJapanIndia
MalaysiaJapanJapanJapanJapanJapanJapanIndia
ChinaJapanJapanJapanJapan
MalaysiaTaiwanJapanIndia
General footnotes: • Whenever possible, consolidated figures were used. • In cases where non-banking activities account for a substantial portion of the consolidated figures, unconsolidated figures were used. • Data pertain to financial years ended through Mar 31 the following year (cut off date for inclusion was middle August 2009). • Only banks whose financial data are available for either financial year 2007 or 2008 or both were included in our ranking.• When 2007 financial year data were used, we denote banks with *. • All figures (except percentages) are quoted in US$ and 2008 year end exchange rates. • All percentage changes are calculated using original currency values. • Assets are the sum of cash and bank balances, marketable securities and other short-term investments, net loans and mortgages, long-term investments, fixed assets and other assets. • Deposits are demand, saving, and time deposits received from non-bank customers. • Loans are commercial, consumer and other loans lent out to non-bank customers (net of reserves). • Net interest income: insurance-related interest was excluded from interest income and expense where it has been disclosed separately. Dividend income is included as interest income. Dividends on all preference shares as well as any other instrument classified as a hybrid security are classified as an interest expense item. • Non-interest operating income includes net gains/losses on trading and derivatives, net gains/losses on other securities, net gains/losses at fair value through the income statement, net insurance income, net fees and commissions and other operating income such as rental income, etc. • Total operating income is the summation of net interest income and non-interest operating income. • Operating expenses are staff
Operating Profit$million Change RankCountry
Hokkaido Bank*Ogaki Kyoritsu BankSan-In Godo BankCathay United BankHyakujushi Bank*Higo BankKiyo Holdings*Krung Thai BankHDFC BankKansai Urban Banking CorporationMusashino BankKiyo BankKasikornbankBank of New ZealandTaipei Fubon Commercial BankKeiyo BankSiam Commercial BankTaiwan Business BankKagoshima BankSuruga BankHokkoku BankCitibank (Singapore)*Bank of JiangsuBank of NagoyaBendigo and Adelaide BankING Bank (Australia)Union Bank of IndiaToho BankBank MandiriShanghai Commercial and Savings BankBank SinoPacMinato BankAXIS BankRHB CapitalMomiji Bank*Oita BankYamanashi Chuo BankAwa BankAichi BankBank of IkedaSyndicate BankBeijing Rural Commercial Bank*Shikoku BankBank of IwateTokyo Tomin BankTochigi BankAMMB HoldingsTaishin International BankEighteenth BankCentral Bank of India*
101102103104105106107108109110111112113114115116117118119120121122123124125126127128129130131132133134135136137138139140141142143144145146147148149150
n.a.97
1009599
101n.a.10311211110710412488
109116106108115117119n.a.141122n.a.98
120125110118114126129n.a.135137136142139130133140144146145148151128147121
171-70100140121
52148352465
-270-4336
439454182
63610
378
115-108475325
32119126356
22485226-83
-104374303137
-249632324
-414188
50-238
-51-126-140254
-118-165112
-33.5%P-L
7.8%-29.2%-27.5%-35.7%73.4%91.5%41.4%
P-LP-L
-63.2%2.2%14.9%79.5%-59.1%21.8%-91.0%-27.3%-39.6%
P-L35.3%165.2%-59.0%40.7%6.3%24.5%-57.5%22.3%-40.5%
L-LP-L
71.2%27.7%
L-PP-L
38.5%-75.6%-49.9%
L-L7.6%
-39.0%P-LP-LP-LP-L
8.3%P-LP-L
7.7%
1102571551241371851196548
2872471945249
10717937
2301741442724667
19614013363
2044589
2612706170
12728517820219929010118928224927527680
274278146
Net Profit$million Change Rank
AB300Rank2009
AB300Rank2008
Commercial Bank(Local Currency) (Local Currency)
ABJ ISS-92(PG1-47).indd 32ABJ ISS-92(PG1-47).indd 32 8/28/09 1:04:02 AM8/28/09 1:04:02 AM

33 ISSUE 92 The Asian Banker
101102103104105106107108109110111
112#
113114115116117118119120121122123124125126127128129130131132133134135136137138139140141142143144145146147148149150
22.3%-3.9%3.5%5.6%4.3%2.3%
12.3%12.3%17.1%
-21.4%-2.5%3.8%
14.4%22.2%
7.8%3.3%
17.9%0.2%3.1%5.6%
-5.1%24.6%20.4%
1.8%7.3%9.4%
21.5%1.7%
18.0%8.5%
-4.6%-10.0%19.1%14.1%12.0%
-17.5%3.7%1.3%1.4%
-91.0%n.a.
4.9%-22.9%
-3.4%-13.0%-11.6%11.6%-9.1%
-14.3%11.1%
76.1%78.1%63.0%74.4%74.6%67.7%71.2%95.2%70.6%96.3%85.0%75.4%90.5%
200.5%77.9%72.9%96.3%87.1%73.0%81.0%75.9%42.8%66.0%74.1%
168.0%207.4%
71.9%73.9%56.3%63.3%79.9%84.5%69.5%81.9%70.5%70.6%65.2%73.0%66.7%72.9%
n.a.55.8%72.2%64.8%71.6%68.8%
112.5%81.3%62.4%68.0%
1.9%3.9%6.9%6.2%6.6%5.4%3.2%7.8%8.3%3.4%4.3%3.1%8.7%5.4%6.5%5.1%
10.3%3.4%7.2%6.0%5.8%6.4%5.4%5.0%6.4%4.0%5.4%3.9%8.5%8.4%5.5%3.1%6.9%7.5%4.2%4.1%5.7%5.7%5.7%2.3%
n.a.3.8%3.2%5.0%3.2%4.3%8.8%4.6%3.9%4.8%
53.2%71.5%55.1%65.3%79.0%69.4%62.1%52.8%52.1%56.1%71.5%71.9%50.7%40.0%48.2%57.1%47.1%59.9%70.5%57.9%74.9%40.4%36.0%76.5%65.1%40.8%41.6%78.4%47.3%41.4%91.0%60.1%43.5%43.3%72.6%70.6%71.2%65.4%76.7%94.0%49.6%47.8%
137.1%118.2%
85.6%101.7%
52.3%60.5%80.1%57.8%
26.2%12.4%24.9%
2.4%20.2%10.7%17.2%17.7%31.7%
9.2%n.a.n.a.
30.3%30.7%29.8%
8.2%33.2%11.9%15.7%
n.a.9.4%
51.3%4.7%
12.5%28.9%
2.4%28.4%
9.4%23.3%25.7%
n.a.20.2%44.3%36.2%13.1%12.0%
6.5%11.3%
4.9%n.a.
24.8%2.8%
n.a.n.a.
19.9%n.a.
45.7%44.1%17.6%26.2%
7.8%6.4%
14.7%8.7%9.0%
11.4%7.8%9.7%
10.6%5.8%7.5%0.0%9.8%8.1%9.5%
10.1%11.0%
5.5%12.3%10.6%11.2%13.1%
7.3%9.4%7.5%8.6%8.2%8.3%
12.8%12.2%
8.7%5.2%9.3%n.a.
5.9%8.1%
13.6%9.7%
10.5%5.2%n.a.
8.3%5.6%
11.5%6.3%9.4%n.a.
6.9%8.1%n.a.
10.2%9.5%
15.3%11.2%11.0%12.3%10.7%13.1%15.8%10.2%10.2%10.5%15.1%10.8%11.2%11.0%15.2%
9.7%13.6%11.1%13.1%13.2%10.5%10.3%10.4%12.8%13.3%10.8%15.7%14.0%11.0%
9.4%13.7%
n.a. 8.5%9.2%
14.2%11.6%11.2%
9.4%11.4%
8.3%8.7%
12.8%10.2%10.0%
n.a. 10.0%10.7%
n.a.
42.7%51.3%68.5%
141.7%26.7%51.4%35.9%41.4%70.0%26.5%31.6%
n.a.88.0%
125.0%74.4%34.3%83.2%48.7%47.1%47.2%34.2%37.5%94.4%35.5%
200.0%14.3%80.0%43.8%
138.8%186.9%
94.0%44.9%90.9%91.1%68.8%65.2%49.7%40.9%18.7%41.7%
n.a.44.9%32.2%37.8%45.5%49.2%75.6%
147.2%60.4%
n.a.
3.8%3.5%3.3%0.7%3.8%2.2%5.1%8.2%2.0%5.5%2.9%n.a.
3.7%0.4%0.8%2.4%5.5%1.9%2.8%3.0%4.5%0.8%1.8%3.0%0.1%0.7%2.0%3.3%4.9%0.6%1.2%3.8%1.1%4.5%4.8%5.4%4.4%2.5%3.6%2.7%n.a.
6.9%3.7%2.9%5.4%3.1%4.1%1.3%6.0%n.a.
0.4%-0.2%0.2%0.3%0.3%0.1%0.4%1.0%1.4%
-0.7%-0.1%0.1%1.4%1.3%0.5%0.2%1.8%0.0%0.2%0.3%
-0.3%1.4%1.1%0.1%0.4%0.4%1.2%0.1%1.7%0.7%
-0.3%-0.3%1.4%1.0%0.5%
-0.9%0.2%0.1%0.1%
-1.5%0.8%0.2%
-0.9%-0.2%-0.5%-0.5%1.0%
-0.4%-0.6%0.5%
0.8%0.1%0.7%0.5%0.2%0.4%0.5%1.2%2.1%
-1.0%-0.1%0.5%2.0%1.8%0.7%0.4%2.5%0.0%0.5%0.8%
-0.1%1.7%1.7%0.3%0.7%0.6%1.6%0.2%2.5%0.9%
-0.4%-0.3%1.4%1.4%0.5%
-0.8%0.4%0.3%0.3%
-0.4%0.9%0.8%
-0.8%-0.4%-0.5%-0.4%1.4%
-0.6%-0.2%0.6%
expenses and other non-interest operating expenses. • Operating profit = net interest income + total non-interest operating income - total non-interest expenses + equity-accounted profit/ loss (operating) + change in fair value of own debt - loan impairment charge - other credit impairment charges. • Net profits are recorded after non-operating items, provisions and taxes and include minority interest. • Operating return on assets is the ratio of operating profits over average assets. • Return on assets and return on equity are net profit divided by average assets and total equity respectively. • Τhe Non interest income ratio is the ratio of non-interest operating income over total operating income. • In the change in operating and net profit columns, P-L: profit to losses; L-P: loss to profit; L-L: losses to losses; n.a.: not available or not meaningful • Total Capital Adequacy Ratio is the risk weighted capital ratio. Risk capital is the summation of Tier 1 and Tier 2 capital less investment in subsidiaries, where Tier 2 capital includes cumulative preference shares, revaluation reserves, subordinate and other long term debts. • Tier 1 Capital Ratio is the core capital ratio which includes common stock, disclosed reserves, retained earnings, and minority interest in equity or associates. • All data in this table are collected and updated to the best of our knowledge. • Weprovide this service with no warranty whatsoever as to the currency, accuracy, or applicability of the data for any purposes. • Due to an oversight in the bank screening process, six small banks from Japan, two from Korea and one from Hong Kong that do not fit the traditional criteria have been included in this listing. These banks will not be included in future print or online versions, and have been marked next to the far right column with a #.
Return onEquity Assets
Loan toDepositRatio
Equity toAssetsRatio
Cost to IncomeRatio
Non-interestIncome
Ratio
Loan Loss Reserve toGross NPLs
Gross NPLRatio
0.1%0.1%0.0%2.9%0.0%0.0%0.1%
24.3%n.a.n.a.
0.0%0.2%
17.0%4.4%0.8%0.0%7.5%0.1%0.0%
n.a.0.0%2.6%0.9%
n.a.3.0%1.7%
18.7%0.0%1.9%2.6%3.2%0.0%6.4%5.1%
n.a.0.0%
n.a.0.1%0.0%0.0%
n.a.n.a.
0.0%n.a.
0.0%0.0%1.6%0.8%
n.a.n.a.
LiquidAsset /
Total Asset
Capital Adequacy RatioTier 1 Total
OperatingReturn on
Assets
AB300Rank2009
ABJ ISS-92(PG1-47).indd 33ABJ ISS-92(PG1-47).indd 33 8/28/09 1:04:03 AM8/28/09 1:04:03 AM
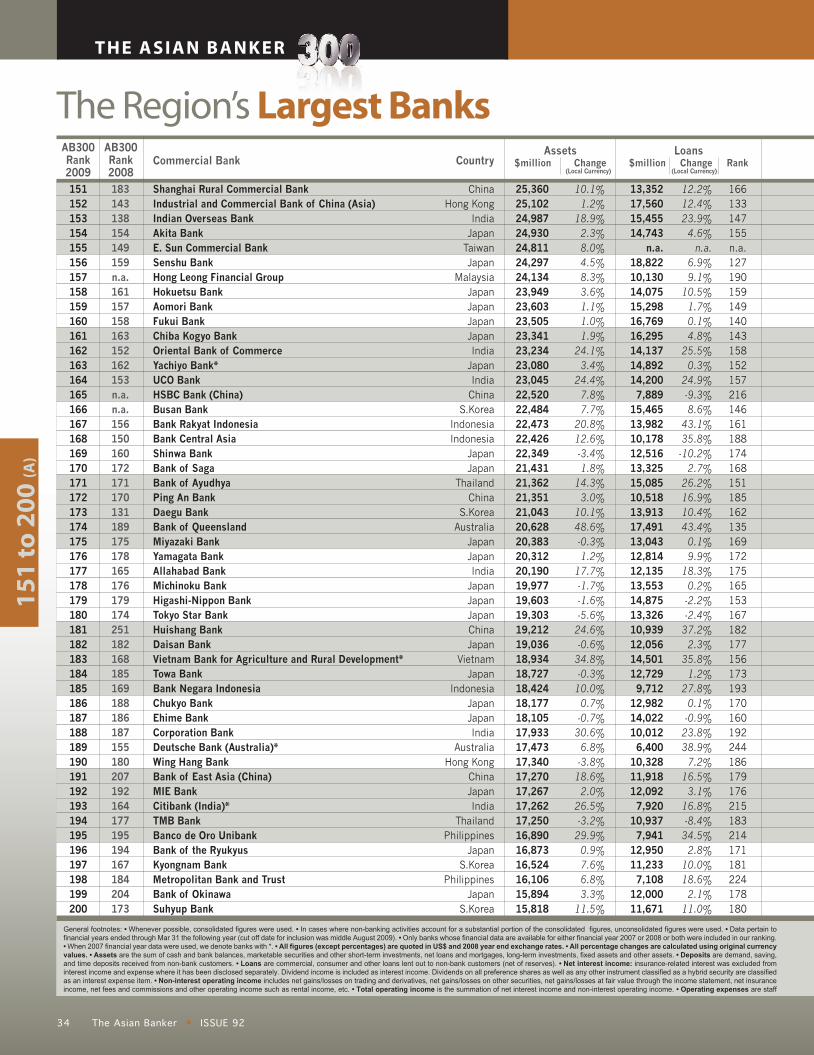
34 ISSUE 92The Asian Banker
THE ASIAN BANKER
The Region’s Largest Banks
15
1 t
o 2
00
(A)
25,36025,10224,98724,93024,81124,29724,13423,94923,60323,50523,34123,23423,08023,04522,52022,48422,47322,42622,34921,43121,36221,35121,04320,62820,38320,31220,19019,97719,60319,30319,21219,03618,93418,72718,42418,17718,10517,93317,47317,34017,27017,26717,26217,25016,89016,87316,52416,10615,89415,818
13,35217,56015,45514,743
n.a.18,82210,13014,07515,29816,76916,29514,13714,89214,200
7,88915,46513,98210,17812,51613,32515,08510,51813,91317,49113,04312,81412,13513,55314,87513,32610,93912,05614,50112,729
9,71212,98214,02210,012
6,40010,32811,91812,092
7,92010,937
7,94112,95011,233
7,10812,00011,671
10.1%1.2%18.9%2.3%8.0%4.5%8.3%3.6%1.1%1.0%1.9%24.1%3.4%24.4%7.8%7.7%20.8%12.6%-3.4%1.8%14.3%3.0%10.1%48.6%-0.3%1.2%17.7%-1.7%-1.6%-5.6%24.6%-0.6%34.8%-0.3%10.0%0.7%-0.7%30.6%6.8%-3.8%18.6%2.0%26.5%-3.2%29.9%0.9%7.6%6.8%3.3%11.5%
12.2%12.4%23.9%4.6%n.a.
6.9%9.1%10.5%1.7%0.1%4.8%25.5%0.3%24.9%-9.3%8.6%43.1%35.8%-10.2%2.7%26.2%16.9%10.4%43.4%0.1%9.9%18.3%0.2%-2.2%-2.4%37.2%2.3%35.8%1.2%27.8%0.1%-0.9%23.8%38.9%7.2%16.5%3.1%16.8%-8.4%34.5%2.8%10.0%18.6%2.1%11.0%
166133147155n.a.127190159149140143158152157216146161188174168151185162135169172175165153167182177156173193170160192244186179176215183214171181224178180
ChinaHong Kong
IndiaJapan
TaiwanJapan
MalaysiaJapanJapanJapanJapanIndia
JapanIndia
ChinaS.Korea
IndonesiaIndonesia
JapanJapan
ThailandChina
S.KoreaAustralia
JapanJapanIndia
JapanJapanJapanChinaJapan
VietnamJapan
IndonesiaJapanJapanIndia
AustraliaHong Kong
ChinaJapanIndia
ThailandPhilippines
JapanS.Korea
PhilippinesJapan
S.Korea
General footnotes: • Whenever possible, consolidated figures were used. • In cases where non-banking activities account for a substantial portion of the consolidated figures, unconsolidated figures were used. • Data pertain to financial years ended through Mar 31 the following year (cut off date for inclusion was middle August 2009). • Only banks whose financial data are available for either financial year 2007 or 2008 or both were included in our ranking.• When 2007 financial year data were used, we denote banks with *. • All figures (except percentages) are quoted in US$ and 2008 year end exchange rates. • All percentage changes are calculated using original currency values. • Assets are the sum of cash and bank balances, marketable securities and other short-term investments, net loans and mortgages, long-term investments, fixed assets and other assets. • Deposits are demand, saving, and time deposits received from non-bank customers. • Loans are commercial, consumer and other loans lent out to non-bank customers (net of reserves). • Net interest income: insurance-related interest was excluded from interest income and expense where it has been disclosed separately. Dividend income is included as interest income. Dividends on all preference shares as well as any other instrument classified as a hybrid security are classified as an interest expense item. • Non-interest operating income includes net gains/losses on trading and derivatives, net gains/losses on other securities, net gains/losses at fair value through the income statement, net insurance income, net fees and commissions and other operating income such as rental income, etc. • Total operating income is the summation of net interest income and non-interest operating income. • Operating expenses are staff
Shanghai Rural Commercial BankIndustrial and Commercial Bank of China (Asia)Indian Overseas BankAkita BankE. Sun Commercial BankSenshu BankHong Leong Financial GroupHokuetsu BankAomori BankFukui BankChiba Kogyo BankOriental Bank of CommerceYachiyo Bank*UCO BankHSBC Bank (China)Busan BankBank Rakyat IndonesiaBank Central AsiaShinwa BankBank of SagaBank of AyudhyaPing An BankDaegu BankBank of QueenslandMiyazaki BankYamagata BankAllahabad BankMichinoku BankHigashi-Nippon BankTokyo Star BankHuishang BankDaisan BankVietnam Bank for Agriculture and Rural Development*Towa BankBank Negara IndonesiaChukyo BankEhime BankCorporation BankDeutsche Bank (Australia)*Wing Hang BankBank of East Asia (China)MIE BankCitibank (India)*TMB BankBanco de Oro UnibankBank of the RyukyusKyongnam BankMetropolitan Bank and TrustBank of OkinawaSuhyup Bank
151152153154155156157158159160161162163164165166167168169170171172173174175176177178179180181182183184185186187188189190191192193194195196197198199200
183143138154149159n.a.161157158163152162153n.a.n.a.156150160172171170131189175178165176179174251182168185169188186187155180207192164177195194167184204173
AB300Rank2009
AB300Rank2008
Commercial Bank CountryAssets
$million ChangeLoans
$million Change Rank(Local Currency)(Local Currency)
ABJ ISS-92(PG1-47).indd 34ABJ ISS-92(PG1-47).indd 34 8/28/09 1:04:04 AM8/28/09 1:04:04 AM

35 ISSUE 92 The Asian Banker
151152153154155156157158159160161162163164165166167168169170171172173174175176177178179180181182183184185186187188189190191192193194195196
197#
198199200
757458907358283430650292300388298585430550787783
2,0121,481
329372863570
2,960387235178686258379555653208946306
1,229304379579197359423254
1,245618774342512718332306
274162401308250299273289295285280285322302463354990622299270534270
2,586243275257289296253339253250445243660239267207448201175217450455587243221510216178
18.7%11.1%27.6%-14.4%6.3%4.7%11.5%-26.3%-13.2%-2.8%-30.5%27.0%-3.6%17.9%92.1%13.8%19.3%30.5%-22.5%-4.8%16.5%8.7%
221.8%24.9%-19.5%-50.0%25.0%-33.2%-5.9%-2.6%62.5%-37.0%44.3%-6.7%16.1%-6.9%-10.6%30.2%8.5%
-17.0%85.5%-17.9%49.7%-1.0%-4.0%-4.3%25.2%-4.9%-8.8%0.9%
1241861052092371901422332281992291551911641181195370
21720510815934
20025327013224020216214125710122479
22620315626220819224378
151121213173128215225
9.0%10.3%30.7%4.2%10.8%10.2%12.6%-3.2%3.8%6.1%3.0%28.1%1.8%12.0%64.3%4.2%21.0%15.7%-1.7%-1.6%7.2%25.8%336.6%23.1%0.1%2.7%20.9%-5.9%4.2%-4.3%64.4%-0.5%45.7%-3.0%-5.2%0.3%2.7%12.3%1.1%19.5%88.8%1.8%17.6%-53.5%12.5%0.5%6.7%9.1%1.6%6.7%
21,31617,82820,32622,175
n.a.20,32117,91621,68221,51020,91621,33320,22321,47519,12914,64511,79818,40519,13520,36819,46815,39815,62813,42613,88117,96918,50117,29518,90618,15617,23714,66817,94013,76217,36414,90116,73116,34214,177
n.a.14,859
9,73214,832
9,48712,90313,25215,609
9,35012,32614,266
9,017
15.1%0.5%18.6%0.8%n.a.
4.2%10.6%1.0%1.9%1.5%2.1%26.5%2.8%24.8%28.0%8.4%21.7%10.8%-3.8%1.6%7.6%-5.5%35.4%57.5%2.1%3.8%18.2%-0.6%-1.1%-5.5%26.2%2.0%45.7%-1.7%11.6%1.1%0.1%28.7%n.a.
1.1%83.3%2.0%21.6%-3.3%42.2%0.4%25.4%10.5%6.1%9.3%
145163148139n.a.149162140141146144150142153181209158152147151173171189186160157165155159166180161187164177167170185n.a.178228179231194190172234198184238
756389592363283370403317350331371412392339460674
1,7131,128
338325761558600292308285448338359422480304702281905289342352141316379232754453486308412479305274
22.8%26.0%19.0%-0.3%6.3%1.4%18.5%-0.6%-2.4%3.2%0.9%19.5%0.7%10.3%71.7%18.6%17.0%29.0%-14.0%-0.2%35.4%11.9%8.6%31.1%-2.9%-3.2%20.9%-1.0%-5.7%-7.8%50.0%-7.3%30.5%-5.6%32.7%-1.0%-5.1%16.2%179.5%1.2%64.7%-3.7%35.9%-3.9%7.5%1.8%24.2%8.0%-0.3%9.0%
1001811231932241911752061972031901711791991511084171
20220498
13112121921222215620019416614221510522581
220198196275207186241101155141210170143214228
expenses and other non-interest operating expenses. • Operating profit = net interest income + total non-interest operating income - total non-interest expenses + equity-accounted profit/ loss (operating) + change in fair value of own debt - loan impairment charge - other credit impairment charges. • Net profits are recorded after non-operating items, provisions and taxes and include minority interest. • Operating return on assets is the ratio of operating profits over average assets. • Return on assets and return on equity are net profit divided by average assets and total equity respectively. • Τhe Non interest income ratio is the ratio of non-interest operating income over total operating income. • In the change in operating and net profit columns, P-L: profit to losses; L-P: loss to profit; L-L: losses to losses; n.a.: not available or not meaningful • Total Capital Adequacy Ratio is the risk weighted capital ratio. Risk capital is the summation of Tier 1 and Tier 2 capital less investment in subsidiaries, where Tier 2 capital includes cumulative preference shares, revaluation reserves, subordinate and other long term debts. • Tier 1 Capital Ratio is the core capital ratio which includes common stock, disclosed reserves, retained earnings, and minority interest in equity or associates. • All data in this table are collected and updated to the best of our knowledge. • Weprovide this service with no warranty whatsoever as to the currency, accuracy, or applicability of the data for any purposes. • Due to an oversight in the bank screening process, six small banks from Japan, two from Korea and one from Hong Kong that do not fit the traditional criteria have been included in this listing. These banks will not be included in future print or online versions, and have been marked next to the far right column with a #.
AB300Rank2009
Operating Expenses$million Change
Deposits$million Change Rank
Total Operating Income$million Change Rank
Net Interest Income$million Change Rank
1,7041,7981,4761,2601,394
8161,775
691739
1,1021,1661,5281,083
8171,7041,3072,0422,126
928948
2,4461,2641,2691,163
6941,0541,246
5151,0841,1251,749
383626421
1,412830790
1,020263
1,3681,506
8141,887
7201,111
886989
1,3191,096
622
135128147167149213130234224184178144187212134161119114202201100166165179233189168264186181131276241270148211218192288151145214123229183206196160185245
Shareholder’s Equity$million Rank
(Local Currency) (Local Currency) (Local Currency) (Local Currency)
ABJ ISS-92(PG1-47).indd 35ABJ ISS-92(PG1-47).indd 35 8/28/09 1:04:06 AM8/28/09 1:04:06 AM

36 ISSUE 92The Asian Banker
THE ASIAN BANKER
The Region’s Largest Banks
15
1 t
o 2
00
(B)
44137389-37n.a.31
323-20
-134-96-32239108118321308762700
2715
156260281127
-243-115163
-117-128
71273
-163304
-3171-9142
186-245
63235
6658
187865
222140
8028
-64.4%-45.1%16.8%
P-Ln.a.
-37.2%13.6%
P-LP-LP-LP-L
-7.9%-21.4%21.4%146.9%-1.9%10.5%21.1%
L-P-74.6%
L-P-8.9%-3.1%28.1%
L-LP-L
-20.5%P-LP-L
-47.6%18.3%
P-L254.6%
P-L47.9%
P-L-31.2%20.0%
L-L-76.2%171.5%-94.0%105.0%
L-P-60.9%82.7%24.1%12.7%-39.8%-76.8%
20716177
254n.a.21690
24928027025311618217592944649
21922715011010316729127314727427919410628695
24414426920913629219811923951
225189197121160187218
ChinaHong Kong
IndiaJapan
TaiwanJapan
MalaysiaJapanJapanJapanJapanIndia
JapanIndia
ChinaS.Korea
IndonesiaIndonesia
JapanJapan
ThailandChina
S.KoreaAustralia
JapanJapanIndia
JapanJapanJapanChinaJapan
VietnamJapan
IndonesiaJapanJapanIndia
AustraliaHong Kong
ChinaJapanIndia
ThailandPhilippines
JapanS.Korea
PhilippinesJapan
S.Korea
General footnotes: • Whenever possible, consolidated figures were used. • In cases where non-banking activities account for a substantial portion of the consolidated figures, unconsolidated figures were used. • Data pertain to financial years ended through Mar 31 the following year (cut off date for inclusion was middle August 2009). • Only banks whose financial data are available for either financial year 2007 or 2008 or both were included in our ranking.• When 2007 financial year data were used, we denote banks with *. • All figures (except percentages) are quoted in US$ and 2008 year end exchange rates. • All percentage changes are calculated using original currency values. • Assets are the sum of cash and bank balances, marketable securities and other short-term investments, net loans and mortgages, long-term investments, fixed assets and other assets. • Deposits are demand, saving, and time deposits received from non-bank customers. • Loans are commercial, consumer and other loans lent out to non-bank customers (net of reserves). • Net interest income: insurance-related interest was excluded from interest income and expense where it has been disclosed separately. Dividend income is included as interest income. Dividends on all preference shares as well as any other instrument classified as a hybrid security are classified as an interest expense item. • Non-interest operating income includes net gains/losses on trading and derivatives, net gains/losses on other securities, net gains/losses at fair value through the income statement, net insurance income, net fees and commissions and other operating income such as rental income, etc. • Total operating income is the summation of net interest income and non-interest operating income. • Operating expenses are staff
Operating Profit$million Change RankCountry
Shanghai Rural Commercial BankIndustrial and Commercial Bank of China (Asia)Indian Overseas BankAkita BankE. Sun Commercial BankSenshu BankHong Leong Financial GroupHokuetsu BankAomori BankFukui BankChiba Kogyo BankOriental Bank of CommerceYachiyo Bank*UCO BankHSBC Bank (China)Busan BankBank Rakyat IndonesiaBank Central AsiaShinwa BankBank of SagaBank of AyudhyaPing An BankDaegu BankBank of QueenslandMiyazaki BankYamagata BankAllahabad BankMichinoku BankHigashi-Nippon BankTokyo Star BankHuishang BankDaisan BankVietnam Bank for Agriculture and Rural Development*Towa BankBank Negara IndonesiaChukyo BankEhime BankCorporation BankDeutsche Bank (Australia)*Wing Hang BankBank of East Asia (China)MIE BankCitibank (India)*TMB BankBanco de Oro UnibankBank of the RyukyusKyongnam BankMetropolitan Bank and TrustBank of OkinawaSuhyup Bank
151152153154155156157158159160161162163164165166167168169170171172173174175176177178179180181182183184185186187188189190191192193194195196197198199200
183143138154149159n.a.161157158163152162153n.a.n.a.156150160172171170131189175178165176179174251182168185169188186187155180207192164177195194167184204173
108125274-2324-4
239-93
-152-83-90187
84115263218544527-17
1140239207
88-247
-63163
-296-101
4184
-308266-43112-24-32186
92150149
16372
154734
1679730
6
99.9%-39.8%10.3%
P-L-69.8%
P-L14.5%
P-LP-LP-LP-L
156.3%-14.0%35.3%152.0%1.6%23.2%28.7%
L-L-98.8%
L-P3.3%0.2%43.8%
P-LP-L
-20.5%P-LP-L
-97.5%43.0%
P-L307.9%
P-L36.0%
P-LP-L
20.0%1601.3%-42.9%245.2%-75.3%100.5%
L-P-65.9%122.2%30.6%-36.1%-58.0%-91.4%
15013574
24220123685
26627726026310317114378924243
2412331238496
16628425211428826922810528977
24614724324410416111711821062
211190195111158197225
Net Profit$million Change Rank
AB300Rank2009
AB300Rank2008
Commercial Bank(Local Currency) (Local Currency)
ABJ ISS-92(PG1-47).indd 36ABJ ISS-92(PG1-47).indd 36 8/28/09 1:04:07 AM8/28/09 1:04:07 AM

37 ISSUE 92 The Asian Banker
151152153154155156157158159160161162163164165166167168169170171172173174175176177178179180181182183184185186187188189190191192193194195196
197#
198199200
6.5%6.6%
22.1%-1.7%1.7%
-0.5%14.0%
-12.7%-18.0%
-7.2%-13.8%13.7%
8.3%16.2%16.1%17.6%29.3%26.9%-1.9%0.1%6.0%
21.9%17.8%
9.5%-29.4%
-5.4%14.1%
-42.8%-10.1%
0.3%15.8%
-50.3%68.4%
-11.6%7.9%
-2.6%-3.8%19.5%34.4%10.9%10.7%
1.7%23.3%
1.2%4.0%4.2%
19.4%7.2%2.8%1.0%
62.6%98.5%76.0%66.5%
n.a.92.6%56.5%64.9%71.1%80.2%76.4%69.9%69.3%74.2%53.9%
131.1%76.0%53.2%61.5%68.4%98.0%67.3%
103.6%126.0%
72.6%69.3%70.2%71.7%81.9%77.3%74.6%67.2%
105.4%73.3%65.2%77.6%85.8%70.6%
n.a.69.5%
122.5%81.5%83.5%84.8%59.9%83.0%
120.1%57.7%84.1%
129.4%
6.7%7.2%5.9%5.1%5.6%3.4%7.4%2.9%3.1%4.7%5.0%6.6%4.7%3.5%7.6%5.8%9.1%9.5%4.2%4.4%
11.5%5.9%6.0%5.6%3.4%5.2%6.2%2.6%5.5%5.8%9.1%2.0%3.3%2.2%7.7%4.6%4.4%5.7%1.5%7.9%8.7%4.7%
10.9%4.2%6.6%5.2%6.0%8.2%6.9%3.9%
36.2%35.3%44.2%86.1%
69.6%42.1%98.9%98.4%73.5%93.7%48.8%75.0%54.9%58.9%45.2%49.2%42.0%91.0%72.5%61.8%47.4%87.4%62.7%
117.2%144.7%
42.1%114.6%
66.7%61.1%38.7%
120.3%47.1%79.4%53.7%78.5%70.7%35.7%
220.9%56.1%41.5%85.5%36.1%73.6%75.8%71.2%43.2%71.0%65.2%58.1%
0.1%15.1%34.7%
n.a.n.a.
13.9%38.0%
n.a.n.a.
14.5%n.a.
29.6%8.9%
38.3%41.6%13.9%14.9%23.8%
n.a.12.6%11.8%
2.0%79.7%24.7%
n.a.n.a.
34.6%n.a.
5.2%24.0%26.4%
n.a.25.8%
8.1%26.4%
5.0%9.8%
39.3%28.1%11.9%10.4%
8.7%39.4%26.7%37.2%
9.8%19.5%33.2%
8.0%10.2%
12.0%7.3%7.9%
10.9%
7.2%n.a.
6.4%7.8%8.3%8.6%9.1%
10.4%n.a. n.a.
8.5%n.a.
15.3%6.4%7.3%
12.4%10.5%
8.0%7.2%6.6%
12.4%n.a.
6.1%8.8%7.7%
13.6%4.3%4.8%4.4%
10.5%7.5%5.7%8.9%n.a.
8.4%n.a.
9.0%11.2%10.1%
9.0%8.2%7.8%
10.0%11.0%
n.a.
11.8%13.6%13.2%11.7%10.6%10.2%
n.a. 9.4%
10.8%11.0%
9.5%13.0%11.6%
n.a. n.a.
13.3%13.2%15.8%10.1%10.7%14.9%10.7%12.0%11.0%
9.7%13.0%
n.a. 8.8%
10.7%9.0%
15.8%7.4%7.2%7.4%
13.5%10.5%
9.2%13.8%
n.a. 15.4%
n.a. 10.6%12.0%13.9%13.5%
9.8%11.8%13.4%11.6%
n.a.
84.2%71.4%40.0%50.0%
n.a.58.4%
104.3%31.2%28.3%35.6%36.0%60.0%23.0%
n.a.83.3%
115.4%n.a.
416.7%n.a.
59.4%58.0%
160.0%123.1%100.0%
54.0%38.6%
n.a.54.4%44.1%50.4%
210.7%57.7%
n.a.25.3%
104.1%52.5%33.8%81.8%
n.a.71.4%
n.a.35.3%38.1%65.1%72.6%41.1%
155.6%75.6%50.7%
n.a.
1.9%0.7%2.5%4.7%0.9%2.0%2.3%3.1%3.8%4.1%3.7%1.5%5.3%n.a.
0.6%1.3%n.a.
0.6%n.a.
3.5%10.0%
0.5%1.3%0.1%3.5%2.8%n.a.
4.7%6.4%5.7%1.2%2.7%n.a.
8.5%4.9%4.3%4.0%1.1%n.a.
0.7%n.a.
2.4%2.1%
16.5%5.5%1.8%0.9%4.5%2.7%n.a.
0.4%0.5%1.2%
-0.1%0.1%0.0%1.0%
-0.4%-0.6%-0.4%-0.4%0.9%0.4%0.6%1.2%1.0%2.7%2.6%
-0.1%0.0%0.7%1.1%1.0%0.5%
-1.2%-0.3%0.9%
-1.5%-0.5%0.0%1.1%
-1.6%1.6%
-0.2%0.7%
-0.1%-0.2%1.2%0.5%0.8%0.9%0.1%2.4%0.1%0.3%0.2%1.0%0.6%0.2%0.0%
0.2%0.5%1.7%
-0.2%n.a.
0.1%1.4%
-0.1%-0.6%-0.4%-0.1%1.1%0.5%0.6%1.5%1.4%3.8%3.4%0.1%0.1%0.8%1.2%1.4%0.7%
-1.2%-0.6%0.9%
-0.6%-0.6%0.4%1.6%
-0.9%1.8%0.0%1.0%
-0.5%0.2%1.2%
-1.4%0.4%1.5%0.0%4.3%0.1%0.5%0.4%1.4%0.9%0.5%0.2%
expenses and other non-interest operating expenses. • Operating profit = net interest income + total non-interest operating income - total non-interest expenses + equity-accounted profit/ loss (operating) + change in fair value of own debt - loan impairment charge - other credit impairment charges. • Net profits are recorded after non-operating items, provisions and taxes and include minority interest. • Operating return on assets is the ratio of operating profits over average assets. • Return on assets and return on equity are net profit divided by average assets and total equity respectively. • Τhe Non interest income ratio is the ratio of non-interest operating income over total operating income. • In the change in operating and net profit columns, P-L: profit to losses; L-P: loss to profit; L-L: losses to losses; n.a.: not available or not meaningful • Total Capital Adequacy Ratio is the risk weighted capital ratio. Risk capital is the summation of Tier 1 and Tier 2 capital less investment in subsidiaries, where Tier 2 capital includes cumulative preference shares, revaluation reserves, subordinate and other long term debts. • Tier 1 Capital Ratio is the core capital ratio which includes common stock, disclosed reserves, retained earnings, and minority interest in equity or associates. • All data in this table are collected and updated to the best of our knowledge. • Weprovide this service with no warranty whatsoever as to the currency, accuracy, or applicability of the data for any purposes. • Due to an oversight in the bank screening process, six small banks from Japan, two from Korea and one from Hong Kong that do not fit the traditional criteria have been included in this listing. These banks will not be included in future print or online versions, and have been marked next to the far right column with a #.
Return onEquity Assets
Loan toDepositRatio
Equity toAssetsRatio
Cost to IncomeRatio
Non-interestIncome
Ratio
Loan Loss Reserve toGross NPLs
Gross NPLRatio
n.a.0.8%0.6%
n.a.n.a.n.a.
5.8%0.0%0.0%0.0%0.0%
23.2%0.0%
n.a.18.9%
0.8%4.3%4.9%0.0%3.4%
27.9%2.7%
n.a.n.a.n.a.
0.0%n.a.
0.0%n.a.n.a.
1.9%0.1%
10.4%n.a.
2.5%0.0%0.0%
n.a.51.8%
2.2%n.a.n.a.n.a.
0.8%39.2%
n.a.0.9%0.7%
n.a.1.8%
LiquidAsset /
Total Asset
Capital Adequacy RatioTier 1 Total
OperatingReturn on
Assets
AB300Rank2009
ABJ ISS-92(PG1-47).indd 37ABJ ISS-92(PG1-47).indd 37 8/28/09 1:04:08 AM8/28/09 1:04:08 AM

38 ISSUE 92The Asian Banker
THE ASIAN BANKER
The Region’s Largest Banks
20
1 t
o 2
50
(A)
15,80015,71515,71015,59215,54915,24715,15715,10915,02814,64214,58914,57514,50714,50014,47014,35514,27314,15914,05714,03813,83413,82013,80613,71213,50813,31913,26313,10413,05812,97812,90112,88512,71812,53512,51712,48612,46612,26212,18412,16112,05712,03412,01611,97411,95911,80211,68311,65811,59311,403
8,4399,5146,6636,1805,3228,5796,8837,0915,872
10,2933,7858,3738,2257,7608,7548,1499,0816,419
10,0976,7449,2578,711
10,1455,715
10,6825,7301,275
n.a.9,5145,5899,0939,4195,9418,5566,5668,4659,2327,4287,0778,4548,7007,5898,9796,5117,9647,4631,7017,0665,5926,986
-0.8%10.0%88.9%38.2%16.6%9.7%24.7%36.8%26.5%2.3%12.0%43.8%25.1%-3.1%12.1%n.a.
20.3%1.6%-3.1%4.6%0.7%13.5%2.0%23.2%6.1%0.9%24.6%-15.5%1.3%7.7%1.2%-3.2%5.1%5.6%12.1%2.9%-1.2%46.2%22.6%4.5%19.6%2.2%1.2%0.3%15.0%-1.7%-5.9%18.8%17.4%16.5%
5.5%10.0%28.0%29.4%38.6%14.3%10.8%34.5%17.1%2.9%18.0%43.0%37.2%-1.3%-0.7%n.a.
21.8%8.3%2.4%17.0%3.6%13.4%0.6%31.0%6.5%-3.2%
214.1%n.a.
3.3%3.3%2.1%-4.9%5.3%5.0%14.8%12.2%0.8%50.7%17.1%1.3%31.4%11.6%0.3%-1.1%10.3%-3.4%
101.9%22.8%45.2%18.0%
209194236247266205231225253187282210211217202212200243191234197203189258184257295n.a.195262199196252206240207198223226208204219201242213222294227261230
Hong KongHong Kong
ChinaIndia
JapanMalaysia
IndiaChinaChinaJapan
Hong KongChinaIndia
Hong KongTaiwanChina
VietnamHong Kong
JapanPhilippines
JapanMalaysia
JapanChina
AustraliaMalaysia
TaiwanJapanJapan
Hong KongJapanJapan
MalaysiaMalaysia
ChinaS.Korea
JapanChinaIndia
TaiwanMalaysiaThailand
JapanJapan
MalaysiaJapan
S.KoreaIndia
VietnamVietnam
General footnotes: • Whenever possible, consolidated figures were used. • In cases where non-banking activities account for a substantial portion of the consolidated figures, unconsolidated figures were used. • Data pertain to financial years ended through Mar 31 the following year (cut off date for inclusion was middle August 2009). • Only banks whose financial data are available for either financial year 2007 or 2008 or both were included in our ranking.• When 2007 financial year data were used, we denote banks with *. • All figures (except percentages) are quoted in US$ and 2008 year end exchange rates. • All percentage changes are calculated using original currency values. • Assets are the sum of cash and bank balances, marketable securities and other short-term investments, net loans and mortgages, long-term investments, fixed assets and other assets. • Deposits are demand, saving, and time deposits received from non-bank customers. • Loans are commercial, consumer and other loans lent out to non-bank customers (net of reserves). • Net interest income: insurance-related interest was excluded from interest income and expense where it has been disclosed separately. Dividend income is included as interest income. Dividends on all preference shares as well as any other instrument classified as a hybrid security are classified as an interest expense item. • Non-interest operating income includes net gains/losses on trading and derivatives, net gains/losses on other securities, net gains/losses at fair value through the income statement, net insurance income, net fees and commissions and other operating income such as rental income, etc. • Total operating income is the summation of net interest income and non-interest operating income. • Operating expenses are staff
Nanyang Commercial BankCITIC Ka Wah BankEvergrowing Bank*HSBC (India)*Sony BankHSBC Bank(Malaysia)Standard Chartered Bank (India)*Bank of NingboBank of Tianjin*Shimizu BankCitibank (Hong Kong)*Bank of HangzhouIndian Bank*Dah Sing Banking GroupStandard Chartered Bank (Taiwan)*Standard Chartered Bank (China)*Bank for Investment and Development of VietnamShanghai Commercial BankKanto Tsukuba BankBank of The Philippine IslandsTaiko BankOCBC Bank (Malaysia)Kagawa BankBank of NanjingCitibank (Australia)Citibank (Malaysia)Agricultural Bank of Taiwan*Japan Trustee Services BankTokushima BankWing Lung BankKita-Nippon BankKumamoto Family BankStandard Chartered Bank (Malaysia)EON CapitalBank of DalianKwangju BankKirayaka BankChina Zheshang BankBank of MaharashtraTaiwan Shin Kong Commercial BankBank Kerjasama Rakyat MalaysiaSiam City BankBiwako Bank*Ibarakiken Credit Cooperative*United Overseas Bank (Malaysia)Hokuto BankKorean Federation of Community Credit Cooperatives*Andhra Bank*Joint Stock Commercial Bank for Foreign Trade*Vietnam Bank for Industry and Trade
201202203204205206207208209210211212213214215216217218219220221222223224225226227228229230231232233234235236237238239240241242243244245246247248249250
n.a.201197214282206209240n.a.211n.a.n.a.181n.a.196199215205210193213221217238191212n.a.n.a.226224228220223n.a.271190229270222225237219233n.a.241234n.a.202n.a.235
AB300Rank2009
AB300Rank2008
Commercial Bank CountryAssets
$million ChangeLoans
$million Change Rank(Local Currency)(Local Currency)
ABJ ISS-92(PG1-47).indd 38ABJ ISS-92(PG1-47).indd 38 8/28/09 1:04:10 AM8/28/09 1:04:10 AM
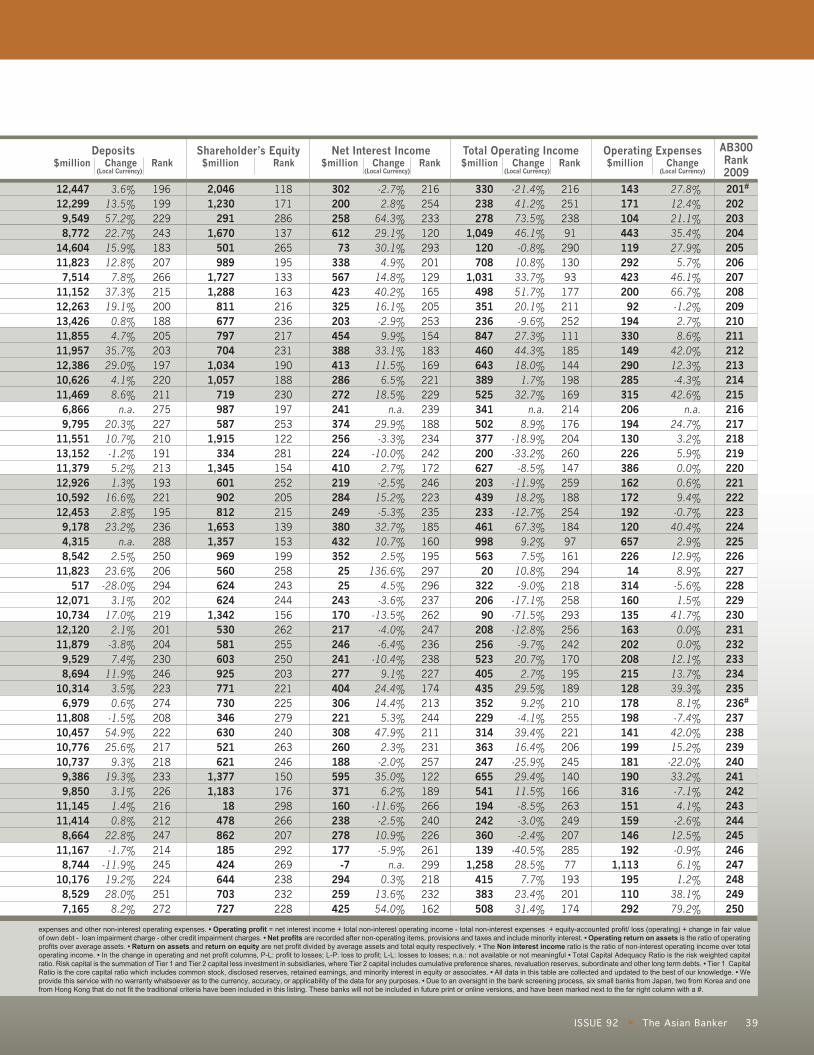
39 ISSUE 92 The Asian Banker
201#
202203204205206207208209210211212213214215216217218219220221222223224225226227228229230231232233234235
236#
237238239240241242243244245246247248249250
330238278
1,049120708
1,031498351236847460643389525341502377200627203439233461998563
20322206
90208256523405435352229314363247655541194242360139
1,258415383508
143171104443119292423200
92194330149290285315206194130226386162172192120657226
14314160135163202208215128178198141199181190316151159146192
1,113195110292
-21.4%41.2%73.5%46.1%-0.8%10.8%33.7%51.7%20.1%-9.6%27.3%44.3%18.0%1.7%32.7%n.a.
8.9%-18.9%-33.2%-8.5%-11.9%18.2%-12.7%67.3%9.2%7.5%10.8%-9.0%-17.1%-71.5%-12.8%-9.7%20.7%2.7%29.5%9.2%-4.1%39.4%16.4%-25.9%29.4%11.5%-8.5%-3.0%-2.4%-40.5%28.5%7.7%23.4%31.4%
21625123891
29013093
17721125211118514419816921417620426014725918825418497
16129421825829325624217019518921025522120624514016626324920728577
193201174
27.8%12.4%21.1%35.4%27.9%5.7%46.1%66.7%-1.2%2.7%8.6%42.0%12.3%-4.3%42.6%n.a.
24.7%3.2%5.9%0.0%0.6%9.4%-0.7%40.4%2.9%12.9%8.9%-5.6%1.5%41.7%0.0%0.0%12.1%13.7%39.3%8.1%-7.4%42.0%15.2%-22.0%33.2%-7.1%4.1%-2.6%12.5%-0.9%6.1%1.2%38.1%79.2%
12,44712,299
9,5498,772
14,60411,823
7,51411,15212,26313,42611,85511,95712,38610,62611,469
6,8669,795
11,55113,15211,37912,92610,59212,453
9,1784,3158,542
11,823517
12,07110,73412,12011,879
9,5298,694
10,3146,979
11,80810,45710,77610,737
9,3869,850
11,14511,414
8,66411,167
8,74410,176
8,5297,165
3.6%13.5%57.2%22.7%15.9%12.8%7.8%37.3%19.1%0.8%4.7%35.7%29.0%4.1%8.6%n.a.
20.3%10.7%-1.2%5.2%1.3%16.6%2.8%23.2%n.a.
2.5%23.6%-28.0%3.1%17.0%2.1%-3.8%7.4%11.9%3.5%0.6%-1.5%54.9%25.6%9.3%19.3%3.1%1.4%0.8%22.8%-1.7%-11.9%19.2%28.0%8.2%
196199229243183207266215200188205203197220211275227210191213193221195236288250206294202219201204230246223274208222217218233226216212247214245224251272
302200258612
73338567423325203454388413286272241374256224410219284249380432352
2525
243170217246241277404306221308260188595371160238278177
-7294259425
-2.7%2.8%64.3%29.1%30.1%4.9%14.8%40.2%16.1%-2.9%9.9%33.1%11.5%6.5%18.5%n.a.
29.9%-3.3%-10.0%2.7%-2.5%15.2%-5.3%32.7%10.7%2.5%
136.6%4.5%-3.6%-13.5%-4.0%-6.4%-10.4%9.1%24.4%14.4%5.3%47.9%2.3%-2.0%35.0%6.2%
-11.6%-2.5%10.9%-5.9%n.a.
0.3%13.6%54.0%
216254233120293201129165205253154183169221229239188234242172246223235185160195297296237262247236238227174213244211231257122189266240226261299218232162
expenses and other non-interest operating expenses. • Operating profit = net interest income + total non-interest operating income - total non-interest expenses + equity-accounted profit/ loss (operating) + change in fair value of own debt - loan impairment charge - other credit impairment charges. • Net profits are recorded after non-operating items, provisions and taxes and include minority interest. • Operating return on assets is the ratio of operating profits over average assets. • Return on assets and return on equity are net profit divided by average assets and total equity respectively. • Τhe Non interest income ratio is the ratio of non-interest operating income over total operating income. • In the change in operating and net profit columns, P-L: profit to losses; L-P: loss to profit; L-L: losses to losses; n.a.: not available or not meaningful • Total Capital Adequacy Ratio is the risk weighted capital ratio. Risk capital is the summation of Tier 1 and Tier 2 capital less investment in subsidiaries, where Tier 2 capital includes cumulative preference shares, revaluation reserves, subordinate and other long term debts. • Tier 1 Capital Ratio is the core capital ratio which includes common stock, disclosed reserves, retained earnings, and minority interest in equity or associates. • All data in this table are collected and updated to the best of our knowledge. • Weprovide this service with no warranty whatsoever as to the currency, accuracy, or applicability of the data for any purposes. • Due to an oversight in the bank screening process, six small banks from Japan, two from Korea and one from Hong Kong that do not fit the traditional criteria have been included in this listing. These banks will not be included in future print or online versions, and have been marked next to the far right column with a #.
AB300Rank2009
Operating Expenses$million Change
Deposits$million Change Rank
Total Operating Income$million Change Rank
Net Interest Income$million Change Rank
2,0461,230
2911,670
501989
1,7271,288
811677797704
1,0341,057
719987587
1,915334
1,345601902812
1,6531,357
969560624624
1,342530581603925771730346630521621
1,3771,183
18478862185424644703727
118171286137265195133163216236217231190188230197253122281154252205215139153199258243244156262255250203221225279240263246150176298266207292269238232228
Shareholder’s Equity$million Rank
(Local Currency) (Local Currency) (Local Currency) (Local Currency)
ABJ ISS-92(PG1-47).indd 39ABJ ISS-92(PG1-47).indd 39 8/28/09 1:04:11 AM8/28/09 1:04:11 AM

40 ISSUE 92The Asian Banker
THE ASIAN BANKER
The Region’s Largest Banks
20
1 t
o 2
50
(B)
15118
118443
-1351586260161
7493264217
19-3289
126200-67201
21237-51280190300
58
-77-141
-6056
27860
198115
13130
788
399164
40-59150
-141145191192148
-51.2%142.8%156.3%48.6%
P-L18.0%35.9%34.3%78.6%-75.1%44.3%25.0%28.3%-69.2%
L-Ln.a.
1.8%-38.9%
P-L-26.6%-60.3%17.4%
L-L66.0%10.7%38.7%10.2%-63.2%
P-LP-LP-LL-P
29.2%-27.8%-9.8%-3.3%L-P
20.1%14.0%-82.5%64.4%
L-P-21.2%
L-L-21.5%
L-LL-P
17.8%-9.6%64.3%
15122417467
2428457
11114823763
10812222325218616913026312922111725710413597
24023626528226220410520113117622816618823375
146210260153281156134133155
Hong KongHong Kong
ChinaIndia
JapanMalaysia
IndiaChinaChinaJapan
Hong KongChinaIndia
Hong KongTaiwanChina
VietnamHong Kong
JapanPhilippines
JapanMalaysia
JapanChina
AustraliaMalaysia
TaiwanJapanJapan
Hong KongJapanJapan
MalaysiaMalaysia
ChinaS.Korea
JapanChinaIndia
TaiwanMalaysiaThailand
JapanJapan
MalaysiaJapan
S.KoreaIndia
VietnamVietnam
General footnotes: • Whenever possible, consolidated figures were used. • In cases where non-banking activities account for a substantial portion of the consolidated figures, unconsolidated figures were used. • Data pertain to financial years ended through Mar 31 the following year (cut off date for inclusion was middle August 2009). • Only banks whose financial data are available for either financial year 2007 or 2008 or both were included in our ranking.• When 2007 financial year data were used, we denote banks with *. • All figures (except percentages) are quoted in US$ and 2008 year end exchange rates. • All percentage changes are calculated using original currency values. • Assets are the sum of cash and bank balances, marketable securities and other short-term investments, net loans and mortgages, long-term investments, fixed assets and other assets. • Deposits are demand, saving, and time deposits received from non-bank customers. • Loans are commercial, consumer and other loans lent out to non-bank customers (net of reserves). • Net interest income: insurance-related interest was excluded from interest income and expense where it has been disclosed separately. Dividend income is included as interest income. Dividends on all preference shares as well as any other instrument classified as a hybrid security are classified as an interest expense item. • Non-interest operating income includes net gains/losses on trading and derivatives, net gains/losses on other securities, net gains/losses at fair value through the income statement, net insurance income, net fees and commissions and other operating income such as rental income, etc. • Total operating income is the summation of net interest income and non-interest operating income. • Operating expenses are staff
Operating Profit$million Change RankCountry
Nanyang Commercial BankCITIC Ka Wah BankEvergrowing Bank*HSBC (India)*Sony BankHSBC Bank(Malaysia)Standard Chartered Bank (India)*Bank of NingboBank of Tianjin*Shimizu BankCitibank (Hong Kong)*Bank of HangzhouIndian Bank*Dah Sing Banking GroupStandard Chartered Bank (Taiwan)*Standard Chartered Bank (China)*Bank for Investment and Development of VietnamShanghai Commercial BankKanto Tsukuba BankBank of The Philippine IslandsTaiko BankOCBC Bank (Malaysia)Kagawa BankBank of NanjingCitibank (Australia)Citibank (Malaysia)Agricultural Bank of Taiwan*Japan Trustee Services BankTokushima BankWing Lung BankKita-Nippon BankKumamoto Family BankStandard Chartered Bank (Malaysia)EON CapitalBank of DalianKwangju BankKirayaka BankChina Zheshang BankBank of MaharashtraTaiwan Shin Kong Commercial BankBank Kerjasama Rakyat MalaysiaSiam City BankBiwako Bank*Ibarakiken Credit Cooperative*United Overseas Bank (Malaysia)Hokuto BankKorean Federation of Community Credit Cooperatives*Andhra Bank*Joint Stock Commercial Bank for Foreign Trade*Vietnam Bank for Industry and Trade
201202203204205206207208209210211212213214215216217218219220221222223224225226227228229230231232233234235236237238239240241242243244245246247248249250
n.a.201197214282206209240n.a.211n.a.n.a.181n.a.196199215205210193213221217238191212n.a.n.a.226224228220223n.a.271190229270222225237219233n.a.241234n.a.202n.a.235
1311766
246-13260352195104-70415187217
25-1550
105153
-110138
12173-50213137223
44
-77-105
-667
20739
13182
-528678
7317118
19-64112
-201121120141111
-50.6%20.6%179.4%41.0%
P-L22.1%25.1%40.0%57.0%
P-L46.6%50.7%28.4%-76.4%
L-Ln.a.
10.8%-46.1%
P-L-35.9%-49.9%21.2%
L-L60.1%12.4%30.6%-13.1%-63.6%
P-LP-LP-LL-P
34.7%-39.9%2.1%-8.3%L-L
59.6%14.2%-84.0%61.5%
L-P-60.1%
P-L-19.5%
L-LL-P
8.0%-7.1%63.6%
13120917681
2397964
10015325653
10293
19824018715211627312521610924894
12691
22922725827125522295
19213217225016817522369
141207253145281136138121148
Net Profit$million Change Rank
AB300Rank2009
AB300Rank2008
Commercial Bank(Local Currency) (Local Currency)
ABJ ISS-92(PG1-47).indd 40ABJ ISS-92(PG1-47).indd 40 8/28/09 1:04:12 AM8/28/09 1:04:12 AM

41 ISSUE 92 The Asian Banker
201#
202203204205206207208209210211212213214215216217218219220221222223224225226227228229230231232233234235
236#
237238239240241242243244245246247248249250
6.5%1.3%
25.0%17.0%-3.1%28.6%24.1%16.0%13.4%-9.7%54.3%29.5%23.6%
2.1%-2.6%
n.a.19.0%
8.0%-25.3%10.0%
2.0%21.5%-5.8%13.7%10.8%25.8%
0.6%0.7%
-11.2%-7.1%
-10.8%1.6%
38.5%4.3%
19.1%12.3%
-16.1%18.2%17.5%
1.1%25.0%10.8%59.3%
-12.4%13.7%
-90.0%33.7%18.6%21.8%16.3%
67.8%77.4%69.8%70.4%36.4%72.6%91.6%63.6%47.9%76.7%31.9%70.0%66.4%73.0%76.3%
118.7%92.7%55.6%76.8%59.3%71.6%82.2%81.5%62.3%
247.5%67.1%10.8%
n.a.78.8%52.1%75.0%79.3%62.3%98.4%63.7%
121.3%78.2%71.0%65.7%78.7%92.7%77.0%80.6%57.0%91.9%66.8%19.5%69.4%65.6%97.5%
13.0%7.8%1.9%
10.7%3.2%6.5%
11.4%8.5%5.4%4.6%5.5%4.8%7.1%7.3%5.0%6.9%4.1%
13.5%2.4%9.6%4.3%6.5%5.9%
12.1%10.0%
7.3%4.2%4.8%4.8%
10.3%4.1%4.5%4.7%7.4%6.2%5.8%2.8%5.1%4.3%5.1%
11.4%9.8%0.1%4.0%7.2%1.6%3.6%5.5%6.1%6.4%
43.3%71.7%37.3%42.2%99.2%41.3%41.0%40.2%26.3%82.1%39.0%32.3%45.2%73.3%60.1%60.6%38.6%34.3%
113.0%61.5%79.6%39.1%82.2%25.4%65.8%40.1%70.1%97.6%77.4%
150.1%78.5%78.7%39.8%53.0%29.4%50.7%86.6%44.9%54.8%73.2%29.1%58.5%77.8%65.8%40.5%
137.9%88.5%47.0%28.7%56.8%
8.5%16.1%
7.4%41.7%38.7%52.3%45.0%15.1%
7.4%13.9%46.4%15.8%35.8%26.6%48.2%29.4%25.5%32.1%
n.a.34.7%
n.a.35.4%
n.a.17.7%56.7%37.5%
n.a.92.1%
n.a.n.a.n.a.
4.0%53.9%31.8%
7.1%13.1%
3.5%2.0%
28.4%23.9%
9.2%31.3%17.3%
1.5%22.7%
n.a.n.a.
29.1%32.4%16.3%
15.9%9.6%4.9%9.7%
12.8%9.2%8.2%n.a.
11.1%8.2%
13.7%n.a.
11.7%6.8%5.2%
12.3%7.1%
18.0%5.6%
12.7%8.8%7.7%8.5%
20.7%12.4%11.3%
8.9%35.6%
7.7%12.0%
7.6%7.0%8.6%9.2%9.0%7.6%5.6%7.6%n.a.
7.1%n.a.
9.7%5.8%n.a. n.a.
4.9%n.a.
8.6%10.0%
n.a.
17.1%14.7%
7.0%10.6%13.3%13.4%10.6%
n.a. 11.5%
9.5%14.3%
n.a. 13.2%13.6%
8.8%13.4%
6.6%19.0%
8.2%14.2%11.4%11.6%
9.8%24.1%12.4%13.7%
8.9%35.6%
8.8%13.8%
9.7%9.2%
13.8%12.6%10.9%12.1%
8.7%10.0%
n.a. 10.6%
n.a. 10.4%
9.6%n.a. n.a.
8.4%n.a.
11.6%12.0%
n.a.
150.0%36.8%
n.a.73.9%45.0%
150.0%36.4%
155.6%103.8%
47.3%100.0%166.7%
50.0%81.8%41.6%
750.0%196.2%
32.0%41.5%59.0%33.4%85.3%51.5%
175.0%n.a.
109.7%n.a.n.a.
47.3%200.0%
41.5%n.a.
96.2%83.3%46.7%
160.0%37.9%
300.0%n.a.
78.0%96.5%65.1%53.3%33.3%71.4%40.2%
n.a.n.a.
30.6%100.0%
0.6%1.9%n.a.
2.3%0.2%1.6%2.2%0.9%2.6%3.5%0.6%0.9%1.2%1.7%1.8%0.2%2.6%2.5%5.8%3.9%3.9%3.4%6.2%1.6%n.a.
3.1%n.a. n.a.
4.6%0.2%3.9%n.a.
2.6%4.8%7.5%1.0%6.7%0.4%2.3%1.6%5.7%8.8%3.4%
11.1%4.2%6.6%n.a. n.a.
14.4%1.8%
0.8%0.1%0.6%1.8%
-0.1%1.7%2.6%1.5%0.8%
-0.5%3.0%1.5%1.7%0.2%
-0.1%n.a.
0.8%1.1%
-0.8%1.0%0.1%1.3%
-0.4%1.7%1.0%1.7%0.0%0.0%
-0.6%-0.8%-0.5%0.1%1.6%0.3%1.1%0.7%
-0.4%0.8%0.7%0.1%2.9%1.0%0.2%
-0.5%1.0%
-1.7%1.0%1.1%1.3%1.0%
1.0%0.1%1.0%3.3%0.0%2.4%4.3%2.0%1.2%0.0%3.6%2.1%1.7%0.1%
-0.2%n.a.
1.0%1.4%
-0.5%1.5%0.2%1.8%
-0.4%2.3%1.4%2.3%0.0%0.1%
-0.6%-1.1%-0.5%0.4%2.2%0.5%1.7%0.9%0.1%1.3%0.7%0.1%3.6%1.4%0.3%
-0.5%1.3%
-1.2%1.2%1.8%1.8%1.4%
expenses and other non-interest operating expenses. • Operating profit = net interest income + total non-interest operating income - total non-interest expenses + equity-accounted profit/ loss (operating) + change in fair value of own debt - loan impairment charge - other credit impairment charges. • Net profits are recorded after non-operating items, provisions and taxes and include minority interest. • Operating return on assets is the ratio of operating profits over average assets. • Return on assets and return on equity are net profit divided by average assets and total equity respectively. • Τhe Non interest income ratio is the ratio of non-interest operating income over total operating income. • In the change in operating and net profit columns, P-L: profit to losses; L-P: loss to profit; L-L: losses to losses; n.a.: not available or not meaningful • Total Capital Adequacy Ratio is the risk weighted capital ratio. Risk capital is the summation of Tier 1 and Tier 2 capital less investment in subsidiaries, where Tier 2 capital includes cumulative preference shares, revaluation reserves, subordinate and other long term debts. • Tier 1 Capital Ratio is the core capital ratio which includes common stock, disclosed reserves, retained earnings, and minority interest in equity or associates. • All data in this table are collected and updated to the best of our knowledge. • Weprovide this service with no warranty whatsoever as to the currency, accuracy, or applicability of the data for any purposes. • Due to an oversight in the bank screening process, six small banks from Japan, two from Korea and one from Hong Kong that do not fit the traditional criteria have been included in this listing. These banks will not be included in future print or online versions, and have been marked next to the far right column with a #.
Return onEquity Assets
Loan toDepositRatio
Equity toAssetsRatio
Cost to IncomeRatio
Non-interestIncome
Ratio
Loan Loss Reserve toGross NPLs
Gross NPLRatio
27.5%80.9%
n.a.n.a.n.a.
6.6%n.a.
1.5%n.a.
0.0%65.0%
3.3%n.a.
2.2%n.a.n.a.
29.5%48.7%
0.0%5.2%
n.a.1.2%0.1%8.3%3.8%6.9%
n.a.n.a.
0.0%14.1%
n.a.n.a.
8.4%0.1%2.0%0.3%0.0%1.5%
n.a.n.a.
0.8%19.0%
n.a.n.a.n.a.
0.0%n.a.n.a.
1.6%0.4%
LiquidAsset /
Total Asset
Capital Adequacy RatioTier 1 Total
OperatingReturn on
Assets
AB300Rank2009
ABJ ISS-92(PG1-47).indd 41ABJ ISS-92(PG1-47).indd 41 8/28/09 1:04:14 AM8/28/09 1:04:14 AM

42 ISSUE 92The Asian Banker
THE ASIAN BANKER
The Region’s Largest Banks
25
1 t
o 3
00
(A)
11,25111,20211,00310,85610,83210,78810,67910,36810,24110,10910,001
9,8629,7969,7719,7419,5829,5309,4249,3579,3579,3329,1069,0359,0299,0038,9338,8228,6028,5938,5378,4698,4298,3948,3828,3438,3238,3038,1978,1148,0908,0588,0218,0087,9917,9687,9637,8897,8607,8417,779
7,5585,7492,6756,3547,7085,4267,0235,2225,1807,5875,9606,5735,9626,5956,8315,7695,6346,6516,8286,2563,7985,0266,5556,6692,308
-214,2746,0845,8665,0804,2625,4445,3582,3466,0502,4404,6432,8272,727
9955,6822,6733,3784,5434,5382,6143,6774,1564,7834,320
2.5%28.4%-1.8%-0.4%25.6%-0.2%2.2%7.3%
-22.1%5.3%25.9%1.8%20.0%1.4%-2.4%9.5%3.5%10.0%0.7%24.3%26.6%91.6%0.6%1.7%-3.0%55.0%-1.0%8.6%-3.1%33.7%8.3%-3.9%2.3%10.2%1.5%28.0%-0.9%9.1%5.9%46.3%0.9%60.8%1.4%4.9%2.7%22.3%-5.3%3.2%13.4%15.1%
2.3%25.7%15.6%-5.6%20.1%-12.5%-1.7%21.2%8.5%9.5%25.4%1.4%26.0%-1.5%-4.8%18.9%15.8%23.5%2.2%51.7%18.5%91.5%0.6%2.2%17.5%n.a.
4.9%4.8%-2.1%34.2%4.9%-2.2%2.8%20.9%1.8%14.3%2.3%2.7%12.6%80.6%-0.4%21.2%-2.0%18.2%1.5%7.8%1.5%-0.9%22.7%10.8%
221256287245218264229267268220251239250238232255260237233246281270241235292297277248254269278263265291249290272285286296259288284273274289283279271276
JapanIndia
TaiwanTaiwan
ThailandTaiwanTaiwan
PakistanChinaJapanIndia
TaiwanIndonesia
JapanJapan
PakistanMalaysia
IndonesiaJapanChinaChinaChinaJapanJapan
TaiwanJapan
Hong KongTaiwanJapanIndia
Hong KongTaiwanJapanChinaJapan
ThailandIndia
JapanPhilippines
JapanJapanChinaJapan
MalaysiaJapan
MalaysiaJapanJapan
PakistanIndia
General footnotes: • Whenever possible, consolidated figures were used. • In cases where non-banking activities account for a substantial portion of the consolidated figures, unconsolidated figures were used. • Data pertain to financial years ended through Mar 31 the following year (cut off date for inclusion was middle August 2009). • Only banks whose financial data are available for either financial year 2007 or 2008 or both were included in our ranking.• When 2007 financial year data were used, we denote banks with *. • All figures (except percentages) are quoted in US$ and 2008 year end exchange rates. • All percentage changes are calculated using original currency values. • Assets are the sum of cash and bank balances, marketable securities and other short-term investments, net loans and mortgages, long-term investments, fixed assets and other assets. • Deposits are demand, saving, and time deposits received from non-bank customers. • Loans are commercial, consumer and other loans lent out to non-bank customers (net of reserves). • Net interest income: insurance-related interest was excluded from interest income and expense where it has been disclosed separately. Dividend income is included as interest income. Dividends on all preference shares as well as any other instrument classified as a hybrid security are classified as an interest expense item. • Non-interest operating income includes net gains/losses on trading and derivatives, net gains/losses on other securities, net gains/losses at fair value through the income statement, net insurance income, net fees and commissions and other operating income such as rental income, etc. • Total operating income is the summation of net interest income and non-interest operating income. • Operating expenses are staff
First Bank of ToyamaUnited Bank of India*China Development Financial Holding*Far Eastern International BankThanachart BankUnion Bank of TaiwanYuanta Commercial BankNational Bank of PakistanRural Credit Cooperatives Union of Shunde*Shonai BankDena BankTa Chong BankBank DanamonNagano BankBank of KochiHabib BankAffin BankBank CIMB NiagaTomato BankChinese Mercantile BankDongguan City Commercial Bank*China Bohai BankTajima Bank*Tottori BankIndustrial Bank of TaiwaneBANK*Chong Hing BankTaichung Commercial BankGifu BankPunjab and Sind BankFubon Bank (Hong Kong)EnTie Commercial BankSendai BankJiangnan Rural Credit Cooperatives of WuhanIbaraki BankStandard Chartered Bank (Thailand)Kotak Mahindra BankNaganoken Credit Cooperative*Land Bank of the Philippines*Trust and Custody Services BankSaikyo BankChangsha City Commercial Bank*Nagano Shinkin Bank*Alliance Financial Group*Miura Fujisawa Shinkin Bank*BIMB HoldingsTakinogawa Shinkin Bank*Tokyo Shinkin Bank*United BankJammu and Kashmir Bank
251252253254255256257258259260261262263264265266267268269270271272273274275276277278279280281282283284285286287288289290291292293294295296297298299300
243208n.a.231260232236216n.a.258245244248257252230246n.a.261n.a.259n.a.263267247n.a.256268269n.a.272253276n.a.275285288n.a.277n.a.279n.a.n.a.n.a.n.a.289n.a.n.a.254265
AB300Rank2009
AB300Rank2008
Commercial Bank CountryAssets
$million ChangeLoans
$million Change Rank(Local Currency)(Local Currency)
ABJ ISS-92(PG1-47).indd 42ABJ ISS-92(PG1-47).indd 42 8/28/09 1:04:16 AM8/28/09 1:04:16 AM

43 ISSUE 92 The Asian Banker
251252253254255256257258259260261262263264265266267268269270271272273274275276277278279280281282283284285286287288289290291292
293#
294 295#
296 297#
298#
299300
158283575188602191132660283149301242940176183554293547179312246188161109146-53165170106287199139121144168314
1,090133396251140180147294140243
-426140473257
130186312136430162154249223161151172538132155277142319136
3884
113114118
80154100
94104137150188117
55140134815
95277216113
7895
136104184
88101221
97
-21.5%-8.4%-19.4%-19.3%50.0%-17.7%-34.5%15.8%35.4%-26.1%11.5%-25.7%13.6%-4.1%-0.1%20.5%7.5%3.1%-2.6%
102.3%36.4%110.7%6.6%
-32.0%-10.0%-162.3%-20.2%-8.9%-25.4%26.2%-0.8%-8.6%-2.3%46.4%-5.7%-6.5%-9.9%12.5%8.2%1.8%5.7%21.0%8.4%10.2%1.2%26.1%
-486.1%0.2%18.5%18.0%
27723615826515326428813823527822724810327126716323216526922324626627529128029527427229223426128628928127322287
287197244284268279230282247297283182241
1.1%16.0%17.1%-3.9%50.0%-10.5%-1.0%35.1%36.1%3.5%12.2%-1.0%30.3%-0.6%-3.0%21.2%2.9%14.3%5.8%75.0%31.5%88.7%2.7%-0.9%9.3%55.6%20.1%3.0%-0.1%18.5%16.0%-68.0%-7.5%14.6%1.2%0.4%-3.5%0.6%1.9%3.2%-4.6%21.8%-1.9%-4.8%2.9%19.0%-7.3%0.5%15.4%16.7%
9,8819,477
4168,9357,7378,3768,8816,5278,9448,8338,5457,3336,7559,2239,0337,4667,2837,6768,7492,4306,6807,1198,5678,3602,1538,3777,6647,8087,7146,6746,1926,5487,9103,1467,9593,7112,7737,7286,049
3997,5985,7587,2576,1647,6575,9287,5167,3946,2246,811
3.3%26.8%197.8%5.5%42.9%5.2%12.1%-3.2%7.6%2.9%28.5%10.1%28.0%2.4%-2.7%14.1%7.5%11.3%1.3%91.9%6.8%
112.0%0.6%3.1%15.7%57.4%-1.5%8.9%-4.6%36.6%15.7%3.7%2.6%18.6%2.0%41.0%2.6%10.4%7.3%6.2%0.2%40.8%2.0%11.7%2.2%18.1%-0.6%3.5%19.4%15.4%
225232295240258253241281239242249269277235237267270261244292278273248254293252262257260279283280256290255289291259285296264287271284263286265268282276
167187104115315215137471212156220158860157181465193438160270222145134138
7028
113164126209129101140144165206490127299
19138106131185131190130131364212
-2.5%-24.1%45.0%-10.6%37.5%-2.0%-20.3%10.2%38.3%-4.4%23.8%-15.4%18.7%-4.7%-4.3%17.4%7.0%11.4%-1.3%
139.4%29.0%91.7%-2.2%-5.0%
162.1%38.9%-10.7%1.9%-5.7%24.0%13.8%-18.8%-5.2%45.3%-2.6%-20.9%29.6%2.6%8.1%
112.5%-11.1%46.2%-1.4%11.4%1.4%25.6%-1.5%-7.8%16.1%23.5%
26325829128820824827914725027124526986
270260149255159267230243272280278294295289265287251285292276274264252140286217298277290281259283256284282192249
expenses and other non-interest operating expenses. • Operating profit = net interest income + total non-interest operating income - total non-interest expenses + equity-accounted profit/ loss (operating) + change in fair value of own debt - loan impairment charge - other credit impairment charges. • Net profits are recorded after non-operating items, provisions and taxes and include minority interest. • Operating return on assets is the ratio of operating profits over average assets. • Return on assets and return on equity are net profit divided by average assets and total equity respectively. • Τhe Non interest income ratio is the ratio of non-interest operating income over total operating income. • In the change in operating and net profit columns, P-L: profit to losses; L-P: loss to profit; L-L: losses to losses; n.a.: not available or not meaningful • Total Capital Adequacy Ratio is the risk weighted capital ratio. Risk capital is the summation of Tier 1 and Tier 2 capital less investment in subsidiaries, where Tier 2 capital includes cumulative preference shares, revaluation reserves, subordinate and other long term debts. • Tier 1 Capital Ratio is the core capital ratio which includes common stock, disclosed reserves, retained earnings, and minority interest in equity or associates. • All data in this table are collected and updated to the best of our knowledge. • Weprovide this service with no warranty whatsoever as to the currency, accuracy, or applicability of the data for any purposes. • Due to an oversight in the bank screening process, six small banks from Japan, two from Korea and one from Hong Kong that do not fit the traditional criteria have been included in this listing. These banks will not be included in future print or online versions, and have been marked next to the far right column with a #.
AB300Rank2009
Operating Expenses$million Change
Deposits$million Change Rank
Total Operating Income$million Change Rank
Net Interest Income$million Change Rank
620543
4,292585602395562
1,321345316448728
1,015383303950782855360
1,338396730379292
1,210172769468265400609551177
57179671
1,359410908613229208689749231560125326624541
24726058
254251274256159280283268227193275284200219208278158273226277285173295222267287272249259294297293237152271204248290291235223289257296282242261
Shareholder’s Equity$million Rank
(Local Currency) (Local Currency) (Local Currency) (Local Currency)
ABJ ISS-92(PG1-47).indd 43ABJ ISS-92(PG1-47).indd 43 8/28/09 1:04:17 AM8/28/09 1:04:17 AM

44 ISSUE 92The Asian Banker
THE ASIAN BANKER
The Region’s Largest Banks
25
1 t
o 3
00
(B)
766
251-9057
-59-119272
61-45112
-2236
12-5
160131121
33247169
4329
-2544
-22619
8-44121
9-156
45212
100210
37107
352669-5
14510
110-517
36172130
-88.5%5.7%
-44.0%L-L
0.0%L-LL-L
-16.6%33.1%
P-L88.5%
L-L-26.6%
L-PL-L
25.1%41.1%-37.2%14.4%86.3%101.5%228.2%220.6%
P-L-42.3%
L-L-70.7%-87.6%
P-L16.3%-86.6%
L-LL-P
44.7%-11.7%11.3%-27.7%68.1%13.2%-5.9%L-P
47.1%P-L
232.7%-68.2%37.3%
P-L13.2%24.2%9.7%
238196113267203261275107200256177243118229245149163172215114145208217251206290222234255171232284241205230184126212183214220195246158231181294213142165
JapanIndia
TaiwanTaiwan
ThailandTaiwanTaiwan
PakistanChinaJapanIndia
TaiwanIndonesia
JapanJapan
PakistanMalaysia
IndonesiaJapanChinaChinaChinaJapanJapan
TaiwanJapan
Hong KongTaiwanJapanIndia
Hong KongTaiwanJapanChinaJapan
ThailandIndia
JapanPhilippines
JapanJapanChinaJapan
MalaysiaJapan
MalaysiaJapanJapan
PakistanIndia
General footnotes: • Whenever possible, consolidated figures were used. • In cases where non-banking activities account for a substantial portion of the consolidated figures, unconsolidated figures were used. • Data pertain to financial years ended through Mar 31 the following year (cut off date for inclusion was middle August 2009). • Only banks whose financial data are available for either financial year 2007 or 2008 or both were included in our ranking.• When 2007 financial year data were used, we denote banks with *. • All figures (except percentages) are quoted in US$ and 2008 year end exchange rates. • All percentage changes are calculated using original currency values. • Assets are the sum of cash and bank balances, marketable securities and other short-term investments, net loans and mortgages, long-term investments, fixed assets and other assets. • Deposits are demand, saving, and time deposits received from non-bank customers. • Loans are commercial, consumer and other loans lent out to non-bank customers (net of reserves). • Net interest income: insurance-related interest was excluded from interest income and expense where it has been disclosed separately. Dividend income is included as interest income. Dividends on all preference shares as well as any other instrument classified as a hybrid security are classified as an interest expense item. • Non-interest operating income includes net gains/losses on trading and derivatives, net gains/losses on other securities, net gains/losses at fair value through the income statement, net insurance income, net fees and commissions and other operating income such as rental income, etc. • Total operating income is the summation of net interest income and non-interest operating income. • Operating expenses are staff
Operating Profit$million Change RankCountry
First Bank of ToyamaUnited Bank of India*China Development Financial Holding*Far Eastern International BankThanachart BankUnion Bank of TaiwanYuanta Commercial BankNational Bank of PakistanRural Credit Cooperatives Union of Shunde*Shonai BankDena BankTa Chong BankBank DanamonNagano BankBank of KochiHabib BankAffin BankBank CIMB NiagaTomato BankChinese Mercantile BankDongguan City Commercial Bank*China Bohai BankTajima Bank*Tottori BankIndustrial Bank of TaiwaneBANK*Chong Hing BankTaichung Commercial BankGifu BankPunjab and Sind BankFubon Bank (Hong Kong)EnTie Commercial BankSendai BankJiangnan Rural Credit Cooperatives of WuhanIbaraki BankStandard Chartered Bank (Thailand)Kotak Mahindra BankNaganoken Credit Cooperative*Land Bank of the Philippines*Trust and Custody Services BankSaikyo BankChangsha City Commercial Bank*Nagano Shinkin Bank*Alliance Financial Group*Miura Fujisawa Shinkin Bank*BIMB HoldingsTakinogawa Shinkin Bank*Tokyo Shinkin Bank*United BankJammu and Kashmir Bank
251252253254255256257258259260261262263264265266267268269270271272273274275276277278279280281282283284285286287288289290291292293294295296297298299300
243208n.a.231260232236216n.a.258245244248257252230246n.a.261n.a.259n.a.263267247n.a.256268269n.a.272253276n.a.275285288n.a.277n.a.279n.a.n.a.n.a.n.a.289n.a.n.a.254265
2266
232-8157
-42-98198
51-8487-2
1656
-92197
9662
3178116
1910-8
-60-260
86
-659013
-1741
37-358
135119221154511
1107
125-444
24107
85
-33.8%19.3%-48.3%
L-L100.0%
L-LL-L
-19.2%41.7%
P-L17.5%
L-L-20.6%
L-PL-L
54.8%42.5%-54.8%-79.6%58.3%132.9%177.7%-12.3%
P-LP-LL-L
-88.0%-88.3%
P-L14.3%-78.2%
L-LL-P
22.5%P-L
15.6%-31.9%-47.2%1.6%0.0%L-P
70.1%-28.6%253.9%-64.2%-51.4%
P-L-3.4%-8.6%13.8%
20317787
25918424526898
18626216723411322626599
159180231108142208219237251286220224254162215280232193235183128218160205212191217149221134291200151170
Net Profit$million Change Rank
AB300Rank2009
AB300Rank2008
Commercial Bank(Local Currency) (Local Currency)
ABJ ISS-92(PG1-47).indd 44ABJ ISS-92(PG1-47).indd 44 8/28/09 1:04:19 AM8/28/09 1:04:19 AM

45 ISSUE 92 The Asian Banker
251252253254255256257258259260261262263264265266267268269270271272273274275276277278279280281282283284285286287288289290291292
293#
294 295#
296 297#
298#
299300
3.1%12.7%
5.1%-14.0%
9.5%-9.9%
-16.0%13.9%15.7%
-21.2%22.1%-0.3%16.2%
1.4%-25.5%22.5%12.7%
9.2%0.7%
14.3%32.3%
2.6%2.5%
-2.4%-4.8%
-88.4%1.0%1.3%
-34.8%21.7%
2.3%-35.5%
0.8%31.8%-1.6%9.0%
10.5%2.5%
11.2%3.5%6.7%
23.6%1.6%
16.2%3.2%
24.5%-134.6%
7.3%17.1%16.6%
76.5%60.7%
643.8%71.1%99.6%64.8%79.1%80.0%57.9%85.9%69.7%89.6%88.3%71.5%75.6%77.3%77.4%86.6%78.0%
257.4%56.8%70.6%76.5%79.8%
107.2%-0.2%55.8%77.9%76.0%76.1%68.8%83.1%67.7%74.6%76.0%65.7%
167.4%36.6%45.1%
249.4%74.8%46.4%46.5%73.7%59.3%44.1%48.9%56.2%76.8%63.4%
5.5%4.8%
39.0%5.4%5.6%3.7%5.3%
12.7%3.4%3.1%4.5%7.4%
10.4%3.9%3.1%9.9%8.2%9.1%3.8%
14.3%4.2%8.0%4.2%3.2%
13.4%1.9%8.7%5.4%3.1%4.7%7.2%6.5%2.1%0.7%2.1%8.1%
16.4%5.0%
11.2%7.6%2.8%2.6%8.6%9.4%2.9%7.0%1.6%4.1%8.0%7.0%
82.2%65.9%54.3%77.4%71.4%88.1%
116.7%37.7%78.5%
108.0%50.1%71.2%57.2%74.8%84.8%50.1%48.4%58.3%76.1%12.1%34.2%60.4%70.9%
108.6%54.8%
n.a. 60.5%54.4%98.5%47.7%75.5%
135.2%96.8%38.5%83.5%42.7%74.8%71.3%69.9%86.0%81.1%43.3%64.2%46.2%73.9%63.2%
n.a. 71.9%46.6%37.8%
n.a.34.0%82.0%38.8%47.6%
n.a.n.a.
28.6%25.3%
n.a.26.9%34.9%
8.6%10.8%
1.1%16.0%34.0%19.9%10.6%13.4%
9.9%22.8%16.9%
n.a.51.9%
n.a.31.3%
3.4%n.a.
27.3%35.1%27.2%
n.a.n.a.
2.0%34.4%55.0%
4.3%24.6%92.5%
1.3%41.1%11.1%37.0%
6.9%21.8%
n.a.6.5%
23.0%17.5%
11.0%n.a. n.a.
8.4%8.0%4.9%8.5%
14.1%n.a.
7.3%6.0%
12.0%15.1%
8.4%5.7%
11.5%10.1%12.0%
7.1%23.9%
n.a. 13.2%10.3%
7.9%15.1%10.0%12.6%
7.9%6.2%7.0%7.6%
11.2%5.7%n.a.
4.9%12.1%
0.0%n.a. n.a.
48.1%7.9%n.a. n.a.
11.5%n.a.
11.3%n.a. n.a.
6.1%12.8%
14.5%n.a. n.a.
10.6%11.0%
8.5%11.3%16.9%15.3%
8.9%10.7%12.0%14.0%
9.0%7.8%
13.6%13.1%15.6%
9.6%24.0%11.6%13.2%11.0%12.0%15.4%10.9%15.6%
9.3%8.5%
11.9%14.0%11.7%
9.0%n.a.
7.8%12.5%22.8%
n.a. 14.3%48.1%11.3%
n.a. n.a.
16.4%n.a.
13.2%n.a. n.a.
10.5%13.5%
46.3%n.a.
33.6%95.3%
100.0%63.3%
176.3%79.7%
n.a.32.8%47.6%
104.9%109.1%
49.9%51.2%69.9%68.5%88.0%36.3%50.0%
108.3%366.7%
21.1%42.4%
193.8%n.a.
133.3%102.9%
31.9%42.9%75.0%
101.1%21.0%74.2%37.4%
136.9%47.2%37.8%
144.6%n.a.
43.4%n.a.
29.4%80.0%15.2%71.7%10.9%32.4%68.5%50.0%
3.1%n.a.
7.2%1.5%3.0%2.5%1.4%
12.3%n.a.
3.5%2.1%1.8%2.2%5.3%7.8%8.3%5.4%2.5%3.9%0.8%2.4%0.3%3.2%2.4%0.5%n.a.
0.3%1.4%5.7%0.7%1.2%1.9%4.7%6.2%5.6%2.4%3.6%3.7%5.6%n.a.
4.2%n.a.
9.7%7.0%7.4%
18.7%4.4%7.0%7.3%2.6%
0.2%0.7%2.1%
-0.7%0.6%
-0.4%-0.9%2.0%0.4%
-0.9%1.0%0.0%1.9%0.1%
-0.9%2.1%1.0%0.9%0.0%2.1%1.4%0.3%0.1%
-0.1%-0.6%-3.5%0.1%0.1%
-0.7%1.2%0.2%
-2.0%0.0%0.5%0.0%0.8%1.6%0.1%1.2%0.3%0.2%0.7%0.1%1.4%0.1%1.7%
-5.5%0.3%1.4%1.2%
0.1%0.7%2.2%
-0.8%0.6%
-0.5%-1.1%2.8%0.5%
-0.5%1.2%0.0%2.7%0.1%0.0%1.7%1.4%1.7%0.4%2.9%2.0%0.6%0.3%
-0.3%0.5%
-3.0%0.2%0.1%
-0.5%1.6%0.1%
-1.8%0.0%0.6%0.1%1.4%2.5%0.5%1.4%0.5%0.3%1.1%
-0.1%1.9%0.1%1.5%
-6.4%0.5%2.3%1.8%
expenses and other non-interest operating expenses. • Operating profit = net interest income + total non-interest operating income - total non-interest expenses + equity-accounted profit/ loss (operating) + change in fair value of own debt - loan impairment charge - other credit impairment charges. • Net profits are recorded after non-operating items, provisions and taxes and include minority interest. • Operating return on assets is the ratio of operating profits over average assets. • Return on assets and return on equity are net profit divided by average assets and total equity respectively. • Τhe Non interest income ratio is the ratio of non-interest operating income over total operating income. • In the change in operating and net profit columns, P-L: profit to losses; L-P: loss to profit; L-L: losses to losses; n.a.: not available or not meaningful • Total Capital Adequacy Ratio is the risk weighted capital ratio. Risk capital is the summation of Tier 1 and Tier 2 capital less investment in subsidiaries, where Tier 2 capital includes cumulative preference shares, revaluation reserves, subordinate and other long term debts. • Tier 1 Capital Ratio is the core capital ratio which includes common stock, disclosed reserves, retained earnings, and minority interest in equity or associates. • All data in this table are collected and updated to the best of our knowledge. • Weprovide this service with no warranty whatsoever as to the currency, accuracy, or applicability of the data for any purposes. • Due to an oversight in the bank screening process, six small banks from Japan, two from Korea and one from Hong Kong that do not fit the traditional criteria have been included in this listing. These banks will not be included in future print or online versions, and have been marked next to the far right column with a #.
Return onEquity Assets
Loan toDepositRatio
Equity toAssetsRatio
Cost to IncomeRatio
Non-interestIncome
Ratio
Loan Loss Reserve toGross NPLs
Gross NPLRatio
0.0%n.a.n.a.
1.9%3.0%2.0%
11.4%n.a.n.a.
0.0%9.2%1.5%2.2%
n.a.0.2%
n.a.0.4%1.5%0.0%
n.a.8.6%2.3%0.1%
n.a.34.3%
n.a.37.1%
0.1%0.0%
16.9%31.0%
n.a.n.a.n.a.
0.1%41.1%
n.a.n.a.
0.1%n.a.
0.0%n.a.n.a.
0.4%0.0%0.3%
n.a.0.0%
n.a.0.2%
LiquidAsset /
Total Asset
Capital Adequacy RatioTier 1 Total
OperatingReturn on
Assets
AB300Rank2009
ABJ ISS-92(PG1-47).indd 45ABJ ISS-92(PG1-47).indd 45 8/28/09 1:04:20 AM8/28/09 1:04:20 AM

CO - PUBL I SHED ART ICLE
ISSUE 92The Asian Banker46
In an age of internationalisation and standardisation in the fi nancial services industry, many banks are now turning to “standard” platforms after having developed their own systems for
a long time. Adopting standard platforms has provided banks with the resources necessary to develop processes and products that allow differentiation in a competitive environment.
Within a short period of time, Zurich-based Avaloq has grown to be market leader in the provision of premier and standard integrated front-to-back solutions to the private and retail banks in Switzerland. More than 40% of the total number of work desks in the Swiss banking industry is supplied with the Avaloq Banking System. The Avaloq Banking System has also been adopted internationally. It was introduced by Swiss banks to locations such as Germany, Luxemburg, Liechtenstein, Andorra, UK, Bahrain, Hong Kong and Singapore.
Affi rming the system’s global appeal, two Asian banks chose to implement the Avaloq solution for their business needs in Asia, tapping into the rich experience and compre-hensive offering of the company, and taking full advantage of a multi-entity platform with standardised processes across entities. This led to extremely high quality standards at the banks.
Supporting the clients’ business with an international presence
Avaloq takes internationalisation seriously. The company approaches this not only with the Avaloq Banking System, but also with its sales and support organisations. The Avaloq Group has full support offi ces in Zurich, Geneva, Luxembourg and Singapore. Avaloq’s development centre is in Switzerland, manned by over 500 employees with banking and technology backgrounds, which this keeps the quality of the Avaloq Banking System at a very high level in both disciplines.
In Singapore, the Avaloq offi ce of 25 staff is the hub to the rest of Asia, supporting the company’s clients. This support structure is enhanced by a network of almost 100 qualifi ed consultants across Avaloq and its partners.
Avaloq’s “follow the client” approach to internationalisation means that future offi ces in other Asian cities are likely to follow.
Supporting the clients’ business with a network of excellence
Avaloq has brought not only its expertise, support and experience to Singapore, but it has also established an Asian Avaloq Community. The Avaloq Community has a long tradition of being a competence-sharing forum for the company’s clients and partners. The members of this “network of excellence” jointly develop innovative and effective solutions at various levels, brainstorm on new business models and collaborate on projects if they wish.
Setting standards in banking—the Avaloq way
Two Asian fi nancial institutions embrace Zurich-based core banking provider’s solutions
ABJ ISS-92(PG1-47).indd 46ABJ ISS-92(PG1-47).indd 46 8/28/09 1:04:21 AM8/28/09 1:04:21 AM

ISSUE 92 The Asian Banker 47
Community members can take an active or passive role, depending on whether they elect to be leaders or followers. This approach has been the cornerstone to the high sat-isfaction levels of Avaloq’s clients.
Supporting the clients’ business with an integrated and future-proof solution
It is always a tough decision for banks when deciding on a suitable platform that will meet the requirements of their challenging business plans. In the “now”, they address issues
of effi ciencies, compliance, customer acquisitions, running costs and maintain-ability. In the “future”, banks think of the expansion of their product offering,
increasing their business units or branches, scalability and sustainability. Avaloq has been used widely by the most demanding of banks for their
core banking needs in both the retail and private banking areas. In the same vein, Avaloq has also been used by other (as demanding) banks for their point solutions (full front-to-back securities process-ing, for example). Thanks to its modular design, single components can be neatly integrated into existing environments.
Most interestingly, Avaloq’s clients have been long-time users of the Avaloq Banking System. This clearly demonstrates how the system was able to meet their current requirements at the time and
also “grow” with the banks in providing the functionality and platform for their future needs.
The Avaloq Banking System is a comprehensive, mature and yet evolving system, in most part due to the Avaloq Community. New
value-adding modules are rolled out on a yearly basis with a clear focus on increasing process effi ciency and customer servicing quality, with the fol-
lowing, examples: The integrated Portfolio Management module not only covers classic portfolio man-
agement subjects like fi nancial needs analysis, automatic investment proposals and rebalancing but also offers the advantage of a seamless integration with back offi ce processing of the transaction. Hence, a client advisor knows precisely the status of each current and historical transaction of the client, at any time.
“We evaluated a number of leading systems. In the end, the decisive factor was the integration into Avaloq. The development and operation of interfaces can be eliminated, the data quality and consistency is improved in a sustainable way and additional service level agreements causing further efforts and costs are avoided.” – Mr. Arnfried Ossen, Head IT Application Management, Bank Sarasin & Cie AG.
Structured products are here to stay—and the best approach to structured products is to ensure that the system that handles these products and their related positions is able to meet the processes, risk and compliance requirements. Not only does the Avaloq Banking System handle these from end to end, but new products or hybrids are easily generated in order to react quickly to market needs.
With the design of the fl exible Avaloq Asset Model and the comprehensive components providing a myriad of permutations, new products can be easily built, with the help of the parameterisation technology of the system.
Ultimately, the success of the banks that run with Avaloq demonstrates that the Avaloq way of setting standards in banking is indeed the path that will ensure sustainable results.
Contact details: Avaloq Singapore Pte LtdOne Phillip Street #06-01Singapore 048692Tel: +65 6438 1017Fax: +65 6438 1167E-Mail: [email protected]
ABJ ISS-92(PG1-47).indd 47ABJ ISS-92(PG1-47).indd 47 8/28/09 1:04:23 AM8/28/09 1:04:23 AM

48 ISSUE 92The Asian Banker
THE ASIAN BANKER
Commercial BankRank
1
2
3
4
5
6
7
8
9
10
11
12
13
14
15
16
17
18
19
20
21
22
23
24
25
26
27
28
29
30
31
32
33
34
35
36
37
38
39
40
41
42
43
44
45
46
47
48
49
50
AB300Rank2009
3
5
6
7
9
12
20
23
25
27
28
29
34
40
41
48
53
56
58
63
70
72
74
78
80
82
84
85
100
104
115
118
123
130
131
142
148
151
152
155
165
172
181
190
191
201
202
203
208
209
Industrial and Commercial Bank of China
China Construction Bank
Agricultural Bank of China
Bank of China
Hongkong and Shanghai Banking Corporation
Bank of Communications
China Merchants Bank
Shanghai Pudong Development Bank
China CITIC Bank
China Minsheng Banking Corporation
Industrial Bank
BOC Hong Kong Holdings
China Everbright Bank
Bank of Taiwan
Hua Xia Bank
Hang Seng Bank
Guangdong Development Bank
Standard Chartered Bank (Hong Kong)
Taiwan Cooperative Bank
Shenzhen Development Bank
Mega International Commercial Bank
Land Bank of Taiwan
Bank of Beijing
Bank of Shanghai
Bank of East Asia
First Commercial Bank
Chinatrust Commercial Bank
Hua Nan Commercial Bank
Chang Hwa Commercial Bank
Cathay United Bank
Taipei Fubon Commercial Bank
Taiwan Business Bank
Bank of Jiangsu
Shanghai Commercial and Savings Bank
Bank SinoPac
Beijing Rural Commercial Bank
Taishin International Bank
Shanghai Rural Commercial Bank
Industrial and Commercial Bank of China (Asia)
E. Sun Commercial Bank
HSBC Bank (China)
Ping An Bank
Huishang Bank
Wing Hang Bank
Bank of East Asia (China)
Nanyang Commercial Bank
CITIC Ka Wah Bank
Evergrowing Bank
Bank of Ningbo
Bank of Tianjin
Country ROEROANet Profit
($m)Assets($m)
China
China
China
China
Hong Kong
China
China
China
China
China
China
Hong Kong
China
Taiwan
China
Hong Kong
China
Hong Kong
Taiwan
China
Taiwan
Taiwan
China
China
Hong Kong
Taiwan
Taiwan
Taiwan
Taiwan
Taiwan
Taiwan
Taiwan
China
Taiwan
Taiwan
China
Taiwan
China
Hong Kong
Taiwan
China
China
China
Hong Kong
China
Hong Kong
Hong Kong
China
China
China
1,427,610
1,105,471
1,026,300
1,017,130
549,652
392,554
229,976
191,588
173,844
153,651
149,372
148,012
124,636
108,397
107,049
98,332
79,890
77,238
75,609
69,417
61,844
61,732
61,016
53,805
53,574
53,247
50,990
50,605
42,127
41,204
37,037
35,050
33,701
32,053
31,603
26,728
25,874
25,360
25,102
24,811
22,520
21,351
19,212
17,340
17,270
15,800
15,715
15,710
15,109
15,028
16,274
13,555
7,528
9,641
7,093
4,168
3,065
1,831
1,954
1,146
1,666
388
1,070
246
449
1,819
407
742
223
90
103
183
793
450
13
270
380
301
146
140
182
3
325
226
-83
50
-118
108
125
24
263
239
184
150
149
131
17
66
195
104
1.2%
1.3%
0.8%
1.0%
1.3%
1.2%
1.5%
1.2%
1.2%
0.8%
1.2%
0.3%
0.9%
0.2%
0.5%
1.9%
0.6%
1.1%
0.3%
0.1%
0.2%
0.3%
n.a.
0.9%
0.0%
0.5%
0.8%
0.6%
0.4%
0.3%
0.5%
0.0%
1.1%
0.7%
-0.3%
0.2%
-0.4%
0.4%
0.5%
0.1%
1.2%
1.1%
1.1%
0.8%
0.9%
0.8%
0.1%
0.6%
1.5%
0.8%
19.2%
20.3%
n.a.
14.0%
24.1%
20.2%
27.9%
35.9%
14.8%
14.8%
25.9%
3.3%
25.3%
3.5%
16.8%
27.8%
15.8%
18.0%
7.0%
4.2%
2.4%
6.1%
n.a.
18.3%
0.3%
10.0%
11.4%
12.1%
6.9%
5.6%
7.8%
0.2%
20.4%
8.5%
-4.6%
4.9%
-9.1%
6.5%
6.6%
1.7%
16.1%
21.9%
15.8%
10.9%
10.7%
6.5%
1.3%
25.0%
16.0%
13.4%
CAR(Total)
13.0%
12.2%
9.4%
13.4%
13.4%
13.5%
11.3%
9.1%
14.3%
9.2%
11.3%
16.2%
9.1%
11.6%
11.4%
12.5%
11.6%
n.a.
10.6%
8.6%
11.2%
10.8%
19.7%
11.3%
13.8%
10.9%
16.2%
10.2%
10.6%
11.2%
11.2%
9.7%
10.5%
14.0%
11.0%
8.3%
10.0%
11.8%
13.6%
10.6%
n.a.
10.7%
15.8%
15.4%
n.a.
17.1%
14.7%
7.0%
n.a.
11.5%
GrossNPL Ratio
2.0%
2.2%
4.3%
2.7%
1.0%
1.9%
1.1%
1.2%
1.4%
1.2%
0.8%
0.5%
2.0%
0.9%
1.8%
1.0%
2.9%
n.a.
n.a.
0.7%
1.0%
0.8%
1.6%
2.3%
n.a.
1.5%
1.5%
1.7%
1.7%
0.7%
0.8%
1.9%
1.8%
0.6%
1.2%
6.9%
1.3%
1.9%
0.7%
0.9%
0.6%
0.5%
1.2%
0.7%
n.a.
0.6%
1.9%
n.a.
0.9%
2.6%
The Largest Banks in Greater China
ABJ ISS-92(PG48-96).indd 48ABJ ISS-92(PG48-96).indd 48 8/28/09 1:10:00 AM8/28/09 1:10:00 AM

49 ISSUE 92 The Asian Banker
Sibos 2009HongKong14-18 September
The global financial forumthat influences yourbusiness success
Sibos is the global event where you make essentialbusiness connections.
Once a year, it brings together the financial industry tocreate opportunities for individuals, organisations andthe community as a whole. It is a unique forum fornetworking, doing business and keeping in touch withwhat is going on in the industry.
Facilitated and organised by SWIFT for financialinstitutions, corporates, application and middlewarevendors and public institutions, it creates the stimulusfor learning, for collaborating, for developing newbusiness, for defining future strategies and for takingcollective action that can shape the future of our industry.
Find out more at www.sibos2009.com
ABJ ISS-92(PG48-96).indd 49ABJ ISS-92(PG48-96).indd 49 8/28/09 1:10:09 AM8/28/09 1:10:09 AM

50 ISSUE 92The Asian Banker
THE ASIAN BANKER
Commercial BankRank
1
2
3
4
5
6
7
8
9
10
11
12
13
14
15
16
17
18
19
20
21
22
23
24
25
26
27
28
29
30
31
32
33
34
35
36
37
38
39
40
41
42
43
44
45
46
47
48
49
50
AB300Rank2009
17
24
31
32
46
55
76
77
83
89
90
93
96
108
109
113
117
122
127
129
133
134
141
147
150
153
157
162
164
167
168
171
177
183
185
188
193
194
195
198
204
206
207
213
217
220
222
226
233
234
State Bank of India
DBS Group
United Overseas Bank
Oversea-Chinese Banking Corporation
ICICI Bank
Maybank
Bumiputra-Commerce Holdings
Public Bank
Punjab National Bank
Bangkok Bank
Bank of Baroda
Bank of India
Canara Bank
Krung Thai Bank
HDFC Bank
Kasikornbank
Siam Commercial Bank
Citibank (Singapore)
Union Bank of India
Bank Mandiri
AXIS Bank
RHB Capital
Syndicate Bank
AMMB Holdings
Central Bank of India
Indian Overseas Bank
Hong Leong Financial Group
Oriental Bank of Commerce
UCO Bank
Bank Rakyat Indonesia
Bank Central Asia
Bank of Ayudhya
Allahabad Bank
Vietnam Bank for Agriculture and Rural Development
Bank Negara Indonesia
Corporation Bank
Citibank (India)
TMB Bank
Banco de Oro Unibank
Metropolitan Bank and Trust
HSBC (India)
HSBC Bank(Malaysia)
Standard Chartered Bank (India)
Indian Bank
Bank for Investment and Development of Vietnam
Bank of The Philippine Islands
OCBC Bank (Malaysia)
Citibank (Malaysia)
Standard Chartered Bank (Malaysia)
EON Capital
Country ROEROANet Profit
($m)Assets($m)
India
Singapore
Singapore
Singapore
India
Malaysia
Malaysia
Malaysia
India
Thailand
India
India
India
Thailand
India
Thailand
Thailand
Singapore
India
Indonesia
India
Malaysia
India
Malaysia
India
India
Malaysia
India
India
Indonesia
Indonesia
Thailand
India
Vietnam
Indonesia
India
India
Thailand
Philippines
Philippines
India
Malaysia
India
India
Vietnam
Philippines
Malaysia
Malaysia
Malaysia
Malaysia
269,286
178,375
127,113
126,032
99,616
77,685
59,681
56,629
52,335
48,043
47,944
46,715
45,431
38,122
37,850
37,353
35,574
33,767
33,222
32,734
30,481
30,177
26,882
25,951
25,613
24,987
24,134
23,234
23,045
22,473
22,426
21,362
20,190
18,934
18,424
17,933
17,262
17,250
16,890
16,106
15,592
15,247
15,157
14,507
14,273
14,038
13,820
13,319
12,718
12,535
2,306
1,472
1,337
1,251
697
867
581
757
646
582
494
636
401
352
465
439
610
475
356
485
374
303
188
254
112
274
239
187
115
544
527
140
163
266
112
186
372
15
47
97
246
260
352
217
105
138
173
223
207
39
1.0%
0.8%
1.1%
1.0%
0.7%
1.2%
1.0%
1.4%
1.4%
1.2%
1.2%
1.5%
1.0%
1.0%
1.4%
1.4%
1.8%
1.4%
1.2%
1.7%
1.4%
1.0%
0.8%
1.0%
0.5%
1.2%
1.0%
0.9%
0.6%
2.7%
2.6%
0.7%
0.9%
1.6%
0.7%
1.2%
2.4%
0.1%
0.3%
0.6%
1.8%
1.7%
2.6%
1.7%
0.8%
1.0%
1.3%
1.7%
1.6%
0.3%
16.3%
9.9%
12.3%
11.3%
7.2%
14.9%
11.8%
26.1%
22.0%
11.9%
19.6%
25.3%
16.6%
12.3%
17.1%
14.4%
17.9%
24.6%
21.5%
18.0%
19.1%
14.1%
n.a.
11.6%
11.1%
22.1%
14.0%
13.7%
16.2%
29.3%
26.9%
6.0%
14.1%
68.4%
7.9%
19.5%
23.3%
1.2%
4.0%
7.2%
17.0%
28.6%
24.1%
23.6%
19.0%
10.0%
21.5%
25.8%
38.5%
4.3%
CAR(Total)
n.a.
14.0%
15.3%
15.2%
14.7%
14.5%
n.a.
13.7%
14.3%
13.8%
12.9%
13.1%
n.a.
13.1%
15.8%
15.1%
15.2%
13.2%
13.3%
15.7%
13.7%
n.a.
11.4%
n.a.
n.a.
13.2%
n.a.
13.0%
n.a.
13.2%
15.8%
14.9%
n.a.
7.2%
13.5%
13.8%
12.0%
13.9%
13.5%
13.4%
10.6%
13.4%
10.6%
13.2%
6.6%
14.2%
11.6%
13.7%
13.8%
12.6%
GrossNPL Ratio
n.a.
1.5%
2.0%
1.7%
3.6%
3.8%
4.9%
1.0%
1.7%
4.7%
n.a.
1.7%
n.a.
8.2%
2.0%
3.7%
5.5%
0.8%
2.0%
4.9%
1.1%
4.5%
n.a.
4.1%
n.a.
2.5%
2.3%
1.5%
n.a.
n.a.
0.6%
10.0%
n.a.
n.a.
4.9%
1.1%
2.1%
16.5%
5.5%
4.5%
2.3%
1.6%
2.2%
1.2%
2.6%
3.9%
3.4%
3.1%
2.6%
4.8%
The Largest Banks in South and Southeast Asia
ABJ ISS-92(PG48-96).indd 50ABJ ISS-92(PG48-96).indd 50 8/28/09 1:10:09 AM8/28/09 1:10:09 AM

51 ISSUE 92 The Asian Banker
Performance Rankings
Largest Profi tNet
ProfitChange
Commercial BankRank
1
2
3
4
5
6
7
8
9
10
11
12
13
14
15
16
17
18
19
20
21
22
23
24
25
26
27
28
29
30
31
32
33
34
35
36
37
38
39
40
41
42
43
44
45
46
47
48
49
50
Industrial and Commercial Bank of China
China Construction Bank
Bank of China
Agricultural Bank of China
Hongkong and Shanghai Banking Corporation
Bank of Communications
Commonwealth Bank of Australia
China Merchants Bank
Westpac Banking Corporation
State Bank of India
Australia and New Zealand Banking Group
China CITIC Bank
National Australia Bank
Shanghai Pudong Development Bank
Hang Seng Bank
Industrial Bank
Orix Corporation
Shinhan Financial Group
DBS Group
United Overseas Bank
Oversea-Chinese Banking Corporation
Kookmin Bank
China Minsheng Banking Corporation
China Everbright Bank
Resona Holdings
Maybank
St George Bank
Bank of Beijing
Public Bank
Standard Chartered Bank (Hong Kong)
ICICI Bank
ANZ National Bank
Punjab National Bank
Bank of India
Korea Exchange Bank
Macquarie Group
Siam Commercial Bank
Industrial Bank of Korea
Bangkok Bank
Bumiputra-Commerce Holdings
Ashikaga Bank
Bank Rakyat Indonesia
Bank Central Asia
Bank of Baroda
Bank Mandiri
Citibank (Singapore)
Woori Financial Group
HDFC Bank
Bank of New Zealand
Bank of Shanghai
AB300Rank2009
35.2%
34.0%
6.2%
17.5%
-15.8%
39.6%
7.2%
37.5%
11.8%
21.3%
-20.9%
60.5%
-47.4%
127.6%
-24.2%
32.6%
-20.6%
-18.2%
-12.9%
-9.8%
-16.0%
-46.1%
23.6%
45.2%
-68.1%
-7.7%
0.9%
n.a.
19.1%
-22.0%
8.5%
6.5%
47.0%
57.0%
-18.6%
-50.3%
21.8%
-35.1%
5.1%
-30.9%
-36.3%
23.2%
28.7%
53.7%
22.3%
35.3%
-73.3%
41.4%
14.9%
4.9%
16,274
13,555
9,641
7,528
7,093
4,168
3,341
3,065
2,674
2,306
2,273
1,954
1,928
1,831
1,819
1,666
1,662
1,608
1,472
1,337
1,251
1,158
1,146
1,070
980
867
814
793
757
742
697
673
646
636
621
621
610
607
582
581
547
544
527
494
485
475
467
465
454
450
3
5
7
6
9
12
13
20
15
17
14
25
10
23
48
28
47
22
24
31
32
21
27
34
11
55
44
74
77
56
46
60
83
93
50
43
117
38
89
76
92
167
168
90
129
122
19
109
114
78
Country
China
China
China
China
Hong Kong
China
Australia
China
Australia
India
Australia
China
Australia
China
Hong Kong
China
Japan
S.Korea
Singapore
Singapore
Singapore
S.Korea
China
China
Japan
Malaysia
Australia
China
Malaysia
Hong Kong
India
New Zealand
India
India
S.Korea
Australia
Thailand
S.Korea
Thailand
Malaysia
Japan
Indonesia
Indonesia
India
Indonesia
Singapore
S.Korea
India
New Zealand
China
NetProfit($m)
Largest Gain in Profi tNet
ProfitChange
Commercial BankRank
1
2
3
4
5
6
7
8
9
10
11
12
13
14
15
16
17
18
19
20
21
22
23
24
25
26
27
28
29
30
31
32
33
34
35
36
37
38
39
40
41
42
43
44
45
46
47
48
49
50
Industrial and Commercial Bank of China
China Construction Bank
Bank of Communications
Agricultural Bank of China
Shanghai Pudong Development Bank
China Merchants Bank
China CITIC Bank
Bank of China
Industrial Bank
State Bank of India
China Everbright Bank
Westpac Banking Corporation
Bank of India
Commonwealth Bank of Australia
China Minsheng Banking Corporation
Punjab National Bank
Bank of Jiangsu
Vietnam Bank for Agriculture and Rural Development
Citibank (India)
Bank of Baroda
Krung Thai Bank
HSBC Bank (China)
AXIS Bank
Hua Xia Bank
HDFC Bank
Citibank (Hong Kong)
Citibank (Singapore)
Public Bank
Bank Kerjasama Rakyat Malaysia
Bank Central Asia
Oriental Bank of Commerce
Bank of Fukuoka
Siam Commercial Bank
Bank of East Asia (China)
Bank Rakyat Indonesia
Bank Mandiri
Deutsche Bank (Australia)
Taipei Fubon Commercial Bank
Bank of Nanjing
Alliance Financial Group
HSBC (India)
Standard Chartered Bank (India)
Union Bank of India
Habib Bank
Dongguan City Commercial Bank
RHB Capital
Chinese Mercantile Bank
Bank of Hangzhou
Kiyo Holdings
Bank of New Zealand
AB300Rank2009
35.2%
34.0%
39.6%
17.5%
127.6%
37.5%
60.5%
6.2%
32.6%
21.3%
45.2%
11.8%
57.0%
7.2%
23.6%
47.0%
165.2%
307.9%
100.5%
53.7%
91.5%
152.0%
71.2%
46.1%
41.4%
46.6%
35.3%
19.1%
61.5%
28.7%
156.3%
54.9%
21.8%
245.2%
23.2%
22.3%
1601.3%
79.5%
60.1%
253.9%
41.0%
25.1%
24.5%
54.8%
132.9%
27.7%
58.3%
50.7%
73.4%
14.9%
4,239
3,438
1,183
1,122
1,027
836
736
564
410
405
333
283
231
225
219
207
203
201
187
173
168
159
156
142
136
132
124
122
121
118
114
113
109
106
102
88
87
80
80
79
72
71
70
70
66
66
66
63
63
59
3
5
12
6
23
20
25
7
28
17
34
15
93
13
27
83
123
183
193
90
108
165
133
41
109
211
122
77
241
168
162
49
117
191
167
129
189
115
224
294
204
207
127
266
271
134
270
212
107
114
Country
China
China
China
China
China
China
China
China
China
India
China
Australia
India
Australia
China
India
China
Vietnam
India
India
Thailand
China
India
China
India
Hong Kong
Singapore
Malaysia
Malaysia
Indonesia
India
Japan
Thailand
China
Indonesia
Indonesia
Australia
Taiwan
China
Malaysia
India
India
India
Pakistan
China
Malaysia
China
China
Japan
New Zealand
GainProfit($m)
ABJ ISS-92(PG48-96).indd 51ABJ ISS-92(PG48-96).indd 51 8/28/09 1:10:10 AM8/28/09 1:10:10 AM

52 ISSUE 92The Asian Banker
THE ASIAN BANKER
Performance Rankings
Largest Growth in LoansLoans
ChangeCommercial BankRank
1
2
3
4
5
6
7
8
9
10
11
12
13
14
15
16
17
18
19
20
Agricultural Bank of Taiwan
Bendigo and Adelaide Bank
Korean Federation of Community Credit Cooperatives
China Bohai Bank
Trust and Custody Services Bank
HDFC Bank*
Chinese Mercantile Bank
China Zheshang Bank
Joint Stock Commercial Bank for Foreign Trade
Bank of Queensland
Bank Rakyat Indonesia
Bank of Hangzhou
Central Bank of India
Deutsche Bank (Australia)
Sony Bank
Huishang Bank
Indian Bank
AXIS Bank
Vietnam Bank for Agriculture and Rural Development
Bank Central Asia
AB300Rank2009
214.1%
188.4%
101.9%
91.5%
80.6%
56.1%
51.7%
50.7%
45.2%
43.4%
43.1%
43.0%
40.7%
38.9%
38.6%
37.2%
37.2%
37.1%
35.8%
35.8%
1,275
27,519
1,701
5,026
995
20,437
6,256
7,428
5,592
17,491
13,982
8,373
15,091
6,400
5,322
10,939
8,225
16,831
14,501
10,178
227
125
247
272
290
109
270
238
249
174
167
212
150
189
205
181
213
133
183
168
Country
Taiwan
Australia
S.Korea
China
Japan
India
China
China
Vietnam
Australia
Indonesia
China
India
Australia
Japan
China
India
India
Vietnam
Indonesia
Loans($m)
Largest Growth in DepositsDepositsChangeCommercial BankRank
1
2
3
4
5
6
7
8
9
10
11
12
13
14
15
16
17
18
19
20
China Development Financial Holding
China Bohai Bank
Bendigo and Adelaide Bank
Chinese Mercantile Bank
Bank of East Asia (China)
Bank of Queensland
eBANK
Evergrowing Bank
China Zheshang Bank
Standard Chartered Bank (Korea)
Vietnam Bank for Agriculture and Rural Development
Thanachart Bank
HDFC Bank*
Banco de Oro Unibank
AXIS Bank
Standard Chartered Bank (Thailand)
Changsha City Commercial Bank
Macquarie Group
Woori Financial Group
Bank of Ningbo
AB300Rank2009
197.8%
112.0%
95.3%
91.9%
83.3%
57.5%
57.4%
57.2%
54.9%
47.6%
45.7%
42.9%
42.7%
42.2%
41.3%
41.0%
40.8%
38.6%
38.2%
37.3%
416
7,119
16,378
2,430
9,732
13,881
8,377
9,549
10,457
25,698
13,762
7,737
28,945
13,252
24,220
3,711
5,758
15,150
127,924
11,152
253
272
125
270
191
174
276
203
238
75
183
255
109
195
133
286
292
43
19
208
Country
Taiwan
China
Australia
China
China
Australia
Japan
China
China
S.Korea
Vietnam
Thailand
India
Philippines
India
Thailand
China
Australia
S.Korea
China
Deposits($m)
Highest Return on Assets
ROACommercial BankRank
1
2
3
4
5
6
7
8
9
10
11
12
13
14
15
16
17
18
19
20
Citibank (Hong Kong)
Bank Kerjasama Rakyat Malaysia
Bank Rakyat Indonesia
Standard Chartered Bank (India)
Bank Central Asia
Citibank (India)
Habib Bank
Chinese Mercantile Bank
China Development Financial Holding
National Bank of Pakistan
Hang Seng Bank
Bank Danamon
HSBC (India)
Siam Commercial Bank
HSBC Bank(Malaysia)
Orix Corporation
BIMB Holdings
Bank of Nanjing
Citibank (Malaysia)
Indian Bank
AB300Rank2009
3.0%
2.9%
2.7%
2.6%
2.6%
2.4%
2.1%
2.1%
2.1%
2.0%
1.9%
1.9%
1.8%
1.8%
1.7%
1.7%
1.7%
1.7%
1.7%
1.7%
211
241
167
207
168
193
266
270
253
258
48
263
204
117
206
47
296
224
226
213
Country
Hong Kong
Malaysia
Indonesia
India
Indonesia
India
Pakistan
China
Taiwan
Pakistan
Hong Kong
Indonesia
India
Thailand
Malaysia
Japan
Malaysia
China
Malaysia
India
Highest Return on Equity
ROECommercial BankRank
1
2
3
4
5
6
7
8
9
10
11
12
13
14
15
16
17
18
19
20
Vietnam Bank for Agriculture and Rural Development
Biwako Bank
Citibank (Hong Kong)
Standard Chartered Bank (Malaysia)
Shanghai Pudong Development Bank
Deutsche Bank (Australia)
Korean Federation of Community Credit Cooperatives
Dongguan City Commercial Bank
Jiangnan Rural Credit Cooperatives of Wuhan
Bank of Hangzhou
Bank Rakyat Indonesia
HSBC Bank(Malaysia)
China Merchants Bank
Hang Seng Bank
Bank Central Asia
Public Bank
Industrial Bank
Citibank (Malaysia)
Bank of India
China Everbright Bank
AB300Rank2009
68.4%
59.3%
54.3%
38.5%
35.9%
34.4%
33.7%
32.3%
31.8%
29.5%
29.3%
28.6%
27.9%
27.8%
26.9%
26.1%
25.9%
25.8%
25.3%
25.3%
183
243
211
233
23
189
247
271
284
212
167
206
20
48
168
77
28
226
93
34
Country
Vietnam
Japan
Hong Kong
Malaysia
China
Australia
S.Korea
China
China
China
Indonesia
Malaysia
China
Hong Kong
Indonesia
Malaysia
China
Malaysia
India
China
* HDFC Bank in 2008 acquired Centurion Bank of Punjab * HDFC Bank in 2008 acquired Centurion Bank of Punjab
ABJ ISS-92(PG48-96).indd 52ABJ ISS-92(PG48-96).indd 52 8/28/09 1:10:13 AM8/28/09 1:10:13 AM

53 ISSUE 92 The Asian Banker
Performance Rankings
Lowest Cost to Income RatioCost-to-Income
Ratio (%)Commercial BankRank
1
2
3
4
5
6
7
8
9
10
11
12
13
14
15
16
17
18
19
20
Chinese Mercantile Bank
Bank of Beijing
Bank of Nanjing
Bank of Tianjin
Hang Seng Bank
Joint Stock Commercial Bank for Foreign Trade
Bank Kerjasama Rakyat Malaysia
Bank of Dalian
Bank of Hangzhou
Public Bank
China CITIC Bank
Bank of Communications
China Everbright Bank
Dongguan City Commercial Bank
Shanghai Commercial Bank
Industrial and Commercial Bank of China (Asia)
Industrial Bank
Corporation Bank
Industrial and Commercial Bank of China
Bank of Jiangsu
AB300 Rank2009
12.1%
23.5%
25.4%
26.3%
28.5%
28.7%
29.1%
29.4%
32.3%
32.3%
32.9%
33.6%
33.7%
34.2%
34.3%
35.3%
35.4%
35.7%
36.0%
36.0%
270
74
224
209
48
249
241
235
212
77
25
12
34
271
218
152
28
188
3
123
Country
China
China
China
China
Hong Kong
Vietnam
Malaysia
China
China
Malaysia
China
China
China
China
Hong Kong
Hong Kong
China
India
China
China
Highest Non-Interest Income toTotal Operating Income Ratio
Non-Interest Income
RatioCommercial BankRank
1
2
3
4
5
6
7
8
9
10
11
12
13
14
15
16
17
18
19
20
Trust and Custody Services Bank
Japan Trustee Services Bank
Macquarie Group
China Development Financial Holding
Daegu Bank
Orix Corporation
ICICI Bank
Sumitomo Trust and Banking
Citibank (Australia)
Chuo Mitsui Trust Holdings
Kotak Mahindra Bank
Standard Chartered Bank (Malaysia)
HSBC Bank(Malaysia)
Industrial Bank of Taiwan
Citibank (Singapore)
Citibank (Japan)
Rokinren Bank
Suncorp-Metway
Standard Chartered Bank (Taiwan)
Thanachart Bank
AB300Rank2009
92.5%
92.1%
84.8%
82.0%
79.7%
74.9%
74.1%
60.2%
56.7%
55.7%
55.0%
53.9%
52.3%
51.9%
51.3%
50.4%
50.0%
48.3%
48.2%
47.6%
290
228
43
253
173
47
46
18
225
26
287
233
206
275
122
62
88
67
215
255
Country
Japan
Japan
Australia
Taiwan
S.Korea
Japan
India
Japan
Australia
Japan
India
Malaysia
Malaysia
Taiwan
Singapore
Japan
Japan
Australia
Taiwan
Thailand
Lowest Gross NPL RatioGrossNPLRatio
Commercial BankRank
1
2
3
4
5
6
7
8
9
10
11
12
13
14
15
16
17
18
19
20
Bendigo and Adelaide Bank
Bank of Queensland
Commonwealth Bank of Australia
St George Bank
Standard Chartered Bank (China)
Wing Lung Bank
Sony Bank
Citibank (Japan)
China Bohai Bank
Chong Hing Bank
ANZ National Bank
Westpac Banking Corporation
China Zheshang Bank
Bank of New Zealand
Industrial Bank of Taiwan
Australia and New Zealand Banking Group
Ping An Bank
BOC Hong Kong Holdings
National Australia Bank
HSBC Bank (China)
AB300Rank2009
0.10%
0.10%
0.20%
0.20%
0.20%
0.20%
0.20%
0.29%
0.30%
0.30%
0.30%
0.40%
0.40%
0.40%
0.48%
0.50%
0.50%
0.50%
0.60%
0.60%
125
174
13
44
216
230
205
62
272
277
60
15
238
114
275
14
172
29
10
165
Country
Australia
Australia
Australia
Australia
China
Hong Kong
Japan
Japan
China
Hong Kong
New Zealand
Australia
China
New Zealand
Taiwan
Australia
China
Hong Kong
Australia
China
Highest Capital Adequacy RatioCapitalAdequacy
RatioCommercial BankRank
1
2
3
4
5
6
7
8
9
10
11
12
13
14
15
16
17
18
19
20
Trust and Custody Services Bank
Japan Trustee Services Bank
Bank of Nanjing
Chinese Mercantile Bank
Shinkin Central Bank
Kotak Mahindra Bank
Rokinren Bank
Bank of Beijing
Shanghai Commercial Bank
Nanyang Commercial Bank
National Bank of Pakistan
Alliance Financial Group
BOC Hong Kong Holdings
Chinatrust Commercial Bank
Huishang Bank
HDFC Bank
Bank Central Asia
Bank Mandiri
Chong Hing Bank
Bank CIMB Niaga
AB300Rank2009
48.1%
35.6%
24.1%
24.0%
22.9%
22.8%
20.3%
19.7%
19.0%
17.1%
16.9%
16.4%
16.2%
16.2%
15.8%
15.8%
15.8%
15.7%
15.6%
15.6%
290
228
224
270
16
287
88
74
218
201
258
294
29
84
181
109
168
129
277
268
Country
Japan
Japan
China
China
Japan
India
Japan
China
Hong Kong
Hong Kong
Pakistan
Malaysia
Hong Kong
Taiwan
China
India
Indonesia
Indonesia
Hong Kong
Indonesia
ABJ ISS-92(PG48-96).indd 53ABJ ISS-92(PG48-96).indd 53 8/28/09 1:10:16 AM8/28/09 1:10:16 AM

54 ISSUE 92The Asian Banker
THE ASIAN BANKER
List of Asia Pacifi c’s Strongest Banks
Australia Westpac Banking Corporation 15 9 1Bendigo and Adelaide Bank 125 32 2Commonwealth Bank of Australia 13 40 3Australia and New Zealand Banking Group 14 51 4St George Bank 44 54 5Bank of Queensland 174 90 6ING Bank (Australia) 126 100 7National Australia Bank 10 110 8Suncorp-Metway 67 114 9Citibank (Australia) 225 117 10Macquarie Group 43 176 11Bank of Western Australia 94 207 12Deutsche Bank (Australia) 189 231 13
China Bank of Nanjing 224 4 1China CITIC Bank 25 6 2China Construction Bank 5 10 3Bank of Ningbo 208 13 4China Merchants Bank 20 14 5Industrial Bank 28 20 6Huishang Bank 181 22 7Industrial and Commercial Bank of China 3 26 8Hua Xia Bank 41 27 9Bank of China 7 31 10Bank of Communications 12 33 11Bank of Tianjin 209 38 12Chinese Mercantile Bank 270 43 13China Minsheng Banking Corporation 27 46 14Shanghai Pudong Development Bank 23 47 15Bank of Shanghai 78 57 16Bank of Jiangsu 123 58 17Bank of Hangzhou 212 62 18Bank of Beijing 74 64 19HSBC Bank (China) 165 67 20Dongguan City Commercial Bank 271 78 21China Everbright Bank 34 82 22China Bohai Bank 272 85 23China Zheshang Bank 238 87 24Shanghai Rural Commercial Bank 151 89 25Changsha City Commercial Bank 292 94 26Shenzhen Development Bank 63 107 27Guangdong Development Bank 53 114 28Evergrowing Bank 203 146 29Bank of East Asia (China) 191 148 30Agricultural Bank of China 6 152 31Ping An Bank 172 158 32Standard Chartered Bank (China) 216 162 33Beijing Rural Commercial Bank 142 166 34Jiangnan Rural Credit Cooperatives of Wuhan 284 172 35Rural Credit Cooperatives Union of Shunde 259 195 36Bank of Dalian 235 204 37
Hong Kong Citibank (Hong Kong) 211 17 1Hang Seng Bank 48 30 2Hongkong and Shanghai Banking Corporation 9 39 3Shanghai Commercial Bank 218 72 4Nanyang Commercial Bank 201 87 5Industrial and Commercial Bank of China (Asia) 152 97 6Standard Chartered Bank (Hong Kong) 56 98 7BOC Hong Kong Holdings 29 123 8CITIC Ka Wah Bank 202 146 9Wing Hang Bank 190 152 10Chong Hing Bank 277 156 11Fubon Bank (Hong Kong) 281 169 12Wing Lung Bank 230 210 13Bank of East Asia 80 220 14Dah Sing Banking Group 214 223 15 India HDFC Bank 109 1 1Punjab National Bank 83 2 2Union Bank of India 127 7 3Corporation Bank 188 11 4Bank of India 93 18 5AXIS Bank 133 19 6Citibank (India) 193 28 7HSBC (India) 204 36 8State Bank of India 17 42 9Indian Bank 213 48 10Indian Overseas Bank 153 50 11Bank of Baroda 90 55 12Standard Chartered Bank (India) 207 80 13Canara Bank 96 91 14Oriental Bank of Commerce 162 100 15Dena Bank 261 105 16Punjab and Sind Bank 280 105 16ICICI Bank 46 119 18Jammu and Kashmir Bank 300 128 19UCO Bank 164 132 20Andhra Bank 248 142 21Allahabad Bank 177 160 22Kotak Mahindra Bank 287 179 23Bank of Maharashtra 239 184 24Central Bank of India 150 185 25Syndicate Bank 141 202 26United Bank of India 252 219 27
Indonesia Bank Central Asia 168 5 1Bank Mandiri 129 52 2Bank Negara Indonesia 185 94 3Bank Rakyat Indonesia 167 117 4Bank Danamon 263 123 5Bank CIMB Niaga 268 181 6
Name AB300 Rank2009
Strength Rank2009
Strength Rank
(in the country)
Name AB300 Rank2009
Strength Rank2009
Strength Rank
(in the country)
123456789
1010111112121313
123456789
1010111112121313141415151616171718181919202021212222232324242525262627272828292930303131323233333434353536363737
123456789
101011111212131314141515
123456789
101011111212131314141515161616161818191920202121222223232424252526262727
123456
ABJ ISS-92(PG48-96).indd 54ABJ ISS-92(PG48-96).indd 54 8/28/09 1:10:19 AM8/28/09 1:10:19 AM

55 ISSUE 92 The Asian Banker
List of Asia Pacifi c’s Strongest BanksName AB300
Rank2009
Strength Rank2009
Strength Rank
(in the country)
Name AB300 Rank2009
Strength Rank2009
Strength Rank
(in the country)
Japan San-In Godo Bank 103 64 1Sumitomo Trust and Banking 18 75 2Shinkumi Federation Bank 99 82 3Citibank (Japan) 62 85 4Rokinren Bank 88 99 5Yamaguchi Bank 81 103 6Shizuoka Bank 45 121 7Chugoku Bank 69 125 8Yamanashi Chuo Bank 137 128 9Shoko Chukin Bank 37 134 10Higo Bank 106 137 11Bank of Kyoto 59 139 12Kagoshima Bank 119 141 13Sumitomo Mitsui Financial Group 4 143 14Gunma Bank 68 145 15Bank of Fukuoka 49 150 16Chiba Bank 39 152 1777 Bank 71 152 17Iyo Bank 79 158 19Yamaguchi Financial Group 51 160 20Mitsubishi UFJ Financial Group 1 162 21Bank of Yokohama 30 162 21Daishi Bank 91 165 23Hachijuni Bank 66 166 24Orix Corporation 47 168 25Chuo Mitsui Trust Holdings 26 169 26Resona Holdings 11 172 27Suruga Bank 120 175 28Hiroshima Bank 64 177 29Keiyo Bank 116 178 30Mizuho Financial Group 2 180 31Bank of Nagoya 124 183 32Tajima Bank 273 185 33Shinkin Central Bank 16 187 34Norinchukin Bank 8 188 35Sony Bank 205 189 36Hyakujushi Bank 105 191 37Toho Bank 128 191 37Hokuriku Bank 73 193 39Kiyo Holdings 107 194 40Awa Bank 138 196 41Hokuhoku Financial Group 42 197 42Nishi-Nippon City Bank 57 197 42Fukuoka Financial Group 35 199 44Joyo Bank 52 199 44Bank of the Ryukyus 196 201 46Naganoken Credit Cooperative 288 203 47Hyakugo Bank 98 205 48Hokuyo Bank 61 206 49Bank of Okinawa 199 208 50Trust and Custody Services Bank 290 208 50First Bank of Toyama 251 213 52Hokkaido Bank 101 215 53Aozora Bank 65 216 54Japan Trustee Services Bank 228 216 54Bank of Saga 170 218 56
Taiko Bank 221 221 57Juroku Bank 95 225 58Shinsei Bank 36 226 59Ogaki Kyoritsu Bank 102 228 60Akita Bank 154 228 60Momiji Bank 135 232Aichi Bank 139 233 63Musashino Bank 111 235 64Tokyo Shinkin Bank 298 235 64Ashikaga Bank 92 238 66Hokkoku Bank 121 238 66Nagano Shinkin Bank 293 242 68MIE Bank 192 244 69Senshu Bank 156 245 70Bank of Iwate 144 246 71Shiga Bank 97 247 72Minato Bank 132 248 73Nagano Bank 264 249 74Nanto Bank 86 251 75Yachiyo Bank 163 252 76Yamagata Bank 176 254 77Kiyo Bank 112 255 78Kansai Urban Banking Corporation 110 256 79Sapporo Hokuyo Holdings 54 258 80Tottori Bank 274 258 80Tokyo Star Bank 180 261 82Sendai Bank 283 262 83Tomato Bank 269 263 84Tochigi Bank 146 264 85Fukui Bank 160 265 86Chukyo Bank 186 266 87Saikyo Bank 291 267 88Eighteenth Bank 149 268 89Chiba Kogyo Bank 161 268 89Shinwa Bank 169 268 89Hokuetsu Bank 158 271 92Oita Bank 136 272 93eBANK 276 273 94Higashi-Nippon Bank 179 274 95Ehime Bank 187 274 95Miyazaki Bank 175 276 97Miura Fujisawa Shinkin Bank 295 277 98Bank of Ikeda 140 278 99Kagawa Bank 223 279 100Kita-Nippon Bank 231 279 100Kumamoto Family Bank 232 279 100Tokyo Tomin Bank 145 283 103Tokushima Bank 229 284 104Biwako Bank* 243 284 104Shikoku Bank 143 286 106Aomori Bank 159 286 106Kirayaka Bank 237 286 106Shimizu Bank 210 289 109Shonai Bank 260 289 109Daisan Bank 182 291 111Ibarakiken Credit Cooperative 244 292 112Michinoku Bank 178 293 113Takinogawa Shinkin Bank 297 294 114
123456789
10101111121213131414151516161717171719192020212121212323242425252626272728282929303031313232333334343535363637373737393940404141424242424444444446464747484849495050505052525353545454545656
5757585859596060606062626363646464646666666668686969707071717272737374747575767677777878797980808080828283838484858586868787888889898989898992929393949495959595979798989999
100100100100100100103103104104104104106106106106106106109109109109111111112112113113114114
ABJ ISS-92(PG48-96).indd 55ABJ ISS-92(PG48-96).indd 55 8/28/09 1:10:20 AM8/28/09 1:10:20 AM
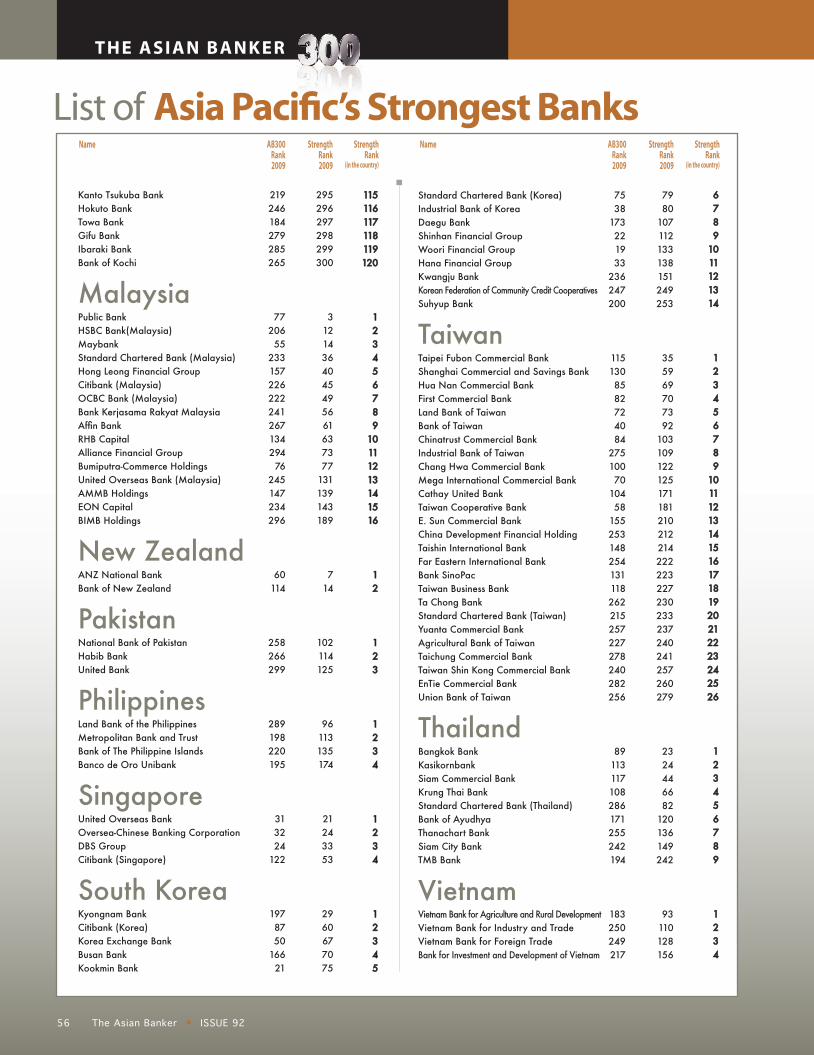
56 ISSUE 92The Asian Banker
THE ASIAN BANKER
List of Asia Pacifi c’s Strongest Banks
Kanto Tsukuba Bank 219 295 115Hokuto Bank 246 296 116Towa Bank 184 297 117Gifu Bank 279 298 118Ibaraki Bank 285 299 119Bank of Kochi 265 300 120 Malaysia Public Bank 77 3 1HSBC Bank(Malaysia) 206 12 2Maybank 55 14 3Standard Chartered Bank (Malaysia) 233 36 4Hong Leong Financial Group 157 40 5Citibank (Malaysia) 226 45 6OCBC Bank (Malaysia) 222 49 7Bank Kerjasama Rakyat Malaysia 241 56 8Affi n Bank 267 61 9RHB Capital 134 63 10Alliance Financial Group 294 73 11Bumiputra-Commerce Holdings 76 77 12United Overseas Bank (Malaysia) 245 131 13AMMB Holdings 147 139 14EON Capital 234 143 15BIMB Holdings 296 189 16
New Zealand ANZ National Bank 60 7 1Bank of New Zealand 114 14 2 Pakistan National Bank of Pakistan 258 102 1Habib Bank 266 114 2United Bank 299 125 3 Philippines Land Bank of the Philippines 289 96 1Metropolitan Bank and Trust 198 113 2Bank of The Philippine Islands 220 135 3Banco de Oro Unibank 195 174 4
Singapore United Overseas Bank 31 21 1Oversea-Chinese Banking Corporation 32 24 2DBS Group 24 33 3Citibank (Singapore) 122 53 4
South Korea Kyongnam Bank 197 29 1Citibank (Korea) 87 60 2Korea Exchange Bank 50 67 3Busan Bank 166 70 4Kookmin Bank 21 75 5
Standard Chartered Bank (Korea) 75 79 6Industrial Bank of Korea 38 80 7Daegu Bank 173 107 8Shinhan Financial Group 22 112 9Woori Financial Group 19 133 10Hana Financial Group 33 138 11Kwangju Bank 236 151 12Korean Federation of Community Credit Cooperatives 247 249 13Suhyup Bank 200 253 14 Taiwan Taipei Fubon Commercial Bank 115 35 1Shanghai Commercial and Savings Bank 130 59 2Hua Nan Commercial Bank 85 69 3First Commercial Bank 82 70 4Land Bank of Taiwan 72 73 5Bank of Taiwan 40 92 6Chinatrust Commercial Bank 84 103 7Industrial Bank of Taiwan 275 109 8Chang Hwa Commercial Bank 100 122 9Mega International Commercial Bank 70 125 10Cathay United Bank 104 171 11Taiwan Cooperative Bank 58 181 12E. Sun Commercial Bank 155 210 13China Development Financial Holding 253 212 14Taishin International Bank 148 214 15Far Eastern International Bank 254 222 16Bank SinoPac 131 223 17Taiwan Business Bank 118 227 18Ta Chong Bank 262 230 19Standard Chartered Bank (Taiwan) 215 233 20Yuanta Commercial Bank 257 237 21Agricultural Bank of Taiwan 227 240 22Taichung Commercial Bank 278 241 23Taiwan Shin Kong Commercial Bank 240 257 24EnTie Commercial Bank 282 260 25Union Bank of Taiwan 256 279 26
Thailand Bangkok Bank 89 23 1Kasikornbank 113 24 2Siam Commercial Bank 117 44 3Krung Thai Bank 108 66 4Standard Chartered Bank (Thailand) 286 82 5Bank of Ayudhya 171 120 6Thanachart Bank 255 136 7Siam City Bank 242 149 8TMB Bank 194 242 9 Vietnam Vietnam Bank for Agriculture and Rural Development 183 93 1Vietnam Bank for Industry and Trade 250 110 2Vietnam Bank for Foreign Trade 249 128 3Bank for Investment and Development of Vietnam 217 156 4
115115116116117117118118119119120120
123456789
1010111112121313141415151616
12
123
1234
1234
12345
6789
10101111121213131414
123456789
10101111121213131414151516161717181819192020212122222323242425252626
123456789
1234
Name AB300 Rank2009
Strength Rank2009
Strength Rank
(in the country)
Name AB300 Rank2009
Strength Rank2009
Strength Rank
(in the country)
ABJ ISS-92(PG48-96).indd 56ABJ ISS-92(PG48-96).indd 56 8/28/09 1:10:20 AM8/28/09 1:10:20 AM
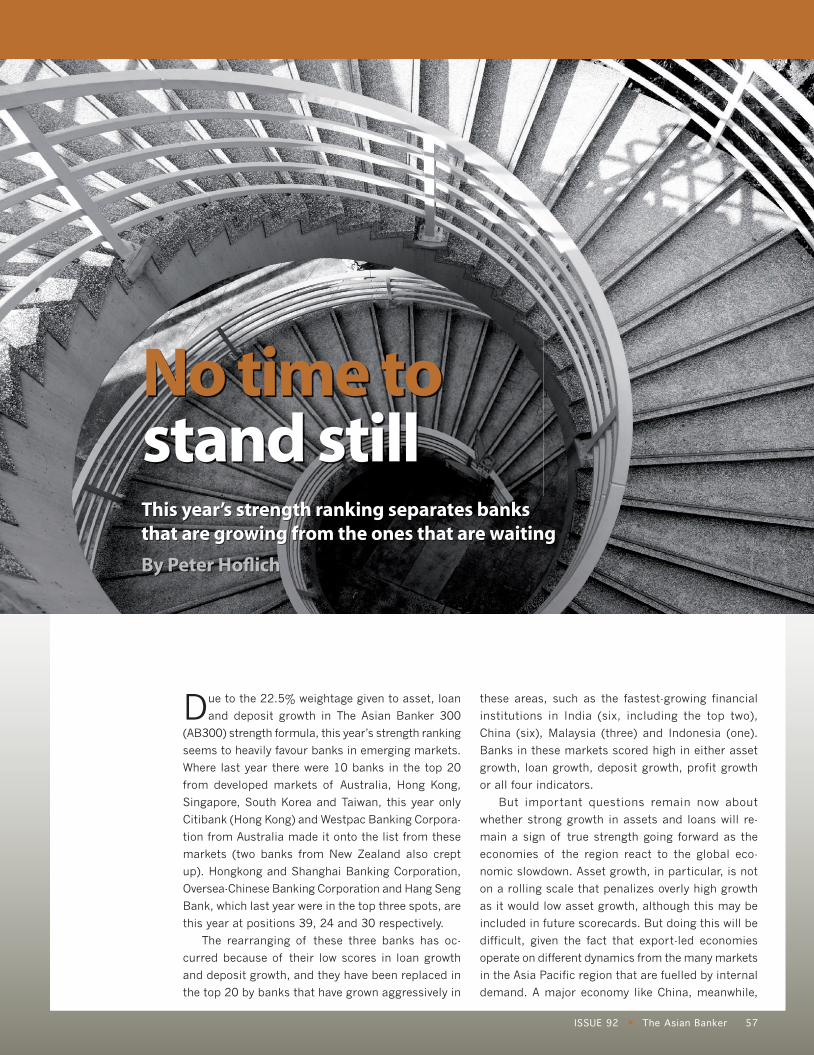
57 ISSUE 92 The Asian Banker
Due to the 22.5% weightage given to asset, loan
and deposit growth in The Asian Banker 300
(AB300) strength formula, this year’s strength ranking
seems to heavily favour banks in emerging markets.
Where last year there were 10 banks in the top 20
from developed markets of Australia, Hong Kong,
Singapore, South Korea and Taiwan, this year only
Citibank (Hong Kong) and Westpac Banking Corpora-
tion from Australia made it onto the list from these
markets (two banks from New Zealand also crept
up). Hongkong and Shanghai Banking Corporation,
Oversea-Chinese Banking Corporation and Hang Seng
Bank, which last year were in the top three spots, are
this year at positions 39, 24 and 30 respectively.
The rearranging of these three banks has oc-
curred because of their low scores in loan growth
and deposit growth, and they have been replaced in
the top 20 by banks that have grown aggressively in
these areas, such as the fastest-growing financial
institutions in India (six, including the top two),
China (six), Malaysia (three) and Indonesia (one).
Banks in these markets scored high in either asset
growth, loan growth, deposit growth, profit growth
or all four indicators.
But important questions remain now about
whether strong growth in assets and loans will re-
main a sign of true strength going forward as the
economies of the region react to the global eco-
nomic slowdown. Asset growth, in particular, is not
on a rolling scale that penalizes overly high growth
as it would low asset growth, although this may be
included in future scorecards. But doing this will be
difficult, given the fact that export-led economies
operate on different dynamics from the many markets
in the Asia Pacific region that are fuelled by internal
demand. A major economy like China, meanwhile,
No time to stand stillThis year’s strength ranking separates banks that are growing from the ones that are waiting
By Peter Hofl ich
ABJ ISS-92(PG48-96).indd 57ABJ ISS-92(PG48-96).indd 57 8/28/09 1:10:23 AM8/28/09 1:10:23 AM

THE ASIAN BANKER
58 ISSUE 92The Asian Banker
Notes: 5 = Highest, 0 = Lowest We have changed the ranking formula to include liquidity indicators.* Risk Index = [E(ROA) + Equity / Assets] / Std. Dev. (ROA).
E(ROA) is the expected return on assets, calculated as the average ROA in the past 5 financial years. Std. Dev (ROA) is the standard deviation of ROA which measures the variability of profitability.
The Risk Index measures how much a bank's earnings can decline until book value becomes negative. Expressed in units of standard deviation of ROA. The Risk Index gauges banks' ability to absorb accounting losses.
Parameters for comparison - Scoring #
5.0Weight 4.04.5 2.02.5 1.01.5 0.00.53.03.5
Measurement range
Assets
YoY Growth in Loans
YoY Growth in Deposits
Risk Index
Capital Adequacy Ratio (CAR)
YoY Growth in Operating Profits
Return on Assets Ratio (ROA)
Cost-to-Income Ratio (CIR)
Non-interest Income / Total Operating Income
Loan Loss Reserve / Gross Non-performing Loans
Non-performing Loan Ratio (NPL)
Liquid Asset / Total Asset
Scale
Liquidity
Balancesheetgrowth
Risk profile
Profitability
Assetquality
> US$100 Bn
No. 1-25
No. 1-25
> 80
> 18%
> 50% & L-P
> 1.6%
< 35%
45-55%
> 100%
< 0.5%
> 24%
US$50-100 Bn
No. 26-50
No. 26-50
60 - 80
16 - 18%
40 - 50%
1.4- 1.6%
35 - 40%
40 - 45% or55 - 60%
90 -100%
0.5 - 1.0%
11.2 - 24%
US$35-50 Bn
No. 51-75
No. 51-75
45 - 60
14 - 16%
35 - 40%
1.2 - 1.4%
40 - 45%
35 - 40% or60 - 65%
80 - 90%
1.0 - 1.5%
6.1 - 11.2%
US$30-35 Bn
No. 76-100
No. 76-100
35 - 45
12 - 14%
30 - 35%
1.1 - 1.2%
45 - 50%
30 - 35% or65 - 70%
70 - 80%
1.5 - 2.5%
3.4 - 6.1%
US$25-30 Bn
No. 101-125
No. 101-125
30 - 35
11 - 12%
25 - 30%
1.0 - 1.1%
50 - 55%
25 - 30% or70 - 75%
60 - 70%
2.5 - 3.5%
1.8 - 3.4%
US$20-25 Bn
No. 126-150
No. 126-150
25 - 30
10 - 11%
20 - 25%
0.9 - 1.0%
55 - 60%
20 - 25% or75 - 80%
50 - 60%
3.5 - 5.0%
0.8 - 1.8%
US$15-20 Bn
No. 151-175
No. 151-175
20 - 25
9 - 10%
15 - 20%
0.7 - 0.9%
60 - 65%
15 - 20% or80 - 85%
40 - 50%
5.0 - 7.5%
0.3 - 0.8%
US$10-15 Bn
No. 176-200
No. 176-200
15 - 20
8 - 9%
10 - 15%
0.5 - 0.7%
65 - 70%
10 - 15% or85 - 90%
30 - 40%
7.5 - 10%
0.1 - 0.3%
US$5-10 Bn
No. 201-225
No. 201-225
10 - 15
6 - 8%
5 - 10%
0.3 - 0.5%
70 - 75%
5 - 10% or90 - 95%
20 - 30%
10 - 12.5%
0.05 - 0.1%
< US$5 Bn
No. 226-250
No. 226-250
5 - 10
0 - 6%
0 - 5%
0 - 0.3%
75 - 80%
0 - 5% or95 - 100%
10 - 20%
12.5 - 15%
0 - 0.%
n.a.
No. 251-300
No. 251-300
< 5
< 0%
< 0% &P-L & L-L
< 0%
> 80%
< 0%
< 10%
> 15%
n.a.
12.5%
5.0%
5.0%
15.0%
10.0%
7.5%
7.5%
10.0%
7.5%
7.5%
7.5%
5.0%
Asia Pacifi c’s Strongest Banks Scorecard
Source: Asian Banker Research
operates on dynamics that are increasingly difficult
to comprehend—or believe.
Comparisons between last year’s AB300
strength ranking and this year’s are somewhat
relative, given one key change in the formula: the
addition of the proportion of liquid assets to total
assets with a 5% weightage (although this factor
has not impacted the scores of last year’s top
banks, as they all earned high marks for liquid-
ity). To balance this new category, we dropped our
weighing of asset growth to 12.5%, from 15%, so
as to give less of a penalty to small banks, and the
proportion of non-interest income to total operation
income to 7.5%, from 10%.
The value of liquidityGiven the emphasis that liquidity has played in the way
markets view banks, it would be impossible to keep it
out of the strength ranking, and we have decided to
introduce an evaluation of banks’ percentage of liquid
assets to total assets into the scorecard this year.
But liquidity ratio is also a double-edged sword;
high liquidity may give clients and investors reas-
surance that a bank is watertight, but investors are
now beginning to wonder when banks will begin
to deploy capital more efficiently (or strategically)
instead of using it as a buffer against potential
troubles. The banks in Singapore, Thailand, India,
Vietnam and Hong Kong, which lead the region in
ABJ ISS-92(PG48-96).indd 58ABJ ISS-92(PG48-96).indd 58 8/28/09 1:10:28 AM8/28/09 1:10:28 AM

59 ISSUE 92 The Asian Banker
the level of liquid assets to total assets, will see
their profitability affected as long as they continue
to sit on expensive capital cushions.
The point about deploying tightly-held capital
was made at the 1H results briefing of Singapore’s
DBS Holdings, which raised $2.7 billion in a rights
issue in January; it was a question that the bank’s
chairman Koh Boon Hwee could not answer. The
four Singapore’s banks in the AB300 have shown the
highest average liquidity ratio, at 17.5% (it is much
higher for local banks, which range from 18.3% to
26.7%). Other markets that have average bank liquid-
ity ratios in the double digits are Thailand (14.1%),
India (10.7%) and Vietnam (10.5%).
The tendency for Asian banks to be thrifty has
been shown not just by the recent slowdown in some
of their lending in but also in the near total lack of
acquisitions by banks around the region, especially
since capital-raising exercises began. Even by the
end of the first half of 2009, the only Asia Pacific
bank to make an acquisition of any real size has been
ANZ Group, which bought 54 of RBS’ branches in six
markets for $550 million, a move it has been waiting
many years to make. But given the general behaviour
of banks around the region, we expect capital and
liquidity to remain important priorities for banks and
may even see the liquidity ratio of Asia’s banks grow
by the end of the year.
Similarly, banks around Asia have kept very high
capital. And while the country in the region with banks
holding the highest total CAR is Indonesia, where the
average is 14.6%, it is closely followed by familiar
face Singapore, at 14.4%. Other markets where the
banks hold very high capital averages are Hong Kong
(14.3%), the Philippines (13.9%), and Malaysia and
Thailand (both with 13.3%).
Country to countryWith emerging market banks that still have strong loan
and deposit growth forming the top of the ranking,
the more developed markets are filling out more of
the bottom rankings. Given their low growth in any of
the asset, loan, deposit or profit growth categories, it
is no surprise that Japanese banks fill out the bottom
of the strength ranking—76 banks in the bottom 100
are from Japan—as they do with other indicators such
as cost to income ratio, non-interest income to total
income, ROA and ROE. Taiwanese banks are also par-
ticularly weak, with 14 of the 26 banks in the AB300
sitting in the bottom 100 for strength ranking.
Profits for banks all around the region will also
be highly affected by the expected rise of fresh NPLs
resulting from trade contractions at Asia’s many ex-
port-driven economies, or from the impact a fall in
commodities prices will have on the region’s natural
resources producers. Bad loans are expected to crop
up in China, where banks in a single quarter in 2009
have given out nearly as many loans as they have in all
of 2008. But NPLs have yet to rear their ugly heads
in this ranking, with only five banks reporting bad
loan ratios in the double digits (one each in Japan,
Malaysia, Pakistan, Thailand and Vietnam). When
they do, they will come from a low base and are not
expected to impact core capital significantly.
It is mostly the banks of Australia and Hong Kong
that are at the top end of the NPL growth chart, with
sharp rises in Korea as well, although it is clear that
the numbers are creeping up steadily around the
region as a whole—the banks at the 20th position in
the NPL chart this year have levels of 0.6%, while one
year ago they showed half of that figure.
Not as bad as 1997Chatter coming from the West has compared the cur-
rent situation to the Great Depression of the 1930s,
with battle-hardened CEOs crying that they’ve never
seen things as bad as this. With memories of the
Asian Financial Crisis fresh in Asian bankers’ minds,
it is clear that 2009 has not been as bad as either
1997 or 1930. There are even indications that some
Japanese banks may become profitable in 2010. But
with the country’s population aging, reforms stalling,
and the banks groaning under some of the highest
cost-to-income ratios in the region, it is unlikely that
they will ever regain their former highs.
Things also look tough for China’s banks, which
have experienced the price competition and margin
compression that comes with aggressive loan growth;
next up one could expect a hit to profitability as
well when lending inevitably slows (not to mention
the inevitable surge in NPLs). Given these special
circumstances, China’s banks may also never be as
profitable again as they have been this year. And so,
if Asia has two tarnished giants in 2010, whose turn
will it be to shine next?
It is mostly the banks of Australia and Hong Kong that are at the top end of the NPL growth chart.
AB300 online version will expand coverage to 500 banksw w w . t h e a s i a n b a n k e r . c o m
ABJ ISS-92(PG48-96).indd 59ABJ ISS-92(PG48-96).indd 59 8/28/09 5:40:48 PM8/28/09 5:40:48 PM

60 ISSUE 92The Asian Banker
THE ASIAN BANKER
Asia Pacifi c’s Strongest Banks
*Risk Index = [E(ROA) + Equity/Assets] / Std. Dev. (ROA) • E(ROA) is the expected return on assets, calculated as the average ROA in the past fi ve fi nancial years. • Std. Dev. (ROA) is the standard deviation of ROA which measures the variability of profi tability. • The Risk Index measures how much a bank’s earnings can decline until book value becomes negative. Expressed in units of standard deviations of ROA, the Risk Index gauges banks’ ability to absorb accounting losses. • Scores are only shown to two decimal places, but rankings refl ect full information.
1
2
3
4
5
6
7
7
9
10
11
12
13
14
14
14
17
18
19
20
21
22
23
24
24
26
27
28
29
30
31
32
33
33
35
36
36
38
39
40
40
42
43
44
45
46
47
48
49
50
HDFC Bank
Punjab National Bank
Public Bank
Bank of Nanjing
Bank Central Asia
China CITIC Bank
ANZ National Bank
Union Bank of India
Westpac Banking Corporation
China Construction Bank
Corporation Bank
HSBC Bank(Malaysia)
Bank of Ningbo
China Merchants Bank
Maybank
Bank of New Zealand
Citibank (Hong Kong)*
Bank of India
AXIS Bank
Industrial Bank
United Overseas Bank
Huishang Bank
Bangkok Bank
Oversea-Chinese Banking Corporation
Kasikornbank
Industrial and Commercial Bank of China
Hua Xia Bank
Citibank (India)*
Kyongnam Bank
Hang Seng Bank
Bank of China
Bendigo and Adelaide Bank
Bank of Communications
DBS Group
Taipei Fubon Commercial Bank
HSBC (India)*
Standard Chartered Bank (Malaysia)
Bank of Tianjin*
Hongkong and Shanghai Banking Corporation
Commonwealth Bank of Australia
Hong Leong Financial Group
State Bank of India
Chinese Mercantile Bank
Siam Commercial Bank
Citibank (Malaysia)
China Minsheng Banking Corporation
Shanghai Pudong Development Bank
Indian Bank*
OCBC Bank (Malaysia)
Indian Overseas Bank
37,850
52,335
56,629
13,712
22,426
173,844
71,106
33,222
304,608
1,105,471
17,933
15,247
15,109
229,976
77,685
37,145
14,589
46,715
30,481
149,372
127,113
19,212
48,043
126,032
37,353
1,427,610
107,049
17,262
16,524
98,332
1,017,130
33,270
392,554
178,375
37,037
15,592
12,718
15,028
549,652
337,790
24,134
269,286
9,357
35,574
13,319
153,651
191,588
14,507
13,820
24,987
4.0
4.5
4.5
1.5
2.5
5.0
4.5
3.5
5.0
5.0
2.0
2.0
2.0
5.0
4.5
4.0
1.5
4.0
3.5
5.0
5.0
2.0
4.0
5.0
4.0
5.0
5.0
2.0
2.0
4.5
5.0
3.5
5.0
5.0
4.0
2.0
1.5
2.0
5.0
5.0
2.5
5.0
1.0
4.0
1.5
5.0
5.0
1.5
1.5
2.5
56.1%
30.3%
19.2%
31.0%
35.8%
15.0%
11.2%
30.0%
14.0%
15.7%
23.8%
14.3%
34.5%
30.3%
17.0%
10.2%
18.0%
26.0%
37.1%
24.7%
7.7%
37.2%
15.0%
11.9%
18.7%
12.1%
15.8%
16.8%
10.0%
6.7%
15.8%
188.4%
19.9%
16.6%
14.7%
29.4%
5.3%
17.1%
6.1%
14.5%
9.1%
24.4%
51.7%
6.5%
-3.2%
16.9%
27.1%
37.2%
13.4%
23.9%
42.7%
25.3%
16.9%
23.2%
10.8%
20.2%
10.1%
33.6%
13.6%
19.4%
28.7%
12.8%
37.3%
32.5%
14.3%
7.2%
4.7%
26.0%
41.3%
25.3%
10.5%
26.2%
3.5%
6.0%
23.5%
19.0%
10.6%
21.6%
25.4%
8.3%
16.0%
95.3%
20.4%
11.1%
18.5%
22.7%
7.4%
19.1%
4.5%
20.4%
10.6%
30.7%
91.9%
7.2%
2.5%
17.1%
23.4%
29.0%
16.6%
18.6%
India
India
Malaysia
China
Indonesia
China
New Zealand
India
Australia
China
India
Malaysia
China
China
Malaysia
New Zealand
Hong Kong
India
India
China
Singapore
China
Thailand
Singapore
Thailand
China
China
India
S.Korea
Hong Kong
China
Australia
China
Singapore
Taiwan
India
Malaysia
China
Hong Kong
Australia
Malaysia
India
China
Thailand
Malaysia
China
China
India
Malaysia
India
5.0
4.5
4.0
5.0
5.0
3.5
2.5
4.5
3.0
3.5
4.0
3.0
5.0
4.5
3.5
2.5
3.5
4.5
5.0
4.5
2.0
5.0
3.5
3.0
4.0
3.0
3.5
3.5
2.5
2.0
3.5
5.0
4.0
3.5
3.0
4.5
1.5
3.5
1.5
3.0
2.5
4.5
5.0
2.0
0.0
3.5
4.5
5.0
3.0
4.0
483.51
51.64
51.60
31.08
75.70
28.72
139.46
35.60
88.86
44.98
100.88
59.65
90.75
14.27
77.29
79.61
n.a.
15.41
n.a.
18.21
33.67
36.62
136.96
41.27
54.12
28.38
93.90
42.57
113.95
29.16
42.03
37.95
16.36
27.36
30.82
29.18
32.29
62.48
24.49
n.a.
201.33
109.13
n.a.
26.02
35.06
43.79
13.34
34.23
52.81
74.66
5.0
4.0
4.0
3.0
4.5
2.5
5.0
3.5
5.0
3.5
5.0
4.0
5.0
1.0
4.5
4.5
1.5
1.5
1.5
1.5
3.0
3.5
5.0
3.5
4.0
2.5
5.0
3.5
5.0
2.5
3.5
3.5
1.5
2.5
3.0
2.5
3.0
4.5
2.0
1.5
5.0
5.0
1.5
2.5
3.5
3.5
1.0
3.0
4.0
4.5
5.0
4.5
3.5
4.0
3.0
4.0
3.0
4.5
3.0
4.0
4.5
3.0
5.0
4.5
3.5
2.0
2.0
4.5
5.0
4.5
3.0
4.5
1.5
2.0
4.0
3.5
3.0
4.0
4.5
2.5
3.5
5.0
4.0
3.0
3.5
4.0
2.0
3.5
2.0
4.0
3.0
4.5
5.0
2.0
1.0
3.5
4.0
4.5
3.5
3.5
1.4%
1.1%
1.5%
1.1%
2.5%
0.8%
1.1%
1.1%
1.0%
1.2%
1.2%
1.6%
1.4%
1.0%
1.3%
1.3%
n.a.
0.9%
n.a.
0.8%
1.3%
0.8%
1.3%
1.2%
1.6%
0.8%
0.4%
2.0%
1.0%
2.1%
0.9%
0.7%
0.8%
0.9%
0.3%
1.5%
1.3%
0.7%
1.5%
n.a.
1.0%
0.9%
n.a.
1.9%
1.4%
0.6%
0.7%
1.4%
1.2%
1.3%
8.3%
6.2%
5.2%
12.1%
9.5%
8.1%
8.0%
5.4%
4.4%
6.2%
5.7%
6.5%
8.5%
5.1%
7.5%
5.4%
5.5%
6.1%
6.9%
4.8%
7.4%
9.1%
10.5%
8.0%
8.7%
6.2%
3.7%
10.9%
6.0%
6.0%
7.0%
6.4%
5.6%
7.9%
6.5%
10.7%
4.7%
5.4%
4.8%
5.1%
7.4%
5.7%
14.3%
10.3%
7.3%
5.1%
3.2%
7.1%
6.5%
5.9%
0.02%
0.14%
0.13%
0.42%
0.16%
0.31%
0.06%
0.18%
0.06%
0.16%
0.07%
0.14%
0.11%
0.42%
0.11%
0.08%
n.a.
0.46%
n.a.
0.31%
0.26%
0.27%
0.09%
0.22%
0.19%
0.25%
0.04%
0.30%
0.06%
0.28%
0.19%
0.19%
0.39%
0.32%
0.22%
0.42%
0.19%
0.10%
0.26%
n.a.
0.04%
0.06%
n.a.
0.47%
0.25%
0.13%
0.29%
0.25%
0.15%
0.10%
Strength Rank 2009
E(ROA)Commercial Bank Country Equity-to-Asset Ratio
Score(15%)
RiskIndex
Std. Dev. (ROA)
Score(12.5%)
$million
AssetsScore(5%)
Change
LoansScore(5%)
Change
Deposits Risk Index*
109
83
77
224
168
25
60
127
15
5
188
206
208
20
55
114
211
93
133
28
31
181
89
32
113
3
41
193
197
48
7
125
12
24
115
204
233
209
9
13
157
17
270
117
226
27
23
213
222
153
AB300 Rank 2009
1 t
o 5
0
ABJ ISS-92(PG48-96).indd 60ABJ ISS-92(PG48-96).indd 60 8/28/09 1:10:29 AM8/28/09 1:10:29 AM

61 ISSUE 92 The Asian Banker
1
2
3
4
5
6
7
7
9
10
11
12
13
14
14
14
17
18
19
20
21
22
23
24
24
26
27
28
29
30
31
32
33
33
35
36
36
38
39
40
40
42
43
44
45
46
47
48
49
50
4.0
4.0
3.5
5.0
4.0
4.0
3.0
3.5
2.5
3.5
3.5
3.5
1.5
3.0
4.0
2.5
4.0
3.5
3.5
3.0
4.0
4.0
3.5
4.0
4.0
3.5
3.0
3.5
3.0
3.5
3.5
2.5
3.5
4.0
3.0
2.5
3.5
3.0
3.5
3.0
1.5
1.5
5.0
4.0
3.5
2.0
2.0
3.5
3.0
3.5
4.5
4.5
1.0
5.0
2.5
4.0
0.0
3.0
0.0
2.0
2.5
2.0
3.5
3.5
0.5
0.5
4.5
5.0
1.5
3.0
0.0
2.0
0.5
0.0
0.5
2.5
1.0
5.0
2.5
0.0
0.0
4.5
2.0
0.0
5.0
4.5
3.0
5.0
0.0
0.0
1.5
3.0
5.0
2.5
4.0
2.0
4.5
3.0
2.0
2.0
4.5
4.0
4.5
5.0
5.0
4.0
3.0
4.0
2.5
4.0
3.5
5.0
4.5
4.5
3.5
4.0
5.0
4.5
4.5
4.0
3.0
3.0
4.0
2.5
4.0
3.5
1.0
5.0
3.0
5.0
3.0
1.0
3.5
2.0
1.5
5.0
5.0
2.0
4.0
3.0
3.0
2.5
5.0
5.0
5.0
2.0
3.5
5.0
4.0
3.5
3.0
4.0
5.0
5.0
4.0
5.0
4.0
4.0
3.5
4.5
4.5
4.0
4.0
4.5
4.0
4.5
4.5
4.5
4.0
4.5
4.5
4.5
3.5
4.0
3.0
4.5
4.0
4.5
4.0
5.0
3.5
1.5
5.0
4.0
3.5
4.0
4.5
5.0
4.5
3.5
4.0
3.0
5.0
3.5
4.0
4.0
4.5
3.5
4.5
4.0
3.5
3.0
2.5
2.0
2.5
1.5
3.5
3.0
3.5
2.0
4.0
5.0
2.0
2.0
4.0
3.5
5.0
3.5
4.5
1.5
3.5
3.0
2.5
3.5
3.5
2.0
2.5
4.0
2.0
3.5
3.0
3.0
1.5
3.0
3.0
4.5
5.0
1.0
4.0
4.5
4.0
4.5
1.5
3.5
4.0
1.5
1.0
4.0
4.0
3.5
3.5
4.0
5.0
5.0
5.0
5.0
5.0
4.0
5.0
5.0
4.0
5.0
5.0
5.0
5.0
5.0
5.0
3.5
4.5
5.0
5.0
5.0
5.0
5.0
4.0
5.0
5.0
1.5
5.0
3.0
5.0
5.0
5.0
5.0
3.5
3.5
4.5
5.0
4.0
5.0
5.0
1.5
2.5
4.0
5.0
5.0
5.0
2.5
4.0
2.0
3.5
3.5
4.0
3.5
4.5
4.0
5.0
3.5
5.0
3.5
4.0
3.5
4.5
4.0
2.5
5.0
4.5
3.5
4.0
4.5
3.5
4.0
2.5
3.5
2.5
3.5
3.5
3.5
4.5
4.0
3.0
5.0
3.5
3.5
4.5
3.5
3.0
3.0
4.0
5.0
3.5
1.5
4.5
2.0
3.0
4.0
4.0
4.0
3.0
3.0
15.8%
14.3%
13.7%
24.1%
15.8%
14.3%
11.7%
13.3%
10.8%
12.2%
13.8%
13.4%
n.a.
11.3%
14.5%
10.8%
14.3%
13.1%
13.7%
11.3%
15.3%
15.8%
13.8%
15.2%
15.1%
13.0%
11.4%
12.0%
11.8%
12.5%
13.4%
10.4%
13.5%
14.0%
11.2%
10.6%
13.8%
11.5%
13.4%
11.6%
n.a.
n.a.
24.0%
15.2%
13.7%
9.2%
9.1%
13.2%
11.6%
13.2%
44.7%
41.9%
5.8%
66.0%
21.1%
35.7%
-2.3%
26.2%
-5.6%
19.8%
20.0%
18.0%
34.3%
31.3%
4.7%
4.5%
44.3%
60.6%
10.4%
29.8%
-9.7%
18.3%
3.3%
-23.5%
3.6%
24.9%
9.5%
105.0%
24.1%
-23.2%
-0.3%
48.2%
16.9%
-12.1%
63.7%
48.6%
29.2%
78.6%
-8.6%
-4.4%
13.6%
28.0%
86.3%
21.1%
38.7%
17.5%
42.2%
28.3%
17.4%
16.8%
1.4%
1.4%
1.4%
1.7%
2.6%
1.2%
1.0%
1.2%
1.0%
1.3%
1.2%
1.7%
1.5%
1.5%
1.2%
1.3%
3.0%
1.5%
1.4%
1.2%
1.1%
1.1%
1.2%
1.0%
1.4%
1.2%
0.5%
2.4%
1.0%
1.9%
1.0%
0.4%
1.2%
0.8%
0.5%
1.8%
1.6%
0.8%
1.3%
1.0%
1.0%
1.0%
2.1%
1.8%
1.7%
0.8%
1.2%
1.7%
1.3%
1.2%
52.1%
42.0%
32.3%
25.4%
42.0%
32.9%
42.3%
41.6%
47.3%
36.3%
35.7%
41.3%
40.2%
36.6%
44.2%
40.0%
39.0%
38.3%
43.5%
35.4%
38.8%
38.7%
48.8%
44.7%
50.7%
36.0%
41.5%
36.1%
43.2%
28.5%
49.9%
65.1%
33.6%
44.6%
48.2%
42.2%
39.8%
26.3%
39.6%
47.8%
42.1%
52.7%
12.1%
47.1%
40.1%
43.4%
37.3%
45.2%
39.1%
44.2%
31.7%
28.8%
21.8%
17.7%
23.8%
10.6%
30.6%
28.4%
34.2%
16.6%
39.3%
52.3%
15.1%
15.6%
35.1%
30.7%
46.4%
31.9%
44.3%
12.0%
30.9%
26.4%
24.9%
32.3%
30.3%
15.2%
23.4%
39.4%
19.5%
31.6%
28.8%
28.9%
14.7%
28.2%
29.8%
41.7%
53.9%
7.4%
37.3%
42.3%
38.0%
42.4%
13.4%
33.2%
37.5%
13.0%
8.8%
35.8%
35.4%
34.7%
70.0%
82.4%
160.0%
175.0%
416.7%
142.9%
233.3%
80.0%
175.0%
131.8%
81.8%
150.0%
155.6%
227.3%
100.0%
125.0%
100.0%
70.6%
90.9%
237.5%
110.0%
210.7%
109.5%
111.8%
88.0%
150.0%
155.6%
38.1%
155.6%
60.0%
118.5%
200.0%
115.8%
100.0%
74.4%
73.9%
96.2%
103.8%
80.0%
250.0%
104.3%
n.a.
50.0%
83.2%
109.7%
150.0%
191.7%
50.0%
85.3%
40.0%
2.0%
1.7%
1.0%
1.6%
0.6%
1.4%
0.3%
2.0%
0.4%
2.2%
1.1%
1.6%
0.9%
1.1%
3.8%
0.4%
0.6%
1.7%
1.1%
0.8%
2.0%
1.2%
4.7%
1.7%
3.7%
2.0%
1.8%
2.1%
0.9%
1.0%
2.7%
0.1%
1.9%
1.5%
0.8%
2.3%
2.6%
2.6%
1.0%
0.2%
2.3%
n.a.
0.8%
5.5%
3.1%
1.2%
1.2%
1.2%
3.4%
2.5%
3.99
3.91
3.84
3.83
3.83
3.76
3.70
3.70
3.68
3.66
3.65
3.64
3.64
3.63
3.63
3.63
3.59
3.55
3.54
3.53
3.53
3.53
3.51
3.51
3.51
3.49
3.48
3.45
3.45
3.43
3.40
3.40
3.39
3.39
3.36
3.35
3.35
3.35
3.35
3.34
3.34
3.33
3.31
3.30
3.29
3.29
3.28
3.28
3.26
3.26
Strength Rank 2009
AggregateStrength
Score 2009Score(7.5%)
Ratio
Non-interest IncomeScore(7.5%)
Change
Operating Profit Operating CostReturn on Assets (ROA)Score(10%)
Cost toIncomeRatio
NII to Total Operating Income (%)
Capital AdequacyScore(10%)
Total Score(7.5%)
Loan Loss CoverageLoan LossReserve toGross NPLs
Score(7.5%)
Loan QualityGross
NPL RatioScore(7.5%)
1.5
1.5
3.5
4.0
3.5
2.0
3.5
4.5
4.0
2.0
1.5
4.0
2.5
4.5
1.5
3.5
5.0
1.5
4.0
2.5
4.5
3.0
4.5
4.5
4.5
2.5
2.0
1.5
2.5
5.0
3.0
3.0
2.5
5.0
2.5
1.5
4.0
1.5
5.0
3.5
3.5
1.5
1.5
4.0
4.0
2.0
1.5
1.5
2.5
2.0
n.a.
n.a.
5.8%
8.3%
4.9%
0.7%
5.5%
18.7%
9.0%
0.7%
n.a.
6.6%
1.5%
11.6%
0.3%
4.4%
65.0%
n.a.
6.4%
1.0%
18.3%
1.9%
13.5%
22.2%
17.0%
1.0%
0.7%
n.a.
0.9%
30.9%
2.4%
3.0%
0.8%
26.7%
0.8%
n.a.
8.4%
n.a.
30.9%
5.9%
5.8%
n.a.
n.a.
7.5%
6.9%
0.4%
n.a.
n.a.
1.2%
0.6%
LiquidityLiquid Assetto Total Asset
Score(5%)
ABJ ISS-92(PG48-96).indd 61ABJ ISS-92(PG48-96).indd 61 8/28/09 1:10:31 AM8/28/09 1:10:31 AM

62 ISSUE 92The Asian Banker
THE ASIAN BANKER
Asia Pacifi c’s Strongest Banks
*Risk Index = [E(ROA) + Equity/Assets] / Std. Dev. (ROA) • E(ROA) is the expected return on assets, calculated as the average ROA in the past fi ve fi nancial years. • Std. Dev. (ROA) is the standard deviation of ROA which measures the variability of profi tability. • The Risk Index measures how much a bank’s earnings can decline until book value becomes negative. Expressed in units of standard deviations of ROA, the Risk Index gauges banks’ ability to absorb accounting losses. • Scores are only shown to two decimal places, but rankings refl ect full information.
51
to
10
0
51
52
53
54
55
56
57
58
59
60
61
62
63
64
64
66
67
67
69
70
70
72
73
73
75
75
77
78
79
80
80
82
82
82
85
85
87
87
89
90
91
92
93
94
94
96
97
98
99
100
Australia and New Zealand Banking Group
Bank Mandiri
Citibank (Singapore)*
St George Bank
Bank of Baroda
Bank Kerjasama Rakyat Malaysia
Bank of Shanghai
Bank of Jiangsu
Shanghai Commercial and Savings Bank
Citibank (Korea)
Affin Bank
Bank of Hangzhou
RHB Capital
Bank of Beijing
San-In Godo Bank
Krung Thai Bank
Korea Exchange Bank
HSBC Bank (China)
Hua Nan Commercial Bank
First Commercial Bank
Busan Bank
Shanghai Commercial Bank
Land Bank of Taiwan
Alliance Financial Group*
Sumitomo Trust and Banking
Kookmin Bank
Bumiputra-Commerce Holdings
Dongguan City Commercial Bank*
Standard Chartered Bank (Korea)
Industrial Bank of Korea
Standard Chartered Bank (India)*
China Everbright Bank
Shinkumi Federation Bank*
Standard Chartered Bank (Thailand)
Citibank (Japan)*
China Bohai Bank
Nanyang Commercial Bank
China Zheshang Bank
Shanghai Rural Commercial Bank
Bank of Queensland
Canara Bank
Bank of Taiwan
Vietnam Bank for Agriculture and Rural Development*
Bank Negara Indonesia
Changsha City Commercial Bank*
Land Bank of the Philippines*
Industrial and Commercial Bank of China (Asia)
Standard Chartered Bank (Hong Kong)
Rokinren Bank*
ING Bank (Australia)
326,325
32,734
33,767
102,105
47,944
12,057
53,805
33,701
32,053
50,086
9,530
14,575
30,177
61,016
41,265
38,122
85,207
22,520
50,605
53,247
22,484
14,159
61,732
7,991
233,466
211,560
59,681
9,332
60,110
114,671
15,157
124,636
43,017
8,323
69,737
9,106
15,800
12,262
25,360
20,628
45,431
108,397
18,934
18,424
8,021
8,114
25,102
77,238
49,857
33,262
5.0
3.5
3.5
5.0
4.0
1.5
4.5
3.5
3.5
4.5
1.0
1.5
3.5
4.5
4.0
4.0
4.5
2.5
4.5
4.5
2.5
1.5
4.5
1.0
5.0
5.0
4.5
1.0
4.5
5.0
2.0
5.0
4.0
1.0
4.5
1.0
2.0
1.5
3.0
2.5
4.0
5.0
2.0
2.0
1.0
1.0
3.0
4.5
4.0
3.5
16.0%
29.6%
7.5%
8.7%
34.7%
31.4%
14.9%
27.3%
13.1%
3.4%
15.8%
43.0%
11.1%
n.a.
0.2%
9.6%
19.3%
-9.3%
6.5%
8.3%
8.6%
8.3%
7.9%
18.2%
9.5%
16.0%
22.4%
18.5%
6.8%
16.1%
10.8%
14.0%
-15.4%
14.3%
n.a.
91.5%
5.5%
50.7%
12.2%
43.4%
28.6%
3.5%
35.8%
27.8%
21.2%
12.6%
12.4%
19.0%
-46.0%
13.8%
13.9%
16.9%
4.8%
18.9%
26.6%
19.3%
20.6%
23.3%
11.5%
6.5%
7.5%
35.7%
-2.4%
n.a.
2.6%
6.3%
36.4%
28.0%
6.7%
9.9%
8.4%
10.7%
7.9%
11.7%
0.3%
14.2%
20.9%
6.8%
47.6%
8.2%
7.8%
11.9%
2.6%
41.0%
n.a.
112.0%
3.6%
54.9%
15.1%
57.5%
21.8%
21.1%
45.7%
11.6%
40.8%
7.3%
0.5%
33.0%
8.2%
-6.9%
Australia
Indonesia
Singapore
Australia
India
Malaysia
China
China
Taiwan
S.Korea
Malaysia
China
Malaysia
China
Japan
Thailand
S.Korea
China
Taiwan
Taiwan
S.Korea
Hong Kong
Taiwan
Malaysia
Japan
S.Korea
Malaysia
China
S.Korea
S.Korea
India
China
Japan
Thailand
Japan
China
Hong Kong
China
China
Australia
India
Taiwan
Vietnam
Indonesia
China
Philippines
Hong Kong
Hong Kong
Japan
Australia
3.5
4.5
2.0
2.5
5.0
5.0
3.0
4.5
3.0
1.0
3.5
5.0
2.5
1.5
0.0
2.5
4.0
0.0
2.0
2.5
2.5
2.5
2.0
4.0
2.5
3.5
4.0
4.0
2.0
3.5
2.5
3.0
0.0
3.0
1.5
5.0
1.5
5.0
3.0
5.0
4.5
1.0
5.0
4.5
4.0
3.0
3.0
4.0
0.0
3.0
29.07
13.25
n.a.
n.a.
49.48
32.70
34.56
15.24
29.78
45.80
75.78
15.84
43.72
n.a.
155.39
33.42
8.50
n.a.
83.20
69.45
52.69
31.72
57.79
11.48
30.55
15.06
28.58
11.71
32.45
21.27
20.22
19.21
142.86
15.25
n.a.
n.a.
33.41
24.71
77.98
n.a.
53.37
48.44
n.a.
12.19
47.62
97.83
37.45
25.31
574.05
172.38
2.5
1.0
1.5
1.5
4.0
3.0
3.0
1.5
2.5
4.0
4.5
1.5
3.5
1.5
5.0
3.0
0.5
1.5
5.0
4.5
4.0
3.0
4.0
1.0
3.0
1.5
2.5
1.0
3.0
2.0
2.0
1.5
5.0
1.5
1.5
1.5
3.0
2.0
4.5
1.5
4.0
4.0
1.5
1.0
4.0
5.0
3.5
2.5
5.0
5.0
3.0
3.5
2.0
3.5
4.5
4.0
4.0
4.0
3.0
2.0
2.5
5.0
0.0
1.5
1.5
2.0
5.0
4.5
2.0
2.5
2.5
3.0
2.5
3.0
0.0
3.5
4.0
2.0
5.0
2.5
2.5
3.0
1.5
5.0
1.5
5.0
1.5
5.0
3.5
5.0
4.0
4.0
5.0
3.0
5.0
2.0
0.0
4.5
2.5
0.0
1.0%
1.3%
n.a.
n.a.
0.9%
2.3%
0.8%
0.6%
1.1%
0.8%
0.8%
1.1%
0.7%
n.a.
0.3%
1.0%
1.5%
n.a.
0.6%
0.7%
1.0%
1.8%
0.3%
0.6%
0.4%
0.9%
1.1%
0.7%
0.3%
0.8%
2.5%
0.6%
0.1%
1.4%
n.a.
n.a.
1.5%
0.7%
0.3%
n.a.
1.1%
0.4%
n.a.
1.2%
0.6%
1.1%
0.8%
1.4%
0.2%
0.4%
5.5%
8.5%
6.4%
4.4%
5.7%
11.4%
5.1%
5.4%
8.4%
7.5%
8.2%
4.8%
7.5%
8.1%
6.9%
7.8%
6.2%
7.6%
4.6%
5.1%
5.8%
13.5%
4.8%
9.4%
6.0%
6.5%
8.8%
4.2%
4.7%
5.0%
11.4%
3.9%
3.5%
8.1%
4.3%
8.0%
13.0%
5.1%
6.7%
5.6%
5.7%
6.2%
3.3%
7.7%
2.6%
11.2%
7.2%
5.6%
5.5%
4.0%
0.22%
0.74%
n.a.
n.a.
0.13%
0.42%
0.17%
0.39%
0.32%
0.18%
0.12%
0.38%
0.19%
n.a.
0.05%
0.26%
0.90%
n.a.
0.06%
0.08%
0.13%
0.48%
0.09%
0.87%
0.21%
0.49%
0.35%
0.42%
0.16%
0.27%
0.69%
0.23%
0.03%
0.62%
n.a.
n.a.
0.43%
0.24%
0.09%
n.a.
0.13%
0.14%
n.a.
0.72%
0.07%
0.13%
0.21%
0.28%
0.01%
0.03%
Strength Rank 2009
E(ROA)Commercial Bank Country Equity-to-Asset Ratio
Score(15%)
Risk Index
Std. Dev. (ROA)
Score(12.5%)
$million
AssetsScore(5%)
Change
LoansScore(5%)
Change
Deposits Risk Index*
14
129
122
44
90
241
78
123
130
87
267
212
134
74
103
108
50
165
85
82
166
218
72
294
18
21
76
271
75
38
207
34
99
286
62
272
201
238
151
174
96
40
183
185
292
289
152
56
88
126
AB300 Rank 2009
ABJ ISS-92(PG48-96).indd 62ABJ ISS-92(PG48-96).indd 62 8/28/09 1:10:32 AM8/28/09 1:10:32 AM

63 ISSUE 92 The Asian Banker
51
52
53
54
55
56
57
58
59
60
61
62
63
64
64
66
67
67
69
70
70
72
73
73
75
75
77
78
79
80
80
82
82
82
85
85
87
87
89
90
91
92
93
94
94
96
97
98
99
100
3.0
4.0
3.5
2.5
3.5
1.5
3.0
2.5
4.0
3.5
3.5
1.5
1.5
5.0
4.0
3.5
3.5
1.5
2.5
2.5
3.5
5.0
2.5
4.5
3.5
3.5
1.5
3.0
1.5
3.0
2.5
2.0
3.5
3.5
4.0
3.5
4.5
2.5
3.0
3.0
1.5
3.0
1.0
3.5
1.5
4.0
3.5
1.5
5.0
3.5
0.0
3.0
4.0
0.5
0.5
5.0
0.0
5.0
0.0
0.0
4.5
2.5
3.0
1.5
5.0
5.0
0.0
5.0
0.5
0.0
0.0
0.0
0.0
5.0
0.0
0.0
0.0
5.0
1.0
0.0
4.0
0.5
5.0
1.5
1.5
5.0
0.0
2.5
0.0
3.0
1.0
0.0
5.0
4.5
4.5
1.5
0.0
0.0
0.0
1.0
2.0
5.0
4.5
2.0
3.5
5.0
2.5
3.0
2.0
2.0
3.0
4.5
3.0
1.5
0.5
2.5
2.0
4.0
1.5
1.5
3.0
3.0
1.0
4.5
0.5
1.5
3.0
4.0
1.0
1.5
5.0
2.5
0.5
2.0
1.5
0.5
2.0
2.0
1.0
1.0
2.5
0.5
5.0
1.5
1.5
3.5
1.0
3.5
0.5
1.0
3.5
3.5
4.0
4.0
4.0
5.0
4.5
4.5
4.0
3.0
3.5
5.0
4.0
5.0
2.5
3.0
4.0
2.5
3.5
3.5
3.5
5.0
3.0
3.5
3.5
3.0
3.0
5.0
2.5
4.0
4.0
5.0
4.5
4.0
1.0
2.0
4.0
4.0
4.5
2.0
3.5
2.0
3.5
3.0
4.0
1.5
4.5
3.5
2.0
4.0
3.5
2.5
5.0
3.0
3.5
1.0
1.0
0.5
3.0
3.0
3.5
2.0
4.0
1.0
2.5
2.0
3.0
4.5
2.0
2.5
1.5
3.5
2.5
4.0
4.0
1.5
4.0
1.0
3.0
2.0
5.0
1.0
1.0
3.5
5.0
2.5
1.0
0.5
0.5
2.5
3.5
1.5
3.0
3.0
4.5
2.5
2.0
4.0
5.0
0.5
5.0
5.0
1.5
5.0
1.5
4.5
5.0
4.5
5.0
5.0
3.0
5.0
4.5
5.0
3.0
2.0
5.0
4.0
2.5
2.5
5.0
1.5
5.0
4.0
4.0
5.0
4.0
5.0
5.0
5.0
1.5
5.0
0.5
5.0
4.5
5.0
5.0
5.0
4.0
5.0
1.5
3.0
1.5
5.0
1.5
5.0
3.5
1.5
1.5
0.5
4.5
2.5
4.5
5.0
1.5
2.0
3.5
3.5
4.5
4.0
2.0
4.5
2.5
3.5
3.0
1.5
4.0
4.5
3.5
4.0
4.0
3.0
4.5
2.0
3.5
4.0
2.5
3.5
4.0
3.5
3.5
3.5
2.5
3.5
5.0
5.0
4.5
5.0
3.5
5.0
1.5
4.5
1.5
2.5
1.5
2.0
4.5
1.5
1.5
4.5
11.1%
15.7%
13.2%
10.4%
12.9%
n.a.
11.3%
10.5%
14.0%
12.7%
13.1%
n.a.
n.a.
19.7%
15.3%
13.1%
12.7%
n.a.
10.2%
10.9%
13.3%
19.0%
10.8%
16.4%
12.1%
13.2%
n.a.
11.6%
n.a.
11.5%
10.6%
9.1%
13.3%
12.5%
14.6%
13.2%
17.1%
10.0%
11.8%
11.0%
n.a.
11.6%
7.2%
13.5%
n.a.
14.3%
13.6%
n.a.
20.3%
12.8%
-23.1%
27.3%
37.4%
3.8%
1.5%
64.4%
-2.2%
83.2%
-40.8%
-13.8%
41.1%
25.0%
25.1%
n.a.
2114.2%
110.5%
-19.7%
146.9%
0.7%
-29.7%
-1.9%
-38.9%
-1.2%
232.7%
-33.8%
-57.8%
-25.2%
101.5%
8.8%
-31.9%
35.9%
1.6%
268.4%
11.3%
n.a.
228.2%
-51.2%
20.1%
-64.4%
28.1%
7.7%
-35.2%
254.6%
47.9%
47.1%
13.2%
-45.1%
-21.3%
-33.8%
6.3%
0.8%
1.7%
1.4%
0.9%
1.2%
2.9%
0.9%
1.1%
0.7%
0.8%
1.0%
1.5%
1.0%
n.a.
0.2%
1.0%
0.8%
1.2%
0.6%
0.5%
1.0%
1.1%
0.3%
1.4%
0.1%
0.6%
1.0%
1.4%
0.5%
0.6%
2.6%
0.9%
0.1%
0.8%
n.a.
0.3%
0.8%
0.8%
0.4%
0.5%
1.0%
0.2%
1.6%
0.7%
0.7%
1.2%
0.5%
1.1%
0.2%
0.4%
46.9%
47.3%
40.4%
41.1%
44.8%
29.1%
38.0%
36.0%
41.4%
51.5%
48.4%
32.3%
43.3%
23.5%
55.1%
52.8%
40.8%
58.9%
45.8%
46.0%
45.2%
34.3%
52.9%
46.2%
48.2%
53.8%
54.5%
34.2%
59.3%
41.5%
41.0%
33.7%
36.6%
42.7%
74.9%
60.4%
43.3%
44.9%
36.2%
62.7%
45.9%
64.1%
47.1%
53.7%
43.3%
69.9%
35.3%
47.9%
64.9%
40.8%
31.5%
23.3%
51.3%
29.0%
34.6%
9.2%
5.2%
4.7%
25.7%
29.5%
34.0%
15.8%
36.2%
9.8%
24.9%
17.7%
26.6%
41.6%
19.9%
21.7%
13.9%
32.1%
24.5%
37.0%
60.2%
10.0%
38.9%
9.9%
25.8%
16.8%
45.0%
9.6%
9.7%
34.4%
50.4%
22.8%
8.5%
2.0%
0.1%
24.7%
32.7%
13.4%
25.8%
26.4%
41.1%
24.6%
15.1%
36.6%
50.0%
2.4%
200.0%
138.8%
37.5%
200.0%
n.a.
96.5%
135.2%
94.4%
186.9%
138.5%
68.5%
166.7%
91.1%
175.0%
68.5%
41.4%
141.7%
83.3%
57.9%
53.7%
115.4%
32.0%
128.6%
80.0%
87.5%
130.8%
89.8%
108.3%
145.5%
126.7%
36.4%
150.0%
10.8%
136.9%
93.1%
366.7%
150.0%
300.0%
84.2%
100.0%
n.a.
64.4%
n.a.
104.1%
n.a.
144.6%
71.4%
n.a.
n.a.
14.3%
0.5%
4.9%
0.8%
0.2%
n.a.
5.7%
2.3%
1.8%
0.6%
1.3%
5.4%
0.9%
4.5%
1.6%
3.3%
8.2%
1.2%
0.6%
1.7%
1.5%
1.3%
2.5%
0.8%
7.0%
1.6%
1.3%
4.9%
2.4%
1.1%
1.5%
2.2%
2.0%
3.7%
2.4%
0.3%
0.3%
0.6%
0.4%
1.9%
0.1%
n.a.
0.9%
n.a.
4.9%
n.a.
5.6%
0.7%
n.a.
n.a.
0.7%
3.25
3.24
3.23
3.21
3.19
3.18
3.16
3.15
3.15
3.11
3.10
3.10
3.09
3.05
3.05
3.05
3.04
3.04
3.01
3.00
3.00
2.99
2.99
2.99
2.98
2.98
2.98
2.96
2.96
2.95
2.95
2.91
2.91
2.91
2.90
2.90
2.89
2.89
2.88
2.85
2.85
2.84
2.83
2.81
2.81
2.81
2.80
2.80
2.79
2.78
Strength Rank 2009
AggregateStrength
Score 2009Score(7.5%)
Ratio
Non-interest IncomeScore(7.5%)
Change
Operating Profit Operating CostReturn on Assets (ROA)Score(10%)
Cost toIncomeRatio
NII to Total Operating Income (%)
Capital AdequacyScore(10%)
Total Score(7.5%)
Loan Loss CoverageLoan LossReserve toGross NPLs
Score(7.5%)
Loan QualityGross
NPL RatioScore(7.5%)
3.0
3.0
3.0
5.0
1.5
2.5
3.0
2.5
3.0
2.0
2.0
3.0
3.5
3.5
0.5
5.0
3.0
4.5
3.0
2.5
2.5
5.0
1.5
2.0
3.5
4.5
3.5
4.0
3.0
2.5
1.5
2.5
1.5
5.0
3.0
3.0
5.0
2.5
1.5
1.5
1.5
3.0
4.0
3.0
1.5
1.0
2.5
3.0
1.5
2.5
3.2%
1.9%
2.6%
32.8%
n.a.
0.8%
1.9%
0.9%
2.6%
0.5%
0.4%
3.3%
5.1%
4.0%
0.0%
24.3%
3.0%
18.9%
2.0%
1.5%
0.8%
48.7%
0.2%
0.4%
5.1%
16.1%
5.0%
8.6%
2.0%
1.4%
n.a.
1.5%
n.a.
41.1%
3.4%
2.3%
27.5%
1.5%
n.a.
n.a.
n.a.
1.8%
10.4%
2.5%
n.a.
0.1%
0.8%
2.9%
n.a.
1.7%
LiquidityLiquid Assetto Total Asset
Score(5%)
ABJ ISS-92(PG48-96).indd 63ABJ ISS-92(PG48-96).indd 63 8/28/09 1:10:33 AM8/28/09 1:10:33 AM

64 ISSUE 92The Asian Banker
THE ASIAN BANKER
Asia Pacifi c’s Strongest Banks
*Risk Index = [E(ROA) + Equity/Assets] / Std. Dev. (ROA) • E(ROA) is the expected return on assets, calculated as the average ROA in the past fi ve fi nancial years. • Std. Dev. (ROA) is the standard deviation of ROA which measures the variability of profi tability. • The Risk Index measures how much a bank’s earnings can decline until book value becomes negative. Expressed in units of standard deviations of ROA, the Risk Index gauges banks’ ability to absorb accounting losses. • Scores are only shown to two decimal places, but rankings refl ect full information.
10
1 t
o 1
50
100
102
103
103
105
105
107
107
109
110
110
112
113
114
114
114
117
117
119
120
121
122
123
123
125
125
125
128
128
128
131
132
133
134
135
136
137
138
139
139
141
142
143
143
145
146
146
148
149
150
Oriental Bank of Commerce
National Bank of Pakistan
Yamaguchi Bank*
Chinatrust Commercial Bank
Dena Bank
Punjab and Sind Bank
Shenzhen Development Bank
Daegu Bank
Industrial Bank of Taiwan
National Australia Bank
Vietnam Bank for Industry and Trade
Shinhan Financial Group
Metropolitan Bank and Trust
Guangdong Development Bank
Suncorp-Metway
Habib Bank
Bank Rakyat Indonesia
Citibank (Australia)
ICICI Bank
Bank of Ayudhya
Shizuoka Bank
Chang Hwa Commercial Bank
BOC Hong Kong Holdings
Bank Danamon
Chugoku Bank
Mega International Commercial Bank
United Bank
Yamanashi Chuo Bank
Joint Stock Commercial Bank for Foreign Trade*
Jammu and Kashmir Bank
United Overseas Bank (Malaysia)
UCO Bank
Woori Financial Group
Shoko Chukin Bank
Bank of The Philippine Islands
Thanachart Bank
Higo Bank
Hana Financial Group
Bank of Kyoto
AMMB Holdings
Kagoshima Bank
Andhra Bank*
Sumitomo Mitsui Financial Group
EON Capital
Gunma Bank
CITIC Ka Wah Bank
Evergrowing Bank*
Bank of East Asia (China)
Siam City Bank
Bank of Fukuoka
23,234
10,368
53,560
50,990
10,001
8,537
69,417
21,043
9,003
455,030
11,403
209,656
16,106
79,890
65,240
9,582
22,473
13,508
99,616
21,362
99,655
42,127
148,012
9,796
64,624
61,844
7,841
28,602
11,593
7,779
11,959
23,045
231,040
119,095
14,038
10,832
40,089
125,319
73,503
25,951
34,712
11,658
1,275,578
12,535
65,006
15,715
15,710
17,270
12,034
93,768
2.5
1.5
4.5
4.5
1.5
1.0
4.5
2.5
1.0
5.0
1.5
5.0
2.0
4.5
4.5
1.0
2.5
1.5
4.5
2.5
4.5
4.0
5.0
1.0
4.5
4.5
1.0
3.0
1.5
1.0
1.5
2.5
5.0
5.0
1.5
1.5
4.0
5.0
4.5
3.0
3.5
1.5
5.0
1.5
4.5
2.0
2.0
2.0
1.5
4.5
25.5%
21.2%
4.5%
5.2%
25.4%
34.2%
31.0%
10.4%
17.5%
12.5%
18.0%
13.7%
18.6%
23.8%
21.9%
18.9%
43.1%
6.5%
5.9%
26.2%
7.4%
7.7%
11.8%
26.0%
5.3%
9.1%
22.7%
0.8%
45.2%
10.8%
10.3%
24.9%
15.0%
0.4%
17.0%
20.1%
4.0%
16.0%
5.0%
8.6%
1.6%
22.8%
5.3%
5.0%
8.6%
10.0%
28.0%
16.5%
11.6%
7.5%
26.5%
-3.2%
5.1%
-26.7%
28.5%
36.6%
27.9%
35.4%
15.7%
10.2%
8.2%
20.1%
10.5%
15.4%
13.6%
14.1%
21.7%
n.a.
-7.0%
7.6%
1.3%
9.5%
1.5%
28.0%
3.2%
7.5%
19.4%
1.7%
28.0%
15.4%
22.8%
24.8%
38.2%
17.2%
5.2%
42.9%
2.2%
16.9%
9.9%
6.0%
1.5%
19.2%
4.0%
11.9%
0.1%
13.5%
57.2%
83.3%
3.1%
3.2%
India
Pakistan
Japan
Taiwan
India
India
China
S.Korea
Taiwan
Australia
Vietnam
S.Korea
Philippines
China
Australia
Pakistan
Indonesia
Australia
India
Thailand
Japan
Taiwan
Hong Kong
Indonesia
Japan
Taiwan
Pakistan
Japan
Vietnam
India
Malaysia
India
S.Korea
Japan
Philippines
Thailand
Japan
S.Korea
Japan
Malaysia
Japan
India
Japan
Malaysia
Japan
Hong Kong
China
China
Thailand
Japan
4.5
4.0
1.0
1.5
4.5
5.0
5.0
2.5
3.5
3.0
4.0
3.0
4.0
4.0
4.0
4.0
5.0
2.0
1.5
4.5
2.0
2.0
3.0
4.5
1.5
2.5
4.0
0.0
5.0
2.5
2.5
4.5
3.5
0.0
3.5
4.0
1.0
3.5
1.5
2.5
0.5
4.0
1.5
1.5
2.5
2.5
4.5
3.5
2.5
2.0
19.19
34.48
78.86
9.91
14.00
7.24
11.54
36.35
14.87
15.38
22.42
40.00
47.64
9.76
25.33
27.87
n.a.
142.74
50.20
18.35
60.32
37.26
11.16
11.94
75.63
18.75
24.61
100.14
n.a.
26.54
46.20
30.44
14.36
83.65
33.05
n.a.
73.02
16.22
50.93
18.87
163.61
23.03
9.13
35.49
55.77
15.07
22.00
n.a.
14.19
94.72
1.5
3.0
4.5
0.5
1.0
0.5
1.0
3.5
1.0
1.5
2.0
3.5
4.0
0.5
2.5
2.5
1.5
5.0
4.0
1.5
4.5
3.5
1.0
1.0
4.5
1.5
2.0
5.0
1.5
2.5
4.0
3.0
1.0
5.0
3.0
1.5
4.5
1.5
4.0
1.5
5.0
2.0
0.5
3.5
4.0
1.5
2.0
1.5
1.0
5.0
4.5
0.0
2.0
0.0
4.5
5.0
4.5
5.0
3.5
3.0
2.5
4.0
3.0
3.5
3.0
3.5
4.0
1.5
0.0
2.5
0.5
2.5
1.0
4.5
1.5
2.5
4.0
1.0
4.5
3.5
4.0
4.5
5.0
3.5
2.0
5.0
1.0
3.5
2.5
2.0
1.0
4.0
1.5
3.0
0.0
3.0
5.0
5.0
1.5
1.5
0.9%
2.5%
0.3%
0.6%
0.7%
0.8%
0.4%
1.0%
0.9%
0.8%
0.6%
1.0%
0.9%
0.2%
1.3%
1.8%
n.a.
1.1%
0.9%
0.4%
0.4%
0.5%
1.2%
2.9%
0.3%
0.8%
1.8%
0.2%
n.a.
0.9%
1.3%
0.5%
0.9%
0.1%
1.6%
n.a.
0.2%
0.8%
0.3%
0.6%
0.3%
1.4%
0.2%
0.6%
0.3%
0.7%
0.4%
n.a.
0.8%
0.4%
6.6%
12.7%
6.9%
6.8%
4.5%
4.7%
3.5%
6.0%
13.4%
4.3%
6.4%
6.6%
8.2%
3.6%
13.1%
9.9%
9.1%
10.0%
10.0%
11.5%
7.2%
5.8%
7.4%
10.4%
5.9%
6.9%
8.0%
5.7%
6.1%
7.0%
7.2%
3.5%
4.9%
6.3%
9.6%
5.6%
5.4%
5.9%
5.5%
8.8%
7.2%
5.5%
4.0%
7.4%
5.6%
7.8%
1.9%
8.7%
9.8%
7.2%
0.39%
0.44%
0.09%
0.74%
0.37%
0.75%
0.33%
0.19%
0.96%
0.33%
0.31%
0.19%
0.19%
0.39%
0.57%
0.42%
n.a.
0.08%
0.22%
0.65%
0.13%
0.17%
0.76%
1.11%
0.08%
0.41%
0.40%
0.06%
n.a.
0.30%
0.18%
0.13%
0.41%
0.08%
0.34%
n.a.
0.08%
0.41%
0.11%
0.50%
0.05%
0.30%
0.46%
0.23%
0.10%
0.57%
0.10%
n.a.
0.75%
0.08%
Strength Rank 2009
E(ROA)Commercial Bank Country Equity-to-Asset Ratio
Score(15%)
RiskIndex
Std. Dev. (ROA)
Score(12.5%)
$million
AssetsScore(5%)
Change
LoansScore(5%)
Change
Deposits Risk Index*
162
258
81
84
261
280
63
173
275
10
250
22
198
53
67
266
167
225
46
171
45
100
29
263
69
70
299
137
249
300
245
164
19
37
220
255
106
33
59
147
119
248
4
234
68
202
203
191
242
49
AB300 Rank 2009
ABJ ISS-92(PG48-96).indd 64ABJ ISS-92(PG48-96).indd 64 8/28/09 1:10:34 AM8/28/09 1:10:34 AM

65 ISSUE 92 The Asian Banker
100
102
103
103
105
105
107
107
109
110
110
112
113
114
114
114
117
117
119
120
121
122
123
123
125
125
125
128
128
128
131
132
133
134
135
136
137
138
139
139
141
142
143
143
145
146
146
148
149
150
3.5
4.5
2.5
4.5
2.5
3.0
1.5
3.5
4.0
2.5
1.5
1.5
3.5
3.0
2.5
3.5
3.5
3.5
4.0
4.0
4.0
2.5
4.5
4.0
3.5
3.0
2.5
4.0
3.5
3.5
1.5
1.5
1.5
1.5
4.0
3.0
3.5
3.0
3.5
1.5
3.5
3.0
3.0
3.5
3.0
4.0
1.0
1.5
2.5
3.0
0.0
0.0
3.0
0.0
5.0
2.0
0.0
0.0
0.0
0.0
5.0
0.0
1.5
0.0
0.0
3.0
1.5
1.5
2.0
5.0
0.0
0.0
0.0
0.0
0.0
0.0
2.5
5.0
0.0
1.0
0.0
2.5
0.0
0.0
0.0
0.5
1.5
0.0
0.0
0.5
2.5
2.0
0.0
0.0
0.0
5.0
5.0
5.0
5.0
0.0
2.0
5.0
1.0
2.0
2.5
4.0
0.5
3.0
0.0
1.0
3.0
2.0
1.5
1.5
1.5
5.0
5.0
3.0
1.5
1.5
0.5
1.0
0.5
5.0
0.5
0.5
4.5
0.5
4.0
3.5
2.5
1.5
0.5
0.0
3.0
1.5
0.5
1.0
0.5
3.0
0.5
3.5
0.0
1.0
0.5
0.5
1.5
2.5
2.5
1.0
3.5
4.5
2.0
3.0
3.0
3.5
4.5
0.0
3.0
2.5
2.5
2.0
1.0
4.5
0.0
3.0
3.5
1.5
1.0
2.0
2.5
2.5
0.0
2.5
2.0
3.0
3.5
1.0
5.0
4.5
4.0
3.0
2.5
2.5
2.0
1.0
1.5
0.0
2.5
3.0
1.0
3.5
3.5
3.0
2.5
1.0
4.5
4.0
2.5
2.0
3.0
3.0
2.0
5.0
3.0
3.0
1.5
2.5
5.0
1.5
2.0
4.0
3.5
1.5
5.0
2.0
1.5
4.5
3.0
1.5
2.0
1.5
2.5
1.0
1.5
1.5
2.5
1.0
3.5
2.0
2.5
4.0
1.0
1.0
3.5
5.0
1.5
1.5
1.0
5.0
2.0
3.0
4.0
3.5
1.5
2.0
1.0
1.5
3.5
1.5
3.0
3.5
2.5
4.0
2.0
2.0
5.0
5.0
5.0
5.0
5.0
1.5
3.5
5.0
2.0
3.0
1.5
1.5
2.5
2.5
1.5
4.0
5.0
5.0
3.0
4.5
3.0
2.0
1.5
2.5
3.5
1.5
5.0
3.5
2.5
5.0
2.5
5.0
1.5
3.5
2.0
1.5
3.0
4.0
2.5
1.5
1.5
1.5
3.0
1.5
3.5
1.0
3.0
3.5
3.5
4.5
4.5
4.0
5.0
4.5
3.5
1.5
2.5
3.0
4.5
1.5
1.5
1.5
2.5
1.5
3.0
3.5
4.5
3.5
3.0
4.5
2.0
2.5
0.5
3.0
2.5
1.5
4.0
2.5
2.5
3.0
3.5
4.0
3.0
2.5
3.0
1.5
3.5
2.5
3.0
3.5
1.5
1.5
1.5
1.5
13.0%
16.9%
10.7%
16.2%
10.7%
11.9%
8.6%
12.0%
15.4%
10.9%
n.a.
n.a.
13.4%
11.6%
10.4%
13.6%
13.2%
12.4%
14.7%
14.9%
14.1%
10.6%
16.2%
14.0%
12.0%
11.2%
10.5%
14.2%
12.0%
13.5%
n.a.
n.a.
n.a.
8.9%
14.2%
11.0%
12.3%
11.8%
12.0%
n.a.
13.6%
11.6%
11.5%
12.6%
11.3%
14.7%
7.0%
n.a.
10.4%
11.1%
-7.9%
-16.6%
28.1%
-4.3%
88.5%
16.3%
-57.5%
-3.1%
-42.3%
-66.0%
64.3%
-57.1%
12.7%
-26.4%
-59.1%
25.1%
10.5%
10.7%
19.3%
L-P
-33.3%
-35.5%
-76.8%
-26.6%
-38.2%
-64.1%
24.2%
214.6%
-9.6%
9.7%
-21.5%
21.4%
-63.3%
P-L
-26.6%
0.0%
10.1%
-66.0%
-20.2%
2.0%
23.4%
17.8%
-63.2%
-27.8%
-15.6%
142.8%
156.3%
171.5%
L-P
-72.1%
0.9%
2.0%
0.4%
0.8%
1.0%
1.2%
0.1%
1.0%
-0.6%
0.5%
1.0%
0.8%
0.6%
0.6%
0.6%
2.1%
2.7%
1.0%
0.7%
0.7%
0.2%
0.4%
0.3%
1.9%
0.2%
0.2%
1.4%
0.2%
1.3%
1.2%
1.0%
0.6%
0.2%
0.0%
1.0%
0.6%
0.1%
0.3%
0.2%
1.0%
0.2%
1.1%
-0.3%
0.3%
0.2%
0.1%
0.6%
0.9%
1.0%
0.4%
48.8%
37.7%
61.5%
52.5%
50.1%
47.7%
36.1%
87.4%
54.8%
57.6%
56.8%
64.9%
71.0%
37.1%
82.9%
50.1%
49.2%
65.8%
74.8%
61.8%
55.1%
56.7%
81.0%
57.2%
64.1%
51.9%
46.6%
71.2%
28.7%
37.8%
40.5%
54.9%
58.9%
58.2%
61.5%
71.4%
69.4%
80.4%
57.7%
52.3%
70.5%
47.0%
49.3%
53.0%
60.0%
71.7%
37.3%
41.5%
58.5%
61.2%
29.6%
28.6%
15.5%
46.8%
26.9%
27.3%
13.0%
79.7%
51.9%
13.1%
16.3%
36.6%
33.2%
11.3%
48.3%
16.0%
14.9%
56.7%
74.1%
11.8%
17.4%
11.3%
20.5%
8.6%
13.1%
n.a.
23.0%
6.5%
32.4%
17.5%
22.7%
38.3%
9.6%
9.7%
34.7%
47.6%
10.7%
n.a.
7.8%
45.7%
15.7%
29.1%
38.4%
31.8%
12.1%
16.1%
7.4%
10.4%
31.3%
12.6%
60.0%
79.7%
59.4%
82.8%
47.6%
42.9%
100.0%
123.1%
193.8%
133.3%
100.0%
n.a.
75.6%
148.3%
42.9%
69.9%
n.a.
n.a.
52.8%
58.0%
38.6%
81.5%
100.0%
109.1%
63.7%
93.8%
68.5%
49.7%
30.6%
50.0%
71.4%
n.a.
150.0%
70.3%
59.0%
100.0%
51.4%
168.3%
35.2%
75.6%
47.1%
n.a.
69.6%
83.3%
55.3%
36.8%
n.a.
n.a.
65.1%
n.a.
1.5%
12.3%
3.2%
1.5%
2.1%
0.7%
0.7%
1.3%
0.5%
0.6%
1.8%
n.a.
4.5%
2.9%
0.7%
8.3%
n.a.
n.a.
3.6%
10.0%
3.3%
1.7%
0.5%
2.2%
3.1%
1.0%
7.3%
4.4%
14.4%
2.6%
4.2%
n.a.
1.2%
3.7%
3.9%
3.0%
2.2%
1.2%
3.3%
4.1%
2.8%
n.a.
2.3%
4.8%
2.9%
1.9%
n.a.
n.a.
8.8%
n.a.
2.78
2.75
2.75
2.75
2.74
2.74
2.73
2.73
2.70
2.70
2.70
2.70
2.69
2.69
2.69
2.69
2.69
2.69
2.68
2.64
2.64
2.63
2.61
2.61
2.59
2.59
2.59
2.58
2.58
2.58
2.56
2.56
2.56
2.55
2.55
2.54
2.51
2.51
2.49
2.49
2.49
2.48
2.46
2.46
2.45
2.44
2.44
2.43
2.43
2.43
Strength Rank 2009
AggregateStrength
Score 2009Score(7.5%)
Ratio
Non-interest IncomeScore(7.5%)
Change
Operating Profit Operating CostReturn on Assets (ROA)Score(10%)
Cost toIncomeRatio
NII to Total Operating Income (%)
Capital AdequacyScore(10%)
Total Score(7.5%)
Loan Loss CoverageLoan LossReserve toGross NPLs
Score(7.5%)
Loan QualityGross
NPL RatioScore(7.5%)
4.5
1.5
1.0
4.0
4.0
4.5
1.5
1.5
5.0
3.0
2.0
3.5
2.0
2.0
3.5
1.5
3.5
3.5
1.5
5.0
2.0
2.5
5.0
3.0
1.0
2.5
1.5
1.5
2.5
1.5
1.5
1.5
3.5
1.5
3.5
3.0
0.5
3.0
1.5
2.5
0.5
1.5
3.5
1.0
1.0
5.0
1.5
1.5
4.5
0.5
23.2%
n.a.
0.1%
10.0%
9.2%
16.9%
n.a.
n.a.
34.3%
3.2%
0.4%
3.4%
0.7%
0.6%
6.0%
n.a.
4.3%
3.8%
n.a.
27.9%
0.7%
1.0%
27.3%
2.2%
0.1%
1.6%
n.a.
n.a.
1.6%
0.2%
n.a.
n.a.
5.7%
0.2%
5.2%
3.0%
0.0%
3.4%
n.a.
1.6%
0.0%
n.a.
4.3%
0.1%
0.1%
80.9%
n.a.
n.a.
19.0%
0.0%
LiquidityLiquid Assetto Total Asset
Score(5%)
ABJ ISS-92(PG48-96).indd 65ABJ ISS-92(PG48-96).indd 65 8/28/09 1:10:36 AM8/28/09 1:10:36 AM

66 ISSUE 92The Asian Banker
THE ASIAN BANKER
Asia Pacifi c’s Strongest Banks
*Risk Index = [E(ROA) + Equity/Assets] / Std. Dev. (ROA) • E(ROA) is the expected return on assets, calculated as the average ROA in the past fi ve fi nancial years. • Std. Dev. (ROA) is the standard deviation of ROA which measures the variability of profi tability. • The Risk Index measures how much a bank’s earnings can decline until book value becomes negative. Expressed in units of standard deviations of ROA, the Risk Index gauges banks’ ability to absorb accounting losses. • Scores are only shown to two decimal places, but rankings refl ect full information.
15
1 t
o 2
00
151
152
152
152
152
156
156
158
158
160
160
162
162
162
165
166
166
168
169
169
171
172
172
174
175
176
177
178
179
180
181
181
183
184
185
185
187
188
189
189
191
191
193
194
195
196
197
197
199
199
Kwangju Bank
Agricultural Bank of China
Chiba Bank
77 Bank
Wing Hang Bank
Bank for Investment and Development of Vietnam
Chong Hing Bank
Iyo Bank
Ping An Bank
Yamaguchi Financial Group*
Allahabad Bank
Mitsubishi UFJ Financial Group
Bank of Yokohama
Standard Chartered Bank (China)*
Daishi Bank
Hachijuni Bank
Beijing Rural Commercial Bank*
Orix Corporation*
Chuo Mitsui Trust Holdings
Fubon Bank (Hong Kong)
Cathay United Bank
Resona Holdings
Jiangnan Rural Credit Cooperatives of Wuhan
Banco de Oro Unibank
Suruga Bank
Macquarie Group
Hiroshima Bank
Keiyo Bank
Kotak Mahindra Bank
Mizuho Financial Group
Taiwan Cooperative Bank
Bank CIMB Niaga
Bank of Nagoya
Bank of Maharashtra
Central Bank of India*
Tajima Bank*
Shinkin Central Bank
Norinchukin Bank
Sony Bank
BIMB Holdings
Hyakujushi Bank*
Toho Bank
Hokuriku Bank*
Kiyo Holdings*
Rural Credit Cooperatives Union of Shunde*
Awa Bank
Hokuhoku Financial Group*
Nishi-Nippon City Bank*
Fukuoka Financial Group*
Joyo Bank
12,486
1,026,300
109,638
61,807
17,340
14,273
8,822
53,782
21,351
82,318
20,190
2,086,805
128,200
14,355
47,791
66,424
26,728
99,118
167,539
8,469
41,204
430,916
8,382
16,890
34,580
103,327
68,143
35,847
8,303
1,639,485
75,609
9,424
33,500
12,184
25,613
9,035
302,117
685,248
15,549
7,963
40,230
33,002
61,205
38,432
10,241
28,355
103,675
75,701
124,243
81,385
1.5
5.0
5.0
4.5
2.0
1.5
1.0
4.5
2.5
4.5
2.5
5.0
5.0
1.5
4.0
4.5
3.0
4.5
5.0
1.0
4.0
5.0
1.0
2.0
3.5
5.0
4.5
4.0
1.0
5.0
4.5
1.0
3.5
1.5
3.0
1.0
5.0
5.0
2.0
1.0
4.0
3.5
4.5
4.0
1.5
3.0
5.0
4.5
5.0
4.5
12.2%
11.3%
4.9%
7.4%
7.2%
21.8%
4.9%
3.9%
16.9%
4.9%
18.3%
3.6%
5.4%
n.a.
6.1%
6.5%
33.8%
4.7%
8.0%
4.9%
6.8%
2.0%
20.9%
34.5%
3.0%
-11.5%
2.1%
5.6%
2.3%
7.7%
6.0%
23.5%
3.8%
17.1%
40.7%
0.6%
-7.4%
11.4%
38.6%
7.8%
-0.6%
9.8%
1.7%
8.0%
8.5%
2.5%
1.1%
2.4%
n.a.
6.8%
0.6%
15.3%
1.5%
2.0%
1.1%
20.3%
-1.5%
3.3%
-5.5%
3.0%
18.2%
-1.0%
1.9%
n.a.
3.0%
1.8%
27.3%
n.a.
9.0%
15.7%
5.5%
1.5%
18.6%
42.2%
0.9%
38.6%
1.7%
4.6%
2.6%
1.3%
5.2%
11.3%
2.8%
25.6%
33.1%
0.6%
1.0%
-3.4%
15.9%
18.1%
4.5%
4.7%
-0.3%
4.5%
7.6%
4.9%
-0.4%
2.5%
n.a.
3.3%
S.Korea
China
Japan
Japan
Hong Kong
Vietnam
Hong Kong
Japan
China
Japan
India
Japan
Japan
China
Japan
Japan
China
Japan
Japan
Hong Kong
Taiwan
Japan
China
Philippines
Japan
Australia
Japan
Japan
India
Japan
Taiwan
Indonesia
Japan
India
India
Japan
Japan
Japan
Japan
Malaysia
Japan
Japan
Japan
Japan
China
Japan
Japan
Japan
Japan
Japan
3.0
2.5
1.5
2.0
2.0
4.0
1.5
1.0
3.5
1.5
4.0
1.0
1.5
1.5
1.5
2.0
5.0
1.0
2.0
1.5
2.0
0.5
4.0
5.0
1.0
0.0
0.5
1.5
0.5
2.0
1.5
4.0
1.0
3.5
5.0
0.0
0.0
2.5
5.0
2.0
0.0
2.5
0.5
2.0
2.5
0.5
0.0
0.5
1.5
2.0
33.60
10.70
32.75
169.21
28.98
24.41
89.40
13.42
n.a.
34.80
13.10
27.34
n.a.
131.96
36.04
n.a.
26.38
8.32
27.74
15.16
12.17
n.a.
11.56
46.40
19.26
48.11
44.19
23.51
8.13
27.55
14.07
49.41
19.12
n.a.
100.10
2.50
6.96
n.a.
1.53
52.67
66.08
20.57
n.a.
25.36
45.10
24.33
37.30
n.a.
39.12
3.0
1.0
3.0
5.0
2.5
0.0
2.0
5.0
1.0
1.5
3.0
1.0
2.5
1.5
5.0
3.5
1.5
2.5
0.5
2.5
1.5
1.0
1.5
1.0
4.0
1.5
4.0
3.5
2.0
0.5
2.5
1.0
4.0
1.5
1.5
5.0
0.0
0.5
1.5
0.0
4.0
4.5
2.0
1.5
2.5
4.0
2.0
3.5
1.5
3.5
0.0
3.5
1.0
1.0
0.5
4.0
0.0
1.5
0.0
1.5
3.5
0.0
1.0
1.5
1.5
1.0
4.5
1.5
2.5
3.5
2.0
1.0
3.5
5.0
0.5
5.0
1.0
2.0
1.5
0.5
2.0
3.0
1.5
4.5
4.5
0.0
0.5
0.0
3.5
3.5
1.5
2.0
0.0
2.0
2.5
2.0
0.0
1.5
1.5
1.5
0.8%
0.4%
0.4%
0.2%
1.3%
0.7%
0.4%
0.8%
n.a.
1.3%
0.3%
0.5%
n.a.
0.2%
0.3%
n.a.
1.8%
0.5%
0.5%
0.2%
0.9%
n.a.
1.2%
0.5%
1.0%
0.3%
0.4%
2.4%
0.3%
0.3%
1.8%
0.3%
0.6%
n.a.
0.2%
0.0%
0.1%
n.a.
-0.5%
0.3%
0.2%
0.2%
n.a.
0.3%
0.3%
0.3%
0.2%
n.a.
0.3%
5.8%
4.1%
5.4%
5.4%
7.9%
8.7%
6.7%
5.9%
5.2%
6.2%
4.5%
6.1%
6.9%
5.0%
6.7%
3.8%
14.6%
4.5%
7.2%
6.2%
5.6%
0.7%
6.6%
6.0%
6.3%
4.3%
5.1%
16.4%
2.8%
4.3%
9.1%
5.0%
4.3%
4.8%
4.2%
1.0%
4.0%
3.2%
7.0%
6.6%
3.9%
3.0%
3.2%
3.4%
5.7%
3.0%
3.9%
5.2%
5.1%
0.20%
0.42%
0.18%
0.03%
0.32%
0.38%
0.08%
0.50%
n.a.
0.21%
0.37%
0.24%
n.a.
0.04%
0.20%
n.a.
0.62%
0.60%
0.28%
0.42%
0.53%
n.a.
0.67%
0.14%
0.38%
0.10%
0.12%
0.80%
0.38%
0.17%
0.78%
0.11%
0.25%
n.a.
0.04%
0.37%
0.59%
n.a.
4.27%
0.13%
0.06%
0.16%
n.a.
0.14%
0.13%
0.14%
0.11%
n.a.
0.14%
Strength Rank 2009
E(ROA)Commercial Bank Country Equity-to-Asset Ratio
Score(15%)
Risk Index
Std. Dev. (ROA)
Score(12.5%)
$million
AssetsScore(5%)
Change
LoansScore(5%)
Change
Deposits Risk Index*
236
6
39
71
190
217
277
79
172
51
177
1
30
216
91
66
142
47
26
281
104
11
284
195
120
43
64
116
287
2
58
268
124
239
150
273
16
8
205
296
105
128
73
107
259
138
42
57
35
52
AB300 Rank 2009
ABJ ISS-92(PG48-96).indd 66ABJ ISS-92(PG48-96).indd 66 8/28/09 1:10:36 AM8/28/09 1:10:36 AM
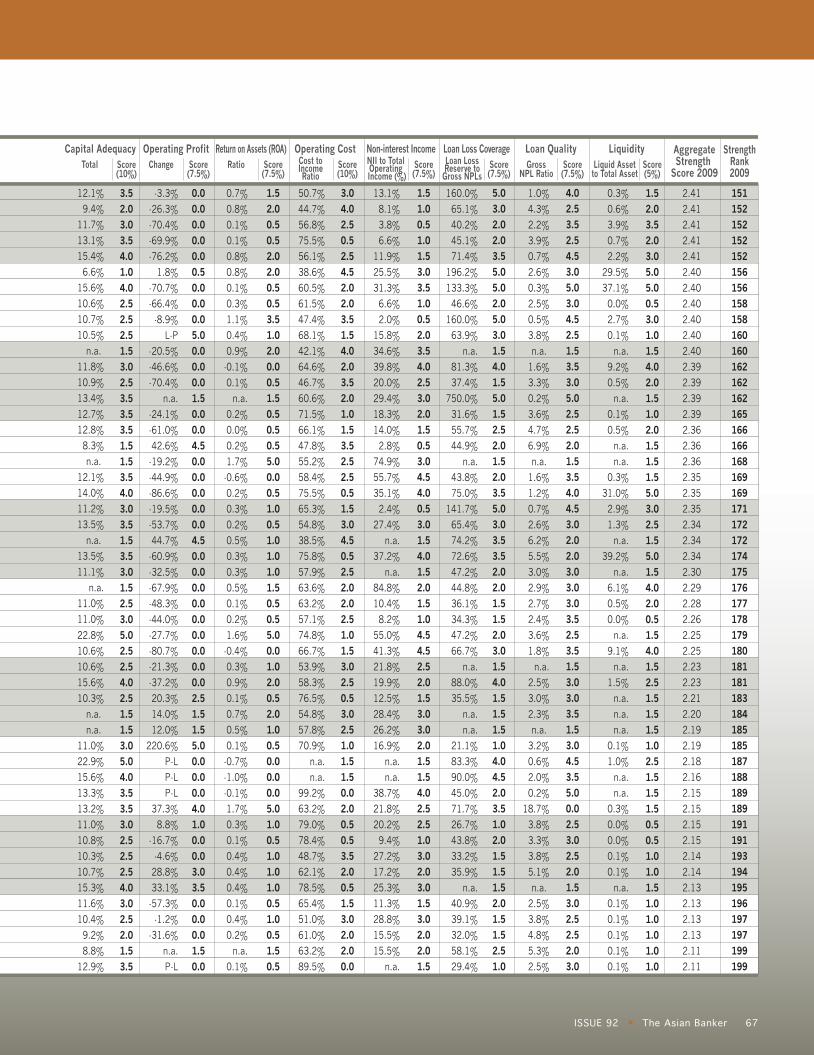
67 ISSUE 92 The Asian Banker
151
152
152
152
152
156
156
158
158
160
160
162
162
162
165
166
166
168
169
169
171
172
172
174
175
176
177
178
179
180
181
181
183
184
185
185
187
188
189
189
191
191
193
194
195
196
197
197
199
199
3.5
2.0
3.0
3.5
4.0
1.0
4.0
2.5
2.5
2.5
1.5
3.0
2.5
3.5
3.5
3.5
1.5
1.5
3.5
4.0
3.0
3.5
1.5
3.5
3.0
1.5
2.5
3.0
5.0
2.5
2.5
4.0
2.5
1.5
1.5
3.0
5.0
4.0
3.5
3.5
3.0
2.5
2.5
2.5
4.0
3.0
2.5
2.0
1.5
3.5
0.0
0.0
0.0
0.0
0.0
0.5
0.0
0.0
0.0
5.0
0.0
0.0
0.0
1.5
0.0
0.0
4.5
0.0
0.0
0.0
0.0
0.0
4.5
0.0
0.0
0.0
0.0
0.0
0.0
0.0
0.0
0.0
2.5
1.5
1.5
5.0
0.0
0.0
0.0
4.0
1.0
0.0
0.0
3.0
3.5
0.0
0.0
0.0
1.5
0.0
1.5
2.0
0.5
0.5
2.0
2.0
0.5
0.5
3.5
1.0
2.0
0.0
0.5
1.5
0.5
0.5
0.5
5.0
0.0
0.5
1.0
0.5
1.0
1.0
1.0
1.5
0.5
0.5
5.0
0.0
1.0
2.0
0.5
2.0
1.0
0.5
0.0
0.0
0.0
5.0
1.0
0.5
1.0
1.0
1.0
0.5
1.0
0.5
1.5
0.5
3.0
4.0
2.5
0.5
2.5
4.5
2.0
2.0
3.5
1.5
4.0
2.0
3.5
2.0
1.0
1.5
3.5
2.5
2.5
0.5
1.5
3.0
4.5
0.5
2.5
2.0
2.0
2.5
1.0
1.5
3.0
2.5
0.5
3.0
2.5
1.0
1.5
1.5
0.0
2.0
0.5
0.5
3.5
2.0
0.5
1.5
3.0
2.0
2.0
0.0
1.5
1.0
0.5
1.0
1.5
3.0
3.5
1.0
0.5
2.0
3.5
4.0
2.5
3.0
2.0
1.5
0.5
3.0
4.5
4.0
0.5
3.0
1.5
4.0
1.5
2.0
1.5
1.0
4.5
4.5
2.5
2.0
1.5
3.0
3.0
2.0
1.5
1.5
4.0
2.5
2.5
1.0
3.0
2.0
3.0
1.5
3.0
2.0
2.0
1.5
5.0
3.0
2.0
2.0
3.5
5.0
5.0
2.0
5.0
3.0
1.5
4.0
1.5
5.0
1.5
2.5
2.0
1.5
2.0
3.5
5.0
3.0
3.5
3.5
2.0
2.0
1.5
1.5
2.0
3.0
1.5
4.0
1.5
1.5
1.5
1.0
4.0
4.5
2.0
3.5
1.0
2.0
1.5
1.5
1.5
2.0
1.5
1.5
2.5
1.0
4.0
2.5
3.5
2.5
4.5
3.0
5.0
3.0
4.5
2.5
1.5
3.5
3.0
5.0
2.5
2.5
2.0
1.5
3.5
4.0
4.5
3.0
2.0
2.0
3.0
3.0
3.0
3.5
2.5
3.5
1.5
3.0
3.0
3.5
1.5
3.0
4.5
3.5
5.0
0.0
2.5
3.0
2.5
2.0
1.5
3.0
2.5
2.5
2.0
3.0
12.1%
9.4%
11.7%
13.1%
15.4%
6.6%
15.6%
10.6%
10.7%
10.5%
n.a.
11.8%
10.9%
13.4%
12.7%
12.8%
8.3%
n.a.
12.1%
14.0%
11.2%
13.5%
n.a.
13.5%
11.1%
n.a.
11.0%
11.0%
22.8%
10.6%
10.6%
15.6%
10.3%
n.a.
n.a.
11.0%
22.9%
15.6%
13.3%
13.2%
11.0%
10.8%
10.3%
10.7%
15.3%
11.6%
10.4%
9.2%
8.8%
12.9%
-3.3%
-26.3%
-70.4%
-69.9%
-76.2%
1.8%
-70.7%
-66.4%
-8.9%
L-P
-20.5%
-46.6%
-70.4%
n.a.
-24.1%
-61.0%
42.6%
-19.2%
-44.9%
-86.6%
-19.5%
-53.7%
44.7%
-60.9%
-32.5%
-67.9%
-48.3%
-44.0%
-27.7%
-80.7%
-21.3%
-37.2%
20.3%
14.0%
12.0%
220.6%
P-L
P-L
P-L
37.3%
8.8%
-16.7%
-4.6%
28.8%
33.1%
-57.3%
-1.2%
-31.6%
n.a.
P-L
0.7%
0.8%
0.1%
0.1%
0.8%
0.8%
0.1%
0.3%
1.1%
0.4%
0.9%
-0.1%
0.1%
n.a.
0.2%
0.0%
0.2%
1.7%
-0.6%
0.2%
0.3%
0.2%
0.5%
0.3%
0.3%
0.5%
0.1%
0.2%
1.6%
-0.4%
0.3%
0.9%
0.1%
0.7%
0.5%
0.1%
-0.7%
-1.0%
-0.1%
1.7%
0.3%
0.1%
0.4%
0.4%
0.4%
0.1%
0.4%
0.2%
n.a.
0.1%
50.7%
44.7%
56.8%
75.5%
56.1%
38.6%
60.5%
61.5%
47.4%
68.1%
42.1%
64.6%
46.7%
60.6%
71.5%
66.1%
47.8%
55.2%
58.4%
75.5%
65.3%
54.8%
38.5%
75.8%
57.9%
63.6%
63.2%
57.1%
74.8%
66.7%
53.9%
58.3%
76.5%
54.8%
57.8%
70.9%
n.a.
n.a.
99.2%
63.2%
79.0%
78.4%
48.7%
62.1%
78.5%
65.4%
51.0%
61.0%
63.2%
89.5%
13.1%
8.1%
3.8%
6.6%
11.9%
25.5%
31.3%
6.6%
2.0%
15.8%
34.6%
39.8%
20.0%
29.4%
18.3%
14.0%
2.8%
74.9%
55.7%
35.1%
2.4%
27.4%
n.a.
37.2%
n.a.
84.8%
10.4%
8.2%
55.0%
41.3%
21.8%
19.9%
12.5%
28.4%
26.2%
16.9%
n.a.
n.a.
38.7%
21.8%
20.2%
9.4%
27.2%
17.2%
25.3%
11.3%
28.8%
15.5%
15.5%
n.a.
160.0%
65.1%
40.2%
45.1%
71.4%
196.2%
133.3%
46.6%
160.0%
63.9%
n.a.
81.3%
37.4%
750.0%
31.6%
55.7%
44.9%
n.a.
43.8%
75.0%
141.7%
65.4%
74.2%
72.6%
47.2%
44.8%
36.1%
34.3%
47.2%
66.7%
n.a.
88.0%
35.5%
n.a.
n.a.
21.1%
83.3%
90.0%
45.0%
71.7%
26.7%
43.8%
33.2%
35.9%
n.a.
40.9%
39.1%
32.0%
58.1%
29.4%
1.0%
4.3%
2.2%
3.9%
0.7%
2.6%
0.3%
2.5%
0.5%
3.8%
n.a.
1.6%
3.3%
0.2%
3.6%
4.7%
6.9%
n.a.
1.6%
1.2%
0.7%
2.6%
6.2%
5.5%
3.0%
2.9%
2.7%
2.4%
3.6%
1.8%
n.a.
2.5%
3.0%
2.3%
n.a.
3.2%
0.6%
2.0%
0.2%
18.7%
3.8%
3.3%
3.8%
5.1%
n.a.
2.5%
3.8%
4.8%
5.3%
2.5%
2.41
2.41
2.41
2.41
2.41
2.40
2.40
2.40
2.40
2.40
2.40
2.39
2.39
2.39
2.39
2.36
2.36
2.36
2.35
2.35
2.35
2.34
2.34
2.34
2.30
2.29
2.28
2.26
2.25
2.25
2.23
2.23
2.21
2.20
2.19
2.19
2.18
2.16
2.15
2.15
2.15
2.15
2.14
2.14
2.13
2.13
2.13
2.13
2.11
2.11
Strength Rank 2009
AggregateStrength
Score 2009Score(7.5%)
Ratio
Non-interest IncomeScore(7.5%)
Change
Operating Profit Operating CostReturn on Assets (ROA)Score(10%)
Cost toIncomeRatio
NII to Total Operating Income (%)
Capital AdequacyScore(10%)
Total Score(7.5%)
Loan Loss CoverageLoan LossReserve toGross NPLs
Score(7.5%)
Loan QualityGross
NPL RatioScore(7.5%)
1.5
2.0
3.5
2.0
3.0
5.0
5.0
0.5
3.0
1.0
1.5
4.0
2.0
1.5
1.0
2.0
1.5
1.5
1.5
5.0
3.0
2.5
1.5
5.0
1.5
4.0
2.0
0.5
1.5
4.0
1.5
2.5
1.5
1.5
1.5
1.0
2.5
1.5
1.5
1.5
0.5
0.5
1.0
1.0
1.5
1.0
1.0
1.0
1.0
1.0
0.3%
0.6%
3.9%
0.7%
2.2%
29.5%
37.1%
0.0%
2.7%
0.1%
n.a.
9.2%
0.5%
n.a.
0.1%
0.5%
n.a.
n.a.
0.3%
31.0%
2.9%
1.3%
n.a.
39.2%
n.a.
6.1%
0.5%
0.0%
n.a.
9.1%
n.a.
1.5%
n.a.
n.a.
n.a.
0.1%
1.0%
n.a.
n.a.
0.3%
0.0%
0.0%
0.1%
0.1%
n.a.
0.1%
0.1%
0.1%
0.1%
0.1%
LiquidityLiquid Assetto Total Asset
Score(5%)
ABJ ISS-92(PG48-96).indd 67ABJ ISS-92(PG48-96).indd 67 8/28/09 1:10:38 AM8/28/09 1:10:38 AM
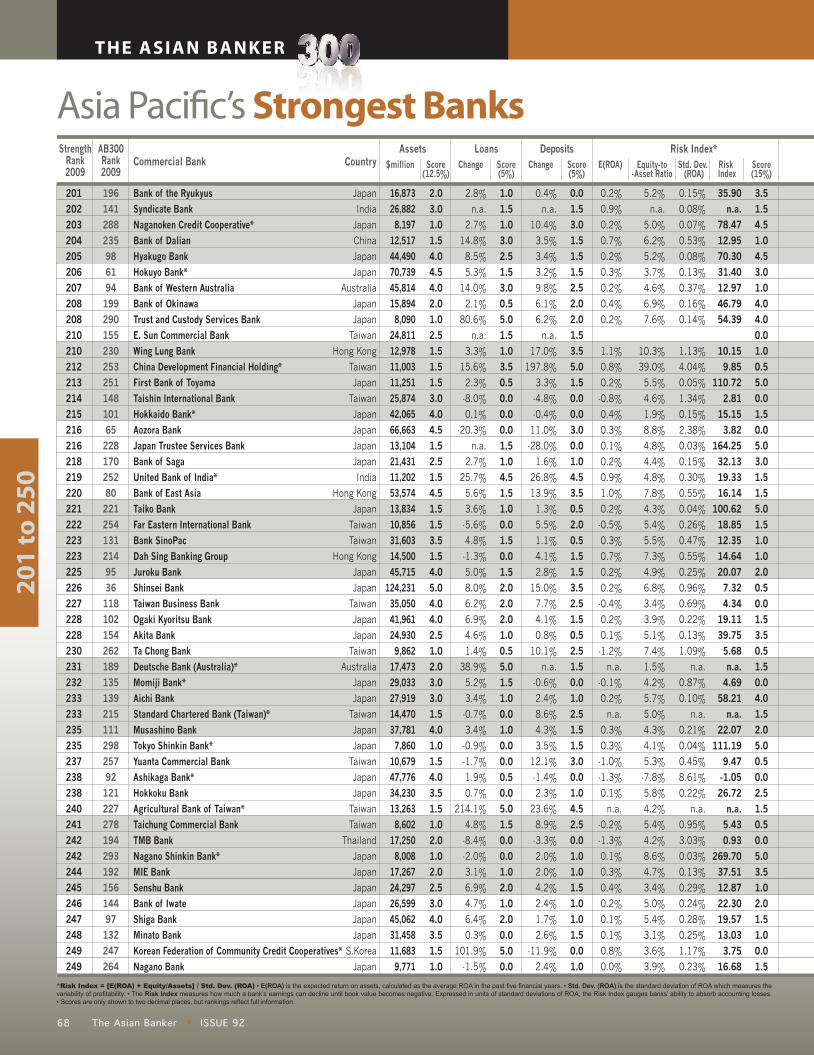
68 ISSUE 92The Asian Banker
THE ASIAN BANKER
Asia Pacifi c’s Strongest Banks
*Risk Index = [E(ROA) + Equity/Assets] / Std. Dev. (ROA) • E(ROA) is the expected return on assets, calculated as the average ROA in the past fi ve fi nancial years. • Std. Dev. (ROA) is the standard deviation of ROA which measures the variability of profi tability. • The Risk Index measures how much a bank’s earnings can decline until book value becomes negative. Expressed in units of standard deviations of ROA, the Risk Index gauges banks’ ability to absorb accounting losses. • Scores are only shown to two decimal places, but rankings refl ect full information.
20
1 t
o 2
50
201
202
203
204
205
206
207
208
208
210
210
212
213
214
215
216
216
218
219
220
221
222
223
223
225
226
227
228
228
230
231
232
233
233
235
235
237
238
238
240
241
242
242
244
245
246
247
248
249
249
Bank of the Ryukyus
Syndicate Bank
Naganoken Credit Cooperative*
Bank of Dalian
Hyakugo Bank
Hokuyo Bank*
Bank of Western Australia
Bank of Okinawa
Trust and Custody Services Bank
E. Sun Commercial Bank
Wing Lung Bank
China Development Financial Holding*
First Bank of Toyama
Taishin International Bank
Hokkaido Bank*
Aozora Bank
Japan Trustee Services Bank
Bank of Saga
United Bank of India*
Bank of East Asia
Taiko Bank
Far Eastern International Bank
Bank SinoPac
Dah Sing Banking Group
Juroku Bank
Shinsei Bank
Taiwan Business Bank
Ogaki Kyoritsu Bank
Akita Bank
Ta Chong Bank
Deutsche Bank (Australia)*
Momiji Bank*
Aichi Bank
Standard Chartered Bank (Taiwan)*
Musashino Bank
Tokyo Shinkin Bank*
Yuanta Commercial Bank
Ashikaga Bank*
Hokkoku Bank
Agricultural Bank of Taiwan*
Taichung Commercial Bank
TMB Bank
Nagano Shinkin Bank*
MIE Bank
Senshu Bank
Bank of Iwate
Shiga Bank
Minato Bank
Korean Federation of Community Credit Cooperatives*
Nagano Bank
16,873
26,882
8,197
12,517
44,490
70,739
45,814
15,894
8,090
24,811
12,978
11,003
11,251
25,874
42,065
66,663
13,104
21,431
11,202
53,574
13,834
10,856
31,603
14,500
45,715
124,231
35,050
41,961
24,930
9,862
17,473
29,033
27,919
14,470
37,781
7,860
10,679
47,776
34,230
13,263
8,602
17,250
8,008
17,267
24,297
26,599
45,062
31,458
11,683
9,771
2.0
3.0
1.0
1.5
4.0
4.5
4.0
2.0
1.0
2.5
1.5
1.5
1.5
3.0
4.0
4.5
1.5
2.5
1.5
4.5
1.5
1.5
3.5
1.5
4.0
5.0
4.0
4.0
2.5
1.0
2.0
3.0
3.0
1.5
4.0
1.0
1.5
4.0
3.5
1.5
1.0
2.0
1.0
2.0
2.5
3.0
4.0
3.5
1.5
1.0
2.8%
n.a.
2.7%
14.8%
8.5%
5.3%
14.0%
2.1%
80.6%
n.a.
3.3%
15.6%
2.3%
-8.0%
0.1%
-20.3%
n.a.
2.7%
25.7%
5.6%
3.6%
-5.6%
4.8%
-1.3%
5.0%
8.0%
6.2%
6.9%
4.6%
1.4%
38.9%
5.2%
3.4%
-0.7%
3.4%
-0.9%
-1.7%
1.9%
0.7%
214.1%
4.8%
-8.4%
-2.0%
3.1%
6.9%
4.7%
6.4%
0.3%
101.9%
-1.5%
0.4%
n.a.
10.4%
3.5%
3.4%
3.2%
9.8%
6.1%
6.2%
n.a.
17.0%
197.8%
3.3%
-4.8%
-0.4%
11.0%
-28.0%
1.6%
26.8%
13.9%
1.3%
5.5%
1.1%
4.1%
2.8%
15.0%
7.7%
4.1%
0.8%
10.1%
n.a.
-0.6%
2.4%
8.6%
4.3%
3.5%
12.1%
-1.4%
2.3%
23.6%
8.9%
-3.3%
2.0%
2.0%
4.2%
2.4%
1.7%
2.6%
-11.9%
2.4%
Japan
India
Japan
China
Japan
Japan
Australia
Japan
Japan
Taiwan
Hong Kong
Taiwan
Japan
Taiwan
Japan
Japan
Japan
Japan
India
Hong Kong
Japan
Taiwan
Taiwan
Hong Kong
Japan
Japan
Taiwan
Japan
Japan
Taiwan
Australia
Japan
Japan
Taiwan
Japan
Japan
Taiwan
Japan
Japan
Taiwan
Taiwan
Thailand
Japan
Japan
Japan
Japan
Japan
Japan
S.Korea
Japan
1.0
1.5
1.0
3.0
2.5
1.5
3.0
0.5
5.0
1.5
1.0
3.5
0.5
0.0
0.0
0.0
1.5
1.0
4.5
1.5
1.0
0.0
1.5
0.0
1.5
2.0
2.0
2.0
1.0
0.5
5.0
1.5
1.0
0.0
1.0
0.0
0.0
0.5
0.0
5.0
1.5
0.0
0.0
1.0
2.0
1.0
2.0
0.0
5.0
0.0
35.90
n.a.
78.47
12.95
70.30
31.40
12.97
46.79
54.39
10.15
9.85
110.72
2.81
15.15
3.82
164.25
32.13
19.33
16.14
100.62
18.85
12.35
14.64
20.07
7.32
4.34
19.11
39.75
5.68
n.a.
4.69
58.21
n.a.
22.07
111.19
9.47
-1.05
26.72
n.a.
5.43
0.93
269.70
37.51
12.87
22.30
19.57
13.03
3.75
16.68
3.5
1.5
4.5
1.0
4.5
3.0
1.0
4.0
4.0
0.0
1.0
0.5
5.0
0.0
1.5
0.0
5.0
3.0
1.5
1.5
5.0
1.5
1.0
1.0
2.0
0.5
0.0
1.5
3.5
0.5
1.5
0.0
4.0
1.5
2.0
5.0
0.5
0.0
2.5
1.5
0.5
0.0
5.0
3.5
1.0
2.0
1.5
1.0
0.0
1.5
0.0
1.5
3.0
1.5
1.5
1.5
2.5
2.0
2.0
1.5
3.5
5.0
1.5
0.0
0.0
3.0
0.0
1.0
4.5
3.5
0.5
2.0
0.5
1.5
1.5
3.5
2.5
1.5
0.5
2.5
1.5
0.0
1.0
2.5
1.5
1.5
3.0
0.0
1.0
4.5
2.5
0.0
1.0
1.0
1.5
1.0
1.0
1.5
0.0
1.0
0.2%
0.9%
0.2%
0.7%
0.2%
0.3%
0.2%
0.4%
0.2%
1.1%
0.8%
0.2%
-0.8%
0.4%
0.3%
0.1%
0.2%
0.9%
1.0%
0.2%
-0.5%
0.3%
0.7%
0.2%
0.2%
-0.4%
0.2%
0.1%
-1.2%
n.a.
-0.1%
0.2%
n.a.
0.3%
0.3%
-1.0%
-1.3%
0.1%
n.a.
-0.2%
-1.3%
0.1%
0.3%
0.4%
0.2%
0.1%
0.1%
0.8%
0.0%
5.2%
n.a.
5.0%
6.2%
5.2%
3.7%
4.6%
6.9%
7.6%
10.3%
39.0%
5.5%
4.6%
1.9%
8.8%
4.8%
4.4%
4.8%
7.8%
4.3%
5.4%
5.5%
7.3%
4.9%
6.8%
3.4%
3.9%
5.1%
7.4%
1.5%
4.2%
5.7%
5.0%
4.3%
4.1%
5.3%
-7.8%
5.8%
4.2%
5.4%
4.2%
8.6%
4.7%
3.4%
5.0%
5.4%
3.1%
3.6%
3.9%
0.15%
0.08%
0.07%
0.53%
0.08%
0.13%
0.37%
0.16%
0.14%
1.13%
4.04%
0.05%
1.34%
0.15%
2.38%
0.03%
0.15%
0.30%
0.55%
0.04%
0.26%
0.47%
0.55%
0.25%
0.96%
0.69%
0.22%
0.13%
1.09%
n.a.
0.87%
0.10%
n.a.
0.21%
0.04%
0.45%
8.61%
0.22%
n.a.
0.95%
3.03%
0.03%
0.13%
0.29%
0.24%
0.28%
0.25%
1.17%
0.23%
Strength Rank 2009
E(ROA)Commercial Bank Country Equity-to-Asset Ratio
Score(15%)
RiskIndex
Std. Dev. (ROA)
Score(12.5%)
$million
AssetsScore(5%)
Change
LoansScore(5%)
Change
Deposits Risk Index*
196
141
288
235
98
61
94
199
290
155
230
253
251
148
101
65
228
170
252
80
221
254
131
214
95
36
118
102
154
262
189
135
139
215
111
298
257
92
121
227
278
194
293
192
156
144
97
132
247
264
AB300 Rank 2009
ABJ ISS-92(PG48-96).indd 68ABJ ISS-92(PG48-96).indd 68 8/28/09 1:10:39 AM8/28/09 1:10:39 AM

69 ISSUE 92 The Asian Banker
201
202
203
204
205
206
207
208
208
210
210
212
213
214
215
216
216
218
219
220
221
222
223
223
225
226
227
228
228
230
231
232
233
233
235
235
237
238
238
240
241
242
242
244
245
246
247
248
249
249
2.0
3.0
1.5
2.5
2.5
1.5
3.0
3.0
5.0
2.5
3.5
1.5
4.0
2.5
2.5
3.0
5.0
2.5
1.5
3.5
3.0
2.5
2.5
3.5
2.5
1.5
2.0
2.0
3.0
3.0
1.5
1.5
3.0
1.5
2.5
1.5
3.0
0.0
3.5
1.5
2.0
3.5
1.5
2.5
2.5
3.5
2.5
2.0
1.5
2.0
5.0
0.5
5.0
0.0
0.0
0.0
0.0
0.0
0.0
1.5
0.0
0.0
0.0
0.0
0.0
0.0
0.0
0.0
1.0
0.0
0.0
0.0
0.0
0.0
0.0
0.0
0.0
0.0
0.0
0.0
0.0
5.0
0.0
0.0
0.0
1.5
0.0
0.0
0.0
1.5
0.0
5.0
0.0
0.0
0.0
0.0
0.0
0.0
5.0
5.0
0.5
2.0
0.5
3.5
0.5
1.0
0.0
0.5
1.0
0.5
0.0
5.0
0.5
0.0
1.0
0.0
0.5
0.5
1.5
0.5
0.5
0.0
0.0
0.5
0.0
0.0
0.5
0.0
0.0
0.0
1.5
1.0
0.5
0.0
0.0
1.0
0.0
3.5
0.0
0.5
0.5
0.5
0.5
0.5
0.0
0.0
0.0
0.0
3.0
0.5
1.0
3.5
1.0
5.0
0.0
2.0
2.0
1.5
0.0
5.0
0.0
3.0
0.0
2.0
3.0
1.5
0.0
1.0
1.5
0.0
0.5
0.5
0.0
1.0
1.0
0.0
2.5
1.0
0.0
1.0
0.0
1.0
0.5
2.0
1.0
1.0
0.0
3.5
1.0
1.0
3.0
1.0
2.0
0.0
1.5
0.0
0.0
2.0
0.0
1.0
1.0
2.5
0.5
1.0
0.5
0.5
2.5
1.0
1.0
1.5
1.5
2.0
1.5
4.5
3.0
1.5
1.0
1.5
3.5
1.5
1.5
4.0
1.5
3.0
1.5
1.5
1.5
1.5
1.5
3.5
3.0
1.5
0.5
5.0
1.5
1.0
1.5
2.5
1.0
1.5
0.5
3.0
1.5
1.0
1.5
1.5
1.0
2.5
1.5
1.5
2.0
1.5
1.5
2.0
1.5
2.0
1.5
2.5
1.5
1.5
5.0
1.5
2.0
5.0
2.0
3.5
1.5
2.5
1.5
1.5
1.5
4.5
4.5
4.0
2.5
3.0
2.0
2.5
2.5
5.0
1.5
3.0
0.5
2.0
1.5
1.5
5.0
2.0
1.5
1.5
5.0
3.0
1.0
1.5
2.5
1.5
2.0
2.0
1.5
2.0
3.5
1.5
2.5
1.5
3.0
3.0
1.5
3.0
1.5
4.5
5.0
2.0
3.0
4.0
2.5
2.5
1.5
3.0
1.5
1.5
2.5
3.5
4.0
3.5
2.5
2.5
3.5
3.0
2.5
3.5
1.5
2.5
2.5
3.5
3.0
2.0
4.0
2.5
2.5
1.5
4.0
0.0
1.5
3.5
3.5
3.0
3.5
2.5
1.5
2.0
9.8%
11.4%
n.a.
10.9%
11.0%
8.4%
11.1%
11.6%
48.1%
10.6%
13.8%
n.a.
14.5%
10.0%
10.2%
11.6%
35.6%
10.7%
n.a.
13.8%
11.4%
10.6%
11.0%
13.6%
10.1%
8.4%
9.7%
9.5%
11.7%
12.0%
n.a.
8.5%
11.2%
8.8%
10.2%
n.a.
11.3%
-11.7%
13.1%
8.9%
9.3%
13.9%
n.a.
10.6%
10.2%
12.8%
10.3%
9.4%
n.a.
9.0%
82.7%
2.0%
68.1%
-9.8%
-74.9%
-31.8%
P-L
-39.8%
-5.9%
n.a.
P-L
-44.0%
-88.5%
P-L
-6.7%
L-L
-63.2%
-74.6%
5.7%
P-L
-60.3%
L-L
L-L
-69.2%
-79.7%
P-L
-77.5%
-54.8%
P-L
L-L
L-L
L-P
-27.1%
L-L
P-L
13.2%
L-L
-4.7%
P-L
10.2%
-87.6%
L-P
P-L
-94.0%
-37.2%
P-L
L-L
P-L
L-P
L-P
0.2%
0.8%
0.1%
1.1%
0.1%
0.4%
-0.2%
0.2%
0.3%
0.1%
-0.8%
2.1%
0.2%
-0.4%
0.4%
-3.7%
0.0%
0.0%
0.7%
0.0%
0.1%
-0.7%
-0.3%
0.2%
-0.2%
-1.1%
0.0%
-0.2%
-0.1%
0.0%
0.5%
0.5%
0.1%
-0.1%
-0.1%
0.3%
-0.9%
1.2%
-0.3%
0.0%
0.1%
0.1%
0.1%
0.1%
0.0%
-0.2%
-0.4%
-0.3%
1.0%
0.1%
71.2%
49.6%
71.3%
29.4%
84.9%
61.7%
60.4%
65.2%
86.0%
150.1%
54.3%
82.2%
60.5%
53.2%
n.a.
97.6%
72.5%
65.9%
92.4%
79.6%
77.4%
91.0%
73.3%
74.1%
104.2%
59.9%
71.5%
86.1%
71.2%
220.9%
72.6%
76.7%
60.1%
71.5%
71.9%
116.7%
45.7%
74.9%
70.1%
54.4%
73.6%
64.2%
85.5%
69.6%
118.2%
81.7%
60.1%
88.5%
74.8%
9.8%
24.8%
4.3%
7.1%
4.8%
1.8%
22.0%
8.0%
92.5%
n.a.
n.a.
82.0%
n.a.
44.1%
26.2%
n.a.
92.1%
12.6%
34.0%
n.a.
n.a.
38.8%
n.a.
26.6%
11.9%
n.a.
11.9%
12.4%
n.a.
34.9%
28.1%
13.1%
4.9%
48.2%
n.a.
6.5%
n.a.
20.2%
9.4%
n.a.
3.4%
26.7%
11.1%
8.7%
13.9%
n.a.
6.0%
20.2%
n.a.
10.8%
41.1%
n.a.
37.8%
46.7%
37.5%
44.9%
n.a.
50.7%
n.a.
n.a.
200.0%
33.6%
46.3%
147.2%
42.7%
75.5%
n.a.
59.4%
n.a.
n.a.
33.4%
95.3%
94.0%
81.8%
51.0%
69.6%
48.7%
51.3%
50.0%
104.9%
n.a.
68.8%
18.7%
41.6%
31.6%
32.4%
176.3%
48.2%
34.2%
n.a.
102.9%
65.1%
29.4%
35.3%
58.4%
37.8%
43.8%
44.9%
n.a.
49.9%
1.8%
n.a.
3.7%
7.5%
3.2%
3.3%
n.a.
2.7%
n.a.
0.9%
0.2%
7.2%
3.1%
1.3%
3.8%
4.9%
n.a.
3.5%
n.a.
n.a.
3.9%
1.5%
1.2%
1.7%
3.9%
4.6%
1.9%
3.5%
4.7%
1.8%
n.a.
4.8%
3.6%
1.8%
2.9%
7.0%
1.4%
4.5%
4.5%
n.a.
1.4%
16.5%
9.7%
2.4%
2.0%
2.9%
2.2%
3.8%
n.a.
5.3%
2.10
2.08
2.08
2.06
2.06
2.05
2.04
2.03
2.03
2.00
2.00
2.00
1.99
1.96
1.96
1.93
1.93
1.93
1.91
1.89
1.89
1.86
1.84
1.84
1.81
1.80
1.79
1.78
1.78
1.78
1.76
1.75
1.75
1.75
1.75
1.75
1.73
1.71
1.71
1.70
1.70
1.69
1.69
1.69
1.68
1.65
1.64
1.61
1.60
1.60
Strength Rank 2009
AggregateStrength
Score 2009Score(7.5%)
Ratio
Non-interest IncomeScore(7.5%)
Change
Operating Profit Operating CostReturn on Assets (ROA)Score(10%)
Cost toIncomeRatio
NII to Total Operating Income (%)
Capital AdequacyScore(10%)
Total Score(7.5%)
Loan Loss CoverageLoan LossReserve toGross NPLs
Score(7.5%)
Loan QualityGross
NPL RatioScore(7.5%)
1.5
1.5
1.5
3.0
0.5
1.0
4.0
1.5
1.5
1.5
4.5
1.5
0.5
2.5
1.0
4.0
1.5
3.0
1.5
2.5
1.5
3.0
3.0
3.0
0.5
3.0
1.0
1.0
1.5
2.5
5.0
1.5
0.5
1.5
0.5
0.5
4.5
1.0
0.5
1.5
1.0
2.5
1.5
1.5
1.5
1.5
0.5
0.5
1.5
1.5
n.a.
n.a.
n.a.
2.0%
0.0%
0.1%
8.7%
n.a.
n.a.
n.a.
14.1%
n.a.
0.0%
0.8%
0.1%
6.2%
n.a.
3.4%
n.a.
1.4%
n.a.
1.9%
3.2%
2.2%
0.0%
3.3%
0.1%
0.1%
n.a.
1.5%
51.8%
n.a.
0.0%
n.a.
0.0%
0.0%
11.4%
0.1%
0.0%
n.a.
0.1%
0.8%
n.a.
n.a.
n.a.
n.a.
0.0%
0.0%
n.a.
n.a.
LiquidityLiquid Assetto Total Asset
Score(5%)
ABJ ISS-92(PG48-96).indd 69ABJ ISS-92(PG48-96).indd 69 8/28/09 1:10:40 AM8/28/09 1:10:40 AM

70 ISSUE 92The Asian Banker
THE ASIAN BANKER
Asia Pacifi c’s Strongest Banks
*Risk Index = [E(ROA) + Equity/Assets] / Std. Dev. (ROA) • E(ROA) is the expected return on assets, calculated as the average ROA in the past fi ve fi nancial years. • Std. Dev. (ROA) is the standard deviation of ROA which measures the variability of profi tability. • The Risk Index measures how much a bank’s earnings can decline until book value becomes negative. Expressed in units of standard deviations of ROA, the Risk Index gauges banks’ ability to absorb accounting losses. • Scores are only shown to two decimal places, but rankings refl ect full information.
25
1 t
o 3
00
251
252
253
254
255
256
257
258
258
260
261
262
263
264
265
266
267
268
268
268
271
272
273
274
274
276
277
278
279
279
279
279
283
284
284
286
286
286
289
289
291
292
293
294
295
296
297
298
299
300
Nanto Bank
Yachiyo Bank*
Suhyup Bank
Yamagata Bank
Kiyo Bank
Kansai Urban Banking Corporation
Taiwan Shin Kong Commercial Bank
Sapporo Hokuyo Holdings
Tottori Bank
EnTie Commercial Bank
Tokyo Star Bank
Sendai Bank
Tomato Bank
Tochigi Bank
Fukui Bank
Chukyo Bank
Saikyo Bank
Eighteenth Bank
Chiba Kogyo Bank
Shinwa Bank
Hokuetsu Bank
Oita Bank
eBANK*
Higashi-Nippon Bank
Ehime Bank
Miyazaki Bank
Miura Fujisawa Shinkin Bank*
Bank of Ikeda
Kagawa Bank
Kita-Nippon Bank
Kumamoto Family Bank
Union Bank of Taiwan
Tokyo Tomin Bank
Tokushima Bank
Biwako Bank*
Shikoku Bank
Aomori Bank
Kirayaka Bank
Shimizu Bank
Shimizu Bank
Daisan Bank
Ibarakiken Credit Cooperative*
Michinoku Bank
Takinogawa Shinkin Bank*
Kanto Tsukuba Bank
Hokuto Bank
Towa Bank
Gifu Bank
Ibaraki Bank
Bank of Kochi
50,522
23,080
15,818
20,312
37,498
37,796
12,161
79,006
9,029
8,429
19,303
8,394
9,357
26,008
23,505
18,177
8,058
25,687
23,341
22,349
23,949
28,613
8,933
19,603
18,105
20,383
7,968
27,825
13,806
12,901
12,885
10,788
26,543
13,058
12,016
26,645
23,603
12,466
14,642
10,109
19,036
11,974
19,977
7,889
14,057
11,802
18,727
8,593
8,343
9,741
4.5
2.5
2.0
2.5
4.0
4.0
1.5
4.5
1.0
1.0
2.0
1.0
1.0
3.0
2.5
2.0
1.0
3.0
2.5
2.5
2.5
3.0
1.0
2.0
2.0
2.5
1.0
3.0
1.5
1.5
1.5
1.5
3.0
1.5
1.5
3.0
2.5
1.5
1.5
1.5
2.0
1.5
2.0
1.0
1.5
1.5
2.0
1.0
1.0
1.0
6.7%
0.3%
11.0%
9.9%
5.6%
0.2%
1.3%
2.7%
2.2%
-2.2%
-2.4%
2.8%
2.2%
3.2%
0.1%
0.1%
-0.4%
-4.8%
4.8%
-10.2%
10.5%
0.9%
n.a.
-2.2%
-0.9%
0.1%
1.5%
3.9%
0.6%
2.1%
-4.9%
-12.5%
-0.2%
3.3%
0.3%
3.2%
1.7%
0.8%
2.9%
9.5%
2.3%
-1.1%
0.2%
1.5%
2.4%
-3.4%
1.2%
-2.1%
1.8%
-4.8%
1.2%
2.8%
9.3%
3.8%
-0.4%
3.1%
9.3%
0.6%
3.1%
3.7%
-5.5%
2.6%
1.3%
1.6%
1.5%
1.1%
0.2%
0.3%
2.1%
-3.8%
1.0%
1.3%
57.4%
-1.1%
0.1%
2.1%
2.2%
2.8%
2.8%
2.1%
-3.8%
5.2%
0.5%
3.1%
1.4%
1.1%
1.9%
-1.5%
0.8%
2.9%
2.0%
0.8%
-0.6%
-0.6%
-1.2%
-1.7%
-1.7%
-4.6%
2.0%
-2.7%
Japan
Japan
S.Korea
Japan
Japan
Japan
Taiwan
Japan
Japan
Taiwan
Japan
Japan
Japan
Japan
Japan
Japan
Japan
Japan
Japan
Japan
Japan
Japan
Japan
Japan
Japan
Japan
Japan
Japan
Japan
Japan
Japan
Taiwan
Japan
Japan
Japan
Japan
Japan
Japan
Japan
Japan
Japan
Japan
Japan
Japan
Japan
Japan
Japan
Japan
Japan
Japan
2.0
0.0
2.5
2.5
1.5
0.0
0.5
1.0
0.5
0.0
0.0
1.0
0.5
1.0
0.0
0.0
0.0
0.0
1.5
0.0
2.5
0.0
1.5
0.0
0.0
0.0
0.5
1.0
0.0
0.5
0.0
0.0
0.0
1.0
0.0
1.0
0.5
0.0
1.0
2.5
0.5
0.0
0.0
0.5
0.5
0.0
0.5
0.0
0.5
0.0
12.45
34.69
11.77
19.20
14.51
7.43
3.29
1.98
29.62
1.62
14.18
10.98
28.20
12.74
16.47
23.11
6.58
8.30
15.06
1.25
10.58
7.81
0.40
14.38
24.13
5.25
31.57
1.56
19.33
12.88
1.80
3.69
9.24
12.82
-0.20
6.38
8.51
7.06
12.85
6.29
2.28
13.12
3.11
0.32
4.22
1.65
2.69
6.66
7.50
5.18
1.0
3.0
1.0
1.5
1.0
0.5
0.0
0.0
2.5
0.0
1.0
1.0
2.5
1.0
1.5
2.0
0.5
0.5
1.5
0.0
1.0
0.5
0.0
1.0
2.0
0.5
3.0
0.0
1.5
1.0
0.0
0.0
0.5
1.0
0.0
0.5
0.5
0.5
1.0
0.5
0.0
1.0
0.0
0.0
0.0
0.0
0.0
0.5
0.5
0.5
0.5
1.5
2.5
1.5
0.0
1.5
2.5
0.0
1.5
1.5
0.0
1.5
0.5
1.0
1.0
0.5
0.0
0.0
1.0
0.0
0.5
0.5
5.0
0.0
0.0
1.0
1.0
1.5
1.5
1.0
0.0
2.0
0.0
1.5
0.5
0.5
1.0
0.0
0.5
1.5
1.0
0.5
0.0
0.0
0.0
0.0
0.0
0.0
1.0
0.0
0.0%
0.3%
0.7%
0.2%
0.1%
0.1%
-0.6%
-0.3%
0.1%
-3.2%
0.8%
0.1%
0.0%
0.1%
0.1%
0.2%
-0.1%
-0.1%
0.2%
-1.6%
0.1%
0.1%
-1.1%
0.2%
0.1%
-0.1%
0.1%
-0.6%
0.0%
0.1%
-1.0%
-0.4%
0.2%
0.0%
-0.5%
0.0%
0.0%
-0.3%
-0.1%
0.0%
-0.2%
0.0%
-0.5%
-0.7%
-0.2%
-0.3%
-0.3%
0.1%
0.1%
-0.2%
3.5%
4.7%
3.9%
5.2%
3.1%
3.4%
5.1%
3.3%
3.2%
6.5%
5.8%
2.1%
3.8%
4.3%
4.7%
4.6%
2.8%
3.9%
5.0%
4.2%
2.9%
4.1%
1.9%
5.5%
4.4%
3.4%
2.9%
2.3%
5.9%
4.1%
4.5%
3.7%
3.2%
4.8%
0.1%
3.2%
3.1%
2.8%
4.6%
3.1%
2.0%
4.0%
2.6%
1.6%
2.4%
1.6%
2.2%
3.1%
2.1%
3.1%
0.29%
0.14%
0.39%
0.28%
0.22%
0.48%
1.38%
1.50%
0.11%
2.08%
0.47%
0.20%
0.14%
0.34%
0.29%
0.21%
0.41%
0.45%
0.34%
2.03%
0.28%
0.54%
2.07%
0.40%
0.19%
0.63%
0.10%
1.09%
0.31%
0.32%
1.96%
0.88%
0.36%
0.38%
1.63%
0.50%
0.37%
0.36%
0.35%
0.50%
0.79%
0.30%
0.67%
2.66%
0.53%
0.79%
0.72%
0.47%
0.30%
0.55%
Strength Rank 2009
E(ROA)Commercial Bank Country Equity-to-Asset Ratio
Score(15%)
RiskIndex
Std. Dev. (ROA)
Score(12.5%)
$million
AssetsScore(5%)
Change
LoansScore(5%)
Change
Deposits Risk Index*
86
163
200
176
112
110
240
54
274
282
180
283
269
146
160
186
291
149
161
169
158
136
276
179
187
175
295
140
223
231
232
256
145
229
243
143
159
237
210
260
182
244
178
297
219
246
184
279
285
265
AB300 Rank 2009
ABJ ISS-92(PG48-96).indd 70ABJ ISS-92(PG48-96).indd 70 8/28/09 1:10:41 AM8/28/09 1:10:41 AM

71 ISSUE 92 The Asian Banker
251
252
253
254
255
256
257
258
258
260
261
262
263
264
265
266
267
268
268
268
271
272
273
274
274
276
277
278
279
279
279
279
283
284
284
286
286
286
289
289
291
292
293
294
295
296
297
298
299
300
2.5
3.0
1.5
3.5
2.5
2.5
2.5
2.0
3.0
3.0
2.0
1.5
2.0
2.5
2.5
2.5
3.0
2.5
2.0
2.5
2.0
2.0
2.5
2.5
2.0
2.0
1.5
2.0
2.0
2.0
2.0
1.5
2.5
1.5
2.0
1.5
2.5
1.5
2.0
1.5
1.0
1.5
1.5
1.5
1.5
1.5
1.0
1.5
1.0
1.0
0.0
0.0
0.0
0.0
0.5
0.0
0.0
0.0
0.0
0.0
0.0
5.0
1.5
0.0
0.0
0.0
5.0
0.0
0.0
5.0
0.0
0.0
0.0
0.0
0.0
0.0
0.0
0.0
0.0
0.0
5.0
0.0
0.0
0.0
0.0
0.0
0.0
5.0
0.0
0.0
0.0
0.0
0.0
0.0
0.0
0.0
0.0
0.0
0.0
0.0
0.0
1.0
0.5
0.0
0.5
0.0
0.5
0.0
0.0
0.0
0.5
0.5
0.5
0.0
0.0
0.0
0.5
0.0
0.0
0.0
0.0
0.0
0.0
0.0
0.0
0.0
0.5
0.0
0.0
0.0
0.5
0.0
0.0
0.0
0.5
0.0
0.0
0.0
0.0
0.0
0.0
0.0
0.0
0.0
0.0
0.0
0.0
0.0
0.0
0.0
0.0
0.5
2.5
0.0
1.0
2.5
1.0
1.5
0.0
0.0
2.0
0.0
0.5
0.0
1.0
0.5
0.0
0.0
0.0
0.0
0.0
1.0
1.5
1.5
1.0
0.0
1.0
0.0
0.0
0.5
0.5
0.0
0.0
0.5
0.5
0.0
0.0
0.0
0.0
0.0
0.0
1.5
0.0
1.5
0.0
0.0
0.5
0.0
0.0
0.0
1.5
1.0
1.5
1.5
1.5
1.0
2.5
1.5
1.5
3.0
2.5
1.5
1.5
1.5
1.5
1.0
0.5
2.0
1.5
1.5
1.5
1.5
1.5
1.0
1.0
1.5
1.0
1.5
1.5
1.5
0.5
1.5
2.0
1.5
2.0
1.5
1.5
0.5
1.5
1.5
1.5
0.5
1.5
1.5
1.5
1.5
1.0
1.5
0.5
0.5
1.5
1.0
1.5
1.5
1.5
1.0
3.5
2.5
2.0
5.0
2.5
1.0
1.5
2.0
1.5
2.5
2.0
3.0
1.5
1.5
1.5
3.0
1.5
2.0
1.5
2.5
0.5
2.0
2.5
2.0
1.5
3.0
2.0
2.0
2.5
1.5
1.0
1.5
2.0
1.5
2.5
1.5
2.5
0.5
2.0
2.0
1.0
1.5
1.5
2.5
3.0
2.0
1.5
3.0
1.5
2.0
3.5
2.5
3.5
3.5
2.0
2.5
2.5
3.0
2.5
2.5
2.5
2.0
2.5
1.5
3.0
2.0
1.5
2.0
2.5
3.0
2.0
3.0
2.0
2.5
1.5
3.5
2.0
2.5
3.0
2.5
2.5
2.0
2.5
3.0
3.0
1.0
2.5
2.5
2.0
2.0
1.5
2.0
2.0
1.5
10.1%
11.6%
n.a.
13.0%
10.5%
10.2%
10.6%
9.8%
12.0%
11.7%
9.0%
9.0%
9.6%
10.0%
11.0%
10.5%
11.3%
10.7%
9.5%
10.1%
9.4%
9.2%
10.9%
10.7%
9.2%
9.7%
n.a.
9.4%
9.8%
9.7%
9.2%
8.5%
10.2%
8.8%
9.6%
8.7%
10.8%
8.7%
9.5%
8.9%
7.4%
n.a.
8.8%
n.a.
8.2%
8.4%
7.4%
8.5%
7.8%
7.8%
P-L
-21.4%
-76.8%
P-L
2.3%
P-L
-82.5%
P-L
P-L
L-L
-47.6%
L-P
14.4%
P-L
P-L
P-L
L-P
L-L
P-L
L-P
P-L
P-L
L-L
P-L
-31.2%
L-L
-68.2%
L-L
L-L
P-L
L-P
L-L
P-L
P-L
-21.2%
P-L
P-L
L-P
-75.1%
P-L
P-L
L-L
P-L
P-L
P-L
L-L
P-L
P-L
-11.7%
L-L
-0.5%
0.4%
0.0%
-0.3%
0.1%
-0.7%
0.1%
-3.0%
-0.1%
-2.0%
0.0%
0.0%
0.0%
-0.5%
-0.4%
-0.1%
0.2%
-0.6%
-0.4%
-0.1%
-0.4%
-0.9%
-3.5%
-0.5%
-0.2%
-1.2%
0.1%
-1.5%
-0.4%
-0.5%
0.1%
-0.4%
-0.5%
-0.6%
0.2%
-0.9%
-0.6%
-0.4%
-0.5%
-0.9%
-1.6%
-0.5%
-1.5%
-5.5%
-0.8%
-1.7%
-0.2%
-0.7%
0.0%
-0.9%
93.7%
75.0%
58.1%
144.7%
71.9%
56.1%
73.2%
n.a.
108.6%
135.2%
61.1%
96.8%
76.1%
101.7%
73.5%
78.5%
81.1%
80.1%
93.7%
91.0%
98.9%
70.6%
n.a.
66.7%
70.7%
117.2%
73.9%
94.0%
82.2%
78.5%
78.7%
88.1%
85.6%
77.4%
77.8%
137.1%
98.4%
86.6%
82.1%
108.0%
120.3%
65.8%
114.6%
n.a.
113.0%
137.9%
79.4%
98.5%
83.5%
84.8%
n.a.
8.9%
10.2%
n.a.
n.a.
9.2%
23.9%
n.a.
n.a.
27.2%
24.0%
n.a.
10.6%
n.a.
14.5%
5.0%
1.3%
17.6%
n.a.
n.a.
n.a.
12.0%
n.a.
5.2%
9.8%
n.a.
6.9%
n.a.
n.a.
n.a.
4.0%
n.a.
19.9%
n.a.
17.3%
n.a.
n.a.
3.5%
13.9%
n.a.
n.a.
1.5%
n.a.
n.a.
n.a.
n.a.
8.1%
n.a.
2.0%
1.1%
37.9%
23.0%
n.a.
38.6%
n.a.
26.5%
78.0%
56.2%
42.4%
101.1%
50.4%
21.0%
36.3%
49.2%
35.6%
52.5%
43.4%
60.4%
36.0%
n.a.
31.2%
65.2%
n.a.
44.1%
33.8%
54.0%
15.2%
41.7%
51.5%
41.5%
n.a.
63.3%
45.5%
47.3%
53.3%
32.2%
28.3%
37.9%
47.3%
32.8%
57.7%
33.3%
54.4%
10.9%
41.5%
40.2%
25.3%
31.9%
37.4%
51.2%
3.4%
5.3%
n.a.
2.8%
n.a.
5.5%
1.6%
4.1%
2.4%
1.9%
5.7%
4.7%
3.9%
3.1%
4.1%
4.3%
4.2%
6.0%
3.7%
n.a.
3.1%
5.4%
n.a.
6.4%
4.0%
3.5%
7.4%
2.7%
6.2%
3.9%
n.a.
2.5%
5.4%
4.6%
3.4%
3.7%
3.8%
6.7%
3.5%
3.5%
2.7%
11.1%
4.7%
4.4%
5.8%
6.6%
8.5%
5.7%
5.6%
7.8%
1.59
1.59
1.58
1.56
1.56
1.53
1.51
1.50
1.50
1.44
1.44
1.41
1.39
1.39
1.38
1.35
1.31
1.30
1.30
1.30
1.29
1.29
1.26
1.25
1.25
1.24
1.23
1.21
1.19
1.19
1.19
1.19
1.18
1.14
1.14
1.11
1.11
1.11
1.09
1.09
1.00
0.96
0.91
0.86
0.80
0.78
0.76
0.75
0.73
0.71
Strength Rank 2009
AggregateStrength
Score 2009Score(7.5%)
Ratio
Non-interest IncomeScore(7.5%)
Change
Operating Profit Operating CostReturn on Assets (ROA)Score(10%)
Cost toIncomeRatio
NII to Total Operating Income (%)
Capital AdequacyScore(10%)
Total Score(7.5%)
Loan Loss CoverageLoan LossReserve toGross NPLs
Score(7.5%)
Loan QualityGross
NPL RatioScore(7.5%)
1.0
0.5
3.0
0.5
1.5
1.5
1.5
1.0
1.5
1.5
1.5
1.5
0.5
0.5
0.5
0.5
0.5
1.5
0.5
0.5
0.5
0.5
1.5
1.5
0.5
1.5
0.5
0.5
1.0
1.5
1.5
3.0
0.5
0.5
1.5
0.5
0.5
0.5
0.5
0.5
1.0
1.5
0.5
1.5
0.5
0.5
1.5
0.5
1.0
1.5
0.1%
0.0%
1.8%
0.0%
0.2%
n.a.
n.a.
0.1%
n.a.
n.a.
n.a.
n.a.
0.0%
0.0%
0.0%
0.0%
0.0%
n.a.
0.0%
0.0%
0.0%
0.0%
n.a.
n.a.
0.0%
n.a.
0.0%
0.0%
0.1%
n.a.
n.a.
2.0%
0.0%
0.0%
n.a.
0.0%
0.0%
0.0%
0.0%
0.0%
0.1%
n.a.
0.0%
n.a.
0.0%
0.0%
n.a.
0.0%
0.1%
0.2%
LiquidityLiquid Assetto Total Asset
Score(5%)
ABJ ISS-92(PG48-96).indd 71ABJ ISS-92(PG48-96).indd 71 8/28/09 1:10:43 AM8/28/09 1:10:43 AM

THE ASIAN BANKER
72 ISSUE 92The Asian Banker
Country Capsules
0
0.2
0.4
0.6
0.8
1.0
1.2
2006 2007 2008 March 2009*
Gro
ss N
PL
rati
o (%
)
NAB
CBA
ANZ
WBC
11040519
1765411420732100
12345678910
National Australia BankCommonwealth Bank of AustraliaAustralia and New Zealand Banking GroupWestpac Banking CorporationMacquarie GroupSt George BankSuncorp-MetwayBank of Western AustraliaBendigo and Adelaide BankING Bank (Australia)
Commercial BankRank Strength Rank 2009
455,030337,790326,325304,608103,327102,10565,24045,81433,27033,262
1,9283,3412,2732,674
621814383-96119126
8.9%19.9%13.9%20.7%9.0%
17.7%4.5%-5.0%7.3%9.4%
0.5%1.0%0.8%1.0%0.5%0.9%0.6%
-0.2%0.4%0.4%
10.9%11.6%11.1%10.8%
n.a.10.4%10.4%11.1%10.4%12.8%
0.6%0.2%0.5%0.4%2.9%0.2%0.7%n.a.
0.1%0.7%
Net Profit($m) ROA ROE CAR
(Total)Assets($m)
Gross NPLRatio
AB300Rank 2009
10 13 14 15 43 44 67 94 125 126
AustraliaAustralia: 13 banks in the AB300. Total assets: $1,858.4 bn. Total net profi t: $12.5 bn
Source: Asian Banker Research
Although Australia’s golden age of banking of-
ficially ended last December when bank lending
felt its first month-on-month contraction since 1992,
its banks have weathered the storm remarkably well.
The Big Four Australian banks are firmly placed within
the top 13 ranks in The Asian Banker 300 (AB300)
ranking for biggest regional profits.
However, that does not mean that they have been
left completely unscathed by the credit crunch—the
banks’ ROA fell in 2008 to 0.61% from an average of
1.9% a year earlier, and ROE also fell to 10.84% from
an overall average of 13.74% in the same period. Again,
this can be attributed to the fall in net profit through a
surge in credit impairment charges, which trebled to
$6.8 billion in 2008, from $2.4 billion in 2007. Most
of the country’s banks managed to maintain profits,
although NAB’s 0.9% dip in annual earnings broke Aus-
tralian banks’ 15-year profit growth streak. That was
followed in December with a $139 million loss at Bank
of Western Australia; once an aggressively expanding
financial institution, loan impairment expenses of
$570 million took its toll on the HBOS-owned bank in
2008, and it was sold off to Commonwealth Bank of
Australia at the end of 2008.
The merger between Westpac Banking Corpora-
tion (Westpac) and St George Bank on December 1st,
2008 has led to the establishment of Australia’s sec-
ond largest entity by assets, and has led to pressure
on the other Big Four banks to acquire and maintain
their market dominance, although acquisition targets
remain scarce. Bendigo Bank and Bank of Adelaide
completed their merger a day before Westpac’s, to
become Bendigo and Adelaide Bank, the number 125
in the AB300 with assets of $330 billion (they had
been at positions 200 and 134, respectively, in the
previous year’s AB300).
The banks, in particular the Big Four, engaged in
continuous debt issuance for capital raising through-
Australia: the rocky ride is not over yet
NPLs are growing sharply, especially at NAB and ANZ
Source: The Asian Banker Research, Bankscope* June data for Commonwealth Bank of Australia
ABJ ISS-92(PG48-96).indd 72ABJ ISS-92(PG48-96).indd 72 8/28/09 1:10:44 AM8/28/09 1:10:44 AM

73 ISSUE 92 The Asian Banker
out the fiscal year, and since the beginning of 2008
Australia’s banks have held over 50 capital raising ex-
ercises, of both equity and debt, with the latter being
the more common method. But despite the frequency,
volumes were typically low in 2008 with the majority
of the exercises being small, frequent bond issuances,
often of only a few million dollars. The slow pace
continued into 2009, but eventually gathered pace
when NAB successfully raised $2.25 billion in July in
an underwritten share placement, while ANZ raised $2
billion in May. In both cases it seems that the capital
raising was conducted primarily to improve market
share in SME business lending, with the banks feeling
the pressure from the merger between Westpac and
St George, although ANZ eventually used $550 million
in August 2009 to buy The Royal Bank of Scotland’s
operations in six Asian markets.
The Australian banks have historically had the
lowest NPLs in the region, and the trend continued
throughout 2008 with four banks, Bendigo and Ad-
elaide Bank, Bank of Queensland, Commonwealth
Bank of Australia and St George Bank occupying
the top four places in the AB300’s gross NPL ratio
ranking, with figures of 0.1%, 0.1%, 0.2% and 0.2%
respectively. This occurred despite the average gross
NPL ratio more than trebling during the period of the
fiscal year, from 0.25% in 2007 to 0.79% in 2008,
meaning that some large banks have been hit with a
wave of bad loans. Recent figures for NAB, ANZ and
Westpac show that NPLs moved up 0.4%, 0.6% and
0.4% to 1%, 1.1% and 0.8% respectively, signalling
the clear start of a worrying trend. NPL provisions
have also been steadily rising throughout the year,
with NAB announcing $574.3 million in provisions in
July to cover credit losses and ANZ announcing $678.2
million worth of provisions to cover bad debt losses.
The Australian banks currently have a lot of re-
serves due to the capital raised throughout the year.
The average capital adequacy ratios across the banks
have risen to 12.26% in 2008 from 11.86% a year
earlier. Perhaps what will determine the performance
of the Australian banks next year will be how they put
this capital to use, and whether they actually lend or
acquire, or just sit on their capital.
26101523133144764620
12345678910
Industrial and Commercial Bank of ChinaChina Construction BankAgricultural Bank of ChinaBank of ChinaBank of CommunicationsChina Merchants BankShanghai Pudong Development BankChina CITIC BankChina Minsheng Banking CorporationIndustrial Bank
Commercial BankRank Strength Rank 2009
1,427,6101,105,4711,026,3001,017,130
392,554229,976191,588173,844153,651149,372
16,27413,5557,5289,6414,1683,0651,8311,9541,1461,666
19.2%20.3%
n.a.14.0%20.2%27.9%35.9%14.8%14.8%25.9%
1.2%1.3%0.8%1.0%1.2%1.5%1.2%1.2%0.8%1.2%
13.0%12.2%9.4%
13.4%13.5%11.3%9.1%
14.3%9.2%
11.3%
2.0%2.2%4.3%2.7%1.9%1.1%1.2%1.4%1.2%0.8%
Net Profit($m) ROA ROE CAR
(Total)Assets($m)
Gross NPLRatio
AB300Rank 2009
3 5 6 7 12 20 23 25 27 28
ChinaChina: 37 banks in the AB300. Total assets: $6,697.2 bn. Total net profi ts: $66.9 bn
Source: Asian Banker Research
As many of the world’s financial institutions
scramble for survival in the midst of a lingering
financial crisis, Chinese banks have over the last year
emerged as some of the world’s strongest and most
profitable. In total, 37 of the 300 largest banks by
assets in the Asia Pacific region were from China,
including the six in the top 20 that registered growth
between 12% and 43%. At the head of the pack was
Industrial and Commercial Bank of China (ICBC),
whose assets stood at $1.42 trillion, a 12.4% year-
on-year increase that solidified its third place position
overall in the region. China Construction Bank (CCB)
meanwhile ranked 5th, Agricultural Bank of China
(ABC) 6th, Bank of China (BOC) 7th, Bank of Com-
munications (BoComm) 12th and China Merchants
Bank (CMB) 20th.
China: Pushing the envelope
ABJ ISS-92(PG48-96).indd 73ABJ ISS-92(PG48-96).indd 73 8/28/09 1:10:47 AM8/28/09 1:10:47 AM
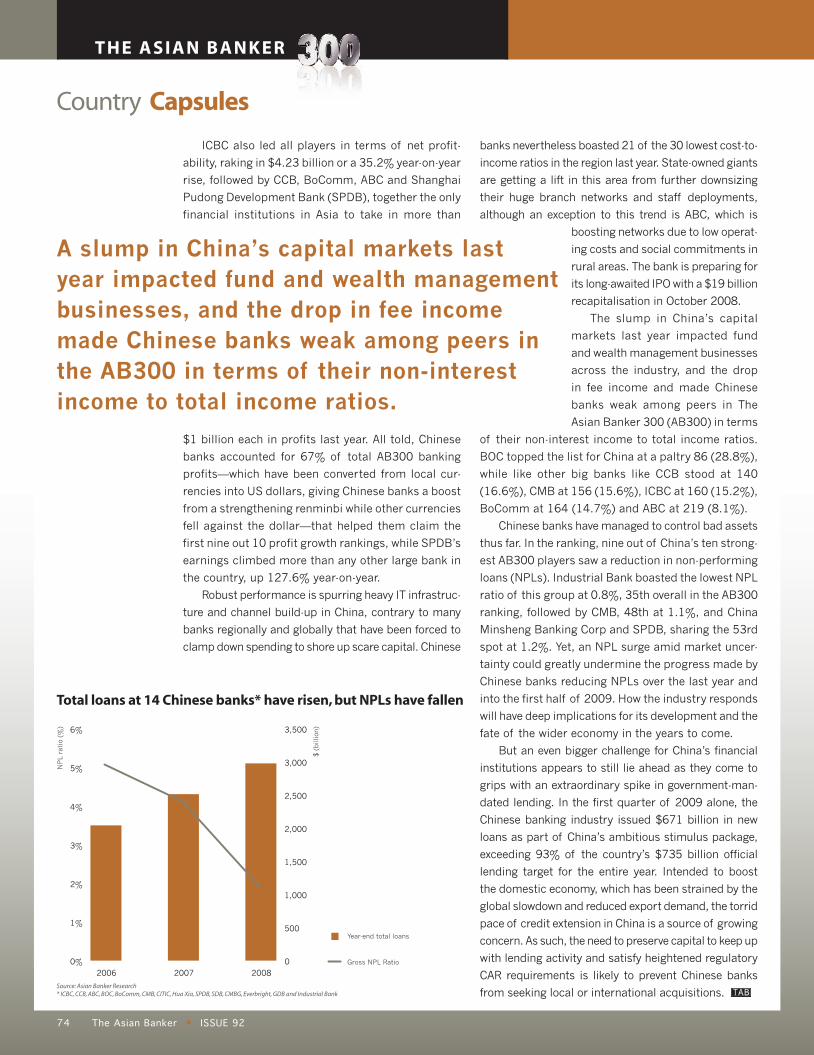
THE ASIAN BANKER
74 ISSUE 92The Asian Banker
Country Capsules
ICBC also led all players in terms of net profit-
ability, raking in $4.23 billion or a 35.2% year-on-year
rise, followed by CCB, BoComm, ABC and Shanghai
Pudong Development Bank (SPDB), together the only
financial institutions in Asia to take in more than
$1 billion each in profits last year. All told, Chinese
banks accounted for 67% of total AB300 banking
profits—which have been converted from local cur-
rencies into US dollars, giving Chinese banks a boost
from a strengthening renminbi while other currencies
fell against the dollar—that helped them claim the
first nine out 10 profit growth rankings, while SPDB’s
earnings climbed more than any other large bank in
the country, up 127.6% year-on-year.
Robust performance is spurring heavy IT infrastruc-
ture and channel build-up in China, contrary to many
banks regionally and globally that have been forced to
clamp down spending to shore up scare capital. Chinese
banks nevertheless boasted 21 of the 30 lowest cost-to-
income ratios in the region last year. State-owned giants
are getting a lift in this area from further downsizing
their huge branch networks and staff deployments,
although an exception to this trend is ABC, which is
boosting networks due to low operat-
ing costs and social commitments in
rural areas. The bank is preparing for
its long-awaited IPO with a $19 billion
recapitalisation in October 2008.
The slump in China’s capital
markets last year impacted fund
and wealth management businesses
across the industry, and the drop
in fee income and made Chinese
banks weak among peers in The
Asian Banker 300 (AB300) in terms
of their non-interest income to total income ratios.
BOC topped the list for China at a paltry 86 (28.8%),
while like other big banks like CCB stood at 140
(16.6%), CMB at 156 (15.6%), ICBC at 160 (15.2%),
BoComm at 164 (14.7%) and ABC at 219 (8.1%).
Chinese banks have managed to control bad assets
thus far. In the ranking, nine out of China’s ten strong-
est AB300 players saw a reduction in non-performing
loans (NPLs). Industrial Bank boasted the lowest NPL
ratio of this group at 0.8%, 35th overall in the AB300
ranking, followed by CMB, 48th at 1.1%, and China
Minsheng Banking Corp and SPDB, sharing the 53rd
spot at 1.2%. Yet, an NPL surge amid market uncer-
tainty could greatly undermine the progress made by
Chinese banks reducing NPLs over the last year and
into the first half of 2009. How the industry responds
will have deep implications for its development and the
fate of the wider economy in the years to come.
But an even bigger challenge for China’s financial
institutions appears to still lie ahead as they come to
grips with an extraordinary spike in government-man-
dated lending. In the first quarter of 2009 alone, the
Chinese banking industry issued $671 billion in new
loans as part of China’s ambitious stimulus package,
exceeding 93% of the country’s $735 billion official
lending target for the entire year. Intended to boost
the domestic economy, which has been strained by the
global slowdown and reduced export demand, the torrid
pace of credit extension in China is a source of growing
concern. As such, the need to preserve capital to keep up
with lending activity and satisfy heightened regulatory
CAR requirements is likely to prevent Chinese banks
from seeking local or international acquisitions.
0%
1%
2%
3%
4%
5%
6%
2006 2007 20080
500
1,000
1,500
2,000
2,500
3,000
3,500
NP
L ra
tio
(%)
$ (
bill
ion)
Year-end total loans
Gross NPL Ratio
Total loans at 14 Chinese banks* have risen, but NPLs have fallen
Source: Asian Banker Research * ICBC, CCB, ABC, BOC, BoComm, CMB, CITIC, Hua Xia, SPDB, SDB, CMBG, Everbright, GDB and Industrial Bank
A slump in China’s capital markets last year impacted fund and wealth management businesses, and the drop in fee income made Chinese banks weak among peers in the AB300 in terms of their non-interest income to total income ratios.
ABJ ISS-92(PG48-96).indd 74ABJ ISS-92(PG48-96).indd 74 8/28/09 1:10:48 AM8/28/09 1:10:48 AM

75 ISSUE 92 The Asian Banker
Sustainability strainedThe annual defi nitive ranking and survey of Asia Pacifi c’s largest and strongest banks
The Asian Banker 3002009-2010 Edition
An indispensable research and reference support mechanism that provides banking industry analysts, fund managers and technology solutions providers with:
• In-depth metrics and indicators for balance sheet, income statement, liquidity, asset quality, capital adequacy and profi tability for 500 fi nancial institutions.
• Loan breakdown by maturity and category, customer deposits, revenue structure and important non-fi nancial information such as number of branches and employees.
• Exclusive in-depth country-level analysis of data that examines metrics pertinent and unique to 30 key countries and regions, including consolidation activities and rapid development in emerging markets.
The Asian Banker 300 Premium Edition will be delivered to you in Excel format on an interactive CD-ROM, for you to use in any way you wish. You will also be given password access to the online edition which will be updated twice yearly.
For more information, please contact:Ms Vicky SuManager, FSI Client ServicesTel: +65 6236 6517Fax: +65 6236 6530Email: [email protected]
ABJ ISS-92(PG48-96).indd 75ABJ ISS-92(PG48-96).indd 75 8/28/09 1:10:52 AM8/28/09 1:10:52 AM

THE ASIAN BANKER
76 ISSUE 92The Asian Banker
Country Capsules
0
5
10
15
20
25
30
35
40
45
50
Non
-inte
rest
Inco
me
Rat
io (
%)
HSBC
BOC Hon
g Ko
ng H
oldings
Hang
Seng
Ban
k
Stan
dard C
harte
red
Bank
ICBC (A
sia)
Wing
Hang
2007
2008
391233098220971528714617
12345678910
Hongkong and Shanghai Banking CorporationBOC Hong Kong HoldingsHang Seng BankStandard Chartered Bank (Hong Kong)Bank of East AsiaIndustrial and Commercial Bank of China (Asia)Wing Hang BankNanyang Commercial BankCITIC Ka Wah BankCitibank (Hong Kong)
Commercial BankRank Strength Rank 2009
549,652148,01298,33277,23853,57425,10217,34015,80015,71514,589
7,093388
1,81974213
12515013117
415
24.1%3.3%
27.8%18.0%0.3%6.6%
10.9%6.5%1.3%
54.3%
1.3%0.3%1.9%1.1%0.0%0.5%0.8%0.8%0.1%3.0%
13.4%16.2%12.5%
n.a.13.8%13.6%15.4%17.1%14.7%14.3%
1.0%0.5%1.0%
n.a.n.a.
0.7%0.7%0.6%1.9%0.6%
Net Profit($m) ROA ROE CAR
(Total)Assets($m)
Gross NPLRatio
AB300Rank 2009
9 29 48 56 80 152 190 201 202 211
Hong KongHong Kong: 15 banks in the AB300. Total assets: $1,074 bn. Total net profi ts: $11 bn
Source: Asian Banker Research
Despite being a territory of only seven million people,
Hong Kong has more banks in the Asian Banker
300 (AB300) ranking of banks by asset size than any
country besides Japan, China, Taiwan, India and Ma-
laysia—countries with populations that range from 22
million to 1.3 billion. With only 4.3% of the total assets
of the AB300 banks, Hong Kong lenders so far had a
greater proportion of the profits with 11%, the only
domain besides Australia (12.5%) and China (66.9%)
to see its share of the wealth move into double digits.
With the blistering policy-led growth and profit-
taking across the border in China, Hong Kong’s banks
have a highly competitive neighbour next door to
stay ahead of, even as that neighbour makes inroads
into its market—Bank of China, Industrial and Com-
mercial Bank of China and China Construction Bank
have all set up shop in Hong Kong by acquiring local
lenders, and have recently been joined by China
Merchants Bank, which agreed in October 2008 to
pay $2.48 billion for a 53% stake in the struggling
family-run Wing Lung Bank, Hong Kong’s only unprof-
itable bank and its 13th-largest by assets.
In terms of profitability, the gains in this year’s
AB300 were not as good as last year’s. Indeed, even
as the whole region saw profits drop 39% (fuelled
by massive losses in Japan), so Hong Kong’s banks
saw profit fall 30% as well. In fact, only two banks
in Hong Kong saw net income growth this year—Citi-
bank’s profits of $132 million were a 46.6% boost
from the previous year’s, and CITIC Ka Wah Bank’s
measly $3 million was 20.6% better than the previ-
ous year. Other banks saw their profits reduced
from the previous year’s by various degrees, ranging
from the $47 million in the case of Fubon Bank, to a
$531 wipeout at Bank of East Asia (BEA) that repre-
sented a 97.1% reduction of what it had earned the
previous year (BEA, which had a sizeable portfolio
of securitised assets, decided to write all of them
off in one go).
Hong Kong: Shrinking profi ts, hidden dragon
Non-interest Income is slipping in Hong Kong’s biggest banks
Source: Asian Banker Research
ABJ ISS-92(PG48-96).indd 76ABJ ISS-92(PG48-96).indd 76 8/28/09 1:10:53 AM8/28/09 1:10:53 AM

77 ISSUE 92 The Asian Banker
Hong Kong banks still saw their loans growing,
though; Standard Chartered Bank led the group with
19% growth, followed by Citibank at 18% growth,
Industrial and Commercial Bank of China (ICBC) at
12%, and BOC Hong Kong Holdings at 11.8%. Only
Dah Sing Banking Group shank loans, by 1.3%. Cor-
respondingly, banks also grew their deposits, with
Standard Chartered Bank again leading the way with
33% growth—a heavy rate of liabilities gathering
that it seemed to adopt in several markets, such as
South Korea and Thailand, where it grew deposits
47.6% and 41% respectively. Following the way was
Wing Lung Bank, which grew deposits 17%, Fubon
Bank which grew them 15.7%, Bank of East Asia
grew at 13.9%, and CITIC Ka Wah Bank expanded
at 13.5%.
Perhaps the Achilles heel of the Hong Kong banks
is in their non-interest income, which fell sharply this
year, leaving only three Hong Kong banks in the top
50 banks in the measure of non-interest income to
total income. These were Citibank, at position 22 with
46.6% (where it ranked below Citibank in Australia,
Singapore and Japan, an indication of how tough the
market was in Hong Kong), HSBC at position 43 with
37.3%, and Standard Chartered Bank, at position
46 with 36.6%.
Citibank Hong Kong’s strong non-interest in-
come to total income ratio was one of the meas-
ures that helped earn it the title of strongest bank
in Hong Kong according to the AB300 strength
scorecard, and position 17 overall. In fact, its
performance helped it to earn the position of
second-highest ranked foreign bank in the entire
AB300, after HSBC (Malaysia), which is at position
12. It led Hong Kong in profit gain, ROE, where its
54.3% made it third in the overall strength rank-
ing, and ROA, where its 3% made it first in the
overall ranking.
4211925518911719202
12345678910
State Bank of IndiaICICI BankPunjab National BankBank of BarodaBank of IndiaCanara BankHDFC BankUnion Bank of IndiaAXIS BankSyndicate Bank
Commercial BankRank Strength Rank 2009
269,28699,61652,33547,94446,71545,43137,85033,22230,48126,882
2,306697646494636401465356374188
16.3%7.2%
22.0%19.6%25.3%16.6%17.1%21.5%19.1%
n.a.
1.0%0.7%1.4%1.2%1.5%1.0%1.4%1.2%1.4%0.8%
n.a.14.7%14.3%12.9%13.1%
n.a.15.8%13.3%13.7%11.4%
n.a.3.6%1.7%n.a.
1.7%n.a.
2.0%2.0%1.1%n.a.
Net Profit($m) ROA ROE CAR
(Total)Assets($m)
Gross NPLRatio
AB300Rank 2009
17 46 83 90 93 96 109 127 133 141
IndiaIndia: 27 banks in the AB300. Total assets: $956.9 bn. Total net profi ts: $9.4 bn
Source: Asian Banker Research
The 2008-2009 period had been a particularly
volatile one for India. Due to the global reces-
sion and negative sentiment towards the outlook
of the Indian economy, foreign institutional invest-
ments declined to such an extent in 2008 that
the stock market lost more than 50% of its value
before climbing up back again to more stable
levels in the first half of 2009. Inflation rose to
considerable levels of 12% in July 2008, but fell
sharply thereafter, to an all-time low of 0.14% by
April 2009.
The government used various monetary and
fiscal measures to restore balance in the economy,
and due to the lack of liquidity in the markets
the Reserve Bank of India reduced both the cash
reserve ratio and the repo rate. And while inter-
bank rates still stayed high at around 20%, the
reductions in policy rates were a signal to the
privately-run banks, who lowered theirs towards
the end of 2008 while major public banks such as
State Bank of India (SBI) soon cut their interest
rates as well.
India: From a position of strength
ABJ ISS-92(PG48-96).indd 77ABJ ISS-92(PG48-96).indd 77 8/28/09 1:10:55 AM8/28/09 1:10:55 AM

THE ASIAN BANKER
78 ISSUE 92The Asian Banker
Country Capsules
2006 2007 2008
Non
-inte
rest
inco
me
to t
otal
inco
me
(%)
NP
L ra
tio
(%)
Non-interest Income Ratio
NPL Ratio28
29
30
31
32
33
34
35
36
37
0
0.5
1.0
1.5
2.0
2.5
3.0
3.5
Even though the impact of the global financial
crisis turned out to be much more severe than
expected, the Indian economy remained funda-
mentally strong, and commentators such as KV
Kamath, the chairman of ICICI Bank, have pre-
dicted that GDP growth for the 2009-2010 fiscal
year would be over 6%. India’s financial sector
has remained resilient compared with that of the
key developed economies in the face of the sub-
prime crisis, and in this year’s The Asian Banker
300 (AB300), the 27 Indian banks that made the
list have remained at the top of many rankings,
including the strength ranking, where six Indian
banks found themselves in the top 20 (including
the first and second positions), through their very
high asset growth, loan growth, deposit growth,
CAR, operating profit and ROA.
Indian banks as a whole have high liquidity, and
on a regional basis sit in the third position for aver-
age liquid assets to total assets after Singapore and
Thailand. There were no surprises in terms of profit-
ability, and India’s largest bank, state-owned lender
SBI, was naturally also India’s most profitable bank
and the tenth-best performer in Asia Pacific, while
its second-largest (and the largest privately-owned)
financial institution ICICI Bank was its second-most
profitable bank and the region’s 31st-most profitable
bank overall. ICICI Bank shone further by having one
of the region’s highest ratios of non-interest income
at 74%, while also turning in India’s third-highest
CAR, at 14.7%.
Indian banks had been aggressively growing
their loan portfolios for the past few years to com-
pete with the international banks that had been
entering the Indian market, resulting in higher
non-performing loans hitting the banks’ balance
sheets. After the advent of the credit crisis, which
was marked by the collapse of Bear Stearns in
March 2008, the Indian banks continued their
aggressive loan growth to meet their targets,
carrying on until September 2008. Since October
2008, banks have cooled off their loan growth
and also started following stricter underwriting
policies. NPLs have also been reducing in the
last few years, but the banks have been looking
into other means for revenues as well, especially
fee revenues.
Through its acquisition of Centurion Bank of
Punjab, HDFC Bank, determined by the strength
ranking scorecard to be the Asia Pacific region’s
strongest bank, has enjoyed India’s highest loan
growth (56.1%) and deposit growth (41.3%). It
also kept NPLs relatively low, and at 2.0% has
the eight-lowest NPLs of any Indian bank, which
was position 101 on a regional basis. However, it
was not strong on all counts—compared with its
main rival among privately-owned banks, ICICI
Bank, it had a very low non-interest income ratio
at 31.7%, the 17th-highest in India and at position
70 in the region.
Non-interest incomes ratios of the top five
private banks show that private banks, which
had ratios ranging from 74% at ICICI to 41.7% at
HSBC, have done much better than the top five
public banks, which ranged from 42.4% at State
Bank of India to 28.8% at Punjab National Bank.
But non-interest income isn’t everything—Punjab
National Bank, with strong loan and deposit growth,
became the region’s second-strongest bank, right
after HDFC Bank.
Even as Indian banks’ NPLs come down, so does their reliance on fee income
Source: Asian Banker Research
Indian banks as a whole have high liquidity, and on a regional basis sit in the third position for average liquid assets to total assets after Singapore and Thailand.
FAFAFAABJ ISS-92(PG48-96).indd 78ABJ ISS-92(PG48-96).indd 78 8/28/09 1:10:56 AM8/28/09 1:10:56 AM
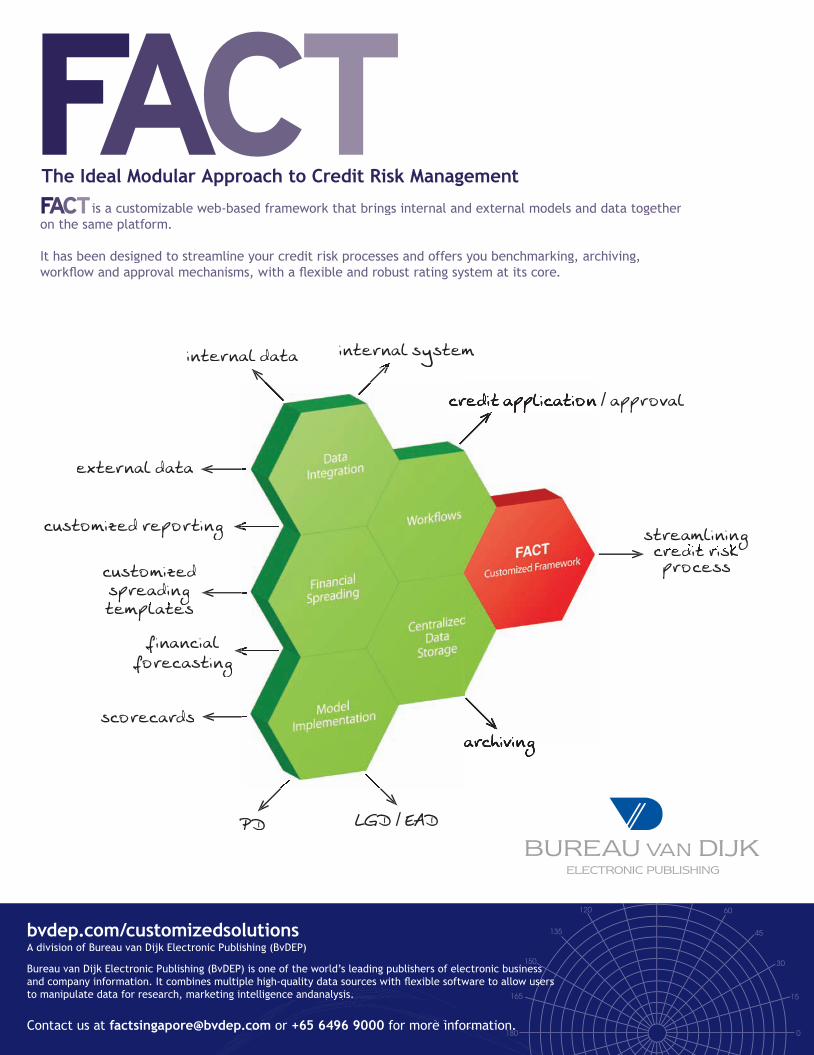
79 ISSUE 92 The Asian Banker
internal data
scorecards
financialforecasting
customized spreadingtemplates
p gp
customized reporting
external data
internal system
/ approval/
streamliningcredit risk
gprocess
LGD / EAD/PD
The Ideal Modular Approach to Credit Risk Management
is a customizable web-based framework that brings internal and external models and data togetheron the same platform.
It has been designed to streamline your credit risk processes and offers you benchmarking, archiving,workflow and approval mechanisms, with a flexible and robust rating system at its core.
bvdep.com/customizedsolutionsA division of Bureau van Dijk Electronic Publishing (BvDEP)
Bureau van Dijk Electronic Publishing (BvDEP) is one of the world’s leading publishers of electronic business and company information. It combines multiple high-quality data sources with flexible software to allow users to manipulate data for research, marketing intelligence andanalysis.
Contact us at [email protected] or +65 6496 9000 for more information.
sers s
ynalysis.ysis.lysisrces w
m o oreocomcom.com.com.comp.cooco
an
ereree infe infininfonfornformrmm or
with fl
FACT Ad Artwork indd 1FACT Ad Artwork indd 1FA rk inrk inrk indddddd 111 PMPMPP666636366620/09 12:28:320/09 12:28:38822990/0/ 8:38:3/2/2//111/21/211111/2/2 66666636 P36 PPP66663333:::36 PMMMABJ ISS-92(PG48-96).indd 79ABJ ISS-92(PG48-96).indd 79 8/28/09 1:11:09 AM8/28/09 1:11:09 AM

THE ASIAN BANKER
80 ISSUE 92The Asian Banker
Country Capsules
0
2
4
6
8
10
12
14
16
Indo
nesia
Sing
apor
e
Hong
Kong
Philip
pine
s
Malay
sia
Thailand
Indi
a
S.Ko
rea
China
New Z
ealand
Austra
lia
Taiw
an
Japa
n
Viet
nam
Ave
rage
tot
al C
AR
(%
)
CAR
52117594123181
123456
Bank MandiriBank Rakyat IndonesiaBank Central AsiaBank Negara IndonesiaBank DanamonBank CIMB Niaga
Commercial BankRank Strength Rank 2009
32,73422,47322,42618,4249,7969,424
48554452711216562
18.0%29.3%26.9%7.9%
16.2%9.2%
1.7%2.7%2.6%0.7%1.9%0.9%
15.7%13.2%15.8%13.5%14.0%15.6%
4.9%n.a.
0.6%4.9%2.2%2.5%
Net Profit($m) ROA ROE CAR
(Total)Assets($m)
Gross NPLRatio
AB300Rank 2009
129 167 168 185 263 268
IndonesiaIndonesia: 6 banks in the AB300. Total assets: $115.3 bn. Total net profi ts: $1.9 bn
Source: Asian Banker Research
Although there was a crisis going on in the world
around them, Indonesian banking looked
more like business as usual. Even with the weak-
ening of the rupiah relative to the dollar, the six
Indonesian banks in this year’s Asian Banker 300
(AB300) did see their profits increase by roughly
$100 million to $1.9 billion. Indonesia’s banks
also found themselves in the top half of several
key rankings: they were placed between positions
3 and 117 in ROA, between positions 57 and 148
in cost to income ratio, between positions 42 and
180 for net profit, between positions 34 and 112
for deposit growth, and between positions 16 and
74 for CAR. In fact, Indonesian banks had higher
average CAR than those from any other market
in Asia Pacific.
Indonesia’s banks did less well on the ranking
of liquid assets to total assets, where they were
11th of 14 markets with a 2.9% ratio, which is
far less than regional leader Singapore’s 17.5%.
They also had relatively poor non-interest income
streams at an average of 19.5%, putting them 10th
of 14 banks, and their NPLs were on the high side
as well: while Bank Central Asia (BCA) may have
been the 19th-best bank overall with only 0.6%
NPLs, Bank Mandiri’s 4.9%, Bank Negara Indo-
nesia’s (BNI) 4.9% and Bank Rakyat Indonesia’s
(BRI) 5.7%—which puts it at position 241 in the
listing—are more worrying.
Between themselves, there was also a shake-up:
privately-owned BCA, which has typically always
been the second-largest bank by assets in Indonesia
behind state-owned giant Bank Mandiri, this year
lost its position to BRI, also a state-owned lender,
which grew its assets at a rate of 20.8% compared
to BCA’s 12.6%. But this didn’t prevent BCA from
doing well in the strength ranking, where it was fifth
overall behind the strongest banks of India (2), Ma-
laysia and China; these banks all saw strong asset,
loan, deposit and net profit growth, and ahead of the
banks of Asia’s developed markets, which did poorly
in those indicators. BCA did well in the scorecard’s
loan growth, risk index, CAR, ROA, cost to income
ratio, loan loss reserve to gross NPLs, and overall
gross NPL categories.
Another upset may be in the making, with the
emergence of Bank CIMB Niaga, which was formed
Indonesia: Well-capitalised, but illiquid
Indonesian banks lead the region in average CAR
Source: Asian Banker Research
ABJ ISS-92(PG48-96).indd 80ABJ ISS-92(PG48-96).indd 80 8/28/09 1:11:12 AM8/28/09 1:11:12 AM

81 ISSUE 92 The Asian Banker
when Malaysia’s Bumiputra-Commerce Holdings
consolidated its stake in Bank Niaga and Bank Lippo
to comply with the central bank’s single presence
policy that allows a single majority owner to keep
only a single bank holding in Indonesia (owners
of multiple holdings must merge, diverge, or form
financial holding companies). While Bank Niaga has
in past years been able on its own to creep onto the
AB300’s lower reaches, or been pushed off in oth-
ers, it is now in a solid position at 268, edging close
to Bank Danamon’s 263 position. It may be some
time before it overtakes the aggressive microfinance
lender, which grew assets at 20% to Bank CIMB
Niaga’s 10%, but with time and further integration
the ambitious Malaysian group may yet push suc-
cessfully for higher growth, both through aggressive
lending or further acquisition.
But Bank Danamon, which is 58% owned by
Singapore’s Temasek Holdings and run by former
Citibanker Sebastian Paredes, may not be in its
position for long either, having raised $362 million
in an April rights issue to bring its CAR to a ridicu-
lously-high 23%—well above the central bank’s 8%
capital requirement. Sitting on an expensive capital
cushion to wait out the crisis is clearly not what
Paredes has in mind, and if ever there was an Asian
bank that was ripe for an acquisition, then Bank
Danamon is it.
Acquisition targets, however, are less apparent.
Bank Internasional Indonesia has already been
acquired by Maybank in a controversial May 2008
deal, which saw Malaysia’s largest bank overpay
tremendously for the right to own the brand, and
other foreign banks already have their hooks in
many of Indonesia’s other banks: ANZ with Panin,
Standard Chartered Bank with Permata, and Singa-
pore’s UOB with Bank Buana. But there are plenty
of small lenders for Bank Danamon to set its sights
on—Indonesia still has nearly 130 banks—and when
HSBC bought 88% of Bank Ekonomi in late 2008 it
instantly increased its branch network in the country
by 96 branches.
16218014318817218775169162199
12345678910
Mitsubishi UFJ Financial GroupMizuho Financial GroupSumitomo Mitsui Financial GroupNorinchukin BankResona HoldingsShinkin Central BankSumitomo Trust and BankingChuo Mitsui Trust HoldingsBank of YokohamaFukuoka Financial Group
Commercial BankRank Strength Rank 2009
2,086,8051,639,4851,275,578
685,248430,916302,117233,466167,539128,200124,243
-2,199-6,420-3,480-6,306
980-2,055
201-969
8920
-2.3%-13.8%-6.5%
-21.1%17.2%
-42.6%1.4%
-13.1%1.1%
n.a.
-0.1%-0.4%-0.3%-1.0%0.2%
-0.7%0.1%
-0.6%0.1%
n.a.
11.8%10.6%11.5%15.6%13.5%22.9%12.1%12.1%10.9%8.8%
1.6%1.8%2.3%2.0%2.6%0.6%1.6%1.6%3.3%5.3%
Net Profit($m) ROA ROE CAR
(Total)Assets($m)
Gross NPLRatio
AB300Rank 2009
1 2 4 8 11 16 18 26 30 35
JapanJapan: 120 banks in the AB300. Total assets: $10,951.8 bn. Total net profi ts: -$25.1 bn
Source: Asian Banker Research
Although they are not suffering as much as finan-
cial institutions in other large economies, Japan’s
banks are still the most bloated and least efficiently-
run financial institutions in Asia Pacific: their share
of the region’s assets, loans and deposits were by
far the largest, with China—the only contender for
scale—trailing by nearly half. But while it may have the
largest representation of banks on the chart at 120,
Japan was the only country where banks incurred
more losses than made profit: the cumulative losses
of the 120 Japanese banks in the AB300 represent
nearly one quarter of the region’s total profits. In
total, 56 of the region’s 67 loss-making banks were
Japanese, among them all of the mega-banks and
large regional banks such as Shinsei Bank; but de-
spite the bleak outlook, the fact that only seven of
them had lost money two years in a row may indicate
that the losses could still be one-offs, and there is
Japan: Ineffi cient market
ABJ ISS-92(PG48-96).indd 81ABJ ISS-92(PG48-96).indd 81 8/28/09 1:11:13 AM8/28/09 1:11:13 AM
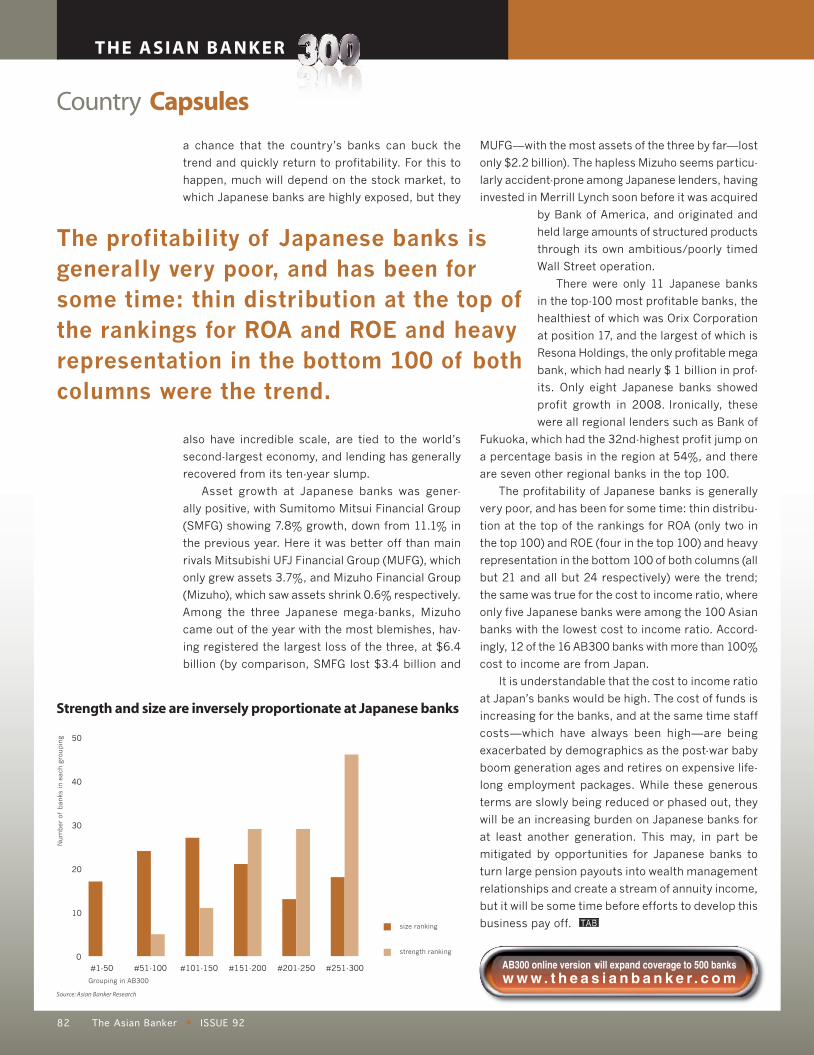
THE ASIAN BANKER
82 ISSUE 92The Asian Banker
Country Capsules
Num
ber
of
ban
ks in e
ach g
roupin
g
Grouping in AB300
0
10
20
30
40
50
#1-50 #51-100 #101-150 #151-200 #201-250 #251-300
size ranking
strength ranking
a chance that the country’s banks can buck the
trend and quickly return to profitability. For this to
happen, much will depend on the stock market, to
which Japanese banks are highly exposed, but they
also have incredible scale, are tied to the world’s
second-largest economy, and lending has generally
recovered from its ten-year slump.
Asset growth at Japanese banks was gener-
ally positive, with Sumitomo Mitsui Financial Group
(SMFG) showing 7.8% growth, down from 11.1% in
the previous year. Here it was better off than main
rivals Mitsubishi UFJ Financial Group (MUFG), which
only grew assets 3.7%, and Mizuho Financial Group
(Mizuho), which saw assets shrink 0.6% respectively.
Among the three Japanese mega-banks, Mizuho
came out of the year with the most blemishes, hav-
ing registered the largest loss of the three, at $6.4
billion (by comparison, SMFG lost $3.4 billion and
Strength and size are inversely proportionate at Japanese banks
Source: Asian Banker Research
The profitability of Japanese banks is generally very poor, and has been for some time: thin distribution at the top of the rankings for ROA and ROE and heavy representation in the bottom 100 of both columns were the trend.
AB300 online version will expand coverage to 500 banksw w w . t h e a s i a n b a n k e r . c o m
MUFG—with the most assets of the three by far—lost
only $2.2 billion). The hapless Mizuho seems particu-
larly accident-prone among Japanese lenders, having
invested in Merrill Lynch soon before it was acquired
by Bank of America, and originated and
held large amounts of structured products
through its own ambitious/poorly timed
Wall Street operation.
There were only 11 Japanese banks
in the top-100 most profitable banks, the
healthiest of which was Orix Corporation
at position 17, and the largest of which is
Resona Holdings, the only profitable mega
bank, which had nearly $ 1 billion in prof-
its. Only eight Japanese banks showed
profit growth in 2008. Ironically, these
were all regional lenders such as Bank of
Fukuoka, which had the 32nd-highest profit jump on
a percentage basis in the region at 54%, and there
are seven other regional banks in the top 100.
The profitability of Japanese banks is generally
very poor, and has been for some time: thin distribu-
tion at the top of the rankings for ROA (only two in
the top 100) and ROE (four in the top 100) and heavy
representation in the bottom 100 of both columns (all
but 21 and all but 24 respectively) were the trend;
the same was true for the cost to income ratio, where
only five Japanese banks were among the 100 Asian
banks with the lowest cost to income ratio. Accord-
ingly, 12 of the 16 AB300 banks with more than 100%
cost to income are from Japan.
It is understandable that the cost to income ratio
at Japan’s banks would be high. The cost of funds is
increasing for the banks, and at the same time staff
costs—which have always been high—are being
exacerbated by demographics as the post-war baby
boom generation ages and retires on expensive life-
long employment packages. While these generous
terms are slowly being reduced or phased out, they
will be an increasing burden on Japanese banks for
at least another generation. This may, in part be
mitigated by opportunities for Japanese banks to
turn large pension payouts into wealth management
relationships and create a stream of annuity income,
but it will be some time before efforts to develop this
business pay off.
ABJ ISS-92(PG48-96).indd 82ABJ ISS-92(PG48-96).indd 82 8/28/09 5:49:47 PM8/28/09 5:49:47 PM

83 ISSUE 92 The Asian Banker
ABJ ISS-92(PG48-96).indd 83ABJ ISS-92(PG48-96).indd 83 8/28/09 1:11:16 AM8/28/09 1:11:16 AM

THE ASIAN BANKER
84 ISSUE 92The Asian Banker
Country Capsules
-10%
-5%
0%
5%
10%
15%
20%
EON C
apita
l
RHB Cap
ital
Bank Ke
rjasa
ma Ra
kyat
Malay
sia
Bumip
utra
-Com
mer
ce H
oldi
ng
AMMB H
oldi
ngs
BIMB H
oldi
ngs
Affin
Ban
k
% c
han
ge
Loan Growth Change in 2008
NPL Growth Change in 2008
14773631394012494536
12345678910
MaybankBumiputra-Commerce HoldingsPublic BankRHB CapitalAMMB HoldingsHong Leong Financial GroupHSBC Bank (Malaysia)OCBC Bank (Malaysia)Citibank (Malaysia)Standard Chartered Bank (Malaysia)
Commercial BankRank Strength Rank 2009
77,68559,68156,62930,17725,95124,13415,24713,82013,31912,718
867581757303254239260173223207
14.9%11.8%26.1%14.1%11.6%14.0%28.6%21.5%25.8%38.5%
1.2%1.0%1.4%1.0%1.0%1.0%1.7%1.3%1.7%1.6%
14.5%n.a.
13.7%n.a.n.a.n.a.
13.4%11.6%13.7%13.8%
3.8%4.9%1.0%4.5%4.1%2.3%1.6%3.4%3.1%2.6%
Net Profit($m) ROA ROE CAR
(Total)Assets($m)
Gross NPLRatio
AB300Rank 2009
55 76 77 134 147 157 206 222 226 233
MalaysiaMalaysia: 16 banks in the AB300. Total assets: $391.4 bn. Total net profi ts: $4.7 bn
Source: Asian Banker Research
While Malaysia’s banks are not the largest in
the region—the sixteen banks in this year’s
Asian Banker 300 (AB300) are scattered between
positions 55 and 256 in our ranking of the larg-
est banks by asset size—nearly all of them punch
above their weight in the strength ranking, where
they range from positions 3 to 189, with number
294 in size Alliance Financial Group especially
well-placed at position 73 for strength. The only
exception to this is Bumiputra-Commerce Hold-
ings the listed vehicle for the CIMB Group which
holds CIMB Bank and other commercial banking
organisations, which is 76th in size, but a still-re-
spectable 77th in strength.
The Malaysian banks seem to score the highest
marks in ROA, their cost to income ratios, and the
ratio of non-interest income to total income. In terms
of ROA, eight of them are in the top 50, while with
the cost to income ratio, six of them are in the top 50.
For the ratio of non-interest income to total income,
10 Malaysian banks are in the top 50; here they are
so strong that the country’s average of 33.2% is
second regionally only to Singapore.
Foreign banks in Malaysia do better against their
local peers than any others in Asia in these three
categories, and banks like HSBC, Citi, Standard
Chartered Bank, OCBC, and UOB hold three of the
top five positions in each of these rankings. In the
strength ranking as a whole, Malaysia is also the
home of Asias strongest foreign-headquartered
bank, HSBC (Malaysia). By this measure, the bank
comes in at position 12, well above any other Ma-
laysian bank—except Public Bank, which holds
position three.
To earn its high strength ranking, Public Bank
was not only Malaysia’s second-most profitable
bank with $757 million, but it recorded the largest
profit gain of any other Malaysian bank (and this was
Malaysia: Not big, but strong
Most Malaysian banks with high NPL reduction are still growing their books
Source: Asian Banker Research
ABJ ISS-92(PG48-96).indd 84ABJ ISS-92(PG48-96).indd 84 8/28/09 1:11:17 AM8/28/09 1:11:17 AM

85 ISSUE 92 The Asian Banker
one area where Malaysian banks were particularly
weak—five of them saw profits shrink). Its cost to
income ratio is also strong—at 32.3%, it was the
ninth-best in the AB300 and second-best in Malaysia
after Bank Rakyat, while it grew loans 19.2% and
deposits 16.9%.
But the bank is also very exposed to interest in-
come: despite being stronger than most Malaysian
banks in many areas, Public Bank was second from
the bottom of the Malaysian banks with respect to
non-interest income as a proportion of total income.
At only 21%, it was respectable on a regional level,
coming in at position 127, but well below Standard
Chartered Bank’s 53.9%, HSBC Malaysia’s 52.3%,
AMMB Holdings’ 45.7%, or Bumiputra-Commerce
Holdings’ 38.9%. The only bank to have a lower ratio
in this area was Bank Rakyat, with a dreadful 9.2%
that landed it at position 212 overall.
With Malaysia an emerging market, its banks
followed the general trend of the emerging markets
in this year’s AB300 of having high deposit and
loan growth rates. UOB led deposit growth with
22.8%, while Bumiputra-Commerce Holdings saw
20.9% and Bank Rakyat saw 19.3%. Loan growth
at the Malaysian banks generally outpaced deposit
growth, and sector leader Bank Rakyat expanded
its loan book 31%, while Buiputra-Commerce Hold-
ings added 22.4%, Public Bank 19.2%, Alliance
Bank 18.2% and Maybank 17.8%. Correspondingly,
these banks also saw some of the highest NPLs in
the country, with Alliance Financial Group holding
7%, Bank Rakyat 5.7%, and Bumiputra-Commerce
Holdings 4.9%.
Malaysia’s banks have relatively high capital
adequacy ratios, with Alliance Holdings leading the
pack with 16.4%, followed by Maybank with 14.5%,
Standard Chartered Bank with 13.8% and Citibank
with 13.7%. On a regional basis, the Malaysian banks
in the AB300 are relatively well-placed, with 13.3%
average CAR. Where Malaysia does less well is in
liquidity—its percentage of liquid to total assets is
only 3.2%, where it sits in position 10 of 14 countries
with banks in the AB300, just behind China and
South Korea and well behind industry leaders such
as Singapore (17.5%), Thailand (14.1%) and India
(10.7%).
17411313596
1234
Banco de Oro UnibankMetropolitan Bank and TrustBank of The Philippine IslandsLand Bank of the Philippines
Commercial BankRank Strength Rank 2009
16,89016,10614,0388,114
4797
13892
4.0%7.2%
10.0%11.2%
0.3%0.6%1.0%1.2%
13.5%13.4%14.2%14.3%
5.5%4.5%3.9%5.6%
Net Profit($m) ROA ROE CAR
(Total)Assets($m)
Gross NPLRatio
AB300Rank 2009
195 198 220 289
PhilippinesPhilippines: 4 banks in the AB300. Total assets: $55.1 bn. Total net profi ts: $0.4 bn
Source: Asian Banker Research
With its four The Asian Banker 300 (AB300)
banks racking up a combined $55.1 billion,
the Philippines was one of five countries that had
four banks or less on the ranking. But despite the
four banks taking in more deposits than the three
Pakistan banks or the four Vietnamese banks on the
list, and having more assets and loans than the banks
from Pakistan, and it still was the lowest in terms of
total net profit at only $400 million.
Although the four banks—Banco De Oro Unibank
(BDO), Metropolitan Bank and Trust (Metrobank),
Bank of the Philippine Islands (BPI) and Land Bank
of the Philippines (Land Bank)—were all profitable,
only Land Bank saw its profit increase, and at a
rate of merely 1.6%. Meanwhile, BPI saw its profit
decrease 35.9%, Metrobank saw it drop 36.1%, and
BDO experienced a fall of 65.9%.
The Philippine banks also tended to rank quite
poorly on some strength indicators, such as cost
to income ratio where they ranged from 61.5% for
BPI, all the way up to 75.8% for BDO. The banks
also saw relatively high NPLs, ranging from 3.9% for
BPI, up to 5.6% for Land Bank, the country’s most
aggressive lender (but least enthusiastic deposit-
taker). Land Bank was the country’s top bank in the
AB300 strength ranking, on the merit of its strong
risk score, its high CAR, and high loan loss reserves
to gross NPLs.
Philippines: Matters of size
ABJ ISS-92(PG48-96).indd 85ABJ ISS-92(PG48-96).indd 85 8/28/09 1:11:18 AM8/28/09 1:11:18 AM

THE ASIAN BANKER
86 ISSUE 92The Asian Banker
Country Capsules
But while Land Bank was the strongest bank
of the year in the Philippines, the most interesting
bank is still what is now the country’s largest, BDO.
But it was also the poorest-performer of the four
in the strength ranking. The bank, which several
years ago took the industry by storm by arrang-
ing the takeover of larger competitor Equitable
PCI Bank, has finally passed the once-monolithic
Metrobank to become the largest bank in the
Philippines by assets, with asset growth of 29%
that beat Metrobank’s 6.8% and BPI’s 4.6%. The
rationale of combining the legacy BDO, which was
a strong SME lender, with legacy Equitable BPI
Bank, which had a solid retail banking operation,
boded well for the creation of a more well-rounded
sustainable business.
In some ways, the gamble has paid off, with the
bank enjoying not only the industry’s highest asset
growth but also loan growth of 34.5%—nearly dou-
ble Metrobank’s 18.6%—and at 42.2% a deposit
growth rate more than four times Metrobank’s. But
integration issues have brought its cost to income
ratio up beyond acceptable levels, and the bank’s
5.51% NPLs—the second-highest of the four banks
after Land Bank—are a little on the high side. The
bank also suffered from lower trading volumes from
mark-to-market revaluations, as well as increased
provisions to cover possible losses from exposure
to the US banking sector that cut its net income
by more than half. These factors
showed up in the bank’s ROA of
0.3% and ROE of 4%, the lowest of
the Philippine banks in the AB300.
But the bank is forging ahead with
deal-making, acquiring GE Money
Bank of the Philippines—which GE
Money only set up in 2005 when
it bought the 31-branch Keppel
Bank—and forging ahead with GE
as an investment partner. It will
be interesting to see how, in the years ahead, GE
makes out with its ever-evolving Philippines strat-
egy, and how BDO leverages the new relationship
for greater cost efficiencies than it’s been able to
wring out of the acquisition.
Behind aggressive mover BDO, BPI and Metrobank
seem to be in a relative limbo. With crumbling
profitability due to provisioning on possible losses
from exposure to Lehman Brothers in the case of
Metrobank, and on expenses related to the valuation
of its retirement fund for BPI, both banks were also
relatively mediocre in loan growth, deposit growth,
ROA and ROE, as well as non-interest income to total
income. Cost to income is also a grave concern—BPI
may have the lowest of the four, but at 61% it has
much more cost cutting to do.
BDO stands in relatively good stead in its CAR
ratio, which is a respectable 13.5%, although it is
not as protected as Land Bank and BPI, with 14.3%
and 14.2% respectively. More worrying is the fact
that the Philippine banks are not as liquid as other
banks in the region, with an average liquid assets
to total assets ratio of only 2%, the second-last of
the 14 countries in the Asian Banker 300 and a
long way away from Singapore’s unassailable 17.5%
liquidity ratio.
tota
l as
sets
US
$m
illio
n
0
2000
4000
6000
8000
10000
12000
14000
16000
18000
2005 2006 2007 2008
Metropolitan Banking and Trust
Bank of the Philippine Islands
Banco De Oro Unibank
Banco de Oro has moved far ahead of its closest rivals
Source: Asian Banker Research
Philippine banks also tended to rank quite poorly on some strength indicators, such as cost to income ratio where they ranged from 61.5% for BPI, all the way up to 75.8% for BDO.
AB300 online version will expand coverage to 500 banksw w w . t h e a s i a n b a n k e r . c o m
ABJ ISS-92(PG48-96).indd 86ABJ ISS-92(PG48-96).indd 86 8/28/09 1:11:19 AM8/28/09 1:11:19 AM

87 ISSUE 92 The Asian Banker
0
0.5
1.0
1.5
2.0
2.5
3.0
3.5
4.0
4.5
DBS UOB OCBC
NP
L le
vel (%
)
2006
2007
2008
33212453
1234
DBS GroupUnited Overseas BankOversea-Chinese Banking CorporationCitibank (Singapore)
Commercial BankRank Strength Rank 2009
178,375127,113126,03233,767
1,4721,3371,251
475
9.9%12.3%11.3%24.6%
0.8%1.1%1.0%1.4%
14.0%15.3%15.2%13.2%
1.5%2.0%1.7%0.8%
Net Profit($m) ROA ROE CAR
(Total)Assets($m)
Gross NPLRatio
AB300Rank 2009
24 31 32 122
SingaporeSingapore: 4 banks in the AB300. Total assets: $465.3 bn. Total net profi ts: $4.5 bn
Source: Asian Banker Research
The four Singapore banks in this year’s Asian
Banker 300 (AB300)—DBS, United Overseas
Bank (UOB), Oversea-Chinese Banking Corporation
(OCBC) and Citibank Singapore—are on average
the most liquid in the region, shoring up a dizzy-
ing 17.5% liquid assets to total assets. However,
it seems that Citibank Singapore 2.6% ratio is
bringing down the level of the others, which for
DBS, UOB and OCBC are 26.7%, 18.3% and 22.2%
respectively. The banks also have the region’s
second-highest average total CAR at 14.4%, just
behind Indonesia’s 14.6%, with Citibank once again
dragging down the numbers—but not much—with
its “underachieving” 13.2%.
While the high liquidity and total CAR ratios seem
to give banks in Singapore—which is highly exposed
to walking wounded export businesses, as well as
the recently-volatile financial services industry, and
has suffered a deep recession—fortress-like balance
sheets. But eventually the banks will need to stop
worrying about the sky falling and venture out with
their capital to aggressively grow loans again, or
make strategic acquisitions.
One chance for such an acquisition has come
and gone, with ANZ picking up RBS’ retail and/or
institutional businesses in Hong Kong, Indonesia,
the Philippines, Singapore, Taiwan and Vietnam for
$550 million, the largest acquisition in Asia up to
that point in 2009. Expansion seems particularly
traumatic for DBS, Southeast Asia’s largest bank by
assets, which overpaid for its underachieving Hong
Kong operations, has bungled expansion plans in
Thailand and India, and lost out on ill-conceived
bids for banks in China and South Korea. More
smoothly-managed has been UOB’s acquisition of
its Indonesian subsidiary operation Bank Buana,
now called UOB Buana, which was built up slowly
over many years to its current 98.997% stake and
subsequent delisting from the stock market on
November 20th, 2008.
Between Singapore’s three banks, leading lender
DBS enjoyed the best asset growth of 10.2% to take
the number 24 spot in the AB300. UOB’s 4.6% asset
growth allowed it to increase the distance between
itself and OCBC, which had narrowed precariously
in the previous AB300, but was widened when the
smaller lender only managed 3.9% asset growth; the
banks are at positions 31 and 32 respectively in the
AB300. Between the three of them, UOB damaged
its reputation as a lender who keeps lending even in
bad times by only increasing its loans 7.7%, against
Singapore: Sitting pretty on a capital cushion
Only OCBC’s NPLs have continued to drop in 2008
Source: Asian Banker Research
ABJ ISS-92(PG48-96).indd 87ABJ ISS-92(PG48-96).indd 87 8/28/09 1:11:20 AM8/28/09 1:11:20 AM
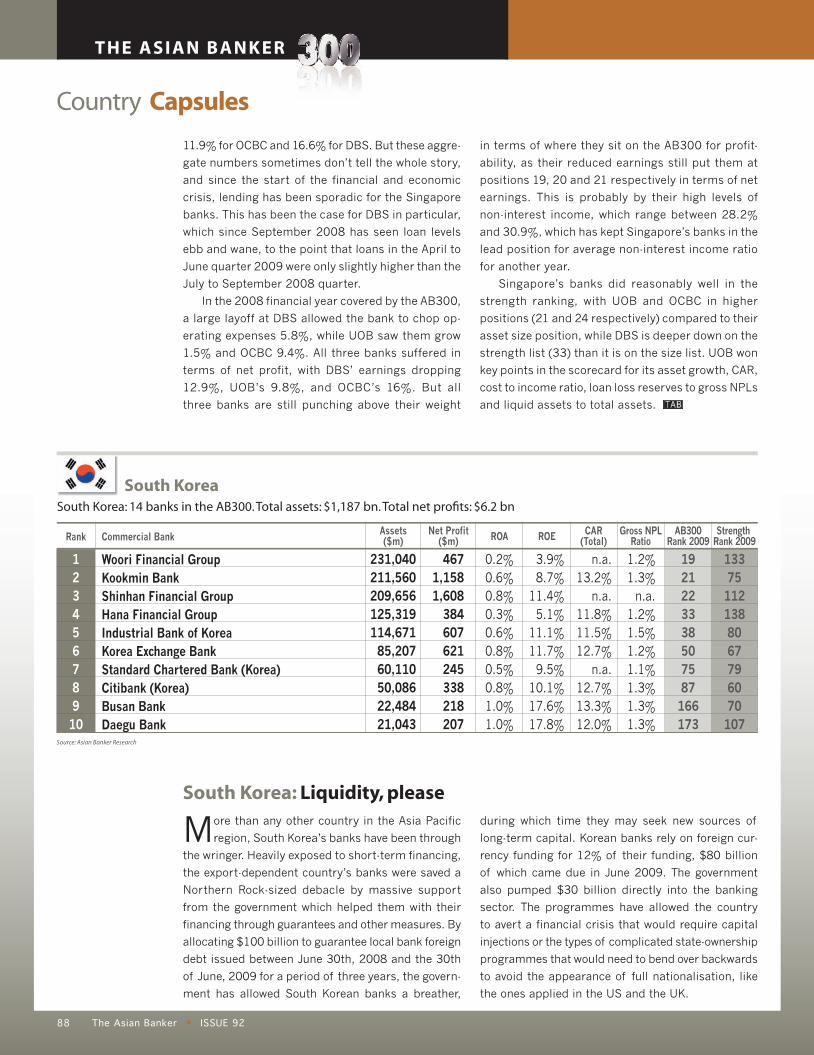
THE ASIAN BANKER
88 ISSUE 92The Asian Banker
Country Capsules
133751121388067796070107
12345678910
Woori Financial GroupKookmin BankShinhan Financial GroupHana Financial GroupIndustrial Bank of KoreaKorea Exchange BankStandard Chartered Bank (Korea)Citibank (Korea)Busan BankDaegu Bank
Commercial BankRank Strength Rank 2009
231,040211,560209,656125,319114,67185,20760,11050,08622,48421,043
4671,1581,608
384607621245338218207
3.9%8.7%
11.4%5.1%
11.1%11.7%9.5%
10.1%17.6%17.8%
0.2%0.6%0.8%0.3%0.6%0.8%0.5%0.8%1.0%1.0%
n.a.13.2%
n.a.11.8%11.5%12.7%
n.a.12.7%13.3%12.0%
1.2%1.3%
n.a.1.2%1.5%1.2%1.1%1.3%1.3%1.3%
Net Profit($m) ROA ROE CAR
(Total)Assets($m)
Gross NPLRatio
AB300Rank 2009
19 21 22 33 38 50 75 87 166 173
South KoreaSouth Korea: 14 banks in the AB300. Total assets: $1,187 bn. Total net profi ts: $6.2 bn
Source: Asian Banker Research
More than any other country in the Asia Pacific
region, South Korea’s banks have been through
the wringer. Heavily exposed to short-term financing,
the export-dependent country’s banks were saved a
Northern Rock-sized debacle by massive support
from the government which helped them with their
financing through guarantees and other measures. By
allocating $100 billion to guarantee local bank foreign
debt issued between June 30th, 2008 and the 30th
of June, 2009 for a period of three years, the govern-
ment has allowed South Korean banks a breather,
during which time they may seek new sources of
long-term capital. Korean banks rely on foreign cur-
rency funding for 12% of their funding, $80 billion
of which came due in June 2009. The government
also pumped $30 billion directly into the banking
sector. The programmes have allowed the country
to avert a financial crisis that would require capital
injections or the types of complicated state-ownership
programmes that would need to bend over backwards
to avoid the appearance of full nationalisation, like
the ones applied in the US and the UK.
South Korea: Liquidity, please
11.9% for OCBC and 16.6% for DBS. But these aggre-
gate numbers sometimes don’t tell the whole story,
and since the start of the financial and economic
crisis, lending has been sporadic for the Singapore
banks. This has been the case for DBS in particular,
which since September 2008 has seen loan levels
ebb and wane, to the point that loans in the April to
June quarter 2009 were only slightly higher than the
July to September 2008 quarter.
In the 2008 financial year covered by the AB300,
a large layoff at DBS allowed the bank to chop op-
erating expenses 5.8%, while UOB saw them grow
1.5% and OCBC 9.4%. All three banks suffered in
terms of net profit, with DBS’ earnings dropping
12.9%, UOB’s 9.8%, and OCBC’s 16%. But all
three banks are still punching above their weight
in terms of where they sit on the AB300 for profit-
ability, as their reduced earnings still put them at
positions 19, 20 and 21 respectively in terms of net
earnings. This is probably by their high levels of
non-interest income, which range between 28.2%
and 30.9%, which has kept Singapore’s banks in the
lead position for average non-interest income ratio
for another year.
Singapore’s banks did reasonably well in the
strength ranking, with UOB and OCBC in higher
positions (21 and 24 respectively) compared to their
asset size position, while DBS is deeper down on the
strength list (33) than it is on the size list. UOB won
key points in the scorecard for its asset growth, CAR,
cost to income ratio, loan loss reserves to gross NPLs
and liquid assets to total assets.
ABJ ISS-92(PG48-96).indd 88ABJ ISS-92(PG48-96).indd 88 8/28/09 1:11:22 AM8/28/09 1:11:22 AM

89 ISSUE 92 The Asian Banker
ABJ ISS-92(PG48-96).indd 89ABJ ISS-92(PG48-96).indd 89 8/28/09 1:11:26 AM8/28/09 1:11:26 AM

THE ASIAN BANKER
90 ISSUE 92The Asian Banker
Country Capsules
More recently, Korea’s six largest lenders by as-
sets—Kookmin Bank, Woori Bank, Shinhan Bank,
Hana Bank, the Industrial Bank of Korea (IBK) and
the Nonghyup agricultural cooperative—will set up a
private bad bank, capitalised with $1.2 billion, to be
run for five years to clean up $4 billion in troubled
loans. According to the Financial Services Com-
mission, Korea’s financial regulator, NPLs swelled
from 0.75% at the end of 2007 to 1.2% by the end
of 2008, before jumping to 1.5% three months later
in March 2009, when they levelled off.
Given their difficulties, which were mostly con-
centrated in the second half of the January to De-
cember 2008 financial year, it is clear that Korean
banks should have fared better in the size ranking
than in the strength ranking, and this was definitely
the case: Korea’s largest banks and banking groups
by assets in The Asian Banker 300 (AB300) are
Woori Financial Group (19), Kookmin Bank (21),
Shinhan Financial Group (22), Hana Financial Group
(33) and IBK (38), while the same banks’ respective
strength rankings are 133, 75, 112, 138 and 80.
The strongest large Korean bank is Citibank Korea
which, like its peers, scored high marks for asset
growth, but also risk index, gross NPL ratio and
loan loss reserves to gross NPLs. Korean banks on a
whole got low scores for liquid assets to total assets,
operating profits, ROA, and non-interest income to
total income. On average, the Korean banks’ average
ratio of liquid assets to total assets was low at 3.3%,
putting it right in the middle of the region’s 14 banks
at position eight, where the ratios bottom
out as they come down from Singapore’s
high of 17.5%. In terms of average CAR,
they are also mediocre, again in position
eight with 12.3%, coming in right after
Thailand and India.
But despite the difficulties Korean
banks faced in the year, none of them
declared losses, and five of them even
showed profit gains. Their asset quality, for the banks
that provide information on bad loans, is also very
high, with the highest NPL ratio only 1.5% for the
Industrial Bank of Korea.
Regarding asset size, this year’s AB300 counts
financial groups in the ranking, which has put
Woori Financial Group ahead of Kookmin Bank for
the first time. But Kookmin, which reorganised as
KB Financial only in September 2008, has been
raising money from shareholders and is clearly on
a path of building itself up again through acquisi-
tions, which could include the long-coveted Korea
Exchange Bank that it had once agreed to purchase
before being blocked by regulators. Hana Financial
Holdings has also moved beyond IBK to take up the
number four position. The top five banks all had
asset, loan and deposit growth in the double digits,
with Hana Financial Group leading asset growth at
15%, IBK leading loan growth at 16.1%, and Woori
Financial leading deposit growth at 38.2%.
Shinhan Financial Group had the largest profit of
any Korean financial institution at $1.608 billion on
the top of its strong credit card business, although
this was 46.1% smaller than it had been in the previ-
ous year. It was followed rapidly by other profitable
lenders Kookmin Bank and Korea Exchange Bank. No
Korean banks lost money in 2008, with one coming
out of a loss-making 2007.
0
0.2
0.4
0.6
0.8
1.0
1.2
1.4
1.6
2006 2007 2008 2009 March 2009 June
Gro
ss N
PL
rati
o (%
)
NPLs have gathered pace in South Korea
Source: Asian Banker Research
Korean banks on a whole got low scores for liquid assets to total assets, operating profits, ROA, and non-interest income to total income.
AB300 online version will expand coverage to 500 banksw w w . t h e a s i a n b a n k e r . c o m
ABJ ISS-92(PG48-96).indd 90ABJ ISS-92(PG48-96).indd 90 8/28/09 1:11:27 AM8/28/09 1:11:27 AM

91 ISSUE 92 The Asian Banker
Ta Chong Bank
Standard Chartered Bank
Union Bank of Taiwan
Industrial Bank of Taiwan
Far Eastern International Bank
Bank SinoPac
Yuanta Commercial Bank
Taishin International Bank
EnTie Commercial Bank
2008
2007
2001000-100-200-300-400-500-600
9218112573701036912217135
12345678910
Bank of TaiwanTaiwan Cooperative BankMega International Commercial BankLand Bank of TaiwanFirst Commercial BankChinatrust Commercial BankHua Nan Commercial BankChang Hwa Commercial BankCathay United BankTaipei Fubon Commercial Bank
Commercial BankRank Strength Rank 2009
108,39775,60961,84461,73253,24750,99050,60542,12741,20437,037
246223103183270380301146140182
3.5%7.0%2.4%6.1%
10.0%11.4%12.1%6.9%5.6%7.8%
0.2%0.3%0.2%0.3%0.5%0.8%0.6%0.4%0.3%0.5%
11.6%10.6%11.2%10.8%10.9%16.2%10.2%10.6%11.2%11.2%
0.9%n.a.
1.0%0.8%1.5%1.5%1.7%1.7%0.7%0.8%
Net Profit($m) ROA ROE CAR
(Total)Assets($m)
Gross NPLRatio
AB300Rank 2009
40 58 70 72 82 84 85 100 104 115
TaiwanTaiwan: 26 banks in the AB300. Total assets: $851.3 bn. Total net profi ts: $2.0 bn
Source: Asian Banker Research
No banks in the Asia Pacific region have had a
harder time than the banks of Taiwan. The coun-
try’s been struck with earthquakes and typhoons, the
government controls the largest lenders, foreign banks
have come and bought up struggling tier II banks, while
banks like Chinatrust Commercial Bank (Chinatrust)
and Taishin International Bank (Taishin) that tried to
make ambitious acquisitions found the government
standing in their way. As if things couldn’t get any more
murky, now the new Kuomintang government of presi-
dent Ma Ying-jeow has indicated a desire to allow closer
relations with China, which includes allowing gigantic
Mainland lenders like Bank of China and Industrial and
Commercial Bank of China to open up shop in Taiwan.
It’s enough to make any self-respecting privately-run
Taiwanese bank look overseas for opportunities, which
is what some are already starting to do.
Taiwan’s banks are also the Asia Pacific region’s
least profitable. Of the 26 Taiwanese banks in the
survey, nine were loss making—of which seven had
also lost money in 2007, a year of record profits in
most markets. This compares with Japan, the other
market with a large number of loss-making financial
institutions, where—of the 120 Japanese banks in the
survey—56 were loss-making and only seven had lost
money two years in a row.
To compare itself to its regional peers in China
and Hong Kong, Taiwanese banks fill out the mid-
section of the Greater China banks in terms of size,
but their ROA is weak, with leading large Taiwanese
bank Chinatrust Commercial Bank weighing in at just
110 in the total ROA ranking, and all the other 25 Tai-
wanese banks scattered between 112 and 293. Eight
Taiwanese banks had negative ROAs. This compares
with Chinese Mercantile Bank, which had China’s best
ROA, at position eight, and Citibank (Hong Kong) and
Hang Seng Bank, which were in the top 10 in the ROA
ranking. A single Hong Kong bank had negative ROA,
and the Chinese banks were all positive.
Taiwan: polarized performance
Most of Taiwan’s loss-making banks are repeat offenders
Source: Asian Banker Research
ABJ ISS-92(PG48-96).indd 91ABJ ISS-92(PG48-96).indd 91 8/28/09 1:11:28 AM8/28/09 1:11:28 AM

THE ASIAN BANKER
92 ISSUE 92The Asian Banker
Country Capsules
2366244412024214913682
123456789
Bangkok BankKrung Thai BankKasikornbankSiam Commercial BankBank of AyudhyaTMB BankSiam City BankThanachart BankStandard Chartered Bank (Thailand)
Commercial BankRank Strength Rank 2009
48,04338,12237,35335,57421,36217,25012,03410,8328,323
58235243961014015
1185758
11.9%12.3%14.4%17.9%6.0%1.2%
10.8%9.5%9.0%
1.2%1.0%1.4%1.8%0.7%0.1%1.0%0.6%0.8%
13.8%13.1%15.1%15.2%14.9%13.9%10.4%11.0%12.5%
4.7%8.2%3.7%5.5%
10.0%16.5%8.8%3.0%2.4%
Net Profit($m) ROA ROE CAR
(Total)Assets($m)
Gross NPLRatio
AB300Rank 2009
89 108 113 117 171 194 242 255 286
ThailandThailand: 9 banks in the AB300. Total assets: $228.9 bn. Total net profi ts: $2.4 bn
Source: Asian Banker Research
Despite significant political upheaval in Thai-
land, all nine Thai banks covered in The
Asian Banker 300 (AB300) finished the year 2008
profitably, with three banks—Bank of Ayudhya,
TMB Bank and Siam City Bank—recovering from
losses in 2007. The most outstanding growth
momentum was achieved by Thanachart Bank,
which doubled its net profits year-on-year. Krung
Thai Bank also achieved a 91% net profit growth
year-on-year of $352 million, which put the bank
Thailand: Snakes and ladders
But Taiwanese banks are still living up to their
reputation for resilience and don’t seem to be suf-
fering from high NPLs, with most of the banks still
declaring less than 2%, a sight better than the chronic
delinquencies that the Thai banks have had on their
books for the past decade, for example.
Leading in many of the indicators is Chinatrust.
Not only is it Taiwan’s largest privately run commercial
bank, it is also the island’s most profitable financial
institutions and has the biggest CAR. But it is still
dwarfed by government-owned institutions like Bank
of Taiwan and Taiwan Cooperative Bank, which are
number 40 and number 58 in the region respectively;
Chinatrust comes in at 84.
Taiwan’s largest banks be far are still government-
owned institutions, led by Bank of Taiwan (BOT).
Overall, these banks have seen strong performance in
2008, with asset growth of 3.1% to 7.4% in the case
of BOT. Loan growth was led by Mega International
Commercial Bank, which grew its book by 9.1%, while
deposits at the five state-owned mega banks grew
from 5.2% to BOT’s 21.1%. In Taiwan, banking is still
seen as a government service, and it can be expected
in a downturn for government banks, which tend to
charge few or no fees, to do much better. In the past
year, privately-owned banks like Chinatrust and Taishin
have suffered from charges of mis-selling complicated
structured products linked to Lehman Brothers, and ul-
timately returned to investors some of the money that
they had lost as a result of the investment bank’s col-
lapse. This may be one of the reasons for Chinatrust’s
25% fall in deposits. Taishin saw its assets, loans and
deposits shrink 4%, 8% and 4.8% respectively.
But Taiwanese banks still have relatively high costs,
with only four banks entering ranks of the top 100
banks with the lowest cost-to-income ratios, and their
21 peers are scattered throughout the bottom 200.
Given their low profitability and inefficiency, it does
appear that many Taiwanese banks are barely holding
on. But what will become of its least profitable insti-
tutions? A large number of foreign banks—Citibank,
DBS, HSBC and Standard Chartered Bank—have
already bought into local tier II institutions, as have
private equity players like Carlyle Group. But there
are no more likely candidates among global banks;
Taiwanese banks, fearing government intervention or
low ROIs if the institutions are too small and trouble-
some to integrate, may not be interested.
ABJ ISS-92(PG48-96).indd 92ABJ ISS-92(PG48-96).indd 92 8/28/09 1:11:29 AM8/28/09 1:11:29 AM
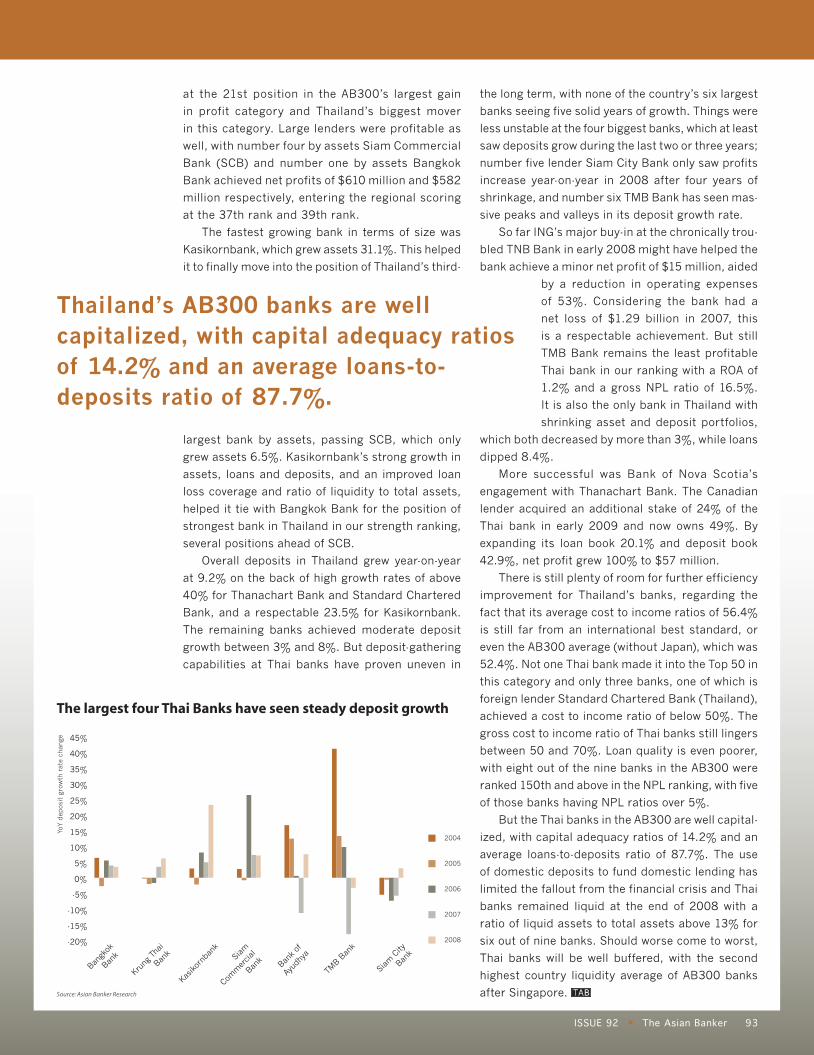
93 ISSUE 92 The Asian Banker
-20%
-15%
-10%
-5%
0%
5%
10%
15%
20%
25%
30%
35%
40%
45%
Bangk
ok
Bank
Krung
Tha
i
Bank
Kasiko
rnba
nkSi
am
Comm
ercia
l
Bank Ban
k of
Ayud
hya
TMB B
ank
Siam
City
Bank
YoY d
epos
it g
row
th r
ate
chan
ge
2004
2005
2006
2007
2008
The largest four Thai Banks have seen steady deposit growth
Source: Asian Banker Research
at the 21st position in the AB300’s largest gain
in profit category and Thailand’s biggest mover
in this category. Large lenders were profitable as
well, with number four by assets Siam Commercial
Bank (SCB) and number one by assets Bangkok
Bank achieved net profits of $610 million and $582
million respectively, entering the regional scoring
at the 37th rank and 39th rank.
The fastest growing bank in terms of size was
Kasikornbank, which grew assets 31.1%. This helped
it to finally move into the position of Thailand’s third-
largest bank by assets, passing SCB, which only
grew assets 6.5%. Kasikornbank’s strong growth in
assets, loans and deposits, and an improved loan
loss coverage and ratio of liquidity to total assets,
helped it tie with Bangkok Bank for the position of
strongest bank in Thailand in our strength ranking,
several positions ahead of SCB.
Overall deposits in Thailand grew year-on-year
at 9.2% on the back of high growth rates of above
40% for Thanachart Bank and Standard Chartered
Bank, and a respectable 23.5% for Kasikornbank.
The remaining banks achieved moderate deposit
growth between 3% and 8%. But deposit-gathering
capabilities at Thai banks have proven uneven in
the long term, with none of the country’s six largest
banks seeing five solid years of growth. Things were
less unstable at the four biggest banks, which at least
saw deposits grow during the last two or three years;
number five lender Siam City Bank only saw profits
increase year-on-year in 2008 after four years of
shrinkage, and number six TMB Bank has seen mas-
sive peaks and valleys in its deposit growth rate.
So far ING’s major buy-in at the chronically trou-
bled TNB Bank in early 2008 might have helped the
bank achieve a minor net profit of $15 million, aided
by a reduction in operating expenses
of 53%. Considering the bank had a
net loss of $1.29 billion in 2007, this
is a respectable achievement. But still
TMB Bank remains the least profitable
Thai bank in our ranking with a ROA of
1.2% and a gross NPL ratio of 16.5%.
It is also the only bank in Thailand with
shrinking asset and deposit portfolios,
which both decreased by more than 3%, while loans
dipped 8.4%.
More successful was Bank of Nova Scotia’s
engagement with Thanachart Bank. The Canadian
lender acquired an additional stake of 24% of the
Thai bank in early 2009 and now owns 49%. By
expanding its loan book 20.1% and deposit book
42.9%, net profit grew 100% to $57 million.
There is still plenty of room for further efficiency
improvement for Thailand’s banks, regarding the
fact that its average cost to income ratios of 56.4%
is still far from an international best standard, or
even the AB300 average (without Japan), which was
52.4%. Not one Thai bank made it into the Top 50 in
this category and only three banks, one of which is
foreign lender Standard Chartered Bank (Thailand),
achieved a cost to income ratio of below 50%. The
gross cost to income ratio of Thai banks still lingers
between 50 and 70%. Loan quality is even poorer,
with eight out of the nine banks in the AB300 were
ranked 150th and above in the NPL ranking, with five
of those banks having NPL ratios over 5%.
But the Thai banks in the AB300 are well capital-
ized, with capital adequacy ratios of 14.2% and an
average loans-to-deposits ratio of 87.7%. The use
of domestic deposits to fund domestic lending has
limited the fallout from the financial crisis and Thai
banks remained liquid at the end of 2008 with a
ratio of liquid assets to total assets above 13% for
six out of nine banks. Should worse come to worst,
Thai banks will be well buffered, with the second
highest country liquidity average of AB300 banks
after Singapore.
Thailand’s AB300 banks are well capitalized, with capital adequacy ratios of 14.2% and an average loans-to-deposits ratio of 87.7%.
ABJ ISS-92(PG48-96).indd 93ABJ ISS-92(PG48-96).indd 93 8/28/09 6:05:17 PM8/28/09 6:05:17 PM

CO - PUBL ISHED ART ICLE
ISSUE 92The Asian Banker94
PL_FISBRDD9029_PGA_Elev.indd 1 7/17/09 4:47:59 PM
The economic crisis has affected different people in dif-ferent ways. For a lot of my friends who hopped to the
hedge funds late last October, not too much has changed since they still pull in million dollar salaries and fl y Emperor
Class. I can’t do that any more since the bank I run was taken over by the govern-
ment and I got a new salary of one dollar a year. Of course, I could have gone to private equity or government, but I
decided to stick around to see if I could be a part
of history. In a way
I don’t envy them their life-style-preserv-ing moves, s i nc e t he y
still have all that stress and
pressure and need to per-
form. S inc e I’m too big to fail, I usu-ally take off at six every night: when the whistle blows, I just punch my card and go home.
Some of those guys ask me how I can make do on my new salary. It’s
pretty easy, actu-ally because of the new s o c i a l i s e d c ond i t i on s I f ind my-self in—my rent is only two cents a month, and I
Ah Phre Niah’s alter ego has a day job at The Asian Banker. He can be reached through [email protected].
can eat in the company cafeteria for one cent a month. I get a membership at the golf club for one cent a year, and my chauffeur service also costs two cents a month. Naturally, with a salary this low I don’t need to pay tax.
Since I don’t have to work weekends any more, I’ve taken up music. The CEO up the street has challenged me to duelling banjos at the end of the year. We’ve both been nationalised, and there’s been talk of us eventu-ally merging. Let’s see if we ever get around to it. But when we do merge, I suppose whoever wins the duel will get to be the CEO, while the other will have to rot as chairman. I’d better practice a bit. Maybe after I take my nap.
Of course, I still have to take business trips from time to time. I like these, because they usually qualify me for some overtime pay—it’s not much, but every bit counts. I also get to live a bit of the old life, because one of the perks of travel is that I still get to fl y Emperor Class again; they call it “Economy Plus” to disguise this disgusting luxury from the proletariat…erm…voters. Sometimes my old friends drop me an email to offer their condolences to my “reduced” circumstances. I don’t even bother to reply. Let them allocate capital effi ciently for a change.
I’ll admit it’s not easy. And sometimes I do have to dip into my savings. I remember that fi rst year; even though I was trying to keep things simple, I burned through my dol-lar in the fi rst six weeks of the year. But I don’t think that I’ve had it as hard as my wife has; she used to have nearly unlimited freedom, both personal and fi nancial, but not any more now that I’m “hovering around all the time.” Our re-acquaintance after all these years hasn’t been smooth. Also, she couldn’t take the microsalary situation, not after decades of conditioning, and has nicknamed me Bernie. I guess that’s code for “left me high and dry fi nancially.” I don’t think that’s really being fair, but she was built for high society, the sort of place where she could lord it over every executive spouse she elbowed aside on her way to the top. I couldn’t give that to her any more. She now gets alimony: half of my salary.
I hope she spends that fi fty cents a year wisely.
Double or nothing (again)
ISSUE 92The Asian Banker94
ABJ ISS-92(PG48-96).indd 94ABJ ISS-92(PG48-96).indd 94 8/28/09 6:07:47 PM8/28/09 6:07:47 PM
95 ISSUE 92 The Asian Banker
Payments ■ Processing Services ■ Risk & Compliance ■ Customer & Channel Management ■ Business Intelligence & Optimization
© 2009 Fiserv, Inc. or its affi liates.
Going up? Today’s shifting demands require a partner who shares your goals with the proven expertise
to help you reach them. For more than 16,000 clients worldwide, Fiserv is transforming the way fi nancial
services are delivered. Helping turn possibilities into realities. With Fiserv, you have the power to go places.
The power within. www.newfi serv.com
Visit us at Sibos, Booth 3C03.
PL_FISBRDD9029_PGA_Elev.indd 1 7/17/09 4:47:59 PM
ABJ ISS-92(PG48-96).indd 95ABJ ISS-92(PG48-96).indd 95 8/28/09 1:11:34 AM8/28/09 1:11:34 AM

96 ISSUE 92The Asian Banker
THE ASIAN BANKER
AMBIT CORPORATE BANKING
Visit SunGard at SIBOS Stand 3G11 or go to www.sungard.com/sibos
©2009 SunGard
You have the vision to imagine the Bank of the Future…SunGard has the solutions to make it real today
Every day, 800 banks in 70 countries rely on SunGard’s Ambit to help them transformtheir business and discover new growth opportunities. Ambit helps them unlock the potentialof their business and become the bank of the future. Ambit is a suite of solutions forretail, commercial and private banking, straight-through enterprise processing, treasury management, finance, risk and compliance.
Trademark information: SunGard, the SunGard logo, and Ambit are trademarks or registered trademarks of SunGard Data Systems Inc. or its subsidiaries in the U.S. andother countries. All other trade names are trademarks or registered trademarks of their respective holders.
The emphasis for our bank is
operational efficiency. With
Ambit Messaging Hub and
its Service Oriented
Architecture, we can create
quick and flexible work
processes without the need
for additional coding.
“
“
ABJ ISS-92(PG48-96).indd 96ABJ ISS-92(PG48-96).indd 96 8/28/09 1:11:35 AM8/28/09 1:11:35 AM