The use of titanium and stainless steel in fracture fixation
Upload
khangminh22Category
view
0download
0
NODULATION, NITROGEN FIXATION AND DIVERSITY OF THE
AFRICAN YAM BEAN RHIZOBIA IN FOUR GHANAIAN SOILS
BY
ABIGAIL TETTEY
(10230237)
THIS THESIS IS SUBMITTED TO THE UNIVERSITY OF GHANA,
LEGON, IN PARTIAL FULFILMENT OF THE REQUIREMENTS FOR
THE AWARD OF MASTER OF PHILOSOPHY DEGREE IN SOIL
SCIENCE.
Department of Soil Science,
School of Agriculture,
College of Basic and Applied Sciences,
University of Ghana, Legon,
Accra, Ghana.
JULY, 2014
University of Ghana http://ugspace.ug.edu.gh

i
DECLARATION
I hereby declare that, except for references to other peoples work, which have been duly cited
and acknowledged, this thesis is the result of my own original research and has not been
presented elsewhere either in part or in whole for another degree.
…………………….……………. ……………………..
Abigail Tettey (Student) Date
………………………………… …………………….
Prof. S. K. A. Danso (Principal Supervisor) Date
………………………………… ………………………
Dr. (Mrs.) S. Asuming–Brempong (Co–supervisor) Date
University of Ghana http://ugspace.ug.edu.gh

ii
DEDICATION
I dedicate this thesis to the blessed memory of Prof. Seth Kofi Akyea Danso, who suddenly
passed away at the final stages of this project. May his soul rest in eternal Peace.
I also dedicate this thesis to Prof. Emmanuel Owusu–Bennoah, for the special interest he took to
help me come this far. God richly bless you.
University of Ghana http://ugspace.ug.edu.gh

iii
ACKNOWLEDGEMENTS
Glory be to the Almighty God for His love, abundant grace and mercy upon my life without
which this thesis would not have been completed successfully.
I express my sincere appreciation and gratitude to my principal supervisor, the late Professor S.
K. A. Danso for his invaluable guidance, suggestions, encouragement and financial support
which have helped me complete this work successfully. I am particularly appreciative of his
strictness and concern. May the Almighty God richly bless him.
A very special thank you to my co–supervisor; Dr. (Mrs) S. Asuming–Brempong for her support,
guidance, understanding and encouragement towards the successful completion of this work.
God bless her abundantly.
I am extremely grateful to Prof. E. Owusu–Bennoah for obtaining a Council for Scientific and
Industrial Research (CSIR)–West African Agricultural Productivity Programme (WAAPP),
CSIR–WAAPP Fellowship for me, without which this work could not have been finished
successfully. I am also very grateful to Dr. (Mrs) R. Mamaa Entsua–Mensah, the Deputy
Director–General, CSIR and all the Coordinators of WAAPP for providing the financial package
for this work.
I am grateful to Dr. I. Y. D. Lawson for reading through this thesis and making the necessary
inputs when Prof. Danso suddenly passed away.
I am also thankful to Dr. T. A. Adjadeh (Head of Department), all Lecturers and technicians of
the Department of Soil Science for their encouragements, suggestions and support in the course
of my study.
A big thank you to all the technicians of Ecological Laboratory of University of Ghana, Legon,
for granting me the permission and also assisting me to carry out my research in their laboratory.
University of Ghana http://ugspace.ug.edu.gh

iv
My appreciation also goes to Dr. S. Amiteye, Mr Ofori Ayerh, Mr Robert Appiah, and all staff of
Biotechnology and Nuclear Agriculture Research Institute (BNARI)–Ghana Atomic Energy
Commission (GAEC) for granting me the permission and helping me to undertake part of my
research in their laboratory.
A special thank you to Mr Benjamin Otu and Mr K. Acquah all of Biotech laboratory, University
of Ghana for the assistance they gave me in the course of my project.
I thank my parents, Mr J. T. Kpabitey and Madam Paulina Ayerkie, and my siblings (Abraham,
Felix and Naomi) for their support and encouragement throughout my course of study.
There are people without whose help this research could not have been a success. In no particular
order, but with equal gratitude for their expertise and support, I wish to thank Mr J. A. Narternor,
Mr M. S. Elegba, Mr D. K. Tsatsu, Mr W. A. Asante, Mr E. N. A. Bonaparte, Mr A. N. Odonkor,
Dr J. Bawole, Mr C. Fasemkye, Mr E. T. Nanor, Mr N. Agyekum and all staff of University of
Ghana Experimental Farms, Legon.
A special thank you goes to all my colleagues especially Daniel Fianko Ansah for the support he
gave me during the period of this research. God bless you.
Finally, to all those who helped me directly and indirectly, I say thank you very much.
University of Ghana http://ugspace.ug.edu.gh

v
ABSTRACT
Indigenous and traditional crops are very essential in the survival strategies of local farmers,
since they have multiple uses such as a variety of plant parts that can be consumed as well as for
medicinal purposes. Traditional crops play an important role in achieving food security as well
as conserving biodiversity. Some of these indigenous crops (e.g. legumes) have the capacity to
establish and grow relatively well on poor fertility soils where crops such as maize (a major
staple cereal) may fail to give good yields. These under–exploited legumes include the African
yam bean (Sphenostylis stenocarpa). Efforts to exploit them in agriculture have been made in
some countries, but little has been reported on the cultivation and performance of similar crops in
Ghanaian soils.
This study was conducted to assess the nodulation, nitrogen fixing potential, the abundance, and
diversity of the rhizobia that nodulate the African yam bean in four Ghanaian soils as well as
assess the response of African yam bean to nitrogen and phosphorus fertilization.
The result of the Most Probable Number (MPN) estimates showed that the four soils contained
varied numbers of indigenous rhizobia capable (from 9.3×10 cells g–1 soil in Toje series to
2.0×10² cells g–1 soil in the Akuse series) of nodulating African yam bean. That of cowpea (used
for comparison) ranged from 1.2×10 cells g–1 soil in the Toje series to 6.8×10² cells g–1 soil in
the Adenta series, with about 75% of the soils tested, containing more than 102 rhizobia cells per
gram of soil.
For the Toje series, African yam bean formed the lowest number of nodules (mean 14 nodules
plant–1), with plants in Haatso forming the highest (mean 39 nodules plant–1). Nodulation in the
Adenta series like that in Haatso series was significantly higher than nodulation in the Akuse
series.
University of Ghana http://ugspace.ug.edu.gh

vi
Nitrogen fertilization had a significant adverse effect on nodulation, nodule dry weight and N
derived from N2 fixation, whiles there was an increase in dry matter yield. In contrast, P
fertilization had a positive effect on all the parameters mentioned above.
The cross–inoculation studies revealed that the African yam bean rhizobia were able to form
nodules on cowpea, yardlong bean and Pueraria, but not on bambara, lima bean and crotalaria,
even though rhizobia isolated from bambara, lima bean and yardlong bean formed nodules on the
African yam bean.
Random amplified polymorphic DNA (RAPD) analysis with RPO4 showed that the 30 isolates
examined consisted of two major genetic groups, with a mean similarity of 60%. A similar
phylogenetic clustering of these isolates was observed with the RPO1 primer with mean
similarity of 54%. However, the RPO1 primer revealed a higher diversity among the African
yam bean isolates in Haatso and Adenta series than did the RPO4 primer, based on the Shannon–
Weiner diversity index. The amplification of the 16S–23S rDNA (ITS) gene of almost all the
isolates gave band of sizes from 350 bp to 850 bp. Combined restriction analysis of digested ITS
region with HhaI and HindIII endonucleases, also distinguished the isolates into two major
phylogenetic groups at 56% similarity level. Characterization of the test rhizobia isolates based
on PCR amplification of the 16S rDNA gene gave almost a single band of 1500 bp. Restriction
of the 16S gene with HaeIII and HhaI enzymes also clustered the isolates into two major groups
at 53% similarity level.
From the results, it can be concluded that, African yam bean rhizobia may be widespread and
diverse in Ghanaian soils. Also, the African yam bean appears to be a relatively permissive host.
This character however may not guarantee effectiveness in N2 fixation and may sometimes lead
to the formation of less effective symbioses with less specific and ineffective strains. It is
therefore recommended that the study be conducted in various areas with different soils types to
University of Ghana http://ugspace.ug.edu.gh

vii
establish the validity of the conclusion, that the African yam bean nodulating rhizobia are
common in most if not all Ghanaian soils. Further taxonomic study of indigenous African yam
bean Rhizobium isolates in different soils should be carried out by taking as many
morphological, biochemical and genetic characters as possible to have a more complete picture
of the taxonomy and the evolutionary relationship between the African yam rhizobia that
nodulate other commonly given legumes, such as cowpea, lima bean and bambara groundnuts.
University of Ghana http://ugspace.ug.edu.gh

viii
TABLE OF CONTENTS
DECLARATION ............................................................................................................................. i
DEDICATION ................................................................................................................................ ii
ACKNOWLEDGEMENTS ........................................................................................................... iii
ABSTRACT .................................................................................................................................... v
TABLE OF CONTENTS ............................................................................................................. viii
LIST OF TABLES ....................................................................................................................... xiv
LIST OF FIGURES ...................................................................................................................... xv
CHAPTER ONE ............................................................................................................................. 1
INTRODUCTION .......................................................................................................................... 1
CHAPTER TWO ............................................................................................................................ 5
LITERATURE REVIEW ............................................................................................................... 5
2.1 Nitrogen in the Biosphere ..................................................................................................... 5
2.2 The Concept of Nitrogen Fixation ........................................................................................ 6
2.2.1 Industrial Nitrogen Fixation (Haber–Bosch process) .................................................... 7
2.2.2 Biological Nitrogen Fixation (The Legume–Rhizobium Symbiosis)............................. 7
2.2.2.1 Nitrogen Fixation by Free–Living Heterotrophs (Asymbiotic fixation).................. 8
2.2.2.2 Symbiotic Nitrogen Fixation.................................................................................... 9
2.3 The Legume Component..................................................................................................... 11
2.3.1 The African yam bean (Sphenostylis stenocarpa) ....................................................... 14
University of Ghana http://ugspace.ug.edu.gh

ix
2.4 The Rhizobium (Nitrogen Fixing Bacterium) ..................................................................... 20
2.4.1 Rhizobia Diversity in Soils .......................................................................................... 21
2.5 Methods of Studying Rhizobium Diversity in Soils ............................................................ 22
2.5.1 Cross Inoculation Group Concept ................................................................................ 22
2.5.2 Cultural and Metabolic Methods ................................................................................. 24
2.5.3 The Molecular Method ................................................................................................ 24
2.5.3.1 Importance of Molecular Biology in Rhizobium Studies ....................................... 25
2.6 Assessment of Biological Nitrogen Fixation ...................................................................... 27
2.6.1 Nodulation and plant total N content ........................................................................... 27
2.7 Measurement of Biological Nitrogen Fixation ................................................................... 28
2.7.1 The Total N Difference Method (TND) ....................................................................... 28
2.7.2 Acetylene Reduction Assay (ARA) ............................................................................. 29
2.7.3 15N Isotope Dilution Method ....................................................................................... 30
2.8 Factors Affecting Biological Nitrogen Fixation ................................................................. 31
2.8.1 Edaphic Factors ............................................................................................................ 31
2.8.1.1 Effect of Soil Nitrogen on Nodulation and Nitrogen Fixation .............................. 32
2.8.1.2 Effect of Soil Phosphorus on Nodulation and Nitrogen Fixation .......................... 32
2.8.1.3 Soil pH ................................................................................................................... 34
2.8.1.4 Availability of Heavy Metals ................................................................................. 34
2.8.1.5 Soil moisture. ......................................................................................................... 35
University of Ghana http://ugspace.ug.edu.gh

x
2.8.1.6 Drought .................................................................................................................. 35
2.8.1.7 Salinity ................................................................................................................... 36
2.8.2 Environmental (Climatic) Factors................................................................................ 37
2.8.2.1 Temperature. .......................................................................................................... 37
2.8.3 Biotic Factors ............................................................................................................... 38
2.8.3.1 Presence of Compatible Rhizobium ....................................................................... 38
2.8.3.2 Crop Effects ........................................................................................................... 39
2.8.3.3 Cropping System .................................................................................................... 39
CHAPTER THREE ...................................................................................................................... 42
MATERIALS AND METHODS .................................................................................................. 42
3.1 Soil Characterization and Description ................................................................................ 42
3.2 Soil Sampling and Analysis ................................................................................................ 43
3.2.1 Chemical Analysis ........................................................................................................... 44
3.2.1.1 Soil pH ...................................................................................................................... 44
3.2.1.2 Available Phosphorus Determination ....................................................................... 44
3.2.1.3 Total Nitrogen Determination ................................................................................... 45
3.2.1.4 Soil Organic Carbon Determination ......................................................................... 46
3.2.1.5 Cation Exchange Capacity (CEC) ............................................................................ 46
3.2.2 Physical Analysis ............................................................................................................. 47
3.2.2.1 Soil Bulk Density ...................................................................................................... 47
University of Ghana http://ugspace.ug.edu.gh

xi
3.2.2.2 Particle Size Analysis ............................................................................................... 47
3.3 Estimation of the populations of rhizobia in the soils using the Most Probable Number
plant infection technique. ...................................................................................................... 49
3.4 The Greenhouse Experiment ............................................................................................... 50
3.4.1 Nodulation Potential of African Yam Bean ................................................................. 50
3.4.2 Nitrogen and Phosphorus Response Experiment ......................................................... 50
3.5 Chemical Analysis of Plant Material .................................................................................. 51
3.5.1 Digestion of Plant Material .......................................................................................... 51
3.5.2 Determination of Plant Total Nitrogen ........................................................................ 52
3.5.3 Determination of Plant Total Phosphorus .................................................................... 53
3.6 Isolation of Rhizobia ........................................................................................................... 54
3.7 Cross Inoculation Studies (Host Range Analysis) .............................................................. 54
3.8 Molecular Characterisation ................................................................................................. 55
3.8.1 Genomic DNA Extraction............................................................................................ 55
3.8.2 PCR Amplification of Genomic DNA using RPO1 and RPO4 Primers ..................... 56
3.8.3 PCR Amplification of 16S–23S Intergenic Spacer (ITS) and 16S rDNA Gene.......... 57
3.8.4 Restriction Fragment Length Polymorphism (RFLP) Analysis................................... 57
3.9 Data Analysis ...................................................................................................................... 58
3.9.1 Statistical Analysis ....................................................................................................... 58
3.9.2 Cluster Analysis ........................................................................................................... 58
3.9.3 Diversity, Richness and Evenness Indices ................................................................... 58
University of Ghana http://ugspace.ug.edu.gh

xii
CHAPTER FOUR ......................................................................................................................... 60
RESULTS ..................................................................................................................................... 60
4.1 Soil characterization............................................................................................................ 60
4.2 Nodulation Potential of African Yam Bean (Sphenostylis stenocarpa) ............................. 62
4.3 Response of African Yam Bean to N Fertilization ............................................................. 63
4.3.1 Effect of Nitrogen Application on Nodulation in African Yam Bean ......................... 63
4.3.2 Effect of Nitrogen application on N2 fixation in African yam bean ............................ 64
4.3.3 Effect of Nitrogen application on N accumulation in African yam bean .................... 65
4.3.4 Effect of Nitrogen Application on Dry Matter Yield of African yam bean................. 66
4.4 Response of African Yam Bean to Phosphorus Application .............................................. 67
4.4.1 Effect of P application on nodulation and nodule dry weight of AYB ........................ 67
4.4.2 Effect of P application on N2 fixation in African yam bean ........................................ 69
4.4.3 Effect of Phosphorus on N accumulation by African yam bean .................................. 70
4.4.4 Effect of Phosphorus application on Dry Matter Yield of African yam bean ............. 71
4.4.5 Effect of P application on P uptake and Phosphorus Utilization Efficiency (PUE) of
African yam bean .................................................................................................................. 72
4.5 Diversity of Indigenous African Yam Bean Rhizobia ........................................................ 73
4.5.1 Cross Inoculation Studies (Host Range Analysis) ....................................................... 73
4.5.2 Molecular Analysis ...................................................................................................... 76
4.5.2.1 DNA Amplification using arbitrarily primed oligonucleotide (RPO4) ................. 76
4.5.2.2 Direct DNA Amplification using nif gene directed primer (RPO1) ...................... 78
University of Ghana http://ugspace.ug.edu.gh

xiii
4.5.2.3 Diversity Indices based on RPO1 and RPO4 genomic DNA Profiles ................... 79
4.5.2.4 RFLP analysis of the amplified 16S–23S rDNA Spacer (ITS).............................. 81
4.5.2.5 RFLP analysis of the amplified 16S rDNA region. ............................................... 82
CHAPTER FIVE .......................................................................................................................... 84
DISCUSSION ............................................................................................................................... 84
5.1 Soil Characterisation ........................................................................................................... 84
5.2 Nodulation of African yam bean (Sphenostylis stenocarpa) in four Ghanaian Soils. ........ 85
5.3 Nitrogen and Phosphorus Response Studies ....................................................................... 87
5.3.1 Response of African Yam Bean to Nitrogen Fertilization ........................................... 87
5.3.2 Response of African Yam Bean to Phosphorus Fertilization ...................................... 90
5.4 Diversity of Indigenous African Yam Bean Rhizobium Isolates ........................................ 93
5.4.1 Cross Inoculation Studies (Host Range Analysis) ....................................................... 93
5.4.2 Molecular Analysis ...................................................................................................... 95
CHAPTER SIX ............................................................................................................................. 99
SUMMARY, CONCLUSION AND RECOMMENDATIONS ................................................... 99
6.1 SUMMARY AND CONCLUSION ................................................................................... 99
6.2 RECOMMENDATIONS .................................................................................................. 101
REFERENCES ........................................................................................................................... 102
APPENDICES ............................................................................................................................ 138
University of Ghana http://ugspace.ug.edu.gh

xiv
LIST OF TABLES
Table 2.1: Taxonomic profile of African yam bean. .................................................................... 15
Table 2. 2: Cross–Inoculation Group (C–IG) and Legume–Rhizobium Association. .................. 23
Table 4.1: Some chemical, physical and biological characteristics of the four soils used. .......... 60
Table 4.2: Nodulation, N accumulation and Shoot dry weight of African Yam Bean grown in
four Ghanaian Soils...................................................................................................... 62
Table 4.3: Effect of N application on nodulation and nodule mass of African yam bean in two
soils. ............................................................................................................................. 64
Table 4.4: Effect of Nitrogen on N2 fixation in African yam bean in two Ghanaian soils. .......... 65
Table 4.5: Effect of Nitrogen application on N accumulation and shoot total N of African yam
bean in two soils........................................................................................................... 66
Table 4.6: Effect of P application on nodulation and nodule mass of African yam bean in two
soils. ............................................................................................................................. 69
Table 4.7: Effect of Phosphorus on N2 fixation in African yam bean in two soils. ...................... 70
Table 4.8: Effect of P application on Percent Shoot N and shoot total N of African yam bean in
two soils. ...................................................................................................................... 71
Table 4.9: Effect of Phosphorus on P uptake and P Utilisation Efficiency. ................................. 73
Table 4.10: Test of the abilities of five African yam bean Bradyrhizobia isolates to cross
inoculate five host legumes. ......................................................................................... 74
Table 4.11: Shannon–Weaver diversity, Pielou evenness and Margalef richness indexes of RPO1
and RPO4 amplified DNA profiles of 30 Bradyrhizobium isolates of African yam
bean obtained from four Ghanaian soils. ..................................................................... 80
University of Ghana http://ugspace.ug.edu.gh

xv
LIST OF FIGURES
Figure 2.1: The Nitrogen Cycle. ..................................................................................................... 5
Figure 2.2: A, B, and C are samples of the different varieties of African yam bean grains, and D
is a sample of the edible root tuber of the African yam bean plant. ............................ 19
Figure 4.1: Shoot dry weight of African yam bean in Adenta and Akuse soils as affected by N
application. ................................................................................................................... 67
Figure 4.2: Shoot dry weight of African yam bean in Adenta and Akuse soils as affected by
phosphorus application. ............................................................................................... 72
Figure 4.3: Abilities of Rhizobium isolates obtained from three different legume genera to form
nodules on African yam bean. ..................................................................................... 75
Figure 4.4: Sample of a horizontal Gel electrophoretic pattern of amplified DNA of 15 African
yam bean bradyrhizobia isolates using RPO4 Primer. Lane M: 100 bp molecular
maker and Lane 1–15 are rhizobia isolates. ................................................................. 77
Figure 4.5: Dendrogram generated with Un–weighted pair group with mathematical average
(UPGMA) showing genetic relationships among 30 African yam bean bradyrhizobia
isolates identified by RPO4 Primer analysis. AK, AD, HTS and TJ implies isolates
from Akuse, Adenta, Haatso and Toje soils respectively. ........................................... 77
Figure 4.6: Sample of a Gel electrophoretic pattern of amplified DNA of African yam bean
rhizobia using RPO1 Primer. Lane M: 100 bp molecular maker and Lane 1–19 are
rhizobia isolates. .......................................................................................................... 78
Figure 4.7: Dendrogram (UPGMA) of genetic relationships among 30 African yam bean
bradyrhizobia isolates identified by RPO1 Primer analysis. AK, AD, HTS and TJ
implies isolates from Akuse, Adenta, Haatso and Toje soil series’ respectively. ....... 79
University of Ghana http://ugspace.ug.edu.gh
xvi
Figure 4.8: UPGMA dendrogram based on the combined HhaI and HindIII ITS RFLPs of 30
bradyrhizobia isolates of African yam bean strains. AK, AD, HTS and TJ implies
isolates from Akuse, Adenta, Haatso and Toje soil series’ respectively. .................... 82
Figure 4.9: UPGMA dendrogram based on the combined HhaI and HaeIII 16S RFLPs and of
nodule isolates of African yam bean strains. AK, AD, HTS and TJ implies isolates
from Akuse, Adenta, Haatso and Toje soil series’ respectively. ................................. 83
University of Ghana http://ugspace.ug.edu.gh

1
CHAPTER ONE
INTRODUCTION
Even though nodulated legumes have been used by indigenous people in Africa for centuries, it
is sometimes doubtful if their full potential has been realized (Sprent et al., 2010). Legumes are
recognized as a source of dietary protein and energy in the countries where cost of animal protein
is high (Amarowicz & Pegg, 2008). Protein contents in legume grains range from 17% to 40%,
contrasting with the 7–13% of cereals, and being equal to the 18–25% protein contents of meat
(Genovese & Lajolo, 2001). The leaves are sometimes eaten, either raw or cooked, the grain is
eaten fresh or dried, and the haulms are used as forage.
A hallmark trait of legumes is their ability to nodulate and fix atmospheric nitrogen in symbiosis
with compatible soil bacteria (rhizobia). Most studies on legume–Rhizobium symbiosis focus on
biomass productivity, nodulation, nitrogen fixation and its residual effect of domesticated food
legumes (Mapfumo et al., 1999; Mafongoya et al., 2002), with little attention to indigenous
legumes. Vast collections of indigenous legumes are present in Africa, ranging from large
rainforest trees to small annual herbs (Lock, 1989). Most indigenous crops have multiple uses
and a variety of plant parts that can be consumed. They produce both edible seeds and tubers and
thus have the potential of expanding the food basket of Africans, including Ghanaians. Thus,
traditional crops play an important role in achieving food security and in conserving biological
diversity (Warren, 1991). However, there is very little evidence of their domestication and
cultivation. Most indigenous crops (e.g. legumes) have the capacity to establish and grow
relatively well on poor fertility soils where crops such as maize (a major staple cereal) have
failed to give good yields (Mapfumo et al., 2005).
University of Ghana http://ugspace.ug.edu.gh

2
Poor and declining soil fertility, increasing cost of mineral fertilizers and the associated
environmental effects, low availability and poor quality of organic amendments remain major
challenges to food security in Africa (Smaling et al., 1997; Giller et al., 1997). High demand for
land for non–agricultural purposes has also significantly reduced the fallowing durations, as a
traditional soil fertility regeneration practice (Mafongoya et al., 2006). Thus traditional crops are
very vital in the survival strategies of most African farmers, since most indigenous crops are able
to grow on marginal, leached or eroded land.
Grain legumes constitute the main source of protein in the diets of the average Ghanaian home
(Klu et al., 2001). The widely used ones include cowpea (Vigna unguiculata), groundnut
(Arachis hypogaea), lima bean (Phaseolus lunatus) among others (Klu et al., 2001). However,
there are other pulses (grain legumes) that could help meet human dietary needs but are
cultivated only in localized areas and used less. These under–exploited legumes include African
yam bean (Sphenostylis stenocarpa), bambara groundnut (Vigna subterranea) and pigeon pea
(Cajanus cajan) (Klu et al., 2001).
In Ghana however, except for the highly popular legumes such as cowpea, soybean, groundnut,
bambara, few reliable data are available on the abilities of other legumes to nodulate and fix
nitrogen with naturally occurring strains of rhizobia in various soils. However, there are several
others which have not been well studied with regards to their ability to fix nitrogen into the soil
and improve soil fertility, and even serve as food sources. Efforts to exploit them in productive
agriculture have been made in some countries, but little has been reported on the cultivation and
performance of similar species in Ghanaian soils.
University of Ghana http://ugspace.ug.edu.gh

3
Food security and sustainability is a serious global concern in recent times, and many indigenous
food crops of Africa which promise to ameliorate food and nutritional insecurities are presently
neglected and under–utilized (Adewale & Odoh, 2012). African yam bean is one of such crop
with great nutritional potentials. Thus the subsistence nature of production of the crop may have
been occasioned by its poor acceptability as a valuable crop among middle–aged farmers in
Africa (Adewale & Odoh, 2012). The poor awareness about the taxonomy, nodulation, and
nitrogen fixing ability, variety and nutritional value of edible parts of the African yam bean may
be due to limited research on it.
Further research and development of these and other species is essential for human livelihood, to
retain agricultural production and biodiversity in a changing world that is being increasingly
dominated by a few crops. Thus, screening rhizosphere soils of legumes for the presence and
abundance of highly effective native Rhizobium strains in soils is therefore very crucial and
highly effective in efforts to promote greater exploitation of biological nitrogen fixation as a
substitute or supplement to nitrogen fertilization (Dogbe et al., 2000). This information is
somehow not adequate or is lacking. Besides, since many soil types that occur in Ghana are
found in the West African sub–region, it is likely that such information could be useful to
farmers in other countries of the sub–region.
Therefore to contribute towards bridging of this knowledge gap, this study was carried out to
investigate the nodulation and N2 fixation of the African yam bean in some Ghanaian soils, as
well as to evaluate the homologous rhizobia of African yam bean found in four Ghanaian soils.
University of Ghana http://ugspace.ug.edu.gh

4
Specific study objectives are:
1) Enumerate the populations of indigenous rhizobia capable of nodulating the African yam
bean in four soils in Ghana.
2) Assess how nitrogen and phosphorus fertilization influence nodulation, N fixation and
growth of the African yam bean.
3) To assess the diversity of the obtained rhizobia isolates.
Research Questions
1) Does the indigenous rhizobia have the potential to fix N2 in African yam bean?
2) How compactible are the rhizobia that nodulate the African yam bean with tropical food
and forage legumes?
3) How genetically diverse is the African yam bean nodulating Rhizobium?
University of Ghana http://ugspace.ug.edu.gh

5
CHAPTER TWO
LITERATURE REVIEW
2.1 Nitrogen in the Biosphere
Nitrogen is an important component of many organic molecules such as DNA, RNA and proteins
which are the building blocks of life. Nitrogen constitutes 78% of the air we breathe in terms of
volume. Even though the majority of the air we breathe is N2, most of this is unavailable for
plants use. This is because of the strong triple bond between the N atoms in the N2 molecule,
making it somewhat inert. Thus, in order for plants and animals to use nitrogen, it must be
converted to either ammonium (NH4+), nitrate (NO3
–) or organic nitrogen. Nitrogen is a versatile
element that exists in both organic and inorganic forms as well as in many different oxidation
states (Harrison, 2003).
The movement of nitrogen between the atmosphere, biosphere, and geosphere is summarised in
the nitrogen cycle in Figure 2.1 (http://www.ianlee.co.uk/oldweb/nitrogen.htm).
Figure 2.1: The Nitrogen Cycle.
University of Ghana http://ugspace.ug.edu.gh

6
Nitrogen (N), one of the macronutrients, is most often found limiting for plant growth. This is
attributed to the continual loss of nitrogen from the reserve of fixed nitrogen or combined,
present in soil and available for use by plants. Available soil nitrogen is constantly depleted by
processes such as microbial denitrification, soil erosion, leaching, chemical volatilization,
removal of nitrogen–containing crop residues from the land surface. Thus, the nitrogen reserve in
agricultural soils must be replenished intermittently, in order to maintain an adequate level of
nitrogen for crop production. Soil nitrogen is normally replenished through the addition of
inorganic nitrogenous fertilizers or by the activity of biological nitrogen fixation systems.
2.2 The Concept of Nitrogen Fixation
Plant growth is often limited by the availability of nitrogen in the soil even though 78–80% of
the atmosphere is composed of nitrogen gas (N2). Therefore atmospheric nitrogen can only be
used by plants, when it is ‘fixed’; that is, split and combined with hydrogen or oxygen. This
process of nitrogen fixation requires a large input of energy (Wagner, 2012) and can occur either
biologically, within the cells of various bacteria, chemically (in fertilizer industries) or during
lightning.
Nitrogen fixation occurs both biologically and non–biologically. Non–biological nitrogen
fixation occurs through the effects of lightning, and in industry primarily through the Haber–
Bosch process. Industrial nitrogen fixation in the form of nitrogen fertilizer has increased from
3.5 million tons in 1950 to 80 million tons in 1989 (Hardy, 1993) and 1.4×10¹⁴ Mg N year–1
(Canfield et al., 2010) in response to the needs of high–yielding crops. Lightning worldwide is
also reported to contribute approximately 1×10¹⁰ kg NH3 per year (Cheng, 2008). Cheng (2008)
reported that approximately 2 tonnes of industrially–fixed nitrogen are needed as fertilizer for
University of Ghana http://ugspace.ug.edu.gh

7
crop production to equal the effects of 1 tonne of nitrogen biologically–fixed by legume.
Biological nitrogen fixation is estimated at 1.1×10¹⁴ Mg N year–1 (Canfield et al., 2010).
2.2.1 Industrial Nitrogen Fixation (Haber–Bosch process)
The split of the stable triple bond of molecular nitrogen (N≡N) is very energy demanding and is
accomplished at high temperatures (600–800°C) and pressures (as much as 5.06×10⁷ Pa)
(Cheng, 2008). At a temperature of about 600°C, atmospheric nitrogen and hydrogen (usually
derived from natural gas or petroleum) are combined chemically in a vessel to form ammonia
(NH3). Catalyst (usually iron with oxides of aluminium and potassium) are added to the vessel to
speed up the chemical reaction. The Haber process is a widely used process for the commercial
production of ammonia. The process is summarised in the following equation
(http://www.reference.com/browse/haber+process).
𝑁2(𝑔) + 3𝐻2(𝑔)ℎ𝑒𝑎𝑡, 𝑝𝑟𝑒𝑠𝑠𝑢𝑟𝑒 & 𝑚𝑒𝑡𝑎𝑙 𝑐𝑎𝑡𝑎𝑙𝑦𝑠𝑡⇔ 2𝑁𝐻3(𝑔) (𝛥𝐻 = 92.4 𝑘𝐽 𝑚𝑜𝑙
−1)
2.2.2 Biological Nitrogen Fixation (The Legume–Rhizobium Symbiosis)
Biological nitrogen fixation involves the fixing of atmospheric nitrogen through symbiotic and
asymbiotic means (Raven et al., 1992). Biological nitrogen fixation is an important and
environmentally friendly natural process that supports life on this planet (Salisbury & Ross,
1992), since plants and animals obtain nitrogen from either nitrogen–fixing organisms or from
nitrogen fertilizers. Many kinds of microbes live in close association with specific host plants,
and hence benefit from these associations by obtaining carbon and other nutrients from their
hosts. A variety of bacteria, fungi, nematodes and protozoa colonize the rhizosphere of plants,
existing either as free–living organisms in the soil or attached to surface of plant roots (Bowen &
Rovira, 1999), since carbon and minerals sources are very much in abundance in the zone
University of Ghana http://ugspace.ug.edu.gh

8
(Walker et al., 2003). Marschner (1993) also attributed this is due to the fact that plants exude
high levels of nutrients from their roots, including low–molecular–weight root exudates (such as
amino acids, organic acids, sugars, aromatics and other secondary metabolite) and high–
molecular–weight root exudates (such as polysaccharides and proteins).
Soil bacteria belonging to various genera of the order Rhizobiales (collectively called rhizobia)
are able to invade legume roots in nitrogen–limiting environments, thus leading to the formation
of root nodules (Soto et al., 2006 ). In the root nodules through the induction of the nitrogenase
complex, the Rhizobium is able to convert atmospheric nitrogen into ammonia, which is used by
the plant, while the plant supplies carbon source to the bacteria for the reduction of nitrogen.
Furthermore the process involves the release of flavonoids from the root of the legume host,
induce transcription of nodulation genes in compatible Rhizobium, leading to the formation of
lipochito–oligosaccharide molecules that, in turn, signal the host plant to begin nodule formation
(Long, 1996).
2.2.2.1 Nitrogen Fixation by Free–Living Heterotrophs (Asymbiotic fixation)
Many heterotrophic bacteria live in the soil and fix significant levels of nitrogen without the
direct interaction with other organisms (Wagner, 2012). Examples of free–living nitrogen–fixing
bacteria include species of Azotobacter, Bacillus, Clostridium, and Klebsiella. These bacteria
must find their own source of energy, typically by oxidizing organic molecules released by other
organisms or from decomposition (Wagner, 2012). However there are some free–living
organisms that have chemolithotrophic abilities and can thereby are able to utilize inorganic
compounds as sources of energy to fix atmospheric nitrogen (Wagner, 2012). Because the
activity of nitrogenase can be inhibited by oxygen, free–living organisms behave as anaerobes or
microaerophiles during the process of nitrogen fixation. However, because of the scarceness of
University of Ghana http://ugspace.ug.edu.gh

9
suitable carbon and energy sources for the free–living organisms, their contribution to global
nitrogen fixation rates is generally considered minor (Wagner, 2012). However, Vadakattu and
Paterson (2006) in an intensive wheat rotation farming system study in Australia demonstrated
that free–living microorganisms contributed 20 kg N ha–1 yr–1 to the cropping system (i.e. about
30–50% of the total nitrogen needs). Nonetheless, maintaining wheat stubble and reduced tillage
in this system, was reported by Vadakattu and Paterson (2006) to provide the necessary high–
carbon, low–nitrogen environment to optimize the activity of the free–living organisms.
Associative Nitrogen Fixation
Species of Azospirillum are able to form close associations with several members of the grass
family, Poaceae, comprising agronomically important cereal crops, such as rice, wheat, corn,
oats, and barley (Tarrand et al., 1978). Appreciable amounts of nitrogen fixed by these bacteria
have been reported within the rhizosphere of the host plants. Vlassak and Reynders (1997)
commented that the level of associative nitrogen fixation is influenced by several factors,
including soil temperature, the ability of the host plant to provide a rhizosphere environment low
in oxygen, the availability of host photosynthate for the bacteria, the competitiveness of the
bacteria, and the efficiency of nitrogenase.
2.2.2.2 Symbiotic Nitrogen Fixation
Symbiotic nitrogen fixation occurs when nitrogen fixing bacteria such as Rhizobium form
symbiotic relationships with legume host plants. In this relationship, the nitrogen fixing bacteria
inhabit the legume root nodules and receive carbohydrates as well as a favourable environment
from their host plant in exchange for the atmosphere nitrogen they fix (Harrison, 2003). The
energy requirements of BNF are met by renewable sources such as plant–synthesized
carbohydrates rather than from non–renewable fossil fuels such as natural gas. The plant
University of Ghana http://ugspace.ug.edu.gh

10
provides the rhizobia with sugars from photosynthesis (for energy), micronutrients and
ultimately provides shelter from desiccation and predation (Sprent & Raven, 1992). The fixed
nitrogen is exported from the nodule in several different forms (White et al., 2007) and are taken
up by the host plant for protein synthesis and its growth and development (Sessitsch et al., 2002).
This mutualistic relationship between the Leguminosae and the Rhizobiceae forms the basis for
the ecological importance of legumes in natural and agricultural ecosystems. Thus, symbiotic
legumes contribute largely to the N economy of the ecosystems, with asymbiotic and symbiotic
biological systems fixing an estimated 100–175 million metric tons of nitrogen annually (Burns
& Hardy, 1975). The process of biological nitrogen fixation has been studied extensively (Leigh,
2002), however, the nitrogen reduction process is a very complex mechanism which has not yet
been fully elucidated (Franche et al., 2009). The result of net reduction of molecular nitrogen to
ammonia is generally accounted for by the following equation (Vance, 2008):
𝑁2 + 8𝑒− + 8𝐻+ + 16𝐴𝑇𝑃 → 2𝑁𝐻3 + 16𝐴𝐷𝑃 + 16𝑃𝑖 +𝐻2
The above chemical equation essentially requires the molybdenum (Mo) and Fe proteins of the
nitrogenase enzyme, an electron source and a supply of ATP (Howard & Rees, 1996). The
process has to overcome the presence of oxygen (O2) released when ATP is generated in the
bacteroids (rhizobia transformed in compartmentalised cells in which they are capable of N2
fixation) (Schauser et al., 2008), as oxygen inactivates nitrogenase synthesis (Hill et al., 1981).
This problem is overcome by plant–derived leghaemoglobin which binds with O2 and facilitates
O2 diffusion through the bacteroids at a low and buffered concentration (Burris & Haas, 1994).
An example is the water fern Azolla’s symbiosis with a cyanobacterium Anabaena azollae.
Anabaena colonizes the cavities formed at the base of Azolla fronds. The cyanobacteria fixes
nitrogen in specialized cells called heterocysts. Rice paddies are typically covered with Azolla
University of Ghana http://ugspace.ug.edu.gh

11
blooms that fix up to 600 kg N ha–1 during the growing season (Fattah, 2005). The second
example is the symbiosis between actinorhizal trees with the actinomycete, Frankia.
Actinorhizal plants are found in many ecosystems including alpine, xeric, forest, glacial till,
riparian, coastal dune, and arctic tundra environments (Benson & Sylvester, 1993). Even though
the symbiotic partners described above play an important role in the worldwide ecology of
nitrogen fixation, by far the most important nitrogen–fixing symbiotic associations are the
relationships between legumes and Rhizobium bacteria.
2.3 The Legume Component
Leguminous plants are relevant economic crops, because of their diversity, manifested in their
ability to adapt to a wide range of ecological conditions, the variety of their edible parts, high
protein content of the grains, their use as pastures, etc. (Morel et al., 2012). A hallmark trait of
legumes is their ability to nodulate and fix atmospheric nitrogen in symbiosis with compatible
Rhizobium strains. This ability of many legumes to nodulate is an issue of ecological and
economic importance (Zahran, 2009).
Legumes are flowering plants that produce seedpods while some produce root tubers (Morel et
al., 2012). They have colonized several ecosystems (Schrire et al., 2005), and have been found in
most of the archaeological annals of plants (Morel et al., 2012).
Leguminosae (alternatively Fabaceae) is the third most populous family of flowering plants
(behind Asteraceae and Orchidaceae) with 670 to 750 genera and 18,000 to 19,000 species
(Rivas et al., 2009). Traditionally, three main subfamilies are distinguished: Caesalpinoidae,
Mimosoidae and Papilionidae. The Caesalpinoidae has very few nodulating members, whereas
most of the important agricultural crops are members of the Papilionidae (Giller, 2001). The
Mimosoidae has recently received attention, since, in many cases, bacteria recovered from their
University of Ghana http://ugspace.ug.edu.gh

12
nodules belong to the beta subclass of Proteobacteria, while Papilionidae symbionts belong to
the alpha subclass (Chen et al., 2003). However, not all species of the Leguminosae can form
symbioses with Rhizobium (Sprent, 2001). It is estimated that only 5% of the genera within the
Caesalpinioideae can be nodulated, while within the Mimosoideae and Papilionoideae, this
proportion increases to approximately 88% and 97%, respectively (Sprent, 2008).
Parasponia spp is the only non–legume woody plant that has been reported to form symbiosis
with Rhizobium and utilize nitrogen fixed by the bacteria (Becking, 1992). The Parasponia–
Rhizobium association can be highly effective with levels of nitrogen fixation comparable with
those observed in legume–Rhizobium symbioses (Trinick, 1980). Both fast and slow–growing
rhizobia (Rhizobium and Bradyrhizobium) are capable of nodulating Parasponia species (Trinick
& Hadobas, 1988).
Leguminous plants are very diverse in morphology, habitat, and ecology, ranging from annual
herbs to giant forest trees (Singh et al., 2007). Some 25% of the world’s major crop production is
derived from legumes, and more than one–third of humanity’s nutritional nitrogen requirement
comes from legumes (Rivas et al., 2009). Grain legumes are widely recognized as essential
sources of food and feed proteins (Howieson et al., 2000). In many regions of the world, legume
seeds are the unique supply of protein in the diet and they often represent a necessary supplement
to other protein sources (Rivas et al., 2009). Legumes also contain many health–promoting
components, such as fibre, resistant starch, minerals, and numerous phytochemicals endowed
with useful biological activities (Amarowicz & Pegg, 2008). Hydrophilic phytochemicals, such
as ascorbic acid, phenolic acids and polyphenols, have been associated with an enhancement of
the immune system functionality and reduced cancer risk, whereas lipophilic phytonutrients,
University of Ghana http://ugspace.ug.edu.gh

13
such as carotenoids and tocopherols, may prevent the risk of cardiovascular and some eye
diseases (Dillard & German, 2000).
Besides, legumes are very important both agriculturally and ecologically since they are
responsible for a substantial part of the global flux of nitrogen from atmospheric N2 to fixed
forms such as ammonia, nitrate, and organic nitrogen. They are harvested as food for human and
as feed for animal consumption as well as used for fuel–woods, timber, oil production, and
medicinal purposes. They are also cultivated as ornamentals, used as living fences and
firebreaks, etc (Lewis et al., 2005). They are also utilized as cover crops, intercropped with
cereals and other staple foods, used as agro–forestry trees due to their nitrogen fixing abilities. In
rotation with cereals, legumes provide a source of slow–release nitrogen that contributes to
sustainable cropping systems (Popelka et al., 2004).
Legumes, by virtue of their capacity to fix nitrogen, are widely distributed in all tropical soils
displaying a wide range of tolerance to acidity, alkalinity, water logging, mineral deficiency and
drought (Rengel, 2002). They can colonize marginal lands and impoverished soils, thus offering
some advantages in rehabilitating degraded and marginalized soils (Assefa, 1993). Legumes are
environmentally friendly plants since all the nitrogen they fix in association with the rhizobia is
assimilated by the plants with no leaching and ground water pollution (Diriba, 2007). Legumes
play a critical role in natural ecosystems, agriculture and agroforestry where their ability to fix
nitrogen in symbiosis with rhizobia makes them excellent colonizers of low–nitrogen
environments (Graham & Vance, 2003).
Grain legumes (beans, peas, lentils, etc) provide about 33% of the dietary protein requirements
of humans (Vance et al., 2000). Soybean and peanut, provide more than 35% of the worlds
processed vegetable oils. Grain legumes, fodder–pasture legumes, N2–fixing shrub and tree
University of Ghana http://ugspace.ug.edu.gh

14
legumes are important for cropping systems in Africa (Dakora & Keya, 1997). They are able to
grow in diverse ecological zones in the continent, including low fertility soils, and nodulate with
a wide diversity of rhizobia and bradyrhizobia (Dakora & Keya, 1997).
Cowpea (Vigna unguiculata), bambara groundnut (Vigna subterranean), Kersting’s bean
(Macrotyloma geocarpum) are among the major indigenous legumes cultivated throughout sub–
Saharan Africa (Dakora & Keya, 1997). Nonetheless, imported species such as common bean,
groundnut, pigeon pea and soybean have also become important components of the traditional
cropping systems in sub–Saharan Africa (Dakora & Keya, 1997).
Research attention has started to focus on the undomesticated/neglected/underutilized food
legumes in Africa (Dakora & Keya, 1997). The most significant of these species, with regards to
food use and value, include, marama bean (Tylosema esculentum), Sphenostylis stenocarpa
(African yam bean), Vigna Zobatifolia and Vigna vexillata, which produce tubers with protein
content ranging from 8 to 15%; levels higher than any conventional tuber crop (Dakora & Keya,
1997). The seeds are also rich in protein and essential amino acids such as methionine and lysine.
The scientifically unimproved marama bean rivals soybean and groundnut in both protein and oil
contents (Dakora & Keya, 1997). These undomesticated food legumes are similar in their ability
to grow in highly leached and low fertility soils, and thrive in harsher conditions. The capacity of
these legumes to grow in poor nitrogen soils, and yet store great quantities of protein in seeds
and tubers, suggests a dependence on symbiotic fixation for N nutrition.
2.3.1 The African yam bean (Sphenostylis stenocarpa)
African yam bean (Sphenostylis stenocarpa [Hochst. Ex. A. Rich.] Harm) like other tuberous
legumes (e.g. Pachyrhizus sp.) belongs to the Fabaceae family and the order Fabales and by its
name is indigenous to tropical Africa (Potter, 1992). Harms (1899) evolved the generic name
University of Ghana http://ugspace.ug.edu.gh

15
Sphenostylis as the botanical genus to describe a group of distinctive leguminous taxon formerly
grouped within the Dolichos and Vigna genera (Adewale & Odoh, 2012).
The African yam bean (Sphenostylis stenocarpa) should not be confused with the Pachyrhizus
spp which in many places in the literature are referred to as “yam bean”, Mexican yam bean,
Mexican turnip Jicama, ahipa, etc (Adewale & Dumet, 2011). Pachyrhizus spp. is a more
popular tuberous legume that is common in the tropics of Asia and Southern America (Adewale
& Dumet, 2011). There are seven species within the genus, Sphenostylis, however, Sphenostylis
stenocarpa is economically, the most important species (Potter & Doyle, 1994). The taxonomic
profile of African yam bean is presented in Table 2.1.
Table 2.1: Taxonomic profile of African yam bean.
Rank Scientific /Common Name
Kingdom Plantae
Subkingdom Tracheobionta (vascular plants)
Super division (phylum) Spermatophyta (seed plants)
Division (sub phylum) Magnoliophyta (flowering plants)
Class Magnoliopsida (Dicotyledons)
Subclass Rosidae
Order Fabales
Family Fabaceae (Pea family)
Sub family Papilionoideae
Tribe Phaseoleae
Sub tribe Phaseolinae
Genus Sphenostylis E. Meyer (Sphenostylis)
Species Sphenostylis stenocarpa (Hochst. Ex. A. Rich.) Harms. (AYB)
Source: http//plants.usda.gov/core/profile? Symbol=spst8.
University of Ghana http://ugspace.ug.edu.gh

16
African yam bean is the most important, most cultivated and most valuable species in the genus
Sphenostylis (Potter & Doyle, 1992). This tuberous legume is important in most indigenous
African food cultures and in peasant agriculture (Adewale & Dumet, 2011). There is no record of
the origin of the crop in any other continent except Africa (Potter & Doyle, 1994). This confirms
the claim that the crop is a tropical African legume. The African yam bean is common in Central
and West Africa, particularly in Cameroon, Cote d'Ivoire, Ghana, Nigeria, Togo (Porter, 1992),
Gabon, Democratic Republic of Congo, Ethiopia, parts of East Africa, Malawi and Zimbabwe
(Uttech, 2007). Adansi (1975) reported that it was introduced into Ghana from Togo. It is usually
cultivated as a secondary crop with yam and cassava in Ghana and Nigeria (Adewale, 2010). In
Ghana it is found in localized areas in the Volta Region, where it is grown by peasant farmers as
a security crop (Klu et al., 2001). Farmers who still hold some seed stocks, especially the white
with black–eye pattern, plant it at the base of yam mounds in June or July (Amoatey et al.,
2000). The African yam bean flourishes and takes over the stakes from senescing yam.
African yam bean is a vigorously climbing herbaceous vine whose height can reach 1.5–3 m or
more (Adewale & Dumet, 2011). The main vine/stem produces many branches which also twine
strongly on available stakes (Adewale & Dumet, 2011). African yam bean flowers profusely in
100 to 150 days, producing brightly–coloured flowers, which may be pink, purple or greenish
white, which mature into slightly woody pods containing about 20 to 30 seeds (Klu et al., 2001).
The flowers seem to exhibit self–pollination; up to six pods/peduncle results after fertilization
with usually linear and long pods which turn brown when mature (Dukes, 1981). The pods which
are sometimes flat or raised in a ridge–like form on both margins are usually prone to shattering;
they dehisce along the dorsal and ventral sutures when dry. The seeds are sometimes round, oval,
oblong, or rhomboid with different colours (Oshodi et al., 1995) and size (Adewale et al., 2010).
University of Ghana http://ugspace.ug.edu.gh

17
Mono–coloured seeds are white, grey, cream, light or dark brown, purple, or black. The stem of
the plant produces small underground tubers of various sizes and shapes (Adewale & Dumet,
2011). The seeds are hard and diverse in colour and shape, usually spherical, ellipsoid with dark–
brown, creamy–white or brownish yellow colour (Edem et al., 1990). The tubers are white,
watery and very similar to sweet potatoes (Kay, 1987). The seeds and tubers are the two major
organs of economic importance as food; however, there are cultural and regional preferences
(Adewale & Dumet, 2011). In West Africa for instance, the seeds are preferred to the tubers,
while the tubers are appreciated in East and Central Africa (Potter, 1992).
The African yam bean is found in forests, open and wooded grasslands, rocky fields as well as
marshy grounds, occurring both as a cultivated crop and as weed (Potter, 1992). The African
yam bean grows on a wide range of soils including acid and highly leached sandy soils at
altitudes, ranging from sea level to 1,950 m (Duke et al., 1977). The suitability of the African
yam bean for different ecologies, varied soil and climatic conditions (Schippers, 2000) suggests
that it can potentially serve as an important crop for food security. This ability of the crop to
survive in diverse agro ecological conditions of Africa must have aided its continual existence
over times (Klu et al., 2001). In Ghana and Nigeria, only a small sector of farmers are involved
in its cultivation, hence, they are the holders of the crop’s genetic resources (Adewale et al.,
2012).
African yam bean seed has higher amino acid content than that found in pigeon pea, cowpea, and
bambara groundnut (Uguru & Madukaife, 2001). The African yam bean seeds were found to be
rich in potassium and phosphorus (Oshodi et al., 1995), calcium, iron, magnesium and zinc but
low in sodium and copper (Edem et al., 1990). Achinewhu and Ackah (2003) analysed raw
samples of African yam bean and cowpea processed into “moimoi” (a local dish) and porridges
University of Ghana http://ugspace.ug.edu.gh

18
for chemical, functional and sensory properties analysis. Sensory evaluations showed that
African yam beans do not differ significantly from cowpea. The African yam bean is also
reported to have medicinal importance (Potter, 1992). African yam bean has low susceptibility to
most field and storage leguminous pests (Omitogun et al., 1999). African yam bean seeds
contain lectins, a group of carbohydrate binding proteins, found to have strong insecticidal effect
against Callosobruchus maculatus (cowpea weevil) (Machuka et al., 2000).
Like other legumes, the African yam bean also nodulate profusely and fix atmospheric nitrogen,
thereby helping to replenish soil nitrogen (Klu et al., 2001). Assefa and Kleiner (1997) remarked
that African yam bean has very high nitrogen–fixing ability. Although the vast genetic, economic
and nutritional potentials of African yam bean have begun to be recognized, especially in
reducing malnutrition among Africans, the crop has not received adequate research attention
compared to major legumes such as cowpea, groundnut and soybean (Saka et al., 2004). It is thus
a minor legume classified as neglected, underutilized or underexploited species (Saka et al.,
2004). Its usefulness and attractiveness to consumers could be enhanced if it receives adequate
attention and breeding efforts are geared towards its improvement. African yam bean needs to be
improved genetically for farmer and consumer preferred traits like disease resistance, drought
tolerance and early flowering to reduce the length of the crop cycle, reduced seed coat hardness
to make for easier cooking and increased nutritional value and/or reduced anti–nutritional factors
which are reported to cause discomfort and flatulence when consumed (Onyeike & Omubo–
Dede, 2002). Figure 2.2 shows some pictures of the different varieties of African yam bean
grains as well as the root tuber of the crop.
University of Ghana http://ugspace.ug.edu.gh

19
Figure 2.2: A, B, and C are samples of the different varieties of African yam bean grains,
and D is a sample of the edible root tuber of the African yam bean plant.
A
D C
B
University of Ghana http://ugspace.ug.edu.gh

20
2.4 The Rhizobium (Nitrogen Fixing Bacterium)
Discovery of the legume–Rhizobium symbiosis has been attributed to the German scientists
Hellriegel and Wilfarth, who in 1886 reported that legumes bearing root nodules could use
molecular (gaseous) nitrogen. In 1888, Beijerinck, a Dutch microbiologist, succeeded in isolating
a bacterial strain (Rhizobium leguminosarum) from root nodules, and pure cultures were shown
to induce nodules when inoculated to the same host plants (Franche et al., 2009). These bacteria
were named Bacillus radicicola by Beijerinck. The generic name, Rhizobium was formally
adopted in 1962 by Buchaman (Giller, 2001). The current taxonomy of rhizobia consists of
several genera in the subclass Alpha– and Beta– Proteobacteria: Rhizobium, Mesorhizobium,
Ensifer (previously Sinorhizobium), Azorhizobium, Methylobacterium, Bradyrhizobium,
Phyllobacterium, Devosia and Ochrobactrum are genera that belong to rhizobial Alpha–
Proteobacteria (Morel et al., 2012).
Rhizobia are a genetically diverse and physiologically heterogeneous group of bacteria
(Somasegaran & Hoben, 1994) which elicit nodule formation on legumes (Denarie et al., 1996).
Rhizobia are a ubiquitous part of the soil micro–flora in a free–living state in the rhizosphere of
legumes (Allen & Allen, 1981; Somasegaran & Hoben, 1994). The ability to form symbiotic
relationships with members of the plant family Fabaceae, is a unique feature associated with
bacteria belonging to the family Rhizobiaceae (Pepper & Upchurch, 1991). Despite the
widespread distribution of leguminous crops, many soils remain void of rhizobial strains
(Brockwell et al., 1995).
Rhizobium is gram negative, motile, rod–shaped (approximately 0.5–0.9 µm in width and 1.2–
3.0 µm in length) and heterotrophic (Somasegaran & Hoben, 1994). Root nodule bacteria
generally grow under 25–30°C (optimum) and in the pH range of 6–7 (Somasegaran & Hoben,
University of Ghana http://ugspace.ug.edu.gh

21
1994). Rhizobium growth normally occurs under aerobic conditions. However, when fixing
nitrogen, low levels of oxygen are required, to protect the enzyme nitrogenase (Rending &
Taylor, 1989) and hence, Rhizobium is able to grow in microaerophilic conditions (Somasegaran
& Hoben, 1994). Rhizobium differs from most other soil microorganisms by taking dual forms,
i.e., a free–living in soils and symbiotic form inside of host legumes (Fujihara, 2009).
2.4.1 Rhizobia Diversity in Soils
Rhizobia are diverse and their classification has undergone great changes due to new
phylogenetic data leading to the description of new taxa (Zakhia & de Lajudie, 2001). It is an
expanding field because more and more rhizobia are being isolated and characterised, especially
from the Mediterranean and tropical zones, where diversity is still poorly documented (Zakhia &
Lajudie, 2001). Population diversity among rhizobia compatible with a particular legume is
likely to be greatest in the center of origin of that host (Lie et al., 1987). However, varied
rhizobial populations can arise in symbiosis with species that are not indigenous to a particular
region (Sadowsky & Graham, 1998).
Rhizobia are arguably the best known soil bacteria, and are also the most widely studied plant
symbionts, because of their ability to fix atmospheric nitrogen in the root nodules of compatible
leguminous plants (Hirsch, 1996). There has been considerable work over the past half–century
on the size and dynamics of natural populations in different agricultural soils, and the behaviour
and survival of inoculant strains (Hirsch, 1996). The advent of modern molecular techniques has
resulted in proposals of differing credibility to improve upon the study of symbiotic N2 fixation.
Rhizobial numbers vary depending on the soil type, environment and type of cultivation of the
soil. Hirsch (1996) mentioned that since populations in bulk soil rarely exceed 106 cells g–1 soil,
compared with an estimated 10–109 viable bacterial cells g–1 soil, they invariably comprise a
University of Ghana http://ugspace.ug.edu.gh

22
minority group, although they can reach much higher numbers in the rhizosphere. In agricultural
soils, the population of rhizobia is enhanced by the presence of the cultivated legume it can
nodulate (Thies et al., 1992; Sadowsky & Graham, 1998). In the past, Rhizobium species and
biovars were generally defined according to the host plants which they nodulate. However,
recent advances in DNA sequence–based taxonomy have facilitated a move from this functional
classification (Hirsch, 1996).
When soil samples are diluted and used to inoculate seedlings, the Most Probable Number
(MPN) of infective (nodulating) cells in the original sample can be calculated from the number
of plants with root nodules (Vincent, 1970). It appears that a single rhizobial cell normally
initiates and colonizes each nodule, multiplying by many orders of magnitude in the nutrient-rich
environment provided by the host plant, although nodules containing more than one strain have
been reported (Johnston & Beringer, 1975). However, increases in rhizobia populations, are
often seen under a recently planted legume crop, months before any boost in numbers
precipitated by nodule senescence, indicating that the rhizobia-host interaction involves more
than nodulation (Hirsch, 1996).
2.5 Methods of Studying Rhizobium Diversity in Soils
2.5.1 Cross Inoculation Group Concept
Based on early investigations of legume–Rhizobium symbiosis that largely focused on
agriculturally important crops, the concept of cross–inoculation groups was introduced (Fred et
al., 1932). Of the cross–inoculation groups that were originally described, six were generally
considered to be sufficiently unique to have species epithets assigned to them. Cultural,
morphological, biochemical and serological methods have been applied to identify, characterize
University of Ghana http://ugspace.ug.edu.gh

23
and classify isolates of Rhizobium over the years. The legume–Rhizobium association is specific
(each Rhizobium strain establishes a symbiosis with only a limited set of host plants and vice
versa). Plants which are mutually compatible with the same species of rhizobia were listed in the
cross–inoculation groups and were used in rhizobial taxonomy. Table 2.2 presents the various
cross inoculation groups.
Table 2. 2: Cross–Inoculation Group (C–IG) and Legume–Rhizobium Association.
Rhizobium Species Compactible Hosts C–IG
Rhizobium melilotus Melilotus spp. Trigonella spp. Alfalfa group
R. leguminosarum bv trifolii Trifolium spp. Clovers
R. leguminosarum bv viciae Pisum spp., Lens culinaris, Peas
Vicia spp., Vicia faba
R. leguminosarum bv phaseoli Phaseolus vulgaris, P. coccineus Bean group
Rhizobium lupini lupinus Lupine
Bradyrhizobium japonicum Glycine max Soybean
Cowpea Miscellany Vigna sp., Macroptilium spp.,
Lablab spp., Lima bean
Stylosanthes spp., etc
Source: Alexander (1978).
The occurrence of a wide diversity of the root nodulating bacteria in a particular soil increases
the opportunity for a legume host to find compatible rhizobia. This principle is commonly used
for the isolation of efficient and well adapted rhizobial strains (Florentino et al., 2010).
University of Ghana http://ugspace.ug.edu.gh

24
2.5.2 Cultural and Metabolic Methods
Many previous studies or researchers have used a large range of biochemical and metabolic tests
to differentiate, characterise and classify rhizobial species. These methods include growth rate,
colony characteristics, salt tolerance, pH tolerance, carbon utilisation, utilisation of nitrogen
sources, vitamin requirements, tolerance to dyes (e.g. BTB, BCB etc.), tolerance to antibiotics,
tolerance to pesticides, effects of temperature, growth rate in peptone broth, nitrate reduction,
production of catalase, production of acid or alkali, etc. (Graham et al., 1991; Somasegaran &
Hoben, 1994; Mpepereki et al., 1997; Odee et al., 1997). Rhizobia species differ significantly in
carbohydrate metabolism and substrate utilization (Somasegaran & Hoben, 1994). The utilization
of carbohydrates such as glucose, sucrose, lactose, fructose, arabinose and succinate, serve as a
diagnostic test in the differentiation of Rhizobium species (Graham et al., 1991; Somasegaran &
Hoben, 1994). Fast–and slow–growing rhizobia variably utilized sugars and other carbohydrates
(Mpepereki et al., 1997). Rhizobia nitrogen requirements can be satisfied by inorganic
nitrogenous salts (e.g., nitrate and ammonium salts) and by many amino acids and short chain
peptides (Zhang et al., 1991).
2.5.3 The Molecular Method
Biologist have employed a variety of molecular techniques to address questions about
phylogeny, evolution, and population diversity during the last decade (Boyer et al., 2001).
Random amplified polymorphic DNA (RAPD) developed by Williams et al. (1990) is still
among the most widely used because the technique is simple and relatively inexpensive (Harris,
1999).
Initial investigations of Rhizobium genomic profiles concentrated on estimating diversity at
conserved regions of genes like 16S rDNA genes using a technique called Amplified Ribosomal
University of Ghana http://ugspace.ug.edu.gh
25
DNA restriction analysis (ARDRA) (Pandey et al., 2004). Also PCR amplification with primers
specific to the repetitive gene elements; REP (Repetitive Extragenic Pallindromic), ERIC
(Enterobacterial Repetitive Intergenic Consensus) and BOX (composed of the box A, B and C
subunits) techniques have been used for genomic fingerprinting of bacteria (Louws et al., 1994).
These repetitive elements, located in the intergenic regions of many bacterial genomes, are
considered to be highly conserved (Martin et al., 1992) which make them useful for elucidating
relationships within and between bacterial species (Chen et al., 2000).
Restriction Fragment Length Polymorphism (RFLP) analysis is another technique that has been
used to discriminate differences in restriction enzyme profiles of amplified DNA (Laguerre et
al., 1996; Odee et al., 2002). Multi–locus sequence typing analysis where sequence variation is
examined for multiple loci have also been used for population studies (van Berkum et al., 2003).
2.5.3.1 Importance of Molecular Biology in Rhizobium Studies
Prior to the advent of molecular techniques, the study of rhizobia diversity involved phenotypic
characterisation as well as classification (Schwinghamer & Dubman, 1980). These phenotypic
methods provided important information for formalising taxonomic organisation and structure,
rhizobial population structure and species diversity (Thies et al., 2001). However, these
phenotypic techniques were reportedly limited in many ways (Thies et al., 2001). These
phenotypic techniques were reported particularly to be highly labour intensive and with low
discriminatory power compared to the molecular techniques (Streeter, 1994; Thies et al., 2001).
Thies et al. (2001) reported that since the late 1980s, molecular–based methods for
differentiation and characterising bacterial isolates have been available. These methods that have
revolutionised the study of Rhizobium ecology are based upon the polymerase chain reaction
University of Ghana http://ugspace.ug.edu.gh

26
analysis (Graham, 2008). These molecular methods generally have higher discriminatory power
and are faster than most phenotypic methods (Handley et al., 1998). However, some of them
especially the PCR–based techniques, are reported to have low reproducibility and greatly
dependent on colony age, source and concentration of reagents and also on DNA purity and
extraction protocol (Sato et al., 1999).
The assessment of rhizobial genetic diversity is contributing both to the worldwide knowledge of
diversity of soil microorganisms, and to the usefulness of rhizobial collections (Ogutcu et al.,
2008), and in developing long–term strategies to increase contributions of legume–Rhizobium
nitrogen fixation to agricultural productivity.
The use of genotypic approaches, applied to isolates obtained from a large number of legume
species and from different regions, have resulted in reclassification of known rhizobia species as
well as in an increased number of new species (Prevost & Antoun, 2006). Thus genetic methods
have usually provided additional information and made classification of rhizobia much more
definitive. Recent development in PCR techniques have facilitated genetic analysis of a larger
portion of the rhizobia genome and have aided classification greatly. The use of PCR and
sequencing techniques have resulted in the creation of new species (e.g. R. ciceri) (Nour et al.,
1994), and the confirmation of the identity of some species such as R. tropici and R. etli, R.
Fredii (Javis et al., 1992) in the genus Rhizobium.
Molecular techniques have helped to develop easy and quick methods to microbial
characterization including distinguishing genera, species and even strains (Schneider & de
Brujin, 1996; Giongo et al., 2008). Polymerase Chain Reaction (PCR) techniques and the use of
primers corresponding to consensus repetitive sequences scattered in the bacteria genome,
University of Ghana http://ugspace.ug.edu.gh

27
thought as ERIC 1 & 2, BOX, etc can create highly characteristic patterns when distinguished in
agarose gels, providing well separation on strain level (Adiguzel, 2006). ERIC sequences are
highly protected among rhizobia genomes and they were used to select and classify different
rhizobia strains in population works (Giongo et al., 2008).
2.6 Assessment of Biological Nitrogen Fixation
To ensure full recognition of the benefits of the Legume–Rhizobium symbiosis, it is necessary to
be able to assess the extent of effective nodulation and if possible nitrogen fixed. Several
methods such as nodule number, nodule mass, nodule colour, total N uptake, shoot dry matter
yield, percent of nitrogen derived from atmosphere using the N difference and A–value methods
(Beck et al., 1993; Hardarson & Danso, 1993) have been used.
2.6.1 Nodulation and plant total N content
Evaluation of the capacity of a crop in fixing nitrogen can be assessed by assessing nodulation
parameters such as nodule number, nodule mass, nodule colour, distribution and longevity of the
nodule population. Nodule number and nodule mass or nodule weight per unit dry weight of the
whole plant or root system are often used in trial comparisons; however, similar information can
be obtained by visually scoring nodulation on a 0–5 basis taking into account nodule number,
size, pigmentation and distribution (Peoples et al., 1989). Effectiveness of nodules can generally
be estimated by the degree of pink/red coloration of nitrogen fixing bacteroids tissue inside the
nodule. The rankings as reviewed by Peoples et al. (1989) should be regarded as a guide only.
Ideally, visual ratings should be consistently done by one person throughout an experiment, but
if more than one person is involved, division of labour should be on the basis of replicates and
not treatments (Peoples et al., 1989). The procedure involves carefully digging–up 20 plants at
University of Ghana http://ugspace.ug.edu.gh

28
random across a crop (ensuring the root system and nodules are recovered) and scoring each
plant using pre–determined classification criteria.
Regardless of the method used to measure nitrogen fixation, it is necessary to determine amounts
of total plant nitrogen (Peoples et al., 1989). Commonly, the wet Kjedahl digestion method is
used. In this method, organic and mineral N is reduced to NH3 in hot, concentrated sulphuric acid
in the presence of a catalyst. The NH3 is recovered by distillation and estimated by titration or
calorimetrically (Bergersen, 1980).
2.7 Measurement of Biological Nitrogen Fixation
Several methods for estimating nitrogen fixation in plants are available, although all have their
advantages and disadvantages. Most of these methods have been reviewed by various researchers
(e.g. Rennie & Rennie, 1983; Danso, 1985). The commonly applied methods to measure the
rates of nitrogen fixation in grain legumes include the acetylene reduction (AR) assay, 15N
assimilation technique, xylem solute technique and total nitrogen difference method. Most of
these techniques have some advantages and disadvantages (Hardarson & Danso, 1993; Witty &
Day, 1978). To optimize the amount of nitrogen fixed in any system it is necessary to be able to
accurately estimate the magnitude of fixation under different conditions with the appropriate
techniques.
2.7.1 The Total N Difference Method (TND)
The total nitrogen difference method is the simplest of all the methods (Danso et al., 1992). It
involves quantification of total nitrogen in both the fixing plant and the non–fixing plant
(Hardarson & Danso, 1993). The technique operates upon the assumption that two genotypically
similar plants that differ only in the ability to nodulate and fix nitrogen should absorb the same
amount of soil N whether the nitrogen fixing species is actively or not fixing under uniform
University of Ghana http://ugspace.ug.edu.gh

29
environmental conditions. Therefore by analysing the total N in the two plants, the amount of
nitrogen fixed from the atmosphere could be estimated as the difference between the two (Danso
& Herridge, 1987). One problem with the total nitrogen difference method is the difficulty in
getting an appropriate non–fixing plant for the reference. Also another limitation is that there is
the probability that the fixing legume and non-fixing reference plant may be taking up different
amounts of soil N, which could be a major source of error (Danso, 1985). Danso et al. (1986)
recommended that soils with marginal N content should be used when applying the total nitrogen
difference method in order to minimize errors. This means that errors occur when this method is
employed under conditions where the available N supply is high. For example, vermiculite was
used as an N–free growth medium for the study of associative N2 fixation (Rennie & Larson,
1979), but later research showed that significant quantities of mineral N can be released from
vermiculite when it is incubated under warm moist conditions (Giller et al., 1986). Despite the
above limitations of the TND approach, the method has the advantage of giving a measure of the
total amount of N fixed over the length of the experiment and is indispensable for many
laboratory based studies (Giller & Wilson, 1991).
2.7.2 Acetylene Reduction Assay (ARA)
The Acetylene Reduction assay relies on the preferential reduction of acetylene (C2H2) to
ethylene (C2H4) by nitrogenase, instead of reducing nitrogen to ammonia (Montoya et al., 1996).
However, the AR assay has not escaped criticism during the past four decades of its use,
predominantly due to potential indirect effects of C2H2 on microbial metabolism and the
reliability of the factor used to extrapolate rates of C2H4 production to rates of nitrogen fixation
(Giller, 1987).
University of Ghana http://ugspace.ug.edu.gh

30
The acetylene reduction assay is a useful diagnostic tool for the detection of nitrogenase activity
and has been widely used in all areas of nitrogen fixation research because of its high sensitivity
and simplicity. However, its reliability is now questioned for even comparative studies since
acetylene reduction provides only an instantaneous measure of nitrogenase activity under the
prevailing assay conditions, therefore its accuracy has always been restricted by the requirement
for many repeated determinations to adjust for marked diurnal and seasonal changes in nitrogen
fixing activity (Peoples et al., 1989). Further errors in the field can arise due to the use of an
inappropriate calibration factor to relate ethylene production to nitrogen fixation, incomplete
recovery of a plant’s total nodule population, nodule detachment or damage prior to assay, plant
disturbance, or an acetylene–induced decline in nitrogenase activity during assay (Witty &
Minchin, 1988). Although in situ procedures with flow–through gas systems have been devised
to overcome some of these technical problems, the procedure has only limited application for the
measurement of nitrogen fixation in the field (Peoples et al., 1989).
2.7.3 15N Isotope Dilution Method
Most of the above mentioned techniques are based on indirect criteria, and cannot distinguish
various sources of nitrogen in a fixing plant. The 15N assimilation technique follows the net
incorporation of the 15N tracer into cellular biomass after a predetermined incubation period.
However, its use is limited because of the high cost of the 15N isotopic tracer and the expensive
equipment needed for the determination of the 15N/14N isotopic ratios (especially in developing
countries).
There are two stable isotopes of nitrogen, 14N and 15N. The heavy isotope, 15N, occurs in
atmospheric nitrogen at a constant abundance of 0.3663 atoms percentage (total variation ranges
from 0.36628 to 0.36632) (Mariotti et al., 1983). If the 15N abundance in plant is lower than this,
University of Ghana http://ugspace.ug.edu.gh

31
an estimate of the proportions of legume N derived from each source can be made. In many cases
the very small differences in natural abundance of 15N between soil N and N2 can be used,
provided a suitably precise mass spectrometer is available. More usually, the difference between
soil nitrogen and atmospheric nitrogen is extended by incorporation into the soil of 15N enriched
nitrogenous compounds (e.g. of between 5 and 95 atoms % 15N).
2.8 Factors Affecting Biological Nitrogen Fixation
Grain legumes fix about 15–210 kg N ha−1 seasonally in Africa, and hence feature prominently
in the cropping systems of traditional farmers (Dakora & Keya, 1997). However, increased
exploitation of this biological N is constrained by various environmental and nutritional factors.
Thus the ability of deriving full benefits from biological nitrogen fixation depends substantially
on the edaphic, climatic and biotic characteristics of the soil and the environment. The amount of
atmospheric N2 fixed by legumes varies widely, depending on the management of the abiotic and
biotic soil environmental components (Dakora & Keya, 1997). Several factors have been noted
to affect biological nitrogen fixation in legumes. There have already been many extensive reports
on the factors that affect biological nitrogen fixation in legumes (Sprent, 1976; Vincent, 1980).
2.8.1 Edaphic Factors
Edaphic factors which relate to the soil include: soil moisture, drought, soil pH, soil phosphorus
levels, soil mineral nitrogen concentration, and availability of micronutrients: Iron (Fe),
Molybdenum (Mo), Cobalt (Co) and Boron (B). Dakora and Keya (1997) reported that soil
constraints play a major role in limiting crop yields in Africa. The intrinsically low fertility of
African soils and their highly heterogeneous nature, tends to limit land use and crop choice as
wel1 as nutrient–supplying capacity (Munns & Franco, 1981). Thus nutrient deficiencies
involving P, K, S, Mo and Zn are quite common.
University of Ghana http://ugspace.ug.edu.gh
32
2.8.1.1 Effect of Soil Nitrogen on Nodulation and Nitrogen Fixation
The nitrogen fertility of soils is crucial for increased production in the African savanna (Dakora
& Keya, 1997). About 90% of mineral N in the continent is found in living plants, with only a
small fraction left in soils while the reverse ratio is more typical in temperate environments
(Borlaug, 1991).
The heterogeneous nature of African soils affects legume nodulation and N2 fixation through
differences in soil N status (Peoples & Herridge, 1990). High amounts of soil N are documented
to adversely affect N2 fixation in many nodulating legumes (Peoples & Herridge, 1990). This
appears to be a mechanism presumably to avoid ‘wasting’ photosynthate on supporting a
nitrogen–fixing symbiosis when it is not necessary, owing to abundant soil available N (Hirsch,
1996). Numerous studies (Eaglesham, 1982; Ssali & Keya, 1986), etc. have shown that N2
fixation in cowpea, soybean, common bean and groundnut is reduced in the presence of
combined N. In contrast, some indigenous African legumes such as bambara groundnut and
Kersting’s bean exhibit nitrate tolerance (Dakora et al., 1992). Thus, nodulation might be
inhibited at root intracellular nitrate levels where nitrogen fixation theoretically could occur
(Hirsch, 1996). Due to this inhibition phenomenon, estimations on the distribution of rhizobia
based on host plant nodulation in the field may be false if soil nitrate is high, in contrast with
plant infection tests with dilutions of field soil carried out in vitro (Hirsch, 1996).
2.8.1.2 Effect of Soil Phosphorus on Nodulation and Nitrogen Fixation
Phosphorus (P) is an essential macronutrient for plant growth and function. The P requirements
of host plants for optimal growth and symbiotic nitrogen fixation processes have been assessed
by determination of nodule development and functioning (Sa & Israel, 1991). The influence of P
on symbiotic nitrogen fixation in leguminous plants has received considerable attention. Robson
University of Ghana http://ugspace.ug.edu.gh

33
and O’Hara (1981) concluded that P nutrition increased symbiotic nitrogen fixation in
subterranean clover (Trifolium subterraneum L.) by stimulating host plant growth rather than by
exerting specific effects on rhizobial growth or on nodule formation and function. Decreased
specific–nitrogenase activity in nodules of P–deficient soybean plants was associated with
decreased energy status of host plant cells of nodules. During the process of photosynthesis, ATP
is generated when light energy is transformed and stored in the form of ATP for later use by the
plant. Thus phosphorus has a specific involvement in symbiotic nitrogen fixation as an energy
source when 16 molecules of adenosine triphosphate (ATP) are converted to adenosine
diphosphate (ADP) as each molecule of N2 is reduced to NH3 (Anonymous, 1999; Cheng, 2008).
Inadequate P restricts root growth, the process of photosynthesis, translocation of sugars, and
other such functions which directly or indirectly influence N2 fixation by legume plants
(Anonymous, 1999).
In legumes, phosphorus deficiency specially affects symbiotic nitrogen fixation by limiting the
growth and survival of rhizobia (O’Hara et al., 1988), nodule formation (Drevon & Hartwig,
1997), nodule functioning (Tang et al., 2001a) and host plant growth (Tsvetkova & Georgiev,
2003). Furthermore, phosphorus deficiency has been reported to decrease nodule mass more than
host growth in soybean (Drevon & Hartwig, 1997). Nonetheless, reports on P effect on nodule
formation and functioning are controversial: phosphorus deficiency may increase, decrease or
not affect the nodule number per unit of shoot mass (Vadez et al., 1996), as well as the specific
nitrogenase activity and the amount of N fixed per nodule mass (Tang et al., 2001b). Differences
in the response of nodule formation and functioning to P deficiency appear to be related to
legume species, soil and environmental conditions as well as the duration and severity of the
stress.
University of Ghana http://ugspace.ug.edu.gh

34
2.8.1.3 Soil pH
Rhizobial survival in soil is adversely affected by extremes of pH and high salt content, although
a few leguminous hosts will grow under saline or alkaline conditions (Hirsch, 1996). Very acid
soils are not conducive to survival of rhizobia or their host plants, but in general there is a
correlation between acid–tolerance of the host plant species and the rhizobial symbionts (Danso,
1977). This is illustrated in a survey of 60 different soil types stated by Catroux and Amarger
(1992). The symbiont of acid–intolerant lucerne, S. meliloti, was present at 103 nodulating cells
g−1 soil in alkaline soils’ pH 7–8, whereas if it was not present at all in soils more acid than pH
6.0, where fewer than 10 nodulating cells g−1 were detected. Conversely, the symbiont of acid–
tolerant lupins, Bradyrhizobium sp. (Lupinus) was present at around 102 nodulating cells g−1 soil
at pH 4.5–5.5, but could not be detected in soils above pH 6 (Hirsch, 1996). In soils with pH 5.5–
7.5, the biovars of R. leguminosarum were present at 104–105 nodulating cells g−1 but below or
above this pH range their populations were lower than those of Bradyrhizobium sp. (Lupinus) or
S. meliloti, respectively (Hirsch, 1996). Lowendorf (1980) compared the results from six
different researchers and found that there is a general consensus that the most acid soil in which
B. japonicum can survive is pH 4, for R. leguminosarum biovars trifolii and viciae the limit is pH
4.7, and for S. meliloti, pH 5. Rhizobium leguminosarum bv. trifolii in laboratory cultures grew
more slowly in media at pH 4.5 than in those at pH 5.5 (Wood & Cooper, 1988).
2.8.1.4 Availability of Heavy Metals
Consequence of low soil pH is the increased solubility and hence the bioavailability of some
metal ions. Heavy metals have been shown to be detrimental to rhizobial survival (Brady et al.,
1990). In plots at Woburn which had received sewage sludge over a long period, resulting in
heavy–metal contamination, the population of R. leguminosarum bv. trifolii was reduced
University of Ghana http://ugspace.ug.edu.gh

35
dramatically, in addition, only one strain able to nodulate clovers was found, and it was
ineffective on white clover (Hirsch et al., 1993). This strain was shown to be more resistant to
Cd, Cu, Ni and Zn than were diverse isolates from adjacent control plots (Chaudri et al., 1992).
However, S. meliloti inoculant introduced into metal–contaminated soil survived better than R.
leguminosarum bv. trifolii and R. loti (Giller et al., 1993), indicating that rhizobial species might
vary in their sensitivity to heavy–metal contamination. Similarly, Chaudri et al. (1993) found
increasing levels of Zn, Cu, Ni and Cd, in combination with different soil pH and organic carbon
levels, reduced R. leguminosarum bv. trifolii numbers in German soils, and concluded that Zn
was the metal most toxic to rhizobia.
2.8.1.5 Soil moisture.
There are many reports on the effects of desiccation on rhizobial survival; in some cases rhizobia
survive for many years following desiccation; in others, especially where it is combined with
elevated temperatures, numbers drop. However, long–term studies on survival of B. japonicum in
Italian soils indicate that moisture content of soil is the most obvious factor affecting population
level, waterlogging leading to a dramatic decrease (Beringer & Kay, 1993). Similarly, flooding
on R. leguminosarum populations, although there are contradictory reports in the literature that
waterlogging or flooding has no effect on rhizobial numbers. It seems likely that there are
complex interactions between soil type and climatic conditions, rhizobial species studied and
method of assessment.
2.8.1.6 Drought
Water stress reduces N2 fixation, nodule respiration, and cytosolic protein content of the nodule
(Bordeleau & Prevost, 1994). Soil moisture deficiency reduces the rhizobial population density
in the soil (Tate, 1995), rhizobial migration, nodule number and size (Williams & De Mallorea,
University of Ghana http://ugspace.ug.edu.gh

36
1984) and has a pronounced effect on N2 fixation since nodule initiation, growth and activity are
more sensitive to water stress than are generally root and shoot metabolism (Albrecht et al.,
1994). In dry soil, infection of root hairs is restricted because they become short, stubby and
inadequate for rhizobial infection (Lie, 1981). Eaglesham and Ayanaba (1984) stated that excess
water is detrimental to N2 fixation because it lowers oxygen diffusion for nodule functions and
may lead to a build–up of CO2 (which inhibits nodule formation) and ethylene (which restricts
nodulation at lower concentration).
A reduction in root nodule flux has been associated with the inhibition of nitrogen fixation under
drought (Sanginga et al., 2000a). The legume–Rhizobium symbiosis is strongly related to the
physiological state of the host plant (Cochard et al., 2002). Thus a limiting factor like drought
might impose a limitation on the vigour of the host legume (Cavender–Bares & Bazzaz, 2000).
Consequently, nodulation fails to occur through loss of infection sites due to changes in the
morphology of effectible root hairs (Eaglesham & Ayanaba, 1984). Schulze et al. (1991) found
that in the desert and savannah areas of Namibia, symbiotic acacias spend more water per unit
carbon assimilated than non–legumes. The waters spent on carbon assimilation probably
represents the cost of supplying extra carbohydrate for nitrogen fixation (Danso et al., 1992) thus
suggesting that in the dry savannah and Sahelian zones of Africa water cost of nitrogen fixation
can itself constrain the symbiotic process and reduce biological N yield.
2.8.1.7 Salinity
Salinity has been identified as one of the factors that affect the growth and activity of nitrogen
fixing legumes in arid and semi–arid climates (Zahran, 2001). Tate (1995) reported that
increased salt concentration may have a detrimental effect on soil microbial populations as a
result of direct toxicity as well as through osmotic stress. Effects of salt stress include inhibition
University of Ghana http://ugspace.ug.edu.gh

37
of initial step of rhizobia–legume symbiosis such as curling of root hairs, reduction in nodule
respiration (Delgado et al., 1994; Walsh, 1995), reduction in production of leghaemoglobin and
reduction in photosynthetic activities and growth of the plant (Delgado et al., 1994). In contrast
to their host legumes, some rhizobia can survive in the presence of high level of salt both in the
culture and soil (Bordeleau & Prevost, 1994). Many species of bacteria adapt to saline conditions
by intracellular accumulation of low molecular weight organic substances (Csonke & Hanson,
1991).
2.8.2 Environmental (Climatic) Factors
Two important climatic determinants affecting biological nitrogen fixation are temperature and
light.
2.8.2.1 Temperature.
Various stages of nodulation and nitrogen fixation of herbaceous legumes are affected by soil
temperature (Sprent, 1979). Soil temperature affect the survival and thus the population of
Rhizobium or Bradyrhizobium in soil, with lower temperatures being more favourable than high
temperatures (Danso, 1977). High soil temperature can prevent nodulation, and even if
nodulation does occur, these temperatures could inhibit the process of nitrogen fixation in
legumes (Day et al., 1978). The much lower optimum temperature for symbiotic plants (25°C)
than that reported for nitrogenase activity of detached nodules (40°C) (Bond & Macintosh,
1975), suggests that the temperature effect on plant growth was a major determinant in the
symbiotic system. A study conducted on Casuarina species by Reddell et al. (1985) suggested
that such temperature requirements for significant nodulation and nitrogen fixation affects the
natural distribution of Casuarina species. Casuarina spp. occurs in soils with low N and seems
to be dependent almost entirely on BNF. Rhizobia cannot survive under extreme soil
University of Ghana http://ugspace.ug.edu.gh

38
temperatures. Their response to heat appears to be strain–dependent and is affected by soil type,
moisture content etc.
2.8.3 Biotic Factors
Among the biotic factors affecting biological nitrogen fixation, the major ones include;
absence/presence of the required Rhizobium species, plant physiological defects (e.g. excessive
defoliation of host plant), crop competition (cropping system), insects and pest attack, etc.
2.8.3.1 Presence of Compatible Rhizobium
An important pre–requisite for effective nodulation and nitrogen fixation is the presence of an
effective and competitive strain in the soil (Danso & Owiredu, 1988). The survival and
persistence of an adequate number of effective Rhizobium in soils independent of a hosts`
stimulant is essential to ensure nodulation of young seedlings (Dudeja & Khurana, 1989).
One factor causing reduction in rhizobial populations could be increased predation by protozoa
(Habte & Alexander, 1977). Protozoa will be more mobile as moisture content increases (Vargas
& Hattori, 1986) and rhizobia more available for predation (Postman, et al., 1989).
Soils with high clay content appear to be more conducive to rhizobial survival than are low clay
soils (Danso, 1977). This might be caused by the higher protection offered by clay against
adverse conditions such as drought and high temperatures (Danso, 1977). This would reduce the
size of the neck of the pores, effectively protecting the bacteria which inhabit them from
protozoan predation (Heijnen & van Veen, 1991).
Other biotic factors that could reduce rhizobial numbers include bacteriophages, bacterial
parasites such as Bdellovibrio, antibiotics produced by other soil microbes and bacteriocins
produced by other rhizobia (Hirsch, 1996). Although Bdellovibrio are present in many soils, and
University of Ghana http://ugspace.ug.edu.gh

39
they can be shown to parasitize rhizobia in dense liquid culture, they did not significantly reduce
rhizobial numbers, and appropriate conditions for Bdellovibrio infection are unlikely to occur in
field soils (Keya & Alexander, 1975). Studies of bacteriocin production of more than 100 R.
leguminosarum isolates showed that mutual antagonism was frequent (Hirsch, 1979).
2.8.3.2 Crop Effects
There are numerous reports of rhizobial population fluctuations in response to different crops,
and over time (Hirsch, 1996). Observations differ widely, depending upon plants, rhizobial
species, soil type, climate and agronomic practices (Hirsch, 1996). There are studies of the
response of indigenous populations to host plants, other crops and different soil treatments; and
some information on natural colonization of soils by rhizobia, where inoculation is not involved.
Counts of rhizobia are usually higher in the host rhizosphere, and following soil cultivation
procedures which disperse the bacteria released from senescent nodules of a well–nodulated
crop. This has been observed in B. japonicum; populations increased in the presence of soya
beans (Weaver et al., 1972) and again in the following winter, the latter increase was attributed
to release from nodules (Kuykendall et al., 1982). Soils with no record of ever having grown a
particular legume can still contain significant numbers of the compatible rhizobia (Hirsch, 1996).
These might reflect ancient vegetation patterns, or alternatively rhizobia may have invaded from
nearby sites.
2.8.3.3 Cropping System
Nitrogen fixation in legumes is also influenced by the cropping system used. An evaluation of
traditional cropping systems in Africa shows that crop rotation involving legume and cereal
monocultures is by far more sustainable than intercropping, the most dominant cultural practice
in the continent (Dakora & Keya, 1997). Eaglesham et al. (1981) in monitoring root nodule
University of Ghana http://ugspace.ug.edu.gh

40
formation in cropping systems involving maize and four grain legumes (cowpea, Bambara
groundnut, Kersting’s bean and groundnut) discovered changes in nodule abundance dynamics in
response to the cropping pattern. Cowpea and groundnut showed decreased nodule numbers with
intercropping. However, Bambara groundnut and Kersting’s bean formed more nodules when
intercropped than when sole cropped. The fact that nitrogen fixation in cowpea was unaffected
by intercropping with maize in Nigeria (Eaglesham et al., 1981) might suggest cultivar
differences in symbiotic response to cropping systems. It is clear that introduced species like
soybean show reduced nitrogen fixation under mixed cropping (Nambiar et al., 1982). With
some species, symbiotic activity in intercropped legume can be stimulated if the associated
cereal in the mixture exerts intense competition for soil N. In that case the legume is forced to
rely more on symbiosis for its N nutrition (Danso et al., 1987). Danso et al. (1987) showed that
by increasing the population of the cereal in the mixture, this increased the proportion of the
nitrogen derived from the symbiotic fixation. Tree legumes can also fix about 43–581 kg N ha
yr–1 making their leaf prunings an important component of sustainability in agroforestry and
alley cropping systems.
Rotational cropping involving legumes and cereals have been found to be a more sustainable
system of increasing food production (Dakora & Keya, 1997). The ability of African yam bean
to form effective nodules with a wide range of rhizobial strains makes it a suitable for sustainable
development purposes in most cropping systems. The use of African yam bean and other
legumes as cover crops, can increase the efficiency of fertilizer utilization and the amount of
organic matter for maintenance of high soil productivity (Dakora & Keya, 1997). Although
legumes of all categories contribute to nitrogen fertility in various cropping systems, the extent
University of Ghana http://ugspace.ug.edu.gh

41
of their nodulation could be constrained by a range of factors amongst which is the environment
relating to both the host plant and its microsymbiont (Dakora & Keya, 1997).
University of Ghana http://ugspace.ug.edu.gh

42
CHAPTER THREE
MATERIALS AND METHODS
3.1 Soil Characterization and Description
Four soil types namely, Toje, Adenta, Haatso and Akuse series’ (Local names), located in the
coastal savanna zone of Ghana were used for the experiment. Toje, Adenta and Haatso series’
form part of the soil series along a catena down the Legon hill.
The soils had ustic moisture and isohyperthermic temperature regimes (Eze et al., 2010). Total
annual rainfall is about 900 mm (Dowuona et al., 2012) and is bimodally distributed. The rainfall
regime consists of a main wet season which falls between March to June/July, and a minor rainy
season around September to October. This area is further characterized by a distinct dry season
between December and February. Relative humidity ranges between 59% in the afternoon and
93% at night with a mean annual temperature of about 28°C (Dowuona et al., 2012). The
vegetation is grassland with substantial amounts of clumps and thickets. Quartzite and quartzitic
sandstones are the underlying geological formations with evidence of fractures and groundwater
reserves typical of the hydrogeology of the Togo Structural Units of Ghana (Dapaah–Siakwan &
Gyau–Boakye, 2000). The soils were sampled to a depth of 0–20 cm from an uncultivated field
at the University of Ghana Experimental farm at Legon.
Adenta series has been classified as Savannah Ochrosol (Brammer, 1962), Typic Kandiustalf
(Eze et al., 2010) according to USDA classification system and as Haplic Luvisol by Soil
Research Institute (1999) according to FAO–UNESCO classification system (1990). The Adenta
soil is a well–drained soil series which occurs extensively on gentle middle slope with site
gradient of 1–2% on a catena along the Legon hill. The Adenta series has a profile which
University of Ghana http://ugspace.ug.edu.gh

43
consists of light yellowish brown sandy clay loam topsoil with friable granular structure and has
an altitude of 82 meters above sea level (Eze et al., 2010).
Toje series is classified as Rhodic Kandiustalf and Haatso as Kandic Paleustalf according to
USDA classification system (Eze et al., 2010). These soil series’ have an altitude of 108 metres
and 66 meters respectively above sea level (Eze et al., 2010). Toje series is located at the lower
upper slope with slope less than 1% whiles Haatso series is located at the lower slope positions.
Haatso series at the foot of the catena is formed on colluvial and alluvial deposits underlain by
iron-stained quartzite or sandstone at 0.6–0.9 meters (Brammer, 1967). The topsoil of Toje series
is dark reddish brown grading to red with depth. The structure is granular at the surface, with
friable consistency; this changes to weak, fine sub–angular blocky below the surface.
The Akuse soil series is classified as a Calcic Vertisol (Eze, 2008), according to USDA
classification system. The parent material is garnetiferous hornblende gneiss and it occurs on
upper-middle slope with an altitude of 18 m above sea level (Yangyuoru et al., 2006). The
relative humidity at night time to the early hours of the day ranges from 70 to 100% throughout
the year (Yangyuoru et al., 2006). The afternoon relative humidity falls to a range of 20–65%
during the year. The texture of the soils is mainly sandy to silty clay.
3.2 Soil Sampling and Analysis
Three representative surface soil samples from the plough layer (0–20 cm) of each of four soil
series (Adenta, Akuse, Haatso and Toje) were sampled in bulk. Prior to potting and crop
establishment, soil samples were crushed and sieved through a 2 mm sieve to obtain the fine
earth fraction.
University of Ghana http://ugspace.ug.edu.gh

44
3.2.1 Chemical Analysis
3.2.1.1 Soil pH
Soil pH was determined in both distilled water and 0.01M calcium chloride using the
electrometric method by Peech (1965). Twenty grammes (20 g) of 2 mm sieved soil sample were
weighed into a 50 mL beaker and 20 mL of distilled water was added (1:1, soil to water ratio).
The soil–water suspension was stirred vigorously for 30 minutes and allowed to stand for about
20 minutes, most of the particles to settle. The pH meter (Hanna H19017 microprocessor pH
meter) was standardized with solutions at pH of 4 and 7. The pH meter electrode was partly
immersed gently into the supernatant and the reading on the pH meter was recorded as pH in
water (pHW). The pH meter electrode was rinsed in–between pH readings with distilled water.
The procedure was repeated with 20 g of soil and 40 mL of 0.01M CaCl2 solution (1:2, soil to
salt solution ratio). The pH reading was recorded as the soil pH in salt (pHS)
3.2.1.2 Available Phosphorus Determination
Available phosphorus was determined using Bray 1 method (Bray & Kurtz, 1945). Five
grammes (5 g) of air–dried and sieved soil were weighed into extraction bottle and 50 mL of
Bray1 (mixture of 0.03M NH4F and 0.025M HCl) solution was added and shaken on a
mechanical shaker for three minutes. The suspension was centrifuged and filtered through No. 42
Whatman filter paper into a 100 mL volumetric flask and made up to the volume. Five millilitres
(5 mL) aliquot of the filtrate was taken into a 50 mL volumetric flask in duplicate. The pH was
adjusted using P–nitrophenol indicator and neutralized with a few drops of 4M NH4OH until the
solution turned yellow. Eight millilitres (8 mL) of reagent B; prepared by dissolving 1.056 g of
ascorbic acid in 200 mL of reagent A [12 g of ammonium molybdate + 0.2998 g of antimony
potassium tartrate dissolved in 250 mL of distilled water]. The dissolved reagents were added to
University of Ghana http://ugspace.ug.edu.gh

45
1000 mL of 2.5M H2SO4, mixed thoroughly and made to the 2000 mL mark (Watanabe & Olsen,
1965). The solutions were mixed thoroughly by shaking and allowed to stand for 15 minutes for
the colour to stabilize (the colour changed to blue of different intensity depending on the
concentration of phosphorus available in the soil). A blank was prepared with distilled water and
8 mL of reagent B. The spectrophotometer was calibrated using 25 mg L−1 standard P solution
prepared in the same manner as above. The intensity of the blue colour was measured using the
Philips PU 8620 spectrophotometer at a wavelength of 712 nm. The available P concentration in
the soil sample was read and calculated using the spectrophotometer reading as follows:
P (%) =R × Vol. of extract
Vol. of aliquot × Weight of soil × 106× 100 [3.1]
Where R = Spectrophotometer reading (mg L–1).
3.2.1.3 Total Nitrogen Determination
Half of a gram (0.5 g) of soil was weighed into a 250 mL Kjedahl flask and a tablet of digestion
accelerator, selenium catalyst, was added followed by 5 mL concentrated sulphuric acid. The
mixture was digested until the digest became clear. The flask was then cooled and its content
transferred into a 100 mL volumetric flask with distilled water and quantitatively made up to
volume. A 5 mL aliquot of the digest was taken into a Markhan distillation apparatus. Five
millilitres (5 mL) of 40% NaOH solution was added to the aliquot and the mixture distilled. The
distillate was collected in 5 mL of 2% boric acid solution. Three drops of a mixed indicator
containing methyl red and methylene blue were added to the distillate in a 50 mL Erlenmeyer
flask and then titrated against 0.01M HCl acid solution (Bremner, 1965). The % nitrogen was
calculated as:
N(%) =Titre × Molarity of HCl × Vol. of extract × 0.014
Vol. of aliquot × Weight of soil × 100 [3.2]
University of Ghana http://ugspace.ug.edu.gh

46
Where 0.014 = milliequivalent weight of nitrogen
3.2.1.4 Soil Organic Carbon Determination
Organic carbon was determined by the wet combustion method of Walkley and Black (1934). A
half gram (0.5 g) of air–dried and sieved soil sample was weighed into a conical flask. Ten
millilitres (10 mL) of potassium dichromate and 20 mL of concentrated sulphuric acid (H2SO4)
solutions were added. The flask was swirled to ensure that all the soil particles were in contact
with the solution to allow for digestion. The content of the flask was allowed to settle for 30
minutes to ensure an efficient combustion after which 200 mL of distilled water was added. Ten
millilitres (10 mL) of orthophosphoric acid and barium phenylalanine sulphate (an indicator),
were added to the solution. The solution was then titrated against ferrous ammonium sulphate
solution until colour changed. The titre value was used to calculate the percent carbon (%C) as:
%SOC = [10 − (XN)] × 0.003 × 1.33
W× 100 [3.3]
Where X = titre value of the ferrous ammonium sulphate.
N = molarity of the ferrous ammonium sulphate.
W = weight of the soil sample, 1.33 = correction factor (f) assuming more than 75%
recovery of organic carbon by wet combustion procedure, 0.003 = Milliequivalent
weight of carbon (g).
3.2.1.5 Cation Exchange Capacity (CEC)
Ten grammes (10 g) of soil was weighed into an extraction bottle and 100 mL of 1N NH4OAc
solution at pH 7 was added and agitated for 30 minutes. The suspension was filtered through a
Number 42 Whatman filter paper. The non–adsorbed ammonium ions were then washed off with
methanol and the ammonium saturated soil was leached with acidified 1M KCl solution. A 10
University of Ghana http://ugspace.ug.edu.gh
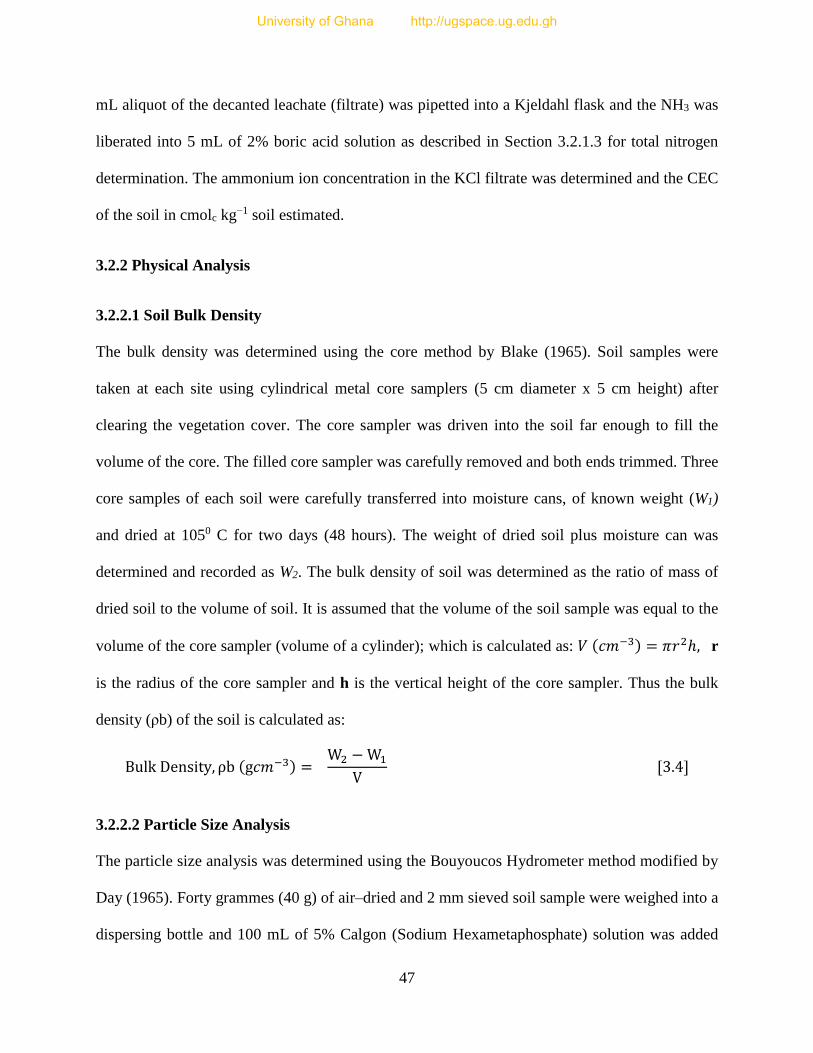
47
mL aliquot of the decanted leachate (filtrate) was pipetted into a Kjeldahl flask and the NH3 was
liberated into 5 mL of 2% boric acid solution as described in Section 3.2.1.3 for total nitrogen
determination. The ammonium ion concentration in the KCl filtrate was determined and the CEC
of the soil in cmolc kg−1 soil estimated.
3.2.2 Physical Analysis
3.2.2.1 Soil Bulk Density
The bulk density was determined using the core method by Blake (1965). Soil samples were
taken at each site using cylindrical metal core samplers (5 cm diameter x 5 cm height) after
clearing the vegetation cover. The core sampler was driven into the soil far enough to fill the
volume of the core. The filled core sampler was carefully removed and both ends trimmed. Three
core samples of each soil were carefully transferred into moisture cans, of known weight (W1)
and dried at 1050 C for two days (48 hours). The weight of dried soil plus moisture can was
determined and recorded as W2. The bulk density of soil was determined as the ratio of mass of
dried soil to the volume of soil. It is assumed that the volume of the soil sample was equal to the
volume of the core sampler (volume of a cylinder); which is calculated as: 𝑉 (𝑐𝑚−3) = 𝜋𝑟2ℎ, r
is the radius of the core sampler and h is the vertical height of the core sampler. Thus the bulk
density (ρb) of the soil is calculated as:
Bulk Density, ρb (g𝑐𝑚−3) = W2 −W1V
[3.4]
3.2.2.2 Particle Size Analysis
The particle size analysis was determined using the Bouyoucos Hydrometer method modified by
Day (1965). Forty grammes (40 g) of air–dried and 2 mm sieved soil sample were weighed into a
dispersing bottle and 100 mL of 5% Calgon (Sodium Hexametaphosphate) solution was added
University of Ghana http://ugspace.ug.edu.gh

48
and shaken for two hours. The suspension was thereafter transferred into a 1 L graduated
sedimentation cylinder and was brought to the mark by adding distilled water. A plunger was
used to stir the suspension vigorously by moving it in and out of the suspension several times.
The first and second hydrometer readings were taken at 5 minutes and 5 hours after the plunger
was removed, a hydrometer was gently lowered into the content and the scale at the top of the
meniscus was noted and recorded. These readings represented the silt plus clay fraction and the
clay fraction, respectively. The suspension was poured from the sedimentation cylinder into a
47–micron (µm) sieve and effluent discarded. Tap water was run through the sediment on the
sieve to wash off most of the fine material. The sand particles left in the sieve were transferred
into a moisture can, oven dried for 24 hours, cooled in a desiccator and the dry weight
determined. The percentage of sand, silt and clay fractions were calculated based on the oven dry
weight of the soil sample taken as follows:
%(Clay + Silt) =Hydrometer reading at 5mins
weight of soil (g)× 100 [3.5]
Clay (%) =Hydrometer reading at 5 hours
weight of soil (g)× 100 [3.6]
Silt (%) = %(Clay + Silt) − Clay (%) [3.7]
Sand (%) =Weight of oven dry sand retained on the 47µm seive
weight of soil (g)× 100 [3.8]
The textural classes were determined using the texture triangle.
University of Ghana http://ugspace.ug.edu.gh

49
3.3 Estimation of the populations of rhizobia in the soils using the Most Probable Number
plant infection technique.
The estimated population of rhizobia in the soils capable of nodulating the test legumes was
enumerated by the Most Probable Number (MPN) plant infection assay (Vincent, 1970) using a
modified Leonard jar assembly. The assembly was composed of a plastic cup tapered to a similar
cup at the bottom. The cup containing the rooting medium (acid–wash sand) was inserted into a
similar plastic cup containing the nutrient solution. Hundred millilitres (100 mL) of N–free
nutrient solution (appendix B) was added to the lower container of each Leonard jar assembly.
The rooting medium was irrigated with a cotton wick connecting the upper and the lower units,
after which the whole assembly was autoclaved to get rid of microorganisms. The legume seeds
were surface sterilized in 70% alcohol for 3 minutes and rinsed thoroughly in several changes of
sterilized distilled water (Somasegaran & Hoben, 1994). The seeds were pre–germinated on
moist filter paper in petri dishes until the radicles were about 2 cm long. A pair of sterilized
forceps was used to prepare holes in the rooting medium in each assembly. Seeds with radicle
length of about 1–2 cm were picked up with the sterile pair of forceps and placed one per hole,
with the radicle facing downwards. The holes were deep enough to accommodate pre–
germinated seeds 0.5 cm below the surface. Two seedlings were transplanted into each sterilized
plastic cup containing autoclaved acid–washed sand. The assembly were randomly arranged in a
greenhouse. One millilitre (1 mL) of ten–fold dilutions (i.e. ten grams of the soil sample was
diluted in 90 mL of sterile distilled water) of soil suspension was used to inoculate each jar
(Somasegaran & Hoben, 1994) with four replicates of each dilution (10–1, 10–2, 10–3, 10–4, 10–5)
step. The plants were supplied with N–free nutrient solution when necessary. The plants were
assessed for the presence of nodules 6 weeks after planting and the most probable number of
University of Ghana http://ugspace.ug.edu.gh

50
rhizobia cells per gram of soil per legume calculated (Vincent, 1970). At harvest, the total
number of nodulated units was obtained by summing up the nodulated units at each dilution
level. Uninoculated controls were used to check for sterile conditions. The MPN was calculated
using the formula:
MPN =m × d
v [3.9]
Where: m is the most likely number from MPN table,
d is the lowest dilution in the series and
v is the aliquot used for inoculation (Somasegaran & Hoben, 1994).
3.4 The Greenhouse Experiment
3.4.1 Nodulation Potential of African Yam Bean
The ability of African yam bean to nodulate in the various soils was evaluated in plastic pots
with top internal diameter of 16.3 cm and bottom interior diameter of 11.2 cm containing 2 kg of
each soil type. The pots were perforated at the bottom to allow for drainage of excess water.
They were placed in plastic plates to collect any excess drained water. Four surface sterilised and
pre–germinated seeds were planted in each pot, which were later thinned to two plants. There
were three replicate per each soil. The pots were randomly arranged, kept at the greenhouse and
watered regularly. The plants were harvested six weeks after planting and assessed for
nodulation.
3.4.2 Nitrogen and Phosphorus Response Experiment
The response of African yam bean to nitrogen and phosphorus fertilizers was evaluated. The
experiment was conducted in plastic pots (14.5 cm high, 16.3 cm wide at the top and 11.2 cm
University of Ghana http://ugspace.ug.edu.gh

51
wide at the base). The pots were filled with 2 kg each of the various soils that have been sieved
through 2 mm sieve. Four seeds were planted in each pot and later thinned to two after
germination. Isotope dilution was done with 15N labelled (NH4)2SO4 and ordinary (NH4)2SO4
fertilizer applied at 0, 50, 100, and 200 kg N ha−1. Phosphorus was applied in the form of triple
superphosphate (TSP) at 0, 40, 80 and 120 kg P ha−1. The test crops used were African yam bean
(Sphenostylis stenocarpa, cream colour) and maize (Zea maiz Cultivar Obaatampa used as a
reference plant). The nitrogen fertilizer was applied in two splits; 5 days after germination and
three weeks after germination. The experiment was arranged as randomised complete design
with four replicates. The plants were kept in the greenhouse and watered daily. The plants were
harvested at seven weeks after planting by cutting the stem at the soil surface level. The roots
were carefully washed in slow running water and observed nodules were collected and counted.
The vegetative parts were oven–dried at 70oC until a constant dry weight was obtained. The
shoot dry weight was obtained and the plant samples were milled for chemical analysis.
3.5 Chemical Analysis of Plant Material
3.5.1 Digestion of Plant Material
One–tenth of a gram (0.1 g) of the milled plant sample was weighed into a 25 mL flask and 5 mL
of concentrated sulphuric acid (H2SO4) was added. The flasks were swirled intermittently to
facilitate contact between the sample and the sulphuric acid. The flask was allowed to stand
overnight for the sulphuric acid to dissolve the plant sample entirely. Thereafter, each solution
was heated for some time after which Hydrogen Peroxide (H2O2) was added until the solution
became clear. Distilled water was added and the solutions were allowed to stand overnight to
cool and settle after which they were decanted into a 100 mL flask. Aliquots of the digest or
extract were taken for nitrogen and phosphorus determination.
University of Ghana http://ugspace.ug.edu.gh

52
3.5.2 Determination of Plant Total Nitrogen
A 5 mL aliquot of the digest (described in Section 3.5.1 above) was taken into a Markhan
distillation apparatus. Five millilitres (5 mL) of 40% NaOH solution was added to the aliquot and
the mixture distilled. The distillate was collected in 5 mL of 2% boric acid. Three drops of a
mixed indicator containing methyl red and methylene blue were added to the distillate in a 50
mL Erlenmeyer flask and then titrated against 0.01M HCl acid solution (Bremner, 1965). The
percentage nitrogen was calculated as:
N(%) =Titre × Molarity of HCl × Vol. of extract × 0.014
Vol. of aliquot × Weight of plant sample × 100 [3.10]
Where 0.014 = milliequivalent weight of nitrogen
The shoot total N (mg/plant) was derived from the shoot biomass (shoot dry matter yield: SDW)
and the plant N content (% N) as:
Shoot Total N (𝑚𝑔/𝑝𝑙𝑎𝑛𝑡) = 𝑆𝐷𝑊 (𝑔 /𝑝𝑙𝑎𝑛𝑡) ×shoot % N
100× 1000 [3.11 ]
The percentage of 15N atom excess in the milled plant samples (African yam bean and maize)
were analysed in Belgium by KULEUVEN Research and Development Laboratory. The
percentage of N derived from the atmosphere (%Ndfa) by the legume was calculated using the
formula by IAEA (2001):
%Ndfa = (1 −atom % N15 excess in Nitrogen fixing plant
atom % N15 excess in reference plant) × 100 [3.12 ]
Total N fixed (𝑚𝑔/𝑝𝑙𝑎𝑛𝑡) = % Ndfa
100× 𝑆ℎ𝑜𝑜𝑡 𝑡𝑜𝑡𝑎𝑙 𝑁 (𝑚𝑔/𝑝𝑙𝑎𝑛𝑡) [3.13 ]
University of Ghana http://ugspace.ug.edu.gh

53
3.5.3 Determination of Plant Total Phosphorus
Five millilitres (5 mL) aliquot of the digest (described in section 3.5.1 above) was taken into a 50
mL volumetric flask in duplicates. The pH was adjusted using P–nitrophenol indicator and
neutralized with a few drops of 4M NH4OH until the solution turned yellow. Eight millilitres (8
mL) of reagent B; prepared by dissolving 1.056 g of ascorbic acid in 200 mL of reagent A [12 g
of ammonium molybdate + 0.2998 g of antimony potassium tartrate dissolved in 250 mL of
distilled water]. The dissolved reagents were added to 1000 mL of 2.5M H2SO4 (148 mL of
conc. H2SO4), mixed thoroughly and made to the 2000 mL mark (Watanabe & Olsen, 1965). The
solutions were mixed thoroughly by shaking and allowing to stand for 15 minutes for the colour
to stabilize. The colour changed to blue of different shades depending on the concentration of
phosphorus available in the soil. A blank was prepared with distilled water and 8 mL of reagent
B. The spectrophotometer was calibrated using 25 mg L−1 standard P solution prepared in the
same manner as above. The intensity of the blue colour was measured using the Philips PU 8620
spectrophotometer at a wavelength of 712 nm. The P concentration in the plant tissue was
calculated as:
P (%) =R × Vol. of extract
Vol. of aliquot × Weight of soil × 106× 100 [3.14]
Where R = Spectrophotometer reading in mg L–1
The shoot total P (P uptake) was derived from the shoot biomass (dry matter yield) and the shoot
P content (% P) as:
Shoot Total P (𝑚𝑔/𝑝𝑙𝑎𝑛𝑡) = 𝑆ℎ𝑜𝑜𝑡 𝑑𝑟𝑦 𝑤𝑒𝑖𝑔ℎ𝑡 (𝑔) ×shoot % P
100× 1000 [3.15 ]
University of Ghana http://ugspace.ug.edu.gh

54
The phosphorus utilization efficiency (PUE) was also calculated for the different rates of P using
the formula of Elliott and White (1994):
PUE (𝑔 𝑆𝐷𝑀𝑌/ 𝑚𝑔 𝑃 𝑡𝑎𝑘𝑒𝑛 𝑢𝑝) =𝑆𝐷𝑀𝑌 (𝑔)
𝑃 𝑈𝑝𝑡𝑎𝑘𝑒 (𝑚𝑔/𝑝𝑙𝑎𝑛𝑡) [3.16 ]
SDMY = shoot dry matter yield
3.6 Isolation of Rhizobia
Representative nodules were sampled from the initial screening study and Rhizobium spp were
isolated for further studies. The nodules were first surface sterilized with 70% alcohol for 3
minutes and then with 0.1% mercuric chloride (HgCl) for another 3 minutes and rinsed with
several washes of sterile distilled water (Somasegaran & Hoben, 1994). The nodules were each
crushed in a drop of sterile distilled water in a petri dish with a sterile rod. A loopful of the
suspension was then streaked on yeast extract mannitol (YEM) agar (Appendix A) plates and
incubated at 28oC. A total of 30 Rhizobium isolates were obtained.
3.7 Cross Inoculation Studies (Host Range Analysis)
The ability of each isolate to nodulate different leguminous plant species was assessed using the
cross inoculation concept. The legumes used as host plants included both grain and forage
legumes. They included cowpea (Vigna unguiculata), yardlong bean (Vigna sesquipedalis),
groundnut (Arachis hypogea), lima bean (Phaseolus lunatus), African yam bean (Sphenostylis
stenocarpa), bambara groundnut (Voandzeia subterranean), crotalaria (Crotalaria spp) and
Pueraria. Seeds of the selected host legumes were surface–sterilized and germinated in sterile
Petri dishes containing moist sterile filter paper. The germinated seedlings were transplanted at
two seedlings per growth pouch. Growth pouches containing sterile nitrogen free nutrient
University of Ghana http://ugspace.ug.edu.gh

55
solution were inoculated with 1 mL of 4 days old YEM broth culture (containing about 109 cells
mL−1) of the corresponding rhizobia isolate (Somasegaran & Hoben, 1994). Uninoculated
pouches served as control treatment. The pouches were randomly arranged and kept in the
greenhouse. Seedlings were watered with sterile N–free nutrient solution whenever necessary.
Nodule formation was assessed five weeks after inoculation.
3.8 Molecular Characterisation
Thirty (30) rhizobial isolates were randomly isolated from nodules of African yam bean
(Sphenostylis stenocarpa) grown in four Ghanaian soils. The nodules were selected mostly based
on the presence of the pink/red colouration in the nodule and the size of the nodule. Total
genomic DNA isolated from African yam bean rhizobia was analysed by Polymerase Chain
Reaction (PCR) technique using an arbitrary primer (RPO4: 5′–GGAAGTCGCC–3′), a 20–base
oligonucleotide primer corresponding to a conserved nif gene promoter region (RPO1: 5′–
TGCGGCTGGATCACCTCCTT–3′) (Richardson et al., 1995). The Amplified Ribosomal DNA
Restriction Analysis (ARDRA) of the 16S rDNA gene was done. Also, the Internal Transcribed
Spacer (ITS) was amplified and the size fractionated.
3.8.1 Genomic DNA Extraction
Genomic DNA was extracted by using a Qiagen DNeasy kit. The rhizobial isolates were grown
in YEM broth in an incubator shaker at 150 rpm and 28°C for 72 hours. About 1–2 mL of
rhizobial cultures were centrifuged at 8500×g for 10 minutes and the supernatant discarded. The
cell pellets were harvested and resuspended in 400 µL of preheated AP1 buffer (lysis buffer),
vortexed and incubated at 65oC for 15 minutes in a water bath. The tubes were inverted every 5
minutes during the incubation period. The cell pellets were added with 130 µL of AP2 buffer
(precipitation buffer), vortexed and incubated on ice for 5 minutes. The lysate was transferred
University of Ghana http://ugspace.ug.edu.gh

56
into a DNA Mini spin column placed in a 2 mL collection tube and centrifuged for 5 minutes at
20,000×g (14,000 rpm). The flow–through fraction was transferred into a new tube and 1.5
volumes of AP3/E was added and mixed by pipetting. An aliquot of 650 µL of the mixture was
transferred into a DNeasy Mini spin column in a 2 mL collection tube and centrifuged for 1 min
at 6000×g, after which the flow–through was discarded. Thereafter, 500 µL of AW buffer was
added and centrifuged for 2 minutes at 20,000×g. The spin column was carefully transferred into
a new 2 mL micro centrifuge tube, and 100 µL of AE buffer was added for elution. The mixture
was incubated at room temperature for 5 minutes and then centrifuged at 6000×g for 1 min. The
column was discarded the DNA was stored appropriately (4C for short term, −20C for long
term storage).
3.8.2 PCR Amplification of Genomic DNA using RPO1 and RPO4 Primers
Total genomic DNA of the rhizobial isolates were amplified using RPO1 and RPO4 primers.
Amplification reaction was carried out in a 12.5 μL mixture solution containing 1 μL of 12.5
mM MgCl2, 1.25 μL of ×10 buffer, 0.25 μL of dNTPs, 0.25 μL of Taq polymerase, 1 μL of
primer, 1.5 μL of template DNA and 7.25 μL of water. Polymerase chain reaction (PCR)
amplifications were carried out in a BOI–RAD iCycler system with an initial denaturation of
temperature of 92°C for 30 s, followed by 35 cycles of denaturation (30 seconds at 94°C),
annealing (2 min at 40°C), and extension (90 seconds at 78°C); followed by a final extension at
72oC for 3 min. The concentration and size of the PCR products were examined on a 2% agarose
gel pre–stained with ethidium bromide in 1×Tris–acetate EDTA (TAE) buffer. The gels were run
for 120 minutes at 90v and photographed under UV illumination in a GeneFlash (Syngene BIO
Imaging) unit.
University of Ghana http://ugspace.ug.edu.gh

57
3.8.3 PCR Amplification of 16S–23S Intergenic Spacer (ITS) and 16S rDNA Gene
Polymerase chain reaction (PCR) of the 16S–23S rDNA (ITS) and the 16S rDNA gene was
performed with the primer sets; ITS 149072F (5′–TGCGGCTGGATCCCCTCCTT–3′), ITS
13238R (5′–CCGGGTTTCCCCATTCGG–3′), 16SF (5′–AGAGTTTGATCCTGGCTCAG–3′)
and 16SR (5′–AAGGAGGTGATCCAGCCGCA–3′). Amplification reactions were performed in
a 25 µL volume, containing 2 µL MgCl2 (25 mmol L−1), 0.5 µL of dNTPs, 2.5 µL of 10× buffer,
0.5 µL Taq polymerase, 12.8 µL of H2O, 2.0 µL of each primer and 2 µL of template DNA. The
thermal profile used was an initial denaturation step at 95 °C for 1 minute, 35 cycles consisting;
of 1 min denaturation at 94 °C, 1 minute of primer annealing at 50 °C and 2 min of extension at
72 °C, plus a 3 min final extension at 72 °C. The concentration and size of the PCR products were
examined on a 2% agarose gel pre–stained with ethidium bromide in 1×Tris–acetate EDTA
(TAE) buffer. The gels were run for 120 minutes at 90v and photographed under UV
illumination in a GeneFlash (Syngene BIO Imaging) unit.
3.8.4 Restriction Fragment Length Polymorphism (RFLP) Analysis
Polymerase chain reaction (PCR) products were digested with the restriction endonucleases
HindIII and HhaI for ITS analysis and HhaI and HaeIII for 16S rDNA gene analysis. The
restriction enzymes were used to digest 5 μL aliquots of amplified DNA and incubated at 37oC
for at least one hour. The digested DNA fragments were separated by horizontal gel
electrophoresis on a 2.5% agarose gel pre–stained with ethidium bromide in 1×TAE buffer. The
gels were run for 90 minutes at 100v and photographed under UV illumination in a GeneFlash
(Syngene BIO Imaging) unit.
University of Ghana http://ugspace.ug.edu.gh

58
3.9 Data Analysis
3.9.1 Statistical Analysis
The data collected from the various experiments were subjected to general Analysis of Variance
and the means obtained were compared by the Least Significant Difference (LSD) at 5 % level of
significance using GENSTAT software version 9. Microsoft Excel was used to effectively order
and summarize the mean values into graphs, as well as run correlation analysis where necessary.
3.9.2 Cluster Analysis
Polymerase chain reaction (PCR) products were scored as presence (1) and absence (0) of band
at specific band sizes for each of the primers used. A data matrix with fragments in columns and
rhizobia isolates in rows was assembled from these scores. Cluster analysis was performed to
reveal the genetic relationship among the isolates. Genetic associations among varieties were
evaluated using simple matching similarity coefficients for pair–wise comparisons based on the
proportion of shared bands produced by the primers. Similarity matrices were generated using
the SIMQUAL sub–program of NTSYS–PC software (Rohlf, 1998). Similarity coefficients were
used for cluster analysis of varieties using the SAHN sub–program of NTSYSPC software and
dendrograms were obtained using the un–weighted pair–group method with arithmetic average
(UPGMA) sub–program of NTSYS–PC V.2.1.
3.9.3 Diversity, Richness and Evenness Indices
The diversity among rhizobia isolates from the various soils was estimated using the Shannon–
Weaver Index (Shannon & Weaver, 1949). This Index of diversity (H′) was estimated based on
the number of isolates belonging to each group of profiles in RPO1 and RPO4 PCR
amplifications, considering an 80% similarity in the cluster analysis. The idea behind this index
University of Ghana http://ugspace.ug.edu.gh

59
is that the diversity of a community is similar to the amount of information in a code or message.
The diversity is calculated using the following equation:
𝑯′ = −∑𝑷𝒊𝒍𝒏 𝑷𝒊
𝒏
𝒊−𝟏
[𝟑. 𝟏𝟕]
Where Pi is the proportion of individuals found in species i. For a well–sampled community, this
proportion as Pi = ni/N, where ni is the number of individuals in species i and N is the total
number of individuals in the community. Since by definition the p is between zero and one, the
natural log makes all of the terms of the summation negative, which is why the inverse of the
sum is taken.
The Margalef index was used to calculate the quantity of richness (R) among the isolates
(Margalef, 1958):
𝑹 = 𝑺 − 𝟏 𝒍𝒏 𝑵⁄ [𝟑. 𝟏𝟖]
Where S in this case is the number of groups or clusters and N is the total number of isolates in
all clusters.
Pielou index (J) was used to estimate the degree of evenness among the isolates (Pielou, 1966):
𝑱 = 𝑯′
𝒍𝒏 𝑺⁄ [𝟑. 𝟏𝟗]
Where H′ is the Shannon–Weaver index and S is the total number of clusters per soil at 80%
similarity level.
University of Ghana http://ugspace.ug.edu.gh

60
CHAPTER FOUR
RESULTS
4.1 Soil characterization
Results on selected chemical, physical and biological properties are presented in Table 4.1.
Table 4.1: Some chemical, physical and biological characteristics of the four soils used.
Soil Characteristics Level
Adenta Akuse Haatso Toje
pHw (H2O) 5.7 6.5 6.4 5.4
pHs (0.01M CaCl2) 4.9 5.2 5.2 4.3
Organic carbon (g kg−1) 4.8 8.7 3.0 8.7
Total N (g kg−1) 4.5 0.9 1.2 1.5
Available P (mg kg−1) 4.08 7.6 3.8 5.3
C/N ratio 0.88 9.67 2.5 5.8
Bulk Density (Mg m−3) 1.32 1.46 1.34 1.25
Sand (g kg−1) 680 514 755 515
Silt (g kg−1) 80 63 65 127
Clay (g kg−1) 240 423 180 358
Textural Class SCL SC SL SCL
CEC (cmolc kg−1 soil) 7.1 33.2 7.4 5.8
Rhizobia Population (cells g−1 soil)
African yam bean 170 200 140 93
Cowpea 680 200 280 120
SCL = Sandy Clay Loam SC=Sandy clay SL=Sandy loam
University of Ghana http://ugspace.ug.edu.gh
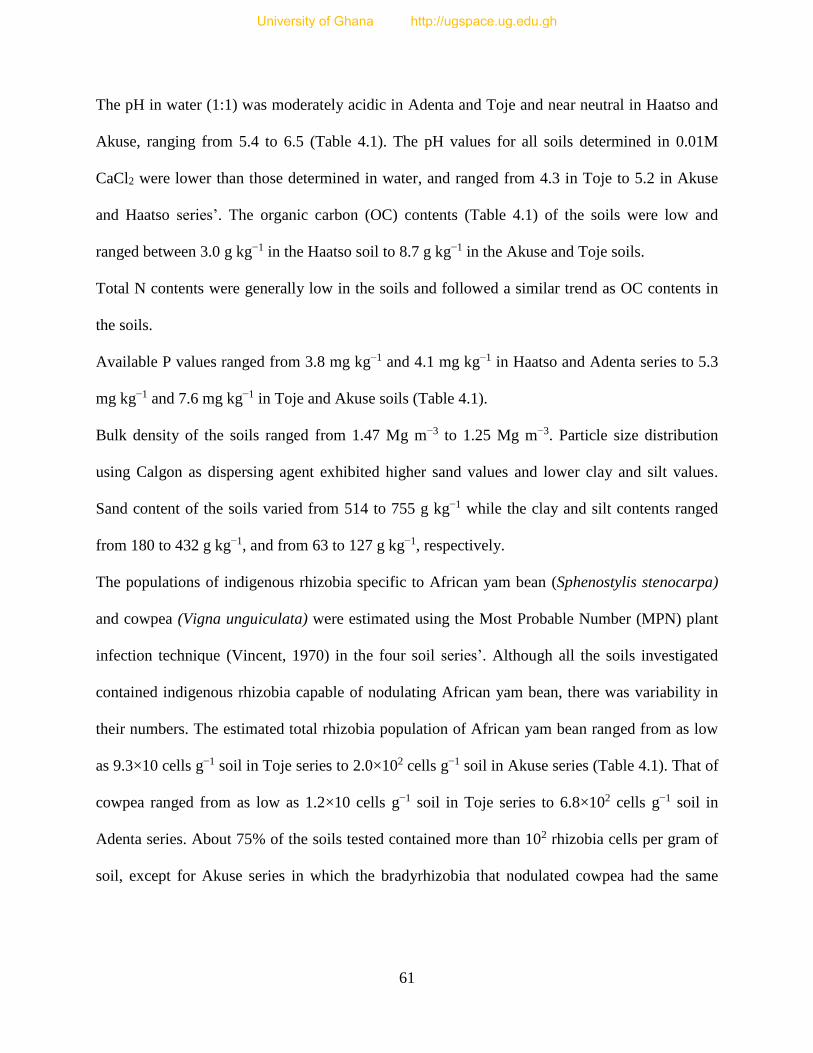
61
The pH in water (1:1) was moderately acidic in Adenta and Toje and near neutral in Haatso and
Akuse, ranging from 5.4 to 6.5 (Table 4.1). The pH values for all soils determined in 0.01M
CaCl2 were lower than those determined in water, and ranged from 4.3 in Toje to 5.2 in Akuse
and Haatso series’. The organic carbon (OC) contents (Table 4.1) of the soils were low and
ranged between 3.0 g kg−1 in the Haatso soil to 8.7 g kg−1 in the Akuse and Toje soils.
Total N contents were generally low in the soils and followed a similar trend as OC contents in
the soils.
Available P values ranged from 3.8 mg kg−1 and 4.1 mg kg−1 in Haatso and Adenta series to 5.3
mg kg−1 and 7.6 mg kg−1 in Toje and Akuse soils (Table 4.1).
Bulk density of the soils ranged from 1.47 Mg m−3 to 1.25 Mg m−3. Particle size distribution
using Calgon as dispersing agent exhibited higher sand values and lower clay and silt values.
Sand content of the soils varied from 514 to 755 g kg−1 while the clay and silt contents ranged
from 180 to 432 g kg−1, and from 63 to 127 g kg−1, respectively.
The populations of indigenous rhizobia specific to African yam bean (Sphenostylis stenocarpa)
and cowpea (Vigna unguiculata) were estimated using the Most Probable Number (MPN) plant
infection technique (Vincent, 1970) in the four soil series’. Although all the soils investigated
contained indigenous rhizobia capable of nodulating African yam bean, there was variability in
their numbers. The estimated total rhizobia population of African yam bean ranged from as low
as 9.3×10 cells g−1 soil in Toje series to 2.0×10² cells g−1 soil in Akuse series (Table 4.1). That of
cowpea ranged from as low as 1.2×10 cells g−1 soil in Toje series to 6.8×10² cells g−1 soil in
Adenta series. About 75% of the soils tested contained more than 102 rhizobia cells per gram of
soil, except for Akuse series in which the bradyrhizobia that nodulated cowpea had the same
University of Ghana http://ugspace.ug.edu.gh

62
population as African yam bean bradyrhizobia, all the soils harboured less compatible African
yam bean bradyrhizobia than the cowpea (Table 4.1).
4.2 Nodulation Potential of African Yam Bean (Sphenostylis stenocarpa)
The nodulation capacity of African yam bean with native rhizobia was evaluated in four
Ghanaian soils. Root nodules were formed on all the African yam bean plants grown in all the
soils. However, significant differences (p < 0.05) occurred among the different soils (Table 4.2).
Toje series with the lowest pH recorded the lowest number of nodules (14 nodules plant–1) with
those in Haatso forming the highest (39 nodules plant–1) (Table 4.2). Nodulation in Adenta series
like that in Haatso series was significantly (p < 0.05) higher than that in Akuse series, which was
in turn higher than that in Toje series. Adenta series recorded about 76% higher nodulation
compared to Toje series, and about 11% less compared to Haatso. Haatso series thus recorded
about 78% higher nodulation compared with Toje series (Table 4.2). Haatso series recorded the
highest amount of shoot total nitrogen, followed by Adenta. There were significant differences (p
< 0.001) in the shoot dry weight of African yam bean among the soils tested.
Table 4.2: Nodulation, N accumulation and Shoot dry weight of African Yam Bean grown
in four Ghanaian Soils.
Soil Nodules plant–1 Shoot Dry Weight Shoot N Shoot Total N
(g plant–1) (%) (mg plant–1)
Adenta 37 2.0 3.0 61.1
Akuse 23 1.1 4.2 37.8
Haatso 39 1.9 3.1 73.1
Toje 14 1.2 3.1 38.4
LSD (0.05) 8.95 0.34 0.55 11.3
CV (%) 21.30 14.40 10.40 13.9
University of Ghana http://ugspace.ug.edu.gh
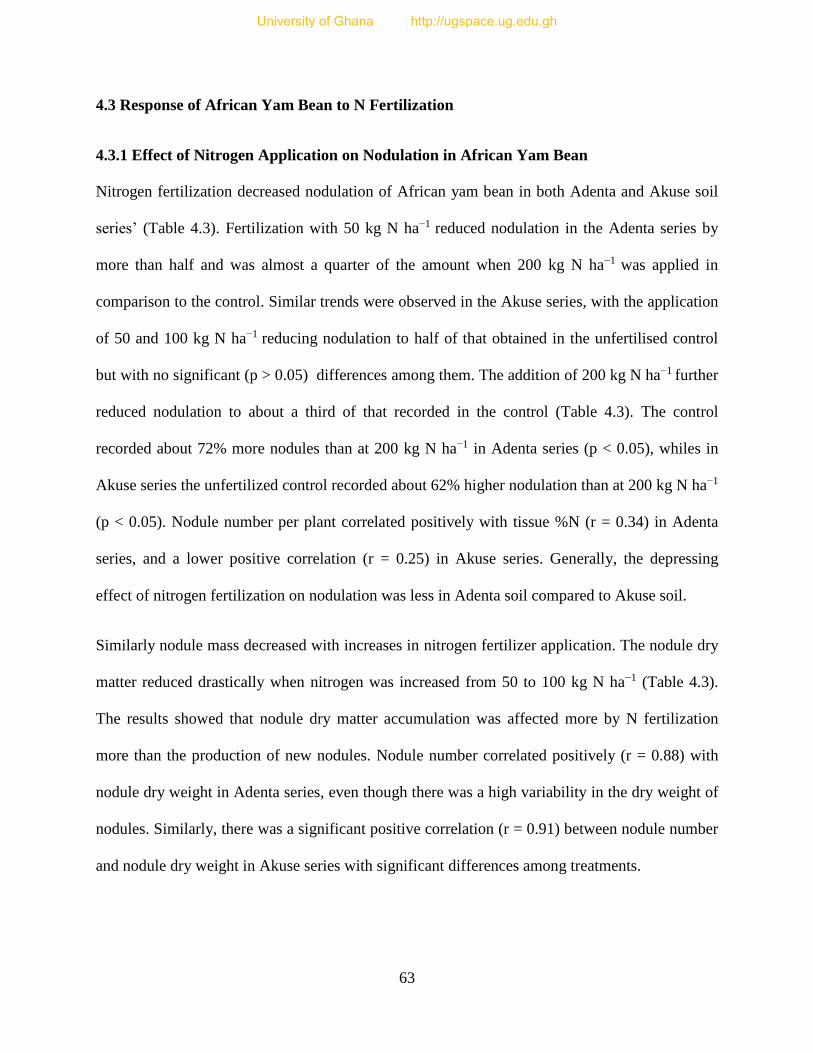
63
4.3 Response of African Yam Bean to N Fertilization
4.3.1 Effect of Nitrogen Application on Nodulation in African Yam Bean
Nitrogen fertilization decreased nodulation of African yam bean in both Adenta and Akuse soil
series’ (Table 4.3). Fertilization with 50 kg N ha−1 reduced nodulation in the Adenta series by
more than half and was almost a quarter of the amount when 200 kg N ha−1 was applied in
comparison to the control. Similar trends were observed in the Akuse series, with the application
of 50 and 100 kg N ha−1 reducing nodulation to half of that obtained in the unfertilised control
but with no significant (p > 0.05) differences among them. The addition of 200 kg N ha−1 further
reduced nodulation to about a third of that recorded in the control (Table 4.3). The control
recorded about 72% more nodules than at 200 kg N ha−1 in Adenta series (p < 0.05), whiles in
Akuse series the unfertilized control recorded about 62% higher nodulation than at 200 kg N ha−1
(p < 0.05). Nodule number per plant correlated positively with tissue %N (r = 0.34) in Adenta
series, and a lower positive correlation (r = 0.25) in Akuse series. Generally, the depressing
effect of nitrogen fertilization on nodulation was less in Adenta soil compared to Akuse soil.
Similarly nodule mass decreased with increases in nitrogen fertilizer application. The nodule dry
matter reduced drastically when nitrogen was increased from 50 to 100 kg N ha−1 (Table 4.3).
The results showed that nodule dry matter accumulation was affected more by N fertilization
more than the production of new nodules. Nodule number correlated positively (r = 0.88) with
nodule dry weight in Adenta series, even though there was a high variability in the dry weight of
nodules. Similarly, there was a significant positive correlation (r = 0.91) between nodule number
and nodule dry weight in Akuse series with significant differences among treatments.
University of Ghana http://ugspace.ug.edu.gh

64
Table 4.3: Effect of N application on nodulation and nodule mass of African yam bean in
two soils.
ADENTA AKUSE
Fertilizer Rate
(kg N ha−1)
Nodule number
per plant
Nodule dry wt.
(mg plant−1)
Nodule number
per plant
Nodule dry wt.
(mg plant−1)
0 37 39.2 20 20.9
50 15 10.0 11 3.5
100 14 6.8 10 7.0
200 10 3.5 8 2.0
LSD (0.05) 8.9 10.6 6.2 9.9
4.3.2 Effect of Nitrogen application on N2 fixation in African yam bean
The effect of nitrogen fertilization on nitrogen fixation is presented in Table 4.4. The amount of
N2 fixed was calculated using the 15N Isotope dilution method. The result shows a general
decrease in N2 fixation with increasing rate of nitrogen application in both soils even though
there was high variability among treatments. Nitrogen fertilization of 200 kg N ha−1 recorded
high amount of total N2 fixed than the lower rates (Table 4.4). This could be due to the high dry
matter yield observed with increase in plant available nitrogen. Generally nodule number
correlated positively (r = 0.781) with total nitrogen fixed. Total N2 fixed when 50 kg N ha−1 was
applied was insignificant. Interestingly, nitrogen fixation increased at 200 kg N ha−1 in Adenta
soil.
University of Ghana http://ugspace.ug.edu.gh

65
Table 4.4: Effect of Nitrogen on N2 fixation in African yam bean in two Ghanaian soils.
Ndfa* (%) Total N fixed (mg plant−1)
Fertilizer Rate
(kg N ha−1)
Adenta Akuse Adenta Akuse
0 34.6 12.9 23.7 4.5
50 0.0 0.0 0.0 0.0
100 13.4 35.9 12.4 28.9
200 32.9 5.5 41.7 79.1
LSD (0.05) 5.2 4.7 5.9 8.8
Ndfa* = Nitrogen derived from Atmosphere
4.3.3 Effect of Nitrogen application on N accumulation in African yam bean
The concentration of N in shoot of African yam bean increased significantly (p < 0.05) in both
soils with increase in N rates. Shoot %N varied from 3.3% in the control to 5.5% at 200 kg N
ha−1. The percentage increases in shoot N concentration (%N) across the different rates of N are
24%, 46% and 65% for 50, 100 and 200 kg N ha−1 respectively, in comparison with the control
in Adenta series. Similarly Akuse series also recorded significant (p < 0.05) increases in shoot N
concentration across treatments (Table 4.5). The variations in the shoot N concentration with N
fertilization were 13% to 46% in 200 kg N ha−1. Secondly, increasing the rate of N applied,
resulted in increment of shoot total N accumulation (Table 4.5).
University of Ghana http://ugspace.ug.edu.gh

66
Table 4.5: Effect of Nitrogen application on N accumulation and shoot total N of African
yam bean in two soils.
ADENTA AKUSE
Fertilizer Rate
(kg N ha−1)
Shoot N
(%)
Total N in Shoot
(mg plant−1)
Shoot N
(%)
Total N in Shoot
(mg plant−1)
0 3.3 57.3 3.8 33.1
50 4.1 62.6 4.3 47.5
100 4.9 92.9 5.1 74.4
200 5.5 117.8 5.3 137.3
LSD (0.05) 0.49 14.1 0.8 14.5
4.3.4 Effect of Nitrogen Application on Dry Matter Yield of African yam bean
Nitrogen fertilization had a significant influence on above ground biomass of African yam bean
in both soils (Figure 4.1). Shoot dry matter accumulation increased significantly (p < 0.001) with
increases in N treatment in both soils (Figure 4.1). Shoot dry matter accumulation in the
unfertilised control and 50 kg N ha−1 was significantly (p < 0.05) different from those of the 100
and 200 kg N ha−1 in the Adenta soil. Increasing the rate of nitrogen from 0 to 200 kg N ha−1 in
Adenta resulted in about 2–fold increase in shoot dry matter accumulation (p < 0.017).
Shoot dry matter accumulation however showed about a threefold increase at 200 kg N ha−1 over
the unfertilised control in Akuse soil. Increases in shoot dry weight in Akuse soil across the
various N treatments showed that shoot dry weight approximately doubled at 200 kg N ha−1
compared to 50 kg N ha−1. Although less pronounced, there were significant (p < 0.05)
differences in the shoot dry weight between the 50 and 100 kg N ha−1 in Akuse. A strong
University of Ghana http://ugspace.ug.edu.gh

67
positive correlation was recorded between the shoot dry weight and nitrogen accumulation (% N)
in both soils (r = 0.61 and r = 0.77 for Adenta and Akuse soils’ respectively).
Figure 4.1: Shoot dry weight of African yam bean in Adenta and Akuse soils as affected by
N application.
4.4 Response of African Yam Bean to Phosphorus Application
4.4.1 Effect of P application on nodulation and nodule dry weight of AYB
In contrast to nitrogen fertilization, increasing the rates of phosphorus application resulted in
significant (p < 0.001) increases in nodule numbers in both soils over their respective controls
(Table 4.6). Nodule numbers ranged from 34 nodules plant−1 in the control to 78 nodules
plant−1at 120 kg P ha−1 in Adenta soil, and 15 nodules plant−1 in the control to 94 nodules plant−1
1.170.87
1.52
1.12
1.92
1.48
2.17
2.49
0
0.2
0.4
0.6
0.8
1
1.2
1.4
1.6
1.8
2
2.2
2.4
2.6
Adenta Akuse
Soils used
Sh
oo
t D
ry W
eigh
t (g
pla
nt
-1)
0
50
100
200
LSD (0.05) = 0.34
LSD (0.05) = 0.36
University of Ghana http://ugspace.ug.edu.gh

68
at 120 kg P ha−1 in Akuse soil. However, addition of phosphorus in excess of 80 kg P ha−1 in
Adenta soil, did not translate into any significant increase in nodule numbers, while significant
increases in nodule numbers were recorded in Akuse soil (Table 4.6).
Under low soil P conditions, both soils gave fewer and smaller nodules compared to the more
numerous and heavier nodules produced under high P levels. This implies a positive response of
nodule mass to increasing phosphorus rate. Comparison of Adenta and Akuse soils’ dry nodule
biomasses, across phosphorus rates, revealed that dry nodule mass was about 31% heavier in
Adenta soil than Akuse, with more pronounced variations observed at lower rates of fertilization.
There was a significant (p < 0.05) relationship between nodule number and nodule mass in both
soils, with both parameters increasing linearly (r = 0.81 and r = 0.94 for Adenta and Akuse soils’,
respectively) with increase in P rate. In Adenta soil, there was a little over two–fold increase in
nodule number with added P (between 0 and 120 kg P ha−1) but the nodule dry weight increased
by a little over seven folds (Table 4.6). Similarly in Akuse soil, nodule number increased by six
fold while nodule dry weight increased by 15–fold. Thus the addition of P had a greater effect on
nodule mass than on the numbers.
University of Ghana http://ugspace.ug.edu.gh

69
Table 4.6: Effect of P application on nodulation and nodule mass of African yam bean in
two soils.
ADENTA AKUSE
Fertilizer Rate
(kg P ha−1)
Nodule number
per plant
Nodule dry wt.
(mg plant−1)
Nodule number
per plant
Nodule dry wt.
(mg plant−1)
0 34 39.2 15 20.9
40 43 189.5 42 176.9
80 75 265.7 71 240.8
120 79 289.8 94 300.8
LSD (0.05) 16.8 87.7 16.1 60.6
4.4.2 Effect of P application on N2 fixation in African yam bean
The data on the effect of P fertilization on nitrogen fixation in African yam bean across
treatments is presented in Table 4.7. Phosphorus fertilization from 40 to 80 and 120 kg P ha−1 did
not result in any significant increase in the percentage of nitrogen derived from atmosphere (%
Ndfa) in both soils (Table 4.7). Thus majority of the incremental effect of P on nitrogen fixation
(% Ndfa) occurred between zero and 40 kg P ha−1 in both soils (Table 4.7).
Similarly, P had a positive effect on total nitrogen fixation in both soils (Table 4.7). Total N2
fixation ranged from 23.7 mg N plant−1 in the unfertilised control to 117.8 mg N plant−1 at 120
kg P ha−1 in Adenta soil. A similar trend was observed in Akuse soil with values ranging from
4.5 mg N plant−1 in the control to 105 mg N plant−1 at 120 kg P ha−1 (Table 4.7). However, the
increase in total N2 fixed with increase in P was higher in Akuse soil than in Adenta soil.
Interestingly in Akuse soil, even though there was no significant difference in %Ndfa among P
treatments except for the control, the corresponding total N2 fixation showed significant
differences among treatments (Table 4.7).
University of Ghana http://ugspace.ug.edu.gh
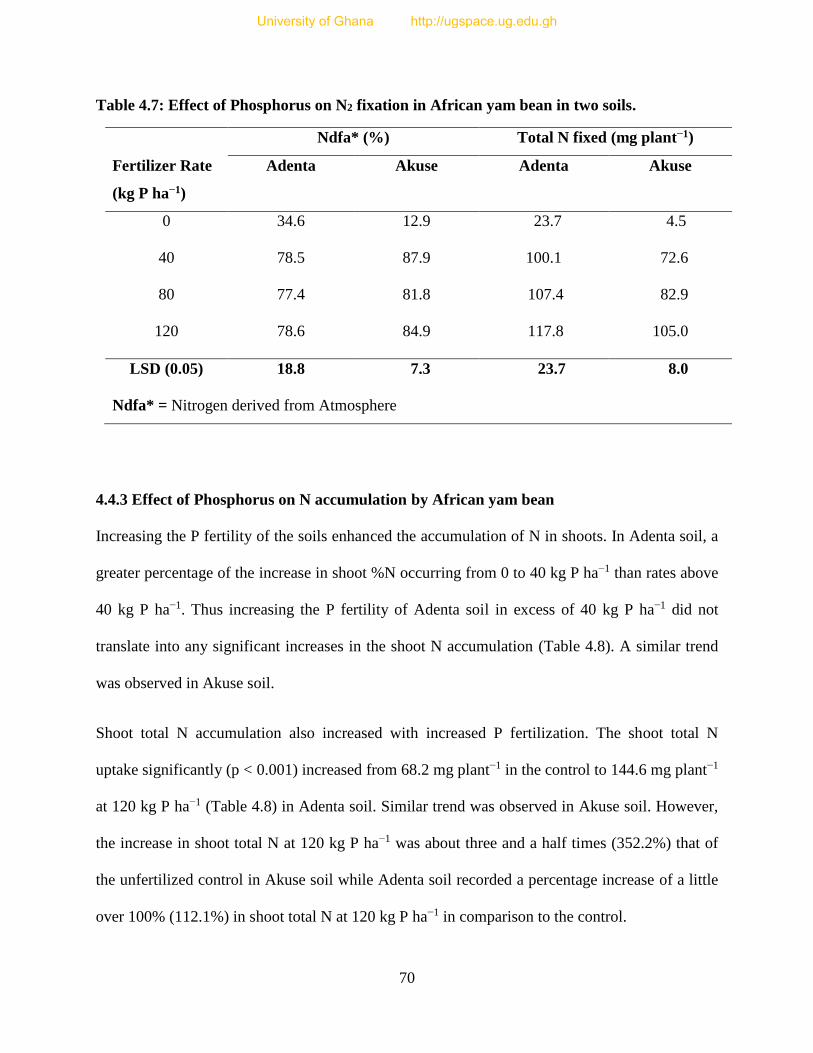
70
Table 4.7: Effect of Phosphorus on N2 fixation in African yam bean in two soils.
Ndfa* (%) Total N fixed (mg plant−1)
Fertilizer Rate
(kg P ha−1)
Adenta Akuse Adenta Akuse
0 34.6 12.9 23.7 4.5
40 78.5 87.9 100.1 72.6
80 77.4 81.8 107.4 82.9
120 78.6 84.9 117.8 105.0
LSD (0.05) 18.8 7.3 23.7 8.0
Ndfa* = Nitrogen derived from Atmosphere
4.4.3 Effect of Phosphorus on N accumulation by African yam bean
Increasing the P fertility of the soils enhanced the accumulation of N in shoots. In Adenta soil, a
greater percentage of the increase in shoot %N occurring from 0 to 40 kg P ha−1 than rates above
40 kg P ha−1. Thus increasing the P fertility of Adenta soil in excess of 40 kg P ha−1 did not
translate into any significant increases in the shoot N accumulation (Table 4.8). A similar trend
was observed in Akuse soil.
Shoot total N accumulation also increased with increased P fertilization. The shoot total N
uptake significantly (p < 0.001) increased from 68.2 mg plant−1 in the control to 144.6 mg plant−1
at 120 kg P ha−1 (Table 4.8) in Adenta soil. Similar trend was observed in Akuse soil. However,
the increase in shoot total N at 120 kg P ha−1 was about three and a half times (352.2%) that of
the unfertilized control in Akuse soil while Adenta soil recorded a percentage increase of a little
over 100% (112.1%) in shoot total N at 120 kg P ha−1 in comparison to the control.
University of Ghana http://ugspace.ug.edu.gh

71
Table 4.8: Effect of P application on Percent Shoot N and shoot total N of African yam
bean in two soils.
ADENTA AKUSE
Fertilizer Rate
(kg P ha−1)
Shoot N
(%)
Total N in Shoot
(mg plant−1)
Shoot N
(%)
Total N in Shoot
(mg plant−1)
0 3.3 68.2 3.8 33.1
40 4.14 126.6 4.2 74.7
80 4.1 138.7 4.4 113.8
120 4.1 144.6 4.7 146.3
LSD (0.05) 0.4 12.3 0.7 29.3
4.4.4 Effect of Phosphorus application on Dry Matter Yield of African yam bean
Shoot dry matter also showed a significant increase with increase in P rate (Figure 4.2). At 120
kg P ha−1, shoot dry matter increased was about 75% (p < 0.001) relative to the unfertilized
control in Adenta soil. On the other hand, a greater percentage increase was observed in Akuse
soil, with 120 kg P ha−1 recording a shoot dry matter of as much as three times that of the control
(Figure 4.2). Increasing the rate of P from 40 to 80 kg P ha−1 did not translate into significant
increases in shoot biomass in both soils. However, there were significant (p < 0.05) differences
observed between the unfertilised control and 120 kg P ha−1.
University of Ghana http://ugspace.ug.edu.gh

72
Figure 4.2: Shoot dry weight of African yam bean in Adenta and Akuse soils as affected by
phosphorus application.
4.4.5 Effect of P application on P uptake and Phosphorus Utilization Efficiency (PUE) of
African yam bean
Table 4.9 shows that there were significant (p < 0.05) increases in shoot P uptake with higher P
rate. The increase in P uptake may be attributed more to the increased dry matter yield rather
than increases in shoot P concentration (%P). The PUE is a derived technical expression of the
performance of African yam bean, and reflects the effectiveness or otherwise of the legume to
phosphorus fertilizer. The utilisation efficiency of the phosphorus applied was calculated for the
different rates in terms of dry matter yield per unit of P taken up. The results showed that lower
PUE was seen at higher P rates. There was a negative correlation between P uptake and PUE (r =
2.06
0.87
3.11
1.78
3.39
2.43
3.613.32
0.5
1
1.5
2
2.5
3
3.5
4
Adenta Akuse
Soils used
Shoot
dry
wie
ght
(g p
lant-1
)
0
40
80
120
LSD (0.05) = 0.66LSD (0.05) = 0.41
University of Ghana http://ugspace.ug.edu.gh

73
–0.80, R2 = 0.65 and r = –0.46, R2 = 0.212, respectively) on Adenta and Akuse soils’. The
maximum PUE was observed at 40 kg P ha–1 and decreased significantly (p < 0.05) with increase
in application rates (Table 4.9). Also, there was higher phosphorus utilisation efficiency (PUE)
by plants grown in the Adenta soil compared to those grown in Akuse soil.
Table 4.9: Effect of Phosphorus on P uptake and P Utilisation Efficiency.
P Uptake
(mg plant−1)
PUE*
(g DMY per mg P taken up)
Fertilizer Rate
(kg P ha−1)
Adenta Akuse Adenta Akuse
0 3.8 1.5 0.51 0.47
40 5.4 4.7 0.57 0.52
80 8.0 5.3 0.42 0.47
120 8.9 8.0 0.49 0.44
LSD (0.05) 2.2 3.6 0.12 0.13
PUE* = Phosphorus Utilization Efficiency
4.5 Diversity of Indigenous African Yam Bean Rhizobia
4.5.1 Cross Inoculation Studies (Host Range Analysis)
The degree of compatibility of indigenous African yam bean rhizobial isolates with some
selected legume species was examined, to determine the level of promiscuity of African yam
bean (Table 4.10). The results showed that there are differences in the type of host nodulated by
the different isolates. Three (3) out of the six (6) host legumes tested were nodulated by 80% of
the African yam bean bradyrhizobia isolates. Two host legumes from the genus Vigna; cowpea
(Vigna unguiculata) and yardlong bean (Vigna sesquipedalis) were compatible with most (80%)
University of Ghana http://ugspace.ug.edu.gh

74
of the five isolates tested. However none of the isolates tested was capable of eliciting nodulation
on bambara (Vigna subterranea), lima bean (Phaseolus lunatus) or crotalaria. Interestingly, most
of the isolates tested formed nodules with Pueraria spp.
Table 4.10: Test of the abilities of five African yam bean Bradyrhizobia isolates to cross
inoculate five host legumes.
Nodulation Score
Isolate AYB* Cowpea Bambara Lima bean YLB** Pueraria Crotalaria
AYB 1 + + – – + + –
AYB 2 + + – – + + –
AYB 3 + + – – – + –
AYB 4 + + – – + – –
AYB 5 + – – – + + –
*AYB=African Yam Bean **YLB=Yard Long bean + = presence of nodules and
– = absence of nodulation.
In a second experiment, rhizobia isolates from lima bean, yardlong bean and bambara groundnut
were inoculated on African yam bean (Figure 4.3). In contrast to the earlier results, African yam
bean was compatible to some (20%) of rhizobia isolates obtained from bambara groundnut, 40%
of lima bean rhizobia and 80% of rhizobia isolated from yardlong bean.
University of Ghana http://ugspace.ug.edu.gh

75
BG = Bambara Groundnut, LB = Lima Bean, YLB = Yardlong bean, AYB = African yam bean
Figure 4.3: Abilities of Rhizobium isolates obtained from three different legume genera to
form nodules on African yam bean.
0
10
20
30
40
50
60
70
80
90
100
BG LB YLB AYB
% o
f Is
ola
tes
tha
t N
od
ula
ted
Afr
ica
n y
am
bea
n
Source of Isolate
University of Ghana http://ugspace.ug.edu.gh

76
4.5.2 Molecular Analysis
4.5.2.1 DNA Amplification using arbitrarily primed oligonucleotide (RPO4)
Random amplified polymorphic DNA (RAPD) technique based on the polymerase chain reaction
(PCR) has been one of the most commonly used molecular techniques to develop DNA markers.
RAPD markers are amplification products of anonymous DNA sequences using single, short and
arbitrary oligonucleotide primers, and thus do not require prior knowledge of a DNA sequence.
The arbitrarily primed PCR amplifies anonymous fragments of DNA from any genome (Welsh
& McClelland, 1990).
The amplification patterns obtained using this primer revealed a high level of polymorphism
among the 30 African yam bean rhizobial isolates tested. An example of RPO4 primer
fingerprint is shown in Figure 4.4. The sizes of DNA bands that were produced in the PCR
reactions ranged from >100 bp to ≈ 2100 bp, but most of the bands were between 100 bp and
1000 bp range. The dendrogram (Fig. 4.5) derived from RPO4 profiles clustered all the 30
African yam bean Rhizobium strains into two distinct groups (1 & 2) at 60% similarity level.
Thus at 60% similarity level all the isolates were the same. The first major cluster (1) has nine
isolates which diverge at 63% similarity level. Within the second major cluster (2), two groups
of strains could be distinguished. Five isolates forming the first sub cluster (A) at 67% similarity
level. The second sub cluster (B) at 65% similarity has 16 isolates. Identical RAPD patterns
(100% similarity coefficient) using RPO4 primer were observed for two isolates (both from
Adenta series’). Six isolates (5 from Haatso and 1 from Adenta) and 8 isolates (2 from Akuse, 3
from Adenta, 2 from Haatso and 1 from Toje soils’) had 88% and 92% similarities, respectively
(Fig. 4.5). Based on these results, it is evident that RAPDs are useful for isolate discrimination
and identification in rhizobium populations collected from different soils.
University of Ghana http://ugspace.ug.edu.gh

77
Figure 4.4: Sample of a horizontal Gel electrophoretic pattern of amplified DNA of 15
African yam bean bradyrhizobia isolates using RPO4 Primer. Lane M: 100 bp
molecular maker and Lane 1–15 are rhizobia isolates.
Figure 4.5: Dendrogram generated with Un–weighted pair group with mathematical
average (UPGMA) showing genetic relationships among 30 African yam bean
bradyrhizobia isolates identified by RPO4 Primer analysis. AK, AD, HTS and
TJ implies isolates from Akuse, Adenta, Haatso and Toje soils respectively.
Similarity Coefficient
0.60 0.70 0.80 0.90 1.00
AK1 AK3 AD1 AK2 HTS2 AK6 AK8 TJ1 AK7 AK4 AK5 AD2 AK9 AD3 AD4 AD5 AD7 HTS3 HTS4 HTS5 AD6 HTS1 HTS6 HTS7 HTS8 HTS9 TJ2 TJ3 TJ4 TJ5
1
2
B
A
University of Ghana http://ugspace.ug.edu.gh

78
4.5.2.2 Direct DNA Amplification using nif gene directed primer (RPO1)
Direct amplified polymorphic DNA (DAPD) analysis, was performed using a single primer
(RPO1) directed to a nif gene promoter consensus sequence (Richardson et al., 1995). Based on
the average cluster analysis, the isolates formed 2 major groups at 54% similarity level (Fig. 4.6).
The first cluster had two distinct clusters with a mean similarity of 58%. The second major
cluster had three isolates all from Toje soil with 65% similarity, with two isolates having a
similarity of 72%. The RPO1 Primer showed a 95% similarity between two isolates from the
Akuse series.
Figure 4.6: Sample of a Gel electrophoretic pattern of amplified DNA of African yam bean
rhizobia using RPO1 Primer. Lane M: 100 bp molecular maker and Lane 1–19
are rhizobia isolates.
University of Ghana http://ugspace.ug.edu.gh

79
Figure 4.7: Dendrogram (UPGMA) of genetic relationships among 30 African yam bean
bradyrhizobia isolates identified by RPO1 Primer analysis. AK, AD, HTS and
TJ implies isolates from Akuse, Adenta, Haatso and Toje soil series’
respectively.
4.5.2.3 Diversity Indices based on RPO1 and RPO4 genomic DNA Profiles
In order to quantify the diversity among isolates from each soil based on the amplification
profiles generated by RPO1 and RPO4 primers, the Shannon–Weaver diversity index (H′) was
calculated, maintaining the basis of 80% similarity level (Table 4.11). The Shannon–Weaver
index calculates the uncertainty of predicting the type of another isolate from that population.
The results revealed a high genetic diversity of bradyrhizobia isolated from the different soils.
Simialrity Coefficient
0.54 0.65 0.75 0.85 0.95
AK1 AD1 AD4 AD6 HTS2 AK6 HTS4 AD7 AD2 TJ2 AK2 AK3 HTS1 AK8 AK9 AD3 HTS3 AD5 HTS7 AK4 AK5 AK7 HTS6 HTS5 HTS9 HTS8 TJ5 TJ1 TJ3 TJ4
1B
1A
2
1
University of Ghana http://ugspace.ug.edu.gh

80
The calculations showed higher diversity in Haatso series revealed by RPO1 (H′ = 2.03),
followed by Adenta series (H′ = 1.55), and Akuse series (H′ = 1.52) soils (Table 4.11). However,
RPO4 showed a higher diversity among rhizobia isolates in Akuse series (H′ = 1.67) than the
RPO1 primer (H′ = 1.52). The diversity among rhizobia isolates revealed by RPO1 in Haatso soil
like that of Adenta was higher than that revealed by the RPO4 primer, whiles that in Akuse soil
revealed by RPO4 primer was higher than that revealed by RPO1. Diversity among the isolates
in Toje soil revealed by both primers was the same (Table 4.11).
The evenness index (J) was almost the same in all soil populations studied for both primers
(Table 4.11). The richness index (S) of the different soil types was generally higher for RPO1 in
Adenta and Haatso soils than for RPO4 primer. However, there was a higher richness in Akuse
soil revealed by the RPO4 primer than RPO1 (Table 4.11), confirming the trends in diversity.
The mean indices determined across all soils for the African yam bean nodulating rhizobia gave
a Shannon–Weaver diversity index of 1.68 and 1.47, an evenness of 0.97 and 0.95 and a richness
of 5.24 and 4.24 for RPO1 and RPO4 primers’ respectively.
Table 4.11: Shannon–Weaver diversity, Pielou evenness and Margalef richness indexes of
RPO1 and RPO4 amplified DNA profiles of 30 Bradyrhizobium isolates of
African yam bean obtained from four Ghanaian soils.
Source of
isolates (soil)
Shannon–Weaver
Diversity
Pielou Evenness Margalef Richness
Adenta
Akuse
Haatso
Toje
Mean
RPO1
1.55
1.52
2.03
1.61
1.68
RPO4
1.27
1.67
1.31
1.61
1.47
RPO1
0.96
0.94
0.98
1.00
0.97
RPO4
0.92
0.93
0.94
1.00
0.95
RPO1
4.49
4.54
7.54
4.38
5.24
RPO4
3.49
5.54
3.54
4.38
4.24
University of Ghana http://ugspace.ug.edu.gh
81
4.5.2.4 RFLP analysis of the amplified 16S–23S rDNA Spacer (ITS).
Thirty (30) unclassified bradyrhizobia isolates from African yam bean were examined by
restriction fragment length polymorphism (RFLP) analysis of the ITS gene amplified by
polymerase chain reaction (PCR).
The electrophoretic analysis of the undigested PCR products of the ITS region showed, in most
cases, bands of variable lengths, from 350 bp and 650 bp. The ITS PCR products were restricted
with HindIII, HhaI and EcoRI. The combined HindIII and HhaI restriction patterns of the
amplified ITS region were used for cluster analysis by UPGMA. The EcoRI endonuclease was
unable to digest the ITS region. The restriction analysis revealed two groups (Figure 4.8), with a
mean similarity of 56%, which is consistent with those obtained by the analysis of individual
RFLP patterns (gel image not shown). The first cluster (1) with 60% similarity among members
of the group had only three isolates. The second cluster (2) was composed of 27 isolates with a
mean similarity of 58% among its members. This cluster further diverges at 65% similarity level
into two sub units (Figure 4.8). Generally, the formation of sub groups within this cluster was
influenced by the origin of the isolate.
1
University of Ghana http://ugspace.ug.edu.gh

82
Figure 4.8: UPGMA dendrogram based on the combined HhaI and HindIII ITS RFLPs of
30 bradyrhizobia isolates of African yam bean strains. AK, AD, HTS and TJ
implies isolates from Akuse, Adenta, Haatso and Toje soil series’ respectively.
4.5.2.5 RFLP analysis of the amplified 16S rDNA region.
Thirty (30) unclassified bradyrhizobia isolates from African yam bean were examined by
restriction fragment length polymorphism (RFLP) analysis of the 16S rDNA genes amplified by
polymerase chain reaction (PCR). Gel electrophoresis of the amplified 16S rDNA gene revealed
band length of nearly 1500 bp length of 16S rDNA of the isolates. Almost all the strains
produced a single band and the resulting PCR product was digested separately with HaeIII and
HhaI restriction endonucleases. Cluster analysis of the combined restriction patterns resolved the
isolates into two major clusters at a mean similarity level of 53%, (Figure 4.9). Cluster 1 was the
largest, including 25 test strains. Five test strains (4 strains from Toje and 1 from Adenta soils’),
Similarity Coefficient
0.56 0.65 0.75 0.85 0.95
AK1
AK2 TJ5 AK3
AK9 AD1 AK6
AK8 AD5 AD6
AK4 AD4
AK5 AK7 AD2
HTS3 HTS1 HTS7
HTS6 HTS8
AD7 HTS2 HTS9
HTS4 HTS5 TJ2
TJ1 TJ3 AD3
TJ4 2B
2A
1
2
University of Ghana http://ugspace.ug.edu.gh

83
formed cluster 2. The first major cluster (1) further diverged at 57% similarity level into two sub
clusters (A & B). Sub cluster (B) had only one isolate, whiles sub cluster (A) further diverged at
60% similarity level into two clusters (Figure 4.9). At 80% similarity level, 19 groups were
formed based on the combined cluster analysis, with two strains from Akuse soil having a 100%
similarity.
Figure 4.9: UPGMA dendrogram based on the combined HhaI and HaeIII 16S RFLPs and
of nodule isolates of African yam bean strains. AK, AD, HTS and TJ implies
isolates from Akuse, Adenta, Haatso and Toje soil series’ respectively.
Similarity Coefficient
0.53 0.64 0.76 0.88 1.00
AK1 AK2 AD7 HTS4 HTS6 HTS2 HTS9 AK3 AD1 AK5 AK7 AD4 TJ1 AD3 AK4 AK9 AK6 HTS5 AD5 HTS7 AD6 HTS3 HTS1 HTS8 AK8 AD2 TJ2 TJ5 TJ3 TJ4
1
1B
1A
2
University of Ghana http://ugspace.ug.edu.gh

84
CHAPTER FIVE
DISCUSSION
5.1 Soil Characterisation
The four soils (Adenta, Akuse, Haatso and Toje series’) recorded higher pH in water than in salts
solution, making the net change in pH negative. This suggests that the soils have a net negative
charge that may serve as potential sites for adsorption of positively charged compounds.
Secondly the negative change in pH value is indicative of the fact that the soils are deeply
weathered (Abekoe & Sahrawat, 2001).
The low carbon content of the soils is characteristic of soils in semi–arid ecosystems, where the
high rate of mineralization due to high temperatures reduces the accumulation of carbon
(Dowuona et al., 2012). Soil nitrogen levels were compared to general ratings defined by Landon
(1984) as very high (>10 g kg−1), high (5–10 g kg−1), medium (2−5 g kg−1), low (1−2 g kg−1) and
very low (<1 g kg−1). Based on this, the results showed generally low nitrogen contents of the
soils (Table 4.1). The low C/N ratio of the soils confirms the high rate of decomposition of
organic matter. The textural characterization of the soils indicates that they are predominantly
sandy clay loam, sandy clay, and sandy loam for Adenta and Toje soils, Akuse and Haatso soils
respectively.
The high sand content and low clay content coupled with the average daily temperature of 28oC
prevailing in the Haatso environment would promote fast decomposition and low retention of
added organic matter. Consequently organic matter and consequently organic carbon contents of
the soils is lower (Table 4.1). Jones et al. (2006) stated that clay fraction has been found to
accommodate more organic carbon, total N and P contents than silt and sand fractions. It is
University of Ghana http://ugspace.ug.edu.gh

85
therefore, not surprising that with its higher clay content, the Akuse series had comparatively
higher organic carbon and available P contents’.
Available P was generally low in all the soils. The low level of this nutrient element is
characteristic of soils in the savannah zones of Africa due to the low organic matter content
(Brammer, 1967).
The medium bulk density of the soil (ranges between 1.25–1.5 Mg m−3) reflects the sandy clay
loam characteristic of soils. The higher bulk density (1.5 Mg m−3) of the Akuse series could be
due to the presence of high activity clays like montmorillonite in the soil. The presence of this
mineral will make the soil harden on drying to increase the bulk density.
Cation exchange capacity (CEC) ranged from 5.8 cmolc kg−1 soil in Toje to 33.2 cmolc kg−1 soil
in Akuse series. This observed trend in CEC could be attributed to the higher clay and organic
matter contents associated with the Akuse soil.
The rhizobia capable of forming root nodules on African yam bean exist in Ghanaian soils, even
though in varying populations. Akuse soil, followed by Adenta and Haatso soils’ harboured the
200, 170 and 140 cells g–1 soil of African yam bean rhizobia respectively. Toje soil recorded the
lowest population of 93 cell g–1 soil of African yam bean nodulating rhizobia. The abundance of
naturally occurring rhizobia showed that the population density of indigenous bradyrhizobia
capable of nodulating African yam bean was greatly influenced by the soil types.
5.2 Nodulation of African yam bean (Sphenostylis stenocarpa) in four Ghanaian Soils.
The ability of African yam bean to nodulate profusely with Bradyrhizobium strains indigenous to
Ghanaian soils confirms observations made by Oagile (2005) that describes the African yam
bean to be a promiscuous legume and have the ability to adapt to varying soil environments
(Oagile et al., 2012). Nodulation trends observed in the various soils indicate the diversity in
University of Ghana http://ugspace.ug.edu.gh

86
African yam bean rhizobia populations in Ghanaian soils. Also, rhizobia from woody legumes
were found to promiscuously nodulate tropical pulse crops such as common bean (Phaseolus
vulgaris), groundnut (Arachis hypogeal), soybean (Glycine max) and African yam bean
(Sphenostylis stenocarpa) (Assefa & Kleiner, 1997). This suggests that the African yam bean
has the ability to match other indigenous legumes in terms of plant growth and nodulation,
indicating its potential as a component of local cropping systems (Assefa & Kleiner, 1997).
Based on an intercropping trial conducted to assess the effect of some food legumes used as
cover crops on the performance of cassava, yam and maize, Obiagwu (1995) reported that
African yam bean nodulates profusely and also contributed to soil productivity and yield of the
main crop without any inoculation. Oganale (2009) also described the crop as a profuse
nodulator, compatible with many Rhizobium strains. He remarked that the African yam bean
landraces that he studied obtained 79–97.6% of their nitrogen from the atmosphere through
fixation. Moyin–Jesu and Adekayode (2010) concluded that the use of African yam bean plant as
biological fertilizer source for yam (Dioscorea rotundata L) production could substitute for 250
kg ha−1 NPK fertilizer and 6 t ha–1 poultry manure.
Although Vincent (1980) reported the presence of rhizobia in virgin soils, the fact that all the
soils tested, hitherto, were not cultivated with African yam bean, and contained large enough
numbers or populations to enable them infect African yam bean is not unusual. This may imply
that either African yam bean rhizobia naturally occur as part of the indigenous soil rhizobia
population or that other native legumes grown previously on the soil belong in the same host
group as African yam bean and thus serve as inoculant sources of African yam bean rhizobia.
University of Ghana http://ugspace.ug.edu.gh

87
The results from the MPN counts and the screening experiments seem to suggest some
relationship between rhizobia numbers and nodulation. This is because the soils that recorded
high nodulation generally had higher rhizobial numbers and vice versa. Thies et al. (1991) used
the rhizobial population density of a given soil as an indirect means of predicting whether or not
a legume will respond to inoculation. It is therefore most likely that these soils may not need to
be inoculated, or inoculation responses may not be as high as those without inoculation. The
ability of African yam bean to nodulate in different soil types implies that it is highly adaptable
to varying soil conditions and thus is a good legume for soil improvement.
5.3 Nitrogen and Phosphorus Response Studies
5.3.1 Response of African Yam Bean to Nitrogen Fertilization
The response of African yam bean to nitrogen was assessed in two soils and the results indicated
that nitrogen fertilization had an inhibitory effect on nodulation of African yam bean, with
nodule numbers decreasing significantly from 37 nodules plant−1 in the unfertilised control to 10
nodules plant−1 at 200 kg N ha−1 in Adenta soil. A similar trend of N effect was observed in the
Akuse soil, with 20 nodules plant−1 in the unfertilised control and 8 nodules plant−1 at 200 kg N
ha−1 (Table 4.3). The dry weight of nodules also followed a similar trend. The results showed
that the higher the number of nodules, the higher the dry weight. This result is substantiated by
the assertion made by Oti and Agbim (2000a) that a simple relationship exists between nodule
number and nodule dry weight, and they are indices of N2 fixation.
The inhibitory effect of high inorganic nitrogen on nodulation and nitrogen fixation has been
reported by many researchers (Eaglesham et al., 1983; Becker et al., 1986; Waterer, 1992). It has
been suggested by Harper (1987) and Streeter (1988) that there are multiple effects of nitrate
inhibition; such as decrease in number of nodules, nodule dry mass and N2 fixation activity.
University of Ghana http://ugspace.ug.edu.gh

88
Furthermore factors such as acceleration of nodule senescence or disintegration as well as
carbohydrate deprivation in nodules (Streeter, 1988; Vessy & Waterer, 1992), feedback
inhibition by products of nitrate metabolism such as glutamine (Neo & Layzell, 1997),
asparagine (Bacanamwo & Harper, 1997), and decreased O2 diffusion into nodules which
restricts the respiration of bacteroids (Gordon et al., 2002) have also been documented. The
generally poor N2 fixed upon addition of mineral nitrogen suggests that African yam bean is very
sensitive to mineral nitrogen and thus low levels or no supply of available nitrogen may cause
the crop to fix more nitrogen for its use. However, the higher dry matter yield observed in N–
fertilised plants than the unfertilised control plants is indicative that N2 fixation was not
supplying the plants with all the nitrogen it needed for maximum growth, or that the strains that
nodulated were not highly effective in N2 fixation. These observations were supported by
conclusions made by Sanginga et al. (2000b) that the improved growth and yield observed in
soybean line 1456–2E, indicated that N2 fixation induced by indigenous bradyrhizobia
community supplied less than optimal amounts of nitrogen.
The inhibitory effect of available nitrogen on nodulation was more prominent in Akuse than in
Adenta. With soils low in mineral N, a moderate dose of starter–N has been demonstrated to
stimulate seedling growth and subsequently N2 fixation (Herridge et al., 1984). Becker et al
(1986) stated that nodulating legumes prefer easily absorbable forms of N to nodulation and
subsequent fixation of atmospheric N because of the “cost of energy” involved in the later. The
available N inhibitory effect was more severe in Akuse soil than in Adenta soil. This could also
be due to the slightly high pH (6.5) of Akuse soil. At pHs’ near neutral (near pH 7), the microbial
conversion of ammonium (NH4+) to nitrate (NO3
–) is rapid, and crops generally take up nitrate
University of Ghana http://ugspace.ug.edu.gh
89
(Rosen et al., 2004). This must have contributed to the low performance (in terms of nodulation)
of African yam bean on Akuse soil compared to Adenta soil.
Dry matter accumulation is one of the measures of plant growth (Noggle & Fritz, 1983), a
function of crop species and soil fertility (Oti & Agbim, 2000b) and reflects the relative growth
rate with regards to the net assimilation rate. The result in the present study (Figure 4.1) showed
that increasing the rate of mineral N resulted in a corresponding improvement in shoot biomass
accumulation of African yam bean in both Adenta and Akuse soils. The significant positive
relationship between dry matter and N accumulation (% N) is in agreement with work done by
Oikeh et al. (2008) who also observed a direct relationship between dry matter and N
accumulation in legumes. This confirms the assertion made by Becker et al. (1986) that root
nodulating legumes prefer the uptake of available or mineral nitrogen to atmospheric nitrogen
fixation, in order to conserve energy. The high N accumulation and its subsequent increase in
shoot dry weight recorded in response to higher rates of nitrogen, supports the conclusions made
by Mae (1997) that larger amounts of absorbed nitrogen increases leaf weight and N content in
leaves, which leads to enhancement of photosynthetic capacity and promotion of carbohydrate
accumulation in leaf. Sage and Pearcy (1987) also reported that photosynthetic capacity and total
amount of leaf N per unit leaf area are usually correlated. Dordas and Sioulas (2009) stated that
the shortage or excess of nitrogen can affect assimilate partitioning between the vegetative and
reproductive organs as well as dry matter partitioning. This may have been responsible for the
low dry matter yield recorded in the low N fertilised treatment.
The results of nitrogen influence on N uptake indicate that nitrogen uptake increased
significantly with increasing rate of application (Table 4.4). The relationship that exists between
N and dry matter yield, as well as N concentration and N uptake in African yam bean led to the
University of Ghana http://ugspace.ug.edu.gh

90
conclusion that the high N uptake recorded is due to high dry matter yield of the African yam
bean recorded at higher rates of nitrogen and not necessarily due to high nitrogen concentration
(%N) in the plant biomass or tissue. Plant biomass and tissue N (%N) were linearly correlated to
nodule mass while correlation to nodule number was low, suggesting nodule mass to be a better
indicator of symbiotic efficiency than nodule number.
5.3.2 Response of African Yam Bean to Phosphorus Fertilization
The influence of P on symbiotic nitrogen fixation in leguminous plants has received considerable
attention. Results from this study indicate that P application significantly improved nodulation in
both soils; with nodule numbers ranging from 34 nodules plant−1 in the control to 78 nodules
plant–1 at 120 kg P ha−1 in Adenta soil and 15 nodules plant–1 in the control to 94 nodules plant−1
at 120 kg P ha−1 in Akuse soil (Table 4.6). This increase in nodulation upon P addition, is
supported by conclusions that, in legumes, phosphorus deficiency particularly, affects symbiotic
nitrogen fixation by limiting the growth and survival of rhizobia (O’Hara et al., 1988), nodule
formation (Drevon & Hartwig, 1997), nodule functioning (Tang et al., 2001a), host plant growth
(Tsvetkova & Georgiev, 2003), root development and N2 fixation (Danso, 1992). However some
contradictory reports on P requirements for nodule formation and functioning have also been
recorded. For instance, phosphorus deficiency has been reported either increase, decrease or not
affect the nodule number per unit of shoot mass (Tang et al., 2001; Vadez et al., 1996), as well
as the specific nitrogenase activity and the amount of N2 fixed per nodule mass (Tang et al.,
2001b). Secondly, Sa and Israel (1991) also concluded that the importance of P for optimal
growth and symbiotic N2 fixation processes can be assessed by nodule development and
functioning. Robson and O’Hara (1981) concluded that P nutrition increased symbiotic N2
University of Ghana http://ugspace.ug.edu.gh

91
fixation in subterranean clover (Trifolium subterraneum L.) by stimulating host plant growth
rather than by exerting specific effects on rhizobial growth or on nodule formation and function.
Higher nodule mass with increasing P rates was observed (Table 4.6). Thus lower rates of P
resulted in fewer and lighter nodules compared to higher P rates. Miller et al. (1982) reported
that nodule weight was a contributing factor to nitrogen fixation activity while nodule number
was important in its relationship with nodule weight. Phosphorus deficiency might have caused a
negative effect on the processes of nitrogen fixation by decreasing nodule capacity to fix
atmospheric N2 as a result of lower nodule size. The possibility that ATP synthesis was limited
by deprivation in inorganic P (Sa & Israel, 1991) could also be considered.
Dry matter accumulation also increased significantly with increase in phosphorus rates. The
significant performance of African yam bean on both soils in terms of dry matter accumulation
may be due to the high level of available P which promoted early development of root, higher P
uptake and subsequently better growth of the crop. The results from this study showed a positive
relationship between shoot dry matter yields and P application in both soils (Figure 4.2). The
increase in plant dry matter accumulation could be due to the fact that P is an important element
that significantly affects plant growth and metabolism (Brady & Weil, 2004). Phosphorus is a
component of DNA and RNA, involved in cell division and is important for plant growth (Brady
& Weil, 2004). Thus the expansion (growth and development) of plants under P stress conditions
decreased by the number of cell divisions, which implies control of cell division by a common
regulatory factor (Chiera et al., 2002). Phosphorous also encourages vegetative growth and
formation of root system which efficiently absorbs nutrients from soil (Shukla et al., 2010).
The control in the Adenta soil performed better in P uptake than the counterpart in the Akuse soil
(Table 4.9). This may be due to the higher level of available P in the original Adenta soil which
University of Ghana http://ugspace.ug.edu.gh

92
may have enhanced early development of roots of the crop. This effect resulted in higher shoot
dry matter yield in the Adenta soil and it confirms the important role that P availability plays in
terms of P uptake and dry matter yield of crops (Marschner, 1993).
The significant increase of nitrogen fixation (Table 4.7) in African yam bean upon P addition
was also supported by increases in the number of nodules and nodule dry weight (Table 4.6).
These observations agree with conclusions made by Ibeawuchi et al. (2004), who reported that
nodule weight and nodule numbers are all indices of nitrogen fixation since they have either
direct or indirect relationship. The high nodule dry weight and number of nodules of African
yam bean and its ability to fix nitrogen in this study are an indication of the importance of
African yam bean in sustainable agriculture. Also, the positive response to P fertilizer observed
in this study may be due to the low native available P of the soils coupled with the specific role
of phosphorus in nodule initiation, growth and functioning.
Richardson et al. (2011) defined phosphorus utilization efficiency as the ability of a plant
species to produce higher dry matter per unit of P absorbed or taken up. The phosphorus
utilization efficiency of African yam bean was computed and the results showed that, P uptake
increased with an increase in P application, but the P utilization efficiency decreased (Table 4.9).
This implies that the utilisation of nutrients decreases with increasing rate of nutrient application,
as stated by Liebig’s law of minimum. This high PUE at lower rates of P, could reduce fertilizer
input cost and also decrease the rate of nutrient losses and enhance crop yields. Efficient
utilization of acquired P is also considered an important adaptation for plant growth on low P
soils. According to Raghothama (1999) the mechanism of higher internal P utilization efficiency
may be related to the ability of a plant in releasing inorganic P from the storage pool (vacuole) to
the cytoplasm. Also selective allocation of P between cytoplasm and vacuole, if in favour of
University of Ghana http://ugspace.ug.edu.gh

93
cytoplasm ensures sufficient Pi concentration in metabolically active compartments for normal
functioning of plant metabolism (Raghothama, 1999).
The higher P utilization efficiency recorded in low P treatments may be due to the fact that,
during P starvation, plants increase the efficiency of P use. Plaxton and Tran (2011) explained
this phenomenon as a regulation of a wide array of P–starvation inducible hydrolases that
scavenge and recycle P from intra and extracellular organic P compounds.
5.4 Diversity of Indigenous African Yam Bean Rhizobium Isolates
5.4.1 Cross Inoculation Studies (Host Range Analysis)
The cross inoculation group concept is based on the ability of rhizobia to specifically nodulate a
group of legume host species (Fred et al., 1932). It is based on this concept that species of
Rhizobium have been classified as either promiscuous or specific. The concept was therefore
applied in this study to determine the symbiotic specificity or otherwise of native African yam
bean bradyrhizobia obtained from the screening experiment. The results showed that isolates of
rhizobium obtained from the African yam bean were compatible with cowpea, yardlong bean,
and pueraria, but did not form nodules on lima bean, Bambara and crotalaria. This may mean
that African yam bean could be in the same cross inoculation group with Pueraria spp and
yardlong bean.
Lie et al. (1987) stated that population diversity among rhizobia compatible with a particular
legume is likely to be greatest in the center of origin of that host. However, varied rhizobial
populations can arise in symbiosis with species that are not indigenous to a particular region
(Sadowsky & Graham, 1998). Further experimental studies conducted in the frame of this
project, where African yam bean was cross inoculated with rhizobia isolates from different
University of Ghana http://ugspace.ug.edu.gh

94
legumes species, showed that although rhizobium isolated from the African yam bean were
unable to nodulate lima bean, bambara and crotalaria isolates from each of these three legumes
formed nodules on African yam bean. This observation is confirmed by similar results obtained
by Assefa and Kleiner (1997) who cross inoculated African yam bean with Bradyrhizobium sp.
AUEB20, isolated from Erythrina brucei (an Ethiopian tree legume). They reported that African
yam bean plants were nodulated profusely and the nodules were observed to be active in nitrogen
fixation. Oagile (2005) also found African yam bean landraces to form nitrogen fixing nodules
when inoculated with strains of Rhizobium spp, ORS 302 (broad host range), and
Bradyrhizobium spp, CP 279 (broad host range). The ability of African yam bean to nodulate
profusely with Rhizobium indigenous to Ghanaian soils confirms conclusions made by Oagile
(2005) that describes African yam bean to be a promiscuous legume, being able to form nodules
with three of the five strains tested and belonging to both Rhizobium spp. and Bradyrhizobium
spp. The large numbers of nodules formed in African yam bean landraces reported by Oagile
(2005) were also found to be comparable to numbers recorded on cowpea inoculated with
Bradyrhizobium strains indigenous to Ghanaian soils (Obiagwu, 1995).
Three out of the six host legumes tested were nodulated by 80% of the African yam bean
bradyrhizobia isolates tested. This agrees with assumption made by Halliday (1985) that most
tropical legumes are non–selective in the rhizobia they require for effective symbioses. However,
contrasting result was observed when rhizobia isolated from lima bean and bambara nodulated
with African yam bean. Similar results of one rather than dual–way nodulation has been
observed in studies on tree legume rhizobia (Boakye, 2014).
This result on host range studies reflects the promiscuity of the tested isolates and differences
between these findings may be due to the particular isolate(s) tested. It is well recognized that
University of Ghana http://ugspace.ug.edu.gh

95
strains within a rhizobial population show great variation in their specificity and symbiotic
effectiveness on many hosts. It is, therefore, not surprising to observe similar results in this study
whereby all the isolates exhibited some variations in interaction with other host plants
5.4.2 Molecular Analysis
The genetic diversity of 30 bradyrhizobia isolated from root nodules of African yam bean,
cultivated in four Ghanaian soils was studied by RAPD (Random amplified polymorphic DNA)
(RPO4 primer), DAPD (Direct amplified polymorphic DNA) (RPO1 primer) and restriction
fragment length polymorphism (RFLP) analysis of PCR–amplified ITS and 16S rDNA
techniques.
The amplification profiles generated by RPO4 differentiated between the African yam bean
bradyrhizobia isolate tested. The primer grouped the rhizobia isolates into different clusters
(Figure 4.5) at different levels of similarity. The results from the RAPD analysis showed that
PCR using short arbitrary oligonucleotide primers of random sequence is an effective means of
differentiating complex DNA genomes (Welsh & McClelland, 1990). Closely related taxa had
similar fragment distributions, while distantly related ones were more divergent. This confirms
conclusions made by Borowsky et al. (1995) that arbitrarily primed oligonucleotide (RPO4)
amplifications contain considerable phylogenetic information.
Direct amplification of polymorphic DNAs (DAPD) fingerprinting also proved to be highly
discriminatory and fast in strain identification (Figure 4.7). These results are supported by the
conclusions that DNA fingerprinting with RPO1 primer is a global technique, as the sequence of
the RPO1 primer is reiterated in rhizobial genomes, including plasmids and chromosomes
(Alexandre et al., 2006). Also the analysis of Mesorhizobium loti genome revealed more than 60
University of Ghana http://ugspace.ug.edu.gh

96
regions with homology to RPO1 primer sequence (Laranjo et al., 2002). This confirms the
discriminatory power of RPO1 primer. The dendrogram generated from the RPO1 amplification
profiles shows some similarity with the clustering revealed by RPO4 primer. However in
contrast to RPO4 primer, RPO1 primer clustered most (27) of the isolates instead of nine by
RPO4 into the first major cluster with only three rather than 21 isolates in the second major
cluster (Figure 4.6).
The use of the nif–directed RPO1 primer for amplifying the Rhizobium strains enable the direct
differentiation of the strains tested. This may be due to the fact that the amplification profiles
generated by the RPO1 primer were not affected by the presence of contaminating DNAs.
However, though not investigated, it is assumed that this may not be achieved or possible with
10–mer arbitrary primers such as RPO4 and RPO5, etc, which are expected to amplify a wide
range of target DNA (Welsh & McClelland, 1990).
The Shannon–Weaver diversity index calculated for the various soils using RPO1 and RPO4
primers showed Bradyrhizobium diversity among the four soils. The large diversity of rhizobia–
nodulating African yam bean in the different soils may indicate that African yam bean accepts
many different microsymbionts and indicates broad host range ability. This could be supported
by the assertion that, the use of techniques targeting more specific functional symbiotic genes
such as nod and nif genes could reveal more information on rhizobia diversity.
The restriction analysis of the ITS and 16S gene regions revealed additional heterogeneity in the
bradyrhizobia isolates. Variations in length of the ITS region recorded in this study have also
been observed in other bacteria. ITS band sizes of 303–305 bp have been reported for
Staphylococcus aureus (Gurtler & Barrie, 1995), 100–700 bp for Pseudomonas aeruginosa
University of Ghana http://ugspace.ug.edu.gh

97
strains (Hartman et al., 1986). The ITS band size ranges recorded within the African yam bean
bradyrhizobia population studied, demonstrates that the 16S–23S rDNA spacer region could be
of taxonomic importance. Furthermore, digestion of this region with HhaI and HindIII restriction
enzymes was also useful for fingerprinting the rhizobia isolates, all of which were obtained from
the same legume host (African yam bean), and with the potential for different nodules to harbour
the same or different strains. The general level of similarity revealed by the ITS PCR–RFLP
analysis are consistent with both that of RPO1 and RPO4 primers. The results of this experiment
further showed that there is a strong tendency of isolates from the same location or soil to be
grouped together. This suggests that restriction analysis of amplified DNA may serve as an
efficient tool for rhizobial population studies across different locations or soil.
The 16S rDNA gene PCR–RFLP pattern has been used to detect potential taxa of new isolates
(Laguerre et al., 1994). The 16S rDNA gene is one of the most conserved genes of a DNA,
implying that it has undergone very little change throughout time, or it varies very little from cell
to cell. Even organisms that are distantly related, or that evolved a long time ago, have 16S
rDNA sequences that are very similar. Scientists use this gene, as well as other ribosomal genes,
to measure taxonomy, phylogeny and the rate of divergence. It is also known that a longer stretch
of the 16S rDNA gene (e.g. 800 instead of 300 bp) contains a conserved region that is sufficient
to show the variation within groups of root rhizobia, hence its frequent use to infer the
phylogenetic affiliation of isolates (Odee et al., 2002; Bala et al., 2003). In this study, by using
16S rDNA gene PCR–RFLP, several subgroups were identified (Figure 4.6). The groups
produced by the RFLP analysis confirmed the groupings established by RAPD and DAPD
analyses.
University of Ghana http://ugspace.ug.edu.gh

98
The wide genetic diversity of the Bradyrhizobium isolates that were obtained from the same
legume specie (African yam bean) has further strengthened the views of workers such as Odee et
al. (2002) that the sub–Saharan region might be an important centre of rhizobial biodiversity.
University of Ghana http://ugspace.ug.edu.gh

99
CHAPTER SIX
SUMMARY, CONCLUSION AND RECOMMENDATIONS
6.1 SUMMARY AND CONCLUSION
The primary purpose of this study was to assess the nodulation, nitrogen fixation abilities and
growth of uninoculated African yam bean, how these parameters are influenced by the N and P
levels, and the diversity of the indigenous rhizobia that nodulate African yam bean in each of
four Ghanaian soils.
The results obtained indicate that rhizobia capable of forming root nodules on African yam bean
exist in Ghanaian soils, even though in varying populations. Akuse soil, followed by Adenta and
Haatso soil harboured the highest number of African yam bean rhizobia (200, 170 and 140 cells
g–1 soil, respectively). Toje soil recorded the lowest population of 93 cell g–1 soil of African yam
bean nodulating rhizobia.
Interestingly, screening for nodulation of African yam bean on these soils showed that African
yam bean plants grown on Haatso and Adenta soils formed the highest number of nodules (39
and 37 nodules per plant, respectively), even though the MPN count reported lower populations
than were present in the Akuse soil.
The application of nitrogen and phosphorus affected various parameters such as nodulation,
nodule mass, nitrogen fixation, nutrient uptake and shoot dry matter yield. Increasing the mineral
N fertility of the soils, resulted in lower nodulation, reduced nodule masses, with corresponding
lower nitrogen fixation, but in increased shoot dry matter yield in both Adenta and Akuse soils.
The shoot total nitrogen (N uptake) was also increased upon N addition.
University of Ghana http://ugspace.ug.edu.gh

100
In contrast to N application, P fertilization enhanced nodulation, nodule mass, nitrogen fixation,
increased N and P uptake, increased shoot dry matter yield and improved growth.
Cross inoculation studies revealed African yam bean to be compatible with rhizobia from lima
bean, bambara groundnut, and yardlong bean. Also African yam bean Bradyrhizobium was able
to nodulate cowpea, yardlong bean and pueraria spp.
Further genetic diversity studies of African yam bean bradyrhizobia isolates collected from four
Ghanaian soils suggests that random and direct amplification of the genomic DNA and PCR–
RFLP analysis of the ITS and 16S regions can be used whenever necessary in evaluating
collections of rhizobial isolates.
Moreover, random and direct fingerprinting proved to be fast and reproducible methods for
rhizobial isolate differentiation. Ranges of discriminating powers were also equivalent between
the two approaches. These markers have found a wide range of application in gene mapping,
population genetics, molecular evolutionary genetics and plant and animal breeding. This is
mainly due to the speed, cost and efficiency of the RAPD technique to generate large numbers of
markers in a short period compared with previous methods.
Cluster analysis of RAPD and DADP–generated genomic fingerprint yielded results that are in
close agreement with ARDRA analysis as well as by direct comparison of primary similarity
values. The observed correlation between RAPD, DAPD and ARDRA genomic fingerprint
analyses suggests that genomic fingerprint methods can function as core techniques in
polyphasic taxonomy, regardless of the statistical model employed.
However, since different numbers of bands may be generated with each primer set, the annealing
conditions used, and the prevalence distribution of the target repetitive elements in question may
University of Ghana http://ugspace.ug.edu.gh

101
vary. An example of a similar variation may occur in RFLP, ARDRA and AFLP, depending on
the restriction that is used.
6.2 RECOMMENDATIONS
Based on the results obtained from this study, the following recommendations are made:
1) The study should be conducted in various areas with different soil types to establish the
validity of these conclusion that African yam bean nodulating rhizobia are common in most
if not all Ghanaian soils.
2) African yam bean should be allowed to grow to maturity to observe the effect of nodulation
and nitrogen fixation on seed yield.
3) Further taxonomic study of indigenous African yam bean Rhizobium isolates in different
soils should be carried out by taking as many morphological, biochemical and genetic
characters as possible to have a more complete picture of their taxonomy and the
evolutionary relationship of the African yam bean rhizobia.
4) Finally, although the African yam bean appears to be a relatively permissive host, this
character does not guarantee effectiveness in nitrogen fixation and may lead to formation of
less effective symbioses with strains not highly evolved to fix nitrogen with African yam
bean. Because little has been done to measure potential benefits of rhizobial diversity,
nitrogen fixation, and African yam bean productivity, I believe that research in this area may
be useful in the future.
University of Ghana http://ugspace.ug.edu.gh

102
REFERENCES
Abekoe, M. K., & Sahrawat, K. L. (2001). Phosphate retention and extractability in soils of the
humid zone in West Africa. Geoderma, 102, 175–187.
Achinewhu, S. C., & Akah, G. N. (2003). Chemical, functional and sensory functions of
processed African yam bean (Sphenostylis stenocarpa) and cowpea (Vigna
unguiculata). Plant Foods Hum. Nutr., 58, 1–6.
Adansi, M. A. (1975). Master register of economic plants (excluding Cocoa) in Ghana. [Bulletin
No.4.]. Crops Research Institute, CSIS, Ghana. p. 97.
Adewale, B. D. (2010). Genetic Diversity, Stability and Reproductive Biology of African yam
bean; Sphenostylis stenocarpa (Hochst. ex A. Rich.) Harms. Unpublished PhD
Thesis, University of Agriculture, Abeokuta, Nigeria.
Adewale, B. D., & Dumet, D. (2011). Descriptors for African yam bean, Sphenostylis stenocarpa
(Hochst ex. A. Rich.) Harms. http://old.iita.org/cms/articlefiles/1488–ayb descriptors.
Adewale, B. D., & Odoh, N. C. (2012). A Review on Genetic Resources, Diversity and
Agronomy of African Yam Bean (Sphenostylis stenocarpa (Hochst. Ex A. Rich.)
Harms): A Potential Future Food Crop. Sustainable Agric. Res., 2, 32–43.
Adewale, B. D., Dumet, D. J., Vroh–Bi, I., Kehinde, O. B., Ojo, D. K., Adegbite, A. E., &
Franco, J. (2012). Morphological diversity analysis of African yam bean and
prospects for utilization in germplasm conservation and breeding. Genetic Resources
and Crop Evolution, 59, 927–936.
University of Ghana http://ugspace.ug.edu.gh

103
Adewale, B. D., Kehinde, O. B., Aremu, C. O., Popoola, J. O., & Dumet, D. J. (2010). Seed
metrics for genetic and shape determinations in African yam bean (Sphenostylis
stenocarpa Hochst. Ex. A. Rich) harms. African J. of Plant Sc., 4, 107–115.
Adiguzel, A. (2006). Molecular characterization of thermophilic bacteria isolated from water
samples taken from various thermal plants. Unpublished PhD Thesis, Ataturk
University, Graduate School at Natural and Applied Sciences, Erzurum, Turkey. (pp.
130–136).
Albrecht, S. L., Bennett, J. M., & Boote, K. J. (1994). Relationship of nitrogenase activity to
plant water stress in field grown soybeans. Field Crops Res., 8, 61–71.
Alexander, M. (1978). Introduction to soil microbiology. New York, NY, London: Willey.
Alexandre, A., Laranjo, M., & Oliveira, S. (2006). Natural Populations of Chickpea Rhizobia
Evaluated by Antibiotic Resistance Profiles and Molecular Methods. Microb. Ecol.,
51, 128–136.
Allen, O. N., & Allen, E. K. (1981). The Leguminous. A source Book of Characterization, Uses
and Nodulation (pp. 420–422). London: Macmillan Publishers Ltd.
Amarowicz, R., & Pegg, R. B. (2008). Legumes as a source of natural antioxidants. Eur. J. of
Lipid Sci. and Tech., 110, 865–878.
Amoatey, H. M., Klu, G. Y. P., Bansa, D., Kumaga, F. K., Aboagye, L. M., Benett, S. O., &
Gamedoagbao, D. K. (2000). African yam bean (Sphenostylis stenocarpa): A
neglected crop in Ghana. W A J. Appl. Ecol., 1, 53–60.
Anonymous (1999). Effect of phosphorus on nitrogen fixation. Better crops, 83, 30–31.
University of Ghana http://ugspace.ug.edu.gh

104
Assefa, F. (1993). Nodulation and nitrogen fixation by Rhizobia and Bradyrhizobia spp. of some
indigenous tree legumes of Ethiopia. University of Bayreuth, Germany.
Assefa, F., & Kleiner, D. (1997). Nodulation of African yam bean (Sphenostylis stenocarpa) by
Bradyrhizobium sp. isolated from Erythrina brucei. Biol. and Fert. of Soils, 25, 209–
210.
Bacanamwo, M., & Harper, J. E. (1997). The feedback mechanism of nitrate inhibition of
nitrogenase activity in soybean may involve asparagine and/or products of its
metabolism. Physiol. Of Plant, 100, 371–377.
Bala, A., Murphy, P., & Giller, K. E. (2003). Distribution and diversity of rhizobia nodulating
agroforestry legumes in soils from three continents in the tropics. Mol. Ecol., 12,
917–930.
Beck, D. P., Materon, L. A., & Afandi, F. (1993). Practical Rhizobium–Legume technology
manual. [Technical Manual No: 19], ( pp. 1–54). Aleppo, Syria: International Centre
for Agricultural Research in the Dry Areas (ICARDA).
Becker, M., Alazard, D., & Ottow, J. C. G. (1986). Mineral nitrogen effect on nodulation and
nitrogen fixation of the stem–nodulating legume Aeschynomene afraspera. Z.
Pflanzenernaehr. Bodenk., 149, 485–491.
Becking, J. H. (1992). Biological Nitrogen Fixation. In G. Stacey, R. H. Burris, & H. J. Evans
(Eds.), (pp. 497–559). New York, NY: Chapman & Hall.
Benson, D. R., & Silvester, W. B. (1993). Biology of Frankia strains, actinomycete symbionts of
actinorhizal plants. Microbiol. Rev., 57, 293–319.
University of Ghana http://ugspace.ug.edu.gh

105
Bergersen, F. J. (1980). Measurement of nitrogen fixation by direct means. In F. J. Bergersen
(Ed.), Methods for evaluating biological nitrogen fixation. (pp. 111–138).
Chichester, UK: John Wiley & Sons.
Beringer, J. E., & Kay, H. E. (1993). Monitoring the survival of Bradyrhizobium japonicum
released into Italian soils. In: BRIDGE/BIOTECH Final Sectorial Meeting on
Biosafety and First Sectorial Meeting on Microbial Ecology, Granada, October 24–
27, 1993. Brussels: CEC. p. 113.
Blake, G. R., & Hartge, K. H. (1965). Bulk density. In Klute, A., (Ed.). Methods of Soil Analysis,
Part 1–Physical and Mineralogical Methods, (2nd ed., pp. 363–382). Agronomy
Monograph 9, American Society of Agronomy–Soil Science Society of America,
Madison.
Boakye, E. Y. (2014). Studies on indigenous rhizobia that nodulate multi–purpose tropical tree
legumes in Ghana. PhD Thesis, University of Ghana, Legon–Accra. pp. 98–99.
Bond, G., & Mackintosh, A. (1975). Diurnal changes in nitrogen fixation in the root nodules of
Casuarina. Proc. Roy. Soc. London. [B], 192, l–12.
Bordeleau, L. M., & Prevost, D. (1994). Nodulation and nitrogen fixation in extreme
environments. Plant Soil, 161, 115–125.
Borlaug, N. (1991). Reaching sub–Saharan Africa’s small–scale farmers with improved
technology: the Sasakawa–Global 200 experience. In L. Garbus, A. Pritchard, & O.
Knudsen (Eds.), Agricultural issues in the 1990’s, proceedings of the 11th
Agriculture Sector Symposium. Washington DC, USA: World Bank.
University of Ghana http://ugspace.ug.edu.gh

106
Borowsky, R. L., McClelland, M., Cheng, R., & Welsh, J. (1995). Arbitrarily primed DNA
fingerprinting for phylogenetic reconstruction in vertebrates: the Xiphophorus model.
Mol. Biol. Evol., 12, 1022–1032.
Bowen, G. D., & Rovira, A. D. (1999). The rhizosphere and its management to improve plant
growth. Advances in Agronomy, 66, 1–102.
Boyer, S. L., Flechtner, V. R., & Johansen, J. R. (2001). Is the 16S–23S rRNA Internal
Transcribed Spacer Region a Good Tool for Use in Molecular Systematics and
Population Genetics? A Case Study in Cyanobacteria. Mol. Biol. Evol., 18, 1057–
1069.
Brady, D. J., Hetch–Buchholz, C. H., Asher, C. J., & Edwards, D. G. (1990). Effect of low
activities of aluminium on Soybean (Glycine max L.) early growth and nodulation. In
M. L. Van Blusichem (Ed.), Plant Nutrient Physiology and Application, (pp. 329–
334). Dordrecht: Kluwer.
Brady, N., & Weil, R. (2004). Elements of the Nature and Properties of Soils (2nd ed.). New
Jersey: Pearson/Prentice Hall Upper Saddle River.
Brammer, H. (1962). Soils. In: J. B. Wills (Ed.), Agriculture and Land Use in Ghana (pp. 88–
126), London: Oxford University Press.
Brammer, H. (1967). Soils of the Accra plains. Memoir No. 3, Soil Research Institute, Kumasi.
Bray, R. H., & Kurtz, L. T. (1945). Determination of total organic and available forms of
phosphorus in soil. Soil Sci., 59, 39–45.
University of Ghana http://ugspace.ug.edu.gh

107
Bremner, J. M. (1965). Total nitrogen. In C. A. Black (Ed.). Methods of soil analysis. Part 2.
Chemical and Microbiological properties (pp. 1149–1178). American Society of
Agronomy.
Brockwell, J., Bottomley, P. J., & Thies, J. E. (1995). Manipulation of rhizobia microflora for
improving legume productivity and soil fertility: A critical assessment. Plant and
Soil, 174, 143–180.
Broughton, W. J., & Dilworth, M. J. (1971). Control of leghaemoglobin synthesis in snake
beans. Biochem. J., 125, 1075–1080.
Burns, R. C., & Hardy, R. W. F. (1975). Nitrogen fixation in bacteria and higher plants. New
York, NY: Springer–Verlag.
Burris, R. H., & Haas, E. (1994). The red pigment of leguminous root nodules. J. Biol. Chem.,
155, 227–229.
Canfield, D. E., Glazer, A. N., & Falkowski, P. G. (2010). The evolution and future of Earth’s
nitrogen cycle. Science, 330, 192–196.
Catroux, G., & Amarger, N. (1992). Rhizobia as soil inoculants in agriculture. In M. J. Day, & J.
C. Fry (Eds.). Environmental Release of Genetically Engineered and other Micro–
organisms. (pp. 1–13). Cambridge: Cambridge University Press.
Cavender–Bares, J., & Bazzaz, F. A. (2000). Changes in drought response strategies with
ontogeny in Quercus rubra: Implications for scaling from seedlings to mature trees.
Oecologia, 124, 8–18.
University of Ghana http://ugspace.ug.edu.gh

108
Chaudri, A. M., McGrath, S. P., & Giller, K. E. (1992). Metal tolerance of isolates of Rhizobium
leguminosarum biovar trifolii from soil contaminated by past applications of sewage
sludge. Soil Biol. and Biochemistry, 24, 83–88.
Chaudri, A. M., McGrath, S. P., Giller, K. E., Rietz, E., & Sauerbeck, D. R. (1993). Enumeration
of indigenous Rhizobium leguminosarum biovar trifolii in soils previously treated
with metal contaminated sewage sludge. Soil Biol. and Biochemistry, 25, 301–309.
Chen, A., Figueredo, F. O. P., & Hungria, M. (2000). Genetic characterization of soybean
rhizobia in Paraguay. Appl. Environ. Microbiol. 66, 5099–5103.
Chen, W. M., Moulin, L., Bontemps, C., Vandamme, P., Bena, G., & Boivin–Masson, C. (2003).
Legume symbiotic nitrogen fixation by b–Proteobacteria is widespread in nature. J.
of Bacteriol., 185, 7266–7272.
Cheng, Q. (2008). Perspectives in Biological Nitrogen Fixation Research. J. of Integrative Plant
Biol., 50, 784–796.
Chiera, J., Thomas, J., & Rufty, T. (2002). Leaf initiation and development in soybean under
phosphorus stress. J. of Exp. Bot., 53, 473–481.
Cochard, H., Coll, L., Le Roux, X., & Ameglio, T. (2002). Unravelling the effects of plant
hydraulics on stomata closure during water stress in Walnut. Plant Physiol., 128,
282–290.
Csonke, L. N., & Hanson, A. D. (1991). Prokaryotic osmoregulation: genetics and physiology.
Annu. Rev. Plant Physiol., 45, 569–606.
University of Ghana http://ugspace.ug.edu.gh

109
Dakora, F. D., & Keya, S. O. (1997). Contribution of legume nitrogen fixation to sustainable
agriculture in Sub–Saharan Africa. Soil Biol. and Biochem., 29, 809–817.
Dakora, F. D., Atkins, C. A., & Pate, J. S. (1992). Effect of NO3 on N2 fixation and nitrogenous
solutes of xylem in two nodulated West African geocarpic legumes, Kerting's bean
(Macrotyloma geocarpum L.) and bambara groundnut (Vigna subterranea (L.). Plant
and Soil, 140, 255–262.
Danso, S. K. A. (1977). The ecology of Rhizobium and recent advances in the study of ecology
of Rhizobium. In A. Ayanaba, & P. J. Dart (Eds.). Biological nitrogen fixation in
farming systems of the Humid Tropics. (pp. 115–125). Chichester: John Wiley and
Sons.
Danso, S. K. A. (1985). Methods of estimating biological nitrogen fixation. In H. Ssali, & S. O.
Keya (Eds.), Biological nitrogen fixation in Africa. (pp. 224–244). Nairobi, Kenya:
Rhizobium MIRCEN.
Danso, S. K. A. (1992). Biological nitrogen fixation in tropical agrosystems: twenty years of
biological nitrogen fixation in Africa. In K. Mulongoy, M. Gueye, & D. S. C.
Spencer (Eds.), Biological Nitrogen Fixation and Sustainable Tropical Agriculture
(pp. 3–13). Chichester, UK: John Wiley and Sons.
Danso, S. K. A., & Herridge, D. F. (1987). Measurement of Nitrogen Fixation in Trees. Non–
Isotopic Methods. Vienna, Austria. p.18.
University of Ghana http://ugspace.ug.edu.gh

110
Danso, S. K. A., & Owiredu, J. D. (1988). Competitiveness of introduced and indigenous
cowpea Bradyrhizobium strains for nodule formation on cowpeas Vigna unguiculata
(L. Walp.) in three soils. Soil Biol. and Biochem., 20, 305–310.
Danso, S. K. A., Hardarson, G., & Zapata, F. (1986). Assessment of dinitrogen fixation
potentials of forage legumes with 15N techniques. In I. Haque, S. Jutzi, & P. J. H.
Neate (Eds.), Proceedings of a Workshop on Potentials of Forage Legumes in
Farming Systems of Sub–Saharan Africa. (pp. 26–57). Addis Ababa: ILCA.
Danso, S. K. A., Zapata. F., Hardarson, G., & Fried, M. (1987). Nitrogen fixation in faba beans
as affected by plant population density in sole or intercropped systems with barley.
Soil Biol. Biochem., 19, 411–415
Danso, S. K., Bowen, G. D., & Sanginga, N. (1992). Biological nitrogen fixation in trees in agro
ecosystems. Plant and Soil, 141: 177–196.
Dapaah–Siakwan, S., & Gyau–Boakye, P. (2000). Hydro–geologic framework and borehole
yields in Ghana. Hydrogeology J., 8, 405–416.
Day, J. M., Roughley, R. J. J., Eaglesham, R. T., Dye, M., & White, S. P. (1978). Effect of high
soil temperature on nodulation of cowpea. Ann. Appl. Boil., 88, 476–481.
Day, P. R. (1965). Particle fractionation and particle size analysis. In C. A, Black (Ed.), Methods
of Soil Analysis. (pp. 545–567). Madison: American Society of Agronomy.
Delgado, M. J., Ligero, F., & Liuch, C. (1994). Effects of salt stress on growth and nitrogen
fixation by pea, faba bean, common bean and soy bean plants. Soil Biol. and
Biochem., 26, 371–376.
University of Ghana http://ugspace.ug.edu.gh

111
Denarie, J., Debelle, F., & Prome, J–C. (1996). Rhizobium lipochito–oligosaccharide nodulation
factors: signalling molecules mediating recognition and morphogenesis. Annu Rev
Biochem., 65, 503–535.
Dillard, C. J., & German, J. B. (2000). Phytochemicals: Nutraceuticals and Human Health. J. Sci.
Food Agric., 80, 1744–1756.
Diriba, T. (2007). Nodulation Pattern and Biodiversity of Endosymbionts of Some Woody
Legumes of Ethiopia. (Unpublished PHD Thesis), Addis Ababa University. 15 p.
Dogbe, W., Fening, J. O., & Danso, S. K. A. (2000). Nodulation of legumes in inland Valley
Soils of Ghana. Symbiosis, 28, 77–92.
Dordas, C., & Sioulas, C. (2009). Dry matter and nitrogen accumulation, partitioning, and
retranslocation in safflower (Carthamus tinctorius L) as affected by nitrogen
fertilization. Field Crops Res., 110, 35–43.
Dowuona, G. N. N., Atwere, P., Dubbin, W., Nude, P. M., Mutala, B. E., Nartey, E. K., & Heck,
R. J. (2012). Characteristics of termite mounds and associated Acrisols in the coastal
savannah zone of Ghana and impact on hydraulic conductivity. Natur. Sci. 4, 423–
437.
Drevon, J. J., & Hartwig, U. A. (1997). Phosphorus deficiency increases the argon–induced
decline of nodule nitrogenase activity in soy bean and alfalfa. Planta, 201, 463–469.
Dudeja, S. S., & Khurana, A. L. (1989). Persistence of Bradyrhizobium sp. (Cajanus) in a sandy
loam. Soil Biol. and Biochem. 21, 709–713.
University of Ghana http://ugspace.ug.edu.gh
112
Duke, J. A., Okigbo, B. N., & Reed, C. F. (1977). African Yam Bean, Sphenostylis stenocarpa
(Hochst ex A. Rich). Trop. Grain Legume Bulletin, 10, 4–5.
Dukes, J. A. (1981). Handbook of Legumes of World Economic Importance. (pp. 220–222), New
York, USA: Plenum Press.
Eaglesham, A. R. J., & Ayanaba, A. (1984). Tropical stress ecology of Rhizobia, root nodulation
and legume fixation. In N. S. Subba Rao (Ed.), Current Development in Biological
Nitrogen Fixation (pp. 1–35). New Delhi: Oxford and IBH.
Eaglesham, A. R. J., Ayanaba, A., Rango Rao, V., & Eskew, D. L. (1981). Improving the
Nitrogen Nutrition of Maize by Intercropping with Cowpea. Soil. Biol., Biochem. 13,
169–171.
Eaglesham, A. R. J., Hassouna, S., & Seegers, R. (1983). Fertilizer–N effects on N2 fixation by
cowpea and soybeans. Agron. J., 75, 61–66.
Edem, D. O., Amugo, C. I., & Eka, O. U. (1990). Chemical composition of Yam beans
(Sphenostylis stenocarpa). Trop. Sci., 30, 59–63.
Elliott, K. J., & White, A. S. (1994). Effects of Light, Nitrogen and Phosphorus on Red Pine
Seedling Growth and Nutrient Use Efficiency. Forest Sci. 40, 47–58.
Eze, P. N. (2008). Characterization, classification and Pedogenesis of soils on a Legon catena in
the Accra plains, Ghana. MPhil Thesis. University of Ghana, Legon–Accra. 126 p.
Eze, P. N., Udeigwe, T. K., & Stietiya, M. H. (2010). Distribution and potential source
evaluation of heavy metals in prominent soils of Accra Plains, Ghana. Geoderma,
156, 357–362.
University of Ghana http://ugspace.ug.edu.gh

113
FAO/UNESCO/ISRIC. (1990). Revised Legend of the Soil Map of the World. World Soil
Resources Report No. 60. FAO, Rome.
Fattah, Q. A. (2005, December, 9–11). Plant Resources for Human Development. Keynote Paper
Presented at the Third International Botanical Conference organized by Bangladesh
Botanical Society (pp. 1–7). Dhaka–1000, Bangladesh: Department of Botany,
University of Dhaka.
Florentino, L. A., Sousa, P. M., Silva, J. S., & Silva, K. B. (2010). Diversity and efficiency of
Bradyrhizobium strains isolated from soil samples collected from around Sesbania
virgata roots using cowpea as trap species. Revista Brasileira de Ciência do Solo. 34,
1113–1123.
Franche, C., Lindstrom, K., & Elmerich, C. (2009). Nitrogen–fixing bacteria associated with
leguminous and non–leguminous plants. Plant and Soil, 321, 35–59.
Fred, E. B., Baldwin, I. L., & Mckoy, E. (1932). Root nodule bacteria and leguminous plants.
University of Wisconsin Press, Madison.
Fujihara, S. (2009). Biogenic amines in rhizobia and legume root nodules. Microbes and Envir.,
24, 1–13.
Genovese, M. I., & Lajolo, F. M. (2001). Trypsin inhibitory activity of bean (Phaseolus vulgaris
L.): Critical Evaluation of methods determination. Latin American Archives of
Nutrition, 51, 386–394.
Giller, K. E. (1987). Use and abuse of the acetylene reduction assay for measurement of
“associative nitrogen fixation”. Soil Biol. Biochem., 19, 783–784.
University of Ghana http://ugspace.ug.edu.gh

114
Giller, K. E. (2001). Nitrogen Fixation in Tropical Cropping Systems. (2nd ed., pp. 29–34).
Wallingford UK: CAB International.
Giller, K. E., & Wilson, K. J. (1991). Nitrogen Fixation in Tropical Cropping Systems. (pp. 68–
69), Wallingford, UK: CAB International.
Giller, K. E., Beare, M. H., Lavelle, A–M., Isaac, N., & Swift, M. J. (1997). Agricultural
intensification, soil biodiversity and ecosystem function. Appl. Soil Ecol., 6, 3–16.
Giller, K. E., Nussbaum, R., Chaudri, A. M., & McGrath, S. P. (1993). Rhizobium meliloti is less
sensitive to heavy metal contamination in soil than R. leguminosarum bv. trifolii or
R. loti. Soil Biology and Biochemistry, 25, 273–278.
Giller, K. E., Wani, S. P., & Day, J. M. (1986). Use of Isotope dilution to measure nitrogen
fixation associated with the roots of Sorghum and millet genotypes. Plant and Soil, 9,
255–263.
Giongo, A., Ambrosini, A., Vargas, L. K., Freire, J. R. J., Bodanese–Zanettini, M. H., &
Passaglia, L. M. P. (2008). Evaluation of genetic diversity of bradyrhizobia strains
nodulating soybean (Glycine max (L.) Merrill) isolated from South Brazilian fields.
Appl. Soil Ecol., 38, 261–269.
Gordon, A. J., Skot, L., James, C. L., & Minchin, F. R. (2002). Short–term metabolic response of
soybean root nodules to nitrate. J. Exp. Bot., 53, 423–428.
Graham, J. (2008). Nodulation competition among Bradyrhizobium japonicum strains as
influenced by rhizosphere bacteria and iron availability. Biology and Fertility of
Soils, 7, 108–112.
University of Ghana http://ugspace.ug.edu.gh

115
Graham, P. H. (2008) Ecology of the root nodule bacteria of legumes. In M. J. Dilworth, E. K.
James, J. I. Sprent, & W. E. Newton (Eds.), Nitrogen Fixing Leguminous Symbioses
(pp. 23–58). The Netherlands: Springer.
Graham, P. H., & Vance, C. P. (2003). Legumes: importance and constraints to greater use. Plant
Physiol., 131, 872–877.
Graham, P., Sadowsky, M. J., Keyser, H. H., Barnet, Y. M., Bradley, R. S., Cooper, J. E., De
Ley D. J., Jarvis, B. D. W., Roslycky, E. B., Strijdom, B. W., & Young, J. P. W.
(1991). Proposed minimal standards for the description of new genera and species of
root and stem nodulating bacteria. Int. J. Syst. Bacteriol., 41, 582–587.
Gurtler, V., & Barrie, H. D. (1995). Typing of Staphylococcus aureus strains by PCR–
amplification of variable–length 16S–23S rDNA spacer regions: characterization of
spacer sequences. Microbiol., 141, 1255–1265.
Habte, M., & Alexander, M. (1977). Further evidence for the regulation of bacterial populations
in soil by protozoa. Archives of Microbiology, 113, 181–183.
Halliday, J. (1985). Biological Nitrogen Fixation in Tropical Agriculture. Current Plant Science
and Biotechnology in Agriculture, 1: 675–681.
Handley, B. A., Hedges, A. J., & Beringer, J. E. (1998). Importance of host plants for detecting
the population diversity of Rhizobium leguminosarum biovar viciae in soil. Soil Biol.
Biochem., 30, 241–249.
University of Ghana http://ugspace.ug.edu.gh

116
Hardarson, G., & Danso, S. K. A. (1990). Use of 15N methodology to assess biological nitrogen
fixation. In: Use of Nuclear Techniques in Studies of Soil–Plant relationship. (pp.
129–160), Vienna, Austria: IAEA.
Hardarson, G., & Danso, S. K. A. (1993). Methods for measuring biological nitrogen fixation in
grain legumes. Plant Soil, 152, 19–24.
Harms, H. (1899). Leguminosae Africanae II. Bot. Jahrb., 26, 308–310.
Harper, J. E. (1987). Nitrogen metabolism. Soybeans: Improvement, production and Uses. (2nd
ed., pp. 497–533). Agronomy Monograph no.16. ASA–CSSA–SSSA.
Harris, S. A. (1999). RAPDs in systematics–a useful methodology? In P. M. Hollingsworth, R.
M. Bateman, & Gornall, R. J. (Eds.). Molecular Systematics, Plant and Evolution
(pp. 221–228). London: Taylor and Francis.
Harrison, J. (2003). The Nitrogen Cycle. Vision learning Vol. EAS–2 (4). Retrieved on Dec.,
2013 from: http://www.visionlearning.com/en/library/Earth-Science/6/The–
Nitrogen–Cycle/98.
Hartman, R. K., Toschka, H. Y., Ulbrich, N., & Erdman, V. A. (1986). Genomic organisation of
rDNA in Pseudomonas aeruginosa. FEBS Lett., 195, 187–19.
Heijnen, C. E. & van Veen, J. A. (1991). A determination of protective microhabitats for bacteria
introduced into soil. FEMS Microb. Ecol, 85, 73–80.
Herridge, D. F., Roughley, R. J., & Brockwell, J. (1984). Effects of rhizobia and soil nitrate on
the establishment and functioning of the soybean symbiosis in the field. Aust. J. of
Agricul. Res., 35, 149–161.
University of Ghana http://ugspace.ug.edu.gh

117
Hill, S., Kennedy, C., Kavanagh, E., Goldberg, R. B., & Hanau, R. (1981). Nitrogen fixation
gene (nifL) involved in oxygen regulation of nitrogenase synthesis in Klebsiella
pneumonia. Nature, 290, 424–426.
Hirsch, P. R. (1979). Plasmid–determined bacteriocin production by Rhizobium leguminosarum.
J. of Gen. Microb., 113, 219–228.
Hirsch, P. R. (1996). Population dynamics of reveals a close phylogenetic relationship among
indigenous and genetically modified rhizobia in the Phaseolus vulgaris symbionts.
Microbiology, field. New Phytologist, 133, 159–171.
Hirsch, P. R., Jones, M. J., Mcgrath, S. P., & Giller, K. E. (1993). Heavy metals from past
applications of sewage sludge decrease the genetic diversity of Rhizobium
leguminosarum biovar trifolii populations. Soil Biology & Biochemistry, 25, 1485–
1490.
Howard, J. B., & Rees, D. C. (1996). Structural basis of biological nitrogen fixation. Chemical
Reviews, 96, 2965–2982.
Howieson, J. G., O’Hara, G. W., & Carr, S. J. (2000). Changing roles for legumes in
Mediterranean agriculture: developments from an Australian perspective. Field
Crops Research, 65, 107–122.
IAEA (International Atomic Energy Agency) (2001). Use of isotope and radiation methods in
soil and water management and crop nutrition. FAO/IAEA: Vienna.
University of Ghana http://ugspace.ug.edu.gh

118
Ibeawuchi, I. I., Obiefina, J. C., Ofoh, M. C., Ihejirika, G. O., Tom, C. T., Owneremadu, E. U., &
Opara, C. C. (2004). An Evaluation of four soybean varieties intercropped with Okra
in Owerri Ultisol of Southeastern Nigeria. Pakist. J. Biol. Sci., 8(2), 215–219.
Javis, B. D. W., Downer, H. L., & Young, J. P. W. (1992). Phylogeny of fast–growing soybean–
nodulating rhizobia supports synonymy of Sinorhizobium and Rhizobium and
assignment to Rhizobium fredii. Int. J. Syst. Bacteriol., 42, 93–96.
Johnston, A. W. B., & Beringer, J. E. (1975). Identification of the rhizobium strains in pea root
nodules using genetic markers. J. Gen Microbiol., 87, 343–350.
Jones, J. W., Koo, J., Naab, J. B., Bostick, W. M., Traore, S., & Graham, T. (2006). Integrating
stochastic models and in situ sampling for monitoring soil carbon sequestration.
Agric. Systems, 94: 52–62.
Kay, D. E. (1987). Crop and Product Digest No. 2–Root Crops. Tropical Development and
Research Institute, London, (revised by Gooding, E. G. B.).
Keya, S. O., & Alexander, M. (1975). Regulation of parasitism by host density: the
Bdellovibrio–Rhizobium interrelationship. Soil Biol. and Biochem., 7, 231–237.
Klu, G. Y. P., Amoatey, H. M., Bansa, D., & Kumaga, F. K. (2001). Cultivation and Uses of
African yam bean (Sphenostylis stenocarpa) in the Volta Region of Ghana. J. Food
Techn. in Africa, 6, 74–77.
Kuykendall, L. D., Devine, T. E., & Cregan, P. B. (1982). Positive role of nodulation on the
establishment of Rhizobium in subsequent crops of soybean. Canadian J. of
Microbiology, 7, 79–81.
University of Ghana http://ugspace.ug.edu.gh

119
Laguerre, G., Allard, M. R., Revoy, F., & Amarger, N. (1994). Rapid identification of rhizobia
by restriction fragment length polymorphism analysis of PCR–amplified 16S rRNA
genes. Appl. Environ. Microbiol., 60, 56–63.
Laguerre, G., Mavingui, P., Allard, M. R., Charnay, M. P., Louvrier, P., Mazurier, S. I.,
Rigottier–Gois, L., & Amarger, N. (1996). Typing of rhizobia by PCR DNA
fingerprinting and PCR restriction fragment length polymorphism analysis of
chromosomal and symbiotic gene regions: application to Rhizobium leguminosarum
and its different biovars. Appl. Env. Microb., 62, 2029–2036.
Landon, J. R. (1984). Booker tropical soils manual. Booker Agriculture International Ltd.,
Longman.
Laranjo, M., Branco, C., Soares, R., Alho, L., Carvalho, M., & Oliveira, S. (2002). Comparison
of chickpea rhizobia isolates from diverse Portuguese natural populations based on
symbiotic effectiveness and DNA fingerprint. J. Appl. Microbiol., 92, 1043–1050.
Leigh, G. J. (2002). Nitrogen fixation at the millennium. London: Elsevier Science.
Lewis, G., Schrire, B., Mackinder, B., & Lock, M. (2005). Legumes of the world. Royal
Botanical Gardens. UK: Kew Publishing.
Lie, T. A. (1981). Environmental physiology of Legume–Rhizobium symbiosis. In W. J.
Broughton (Ed.), Nitrogen fixation (vol. 1, pp. 104–134). Oxford, UK: Clarendon
Press.
Lie, T. A., Ktan, D. G., Engin, M., Pijnenborg, J., & Anlarsal, E. (1987). Coevolution of the
Legume–Rhizobium association. Plant, 100, 171–181.
University of Ghana http://ugspace.ug.edu.gh

120
Lock, J. M. (1989). Legumes of Africa: A check list. Kew, England: Royal Botanic Gardens.
Long, S. R. (1996). Rhizobium symbiosis: Nod factors in perspective. Plant Cell, 8, 1885–1898.
Louws, F. J., Fulbright, D. W., Stephens, C. T., & de Bruijn, F. J. (1994). Specific genomic
fingerprints of phytopathogenic Xanthomonas and Pseudomonas pathovars and
strains generated with repetitive sequences and PCR. Appl. Environ. Microbiol., 60,
2286–2295.
Lowendorf, H. S. (1980). Survival of Rhizobium in soil. Adv. in Microbiol. Ecol., 4, 87–124.
Machuka, J. S., Okeola, O. G., Chrispeels, M. J., & Jackai, L. E. N. (2000). African yam bean
seed lectins affect the development of the cowpea weevil but do not affect the
development of larvae of legume pod borer. Phytochemistry, 53, 667–674.
Mae, T. (1997). Physiological nitrogen efficiency in rice: Nitrogen utilization, photosynthesis,
and yield potential. Plant and Soil, 196, 201–210.
Mafongoya, P. I., Kuntashula, E., Kwesiga, F., Chirwa, T., Chintu, R., Sileshi, G., & Matibini, J.
(2002). Leguminous agroforestry options for replenishing soil fertility in Southern
Africa. In S. R. Waddington (Ed.), Grain Legumes and Green Manures for Soil
Fertility in Southern Africa: Taking Stock of Progress (pp. 141–154). Harare,
Zimbabwe: Soil–Fert–Net/CIMMYT.
Mafongoya, P. L., Bationo, A., Kihara, J., & Waswa, B. S. (2006). Appropriate technologies to
replenish soil fertility in Southern Africa. Nutr. Cycl. Agroecosystem, 76, 137–151.
University of Ghana http://ugspace.ug.edu.gh

121
Mapfumo, P., Giller, K. E., Mpepereki, S., & Mafongoya, P. L. (1999). Dinitrogen fixation by
pigeon pea of different maturity types on granitic sandy soils in Zimbabwe.
Symbiosis, 27, 305–318.
Mapfumo, P., Mtambanengwe, F., Giller, K. E., & Mpepereki, S. (2005). Tapping indigenous
herbaceous legumes for soil fertility management by resource–poor farmer in
Zimbabwe. Agric. Ecosystem and Envron., 109, 221–233.
Margalef, R. (1958). Information theory in ecology. Gen. Syst. 3:36-7 1. Transl. from Mem. R.
Acad. Cienc. Artes. Barc. 32, 373-449, 1957.
Mariotti, A. (1983). Atmospheric nitrogen is a reliable standard for natural N abundance
measurements. Nature, 31, 685–687.
Marschner, H. (1993). Mineral nutrition in plants. (2nd ed., pp 13, 114, 276). San Diego, CA:
Academic.
Martin, B., Humbert, O., Camara, M., Guenzi, E., Walker, J., Mitchell, T., Andrew, P.,
Prudhomme, M., Alloing, G., Hackenbeck, R., Morrison, D. A., Boulnois, G. J., &
Claverys, J–P. (1992). A highly conserved repeated DNA element located in the
chromosome of Streptococcus pneumoniae. Nucleic Acids Research, 20, 3479–3483.
Miller, J. C., Scott, J. S., Zary, K. W., & Hair, S. K. O. (1982). The influence of available nitrate
levels on N–fixation in 3 cultivars of cowpea. Agron. J., 74,14–19
Montoya, J. P., Voss, M., Kaehler, P., & Capone, D. G. (1996). A simple, high precision, high
sensitivity tracer assay for dinitrogen fixation. Appl. Environ. Microbiol., 62, 986–
993.
University of Ghana http://ugspace.ug.edu.gh

122
Morel, M. A., Branna, V., & Castro–Sowinski, S. (2012). Legume Crops, Importance and Use of
Bacterial Inoculation to Increase Production. In A. Goyal (Ed. Intech), Crop Plant,
(pp. 217–240).
Moyin–Jesu, E. I., & Adekayode, F. O. (2010). Use of Long Yam Bean (Sphenostylis
stenocarpa) as Soil Amendment for the Growth, Leaf Chemical Composition and
Yield of White Yam (Dioscorea rotundata L). J. Amer. Sci., 6, 10–17.
Mpepereki, S., Makonese, F., & Wollum, A. G. (1997). Physiological characterization of
indigenous rhizobial nodulation Vigna unguiculata in Zimbabwean soils. Symbiosis
22, 275–292.
Munns, D. N., & Franco, A. A. (1981). Soil constraints to legume production. In: Biological
nitrogen fixation technology for tropical agriculture (pp. 133–12). Colombia: CIAT,
Cali.
Nambiar, P. T. C., Rao, M. R., Reddy, M. S., Floyd, C., Dart, P. J., & Willey, R. W. (1982).
Nitrogen fixation by groundnut (Arachis Hypogea) in intercropped and rotational
systems. In P. H. Graham & S. C. Harris (Eds.), Biological nitrogen fixation
technology for tropical agriculture (pp. 64–652). Cali, Colombia: Centro
Internacional de Agricultura Tropical (CIAT).
Neo, H. H., & Layzell, D. B. (1997). Phloem glutamine and the regulation of O2 diffusion in
legume nodules. Plant Physiol., 113, 259–267.
Noggle, G. R., & Fritz, G. J. (1983). Introductory Plant Physiology. Prentice–Hall.
University of Ghana http://ugspace.ug.edu.gh

123
Nour, S. M., Fernandez, M. P., Normand, P., & Cleyet–Marel, J. C. (1994). Rhizobium ciceri sp.
nov. Consisting of strains that nodulate chickpeas (Cicer arietinum L.). Int. J. Syst.
Bacteriol., 44, 511–522.
O’Hara, G. W., Boonkered, N., & Dilworth, M. J. (1988). Mineral constraints to nitrogen
fixation, Plant and Soil, 108, 93–110.
Oagile, O. (2005). African yam bean; morphology, clonal propagation and nitrogen fixation.
(Unpublished PHD Thesis), University of Nottingham, UK. (pp. 139–151).
Oagile, O., Mmolotsi, R., Segwagwe, A., & Babili, T. P. (2012). African Yam Bean
(Sphenostylis stenocarpa) nodulates Promiscuously with Rhizobium Indigenous to
Soils of Botswana. J. Plant Studies, 1, 109–113.
Obiagwu, C. J. (1995). Estimated yield and nutrient contributions of legume cover crops
intercropped with yam, cassava, and maize in the Benue River Basins of Nigeria. J.
Plant Nutri. 18: 2775–2782.
Odee, D. W., Haukka, K., McInroy, S. G., Sprent, J. I., Sutherland, J. M., & Young, J. P. W.
(2002). Genetic and symbiotic characterization of rhizobia isolated from tree and
herbaceous legumes grown in soils from ecologically diverse sites in Kenya. Soil
Biol. Biochem., 34, 804–811.
Odee, D. W., Sutherland, J. M., Makatiani, E. T., McInroy, S. G., & Sprent, J. I. (1997).
Phenotypic characteristics and composition of rhizobia associated with woody
legumes growing in diverse Kenyan conditions. Plant and Soil, 188, 65–75.
University of Ghana http://ugspace.ug.edu.gh

124
Oganale, D. (2009). Nodulation and nitrogen fixation of African yam beam (Sphenostylis
stenocarpa). Proceedings of African Crop Science Society Conference, Cape Town,
2009. Science and Technology supporting food security in Africa. September 28–
October 1, 2009.
Ogutcu, H, Algur, O. F., Elkoca, E., & Kantar, F. (2008). The determination of symbiotic
effectiveness of Rhizobium strains isolated from wild chickpea collected from high
altitudes in Erzurum. Turk. J. Agric. Forest. Sci., 32, 241–248.
Oikeh, S. O., Nwilene, F., Diatta, S., Osiname, O., Touré, A., & Okeleye, K. A. (2008).
Responses of upland NERICA rice to nitrogen and phosphorus in forest agro–
ecosystems. Agron. J., 100, 5–741.
Omitogun, O. G., Jackai, L. E. N., & Thottappilly, G. (1999). Isolation of insecticidal lectin–
enrich extracts from African yam bean (Sphenostylis stenocarpa) and other legume
species. Entomologia Experimentalis et Applicata, 90, 301–311.
Onyeike, E. N., & Omubo–Dede, T. T. (2002). Effect of heat treatment on the proximate
composition, energy values and levels of some toxicants in African yam bean
(Sphenostylis stenocarpa) seed varieties. Plant Foods Hum. Nutr., 57, 223–231.
Oshodi, A. A., Ipinmoroti, K. O., Adeyeye, E. I., & Hall, G. M. (1995). In vitro Multi–enzyme
digestibility of protein of six varieties of African yam bean flours. J. Sci., Food and
Agriculture, 69, 373–377.
Oti, N. N., & Agbim, N. N. (2000a). Comparative studies of Nitrogen fixing potentials of some
wild and cultivated legumes 1. Green house trial. J. Agric. and Rural Dev., 1, 27–44.
University of Ghana http://ugspace.ug.edu.gh
125
Oti, N. N., & Agbim, N. N. (2000b).Comparative studies of Nitrogen fixing potentials of some
wild and cultivated legumes 2. Field Evaluation. J. Agric and Rural Dev., 1, 79–89.
Pandey, P., Sahgel, M., Maheshwari, D. K., & Johri, B. N. (2004). Genetic diversity of rhizobia
isolated from medicinal legumes growing in the sub–Himalayan region of
Uttaranchal. Curr. Sci., 86, 202–207.
Peech, M. E. (1965). Hydrogen ion activity. In C. A. Black, D. D. Evans, J. L. White, L. E.
Ensminger, & F. E. Clark (Eds.). Methods of Soil Analysis: Chemical and
Microbiological Properties (vol. 2, pp. 914–926). Madison: American Society of
Agronomy.
Peoples, M. B., & Herridge, D. F., (1990). Nitrogen fixation by legumes in tropical and
subtropical agriculture, Advan. in Agron., 44, 155–173.
Peoples, M. B., Faizah A. W., Rerkasem, B., & Herridge, D. F. (Eds.). (1989). Methods for
evaluating biological nitrogen fixation by nodulated legumes in the field (pp. 7–8).
Australian Centre for International Agricultural Research (ACIAR), Monograph No.
11: Canberra.
Pepper, I. L., & Upchurch, R. P. (1991). Nitrogen fixation by desert legumes associated with
rhizobia, In J. Skujins (Ed.). Semiarid lands and deserts: Soil resource and
reclamation. New York, NY: Marcel Dekker Inc.
Pielou, E. (1966). The measurement of diversity in different types of biological collections. J.
Theor. Biol., 13, 131–144.
University of Ghana http://ugspace.ug.edu.gh

126
Plaxton, W. C., & Tran, H. T. (2011). Metabolic adaptations of phosphate-starved plants. Plant
Physiology, 156, 1006–1015.
Popelka, C., Terryn, N., & Higgins, T. (2004). Gene technology for grain legumes: can it
contribute to the food challenge in developing countries? Plant Science, 167, 195–
206,
Postman, J., Walter, S., & van Veen, J. A. (1989). Influence of different initial moisture contents
on the distribution and population dynamics of introduced Rhizobium leguminosarum
biovar trifolii. Soil Biol. and Biochem., 21, 437–442.
Potter, D. (1992). Economic botany of Sphenostylis (Leguminosae). Economic Botany, 46, 262–
275.
Potter, D., & Doyle, J. J. (1992). Origin of African yam bean (Sphenostylis stenocarpa,
Leguminosae): evidence from morphology, isozymes, chloroplast DNA and
Linguistics. Economic Botany, 46, 276–292.
Potter, D., & Doyle, J. J. (1994). Phylogeny and systematics of Sphenostylis and Nesphostylis
(Leguminosae: Phaseoleae) based on morphological and chloroplast DNA data.
Systematic Botany, 19, 389–406.
Prevost, D., & Antoun, H. (2006). Root nodule bacteria and symbiotic nitrogen fixation. In M. R.
Carter, & E. G. Gregorich (Eds.), Soil Sampling and Methods of Analysis (p. 379)
Taylor & Francis Group, LLC.
Raghothama, K. G. (1999). Phosphate acquisition. Annu Rev Plant Physiol., 50, 665–693.
University of Ghana http://ugspace.ug.edu.gh

127
Raven, J. A., Wollenweber, B., & Handley, L. (1992). A comparison of ammonium and nitrate
as nitrogen sources for photolithotrophs. New Phytologist, 121, 19–32.
Reddell, P., Bowen, G. D., & Robson, A. D. (1985). The effects of soil temperature on plant
growth, nodulation and nitrogen fixation in Casuarina cunninghamiana Miq. New
Phytologist, 101, 441–450.
Rending, V. V., & Taylor, H. M. (1989). Principles of Soil–Plant Interrelationships, McGraw–
Hill Inc., USA.
Rengel, Z. (2002). Breeding for better symbiosis. Plant soil, 145, 147–162.
Rennie, R. J., & Rennie, D. A. (1983). Techniques for quantifying N2 fixation in association with
non–legumes under field and greenhouse conditions. Can. J. Microbiol., 29, 1022–
1035.
Rennie, R. J., & Larson, I. R. (1979). Dinitrogen fixation associated with disomic chromosome
substitution lines of spring wheat. Can. J. of Botany, 57, 2771–2775.
Richardson A. E., Lynch J. P., Ryan P. R., Delhaize E., Smith F. A., Smith S. E., et al. (2011).
Plant and microbial strategies to improve the phosphorus efficiency of agriculture.
Plant and Soil, 349, 121–156.
Richardson, A. E., Viccars, L. A., Watson, J. M., & Gibson, A. H. (1995). Differentiation of
Rhizobium strains using the polymerase chain reaction with random and directed
primers. Soil Biol. and Biochem., 27, 515–524.
Rivas, R., Garcia–Fraile, P., & Velazquez, E. (2009). Taxonomy of Bacteria Nodulating
Legumes. Microbiol. Insights, 2, 51–69.
University of Ghana http://ugspace.ug.edu.gh
128
Robson, A. D., & O’Hara, G. W. (1981). Involvement of phosphorus in nitrogen fixation by
subterranean clover (Trifolium subterraneum L.). Aust. J. Plant Physiol., 8, 427–436.
Rohlf, F. J. (1998). NTSYSpc. Numerical taxonomy and multivariate analysis system (Version
2.0) user guide. Applied Biostatistics, Inc., Setauket, New York. p. 37.
Rosen, C. J., Bierman, P. M., & Eliason, R. D. (2004). Soil pH Modification. Soil Test
Interpretations and Fertilizer Management for Lawns, Turf, Gardens, and Landscape
Plants.http://www.extension.umn.edu/distribution/horticulture/components/1731–
03.html.
Sa, T. M., & Israel, D. W. (1991). Energy status and function of phosphorus deficient soybeans
nodules. Plant Physiology, 97, 928–935
Sadowsky, M. J., & Graham, P. H. (1998). Soil biology of the Rhizobiaceae. In H. P. Spaink, A.
Kondorosi, & P. J. J. Hooykaas (Eds.). The Rhizobiaceae (pp. 155–172.). Dordrecht,
The Netherlands: Kluwer.
Sage, R. F., & Pearcy, R. W. (1987). The nitrogen use efficiency of C3 and C4 plants. II. Leaf
nitrogen effects on the gas exchange characteristics of Chenopodium album L. and
Amaranthus retroflexus L. Plant Physiol., 84, 959–963.
Saka, J. O., Ajibade, S. R., Adeniyan, O. N., Olowoyo, R. B., & Ogunbodede, B. A. (2004).
Survey of underutilized grain legume production systems in the Southwest
Agricultural zone of Nigeria. Agric. Food Inf., 6, 93–108.
University of Ghana http://ugspace.ug.edu.gh

129
Salisbury, F. B., & Ross, C. W. (1992). Hormones and growth regulators: auxin and GA. In F. B.
Salisbury, & C. W. Ross (Eds.). Plant Physiology (4th ed., pp. 372–407). Belmont:
Wadsworth Publishing Company.
Sanginga, N., Lassa, O., & Singh, B. B. (2000a). Phosphorus use efficiency and nitrogen balance
of cowpea breeding lines in a low P soil of the derived savannah zone in West
Africa. Plant and Soil, 220, 119–128.
Sanginga, N., Tholtappilly, G., & Dashiell, K. (2000b). Effectiveness of rhizobia nodulating
recent promiscuous soybean selection in the moist Savana of Nigeria. Soil Biol. and
Biochem., 32, 127–133.
Sato, M. L., Garcia–Blasque, C., & Van Berkum, P. (1999). Verification of strain identity in
Brazilian soybean inoculants using polymerase chain reaction. World J. Microbiol.
Biotech., 15, 387–391.
Schauser, L., Udvardi, M., Tabata, S., & Stougaard, J. (2008). Legume genomic relevant to
nitrogen fixation. In M. J. Dilworth, K. E. James, J. I. Sprent, & W. E. Newton
(Eds.), Nitrogen–fixing leguminous symbioses (pp. 211–233). Dordrecht, The
Netherlands: Springer.
Schippers, R. R. (2000). African Indigenous vegetables: An overview of the cultivated species.
(pp. 89–98). Chatham., UK.
Schneider, M., & De Brujin, F. J. (1996). Rep–PCR mediated genomic fingerprinting of rhizobia
and computer–assisted phylogenetic pattern analyses. World J. Microb. and Biotech.,
12, 163–174.
University of Ghana http://ugspace.ug.edu.gh

130
Schrire, B. D., Lewis, G. P., & Lavin, M. (2005). Biogeography of the Leguminosae, In G.
Lewis, G. Schrire, B. Mackinder, & M. Lock (Eds.), Legumes of the world (pp. 21–
54). Kew, UK: Royal Botanic Gardens, ISBN 8773043044.
Schulze, E. D., Gebauer, G., Ziegler, H., & Lange, O. L. (1991). Estimates of nitrogen fixation
by trees on an aridity gradient in Namibia. Oecologia, 88, 451–455.
Schwinghamer, E. A., & Dudman, W. F. (1980). Methods of identifying strains of diazotrophs.
In F. J. Bergersen (Ed.), Methods for Evaluating Biological Nitrogen Fixation (pp.
337–365). New York, USA: John Wiley and Sons.
Sessitsch, A. J., Howieson, J. G., Perret, X., Antoun, H., & Martinez–Romeoro, E. (2002).
Advances in Rhizobium Research. Critical Reviews. Plant Sciences, 21, 323–378.
Shukla, S., Boman, B. J., Ebel, R., Roberts, P. D., & Hanlon, A. E. (2010). Reducing
unavoidable nutrient losses from Florida’s horticultural crops. Hort. Techn., 20, 52–
66.
Singh, R. J., Chung, G. H., & Nelson, R. L. (2007). Landmark research in legumes. Genome, 50,
525–537.
Smaling, E. M. A., Nandwa, S. M., & Janssen, B. H. (1997). Soil fertility in Africa is at stake. In
J. R. Buresh, P. A. Sanchez, & F. Calhoun (Eds.), Replenishing Soil Fertility in
Africa (pp. 47–61) SSSA Special Publication 51, SSSA, Madison, WI, USA.
Somasegaran, P., & Hoben, H. J. (1994). Handbook for rhizobia, methods in Legume–Rhizobium
technology, laboratory manual (p. 450). Springer–verlage, New York, Inc.
University of Ghana http://ugspace.ug.edu.gh

131
Soto, M. J., Sanjuán, J., & Olivares, J. (2006). Rhizobia and plant–pathogenic bacteria: common
infection weapons. Microbiology, 152, 3167–3174.
Sprent, J. I. (1976). Water deficits and nitrogen fixing root nodules. In: Water deficits and plant
growth, Vol. IV, Soil–water measurement, plant responses, and breeding for drought
resistance (pp. 291–315). New York, NY: Academic Press.
Sprent, J. I. (1979). The biology of nitrogen fixing organisms (p. 196). London: McGraw–Hill
Book Co.
Sprent, J. I. (2001). Nodulation in legumes. Royal Botanic Gardens, Kew, UK.
Sprent, J. I. (2008). Evolution and diversity of legume symbiosis. In M. J. Dilworth, E. K. James,
J. I. Sprent, & W. E. Newton (Eds.). Nitrogen fixing Leguminous Symbioses (pp. 1–
21). Dordrecht, The Netherlands: Springer.
Sprent, J. I., & Raven, J. A. (1992). Evolution of nitrogen–fixing symbioses. In G. Stacey, R. H.
Burris, & H. J. Evans (Eds.), Biological nitrogen fixation (pp. 461–495). New York,
NY: Chapman Hall.
Sprent, J. I., Odee, D. W., & Dakora, F. D. (2010). African legumes: a vital but under–utilized
resource, J. of Experimental Botany, 61 (5), 1257–1265.
Ssali, H., & Keya, S. O. (1986). The effects of phosphorus and nitrogen fertilizer level on
nodulation, growth and dinitrogen fixation of three bean cultivars. Tropical
Agriculture, 63, 105–109.
Streeter, J. G. (1988). Inhibition of legume nodule formation and N2 fixation by nitrate. CRC
Crit. Rev. Plant Sci., 7, 1–23.
University of Ghana http://ugspace.ug.edu.gh

132
Streeter, J. G. (1994). Failure of inoculant rhizobia to overcome the dominance of indigenous
strains for nodule formation. Can. J. Microbiol., 40, 513–522.
Tang, C., Hinsinger, P., Drevon, J. J., & Jaillard, B. (2001a). Phosphorus deficiency impairs
early nodule functioning and enhances proton release in roots of Medicago
truncatula L., Ann. Bot., 88, 131–138.
Tang, C., Hinsinger, P., Jaillard, B., Rengel, Z., & Drevon, J. J. (2001b). Effect of phosphorus
deficiency on the growth, symbiotic N2 fixation and proton release by two bean
(Phaseolus vulgaris) genotypes. Agronomy, 21, 683–689.
Tarrand, J. J., Krieg, N. R., & Dobereiner, J. (1978). A taxonomic study of the Spirillum
lipoferum group, with descriptions of a new genus Azospirillum gen. nov. and two
species, Azospirillum lipoferum (Beijerinck) comb. nov. and Azospirillum brasilense
sp. nov. Can. J. of Microb., 24, 967–980.
Tate, R. L. (1995). Soil microbiology (Symbiotic nitrogen fixation). New York, NY: John Wiley
and Sons.
Thies, J. E., Bohlool, B. B., & Singleton, P. W. (1992) .Environmental effects on competition for
nodule occupancy between introduced and indigenous rhizobia and among
introduced strains. Canadian J. of Microbiology, 38 (6), 493–500.
Thies, J. E., Holmes, E. M., & Vachot, A. (2001). Application of molecular Techniques to
studies in rhizobium ecology: a review. Aust. J. Exp. Agr., 41, 299–319.
University of Ghana http://ugspace.ug.edu.gh
133
Thies, J. E., Singleton, P. W., & Bohlool, B. B. (1991). Influence of the size of indigenous
rhizobial populations on establishment and symbiotic performance of introduced
rhizobia on field–grown legumes. Appl. and Env. Microb., 57, 19–28.
Trinick, M. J. (1980). Growth of Parasponia in agar tube culture and symbiotic effectiveness of
isolates from Parasponia spp. New Phytol., 85, 37–45.
Trinick, M. J., & Hadobas, P. A. (1988). Biology of the Parasponia–Bradyrhizobium symbiosis.
Plant and Soil, 110, 177–185.
Tsvetkova, G. E., & Georgiev, G. I. (2003). Effect of phosphorus nutrition on the nodulation,
nitrogen fixation and nutrient Use efficiency of Bradyrhizobium japonicum–soybean
(glycine max l. merr.) symbiosis. Bulgaria J. Plant Physiol., Special Issue: 331–335.
Uguru, M. I., & Madukaife, S. O. (2001). Studies on the variability in agronomic and nutritive
characteristics of African yam bean (Sphenostylis stenocarpa Hochst ex. A. Rich.
Harms). Plant Prod. Res. J., 6, 10–19.
Uttech, S. (2007, September, 15). Yam bean a nearly forgotten crop: Interbreeding may produce
quality food source for resource–poor countries. [Blog Post]. Retrieved from
http://www.eurekalert.org/pub_releases/2007-09/asoa-yba082307.php. American
Society of Agronomy.
Vadakattu, G., & Paterson, J. (2006). Free–living bacteria lift soil nitrogen supply. Farming
Ahead, 169, 40.
University of Ghana http://ugspace.ug.edu.gh

134
Vadez, V., Rodier, F., Payre, H., & Drevon, J. J. (1996). Nodule permeability to O2 and
nitrogenase–linked respiration in bean genotypes varying in the tolerance of Nitrogen
fixation to P deficiency. Plant Physiol. Biochem., 34, 871–878.
van Berkum, P., Terefework, Z., Paulin, L., Suomalainen, S., Lindström, K., & Eardly, D.
(2003). Discordant phylogenies within the rrn loci of rhizobia. J. of Bacteriol., 185,
2988–2998.
Vance, C. P. (2008). Carbon and nitrogen metabolism in legume nodules. In M. J. Dilworth, E.
K. James, J. I. Sprent & W. E. Newton (Eds.), Nitrogen–Fixing Leguminous
Symbioses (pp. 293–320). Dordrecht: Springer.
Vance, C. P., Graham, P. H., & Allan, D. L. (2000). Biological nitrogen fixation, Phosphorus: a
critical future need. In F. O. Pederosa, M. Hungria, M. G. Yates, & M. G. Newton,
(Eds.). Nitrogen Fixation: From Molecules to Crop Productivity (pp. 505–514).
Dordrecht, Netherland: Kluwer Academic Publishers.
Vargas, R., & Hattori, T. (1986). Protozoan predation of bacterial cells in soil aggregates. FEMS
Microbiology Ecology, 38, 233–242.
Vessey, J., & Waterer, J. (1992). In search of the mechanism of nitrate inhibition of nitrogenase
activity in legume nodules: recent developments. Physiol. Plant., 84, 171–176.
Vincent, J. M. (1970). A Manual for the Practical Study of Root–Nodule Bacteria. International
Biological Program (IBP) Handbook, No. 15 (pp. 54–72.). Blackwell Scientific
Publications, Oxford and Edinburgh.
University of Ghana http://ugspace.ug.edu.gh
135
Vincent, J. M. (1980). Factors controlling the legume–Rhizobium symbiosis. In W. E. Newton, &
W. H. Orme–Johson (Eds.). Nitrogen Fixation (vol. 2, pp. 103–129). Baltimore:
University Park Press.
Vlassak, K., & Reynders, R. (1997). Agronomic aspects of biological Dinitrogen fixation by
Azospirillum spp. in Associative N2 Fixation. In: P. B. Vose, A. P. Ruschel, & F. L.
Boca Raton (Eds.). CRC Press, 1, 93–102.
Wagner, S. C. (2012). Biological Nitrogen Fixation. Nature Education Knowledge, 3: 15.
Walker, T. S., Bais, H. P., Grotewold, E., & Vivanco, J. M. (2003). Root exudation and
rhizosphere biology. Plant Physiol., 132, 44–51.
Walkley, A., & Black, A. I. (1934). An examination of the Degtjareff method for determining
soil organic matter, and a proposed modification of the chromic acid titration
method. Soil Sci., 37, 29–38.
Walsh, K. B. (1995). Physiology of the legume nodule and its response to stress. Soil Biol.
Biochem., 27, 637–655.
Warren, D. M. (1991). Using Indigenous Knowledge in Agricultural Development. World Bank
Discussion Paper No.127. Washington, D.C.: The World Bank.
Watanabe, F. S. & Olsen, S. R. (1965). Test of an ascorbic method for determining phosphorus
in water and extract from soil. Soil Sci. Soc. Am. Proc., 29, 677–678
Waterer, D. R. (1992). Influence of planting date and row covers on yields and crop values for
bell peppers in Saskatchewan. Can. J. Plant Sci., 72, 527–533.
University of Ghana http://ugspace.ug.edu.gh

136
Weaver, R. W., Frederick, L. R., & Dumenil, L. C. (1972). Effect of soybean cropping and soil
properties on number of Rhizobium japonicum in Iowa soils. Soil Sci., 114, 137–141.
Welsh, J., & McClelland, M. (1990). Fingerprinting genome using PCR with arbitrary primers.
Nucleic Acids Res., 18: 7213–7218.
White, J., Prell, J., James, E. K., & Poole, P. (2007). Nutrient sharing between symbionts. Plant
Physiol., 144, 604–614.
Williams, J. G. K., Kublik, A. R., Livak, K. J., Rafalski, J. A., & Tingey, S. V. (1990). DNA
polymorphism amplified by arbitrary primers are useful as genetic markers. Nucleic
Acids Res., 18, 6531–6535.
Williams, P. M., & De Mallorea, M. S. (1984). Effect of osmotically induced moisture stress on
nodulation and nitrogenase activity of Glycine max. Plant and Soil, 80, 267–283.
Witty, J. F., & Day, J. M. (1978). Use of 15N2 in evaluating asymbiotic N fixation. p. 135. In:
Isotopes in biological nitrogen fixation. International Atomic Energy Agency:
Vienna.
Witty, J. F., & Minchin, F. R. (1988). Measurement of nitrogen fixation by the acetylene
reduction assay; myths and mysteries. In D. P. Beck, & L. A. Materon (Eds.).
Nitrogen fixation by legumes in Mediterranean agriculture. (pp. 331–343).
Dordrecht: Martinus Nijhoff.
Wood, M., & Cooper, J. E. (1988). Acidity, aluminium and multiplication of Rhizobium trifolii:
effects of temperature and carbon source. Soil Biology and Biochemistry, 20, 89–93.
University of Ghana http://ugspace.ug.edu.gh

137
Yangyuoru, M., Boateng, E., Adiku, S. G. K., Acquah, D., Adjadeh, T. A., & Mawunya, F.
(2006). Effects of Natural and Synthetic Soil Conditioners on Soil Moisture
Retention and Maize Yield. W. A. J. Appl. Ecol., 9, 1–8.
Zahran, H. H. (2001). Rhizobia from wild legumes: diversity, taxonomy, ecology, nitrogen
fixation and biotechnology. J. of Biotechnol., 91, 143–153.
Zahran, H. H. (2009). Enhancement of Rhizobia–Legumes Symbioses and Nitrogen Fixation for
Crops Productivity Improvement. In M. S. Khan, A. Zaidi, & J. Musarrat (Eds.),
Microbial Strategies for Crop Improvement (pp. 227–254). Netherlands: Springer.
Zakhia, F., & de Lajudie, P (2001). Taxonomy of rhizobia. Agronomie, 21, 569–576.
Zhang, X., Harper, R., Karsisto, M., & Lindstrom, K. (1991). Diversity of Rhizobium bacteria
isolated from root nodules of leguminous trees. Int. J. of Syst. Bacterio., 41, 104–
113.
University of Ghana http://ugspace.ug.edu.gh

138
APPENDICES
Appendix A: Composition and Preparation of Yeast Extract Mannitol (YEM) Agar
Reagent Quantity (g L–1)
Mannitol 10.0
Dipotassium Phosphate (K2HPO4) 0.8
Potassium dihydrogen phosphate (KH2PO4) 0.2
Magnesium Sulphate (MgSO4. 7H2O) 0.2
Sodium Chloride (NaCl) 0.1
Calcium Chloride (CaCl2) 0.1
Yeast Extract 1.0
Agar 15.0
Sterile distilled water 1 L
University of Ghana http://ugspace.ug.edu.gh

139
Appendix B: Composition and Preparation of N–free Nutrient Solution (Broughton & Dillworth,
1971).
Stock solution Composition Quantity (g L–1)
Solution 1 CaCl2.2H2O 249.1
Solution 2 KH2PO4 135.1
Solution 3 Fe-citrate 6.70
MgSO4.7H2O 123.3
K2SO4 87.0
MnSO4.H2O 0.338
Solution 4 H3BO3 0.247
ZnSO4.7H2O 0.288
CuSO4.5H2O 0.100
CoSO4.7H2O 0.056
Na2MoO2.2H2O 0.048
For each 10 litres of full strength culture solution, take 5.0 mL each of solutions 1 to 4, then add
to 5.0 litres of water, then dilute to 10 litres. Use 1N NaOH to adjust the pH to 6.6–6.8.
University of Ghana http://ugspace.ug.edu.gh

140
Appendix C: ANOVA table for Nitrogen effect on some growth parameters of African yam bean in Adenta and Akuse soils’.
Variate: Nodule number plant–1 (Adenta). Variate: Nodule number plant–1 (Akuse).
Variate: Nodule dry weight (mg plant–1) (Adenta). Variate: Nodule dry weight (mg plant–1) (Akuse).
Variate: Shot total N (mg/plant) (Adenta). Variate: Shoot total N (mg/plant) (Akuse).
Variate: Shoot dry weight (g plant–1) (Adenta). Variate: Shoot dry weight (g plant–1) (Akuse).
Source of variation
Treatments
Residual
Total
d.f
3
8
11
s.s.
287.08
85.83
372.92
m.s.
95.69
10.73
v.r.
8.92
F pr
0.006 Source of variation
Treatments
Residual
Total
d.f
3
8
11
s.s.
1505.05
140.00
1645.06
m.s.
501.69
17.50
v.r.
28.67
F pr
<.001
Source of variation
Treatments
Residual
Total
d.f
3
26
29
s.s.
24327
41738
66065
m.s.
8109
5217
v.r.
1.55
F pr
0.25 Source of variation
Treatments
Residual
Total
d.f
3
8
11
s.s.
669.13
223.09
892.22
m.s.
223.04
27.89
v.r.
8.00
F pr
<.001
Source of variation
Treatments
Residual
Total
d.f
3
8
12
s.s.
7155.05
450.62
7605.67
m.s.
2385.02
56.33
v.r.
42.34
F pr
<.001 Source of variation
Treatments
Residual
Total
d.f
3
8
12
s.s.
19322.83
474.57
19797.40
m.s.
6440.94
59.32
v.r.
108.58
F pr
<.001
Source of variation
Treatments
Residual
Total
d.f
3
8
12
s.s.
0.683
0.293
0.976
m.s.
0.229
0.037
v.r.
6.21
F pr
0.017 Source of variation
Treatments
Residual
Total
d.f
3
8
11
s.s.
4.549
0.263
4.812
m.s.
0.5162
0.033
v.r.
46.07
F pr
<.001
University of Ghana http://ugspace.ug.edu.gh

141
Appendix D: ANOVA tables for Phosphorus effect on some growth parameters of African yam bean in Adenta and Akuse soils’.
Variate: Nodule number plant–1 in Adenta soil Variate: Nodule number plant–1 in Akuse soil
Variate: Nodule dry weight (mg/plant) (Adenta) Variate: Nodule dry weight (mg/plant) (Akuse)
Variate: Shoot total N (mg/plant) (Adenta) Variate: Shoot total N (mg/plant) (Akuse)
Variate: Shoot dry weight (g/plant) (Adenta) Variate: Shoot dry weight (g/plant) (Akuse).
Source of variation
Treatments
Residual
Total
d.f
3
8
12
s.s.
4722.92
706.33
5429.25
m.s.
1574.31
88.29
v.r.
17.83
F pr
<.001 Source of variation
Treatments
Residual
Total
d.f
3
8
11
s.s.
12615.73
309.50
12925.23
m.s.
4205.24
38.69
v.r.
108.70
F pr
<.001
Source of variation
Treatments
Residual
Total
d.f
3
8
11
s.s.
11693
17357
129050
m.s.
37231
2170
v.r.
17.16
F pr
<.001 Source of variation
Treatments
Residual
Total
d.f
3
8
11
s.s.
132563
8140
140703
m.s.
44188
1017
v.r.
43.43
F pr
<.001
Source of variation
Treatments
Residual
Total
d.f
3
8
11
s.s.
11048.62
341.33
1389.95
m.s.
3682.87
v.r.
86.32
F pr
<.001 Source of variation
Treatments
Residual
Total
d.f
3
8
11
s.s.
24356.3
1932.6
26288.9
m.s.
8118.8
241.6
v.r.
33.61
F pr
<.001
Source of variation
Treatments
Residual
Total
d.f
3
8
11
s.s.
4.24937
0.7693
4.62631
m.s.
1.4165
0.0471
v.r.
30.06
F pr
<.001 Source of variation
Treatments
Residual
Total
d.f
3
8
11
s.s.
11.2379
1.0026
12.2405
m.s.
3.7460
0.1253
v.r.
29.89
F pr
<.001
University of Ghana http://ugspace.ug.edu.gh
Copyright © 2022 FDOKUMEN