A White Paper On Livelihoods - Goa - India Environment Portal
89
-
Upload
khangminh22 -
Category
Documents
-
view
1 -
download
0
Transcript of A White Paper On Livelihoods - Goa - India Environment Portal


A White Paper On Livelihoods - Goa
ACKNOWLEDGEMENTS
Goa Livelihoods Forum (GLF) is grateful to organisations, institutions and individuals who
helped make this White Paper a reality. We are grateful to Life Line Foundation for helping
with the survey of the households across all the Talukas of Goa.
FIDR has conceptualised the White Paper by providing technical support and guidance.
GLF acknowledges the contribution of our Advisory Group including Siddhartha Behera, Asha
Dharmanand Vernekar, Dharmanand Vernekar, Sanjib Dash and Prakash Kamat, who played a
critical role in developing the White paper.
The Advisory Group comprises of sectoral specialists including Siddharth Kuncolienkar,
Nitin Kunkolienker, Yatish Naik, Jennifer Lewis E Kamat, Babita Angle, Amol Navelkar,
Serafino Cota, Ramesh Ghadi, Raj Vaidya, Damodar Mauzo, and various other active
members of our platform. The Sarpanch of villages in all the 12 Talukas and more
importantly the communities provided valuable information on the current scenario of
Livelihoods in Goa.
We laud the efforts of Ravi Kumar & Divya Parmar who have assisted in putting together
this White Paper.
Our sincere gratitude to the entrepreneurs, youths, Panchayat leaders, women leaders, who
have been instrumental in helping us create the platform to release India's first White Paper
on Livelihoods in Goa which would pave the way for many more such initiatives, across the
country.
Thank you all!
1 | P a g e

A White Paper On Livelihoods - Goa
FOREWORD
This situational assessment of livelihoods in Goa may appropriately be referred to as a
White Paper, perhaps the first White Paper on livelihoods in Goa, and one of the few state-
wide in India.
The effort was to reach out to households, individuals, social groups, communities all across the
state, spend time with them, undertake a mix of qualitative and quantitative research and
prepare an in-depth, authoritative report. This White Paper is more of a guide which is aimed
at informing readers, concisely about the complex issue of livelihoods, income, sources of income
and quality of life, in the backdrop of Goa experiencing a big change in the economics of
dominant sectors – mining, tourism and hospitality and others.
The White Paper is meant to help readers understand the issue of sustained quality and
standard of life of Goans, offer possibilities of policy and implementation interventions and
brace the state to tackle the growth imperatives for the next generations. Sustained
development is the key epithet and we invite all the readers to contribute to this White
Paper, as it is ever evolving. I am sure you would find this document substantive & useful.
Join me in lauding the efforts of Goa Livelihoods Forum (GLF) in presenting the first ever
Livelihoods White Paper, conceived & developed by the civil society of Goa!
CHARUDUTTA PANIGRAHI
MENTOR, GLF
2 | P a g e

A White Paper On Livelihoods - Goa
DISCLAIMER
All information in this document is provided for general information only and is not in
the nature of advice. It should not be relied upon for any purpose and GLF makes no
warranty or representation and gives no assurance as to its accuracy, completeness or
suitability for any purpose.
Information about an individual, civil society organization or programme in this
publication does not indicate GLF's endorsement. Where cited, you should refer to the
primary sources for more information. This report does not necessarily reflect the views
of GLF partners.
GLF reserves the right to make alterations to any of its documents without notice. Reproduction and dissemination of this document is permitted provided that the document is unaltered and ownership is acknowledged.
Express permission of GLF is required for use of this document (in whole or in part) if such use has the possibility of generating income for the licensee.
3 | P a g e

A White Paper On Livelihoods - Goa
TABLE OF CONTENTS Acknowledgements Foreword Disclaimer INTRODUCTION ........................................................................................................................... 5 OBJECTIVES OF THE STUDY .......................................................................................................... 6
TOPOGRAPHY ............................................................................................................................. 6
CLIMATOLOGY ............................................................................................................................ 7
IMPACT ON ECONOMIC STATUS .................................................................................................. 7
ANALYSIS OF GOA LIVELIHOOD SURVEY ....................................................................................... 8
PROFILE OF THE SURVEY RESPONDENTS ...................................................................................... 9
AGE ........................................................................................................................................ 9
OCCUPATION .......................................................................................................................... 9
HOUSE .................................................................................................................................... 9
LENGTH OF RESIDENCE ............................................................................................................ 9
FAMILY MEMBERS ................................................................................................................... 9
STATE WIDE ANALYSIS – ALL 12 TALUKS ......................................................................................11
TALUKA WISE ANALYSIS .........................................................................................................18
PONDA ...............................................................................................................................18
SATARI ...............................................................................................................................19
BARDEZ ..............................................................................................................................20
PERNEM .............................................................................................................................21
TISWADI .............................................................................................................................22
BICHOLIM ...........................................................................................................................23
SANGUEM ..........................................................................................................................24
CANCONA ...........................................................................................................................25
DHARBANDORA ..................................................................................................................26
MORMUGAO ......................................................................................................................28
QUEPEM .............................................................................................................................29
SALCETE .............................................................................................................................30
CONCLUSION .............................................................................................................................32
4 | P a g e

A White Paper On Livelihoods - Goa
INTRODUCTION
Goa, an epitome of tranquillity in the midst of cultural diversity, is a state, world renowned for its lush greeneries and beaches, a sheer paradise of scenic charm, positioned beautifully amidst seas. It is located in the western region of India sharing its borders with the Arabian Sea in the west and Maharashtra in the north with Karnataka to the south and east. Goa has a coastline of about 104 km and inland waterways of about 250 km.
Goa being the smallest yet is the fastest growing and the richest economy in the country. The Gross State Domestic Product of Goa at current prices increased at a Compound Annual Growth Rate (CAGR) of 8.78 per cent from 2011-12 to 2017-18. Goa’s net state domestic product (NSDP) was Rs 587.71 billion (US$ 8.76 billion) in 2017-18. The state had one of the highest per capita GSDP in the country and stands at about US$ 6,044.5 in 2017-18.
The mining industry specifically the iron ore mining in Goa has been one of the oldest industries that has immensely contributed towards the growth of the state and brought immense economic prosperity. Developing regions with large mineral deposits confront a challenge in striking the right balance between using the mineral resources for economic prosperity and safeguarding environmental stability and socioeconomic welfare.
The state has high literacy rate of 87.50 percent as per 2011 Census Survey and was ranked third in terms of quality of life in 2005 HDI ranking. 40 percent of the state population is made up of migrants. Though traditionally an agrarian economy, Goa has seen a shift to other sectors like manufacturing and tourism. This is due to the fact that agriculture is time consuming, requires more efforts as well as the expensive labour and thus turns out to be a slow and in many cases seemingly unfruitful process.
The present proposed study is helpful to solve these all important inter linked complex socioeconomic and environmental issues. Therefore, the present study has been planned to study the impacts of mining and its closure on the prevailing socioeconomic situation of the local people. The results obtained from the present study shall be helpful to devise multiple steps and measures to minimize the impacts of mining closure and bring about a synergy to the effect wherein impacts on the local environment, forest and the health of local people can be buttressed and the shifting focus towards livelihood bringing about a situational change in the populace. The discussion would then shift to bridging the gaps created by the mining ban and preparing a congenial atmosphere for the common man to voice his views, issues and problems arising out of the issue and airing the same in support forums to ensure a discussion is made to arrive at a proper conclusion keeping every stakeholders interest.
5 | P a g e

A White Paper On Livelihoods - Goa
OBJECTIVES OF THE STUDY
The study aims at covering the following objectives:
a. To study the socio-economic characteristics of the households in the talukas. b. To assess the situation of the area and to facilitate the process of identification
of the stakeholders. c. Identify potential impacts and issues d. Situational analysis of the HH’s in the talukas e. To assess the impact of mining ban on the socio-economic characteristics of
the households in the mining areas.
TOPOGRAPHY
Goa is the second smallest state located on the west coast of India covering an area of 3702 sq. km. and runs 105 km long and 65 km wide. Goa is located between latitudes 14º53’55’’ N and 15º 47’ 59’’ N and longitudes 73º40’34’’ E and 74º17’03’’ E. The Arabian Sea marks the western boundary of the State. To the North and North East is the State of Maharashtra and to the East and South-East is bordered by Karnataka. The State if divided into two administrative districts namely North and South. All together there are 12 talukas, 191 Village Panchayats and 14 Municipalities.
Goa is essentially a rugged hilly and mountainous tract with narrow valleys and sandy linear plains along the coast. The terrain is undulating. The highest peak is Mamai Devi with 832 m height. The State is broader towards the North. In its physiographical aspects, the state can be classified into three types of terrain which grade from low lying coastal estuarine plains to the West, undulating region in the central part, to the steep slopes of the Western Ghats on the eastern border of the state. The three terrain types can be delineated roughly longitudinally, except in the far South of the State, where all three types seem to merge.
The most visible or well-known part of Goa (especially by tourists) is the coastal belt which runs from north to south, while the least known is the Western Ghats region, which also runs from north to south in the hinterland. Sandwiched in between is the midland region. The coastal plain comprises the talukas of Bardez, Tiswadi, Mormugao and Salcete, which cover about 22% of the total geographical area. The intermediate or transitional sub mountainous region comprising the talukas of Pernem, Bicholim, Ponda and Quepem, with undulating uplands, covers about 35% of the area, whereas the interior hilly region of Sattari, Sanguem and Canacona talukas make up the remaining 43% of the area.
6 | P a g e

A White Paper On Livelihoods - Goa
CLIMATOLOGY
Goa is grouped under Western Zone Agro-Climatic region of India. The state is situated well within the tropics. It has tropical maritime and monsoon type of climate influenced to a large extent by conditions in the Arabian Sea. For this reason, the climate is humid throughout the year due to proximity of the seas. The main feature of the Goa climate is the monsoon. There are four seasons corresponding to winter (December to February), summer or Pre-monsoon (March to May), monsoon (June to September) and post monsoon (October and November). Goa experiences a dry period lasting six to eight months of the year, followed by the annual rainfall, which occurs over the remaining four months. During the two months preceding the beginning of the monsoon, the humidity increases. The average relative humidity is 70 – 90% (reaching the highest value during the monsoon).
IMPACT ON ECONOMIC STATUS
In Goa context, one study by Mendes (2001) talks about a time when mining was mainly concentrated in Bicholim taluka. There has been subsequent extension in the mining activities to other talukas like Sattari, Sanguem and Quepem talukas as well. Thus, with this increase in spread of the industry this objective aims to seek whether there has been any change in the determinants of the economic status.
Mendes G. (2001) in his thesis submitted to Utkal University, Department of Economics revealed that the socio-economic status of the households in the mining regions is better as compared to that of its non-mining counterparts in Goa’s Bicholim taluka. He used a sample of 380 in each of the two strata for the purpose of study. The researcher in order to attain the objectives has employed the tools such as regression analysis, average, standard deviations and percentage. The major variable considered for the studies are education, participation rate, trade and service and landholding size to determine the per capita income of the households in the mining area. The researcher found that mining brings ample of employment as well as trade/business opportunities for the people in the mining areas as there is in-migration of the people into the areas. He also found an improvement in the economic status, literacy rates of the people and participation rate. The study reveals that the women in the mining areas are found to be better as compared to that of non-mining areas with respect to the variables considered in the study. Corollary to his study can also help in deducing that mining had impacted local communities and some of the positive impacts have been employment and community development projects.
7 | P a g e

A White Paper On Livelihoods - Goa
ANALYSIS OF GOA LIVELIHOOD SURVEY
For the purpose of this report and the Situational Assessment in both the mining and non-mining talukas in Goa, we have adapted a few indicators from the UNDP adopted Human Development Index (HDI), as far as applicable, which is a statistical tool used to measure a country's overall achievement in its social and economic dimensions. The social and economic dimensions of a country are based on the health of people, their level of education attainment and their standard of living. We have tried to utilize the indicators only and in the state of Goa context.
It is commonly accepted that HDI is one of the best tools to keep track of the level of development of a country, as it combines all major social and economic indicators that are responsible for economic development. We have optimized the indicators in a state situation.
DEMOGRAPHIC PROFILE OF RESPONDENTS
100%
90%
80%
70%
60%
50%
40%
30%
20%
10%
0%
Age b
elow
35A
geab
ove3
5Non
-W
orkin
gPen
sione
r
Agric
ultu
reM
inin
g
fishi
ngTo
urism
Oth
er(s
ervi
ce, B
usin
ess)
Own
Hous
eRen
tHou
seM
oret
han5
0
year
s
25 Y
ears
to 5
0 ye
ars2
4to1
5yea
rs
14 to
10
year
purp
ose
Sing
le2t
o6M
oret
han
7
Yes No
Gas
Stov
eFire
woo
d
YesN
O
from
AGE OCCUPATION HOUSE LENGTH OF FAMILY OWN TYPE OF HEALTH
RESIDENCE MEMBERS VEHICLE FUEL ISSUES
8 | P a g e

A White Paper On Livelihoods - Goa
PROFILE OF THE SURVEY RESPONDENTS
AGE
More than 80 % of the respondents were aged 35 and above.
OCCUPATION
The occupational status of the respondents varied from engaging in agriculture to fishing, mining and tourism sectors. 30 percent of the respondents was either not working or were drawing government pensions.
HOUSE
More than 70 % of the respondents were residing in their own house. The rest
were residing on rent basis.
LENGTH OF RESIDENCE
40 % of the respondents have been in Goa for 25 to 50 years. The migrated population was less than 20%
FAMILY MEMBERS
Majority of the respondents inhabited with 2-6 members in one house.
Respondents Infra
450 400 350 300 250 200
150 100
50
0
Sample Size Kacha House Pakka House
Ponda, Sattari, Pernem, Cancona and Dharbandora are the talukas where most of the houses are Kutcha houses – well over 50%. During the survey it was observed that as is often the case with rapid development, these rural and remote settlements are confronted with many environmental, social and economic challenges. The mining belt of Goa with an area of more than 700 sq. kms is mostly concentrated in 4 talukas
9 | P a g e

A White Paper On Livelihoods - Goa
namely Bicholim, Sattari, Sanguem and Quepem. But the absence the basic amenity of Pucca housing in areas like Sattari calls for greater collaborations under PPP or similar models. There is enough scope to involve the mining companies and developed a self-regulatory framework, in which standards of provision should be developed to reflect socially sustainable outcomes. In our Roundtable discussions it was expressed by the participants that the issue of adequate and durable housing is integral to poverty reduction and social justice in Goa. The living conditions of the people in the areas show that the settlement or the resettlement programs are inefficient and perpetuate various unhealthy and uninsured circumstances. It is not about simply supplying shelter for the inhabitants of rural villages. The housing programs need to work towards a larger goal of building “healthy and sustainable communities.”
10 | P a g e

A White Paper On Livelihoods - Goa
STATE WIDE ANALYSIS – ALL 12 TALUKAS
Talukas
Ponda
Sattari
Bardez
Pernem
Tiswadi
Bicholim
Sanguem
Cancona
Dharbandora
Mormugao
Quepem
Salcete
Sample Size 220 382 200 223 202 215 257 213 215 239 208 260
Average Income 163161 148156 151430 146534 153077 150864 147207 144797 148511 150167 121634 147575
Kutcha House 128 140 27 199 19 59 125 122 122 4 7 28
Pakka House 92 237 173 24 176 155 121 91 91 235 201 231
Annual Expense 121752 123000 123768 121776 123300 122268 122124 119904 121620 123408 116892 121812
Savings (as a % of
total average 41409 25156 27662 24758 27052 28596 25083 24893 25891 26759 4742 25763
income)
Income post 84622
86570
80906
83952
84483
79524
85397
94774
84890
75237
84780
84635
mining closure
Average
increase/Decrease -48% -42% -47% -43% -45% -47% -42% -35% -43% -50% -30% -43%
in income %
11 | P a g e

A White Paper On Livelihoods - Goa
Indices
450
180,000
400
160,000
350
140,000
300
120,000
250
100,000
200
80,000
150
60,000
100
40,000
50
20,000
0
-
Ponda Satari Bardez Pernem Tiswadi Bichollim Sanguem Cancona Dharband Mormuga Quepem Salcete
ora o Average Income 163,161 148,156 151,430 146,534 153,077 150,864 147,207 144,797 148,511 150,167 121,634 147,575
Annual Expense 121,752 123,000 123,768 121,776 123,300 122,268 122,124 119,904 121,620 123,408 116,892 121,812
Savings (as a % of total average income) 41,409 25,156 27,662 24,758 27,052 28,596 25,083 24,893 25,891 26,759 4,742 25,763
Income post mining closure 84,622 86,570 80,906 83,952 84,483 79,524 85,397 94,774 84,890 75,237 84,780 84,635
Sample Size 220 382 200 223 202 215 257 213 215 239 208 260
Kacha House 128 140 27 199 19 59 125 122 122 4 7 28
Pakka House 92 237 173 24 176 155 121 91 91 235 201 231
12 | P a g e

A White Paper On Livelihoods - Goa
Talukas Ponda Sattari Bardez Pernem Tiswadi Bicholim Sanguem Cancona Dharbandora Mormugao Quepem Salcete Water
95%
90%
90%
95%
96%
94%
95%
91%
81%
90%
90%
91%
Supply
Water
60%
31%
33%
13%
22%
62%
55%
45%
58%
43%
37%
67%
Shortage
Sanitation 86% 80% 88% 75% 95% 93% 95% 70% 73% 62% 71% 61%
Access to
social 28% 50% 61% 63% 46% 33% 49% 66% 38% 18% 79% 63%
welfare
Garbage
Management 80% 60% 20% 51% 92% 40% 45% 36% 57% 77% 69% 73%
Road 90%
92%
87%
95%
95%
95%
92%
63%
69%
97%
89%
90%
accessibility
Public 92%
65%
84%
99%
97%
83%
82%
88%
88%
97%
98%
98%
Transport
Private 80%
68%
77%
77%
82%
63%
55%
68%
60%
55%
78%
71%
transport
Farming
Land owners 15% 22% 25% 38% 8% 20% 4% 43% 1% 12% 43% 7%
Type of 50%
60%
33%
46%
41%
95%
33%
96%
75%
86%
75%
65%
farming
Purpose of
18%
85%
60%
60%
30%
25%
25%
47%
75%
44%
66%
30%
farming
13 | P a g e

A White Paper On Livelihoods - Goa
Taluka Parameter 1
Salcete Quepem Mormugao Dharbandora Cancona Sanguem Bichollim Tiswadi Pernem Bardez Satari
Ponda
61% 71%
62%
73%
70% 95%
Sanitation 93% 95%
75% 88%
80%
86%
37%
67%
43%
58%
45%
55%
Water Shortage
62%
22%
13%
33% 31%
60%
91% 90% 90%
81% 91%
95%
Water Supply 94% 96%
95% 90% 90%
95%
14 | P a g e

A White Paper On Livelihoods - Goa
Taluka Parameter 2
Salcete Quepem Mormugao Dharbandora Cancona Sanguem Bichollim Tiswadi Pernem Bardez Satari Ponda
73% 69%
77%
57%
36%
Garbage Management 45%
40%
92%
51%
20%
60%
80%
63%
79%
18%
38%
66%
Access to social welfare 49%
33%
46%
63%
61%
50%
28%
15 | P a g e

A White Paper On Livelihoods - Goa
Taluka Parameter 3
Salcete Quepem Mormugao Dharbandora Cancona Sanguem Bichollim Tiswadi Pernem Bardez Satari Ponda
71%
55% 78%
60%
55% 68%
63%
77% 77%
82%
68% 80%
98% 98%
97% 88% 88%
82% 83%
84%
97% 99%
65%
92%
90%
89%
Private transport
Public Transport

16 | P a g e

A White Paper On Livelihoods - Goa
Salcete
Purpose of farming
Taluka Parameter 4 Quepem Mormugao Dharbandora Cancona Sanguem Bichollim Tiswadi Pernem Bardez Satari Ponda
30%
66% 44%
75% 47%
25% 25%
30% 60% 60%
18%
85%
65%
75% 75%
86%
33%
96%
41%
95% 46%
Type of far ming
Farming Land owners
33%
60% 50%
7% 43%
12% 1%
43% 4%
20% 8%
38%
15%
22%
25%

17 | P a g e

A White Paper On Livelihoods - Goa
TALUKA WISE ANALYSIS
Ponda
Ponda
Garbage Management 80%
Purpose of farming 18%
Type of farming 50%
Farming Land owners 15%
Sanitation 86%
Private transport 80%
Public Transport 92%
Road accesibility 90%
Access to social welfare 28%
Water Shortage 60%
Water Supply 95%
PONDA
This is the industrial centre for the state, and there is several factories and industrial estates in the area and is also one of Goa's fastest-growing cities. Ponda is also an educational hub with top notch engineering colleges like NIT, IIT, GEC and several other educational institutions. It is strategically located with two major national highways and is the connect between Panjim and the Belgaum-Hubli markets.
Primary issues include the under use of social welfare schemes probably due to lack of exposure of the people living in this particular taluka, through providing exposure via one to one conversations or mass advertising campaigns highlighting government schemes people in this taluka could be encouraged to avail government schemes to its fullest. Secondly, Ponda lacks thriving enterprise as most of the agricultural produce is primarily for self-consumption. While this could be considered a step toward self-sufficiency, it means no scope of improvement within the taluka in terms of welfare or economic growth which is why possibly tax breaks and subsidies could be introduced furthermore.
People should be provided loans at lower rates and from formal banking organizations in order to promote reinvestment in machinery aiming to cut production costs to its
18 | P a g e
A White Paper On Livelihoods - Goa
minimal as over 25% of incomes in Ponda are simply saved while the farmers continue to use technologically primitive ways of farming. Although house ownership is not a main issue in Ponda, house structures still continue to comprise a high number of kutcha houses which indicates a lack of actual development.
While some problems like those mentioned above persist, Ponda still has a good network of roads, abundance of private house owners as well as adequate sanitary facilities.
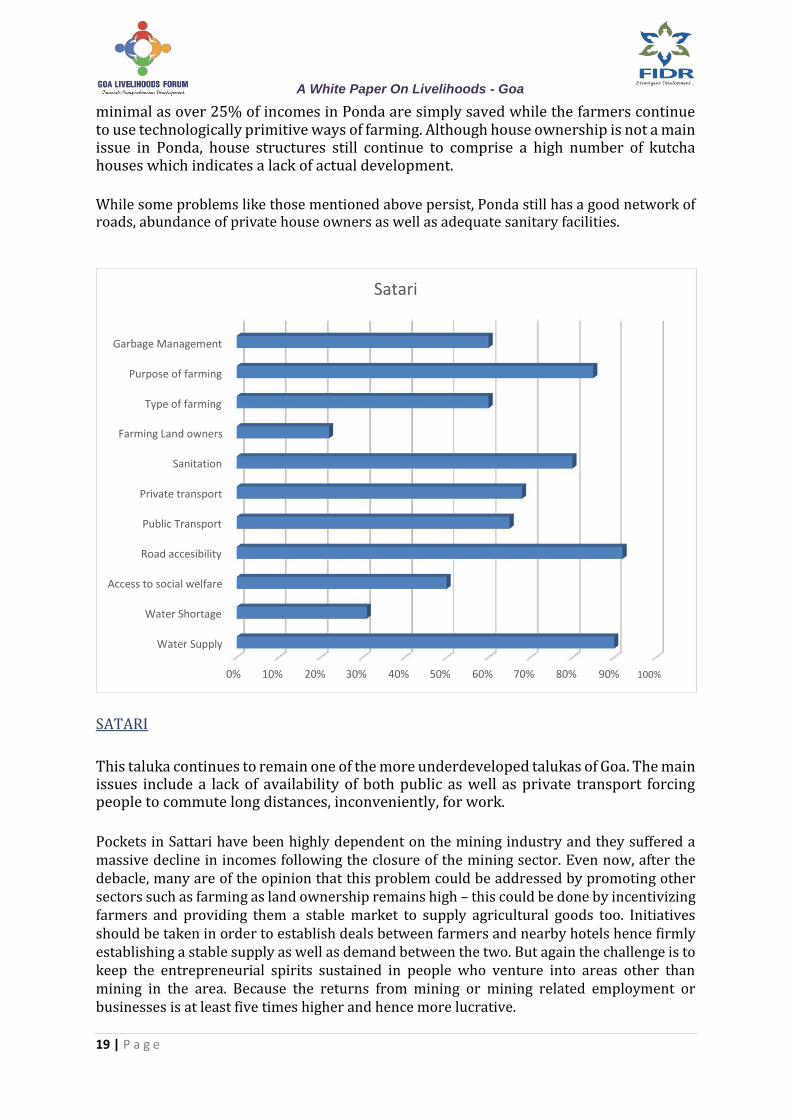
Satari
Garbage Management
Purpose of farming
Type of farming
Farming Land owners
Sanitation
Private transport
Public Transport
Road accesibility
Access to social welfare
Water Shortage
Water Supply
0% 10% 20% 30% 40% 50% 60% 70% 80% 90% 100%
SATARI
This taluka continues to remain one of the more underdeveloped talukas of Goa. The main issues include a lack of availability of both public as well as private transport forcing people to commute long distances, inconveniently, for work.
Pockets in Sattari have been highly dependent on the mining industry and they suffered a massive decline in incomes following the closure of the mining sector. Even now, after the debacle, many are of the opinion that this problem could be addressed by promoting other sectors such as farming as land ownership remains high – this could be done by incentivizing farmers and providing them a stable market to supply agricultural goods too. Initiatives should be taken in order to establish deals between farmers and nearby hotels hence firmly establishing a stable supply as well as demand between the two. But again the challenge is to keep the entrepreneurial spirits sustained in people who venture into areas other than mining in the area. Because the returns from mining or mining related employment or businesses is at least five times higher and hence more lucrative.
19 | P a g e
A White Paper On Livelihoods - Goa
While certain problems persist, Sattari enjoys a good water supply with majority of people having access to them as well. Hence farming has massive potential to grow in this taluka if water-based irrigation facilities are established. Lastly, the tertiary sector too could be promoted in this Taluka e.g.- transportation of goods and services via buses and lorry’s as Sattari enjoys a good network of roads.
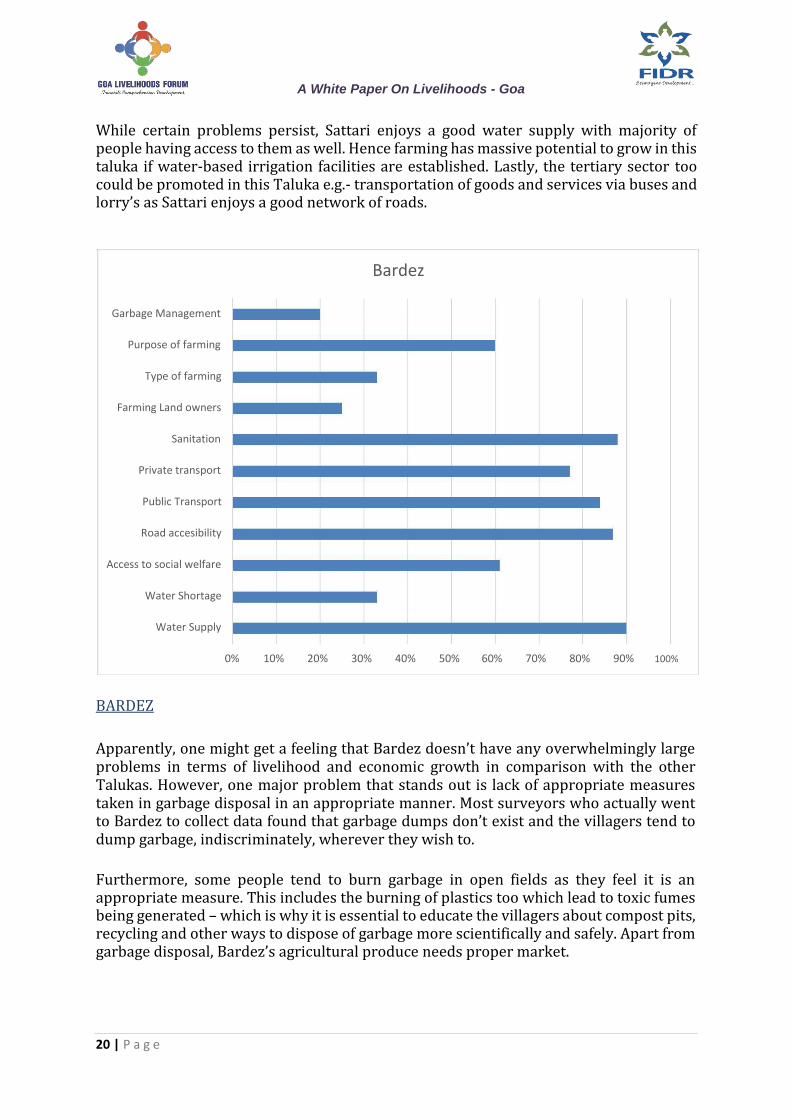
Bardez
Garbage Management
Purpose of farming
Type of farming
Farming Land owners
Sanitation
Private transport
Public Transport
Road accesibility
Access to social welfare
Water Shortage
Water Supply
0% 10% 20% 30% 40% 50% 60% 70% 80% 90% 100%
BARDEZ
Apparently, one might get a feeling that Bardez doesn’t have any overwhelmingly large problems in terms of livelihood and economic growth in comparison with the other Talukas. However, one major problem that stands out is lack of appropriate measures taken in garbage disposal in an appropriate manner. Most surveyors who actually went to Bardez to collect data found that garbage dumps don’t exist and the villagers tend to dump garbage, indiscriminately, wherever they wish to.
Furthermore, some people tend to burn garbage in open fields as they feel it is an appropriate measure. This includes the burning of plastics too which lead to toxic fumes being generated – which is why it is essential to educate the villagers about compost pits, recycling and other ways to dispose of garbage more scientifically and safely. Apart from garbage disposal, Bardez’s agricultural produce needs proper market.
20 | P a g e

A White Paper On Livelihoods - Goa
Initiatives should be introduced which aim to reduce costs of production as this would result in larger profit margins for the farmers hence adding to the betterment of the livelihoods of people living in this taluka.
Adequate water supply, decent road networks and appropriate sanitation facilities are all some of the strengths of this taluka. However good water supply doesn’t guarantee clean water in addition to the fact that pollution is really high in this taluka. It is essential to ensure that water resources in this taluka are maintained well and not polluted.
Pernem
Garbage Management
Purpose of farming
Type of farming
Farming Land owners
Sanitation
Private transport
Public Transport
Road accesibility
Access to social welfare
Water Shortage
Water Supply
0% 20% 40% 60% 80% 100% 120%
PERNEM
Pernem is subject to a lack of proper infrastructure as more than 85% of all houses are kutcha houses suggesting a lack of economic welfare of the people. There is also limited access to proper sanitary facilities for 75% of all people residing in this taluka. There is a felt need for the development of cemented houses (pucca houses) and for providing people access to proper toilet facilities.
Pernem enjoys good public transport services which is why private ownership of vehicles is still relatively high. Public transport should be maintained and continued to be encouraged.
21 | P a g e

A White Paper On Livelihoods - Goa
Tiswadi
Garbage Management
Purpose of farming
Type of farming
Farming Land owners
Sanitation
Private transport
Public Transport
Road accesibility
Access to social welfare
Water Shortage
Water Supply
0% 20% 40% 60% 80% 100% 120%
TISWADI
It is one of the more prospering talukas in Goa. Tiswadi has the second highest average income when compared to all the other talukas. The people enjoy adequate water supply and infrastructure. But a major problem in this taluka is poor awareness of government welfare schemes.
There should be more awareness programs on government schemes in this taluka. While farming isn’t a widespread profession in this region it accounts for a larger proportion of self-consumption when compared to other regions. It is a felt need, with the respondents urging to encourage farming, as Tiswadi was highly dependent on the mining sector and following the mining closure, real average incomes have fallen by more than 60%. The annual incomes have dipped sizeably but other sectors like farming though could at the best supplement the family income, can not compensate to the same extent or even marginally lower.
The local population feel strongly that farming is highly feasible and there is abundance of water and road accessibility. But specific inputs for farming are required. Fallow lands cover the highest area on 3,669 hectares in Tiswadi (highest amongst all talukas).
22 | P a g e

A White Paper On Livelihoods - Goa
Bicholim
Garbage Management
Purpose of farming
Type of farming
Farming Land owners
Sanitation
Private transport
Public Transport
Road accesibility
Access to social welfare
Water Shortage
Water Supply
0% 10% 20% 30% 40% 50% 60% 70% 80% 90% 100%
BICHOLIM
It would not be an exaggeration to identify Bicholim as one of the epicentres of Iron Ore mining in Goa and the results of the assessment in areas like Surla, Velguem, Shirgaon, Assnora and Advalpale indicate that the closure of mining has dealt a severe blow to the quality of life of the households and their incomes. The loss of livelihoods in Bicholim has eroded the self-confidence of the people in the area, as says”, Sandesh Naik, Amona. Without any alternative available or promoted amongst the community, the local population are rudderless, and the locals are of the view that this is going to aggravate the outward migration of the local youth to a large extent. In the state about 56% of the households are in North Goa and about 44% in South Goa. In North Goa, Bicholim’s population is about 7%. Mining activities contributed directly to this major chunk of the state’s population, besides other areas and talukas. But this taluka suffers from a number of problems which have a direct or indirect impact on the people residing. Although 95% of the people claim that there is adequate water supply it isn’t necessary that the people actually have access to most of these sources of water. While surveying it was discovered that more than half of the sample claim that they have experienced a water shortage.
So even if there is water supply system which is laid out, the people face water crisis. This calls for urgent action to make water accessible to most of the population. More than 35% of the people residing in Bicholim are illiterate and uneducated when it comes to the knowledge about social welfare schemes of the government. This prevents
the Bicholim inhabitants from gaining access to the government plans and schemes. Land ownership in Bicholim ranks in the median range when compared to the other talukas.
23 | P a g e

A White Paper On Livelihoods - Goa But most of the farming is done by owners themselves and not by employing local labourers instead.
Initiatives and incentives must be provided to the land owners to reduce self-consumption and expand farming in order to not only increase agricultural produce but to also generate employment.
While the above problems persist Bicholim still enjoys a good network of roads and access to public transport. But garbage management is still a work in progress and measures are still required to be taken in order to improve waste disposal methods and approaches.
Sanguem
Garbage Management
Purpose of farming
Type of farming
Farming Land owners
Sanitation
Private transport
Public Transport
Road accesibility
Access to social welfare
Water Shortage
Water Supply
0% 10% 20% 30% 40% 50% 60% 70% 80% 90% 100%
SANGUEM
Besides Bicholim the other mining hot spot is Sanguem in south Goa. Mining in this area had significantly contributed to the state exchequer as well as to the GSDP of Goa. Now the dependents feel somewhat slighted because if there were any legal issues, succession legalities or any other statutory wrangling, they feel that the issues should have been discussed in the communities and a preparatory move should have been taken for protecting the livelihoods o the people. Some feel that the value of environmental degradation, loss that mining caused to the flora, fauna, and wild life habitat and to the human health and farming economy is significant, but amidst the
chaos of mining related discourses in the state, the hapless people were driven to penury. In fact some villagers mentioned that,’ we welcome researchers to study the impacts of
24 | P a g e

A White Paper On Livelihoods - Goa
mining in the state of Goa so that the faults that are supposedly attributable to mining have caused all above stated problems to the people, nature and environment and the society of the state can be brought out by the field level study and addressed to in future. But nothing like that was done.” As far as the living standards are concerned, Sanguem has almost equal number of people residing in both Kutcha as well as Pucca houses. Transport is a concern and a growing among the people of Sanguem suffers because of lack of good network of roads and low access to both public as well as private transport.
The people of this taluka travel long distances by foot which is cumbersome, inefficient and unproductive. Farm sector enterprises need to be promoted. Land ownership is less but farm initiatives could be taken up, supported by a good irrigation system which can make use of the water resources available to the people in Sanguem. Garbage management and waste disposal remain a challenge.
Cancona
Garbage Management
Purpose of farming
Type of farming
Farming Land owners
Sanitation
Private transport
Public Transport
Road accesibility
Access to social welfare
Water Shortage
Water Supply
0% 20% 40% 60% 80% 100% 120%
CANCONA
Like some of the other talukas, Cancona suffers from lack of housing infrastructure and most of the houses remain kutcha houses, to date. The average incomes are the second lowest at below 90,000 (post mining closure) based on the data that has been collated. Unlike the other talukas, Cancona has poor road accessibility.
Bad roads have meant that people aren’t purchasing private vehicles to commute and are solely dependent on public transport which can be assumed to be in poor condition due to the roads being very poor. Furthermore, sanitation and garbage disposal facilities too
25 | P a g e
A White Paper On Livelihoods - Goa are among the poorest amongst all the talukas, with roughly half the population residing in this taluka not having access to basic amenities.
Cancona being an agriculturally thriving taluka, the land ownership and agricultural produce is the highest in this region. However, the fact that over 90% of the land owners engages in self farming and is less than optimally productive.
To increase efficiency, community farming should be encouraged thereby generating more income, more jobs and value add in farming sector. The impact of mining sector closure affected all the other sectors in this taluka. Fallow lands are increasing in Goa due to various social factors. These must be revived with the help of community farming and by doing in-depth microclimatic studies. Cancona can lead by example for the rest of the state to replicate. People opined that there must be attempt to revive agriculture through community farming which is a cooperative cultivation model like the ‘gaunkari’, (comunidade) system in Goa. The fallow land study must be followed up with microclimatic studies so that farmers know what crops grow best in which soil. This will ensure a horticulture hub model.
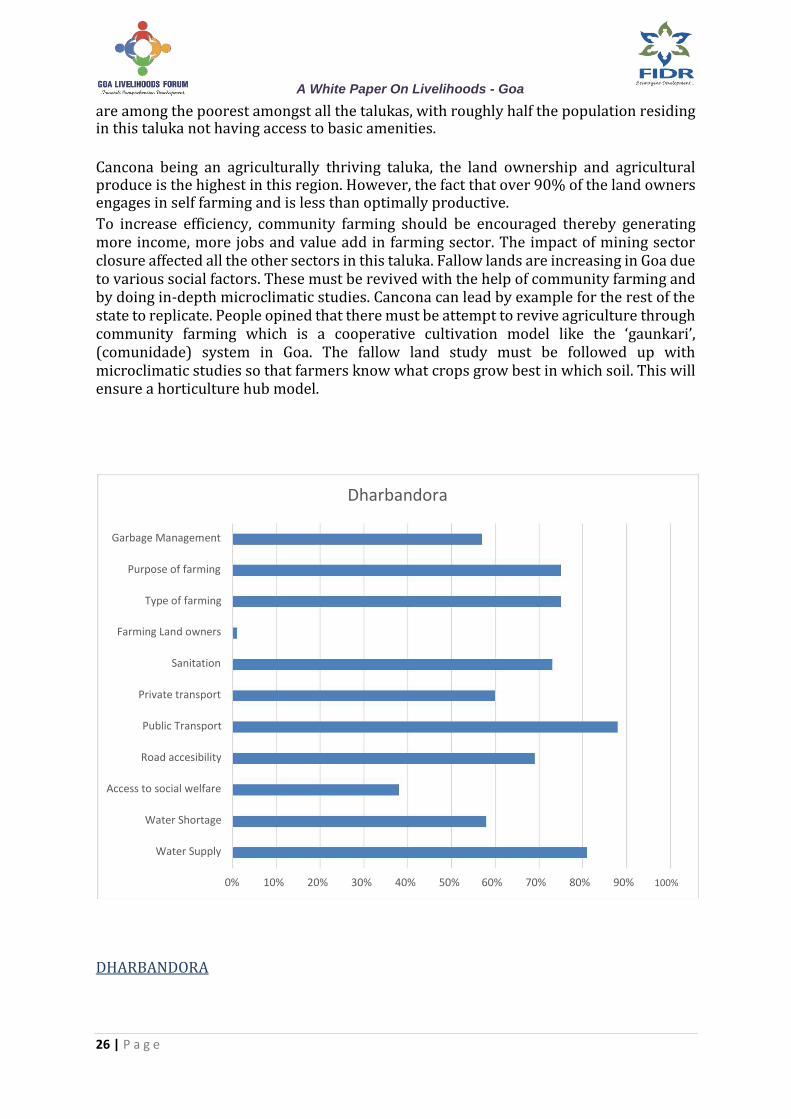
Dharbandora
Garbage Management
Purpose of farming
Type of farming
Farming Land owners
Sanitation
Private transport
Public Transport
Road accesibility
Access to social welfare
Water Shortage
Water Supply
0% 10% 20% 30% 40% 50% 60% 70% 80% 90% 100%
DHARBANDORA
26 | P a g e
A White Paper On Livelihoods - Goa
There’s a whole ecology In Dharbandora that is built around the mining industry – the
truck owners and drivers, the machine operators, truck mechanics, tyre retreaders and
truck spare part dealers, restaurants, traders of consumer durables – it’s a local economy,
reflective of the state’s trend. This being a prominent mining belt, we realised during our
assessment that this symbiotic economy has thrived solely on mining in the mining belt.
Mining shutdown has had a cascading effect on all types of trading activities in this area.
If truck owners are worried over how to repay their bank instalments, families of mining
dependent people are looking at a bleak and blank future.
Dharbandora has unique problems and specific to the particular region – water supply and water shortages are big problems in the taluka. Majority of the houses are still kutcha along with poor network of roads throughout this region.
In addition to these problems, accesses to welfare schemes provided by the government are very limited and so is the availability of adequate sanitation which calls for immediate action in several welfare sectors. Serious concerns were expressed by the respondents and the people urged for promoting different sectors of livelihoods.
Because post the mining closure, average incomes have fallen by nearly 42%. Only 1% of the villagers own land which highlights the severity of the problem in the taluka, as it was a solely mining dependent taluka of Goa.
Mormugao
Garbage Management
Purpose of farming
Type of farming
Farming Land owners
Sanitation
Private transport
Public Transport
Road accesibility
Access to social welfare
Water Shortage
Water Supply
0% 20% 40% 60% 80% 100% 120%
27 | P a g e

A White Paper On Livelihoods - Goa
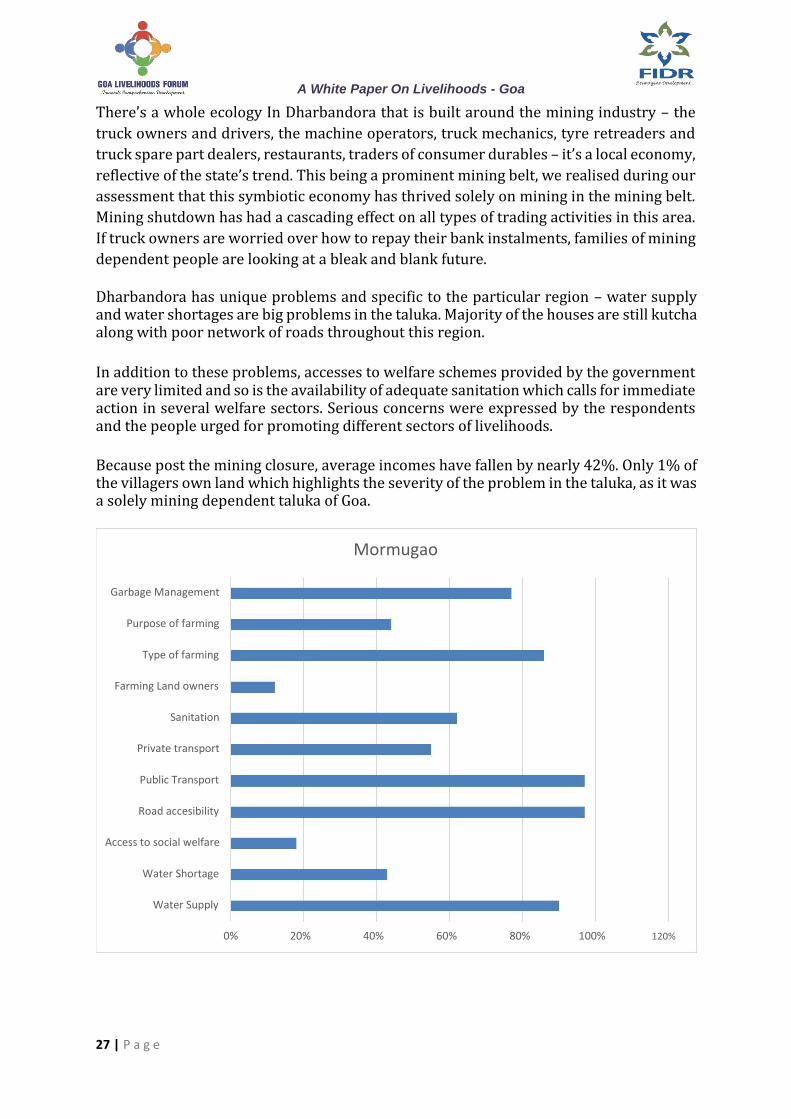
MORMUGAO
This is a relatively prosperous taluka of Goa and the numbers of kutcha houses are
much lower than the other talukas. Road accessibility, public transport and water
related facilities are present. But surprising is that only 18% people benefit from social
welfare schemes. Water shortage is being faced by approximately 47% residents and
only 66% people have access to the sanitation facilities. This reflects the lack of social
awareness in the various public welfare schemes.
The taluka was doing well economically, due to the presence of the port, cargo industry
and related activities. But after the closure of the mining activities, the income of the
people has gone down by 49%. Approximately 12% of residents own a farming land,
but most of the people were engaged in ports/mining related activities/employments.
The people also have very low savings – at about 17%. As far as the Mormugao Port is
concerned, Iron ore accounted for 80% of Mormugao port’s volumes, with about 700
ships calling at the port to pick up cargo.
This has been badly hit by the ban on iron ore mining, with some 2,600 employees and
about 4,000 pensioners facing an uncertain future.
The financial position of the Port is precarious because the current earning is about ₹ 10 crores per month without any iron ore" whereas the port needs about ₹ 15 crores a month for wages and pension liabilities. The Port is running a deficit of about ₹ 15 crores a month for general operating expenses including upkeep and maintenance of
the port. At this rate, the cash surplus will be depleted in another three months. In its
heyday, Mormugao, India’s top iron ore export port earned about ₹ 40 crores p from handling the steel-making commodity alone.
28 | P a g e

A White Paper On Livelihoods - Goa
Quepem
Garbage Management
Purpose of farming
Type of farming
Farming Land owners
Sanitation
Private transport
Public Transport
Road accesibility
Access to social welfare
Water Shortage
Water Supply
0% 20% 40% 60% 80% 100% 120%
QUEPEM
In terms of average income Quepem could be considered to be the least earning taluka. But the kind of houses, water resources and access to these water resources along with well-established and accessible roadways suggests that the people residing in this region may lack finances but benefit from public welfare programs.
One issue however which needs to be highlighted is the availability of proper sanitation facilities, as not everyone in this taluka has access to toilets. As far as livelihoods in this region are concerned the impact of the mining closure on this taluka seems to have been somewhat absorbed due to agriculture.
The respondents expressed their anguish over the high cost of living in this taluka. Average expenses are a lot higher than the other talukas, causing savings to be a lot lesser than any of the other talukas in Goa (less than 4% of income). There is a lack of banks in the local area to promote savings.
29 | P a g e

A White Paper On Livelihoods - Goa
Salcete
Garbage Management
Purpose of farming
Type of farming
Farming Land owners
Sanitation
Private transport
Public Transport
Road accesibility
Access to social welfare
Water Shortage
Water Supply
0% 20% 40% 60% 80% 100% 120%
SALCETE
The taluka has good road accessibility and public transport facilities. Residents of Salcete, mostly dwell in pucca houses i.e. 231 out of 260. Water supply in the region is good at about 91%. But 67% people have experienced water shortage. 63% people avail the facilities of social welfare schemes in the region.
Sanitation facilities still remain a suspect because only 61% have confirmed to having proper sanitation facilities. 73% have access to Garbage management facilities sand only 7% people hold farming land in this area. After the closure of mines, the income of people has gone down by over 40% and unemployment has spiralled. The savings of the residents is at 18% but clearly showing a downward trend.
The respondents requested for urgent resumption of mining activities in Goa and are scared that rising unemployment and joblessness might give rise to social evils, which would have a long-lasting damaging influence on the entire Goa society.
30 | P a g e

A White Paper On Livelihoods - Goa
Income Chart
180,000 160,000 140,000 120,000 100,000 80,000 60,000 40,000 20,000
-
Average Income Annual Expense Savings (as a % of total average income) Income post mining closure
Income determines the spending power of the households and is a major variable in determining the socio-economic status. A higher income has the capacity to meet the basic requirements as well as comforts of the people.
It aids people in satisfying most of their requirements. The amount of income earned depends on the number and nature of the economic activities practiced by an individual or a household. The household expenditure is useful in determining the socio-economic status of the households. High monthly expenditure indicates the capacity to spend more due to high income.
The monthly household expenditure includes consumption of food items, grocery, clothing, other apparels, payment of various bills and travelling expenses, but excludes financial liability such as loan. Savings determine the income earning capacity of the individual. Higher the income of the individual, higher is the savings and vice-versa.
The post ban period however, tremendously affected the mining dependent. Closing of mines left the labourers jobless, temporarily employed people were also jobless, trade and business witnessed a decline and some businesses had to be shut down.
The pre-mining phase has seen an increase in the incomes of the households, with a simultaneous increase in the monthly expenditure, savings according to the opinion of the people. The post mining phase has seen a decline in the monthly incomes thereby a decline in the monthly expenditure and savings.
31 | P a g e
A White Paper On Livelihoods - Goa
CONCLUSION
Majority of the respondents had a nostalgic view of their villages. And Goa villages are world famous for being peaceful havens where people live simple lives, where the air is pure and the land is green as far as the eye can see. Some of those images are indeed true, but the realities of day-to-day life for a great majority of rural people are nothing short of cruel. Gradually economic stress, social injustice and hopelessness is seeping in. From a town planning perspective, it is not that no strategies had been adopted by mining companies to address the externalities of mining development. But in most cases, people felt that broader community provisions should have been driven over the years, and implemented pragmatically by individual mining companies or the associations, in a more structured and collaborative manner, out of recognition for the need to secure mineworkers and key support service workers (i.e. doctors, teachers, etc.) for their local workforce.
Garbage management in about six (Bardez, Pernem, Bicholim, Sanguem, Cancona, Dharbandora) out of the twelve talukas is far below expectations of the habitants (almost less than 50%). The local government in partnership with corporates or expert groups need to implement projects of Solid Liquid waste Management in the talukas. Some of the talukas can take the benefit of the CSR programs of the corporates. MGNREGA, if applicable can be a conventional and yet a consistent way of disposing garbage and very economical, effective and eco-friendly. Funds provided under Mahatma Gandhi National Rural Employment Guarantee Scheme (MG-NREGS) or NREGA could be utilized for this kind of work. Swachh Bharat Mission Gramin (SBM-Gramin) also has an exclusive financial component for village sanitation.
Besides job creation and check the flow of migration, the scheme is expected to create sustainable assets for the village like drains, retaining walls, small link roads. If some of the MG-NREGA funds could be diverted towards solid waste management jobs can be created for the local unemployed people. This push towards waste management can help in making villages cleaner and garbage free and assist in constructing compost pits, purchasing hand carts to carry garbage, making organic compost, etc.
The respondents felt that a lot of garbage and wet waste was lying scattered in their villages, and the water bodies have been choked due to accumulation of polythene and there is no policy to manage all this.
It was found during the surveys that the dominant and highest priority issues identified were mostly those involving the community and the environment. A group of local activists opined that because of past issues, community concerns were that mining activities would damage the environment, with flow-on effects on livelihoods and health. Communities reported ignorance and said that that they were not getting the information they needed to understand the impacts of mine water-related issues. Although there is unbiased information available in the form of the scientific literature, it is not in a format that is accessible to them. During our group meetings and interactions with the communities it was suggested that the NGOs and the government should do more to provide simple, understandable and unbiased information to the community. It is not that Mining companies have not undertaken targeted interventions
32 | P a g e

A White Paper On Livelihoods - Goa
in the communities. They have worked in about 26 villages across five talukas with a goal to discharge the responsibility for the company’s operations and encourage a positive impact through its CSR interventions in the community. Key focus areas like health, education, agriculture and livelihood and infrastructure have been given priority. Over 30% of the respondents weren’t aware or didn’t mention as the top of mind recall the community interventions of the mining companies.
Water supply to the households is over 90% on an average in all the talukas. However, about half or more of the respondents in certain areas, report water shortage. In Talukas like Ponda, Bicholim, Sanguem, Cancona, Dharbandora, Mormugao, Salcete, about 60% of the respondents experienced water shortage – lack access to clean, affordable water within half an hour of their homes or in the general supply. Providing water is not only vital to human safety and security but has huge social and economic benefits too. Children lose out on education and adults on work when they are sick from easily preventable diseases. Providing affordable water and in general supply by the government (in most of the talukas water supply is over 90%) saves lives and reduces the burden on healthcare, as well as freeing up economic resources.
It was good to note that the general population and specifically the youth are aware that climate change is bringing droughts and heat waves across the country, as well as floods and sea level rises in coastal areas in India. The respondents lamented that pollution is increasing and the depletion of groundwater aquifers are, in many places making the water more saline.
In the mining belt, the respondents felt that competing demands for water means that those who are poorer or marginalised find it more difficult to get water than the rich and the growing number of migrants aggravates the situation. They also said that the government is prioritising agriculture and industry over people, while turning a blind eye to polluters and those who over-extract water from underground sources. Sharing access to water equitably requires good governance, tight regulation, investment and enforcement, all the elements which can be driven by the civil society organisations.
Nearly one-third of Goa’s access to social welfare is less than 30% and the people and households live without access to wider social protection (social welfare) systems. Promoting the dignity and worth of peoples, it is time to rethink what social protection means, and how it can be reshaped to enable the dignity and worth of all. Because of the high per capita income in Goa and the standard of living, which is now sliding down fast, the Goa communities are often ‘excluded’ from the social protection programs because they lag in basic eligibility criteria. During the survey, the team met a few community leaders who are at the heart of social protection systems. They explained that for them, a social protection system is not just a government cash transfer scheme, benefits for those who are unemployed, or access to healthcare or schools. A social work understanding based on experiences of working with people in distress and poverty can help design the role and potential of social protection systems, making it Goa specific. It was clear from the interactions that not many had anticipated this kind of an economic downturn.
33 | P a g e

A White Paper On Livelihoods - Goa
There are community workers whom the team met and they emphasised that, the “starting points are family and community structures”. These have enabled people to survive against challenges over the years. They need to be recognised as the basis upon which all other aspects of social protection should be built, more so for Goa because of the demographic mix. And also, that they inadvertently replace these organic systems of care with top-down programmes that over time, move people away from the intergenerational knowledge and wisdom that have supported their wellbeing for so long.
There are, of course, limits to what families and communities can offer. Many traditional family structures surviving without (without access to wider, empowering social protection systems) negate the rights and freedoms of women. These nuances need to be considered while we examine the reach of social protection programs in Goa. Specifically, talukas like Ponda, Bicholim, Dharbandora and Mormugao, which are mining related industrial areas, have witnessed very less penetration or utilisation of public social protection schemes. It is surprising because with the help of the companies, the community development programs could have been better targeted.
But the respondents are aware of the government’s initiatives in sectors like agriculture. One local Sarpanch mentioned that the government is encouraging community farming and is collecting soil database which would be very useful in providing exhaustive information not only for farmers but also for the planners, executors and administrators. It has its relevance not only in agriculture but also for other allied activities like irrigation, soil conservation, water harvesting, and forestry, horticulture, floriculture and landscape developer.
The road infrastructure in Goa is one of the most developed in the country. And the citizens’ access to the infrastructure, public transport is well over 80%, which means that most people have the infrastructure, the access and the utilisation. But many respondents spoke about the Khazan which is the network of agricultural lands and lakes that works as passage to its nine major rivers and their tributaries (more than 40). This wetland system is called Khazan.
The Khazan system depends on embankments (bundhs) which are built with mud and laterite stones, drainage canals and sluice gates that, along with estuaries and mangrove areas, restrict tidal waves to ingress and this also helps regulate the flow of rain and river water. The respondents strongly expressed their displeasure in the fact that Goa is rapidly moving away from agriculture and fishing and promoting tourism and in the process maintenance of the bundhs and sluice gates has not been given priority. Experts have estimated that around 80,000 jobs and annual revenue up to Rs 150 crore depend on Khazan lands. Moreover, there is resentment among people that the Khazan lands are now being used for infrastructure development and there is this perception the ancient, ecology and agriculture friendly system is being threatened.
Contrary to many other parts of the country, Goa’s public transport system caters to most of Goa’s population and is optimally utilised by the people. People with private vehicle(s) also use public transport which is a good example for other states. In Goa the private operators do not necessarily provide better services than public undertakings.
34 | P a g e

A White Paper On Livelihoods - Goa
The Kadamba Transport Corporation (KTC) services reach to all nooks and corner of the state is perceived to be better than the private bus operators in Goa and KTC outscores on almost every count. This is an example of a successful state transport undertaking which has not been privatized. Though the private operators have more than twice the number of vehicles, yet their services are not rated better than the KTC’s. But what is surprising is the fact that on an average, more than 80% of Goa population has equal access to both public and private transport.
Barring Sattari area (where the access to both public and private transport shows a downswing) the rest of the state has the advantage of good roads infrastructure and large number of private vehicle ownership too. The state had a road density of more than 68.7 km per 1,000 sq. km of area, in 2018. For short distances, youth and women have two-wheelers at their disposal. The general law and order situation on the roads and even in the rural and urban areas makes it safe for them to use their own vehicles (mostly two wheelers). The River Navigation Department has also been established to provide safe, dependable & affordable transport facilities on ferry routes of Goa’s inland waters.
Once upon a time, and not so long ago, about 5 years back, Goa topped the country in household quality of life at 16.2, ahead of Gujarat's index of 13.2. This index is defined by a combination of basic amenities, quality of housing and ownership of assets. The census established Goans as being India's biggest electricity consumers (96.9 per cent), LPG users (89.9 per cent) and computer owners (31.1 per cent). Around the same time, Goa witnessed high growth in household savings and was one of the few states where inflation declined. Deposits of scheduled commercial banks per person grew by 8 per cent between 2011 and 2013 while average growth in small states was only 4 per cent. Affluent urban households grew by 10 per cent between 2009 and 2012 while average growth in other small states was less than 5 per cent. Increase in domestic tourists & the mining boom helped raise the per capita income to over twice the amount by 2011 (even in the year 2000-01 it was stated to be highest in the country at Rs 45,105.
But since the closure of the mining in Goa the per capita income of Goa has slid down by about half from ₹375,554. Th it is bad news for Goa because the decrease in per capita income has been alarming.
Stoppage of iron ore mining in Goa has impacted revenues worth over Rs 34 billion and the livelihoods of several dependent segments have been affected due to ceasing of mining activities. It has left the stakeholders of the industry without any alternate sources of income. The savings of the households have dipped drastically after the closure of the mines. Not confined to only the mining talukas, the income and savings have been severely hit, exceeding well over 40% in most of the cases.
Stoppage of mining has resulted in loss of direct and indirect employment and has affected over 300000 households in Goa. Alongside, there is threat to increase of non-performing assets (NPA) for banks as entities in the mining machinery; trucks etc. have lost their earning potential. This has put a burden on the financial institutions. Presently it has given rise to fermenting social evils due to hopelessness amongst the people facing grave economic crisis. The total contribution of mining and its activities to Goa's state gross domestic product (GDP) has been much over 15 percent.
35 | P a g e

A White Paper On Livelihoods - Goa
The stoppage of mining in the state has not only caused revenue damage and job loss within the state but has also led to major loss of investor confidence which would have a long-term negative impact on Goa's economy. The survey results clearly demonstrated a sense of all-round glom in the state economy and social life. For two consecutive years, the Goa government, in its annual budgets has conceded that around 20% of its GDP decline is attributable to mining. The economic survey shows that Goa earned Rs 244.9 crores just as royalty in 2016-17 from iron ore extraction and exports. Since 2015, the state has collected Rs 118.7 crores for Goa Mineral Ore Permanent Fund
The loss of livelihoods in Goa need not necessarily show in abject poverty because the economy of the state has always been able to take care of the sustainability and provision of basic living conditions for the people. But the deep cut in the per capita income is a body blow to the income of the people. The closure of mining has dealt a devastating blow to the livelihoods of people which includes both in mining and non-mining areas. Agriculture, art & craft, tourism and all allied industries have suffered because of suspension of mining activities.
The state has prepared a vision 2025 document which envisions doubling of farmer’s income by 2022 and substantial increase in the GDP from agriculture and allied sector. Various schemes are proposed to promote agricultural mechanization to overcome shortage and high cost of manual labour. The incentives and schemes include custom services of agricultural machineries including mechanised paddy transplanter, assistance for agricultural machinery and equipment, special assistance for maintenance of tractor, one-time assistance for removal of bushes and weeds, assistance for land levelling and the like. But the returns from agriculture are seasonal and less lucrative in comparison to mining income. And the landholding of farmers, which we observed during the assessment is less and not surprisingly during the year 2017-18 till December, only 18809 farmers (out of the total population of about 1.6 million) have been benefitted with all the incentives mentioned above. And 421.31 MT of vegetables and 7.59 M. Tonnes of fruits cultivated amounting to about Rs 145.50 lakh were procured from 739 farmers through Goa State Horticultural Corporation Limited to promote their cultivation. The average milk collection has been 66,000 litres/day in 2016-17.
With the purchase of 1395 animals, it has recently gone up to 72,000 litres/day. This shows the low scale of operations in agriculture and the ensuing income.
The psychological and social costs of prolonged unemployment post the ban on mining in Goa has impacted harshly on the quality of life of affected individuals and families. Experiences of low self-esteem and loss of self-identity impact on physical and mental health and can extend to broader consequences of social isolation and the loss of social networks and support. The impact of redundancy causes family disruption and breakdown. At the very least it reduces people’s sense of membership and contribution to the life of the community.
This savage impact can foster suicidal tendencies, marriage breakdowns, drug and alcohol abuse and much more. Loss of self-esteem and confidence resulting from job loss can operate as barriers to re-employment. For many people, work provides a social
36 | P a g e

A White Paper On Livelihoods - Goa
network and often a reason for social interaction. Loss of income also limits the ability of people to attend social outings. Self-esteem and confidence were reported as being lost more quickly by mature-age job seekers than job seekers in other age groups.
Much of the disturbance or stress placed on relationships was attributed to the changing of the breadwinner role between partners, which for mature-age couples, is often traditionally held by males. A feeling of depression sets in and they tend to display a lot of anger towards society. Wives, partners and families are left to cope with a “changed person”. Recent research indicates that the cause of a substantial number of divorces and relationship break-ups in the 40 and over age group can be traced back to the male losing his job and his perceived role as the main provider for the family.
Not only is there a greater reliance on income support but the skill level of workers who have difficulties getting another job may fall, which is a loss to the economy. The health consequences of unemployment result in a greater strain on the health system. Regional and rural areas may experience particularly severe economic upheaval. Unemployment has been known to induce substance abuse. Goa has been hit with similar aspects of increased alcoholism leading to family upheavals and higher reported cases of domestic violence as a result of the same.
In one our conversations with a school teacher in Dharbandora, he mentioned that, “the relationship between economic growth, human well-being, and the achievement of a sustainable future are closely interlinked.” Over 82% of the respondents opined that in the near future the economy of the state would be further damaged due to the mining imbroglio. They also mentioned that youth out migration is high but would be much higher in the coming months and Goa would be a state with much of the youth and next generation absent. So they asked whether all the development is worth it and are meant for whom, if the people start migrating. A sustainable future will come into being if the biophysical and social conditions needed to support economic activity and human flourishing are maintained from each generation to the next.
Mining had helped build a SME (small and medium enterprises) of truckers, machine
contractors and owners of river barges. But mining closure has resulted in truckers and
barge-owners burdened with bank debts. Mining and related transportation and mobility
industry (including mechanics/garages, maintenance, drivers, support staff) had
galvanised downstream establishments catering to well over 25,000 trucks, machinery,
barge building industries and a large contingent of contract workers, creating a ripple
effect on the economy of those areas, and indirectly providing employment to 1.5 lakh
according to government estimates (only belonging to the allied industries and
occupations). These people have since fallen back on an agrarian and high risk and
vulnerable job economy, with all but the more hopeful waiting for resumption (about
68% of our respondents).
During our assessment, we have noticed groundswell in favour of resuming or protecting the livelihoods of people cutting across talukas, villages and other
37 | P a g e

A White Paper On Livelihoods - Goa
alignments. It has come out clear from this assessment that mining closure has not only
affected the mining areas and their economies and households. The embargo on mining
has affected the economy of the entire state. People groups from all over the state have
been demanding – from Panchayat onwards, the resumption of mining. Pro-mining
agitators have protested even in the national capital demanding the resumption of mining
which was banned on orders of the Supreme Court. The protests have been aimed at
getting the attention of MPs at the winter session of Parliament. The demand has been to
“amend the Mines and Minerals (Development and Regulation) Act which will allow
existing mining leases to be renewed faster, instead of auctioning them which will take
time,". As Digambar Naik, Navelim, who was in the protest told us "the mining ban has
brought about tremendous hardships to the people of Goa and we had been to Panjim,
Delhi and everywhere to highlight that to the MPs, so that they move an amendment in
the current Parliament session." The political leaders of various parties have also
participated in the protests.
38 | P a g e

A White Paper On Livelihoods- Goa
Appendix 1
Bardez
Basic Details
Number
19
30
95
69
08
0
51
65
2
50
98
8
47
83
3
47
34
2
24
07
9
24
00
7
2543
2
25
13
1
1006
38
9831
3
13
%4
8.
97
%4
8.
7749
35
46
9
2656
1541
5902
2152
51
6
247
12
62
9
18
01
2
6277
8
61
94
4
3352
0 133
592
65
55
5
87
74
3
Hou
seho
ld
Mal
e
Fem
ale
Boy
s
Gir
ls
Mal
e
Fem
ale
Mal
e
Fem
ale
Mal
e
Fem
ale
Mal
e
Fem
ale
JOB
LAB
OU
R
AN
TD
AN
NP
OA
P
WP
DP
RSBY
GA
S
IAY/
PMAY
Bu
llock
Co
w
Bu
ffal
o
Go
at
Shee
p
Hen
Oth
ers
Population Population Adult Edu. Child Edu. Total Literacy Welfare Scheme Livestock 18+ 0-18 Population
39 | P a g e

A White Paper On Livelihoods- Goa
Infrastructure
Number
56628
50305
44357
35961 35960
28345 28346
4792 4792
45 46 69 102 112 33 19 41 29 84 10 18 24 74
40 | P a g e

A White Paper On Livelihoods- Goa
Economic Development
Series1
1 1
0
Soil Testing Center Government Seed Fertilizer Shop Center
Distribution
Agriculture
Total Area (in Hect) Net Sown Area (in Hect) Un Irrigated Irrigated
9737718.1 9680368
50583 6348
1
Women Empowerment
Series1
8609
6774
4498
3084
554 209
No Of SHG No. of No. of No. of SHG No of No of Household Household accessed Bank household household mobilized for mobilized for Loans supported by supported by
SHG PG Village based Village based
Agriculture Livestock
Revenue
Agriculture Livestock Welfare Scheme
12%
44%
44%
41 | P a g e

18
42
7
12
2
4966
3816
4608
3134
1273
1525
311
A W
hite
3491
Paper 2295
751
th On
6541
-Livelihoods
165
10940
22020
Goa 688
20776
1830
3980
1234
0
0
14191
10422
14371
2975
12360
3500
672
6390

A White Paper On Livelihoods- Goa
Bicholim:
Basic Details
Number
45
58
2
3 5 3 6 4
3 4 6 6 7 37
40
6
16
93
6
17
69
0
17
70
4
1684
6
16
98
6
13
85
2
17
52
4
17
99
9
17
99
1
15
81
5
7969
7798
8596
8840
84
%4
6.
47
.95
%
2285
497
23
5 30
12
11
82
11
9
24
1000
3143
5872
Hou
seho
ld
Mal
e
Fem
ale
Boy
s
Gir
ls
Mal
e
Fem
ale
Mal
e
Fem
ale
Mal
e
Fem
ale
Mal
e
Fem
ale
JOB
LAB
OU
R
AN
TD
AN
NP
OA
P
WP
DP
RSB
Y
GA
S
IAY/
PMA
Y
Bul
lock
Cow
Buf
falo
Goat
Shee
p
Hen
Oth
ers
Population Population Adult Edu. Child Edu. Total Literacy Welfare Scheme Livestock 18+ 0-18 Population
43 | P a g e

A White Paper On Livelihoods- Goa
Infrastructure
Number
12590 11895
11348
8040 8040 7337 7337
1579 1579
11 9 34 48 51 19 1 24 17 43 4 16 1 33
44 | P a g e

A White Paper On Livelihoods- Goa
Economic Development Women Empowerment
Series1 Series1
5471
1802
844
579 177 531
No Of SHG No. of No. of No. of SHG No of No of 0 0 0 Household Household accessed Bank household household mobilized for mobilized for Loans supported by supported by
Soil Testing Center Government Seed Fertilizer Shop Center
SHG PG Village based Village based
Distribution Agriculture Livestock
Agriculture Revenue
Total Area (in Hect) Net Sown Area (in Hect) Un Irrigated Irrigated
Agriculture Livestock Welfare Scheme
21151 8%
10168 35%
7701
57%
2128
1
45 | P a g e

A White Paper On Livelihoods- Goa
Health Nutrition
Number
7964
5579 5435
5817
5102
4316
2816
3240 2658 2232
1843 2056
1909
1409 1279 1277
647
956 400 394
69 175
87
4 24 0 0 0 10 41 25 0 0 53
46 | P a g e
A White Paper On Livelihoods- Goa
Pernem:
Basic Details
Number
51
90
9
35
01
9
3 3 1 8 7 40
75
9
18
25
4
1751
8
1639
1
1668
0
16
82
0
7891
7217
8515
8751
7
3%
45
.
47
.18
%
2126
1282
7
473
21
7
2635
1015
11
5
26
88
9
3457
18
92
7
18
42
1
6875
1864
0
17
53
8
Hou
seho
ld
Mal
e
Fem
ale
Boy
s
Gir
ls
Mal
e
Fem
ale
Mal
e
Fem
ale
Mal
e
Fem
ale
Mal
e
Fem
ale
JOB
LAB
OU
R
AN
TD
AN
NP
OA
P
WP
DP
RSB
Y
GA
S
IAY/
PMAY
Bu
llock
Cow
Bu
ffal
o
Goat
Shee
p
Hen
Oth
ers
Population Population Adult Edu. Child Edu. Total Literacy Welfare Scheme Livestock 18+ 0-18 Population
47 | P a g e

11165
A White Paper On Livelihoods- Goa
Infrastructure
Number
17100
11471
9005 8482
9005 8482
787 787
13 14 23 36 52 24 8 24 19 42 6 18 5 46
48 | P a g e

A White Paper On Livelihoods- Goa
Economic Development
Series1
6
1
0
Soil Testing Center Government Seed Fertilizer Shop Center
Distribution
Women Empowerment
Series1
5616
3720
2248
1303 449
69
No Of SHG No. of No. of No. of SHG No of No of Household Household accessed household household
mobilized for mobilized for Bank Loans supported by supported by SHG PG Village based Village based
Agriculture Livestock
Agriculture Revenue
Total Area (in Hect) Net Sown Area (in Hect) Un Irrigated Irrigated
Agriculture
8%
20248
10487 9832 Welfare Livestock
39%
Scheme
2461 53%
1
49 | P a g e

A White Paper On Livelihoods- Goa
Health Nutrition
Number
7 7 5 4
5649
5429
5292
5659
4201
3286
1
23
0
0
0
2116
1773
19
57
15
17
16
3
10
00
56
13
86
96
5
13
5
2114
3 5 99
63
1
26
39
4
0
0
93
0
38
4
50
1374
50 | P a g e
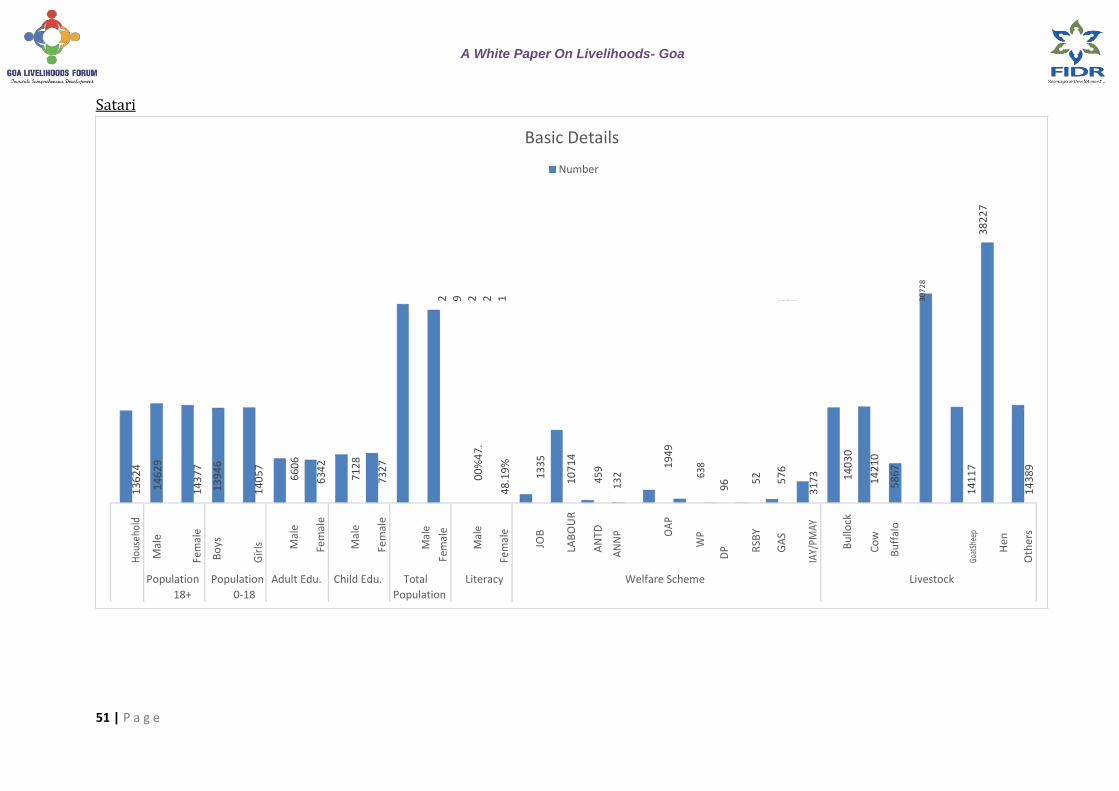
A White Paper On Livelihoods- Goa
Satari
Basic Details
Number
38
22
7
2 9 2 2 1
2 8 3 6 7 30
72
8
13
62
4
14
62
9
14
37
7
13
94
6
14
05
7
6606
6342
7128
7327
0
0%
47
.
48
.19
%
1335
10
71
4
45
9
13
2 19
49
638
96 52
57
6
3173
14
03
0
14
21
0
5867
14
11
7
14
38
9
Hou
seho
ld
Mal
e
Fem
ale
Bo
ys
Gir
ls
Mal
e
Fem
ale
Mal
e
Fem
ale
Mal
e
Fem
ale
Mal
e
Fem
ale
JOB
LAB
OU
R
AN
TD
AN
NP
OA
P
WP
DP
RSB
Y
GA
S
IAY/
PMA
Y
Bu
llock
Co
w
Bu
ffal
o
Goat
Shee
p
Hen
Oth
ers
Population Population Adult Edu. Child Edu. Total Literacy Welfare Scheme Livestock 18+ 0-18 Population
51 | P a g e

A White Paper On Livelihoods- Goa
Infrastructure
Number
10224
8572
7702
6618 6618
5949 5949
1111 1111
8 6 64 14 121 26 1 66 18 77 3 24 7 86
52 | P a g e

A White Paper On Livelihoods- Goa
Economic Development Women Empowerment
Series1 Series1
1781 1425
2
1391
1 1 159
338 49
No Of SHG No. of No. of No. of SHG No of No of Household Household accessed Bank household household
Soil Testing Center Government Seed mobilized for mobilized for Loans supported by supported by
Fertilizer Shop Center SHG PG Village based Village based
Distribution Agriculture Livestock
Agriculture
Total Area (in Hect) Net Sown Area (in Hect) Un Irrigated Irrigated 47213
16251 14185
2554
1
Revenue
Agriculture
Welfare 16%
Scheme
43%
Livestock 41%
53 | P a g e

A White Paper On Livelihoods- Goa
Health Nutrition
Number
2
65
5
4 6 0 1 4598
44 81
4791
3558
5
60
0
0
0
23
22
1614
17
16
1407
48
3
1175
94
1540
1074
17
3
1836
78
26 79
10
8
55
8
72
35
4
0
0
80
9
35
0
80
11
80
54 | P a g e
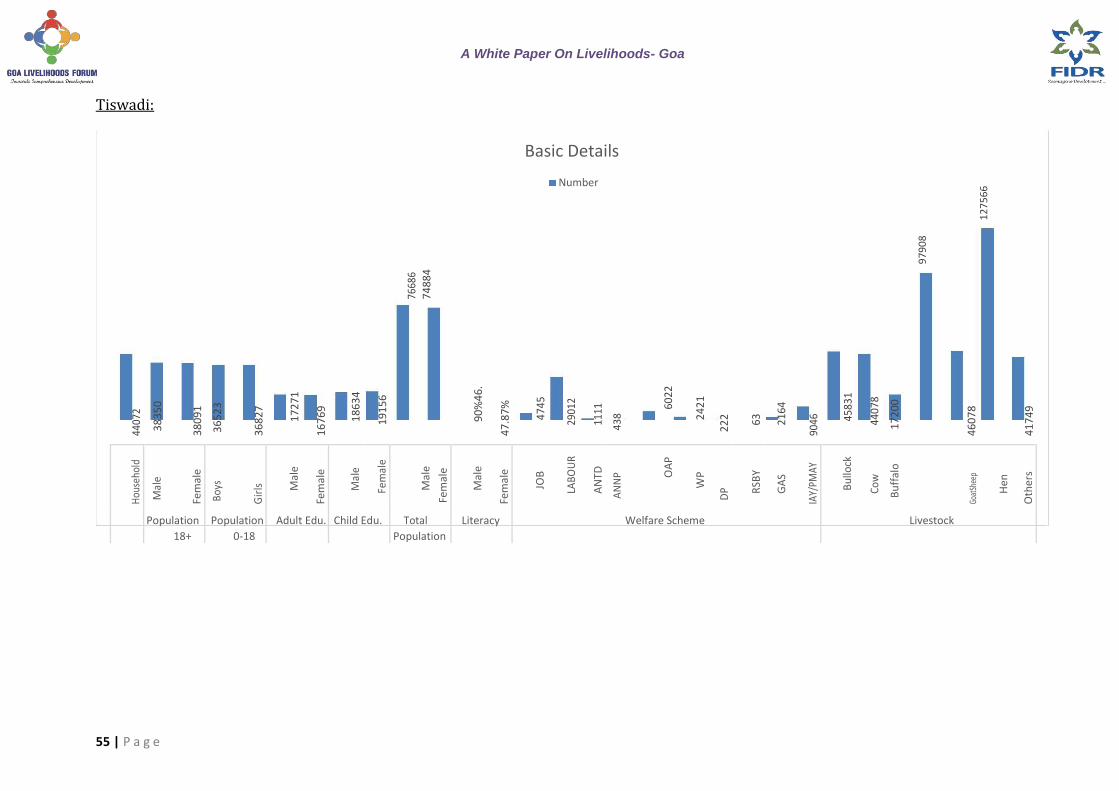
A White Paper On Livelihoods- Goa
Tiswadi:
Basic Details
Number
7668
6
74
88
4
12
75
66
97
90
8
4407
2
38
35
0
38
09
1
36
52
3
36
82
7
17
27
1
16
76
9
18
63
4
19
15
6
90
%4
6.
47
.87
%
4745
2901
2
1111
43
8 60
22
24
21
22
2
63
2164
9046
4583
1
4407
8
17
20
0
46
07
8
41
74
9
Hou
seho
ld
Mal
e
Fem
ale
Boy
s
Gir
ls
Mal
e
Fem
ale
Mal
e
Fem
ale
Mal
e
Fem
ale
Mal
e
Fem
ale
JOB
LAB
OU
R
AN
TD
AN
NP
OA
P
WP
DP
RSB
Y
GA
S
IAY/
PMAY
Bu
llock
Cow
Bu
ffal
o
Goat
Shee
p
Hen
Oth
ers
Population Population Adult Edu. Child Edu. Total Literacy Welfare Scheme Livestock 18+ 0-18 Population
55 | P a g e

A White Paper On Livelihoods- Goa
Infrastructure
Number
41032
35100
25790
21883 21225
21883 21225
22 26 43 26 63 25 15 35 986 986
16 44 1 19 3 69
56 | P a g e
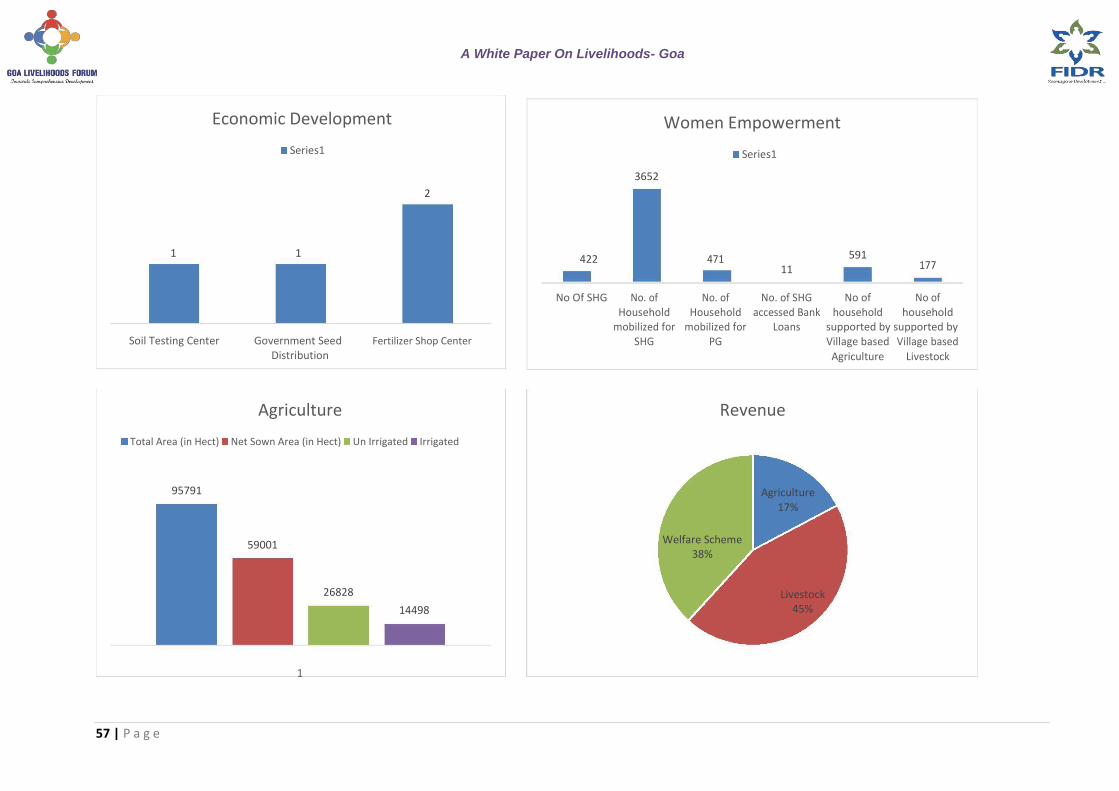
A White Paper On Livelihoods- Goa
Economic Development
Series1
2
1 1
Soil Testing Center Government Seed Fertilizer Shop Center
Distribution
Agriculture
Total Area (in Hect) Net Sown Area (in Hect) Un Irrigated Irrigated
95791
59001
26828
14498
Women Empowerment
Series1
3652
422 471 11
591 177
No Of SHG No. of No. of No. of SHG No of No of Household Household accessed Bank household household mobilized for mobilized for Loans supported by supported by SHG PG Village based Village based
Agriculture Livestock
Revenue
Agriculture 17%
Welfare Scheme
38%
Livestock 45%
1
57 | P a g e

A White Paper On Livelihoods- Goa
Health Nutrition
Number
90
1
67
3
27
1
4
11
75
6
1145
9
12
26
0
9093
9
0
3
7
10
42
0
0
0
3666
3309
3434
2827
1036
1886
90
2398
1667
22
9
5103
5 8 22
8
1360
46
83
8
0
0
20
09
82
3
10
1
2964
58 | P a g e
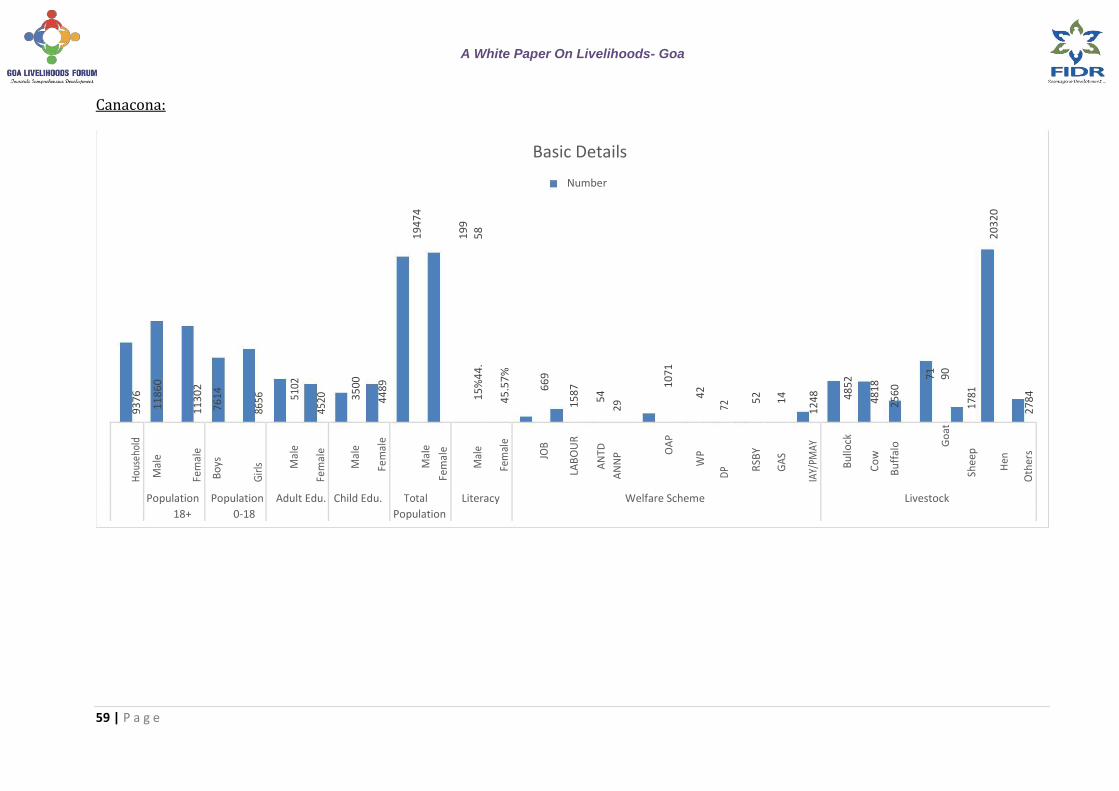
A White Paper On Livelihoods- Goa
Canacona:
Basic Details
Number
19
47
4
19
9
58
20
32
0
9376
11
86
0
11
30
2
7614
8656
5102
4520
3500
4489
15
%4
4.
45
.57
%
66
9
1587
54
29
1071
42
72 52
14
1248
4852
4818
2560
71 90
1781
2784
Hou
seho
ld
Mal
e
Fem
ale
Bo
ys
Gir
ls
Mal
e
Fem
ale
Mal
e
Fem
ale
Mal
e
Fem
ale
Mal
e
Fem
ale
JOB
LAB
OU
R
AN
TD
AN
NP
OA
P
WP
DP R
SBY
GA
S
IAY/
PMAY
Bu
llock
Co
w
Bu
ffal
o Go
at
Shee
p
Hen
Oth
ers
Population Population Adult Edu. Child Edu. Total Literacy Welfare Scheme Livestock 18+ 0-18 Population
59 | P a g e

A White Paper On Livelihoods- Goa
Infrastructure
Number
7657
5841
4319
3953 3953
3276 3276
2147 2147
6 5 7 8 14 6 1 7 6 13 0 6 2 8
60 | P a g e

A White Paper On Livelihoods- Goa
Economic Development
Series1
1
0 0
Soil Testing Center Government Seed Fertilizer Shop Center
Distribution
Women Empowerment
Series1 2358
221 33 39 120 0
No Of SHG No. of No. of No. of SHG No of No of Household Household accessed household household mobilized for mobilized for Bank Loans supported by supported by
SHG PG Village based Village based
Agriculture Livestock
Agriculture
Total Area (in Hect) Net Sown Area (in Hect) Un Irrigated Irrigated 33301.34
13264.72 13693.13
110.12
1
Revenue
Welfare Scheme Agriculture
26% 32%
Livestock 42%
61 | P a g e

A White Paper On Livelihoods- Goa
Health Nutrition
Number
1954
1729
1476 1351
986
803 829 791
488
605 634 533
428
286 251
181 211 99 151 117
1 8 1 1 1
22 33 70 16 32 0
0 0 0
62 | P a g e

A White Paper On Livelihoods- Goa
Dharbandora:
Basic Details
Number
13
37
0
12
96
5
1160
4
61
17
7967
7458
5403
5507
3427
2980
24
81
2861
Hou
seho
ld
Mal
e
Fem
ale
Boy
s
Gir
ls
Mal
e
Fem
ale
Mal
e
Fem
ale
M
ale
Fem
ale
Population Population Adult Edu. Child Edu. Total 18+ 0-18 Population
33
%4
2.
44
.12
%
42
6
85
3
84
11
3
46
4
10
4
14
9
78
21
70
3 26
72
1666
3021
40 46
1000
18
87
Mal
e
Fem
ale
JOB
LAB
OU
R
AN
TD
AN
NP
OA
P
WP
DP
RSB
Y
GA
S
IAY/
PMA
Y
Bul
lock
Cow
Buf
falo
Goa
t
She
ep
Hen
Oth
ers
Literacy Welfare Scheme Livestock
63 | P a g e

A White Paper On Livelihoods- Goa
Infrastructure
Number
4925
4025 3860
3418 3418
1862 1862
837 837
6 7 14 7 20 9 2 16 6 20 2 6 4 17
64 | P a g e

A White Paper On Livelihoods- Goa
Economic Development Women Empowerment Series1 4000
3500
3669
3000
2500
2000
1500
1000
264 712 242 519 96
500
0
No Of SHG No. of No. of No. of SHG No of No of
Household Household accessed household household 0 0 0 mobilized mobilized Bank Loans supported supported
for SHG for PG
by Village by Village
Soil Testing Center Government Seed Fertilizer Shop Center
based based
Distribution Agriculture Livestock
Agriculture Revenue
Total Area (in Hect) Net Sown Area (in Hect) Un Irrigated Irrigated
36472.76
Welfare
Scheme 22% Agriculture
14359.4
49%
Livestock
6568.63 29%
1496.76
1
65 | P a g e

A White Paper On Livelihoods- Goa
Health Nutrition
Number
2051
1242
1019
662 638
768 619
490 441
420
511
334
298
305
264
122 72 84 88 125
1 13 0 0 0 52 56 12 47 11 23 0 0 2
66 | P a g e

A White Paper On Livelihoods- Goa
Mormugao:
Basic Details
Number
32
66
7
29
63
7
34
48
1
21
54
7
20
61
2
16
32
7
11
12
0
902
5
9272
8244
5119
4696
09
%4
4
.
43
.98
%
1460
1933
65
96
20
13
91
106 64
23
2361
10
37
8
8965
6590
13
27
9
3290
5870
Hou
seho
ld
Mal
e
Fem
ale
Bo
ys G
irls
Mal
e
Fem
ale
Mal
e
Fem
ale
Mal
e
Fem
ale
Mal
e
Fem
ale JO
B
LAB
OU
R
AN
TD
AN
NP
OA
P
WP
DP R
SBY
GA
S
IAY/
PMAY
Bu
llock
Co
w
Bu
ffal
o
Go
at
Shee
p
Hen
Oth
ers
Population Population Adult Edu. Child Edu. Total Literacy Welfare Scheme Livestock 18+ 0-18 Population
67 | P a g e

A White Paper On Livelihoods- Goa
Infrastructure
Number
13626
12565
10926
8397 8397
4560 4560
3370 3370
9 9 13 5 18 7 4 13 6 11 1 6 2 21
68 | P a g e

A White Paper On Livelihoods- Goa
Economic Development
Series1
1 1
0
Soil Testing Center Government Seed Fertilizer Shop Center
Distribution
Agriculture
Total Area (in Hect) Net Sown Area (in Hect) Un Irrigated Irrigated
3521725.6
1784376.09 1733690.77
335535.87
Women Empowerment Series1
468 453
204
45
108
7
No Of SHG No. of No. of No. of SHG No of No of Household Household accessed household household
mobilized for mobilized for Bank Loans supported by supported by
SHG PG Village based Village based
Agriculture Livestock
Welfare Scheme Revenue Livestock
0% 1%
Agriculture 99%
1
69 | P a g e

A White Paper On Livelihoods- Goa
Health Nutrition
Number
5288
3203 3183
1579 1579 1391
1616
1020 889 1064 1105 982 840
483
287 173 399 562
1 12 0 0 0 58 154 30 39 216 62 63 0 0 222 2
70 | P a g e

A White Paper On Livelihoods- Goa
Ponda:
Basic Details
Number
73
62
0
7229
0
68
87
9
8
3556
6
3788
8
3440
2
26
79
2
20
15
1
15
15
7
12
32
2
17
82
5
18
45
1
13
12
7
21
56
8 2 3 8 9 3
13
97
7
44%
46%
2887
5501
184
19
9 26
85
16
0
27
7
10
9
39
3404
5917
Hou
seho
l
d
Mal
e
Fem
ale
Boy
s
Gir
ls
Mal
e
Fem
ale
Mal
e
Fem
ale
Mal
e
Fem
ale
Mal
e
Fem
ale
JOB
LAB
OU
R
AN
TD
AN
NP
OA
P
WP
DP
RSB
Y
GA
S
IAY/
PMA
Y
Bul
lock
Cow
Buf
falo
Goa
t
She
ep
Hen
Oth
ers
Population Population Adult Edu. Child Edu. Total Literacy Welfare Scheme Livestock 18+ 0-18 Population
71 | P a g e
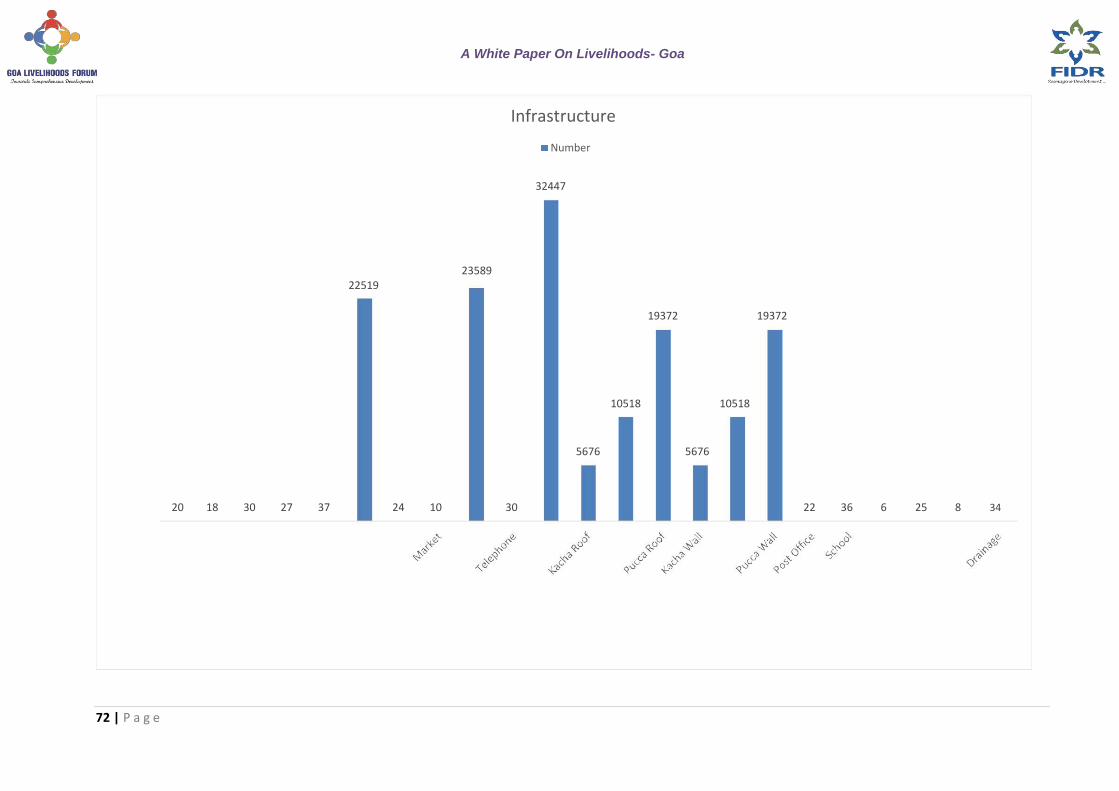
A White Paper On Livelihoods- Goa
Infrastructure
Number
32447
23589
22519
19372 19372
10518 10518
5676 5676
20 18 30 27 37 24 10 30 22 36 6 25 8 34
72 | P a g e

A White Paper On Livelihoods- Goa
Economic Development Women Empowerment
Series1
6
5985
Series1
2778
491
1329
2 2 179 591
No Of SHG No. of No. of No. of SHG No of No of Household Household accessed Bank household household mobilized for mobilized for Loans supported by supported by Soil Testing Center Government Seed Fertilizer Shop Center SHG PG Village based Village based
Distribution Agriculture Livestock
Agriculture
Total Area (in Hect) Net Sown Area (in Hect) Un Irrigated Irrigated 32727
10612 10802
6477
Revenue
Welfare Agriculture Scheme 17%
30%
Livestock
53%
1
73 | P a g e

A White Paper On Livelihoods- Goa
Health Nutrition
Number
97
58
2
5
4
5
15
29
0
3
0
4297
4127
4002
2329
42
4
14
45
41
6
32
31
88
4
53
1
3830
82
437
5 11
7
36
3
98
12
1
0
0
50
4
1823
2677
93
2
2576
89
1
3
1294
74 | P a g e

A White Paper On Livelihoods- Goa
Quepam:
Basic Details
Number
23
96
1
2385
3
25
78
6
11
61
1
14
23
7
1221
3
9724
11
64
0
6267
4888
4438
6041
50
%4
4.
45
.46
%
83
1
1769
19
5
29
1 8
82
214
328 17
0
54
1382
4811
6329
6344
83
5
8
2068
3948
Hou
seho
ld
Mal
e
Fem
ale
Bo
ys
Gir
ls Mal
e
Fem
ale
Mal
e
Fem
ale
Mal
e
Fem
ale
Mal
e
Fem
ale
JOB
LAB
OU
R
AN
TD
AN
NP
OA
P
WP
DP R
SBY
GA
S
IAY/
PMAY
Bu
llock
Co
w
Bu
ffal
o Go
at
Shee
p
Hen
Oth
ers
Population Population Adult Edu. Child Edu. Total Literacy Welfare Scheme Livestock 18+ 0-18 Population
75 | P a g e

A White Paper On Livelihoods- Goa
Infrastructure
Number
10082
7226 7158 7158 6851
3904 3904
549 549 7 6 29 18 30 15 2 31 11 32 1 10 4 34
76 | P a g e
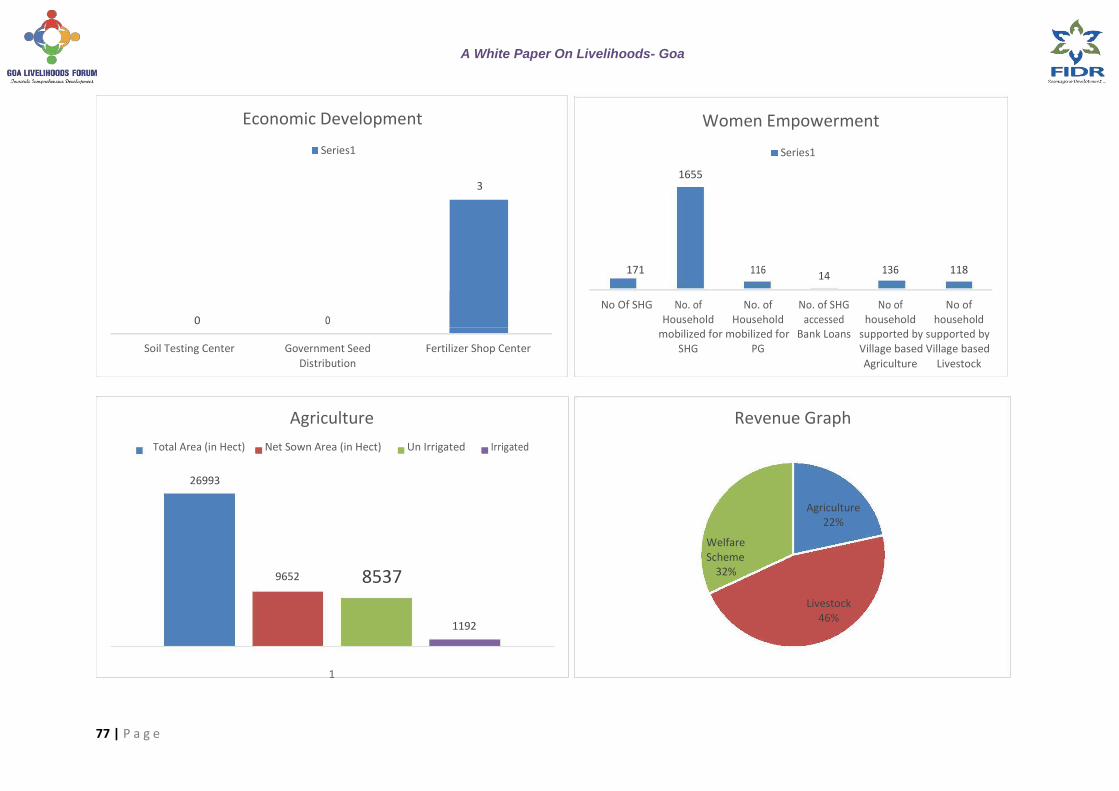
A White Paper On Livelihoods- Goa
Economic Development
Series1
3
0 0
Soil Testing Center Government Seed Fertilizer Shop Center
Distribution
Agriculture
Total Area (in Hect) Net Sown Area (in Hect) Un Irrigated Irrigated
26993
9652 8537
1192
Women Empowerment
Series1
1655
171 116 14
136 118
No Of SHG No. of No. of No. of SHG No of No of Household Household accessed household household mobilized for mobilized for Bank Loans supported by supported by SHG PG Village based Village based
Agriculture Livestock
Revenue Graph
Agriculture
22%
Welfare Scheme
32%
Livestock
46%
1
77 | P a g e

A White Paper On Livelihoods- Goa
Health Nutrition
Number
37
11
15
66
14
06
1 4 1 1 1 1 1 2 16
74
1 4 9 7 15
96
5 29
2
4
2
63
7
72
6 2 5 15
5
3 0 8
1 8 6
83
3 7 68
9 37
0
0
10
7
61
5
76
3
38
7
57
0
23
1
0
42
3
78 | P a g e
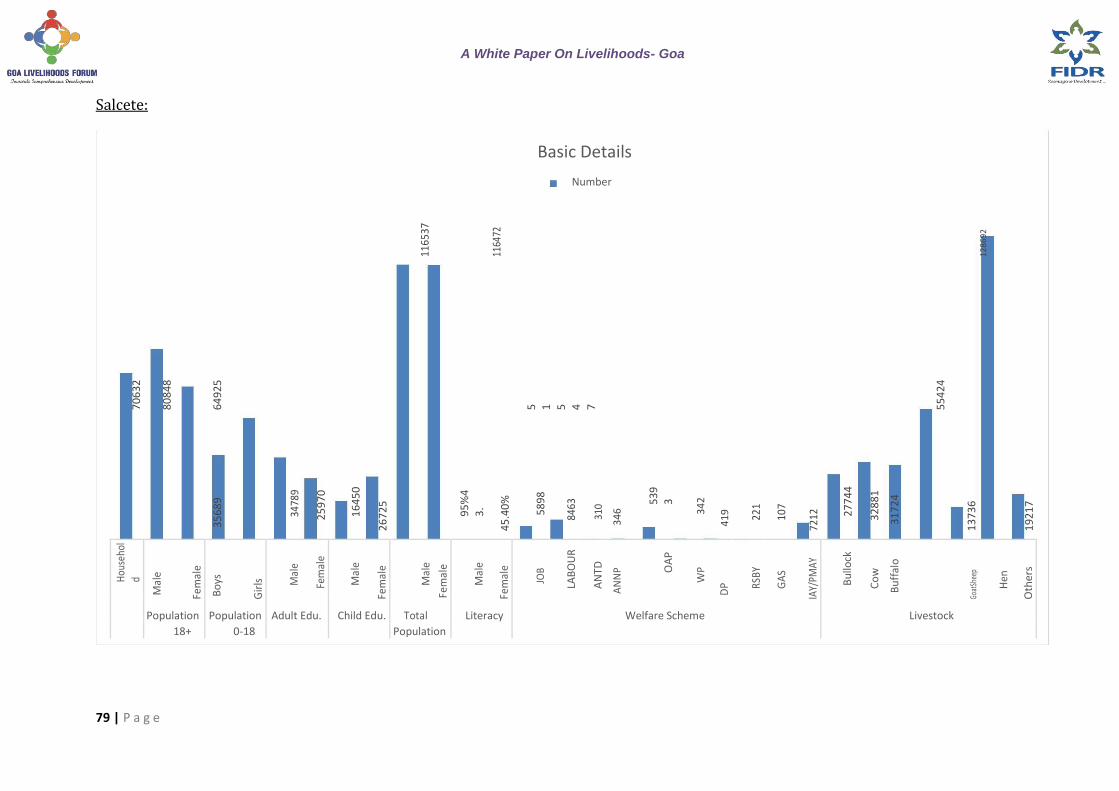
A White Paper On Livelihoods- Goa
Salcete:
Basic Details
Number
1165
37
1164
72
12
86
92
70
63
2
80
84
8
64
92
5
5 1 5 4 7
55
42
4
35
68
9
3478
9
25
97
0
16
45
0
26
72
5
95
%4
3.
45
.40
%
5898
8463
310
34
6 53
93
34
2
41
9
221
107
7212
27
74
4
32
88
1
31
72
4
13
73
6
19
21
7
Hou
seho
l
d
Mal
e
Fem
ale
Bo
ys
Gir
ls
Mal
e
Fem
ale
Mal
e
Fem
ale
Mal
e
Fem
ale
Mal
e
Fem
ale
JOB
LAB
OU
R
AN
TD
AN
NP
OA
P
WP
DP
RSBY
GA
S
IAY/
PMAY
Bu
llock
Co
w
Bu
ffal
o
Goat
Shee
p
Hen
Oth
ers
Population Population Adult Edu. Child Edu. Total Literacy Welfare Scheme Livestock 18+ 0-18 Population
79 | P a g e

A White Paper On Livelihoods- Goa
Infrastructure
Number
67031
57150
43750 43750 40117
23744 23744
3138 3138 32 33 48 44 44 29 19 47 33 42 13 31 8 49
80 | P a g e
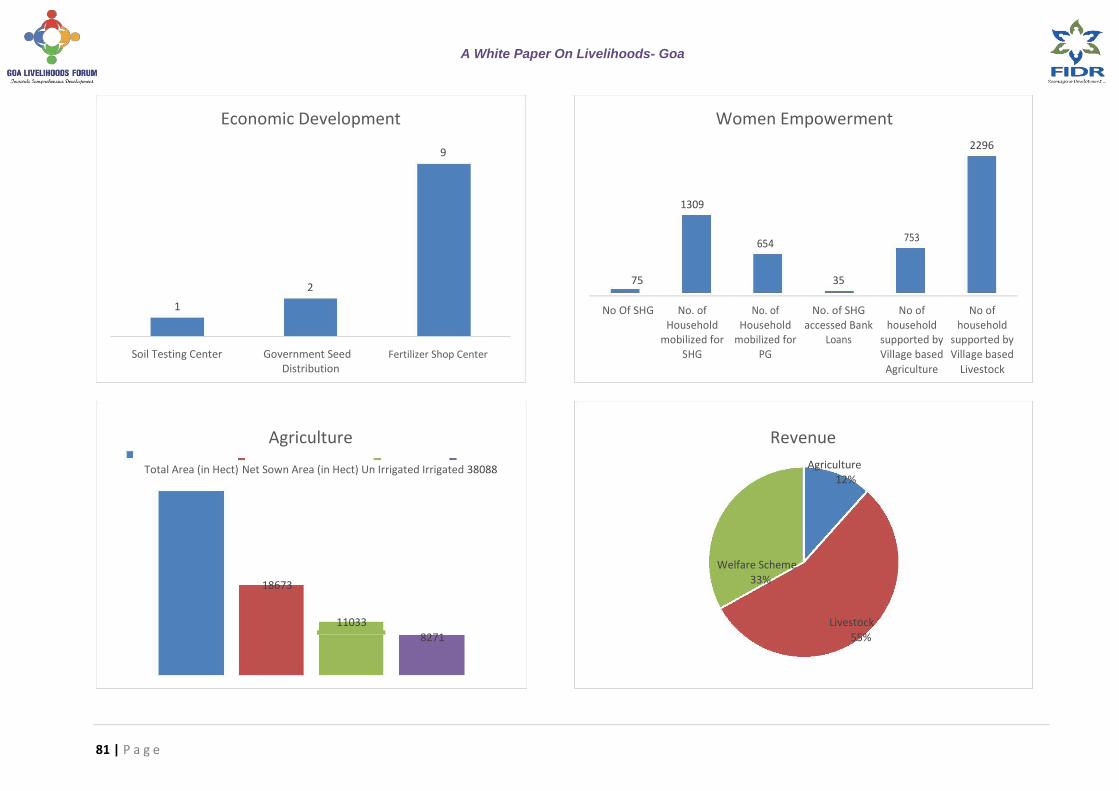
A White Paper On Livelihoods- Goa
Economic Development
9
2
1
Soil Testing Center Government Seed Fertilizer Shop Center
Distribution
Women Empowerment
2296
1309
654
753
75 35
No Of SHG No. of No. of No. of SHG No of No of Household Household accessed Bank household household mobilized for mobilized for Loans supported by supported by
SHG PG Village based Village based
Agriculture Livestock
Agriculture
Total Area (in Hect) Net Sown Area (in Hect) Un Irrigated Irrigated 38088
18673
11033 8271
Revenue
Agriculture 12%
Welfare Scheme
33%
Livestock 55%
81 | P a g e

A White Paper On Livelihoods- Goa
Health Nutrition
Number
21
98
0
9 6 8 9 1079
2
9
38
7
9
0
6883
4201
54
33
3657
1908
1998
65
0
44
73
83
2
50
3
11
3
59
17
14
8
48
6
16
3
25
2
0
0
85
4
4021
5003
2363
4160
1548
4
2568
82 | P a g e

A White Paper On Livelihoods- Goa
Sanguem:
Basic Details
16
01
5
1615
8
16
24
0
9276
5 0 8
7437
6739
6650
39 98
37 98
30 95
34 62
Hou
seho
ld
Mal
e
Fem
ale
Boy
s
Gir
ls
Mal
e
Fem
ale
Mal
e
Fem
ale
Mal
e Fe
mal
e
Population Population Adult Edu. Child Edu. Total 18+ 0-18 Population
14
%3
7.
38
.00
%
48
3
88
8
18
8
23
5 7
17
18
7
27
1
11
6
54
85
4 39
61
3134
3865
49 45
1226
19
46
Mal
e
Fem
ale
JO
B
LAB
OU
R
AN
TD
AN
NP
OA
P
WP
DP
RSB
Y
GA
S
IAY/
PMA
Y
Bu
llock
Cow
Buf
falo
Goa
t
She
ep
Hen
Oth
ers
Literacy Welfare Scheme Livestock
83 | P a g e

A White Paper On Livelihoods- Goa
Infrastructure
6063
4952
4116 4174 4174
2290 2290
972 972
4 2 27 18 23 12 0 22 6 29 2 7 5 24
84 | P a g e

A White Paper On Livelihoods- Goa
Economic Development Women Empowerment
1478 6
5
4 713
496
190 171 14
No Of SHG No. of No. of No. of SHG No of No of
Household Household accessed household household
Soil Testing Center Government Seed Fertilizer Shop Center mobilized for mobilized for Bank Loans supported by supported by
SHG PG Village based Village based
Distribution Agriculture Livestock
Agriculture Revenue
Total Area (in Hect) Net Sown Area (in Hect) Un Irrigated Irrigated
51751
Welfare Agriculture Scheme
23% 40%
17807
12312 Livestock 37%
2011
1
85 | P a g e

A White Paper On Livelihoods- Goa
Health Nutrition
Number
21
04
1 4 4 4 1360
98
3
90
6
8 9 7
947
5 23
0
2
0
49
4
47
5
49
5
21
8
71
7
1 9 2 11
7
7 3 2 1 93
25
29
0
0
81
46
8
41
0
23
3
63
0
26
6
0
26
6
86 | P a g e