Weight-bearing or non-weight-bearing after surgical treatment ...
Upload
khangminh22Category
view
5download
0
�����������������
Citation: Nunes, C.; Oliveira, T.;
Santini, F.d.O.; Castelli, M.;
Cruz-Jesus, F. A Weight and
Meta-Analysis on the Academic
Achievement of High School
Students. Educ. Sci. 2022, 12, 287.
https://doi.org/10.3390/
educsci12050287
Academic Editor: James Albright
Received: 28 February 2022
Accepted: 10 April 2022
Published: 19 April 2022
Publisher’s Note: MDPI stays neutral
with regard to jurisdictional claims in
published maps and institutional affil-
iations.
Copyright: © 2022 by the authors.
Licensee MDPI, Basel, Switzerland.
This article is an open access article
distributed under the terms and
conditions of the Creative Commons
Attribution (CC BY) license (https://
creativecommons.org/licenses/by/
4.0/).
education sciences
Review
A Weight and Meta-Analysis on the Academic Achievement ofHigh School StudentsCatarina Nunes 1,*, Tiago Oliveira 1, Fernando de Oliveira Santini 2, Mauro Castelli 1 andFrederico Cruz-Jesus 1
1 NOVA IMS Infomation Management School, Universidade Nova de Lisboa, 1070-312 Lisboa, Portugal;[email protected] (T.O.); [email protected] (M.C.); [email protected] (F.C.-J.)
2 UNISINOS Business School, Universidade do Vale do Rio dos Sinos, Porto Alegre 93022-750, Brazil;[email protected]
* Correspondence: [email protected]
Abstract: Understanding the determinants of academic achievement (AA) is crucial for virtually everystakeholder interested in personal development and individual and societal wellbeing. Extensiveresearch in several areas, such as education, economics, or psychology, has addressed this topic,identifying a vast number of determinants that impact high school students’ AA. In this work, weperform a meta-analysis, including a weight analysis of 49 quantitative studies that investigate thistopic, exploring the best predictors of high school students’ academic success. We also exploremoderation effects. Our results show that academic self-efficacy and socioeconomic status are the bestpredictors of AA, and they are statistically significant. Other statistically significant predictors, albeitless common in the analyses, are mastery avoidance, motivation, sleep habits, and work avoidance.Implications for theory and practice and directions for future research are discussed.
Keywords: academic achievement; academic success; quantitative; weight-analysis; meta-analysis
1. Introduction
Academic achievement (AA) has been a key topic of interest in many areas of knowl-edge, namely education, psychology, sociology, and economics [1], and involves one’sfamily, community, and school experiences [2]. It is usually measured through perfor-mance, namely individual students’ grades in a given year, school achievement exams orstandardized test scores in core subjects, grade point average (GPA), and teacher ratingscales [3].
The impact that students’ AA has on individuals and overall society is a matterthat has increasingly concerned researchers, mainly due to the positive effects that it hasdemonstrated on critical aspects of society, such as improvements in development andproductivity [4]. Research shows that international scores on mathematics and science testsare strongly related to national development and economic growth because mathematics,science, and reading skills are essential for the labor force [5]. Academic difficulties maylead to long-term patterns of school dropout, academic failure, and problems achievinga successful career in adulthood [6]. Struggling in school can also lead to externalizingproblems [7,8], especially during adolescence and high school years, which are understoodto be a critical period with important implications for school achievement [9]. Given allthe rapid societal transformations and the need to handle and adapt to the economic,technological, and cultural changes of societies and the competition in the job market [10],one can understand the importance of understanding the drivers of AA, as it is a topicthat has considerable personal and social impacts. School dropout is one of the mostcommon outcomes of school failure [11]. It is also an obstacle to economic growth andemployment, as dropout harms productivity and competitiveness and fuels poverty andsocial exclusion. For these reasons, the Europe 2020 Strategy seeks to reduce dropout
Educ. Sci. 2022, 12, 287. https://doi.org/10.3390/educsci12050287 https://www.mdpi.com/journal/education
Educ. Sci. 2022, 12, 287 2 of 17
rates, increase the number of students who complete their compulsory education, andsimultaneously increase the number of students who continue to university level [12]. Thismatter is still ongoing as it is a fundamental concern in the 2030 Strategy, according towhich all young people should receive better education and training, regardless of theirsocio-economic background, thereby leading to more and better skills.
Therefore, research on this topic is critical to provide decision makers with qualityinformation to increase school success [13]. The interconnectedness between researchersand practitioners also enriches the range of knowledge gained, improving theory buildingand allowing more practically applicable results [14]. Most of the research on AA hasidentified many factors that impact students’ performance, namely characteristics of thestudents [15,16], parents [17,18], teachers [19,20], and schools [21]—the four main agentsrelated to the education process. However, most studies and reviews on this topic explorethe contributions of each of these factors individually or in clusters of more related factors.Another conundrum is that the literature in AA reports conflicting findings. For example,some authors show that internet access is highly correlated with low academic achieve-ment [22,23]. However, other studies have proved these conclusions are unclear, as childrenwho use the internet more often attain higher scores [24,25]. In this line, a quantitativemeta-analysis serves as a valuable tool for synthesizing the results of numerous studies ona particular topic [26]. We perform a quantitative synthesis of the findings in this researcharea with our weight analysis and meta-analysis by identifying determinants that havebeen intensely scrutinized in the literature, including the best predictors of success andshedding light on the contributions of each construct to AA. This meta-analysis will alsopromote a generalization analysis of each relationship tested with AA, thereby providingevidence regarding the conflicting results found in the academic literature [27].
We will perform a weight and meta-analysis of factors that impact AA, includinghigh school students. Although it may seem reasonable to assume that several AA driversmay be shared across different school levels, each undoubtedly has its own and, moreimportantly, different impacts. High school was chosen because, even though this particularperiod of school life is a part of compulsory education in most developed countries, it isthe one during which most students drop out [11]. The high school period is characterizedby significant changes on a personal level, namely in identity and personal and socialdevelopment [28], and research shows that, in adolescence, cognitive-affective variablesbecome crucial in accounting for academic behavior, compared to earlier years [29]. Highschool also presents changes at a curricular level, as secondary education is more narroweddown to a student’s interests regarding preparation for tertiary education or pursuit of aprofessional career [30]. High school success is also linked to better results in university [31].Thus, the importance of understanding AA is to enhance social and personal development.
This paper’s contributions are threefold. First, we contribute to a broader understand-ing of which of the determinants of AA have received more attention from researchersin this period of education. Second, we characterize the impact and relevance of thosedeterminants on high school achievement. Finally, we identify the best AA determinantsbased on the weight analysis and meta-analysis results.
The following section describes the research methodology. Subsequently, we presentthis study’s results, including descriptive statistics, weight analysis, and meta-analysis.Finally, we discuss the findings and their implications for theory and practice, our conclu-sions, study limitations, and avenues for future research.
2. Method2.1. Criteria for Selection of Studies
The first step in a weight and meta-analysis investigation is to formulate the prob-lem [32]. We are interested in determining which factors are most studied when trying toexplain the academic performance of high school students. The second step concerns howto conduct a systematic review [32]. We follow the PRISMA protocol [33] to achieve thisaim as applied in other researchers’ meta-analyses [34]. Following the PRISMA protocol,
Educ. Sci. 2022, 12, 287 3 of 17
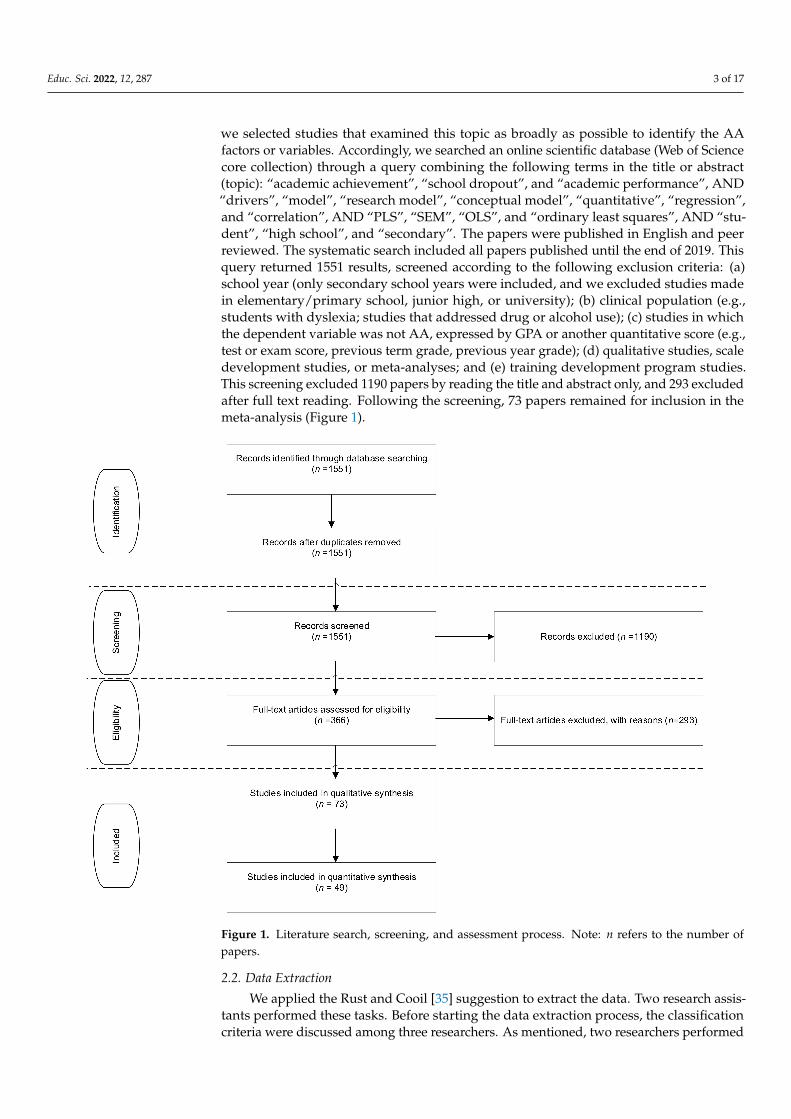
we selected studies that examined this topic as broadly as possible to identify the AAfactors or variables. Accordingly, we searched an online scientific database (Web of Sciencecore collection) through a query combining the following terms in the title or abstract(topic): “academic achievement”, “school dropout”, and “academic performance”, AND“drivers”, “model”, “research model”, “conceptual model”, “quantitative”, “regression”,and “correlation”, AND “PLS”, “SEM”, “OLS”, and “ordinary least squares”, AND “stu-dent”, “high school”, and “secondary”. The papers were published in English and peerreviewed. The systematic search included all papers published until the end of 2019. Thisquery returned 1551 results, screened according to the following exclusion criteria: (a)school year (only secondary school years were included, and we excluded studies madein elementary/primary school, junior high, or university); (b) clinical population (e.g.,students with dyslexia; studies that addressed drug or alcohol use); (c) studies in whichthe dependent variable was not AA, expressed by GPA or another quantitative score (e.g.,test or exam score, previous term grade, previous year grade); (d) qualitative studies, scaledevelopment studies, or meta-analyses; and (e) training development program studies.This screening excluded 1190 papers by reading the title and abstract only, and 293 excludedafter full text reading. Following the screening, 73 papers remained for inclusion in themeta-analysis (Figure 1).
Figure 1. Literature search, screening, and assessment process. Note: n refers to the number ofpapers.
2.2. Data Extraction
We applied the Rust and Cooil [35] suggestion to extract the data. Two research assis-tants performed these tasks. Before starting the data extraction process, the classificationcriteria were discussed among three researchers. As mentioned, two researchers performed

Educ. Sci. 2022, 12, 287 4 of 17
the coding of all valid articles separately. At the end of these procedures, the results werecompared, and the level of agreement was 80%. For the cases in disagreement, the thirdresearcher analyzed the differences. The procedure used for the data extraction followedthat of earlier meta-analysis research [36]. The following items were extracted from each ar-ticle: year of publication, type of relationship found with AA (e.g., independent–dependentvariable), name of relational constructs, coefficient of relationships between constructs,significance (yes or no), quantitative method, sample size, school year, school subject (whenavailable), and nationality of the sample. We identified 363 relationships between explana-tory variables and AA. Figure 1 illustrates each step applied to identify the valid studiesused in this meta-analysis.
2.3. Merging of Variables
The extracted data analysis revealed that, in some cases, different authors gave dif-ferent names to variables that measure the same construct, and therefore have the samemeaning. Hence, after a detailed theoretical review, we merged variables found in thestudies that were synonyms (e.g., gender and sex), described with different phrasing (e.g.,performance-approach and performance-approach goals, absence, and absenteeism), or relatedto the same construct (e.g., cognitive confidence and academic self-efficacy). After mergingvariables, we identified twenty relationships between variables studied at least three timesor more in our sample’s papers [37]. Nineteen of those relationships revealed the dependentvariable was AA; the other relationship between variables present at least three times wasbetween academic self-efficacy and performance goals. From the initial pool of 73 papers,24 studied only variables that did not coincide with the others, i.e., were not used at leastthree times in explaining AA. We therefore excluded those 24 papers from the analysis.The final sample included in the weight analysis and meta-analysis comprises 49 papers(Appendix A).
2.4. Analysis Procedures2.4.1. Weight Analysis
Weight is an indicator of the predictive power of independent variables [38]. Theweight for a variable was calculated by dividing the number of times an independentvariable was reported to be significant by the number of times the independent variablewas examined. This study analyzes the constructs’ relationship strength, i.e., the influenceof an independent variable over a dependent variable (AA). A weight of 1 indicates thatthe relationship was significant in all papers, and a weight equal to 0 indicates that therelationship was nonsignificant in all studies.
2.4.2. Meta-Analysis
We follow the traditional analysis techniques used in meta-analytical studies [39],whereby the direct analysis was performed considering Pearson’s correlation coefficient(r). When studies did not report the correlation effects (e.g., Beta; t-test; F-ratio; and χ2),we used Hunter and Schmidt’s (2015) conversion procedure suggestions. The effect sizeswere corrected by scales reliability and sample size [37]. As suggested by those authors, weapplied the random-effects model of the effect size and considered the confidence intervalindex at the 95% level.
Our analysis also presented heterogeneity among the studies by the Q and I2 tests.Cochran’s Q calculates the weighted sum of squared differences between the individualeffects of the study and the combined effect of the studies [40]. The I2 statistic is obtainedthrough the Q statistic. I2 of 25% or lower presents low heterogeneity; the I2 index of26–50% shows moderate heterogeneity, and studies with an I2 greater than 75% have highheterogeneity [41].
We also investigated possible moderators on the significant relationships with morethan ten effects [37]. This analysis was conducted via a meta-regression test in which weused raw effect sizes from primary studies as a dependent variable in weighted regression

Educ. Sci. 2022, 12, 287 5 of 17
analysis. The coded moderators were used as independent variables [42]. All analyseswere performed employing the metafor R package [43].
3. Results3.1. Descriptive Statistics
In the 49 selected papers published between 1992 and 2019, we identified 120 relation-ships (independent–dependent variables) included in the meta and weight analyses. TheTable A1 in the Appendix A synthesizes the list of papers selected for our study, indicatingthe school years and subjects each study refers to (when this information is available), thesample size, country, and the statistical analysis used. The total sample is 610,522 studentsfrom 25 different countries in Europe (10), Asia (9), North America (2), Africa (2), andAustralia (1). South Korea is the country with the largest sample size (487,077), and theUnited Kingdom (UK) has the smallest (120). Although many studies choose to assess AAconsidering global performance in a given year (e.g., GPA), Math, Sciences, and English(either as a native or foreign language) are the main subjects considered. Few of the articlesfound were published before 2012; nonetheless, from that year on, we observed a moreregular number of publications per year, showing an increasing interest in this topic.
3.2. Weight Analysis
Table 1 presents the results of the weight analysis ordered by the independent variables’frequency of use. According to the weight analysis, the variables that can be considered tobe the leading determinants of AA (as their weight is equal to or greater than 0.8 and are ex-amined at least five times) are academic self-efficacy (1), conscientiousness (0.88), cognitiveability (0.88), socioeconomic status (SES) (0.86), gender (0.81), and performance-avoidance(0.80). Some variables are significant in all studies and therefore have a weight of 1, butbecause they are present fewer than five times are considered “promising determinants.”These include sleep habits, motivation (both present four times), absenteeism, work avoidance,and mastery avoidance (present three times).
Table 1. Weight analysis results (ordered by frequency of use).
Independent Variable DependentVariable Non-Significant Significant Frequency of Use Weight = Sig/Freq
Gender AA 4 17 21 0.81Socioeconomic status (SES) AA 2 12 14 0.86
Academic self-efficacy AA 0 11 11 1.00Performance-approach AA 2 7 9 0.78
Conscientiousness AA 1 7 8 0.88Cognitive ability AA 1 7 8 0.88
Agreeableness AA 4 2 6 0.33Performance avoidance AA 1 4 5 0.80
Motivation AA 0 4 4 1.00Sleep habits AA 0 4 4 1.00
ICT leisure use AA 1 3 4 0.75Extraversion AA 3 1 4 0.25
Openness AA 3 1 4 0.25Absenteeism AA 0 3 3 1.00
Mastery avoidance AA 0 3 3 1.00Work avoidance AA 0 3 3 1.00
Parental involvement AA 1 2 3 0.67Emotional stability AA 2 1 3 0.33Mastery approach AA 2 1 3 0.33
3.3. Meta-Analysis Correlations Effects
We first present the results of direct relationships (Table 2). This table presents: (a) theeffect sizes (r) adjusted by sample size and reliability of measurement; (b) the correlations

Educ. Sci. 2022, 12, 287 6 of 17
transformed by Fischer’s Z-distribution; (c) the upper and lower confidence interval in-dex (95% level), which comprises an estimate of the mean range of corrected weightedcorrelations [37], and (d) the heterogeneity test of the effects by Cochran’s Q test and I2.
Table 2. Meta-analytic calculation (ordered by frequency of use).
Variables (k) (o) N r Z Sig LCI(95%)
UCI(95%) Q I2
Gender 20 21 571,462 −0.021 −0.470 0.636 −0.109 0.067 5220.200 99.600%Socioeconomic status 13 13 117,088 0.183 3.420 0.000 *** 0.079 0.284 1748.680 99.300%Academic self-efficacy 11 11 27,705 0.347 3.970 0.000 *** 0.181 493 969.220 98.900%Performance-approach 9 9 8930 0.147 2.620 0.008 ** 0.037 0.254 90.780 91.200%
Conscientiousness 9 9 10,981 0.119 1.390 0.165 −0.049 0.281 416.340 98.100%Cognitive ability 8 8 50,844 0.249 1.210 0.225 −0.156 0.583 7732.000 99.900%
Agreeableness 6 6 5654 −0.024 −0.391 0.697 −0.14 0.1 78.870 92.400%Performance-avoidance 4 5 3244 −0.099 −1.140 0.253 −0.263 0.07 73.220 94.500%
Motivation 4 4 21,054 0.22 11.690 0.001 *** 0.184 0.255 12.090 75.200%Sleep habits 3 3 11,799 −0.192 −2.010 0.044 * −0.366 −0.004 134.860 98.500%
ICT leisure use 4 4 8777 −0.216 −2.590 0.009 ** −0.368 −0.053 84.330 96.400%Extraversion 4 4 4572 −0.044 −2.680 0.007 ** −0.076 −0.019 3.31 ns 4.200%
Openness 4 4 4617 0.075 1.340 0.179 −0.034 0.184 11.690 74.300%Absenteeism 3 3 9271 −0.177 −1.680 0.095 −0.369 0.029 54.150 96.300%
Mastery avoidance 2 3 1908 −0.271 −2.440 0.014 * −0.464 −0.055 39.570 94.900%Work avoidance 3 3 3325 −0.219 −2.720 0.006 ** −0.366 −0.062 23.040 91.300%
Parental involvement 3 3 23,846 0.113 2.250 0.024 * 0.017 0.245 122.150 98.400%Emotional Stability 4 4 1316 0.056 1.260 0.207 −0.031 0.142 5.20 ns 42.400%Mastery approach 3 3 4286 0.221 2.000 0.004 ** 0.004 0.418 49.510 96.000%
Note: * p < 0.05; ** p < 0.01; and *** p < 0.001; ns = non-significant; k = number of studies used in the analysis;o = number of observations tested; r = weighted average effect and corrected from the sample obtained in studies;Z = Fisher Z effects; Sig = degree of significance of the effect size, LCI lower confidence interval; UCI upperconfidence interval; Q: test of heterogeneity; and I2 = test of heterogeneity.
We evaluated 19 constructs related to AA. Eleven of these presented significant effects.Academic self-efficacy had the strongest positive effect-size (r = 0.347; p < 0.001). This analysiswas obtained from 12 studies and a sample of 27,705 students. Extraversion was negativelyrelated with achievement (r = −0.044; p < 0.01). In this case, we also observed that theeffects produced by four primary studies that analyzed the relationship produced consistentfindings as the heterogeneity index was not significant (Q = 3.31; p > 0.05; I2 = 4.2%). Alongthe same line, we also found a negative and significant effect on the relationship betweenICT leisure use and AA (r = −0.216; p < 0.05).
Other significant effects were related to mastery assumptions. While the relationshipbetween mastery approach and AA was positive (r = 0.221; p < 0.05), the effect of masteryavoidance on AA was negative (r = −0.217; p < 0.05). Both were obtained from three effect-sizes. We also noted positive and significant effects of student motivation and AA (r = 0.220;p < 0.01). These results are derived from a sample of 21,054 students distributed amongfour studies. Parental involvement also presented positive and significant effects on studentachievement (r = 0.113; p < 0.05). Regarding the other four significant relationships, wefound that performance approach and SES socio-economic status showed positive effects onAA (r = 0.147 and r = 0.183; respectively), while sleep habits and work avoidance producednegative effects (r = −0.192 and r = −0.219; respectively).
Finally, the results also showed that eight of the tested relationships, namely absen-teeism, agreeableness, cognitive ability, conscientiousness, emotional stability, gender, openness,and performance-avoidance, do not yield a significant effect on the students’ AA. One canargue that, although these features appear in some research as AA antecedents, they canwork as such in specific contexts.
3.4. Moderation Effects
We also investigated possible moderators that could explain some heterogeneity in thedirect relationships found [44]. The analysis was on the relationships between (1) academicself-efficacy and AA and (2) SES and AA. Both relationships were significant and produced

Educ. Sci. 2022, 12, 287 7 of 17
more than ten effect sizes. Lower numbers would be insufficient to analyze effect sizechanges through moderators [37].
In the same vein, we analyzed the possible moderation of (1) the scores of the 2018Program for International Student Assessment (PISA), an international assessment thatmeasures 15-year-old students’ reading, math, and science literacy every three years, (2) theHuman Development Index (HDI), a statistic composite index of life expectancy, education,and per capita income indicators, and (3) Education Index (EI), a component of the HDI,measured by combining average adult years of schooling with expected years of schoolingfor children in each country. The PISA index was obtained by the National Center forEducation Statistics (2018), the EI from the United Nations Human Development Report(2016), and the HDI from the United Nations Human Development Report (2019). Each ofthe moderators’ classifications was based on the country of origin of the data collectionsapplied in each investigation. The raw PISA index scores are scaled to allow meaningfulcomparisons: the OECD average in each domain (mathematics, reading, and science) is 500,and the standard deviation is 100; the EI and HDI scores vary from 0.001 to 0.999. Table 3presents the moderation analysis results.
Table 3. Meta-regression analysis.
Academic Self−Efficacy and AAModerator ß z CI(L) CI(U) p
Intercept 0.897 0.911 −0.890 −2.680 0.325PISA × ASE −0.002 0.001 −0.004 0.001 0.208HDI × ASE 0.375 1.560 −2.690 3.440 0.811EI × ASE −0.124 0.933 −1.950 1.700 0.089
Socioeconomic status (SES) and AAß z CI(L) CI(U) p
Intercept 1.267 1.530 −1.730 4.260 0.408PISA × SES −0.001 0.002 −0.005 0.003 0.587HDI × SES −1.900 4.090 −9.910 6.110 0.642EI × SES 1.310 2.730 −4.050 6.740 0.632
As seen in Table 3, none of the moderators obtained significant effects. This observationmay indicate that the impact of the academic self-efficacy and SES variables included in thismeta-analysis’ studies is relatively stable across countries, regardless of being developedor developing, as none of the possible moderator variables explored explain variance inour results.
3.5. Major Findings
Figure 2 presents the combined results of the weight and meta-analysis. Values rep-resent the weights obtained by weight analysis, and the weighted average effect valuesobtained in the meta-analysis are in parentheses. Best and promising predictors as deter-mined from the weight analysis are represented: best predictors have a weight of at least0.80 and are present in the analysis five times or more. Promising predictors have a weightof 1 but are examined fewer than five times. The results show that the best predictors ofAA are academic self-efficacy, socioeconomic status, cognitive ability, gender, conscientiousness,and performance-avoidance. Of these best predictors, those statistically significant in themeta-analysis are academic self-efficacy and socioeconomic status. The statistically signifi-cant promising predictors are motivation, sleep habits, mastery avoidance, and work avoidance.Absenteeism is also a promising determinant (weight of 1, but only present four times inthe analysis). However, it proved not significant in the meta-analysis. The determinantsfound to be least important are agreeableness, openness, and emotional stability, as they wereall nonsignificant and had low weight values.

Educ. Sci. 2022, 12, 287 8 of 17
Figure 2. Final weight analysis and meta-analysis results model. Note: * p < 0.05; ** p < 0.01;and *** p < 0.001. Values represent the weight and effect sizes (r) adjusted by sample size, andmeasurement reliabilities are in parentheses. Full lines represent significant paths.
4. Discussion
This paper’s results show that AA is a widely studied topic that interests researchersfrom different areas and is a topic that has become increasingly prominent in the literature,with a growing number of published papers in the last decade. Paradoxically, there area plethora of studies with apparently contradictory findings and a paucity of studiessummarizing the literature with the goal of shedding light on such a pertinent topic as isAA. Our goal is to contribute to this synthesis of the drivers that are the best and mostsignificant predictors of AA.
From the weight analysis, the following variables emerged as the best predictorsof students’ success in high school (independent variables that were examined five ormore times and with a weight of at least 0.80): academic self-efficacy, socioeconomic status,conscientiousness, cognitive ability, gender, and performance-avoidance. All of these variables,except for performance avoidance, positively impact AA, but only academic self-efficacy andsocioeconomic status are statistically significant in the meta-analysis. Academic self-efficacyrefers to an individual’s belief that they can successfully achieve a specific academic goalat a designated level in an academic task [45]. In this analysis, socioeconomic status (SES)measures derive from self-reported or self-perceived values and school record information.Students’ SES background depends upon family income, level of education, and occupationstatus and, not surprisingly, is a significant determinant of AA, as social and economicconditions may influence youngsters’ functioning and development [46]. Conscientiousnessis a personality trait present in the Big Five Model related to self-control, the ability toplan, and being efficient and organized [47]. As operationalized in the papers in this meta-analysis, cognitive ability is a quantitative measure of the general intelligence (g factor), i.e.,the ability for reasoning, problem-solving, complex idea comprehension, and learning fromexperience [48]. Cognitive ability is one of the most studied predictors of AA, and research
Educ. Sci. 2022, 12, 287 9 of 17
has consistently demonstrated it to be a significant predictor of success in school [49] andadult life [50]. Concerning gender, our results are consistent with the literature: females tendto perform better than males. However, some authors have shown that males outperformfemales in specific mathematics abilities [51], so this analysis could help clarify genderimpact on AA. The only determinant identified in the weight analysis as one of the bestpredictors of AA that has a negative impact is performance-avoidance, i.e., the desire toavoid performing more poorly than others do [52]. Performance-avoidance is consistentlylinked to several adverse outcomes, such as anxiety and decreased performance [53], thusexplaining its negative impact on AA.
Other relationships between variables evaluated five times or more in this study werefound to be significant in the meta-analysis but obtained a weight slightly below 0.80. Thisis the case for performance approach (weight = 0.78), for which further research could helpassess the actual impact on AA. The AA determinants with the lowest weight value (0.25)are extraversion and openness, personality traits that are part of the Big Five PersonalityModel [54], suggesting they are probably not among the most relevant for AA research.
Our weight analysis and meta-analysis results allow us to draw a model of the predic-tors of high school achievement across countries. The best of these predictors are academicself-efficacy and social-economic status. The model also identifies other seemingly impor-tant antecedents of AA (carrying weights of 1 but present fewer than five times in thisanalysis), viz. motivation, sleep habits, work avoidance, and mastery avoidance. These lastthree antecedents have a significant negative impact on AA and should continue to beconsidered in future research in order to clarify their importance in student achievement.Although not statistically significant in the meta-analysis, absenteeism is also a promisingpredictor of AA. These results highlight the importance of students’ habits outside school,and further conclusions can help parents, teachers, and other educational agents promotebetter conditions to enhance AA.
We analyzed the possible effect of moderators in two relationships found in this meta-analysis: academic self-efficacy and AA, and SES and AA. The data samples used in thisstudy belong to countries with different social and economic development classifications,such as Norway, the USA, the Dominican Republic, and Iran. No significant results werefound for the moderators (PISA index score, Human Development Index, and EducationIndex score of each country), which seems to indicate that both of the previously mentioneddeterminants (academic self-efficacy and SES) influence AA in a manner that is independentof the students’ country of origin.
Survey-driven measures, such as those in most studies presented in this work, havebeen widely used in AA research. Recent research [55] has suggested that data-drivenresearch using machine learning techniques could complement the more traditional re-search approach and produce more accurate results, capitalizing on the massive amount ofinformation available to educational institutions [56]. For example, Cruz-Jesus et al. [57]employed artificial intelligence techniques to assess AA drivers in high school, using adatabase from all public high schools in Portugal. The database included demographicinformation, financial information of students’ families, and information about the schooland the area in which the school is located. These authors found that students’ previousacademic record (namely if the student had failed previously) and gender (females out-performing males) impact AA the most, whereas, and contrary to what previous researchhad suggested [58], class size does not significantly affect students’ achievement. Apartfrom gender, none of the other variables identified by these authors emerged in our analysis,suggesting that using AI methods could bring new valuable insights to this area of research.
4.1. Theoretical Implications
This paper contributes to theory by assessing the main drivers of AA through an analy-sis of relevant literature. To the best of our knowledge, no research addresses meta-analysiscombined with weight analysis in the context of AA. Using these analytical methods, wecontribute to research by identifying the most used determinants, their significance, impact,

Educ. Sci. 2022, 12, 287 10 of 17
and the best predictors of AA, thus allowing us to synthesize knowledge from a vast areaof research.
According to our results, one of the most critical drivers of AA is academic self-efficacy,a variable that impacts AA positively. Students who have a high level of academic self-efficacy tend to have a greater level of class participation and exert prodigious effort instudying, which will increase their final score [59]. Research also indicates that academic self-efficacy moderates the relationship between future orientation (i.e., students’ expectationsabout the outcomes of their academic path) and AA [60]. Our study also allowed us toassess the impact of all four dimensions of the achievement goals framework [61] on highschool students’ AA. According to this framework, individuals who have a strong masteryorientation feel competent at a task when they have mastered the task itself or when theyhave improved relative to their past performance. In contrast, individuals who have astrong performance orientation feel competent at a task when they have performed well onthe task relative to others.
Previous research findings are not consistent considering the impact of the performance-approach (i.e., the desire to outperform others) showing that, although it is a driver ofsuccess, it is also related to adverse outcomes, namely due to increased performance anxietylevels [61]. However, our results highlight a significant positive impact of performance-approach on AA, suggesting that the motivation to perform better than peers can be morebeneficial than detrimental at the secondary education level. Our results also reveal apositive impact of the mastery approach on AA, consistent with earlier empirical researchreporting that this driver is linked to several positive achievement outcomes throughincreased self-efficacy, adaptive learning strategies, and feedback-seeking behaviors [62].Performance-avoidance and mastery avoidance are both determinants with a negative impacton AA. The impact is significant for mastery avoidance, suggesting that when preventingfailure, it is the self-evaluation of past performance rather than comparing with otherstudents that matter the most. However, based on earlier research, we would have expecteda stronger relationship between performance-avoidance and AA [53].
Some predictors in this study did not significantly impact AA; namely, conscientiousnessis a contrasting result compared with recent findings [63]. This aspect indicates thatconscientiousness is a crucial non-cognitive predictor for school achievement comparedto other predictors such as self-efficacy, grit, and anxiety. It should be focused on whensupporting students and improving their performance. Our results, however, highlightcontext-specific determinants such as academic self-efficacy as more relevant and worthy ofsuch focus.
4.2. Practical Implications
Academic success has significant personal and societal outcomes. This study’s findingsraise implications that could be of widespread interest to policymakers, schools, andteachers. Specifically, understanding which among the variables studied herein are the bestpredictors of AA yields valuable information highlighting new policies or interventionsthat could be directed to enhance academic results.
Considering academic self-efficacy is one of the most critical determinants of AA, schoolmanagement bodies and teachers could implement academic self-efficacy enhancing inter-ventions such as teaching study methods and test-taking skills to reduce performanceanxiety [64], thus increasing students’ belief that they will succeed academically. Theseinterventions would convey benefits for students with low academic self-efficacy, who areusually less motivated to thrive [65]. Our results also suggest other ways of improving AA,such as interventions designed to minimize the negative impact of mastery avoidance andwork avoidance—specifically discussing with students the influence of previous academicfailure on their performance and helping them to set personalized and attainable achieve-ment goals. Combined with school environment interventions, such as those discussed,others involving families and schools seem to convey good results: parental involvementis a strong predictor of student AA [66]. Our results demonstrate a positive relationship

Educ. Sci. 2022, 12, 287 11 of 17
between parents’ involvement in school life and AA. Previous research has highlightedthat the combination of solid school–family relationships and high levels of parental sat-isfaction with a school leads to better results [67]. Therefore, facilitating ways to engageparents in their children’s academic path and enhance communication with schools areseemingly beneficial to increasing performance. Parental involvement can be contingent onthe family’s SES, as not all families have the same availability or social capital to participatein students’ school life. Although SES is a relatively stable condition and difficult to change,research suggests that social inequalities can be attenuated by interventions based on thesociocultural-self model. Targeting individual attributes can help underprivileged studentsform and sustain a positive self-concept, increasing AA [68]. Research also shows that hopeis a significant mediator between SES and AA [69], meaning that SES gaps can be overcomeif students’ hope increases.
Our results show that ICT leisure use impairs AA. Thus, policy changes in schoolsto minimize the impact of this variable, such as the restraint of mobile phone use in theclassroom or monitoring students’ time spent on the internet (on social media, gaming,etc.), could increase AA. The concern with ICT leisure use should also be considered outsideschool. The Internet and technology use play a tremendous part in everyday humanlife activities and are also considered an asset for learning. Nevertheless, their excessiveuse has been linked to addiction behaviors [70,71]. Research has shown that parentalmonitoring of students’ internet usage should be done carefully, as mere dissuasion maynot be an effective strategy. Some authors suggest alternative means such as rationalization.Communication should be preferential [72].
Although a common characteristic in adolescence, poor sleep habits also diminish AAand are antecedents of other problems such as smoking, alcohol usage, and high anxiety anddepression scores. Seemingly, high school students would benefit from more guidance fromparents, school authorities, and health professionals regarding sleep and sleep habits [73].
4.3. Limitations and Future Studies
As stated above, AA is a vast topic that interests researchers from different areas ofknowledge. We present an analysis based on a few papers, which are only a tiny portionof the existing literature on this topic. The fact that we only selected papers written inEnglish can also mean we omitted relevant literature in other languages and, for the typeof analysis conducted, we also left out qualitative studies.
5. Conclusions
This paper performs a meta-analysis and weight analysis on the determinants of AAin high school of 49 papers published across 27 years (1992–2019). We identify some ofthe best and most promising predictors of high school AA and their significance, thuscontributing to an integrated and synthesized view of an extensive research topic suchas AA. The results show that academic self-efficacy and socioeconomic status are thevariables with the most significant impact on AA. At the same time, motivation, sleephabits, absenteeism, work avoidance, and mastery avoidance are promising determinantsthat should be further explored in research. We critically discuss these results, framing themin the findings reported in the existing literature, and propose a model of the synthesizeddeterminants of AA that could be of use for researchers by providing information aboutthe primary constructs to be included in AA research models. Our research also enablesparents, teachers, and other stakeholders to support policies and interventions aimed athelping students achieve better schooling results.
Author Contributions: Conceptualization, T.O., F.C.-J. and M.C.; methodology, C.N., F.d.O.S. andT.O.; software, C.N. and F.d.O.S.; validation, F.d.O.S., C.N. and T.O.; formal analysis, C.N. and T.O.;investigation, C.N.; resources, C.N.; data curation, F.d.O.S.; writing—original draft preparation, C.N.;writing—review and editing, C.N., F.d.O.S., T.O., F.C.-J. and M.C.; visualization, C.N.; supervision,T.O.; project administration, T.O., F.C.-J. and M.C.; funding acquisition, T.O. All authors have readand agreed to the published version of the manuscript.

Educ. Sci. 2022, 12, 287 12 of 17
Funding: This work was supported by national funds through FCT (Fundação para a Ciência e aTecnologia) under project DSAIPA/DS/0032/2018 (DS4AA).
Institutional Review Board Statement: Not applicable.
Informed Consent Statement: Not applicable.
Data Availability Statement: Not applicable.
Conflicts of Interest: The authors declare no conflict of interest.
Appendix A
Table A1. List of useful datasets, indicating school grade and school subject (when indicated), numberof subjects, country, and analysis method.
Studies School Subject Sample Size Country Method
Abdi et al. [74] GPA 127 Iran Regression analysis
Ahinful et al. [75] Accounting 500 Ghana Regression analysis
Anderson andKeith [76] ND 8100 USA Structural equation
modeling (SEM)
Arslan [77] GPA 553 Turkey SEM
Carolan [78] Math 10,350 USA Regression analysis
Cho and Coulton [79] English, Math 1100 South Korea Ordinary least squares regression
Crook et al. [80] Biology 340 Australia Multiple regression
Crouzevialle andButera [81] Physics, Chemistry 173 France Linear regression analysis
Di Fabio andBusoni [82] GPA 286 Italy Hierarchical regression
Di Giunta et al. [83] GPA 426 Italy SEM
Dickhäuser et al. [84] Math 288 Germany SEM
Dinger et al. [85] GPA 524 Germany SEM
Ergene [86] GPA 510 Turkey Multiple regression analyses
Gibson et al. [87] ND 3235 Canada Generalized estimated equations
Gilar-Corbi et al. [88] GPA 1396 Spain Regression analysis
Howard et al. [89] Math 13,694 USA Regression analysis
Inal et al. [90] GPA 804 Turkey Correlation
Ishak et al. [91] GPA 493 Malaysia SEM
Keith and Benson [92] GPA 12,142 USA SEM
Kim and Hong [93] Korean, English, Math 485,977 South Korea Multivariate multilevelmodeling (HLM)
King and Ganotice [94] Math, Science, English 1026 Philippines SEM
Köller et al. [95] GPA 3775 Germany Multiple regression analysis
Kozina et al. [96] Math 2802 Slovenia Multiple regression analyses
Levi et al. [97] EFL, Math, History 289 Israel SEM
Liem et al. [98] Math, English 356 Indonesia SEM
Luo et al. [99] Math 1196 Singapore SEM

Educ. Sci. 2022, 12, 287 13 of 17
Table A1. Cont.
Studies School Subject Sample Size Country Method
McIlroy et al. [100] English, Math, Science 120 UK HLM
Meyer et al. [101] GPA (Math, EFL) 3637 Germany Multiple regression analysis
Miñano et al. [102] Math 341 Spain SEM
Novak et al. [103] GPA 1854 Lithuania Multivariate regression analysis
Oljaca et al. [104] GPA 584 Serbia Linear regression analysis
Osborne [105] ND 21,830 USA Multiple regression analysis
Peklaj et al. [106] Math 386 Slovenia SEM
Pina-Neves et al. [107] Portuguese, Math 2179 Portugal SEM
Rahafar et al. [108] GPA 158 Iran SEM
Robinson et al. [109] GPA 972 USA Regression models
Sæle et al. [110] GPA 1315 Norway Multivariable regression analyses
Sahin et al. [111] GPA 104 Turkey SEM
Sampasa-Kanyingaet al. [112] ND 6093 Canada Multiple linear regression
Sánchez et al. [113] GPA 143 USA Regression models
Sivertsen et al. [114] GPA 8347 Norway Regression models
Soric et al. [115] Chemistry 501 Croatia Multiple regression analysis
Titus et al. [116] Economics 640 Nigeria SEM
Tomás et al. [117] ND 614 DominicanRepublic SEM
Tonetti et al. [118] GPA 36 Italy Multiple regression analysis
Wang et al. [119] GPA 148 China Regression analysis
Wernette and Emory[120] GPA 217 USA Correlation
Zhang et al. [121] Math 10,495 China SEM
Zhou and Zhou [122] EFL 187 China Hierarchical regression analyses
Note: ND = not disclosed in the article; EFL = English as a foreign language; and GPA = grade point average.
References1. Koch, A.; Nafziger, J.; Nielsen, H.S. Behavioral Economics of Education. J. Econ. Behav. Organ. 2015, 115, 3–17. [CrossRef]2. Rivkin, S.G.; Hanushek, E.A.; Kain, J.F. Teachers, Schools, and Academic Achievement. Econometrica 2005, 73, 417–458. [CrossRef]3. Chowa, G.A.N.; Masa, R.D.; Ramos, Y.; Ansong, D. How Do Student and School Characteristics Influence Youth Academic
Achievement in Ghana? A Hierarchical Linear Modeling of Ghana YouthSave Baseline Data. Int. J. Educ. Dev. 2015, 45, 129–140.[CrossRef]
4. Spinath, B. Academic Achievement. In Encyclopedia of Human Behavior, 2nd ed.; Elsevier: Amsterdam, The Netherlands, 2012.[CrossRef]
5. Wößmann, L.; Hanushek, E. The Role of Education Quality in Economic Growth. The Role of School Improvement in EconomicDevelopment. World Bank Policy Res. Work. Pap. 2007, 4122, 1–94. [CrossRef]
6. Alexander, K.L.; Entwisle, D.R.; Kabbani, N.S. The Dropout Process in Life Course Perspective: Early Risk Factors at Home andSchool. Teach. Coll. Rec. 2001, 103, 760–822. [CrossRef]
7. Ansary, N.S.; Luthar, S.S. Distress and Academic Achievement among Adolescents of Affluence: A Study of Externalizing andInternalizing Problem Behaviors and School Performance. Dev. Psychopathol. 2009, 21, 319–341. [CrossRef] [PubMed]
8. Bishop, S.A.; Okagbue, H.I.; Odukoya, J.A. Statistical Analysis of Childhood and Early Adolescent Externalizing Behaviors in aMiddle Low Income Country. Heliyon 2020, 6, e03377. [CrossRef]
9. Leeson, P.; Ciarrochi, J.; Heaven, P.C.L. Cognitive Ability, Personality, and Academic Performance in Adolescence. Pers. Individ.Dif. 2008, 45, 630–635. [CrossRef]
10. OECD. OECD Employment Outlook 2019—The Future of Work. In The Future of Work; OECD: Paris, France, 2019. [CrossRef]

Educ. Sci. 2022, 12, 287 14 of 17
11. Janosz, M.; Le Blanc, M.; Boulerice, B.; Tremblay, R.E. Predicting Different Types of School Dropouts: A Typological Approachwith Two Longitudinal Samples. J. Educ. Psychol. 2000, 92, 171. [CrossRef]
12. European Commission/EACEA/Eurydice. Structural Indicators on Early Leaving from Education and Training in Europe—2016;European Commission: Brussels, Belgium, 2016; pp. 5–25.
13. Crain-Dorough, M.; Elder, A.C. Absorptive Capacity as a Means of Understanding and Addressing the Disconnects betweenResearch and Practice. Rev. Res. Educ. 2021, 45, 67–100. [CrossRef]
14. Ming, N.C.; Goldenberg, L.B. Research Worth Using: (Re)Framing Research Evidence Quality for Educational Policymaking andPractice. Rev. Res. Educ. 2021, 45, 129–169. [CrossRef]
15. Watts, T.W.; Duncan, G.J.; Siegler, R.S.; Davis-Kean, P.E. What’s Past Is Prologue: Relations Between Early Mathematics Knowledgeand High School Achievement. Educ. Res. 2014, 43, 352–360. [CrossRef] [PubMed]
16. Steinmayr, R.; Spinath, B. Sex Differences in School Achievement: What Are the Roles of Personality and Achievement Motivation?Eur. J. Pers. 2008, 22, 185–209. [CrossRef]
17. Ali, N.; Ullah, A.; Shah, M.; Ali, A.; Khan, S.A.; Shakoor, A.; Begum, A.; Ahmad, S. School Role in Improving Parenting Skills andAcademic Performance of Secondary Schools Students in Pakistan. Heliyon 2020, 6, e05443. [CrossRef] [PubMed]
18. Fan, X.; Chen, M. Parental Involvement and Students’ Academic Achievement: A Meta-Analysis. Educ. Psychol. Rev. 2001, 13, 1–22.[CrossRef]
19. Akiba, M.; LeTendre, G.K.; Scribner, J.P. Teacher Quality, Opportunity Gap, and National Achievement in 46 Countries. Educ. Res.2007, 36, 369–387. [CrossRef]
20. Kalogrides, D.; Loeb, S. Different Teachers, Different Peers: The Magnitude of Student Sorting within Schools. Educ. Res. 2013, 42,304–316. [CrossRef]
21. Rockoff, J.E. The Impact of Individual Teachers on Student Achievement: Evidence from Panel Data Source: Vol. 94, No. 2, Papersand Proceedings of the One Hundred Sixteenth Annual Meeting of the American Economic Association San Diego, CA. Amer.Am. Econ. Rev. 2004, 94, 247–252. [CrossRef]
22. Kubey, R.W.; Lavin, M.J.; Barrows, J.R. Internet Use and Collegiate Academic Performance Decrements: Early Findings. J. Commun.2001, 51, 366–382. [CrossRef]
23. Liebert, M.A.; Chou, C. College Students: An Online Interview Study. Cyber Psychol. Behav. 2001, 4, 573–586.24. Jackson, L.A.; Von Eye, A.; Biocca, F.A.; Barbatsis, G.; Zhao, Y.; Fitzgerald, H.E. Does Home Internet Use Influence the Academic
Performance of Low-Income Children? Dev. Psychol. 2006, 42, 429–435. [CrossRef] [PubMed]25. Torres-Díaz, J.C.; Duart, J.M.; Gómez-Alvarado, H.F.; Marín-Gutiérrez, I.; Segarra-Faggioni, V. Internet Use and Academic Success
in University Students. Comunicar 2016, 24, 61–70. [CrossRef]26. Bowman, N.A. Effect Sizes and Statistical Methods for Meta-Analysis in Higher Education. Res. High. Educ. 2012, 53, 375–382.
[CrossRef]27. Fern, E.F.; Monroe, K.B. Effect-Size Estimates: Issues and Problems in Interpretation. J. Consum. Res. 1996, 23, 89–105. [CrossRef]28. Nakkula, M.; Toshalis, E. Understanding Youth: Adolescent Development for Educators. Choice Rev. Online 2006. [CrossRef]29. Gonzalez-pienda, J.A.; Nunez, J.C.; Gonzalez-pumariega, S.; Alvarez, L.; Roces, C.; Garcia, M. A Structural Equation Model of
Parental Involvement, Motivational and Aptitudinal Characteristics, and Academic Achievement. J. Exp. Educ. 2002, 70, 257–287.[CrossRef]
30. Julien, H.; Barker, S. How High-School Students Find and Evaluate Scientific Information: A Basis for Information Literacy SkillsDevelopment. Libr. Inf. Sci. Res. 2009, 31, 12–17. [CrossRef]
31. Kleemola, K.; Hyytinen, H. Exploring the Relationship between Law Students’ Prior Performance and Academic Achievement atUniversity. Educ. Sci. 2019, 9, 236. [CrossRef]
32. Cooper, H.M. Research Synthesis and Meta-Analysis: A Step-by-Step Approach. Appl. Soc. Res. Methods Ser. 2010. [CrossRef]33. Moher, D.; Liberati, A.; Tetzlaff, J.; Altman, D.G.; Altman, D.; Antes, G.; Atkins, D.; Barbour, V.; Barrowman, N.; Berlin, J.A.; et al.
Preferred Reporting Items for Systematic Reviews and Meta-Analyses: The PRISMA Statement. PLoS Med. 2009, 6, e1000097.[CrossRef]
34. Guraya, S.Y.; Barr, H. The Effectiveness of Interprofessional Education in Healthcare: A Systematic Review and Meta-Analysis.Kaohsiung J. Med. Sci. 2018, 34, 160–165. [CrossRef] [PubMed]
35. Rust, R.T.; Cooil, B. Reliability Measures for Qualitative Data: Theory and Implications. J. Mark. Res. 1994, 31, 1–14. [CrossRef]36. Rosario, A.B.; Sotgiu, F.; De Valck, K.; Bijmolt, T.H.A. The Effect of Electronic Word of Mouth on Sales: A Meta-Analytic Review
of Platform, Product, and Metric Factors. J. Mark. Res. 2016, 53, 297–318. [CrossRef]37. Hunter, J.E.; Schmidt, F.L. Methods of Meta-Analysis: Correcting Error and Bias in Research Findings; SAGE Publications, Ltd.:
Thousand Oaks, CA, USA, 2015. [CrossRef]38. Kline, R.B. Beyond Significance Testing: Statistics Reform in the Behavioral Sciences, 2nd ed.; American Psychological Association:
Washington, DC, USA, 2013. [CrossRef]39. Santini, F.D.; Ladeira, W.J.; Sampaio, C.H.; da Silva Costa, G. Student Satisfaction in Higher Education: A Meta-Analytic Study.
J. Mark. High. Educ. 2017, 27, 1–18. [CrossRef]40. Lau, J.; Ioannidis, J.P.A.; Schmid, C.H. Summing up Evidence: One Answer Is Not Always Enough. Lancet 1998, 351, 123–127.
[CrossRef]
Educ. Sci. 2022, 12, 287 15 of 17
41. Higgins, J.P.T.; Thompson, S.G.; Deeks, J.J.; Altman, D.G. Measuring Inconsistency in Meta-Analyses. Br. Med. J. 2003, 327,557–560. [CrossRef]
42. Combs, J.G.; Crook, T.R.; Rauch, A. Meta-Analytic Research in Management: Contemporary Approaches, Unresolved Controver-sies, and Rising Standards. J. Manag. Stud. 2019, 56, 1–18. [CrossRef]
43. Viechtbauer, W. Conducting Meta-Analyses in R with the Metafor package. J. Stat. Softw. 2010, 36, 1–48. [CrossRef]44. Lipsey, M.W.; Wilson, D.B. Practical Meta-Analysis. Appl. Soc. Res. Methods Ser. 2007, 135, 58. [CrossRef]45. Bandura, A. Self-Efficacy: The Excercise of Control. Springer Ref. 1997, 13, 158–166.46. Conger, R.D.; Wallace, L.E.; Sun, Y.; Simons, R.L.; McLoyd, V.C.; Brody, G.H. Economic Pressure in African American Families:
A Replication and Extension of the Family Stress Model. Dev. Psychol. 2002, 38, 179–193. [CrossRef] [PubMed]47. Digman, J.M. Higher-Order Factors of the Big Five. J. Pers. Soc. Psychol. 1997, 73, 1246–1256. [CrossRef] [PubMed]48. Gottfredson, L.S. Why g Matters: The Complexity of Everyday Life. Intelligence 1997, 24, 79–132. [CrossRef]49. Rohde, T.E.; Thompson, L.A. Predicting Academic Achievement with Cognitive Ability. Intelligence 2007, 35, 83–92. [CrossRef]50. Furnham, A.; Cheng, H. Childhood Cognitive Ability Predicts Adult Financial Well-Being. J. Intell. 2016, 5, 3. [CrossRef]51. Brunner, M.; Krauss, S.; Kunter, M. Gender Differences in Mathematics: Does the Story Need to Be Rewritten? Intelligence 2008,
36, 403–421. [CrossRef]52. Darnon, C.; Harackiewicz, J.M.; Butera, F.; Mugny, G.; Quiamzade, A. Performance-Approach and Performance-Avoidance Goals:
When Uncertainty Makes a Difference. Personal. Soc. Psychol. Bull. 2007, 33, 813–827. [CrossRef]53. Baranik, L.E.; Stanley, L.J.; Bynum, B.H.; Lance, C.E. Examining the Construct Validity of Mastery-Avoidance Achievement Goals:
A Meta-Analysis. Hum. Perform. 2010, 23, 265–282. [CrossRef]54. McCrae, R.R.; Costa, P.T. The Five Factor Theory of Personality. In Handbook of Personality; Elsevier: Amsterdam, The Netherlands, 2008.
[CrossRef]55. Bernardo, A.B.I.; Cordel, M.O.; Lucas, R.I.G.; Teves, J.M.M.; Yap, S.A.; Chua, U.C. Using Machine Learning Approaches to Explore
Noncognitive Variables Influencing Reading Proficiency in English among Filipino Learners. Educ. Sci. 2021, 11, 628. [CrossRef]56. Fischer, C.; Pardos, Z.A.; Baker, R.S.; Williams, J.J.; Smyth, P.; Yu, R.; Slater, S.; Baker, R.; Warschauer, M. Mining Big Data in
Education: Affordances and Challenges. Rev. Res. Educ. 2020, 44, 130–160. [CrossRef]57. Cruz-Jesus, F.; Castelli, M.; Oliveira, T.; Mendes, R.; Nunes, C.; Sa-Velho, M.; Rosa-Louro, A. Using Artificial Intelligence Methods
to Assess Academic Achievement in Public High Schools of a European Union Country. Heliyon 2020, 6, e04081. [CrossRef][PubMed]
58. Bosworth, R. Class Size, Class Composition, and the Distribution of Student Achievement. Educ. Econ. 2014, 22, 141–165.[CrossRef]
59. Galyon, C.E.; Blondin, C.A.; Yaw, J.S.; Nalls, M.L.; Williams, R.L. The Relationship of Academic Self-Efficacy to Class Participationand Exam Performance. Soc. Psychol. Educ. 2012, 15, 233–249. [CrossRef]
60. Mazzetti, G.; Paolucci, A.; Guglielmi, D.; Vannini, I. The Impact of Learning Strategies and Future Orientation on AcademicSuccess: The Moderating Role of Academic Self-Efficacy among Italian Undergraduate Students. Educ. Sci. 2020, 10, 134.[CrossRef]
61. Elliot, A.J.; Murayama, K. On the Measurement of Achievement Goals: Critique, Illustration, and Application. J. Educ. Psychol.2008, 100, 613–628. [CrossRef]
62. Payne, S.C.; Youngcourt, S.S.; Beaubien, J.M. A Meta-Analytic Examination of the Goal Orientation Nomological Net. J. Appl.Psychol. 2007, 92, 128–150. [CrossRef]
63. Dumfart, B.; Neubauer, A.C. Conscientiousness Is the Most Powerful Noncognitive Predictor of School Achievement in Adoles-cents. J. Individ. Differ. 2016, 37, 8–15. [CrossRef]
64. Schunk, D.H.; Ertmer, P.A. Self-Regulation and Academic Learning: Self-Efficacy Enhancing Interventions. In Handbook ofSelf-Regulation; Elsevier: Amsterdam, The Netherlands, 2000. [CrossRef]
65. Bakadorova, O.; Raufelder, D. Do Socio-Motivational Relationships Predict Achievement Motivation in Adolescents with Highand Low School Self-Concepts? J. Educ. Res. 2016, 109, 219–231. [CrossRef]
66. Wilder, S. Effects of Parental Involvement on Academic Achievement: A Meta-Synthesis. Educ. Rev. 2014, 66, 377–397. [CrossRef]67. Hampden-Thompson, G.; Galindo, C. School–Family Relationships, School Satisfaction and the Academic Achievement of Young
People. Educ. Rev. 2017, 69, 248–265. [CrossRef]68. Li, S.; Xu, Q.; Xia, R. Relationship Between SES and Academic Achievement of Junior High School Students in China: The
Mediating Effect of Self-Concept. Front. Psychol. 2020, 10, 2513. [CrossRef] [PubMed]69. Dixson, D.D.; Keltner, D.; Worrell, F.C.; Mello, Z. The Magic of Hope: Hope Mediates the Relationship between Socioeconomic
Status and Academic Achievement. J. Educ. Res. 2018, 111, 507–515. [CrossRef]70. Xu, Z.; Turel, O.; Yuan, Y. Online Game Addiction among Adolescents: Motivation and Prevention Factors. Eur. J. Inf. Syst. 2012,
21, 321–340. [CrossRef]71. Toozandehjani, A.; Mahmoodi, Z.; Rahimzadeh, M.; Jashni Motlagh, A.; Akbari Kamrani, M.; Esmaelzadeh Saeieh, S. The
Predictor Role of Internet Addiction in High- Risk Behaviors and General Health Status among Alborz Students: A StructuralEquation Model. Heliyon 2021, 7, e06987. [CrossRef] [PubMed]
72. Venkatesh, V.; Sykes, T.A.; Chan, F.K.Y.; Thong, J.Y.L.; Hu, P.J.H. Children’s Internet Addiction, Family-to-Work Conflict, and JobOutcomes: A Study of Parent–Child Dyads. MIS Q. Manag. Inf. Syst. 2019, 43, 903–927. [CrossRef]

Educ. Sci. 2022, 12, 287 16 of 17
73. Saxvig, I.W.; Pallesen, S.; Wilhelmsen-Langeland, A.; Molde, H.; Bjorvatn, B. Prevalence and Correlates of Delayed Sleep Phase inHigh School Students. Sleep Med. 2012, 13, 193–199. [CrossRef]
74. Abdi, H.M.; Bageri, S.; Shoghi, S.; Goodarzi, S.; Hosseinzadeh, A. The Role of Metacognitive and Self-Efficacy Beliefs in Students’Test Anxiety and Academic Achievement. Aust. J. Basic Appl. Sci. 2012, 6, 418–422.
75. Ahinful, G.S.; Tauringana, V.; Bansah, E.A.; Essuman, D. Determinants of Academic Performance of Accounting Students inGhanaian Secondary and Tertiary Education Institutions. Account. Educ. 2019, 28, 553–581. [CrossRef]
76. Anderson, E.S.; Keith, T.Z. A Longitudinal Test of a Model of Academic Success for at–Risk High School Students. J. Educ. Res.1997, 90, 259–268. [CrossRef]
77. Arslan, G. Relationship between Sense of Rejection, Academic Achievement, Academic Efficacy, and Educational Purpose inHigh School Students. Egit. Ve Bilim 2016, 41, 293–304. [CrossRef]
78. Carolan, B.V. Unequal Academic Achievement in High School: The Mediating Roles of Concerted Cultivation and Close Friends.Br. J. Sociol. Educ. 2016, 37, 1034–1055. [CrossRef]
79. Cho, Y.; Coulton, C.J. The Effects of Parental Nonstandard Work Schedules on Adolescents’ Academic Achievement in Dual-EarnerHouseholds in South Korea. Child Indic. Res. 2016, 9, 193–212. [CrossRef]
80. Crook, S.J.; Sharma, M.D.; Wilson, R. An Evaluation of the Impact of 1:1 Laptops on Student Attainment in Senior High SchoolSciences. Int. J. Sci. Educ. 2015, 37, 272–293. [CrossRef]
81. Crouzevialle, M.; Butera, F. The Role of Test Anticipation in the Link between Performance-Approach Goals and AcademicAchievement: A Field Experiment with Science, Technology, Engineering, And mathematics (STEM) Classes. Swiss J. Psychol.2016, 75, 123–132. [CrossRef]
82. Di Fabio, A.; Busoni, L. Fluid Intelligence, Personality Traits and Scholastic Success: Empirical Evidence in a Sample of ItalianHigh School Students. Pers. Individ. Dif. 2007, 43, 2095–2104. [CrossRef]
83. Di Giunta, L.; Alessandri, G.; Gerbino, M.; Luengo Kanacri, P.; Zuffiano, A.; Caprara, G.V. The Determinants of ScholasticAchievement: The Contribution of Personality Traits, Self-Esteem, and Academic Self-Efficacy. Learn. Individ. Differ. 2013, 27,102–108. [CrossRef]
84. Dickhäuser, O.; Dinger, F.C.; Janke, S.; Spinath, B.; Steinmayr, R. A Prospective Correlational Analysis of Achievement Goals asMediating Constructs Linking Distal Motivational Dispositions to Intrinsic Motivation and Academic Achievement. Learn. Individ.Differ. 2016, 50, 30–41. [CrossRef]
85. Dinger, F.C.; Dickhäuser, O.; Spinath, B.; Steinmayr, R. Antecedents and Consequences of Students’ Achievement Goals:A Mediation Analysis. Learn. Individ. Differ. 2013, 28, 90–101. [CrossRef]
86. Ergene, T. The Relationships among Test Anxiety, Study Habits, Achievement, Motivation, and Academic Performance amongTurkish High School Students. Egit. Ve Bilim 2011, 36, 320–330.
87. Gibson, E.S.; Powles, A.C.P.; Thabane, L.; O’Brien, S.; Molnar, D.S.; Trajanovic, N.; Ogilvie, R.; Shapiro, C.; Yan, M.; Chilcott-Tanser,L. “Sleepiness” Is Serious in Adolescence: Two Surveys of 3235 Canadian Students. BMC Public Health 2006, 6, 1–9. [CrossRef]
88. Gilar-Corbi, R.; Miñano, P.; Veas, A.; Castejón, J.L. Testing for Invariance in a Structural Model of Academic Achievement acrossUnderachieving and Non-Underachieving Students. Contemp. Educ. Psychol. 2019, 59, 101780. [CrossRef]
89. Howard, N.R.; Howard, K.E.; Busse, R.T.; Hunt, C. Let’s Talk: An Examination of Parental Involvement as a Predictor of STEMAchievement in Math for High School Girls. Urban Educ. 2019, 0042085919877933. [CrossRef]
90. Inal, S.; Kelleci, M.; Canbulat, N. Internet Use and Its Relation with the Academic Performance for a Sample of High SchoolStudents. HealthMED 2012, 6, 1643–1650.
91. Ishak, Z.; Low, S.F.; Lau, P.L. Parenting Style as a Moderator for Students’ Academic Achievement. J. Sci. Educ. Technol. 2012, 21,487–493. [CrossRef]
92. Keith, T.Z.; Benson, M.J. Effects of Manipulable Influences on High School Grades Across Five Ethnic Groups. J. Educ. Res. 1992,86, 85–93. [CrossRef]
93. Kim, S.; Hong, S. The Effects of School Contexts and Student Characteristics on Cognitive and Affective Achievement in SouthKorea. Asia Pacific Educ. Rev. 2018, 19, 557–572. [CrossRef]
94. King, R.B.; Ganotice, F.A. The Social Underpinnings of Motivation and Achievement: Investigating the Role of Parents, Teachers,and Peers on Academic Outcomes. Asia-Pacific Educ. Res. 2014, 23, 745–756. [CrossRef]
95. Köller, O.; Meyer, J.; Saß, S.; Baumert, J. New Analyses of an Old Topic. Effects of Intelligence and Motivation on AcademicAchievement. J. Educ. Res. Online 2019, 11, 166–189.
96. Kozina, A.; Wiium, N.; Gonzalez, J.M.; Dimitrova, R. Positive Youth Development and Academic Achievement in Slovenia.Child Youth Care Forum 2019, 48, 223–240. [CrossRef]
97. Levi, U.; Einav, M.; Ziv, O.; Raskind, I.; Margalit, M. Academic Expectations and Actual Achievements: The Roles of Hope andEffort. Eur. J. Psychol. Educ. 2014, 29, 367–386. [CrossRef]
98. Liem, G.A.D.; Martin, A.J.; Porter, A.L.; Colmar, S. Sociocultural Antecedents of Academic Motivation and Achievement: Roleof Values and Achievement Motives in Achievement Goals and Academic Performance. Asian J. Soc. Psychol. 2012, 15, 1–13.[CrossRef]
99. Luo, W.; Hogan, D.; Tan, L.S.; Kaur, B.; Ng, P.T.; Chan, M. Self-Construal and Students’ Math Self-Concept, Anxiety andAchievement: An Examination of Achievement Goals as Mediators. Asian J. Soc. Psychol. 2014, 17, 184–195. [CrossRef]

Educ. Sci. 2022, 12, 287 17 of 17
100. McIlroy, D.; Palmer-Conn, S.; Lawler, B.; Poole, K.; Ursavas, O. Secondary Level Achievement Non-Intellective Factors Implicatedin the Process and Product of Performance. J. Individ. Differ. 2017, 38. [CrossRef]
101. Meyer, J.; Fleckenstein, J.; Retelsdorf, J.; Köller, O. The Relationship of Personality Traits and Different Measures of Domain-Specific Achievement in Upper Secondary Education. Learn. Individ. Differ. 2019, 69, 45–59. [CrossRef]
102. Miñano, P.; Gilar, R.; Castejón, J.L. A Structural Model of Cognitive-Motivational Variables as Explanatory Factors of AcademicAchievement in Spanish Language and Mathematics. An. Psicol. 2012, 28, 45–54.
103. Novak, D.; Emeljanovas, A.; Mieziene, B.; Antala, B.; Stefan, L.; Kawachi, I. Is Social Capital Associated with AcademicAchievement in Lithuanian High-School Students? A Population-Based Study. Montenegrin J. Sport. Sci. Med. 2018, 7, 29–35.[CrossRef]
104. Oljaca, M.; Erdeš-Kavecan, D.; Kostovic, S. Relationship between the Quality of Family Functioning and Academic Achievementin Adolescents. Croat. J. Educ. 2012, 14, 485–510.
105. Osborne, J.W. Testing Stereotype Threat: Does Anxiety Explain Race and Sex Differences in Achievement? Contemp. Educ. Psychol.2001, 26, 291–310. [CrossRef]
106. Peklaj, C.; Podlesek, A.; Pecjak, S. Gender, Previous Knowledge, Personality Traits and Subject-Specific Motivation as Predictorsof Students’ Math Grade in Upper-Secondary School. Eur. J. Psychol. Educ. 2015, 30, 313–330. [CrossRef]
107. Pina-Neves, S.; Faria, L.; Räty, H. Students’ Individual and Collective Efficacy: Joining Together Two Sets of Beliefs for Under-standing Academic Achievement. Eur. J. Psychol. Educ. 2013, 28, 453–474. [CrossRef]
108. Rahafar, A.; Maghsudloo, M.; Farhangnia, S.; Vollmer, C.; Randler, C. The Role of Chronotype, Gender, Test Anxiety, andConscientiousness in Academic Achievement of High School Students. Chronobiol. Int. 2016, 33, 1–9. [CrossRef] [PubMed]
109. Robinson, L.; Wiborg, Ø.; Schulz, J. Interlocking Inequalities: Digital Stratification Meets Academic Stratification. Am. Behav. Sci.2018, 62, 1251–1272. [CrossRef]
110. Sæle, R.G.; Sørlie, T.; Nergård-Nilssen, T.; Ottosen, K.O.; Goll, C.B.; Friborg, O. Demographic and Psychological Predictorsof Grade Point Average (GPA) in North-Norway: A Particular Analysis of Cognitive/School-Related and Literacy Problems.Educ. Psychol. 2016, 36, 1886–1907. [CrossRef]
111. Sahin, M.; Gumus, Y.Y.; Dincel, S. Game Addiction and Academic Achievement. Educ. Psychol. 2016, 36, 1540–1550. [CrossRef]112. Sampasa-Kanyinga, H.; Chaput, J.P.; Hamilton, H.A. Social Media Use, School Connectedness, and Academic Performance
Among Adolescents. J. Prim. Prev. 2019, 40, 189–211. [CrossRef]113. Sánchez, B.; Colón, Y.; Esparza, P. The Role of Sense of School Belonging and Gender in the Academic Adjustment of Latino
Adolescents. J. Youth Adolesc. 2005, 34, 619–628. [CrossRef]114. Sivertsen, B.; Glozier, N.; Harvey, A.G.; Hysing, M. Academic Performance in Adolescents with Delayed Sleep Phase. Sleep Med.
2015, 16, 1084–1090. [CrossRef]115. Soric, I.; Penezic, Z.; Buric, I. The Big Five Personality Traits, Goal Orientations, and Academic Achievement. Learn. Individ. Differ.
2017, 54, 126–134. [CrossRef]116. Titus, A.B.; Dada, A.B.; Adu, E.O. School Location and Gender as Correlates of Students’ Academic Achievement in Economics.
Int. J. Educ. Sci. 2016, 13, 255–261. [CrossRef]117. Tomás, J.M.; Gutiérrez, M.; Georgieva, S.; Hernández, M. The Effects of Self-Efficacy, Hope, and Engagement on the Academic
Achievement of Secondary Education in the Dominican Republic. Psychol. Sch. 2020, 57, 191–203. [CrossRef]118. Tonetti, L.; Fabbri, M.; Filardi, M.; Martoni, M.; Natale, V. Effects of Sleep Timing, Sleep Quality and Sleep Duration on School
Achievement in Adolescents. Sleep Med. 2015, 16, 936–940. [CrossRef] [PubMed]119. Wang, S.; Zhao, Y.; Li, J.; Wang, X.; Luo, K.; Gong, Q. Brain Structure Links Trait Conscientiousness to Academic Performance.
Sci. Rep. 2019, 9, 1–12. [CrossRef] [PubMed]120. Wernette, M.J.; Emory, J. Student Bedtimes, Academic Performance, and Health in a Residential High School. J. Sch. Nurs. 2017,
33, 264–268. [CrossRef] [PubMed]121. Zhang, D.; Cui, Y.; Zhou, Y.; Cai, M.; Liu, H. The Role of School Adaptation and Self-Concept in Influencing Chinese High School
Students’ Growth in Math Achievement. Front. Psychol. 2018, 9, 2356. [CrossRef] [PubMed]122. Zhou, W.; Zhou, M. Role of Self-Identity and Self-Determination in English Learning among High School Students. J. Lang.
Identity Educ. 2018, 17, 168–181. [CrossRef]
Copyright © 2022 FDOKUMEN