A Web-based semantic tagging and activity recognition system for species' accelerometry data
10
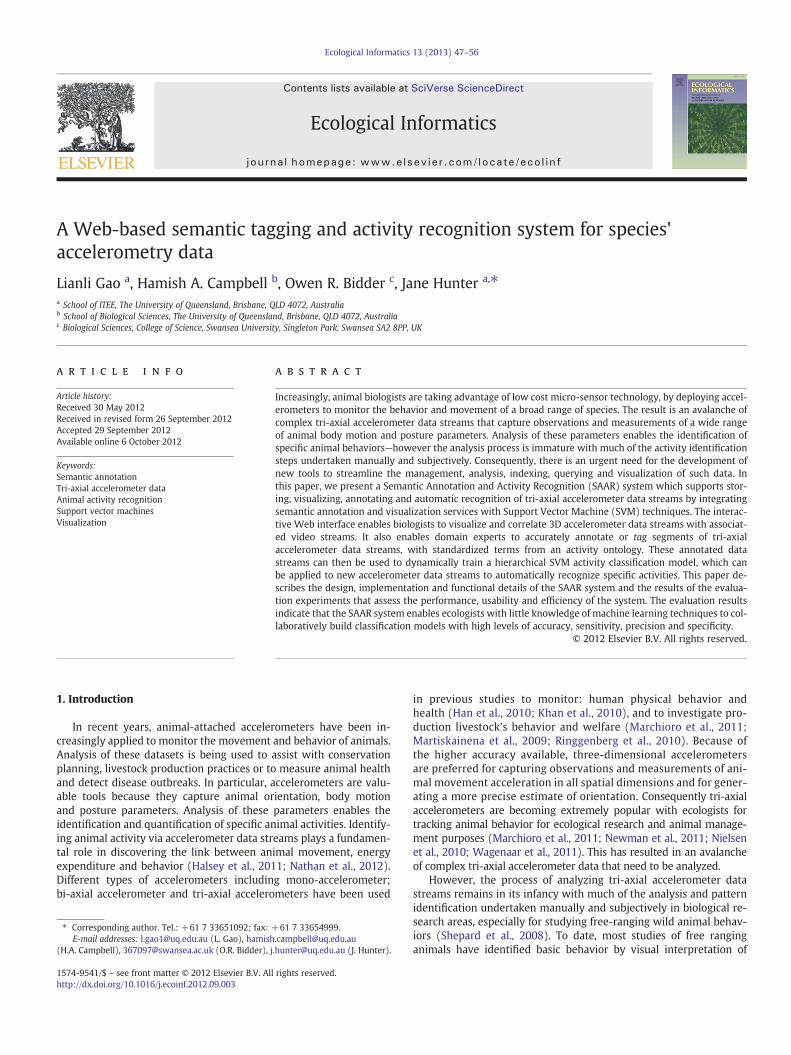
A Web-based semantic tagging and activity recognition system for species' accelerometry data Lianli Gao a , Hamish A. Campbell b , Owen R. Bidder c , Jane Hunter a, ⁎ a School of ITEE, The University of Queensland, Brisbane, QLD 4072, Australia b School of Biological Sciences, The University of Queensland, Brisbane, QLD 4072, Australia c Biological Sciences, College of Science, Swansea University, Singleton Park, Swansea SA2 8PP, UK abstract article info Article history: Received 30 May 2012 Received in revised form 26 September 2012 Accepted 29 September 2012 Available online 6 October 2012 Keywords: Semantic annotation Tri-axial accelerometer data Animal activity recognition Support vector machines Visualization Increasingly, animal biologists are taking advantage of low cost micro-sensor technology, by deploying accel- erometers to monitor the behavior and movement of a broad range of species. The result is an avalanche of complex tri-axial accelerometer data streams that capture observations and measurements of a wide range of animal body motion and posture parameters. Analysis of these parameters enables the identification of specific animal behaviors—however the analysis process is immature with much of the activity identification steps undertaken manually and subjectively. Consequently, there is an urgent need for the development of new tools to streamline the management, analysis, indexing, querying and visualization of such data. In this paper, we present a Semantic Annotation and Activity Recognition (SAAR) system which supports stor- ing, visualizing, annotating and automatic recognition of tri-axial accelerometer data streams by integrating semantic annotation and visualization services with Support Vector Machine (SVM) techniques. The interac- tive Web interface enables biologists to visualize and correlate 3D accelerometer data streams with associat- ed video streams. It also enables domain experts to accurately annotate or tag segments of tri-axial accelerometer data streams, with standardized terms from an activity ontology. These annotated data streams can then be used to dynamically train a hierarchical SVM activity classification model, which can be applied to new accelerometer data streams to automatically recognize specific activities. This paper de- scribes the design, implementation and functional details of the SAAR system and the results of the evalua- tion experiments that assess the performance, usability and efficiency of the system. The evaluation results indicate that the SAAR system enables ecologists with little knowledge of machine learning techniques to col- laboratively build classification models with high levels of accuracy, sensitivity, precision and specificity. © 2012 Elsevier B.V. All rights reserved. 1. Introduction In recent years, animal-attached accelerometers have been in- creasingly applied to monitor the movement and behavior of animals. Analysis of these datasets is being used to assist with conservation planning, livestock production practices or to measure animal health and detect disease outbreaks. In particular, accelerometers are valu- able tools because they capture animal orientation, body motion and posture parameters. Analysis of these parameters enables the identification and quantification of specific animal activities. Identify- ing animal activity via accelerometer data streams plays a fundamen- tal role in discovering the link between animal movement, energy expenditure and behavior (Halsey et al., 2011; Nathan et al., 2012). Different types of accelerometers including mono-accelerometer; bi-axial accelerometer and tri-axial accelerometers have been used in previous studies to monitor: human physical behavior and health (Han et al., 2010; Khan et al., 2010), and to investigate pro- duction livestock's behavior and welfare (Marchioro et al., 2011; Martiskainena et al., 2009; Ringgenberg et al., 2010). Because of the higher accuracy available, three-dimensional accelerometers are preferred for capturing observations and measurements of ani- mal movement acceleration in all spatial dimensions and for gener- ating a more precise estimate of orientation. Consequently tri-axial accelerometers are becoming extremely popular with ecologists for tracking animal behavior for ecological research and animal manage- ment purposes (Marchioro et al., 2011; Newman et al., 2011; Nielsen et al., 2010; Wagenaar et al., 2011). This has resulted in an avalanche of complex tri-axial accelerometer data that need to be analyzed. However, the process of analyzing tri-axial accelerometer data streams remains in its infancy with much of the analysis and pattern identification undertaken manually and subjectively in biological re- search areas, especially for studying free-ranging wild animal behav- iors (Shepard et al., 2008). To date, most studies of free ranging animals have identified basic behavior by visual interpretation of Ecological Informatics 13 (2013) 47–56 ⁎ Corresponding author. Tel.: +61 7 33651092; fax: +61 7 33654999. E-mail addresses: [email protected] (L. Gao), [email protected] (H.A. Campbell), [email protected] (O.R. Bidder), [email protected] (J. Hunter). 1574-9541/$ – see front matter © 2012 Elsevier B.V. All rights reserved. http://dx.doi.org/10.1016/j.ecoinf.2012.09.003 Contents lists available at SciVerse ScienceDirect Ecological Informatics journal homepage: www.elsevier.com/locate/ecolinf
Transcript of A Web-based semantic tagging and activity recognition system for species' accelerometry data
Ecological Informatics 13 (2013) 47–56
Contents lists available at SciVerse ScienceDirect
Ecological Informatics
j ourna l homepage: www.e lsev ie r .com/ locate /eco l in f
A Web-based semantic tagging and activity recognition system for species'accelerometry data
Lianli Gao a, Hamish A. Campbell b, Owen R. Bidder c, Jane Hunter a,⁎a School of ITEE, The University of Queensland, Brisbane, QLD 4072, Australiab School of Biological Sciences, The University of Queensland, Brisbane, QLD 4072, Australiac Biological Sciences, College of Science, Swansea University, Singleton Park, Swansea SA2 8PP, UK
⁎ Corresponding author. Tel.: +61 7 33651092; fax: +E-mail addresses: [email protected] (L. Gao), hamish
(H.A. Campbell), [email protected] (O.R. Bidder), j
1574-9541/$ – see front matter © 2012 Elsevier B.V. Allhttp://dx.doi.org/10.1016/j.ecoinf.2012.09.003
a b s t r a c t
a r t i c l e i n f oArticle history:Received 30 May 2012Received in revised form 26 September 2012Accepted 29 September 2012Available online 6 October 2012
Keywords:Semantic annotationTri-axial accelerometer dataAnimal activity recognitionSupport vector machinesVisualization
Increasingly, animal biologists are taking advantage of low cost micro-sensor technology, by deploying accel-erometers to monitor the behavior and movement of a broad range of species. The result is an avalanche ofcomplex tri-axial accelerometer data streams that capture observations and measurements of a wide rangeof animal body motion and posture parameters. Analysis of these parameters enables the identification ofspecific animal behaviors—however the analysis process is immature with much of the activity identificationsteps undertaken manually and subjectively. Consequently, there is an urgent need for the development ofnew tools to streamline the management, analysis, indexing, querying and visualization of such data. Inthis paper, we present a Semantic Annotation and Activity Recognition (SAAR) system which supports stor-ing, visualizing, annotating and automatic recognition of tri-axial accelerometer data streams by integratingsemantic annotation and visualization services with Support Vector Machine (SVM) techniques. The interac-tive Web interface enables biologists to visualize and correlate 3D accelerometer data streams with associat-ed video streams. It also enables domain experts to accurately annotate or tag segments of tri-axialaccelerometer data streams, with standardized terms from an activity ontology. These annotated datastreams can then be used to dynamically train a hierarchical SVM activity classification model, which canbe applied to new accelerometer data streams to automatically recognize specific activities. This paper de-scribes the design, implementation and functional details of the SAAR system and the results of the evalua-tion experiments that assess the performance, usability and efficiency of the system. The evaluation resultsindicate that the SAAR system enables ecologists with little knowledge of machine learning techniques to col-laboratively build classification models with high levels of accuracy, sensitivity, precision and specificity.
© 2012 Elsevier B.V. All rights reserved.
1. Introduction
In recent years, animal-attached accelerometers have been in-creasingly applied to monitor the movement and behavior of animals.Analysis of these datasets is being used to assist with conservationplanning, livestock production practices or to measure animal healthand detect disease outbreaks. In particular, accelerometers are valu-able tools because they capture animal orientation, body motionand posture parameters. Analysis of these parameters enables theidentification and quantification of specific animal activities. Identify-ing animal activity via accelerometer data streams plays a fundamen-tal role in discovering the link between animal movement, energyexpenditure and behavior (Halsey et al., 2011; Nathan et al., 2012).Different types of accelerometers including mono-accelerometer;bi-axial accelerometer and tri-axial accelerometers have been used
61 7 [email protected]@uq.edu.au (J. Hunter).
rights reserved.
in previous studies to monitor: human physical behavior andhealth (Han et al., 2010; Khan et al., 2010), and to investigate pro-duction livestock's behavior and welfare (Marchioro et al., 2011;Martiskainena et al., 2009; Ringgenberg et al., 2010). Because ofthe higher accuracy available, three-dimensional accelerometersare preferred for capturing observations and measurements of ani-mal movement acceleration in all spatial dimensions and for gener-ating a more precise estimate of orientation. Consequently tri-axialaccelerometers are becoming extremely popular with ecologists fortracking animal behavior for ecological research and animal manage-ment purposes (Marchioro et al., 2011; Newman et al., 2011; Nielsenet al., 2010; Wagenaar et al., 2011). This has resulted in an avalancheof complex tri-axial accelerometer data that need to be analyzed.
However, the process of analyzing tri-axial accelerometer datastreams remains in its infancy with much of the analysis and patternidentification undertaken manually and subjectively in biological re-search areas, especially for studying free-ranging wild animal behav-iors (Shepard et al., 2008). To date, most studies of free ranginganimals have identified basic behavior by visual interpretation of
48 L. Gao et al. / Ecological Informatics 13 (2013) 47–56
accelerometer data (Halsey et al., 2009), empirical calculation viathreshold values (Lagarde et al., 2008) or mathematical calculationsover Microsoft Excel spreadsheets (Shepard et al., 2008). Some recentstudies have applied machine learning techniques to recognize activitiesin humans (Zhenyu and Lianwen, 2009) and animals (Martiskainena etal., 2009; Nathan et al., 2012). However, this research focuses on theoptimization of feature extraction algorithms rather than the provi-sion of an integratedWeb-based system that combines visualization,tagging and automatic recognition tools with a repository for storingthe indexed tri-axial accelerometer data streams.
In particular, the interpretation of wild animal accelerometer datais a difficult problem due to: the volume and complexity of the datastreams; the variability of activity and behavioral patterns across an-imals (due to age, environment, season); the lack of visualization andanalysis tools; the inability to share data and knowledge between ex-perts; the lack of verifiable reference data e.g., using observationalvideo; and the inaccessibility of automatic recognition services. More-over, the steep learning curve associated with building and applyingmachine learning or pattern recognition techniques to accelerometerdata limits the accessibility of these approaches to a relatively smallgroup of experts.
The SAAR (Semantic Annotation and Activity Recognition) systemwas designed to provide solutions to the issues outlined above and toachieve the following objectives and user requirements:
• To provide a repository on the Web where researchers monitoringanimal behavior, can upload and share their datasets—and alsosearch, retrieve and compare datasets from the same or differentspecies;
• To provide interactive graphical visualization services that enablescientists to quickly and easily view and explore tri-axial acceler-ometer data streams and temporally align simultaneously re-corded video (where available) that can be used to verify behavior/activities;
• To provide a platform by which ecologists can interactively record,share and re-use domain expert knowledge on animal movementswithin tri-axial accelerometer data streams in an interoperable,re-usable manner;
• To provide a set of Web services that can be used to analyze, tag andvisualize 3D accelerometer datasets and synchronized video usingterms from controlled vocabularies (pre-defined ontologies);
• To enable ecologists to build their own automatic activity recognitionmodels by training classifiers using features extracted from pre-annotated training sets;
• To assess the quality of results generated by Support Vector Machine(SVM)-based activity recognition classifiers that have been trainedusing manually annotated data for a variety of species (human, dog,badger);
• To determine whether an activity recognition classifier trained usingdata from one species (e.g., a domestic dog) can be usefully applied toother species (e.g., a badger) or wild species (e.g., a dingo), of similarsize and gait.
• To enable the sharing, re-use and refinement of activity recognitionclassifiers developed for specific species, between scientists.
In the remainder of this paper, we describe the SAAR system inmore detail. Section 2 provides detailed information about the re-search methodology, the underlying data/metadata models and theautomatic machine learning approach we have adopted. Section 3 de-scribes the implementation details and provides information aboutthe system infrastructure, functionality and screen shots of the userinterface. Section 4 describes the evaluation process. Section 5 analy-ses the evaluation results including the performance of the hierarchi-cal classifier and the usability of the system. Finally, we discuss ourcontributions, system limitations, as well as the future plans andconclusions.
2. Methodology
2.1. Case study and data collection
The challenge for many ecologists is to understand the movementand behavior of animals “in the wild”. Researchers are currently usingaccelerometers to measure the activity levels and movement of manywild animals (including crocodiles (Campbell et al., 2010), bears(Gervasi et al., 2006) and badgers (Shepard et al., 2008)) to assistwith their management and conservation. In Australia, researchersare investigating the behavior and movement of wild dogs anddingoes in order to develop appropriate management strategies(DERM, 2006; Mitchell and Balogh, 2007). The difficulty with analyz-ing tri-axial accelerometer data from wild animals is that there is lit-tle or no observational data or video that provides the evidence fortraining an automatic activity recognitionmodel. One of the secondaryaims of our work described here is to develop a model for domesticquadruped mammals (i.e., domestic dogs) using the associated videoas verification and to see if this model can be used to accurately recog-nize activities of other similar-sized quadruped mammals (e.g., bad-gers) or similar species in the wild (e.g., dingoes), for which there isno corresponding observational video.
A tri-axial accelerometer (G6A), produced by Cefas TechnologyLimited (CTL), was used to collect human and dog data sets. Thisdata logger is 40 mm×28 mm×16.3 mm, 16 MB memory, 7.3 gweight in air and 2.3 g weight in seawater. It supports a wide rangeof sampling rates from 1 Hz up to 30 Hz. In this study, a sampling fre-quency of 1 Hz was selected, as this is sufficient to detect changes inbehavior and can be used to monitor animals for long periods of timewithout producing vast volumes of redundant data.
We collected data from eight voluntary students and staff from theUniversity of Queensland (four males and four females). They are allhealthy with no physical problems and their ages range from 25 to38. This human data collection was divided into two stages: trainingdata collection and test data collection. The G6A was attached to theshoulder of each volunteer with X axis pointing backwards, Y axispointing left and Z axis pointing upward. At the training data collec-tion stage, each volunteer was asked to do 3 minute walking, 3 min-ute running, 1 minute sit-ups, 3 minute standing, 3 minute sittingand 3 minute lying. At the test data collection stage, each volunteerwas asked to arbitrarily perform these same six activities over a15 minute period. During the entire data collection phase, a camerasimultaneously recorded video which provides the ground truth forthe evaluation phase.
Next, we collected data from domestic dogs. The same accelerom-eter device (G6A) was attached to the back of each dog's neck via itscollar. Six dogs of different breeds and ages were observed (4 year oldBorder Collie, 15 kg weight, 52 cm height; 1 year old dachshund,8.9 kg weight, 20 cm height; 8 year old Cocker Spaniel, 14 kg weight,35 cm height; 5 year old German Short-Haired Pointer, 25.8 kgweight, 63 cm height; 10 years old Staffordshire Terrier–Labradorcross, 21 kg weight, 55 cm height; 5 years old Cavalier King CharlesSpaniel, 7.5 kg weight, 30 cm height). During the training data collec-tion stage, each dog was led by its owner to perform 2 minute walk-ing, 2 minute running, 2 minute standing, 2 minute sitting and2 minute lying. In addition the King Charles Spaniel spent 1 minuteforaging/digging and 1 minute climbing (front paws raised to reacha treat, while the owner walked backwards). During the test data col-lection stage, each dog was led by its owner to randomly perform theactivities above over a period of 10 min. During the entire data collec-tion phase, a camera simultaneously recorded video which providesthe ground truth for the evaluation phase.
In addition, Eurasian badger data was collected from studies un-dertaken at West Hatch RSPCA Centre, Somerset, UK. During thesestudies, five Eurasian badgers were equipped with tri-axial acceler-ometers that were attached to a leather collar fastened round the
49L. Gao et al. / Ecological Informatics 13 (2013) 47–56
badgers' necks with X axis pointing backwards, Y axis pointing leftand Z axis pointing upward (Shepard et al., 2008). Camera trapswere also set up to verify some activities, although large periods of ac-tivity were outside the camera's field of view. Where no verificationby video was possible, manual annotations were made based onprior knowledge and the principals set out by Shepard et al. (2008).Six activities were annotated: walking, running, climbing, foraging,standing and lying.
2.2. Process
Our approach to this research can be sub-divided into the eightstages described below:
1. A Web interface was developed that enables datasets (tri-axial ac-celerometer data in CSV format and corresponding videos in (OggVorbis) OGV format) to be uploaded to the system's server and de-scribed using simple metadata including: Creator, dateCaptured,Species, AnimalID, Location, Coordinates, Description.
2. Users can search, browse, retrieve and open specific datasets andvisualize both the tri-axial accelerometer data (and associatedvideo if available) through a graphical user interface that com-prises two panels (Plot and Video) – juxtaposed one above theother – that display both the tri-axial movement data streamsand the video stream. Simple alignment tools enable users to pre-cisely synchronize the data and video streams.
3. An ontology-based annotation service enables domain experts totag tri-axial accelerometer data streams manually via the com-bined Plot and Video user interface—using predefined ontologiesthat capture the terms describing activities of interest to the re-searcher and of relevance to the animal being studied e.g. running,walking, standing, sitting, and lying. Separate ontologies can be de-veloped for different terrestrial, marine and avian species and themost appropriate ontology selected at run-time.
4. The manually attached tags (and pointers to relevant filesegments/time stamps) are stored on an annotation server inRDF format. Through the annotation interface, users can sharetheir tags with other users, search and retrieve specific tags/annotations and associated accelerometer data segments e.g. giveme all segments in which animal with ID “abcd” is “running”.
5. A user then specifies the set of tagged data streams which are to beused as the training data. The system retrieves and aggregates all ofthe data corresponding to each tag/label and extracts a set ofapplication-dependent features that represent that tag/label. Theapplication-dependent features and representative labels are thenused to interactively train a hierarchical SVM classifier that recog-nizes both “active” and “inactive” states as well as more specificsub-class activities.
6. When new tri-axial accelerometer data streams are uploaded, thecorresponding application-dependent features are extracted andthen input into the trained SVM classifier which automaticallytags/annotates the new data streams. The classification resultsare stored in RDF on the annotation server and displayed via theWeb visualization interface for biologists to verify or correct.
7. Finally, statistical analysis tools are also provided that calculate thestatistics for each activity for a single animal or a set of animals (in-cluding average, minimum, maximum time of occurrence, cumula-tive time of occurrence in the whole period, total number ofoccurrence and standard deviation of the duration time). These re-sults are presented as a pie chart on the Web interface.
8. To evaluate the system we assess the performance of differentSVM classifiers by comparing the automatically tagged datastreams against ground truth data (captured via video or handtagged data streams).We also assess the system's usability and ef-ficiency by collecting and analyzing users' feedback and perfor-mance metrics.
2.3. Activity recognition using support vector machines
SVMs (Support Vector Machines) are well established as a suc-cessful modeling and prediction tool for both pattern classificationand regression tasks. They are linear classifiers based on statisticallearning theory and the idea of the maximum margin hyper-plane.In previous species activity identification studies (Martiskainena etal., 2009; Zhen-Yu and Lian-Wen, 2008, 2009), SVMs demonstraterelatively good performance when applied to the classification oftri-axial accelerometer data streams from humans and cows. ForSAAR, we decided to use the LIBSVM library (Chang and Lin, 2011)because it is open source, written in Java and is simple to downloadand use. More specifically, we decided to use the C-SVC (C-supportVector Classification) algorithm (Boser et al., 1992) from theLIBSVM library because it is the simplest SVM approach.
Our activity recognition service is designed to perform on two hi-erarchical levels: high level recognition and low level recognition. Thehigh level recognition service identifies active and inactive activities,while the low level recognition recognizes specific activities whichare sub-classes of the active and the inactive activity classes (for ex-ample, walking, running, feeding, sleeping, lying, etc.). In order touse the C-SVC algorithms to automatically recognize tri-axial acceler-ometer data stream patterns, application-dependent features have tobe extracted.
In this study, features were extracted using a window size of 3 swith an overlap of 1 s (2 sampling points for 1 Hz sampling rate)between consecutive windows. There are three reasons forselecting this window length and overlap. Firstly, feature extrac-tion on sliding windows with 50% overlap (2/4 samples overlap)has been demonstrated to achieve accurate results in previous re-search efforts (Bao and Intille, 2004; Li et al., 2010; Ravi et al.,2005; Yang et al., 2008). Secondly, it has been shown that a win-dow of 2 s can capture activities (Li et al., 2010), hence a windowof 3 s with 1 second overlap will be sufficient to capture activities.Thirdly, the most efficient algorithm for calculating the Fast FourierTransform (FFT) usually operates with a time window length that isa power of two.
At the high level recognition, we extract the following featuresincluding standard deviation vector, signal magnitude area vectorand waveform length vector. They are expressed respectively asfollows:
• Standard deviation (SD): The standard deviation measures howspread out the signal is within x-axis, y-axis and z-axis respectively.
SD ¼ffiffiffiffiffiffiffiffiffiffiffiffiffiffiffiffiffiffiffiffiffiffiffiffiffiffiffiffiffiffiffiffiffiffiffiffiffiffiffiffiffiffiffiffiffiffiffiffiffiffiffiffiffiffiffiffi1
N−1
XNi¼1
xi−1N
XNk ¼1
xk
!2vuut :
Where xi and xk are the ith and the kth accelerometer values onthe x-axis, y-axis and z-axis, and N is the window size.
• Signal magnitude area (SMA): The signal magnitude area is found tobe a suitable measurement of the degree of movement intensitythat can distinguish between active and inactive activities usingtri-axial accelerometer data (Khan et al., 2008).
SMA ¼ 1N
XNi¼1
xij j þXNi¼1
yij j þXNi¼1
zij j !
:
• Waveform Length (WL): TheWL is the cumulative length of thewave-form amplitude, frequency and duration all within a signal window.
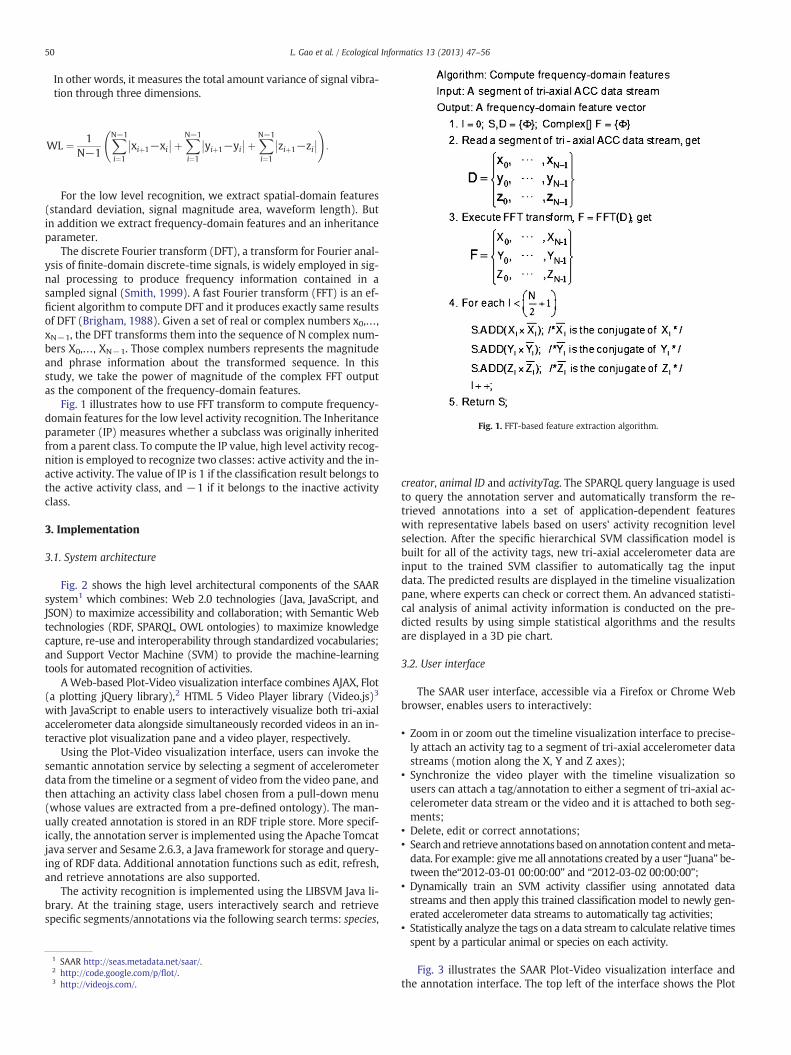
Fig. 1. FFT-based feature extraction algorithm.
50 L. Gao et al. / Ecological Informatics 13 (2013) 47–56
In other words, it measures the total amount variance of signal vibra-tion through three dimensions.
WL ¼ 1N−1
XN−1
i¼1
xiþ1−xi�� ��þXN−1
i¼1
yiþ1−yi�� ��þXN−1
i¼1
ziþ1−zi�� �� !
:
For the low level recognition, we extract spatial-domain features(standard deviation, signal magnitude area, waveform length). Butin addition we extract frequency-domain features and an inheritanceparameter.
The discrete Fourier transform (DFT), a transform for Fourier anal-ysis of finite-domain discrete-time signals, is widely employed in sig-nal processing to produce frequency information contained in asampled signal (Smith, 1999). A fast Fourier transform (FFT) is an ef-ficient algorithm to compute DFT and it produces exactly same resultsof DFT (Brigham, 1988). Given a set of real or complex numbers x0‚…‚
xN−1, the DFT transforms them into the sequence of N complex num-bers X0‚…‚ XN−1. Those complex numbers represents the magnitudeand phrase information about the transformed sequence. In thisstudy, we take the power of magnitude of the complex FFT outputas the component of the frequency-domain features.
Fig. 1 illustrates how to use FFT transform to compute frequency-domain features for the low level activity recognition. The Inheritanceparameter (IP) measures whether a subclass was originally inheritedfrom a parent class. To compute the IP value, high level activity recog-nition is employed to recognize two classes: active activity and the in-active activity. The value of IP is 1 if the classification result belongs tothe active activity class, and −1 if it belongs to the inactive activityclass.
3. Implementation
3.1. System architecture
Fig. 2 shows the high level architectural components of the SAARsystem1 which combines: Web 2.0 technologies (Java, JavaScript, andJSON) to maximize accessibility and collaboration; with Semantic Webtechnologies (RDF, SPARQL, OWL ontologies) to maximize knowledgecapture, re-use and interoperability through standardized vocabularies;and Support Vector Machine (SVM) to provide the machine-learningtools for automated recognition of activities.
AWeb-based Plot-Video visualization interface combines AJAX, Flot(a plotting jQuery library),2 HTML 5 Video Player library (Video.js)3
with JavaScript to enable users to interactively visualize both tri-axialaccelerometer data alongside simultaneously recorded videos in an in-teractive plot visualization pane and a video player, respectively.
Using the Plot-Video visualization interface, users can invoke thesemantic annotation service by selecting a segment of accelerometerdata from the timeline or a segment of video from the video pane, andthen attaching an activity class label chosen from a pull-down menu(whose values are extracted from a pre-defined ontology). The man-ually created annotation is stored in an RDF triple store. More specif-ically, the annotation server is implemented using the Apache Tomcatjava server and Sesame 2.6.3, a Java framework for storage and query-ing of RDF data. Additional annotation functions such as edit, refresh,and retrieve annotations are also supported.
The activity recognition is implemented using the LIBSVM Java li-brary. At the training stage, users interactively search and retrievespecific segments/annotations via the following search terms: species,
1 SAAR http://seas.metadata.net/saar/.2 http://code.google.com/p/flot/.3 http://videojs.com/.
creator, animal ID and activityTag. The SPARQL query language is usedto query the annotation server and automatically transform the re-trieved annotations into a set of application-dependent featureswith representative labels based on users' activity recognition levelselection. After the specific hierarchical SVM classification model isbuilt for all of the activity tags, new tri-axial accelerometer data areinput to the trained SVM classifier to automatically tag the inputdata. The predicted results are displayed in the timeline visualizationpane, where experts can check or correct them. An advanced statisti-cal analysis of animal activity information is conducted on the pre-dicted results by using simple statistical algorithms and the resultsare displayed in a 3D pie chart.
3.2. User interface
The SAAR user interface, accessible via a Firefox or Chrome Webbrowser, enables users to interactively:
• Zoom in or zoom out the timeline visualization interface to precise-ly attach an activity tag to a segment of tri-axial accelerometer datastreams (motion along the X, Y and Z axes);
• Synchronize the video player with the timeline visualization sousers can attach a tag/annotation to either a segment of tri-axial ac-celerometer data stream or the video and it is attached to both seg-ments;
• Delete, edit or correct annotations;• Search and retrieve annotations basedon annotation content andmeta-data. For example: giveme all annotations created by a user “Juana” be-tween the“2012-03-01 00:00:00” and “2012-03-02 00:00:00”;
• Dynamically train an SVM activity classifier using annotated datastreams and then apply this trained classification model to newly gen-erated accelerometer data streams to automatically tag activities;
• Statistically analyze the tags on a data stream to calculate relative timesspent by a particular animal or species on each activity.
Fig. 3 illustrates the SAAR Plot-Video visualization interface andthe annotation interface. The top left of the interface shows the Plot
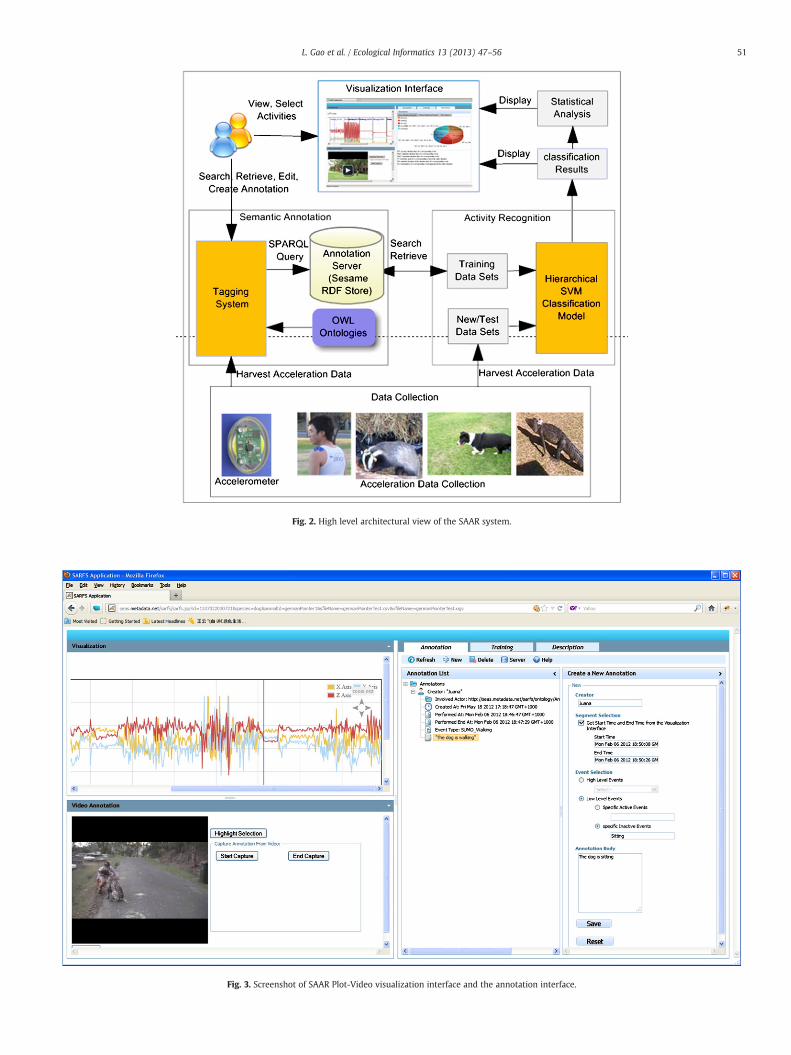
Fig. 2. High level architectural view of the SAAR system.
Fig. 3. Screenshot of SAAR Plot-Video visualization interface and the annotation interface.
51L. Gao et al. / Ecological Informatics 13 (2013) 47–56
52 L. Gao et al. / Ecological Informatics 13 (2013) 47–56
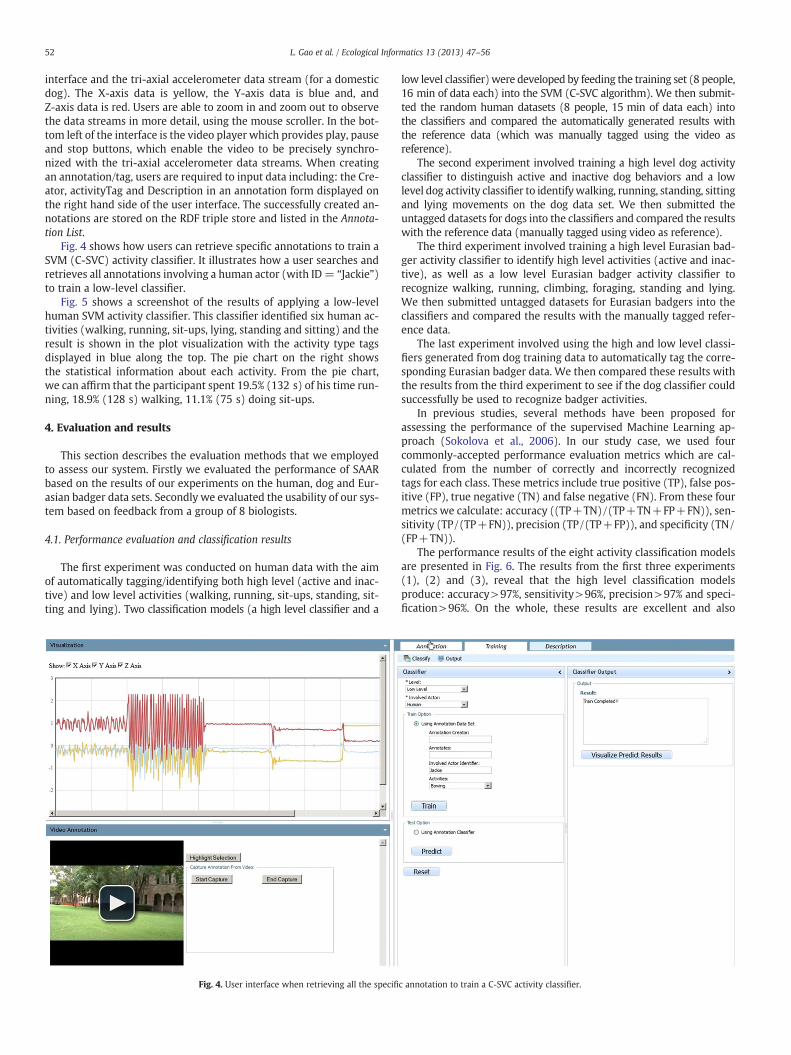
interface and the tri-axial accelerometer data stream (for a domesticdog). The X-axis data is yellow, the Y-axis data is blue and, andZ-axis data is red. Users are able to zoom in and zoom out to observethe data streams in more detail, using the mouse scroller. In the bot-tom left of the interface is the video player which provides play, pauseand stop buttons, which enable the video to be precisely synchro-nized with the tri-axial accelerometer data streams. When creatingan annotation/tag, users are required to input data including: the Cre-ator, activityTag and Description in an annotation form displayed onthe right hand side of the user interface. The successfully created an-notations are stored on the RDF triple store and listed in the Annota-tion List.
Fig. 4 shows how users can retrieve specific annotations to train aSVM (C-SVC) activity classifier. It illustrates how a user searches andretrieves all annotations involving a human actor (with ID= “Jackie”)to train a low-level classifier.
Fig. 5 shows a screenshot of the results of applying a low-levelhuman SVM activity classifier. This classifier identified six human ac-tivities (walking, running, sit-ups, lying, standing and sitting) and theresult is shown in the plot visualization with the activity type tagsdisplayed in blue along the top. The pie chart on the right showsthe statistical information about each activity. From the pie chart,we can affirm that the participant spent 19.5% (132 s) of his time run-ning, 18.9% (128 s) walking, 11.1% (75 s) doing sit-ups.
4. Evaluation and results
This section describes the evaluation methods that we employedto assess our system. Firstly we evaluated the performance of SAARbased on the results of our experiments on the human, dog and Eur-asian badger data sets. Secondly we evaluated the usability of our sys-tem based on feedback from a group of 8 biologists.
4.1. Performance evaluation and classification results
The first experiment was conducted on human data with the aimof automatically tagging/identifying both high level (active and inac-tive) and low level activities (walking, running, sit-ups, standing, sit-ting and lying). Two classification models (a high level classifier and a
Fig. 4. User interface when retrieving all the specifi
low level classifier)were developed by feeding the training set (8 people,16 min of data each) into the SVM (C-SVC algorithm). We then submit-ted the random human datasets (8 people, 15 min of data each) intothe classifiers and compared the automatically generated results withthe reference data (which was manually tagged using the video asreference).
The second experiment involved training a high level dog activityclassifier to distinguish active and inactive dog behaviors and a lowlevel dog activity classifier to identifywalking, running, standing, sittingand lying movements on the dog data set. We then submitted theuntagged datasets for dogs into the classifiers and compared the resultswith the reference data (manually tagged using video as reference).
The third experiment involved training a high level Eurasian bad-ger activity classifier to identify high level activities (active and inac-tive), as well as a low level Eurasian badger activity classifier torecognize walking, running, climbing, foraging, standing and lying.We then submitted untagged datasets for Eurasian badgers into theclassifiers and compared the results with the manually tagged refer-ence data.
The last experiment involved using the high and low level classi-fiers generated from dog training data to automatically tag the corre-sponding Eurasian badger data. We then compared these results withthe results from the third experiment to see if the dog classifier couldsuccessfully be used to recognize badger activities.
In previous studies, several methods have been proposed forassessing the performance of the supervised Machine Learning ap-proach (Sokolova et al., 2006). In our study case, we used fourcommonly-accepted performance evaluation metrics which are cal-culated from the number of correctly and incorrectly recognizedtags for each class. These metrics include true positive (TP), false pos-itive (FP), true negative (TN) and false negative (FN). From these fourmetrics we calculate: accuracy ((TP+TN)/(TP+TN+FP+FN)), sen-sitivity (TP/(TP+FN)), precision (TP/(TP+FP)), and specificity (TN/(FP+TN)).
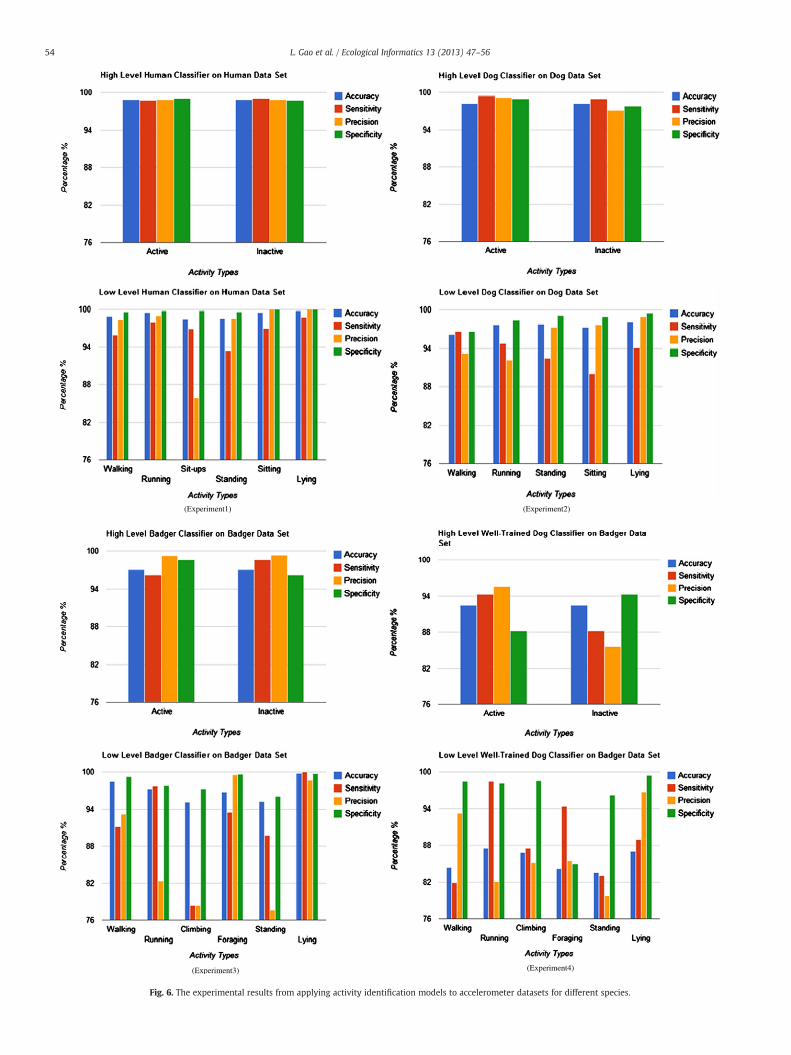
The performance results of the eight activity classification modelsare presented in Fig. 6. The results from the first three experiments(1), (2) and (3), reveal that the high level classification modelsproduce: accuracy>97%, sensitivity>96%, precision>97% and speci-fication>96%. On the whole, these results are excellent and also
c annotation to train a C-SVC activity classifier.
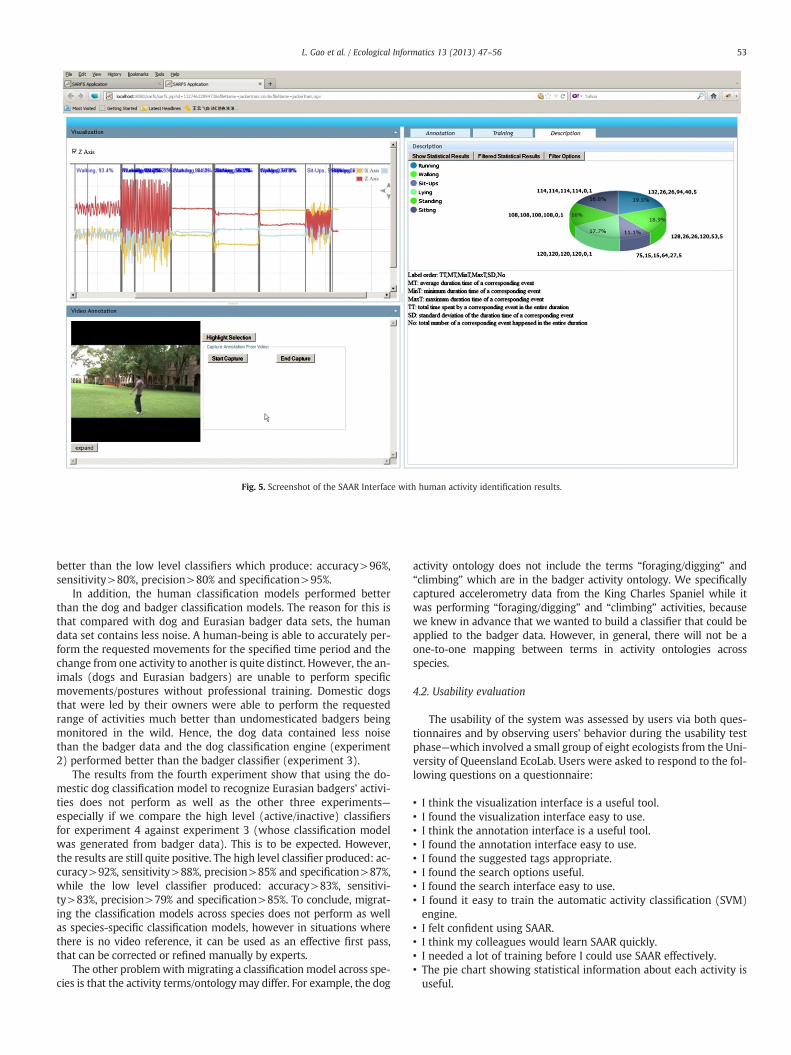
Fig. 5. Screenshot of the SAAR Interface with human activity identification results.
53L. Gao et al. / Ecological Informatics 13 (2013) 47–56
better than the low level classifiers which produce: accuracy>96%,sensitivity>80%, precision>80% and specification>95%.
In addition, the human classification models performed betterthan the dog and badger classification models. The reason for this isthat compared with dog and Eurasian badger data sets, the humandata set contains less noise. A human-being is able to accurately per-form the requested movements for the specified time period and thechange from one activity to another is quite distinct. However, the an-imals (dogs and Eurasian badgers) are unable to perform specificmovements/postures without professional training. Domestic dogsthat were led by their owners were able to perform the requestedrange of activities much better than undomesticated badgers beingmonitored in the wild. Hence, the dog data contained less noisethan the badger data and the dog classification engine (experiment2) performed better than the badger classifier (experiment 3).
The results from the fourth experiment show that using the do-mestic dog classification model to recognize Eurasian badgers' activi-ties does not perform as well as the other three experiments—especially if we compare the high level (active/inactive) classifiersfor experiment 4 against experiment 3 (whose classification modelwas generated from badger data). This is to be expected. However,the results are still quite positive. The high level classifier produced: ac-curacy>92%, sensitivity>88%, precision>85% and specification>87%,while the low level classifier produced: accuracy>83%, sensitivi-ty>83%, precision>79% and specification>85%. To conclude, migrat-ing the classification models across species does not perform as wellas species-specific classification models, however in situations wherethere is no video reference, it can be used as an effective first pass,that can be corrected or refined manually by experts.
The other problemwithmigrating a classification model across spe-cies is that the activity terms/ontologymay differ. For example, the dog
activity ontology does not include the terms “foraging/digging” and“climbing” which are in the badger activity ontology. We specificallycaptured accelerometry data from the King Charles Spaniel while itwas performing “foraging/digging” and “climbing” activities, becausewe knew in advance that we wanted to build a classifier that could beapplied to the badger data. However, in general, there will not be aone-to-one mapping between terms in activity ontologies acrossspecies.
4.2. Usability evaluation
The usability of the system was assessed by users via both ques-tionnaires and by observing users' behavior during the usability testphase—which involved a small group of eight ecologists from the Uni-versity of Queensland EcoLab. Users were asked to respond to the fol-lowing questions on a questionnaire:
• I think the visualization interface is a useful tool.• I found the visualization interface easy to use.• I think the annotation interface is a useful tool.• I found the annotation interface easy to use.• I found the suggested tags appropriate.• I found the search options useful.• I found the search interface easy to use.• I found it easy to train the automatic activity classification (SVM)engine.
• I felt confident using SAAR.• I think my colleagues would learn SAAR quickly.• I needed a lot of training before I could use SAAR effectively.• The pie chart showing statistical information about each activity isuseful.
(Experiment1) (Experiment2)
(Experiment3) (Experiment4)
Fig. 6. The experimental results from applying activity identification models to accelerometer datasets for different species.
54 L. Gao et al. / Ecological Informatics 13 (2013) 47–56
55L. Gao et al. / Ecological Informatics 13 (2013) 47–56
Users were asked to respond to each question from a 5-point Likertscale ranging from “Strongly disagree” to “Strongly agree”. The system'sefficiencywas determined bymeasuring the average time it took a userto: create an annotation through the timeline visualization, create anannotation through the video pane, search existing annotations totrain a SVM classifier, and use the dynamically created classifier to pre-dict animal activities. Each user was given a brief tutorial in the use ofthe SAAR system and then assigned a specific set of annotation and rec-ognition tasks. The time taken to complete each task was recorded.
4.3. Usability evaluation results
The questionnaire results were very positive. All of the users whowere surveyed found the visualization interface, annotation interface,search interface and the pie chart to be useful, and believe that theircolleagues will learn to use the SAAR system quickly. 87.5% of usersfound that the system, including the visualization, annotation andsearch interface, is easy to use. 12.5% of users felt that they would re-quire more time to learn to use it effectively. Aspects that requiredfurther information or clarification included, instructions on how tooperate the zoom in and zoom out functions for the timeline visuali-zation and explanations of the meaning of each search option.
Table 1 shows the results of the time trials. The average time takenby users to create an annotation through the timeline visualizationwas 19.5 s which was less than the time required to create an anno-tation using the video pane. This is because users typically had to re-play video segments multiple times (rewind, pause and replay) to beclear on what the animal was doing. The time to complete Tasks 3 and4 both depends on the size of the data set but the average time foreach task was very low (13 s and 6 s respectively). These times areconsiderably less than the time that would be required if animal be-havior researchers had to implement their own SVM.
It was not possible to compare these times with other comparablesystems because, to our knowledge, there are no other systems thatsupport similar functionalities. However, we believe that these resultsindicate that users are able to use our system quickly and effectivelyto complete the required tasks and that in general, our system willsignificantly expedite the process of analyzing large volumes of 3Daccelerometry data.
5. Limitations and future work
Despite the convincing results presented above, the user tests alsorevealed a number of system limitations. In particular, the systemcurrently only supports accelerometer data of sampling rate 1 Hz.With some species, this sampling rate is insufficient to recognize spe-cific activities. However, the zoom in and zoom out functionalities as-sociated with the Plot panel became very slow when displayinghigher sampling rates or large data sets e.g., 3–5 hour data sets. Thisis due to the fact that the visualization software redraws all the pointswhen users zoom in or zoom out the Plot visualization. We need toinvestigate more scalable approaches for redrawing data files withsampling frequency>1 Hz or data files for extended periods (>2 h).
The second problem that we encountered was related to the qual-ity of the data acquired from the accelerometers. It was quickly
Table 1Summary of time taken by user group to perform requested tasks.
Task description Time range Average time
1. Create a new annotation using the Plot timeline 15–32 s 19.5 s2. Create a new annotation using the video pane 15 s–3.5 min 45.9 s3. Search and retrieve annotations and input as
training data to generate new classifier3 s–1 min 13 s
4. Submit new 15 min dataset into classifier,generate automatic tags and display invisualization pane
4 s–1.5 min 6 s
apparent that the integrity of the data is compromised if the positionof the accelerometer changes during the data capture phase. The ac-celerometers must be rigidly attached in a fixed position and orienta-tion on the back of the animal being monitored. If the position or theorientation changes, the quality of both the data and the classifica-tion deteriorates. This is one of the major challenges associatedwith accelerometers—especially when dealing with wild animalssuch as crocodiles or bears, it is difficult to always attach the acceler-ometer to precisely the same location and to ensure it does not shiftover time.
We have also identified a number of future work directions that wewould like to pursue. Firstly, from the system point view, we plan to in-tegrate the Plot and Video visualization interfaces with the Google Mapinterface to enable simultaneous visualization of tri-axial accelerometerdata streams, videos and GPS location information. In addition, we arealso planning to develop an energy expenditure distributionmap by an-alyzing both animal day and night movements to predict animal healthstatuses.
Secondly, a number of researchers are attaching GPS acoustic andsatellite tags (Guo et al., 2009; Wagenaar et al., 2011) that track GPSlocation on a larger scale as well as other sensors (that measure bodytemperature, heart rate, bioacoustics, etc.) to animals, in addition toaccelerometers. The SAAR system could be extended to support the in-tegration, visualization and analysis of these additional parameters—inorder to detect more complex behaviors, including interactions be-tween animals, such as mating, fighting or territorial marking.
We are also hoping to acquire tri-axial accelerometer data cap-tured from wild dingoes in the future. Dingoes are closer in speciesand behavior to domestic dogs, so we expect that the domestic dogclassifier will work better on dingo data than it did on the badgerdata, but we would like to test this hypothesis. We are also interestedin applying and evaluating this research to accelerometer data cap-tured from flying foxes and birds to monitor their behavior.
To date, we have only evaluated SVMs using the C-SVC algorithm.It would be interesting to evaluate the classification results using dif-ferent types of SVMs (e.g., nu-SVC, regressing SVM) and different ker-nel functions—to determine which SVM and kernel function producethe best results.
Currently the uploaded data sets are openly available via the SAARWeb site. However, many researchers would prefer to limit access totheir experimental data only to project partners, at least until the datahas been published. It also makes sense to restrict who can attach/edit tags on accelerometer data streams. In the future we plan to im-plement authentication and access control protocols over the datasetsand associated tags, to enable the data owner to specify access con-trols including read, edit and re-use permissions.
Finally, once we have implemented the user authentication andaccess control protocols, we plan on making the system available toa broader community of users, beyond just the University of Queens-land ECO-Lab. This will enable us to test the performance, scalabilityand usability of the system based on feedback from a larger volumeof users.
6. Conclusion
We believe that the SAAR system delivers an easy-to-use Web-based repository and a set of semantic tagging, visualization and activityrecognition services that will greatly benefit those researchers who areusing accelerometers to quantify animal movement and behavior. Thedata visualization and semantic annotation/tagging interface enablerapid exploration and interpretation of the accelerometer datasets.More importantly the user interface enables domain experts to recordtheir knowledge in a format that can easily be re-used to develop accu-rate machine learning algorithms capable of automatically recognizingbehavioral patterns in a wide range of species.
56 L. Gao et al. / Ecological Informatics 13 (2013) 47–56
Acknowledgments
The work presented in this paper is supported by the China Schol-arship Council. The authors would also like to thank Professor CraigFranklin and the University of Queensland ECO-Lab for their valuablesupport, contributions and feedback. All procedures were carried outwith the approval of the University of Queensland Animal EthicsCommittee (SBS/300/12/NECTAR). Owen R. Bidder is part-funded bythe European Social Fund (ESF) through the European Union's Con-vergence program administered by the Welsh Government and bythe Royal Society for the Prevention of Cruelty to Animals.
References
Bao, L., Intille, S.S., 2004. Activity recognition from user-annotated acceleration data. The2nd International Conference on Pervasive Computing. Springer, Vienna, pp. 1–17.
Boser, B.E., Guyon, I.M., Vapnik, V.N., 1992. A training algorithm for optimal marginclassifiers. Proceedings of the fifth annual workshop on Computational learningtheory. ACM, Pittsburgh, Pennsylvania, United States, pp. 144–152.
Brigham, E.O., 1988. The Fast Fourier Transform and Its Applications, first ed. Prentice-Hall, Inc., Englewood Cliffs, NJ.
Campbell, H.A., Watts, M.E., Sullivan, S., Read, M.A., Choukroun, S., Irwin, S.R., Franklin,C.E., 2010. Estuarine crocodiles ride surface currents to facilitate long-distancetravel. Journal of Animal Ecology 79, 955–964.
Chang, C.-C., Lin, C.-J., 2011. LIBSVM: a library for support vector machines. TechnicalReport. Department of Computer Science and Information Engineering, Taipei,pp. 1–39.
DERM, 2006. Fraser Island Dingo Management Strategy Review. Queensland Parks andWildlife Service, Brisbane, pp. 1–47.
Gervasi, V., Brunberg, S., Swenson, J.E., 2006. An individual-based method to measureanimal activity levels: a test on brown bears. Wildlife Society Bulletin 34,1314–1319.
Guo, Y., Poulton, G., Corke, P., Bishop-Hurley, G.J., Wark, T., Swain, D.L., 2009. Using ac-celerometer, high sample rate GPS and magnetometer data to develop a cattlemovement and behaviour model. Ecological Modelling 220, 2068–2075.
Halsey, L.G., Portugal, S.J., Smith, J.A., Murn, C.P., Wilson, R.P., 2009. Recording raptorbehavior on the wing via accelerometry. Journal of Field Ornithology 80, 171–177.
Halsey, L.G., Shepard, E.L.C., Wilson, R.P., 2011. Assessing the development and applica-tion of the accelerometry technique for estimating energy expenditure. ComparativeBiochemistry and Physiology. Part A, Molecular & Integrative Physiology 158,305–314.
Han, C.W., Kang, S.J., Kim, N.S., 2010. Implementation of HMM-based human activity rec-ognition using single triaxial accelerometer. IEICE Transactions E93-A, 1379–1383.
Khan, A.M., Lee, Y.K., Kim, T.S., 2008. Accelerometer signal-based human activity recogni-tion using augmented autoregressive model coefficients and artificial neural nets.30th Annual International Conference of the IEEE. IEEE, Vancouver, pp. 5172–5175.
Khan, A.M., Lee, Y.K., Lee, S.Y., 2010. Accelerometer's position free human activity rec-ognition using a hierarchical recognition model. The 12th International Conferenceon eHealth Networking, Application and Services, Lyon, pp. 296–301.
Lagarde, F., Guillon, M., Dubroca, L., Bonnet, X., Kaddour, K.B., Slimani, T., Mouden,E.H.E., 2008. Slowness and acceleration: a new method to quantify the activitybudgets of chelonians. J. Anim. Behav. 75, 319–329.
Li, A., Ji, L., Wang, S., Wu, J., 2010. Physical activity classification using a single triaxialaccelerometer based on HMM,Wireless Sensor Network, 2010. IET-WSN. IET Inter-national Conference on, Beijing, pp. 155–160.
Marchioro, G.F., Cornou, C., Kristensen, A.R., Madsen, J., 2011. Sows' activity classifica-tion device using acceleration data—a resource constrained approach. Computersand Electronics in Agriculture 77, 110–117.
Martiskainena, P., Järvinena, M., Skönb, J.-P., Tiirikainenb, J., Kolehmainenb, M.,Mononena, J., 2009. Cow behaviour pattern recognition using a three-dimensionalaccelerometer and support vector machines. Applied Animal Behaviour Science119, 32–38.
Mitchell, B., Balogh, S., 2007. Monitoring Techniques for Vertebrate Pests—Wild Dogs,Canberra.
Nathan, R., Spiegel, O., Fortmann-Roe, S., Harel, R., Wikelski, M., Getz, W.M., 2012.Using tri-axial acceleration data to identify behavioral modes of free-ranginganimals: general concepts and tools illustrated for griffon vultures. Applied AnimalBehaviour Science 215, 986–996.
Newman, P., Ward, N., Campbell, H., Watts, M., Franklin, C., Hunter, J., 2011. OzTrack:Data Management and Analytics Tools for Australian Animal Tracking. eResearchAustralasia, Melbourne.
Nielsen, L.R., Pedersen, A.R., Herskin, M.S., Munksgaard, L., 2010. Quantifying walkingand standing behaviour of dairy cows using a moving average based on outputfrom an accelerometer. Applied Animal Behaviour Science 127, 12–19.
Ravi, N., Dandekar, N., Mysore, P., Littman, M.L., 2005. Activity recognition from accel-erometer data. The 17th Conference on Innovative Applications of Artificial Intelli-gence. AAAI Press, Pittsburgh, pp. 1541–1546.
Ringgenberg, N., Bergeron, R., Devillers, N., 2010. Validation of accelerometers to auto-matically record sow postures and stepping behaviour. Applied Animal BehaviourScience 128, 37–44.
Shepard, E.L.C., Wilson, R.P., Quintana, F., Laich, A.G., Liebsch, N., Albareda, D.A., Halsey,L.G., Gleiss, A., Morgan, D.T., Myers, A.E., Newman, C., Macdonald, D.W., 2008. Iden-tification of animal movement patterns using tri-axial accelerometry. EndangeredSpecies Research 10, 47–60.
Smith, S.W., 1999. Chapter 8 the discrete Fourier transform, The Scientist andEngineer's Guide to Digital Signal Processing, Second ed. California Technical Pub-lishing, San Diego, California, pp. 141–168.
Sokolova, M., Japkowicz, N., Szpakowicz, S., 2006. Beyond accuracy, F-score and ROC: afamily of discriminant measures for performance evaluation. Australian Confer-ence on Artificial Intelligence, Hobart, pp. 1015–1021.
Wagenaar, R.C., Sapir, I., Yuting, Z., Markovic, S., Vaina, L.M., Little, T.D.C., 2011. Contin-uous monitoring of functional activities using wearable, wireless gyroscope andaccelerometer technology. 33rd Annual International Conference of the IEEE Engi-neering in Medicine and Biology Society, Boston, pp. 4844–4847.
Yang, J.-Y., Wang, J.-S., Chen, Y.-P., 2008. Using acceleration measurements for activityrecognition: an effective learning algorithm for constructing neural classifiers. Pat-tern Recognition Letters 29, 2213–2220.
Zhenyu, H., Lianwen, J., 2009. Activity recognition from acceleration data based on dis-crete consine transform and SVM. IEEE International Conference on Systems, Man,and Cybernetics, San Antonio, pp. 5041–5044.
Zhen-Yu, H., Lian-Wen, J., 2008. Activity recognition from acceleration data using ARmodel representation and SVM. The Seventh International Conference on MachineLearning and Applications, San Diego, pp. 2245–2250.