A visual programming language for designing interactions embedded in web-based geographic...
10
A Visual Programming Language for Designing Interactions Embedded in Web-based Geographic Applications The Nhan Luong, Patrick Etcheverry, Christophe Marquesuza` a and Thierry Nodenot T2i - LIUPPA - Universit´ e de Pau et des Pays de l’Adour 2 All´ ee du Parc Montaury, 64600 Anglet, France {thenhan.luong, patrick.etcheverry, christophe.marquesuzaa, thierry.nodenot}@iutbayonne.univ-pau.fr ABSTRACT Visual programming languages (VPLs) provide notations for representing both the intermediate and the final results of a knowledge engineering process. Whereas some VPLs partic- ularly focus on control flow and/or data flow of a software, very few VPLs stress on the interactive dimension of applica- tion (dialogue flow). This paper focuses on a VPL allowing designers to specify interactions between a user and a sys- tem, in the field of Web-based geographic applications. We first present the underlying interaction model that the VPL is based on, and then the detailed characteristics of the VPL. We show how this VPL has been integrated in a graphical design framework allowing designers to immediately assess their specification. Then we illustrate the way to use the framework from the design step to the final code generation step. Last, we detail an experimentation aiming at evaluating the strengths and the weaknesses of our VPL. Author Keywords Visual design language, interaction design, geographic application design, visual authoring tools. ACM Classification Keywords H.5.m. Information Interfaces and Presentation (e.g. HCI): Miscellaneous General Terms Design, Languages. INTRODUCTION Visual programming languages (VPLs) aim at facilitating software design and implementation by minimizing or avoid- ing complex coding steps. The visual nature of these lan- guages is characterized by the use of graphic elements that can be combined and connected within a two (or more) di- mensional design workspace. The expressive power of these languages explain their attractiveness for simplifying the de- scription of complex things. This richness can also be a con- straint when it comes to interpreting the meaning of diagrams in order to automatically generate executable code. Our research consists in promoting VPLs to empower de- signers developing interactive applications. Depending on the domain, such VPL-based prototyping tools are more or less difficult to produce. Our challenge is to focus on an ill-structured domain that addresses (on a medium-term) the design of applications promoting “Engaged reading interac- tive scenarios that make use of geographic information”. We chose such a domain for three main reasons. Firstly, geo- graphic information promoting engaged reading can be quite informal, but its semantics, once captured by automatic or semi-automatic analysers, can be exploited to promote rich interactive scenarios. Secondly, there is a real need for some VPLs to design applications for touristic, cultural or educa- tional purposes. Lastly, deploying such interactive applica- tions from a VPL is a challenging task because the required VPL must stress on the interactive dimension of the applica- tion (dialogue flow) and not only on the control flow and/or the data flow. In this paper we present this VPL that does not address computer-science companies with structured teams of devel- opers but people (with some computer-science background) from firms or organisations who are interested in deploy- ing interactive applications without having to manage all the complexity of the technology. This visual language only fo- cuses on human computer interactions and proposes specific descriptor elements allowing designers to rapidly specify and assess what happens (from a system reaction viewpoint) when a user carries out an action. The paper is structured as follows: Section 2 (“Related Work”) defines more precisely the concept of VPL and posi- tions our contribution according to similar and related work. Section 3 (“Geographic Application Modelling”) describes the underlying model on which the VPL is based on. This three-part model allows designers to define the contents that will be handled, how they will be displayed on the screen and the possible interactions allowed within these contents. Section 4 (“Visual Specification of Interactions”) presents the main contribution of the paper: we describe the characteris- tics of the VPL that will allow designers to specify interac- tions according to the model described in Section 3. Section 5 (“Application Design with the WINDMash Prototype”) il- lustrates the operational nature of the proposed VPL through a graphical design environment called WINDMash. This de- sign environment integrates our VPL and allows designers to visually specify Web-based geographic applications from an interactive viewpoint and then to generate the correspond- ing executable code. Section 6 (“Evaluation”) presents a first experimentation aiming at evaluating the main strengths and weaknesses of our VPL. Finally, we conclude this paper by summing up the results and presenting our plans for future work. hal-00686530, version 1 - 10 Apr 2012 Author manuscript, published in "The 2012 ACM international conference on Intelligent User Interfaces, Lisbon : Portugal (2012)" DOI : 10.1145/2166966.2167003
Transcript of A visual programming language for designing interactions embedded in web-based geographic...
A Visual Programming Language for Designing InteractionsEmbedded in Web-based Geographic Applications
The Nhan Luong, Patrick Etcheverry, Christophe Marquesuzaa and Thierry NodenotT2i - LIUPPA - Universite de Pau et des Pays de l’Adour
2 Allee du Parc Montaury, 64600 Anglet, France{thenhan.luong, patrick.etcheverry, christophe.marquesuzaa, thierry.nodenot}@iutbayonne.univ-pau.fr
ABSTRACT
Visual programming languages (VPLs) provide notations forrepresenting both the intermediate and the final results of aknowledge engineering process. Whereas some VPLs partic-ularly focus on control flow and/or data flow of a software,very few VPLs stress on the interactive dimension of applica-tion (dialogue flow). This paper focuses on a VPL allowingdesigners to specify interactions between a user and a sys-tem, in the field of Web-based geographic applications. Wefirst present the underlying interaction model that the VPL isbased on, and then the detailed characteristics of the VPL.We show how this VPL has been integrated in a graphicaldesign framework allowing designers to immediately assesstheir specification. Then we illustrate the way to use theframework from the design step to the final code generationstep. Last, we detail an experimentation aiming at evaluatingthe strengths and the weaknesses of our VPL.
Author Keywords
Visual design language, interaction design, geographicapplication design, visual authoring tools.
ACM Classification Keywords
H.5.m. Information Interfaces and Presentation (e.g. HCI):Miscellaneous
General Terms
Design, Languages.
INTRODUCTION
Visual programming languages (VPLs) aim at facilitatingsoftware design and implementation by minimizing or avoid-ing complex coding steps. The visual nature of these lan-guages is characterized by the use of graphic elements thatcan be combined and connected within a two (or more) di-mensional design workspace. The expressive power of theselanguages explain their attractiveness for simplifying the de-scription of complex things. This richness can also be a con-straint when it comes to interpreting the meaning of diagramsin order to automatically generate executable code.
Our research consists in promoting VPLs to empower de-signers developing interactive applications. Depending onthe domain, such VPL-based prototyping tools are more orless difficult to produce. Our challenge is to focus on anill-structured domain that addresses (on a medium-term) the
design of applications promoting “Engaged reading interac-tive scenarios that make use of geographic information”. Wechose such a domain for three main reasons. Firstly, geo-graphic information promoting engaged reading can be quiteinformal, but its semantics, once captured by automatic orsemi-automatic analysers, can be exploited to promote richinteractive scenarios. Secondly, there is a real need for someVPLs to design applications for touristic, cultural or educa-tional purposes. Lastly, deploying such interactive applica-tions from a VPL is a challenging task because the requiredVPL must stress on the interactive dimension of the applica-tion (dialogue flow) and not only on the control flow and/orthe data flow.
In this paper we present this VPL that does not addresscomputer-science companies with structured teams of devel-opers but people (with some computer-science background)from firms or organisations who are interested in deploy-ing interactive applications without having to manage all thecomplexity of the technology. This visual language only fo-cuses on human computer interactions and proposes specificdescriptor elements allowing designers to rapidly specify andassess what happens (from a system reaction viewpoint) whena user carries out an action.
The paper is structured as follows: Section 2 (“RelatedWork”) defines more precisely the concept of VPL and posi-tions our contribution according to similar and related work.Section 3 (“Geographic Application Modelling”) describesthe underlying model on which the VPL is based on. Thisthree-part model allows designers to define the contents thatwill be handled, how they will be displayed on the screenand the possible interactions allowed within these contents.Section 4 (“Visual Specification of Interactions”) presents themain contribution of the paper: we describe the characteris-tics of the VPL that will allow designers to specify interac-tions according to the model described in Section 3. Section5 (“Application Design with the WINDMash Prototype”) il-lustrates the operational nature of the proposed VPL througha graphical design environment called WINDMash. This de-sign environment integrates our VPL and allows designersto visually specify Web-based geographic applications froman interactive viewpoint and then to generate the correspond-ing executable code. Section 6 (“Evaluation”) presents a firstexperimentation aiming at evaluating the main strengths andweaknesses of our VPL. Finally, we conclude this paper bysumming up the results and presenting our plans for futurework.
hal-0
0686
530,
ver
sion
1 -
10 A
pr 2
012
Author manuscript, published in "The 2012 ACM international conference on Intelligent User Interfaces, Lisbon : Portugal (2012)" DOI : 10.1145/2166966.2167003

RELATED WORK
This paper intends to offer a VPL allowing designers tographically describe human computer interactions and to gen-erate the corresponding Web-based application. The contri-bution focus on a VPL adapted to the description of interac-tions. Focusing on interaction is particularly interesting be-cause it is generally the most complex thing to describe, tospecify and to implement in a program. In this paper, the un-derlying code generation process is not considered as a scien-tific contribution but as an engineering work based on existingmodel transformation techniques (MDA).
In next sections, we use visual programming to mean the con-struction of a program starting from a graphical representa-tion of its behaviour. We define a VPL in the same way as [15,19, 20, 22]: any graphical language that lets programmerscreate programs by handling program elements representedgraphically rather than textually. According to the classifi-cation described in [3] (which compiles the viewpoint of au-thors such as [6, 7, 22]), we offer a hybrid text and visuallanguage: programs are visually created and then translatedinto an underlying high-level textual language, which is thentranslated into executable source code.
Integrating VPLs in Geographic Information Systems (GIS)is not a new idea: ArcGIS, Mapinfo, AutoCAD Map3D aresophisticated GIS restricted to specialists. VPLs try to makethese systems available to standard users. As shown in [9],the two recurring problems addressed by VPLs in such sys-tems relate to the creation/selection/aggregation of data andto the manner of representing this data on a map or textu-ally. To our knowledge, there is no VPL allowing designersto define user interactions with displayed data, except the de-fault interactions provided by the displayer (e.g. changingthe background of the map that displays the data). Moreover,default interactions provided by displayers cannot (generally)be set up or disabled by designers.
Similar problems can be highlighted with Mashup systemssuch as Google Mashup or IBM mashup center which allowdesigners to graphically create/aggregate data (from feeds forexample) and to display it in a specific way (on a map withGoogle Mashup, using widgets with IBM mashup center).However, these tools do not allow designers to create newinteractions with displayed data: interactive possibilities arepredefined by displayers (sorting data in a spreadsheet wid-get for example) and designers have little control over thesepredefined interactions.
The underlying programming approach is also very impor-tant. We can identify two main approaches [9, 25] that useVPLs in GIS: The traditional programming approach and theprogramming by demonstration approach. The first approachdeals with using a visual language to describe what the pro-gram must do (cf. ModelBuilder in ArcGIS or the WorkflowDesigner in AutoCAD Map3D). The resulting description isthen compiled or interpreted and run. The second approachconsists in creating a program by showing an existing systemhow to carry out a specific task: The system memorizes eachstep of the process as a new program. Each step is graphicallyrepresented to allow designers checking the features of the
program they are elaborating (see for example the C-SPRLsystem in [25]).
In these two approaches, VPLs are used to specify whichdata must be handled and what must be done with thisdata. There is also a continuous feedback which allows de-signers to control/correct the program they are elaborating.However, designers activity is quite different: In a tradi-tional programming approach, designers carry out a spec-ification/formalization activity of the program to elaboratewhereas in a programming by demonstration approach, de-signers carry out a “tutor” activity by showing an existingsystem how to execute a specific task. The VPL we proposeaims at elaborating geographic application from scratch andso, designers will use our language to design their program ina traditional way.
The interaction programming language we propose is basedon UML which provides several models to describe interac-tions in an application. As shown in [1, 14, 26], UML canbe used as a visual programming language to generate Javacode starting from classes and statechart diagrams. Gener-ally, the interactive aspect of the application is described us-ing statechart diagrams that specify the reactions of a systemaccording to the actions of a user. Statechart diagrams allowdesigners to describe the interactive dimension of an applica-tion globally but this global description can be complex if theapplication includes many interactive possibilities.
The sequence diagram-like VPL we propose allows designersto decompose the global interaction of a system into severalseparate interactions. The design is facilitated because eachdiagram describes only one interaction. The global view andthe coherence of the interactive possibilities of the system canbe reconstituted by merging the set of sequence diagrams toproduce a state chart diagram as presented in [14] and in [26].
GEOGRAPHIC APPLICATION MODELLING
We offer to guide the design process considering the contentspresented to users and the interactive possibilities given tothem. With such an approach, designers’ work involves defin-ing the contents to be manipulated, how they will be displayedand the interactions handling these contents.
We offer design tools allowing designers to focus on the ap-plication’s interactive dimension. To achieve this goal, werely on operational models to be elaborated and integrated indesign environments. These environments should assist thedesigner from the specification step to the deployment step.
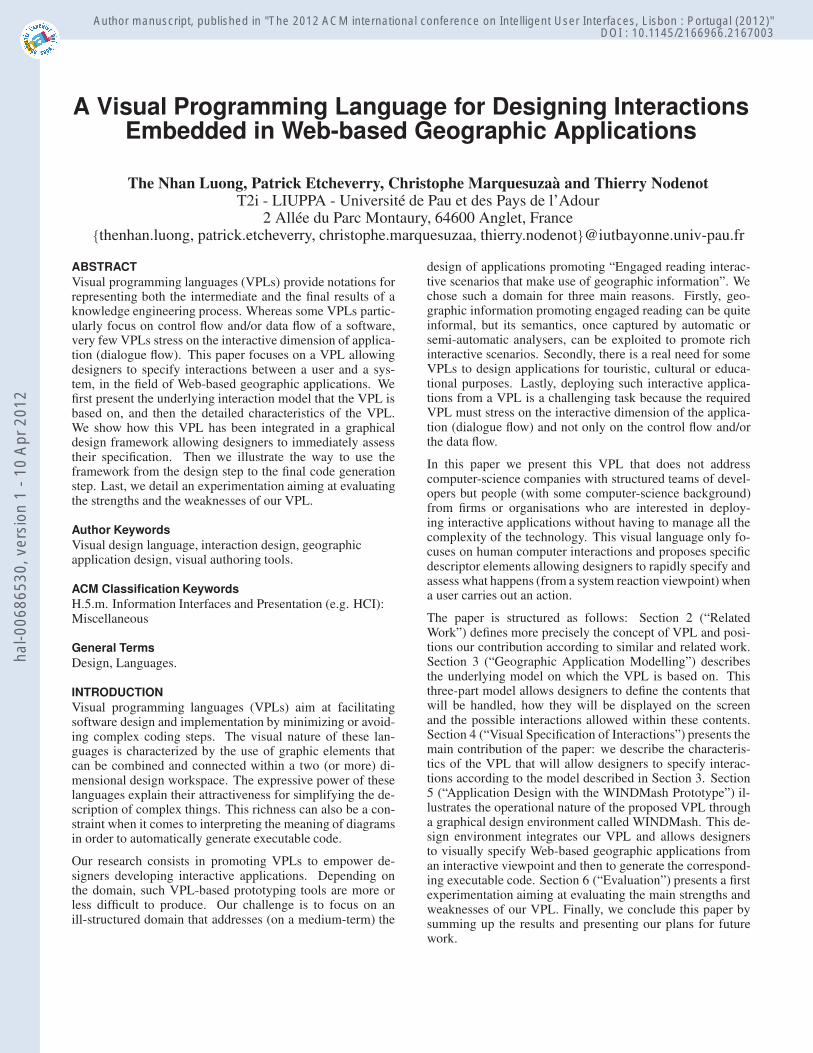
This section defines the main key concepts that we offerto describe the interactions within an application. Figure 1presents an overview of these concepts. The model may bedivided into three parts (Content, Interface and Interaction)articulated around the concept of geographic contents (geo-contents) which represents the central concept of our modelbecause our design approach mainly focuses on emphasizinggeographic data [16].
In the content part, geocontents are defined by a set of struc-tured information; each one has a type (absolute or relativespatial entity), a value (e.g. “Mauleon-Licharre”) and one or
hal-0
0686
530,
ver
sion
1 -
10 A
pr 2
012
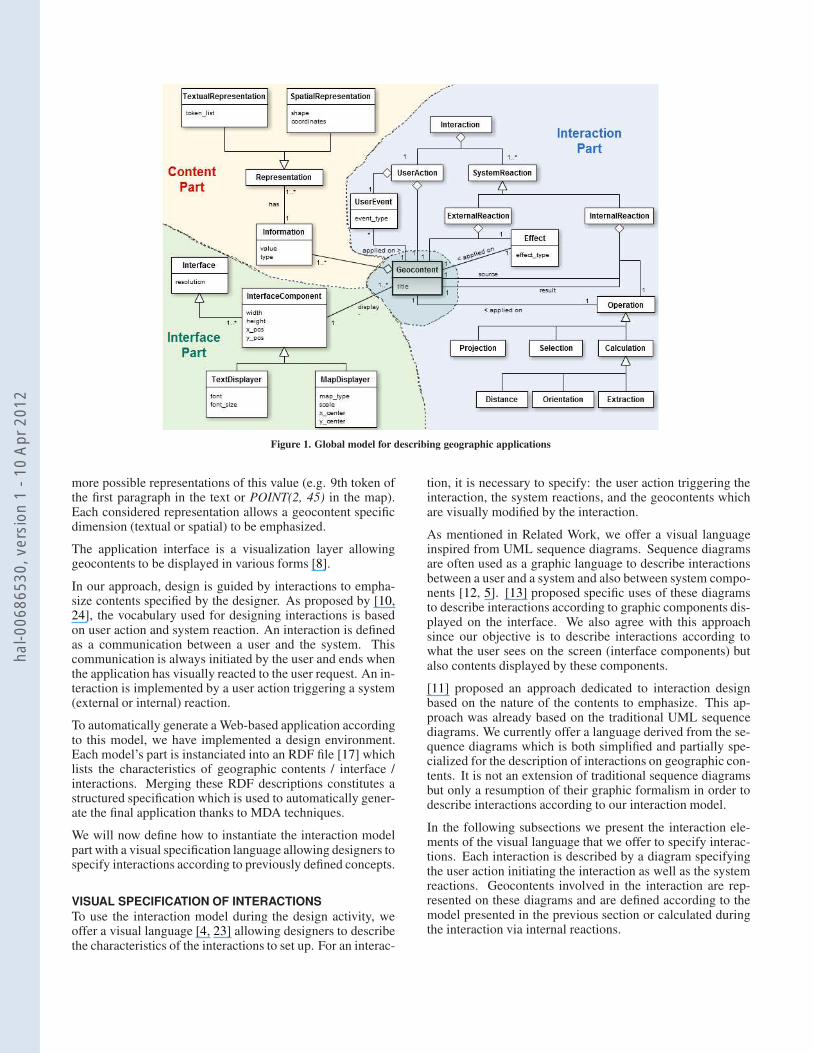
Figure 1. Global model for describing geographic applications
more possible representations of this value (e.g. 9th token ofthe first paragraph in the text or POINT(2, 45) in the map).Each considered representation allows a geocontent specificdimension (textual or spatial) to be emphasized.
The application interface is a visualization layer allowinggeocontents to be displayed in various forms [8].
In our approach, design is guided by interactions to empha-size contents specified by the designer. As proposed by [10,24], the vocabulary used for designing interactions is basedon user action and system reaction. An interaction is definedas a communication between a user and the system. Thiscommunication is always initiated by the user and ends whenthe application has visually reacted to the user request. An in-teraction is implemented by a user action triggering a system(external or internal) reaction.
To automatically generate a Web-based application accordingto this model, we have implemented a design environment.Each model’s part is instanciated into an RDF file [17] whichlists the characteristics of geographic contents / interface /interactions. Merging these RDF descriptions constitutes astructured specification which is used to automatically gener-ate the final application thanks to MDA techniques.
We will now define how to instantiate the interaction modelpart with a visual specification language allowing designers tospecify interactions according to previously defined concepts.
VISUAL SPECIFICATION OF INTERACTIONS
To use the interaction model during the design activity, weoffer a visual language [4, 23] allowing designers to describethe characteristics of the interactions to set up. For an interac-
tion, it is necessary to specify: the user action triggering theinteraction, the system reactions, and the geocontents whichare visually modified by the interaction.
As mentioned in Related Work, we offer a visual languageinspired from UML sequence diagrams. Sequence diagramsare often used as a graphic language to describe interactionsbetween a user and a system and also between system compo-nents [12, 5]. [13] proposed specific uses of these diagramsto describe interactions according to graphic components dis-played on the interface. We also agree with this approachsince our objective is to describe interactions according towhat the user sees on the screen (interface components) butalso contents displayed by these components.
[11] proposed an approach dedicated to interaction designbased on the nature of the contents to emphasize. This ap-proach was already based on the traditional UML sequencediagrams. We currently offer a language derived from the se-quence diagrams which is both simplified and partially spe-cialized for the description of interactions on geographic con-tents. It is not an extension of traditional sequence diagramsbut only a resumption of their graphic formalism in order todescribe interactions according to our interaction model.
In the following subsections we present the interaction ele-ments of the visual language that we offer to specify interac-tions. Each interaction is described by a diagram specifyingthe user action initiating the interaction as well as the systemreactions. Geocontents involved in the interaction are rep-resented on these diagrams and are defined according to themodel presented in the previous section or calculated duringthe interaction via internal reactions.
hal-0
0686
530,
ver
sion
1 -
10 A
pr 2
012

Specification of a user action
A user action is initiated by a specific event (e.g. click, mouse-over, . . . ). This event is applied on contents which are dis-played on an interface component. As an interaction is trig-gered by a user event, a user action is represented by an arrowgoing from the user toward the system and labelled with thename of this triggering event (Figure 2).
Figure 2. Specification of a user action
The arrow destination refers to the contents involved in theinteraction and the interface component used to display them.The contents have an automatically generated identifier thatcan be renamed by the designer. This identifier allows thedesigner to handle the same contents into several interactions.
Specification of an external system reaction
This reaction is always visible by the user. It results in a vi-sual modification of contents displayed on the interface. Thismodification is carried out by the system by applying one orsome visual effects on the contents to emphasize.
Figure 3. Specification of an external system reaction
Since an external reaction is applied on contents and can beseen by the user, it is represented by an arrow going from thecontents to emphasize toward the user (Figure 3). The arrowlabel specifies the effect applied to emphasize these contents.
Specification of an internal system reaction
We consider three distinct internal reactions: projection, se-lection and calculation.
Projection
The projection operation involves transferring contents on agiven interface component. Thereafter, the transferred con-tents can either be displayed on the target interface compo-nent or be used to calculate new contents on this interfacecomponent. The arrow origin (Figure 4) specifies the con-tents that must be projected and the destination defines theinterface component where the contents is projected.
Figure 4. Specification of a projection operation
Selection
A selection is an operation allowing the designer to specifycontents by selecting a subset of displayed contents. Thissubset becomes new contents that can be emphasized in thecontinuation of the interaction.
Figure 5. Specification of a selection operation
The selection operation is graphically represented by an ar-row going from the initial contents toward the subset con-tents designated by the user (Figure 5). The selected contentsbelong to the interface component displaying the initial con-tents. Thenceforth, these new created contents can be dis-played via another external reaction or can be transferred onanother interface component with a projection operation.
Calculation
This operation allows designers to create new contents by ap-plying a calculation operation on specific contents. As thecontents are in a geographic nature, the authorized operationsare also in a geographic nature: distance calculation, orienta-tion, surface, etc. A calculation operation is represented byan arrow labelled with the calculation service to apply. Thearrow connects the input and output contents (Figure 6).
Figure 6. Specification of a calculation operation
The calculation parameters must be defined during the designactivity. The calculation operations must also be pertinentwith the input contents. These consistency checks can onlybe carried out if the design activity is supported by an adaptedsoftware environment.
APPLICATION DESIGN WITH WINDMASH
In order to illustrate our approach, we use the WINDMash1
prototype allowing a designer to elaborate in a visual wayWeb-based geographic applications.
Starting from a text and a map presenting some towns locatedon the French Atlantic and Mediterranean coasts, the maingoal of the application to design is to learn the concept of
1http://erozate.iutbayonne.univ-pau.fr/Nhan/windmash4/
hal-0
0686
530,
ver
sion
1 -
10 A
pr 2
012
“departement”2. The behaviour of the application (Figure 7)is as follows: When the user clicks on a town written on thetext (located on the left part of the screen) or displayed onthe map zone (located on the right part of the screen), thenthe name of the corresponding “departement” is automati-cally displayed (in a dedicated zone in the top centre of thescreen) and the border of the “departement” are highlighted(in a dedicated zone in the bottom centre of the screen). Thename of the clicked town in the main text and the border ofthis town in the main map will also be highlighted.
Figure 7. Screenshot of the final application
A designer may use three complementary workspaces on theWINDMash environment. These workspaces respectivelydeal with defining the geocontents to be handled (Data work-space), organizing the presentation layout of the application(Interface workspace) and specifying how end-users will beable to interact with the application (Interaction workspace).Each workspace corresponds to the instanciation of its spe-cific part of the global model presented in Figure 1. Eachworkspace allows designers to specify a particular viewpointof the application, and each specification leads to the instan-ciation of a specific part of the global model.
Defining geocontents of the application
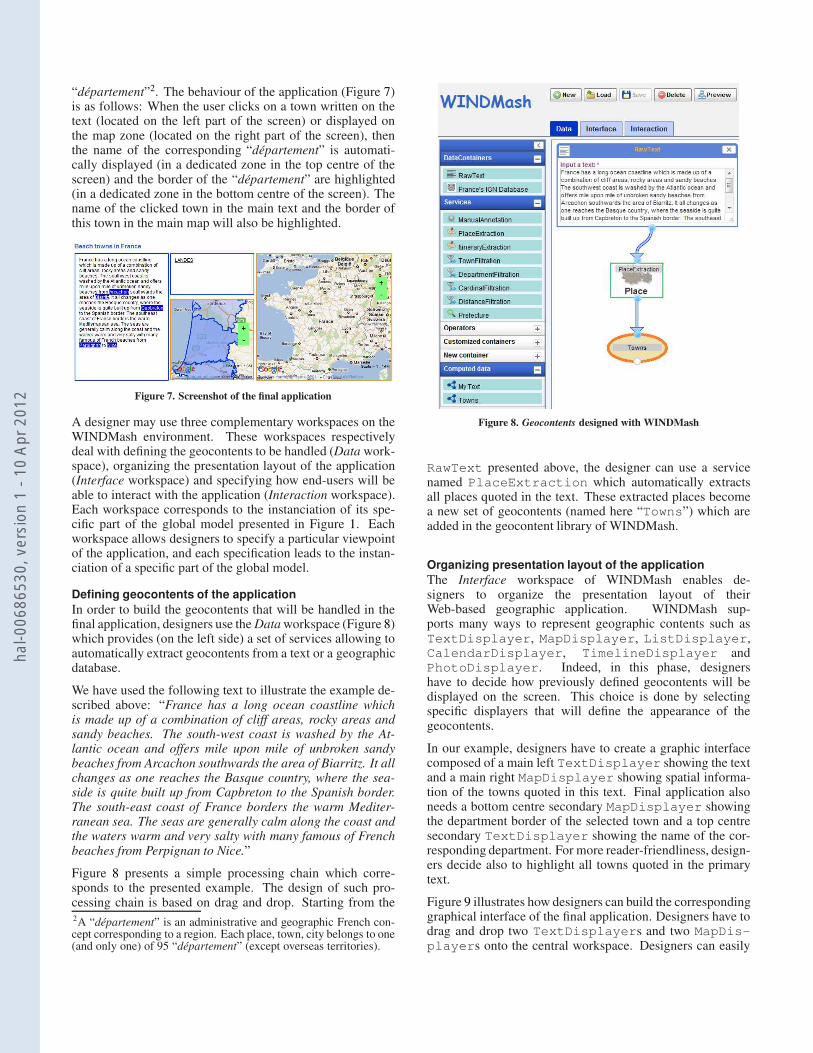
In order to build the geocontents that will be handled in thefinal application, designers use the Data workspace (Figure 8)which provides (on the left side) a set of services allowing toautomatically extract geocontents from a text or a geographicdatabase.
We have used the following text to illustrate the example de-scribed above: “France has a long ocean coastline whichis made up of a combination of cliff areas, rocky areas andsandy beaches. The south-west coast is washed by the At-lantic ocean and offers mile upon mile of unbroken sandybeaches from Arcachon southwards the area of Biarritz. It allchanges as one reaches the Basque country, where the sea-side is quite built up from Capbreton to the Spanish border.The south-east coast of France borders the warm Mediter-ranean sea. The seas are generally calm along the coast andthe waters warm and very salty with many famous of Frenchbeaches from Perpignan to Nice.”
Figure 8 presents a simple processing chain which corre-sponds to the presented example. The design of such pro-cessing chain is based on drag and drop. Starting from the2A “departement” is an administrative and geographic French con-cept corresponding to a region. Each place, town, city belongs to one(and only one) of 95 “departement” (except overseas territories).
Figure 8. Geocontents designed with WINDMash
RawText presented above, the designer can use a servicenamed PlaceExtraction which automatically extractsall places quoted in the text. These extracted places becomea new set of geocontents (named here “Towns”) which areadded in the geocontent library of WINDMash.
Organizing presentation layout of the application
The Interface workspace of WINDMash enables de-signers to organize the presentation layout of theirWeb-based geographic application. WINDMash sup-ports many ways to represent geographic contents such asTextDisplayer, MapDisplayer, ListDisplayer,CalendarDisplayer, TimelineDisplayer andPhotoDisplayer. Indeed, in this phase, designershave to decide how previously defined geocontents will bedisplayed on the screen. This choice is done by selectingspecific displayers that will define the appearance of thegeocontents.
In our example, designers have to create a graphic interfacecomposed of a main left TextDisplayer showing the textand a main right MapDisplayer showing spatial informa-tion of the towns quoted in this text. Final application alsoneeds a bottom centre secondary MapDisplayer showingthe department border of the selected town and a top centresecondary TextDisplayer showing the name of the cor-responding department. For more reader-friendliness, design-ers decide also to highlight all towns quoted in the primarytext.
Figure 9 illustrates how designers can build the correspondinggraphical interface of the final application. Designers have todrag and drop two TextDisplayers and two MapDis-
players onto the central workspace. Designers can easily
hal-0
0686
530,
ver
sion
1 -
10 A
pr 2
012
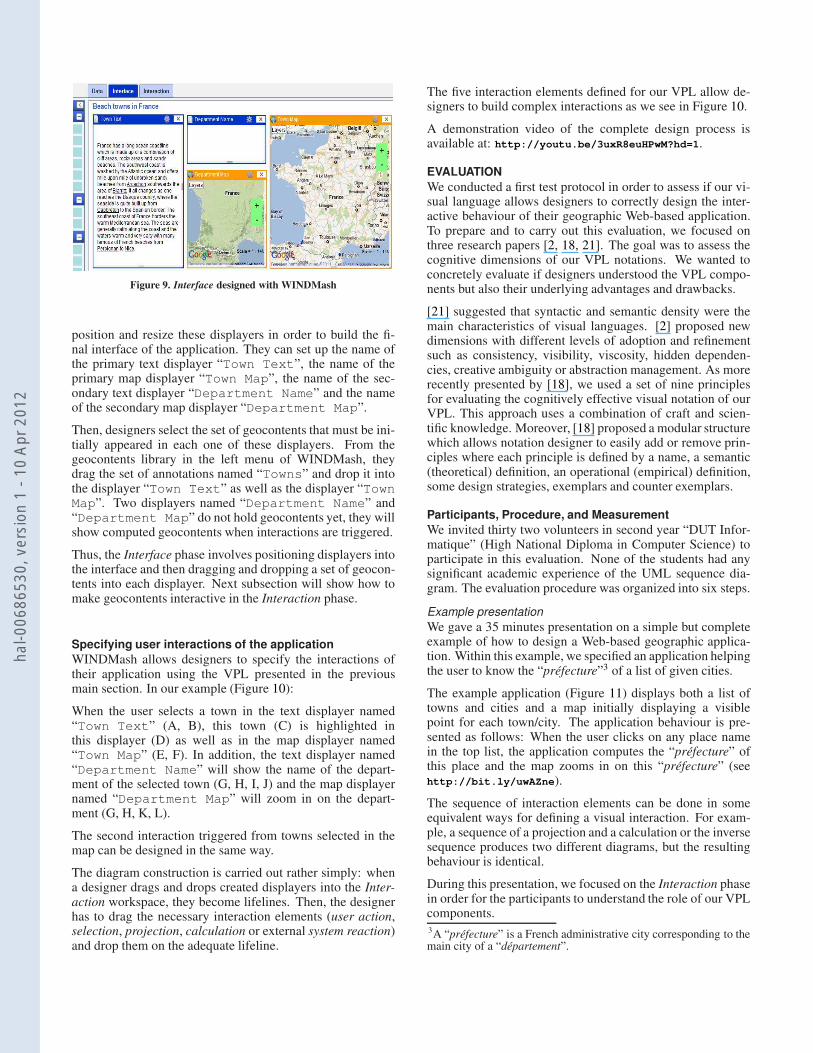
Figure 9. Interface designed with WINDMash
position and resize these displayers in order to build the fi-nal interface of the application. They can set up the name ofthe primary text displayer “Town Text”, the name of theprimary map displayer “Town Map”, the name of the sec-ondary text displayer “Department Name” and the nameof the secondary map displayer “Department Map”.
Then, designers select the set of geocontents that must be ini-tially appeared in each one of these displayers. From thegeocontents library in the left menu of WINDMash, theydrag the set of annotations named “Towns” and drop it intothe displayer “Town Text” as well as the displayer “TownMap”. Two displayers named “Department Name” and“Department Map” do not hold geocontents yet, they willshow computed geocontents when interactions are triggered.
Thus, the Interface phase involves positioning displayers intothe interface and then dragging and dropping a set of geocon-tents into each displayer. Next subsection will show how tomake geocontents interactive in the Interaction phase.
Specifying user interactions of the application
WINDMash allows designers to specify the interactions oftheir application using the VPL presented in the previousmain section. In our example (Figure 10):
When the user selects a town in the text displayer named“Town Text” (A, B), this town (C) is highlighted inthis displayer (D) as well as in the map displayer named“Town Map” (E, F). In addition, the text displayer named“Department Name” will show the name of the depart-ment of the selected town (G, H, I, J) and the map displayernamed “Department Map” will zoom in on the depart-ment (G, H, K, L).
The second interaction triggered from towns selected in themap can be designed in the same way.
The diagram construction is carried out rather simply: whena designer drags and drops created displayers into the Inter-action workspace, they become lifelines. Then, the designerhas to drag the necessary interaction elements (user action,selection, projection, calculation or external system reaction)and drop them on the adequate lifeline.
The five interaction elements defined for our VPL allow de-signers to build complex interactions as we see in Figure 10.
A demonstration video of the complete design process isavailable at: http://youtu.be/3uxR8euHPwM?hd=1.
EVALUATION
We conducted a first test protocol in order to assess if our vi-sual language allows designers to correctly design the inter-active behaviour of their geographic Web-based application.To prepare and to carry out this evaluation, we focused onthree research papers [2, 18, 21]. The goal was to assess thecognitive dimensions of our VPL notations. We wanted toconcretely evaluate if designers understood the VPL compo-nents but also their underlying advantages and drawbacks.
[21] suggested that syntactic and semantic density were themain characteristics of visual languages. [2] proposed newdimensions with different levels of adoption and refinementsuch as consistency, visibility, viscosity, hidden dependen-cies, creative ambiguity or abstraction management. As morerecently presented by [18], we used a set of nine principlesfor evaluating the cognitively effective visual notation of ourVPL. This approach uses a combination of craft and scien-tific knowledge. Moreover, [18] proposed a modular structurewhich allows notation designer to easily add or remove prin-ciples where each principle is defined by a name, a semantic(theoretical) definition, an operational (empirical) definition,some design strategies, exemplars and counter exemplars.
Participants, Procedure, and Measurement
We invited thirty two volunteers in second year “DUT Infor-matique” (High National Diploma in Computer Science) toparticipate in this evaluation. None of the students had anysignificant academic experience of the UML sequence dia-gram. The evaluation procedure was organized into six steps.
Example presentation
We gave a 35 minutes presentation on a simple but completeexample of how to design a Web-based geographic applica-tion. Within this example, we specified an application helpingthe user to know the “prefecture”3 of a list of given cities.
The example application (Figure 11) displays both a list oftowns and cities and a map initially displaying a visiblepoint for each town/city. The application behaviour is pre-sented as follows: When the user clicks on any place namein the top list, the application computes the “prefecture” ofthis place and the map zooms in on this “prefecture” (seehttp://bit.ly/uwAZne).
The sequence of interaction elements can be done in someequivalent ways for defining a visual interaction. For exam-ple, a sequence of a projection and a calculation or the inversesequence produces two different diagrams, but the resultingbehaviour is identical.
During this presentation, we focused on the Interaction phasein order for the participants to understand the role of our VPLcomponents.
3A “prefecture” is a French administrative city corresponding to themain city of a “departement”.
hal-0
0686
530,
ver
sion
1 -
10 A
pr 2
012
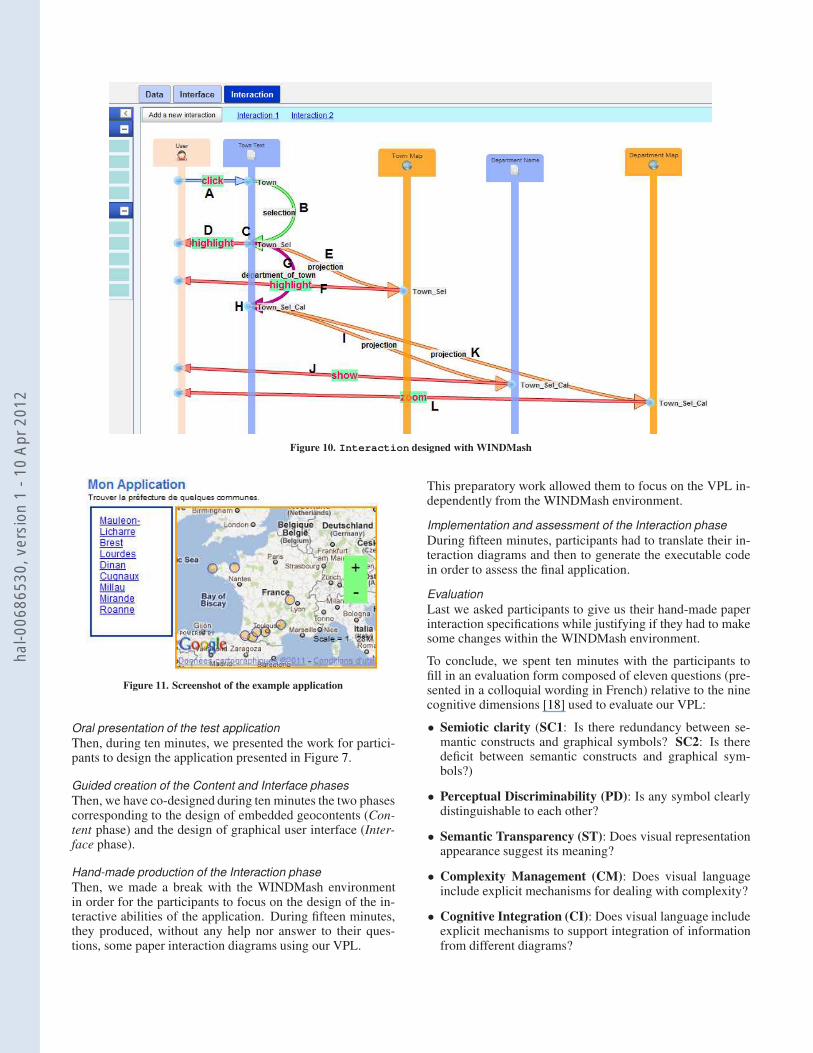
Figure 10. Interaction designed with WINDMash
Figure 11. Screenshot of the example application
Oral presentation of the test application
Then, during ten minutes, we presented the work for partici-pants to design the application presented in Figure 7.
Guided creation of the Content and Interface phases
Then, we have co-designed during ten minutes the two phasescorresponding to the design of embedded geocontents (Con-tent phase) and the design of graphical user interface (Inter-face phase).
Hand-made production of the Interaction phase
Then, we made a break with the WINDMash environmentin order for the participants to focus on the design of the in-teractive abilities of the application. During fifteen minutes,they produced, without any help nor answer to their ques-tions, some paper interaction diagrams using our VPL.
This preparatory work allowed them to focus on the VPL in-dependently from the WINDMash environment.
Implementation and assessment of the Interaction phase
During fifteen minutes, participants had to translate their in-teraction diagrams and then to generate the executable codein order to assess the final application.
Evaluation
Last we asked participants to give us their hand-made paperinteraction specifications while justifying if they had to makesome changes within the WINDMash environment.
To conclude, we spent ten minutes with the participants tofill in an evaluation form composed of eleven questions (pre-sented in a colloquial wording in French) relative to the ninecognitive dimensions [18] used to evaluate our VPL:
• Semiotic clarity (SC1: Is there redundancy between se-mantic constructs and graphical symbols? SC2: Is theredeficit between semantic constructs and graphical sym-bols?)
• Perceptual Discriminability (PD): Is any symbol clearlydistinguishable to each other?
• Semantic Transparency (ST): Does visual representationappearance suggest its meaning?
• Complexity Management (CM): Does visual languageinclude explicit mechanisms for dealing with complexity?
• Cognitive Integration (CI): Does visual language includeexplicit mechanisms to support integration of informationfrom different diagrams?
hal-0
0686
530,
ver
sion
1 -
10 A
pr 2
012
• Visual Expressiveness (VE): Does visual language use thefull range and capacities of visual variables?
• Dual Coding (DC): Does visual language use text to com-plement graphics?
• Graphic Economy (GE): Is the number of different graph-ical symbols cognitively manageable?
• Cognitive fit (CF1: Is visual language handled similarlyon paper and within the WINDMash environment? CF2: Isvisual language handled well by designers unfamiliar withUML sequence diagrams?)
For any question, four possible answers were available(Strongly Agree, Agree, Disagree, Strongly Disagree). More-over, participants had the options to justify their answer witha short open comment.
Results and Discussion
Figure 12 resumes the participants’ answers:
StronglyAgree
Agree Disagree StronglyDisagree
SC1 0% 0% 13% 88% ¨
SC2 0% 0% 63% 38% ¨
PD 38% 50% 0% 13% _ ¨
ST 50% 38% 13% 0% ¨
CM 38% 63% 0% 0% ¨
CI 13% _ 13% _ 25% ¨ 50% ¨ : −VE 13% 50% 38% 0% : −DC 0% 13% 38% 50% ¨
GE 25% 75% 0% 0% ¨
CF1 75% 25% 0% 0% ¨
CF2 0% 63% 13% 25% : −Figure 12. Result table of the experimentation
From a global viewpoint, the evaluation results are encourag-ing as illustrated by smileys added in the above result table.
However, some specific points still need to be improved. Re-lating to Cognitive Integration, it should be interesting to de-fine mechanisms allowing designers to reuse interaction partsof a diagram in other diagrams. This traditional software en-gineering approach (black box vs. glass box) would increasereuse abilities of the VPL. Another interesting perspective re-lates to the Visual Expressiveness principle. We should im-prove the usability of each interaction element, and speciallyits visual representation, to better suggest its role. The un-derlying design environment may also better check connec-tion possibilities between graphic elements in order to reducesome possible designers errors.
Moreover, for the test application, participants have producedtwo different artifacts/deliverables. We may raise some pat-terns to their strengths and weaknesses. They first produceda hand-made production of the Interaction phase. During thisstep, 81% of the participants have produced a “fully-correct”proposal. Other 19% have syntactic problems which may be
hided/overcome by an electronic assistance-tool (our graphi-cal Interaction description WINDMash tool). 6% of the par-ticipants have produced a proposal with 4 diagrams whereas94% used 2 diagrams.
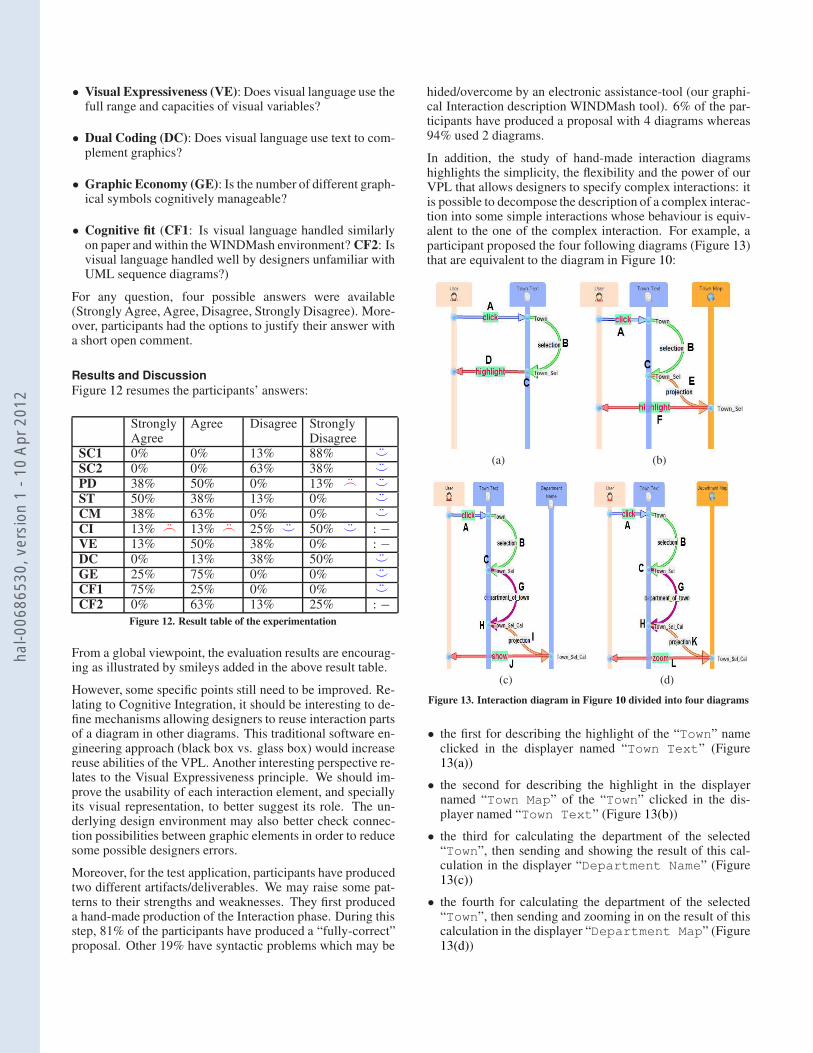
In addition, the study of hand-made interaction diagramshighlights the simplicity, the flexibility and the power of ourVPL that allows designers to specify complex interactions: itis possible to decompose the description of a complex interac-tion into some simple interactions whose behaviour is equiv-alent to the one of the complex interaction. For example, aparticipant proposed the four following diagrams (Figure 13)that are equivalent to the diagram in Figure 10:
(a) (b)
(c) (d)
Figure 13. Interaction diagram in Figure 10 divided into four diagrams
• the first for describing the highlight of the “Town” nameclicked in the displayer named “Town Text” (Figure13(a))
• the second for describing the highlight in the displayernamed “Town Map” of the “Town” clicked in the dis-player named “Town Text” (Figure 13(b))
• the third for calculating the department of the selected“Town”, then sending and showing the result of this cal-culation in the displayer “Department Name” (Figure13(c))
• the fourth for calculating the department of the selected“Town”, then sending and zooming in on the result of thiscalculation in the displayer “Department Map” (Figure13(d))
hal-0
0686
530,
ver
sion
1 -
10 A
pr 2
012

The interaction elements used in Figure 10 (A, B, C, ..., L)can also be found in Figure 13 but they are dispatched intofour diagrams.
Lastly, the participants had to transfer their hand-made pro-posal into the WINDMash environment and to generate theirapplication to immediately check their design. As WIND-Mash is still a prototype, most of the participants encoun-tered problems due to our environment and especially whenthey wanted to correct or to modify a diagram. Our systemis still unstable and they had to start again the whole three-steps process. Hence, during the 15 minutes given time, someparticipants (a quarter) could not achieve. However, amongthose who had syntactic problems with their hand-made pro-posal, all could correct some or all of their “mistakes”. Thiswas quite frustrating for the participants but we had noticedthat it was “only” a debugging problem for our WINDMashenvironment (that we have to shorten drastically before nextevaluation).
CONCLUSION AND FUTURE WORK
In this paper we have offered a VPL allowing designers tospecify and to implement interactions into Web-based ge-ographic applications. Our VPL has been integrated in agraphic design framework called WINDMash for designingapplications according to three main views:
• Which data (geocontents) must be emphasized?
• How this data must be visually displayed?
• What kind of interactions are available to handle this data?
The considered interactions focus on users and are alwaysdescribed in terms of user action triggering system reactions.We gave priority to this “simple” vision of interactions fortwo main reasons:
• to facilitate designers’ work by describing “simple” pro-cesses rather than a global and complex process;
• to favour the elaboration of operational models that can beexploited to generate executable code from visual specifi-cations thanks to model transformation techniques.
Interactions diagrams resulting from our VPL highlight theexchanged flow between the user and the system but also be-tween the interface elements composing the system. We havechosen to describe interactions according to data presented onthe interface. We think that it is a natural way to describe:
• the interface elements that may trigger an interaction;
• how the system will react from a visual viewpoint.
The resulting interaction diagrams may be simple but thesediagrams are always described with high level abstraction el-ements that increase the expressive power and the meaningof the diagram: The designer may define what happens whena user selects a town, without defining what is a town. Des-ignating something on the interface is easy to describe / un-derstand from a graphical viewpoint, even if the designatedelement is something complex (any town).
Our VPL is mostly independent from the geographic field wework on because interactions are described according to:
• user actions which deal with designating data presented ona displayer;
• internal system reactions which deal with computing whathas been selected by the user, transferring data toward spe-cific displayers or computing new data (in this work calcu-lation operations are the only elements that are specific tothe geographic area);
• external system reactions which deal with emphasizing(highlight, show, hide, etc.) specific or computed data.
As shown on the experimentation presented in this paper, ourVPL offers sufficient flexibility to manage the complexity ofan interaction. According to their expertise level, designersmay choose to describe a complex interaction (composed ofmultiple system reactions) with a single diagram or with sev-eral diagrams, each one specifying a system reaction part ofthe global interaction.
First evaluation results about our VPL are very encouraging.Of course, the evaluation task is still a work in progress andwe must elaborate new test protocols to evaluate our interac-tion language according to other criteria such as those pre-sented in [2]. However, this first experimentation has shownthat our visual language is rather easy to master for design-ers specialists knowing UML sequence diagrams. We havenoted that sequence diagrams seem particularly adapted whenit deals with describing interactions thought in terms of flowexchanges between a user and the system but also betweensystem components.
Future work deals with elaborating mechanisms allowing de-signers to check the consistency of the designed interactions.As seen in this paper, describing interactions in a separateway is of course an advantage when it deals with designing acomplex interactive system. However, this advantage can alsobecome a problem when designers need to evaluate the con-sistency of all the system’s interactive possibilities. Currently,interactions are specified separately by a set of diagrams butthere is no mechanism control that checks the global coher-ence of the described interactions. The interactions describedbelow introduce an example of two ambiguous specificationsthat can lead to an incoherent system reaction:
• When the user clicks on a town in the text, the map zoomsin on this town;
• When the user clicks on a town in the text, the map displaysthe corresponding administrative province of this town.
Currently, each specified interaction is encoded using RDF.We plan to exploit the underlying merging and queryingmechanisms of RDF to try to detect possible inconsistenciesbetween all interactions specified by the designer. This hardtask deals with specifying rules that must been verified to en-sure the consistency between two diagrams. The idea is to in-tegrate these checking rules into WINDMash in order to pro-vide a first assistance level allowing designers to keep controlover the global behaviour of the elaborated application.
hal-0
0686
530,
ver
sion
1 -
10 A
pr 2
012

ACKNOWLEDGEMENTS
This work has been supported by the ANR MOANO(http://moano.liuppa.univ-pau.fr) project.
REFERENCES
1. Barbier, F. Supporting the uml state machine diagrams atruntime. In Model Driven Architecture Foundations andApplications, I. Schieferdecker and A. Hartman, Eds.,vol. 5095 of Lecture Notes in Computer Science.Springer Berlin / Heidelberg, 2008, 338–348.
2. Blackwell, A., and Green, T. R. A Cognitive DimensionsQuestionnaire Optimised for Users. In Proceedings of12th Workshop of the Psychology of ProgrammingInterest Group (Corigliano Calabro, Cosenza, Italy,2000), 137–154.
3. Boshernitsan, M., and Downes, M. S. Visualprogramming languages: a survey. Tech. Rep.UCB/CSD-04-1368, EECS Department, University ofCalifornia, Berkeley, Dec 2004.
4. Botturi, L., and Stubbs, T., Eds. Handbook of VisualLanguages for Instructional Design - Theories andPractices. Information Science Reference, 2007.
5. Bowles, J. Decomposing interactions. In AlgebraicMethodology and Software Technology, M. Johnson andV. Vene, Eds., vol. 4019 of LNCS, Springer Berlin /Heidelberg (2006), 189–203.
6. Burnett, M. M., and Baker, M. J. A classification systemfor visual programming languages. J. Vis. Lang.Comput. 5, 3 (1994), 287–300.
7. Chang, S.-K., Ed. Principles of visual programmingsystems. Prentice-Hall, Inc., 1990.
8. Cooper, A. About Face: The Essentials of User InterfaceDesign, 1st ed. John Wiley & Sons, Inc., 1995.
9. Dobesova, Z. Visual programming language ingeographic information systems. In Proceedings of the2nd international conference on Applied informatics andcomputing theory, AICT’11, World Scientific andEngineering Academy and Society (WSEAS) (StevensPoint, Wisconsin, USA, 2011), 276–280.
10. Engels, G., Hausmann, J. H., Heckel, R., and Sauer, S.Dynamic meta modeling: a graphical approach to theoperational semantics of behavioral diagrams in UML.In Proceedings of the 3rd International Conference onthe Unified Modeling Language: advancing thestandard, UML’00, Springer-Verlag (2000), 323–337.
11. Etcheverry, P., Marquesuzaa, C., and Corbineau, S.Designing suited interactions for a documentmanagement system handling localized documents. InProceedings of the 24th annual ACM internationalconference on Design of communication, SIGDOC ’06,ACM (2006), 188–195.
12. Harel, D., and Marelly, R. Come, Let’s Play:Scenario-Based Programming Using LSC’s and thePlay-Engine. Springer-Verlag New York, Inc., 2003.
13. Hennicker, R., and Koch, N. Modeling the user interfaceof web applications with UML. In Workshop of the
pUML-Group held together with the “UML”2001 onPractical UML-Based Rigorous Development Methods -Countering or Integrating the eXtremists (2001),158–172.
14. Khler, H.-J., Nickel, U., Niereand, J., and Zndorf, A.Using UML as visual programming language. TechnicalReport tr-ri-99-205 (1999).
15. Koegel, J. F., and Heines, J. M. Improving visualprogramming languages for multimedia authoring. InED-MEDIA ’93, World Conference on EducationalMultimedia and Hypermedia (1993), 286–293.
16. Luong, T. N., Laborie, S., and Nodenot, T. A frameworkwith tools for designing web-based geographicapplications. In ACM Symposium on DocumentEngineering (2011), 33–42.
17. Manola, F., and Miller, E. RDF Primer.Recommendation, W3C, February 2004.http://www.w3.org/TR/rdf-syntax/.
18. Moody, D. The physics of notations: Toward a scientificbasis for constructing visual notations in softwareengineering. IEEE Trans. Softw. Eng. 35 (November2009), 756–779.
19. Myers, B. A. Taxonomies of visual programming andprogram visualization. Journal of Visual Languages andComputing 1 (March 1990), 97–123.
20. Narayanan, N. H., and Hubscher, R. Visual languagetheory: towards a human computer interactionperspective. Springer-Verlag New York, Inc., New York,NY, USA, 1998, 87–128.
21. Raymond, D. R. Characterizing visual languages. InProc. 1991 IEEE Workshop on Visual Languages.(Kobe, Society Press (1991), 176–182.
22. Shu, N. C. Visual programming: Perspectives andapproaches. IBM Systems Journal 38, 2/3 (1999),199–221.
23. Stubbs, T., and Gibbons, A. The power of designdrawings in other design fields. In Handbook of VisualLanguages in Instructional Design; Theories andPractice (2007).
24. Stuhmer, R., Anicic, D., Sen, S., Ma, J., Schmidt, K.-U.,and Stojanovic, N. Lifting events in RDF frominteractions with annotated web pages. In Proceedingsof the 8th International Semantic Web Conference,Springer-Verlag (2009), 893–908.
25. Traynor, C., and Williams, M. G. End users and GIS: ademonstration is worth a thousand words. MorganKaufmann Publishers Inc., San Francisco, CA, USA,2001, 115–134.
26. Ziadi, T., Blanc, X., and Raji, A. From requirements tocode revisited. In Proceedings of the 2009 IEEEInternational Symposium onObject/Component/Service-Oriented Real-TimeDistributed Computing, ISORC ’09, IEEE ComputerSociety (Washington, DC, USA, 2009), 228–235.
hal-0
0686
530,
ver
sion
1 -
10 A
pr 2
012