A two-stage scheme for text detection in video images
14
A two-stage scheme for text detection in video images Marios Anthimopoulos * , Basilis Gatos, Ioannis Pratikakis Computational Intelligence Laboratory, Institute of Informatics and Telecommunications, National Center for Scientific Research ‘‘Demokritos”, 153 10 Athens, Greece article info Article history: Received 16 July 2009 Received in revised form 17 February 2010 Accepted 3 March 2010 Keywords: Text detection Video OCR Content-based indexing SVM abstract This paper proposes a two-stage system for text detection in video images. In the first stage, text lines are detected based on the edge map of the image leading in a high recall rate with low computational time expenses. In the second stage, the result is refined using a sliding window and an SVM classifier trained on features obtained by a new Local Binary Pattern-based operator (eLBP) that describes the local edge distribution. The whole algorithm is used in a multiresolution fashion enabling detection of characters for a broad size range. Experimental results, based on a new evaluation methodology, show the promising overall performance of the system on a challenging corpus, and prove the superior discriminating ability of the proposed feature set against the best features reported in the literature. Ó 2010 Elsevier B.V. All rights reserved. 1. Introduction The tremendous increase of multimedia content has raised the need for automatic semantic information indexing and retrieval systems. Many methods have been proposed for the semantics extraction of various granularity levels from audiovisual content. Textual information in videos proves to be an important source of high-level semantics. There exist mainly two kinds of text occur- rences in videos, namely artificial and scene text. Artificial text, as the name implies, is artificially added in order to describe the con- tent of the video or give additional information related to it. This makes it highly useful for building keyword indexes. Scene text is textual content that was captured by a camera as part of a scene such as text on T-shirts or road signs and usually brings less related to video information. In Fig. 1, yellow boxes denote artificial text while red boxes delimit the scene text. Text can also be classified into normal or inverse. Normal is denoted any text whose charac- ters have lower intensity values than the background while inverse text is the opposite [1]. In Fig. 2, ‘‘EURO” is inverse while ‘‘SPORT” is normal text. The procedure of textual information extraction from videos is usually split into four distinct steps: (i) detection, (ii) tracking, (iii) segmentation and (iv) recognition. Among all steps, detection step is the most crucial and although it has been exten- sively studied in the past decade presenting quite promising re- sults, there are still challenges to meet. Further down we will discuss the different approaches used towards the text detection problem, the corresponding drawbacks and the remaining chal- lenges. In this discussion we will focus on the methods designed for detecting artificial text in video images. For scene text detection in camera-based images the reader should refer to the survey pa- pers [2–4]. Most of proposed text detection methods use as representative text features, color, edge and texture information. To exploit this information, i.e. describe text and discriminate it from the back- ground, some researchers apply heuristic rules derived by empirical constraints while others use machine-learning methods trained on real data. Recently, some hybrid approaches have been proposed. Many existing heuristic methods, derived from document anal- ysis research area, are based on color or intensity homogeneity of characters. They detect character regions in the image and then group them into words and text lines based on geometrical con- straints. These methods, also known as connected component (CC) methods, can perform satisfactorily only on high quality images with simple background and known text color, assump- tions that usually do not apply in the case of video images. More- over, text in video images often suffers from color bleeding due to video compression. Typical CC approaches can be found in [5,6]. Some other heuristic methods detect text based on edge informa- tion, i.e. strength, density or distribution. Sato et al. [7] apply a 3 3 horizontal differential filter to the entire image with appropriate binary thresholding followed by size, fill factor and horizontal–ver- tical aspect ratio constraints. Xi et al. [8] propose an edge-based method based on an edge map created by Sobel operator followed by smoothing filters, morphological operations and geometrical constraints. Cai et al. [9] and Lyu et al. [10] suggest the use of local thresholding on a sobel-based edge strength map. Anthimopoulos et al. [11] use Canny edge map followed by morphological operations and projection analysis. Kim and Kim [12] instead of using an explicit 0262-8856/$ - see front matter Ó 2010 Elsevier B.V. All rights reserved. doi:10.1016/j.imavis.2010.03.004 * Corresponding author. Tel.: +30 210 650 3218; fax: +30 210 653 2175. E-mail addresses: [email protected] (M. Anthimopoulos), bgat@iit. demokritos.gr (B. Gatos), [email protected] (I. Pratikakis). Image and Vision Computing 28 (2010) 1413–1426 Contents lists available at ScienceDirect Image and Vision Computing journal homepage: www.elsevier.com/locate/imavis
Transcript of A two-stage scheme for text detection in video images

Image and Vision Computing 28 (2010) 1413–1426
Contents lists available at ScienceDirect
Image and Vision Computing
journal homepage: www.elsevier .com/ locate / imavis
A two-stage scheme for text detection in video images
Marios Anthimopoulos *, Basilis Gatos, Ioannis PratikakisComputational Intelligence Laboratory, Institute of Informatics and Telecommunications, National Center for Scientific Research ‘‘Demokritos”, 153 10 Athens, Greece
a r t i c l e i n f o
Article history:Received 16 July 2009Received in revised form 17 February 2010Accepted 3 March 2010
Keywords:Text detectionVideo OCRContent-based indexingSVM
0262-8856/$ - see front matter � 2010 Elsevier B.V. Adoi:10.1016/j.imavis.2010.03.004
* Corresponding author. Tel.: +30 210 650 3218; faE-mail addresses: [email protected] (M
demokritos.gr (B. Gatos), [email protected] (I
a b s t r a c t
This paper proposes a two-stage system for text detection in video images. In the first stage, text lines aredetected based on the edge map of the image leading in a high recall rate with low computational timeexpenses. In the second stage, the result is refined using a sliding window and an SVM classifier trainedon features obtained by a new Local Binary Pattern-based operator (eLBP) that describes the local edgedistribution. The whole algorithm is used in a multiresolution fashion enabling detection of charactersfor a broad size range. Experimental results, based on a new evaluation methodology, show the promisingoverall performance of the system on a challenging corpus, and prove the superior discriminating abilityof the proposed feature set against the best features reported in the literature.
� 2010 Elsevier B.V. All rights reserved.
1. Introduction
The tremendous increase of multimedia content has raised theneed for automatic semantic information indexing and retrievalsystems. Many methods have been proposed for the semanticsextraction of various granularity levels from audiovisual content.Textual information in videos proves to be an important sourceof high-level semantics. There exist mainly two kinds of text occur-rences in videos, namely artificial and scene text. Artificial text, asthe name implies, is artificially added in order to describe the con-tent of the video or give additional information related to it. Thismakes it highly useful for building keyword indexes. Scene textis textual content that was captured by a camera as part of a scenesuch as text on T-shirts or road signs and usually brings less relatedto video information. In Fig. 1, yellow boxes denote artificial textwhile red boxes delimit the scene text. Text can also be classifiedinto normal or inverse. Normal is denoted any text whose charac-ters have lower intensity values than the background while inversetext is the opposite [1]. In Fig. 2, ‘‘EURO” is inverse while ‘‘SPORT” isnormal text. The procedure of textual information extraction fromvideos is usually split into four distinct steps: (i) detection, (ii)tracking, (iii) segmentation and (iv) recognition. Among all steps,detection step is the most crucial and although it has been exten-sively studied in the past decade presenting quite promising re-sults, there are still challenges to meet. Further down we willdiscuss the different approaches used towards the text detectionproblem, the corresponding drawbacks and the remaining chal-
ll rights reserved.
x: +30 210 653 2175.. Anthimopoulos), bgat@iit.
. Pratikakis).
lenges. In this discussion we will focus on the methods designedfor detecting artificial text in video images. For scene text detectionin camera-based images the reader should refer to the survey pa-pers [2–4].
Most of proposed text detection methods use as representativetext features, color, edge and texture information. To exploit thisinformation, i.e. describe text and discriminate it from the back-ground, some researchers apply heuristic rules derived by empiricalconstraints while others use machine-learning methods trained onreal data. Recently, some hybrid approaches have been proposed.
Many existing heuristic methods, derived from document anal-ysis research area, are based on color or intensity homogeneity ofcharacters. They detect character regions in the image and thengroup them into words and text lines based on geometrical con-straints. These methods, also known as connected component(CC) methods, can perform satisfactorily only on high qualityimages with simple background and known text color, assump-tions that usually do not apply in the case of video images. More-over, text in video images often suffers from color bleeding due tovideo compression. Typical CC approaches can be found in [5,6].
Some other heuristic methods detect text based on edge informa-tion, i.e. strength, density or distribution. Sato et al. [7] apply a 3 � 3horizontal differential filter to the entire image with appropriatebinary thresholding followed by size, fill factor and horizontal–ver-tical aspect ratio constraints. Xi et al. [8] propose an edge-basedmethod based on an edge map created by Sobel operator followedby smoothing filters, morphological operations and geometricalconstraints. Cai et al. [9] and Lyu et al. [10] suggest the use of localthresholding on a sobel-based edge strength map. Anthimopouloset al. [11] use Canny edge map followed by morphological operationsand projection analysis. Kim and Kim [12] instead of using an explicit

Fig. 1. Example of artificial and scene text. Yellow boxes bound artificial text whilered indicate scene text.
1414 M. Anthimopoulos et al. / Image and Vision Computing 28 (2010) 1413–1426
edge map as an indicator of overlay text, they suggest the use of atransition map generated by the change of intensity and a modifiedsaturation. A heuristic rule based on the different Local Binary Pat-terns (LBP) is used for verification. These heuristic techniques provedto be very efficient and satisfactory robust for specific applicationswith high contrast characters and relatively smooth background.However, the fact that many parameters have to be estimated exper-imentally condemns them to data dependency and lack ofgenerality.
DCT coefficients of intensity images have been widely used astexture features and have also been used for heuristic text detec-tion methods [13–16]. The DCT coefficients globally map the peri-odicity of an image and can be a quite efficient solution for jpegand mpeg encoded images and videos. In this case, the pre-com-puted coefficients of 8 � 8 pixel block units are used. However, thisblock size is not a large enough area to sufficiently depict the peri-odical features of a text line and the computation of DCT for largerwindows even by the fast DCT transform proves quite costly. Inaddition, these methods still use empirical thresholds on specificDCT-based features and therefore they lack adaptability.
Several machine learning-based approaches have been pro-posed for the detection of text areas with great success. These ap-proaches are based on sliding windows that scan the image andmachine learning techniques which classify each window as textor non-text. Machine learning classifiers have proved to be an
Fig. 2. Example of inverse and normal text.
appealing solution for many problems that cannot be defined ina strict mathematical manner. Jung [17] and Kim et al. [18] directlyuse the color and gray values of the pixels as input for a neural net-work and an SVM, respectively. Wolf and Jolion [19] use an SVMtrained on differential and geometrical features. Lienhart and Wer-nicke in [20] used as features the complex values of the gradient ofthe RGB input image fed to a complex-valued neural network. Liet al. [21] suggest the use of the mean, second order (variance)and third-order central moments of the LH, HL, and HH componentof the first three levels of each window to train a three-layer neuralnetwork. Zhang et al. [22] proposed a system for object detectionbased on Local Binary Patterns (LBP) and Cascade histogrammatching. They applied the proposed method to video text andcar detection. The main shortcoming of the methods attributedto this category is the high computational complexity since a slid-ing window is required to scan the entire image with a typical stepof 3 or 4 pixels, demanding thousands of calls to the classifier perimage.
Recently, some hybrid methods have also been proposed, thatcombine the efficiency of heuristic methods with machine-learn-ing accuracy and generalization. These methods usually consistof two stages. The first localizes text with a fast heuristic techniquewhile the second verifies the previous results eliminating some de-tected area as false alarms using machine learning. In [23], Chenet al. use a localization/verification scheme which claim to behighly efficient and effective. For the verification part, ConstantGradient Variance (CGV) features are fed to an SVM classifier. Yeet al. [24] propose a coarse-to-fine algorithm based on wavelets.The first stage applies thresholding on the wavelet energy in orderto coarsely detect text, while the second identifies the coarse re-sults using an SVM and a more sophisticated wavelet-based fea-ture set. Jung et al. [25] apply as a first stage, a stroke filteringand they also verify the result using an SVM with normalized grayintensity and CGV features. Then, a text line refinement modulefollows, consisting of text boundary shrinking, combination andextension functions. However, the machine learning verificationtask used by these methods can only take a binary decision, i.e. ifan initial result is text or not without having the capability to re-fine it. For example, if the resulting bounding box of the first stagecontains text as well as background pixels, in the second stage itwill be either entirely verified as text, or discarded as false alarm.
Concluding the discussion of the previous works, we can saythat although the specific research area has shown a great pro-gress, there are still challenges to be considered. Machine-learningmethods have shown important capabilities for generalization butproved to be computationally expensive. Hybrid methods benefitregarding efficiency but they are actually based on the initial re-sults of heuristic methods which fail to deal with complex back-ground. Another great challenge is the choice of the feature setused by machine learning techniques to discriminate text fromnon-text areas. The features used until now, usually inherited fromtexture segmentation research area, are not capable to adapt to thespecific problem and fail to discriminate varying-contrast textfrom high-contrast background. Finally, another essential factorfor the optimization of every text detection algorithm is the choiceof an objective evaluation methodology.
In this work we propose a two-stage approach with a novel ma-chine learning refinement which cannot only verify the initial re-sult but refine its boundaries as well. In that way the wholesystem’s performance is based on this refinement, instead of rely-ing to the initial heuristic results. This machine learning stage usesa new, highly discriminative feature set, derived from a proposedoperator that captures the edge structure for different levels ofcontrast, and has shown superior performance against other fea-tures reported in the literature. Finally, a novel evaluation method-ology is introduced which is based on the estimated number of

M. Anthimopoulos et al. / Image and Vision Computing 28 (2010) 1413–1426 1415
characters and proved to be more representative in terms of tex-tual information extraction, contrary to the existing pixel-basedor block-based approaches.
The remainder of our paper is structured as follows: In Section 2the proposed two-stage algorithm is described, Section 3 presentsthe experimental results and the corresponding discussion, and fi-nally, in Section 4 conclusions are drawn.
Initial BBs
CC Analysis
Opening
Dilation
Map Generation
Vertical ProjectionThresholding
HorizontalProjectionThresholding
Changes in BBs?
Heuristic Coarse Detect
Is the wholeimage scanned?
Region GrowingAlgorithm
Fixed Size SlidingWindow
Feature Extraction(eLBP)
SVM Training
M
Yes
No
All resolutionsare processed?
No
Yes
No
Yes
Text Area Detection
Text Line Detectio
VideoImage
Coarse BBs
Final BBs
Fig. 3. Flowchart of the p
2. Proposed methodology
The proposed text detection methodology constitutes a two-stage, coarse-to-fine approach. In the first stage, namely heuristiccoarse detection stage, we adopted a low threshold for the genera-tion of the edge map which provides us with a high recall rate for vid-eos of different contrast values. The second stage, namely machine
ion
Suppression of alreadyfound Textlines in Edge
Map
Resolution LevelDecrease
Saliency MapGeneration
SVM Prediction
achine Learning Refinement
n Multiresolution Analysis
roposed algorithm.

1416 M. Anthimopoulos et al. / Image and Vision Computing 28 (2010) 1413–1426
learning refinement stage is used to refine the result in every Bound-ing Box (BB) of the initial result leading to an effective minimizationof false alarms (Fig. 3). This stage uses an edge histogram-based fea-ture set, derived from a proposed operator and will be described indetail in Section 2.2.1. Finally the multiresolutional manner of themethod aids in detecting characters of various sizes in different res-olutions, although the basic method is trained in a fixed scale.
Since the basic two-stage algorithm is trained on a fixed scale, be-fore the further description of the algorithm we have to make someassumptions about the size range of the text to be recognized. We as-sume that text height varies between MinH and MaxH pixels andevery text line consists of at least three characters leading to a min-imum width of approximately MinW = 3 �MinH pixels. The choiceof the size range is crucial for the system’s performance. Generally,smaller range leads to better detection on a fixed scale level sincecharacters of different sizes present different texture characteristics.However, a narrow range would also lead to many levels for the mul-tiresolution approach and thus more difficult combination of the dif-ferent scales’ results. Eventually, the choice of MinH and MaxHvalues has to satisfy the tradeoff between the performance of thefixed-scale detector and the multiresolution analysis. Further downwe will demonstrate the results of the different stages of the algo-rithm on the video images shown in Fig. 1. Fig. 1a shows an imagewith a relatively low edge density background while Fig. 1b showsa scene with very strong background edges, thus, it constitutes agreat challenge for every text detection system.
2.1. Heuristic coarse text detection
For the first, coarse stage of text detection, we use an approachbased on a previous work by Anthimopoulos et al. [11]. This ap-proach exploits the fact that text lines produce strong vertical edgeshorizontally aligned with a high density. The use of edge information
Fig. 4. Example of text area detection in a low edge density image. (a) Edge map, (b) danalysis.
for text detection is justified by the fact that every kind of text pre-sents strong edges, in order to be readable. Moreover, using edgesas the prominent feature of our system gives us the opportunity todetect normal or inverse characters of any color.
2.1.1. Text area detectionAs a first step of the heuristic coarse detection stage, we pro-
duce the edge map of the video image. Several methodologiesare used in the literature for computing the edge map of an image[26]. For our algorithm we use Canny edge detector. Canny [27]uses Sobel masks in order to find the edge magnitude of the imageintensity and then uses non-maxima suppression and hysteresisthresholding. Ideally, the created edge map is a binarized imagewith the contour pixels set to one (white) and the remainder pixelsequal to zero (black) (Figs. 4a and 5a). After computing the Cannyedge map, a dilation is performed to link the character edges ofevery text line (Figs. 4b and 5b). The structuring element in thedilation is horizontal and its size depends on the estimated maxi-mum distance between the characters. A 3 � (MaxH/2) cross-shaped element found to be satisfactory for characters up to MaxHpixels height. Then a morphological opening is used, removing thenoise and smoothing the candidate text areas (Figs. 4c and 5c). Theelement used here is also cross-shaped with size equal to Min-H �MinW which is actually the size of the smallest text line tobe detected. Every component created by the previous dilationwith height less than MinH or width less than MinW is suppressed.
Unfortunately, this operation may suppress the edges of textlines with height less than MinH pixels. However, this is not sodevastating since very small characters are either way not recog-nized in the stage of recognition. At this phase, every connectedcomponent represents a candidate text area for which we haveto compute the bounding box (Figs. 4d and 5d).
ilated edge map, (c) opening on the edge map, (d) initial bounding boxes after CC
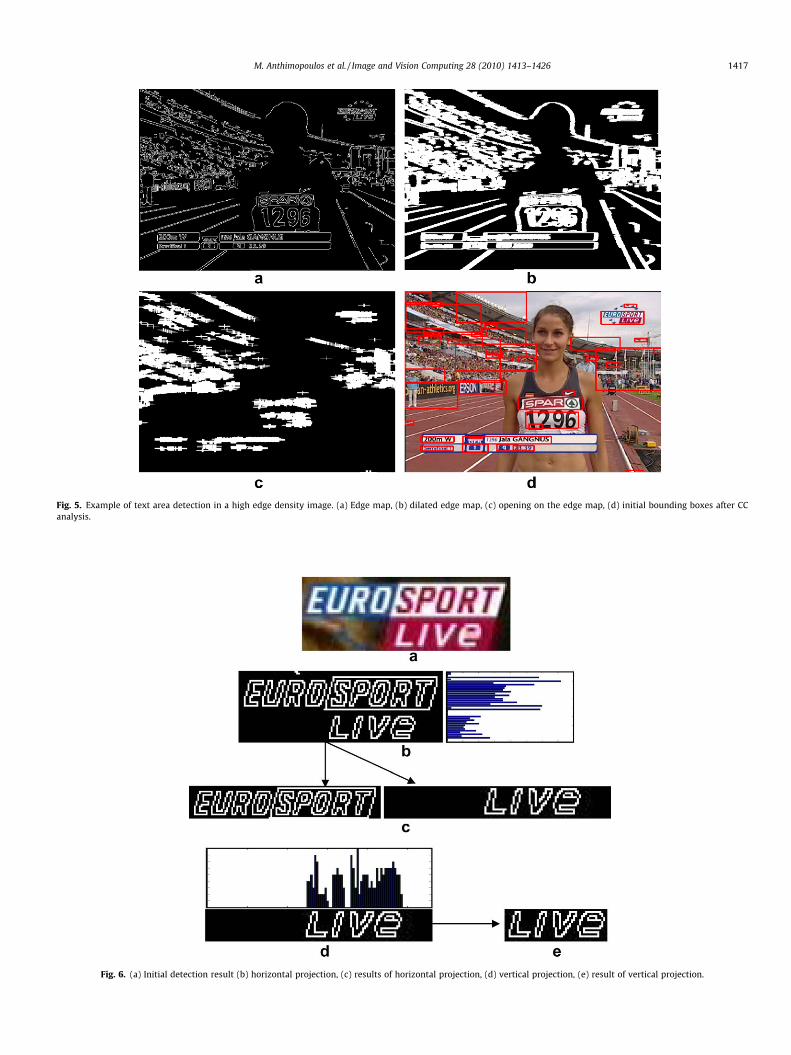
Fig. 6. (a) Initial detection result (b) horizontal projection, (c) results of horizontal projection, (d) vertical projection, (e) result of vertical projection.
Fig. 5. Example of text area detection in a high edge density image. (a) Edge map, (b) dilated edge map, (c) opening on the edge map, (d) initial bounding boxes after CCanalysis.
M. Anthimopoulos et al. / Image and Vision Computing 28 (2010) 1413–1426 1417

Fig. 8. Bounding boxes after projection analysis of the high edge density image.
1418 M. Anthimopoulos et al. / Image and Vision Computing 28 (2010) 1413–1426
2.1.2. Text line detectionThe previous stage has a high detection rate but relatively low
precision due to many false positives. This means that most ofthe text lines are included in the text area boxes while at the sametime some bounding boxes may include more than one text line aswell as noise. The noise usually originates from objects with highintensity edges that connect to the text lines during the dilationprocess. The low precision also originates from detected boundingboxes which do not contain text but objects with high vertical edgedensity. To improve precision by rejecting the false alarms we usea method based on horizontal and vertical projections.
Firstly, the horizontal edge projection of every box is computedand lines with projection values below a threshold are discarded.In this way, boxes with more than one text line are split and somelines with noise are also discarded (Fig. 6b). Nevertheless, boxeswhich do not contain text are usually split in a number of boxeswith very small height and discarded by the next stage due to sizeconstraints.
A box is discarded if:
� Height is lower than MinH.� Width is lower than a MinW.� Ratio width/ height is lower than a threshold (set to 1.5).
Then, a similar procedure with vertical projection follows(Fig. 6d). This method would actually break every text line inwords or even in characters. However, this is not an intention ofthe algorithm so finally the vertically divided parts are reconnectedif the distance between them is less than a threshold which de-pends on the height of the candidate text line (set to 1.5 � height).In this way, a bounding box will split only if the distance betweentwo words is larger than the threshold which means that actuallybelong to different text lines or if a part of the candidate text linecontain only noise. The whole procedure with horizontal and ver-tical projections is repeated until no changes occur. Examples ofprojection analysis results are presented in Figs. 7 and 8.
The final results of the coarse stage for the two examples lead usto some observations. The video image with the smoothest back-ground presents a quite satisfactory result (Fig. 7) while the highedge density image produces many false alarms (Fig. 8).
2.2. Machine learning refinement
Edge-based heuristic methods detect text based mainly on theedge density. However, in many cases, non-text regions present
Fig. 7. Bounding boxes after projection analysis of the low edge density image.
edge density values adequate to produce false alarms that humanoptical perception system would have avoided. This fact motivatedthe research of larger feature sets which capture not only theabrupt intensity changes of the image, but their spatial distribu-tion, as well. The large number of features and the great general-ization capability of Support Vector Machines (SVM’s) [28] led usto use an SVM and a sliding window model followed by a regiongrowing algorithm to refine the result. This approach was initiallyproposed in our previous work [29]. However the features used in[29] proved to be much weaker than the new proposed feature set,which will be described in the next section.
2.2.1. Feature extractionThe majority of the features used for text detection originate
from texture segmentation research area since a text area as a peri-odic repetition of similar objects with specific alignment presentssome of the fundamental characteristics of texture. Local BinaryPattern (LBP) has proven to be highly discriminative for texturesegmentation and its advantages, namely, its invariance to mono-tonic gray-level changes and computational efficiency, make itsuitable for demanding image analysis tasks. This fact motivatedus to use the concept of LBP for text detection and adjust it tothe specific problem.
LBP was originally introduced by Ojala et al. [30] as a non para-metric operator measuring the local contrast for efficient textureclassification. The LBP operator consists of a 3 � 3 kernel wherethe center pixel is used as a threshold. Then the eight binarizedneighbours are multiplied by the respective binomial weight pro-ducing an integer in the range [0 . . . 255] (Fig. 9). Each of the 256different 8-bit words is considered to represent a unique texturepattern.
Formally, the decimal form of the resulting 8-bit word (LBPcode) can be expressed as follows:
LBPðxc; ycÞ ¼X7
n¼0
Sðin � icÞ2n ð1Þ
where ic corresponds to the grey value of the center pixel (xc, yc), in(n 2 ½0;7�) to the grey values of the eight surrounding pixels, andfunction S(x) is defined as:
SðxÞ ¼1; x P 00; x < 0
�ð2Þ
When local binary pattern is applied in a greyscale image, another8-bit greyscale image is created in which each pixel value repre-sents the texture pattern of the respective pixel in the original im-
71 78 20
75 77 24
77 80 22
0 0 1
0 1
0 0 1
eLBPv-h = 2
eLBPdiag = 2+4 = 6
1 1 2
8 2
8 4 4
Se(x)
Multiply
Sum
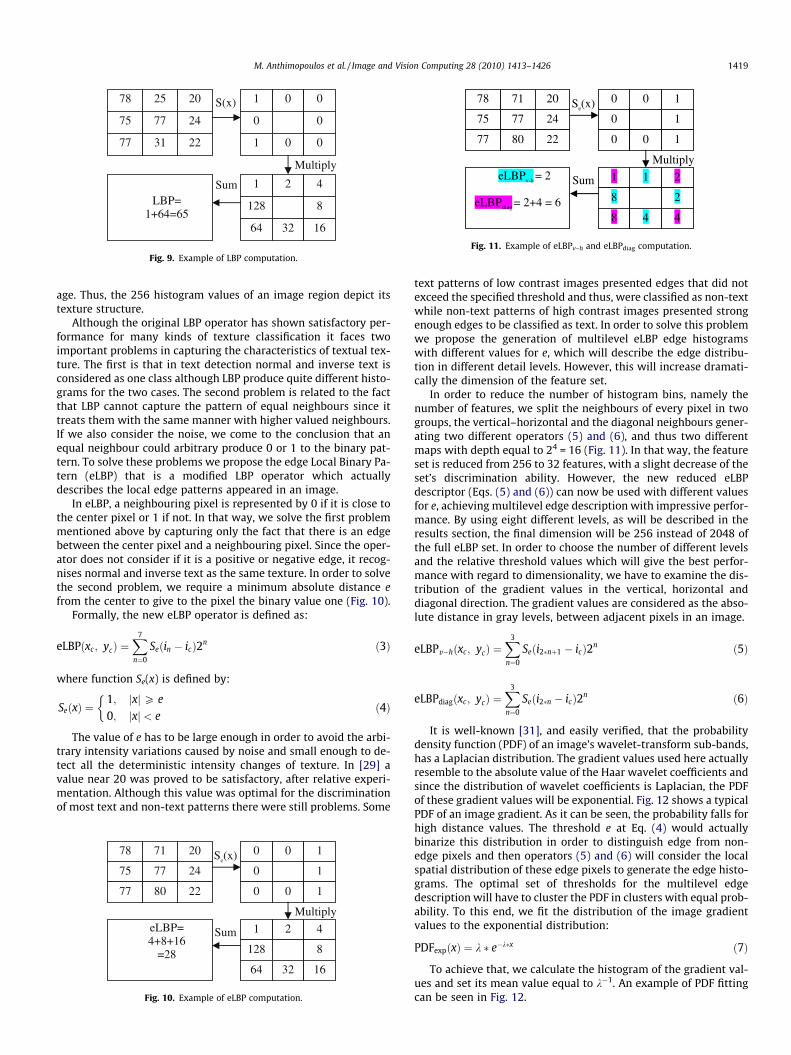
Fig. 11. Example of eLBPv–h and eLBPdiag computation.
25 78 20
75 77 24
77 31 22
0 1 0
0 0
1 0 0
LBP= 1+64=65
2 1 4
128 8
64 32 16
S(x)
Multiply
Sum
Fig. 9. Example of LBP computation.
M. Anthimopoulos et al. / Image and Vision Computing 28 (2010) 1413–1426 1419
age. Thus, the 256 histogram values of an image region depict itstexture structure.
Although the original LBP operator has shown satisfactory per-formance for many kinds of texture classification it faces twoimportant problems in capturing the characteristics of textual tex-ture. The first is that in text detection normal and inverse text isconsidered as one class although LBP produce quite different histo-grams for the two cases. The second problem is related to the factthat LBP cannot capture the pattern of equal neighbours since ittreats them with the same manner with higher valued neighbours.If we also consider the noise, we come to the conclusion that anequal neighbour could arbitrary produce 0 or 1 to the binary pat-tern. To solve these problems we propose the edge Local Binary Pa-tern (eLBP) that is a modified LBP operator which actuallydescribes the local edge patterns appeared in an image.
In eLBP, a neighbouring pixel is represented by 0 if it is close tothe center pixel or 1 if not. In that way, we solve the first problemmentioned above by capturing only the fact that there is an edgebetween the center pixel and a neighbouring pixel. Since the oper-ator does not consider if it is a positive or negative edge, it recog-nises normal and inverse text as the same texture. In order to solvethe second problem, we require a minimum absolute distance efrom the center to give to the pixel the binary value one (Fig. 10).
Formally, the new eLBP operator is defined as:
eLBPðxc; ycÞ ¼X7
n¼0
Seðin � icÞ2n ð3Þ
where function Se(x) is defined by:
SeðxÞ ¼1; jxjP e
0; jxj < e
�ð4Þ
The value of e has to be large enough in order to avoid the arbi-trary intensity variations caused by noise and small enough to de-tect all the deterministic intensity changes of texture. In [29] avalue near 20 was proved to be satisfactory, after relative experi-mentation. Although this value was optimal for the discriminationof most text and non-text patterns there were still problems. Some
71 78 20
75 77 24
77 80 22
0 0 1
0 1
0 0 1
eLBP= 4+8+16
=28
2 1 4
128 8
64 32 16
Se(x)
Multiply
Sum
Fig. 10. Example of eLBP computation.
text patterns of low contrast images presented edges that did notexceed the specified threshold and thus, were classified as non-textwhile non-text patterns of high contrast images presented strongenough edges to be classified as text. In order to solve this problemwe propose the generation of multilevel eLBP edge histogramswith different values for e, which will describe the edge distribu-tion in different detail levels. However, this will increase dramati-cally the dimension of the feature set.
In order to reduce the number of histogram bins, namely thenumber of features, we split the neighbours of every pixel in twogroups, the vertical–horizontal and the diagonal neighbours gener-ating two different operators (5) and (6), and thus two differentmaps with depth equal to 24 = 16 (Fig. 11). In that way, the featureset is reduced from 256 to 32 features, with a slight decrease of theset’s discrimination ability. However, the new reduced eLBPdescriptor (Eqs. (5) and (6)) can now be used with different valuesfor e, achieving multilevel edge description with impressive perfor-mance. By using eight different levels, as will be described in theresults section, the final dimension will be 256 instead of 2048 ofthe full eLBP set. In order to choose the number of different levelsand the relative threshold values which will give the best perfor-mance with regard to dimensionality, we have to examine the dis-tribution of the gradient values in the vertical, horizontal anddiagonal direction. The gradient values are considered as the abso-lute distance in gray levels, between adjacent pixels in an image.
eLBPv�hðxc; ycÞ ¼X3
n¼0
Seði2�nþ1 � icÞ2n ð5Þ
eLBPdiagðxc; ycÞ ¼X3
n¼0
Seði2�n � icÞ2n ð6Þ
It is well-known [31], and easily verified, that the probabilitydensity function (PDF) of an image’s wavelet-transform sub-bands,has a Laplacian distribution. The gradient values used here actuallyresemble to the absolute value of the Haar wavelet coefficients andsince the distribution of wavelet coefficients is Laplacian, the PDFof these gradient values will be exponential. Fig. 12 shows a typicalPDF of an image gradient. As it can be seen, the probability falls forhigh distance values. The threshold e at Eq. (4) would actuallybinarize this distribution in order to distinguish edge from non-edge pixels and then operators (5) and (6) will consider the localspatial distribution of these edge pixels to generate the edge histo-grams. The optimal set of thresholds for the multilevel edgedescription will have to cluster the PDF in clusters with equal prob-ability. To this end, we fit the distribution of the image gradientvalues to the exponential distribution:
PDFexpðxÞ ¼ k � e�k�x ð7Þ
To achieve that, we calculate the histogram of the gradient val-ues and set its mean value equal to k�1. An example of PDF fittingcan be seen in Fig. 12.

Fig. 14. Example of machine learning refinement. (a) Text block detected heuris-tically, (b) saliency map, (c) region growing result, (d) refined result.
Fig. 15. The refined result of the coarse outcome shown in Fig. 8.
Fig. 12. Typical distribution of image gradient values (blue-dotted), fitted expo-nential distribution (red-solid).
1420 M. Anthimopoulos et al. / Image and Vision Computing 28 (2010) 1413–1426
The quantile function (inverse cumulative distribution function)of PDFexp is denoted as:
FexpðpÞ ¼ �k�1 � lnð1� pÞ ð8Þ
where 0 6 p < 1. The quantile function returns the value belowwhich random draws from the given distribution would fall,p � 100% of the time. Therefore, in order to cluster our distributionin equal probability clusters we use as thresholds the values of Fexp
for equally spaced values of p in [0,1). That is,
p ¼ i=ðLþ 1Þ ð9Þ
where i = 1 . . . L and L is the number of different levels. In that way,the selected threshold values will be denser close to zero where thePDF shows higher values. This PDF fitting will be done for every im-age portion detected by the heuristic stage, re-establishing thethreshold set and giving to the feature set the ability to adapt tocases with different contrast profile.
2.2.2. Saliency map generationEvery sub-image that is detected heuristically as a text line is
scanned by a 20 � 10 sliding window and the responses of the clas-sifier (text = 1, non-text = 0) are accumulated in a saliency mapfrom which the final bounding boxes will be extracted (Fig. 13).The step of the moving window was set to 6 pixels horizontallyand 3 pixels vertically, since this values showed a good tradeoff be-tween accuracy and efficiency. Meanwhile another map is gener-ated, in which every value represents the number of visits by thesliding window to the corresponding pixel. This map is used forthe normalization of the saliency map from 0 to 1. After normaliza-tion, every value of the map represents the estimated by the sys-tem probability of the respective pixel, to belong to text area.
Fig. 13. Example of saliency map generation. (a) Tex
2.2.3. Region growing algorithm – refined bounding boxes generationAfter the saliency map generation a region growing algorithm
is applied in order to produce the final result. Two thresholds th1and th2 (with th1 > th2) are used to define whether an area of themap belongs to text. All the pixels of the map with value over th1are considered to belong to text and therefore they are used asseeds. Also, if the value of a pixel is below th1 but over th2 andhas a neighbouring pixel already classified as text it is also con-sidered as a text pixel. The values of th1 and th2 are experimen-tally estimated to 0.8 and 0.4, respectively which means that atext region must contain at least one pixel classified as text bythe 80% of the sliding windows (usually in the center of text)but all pixels have to be classified as text by at least 40% of slidingwindows. A connected component analysis follows to output onebounding box for every text region. Fig. 14 provides an exampleof the refinement method while Fig. 15 presents the final resultof the refinement step.
The contribution of this stage is the capability of refining in-stead of just verifying the initial results like the previous hybrid ap-
t block detected heuristically, (b) saliency map.

M. Anthimopoulos et al. / Image and Vision Computing 28 (2010) 1413–1426 1421
proaches proposed [23–25]. This means that while an image is re-fined, the machine learning algorithm can:
� Discard a part of the text image as false alarm.� Discard the whole image.� Split the image into different text lines.
2.3. Multiresolution analysis
Using differential features in order to detect text gives to themethod independence from text color. However, this methodclearly depends on the size of the characters. The size of the ele-ments for the morphological operations and the geometrical con-straints give to the algorithm the ability to detect text in aspecific range of character sizes. Moreover the classifier of the ma-chine learning stage is trained on the same narrow range of fontsizes since characters of different sizes present different texturecharacteristics.
To overcome this problem, we adopt a multiresolution ap-proach. Both coarse and refinement stages of the algorithm are ap-plied to the images in different resolutions and finally the resultsare combined to the original resolution. This combination mightbe quite difficult if we consider that the same text might be de-
Fig. 16. Multiresolution analysis. (a) Original resolution edge map, (b) result at originalfound text), (d) result at low resolution, (e) final result.
tected in different resolutions so bounding boxes will overlap. Toavoid that, the algorithm suppresses the edges of the already de-tected characters in a resolution before the edge map is passedto the next resolution. Figs. 16 and 17 give examples of the algo-rithm performance using multiresolution framework for our twoexamples.
3. Experimental results and discussion
For our experiments we used a corpus consisting of two videoimage sets. The first one contains 214 frames from athletic eventswith 2963 text occurrences while the second one includes 172frames from news and advertisements with a total of 672 textoccurrences. These sets have been generated by selecting videoimages from 10 different videos, containing artificial and scenetext, and constitute a much more general and thus difficult corpusthan the one used in [11]. For our experiments, we chose MinH = 9and MaxH = 30 since the height of the smaller character found inthe corpus was equal to nine and the range of sizes considered rea-sonable for the fixed-scale detector. For the multiresolution analysis,we used two resolutions: the initial, and the one with a scale factor of0.5. In this way the system can detect characters with height up to 60pixels which was considered to be satisfying. Taking into account
resolution, (c) low resolution edge map (gray pixels denote the area of the already
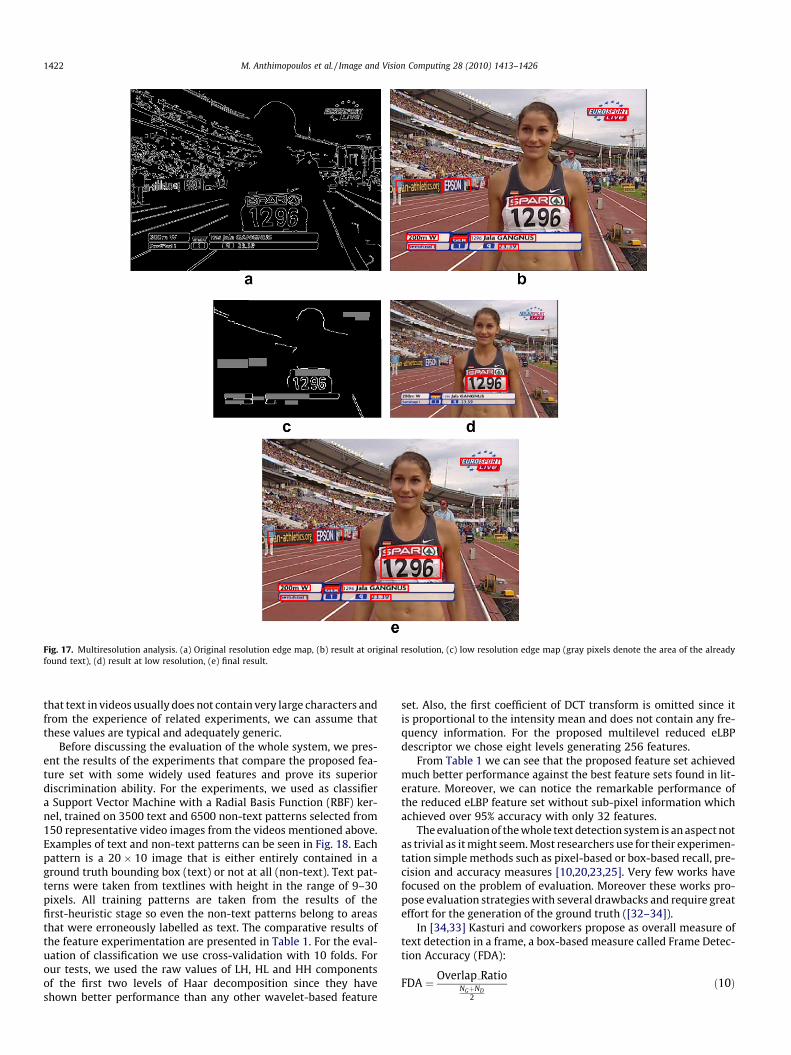
Fig. 17. Multiresolution analysis. (a) Original resolution edge map, (b) result at original resolution, (c) low resolution edge map (gray pixels denote the area of the alreadyfound text), (d) result at low resolution, (e) final result.
1422 M. Anthimopoulos et al. / Image and Vision Computing 28 (2010) 1413–1426
that text in videos usually does not contain very large characters andfrom the experience of related experiments, we can assume thatthese values are typical and adequately generic.
Before discussing the evaluation of the whole system, we pres-ent the results of the experiments that compare the proposed fea-ture set with some widely used features and prove its superiordiscrimination ability. For the experiments, we used as classifiera Support Vector Machine with a Radial Basis Function (RBF) ker-nel, trained on 3500 text and 6500 non-text patterns selected from150 representative video images from the videos mentioned above.Examples of text and non-text patterns can be seen in Fig. 18. Eachpattern is a 20 � 10 image that is either entirely contained in aground truth bounding box (text) or not at all (non-text). Text pat-terns were taken from textlines with height in the range of 9–30pixels. All training patterns are taken from the results of thefirst-heuristic stage so even the non-text patterns belong to areasthat were erroneously labelled as text. The comparative results ofthe feature experimentation are presented in Table 1. For the eval-uation of classification we use cross-validation with 10 folds. Forour tests, we used the raw values of LH, HL and HH componentsof the first two levels of Haar decomposition since they haveshown better performance than any other wavelet-based feature
set. Also, the first coefficient of DCT transform is omitted since itis proportional to the intensity mean and does not contain any fre-quency information. For the proposed multilevel reduced eLBPdescriptor we chose eight levels generating 256 features.
From Table 1 we can see that the proposed feature set achievedmuch better performance against the best feature sets found in lit-erature. Moreover, we can notice the remarkable performance ofthe reduced eLBP feature set without sub-pixel information whichachieved over 95% accuracy with only 32 features.
The evaluation of the whole text detection system is an aspect notas trivial as it might seem. Most researchers use for their experimen-tation simple methods such as pixel-based or box-based recall, pre-cision and accuracy measures [10,20,23,25]. Very few works havefocused on the problem of evaluation. Moreover these works pro-pose evaluation strategies with several drawbacks and require greateffort for the generation of the ground truth ([32–34]).
In [34,33] Kasturi and coworkers propose as overall measure oftext detection in a frame, a box-based measure called Frame Detec-tion Accuracy (FDA):
FDA ¼ Overlap RatioNGþND
2
ð10Þ

Fig. 18. (a) Text samples, (b) non-text samples.
Table 1Results of text/non-text classification using different feature sets.
Features Featuredimension
Classificationaccuracy
Textrecall
Textprecision
Text F-measure
LBP 256 93 89.5 89.6 89.6CGV 200 93.1 89.8 90.2 90Grayscale raw
values200 93.6 91 90 90.5
Grayscalegradient
400 94.1 90.3 91.9 91.1
Color gradient 400 94.8 94.3 90.6 92.4Reduced eLBP
(e = 20)32 95.1 91.3 93.9 92.6
Haar 180 95.3 92.9 93.2 93.2eLBP (e = 20) 256 96.7 94.8 95.2 95DCT 199 96.7 95.3 95.2 95.3Multilevel
reducedeLBP (L = 8)
256 98 97 97 97
M. Anthimopoulos et al. / Image and Vision Computing 28 (2010) 1413–1426 1423
where NG are the ground truth objects, ND the detected objectsand
Overlap Ratio ¼XNmapped
i¼1
jGi \ DijjGi [ Dij
ð11Þ
here Nmapped is the number of mapped object pairs, where the cor-respondence is established between objects, which have the bestspatial overlap. Like many other previous approaches, the authorsalso propose a thresholding of the overlap ratio in order to forgiveminor inconsistencies between the boundaries of the system’s out-put and the ground truth boxes. Thus, the thresholded overlap ratiois defined by:
Thresholded Overlap Ratio ¼XNmapped
i¼1
FDA TðiÞjGi [ Dij
ð12Þ
where
FDA TðiÞ ¼
jGi [ Dij; if jGi\Di jjGi[Di j
P th
jGi \ Dij; if jGi\Di jjGi[Di j
< th; and non binary thresholding
0; if jGi\Di jjGi[Di j
< th; and binary thresholding
8>>><>>>:
ð13Þ
The evaluation methods of this kind are based on the mappingbetween ground truth and detected objects. Especially for the textdetection problem, text lines are considered to be the objectswhere a text line is usually defined as an aligned series of charac-ters with a small intermediate distance relative to their height.However, this subjectively small distance can result arbitrarily inbounding box splits or merges among annotators and detectorsmaking the object mapping inappropriate. In addition, the numberof correctly retrieved boxes is not generally a measure of the re-trieved textual information since the number of characters in dif-ferent boxes may vary considerably. Driven by the problem ofthe text object inexplicit definition, instead of using one-to-onemapping, we based our evaluation method on the overall overlapbetween the resulted and the ground truth areas.
Wolf and Jilion [35] used the main idea of Liang et al. [36] whichwas oriented to document page segmentation evaluation and ad-justed it to video text detection evaluation. Liang et al. proposedthe creation of match score matrices with the overlap betweenevery possible pair of blocks in order to evaluate document struc-ture extraction algorithms. The benefit of this kind of algorithms istheir ability to consider the possible splits or merges of the bound-ing boxes besides one-to-one matching. However, in order tomatch two ground truth boxes with one resulting box, the totaloverlap threshold (as described in Wolf et al. paper) has to be verylow (�40%). This will have as a result accepting as correct, a boxwith size even higher than the double size of the ground truthbox. Wolf et al. also mentioned the low threshold problem dueto the growth of a rectangle area to the square of its side lengths.The same problem is not so intense in the document page segmen-tation field, since for classic documents the text areas are muchbigger compared to the interval created by splits and merges.Moreover Yanikoglu et al. [37] proposed the use of only the text(black) pixels for the computation of overlaps overcoming thelow threshold problem for printed documents. However, this ap-proach could not be applied to video text detection since a binari-zation result is lacking and text pixels cannot be distinguishedfrom background pixels.
Many researchers have used the overall overlap to compute pix-el-based recall and precision measures [12,20,23].
Recallpixel ¼jG \ DjjGj ð14Þ
Precisionpixel ¼jG \ DjjDj ð15Þ
where G is the ground truth area and D the detected area.However the main drawback here similarly to the box-based
approaches is the fact that the number of retrieved pixels doesnot correspond to proportional textual information since differenttextlines may contain characters of various sizes.
Ideally a text detection method as a part of a text extraction sys-tem should not be evaluated on the size of detected areas nor thenumber of detected boxes but on the number of the detected char-acters. Unfortunately, the number of characters in a bounding boxcannot be defined by the algorithm but it can be approximated bythe ratio width/height of the box, if we assume that this ratio isinvariable for every character, the spaces between different wordsin a text line are proportional to its height and each textline con-tains characters of the same size.

Table 2Evaluation values for images of Fig. 19 without thresholding.
(%) Recallecn Precisionecn Fecn Recallpixel Precisionpixel Fpixel FDA
Fig. 19a 70 79.5 74.4 32.5 80.3 46.3 54.7Fig. 19b 81.9 100 90 81.9 100 90 36.3Fig. 19c 7.3 100 13.6 10.6 100 19.2 50Fig. 19d 85.7 44 58.1 85.7 44 58.1 29
Table 3Evaluation values of Wolf and Jolion [35] for images of Fig. 19 (with defaultparameters).
(%) Recallecn Precisionecn F-measure
Fig. 19a 33.3 50 40Fig. 19b 80 100 88.89Fig. 19c 33.3 100 50Fig. 19d 100 100 100
1424 M. Anthimopoulos et al. / Image and Vision Computing 28 (2010) 1413–1426
Let wi, hi, ri be the width, the height, and the ratio width toheight respectively, with i = c, s, t denoting characters, spaces andtextlines. Obviously we can assume that hc = hs = ht. A textline con-taining nc characters will have a width wt = ncwc + nsws, where ns isthe number of spaces. The number of spaces between nc charactersis ns = nc�1. Assuming that there are also spaces at the ends of thetext line, approximately equal to ws/2, the number of spaces be-comes equal to the number of characters: ns = nc.
Thus, wt ¼ ncwc þ ncws ¼ ncðwc þwsÞ ¼ ncðhcrc þ hsrsÞ ¼ ncht
ðrc þ rsÞ ) nc ¼ rtðrcþrsÞ where rc and rs are constants. In other
words, the number of characters in a text line is proportional tothe ratio rt.
Based on that, we define that the contribution of every box tothe overall evaluation will be rt ¼ wt=ht and therefore the contri-bution of every pixel that belongs to the box will be wt ht
wt�ht¼ 1
h2t. In
that way, the evaluation will be based on the recall and precisionof the area coverage, normalized by the approximation of the num-
Fig. 19. Examples of text detection (yellow =
ber of characters for every box (see Eqs. (16) and (17)). The overallmetric will be the weighted harmonic mean of precision and recallalso referred as the F-measure (18). The normalization of a groundtruth bounding box obviously estimates the actual number of char-acters contained in the box, while the same technique for the de-tected boxes estimates the number of characters of therecognition system’s output, since before recognition text imagesare normalized according to their height.
Recallecn ¼
PNi¼1
GDIij jhg2
iPNi¼1
GBij jhg2
i
ð16Þ
Precisionecn ¼
PMi¼1
DGIij jhd2
iPMi¼1
DBij jhd2
i
ð17Þ
Fecn ¼2 � Precisionecn � Recallecn
Precisionecn þ Recallecnð18Þ
where GBi is the ground truth bounding box number i and hgi is itsheight, while DBi is the detected bounding box number i and hdi isits height. N is the number of ground truth bounding boxes and M isthe number of detected bounding boxes and GDI, DGI are the corre-sponding intersections:
GDIi ¼ GBi \[Mi¼1
DBi
!ð19Þ
ground truth, green = supposed output).

Table 4Evaluation values for images of Fig. 19 with non-binary thresholding (th = 80%).
(%) Recallecn Precisionecn Fecn Recallpixel Precisionpixel Fpixel FDA
Fig. 19a 70 88.4 78.1 32.5 91.7 48 61.7Fig. 19b 100 100 100 100 100 100 36.3Fig. 19c 7.3 100 13.6 10.6 100 19.2 50Fig. 19d 100 44 61.1 100 44 61.1 29
Table 5Performance of different text detection algorithms without thresholding.
Frames # Textboxes #
Method Recall(%)
Precision(%)
F-measure(%)
Set1 214 2963 Proposed withoutrefinement
93.5 48.9 64.2
[18] 66.9 66.7 66.8[23] 65.4 75.6 70.1[21] 81.1 70.5 75.4Proposed withrefinement
83.9 79 81.4
Set2 172 672 [18] 63.3 69.2 66.1[23] 68.2 71.1 69.6Proposed without 93.3 61.6 74.2
M. Anthimopoulos et al. / Image and Vision Computing 28 (2010) 1413–1426 1425
DGIi ¼ DBi \[Ni¼1
GBi
!ð20Þ
In order to avoid penalizing minor inconsistencies by non-bin-ary thresholding similarly to (13), the definitions (19) and (20)become:
GDIi ¼GBi; if
GBi\SMi¼1
DBi
� �GBi
P th
GBi \SMi¼1
DBi
� �; if
GBi\SMi¼1
DBi
� �GBi
< th
8>>>>>><>>>>>>:
ð21Þ
refinement[21] 80.6 71.5 75.8Proposed withrefinement
82.7 83.5 83
Table 6Performance of different text detection algorithms with thresholding (th = 80%).
Frames # Textboxes #
Method Recall(%)
Precision(%)
F-measure(%)
Proposedwithoutrefinement
94 49.9 65.2
Set1 214 2963 [18] 68.3 68.6 68.4[23] 68.9 80.5 74.2[21] 85.5 73.3 78.9Proposed withrefinement
86.8 84.5 85.6
Set2 172 672 [18] 65 69.8 67.3[23] 69.5 72.8 71.1Proposed withoutrefinement
95.4 65.5 77.7
[21] 84.2 74 78.8Proposed withrefinement
87 88.2 87.7
DGIi ¼DBi; if
DBi\SNi¼1
GBi
� �DBi
P th
DBi \SNi¼1
GBi
� �; if
DBi\SNi¼1
GBi
� �DBi
< th
8>>>>>><>>>>>>:
ð22Þ
In Tables 2 and 3 we can see the results of the different evalu-ation measures presented above for the four examples of Fig. 19.Looking at the images and the corresponding values we can noticethat the proposed estimated character-based measures were themost representative. In Fig. 19a the true character recall was 21/30 = 70% (with the spaces between words counted) exactly equalto the proposed recall while the pixel-based recall was 32.5% andWolf’s recall was 33.3%. Fig. 19b presents an obviously good detec-tion result, however FDA was only 36.3% due to compulsory one toone matching. On the other hand, although in Fig. 19c the resultwas quite poor, FDA and Wolf’s F-measure scored 50% deceivedby the box-based strategy. Moreover, the evaluation method ofWolf will score 100% for the unsatisfactory result of Fig. 19d dueto the low threshold values enforced by the multi-to-multi match-ing policy. Table 4 presents the corresponding results to Table 2with non-binary thresholding and th = 80. Using thresholding wecan see that the system forgive the non perfect detection of thethird text line in Fig. 19a, increasing the precision. FDA is also in-creased. However, for the Fig. 19b although the pixel based andthe proposed evaluation strategy give 100%, FDA still fails due toone to one mapping.
Table 5 provides the results of the whole text detection systembefore and after the use of the machine learning refinement stage,as well as the performances of three state-of-the-art methods pre-sented in Section 1. The refinement stage of the proposed method-ology increases the precision rate and combined with the highrecall of the initial result makes the overall system performanceto improve from 64.2% and 74.2% to 81.47% and 83%, for the firstand the second set respectively. Table 6 presents the correspondingresults using non-binary thresholding (see Eqs. (21) and (22)).From Table 6 we can see that the results after the refinement stagehave improved much more, compared to Table 5, than the coarseresults. This means that the refined bounding boxes tend to resem-ble to the ground truth bounding boxes. The better performance ofthe system for Set2 was expected because of the smoother back-ground in these kinds of videos. Table 7 shows the average process-
ing time of the proposed, and the state-of-the art algorithms forimages with resolution 768 � 576. The experiments were con-ducted on an Intel single core CPU at 3.2 GHz. Regarding computa-tional complexity, the most time consuming part of text detectionmethods are the prediction calls to the classifier for the machinelearning stage. Although SVM proved to be the most time consum-ing classifier, it is chosen because of its superior performance.
4. Conclusion
In this paper we presented a two-stage system for text detec-tion in video images. The system consists of a very efficient,edge-based, first stage with high recall and a second machinelearning refinement stage which improves performance by reduc-ing the false alarms. The main contributions of this work are thehighly discriminating feature set based on a new texture operator,and the incorporation of the refinement stage which is based on a

Table 7Average processing time per frame of the different text detection algorithms.
Method Average processing time per frame (s)
Proposed without refinement 0.33[18] 8[23] 3.35[21] 1.5Proposed with refinement 2
1426 M. Anthimopoulos et al. / Image and Vision Computing 28 (2010) 1413–1426
sliding window, an SVM classifier and a saliency map. The system’sperformance evaluation is based on the intersection of the groundtruth and the resulted bounding boxes, normalized by the esti-mated number of contained characters. Experimental resultsshowed great robustness on the detection of horizontal textlinesin very complex backgrounds even for scene text. The method doesnot take into consideration any temporal information in order toseparate the text detection from a text tracking stage that maybe used to track text lines between periodical spatial detections.
Acknowledgement
Part of this research was carried out within the framework ofthe co-funded by the EU project CASAM (FP7-ICT-217061).
References
[1] R. Lienhart, Video OCR: A Survey and Practitioner’s Guide, Video Mining,Kluwer Academic Publisher, 2003, pp. 155–184
[2] K. Jung, K.I. Kim, A.K. Jain, Text information extraction in images and video: asurvey, Pattern Recognition 37 (5) (2004) 977–997.
[3] J. Liang, D. Doermann, H. Li, Camera-based analysis of text and documents: asurvey, International Journal on Document Analysis and Recognition 7 (2–3)(2005) 84–104.
[4] D. Doermann, J. Liang, H. Li, Progress in camera based document imageanalysis, in: International Conference on Document Analysis and Recognition,2003, pp. 606–617.
[5] R. Lienhart, W. Effelsberg, Automatic text segmentation and text recognitionfor video indexing, ACM/Springer Multimedia Systems 8 (2000) 69–81.
[6] K. Sobottka, H. Bunke, H. Kronenberg, Identification of text on colored book andjournal covers, in: International Conference on Document Analysis andRecognition, 1999, pp. 57–63.
[7] T. Sato, T. Kanade, E. Hughes, M. Smith, Video OCR for digital news archives,IEEE Workshop on Content-Based Access of Image and Video Databases (1998)52–60.
[8] J. Xi, X.-S. Hua, X.-R. Chen, L. Wenyin, H. Zhang, A video text detection andrecognition system, multimedia and expo, IEEE International Conference(2001) 873–876.
[9] M. Cai, J. Song, M.R. Lyu, A new approach for video text detection, IEEEInternational Conference on Image Processing (2002) 117–120.
[10] M.R. Lyu, J. Song, M. Cai, A comprehensive method for multilingual video textdetection, localization, and extraction, IEEE Transactions. Circuit and Systemsfor Video Technology 15 (2) (2005) 243–255.
[11] M. Anthimopoulos, B. Gatos, I. Pratikakis, Multiresolution text detection invideo frames, in: International Conference on Computer Vision Theory andApplications, 2007, pp. 161–166.
[12] W. Kim, C. Kim, A new approach for overlay text detection and extraction fromcomplex video scene, Image Processing, IEEE Transactions 18 (2) (2009) 401–411.
[13] Y. Zhong, H. Zhang, A.K. Jain, Automatic caption localization in compressedvideo, IEEE Transactions on Pattern Analysis and Machine Intelligence 22 (4)(2000) 385–392.
[14] D. Crandall, S. Antani, R. Kasturi, Extraction of special effects caption textevents from digital video, International Journal on Document Analysis andRecognition 5 (2–3) (2003) 138–157.
[15] Y.K. Lim, S.H. Choi, S.W. Lee, Text extraction in MPEG compressed video forcontent-based indexing, International Conference on Pattern Recognition(2000) 409–412.
[16] U. Gargi, D.J. Crandall, S. Antani, T. Gandhi, R. Keener, R. Kasturi, A system forautomatic text detection in video, International Conference on DocumentAnalysis and Recognition (1999) 29–32.
[17] K. Jung, Neural network-based text location in color images, PatternRecognition Letters 22 (14) (2001) 1503–1515.
[18] K.I. Kim, K. Jung, S.H. Park, H.J. Kim, Support vector machine-based textdetection in digital video, Pattern Recognition 34 (2) (2001) 527–529.
[19] C. Wolf, J.-M. Jolion, Model Based Text Detection in Images and Videos: ALearning Approach, Technical Report LIRIS-RR-2004-13 Laboratoired’Informatique en Images et Systemes d’Information, INSA de Lyon, France,2004.
[20] R. Lienhart, A. Wernicke, Localizing and segmenting text in images and videos,IEEE Transactions on Circuits and Systems for Video Technology 12 (4) (2002)256–268.
[21] H. Li, D. Doermann, O. Kia, Automatic text detection and tracking in digitalvideo, IEEE Transactions on Image Processing 9 (1) (2000) 147–156.
[22] H. Zhang, W. Gao, X. Chen, D. Zhao, Learning informative features for spatialhistogram-based object detection, International Joint Conference on NeuralNetworks 3 (2005) 1806–1811.
[23] D. Chen, J.-M. Odobez, J.-P. Thiran, A localization/verification scheme forfinding text in images and videos based on contrast independent features andmachine learning methods, Image Communication 19 (3) (2004) 205–217.
[24] Q. Ye, Q. Huang, W. Gao, D. Zhao, Fast and robust text detection in images andvideo frames, Image Vision Computing 23 (6) (2005) 565–576.
[25] C. Jung, Q. Liu, J. Kim, A stroke filter and its application to text localization,Pattern Recognition Letters 30 (2) (2009) 114–122.
[26] R. Gonzalez, R. Woods, Digital Image Processing Addison Wesley (1992).[27] J. Canny, A computational approach to edge detection, IEEE Transactions,
Pattern Analysis and Machine Intelligence 8 (1986) 679–698.[28] V. Vapnik, The Nature of Statistical Learning Theory, Springer, 1995.[29] M. Anthimopoulos, B. Gatos, I. Pratikakis, A hybrid system for text detection in
video frames, in: International Workshop on Document Analysis Systems,2008, pp. 286–292.
[30] T. Ojala, M. Pietikainen, D. Harwood, A comparative study of texture measureswith classification based on feature distributions, Pattern Recognition 29 (1)(1996) 51–59.
[31] M. Antonini, M. Barlaud, P. Mathieu, I. Daubechies, Image coding using wavelettransform, IEEE Transactions, Image Processing (1992) 205–220.
[32] X.-S. Hua, L. Wenyin, H.-J. Zhang, An automatic performance evaluationprotocol for video text detection algorithms, IEEE Transactions on Circuits andSystems for Video Technology 14 (4) (2004) 498–507.
[33] M. Vasant, P. Soundararajan, M. Boonstra, H. Raju, D. Goldgof, R. Kasturi, J.Garofolo, Performance evaluation of text detection and tracking in video.International Workshop on Document Analysis Systems, pp. 576–587.
[34] R. Kasturi, D. Goldgof, P. Soundararajan, V. Manohar, J. Garofolo, R. Bowers, M.Boonstra, V. Korzhova, J. Zhang, Framework for performance evaluation of face,text, and vehicle detection and tracking in video: data, metrics, and protocol,IEEE Transactions on Pattern Analysis and Machine Intelligence 31 (2) (2008)319–336.
[35] C. Wolf, J. Jolion, Object count/area graphs for the evaluation of objectdetection and segmentation algorithms, International Journal on DocumentAnalysis and Recognition 8 (4) (2006) 280–296.
[36] J. Liang, I.T. Phillips, R.M. Haralick, Performance evaluation of document layoutanalysis algorithms on the UW Data Set, Document Recognition IV, SPIE (1997)149–160.
[37] B.A. Yanikoglu, L Vincent, Pink panther: a complete environment for ground-truthing and benchmarking document page segmentation, Pattern Recognition31 (9) (1998) 1191–1204.