a technical approach to saudi arabia crude oil supply
136
A TECHNICAL APPROACH TO SAUDI ARABIA CRUDE OIL SUPPLY FORECAST AND POTENTIAL SUBSTITUTES A THESIS SUBMITTED TO THE GRADUATE SCHOOL OF NATURAL AND APPLIED SCIENCES OF MIDDLE EAST TECHNICAL UNIVERSITY BY VOLKAN ASLANOĞLU IN PARTIAL FULFILLMENT OF THE REQUIREMENTS FOR THE DEGREE OF MASTER OF SCIENCE IN PETROLEUM AND NATURAL GAS ENGINEERING SEPTEMBER 2019
-
Upload
khangminh22 -
Category
Documents
-
view
1 -
download
0
Transcript of a technical approach to saudi arabia crude oil supply

A TECHNICAL APPROACH TO SAUDI ARABIA CRUDE OIL SUPPLY
FORECAST AND POTENTIAL SUBSTITUTES
A THESIS SUBMITTED TO
THE GRADUATE SCHOOL OF NATURAL AND APPLIED SCIENCES
OF
MIDDLE EAST TECHNICAL UNIVERSITY
BY
VOLKAN ASLANOĞLU
IN PARTIAL FULFILLMENT OF THE REQUIREMENTS
FOR
THE DEGREE OF MASTER OF SCIENCE
IN
PETROLEUM AND NATURAL GAS ENGINEERING
SEPTEMBER 2019


Approval of the thesis:
A TECHNICAL APPROACH TO SAUDI ARABIA CRUDE OIL SUPPLY
FORECAST AND POTENTIAL SUBSTITUTES
submitted by VOLKAN ASLANOĞLU in partial fulfillment of the requirements for
the degree of Master of Science in Petroleum and Natural Gas Engineering
Department, Middle East Technical University by,
Prof. Dr. Halil Kalıpçılar
Dean, Graduate School of Natural and Applied Sciences
Assoc. Prof. Dr. Çağlar Sınayuç
Head of Department, Petroleum and Natural Gas Eng.
Prof. Dr. Mustafa Verşan Kök
Supervisor, Petroleum and Natural Gas Eng., METU
Examining Committee Members:
Assoc. Prof. Dr. Çağlar Sınayuç
Petroleum & Natural Gas Engineering Dept., METU
Prof. Dr. Mustafa Verşan Kök
Petroleum and Natural Gas Eng., METU
Assoc. Prof. Dr. Emre Artun
Petroleum & Natural Gas Engineering Dept., METU-NCC
Date: 04.09.2019

iv
I hereby declare that all information in this document has been obtained and
presented in accordance with academic rules and ethical conduct. I also declare
that, as required by these rules and conduct, I have fully cited and referenced all
material and results that are not original to this work.
Name, Surname:
Signature:
Volkan Aslanoğlu

v
ABSTRACT
A TECHNICAL APPROACH TO SAUDI ARABIA CRUDE OIL SUPPLY
FORECAST AND POTENTIAL SUBSTITUTES
Aslanoğlu, Volkan
Master of Science, Petroleum and Natural Gas Engineering
Supervisor: Prof. Dr. Mustafa Verşan Kök
September 2019, 116 pages
In this master thesis, crude oil production forecast of Saudi Arabia and its potential
substitutes are investigated. Reservoir and production behavior of 12 giant fields and
the other fields’ production as a function of total production is estimated. Four
different scenarios are suggested for crude oil production forecast while five potential
substitutes can be classified as top substitutes.
The first part of the study shows that Saudi Arabia has produced more than 150 billion
bbl crude oil so far and has another 208.7 billion bbl recoverable reserves to be
produced. However, crude oil production would decrease to 6 MMbpd as 2044 since
the mature oil fields as Ghawar and Abqaiq are close to depletion and some subfields
as Ain Dar/Shedgum and Uthmaniyah is expected to deplete in 20 years. On the other
hand, investments in oil exploration to discovery of new fields and development of
the existing fields could provide consistent production above 15 MMbpd until 2040
with an expenditure around $96.35 billion.
In the second part, it is concluded that although Saudi Arabia has always been the
major crude oil exporter, Iraq could be a perfect substitute if regional peace is
constituted. Even so, the country is the second option considering the major export
destinations of the Kingdom. The neighbor, UAE, is the third option for the crude
vi
importers after Saudi Arabia and Iraq. Moreover, Iran has still the opportunity to
redeem its share in crude oil market to be a potential substitute if sanctions are lifted.
The other potential substitute Russia needs new trade routes as Kanal Istanbul and
Arctic Route or expanding pipeline capacity to canalize Asia markets. Other crude oil
producers need more severe actions.
Keywords: Saudi Arabia, crude oil, production forecast, Middle East, energy politics

vii
ÖZ
TEKNİK METODLAR İLE SUUDİ ARABİSTAN PETROL ARZI TAHMINI
VE SUUD PETROLÜNÜN ALTERNATİFLERİ
Aslanoğlu, Volkan
Yüksek Lisans, Petrol ve Doğal Gaz Mühendisliği
Tez Danışmanı: Prof. Dr. Mustafa Verşan Kök
Eylül 2019, 116 sayfa
Bu yüksek lisans tezinde, Suudi Arabistan’ın ham petrol üretim tahmini ve potansiyel
ikameleri incelendi. 12 dev petrol sahasının rezervuar ve üretim davranışları çıkartıldı
ve diğer sahalar bu sahaların fonksiyonu olarak analiz edildi. Toplamda dört ana ham
petrol üretim senaryosu üzerinden analiz yapılıp, beş ana ikame oluşturuldu.
İlk kısma göre, Suudi Arabistan şu zamana kadar 150 milyar varil petrol üretmiş olup,
halen 208,7 milyar varil üretilebilir ham petrol rezervine sahip. Fakat, ham petrol
üretimi Ghawar ve Abqaiq gibi olgun sahaların tükenmeye yakın olması sebebiyle
üretimin 2044 senesine kadar 6 milyon varil gün miktarına kadar düşmesi bekleniyor.
Ek olarak, Ghawar’ın bölümlerinden Ain Dar/Shedgum ve Uthmaniyah sahalarının da
20 sene içerisinde tükenmesi bekleniyor. Öte yandan, petrol rezervleri araması ve saha
geliştirme metotlarına gerekli yatırım yapılırsa üretimin 2023 ile 2040 senesi arasında
15 milyon varil günden daha fazla olması bekleniyor. Toplam yatırım miktarı ise
yaklaşık olarak 96,35 milyar dolar.
İkinci kısımda, Suudi Arabistan’ın dünyanın en büyük petrol ihracatçısı olmasına
rağmen, Irak’ın bölgesel huzur sağlandığı takdirde mükemmele yakın bir alternatif
olacağı ortaya çıktı. Bölgesel huzurun olmadığı senaryoda bile, Suud Petrolünü ithal
eden ülkeler için en güçlü ikinci seçenek. Komşuları, Birleşik Arap Emirlikleri ise
Suudi Arabistan ve Irak’ın ardından en güçlü üçüncü opsiyon. Ek olarak, İran da

viii
yaptırımları kalkması ve ihracının eski haline dönmesi durumunda oldukça güçlü bir
ikame olacak. Son olarak, Rusya’nın ise Kanal İstanbul ve Arktik Ticaret Hattı veya
petrol taşıma kapasitesinin artırılması gibi alternatiflerle Asya marketindeki payını
artırması lazım. Diğer üreticiler için ise henüz çok yol var.
Anahtar Kelimeler: Suudi Arabistan, ham petrol, üretim tahmini, Orta Doğu, enerji
politikaları

ix
To my family

x
ACKNOWLEDGEMENTS
I would like to express my gratitude to my supervisor Prof. Dr. Mustafa Versan Kök
for his guidance and his patience with me while writing this thesis. It is great that I
had this opportunity to study under his supervision. The relationship between me and
him throughout this study forced me to work harder and harder every day to develop
a quality work for his standards.
Furthermore, I would like to thank Serkan Sahin. He was the main reason I have
decided to work on this thesis. He is a great oil analyst and a role-model. He helped
me when I got lost what to study and encouraged me to follow my dreams. His
recommendations are so valuable that it is not enough whatever I tell. I consider
myself very lucky for his guidance and technical assistance.
Also, Professor Hakan Berument encouraged me a lot. His support is priceless. I
would like to thank my dearest friends from the oil and gas sector, Ismet Emre Can
Kapusuz and Cihat Köşger also the economist Sercan Seker. I believe you will all
achieve something worthy. My ambitious friends who always helped me to proceed
and believe in me, Ozan Sengul, Sercan Gül and Berkay Daçe.
Finally, my deepest thanks belong to my family who always believed in me. Especially
my sister Ezgi Aslanoğlu, mother Kadriye Aslanoğlu and father Ahmet Oğuz
Aslanoğlu. They always stand whenever I needed.
I am sure it will not be enough to say that I am thankful to everyone who helped me
throughout all these years to develop this thesis. I am hoping that this thesis will be
the first step of something great.

xi
TABLE OF CONTENTS
ABSTRACT ................................................................................................................. v
ÖZ ........................................................................................................................... vii
ACKNOWLEDGEMENTS ......................................................................................... x
TABLE OF CONTENTS ........................................................................................... xi
LIST OF TABLES ................................................................................................... xiii
LIST OF FIGURES.................................................................................................. xvi
LIST OF ABBREVIATIONS ................................................................................. xvii
LIST OF SYMBOLS ............................................................................................... xix
CHAPTERS
1. INTRODUCTION ................................................................................................ 1
2. LITERATURE SURVEY ..................................................................................... 3
3. CRUDE OIL MARKET ....................................................................................... 7
3.1 Crude Oil ............................................................................................................ 9
3.2 Organizations .................................................................................................... 17
3.2.1 The Organisation for Economic Co-operation and Development ............. 17
3.2.2 The Organization of Petroleum Exporting Countries ................................ 18
3.2.3 The Cooperation Council for the Arab States of the Gulf ......................... 18
4. SAUDI ARABIA ................................................................................................ 19
4.1 Saudi Aramco ................................................................................................... 22
4.2 Oil Fields .......................................................................................................... 25
4.3 Export Destination ............................................................................................ 35
5. STATEMENT OF THE PROBLEM .................................................................. 37

xii
6. METHODOLOGY ............................................................................................. 39
6.1 Reservoir Evaluation ........................................................................................ 39
6.2 Substitutes ........................................................................................................ 42
7. RESULTS AND DISCUSSIONS ...................................................................... 45
7.1 Saudi Arabia Crude Oil Production Forecast and Cases.................................. 45
7.1.1 Saudi Arabia Crude Oil Production Forecast ............................................ 45
7.1.2 Scenarios ................................................................................................... 52
7.2 Potential Substitutes and Scenarios.................................................................. 55
8. CONCLUSIONS ................................................................................................ 61
REFERENCES .......................................................................................................... 63
APPENDICES ........................................................................................................... 67
A.WORLD FACTS ............................................................................................ 67
B.SAUDI ARABIA CRUDE OIL PRODUCTION HISTORY ........................ 71
C.SAUDI ARABIA CRUDE OIL PRODUCTION FORECAST ..................... 96
D.SUBSTITUTES ............................................................................................ 115

xiii
LIST OF TABLES
TABLES
Table 3.1. Proven Crude Oil Reserves, end of 2017 (OPEC, 2019c) ........................ 11
Table 3.2. Crude Oil Production, May 2019 (JODI, 2019; OPEC, 2019a) ............... 13
Table 3.3. Crude Oil Classification (Speight, 2011) .................................................. 14
Table 3.4. Major Traded Crude Oil Types (Energy Intelligence Group, 2007; OPEC,
2019a) ......................................................................................................................... 15
Table 4.1. Saudi Arabia Major Oil Fields .................................................................. 26
Table 4.2. Field Reservoir Characteristics of Ghawar Sub-Fields (Mearns, 2007) ... 28
Table 4.3. Crude Oil Production (1960-2018) ........................................................... 29
Table 4.4. Top Ten Saudi Arabia Crude Oil Export Destination (Target markets) ... 35
Table 6.1. Past Production Sheet Illustration ............................................................. 40
Table 6.2. The Behavior of OPEC Giant Fields Explored After 2000 (Höök, 2008) 41
Table 7.1. Sub-Fields of Ghawar ............................................................................... 48
Table 7.2. URR Estimation by Cumulative Production Data, 1.1.2004 .................... 50
Table 7.3. Production Properties of 12 Major Oil Fields, as of 1.1.2019 .................. 52
Table 7.4. Case II (Field Development Scenarios) .................................................... 54
Table 7.5. Cases Overview......................................................................................... 54
Table 7.6. Substitutes Elimination ............................................................................. 56
Table 7.7. Substitutes Ranking................................................................................... 58
Table 7.8. The Case that Iran’s Export is Doubled .................................................... 59
Table 7.9. The Case that Russia Influences More on Asian Markets ........................ 60
Table A.1. 1967-1975 Crude Oil Production, Mbpd…………………………...……67
Table A.2. 1976-1984 Crude Oil Production, Mbpd…………………………...……67
Table A.3. 1985-1992 Crude Oil Production, Mbpd……………………………...…67
Table A.4. 1993-2001 Crude Oil Production, Mbpd………………………………..68
Table A.5. 2002-2010 Crude Oil Production, Mbpd…………..……………………68
Table A.6. 2011-2018 Crude Oil Production, Mbpd……………...…………………69
Table B.1. Ghawar Water Cut……………………..……………………….………..71

xiv
Table B.2. Abqaiq Water Cut……………………..……………………..….……….71
Table B.3. Ghawar Production History..…………..……...…………………………72
Table B.4. Ain Dar/Shedgum Production History..…….……………………………74
Table B.5. Uthmaniyah Production History..………..………………………………77
Table B.6. Hawiyah Production History..…………..………………………...……..78
Table B.7. Haradh Production History..…………..…………………………..….….79
Table B.8. Abqaiq Production History..…………..……………………………...….80
Table B.9. Safaniya Production History..…………..………………………………..82
Table B.10. Abu Sa’fah Production History..…………..…………………..…….….84
Table B.11. Berri Production History..…………..………………………...…….….86
Table B.12. Khurais Production History..…………..……………………………….87
Table B.13. Khursaniyah Production History..…………..……………….…...…….88
Table B.14. Manifa Production History..…………..…………………….……...…..89
Table B.15. Marjan Production History..…………..……………….…….……...….90
Table B.16. Qatif Production History..…………..……………………………….....91
Table B.17. Shaybah Production History..…………..………………...………….…92
Table B.18. Zuluf Production History..…………..……………………..………...…93
Table B.19. Others Production History..…………..……………………...…………94
Table C.1. Ain Dar/Shedgum Production Forecast..…….………………..…….…...96
Table C.2. Uthmaniyah Production Forecast..…….………………………..….……97
Table C.3. Hawiyah Production Forecast..…….……………………………..….…..98
Table C.4. Haradh Production Forecast..…….……………………………………...99
Table C.5. Abqaiq Production Forecast..…….………………………….……..…..100
Table C.6. Safaniya Production Forecast..…….……………...…………........……101
Table C.7. Abu Sa’fah Production Forecast..…….……………………...…………102
Table C.8. Berri Production Forecast..…….……………………………………….103
Table C.9. Khurais Production Forecast..…….………………………...………….104
Table C.10. Khursaniyah Production Forecast..…….………………..….…………105
Table C.11. Manifa Production Forecast..…….………………………...………….106
Table C.12. Marjan Production Forecast..…….…………………………...……….107

xv
Table C.13. Qatif Production Forecast..…….……………………………...………108
Table C.14. Zuluf Production Forecast..…….…………………………………......109
Table C.15. Other Fields Production Forecast..…….……………………………...110
Table C.16. Production Model for Unexplored Giant Fields..……………...………111
Table C.17. Crude Oil Production Forecast, Fields (Ghawar to Khursaniyah)……..112
Table C.18. Crude Oil Production Forecast, Fields (Manifa to Total)….….……….113
Table C.19. Crude Oil Production Forecast, MMbpd………………………………114
Table D.1. Crude Oil Exporters and Top 5 Target Markets………………………..115
Table D.2. Crude Oil Exporters and Other Target Markets………………………..116

xvi
LIST OF FIGURES
FIGURES
Figure 3.1. Petroleum System Timeline (Al-Hajeri et al., 2010) ................................ 8
Figure 3.2. Hydrocarbon Value Hierarchy (Deborah, 2012) ....................................... 9
Figure 3.3. Proven Crude Oil Reserves by Region (OPEC, 2019c) .......................... 10
Figure 3.4. Global Conventional Oil Discoveries (Rystad Energy, 2017, 2018) ...... 11
Figure 3.5. ORB Prices Mar 2014- Feb 2019 (OPEC, 2019b) .................................. 12
Figure 3.6. Classification of Some Major Crude Oils ............................................... 16
Figure 4.1. Saudi Arabia Map (McMurray, 2011) ..................................................... 20
Figure 4.2. World Crude Oil Production, 1993-2017 (OPEC, 2019c) ...................... 21
Figure 4.3. Saudi Arabia Crude Oil Production Share, 1967-2017 (OPEC, 2019c) . 22
Figure 4.4. Dammam Well No.1 (Left), Well No.7 (Right) (McMurray, 2011) ....... 23
Figure 4.5. Oil Fields and Royal Family ................................................................... 27
Figure 4.6. Ghawar Crude Oil Production History (1950-2018) ............................... 30
Figure 4.7. Abqaiq Crude Oil Production History (1950-2018) ................................ 31
Figure 4.8. Safaniya Crude Oil Production History (1950-2018) ............................. 32
Figure 4.9. Berri Crude Oil Production History (1950-2018) ................................... 33
Figure 7.1. Ghawar Hubbert Linearization ................................................................ 46
Figure 7.2. Ghawar Water Cut vs. Cumulative Production ....................................... 46
Figure 7.3. Ain Dar/Shedgum Hubbert Linearization ............................................... 47
Figure 7.4. Uthmaniyah Hubbert Linearization ......................................................... 47
Figure 7.5. Abqaiq Hubbert Linearization ................................................................. 48
Figure 7.6. Abqaiq Water Cut vs. Cumulative Production ........................................ 49
Figure 7.7. Safaniya Hubbert Linearization .............................................................. 49
Figure 7.8. Berri Hubbert Linearization .................................................................... 50
Figure 7.9. Other Fields’ Production Ratio Over Total Production .......................... 51
Figure 7.10. Model for Undiscovered Fields ............................................................. 53
Figure 7.11. Production Forecast Scenarios for Different Cases ............................... 55

xvii
LIST OF ABBREVIATIONS
ABBREVIATIONS
ap Annual production
API American Petroleum Institute
Bbl Barrels
BMI Business Monitor International
Bpd Barrels per day
Cp Cumulative production
CSIS Center for Strategic and International Studies
d Annual decline
D Depletion rate
Dp Daily production
EIA Energy Information Administration
GCC Gulf Cooperation Council
GDP Gross Domestic Product
GW Giga-Watts
JODI Joint Organisation Data Initiative
IFP French Institute of Petroleum
IPO The initial public offering
Km Kilometers
MIT Massachusetts Institute of Technology
Mbpd Thousand barrels per day
MMbbl Million barrels
MMbpd Million barrels per day
OECD The Organisation for Economic Co-operation and Development
OEEC The Organisation for European Economic Cooperation
OOIP Original oil in place
OPEC Organization of the Petroleum Exporting Countries
ORB OPEC Reference Basket
xviii
RRI Risk/Reward Index
RRR Remaining recoverable reserves
SPE Society of Petroleum Engineers
SoCal Saudi Arabia and Standard Oil Company of California
UAE The United Arab Emirates
URR Ultimate recoverable reserves
US The United States
WTI West Texas Intermediate

xix
LIST OF SYMBOLS
SYMBOLS
C Carbon
F Fahrenheit
H Hydrogen

1
CHAPTER 1
1. INTRODUCTION
Increasing energy demand following the 19th century’s industrial revolution has been
a naked truth of human history. Higher energy demand had caused increasing energy
supply. Following that, this energy revolution had led to economic growth. The
world’s economy has enormously grown in the past few decades. Extraction volume
of fossil fuels was the driven parameter of this development. As most of the energy
consumed has been generated from fossil fuels in recent decades, humanity will
remain in need of fossil fuels in the following years. Oil can be defined as the black
blood that runs through the veins of the modern global energy system (Höök, 2008).
This fact makes crude oil the world’s most traded commodity globally. Crude oil had
been at the center of politics throughout the 20th century. Even the transformation
through renewable energy sources are currently growing, crude oil is still the major
energy source and is also expected to be so in the future (BP, 2019). On the other hand,
the future of the crude oil market is a controversial issue due to the uncertainty in
technical problems in oil fields also global politics and economics. For the foreseeable
future, the crude oil production forecast is necessary to analyze the oil market
accurately.
As of the end of 2017, there are only five countries which control more than 100 billion
barrels (bbl) of oil equivalent of conventional oil reserves. These are Venezuela (302.8
billion bbl), Saudi Arabia (266.3 billion bbl), Iran (155.6 billion bbl), Iraq (147.2
billion bbl) and Kuwait (101.5 billion bbl) and followed by the United Arab Emirates
(UAE) with 97.8 billion bbl of oil. While none of these countries ever produced more
than 5 million barrels per day (MMbpd) during the last three decades, Saudi Arabia is
consistently producing more than 7 MMbpd since 1991 (OPEC, 2019c). The kingdom

2
has always been market balancer to prevent shortages. For example, Saudi Arabia
increased its crude oil production from 5.4 MMbpd to 8.5 MMbpd in only 90 days
during the Gulf War.
Most forecast reports consider existing econometrics data; although that approach
neglects the scientific facts on reservoir conditions and upstream developments, this
study aims to provide a technical approach to world’s biggest crude oil exporter Saudi
Arabia’s crude oil assets and oil exports scenarios with the potential substitutes in the
market.
The objective of this thesis is to analyze the world’s most important crude oil producer
and exporter Saudi Arabia’s oil reserves and production behavior to enlighten the
future of the Saudi Aramco, after that to the world oil market. For this purpose, Saudi
Arabia’s existing crude oil reserves and production scenarios for the following years
evaluated, then the other major crude oil producers were compared for their
replacement possibility of Saudi Arabian crude oil to its export destinations. The thesis
starts with a brief introduction and literature survey, respectively as the first two
chapters. The crude oil market is briefly introduced in chapter three. Then, chapter
four gives details about the oil production of Saudi Arabia, its fields and export
destinations. In the fifth chapter, the problem and thesis motivation are stated. Chapter
six shows the methodology while analyzing the fields and substitutes. While chapter
seven shows the results and discussions according to these analysis methods, the last
part, chapter eight is the conclusions section.
While other countries can be more transparent about production and condition of the
fields, it was observed that, due to the secrecy of Saudi Arabia oil fields, there was
rarely transparent production or reservoir information about the oil fields of the
kingdom. The primary struggle before analyzing the field was to gather actual
production and reservoir data. However, as solving a puzzle, putting pieces together,
production and reservoir data of fields could be gathered.
3
CHAPTER 2
2. LITERATURE SURVEY
The literature survey for this thesis was conducted on four main categories. These are;
1. Data gatherings by using the studies examining Saudi Arabia’s fields as a
whole,
2. Better investigation of the fields by using evaluation reports of each field,
3. Reservoir and production evaluation methods to use in this study,
4. Saudi Arabia’s export destinations and competitors.
Center for Strategic and International Studies (CSIS) report was presented by Baqi
and Saleri (2004) which the presentation shares the most transparent data ever for
Saudi Arabia oil fields. This study emphasizes the principles of Saudi Aramco and
focuses on the role of the company in the crude oil market. The publication mentions
the share of the kingdom on global oil reserves, number of fields, seismic crew, rig
and locations of the exploration wells in Saudi Arabia with official numbers. Also, the
possible addition of unexplored wells and the growth of oil in initially in place trend
is shown. The significant contribution of this report is the total depletion and annual
depletion rates for major fields. The study is especially helpful for the forecast of
mature fields. The king of oil fields, Ghawar Field, is investigated in subparts. Also,
it is suggested that Saudi Aramco is a cost-effective oil supplier and predicted for
sustained production levels of 10 MMbpd, 12 MMbpd or even to 15 MMbpd, well
beyond 2054 which I think it is not that easy upon my study unless fields are not
developed.
Literature survey and analysis of field behavior from the past production data were
used to analyze Saudi Arabia oil fields with detail. Simmons (2005) defines Saudi

4
Arabia’s oil reserves as a miracle and an economical gift to the world. He analyzes the
Society of Petroleum Engineers (SPE) papers written by technical experts. Also, adds
that easy oil era is over. He mentions that Saudi Arabia’s great oilfields are mature
and some of the fields are coming to end of their economic life, but oilfield technology
provides a chance to increase in total producible reserves. The study is deep in
information for each oil field which is helpful while gathering data.
Powers (2012) conducted another evaluation of the oil industry. He focuses on big
players of the oil industry as the United States (US), Venezuela and the star of the
crude oil market, Saudi Arabia. The study covers the reservoir assessment of the Saudi
Arabian oil fields together with nearly 100 reservoir engineers. He mentions the goals
of Saudi Aramco then emphasizes on each major field. Reservoir properties such as
Original Oil in Place (OOIP) and recovery factors are estimated by using relatively
reliable methods.
Also, the country reports by the international constitutions as Energy Information
Administration (EIA, 2017) and Fitch Solutions (2018) considers econometric tools
rather than the engineering forecast methods. Other studies conducted by Jud (2016)
and Hart (2008) are detailed researches but results and methodology not reliable.
Therefore, such analysis and forecasts are not taken into consideration.
Two volumetric simulations (2D) of the initial and remaining reserves in Ghawar was
determined by Mearns (2007). Two different scenarios for each section of Ghawar is
estimated. The technical approach of the author provides realistic results for the field.
Staniford (2007) studies Ghawar Field by analyzing the oil saturation of each section.
Then the reservoir was modeled in the study which was led to realistic results by using
engineering techniques.
Other researchers as Al-Somali et al. (2009), Aleklett et al. (2010), Ali et al. (1981),
Sadiq and Zaidi (1985), Saleri et al. (2006) and Xia et al. (2014) gave some minor past
production or information about the investigated fields. They are highly considered in
the production forecast.

5
Arps (1945) first suggested the idea of production decline curve analysis. The study
shows that every oil fields production peaks and starts to decline exponentially,
harmonically or with another trend.
Campbell (2013) summarizes the oil production forecast of a field with basic steps.
The most vital is to reach past production through reliable sources. The sources are
mentioned in the first part of the literature survey. The past production analysis covers
cumulative production, the amount left to produce, percentage depleted and the
depletion rate. Second is to use of Hubbert Linearization (Maggio & Cacciola, 2009)
to understand future behavior. After that, the ultimate recoverable reserves (URR) of
the field is calculated. Also, the undiscovered fields and consumption in the country
are estimated. Campbell suggests the most proper guideline for the crude oil
production forecasts.
Höök (2008) studied more than 300 giant oil fields to determine their typical
production behavior. Production parameters, such as decline, depletion rate and
timeline of first oil, build up, peak and decline are stated in the research. This study
enlightens the research for future production of undiscovered oil fields of Saudi
Arabia.
Energy Intelligence (2007) mentions the major traded crude oil types and their key
characteristics which helps to the first categorization of other produced major crude
oils.
Joint Organisation Data Initiative (JODI, 2019) provides monthly crude oil production
data to categorize the substitutes. Also, export, import and direct use of crude oil data
are provided by JODI. The Observatory of Economic Complexity of Massachusetts
Institute of Technology (MIT, 2019) is one of the most helpful resources for export
destinations. The resource provides reliable data about crude oil trade market. All the
possible substitutes’ crude oil export destinations and Saudi Arabia’s target markets’
import points are taken from this source. Also, the crude oil export of Iran is updated
as the latest quarter of 2018, by Tanker trackers (2018).

6
Fitch Solutions Business Monitor International (BMI)'s Upstream Oil and Gas
Risk/Reward Index (RRI) is a key parameter to evaluate potential substitutes to
whether if the country is feasible to invest in upstream according to; oil reserves,
discovery rate, hydrocarbon production and growth, state asset ownership,
competitive landscape, Infrastructure integrity, royalties, income tax, license type,
bureaucratic environment, legal environment risk, economic and political risk index,
operational risk index (Fitch Solutions, 2018).
To summarize, Campbell (2013) suggests the oil field analysis to draw a forecast by
using the previous production data. In this thesis, it is deepened by using this method
to each major field. Simmons (2005) investigates the Saudi Arabian oil fields very
detailed. He enlightens the readers and my objective while writing this thesis was to
move along the way that Simmons opened and improve his legacy and complete the
“Saudi Puzzle” by finding the missing pieces.
While most of the studies focus on one field, the country analysis was superficial, not
that deep. The major difference of this thesis from the other studies analyzed was to
evaluate each field as in separate way and gather them all to project the future of Saudi
Arabian crude oil supply forecast.

7
CHAPTER 3
3. CRUDE OIL MARKET
Petroleum, as an almost infinite series of mixtures of differing hydrocarbons in their
natural state, exhibits a wide range of physical characteristics. These characteristics
have a strong influence on classifying crude oil types (Seba, 2016).
Oil formation needs a complete petroleum system with the necessary elements and
processes. Some geological components and processes are necessary to generate and
store hydrocarbons. These are; a mature source rock, migration pathway, reservoir
rock, trap, and seal. Also processes as generation, migration, and accumulation are
necessary to occur with the proper timing. If these elements are placed in the proper
timeline, oil can generate (Al-Hajeri et al., 2010).
Source rock is the rock that forms oil. If the organic matter rich rock is heated and
pressurized sufficiently, the oil will be generated.
The reservoir rock is where oil is mitigated from a source rock, the final destination
of the hydrocarbons where they are finally located. A reservoir rock should have
sufficient porosity and permeability to store and transmit the fluids.
Trap formation is a configuration of rocks suitable for containing hydrocarbons and
sealed by a relatively impermeable formation through which hydrocarbons will not
migrate since the reservoir rock is the last place for oil migration. Seal rock is an
important component of the trap which provides a tight and impermeable layer to
prevent further mitigation from reservoir rock (Schlumberger, 2019).
Figure 3.1 shows the ideal timing of a petroleum system. The proper timeline starts with
the source-rock deposition. Then it is followed by deposition of reservoir rock, seal
rock and overburden rock. Overburden effects system for a longer period. If elements

8
are supported by the process with proper time order, petroleum system can be formed.
The process is generation, migration and accumulation. Also, after these actions,
reservoir rock needs to be preserved for a long time (Al-Hajeri et al., 2010).
Figure 3.1. Petroleum System Timeline (Al-Hajeri et al., 2010)
Reserves are classified according to their production probabilities. There are three
different scenarios about reserves. These are proven, probable and possible reserves.
Proven reserves: If reserve shows 90% probability to produce and reasonable certainty
is seen with deterministic methods, it is called proven reserve.
Probable reserves: If probabilistic methods show at least 50% probability of
recoverable reserve, in other word if engineering methods suggest more likely to
produce than not to be recoverable, it is called probable reserves.
Possible Reserves: While possible reserves are unproven if geological analysis
suggests that reserves are less likely to be recoverable than probable reserves (SPE,
2001).

9
3.1 Crude Oil
Crude oil is mostly known as petroleum, a wide-ranging term that includes many
substances and forms of liquids (Höök, 2008). However, the term crude oil differs
from petroleum. It excludes unconventional oil as shale oil, tar sands, bitumen and the
refined petroleum liquids derived from any type of oil.
Unconventional Oil: The oil that cannot be produced, transported or refined using
traditional techniques. They require new, highly energy intensive production
techniques. Unconventional oil cannot be recovered through pumping in their natural
state from an ordinary production without being heated or diluted. Extra heavy oil, oil
sands and oil shale can be classified as unconventional oil (Deborah, 2012). Heavy oil
is considered as crude oil even though its properties are close to tar sands and bitumen.
Also, Figure 3.2 shows, conventional crude oil is the most valuable fossil product
compared to coal, extra-heavy oil, heavy oil, natural gas liquids, local natural gas and
remote natural gas.
Figure 3.2. Hydrocarbon Value Hierarchy (Deborah, 2012)

10
As of the end of 2019, the total proven crude oil reserve of the world was 1.49 trillion
bbl which is enough for humanity for at least 53 years with current crude oil demand
unless there is no reservoir development or discovery happen. Figure 3.3 illustrates that,
while the Middle East contains more than half of the total reserves, Middle East and
Latin America, two continents together hold more than three-quarters of the crude oil
reserves.
Figure 3.3. Proven Crude Oil Reserves by Region (OPEC, 2019c)
Table 3.1 shows the proven crude oil reserves by country. While Venezuela holds most
of the reserves, five Middle East countries; Saudi Arabia, Iran, Iraq, Kuwait, and the
UAE follow the country. Russia, Libya, Nigeria, and the US completes the top ten.
Kazakhstan, China, Qatar, Brazil, Algeria, Angola, Ecuador, Azerbaijan, Mexico,
Norway, Oman and Sudan are the other countries with more than 5 billion bbl
reserves. Also, Canada is listed in some rankings as the third country with crude oil
reserves with a total of 170 billion bbl. But if tar sands (already out of this comparison
due to differences between crude oil types explained in this section) are excluded total
conventional crude oil reserve is less than 5 billion bbl.

11
Table 3.1. Proven Crude Oil Reserves, end of 2017 (OPEC, 2019c)
Country Proven Oil Reserves
(MMbbl) Country
Proven Oil Reserves
(MMbbl)
Venezuela 302,809 China 25,627
Saudi Arabia 266,260 Qatar 25,244
Iran 155,600 Brazil 12,634
Iraq 147,223 Algeria 12,200
Kuwait 101,500 Angola 8,384
UAE 97,800 Ecuador 8,273
Russia 80,000 Azerbaijan 7,000
Libya 48,363 Mexico 6,537
Nigeria 37,453 Norway 6,376
US 32,773 Oman 5,373
Kazakhstan 30,000 Sudan 5,000
According to Rystad Energy’s reports (Figure 3.4), the record for the lowest global
discovery of conventional volume was broken in 2017. It is announced that less than
seven billion bbl of oil were discovered which is the lowest discovery ever since the
1940s. Also, resources per discovered field were around 100 MMbbl, while it was 150
MMbbl per discovered field in 2012. However, in 2018, total discovery amount
surged again to 9.4 billion bbl (Rystad Energy, 2017, 2018).
Figure 3.4. Global Conventional Oil Discoveries (Rystad Energy, 2017, 2018)

12
Also, the crude oil market has been suffering from the decreasing crude oil prices. The
prices had been fluctuating during recent years. OPEC made some production
adjustments to balance the decreasing crude oil prices. Figure 3.5 shows the OPEC
Reference Basket (ORB) prices between March 2014 and February 2019. As of 1 May
2019, ORB is $72.00/bbl.
Figure 3.5. ORB Prices Mar 2014- Feb 2019 (OPEC, 2019b)
Table 3.2 shows the crude oil producers with higher than 500 Mbpd rate. As of May
2019, the US was the leading crude oil supplier with 12.20 MMbpd. Russia and Saudi
Arabia were following the US with 10.60 MMbpd and 9.69 MMbpd productions
respectively.

13
Table 3.2. Crude Oil Production, May 2019 (JODI, 2019; OPEC, 2019a)
Country Crude Oil Production
(MMbpd) Country
Crude Oil Production
(MMbpd)
US 12,200 Kazakhstan 1,356
Russia 10,598 Libya 1,174
Saudi Arabia 9,690 UK 1,033
Iraq 4,724 Algeria 1,029
China 3,906 Oman 1,000
Canada 3,496 Colombia 852
UAE 3,061 Venezuela 741
Kuwait 2,710 Indonesia 704
Brazil 2,607 India 684
Iran 2,370 Egypt 631
Nigeria 1,733 Malaysia 617
Mexico 1,709 Qatar 615
Angola 1,471 Azerbaijan 599
Norway 1,403 Ecuador 529
There are different types of crude oils in the world oil market with different
characteristics. Fundamentals vary for each parameter of the crude oil.
Crude oil can be mainly classified commercially according to different kind of
properties as density (API Gravity) and sourness (sulfur content).
API Gravity is the most common way to describe oil quality which depends on the
density of the oil. The American Petroleum Institute (API) defines the gravity number
according to the equation below. API gravity is calculated in 60o F. Length of
hydrocarbons makes the difference in density. Also, as the H/C ratio decreases, density
increases.
oAPI=141.5
specific gravity− 131.5 [4.1.]
14
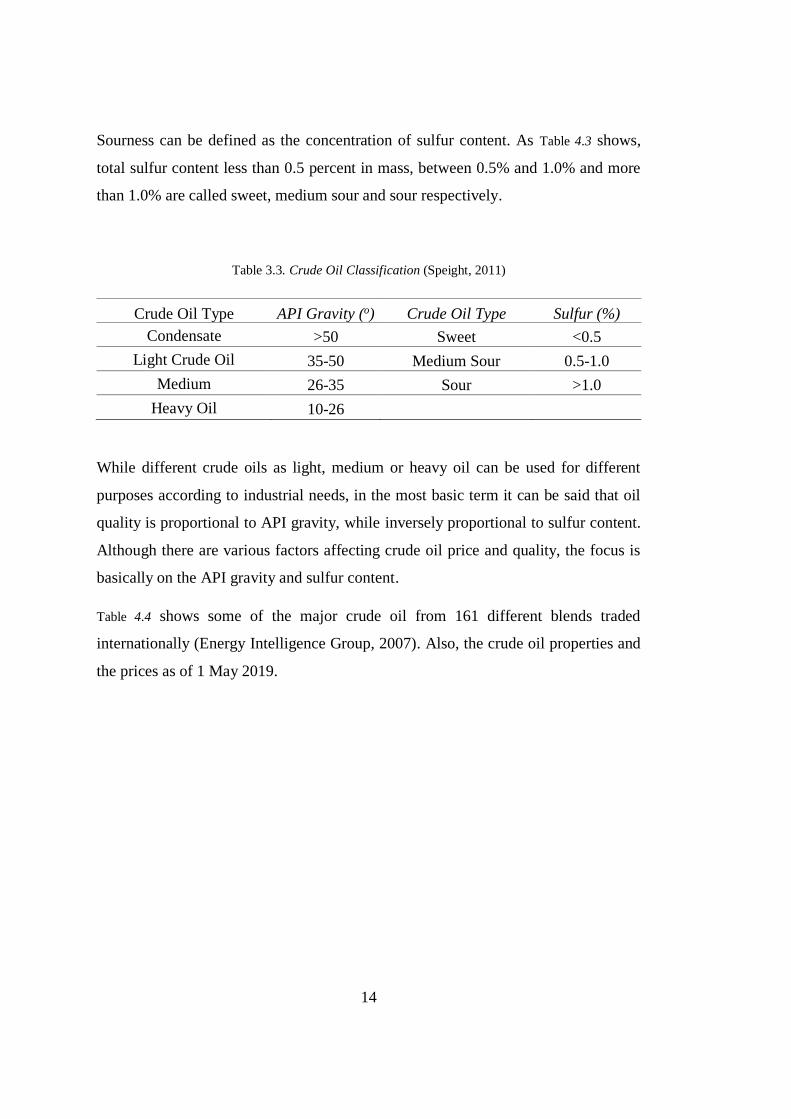
Sourness can be defined as the concentration of sulfur content. As Table 4.3 shows,
total sulfur content less than 0.5 percent in mass, between 0.5% and 1.0% and more
than 1.0% are called sweet, medium sour and sour respectively.
Table 3.3. Crude Oil Classification (Speight, 2011)
Crude Oil Type API Gravity (o) Crude Oil Type Sulfur (%)
Condensate >50 Sweet <0.5
Light Crude Oil 35-50 Medium Sour 0.5-1.0
Medium 26-35 Sour >1.0
Heavy Oil 10-26
While different crude oils as light, medium or heavy oil can be used for different
purposes according to industrial needs, in the most basic term it can be said that oil
quality is proportional to API gravity, while inversely proportional to sulfur content.
Although there are various factors affecting crude oil price and quality, the focus is
basically on the API gravity and sulfur content.
Table 4.4 shows some of the major crude oil from 161 different blends traded
internationally (Energy Intelligence Group, 2007). Also, the crude oil properties and
the prices as of 1 May 2019.

15
Table 3.4. Major Traded Crude Oil Types (Energy Intelligence Group, 2007; OPEC, 2019a)
Crude Oil (Country) API Gravity (o) Sulfur (%) Price ($/bbl)
Arab Light (Saudi Arabia) 34.0 1.78 70.78
Basrah Light (Iraq) 33.7 1.95 69.77
Bonny Light (Nigeria) 35.4 0.14 72.24
Brent Blend (UK) 38.3 0.37 71.15
Dubai (UAE) 31.0 2.00 70.93
Es Sider (Libya) 37.0 0.27 70.25
Girassol (Angola) 32.0 0.34 72.95
Iran Heavy (Iran) 30.2 1.77 67.86
Isthmus (Mexico) 33.4 1.25 70.34
Kuwait Export (Kuwait) 32.4 2.55 71.20
Marine (Qatar) 36.2 1.60 63.60
Merey (Venezuela) 15.0 2.70 58.95
Murban (UAE) 40.4 0.79 71.51
Oriente (Ecuador) 24.8 1.02 67.61
Rabi Light (Gabon) 34.6 0.06 70.40
Urals (Russia) 32.0 1.30 71.90
WTI (US) 39.6 0.24 63.87
Figure 3.6 shows the API Gravity and sulfur content of these major crude oil
distribution. As going to the right API density decreases, while the sulfur content
decreases as moving to the bottom.

16
Figure 3.6. Classification of Some Major Crude Oils
The most significant crude oils in the trade market are West Texas Intermediate
(WTI), Brent Basket and Dubai. While the two benchmark crude oils; Brent Blend
and WTI are classified as sweet light oil, the other benchmark crude oil, Dubai, is
classified as medium sour.
WTI crude is traded in New York Mercantile Exchange (NYMEX)’s oil futures
contract. Its API gravity is around 39.6o with 0.24% sulfur content. Also, WTI is
refined easily because of its high quality. Brent Blend is another benchmark crude oil.
Combination of 38 different oil fields in the North Sea forms the benchmark crude oil.
Its API gravity is 38.3o and contains 0.37% sulfur. These properties make Brent Blend
sweet light crude oil. Its future market is based at the International Petroleum
Exchange (IPE) in London. Dubai is the primary reference for crude oil delivered to
Asian refineries from the Middle East Gulf. Dubai Crude Oil is medium sour with 31o
API gravity and 2% sulfur content (Platts, 2016).
Also, OPEC uses ORB to follow market prices. Although it is not physically traded,
the basket is used for the monitoring of world oil market conditions. ORB consists of
17
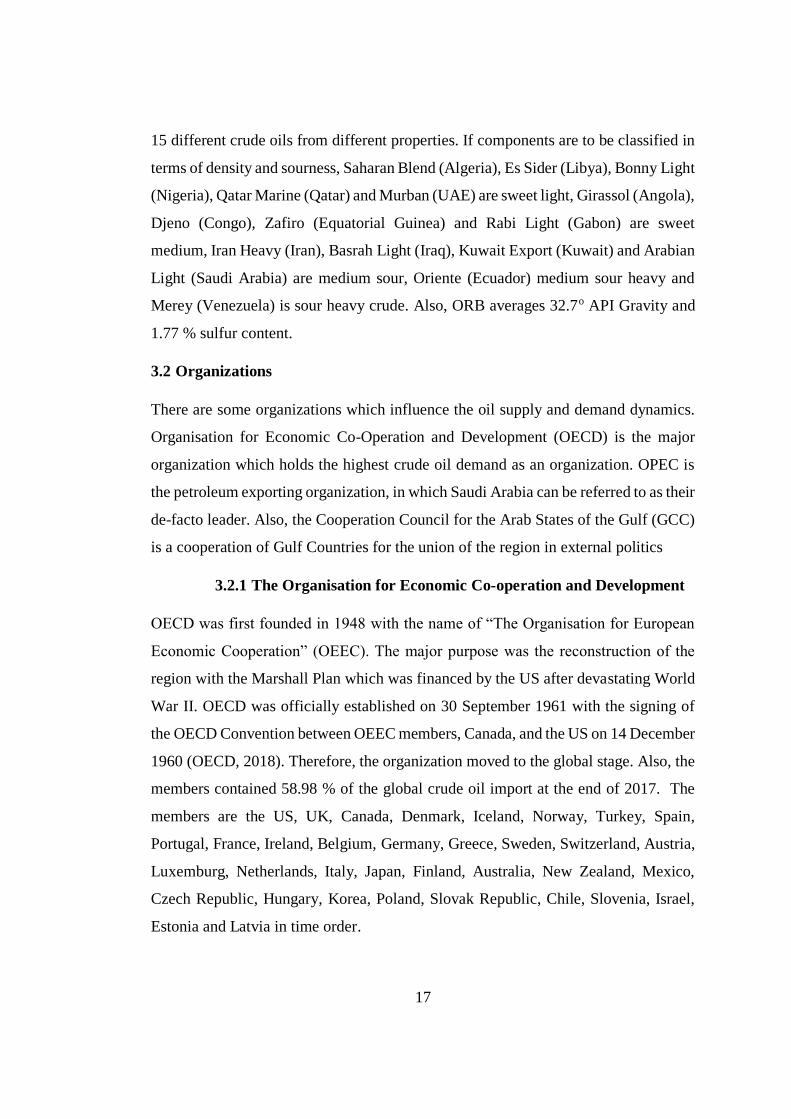
15 different crude oils from different properties. If components are to be classified in
terms of density and sourness, Saharan Blend (Algeria), Es Sider (Libya), Bonny Light
(Nigeria), Qatar Marine (Qatar) and Murban (UAE) are sweet light, Girassol (Angola),
Djeno (Congo), Zafiro (Equatorial Guinea) and Rabi Light (Gabon) are sweet
medium, Iran Heavy (Iran), Basrah Light (Iraq), Kuwait Export (Kuwait) and Arabian
Light (Saudi Arabia) are medium sour, Oriente (Ecuador) medium sour heavy and
Merey (Venezuela) is sour heavy crude. Also, ORB averages 32.7o API Gravity and
1.77 % sulfur content.
3.2 Organizations
There are some organizations which influence the oil supply and demand dynamics.
Organisation for Economic Co-Operation and Development (OECD) is the major
organization which holds the highest crude oil demand as an organization. OPEC is
the petroleum exporting organization, in which Saudi Arabia can be referred to as their
de-facto leader. Also, the Cooperation Council for the Arab States of the Gulf (GCC)
is a cooperation of Gulf Countries for the union of the region in external politics
3.2.1 The Organisation for Economic Co-operation and Development
OECD was first founded in 1948 with the name of “The Organisation for European
Economic Cooperation” (OEEC). The major purpose was the reconstruction of the
region with the Marshall Plan which was financed by the US after devastating World
War II. OECD was officially established on 30 September 1961 with the signing of
the OECD Convention between OEEC members, Canada, and the US on 14 December
1960 (OECD, 2018). Therefore, the organization moved to the global stage. Also, the
members contained 58.98 % of the global crude oil import at the end of 2017. The
members are the US, UK, Canada, Denmark, Iceland, Norway, Turkey, Spain,
Portugal, France, Ireland, Belgium, Germany, Greece, Sweden, Switzerland, Austria,
Luxemburg, Netherlands, Italy, Japan, Finland, Australia, New Zealand, Mexico,
Czech Republic, Hungary, Korea, Poland, Slovak Republic, Chile, Slovenia, Israel,
Estonia and Latvia in time order.

18
3.2.2 The Organization of Petroleum Exporting Countries
OPEC was founded in 1960 by five major oil-producing countries; Iran, Iraq, Kuwait,
Saudi Arabia, and Venezuela. The purpose of this inter-governmental organization
was to coordinate a unified petroleum policy.
Other members are; Libya (1962), The United Arab Emirates (UAE) (1967), Algeria
(1967), Nigeria (1971), Gabon (1975), Angola (2007) and Equatorial Guinea (2017)
and Congo (2018). Now the organization consists of 13 members.
The OPEC Statute stipulates that “any country with a substantial net export of crude
petroleum, which has fundamentally similar interests to those of Member Countries,
may become a Full Member of the Organization, if accepted by a majority of three-
fourths of Full Members, including the concurring votes of all Founder Members”.
OPEC’s share in supply has been more than 40% since 1993 which has a huge impact
on oil prices.
3.2.3 The Cooperation Council for the Arab States of the Gulf
GCC was established on May 25, 1981, with the cooperation of Bahrain, Kuwait,
Oman, Qatar, Saudi Arabia, and the UAE. Members hold 62% of the crude oil reserves
of the Middle East and 33% of the global crude oil reserves. Saudi Arabia influences
the economic growth of other GCC countries. As of the end of 2017, Saudi Arabia
accounts for 53.7% of GCC crude oil reserves, 46.77 % of the GCC’s GDP and 57.5
% of the total production. Additionally, the GCC Secretariat and the headquarters are
based in Riyadh, Saudi Arabia which shows that Saudi Arabia is the de-facto leader
of the Council (Martini et al., 2016).

19
CHAPTER 4
4. SAUDI ARABIA
Saudi Arabia is in the Arab Peninsula, the Middle East. GDP at market prices is $639.6
billion while the population of 32.9 million at the end of 2017 (World Bank, 2019).
Additionally, Saudi Arabia is located near the Strait of Hormuz, the world’s busiest
chokepoint and Bab el Mandeb, the fifth busiest chokepoint. The Strait connects the
Persian Gulf with the Gulf of Oman and the Arabian Sea. The total flow through the
Strait of Hurmuz was 19.1 MMbpd as the end of 2017. The strait accounted for about
30% of all seaborne-traded crude oil and other liquids since 2010. Another regional
chokepoint is Bab el Mandeb which links the Gulf of Aden and the Red Sea. This
waterway is a strategic link between the Mediterranean Sea and the Indian Ocean. An
estimated 4.8 MMbpd of crude oil and refined petroleum products flowed through this
waterway in 2017 towards Europe, the US, and Asia. As the end of 2017 total world
maritime oil trade was around 59 MMbpd, while these two chokepoints hold around
40 % of the global maritime oil trade (Berument et al., 2018).

20
Figure 4.1. Saudi Arabia Map (McMurray, 2011)

21
As of May 2019, total crude oil production of Saudi Arabia was 9.69 MMbpd. The
kingdom contains the worldwide 21.9% of the proven reserves with 266 billion bbl
(OPEC, 2019c). Saudi Arabia’s economy remains heavily dependent on petroleum
exports which were accounted for 69.01% of the total import value at the end of 2017.
The total value of petroleum exports was 85% of the total export value before 2013,
but the Kingdom’s oil revenue dramatically decreased to 69% as crude oil prices have
decreased since mid-2014.
As illustrated in Figure 4.2, Saudi Arabia continuously produced more than 10.85 % of
the worldwide, 27.68 % OPEC and 37.30 % the Middle East crude oil production since
1993. Also, Saudi Arabia is one of the three countries with more than 5 MMbpd crude
oil production in the last three decades. Russia and the US make up the top three.
Figure 4.2. World Crude Oil Production, 1993-2017 (OPEC, 2019c)

22
Also, Figure 4.3 shows the production consistency of Saudi Arabia over the last 50
years. The kingdom protected its production share in recent three decades in the world,
the Middle East and OPEC. As the end of 2017, 13 % of the crude oil supplied to the
world was produced by Saudi Arabia.
Figure 4.3. Saudi Arabia Crude Oil Production Share, 1967-2017 (OPEC, 2019c)
4.1 Saudi Aramco
Saudi Aramco is the national company of the kingdom. The company holds the
licenses in the country and directs all the upstream activities. Saudi Aramco was first
founded by the name of California Arabian Standard Oil Company (CASOC) with the
agreement between Saudi Arabia and Standard Oil Company of California (SoCal).
The company was first founded in Delaware on November 8, 1933. In 1934, Schuyler
B. Henry and J.W Soak completed their survey and structural contour map of the
Dammam Dome, the location of first oil discovery (Saudi Aramco, 2017). In 1934,
the geologist Dick Kerr who is also a pilot took aerial photos of the region. In 1935,

23
first well was drilled in Dhahran, Dammam Dome. In 1936, Texas Company acquired
50% interest in SoCal’s concession (Both Texas Company and SoCal is part of
Chevron now). In 1937, major oil fields including Ghawar, Abqaiq, and Qatif were
discovered by the chief geologist Max Steineke. In 1938, the first commercial well
(Well No.7, Figure 4.4) was discovered in Dammam. The well proved the existence of
oil in the region and a new era started. Production was 1,500 bpd. Also, in 1939,
commercial quantities of oil were found in 161 kilometers (km) northwest of Dhahran.
The importance of this well was the final target which so deep that it was 3,050 meters
(Saudi Aramco, 2017).
Figure 4.4. Dammam Well No.1 (Left), Well No.7 (Right) (McMurray, 2011)

24
In 1941, Abqaiq Field was discovered with the successful drilling operation of Abqaiq
Well No#1. The flow rates were an indication of a major new oil field. The first
refinery opened in Ras Tanura had a capacity of 3,000 bpd but then it was closed due
to World War II. In 1944, the company’s name changed to Arabian American Oil
Company (Aramco), while average production rate was 20,000 bpd. In 1946, the Arab
Industrial Development Department was established to contribute to the local
economy. In 1947, Ras Tanura Refinery completed the first year of operations with
50,000 bpd capacity. In 1948, Exxon purchased 30 % of Aramco and Mobil purchased
10% (Yergin, 1990). Later, oil production hit 500,000 bpd in 1949.
With the discovery of the Safaniya and Ghawar; total recoverable reserves of the
country have increased dramatically to 50 billion bbl. In May 1954, oil production
exceeded one MMbpd and this production became consistent with the year 1958.
Foundation of OPEC was a milestone for the kingdom in 1960. During 1973-1980 the
Saudi Arabian government increased its stake slowly until the company is fully owned
by Saudi Arabia. Finally, in 1988 the company’s name changed to Saudi Aramco
(Saudi Aramco, 2017).
During the 1990s, the company’s proven crude oil reserves volume hit 260 billion bbl.
Also, Saudi Aramco provided the supply deficit in the world oil market by increasing
total production to 8.5 MMbpd from 5.4 MMbpd only in 90 days. This action helped
the world crude oil market to stay stable.
So far approximately 151.36 billion bbl crude oil is produced from Saudi Arabia oil
fields according to the study conducted in the thesis.
25
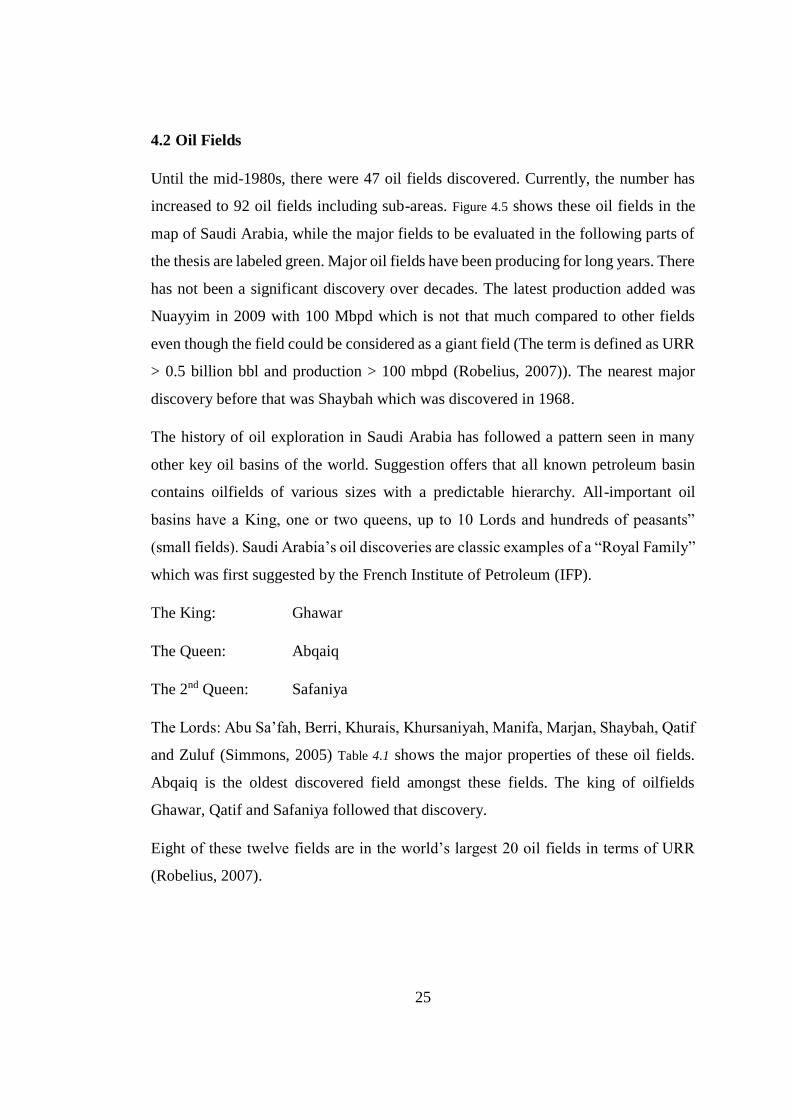
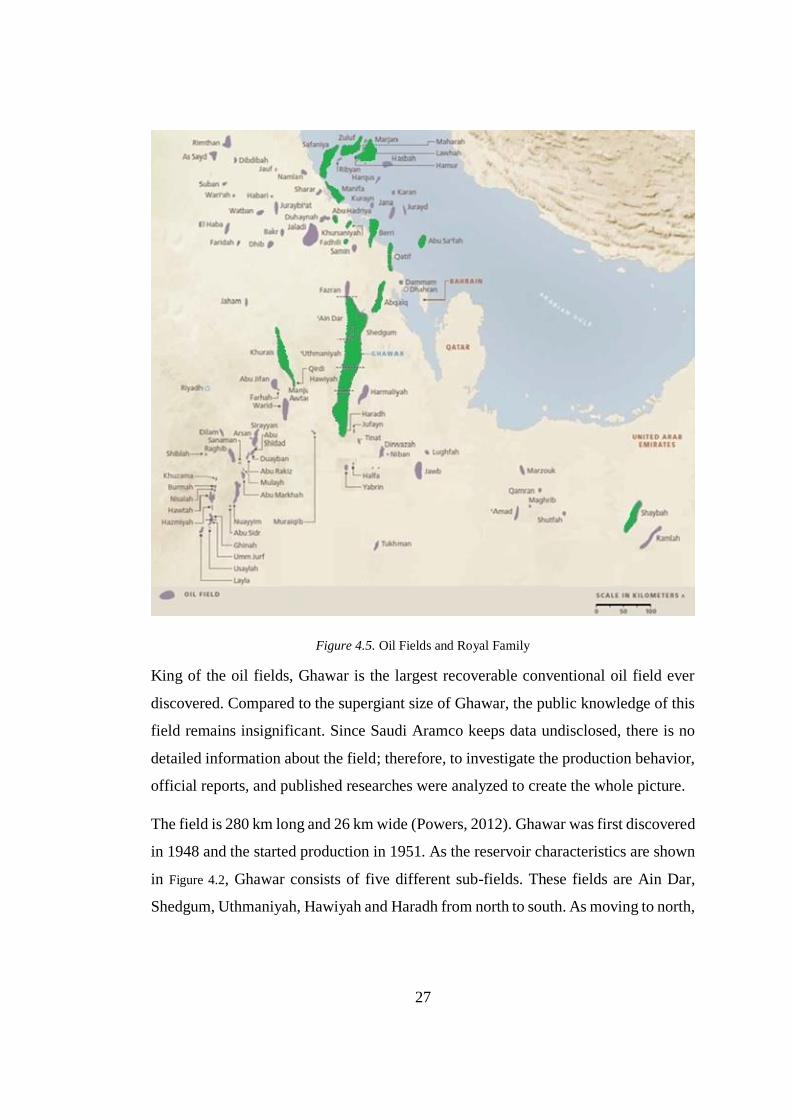
4.2 Oil Fields
Until the mid-1980s, there were 47 oil fields discovered. Currently, the number has
increased to 92 oil fields including sub-areas. Figure 4.5 shows these oil fields in the
map of Saudi Arabia, while the major fields to be evaluated in the following parts of
the thesis are labeled green. Major oil fields have been producing for long years. There
has not been a significant discovery over decades. The latest production added was
Nuayyim in 2009 with 100 Mbpd which is not that much compared to other fields
even though the field could be considered as a giant field (The term is defined as URR
> 0.5 billion bbl and production > 100 mbpd (Robelius, 2007)). The nearest major
discovery before that was Shaybah which was discovered in 1968.
The history of oil exploration in Saudi Arabia has followed a pattern seen in many
other key oil basins of the world. Suggestion offers that all known petroleum basin
contains oilfields of various sizes with a predictable hierarchy. All-important oil
basins have a King, one or two queens, up to 10 Lords and hundreds of peasants”
(small fields). Saudi Arabia’s oil discoveries are classic examples of a “Royal Family”
which was first suggested by the French Institute of Petroleum (IFP).
The King: Ghawar
The Queen: Abqaiq
The 2nd Queen: Safaniya
The Lords: Abu Sa’fah, Berri, Khurais, Khursaniyah, Manifa, Marjan, Shaybah, Qatif
and Zuluf (Simmons, 2005) Table 4.1 shows the major properties of these oil fields.
Abqaiq is the oldest discovered field amongst these fields. The king of oilfields
Ghawar, Qatif and Safaniya followed that discovery.
Eight of these twelve fields are in the world’s largest 20 oil fields in terms of URR
(Robelius, 2007).

26
Table 4.1. Saudi Arabia Major Oil Fields
Field Discovery Production Location Crude Type Grade
(oAPI)
Sulfur
(%)
Ghawar 1948 1951 Onshore Light 34 1.90
Abqaiq 1941 1946 Onshore Extra Light 36 1.32
Safaniya 1951 1957 Offshore Heavy 27 2.97
Abu Sa’fah 1963 1968 Offshore Heavy 29 2.00
Berri 1964 1967 Offshore Light 38 1.17
Khurais 1957 1970 Onshore Light 35 1.74
Khursaniyah 1956 1960 Onshore Light 35 2.38
Marjan 1967 1974 Offshore Medium 31 13.00
Manifa 1957 1964 Offshore Heavy 29 3.00
Shaybah 1968 1998 Onshore Extra Light 42 0.70
Qatif 1947 1951 Onshore Light 38 1.59
Zuluf 1965 1973 Offshore Medium 35 1.65
The Royal Family contributed to 96.34% of total crude oil production of Saudi Arabia,
while the remaining 3.66% was from other 75 fields. Therefore, the production of
these fields “Others” is evaluated as a function of these 12 fields. The examined fields
are introduced in the order of “Royal Family” and the lords in the alphabetical order.
27
Figure 4.5. Oil Fields and Royal Family
King of the oil fields, Ghawar is the largest recoverable conventional oil field ever
discovered. Compared to the supergiant size of Ghawar, the public knowledge of this
field remains insignificant. Since Saudi Aramco keeps data undisclosed, there is no
detailed information about the field; therefore, to investigate the production behavior,
official reports, and published researches were analyzed to create the whole picture.
The field is 280 km long and 26 km wide (Powers, 2012). Ghawar was first discovered
in 1948 and the started production in 1951. As the reservoir characteristics are shown
in Figure 4.2, Ghawar consists of five different sub-fields. These fields are Ain Dar,
Shedgum, Uthmaniyah, Hawiyah and Haradh from north to south. As moving to north,

28
oil quality increases. Permeability, oil viscosity, oil productivity, and reservoir
thickness decreases as moving to the south.
Table 4.2. Field Reservoir Characteristics of Ghawar Sub-Fields (Mearns, 2007)
Field Ain Dar/Shedgum Uthmaniyah Hawiyah Haradh
Discovery 1948 1951 1953 1949
Location Onshore
Reservoir Arab Carbonate
Crude Type Arab Light
Crude Grade (oAPI) 34 33 32 32
Sulfur Content (%) 1.71 1.91 2.13 2.15
Production Capacity (mbpd) 2,000 1,500 600 900
Thickness (feet) 199 180 180 140
Average Porosity (%) 19 18 17 14
Average Permeability (Md) 655 220 220 52
Productivity (Bopd/psi) 140 92 45 31
The Ain Dar/Shedgum fields are evaluated as one field since they have similar
properties. The area is located in one of the most prolific parts of the Ghawar field.
Ain Dar and Shedgum were discovered in 1948 and 1952 respectively. Uthmaniyah is
another prolific part of Ghawar. Some resources analyze the region as dividing to
North and South Uthmaniyah. The northern part was so prolific that, the production
was peaked at 1.9 MMbpd in 1973. Also, the field was discovered and first produced
in 1951. Haradh was first discovered in 1949, and production started in 1951. Hawiyah
is the latest part discovered. The first discovery was in 1953 and this region produced
quite less than the northern parts Haradh is located at the Southernmost portion of the
Ghawar complex and covers an area 75 km long and is 26 km at its widest section.
The field consists of three sub-segments of approximately equivalent reserves.
Therefore, the region can be divided into three subparts as Haradh-I, Haradh-II and
Haradh-III (Simmons, 2005).

29
Ghawar is not called “King of Oilfields” for no reason. According to the study
conducted in this thesis, as the end of 2018, Ghawar Field’s cumulative production is
estimated to be at 80.15 billion bbl. As Table 4.3 shows the amount is only less than the
production of the US and Russia. Even Saudi Arabia produced less than Ghawar if its
share is excluded. Therefore, if Ghawar were a separated country from Saudi Arabia,
it would have been the third country in terms of cumulative production between 1960-
2018.
Table 4.3. Crude Oil Production (1960-2018)
Rank Region Production (billion bbl)
3rd Ghawar 80.15
4th Iran 71.64
5th Saudi Arabia 67.26
6th Venezuela 56.71
7th China 50.37
8th Kuwait 45.09
9th Iraq 42.66
10th Mexico 42.16
As Figure 4.6 illustrates, Ghawar has been producing consistently since the first-day
production started. Even though, the field is very mature, still producing with a large
amount of production rate. As Saudi Arabian government increased its stake and
finally owned the company 1988, during that period the operators and shareholders
pushed fields so hard that Ghawar production decrease to 1.1 MMbpd from 5.77
MMbpd peak level.

30
Figure 4.6. Ghawar Crude Oil Production History (1950-2018)
The Queen, Abqaiq is one of the most mature oil fields in Saudi Arabia. The field is
approximately 59 km in length and 11 km in wide. This onshore field was discovered
in 1941 and production began in 1946. Abqaiq lies in the northeast section of Ghawar
and the rock properties are very similar to the north end of Ghawar in terms of
permeability and quality. Crude oil produced in this field is classified as Arab Extra
Light with 36o API and 1.32 % sulfur content (Powers, 2012). As Figure 4.7 illustrates
Abqaiq enjoyed its peak production in the early 1970s and still producing around 400
mbpd.

31
Figure 4.7. Abqaiq Crude Oil Production History (1950-2018)
The 2nd Queen, Safaniya is the largest conventional offshore field. It was first
discovered in 1951 off the coast of Arabian Peninsula about 200 km north of Dhahran.
Safaniya is 50 km by 15 km in size and both discovered and commenced production
in 1957. Reservoir section is very high-quality sandstone as opposed to Ghawar which
is limestone. API gravity of the crude oil produced is 27o (Simmons, 2005).
As Figure 4.8 illustrates, the field has been producing for long years. After the 2000s,
production has increased by horizontal well applications. This application decreased
the water cut and increased production per well (Zubail et al., 2012).

32
Figure 4.8. Safaniya Crude Oil Production History (1950-2018)
Abu Sa’fah is located 48 km off the shore from mainland Saudi Arabia. The field was
discovered in 1963 and started production in 1968. The production is shared with
Bahrain. Abu Sa’fah crude oil is heavy and sour with 28.6o API with 2.36% sulfur
content (Ali et al., 1981).
Berri is located both onshore and offshore along the western edge of the Arabian Gulf.
The field was first discovered in 1964 and the production started in 1967. Producing
formation is carbonate as Ghawar and Abqaiq. API gravity is 38o and sulfur content
is 1.17%. Figure 4.9 shows the oil production history of the field. The field was shut off
in 1982 after 15 years of production. Berri started to produce in 1993 with horizontal
drilling applications taken place in 1991 (McMurray, 2011). Since then, the field has
been producing around 250 Mbpd.

33
Figure 4.9. Berri Crude Oil Production History (1950-2018)
Khurais shows similarity with Abqaiq, Berri, and Ghawar and while the field is just
located in the west of Ghawar. The field was discovered in 1957 and started production
in 1961. Produced crude oil API gravity is 36o (Al-Somali et al., 2009). Cumulative
production was only 0.42 billion bbl until 1993 which is very little compared to other
major fields. After the developments and the addition of Abu Jifan and Mazalij fields
production started with 1.2 MMbpd and increased its capacity to 1.5 MMbpd by mid-
2018.
Khursaniyah is smaller compared to other fields. The field consists of three different
sub-fields; Khursaniyah, Abu Hadriya, and Fadhili. The information related to this
field is limited while the API gravity of crude oil produced is 35o.
Manifa is one of the oldest offshore fields which was first discovered in 1957. The
field is in 255 km northwest of Dhahran with 45 km in length and 18 km in width.
Also, Manifa is estimated to be the world’s fifth biggest offshore oil field. Crude oil
produced in this field is Arabian Heavy crude with 29o API with 3% sulfur (Xia et al.,
2014). Production was halted in 1984 and mothballed for a long time until 2007

34
(Simmons, 2005). Now the field has been producing with 900 Mbpd capacity since
2013.
Marjan is located 14 km offshore in the Arabian Gulf. The field was discovered in the
mid-1960s and oil production started in 1973. Crude oil produced is Arabian medium
crude with 31o API and crude contains sulfur as high as 13%. Smaller fields near
Marjan is adjoined with the field in terms of cumulative production.
Qatif was first discovered in 1945 and started production in 1951. Crude oil produced
is Arabian Light with 38o API and 1.59% (McKetta Jr, 1990). The field was
mothballed between 1982 and 2004. On August 9, 2004, production at Qatif
commenced again. The major problem about Qatif is that hydrogen sulfide ranging as
high as 10% to 20% in production zones. Half of the possible new drill sites were
rejected since sites were too hazardous (Simmons, 2005).
Shaybah was discovered in 1967; however, production did not start until 1998. The
field is the only significant new discovery put into production in the past three decades.
It is located 550 km southeast of Dhahran which is near the Dubai border. The region
has a very tough climate with temperatures reaching up to 52 oC, wind speed records
more than 40 mph and dunes can grow up to 1,000 ft high. Although the remote
location and harsh terrain acclimate causes higher operational cost for the Shaybah
field, with the developments in the field, production increased consistently to 1 million
bpd as of 2018 (Powers, 2012). The produced crude oil is extra light with 42o API.
Zuluf is one of the northernmost fields in Saudi Arabia and located about 56 km
offshore in the Arabian Gulf. The field was discovered in 1965 and the first production
started in 1973. Although the production zone is the same as Safaniya, produced crude
oil has 34.5o API Gravity and 1.65 % sulfur content (Aljubran et al., 2017).
35
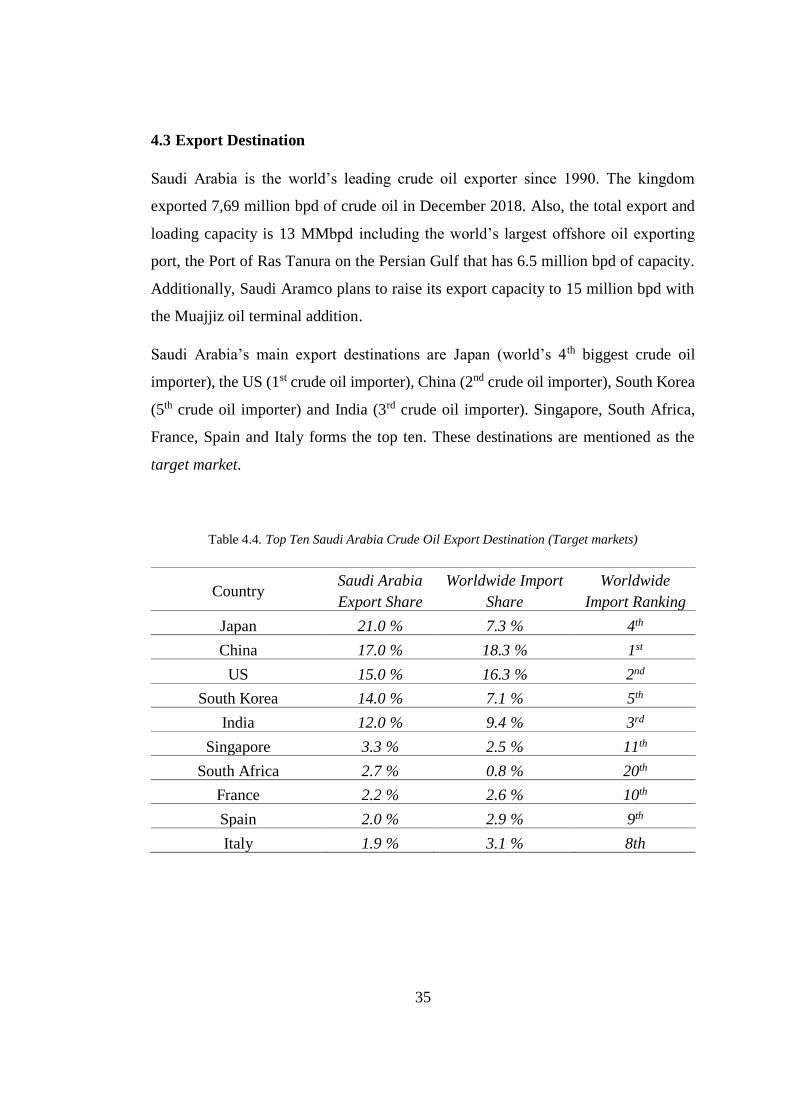
4.3 Export Destination
Saudi Arabia is the world’s leading crude oil exporter since 1990. The kingdom
exported 7,69 million bpd of crude oil in December 2018. Also, the total export and
loading capacity is 13 MMbpd including the world’s largest offshore oil exporting
port, the Port of Ras Tanura on the Persian Gulf that has 6.5 million bpd of capacity.
Additionally, Saudi Aramco plans to raise its export capacity to 15 million bpd with
the Muajjiz oil terminal addition.
Saudi Arabia’s main export destinations are Japan (world’s 4th biggest crude oil
importer), the US (1st crude oil importer), China (2nd crude oil importer), South Korea
(5th crude oil importer) and India (3rd crude oil importer). Singapore, South Africa,
France, Spain and Italy forms the top ten. These destinations are mentioned as the
target market.
Table 4.4. Top Ten Saudi Arabia Crude Oil Export Destination (Target markets)
Country Saudi Arabia
Export Share
Worldwide Import
Share
Worldwide
Import Ranking
Japan 21.0 % 7.3 % 4th
China 17.0 % 18.3 % 1st
US 15.0 % 16.3 % 2nd
South Korea 14.0 % 7.1 % 5th
India 12.0 % 9.4 % 3rd
Singapore 3.3 % 2.5 % 11th
South Africa 2.7 % 0.8 % 20th
France 2.2 % 2.6 % 10th
Spain 2.0 % 2.9 % 9th
Italy 1.9 % 3.1 % 8th


37
CHAPTER 5
5. STATEMENT OF THE PROBLEM
When it comes to oil it is difficult to reach reliable data and make an accurate
economic forecast. Since Saudi Arabia is the de-facto leader and swing producer of
the oil business and Saudi Aramco is on the verge of the initial public offering (IPO)
the condition of the fields and future production is more important than ever.
The primary key for forecasting the future crude oil market of a country is to monitor
the production behavior and evaluate the potential substitutes.
This study aims to draw a future of Saudi Arabian crude oil market by investigating
the oil fields and potential substitutes in the market. This will help to lighten the global
crude oil industry. For this purpose, fields were evaluated within production behavior
methods, other major producers were analyzed according to their replacement power
over Saudi Arabian crude and finally, scenarios were discussed according to these
possible replacements.
As to be explained in further chapters, both evaluations were analyzed through
engineering methods.


39
CHAPTER 6
6. METHODOLOGY
In this thesis, the methodology is divided into two parts. First is to analyze the fields’
reservoirs and future production behavior. Second is to evaluate the potential
substitutes and rank them.
6.1 Reservoir Evaluation
In this section, there are seven steps to analyze the reserves and production. Most
methods are inspired by Campbell’s oil analysis methods.
1. Past Production
The first step of the analysis is to gather and plot past production. Table 6.1 illustrates
an example of past production of Ghawar between 1951-1955. Computed parameters
are,
a) Daily average production (Mbpd) during the year in Column B
b) Annual production (MMbbl) in Column C
𝑎𝑝 = 𝑑𝑝 ∗ 0.365 [6.1.]
Where ap is annual production (MMbbl) and dp is daily production (Mbpd).
c) Cumulative production (MMbbl) in Column D
𝑐𝑝𝑖 = 𝑐𝑝𝑖−1 + 𝑎𝑝𝑖 [6.2.]
Where cp is cumulative production (MMbbl) and i is the year.
d) Depletion rate (%) in Column E
𝐷 =𝑐𝑝
𝑈𝑅𝑅 [6.3.]
40
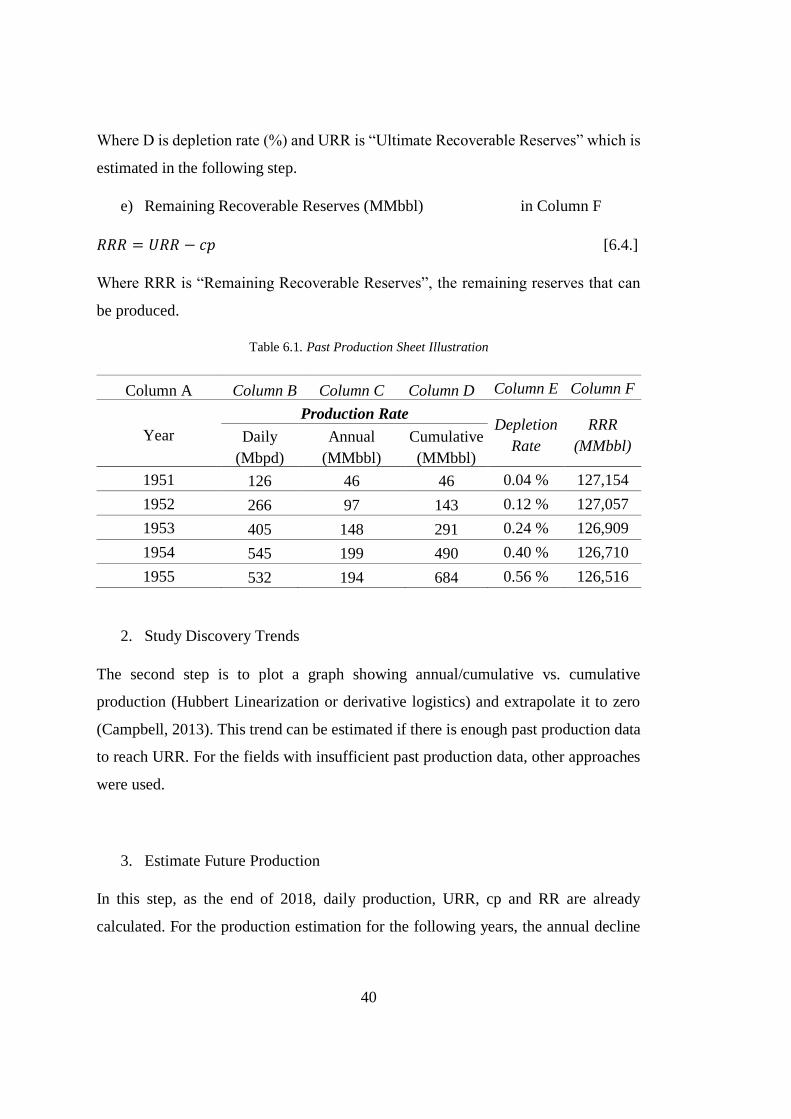
Where D is depletion rate (%) and URR is “Ultimate Recoverable Reserves” which is
estimated in the following step.
e) Remaining Recoverable Reserves (MMbbl) in Column F
𝑅𝑅𝑅 = 𝑈𝑅𝑅 − 𝑐𝑝 [6.4.]
Where RRR is “Remaining Recoverable Reserves”, the remaining reserves that can
be produced.
Table 6.1. Past Production Sheet Illustration
Column A Column B Column C Column D Column E Column F
Year
Production Rate Depletion
Rate
RRR
(MMbbl) Daily
(Mbpd)
Annual
(MMbbl)
Cumulative
(MMbbl)
1951 126 46 46 0.04 % 127,154
1952 266 97 143 0.12 % 127,057
1953 405 148 291 0.24 % 126,909
1954 545 199 490 0.40 % 126,710
1955 532 194 684 0.56 % 126,516
2. Study Discovery Trends
The second step is to plot a graph showing annual/cumulative vs. cumulative
production (Hubbert Linearization or derivative logistics) and extrapolate it to zero
(Campbell, 2013). This trend can be estimated if there is enough past production data
to reach URR. For the fields with insufficient past production data, other approaches
were used.
3. Estimate Future Production
In this step, as the end of 2018, daily production, URR, cp and RR are already
calculated. For the production estimation for the following years, the annual decline

41
rate is necessary. Most of the fields’ decline rate is already known and the others are
estimated by similar reservoir properties.
𝑎𝑝𝑖 = 𝑎𝑝𝑖−1 ∗ (1 − 𝑑) [6.5.]
Where d is the annual decline (%) and i is the year.
The annual declines are directly taken from official reports of Saudi Aramco and
shown in Table 7.3.
4. Estimate Future Production from Unexplored Reserves
This step is to estimate the potential unexplored fields and their reserves. Discovery
vs. year trend is investigated to draw a future. After that, Höök’s approach to
production behavior of OPEC giant fields explored after the 2000s were used (Höök,
2008). This approach fits in Saudi Arabia since 96% of the oil produced from giant
fields. Production parameters of an unexplored field are illustrated in Table 6.2.
Table 6.2. The Behavior of OPEC Giant Fields Explored After 2000 (Höök, 2008)
Depletion at peak 14.1 %
Decline rate -10.2 %
Cum. Prod./ URR at peak 40.6 %
Discovery to First Oil 2.1 years
First Oil to Decline 17.0 years
Plateau 5.0 years
5. Estimate the Future Production from Other Fields
In this step, production of the other fields is forecasted by investigating other fields’
production over total production ratio vs. years relation.
42
6. Potential Production Expansion as Scenario
This step consists the potential developments. If the field’s depletion rate at 2049 is
less than 90%, the production gap is considered as field development. For
development cost analysis, previous developments in Saudi Arabia are considered.
7. Compile the Totals of the Fields
This step concludes the sum of other steps and the possible scenarios.
6.2 Substitutes
The substitute is defined as a potential competitor. There are three different
elimination criteria to be classified as a substitute. These are sufficient crude oil
production, net export capacity and similar crude oil type.
a) Daily production (> 650,000 bpd)
Firstly, the countries eliminated through their daily crude oil production. Countries
with less than 650,000 bpd of production volume as May 2019 were eliminated.
b) Crude oil trade balance (net exporter),
Secondly, the crude oil trade balances of these countries were analyzed. From the
remained countries according to daily production, the ones with the trade deficits or
trade balance with less than 250,000 bpd in crude oil were also eliminated.
c) Crude oil type (Similarity to Arab Light and Arab Medium)
Thirdly, the remaining producers are analyzed by their produced crude oil types.
According to production analysis conducted, as of the end of 2018, average API
Gravity of produced crude oil of Saudi Arabia was 33.9o (14.0% Arab Extra Light,
58.5% Arab Light, 8.8% Arab Medium and 18.7% Arab Heavy). Therefore, since the
light and medium crude is the major part of Saudi Arabia crude oil export market,
countries with producing mostly heavy crude oil are eliminated.

43
After these criteria, remaining countries were classified as a substitute. The substitutes
were ranked according to various classification methods. These are common market
share, competition level, proven reserves, geopolitical risks and production costs.
Average results from each criterion were graded as the final grade.
Maximum grade over one criterion is graded as 100 and the minimum as 0.
𝐺𝑟𝑎𝑑𝑒 =𝑅𝑒𝑠𝑢𝑙𝑡−𝑀𝐼𝑁
𝑀𝐴𝑋−𝑀𝐼𝑁 [6.6.]
a) Common Market Share
Common market share is defined as the ratio of “Substitute’s total crude oil exported
to target markets” to “Total amount of crude oil exported by Saudi Arabia to target
markets”.
𝐶𝑜𝑚𝑚𝑜𝑛 𝑀𝑎𝑟𝑘𝑒𝑡 𝑆ℎ𝑎𝑟𝑒 =𝑆𝑢𝑏𝑠𝑡𝑖𝑡𝑢𝑡𝑒′𝑠 𝐶𝑟𝑢𝑑𝑒 𝑂𝑖𝑙 𝐸𝑥𝑝𝑜𝑟𝑡𝑒𝑑 𝑡𝑜 𝑇𝑎𝑟𝑔𝑒𝑡 𝑀𝑎𝑟𝑘𝑒𝑡
𝑆𝑎𝑢𝑑𝑖 𝐴𝑟𝑎𝑏𝑖𝑎′ 𝐶𝑟𝑢𝑑𝑒 𝑂𝑖𝑙 𝐸𝑥𝑝𝑜𝑟𝑡𝑒𝑑 𝑡𝑜 𝑇𝑎𝑟𝑔𝑒𝑡 𝑀𝑎𝑟𝑘𝑒𝑡𝑠 [6.7.]
b) Competition Level
If the substitute’s export ratio to Saudi Arabia export ratio for the destined target
market is higher than 35%, a substitute is defined as a major competitor for the
destination. This criterion shows the competition severity of the substitute.
If Substitute export on the target market
𝑆𝑎𝑢𝑑𝑖 𝐴𝑟𝑎𝑏𝑖𝑎′𝑠 𝑒𝑥𝑝𝑜𝑟𝑡 𝑜𝑛 𝑡𝑎𝑟𝑔𝑒𝑡 𝑚𝑎𝑟𝑘𝑒𝑡 < 35%, no competition [6.8.]
Substitute export on the target market
𝑆𝑎𝑢𝑑𝑖 𝐴𝑟𝑎𝑏𝑖𝑎′𝑠 𝑒𝑥𝑝𝑜𝑟𝑡 𝑜𝑛 𝑡𝑎𝑟𝑔𝑒𝑡 𝑚𝑎𝑟𝑘𝑒𝑡 > 35%, major competition [6.9.]
𝐶𝑜𝑚𝑝𝑒𝑡𝑖𝑡𝑖𝑜𝑛 𝑙𝑒𝑣𝑒𝑙 = ∑ 𝑐𝑖 ∗ 𝑒𝑠𝑖𝑛𝑖=1 [6.10.]
Where ci = 1 if the substitute is a major competition, [6.11.]
ci = 0 if the substitute is not a major competition [6.12.]
Where 𝑒𝑠𝑖 = 𝑆𝑎𝑢𝑑𝑖 𝐴𝑟𝑎𝑏𝑖𝑎 𝑐𝑟𝑢𝑑𝑒 𝑜𝑖𝑙 𝑒𝑥𝑝𝑜𝑟𝑡 𝑡𝑜 𝑡𝑎𝑟𝑔𝑒𝑡 𝑚𝑎𝑟𝑘𝑒𝑡
𝑆𝑎𝑢𝑑𝑖 𝐴𝑟𝑎𝑏𝑖𝑎 𝑐𝑟𝑢𝑑𝑒 𝑜𝑖𝑙 𝑒𝑥𝑝𝑜𝑟𝑡 𝑖𝑛 𝑡𝑜𝑡𝑎𝑙 [6.13.]
i is the target markets, where n is equal to ten.

44
c) Proven reserves
Proven reserves are overviewed by the total reserves to check if the substitute can
compete for a long time with Saudi Arabia. Substitutes’ reserves are graded over their
proven crude oil reserves.
d) Geopolitical Risks
Oil investment including exploration and trade favors stable and developed markets
with political stability. The countries with economic stability and a proper regulatory
environment, encourage private sector participation. Markets with large and
accessible reserves offer the greatest rewards globally for upstream investment. For
the classification, BMI's Upstream Oil and Gas Risk/Reward Index was used. The
analysis comprises; oil reserves, discovery rate, hydrocarbon production and growth,
state asset ownership, competitive landscape, Infrastructure integrity, royalties,
income tax, license type, bureaucratic environment, legal environment risk, economic
and political risk index, operational risk index.
e) Production Costs
This analysis outlines the average cost to produce one barrel of oil including capital
expenditures (CAPEX) and operational expenditures (OPEX). Rystad Energy (2016)
and Wall Street Journal (WSJ, 2019) (Rystad Energy, 2019; The Wall Street Journal,
2016) were used as sources to determine the costs.

45
CHAPTER 7
7. RESULTS AND DISCUSSIONS
This section presents the results of the analysis conducted within the scope of this
thesis. Analysis carried out in accordance with the methodology as described in
METHODOLOGY to obtain the results. Detailed results can be found in C.
7.1 Saudi Arabia Crude Oil Production Forecast and Cases
This part represents the production forecast and the potential forecast of Saudi Arabia
crude oil production. In this section, 12 major oil fields and the other fields as a whole
were analyzed. Results are explained in Royal Family Hierarchy. Then four case is
analyzed.
Case 0: Production forecast with existing fields,
Case I: Addition of unexplored fields,
Case II: Addition of field development,
Case III: Addition of both unexplored fields and field development.
7.1.1 Saudi Arabia Crude Oil Production Forecast
As Figure 7.1 suggests, according to derivative logistics analysis (ap/cp vs. cp) URR of
Ghawar Field is projected as 127.2 billion bbl. The analysis takes the production data
between 1987-2018 and the coefficient of determination is 0.6019. (Highest URR ever
suggested was by Powers, with 120 billion bbl.)

46
Figure 7.1. Ghawar Hubbert Linearization
Figure 7.2 illustrates the water vs. cumulative production Ghawar Field by using the
production and water cut data between 1993-2004. The graph shows that URR
estimation is rational since water cut would reach 70% when URR is 127.2 billion bbl
which is equal to 2:1 water/oil ratio.
Figure 7.2. Ghawar Water Cut vs. Cumulative Production
Figure 7.3 illustrates the Ain Dar/Shedgum derivative logistics. Cumulative production
is 47 billion bbl with 0.854 of the coefficient of determination. The highest limit
suggested for the field by official reports was between 40.8-51.0 billion bbl (Baqi &
Saleri, 2004).

47
Figure 7.3. Ain Dar/Shedgum Hubbert Linearization
The second biggest sub-part of Ghawar is Uthmaniyah which has 45 billion bbl of
URR according to Figure 7.4 while the coefficient of determination is 0.7395 with the
production data between 2004-2018. The highest URR suggestion was 43 billion bbl
was (Mearns, 2007).
Figure 7.4. Uthmaniyah Hubbert Linearization
The other subparts of Ghawar are Hawiyah and Haradh. There is little information
about these two fields. The reason is that both fields have started producing recently.

48
Major suggestions done for both fields are shown in Table 7.1. The analysis uses the
highest approximations which are verified for Ain Dar/Shedgum and Uthmaniyah.
Therefore, URR of Hawiyah and Haradh are 16 and 18 billion bbl respectively.
Mearns uses oil saturation map over the years, Staniford additionally uses water oil
contact change over the years to estimate the reserves of sub-fields of Ghawar.
Table 7.1. Sub-Fields of Ghawar
Approach Ain Dar/Shedgum Uthmaniyah Hawiyah Haradh Total
Staniford 34 34 11 18 97
Mearns (Base) 33 36 14 14 97
Mearns (High) 38 43 16 16 113
Aslanoglu 48 45 16 18 127
To estimate the URR of Abqaiq, the same approach as Ghawar is applied. As Figure
7.5 and Figure 7.6 shows, Hubbert Linearization is analyzed, then it is verified by water
cut vs. cumulative production for the estimated total production. URR is estimated as
16.75 billion bbl according to the projection. Water oil ratio is expected to be 2:1
which shows that cumulative production which is considerable.
Figure 7.5. Abqaiq Hubbert Linearization

49
Figure 7.6. Abqaiq Water Cut vs. Cumulative Production
URR of Safaniya Field is estimated by using the production data between 1994-2018
as it is seen in Figure 7.7. Extrapolation shows that total cumulative production could
be as high as 49 billion bbl according to derivative logistics. URR is verified by two
different ways,
• 2004 production data: Cumulative production by 2004 is 12,045 billion bbl,
depletion is 26% equal to 46.3 billion bbl)
• URR is suggested to be as high as 55 billion bbl by experts (Aleklett et al.,
2010).
Figure 7.7. Safaniya Hubbert Linearization

50
Berri Field’s URR is estimated to be 10.8 billion bbl according to Hubbert
Linearization which is seen in Figure 7.8. This is verified by 2004 production and
depletion data as well as other suggestions by experts. (12.4 billion bbl and 12 billion
bbl respectively)
Figure 7.8. Berri Hubbert Linearization
Table 7.2. shows the URR estimation by using the Eq. 6.3. According to the table, Abu
Sa’fah, Marjan, Shaybah and Zuluf have 7.83 billion bbl, 13.48 billion bbl, 19.90
billion bbl and 24.74 billion bbl respectively.
Table 7.2. URR Estimation by Cumulative Production Data, 1.1.2004
Field Cumulative Production Depletion Rate URR
Abu Sa’fah 1.64 billion bbl 21 % 7.83 billion bbl
Marjan 1.75 billion bbl 13 % 13.48 billion bbl
Shaybah 1.00 billion bbl 5 % 19.90 billion bbl
Zuluf 3.96 billion bbl 16 % 24.70 billion bbl

51
Two of the fields; Manifa and Qatif Fields’ productions till 2018 and depletion levels
are quite low comparing the URR suggestions by the experts. Therefore, the lowest
value is considered. URR of Manifa and Qatif are 17.0 billion bbl and 8.4 billion bbl
respectively.
Production data of Khurais and Khursaniyah are very few that it is difficult estimate
for the potential cumulative production. Therefore, the URR value is taken from the
reliable sources. Khurais’ URR is 28.8 billion bbl according to estimation of OIP 38
billion bbl and expected recovery is 60% considering the reservoir properties of the
field (Powers, 2012). Khursaniyah is a small field comparing the others, then the field
is the sum of three fields; Khursaniyah, Abu Hadriya and Fadhili which is 7.14 billion
bbl in total.
Future production from the other fields is forecasted by using the other fields’ ratio
over total production during the years. Figure 7.9 illustrates the trend, where the ratio is
5.8 % as 2018 and the next 30 years is projected by using the trend over total
production. Largest production is from Nuayyim Field. The crude is Arab Light with
50o API and low (0.02%) in sulfur content. Therefore, another crude type is considered
as Arab Light because of the large share of Nuayyim.
Figure 7.9. Other Fields’ Production Ratio Over Total Production

52
Table 7.3. shows the production and reservoir properties of the major 12 fields and other
fields. So far expected RRR is 208.7 billion bbl where Reserve/Production ratio is
57.1 years.
Table 7.3. Production Properties of 12 Major Oil Fields, as of 1.1.2019
Field URR
(MMbbl)
RRR
(MMbbl
Annual
Decline
Production (Mbpd)
Peak 2019
Ghawar 127,200 47,055 2.0 % 5,772 4,050
Abqaiq 16,750 3,923 2.8 % 1,094 405
Safaniya 49,000 32,436 1.5 % 1,544 972
Abu Sa’fah 7,800 4,737 1.0 % 300 243
Berri 10,800 6,114 4.1 % 807 243
Khurais 22,800 18,894 2.2 % 1,500 1,272
Khursaniyah 7,140 3,623 4.1 % 467 426
Manifa 17,000 14,965 1.5% 900 900
Marjan 13,400 10,344 1.5% 400 365
Qatif 8,400 5,849 1.0% 444 405
Shaybah 19,900 15,502 1.0% 900 810
Zuluf 24,700 18,439 1.8% 658 551
Others 39,100 26,834 710
7.1.2 Scenarios
As mentioned before, crude oil production forecast is analyzed over four different
scenarios. These are; Case 0, Case I, Case II and Case III.
Case 0 is the production forecast over existing conditions of the field. This case
consists of no field development or oil exploration activity. Therefore, the total
expenditure is zero for the case.
Case I considers the existing production and the additions from undiscovered fields.
Average exploration expenditure per year of Saudi Aramco is $600 million (Whitley

53
& Shakuntala, 2014). Assuming that the producible reserve discovery trend between
1948-2018 (Figure 7.10) applies the same for the future and field production behavior
is considered as Höök’s model (Table 6.2), 16.61 billion bbl production is expected to
be added to cumulative production. Total exploration cost for 30 years would be $
24.34 billion where the unit cost is $1.47/bbl.
Figure 7.10. Model for Undiscovered Fields
Case II is the case that field development is considered. Recent development costs are
taken as reference (Jaffe & Elass, 2007). According to this scenario, total field
development would cost $72.1 billion in return of totally 48.07 billion bbl production
(Table 7.4). Cost per additional bbl production is equal to $1.50/bbl in this case. (Annual
inflation for the following years is considered as 2% as per OECD’s projection.)

54
Table 7.4. Case II (Field Development Scenarios)
Field Year Expansion (Mbpd) Cost ($ billion)
Hawiyah 2023 620 6.84
Haradh 2023 651 7.19
Safaniya 2023 900 7.73
Safaniya 2028 900 8.53
Safaniya 2033 900 9.31
Abu Sa’fah 2023 196 1.34
Berri 2023 590 4.01
Marjan 2023 397 3.41
Manifa 2023 397 3.41
Qatif 2023 138 0.94
Shaybah 2023 693 7.65
Zuluf 2023 650 5.59
Zuluf 2028 650 6.17
Case III considers both discoveries and field developments. As can be seen in Table
7.5, totally 64.68 billion bbl crude oil could be added to future production if $96.35
billion is invested.
Table 7.5. Cases Overview
Case I cost Case II cost Case III cost
16,614 MMbbl 48,066 MMbbl 64,680 MMbbl
$24.34 billion $72.11 billion $96.35 billion
$1.47/bbl $1.50/bbl $1.49/bbl
Figure 7.11 shows the future production for the cases. Without any development or
exploration production is expected to decrease below six mbpd in 2045. The case I
could maintain the crude oil production above ten mbpd until 2040, and 8.5 MMbpd
until 2048. Saudi Arabia is expected to produce over 15 MMbpd in 2023 if necessary
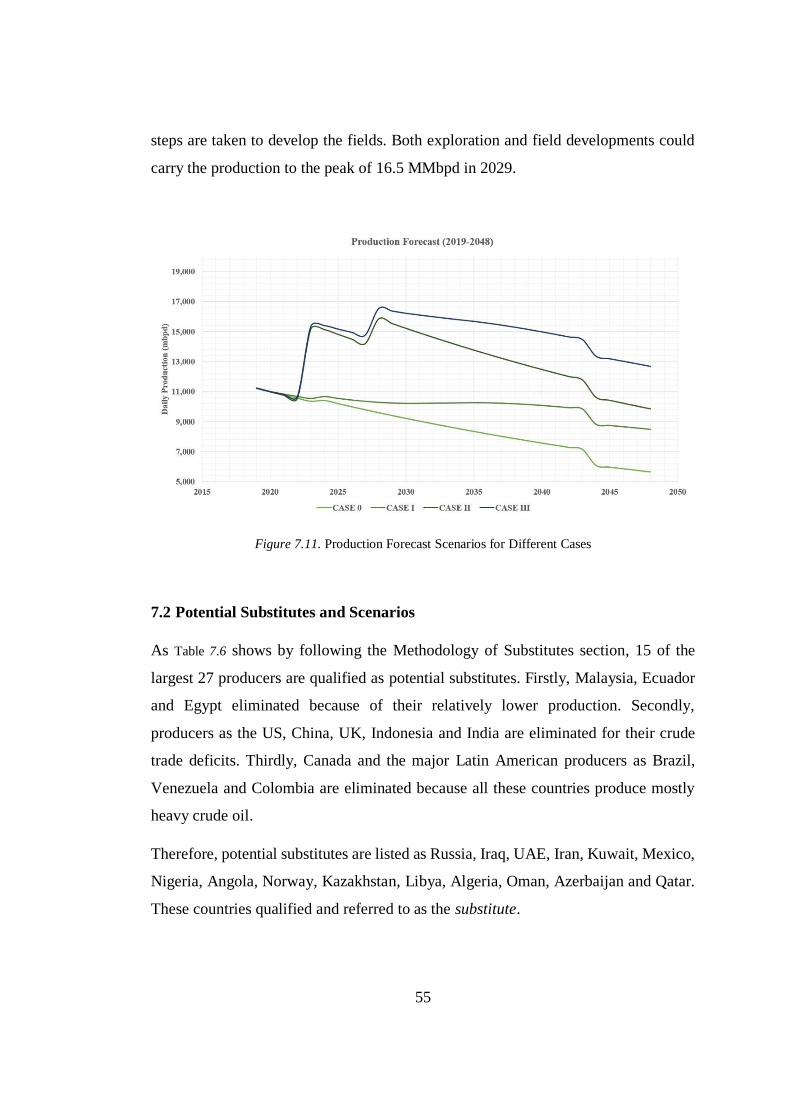
55
steps are taken to develop the fields. Both exploration and field developments could
carry the production to the peak of 16.5 MMbpd in 2029.
Figure 7.11. Production Forecast Scenarios for Different Cases
7.2 Potential Substitutes and Scenarios
As Table 7.6 shows by following the Methodology of Substitutes section, 15 of the
largest 27 producers are qualified as potential substitutes. Firstly, Malaysia, Ecuador
and Egypt eliminated because of their relatively lower production. Secondly,
producers as the US, China, UK, Indonesia and India are eliminated for their crude
trade deficits. Thirdly, Canada and the major Latin American producers as Brazil,
Venezuela and Colombia are eliminated because all these countries produce mostly
heavy crude oil.
Therefore, potential substitutes are listed as Russia, Iraq, UAE, Iran, Kuwait, Mexico,
Nigeria, Angola, Norway, Kazakhstan, Libya, Algeria, Oman, Azerbaijan and Qatar.
These countries qualified and referred to as the substitute.

56
Table 7.6. Substitutes Elimination
Country Production (Mbpd) Trade Balance (Mbpd) Crude Type
Russia 10,598 5,081 Light
Iraq 4,724 3,804 Light
UAE 3,061 520 Light
Kuwait 2,710 2,128 Light
IR Iran 2,370 1,922 Medium
Nigeria 1,733 1,738 Light
Mexico 1,709 1,274 Medium
Angola 1,471 1,670 Light
Norway 1,403 1,373 Light
Kazakhstan 1,356 1,386 Light
Libya 1,174 1,000 Light
Algeria 1,029 668 Light
Oman 1,000 888 Light
Azerbaijan 708 655 Light
Qatar 615 503 Light
Canada 3,496 1,851 Heavy Crude
Brazil 2,607 757 Heavy Crude
Venezuela 741 1,835 Heavy Crude
Colombia 852 614 Heavy Crude
US 12,200 -7,357
China 3,906 -7,567
UK 1,033 -179
Indonesia 704 -32
India 684 -4,308
Egypt 631 91
Malaysia 617 166
Ecuador 529

57
According to the methodology defined in Chapter 6.2 for substitute ranking, four
different criteria are considered. These I: common market share, II: competition level,
III: proven reserves, IV: geopolitical risks and V: production costs.
As Table 7.7 illustrates UAE has the largest common market with Saudi Arabia. Then
they are was followed by Iraq, Kuwait and Russia. Iran is the fifth country which is
affected by recent sanctions. In the second criterion, Iraq was the largest competitor
of Saudi Arabia in target markets with a big difference. Then, Russia, Iran, UAE and
Angola were in the first five. When it comes to proven reserves, the criterion III, Iran
is in the top of the ranking with 155.6 billion bbl crude oil reserve amongst the
substitutes. Iraq is just behind Iran with 147.2 billion bbl reserve. These two countries
are followed by Kuwait, UAE and Russia. according to their proven reserves. On the
other analyze, Norway is the best country to invest if risk and reward analysis is
considered. Russia, Azerbaijan, UAE and Qatar the other countries in top regarding
the geopolitical risks. Considering the last criterion Kuwait has the least production
costs with $8.5/bbl while the country is followed by Iraq, UAE, Iran, Qatar and Oman
respectively which shows that consisting the substitutes Middle Eastern producers
have the lowest production costs.

58
Table 7.7. Substitutes Ranking
Country Criteria Criteria
Total I II III IV V I II III IV V
Iraq 33.8% 42.5% 147.2 51.1 10.7 81.5 100 94.4 39.2 92.0 81.4
UAE 41.0% 23.2% 97.8 60.9 12.3 100 52.5 61.5 67.0 86.2 73.5
Iran 18.0% 23.5% 155.6 49.3 12.6 40.7 53.3 100 34.1 85.1 62.7
Russia 25.6% 23.8% 80.0 62.7 17.3 60.4 54.1 49.7 72.2 68.1 60.9
Kuwait 25.9% 9.8% 101.5 51.3 8.5 61.1 19.5 64.0 39.8 100 56.9
Qatar 15.4% 3.7% 25.2 59.9 15.0 34.0 4.5 13.2 64.2 76.5 38.5
Oman 8.5% 10.1% 5.4 52.0 15.0 16.2 20.2 0.0 41.8 76.5 30.9
Nigeria 15.2% 13.2% 37.5 55.9 31.5 33.6 28.0 21.4 52.8 16.7 30.5
Azerbaijan 5.0% 4.2% 7.0 61.3 20.2 7.2 5.8 1.1 68.2 57.6 28.0
Kazakhstan 4.9% 5.3% 30.0 59.1 27.8 7.0 8.5 16.4 61.9 30.7 24.9
Mexico 11.9% 11.9% 6.5 52.6 29.0 25.1 24.8 0.8 43.5 25.7 24.0
Angola 16.6% 17.7% 8.4 50.4 35.4 37.0 39.0 2.0 37.2 2.5 23.6
Algeria 3.1% 1.8% 12.2 52.4 20.4 2.2 0.0 4.5 42.9 56.9 21.3
Norway 2.2% 2.5% 6.4 72.5 36.1 0.0 1.7 0.7 100 0.0 20.5
Libya 10.5% 4.8% 48.4 37.3 23.8 21.4 7.3 28.6 0.0 44.6 20.4
When all these criteria are considered Iraq is the first substitute of Saudi Arabian crude
oil with total points of 81.4. Country performed well in all criteria except geopolitical
risks. Iraq has been suffering from the regional conflict as Syrian War. But still, Iraq
seems like the best replacement. UAE is second in the ranking with 73.5 points. The
Emirates have the most common market and low production costs with moderate
scores in the other criteria. Therefore, takes the second place as a favorable contender.
These countries are followed by Iran and Russia respectively with 62.7 and 60.9
points. Iran is in the top three even though their exports have decreased to target
markets because of the recent sanctions. Russia is above average in all the criterion.
The federation has a strong position in the crude oil production market. Kuwait is the
fifth candidate for replacing the Saudi Arabian crude oil. The disadvantage of the
country is the low amount of competition in target markets and risky environment.

59
Also, Qatar, Oman and Nigeria compose threat to share of Saudi Arabian crude oil in
the market even though they cannot fully replace. Azerbaijan, Kazakhstan, Mexico,
Angola, Algeria, Norway and Libya are ranked respectively according to their total
points.
According to the results, in the scenario that Iran’s total crude export to target markets
are doubled (the peak point of recent five years) which is possible if production is
increased by developments and sanctions are lifted. Iran’s overall score point becomes
81.3 and shares the top spot with Iraq.
Table 7.8. The Case that Iran’s Export is Doubled
Country Criteria Criteria
I II III IV V I II III IV V Total
Iraq 33.8% 42.5% 147.2 51.1 10.7 81.5 100 94.4 39.2 92.0 81.4
Iran 36.0% 47.1% 156 49.3 12.6 87 100 100 34 85.14 81.3
UAE 41.0% 23.2% 97.8 60.9 12.3 100 52.5 61.5 67.0 86.2 73.5
In the second scenario, if Russia increases its export to 477 Mbpd from 191 Mbpd to
Japan, 305 Mbpd from 225 Mbpd to South Korea and 259 Mbpd from 62 Mbpd to
India. Russia’s possibility of replacing Saudi Arabian crude oil increases that total
score becomes 76.6 as Russia spots the second place. Berument suggests that India’s
crude oil import from Russia is expected to increase between 92,500 bpd to 405,000
bpd where Kanal Istanbul is expectedly increasing the trade towards India (Berument
et al., 2018). Crude export to Japan and South Korea is via the port of Kozmino, De
Kastri and Sakhalin Island. The trade volume could be expanded If oil pipeline
capacity or volume of Arctic trade route are expanded.
In such scenario, Russia crude oil export volume could increase to,
➢ Japan 191 Mbpd to 477 Mbpd,
➢ South Korea 225 Mbpd to 305 Mbpd,
➢ India 62 Mbpd to 259 Mbpd.

60
Table 7.9. The Case that Russia Influences More on Asian Markets
Country Criteria Criteria
Total I II III IV V I II III IV V
Iraq 33.8% 42.5% 147.2 51.1 10.7 81.5 100 94.4 39.2 92.0 81.4
Russia 39.3% 41.4% 80 62.7 17.3 95.7 97.2 49.7 72.2 68.1 76.6
UAE 41.0% 23.2% 97.8 60.9 12.3 100 52.5 61.5 67.0 86.2 73.5
The neighbor countries, Qatar and Oman are weak in the common trade market.
Nigeria, Angola and Mexico are suffering from high exploration and production costs.
Caspian countries Azerbaijan and Kazakhstan are remote from target markets. While
Norway provides a healthy investment environment for oil investors, export options
and proven reserves are limited. Also, Libya needs to lower the geopolitical tensions
in the region.

61
CHAPTER 8
8. CONCLUSIONS
➢ Largest conventional crude oil field, Ghawar and the offshore field Safaniya
have totally 47 and 32 billion bbl remaining recoverable reserves respectively
while Saudi Arabia has still 208.7 billion bbl crude oil to be produced.
➢ The mature oil fields of the kingdom, Ain Dar/Shedgum, Uthmaniyah and
Abqaiq are close to depletion.
➢ Production trend shows that unless production is not enhanced, total crude oil
production volume could decrease to 9.1 MMbpd by 2030 and 5.65 MMbpd
by 2048.
➢ Saudi Arabia has a few options to increase the total crude oil production. First
is to focus on oil exploration which will be expected to cost $24.34 billion for
the next 30 years. Possible outcome is 16.16 billion bbl production increase
with a $1.47/bbl investment. This would protect the production over 10
MMbpd limit until 2043.
➢ Second option is to develop the existing fields. If the target is to reach 15
MMbpd, this is the only possible scenario. Production could reach 15 MMbpd
by 2023 with $48.10 billion investment starting from now until 2023. To keep
the production in this level another $24.01 billion field development is
necessary by 2033. This scenario would keep the production over 10.0 MMbpd
by 2048 with a $1.50/bbl extra production cost.
➢ If the aim is to keep 15 MMbpd production till 2040 and 12.5 MMbpd to 2048,
the total expenditure of $96.35 billion is necessary for exploration and
development costs. This investment would add $1.49/bbl to current costs.

62
➢ As a substitute, Iraq could be a perfect replacement for Saudi Arabia if regional
peace is constituted. UAE is another substitute which is behind Iraq.
➢ Iran needs field development to increase its production and exports. Also, if
the sanctions are lifted, the country would be a great substitute as Iraq.
➢ Russia needs to increase its export capacity on the ports in the east as well as
Novorossiysk to get involved more in Asian markets.
➢ Kuwait is another country which needs to influence more in Asian markets.

63
REFERENCES
Al-Hajeri, M. M., Saeed, M. Al, Derks, J., Fuchs, T., Hantschel, T., Kauerauf, A., …
Peters, K. (2010). Basin and Petroleum System Modeling. Oilfield Review, 21(2),
14–29. Retrieved from
https://www.slb.com/~/media/Files/resources/oilfield_review/ors09/sum09/basi
n_petroleum.pdf
Al-Somali, A. A., Al-khanafair, N., Pomeroy, P., Al-Towailib, A., & Al-Shammari,
A. (2009). Application Of Artificial Lift Technology In The Giant Khurais Field.
Offshore Technology Conference. https://doi.org/10.4043/20133-ms
Aleklett, K., Höök, M., Jakobsson, K., Lardelli, M., Snowden, S., & Söderbergh, B.
(2010). The Peak of the Oil Age–analyzing the world oil production reference
Scenario in World Energy Outlook 2008. Energy Policy, 38(3), 1398–1414.
Retrieved from https://doi.org/10.1016/j.enpol.2009.11.021
Ali, M. F., Hasan, M. U., & Saleem, M. (1981). Distribution of Sulfur Compounds in
Arab Crudes. Middle East Technical Conference and Exhibition, 51–53.
https://doi.org/9583-MS
Aljubran, M., Alsalman, M. A., & Ghazal, M. A. (2017). The Role of Drilling Azimuth
on Wellbore Geomechanical Instability in A Major Offshore Field. SPE Kingdom
of Saudi Arabia Annual Technical Symposium and Exhibition.
https://doi.org/10.2118/188095-MS
Baqi, M. M. A., & Saleri, N. G. (2004). Fifty-Year Crude Oil Supply Scenarios : Saudi
Aramco’s Perspective. Washington D.C., USA. Retrieved from https://csis-
prod.s3.amazonaws.com/s3fs-
public/legacy_files/files/attachments/040224_baqiandsaleri.pdf
Berument, H., Buyukdogan, B., Coskun, B. S., & Ugurlu, G. (2018). Indian Growth
and Turkish Straits. Retrieved February 26, 2019, from http://econ318-
ksg.bilkent.edu.tr/
BP. (2019). BP Energy Outlook:2019 Edition. London, United Kingdom.
Campbell, C. J. (2013). Campbell’s Atlas of Oil and Gas Depletion (Second Edi).
Balldehob, Ireland: Springer. https://doi.org/10.1007/978-1-4614-3576-1
Deborah, G. (2012). Understanding Unconventional Oil. The Carnegie Papers.
Retrieved from https://carnegieendowment.org/files/unconventional_oil.pdf
Energy Intelligence Group. (2007). The Crude Oils and Their Key Characteristics.
Retrieved from https://www.psa-bv.nl/files/CrudeOils.pdf
Fitch Solutions. (2018). BMI’s Upstream Oil & Gas Risk/Reward Index. Retrieved

64
February 24, 2019, from https://infogram.com/bmis-upstream-oil-and-gas-
riskreward-index-1ge9m8n7x53omy6
Höök, M. (2008). Depletion and Decline Curve Analysis in Crude Oil Production.
Uppsala University. Retrieved from http://www.diva-
portal.org/smash/get/diva2%3A338111/FULLTEXT01.pdfTh
Jaffe, A. M., & Elass, J. (2007). Saudi Aramco: National Flagship with Global
Responsibilities. Retrieved from
https://www.bakerinstitute.org/media/files/page/9f100176/noc_saudiaramco_jaf
fe_elass_revised.pdf
JODI. (2019). Jodi Oil Database. Retrieved February 24, 2019, from
http://www.jodidb.org/ReportFolders/reportFolders.aspx?sCS_referer=&sCS_C
hosenLang=en
Maggio, G., & Cacciola, G. (2009). A variant of the Hubbert curve for world oil
production forecasts. Energy Policy, 37, 4761–4770.
https://doi.org/10.1016/j.enpol.2009.06.053
Martini, J., Wasser, B., Kaye, D. D., Egel, D., & Ogletree, C. (2016). The Outlook for
Arab Gulf Cooperation. RAND Corporation. Retrieved from
https://www.rand.org/pubs/research_reports/RR1429.html
McKetta Jr, J. J. (1990). Encyclopedia of Chemical Processing and Design: Volume
35 - Petroleum Fractions Properties to Phosphoric Acid Plants: Alloy Selection.
CRC Press.
McMurray, S. (2011). Energy to the World: The Story of Saudi Aramco. Texas, USA.
Retrieved from
http://www.saudiaramco.com.sa/content/dam/Publications/Energy to the World
- English/Energy-to-the-World-Vol.-1-English.pdf
Mearns, E. (2007). Ghawar reserves update and revisions (1). Retrieved February 24,
2019, from http://theoildrum.com.s3-website.us-east-
2.amazonaws.com/node/2507
OECD. (2018). List of OECD Member countries - Ratification of the Convention on
the OECD. Retrieved February 25, 2019, from
http://www.oecd.org/about/membersandpartners/list-oecd-member-
countries.htm
OPEC. (2019a). Monthly Oil Market Report: June 2019. Vienna, Austria. Retrieved
from
https://www.opec.org/opec_web/static_files_project/media/downloads/publicati
ons/MOMR February 2019.pdf
OPEC. (2019b). OPEC Basket Price. Retrieved February 25, 2019, from
https://www.opec.org/opec_web/en/data_graphs/40.htm

65
OPEC. (2019c). The Organization of the Petroleum Exporting Countries, 108.
https://doi.org/10.1080/08963560802362609
Platts, M. H. F. (2016). FAQ : DUBAI CRUDE FAQ : DUBAI CRUDE. Retrieved
from https://www.spglobal.com/platts/plattscontent/_assets/_files/en/our-
methodology/methodology-specifications/dubai-crude-faq.pdf
Powers, L. W. (2012). The World Energy Dilemma. Tulsa, Oklahoma: PennWell
Corporation.
Robelius, F. (2007). Giant Oil Fields - The Highway to Oil : Giant Oil Fields and their
Importance for Future Oil Production. Uppsala University. Retrieved from
http://uu.diva-portal.org/smash/record.jsf?pid=diva2:169774
Rystad Energy. (2017). All-time low for discovered resources in 2017: Around 7
billion barrels of oil equivalent was discovered. Retrieved February 25, 2019,
from https://www.rystadenergy.com/newsevents/news/press-releases/all-time-
low-discovered-resources-2017
Rystad Energy. (2018). The Oil & Gas Exploration Winners of 2018. Retrieved
February 25, 2019, from https://www.rystadenergy.com/newsevents/news/press-
releases/oil-gas-exploration-winners-2018/
Rystad Energy. (2019). UCube. Oslo, Norway. Retrieved from
https://www.rystadenergy.com/products/EnP-Solutions/ucube/
Saudi Aramco. (2017). Saudi Aramco annual review 2016. Retrieved from
https://www.saudiaramco.com/content/saudi-aramco/en/home/news-
media/publications/corporate-reports/2016-annual-review.html
Schlumberger. (2019). The Oilfield Glossary: Where the Oil Field Meets the
Dictionary. Retrieved February 25, 2019, from
https://www.glossary.oilfield.slb.com/
Seba, R. D. (2016). Economics of Worldwide Petroleum Production (Revised Ed). Oil
& Gas Consultants International.
Simmons, M. R. (2005). Twilight in the Desert: The Coming Saudi Oil Shock and the
World Economy. Hoboken, New Jersey: John Wiley & Sons, Inc.
SPE. (2001). Guidelines for the Evaluation of Petroleum Reserves and Resources: A
Supplement to the SPE/WPC Petroleum Reserves Definiyions and the
SPE/WPC/AAPG Petroleum Resources Definitions. Society of Petroleum
Engineers. Retrieved from https://www.spe.org/industry/docs/Guidelines-
Evaluation-Reserves-Resources-2001.pdf
Speight, J. G. (2011). An Introduction to Petroleum Technology, Economics, and
Politics. An Introduction to Petroleum Technology, Economics, and Politics.
Hoboken, New Jersey: Scrivener & Wiley.

66
https://doi.org/10.1002/9781118192528
The Wall Street Journal. (2016). Barrel Breakdown. Retrieved March 2, 2019, from
http://graphics.wsj.com/oil-barrel-breakdown/
Whitley, S., & Shakuntala, M. (2014). Fossil fuel exploration subsidies: Saudi Arabia.
Washington, USA. Retrieved from http://www.odi.org/sites/odi.org.uk/files/odi-
assets/publications-opinion-files/9264.pdf
World Bank. (2019). Country Data: Saudi Arabia. Retrieved February 26, 2019, from
https://data.worldbank.org/country/saudi-arabia
Xia, G., Bilak, R., Marika, E., Al-Shehri, H. A., & Al-Qahtani, F. Y. (2014).
Performance Assessment of Cuttings Re-Injection (CRI) Operations at the
Manifa OilField, KSA. International Society of Rock Mechanics and Rock
Engineering. https://doi.org/ISRM-SBMR-2014-032
Yergin, D. (1990). The Prize: The Epic Quest for Oil, Money and Power. New York,
New York: Simon & Schuster.
Zubail, M. A., Aramco, S., Bialy, M. El, Maghrabi, S., & Olivares, T. (2012).
Improved Producibility after Delayed Filter Cake Breaker Treatment in the
Safaniya Offshore Field in Saudi Arabia. SPE Kuwait International Petroleum
Conference and Exhibition, 10-12 December, Kuwait City, Kuwait.
https://doi.org/10.2118/163357-MS

67
9. APPENDICES
10. A.WORLD FACTS
Table A.1. 1967-1975 Crude Oil Production, Mbpd
1967 1968 1969 1970 1971 1972 1973 1974 1975
S. Arabia 2,805 3,043 3,216 3,799 4,769 6,016 7,596 8,480 7,075
M. East 10,055 11,275 12,461 13,779 16,164 17,942 21,053 21,705 19,438
OPEC 16,353 18,197 20,204 22,643 24,544 26,153 29,802 29,523 26,011
World 35,377 38,351 41,680 45,198 47,901 50,396 55,033 55,416 52,749
Table A.2. 1976-1984 Crude Oil Production, Mbpd
1976 1977 1978 1979 1980 1981 1982 1983 1984
S. Arabia 8,577 9,200 8,301 9,533 9,901 9,808 6,483 4,539 4,079
M. East 22,047 22,223 21,123 21,569 18,345 15,556 12,930 11,150 10,518
OPEC 29,369 29,745 28,336 29,475 25,454 21,079 17,889 15,941 15,273
World 57,191 59,581 59,954 62,464 59,395 55,676 53,285 52,118 52,698
Table A.3. 1985-1992 Crude Oil Production, Mbpd
1985 1986 1987 1988 1989 1990 1991 1992
S. Arabia 3,175 4,784 3,975 5,100 5,065 6,413 8,118 8,332
M. East 9,725 12,103 11,920 14,150 15,134 16,077 15,892 17,563
OPEC 14,423 17,107 16,276 18,590 20,111 21,756 21,901 23,659
World 52,285 55,111 54,635 56,910 57,804 59,106 58,702 59,323

68
Table A.4. 1993-2001 Crude Oil Production, Mbpd
Country 1993 1994 1995 1996 1997 1998 1999 2000 2001
US 6,847 6,662 6,560 6,465 6,452 6,252 5,881 5,822 5,801
Russia 6,911 6,184 6,034 5,862 5,956 5,886 5,906 6,246 6,727
S. Arabia 8,048 8,049 8,023 8,102 8,012 8,280 7,565 8,095 7,889
Iraq 659 749 737 740 1,384 2,181 2,720 2,810 2,594
China 2,924 2,942 2,996 3,173 3,254 3,207 3,212 3,228 3,297
Canada 1,296 1,351 1,380 1,401 1,414 1,428 1,346 1,392 1,377
UAE 2,159 2,167 2,148 2,161 2,161 2,244 2,049 2,175 2,115
Kuwait 1,882 2,007 2,007 2,006 2,007 2,052 1,873 1,996 1,947
IR Iran 3,425 3,596 3,595 3,596 3,603 3,714 3,439 3,661 3,572
Brazil 643 668 693 784 842 975 1,098 1,231 1,293
M. East 18,265 18,809 18,856 19,012 19,604 21,116 20,283 21,410 20,777
OPEC 24,060 24,498 24,612 24,877 25,616 27,931 26,369 27,999 27,234
World 59,123 59,861 60,445 61,565 62,932 65,141 63,233 65,825 65,406
Table A.5. 2002-2010 Crude Oil Production, Mbpd
Country 2002 2003 2004 2005 2006 2007 2008 2009 2010
US 5,744 5,649 5,441 5,184 5,086 5,074 4,998 5,349 5,475
Russia 7,402 8,122 8,803 9,045 9,242 9,437 9,356 9,493 9,694
S. Arabia 7,093 8,410 8,897 9,353 9,208 8,816 9,198 8,184 8,166
Iraq 2,126 1,378 2,107 1,853 1,957 2,035 2,281 2,336 2,358
China 3,393 3,407 3,485 3,617 3,674 3,736 3,802 3,795 4,076
Canada 1,446 1,459 1,405 1,360 1,346 1,388 1,349 1,217 1,227
UAE 1,900 2,248 2,344 2,378 2,568 2,529 2,572 2,242 2,324
Kuwait 1,746 2,108 2,289 2,573 2,665 2,575 2,676 2,262 2,312
IR Iran 3,248 3,742 3,834 4,092 4,073 4,031 4,056 3,557 3,544
Brazil 1,454 1,496 1,477 1,634 1,723 1,748 1,812 1,950 2,055
M. East 18,618 20,408 21,981 22,722 22,901 22,362 23,142 20,869 21,031
OPEC 24,932 27,544 30,568 31,812 32,076 31,655 32,598 29,406 29,720
World 64,012 67,192 70,504 71,422 71,517 71,157 71,661 68,753 69,635

69
Table A.6. 2011-2018 Crude Oil Production, Mbpd
Country 2011 2012 2013 2014 2015 2016 2017 2018
US 5,643 6,497 7,466 8,753 9,408 8,857 9,355 11,658
Russia 9,787 9,953 10,047 10,088 10,111 10,292 10,349 10,736
Saudi Arabia 9,311 9,763 9,637 9,713 10,193 10,460 9,959 10,643
Iraq 2,653 2,942 2,980 3,110 3,504 4,648 4,469 4,465
China 4,052 4,074 4,164 4,208 4,289 3,983 3,823 3,770
Canada 1,261 1,309 1,382 1,400 1,263 1,186 1,212 3,520
UAE 2,564 2,653 2,797 2,794 2,989 3,088 2,967 3,223
Kuwait 2,659 2,978 2,925 2,867 2,859 2,954 2,704 2,802
IR Iran 3,576 3,740 3,575 3,117 3,152 3,651 3,867 2,758
Brazil 2,105 2,061 2,024 2,255 2,437 2,510 2,622 2,670
Middle East 23,005 24,107 23,845 23,511 24,494 26,608 25,693
OPEC 30,589 32,896 32,027 31,094 32,024 33,441 32,515
World 70,214 72,677 72,803 73,364 75,095 75,388 74,687


71
11. B.SAUDI ARABIA CRUDE OIL PRODUCTION HISTORY
Table B.1. Ghawar Water Cut
Year Production
Water Cut Daily (Mbpd) Annual (MMbbl) Cumulative (MMbbl)
1993 4,800 1,752 37,557 26%
1994 5,000 1,825 39,382 27%
1995 5,050 1,843 41,225 29%
1996 5,100 1,862 43,087 30%
1997 5,150 1,880 44,967 32%
1998 5,000 1,825 46,792 35%
1999 4,700 1,716 48,507 37%
2000 4,900 1,789 50,296 35%
2001 4,950 1,807 52,102 35%
2002 4,850 1,770 53,873 34%
2003 5,150 1,880 55,752 33%
Table B.2. Abqaiq Water Cut
Year Production
Water Cut Daily (Mbpd) Annual (MMbbl) Cumulative (MMbbl)
1989 525 192 7,981 21%
1990 550 201 8,182 23%
1991 575 210 8,392 20%
1992 600 219 8,611 24%
1993 625 228 8,839 24%
1994 650 237 9,076 24%
1995 635 232 9,308 23%
1996 620 226 9,535 22%
1997 605 221 9,755 30%
1998 590 215 9,971 31%
1999 575 210 10,181 29%
2000 560 204 10,385 30%

72
Table B.2. Continued
2001 545 199 10,584 34%
2002 530 193 10,777 36%
2003 515 188 10,965 38%
2004 500 183 11,148 39%
2005 442 161 11,309 39%
Table B.3. Ghawar Production History
Year
Production Depletion
Rate
RRR
(MMbbl) Ap/cp Daily
(Mbpd)
Annual
(MMbbl)
Cumulative
(MMbbl)
1951 126 46 46 0% 127,154 100%
1952 266 97 143 0% 127,057 68%
1953 405 148 291 0% 126,909 51%
1954 545 199 490 0% 126,710 41%
1955 532 194 684 1% 126,516 28%
1956 519 189 873 1% 126,327 22%
1957 506 185 1,058 1% 126,142 17%
1958 580 212 1,270 1% 125,930 17%
1959 653 238 1,508 1% 125,692 16%
1960 727 265 1,774 1% 125,426 15%
1961 745 272 2,045 2% 125,155 13%
1962 762 278 2,324 2% 124,876 12%
1963 780 285 2,608 2% 124,592 11%
1964 843 308 2,916 2% 124,284 11%
1965 906 331 3,247 3% 123,953 10%
1966 921 336 3,583 3% 123,617 9%
1967 1,090 398 3,981 3% 123,219 10%
1968 1,258 459 4,440 3% 122,760 10%
1969 1,427 521 4,961 4% 122,239 10%
1970 1,500 548 5,508 4% 121,692 10%
1971 2,084 761 6,269 5% 120,931 12%

73
Table B.3. Continued
1972 2,668 974 7,243 6% 119,957 13%
1973 3,841 1,402 8,645 7% 118,555 16%
1974 4,453 1,625 10,270 8% 116,930 16%
1975 4,205 1,535 11,805 9% 115,395 13%
1976 5,189 1,894 13,699 11% 113,501 14%
1977 5,287 1,930 15,629 12% 111,571 12%
1978 5,300 1,935 17,563 14% 109,637 11%
1979 5,431 1,982 19,546 15% 107,654 10%
1980 5,563 2,030 21,576 17% 105,624 9%
1981 5,694 2,078 23,654 19% 103,546 9%
1982 3,300 1,205 24,859 20% 102,341 5%
1983 3,390 1,237 26,096 21% 101,104 5%
1984 3,480 1,270 27,366 22% 99,834 5%
1985 1,100 402 27,768 22% 99,432 1%
1986 3,000 1,095 28,863 23% 98,337 4%
1987 2,100 767 29,629 23% 97,571 3%
1988 3,020 1,102 30,732 24% 96,468 4%
1989 3,100 1,132 31,863 25% 95,337 4%
1990 3,000 1,095 32,958 26% 94,242 3%
1991 3,600 1,314 34,272 27% 92,928 4%
1992 4,200 1,533 35,805 28% 91,395 4%
1993 4,800 1,752 37,557 30% 89,643 5%
1994 5,000 1,825 39,382 31% 87,818 5%
1995 5,050 1,843 41,225 32% 85,975 4%
1996 5,100 1,862 43,087 34% 84,113 4%
1997 5,150 1,880 44,967 35% 82,233 4%
1998 5,000 1,825 46,792 37% 80,408 4%
1999 4,700 1,716 48,507 38% 78,693 4%
2000 4,900 1,789 50,296 40% 76,904 4%
2001 4,950 1,807 52,102 41% 75,098 3%
2002 4,850 1,770 53,873 42% 73,327 3%
2003 5,150 1,880 55,752 44% 71,448 3%

74
Table B.3. Continued
2004 5,772 2,107 57,859 45% 69,341 4%
2005 5,400 1,971 59,830 47% 67,370 3%
2006 5,292 1,932 61,762 49% 65,438 3%
2007 4,936 1,802 63,563 50% 63,637 3%
2008 4,838 1,766 65,329 51% 61,871 3%
2009 3,934 1,436 66,765 52% 60,435 2%
2010 3,870 1,412 68,178 54% 59,022 2%
2011 4,384 1,600 69,778 55% 57,422 2%
2012 4,562 1,665 71,443 56% 55,757 2%
2013 4,142 1,512 72,955 57% 54,245 2%
2014 4,162 1,519 74,474 59% 52,726 2%
2015 4,199 1,533 76,007 60% 51,193 2%
2016 3,860 1,409 77,415 61% 49,785 2%
2017 3,679 1,343 78,758 62% 48,442 2%
2018 3,801 1,387 80,145 63% 47,055 2%
Table B.4. Ain Dar/Shedgum Production History
Year
Production Depletion
Rate
RRR
(MMbbl) Ap/cp Daily
(Mbpd)
Annual
(MMbbl)
Cumulative
(MMbbl)
1951 100 37 37 0% 47,964 100%
1952 200 73 110 0% 47,891 67%
1953 300 110 219 0% 47,781 50%
1954 400 146 365 1% 47,635 40%
1955 450 164 529 1% 47,471 31%
1956 450 164 694 1% 47,307 24%
1957 450 164 858 2% 47,142 19%
1958 450 164 1,022 2% 46,978 16%
1959 450 164 1,186 2% 46,814 14%
1960 450 164 1,351 3% 46,650 12%
1961 450 164 1,515 3% 46,485 11%
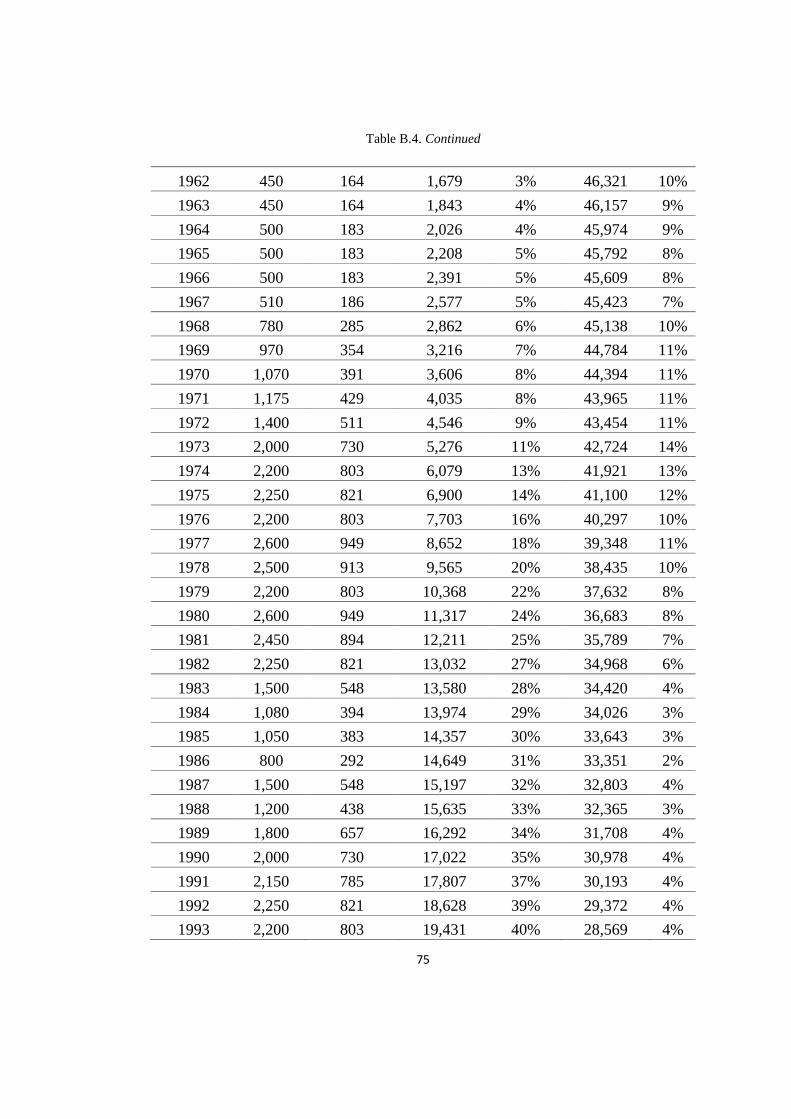
75
Table B.4. Continued
1962 450 164 1,679 3% 46,321 10%
1963 450 164 1,843 4% 46,157 9%
1964 500 183 2,026 4% 45,974 9%
1965 500 183 2,208 5% 45,792 8%
1966 500 183 2,391 5% 45,609 8%
1967 510 186 2,577 5% 45,423 7%
1968 780 285 2,862 6% 45,138 10%
1969 970 354 3,216 7% 44,784 11%
1970 1,070 391 3,606 8% 44,394 11%
1971 1,175 429 4,035 8% 43,965 11%
1972 1,400 511 4,546 9% 43,454 11%
1973 2,000 730 5,276 11% 42,724 14%
1974 2,200 803 6,079 13% 41,921 13%
1975 2,250 821 6,900 14% 41,100 12%
1976 2,200 803 7,703 16% 40,297 10%
1977 2,600 949 8,652 18% 39,348 11%
1978 2,500 913 9,565 20% 38,435 10%
1979 2,200 803 10,368 22% 37,632 8%
1980 2,600 949 11,317 24% 36,683 8%
1981 2,450 894 12,211 25% 35,789 7%
1982 2,250 821 13,032 27% 34,968 6%
1983 1,500 548 13,580 28% 34,420 4%
1984 1,080 394 13,974 29% 34,026 3%
1985 1,050 383 14,357 30% 33,643 3%
1986 800 292 14,649 31% 33,351 2%
1987 1,500 548 15,197 32% 32,803 4%
1988 1,200 438 15,635 33% 32,365 3%
1989 1,800 657 16,292 34% 31,708 4%
1990 2,000 730 17,022 35% 30,978 4%
1991 2,150 785 17,807 37% 30,193 4%
1992 2,250 821 18,628 39% 29,372 4%
1993 2,200 803 19,431 40% 28,569 4%

76
Table B.4. Continued
1994 2,150 785 20,216 42% 27,784 4%
1995 2,200 803 21,019 44% 26,981 4%
1996 2,150 785 21,803 45% 26,197 4%
1997 2,050 748 22,552 47% 25,448 3%
1998 1,980 723 23,274 48% 24,726 3%
1999 1,900 694 23,968 50% 24,032 3%
2000 1,950 712 24,679 51% 23,321 3%
2001 2,000 730 25,409 53% 22,591 3%
2002 1,950 712 26,121 54% 21,879 3%
2003 2,000 730 26,851 56% 21,149 3%
2004 1,956 714 27,565 57% 20,435 3%
2005 2,000 730 28,295 59% 19,705 3%
2006 1,960 715 29,011 60% 18,989 2%
2007 1,998 729 29,740 62% 18,260 2%
2008 1,958 715 30,454 63% 17,546 2%
2009 1,592 581 31,035 65% 16,965 2%
2010 1,566 572 31,607 66% 16,393 2%
2011 1,774 648 32,254 67% 15,746 2%
2012 1,846 674 32,928 69% 15,072 2%
2013 1,676 612 33,540 70% 14,460 2%
2014 1,684 615 34,155 71% 13,845 2%
2015 1,699 620 34,775 72% 13,225 2%
2016 1,544 563 35,339 74% 12,661 2%
2017 1,472 537 35,876 75% 12,124 1%
2018 1,520 555 36,431 76% 11,569 2%

77
Table B.5. Uthmaniyah Production History
Year
Production Depletion
Rate
RRR
(MMbbl) Ap/cp Daily
(Mbpd)
Annual
(MMbbl)
Cumulative
(MMbbl)
2004 0 27,300 61% 17,700
2005 2,200 803 28,103 62% 16,897 3%
2006 2,156 787 28,890 64% 16,110 3%
2007 1,498 547 29,437 65% 15,563 2%
2008 1,468 536 29,973 67% 15,027 2%
2009 1,194 436 30,409 68% 14,591 1%
2010 1,175 429 30,837 69% 14,163 1%
2011 1,331 486 31,323 70% 13,677 2%
2012 1,384 505 31,828 71% 13,172 2%
2013 1,257 459 32,287 72% 12,713 1%
2014 1,263 461 32,748 73% 12,252 1%
2015 1,274 465 33,213 74% 11,787 1%
2016 1,158 423 33,636 75% 11,364 1%
2017 1,104 403 34,039 76% 10,961 1%
2018 1,140 416 34,455 77% 10,545 1%

78
Table B.6. Hawiyah Production History
Year
Production Depletion
Rate
RRR
(MMbbl) Daily
(Mbpd)
Annual
(MMbbl)
Cumulative
(MMbbl)
2004 0 3,000 19% 13,200
2005 600 219 3,219 20% 12,981
2006 588 215 3,434 21% 12,766
2007 576 210 3,644 22% 12,556
2008 565 206 3,850 24% 12,350
2009 459 168 4,018 25% 12,182
2010 452 165 4,183 26% 12,017
2011 512 187 4,369 27% 11,831
2012 532 194 4,564 28% 11,636
2013 484 176 4,740 29% 11,460
2014 486 177 4,918 30% 11,282
2015 490 179 5,096 31% 11,104
2016 463 169 5,266 33% 10,934
2017 441 161 5,427 33% 10,773
2018 456 166 5,593 35% 10,607

79
Table B.7. Haradh Production History
Year
Production Depletion
Rate
RRR
(MMbbl) Daily
(Mbpd)
Annual
(MMbbl)
Cumulative
(MMbbl)
1995 0 0 0 0% 18,000
1996 300 110 110 1% 17,891
1997 300 110 219 1% 17,781
1998 300 110 329 2% 17,672
1999 300 110 438 2% 17,562
2000 300 110 548 3% 17,453
2001 300 110 657 4% 17,343
2002 300 110 767 4% 17,234
2003 600 219 986 5% 17,015
2004 600 219 1,205 7% 16,796
2005 600 219 1,424 8% 16,577
2006 588 215 1,638 9% 16,362
2007 864 315 1,954 11% 16,046
2008 847 309 2,263 13% 15,737
2009 689 251 2,514 14% 15,486
2010 678 247 2,762 15% 15,238
2011 768 280 3,042 17% 14,958
2012 799 292 3,333 19% 14,667
2013 725 265 3,598 20% 14,402
2014 729 266 3,864 21% 14,136
2015 735 268 4,132 23% 13,868
2016 695 254 4,386 24% 13,614
2017 662 242 4,628 26% 13,372
2018 684 250 4,877 27% 13,123

80
Table B.8. Abqaiq Production History
Year
Production Depletion
Rate
RRR
(MMbbl) Ap/cp Daily
(Mbpd)
Annual
(MMbbl)
Cumulative
(MMbbl)
1951 438 160 561 3% 16,189 28%
1952 398 145 707 4% 16,043 21%
1953 359 131 838 5% 15,912 16%
1954 319 116 954 6% 15,796 12%
1955 311 114 1,068 6% 15,682 11%
1956 303 111 1,178 7% 15,572 9%
1957 295 108 1,286 8% 15,464 8%
1958 285 104 1,390 8% 15,360 7%
1959 276 101 1,491 9% 15,259 7%
1960 266 97 1,588 9% 15,162 6%
1961 343 125 1,713 10% 15,037 7%
1962 361 132 1,845 11% 14,905 7%
1963 380 139 1,984 12% 14,766 7%
1964 417 152 2,136 13% 14,614 7%
1965 453 165 2,301 14% 14,449 7%
1966 490 179 2,480 15% 14,270 7%
1967 516 188 2,668 16% 14,082 7%
1968 542 198 2,866 17% 13,884 7%
1969 568 207 3,073 18% 13,677 7%
1970 689 251 3,325 20% 13,425 8%
1971 810 296 3,621 22% 13,129 8%
1972 931 340 3,960 24% 12,790 9%
1973 1,094 399 4,360 26% 12,390 9%
1974 870 318 4,677 28% 12,073 7%
1975 762 278 4,955 30% 11,795 6%
1976 825 301 5,257 31% 11,493 6%
1977 856 312 5,569 33% 11,181 6%
1978 738 269 5,838 35% 10,912 5%
1979 709 259 6,097 36% 10,653 4%

81
Table B.8. Continued
1980 681 248 6,346 38% 10,404 4%
1981 652 238 6,584 39% 10,166 4%
1982 568 207 6,791 41% 9,959 3%
1983 484 177 6,968 42% 9,782 3%
1984 400 146 7,114 42% 9,636 2%
1985 425 155 7,269 43% 9,481 2%
1986 450 164 7,434 44% 9,316 2%
1987 475 173 7,607 45% 9,143 2%
1988 500 183 7,790 47% 8,960 2%
1989 525 192 7,981 48% 8,769 2%
1990 550 201 8,182 49% 8,568 2%
1991 575 210 8,392 50% 8,358 3%
1992 600 219 8,611 51% 8,139 3%
1993 625 228 8,839 53% 7,911 3%
1994 650 237 9,076 54% 7,674 3%
1995 635 232 9,308 56% 7,442 2%
1996 620 226 9,535 57% 7,215 2%
1997 605 221 9,755 58% 6,995 2%
1998 590 215 9,971 60% 6,779 2%
1999 575 210 10,181 61% 6,569 2%
2000 560 204 10,385 62% 6,365 2%
2001 545 199 10,584 63% 6,166 2%
2002 530 193 10,777 64% 5,973 2%
2003 515 188 10,965 65% 5,785 2%
2004 500 183 11,148 67% 5,602 2%
2005 442 161 11,309 68% 5,441 1%
2006 384 140 11,449 68% 5,301 1%
2007 325 119 11,568 69% 5,182 1%
2008 267 97 11,665 70% 5,085 1%
2009 191 70 11,735 70% 5,015 1%
2010 151 55 11,790 70% 4,960 0%
2011 256 93 11,883 71% 4,867 1%

82
Table B.8. Continued
2012 355 130 12,013 72% 4,737 1%
2013 343 125 12,138 72% 4,612 1%
2014 364 133 12,271 73% 4,479 1%
2015 388 142 12,413 74% 4,337 1%
2016 386 141 12,554 75% 4,196 1%
2017 368 134 12,688 76% 4,062 1%
2018 380 139 12,827 77% 3,923 1%
Table B.9. Safaniya Production History
Year
Production Depletion
Rate
RRR
(MMbbl) Ap/cp Daily
(Mbpd)
Annual
(MMbbl)
Cumulative
(MMbbl)
1951 438 160 561 3% 16,189 28%
1957 27 10 10 0% 48,990 100%
1958 76 28 38 0% 48,962 74%
1959 125 46 83 0% 48,917 55%
1960 174 64 147 0% 48,853 43%
1961 212 78 224 0% 48,776 35%
1962 251 91 316 1% 48,684 29%
1963 289 105 421 1% 48,579 25%
1964 389 142 563 1% 48,437 25%
1965 488 178 741 2% 48,259 24%
1966 588 215 956 2% 48,044 22%
1967 528 193 1,149 2% 47,851 17%
1968 467 171 1,319 3% 47,681 13%
1969 407 149 1,468 3% 47,532 10%
1970 574 210 1,677 3% 47,323 12%
1971 742 271 1,948 4% 47,052 14%
1972 909 332 2,280 5% 46,720 15%
1973 962 351 2,631 5% 46,369 13%
1974 1,019 372 3,003 6% 45,997 12%

83
Table B.9. Continued
1975 827 302 3,305 7% 45,695 9%
1976 621 227 3,531 7% 45,469 6%
1977 1,435 524 4,055 8% 44,945 13%
1978 1,221 446 4,501 9% 44,499 10%
1979 1,329 485 4,986 10% 44,014 10%
1980 1,436 524 5,510 11% 43,490 10%
1981 1,544 564 6,074 12% 42,926 9%
1982 750 274 6,347 13% 42,653 4%
1983 750 274 6,621 14% 42,379 4%
1984 750 274 6,895 14% 42,105 4%
1985 750 274 7,169 15% 41,831 4%
1986 750 274 7,442 15% 41,558 4%
1987 750 274 7,716 16% 41,284 4%
1988 750 274 7,990 16% 41,010 3%
1989 750 274 8,264 17% 40,736 3%
1990 750 274 8,537 17% 40,463 3%
1991 750 274 8,811 18% 40,189 3%
1992 750 274 9,085 19% 39,915 3%
1993 750 274 9,359 19% 39,641 3%
1994 960 350 9,709 20% 39,291 4%
1995 883 322 10,031 20% 38,969 3%
1996 807 294 10,326 21% 38,674 3%
1997 730 266 10,592 22% 38,408 3%
1998 653 238 10,831 22% 38,169 2%
1999 577 210 11,041 23% 37,959 2%
2000 500 183 11,224 23% 37,776 2%
2001 525 192 11,415 23% 37,585 2%
2002 550 201 11,616 24% 37,384 2%
2003 575 210 11,826 24% 37,174 2%
2004 600 219 12,045 25% 36,955 2%
2005 651 237 12,282 25% 36,718 2%
2006 701 256 12,538 26% 36,462 2%

84
Table B.9. Continued
2007 752 274 12,813 26% 36,187 2%
2008 802 293 13,106 27% 35,894 2%
2009 842 307 13,413 27% 35,587 2%
2010 903 330 13,743 28% 35,257 2%
2011 1,024 374 14,116 29% 34,884 3%
2012 1,065 389 14,505 30% 34,495 3%
2013 967 353 14,858 30% 34,142 2%
2014 972 355 15,213 31% 33,787 2%
2015 980 358 15,570 32% 33,430 2%
2016 926 338 15,909 32% 33,091 2%
2017 883 322 16,231 33% 32,769 2%
2018 912 333 16,564 34% 32,436 2%
Table B.10. Abu Sa’fah Production History
Year
Production Depletion
Rate
RRR
(MMbbl) Ap/cp Daily
(Mbpd)
Annual
(MMbbl)
Cumulative
(MMbbl)
1973 109 40 140 2% 7,660 28%
1974 121 44 184 2% 7,616 24%
1975 60 22 206 3% 7,594 11%
1976 100 37 242 3% 7,558 15%
1977 130 47 290 4% 7,510 16%
1978 135 49 339 4% 7,461 15%
1979 139 51 390 5% 7,410 13%
1980 131 48 438 6% 7,362 11%
1981 123 45 482 6% 7,318 9%
1982 115 42 524 7% 7,276 8%
1983 109 40 564 7% 7,236 7%
1984 102 37 601 8% 7,199 6%
1985 96 35 636 8% 7,164 6%
1986 90 33 669 9% 7,131 5%

85
Table B.10. Continued
1987 85 31 700 9% 7,100 4%
1988 80 29 729 9% 7,071 4%
1989 75 27 757 10% 7,043 4%
1990 70 26 782 10% 7,018 3%
1991 66 24 806 10% 6,994 3%
1992 62 23 829 11% 6,971 3%
1993 58 21 850 11% 6,950 3%
1994 150 55 905 12% 6,895 6%
1995 165 60 965 12% 6,835 6%
1996 180 66 1,031 13% 6,769 6%
1997 195 71 1,102 14% 6,698 6%
1998 210 77 1,179 15% 6,621 7%
1999 225 82 1,261 16% 6,539 7%
2000 240 88 1,349 17% 6,451 6%
2001 255 93 1,442 18% 6,358 6%
2002 270 99 1,540 20% 6,260 6%
2003 285 104 1,644 21% 6,156 6%
2004 300 110 1,754 22% 6,046 6%
2005 300 110 1,863 24% 5,937 6%
2006 300 110 1,973 25% 5,827 6%
2007 300 110 2,082 27% 5,718 5%
2008 300 110 2,192 28% 5,608 5%
2009 230 84 2,276 29% 5,524 4%
2010 226 82 2,358 30% 5,442 3%
2011 256 93 2,451 31% 5,349 4%
2012 266 97 2,549 33% 5,251 4%
2013 242 88 2,637 34% 5,163 3%
2014 243 89 2,726 35% 5,074 3%
2015 245 89 2,815 36% 4,985 3%
2016 232 85 2,899 37% 4,901 3%
2017 221 81 2,980 38% 4,820 3%
2018 228 83 3,063 39% 4,737 3%

86
Table B.11. Berri Production History
Year
Production Depletion
Rate
RRR
(MMbbl) Ap/cp Daily
(Mbpd)
Annual
(MMbbl)
Cumulative
(MMbbl)
1969 19 7 7 0% 10,793
1970 100 37 43 0% 10,757
1971 155 57 100 1% 10,700
1972 313 114 214 2% 10,586
1973 622 227 441 4% 10,359 51%
1974 637 233 674 6% 10,126 35%
1975 334 122 796 7% 10,004 15%
1976 807 295 1,090 10% 9,710 27%
1977 787 287 1,378 13% 9,422 21%
1978 586 214 1,591 15% 9,209 13%
1979 563 205 1,797 17% 9,003 11%
1980 540 197 1,994 18% 8,806 10%
1981 504 184 2,178 20% 8,622 8%
1982-1992 0 0 2,178 20% 8,622 0%
1993 420 153 2,331 22% 8,469 7%
1994 400 146 2,477 23% 8,323 6%
1995 381 139 2,616 24% 8,184 5%
1996 362 132 2,749 25% 8,051 5%
1997 344 125 2,874 27% 7,926 4%
1998 325 119 2,992 28% 7,808 4%
1999 306 112 3,104 29% 7,696 4%
2000 287 105 3,209 30% 7,591 3%
2001 268 98 3,307 31% 7,493 3%
2002 250 91 3,398 31% 7,402 3%
2003 231 84 3,482 32% 7,318 2%
2004 212 77 3,560 33% 7,240 2%
2005 214 78 3,638 34% 7,162 2%
2006 215 79 3,716 34% 7,084 2%
2007 217 79 3,795 35% 7,005 2%

87
Table B.11. Continued
2008 219 80 3,875 36% 6,925 2%
2009 190 69 3,945 37% 6,855 2%
2010 193 70 4,015 37% 6,785 2%
2011 225 82 4,097 38% 6,703 2%
2012 240 88 4,185 39% 6,615 2%
2013 224 82 4,266 40% 6,534 2%
2014 231 84 4,351 40% 6,449 2%
2015 239 87 4,438 41% 6,362 2%
2016 232 85 4,523 42% 6,277 2%
2017 221 81 4,603 43% 6,197 2%
2018 228 83 4,686 43% 6,114 2%
Table B.12. Khurais Production History
Year
Production Depletion
Rate
RRR
(MMbbl) Daily
(Mbpd)
Annual
(MMbbl)
Cumulative
(MMbbl)
1970-1979 26 9 95 0% 22,705
1980 68 25 120 1% 22,680
1981 144 53 172 1% 22,628
1982 122 45 217 1% 22,583
1983 104 38 255 1% 22,545
1984 88 32 287 1% 22,513
1985 75 27 315 1% 22,485
1986 64 23 338 1% 22,462
1987 54 20 358 2% 22,442
1988 46 17 375 2% 22,425
1989 39 14 389 2% 22,411
1990 33 12 401 2% 22,399
1991 28 10 411 2% 22,389
1992 24 9 420 2% 22,380
1993-2008 0 0 420 2% 22,380

88
Table B.12. Continued
2009 918 335 756 3% 22,044
2010 903 330 1,085 5% 21,715
2011 1,024 374 1,459 6% 21,341
2012 1,065 389 1,848 8% 20,952
2013 967 353 2,201 10% 20,599
2014 972 355 2,555 11% 20,245
2015 980 358 2,913 13% 19,887
2016 926 338 3,251 14% 19,549
2017 883 322 3,573 16% 19,227
2018 912 333 3,906 17% 18,894
Table B.13. Khursaniyah Production History
Year
Production Depletion
Rate
RRR
(MMbbl) Daily
(Mbpd)
Annual
(MMbbl)
Cumulative
(MMbbl)
2003 82 30 1,860 26% 5,280
2004 78 28 1,888 26% 5,252
2005 74 27 1,915 27% 5,225
2006 70 26 1,941 27% 5,199
2007 67 24 1,966 28% 5,174
2008 63 23 1,989 28% 5,151
2009 403 147 2,136 30% 5,004
2010 396 145 2,280 32% 4,860
2011 449 164 2,444 34% 4,696
2012 467 170 2,614 37% 4,526
2013 424 155 2,769 39% 4,371
2014 426 155 2,925 41% 4,215
2015 430 157 3,081 43% 4,059
2016 406 148 3,230 45% 3,910
2017 387 141 3,371 47% 3,769
2018 400 146 3,517 49% 3,623

89
Table B.14. Manifa Production History
Year
Production Depletion
Rate
RRR
(MMbbl) Daily
(Mbpd)
Annual
(MMbbl)
Cumulative
(MMbbl)
1964 40 15 15 0% 16,985
1965 77 28 43 0% 16,957
1966 113 41 84 0% 16,916
1967 48 18 101 1% 16,899
1968 57 21 122 1% 16,878
1969 66 24 146 1% 16,854
1970 76 28 174 1% 16,826
1971 85 31 205 1% 16,795
1972 94 34 239 1% 16,761
1973 103 38 277 2% 16,723
1974 112 41 318 2% 16,682
1975 122 44 362 2% 16,638
1976 131 48 410 2% 16,590
1977 140 51 461 3% 16,539
1978 134 49 510 3% 16,490
1979 129 47 557 3% 16,443
1980 123 45 602 4% 16,398
1981 118 43 645 4% 16,355
1982 114 41 687 4% 16,313
1983 109 40 727 4% 16,273
1984-2012 0 727 4% 16,273
2013 403 147 874 5% 16,126
2014 405 148 1,022 6% 15,978
2015 735 268 1,290 8% 15,710
2016 695 254 1,543 9% 15,457
2017 662 242 1,785 11% 15,215
2018 684 250 2,035 12% 14,965

90
Table B.15. Marjan Production History
Year
Production Depletion
Rate RRR (MMbbl) Daily
(Mbpd)
Annual
(MMbbl)
Cumulative
(MMbbl)
1969 19 7 7 0% 10,793
1970 100 37 43 0% 10,757
1971 155 57 100 1% 10,700
1972 313 114 214 2% 10,586
1973 622 227 441 4% 10,359
1974 637 233 674 6% 10,126
1975 334 122 796 7% 10,004
1976 807 295 1,090 10% 9,710
1977 787 287 1,378 13% 9,422
1978 586 214 1,591 15% 9,209
1979 563 205 1,797 17% 9,003
1980 540 197 1,994 18% 8,806
1981 504 184 2,178 20% 8,622
1982-1992 0 0 2,178 20% 8,622
1993 420 153 2,331 22% 8,469
1994 400 146 2,477 23% 8,323
1995 381 139 2,616 24% 8,184
1996 362 132 2,749 25% 8,051
1997 344 125 2,874 27% 7,926
1998 325 119 2,992 28% 7,808
1999 306 112 3,104 29% 7,696
2000 287 105 3,209 30% 7,591
2001 268 98 3,307 31% 7,493
2002 250 91 3,398 31% 7,402
2003 231 84 3,482 32% 7,318
2004 212 77 3,560 33% 7,240
2005 214 78 3,638 34% 7,162
2006 215 79 3,716 34% 7,084
2007 217 79 3,795 35% 7,005

91
Table B.15. Continued
2008 219 80 3,875 36% 6,925
2009 190 69 3,945 37% 6,855
2010 193 70 4,015 37% 6,785
2011 225 82 4,097 38% 6,703
2012 240 88 4,185 39% 6,615
2013 224 82 4,266 40% 6,534
2014 231 84 4,351 40% 6,449
2015 239 87 4,438 41% 6,362
2016 232 85 4,523 42% 6,277
2017 221 81 4,603 43% 6,197
2018 228 83 4,686 43% 6,114
Table B.16. Qatif Production History
Year
Production Depletion
Rate
RRR
(MMbbl) Daily
(Mbpd)
Annual
(MMbbl)
Cumulative
(MMbbl)
1951-1966 33 12 190 2% 8,210
1967-1978 80 29 540 6% 7,860
1979 150 55 595 7% 7,805
1980 115 42 637 8% 7,763
1981 40 15 652 8% 7,748
1982-2003 0 0 652 8% 7,748
2004 100 37 688 8% 7,712
2005 200 73 761 9% 7,639
2006 300 110 871 10% 7,529
2007 300 110 980 12% 7,420
2008 400 146 1,126 13% 7,274
2009 306 112 1,238 15% 7,162
2010 376 137 1,375 16% 7,025
2011 426 156 1,531 18% 6,869
2012 444 162 1,693 20% 6,707

92
Table B.16. Continued
2013 403 147 1,840 22% 6,560
2014 405 148 1,988 24% 6,412
2015 408 149 2,137 25% 6,263
2016 386 141 2,278 27% 6,122
2017 368 134 2,412 29% 5,988
2018 380 139 2,551 30% 5,849
Table B.17. Shaybah Production History
Year
Production Depletion
Rate
RRR
(MMbbl) Daily
(Mbpd)
Annual
(MMbbl)
Cumulative
(MMbbl)
1979 150 55 595 7% 7,805
1998 210 77 77 0% 19,823
1999 500 183 259 1% 19,641
2000 490 179 438 2% 19,462
2001 510 186 624 3% 19,276
2002 495 181 805 4% 19,095
2003 520 190 995 5% 18,905
2004 492 180 1,174 6% 18,726
2005 560 204 1,379 7% 18,521
2006 560 204 1,583 8% 18,317
2007 560 204 1,787 9% 18,113
2008 560 204 1,992 10% 17,908
2009 582 212 2,204 11% 17,696
2010 572 209 2,413 12% 17,487
2011 648 237 2,650 13% 17,250
2012 674 246 2,896 15% 17,004
2013 613 224 3,119 16% 16,781
2014 615 225 3,344 17% 16,556
2015 621 227 3,571 18% 16,329
2016 772 282 3,852 19% 16,048

93
Table B.17.Continued
2017 736 269 4,121 21% 15,779
2018 760 277 4,398 22% 15,502
Table B.18. Zuluf Production History
Year
Production Depletion
Rate RRR (MMbbl) Daily
(Mbpd)
Annual
(MMbbl)
Cumulative
(MMbbl)
1974 41 15 15 0% 24,685
1975 82 30 45 0% 24,655
1976 102 37 82 0% 24,618
1977 121 44 126 1% 24,574
1978 141 51 178 1% 24,522
1979 313 114 292 1% 24,408
1980 486 177 469 2% 24,231
1981 658 240 710 3% 23,990
1982-1993 400 146 2,462 10% 22,238
1995-2003 400 146 3,958 16% 20,742
2004 407 149 4,107 17% 20,593
2005 450 164 4,271 17% 20,429
2006 450 164 4,435 18% 20,265
2007 450 164 4,599 19% 20,101
2008 450 164 4,764 19% 19,936
2009 344 126 4,889 20% 19,811
2010 339 124 5,013 20% 19,687
2011 384 140 5,153 21% 19,547
2012 399 146 5,299 21% 19,401
2013 363 132 5,431 22% 19,269
2014 364 133 5,564 23% 19,136
2015 368 134 5,698 23% 19,002
2017 500 183 6,073 25% 18,627
2018 517 189 6,261 25% 18,439

94
Table B.19. Others Production History
Year Production
Ratio Model Daily (Mbpd) Annual (MMbbl) Cumulative (MMbbl)
1951 438 160 160
1952 398 145 305
1953 359 131 436
1954 319 116 553
1955 311 114 666
1956 303 111 777
1957 295 108 884
1958 285 104 989
1959 276 101 1,089
1960 266 97 1,186 18% 29%
1961 304 111 1,297 19% 28%
1962 342 125 1,422 20% 28%
1963 380 139 1,561 20% 27%
1964 417 152 1,713 19% 26%
1965 453 165 1,878 19% 25%
1966 490 179 2,057 19% 25%
1967 516 188 2,245 19% 24%
1968 440 161 2,406 15% 23%
1969 568 207 2,613 18% 23%
1970 520 190 2,803 15% 22%
1971 544 199 3,002 12% 22%
1972 931 340 3,342 16% 21%
1973 513 187 3,529 7% 20%
1974 844 308 3,837 10% 20%
1975 762 278 4,115 11% 19%
1976 393 143 4,258 5% 19%
1977 746 272 4,531 8% 18%
1978 738 269 4,800 8% 18%
1979 344 126 4,926 4% 17%
1980 70 135 5,061 4% 17%

95
Table B.19. Continued
1981 652 238 5,299 6% 16%
1982 777 284 5,582 13% 16%
1983 775 283 5,865 13% 15%
1984 772 282 6,147 13% 15%
1985 770 281 6,428 21% 15%
1986 768 280 6,708 14% 14%
1987 765 279 6,987 16% 14%
1988 763 278 7,266 14% 13%
1989 760 278 7,543 13% 13%
1990 758 277 7,820 13% 13%
1991 756 276 8,096 12% 12%
1992 753 275 8,371 11% 12%
1993 751 274 8,645 10% 12%
1994 564 206 8,851 7% 11%
1995 378 138 8,989 5% 11%
1996 191 70 9,059 2% 11%
1997 177 65 9,123 2% 10%
1998 512 187 9,310 6% 10%
1999 455 166 9,476 6% 10%
2000 398 145 9,621 5% 10%
2001 412 151 9,772 5% 9%
2002 427 156 9,928 5% 9%
2003 441 161 10,089 5% 9%
2004 363 132 10,221 4% 9%
2005 441 161 10,382 5% 8%
2006 520 190 10,572 6% 8%
2007 598 218 10,790 7% 8%
2008 929 339 11,129 10% 8%
2009 154 56 11,186 2% 7%
2010 151 55 11,240 2% 7%
2011 142 52 11,292 2% 7%
2012 130 48 11,340 1% 7%
2013 378 138 11,478 4% 7%

96
C. SAUDI ARABIA CRUDE OIL PRODUCTION FORECAST
Table C.1. Ain Dar/Shedgum Production Forecast
Year
Production Depletion
Rate RRR (MMbbl) Daily
(Mbpd)
Annual
(MMbbl)
Cumulative
(MMbbl)
2019 1,620 591 37,022 77% 10,978
2020 1,584 578 37,600 78% 10,400
2021 1,550 566 38,166 80% 9,834
2022 1,515 553 38,719 81% 9,281
2023 1,482 541 39,260 82% 8,740
2024 1,449 529 39,789 83% 8,211
2025 1,418 517 40,306 84% 7,694
2026 1,386 506 40,812 85% 7,188
2027 1,356 495 41,307 86% 6,693
2028 1,326 484 41,791 87% 6,209
2029 1,297 473 42,265 88% 5,735
2030 1,268 463 42,728 89% 5,272
2031 1,240 453 43,180 90% 4,820
2032 1,213 443 43,623 91% 4,377
2033 1,186 433 44,056 92% 3,944
2034 1,160 424 44,480 93% 3,520
2035 1,135 414 44,894 94% 3,106
2036 1,110 405 45,299 94% 2,701
2037 1,085 396 45,695 95% 2,305
2038 1,062 387 46,083 96% 1,917
2039 1,038 379 46,462 97% 1,538
2040 1,015 371 46,832 98% 1,168
2041 993 362 47,195 98% 805
2042 971 354 47,549 99% 451
2043 950 347 47,896 100% 104

97
Table C.2. Uthmaniyah Production Forecast
Year
Production Depletion
Rate
RRR
(MMbbl) Daily (Mbpd) Annual
(MMbbl)
Cumulative
(MMbbl)
2019 1,215 443 34,898 78% 10,102
2020 1,194 436 35,334 79% 9,666
2021 1,174 429 35,763 79% 9,237
2022 1,154 421 36,184 80% 8,816
2023 1,134 414 36,598 81% 8,402
2024 1,115 407 37,005 82% 7,995
2025 1,096 400 37,405 83% 7,595
2026 1,078 393 37,799 84% 7,201
2027 1,059 387 38,185 85% 6,815
2028 1,041 380 38,565 86% 6,435
2029 1,024 374 38,939 87% 6,061
2030 1,006 367 39,306 87% 5,694
2031 989 361 39,667 88% 5,333
2032 972 355 40,022 89% 4,978
2033 956 349 40,371 90% 4,629
2034 939 343 40,714 90% 4,286
2035 923 337 41,051 91% 3,949
2036 908 331 41,382 92% 3,618
2037 892 326 41,708 93% 3,292
2038 877 320 42,028 93% 2,972
2039 862 315 42,343 94% 2,657
2040 848 309 42,652 95% 2,348
2041 833 304 42,956 95% 2,044
2042 819 299 43,255 96% 1,745
2043 805 294 43,549 97% 1,451
2044 791 289 43,838 97% 1,162
2045 778 284 44,122 98% 878
2046 765 279 44,401 99% 599
2047 752 274 44,675 99% 325
2048 739 270 44,945 100% 55

98
Table C.3 .Hawiyah Production Forecast
Year
Production Depletion
Rate
RRR
(MMbbl) Daily (Mbpd) Annual (MMbbl) Cumulative (MMbbl)
2019 486 177 5,770 36% 10,430
2020 478 174 5,945 37% 10,255
2021 470 171 6,116 38% 10,084
2022 462 168 6,285 39% 9,915
2023 454 166 6,450 40% 9,750
2024 446 163 6,613 41% 9,587
2025 438 160 6,773 42% 9,427
2026 431 157 6,931 43% 9,269
2027 424 155 7,085 44% 9,115
2028 417 152 7,237 45% 8,963
2029 409 149 7,387 46% 8,813
2030 402 147 7,534 47% 8,666
2031 396 144 7,678 47% 8,522
2032 389 142 7,820 48% 8,380
2033 382 140 7,959 49% 8,241
2034 376 137 8,097 50% 8,103
2035 369 135 8,231 51% 7,969
2036 363 133 8,364 52% 7,836
2037 357 130 8,494 52% 7,706
2038 351 128 8,622 53% 7,578
2039 345 126 8,748 54% 7,452
2040 339 124 8,872 55% 7,328
2041 333 122 8,994 56% 7,206
2042 328 120 9,113 56% 7,087
2043 322 118 9,231 57% 6,969
2044 317 116 9,346 58% 6,854
2045 311 114 9,460 58% 6,740
2046 306 112 9,572 59% 6,628
2047 301 110 9,681 60% 6,519
2048 296 108 9,789 60% 6,411

99
Table C.4. Haradh Production Forecast
Year
Production Depletion
Rate
RRR
(MMbbl) Daily (Mbpd) Annual (MMbbl) Cumulative (MMbbl)
2019 729 266 5,143 29% 12,857
2020 717 262 5,405 30% 12,595
2021 704 257 5,662 31% 12,338
2022 692 253 5,915 33% 12,085
2023 681 248 6,163 34% 11,837
2024 669 244 6,408 36% 11,592
2025 658 240 6,648 37% 11,352
2026 647 236 6,884 38% 11,116
2027 636 232 7,116 40% 10,884
2028 625 228 7,344 41% 10,656
2029 614 224 7,568 42% 10,432
2030 604 220 7,788 43% 10,212
2031 593 217 8,005 44% 9,995
2032 583 213 8,218 46% 9,782
2033 573 209 8,427 47% 9,573
2034 564 206 8,633 48% 9,367
2035 554 202 8,835 49% 9,165
2036 545 199 9,034 50% 8,966
2037 535 195 9,229 51% 8,771
2038 526 192 9,421 52% 8,579
2039 517 189 9,610 53% 8,390
2040 509 186 9,796 54% 8,204
2041 500 182 9,978 55% 8,022
2042 491 179 10,158 56% 7,842
2043 483 176 10,334 57% 7,666
2044 475 173 10,507 58% 7,493
2045 467 170 10,678 59% 7,322
2046 459 167 10,845 60% 7,155
2047 451 165 11,010 61% 6,990
2048 443 162 11,172 62% 6,828

100
Table C.5. Abqaiq Production Forecast
Year Production Depletion
Rate
RRR
(MMbbl) Daily (Mbpd) Annual (MMbbl) Cumulative (MMbbl)
2019 405 148 12,697 76% 4,053
2020 394 144 12,841 77% 3,909
2021 383 140 12,981 77% 3,769
2022 372 136 13,116 78% 3,634
2023 362 132 13,248 79% 3,502
2024 351 128 13,376 80% 3,374
2025 342 125 13,501 81% 3,249
2026 332 121 13,622 81% 3,128
2027 323 118 13,740 82% 3,010
2028 314 114 13,855 83% 2,895
2029 305 111 13,966 83% 2,784
2030 296 108 14,074 84% 2,676
2031 288 105 14,179 85% 2,571
2032 280 102 14,281 85% 2,469
2033 272 99 14,381 86% 2,369
2034 265 97 14,477 86% 2,273
2035 257 94 14,571 87% 2,179
2036 250 91 14,662 88% 2,088
2037 243 89 14,751 88% 1,999
2038 236 86 14,837 89% 1,913
2039 229 84 14,921 89% 1,829
2040 223 81 15,002 90% 1,748
2041 217 79 15,081 90% 1,669
2042 211 77 15,158 90% 1,592
2043 205 75 15,233 91% 1,517
2044 199 73 15,306 91% 1,444
2045 194 71 15,376 92% 1,374
2046 188 69 15,445 92% 1,305
2047 183 67 15,512 93% 1,238
2048 178 65 15,577 93% 1,173
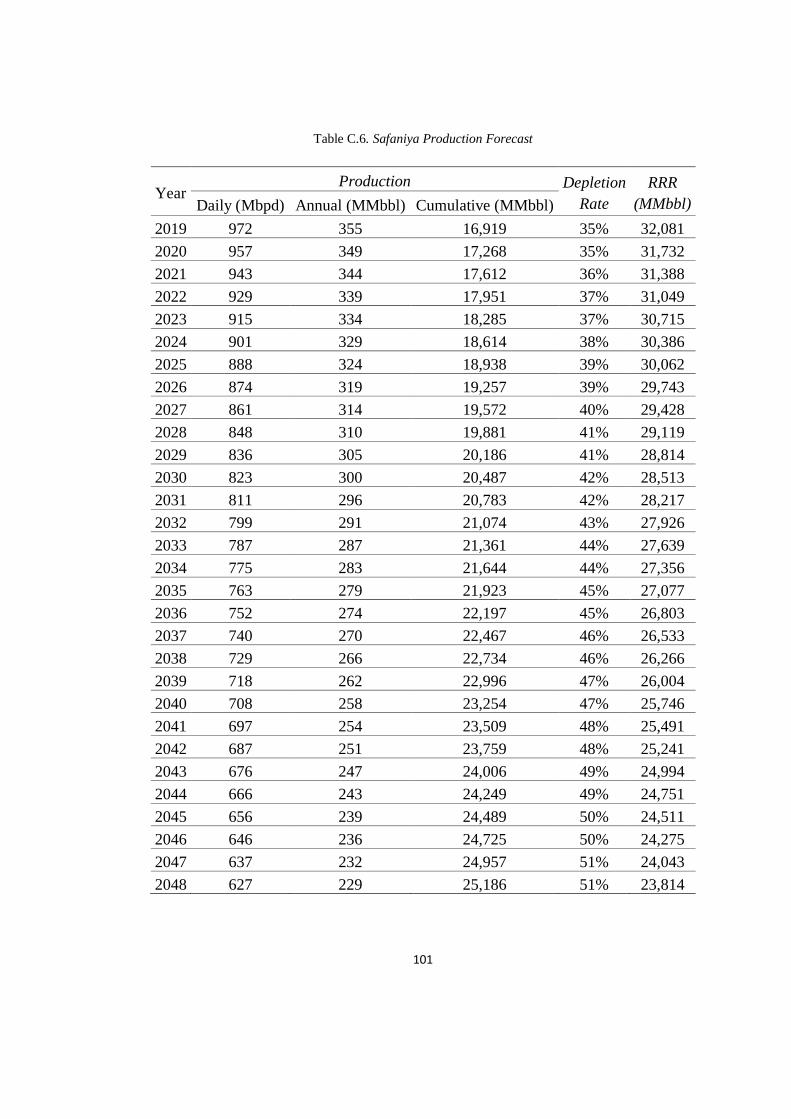
101
Table C.6. Safaniya Production Forecast
Year Production Depletion
Rate
RRR
(MMbbl) Daily (Mbpd) Annual (MMbbl) Cumulative (MMbbl)
2019 972 355 16,919 35% 32,081
2020 957 349 17,268 35% 31,732
2021 943 344 17,612 36% 31,388
2022 929 339 17,951 37% 31,049
2023 915 334 18,285 37% 30,715
2024 901 329 18,614 38% 30,386
2025 888 324 18,938 39% 30,062
2026 874 319 19,257 39% 29,743
2027 861 314 19,572 40% 29,428
2028 848 310 19,881 41% 29,119
2029 836 305 20,186 41% 28,814
2030 823 300 20,487 42% 28,513
2031 811 296 20,783 42% 28,217
2032 799 291 21,074 43% 27,926
2033 787 287 21,361 44% 27,639
2034 775 283 21,644 44% 27,356
2035 763 279 21,923 45% 27,077
2036 752 274 22,197 45% 26,803
2037 740 270 22,467 46% 26,533
2038 729 266 22,734 46% 26,266
2039 718 262 22,996 47% 26,004
2040 708 258 23,254 47% 25,746
2041 697 254 23,509 48% 25,491
2042 687 251 23,759 48% 25,241
2043 676 247 24,006 49% 24,994
2044 666 243 24,249 49% 24,751
2045 656 239 24,489 50% 24,511
2046 646 236 24,725 50% 24,275
2047 637 232 24,957 51% 24,043
2048 627 229 25,186 51% 23,814
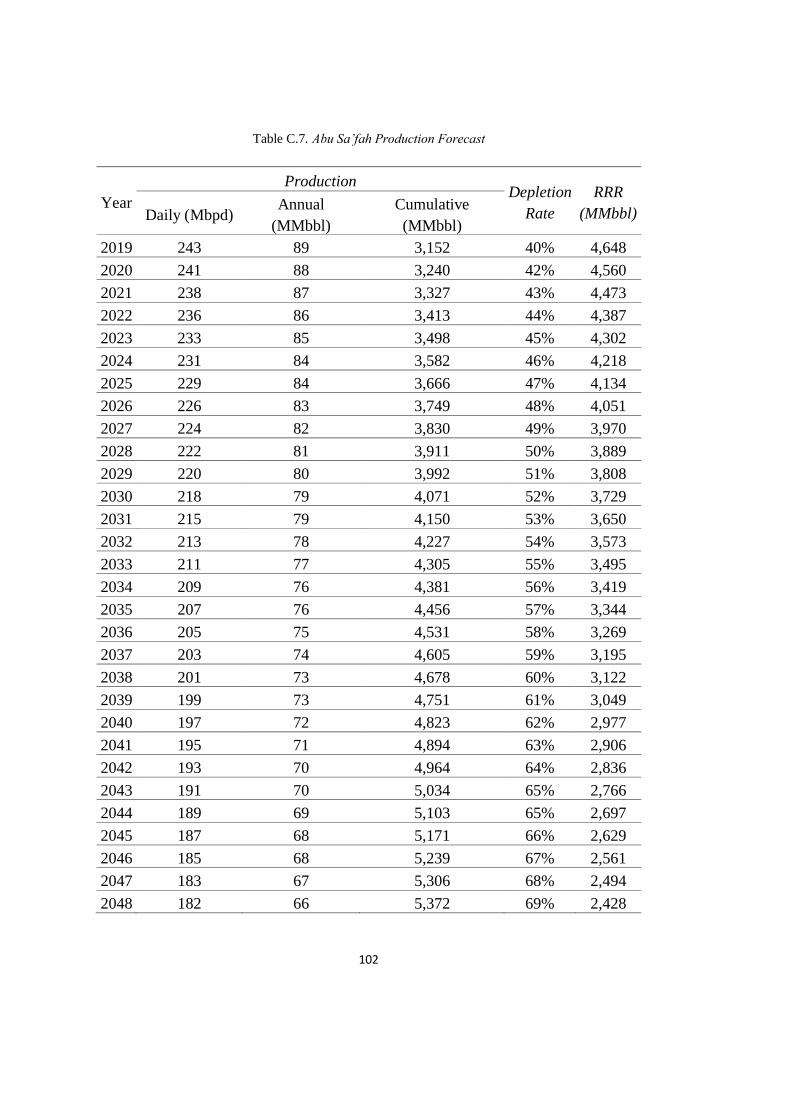
102
Table C.7. Abu Sa’fah Production Forecast
Year
Production Depletion
Rate
RRR
(MMbbl) Daily (Mbpd) Annual
(MMbbl)
Cumulative
(MMbbl)
2019 243 89 3,152 40% 4,648
2020 241 88 3,240 42% 4,560
2021 238 87 3,327 43% 4,473
2022 236 86 3,413 44% 4,387
2023 233 85 3,498 45% 4,302
2024 231 84 3,582 46% 4,218
2025 229 84 3,666 47% 4,134
2026 226 83 3,749 48% 4,051
2027 224 82 3,830 49% 3,970
2028 222 81 3,911 50% 3,889
2029 220 80 3,992 51% 3,808
2030 218 79 4,071 52% 3,729
2031 215 79 4,150 53% 3,650
2032 213 78 4,227 54% 3,573
2033 211 77 4,305 55% 3,495
2034 209 76 4,381 56% 3,419
2035 207 76 4,456 57% 3,344
2036 205 75 4,531 58% 3,269
2037 203 74 4,605 59% 3,195
2038 201 73 4,678 60% 3,122
2039 199 73 4,751 61% 3,049
2040 197 72 4,823 62% 2,977
2041 195 71 4,894 63% 2,906
2042 193 70 4,964 64% 2,836
2043 191 70 5,034 65% 2,766
2044 189 69 5,103 65% 2,697
2045 187 68 5,171 66% 2,629
2046 185 68 5,239 67% 2,561
2047 183 67 5,306 68% 2,494
2048 182 66 5,372 69% 2,428

103
Table C.8. Berri Production Forecast
Year Production Depletion
Rate
RRR
(MMbbl) Daily (Mbpd) Annual (MMbbl) Cumulative (MMbbl)
2019 243 89 4,775 44% 6,025
2020 233 85 4,860 45% 5,940
2021 223 82 4,942 46% 5,858
2022 214 78 5,020 46% 5,780
2023 206 75 5,095 47% 5,705
2024 197 72 5,167 48% 5,633
2025 189 69 5,236 48% 5,564
2026 181 66 5,302 49% 5,498
2027 174 63 5,365 50% 5,435
2028 167 61 5,426 50% 5,374
2029 160 58 5,485 51% 5,315
2030 153 56 5,541 51% 5,259
2031 147 54 5,594 52% 5,206
2032 141 51 5,646 52% 5,154
2033 135 49 5,695 53% 5,105
2034 130 47 5,742 53% 5,058
2035 124 45 5,788 54% 5,012
2036 119 44 5,831 54% 4,969
2037 114 42 5,873 54% 4,927
2038 110 40 5,913 55% 4,887
2039 105 38 5,952 55% 4,848
2040 101 37 5,988 55% 4,812
2041 97 35 6,024 56% 4,776
2042 93 34 6,058 56% 4,742
2043 89 32 6,090 56% 4,710
2044 85 31 6,121 57% 4,679
2045 82 30 6,151 57% 4,649
2046 78 29 6,180 57% 4,620
2047 75 27 6,207 57% 4,593
2048 72 26 6,234 58% 4,566

104
Table C.9. Khurais Production Forecast
Year Production Depletion
Rate
RRR
(MMbbl) Daily (Mbpd) Annual (MMbbl) Cumulative (MMbbl)
2019 1,272 464 4,371 19% 18,429
2020 1,244 454 4,825 21% 17,975
2021 1,217 444 5,269 23% 17,531
2022 1,190 434 5,703 25% 17,097
2023 1,164 425 6,128 27% 16,672
2024 1,138 415 6,543 29% 16,257
2025 1,113 406 6,949 30% 15,851
2026 1,089 397 7,347 32% 15,453
2027 1,065 389 7,735 34% 15,065
2028 1,041 380 8,115 36% 14,685
2029 1,018 372 8,487 37% 14,313
2030 996 364 8,851 39% 13,949
2031 974 356 9,206 40% 13,594
2032 953 348 9,554 42% 13,246
2033 932 340 9,894 43% 12,906
2034 911 333 10,226 45% 12,574
2035 891 325 10,552 46% 12,248
2036 871 318 10,870 48% 11,930
2037 852 311 11,181 49% 11,619
2038 834 304 11,485 50% 11,315
2039 815 298 11,783 52% 11,017
2040 797 291 12,074 53% 10,726
2041 780 285 12,358 54% 10,442
2042 763 278 12,637 55% 10,163
2043 746 272 12,909 57% 9,891
2044 729 266 13,175 58% 9,625
2045 713 260 13,435 59% 9,365
2046 698 255 13,690 60% 9,110
2047 682 249 13,939 61% 8,861
2048 667 244 14,183 62% 8,617

105
Table C.10. Khursaniyah Production Forecast
Year
Production Depletion
Rate
RRR
(MMbbl) Daily (Mbpd) Annual
(MMbbl)
Cumulative
(MMbbl)
2019 426 156 3,672 51% 3,468
2020 409 149 3,821 54% 3,319
2021 392 143 3,964 56% 3,176
2022 376 137 4,102 57% 3,038
2023 360 132 4,233 59% 2,907
2024 346 126 4,359 61% 2,781
2025 331 121 4,480 63% 2,660
2026 318 116 4,596 64% 2,544
2027 305 111 4,707 66% 2,433
2028 292 107 4,814 67% 2,326
2029 280 102 4,917 69% 2,223
2030 269 98 5,015 70% 2,125
2031 258 94 5,109 72% 2,031
2032 247 90 5,199 73% 1,941
2033 237 87 5,286 74% 1,854
2034 227 83 5,369 75% 1,771
2035 218 80 5,448 76% 1,692
2036 209 76 5,524 77% 1,616
2037 201 73 5,598 78% 1,542
2038 192 70 5,668 79% 1,472
2039 184 67 5,735 80% 1,405
2040 177 65 5,800 81% 1,340
2041 170 62 5,862 82% 1,278
2042 163 59 5,921 83% 1,219
2043 156 57 5,978 84% 1,162
2044 150 55 6,033 84% 1,107
2045 143 52 6,085 85% 1,055
2046 138 50 6,135 86% 1,005
2047 132 48 6,183 87% 957
2048 127 46 6,229 87% 911

106
Table C.11. Manifa Production Forecast
Year
Production Depletion
Rate
RRR
(MMbbl) Daily (Mbpd) Annual
(MMbbl)
Cumulative
(MMbbl)
2019 900 329 2,363 14% 14,637
2020 887 324 2,687 16% 14,313
2021 873 319 3,006 18% 13,994
2022 860 314 3,320 20% 13,680
2023 847 309 3,629 21% 13,371
2024 834 305 3,933 23% 13,067
2025 822 300 4,233 25% 12,767
2026 810 296 4,529 27% 12,471
2027 798 291 4,820 28% 12,180
2028 786 287 5,107 30% 11,893
2029 774 282 5,389 32% 11,611
2030 762 278 5,667 33% 11,333
2031 751 274 5,941 35% 11,059
2032 739 270 6,211 37% 10,789
2033 728 266 6,477 38% 10,523
2034 717 262 6,739 40% 10,261
2035 707 258 6,997 41% 10,003
2036 696 254 7,251 43% 9,749
2037 686 250 7,501 44% 9,499
2038 675 247 7,748 46% 9,252
2039 665 243 7,991 47% 9,009
2040 655 239 8,230 48% 8,770
2041 645 236 8,465 50% 8,535
2042 636 232 8,697 51% 8,303
2043 626 229 8,926 53% 8,074
2044 617 225 9,151 54% 7,849
2045 608 222 9,373 55% 7,627
2046 598 218 9,591 56% 7,409
2047 589 215 9,806 58% 7,194
2048 581 212 10,018 59% 6,982

107
Table C.12. Marjan Production Forecast
Year Production Depletion
Rate
RRR
(MMbbl) Daily (Mbpd) Annual (MMbbl) Cumulative (MMbbl)
2019 365 133 3,189 24% 10,211
2020 359 131 3,320 25% 10,080
2021 354 129 3,449 26% 9,951
2022 348 127 3,576 27% 9,824
2023 343 125 3,701 28% 9,699
2024 588 215 3,916 29% 9,484
2025 579 211 4,127 31% 9,273
2026 570 208 4,335 32% 9,065
2027 562 205 4,541 34% 8,859
2028 553 202 4,743 35% 8,657
2029 545 199 4,942 37% 8,458
2030 537 196 5,138 38% 8,262
2031 529 193 5,331 40% 8,069
2032 521 190 5,521 41% 7,879
2033 513 187 5,708 43% 7,692
2034 505 185 5,893 44% 7,507
2035 498 182 6,074 45% 7,326
2036 490 179 6,253 47% 7,147
2037 483 176 6,430 48% 6,970
2038 476 174 6,603 49% 6,797
2039 469 171 6,774 51% 6,626
2040 462 169 6,943 52% 6,457
2041 455 166 7,109 53% 6,291
2042 448 163 7,272 54% 6,128
2043 441 161 7,434 55% 5,966
2044 435 159 7,592 57% 5,808
2045 428 156 7,748 58% 5,652
2046 422 154 7,902 59% 5,498
2047 415 152 8,054 60% 5,346
2048 409 149 8,203 61% 5,197

108
Table C.13. Qatif Production Forecast
Year Production Depletion
Rate
RRR
(MMbbl) Daily (Mbpd) Annual (MMbbl) Cumulative (MMbbl)
2019 405 148 2,698 32% 5,702
2020 401 146 2,845 34% 5,555
2021 397 145 2,990 36% 5,410
2022 393 143 3,133 37% 5,267
2023 389 142 3,275 39% 5,125
2024 385 141 3,416 41% 4,984
2025 381 139 3,555 42% 4,845
2026 377 138 3,693 44% 4,707
2027 374 136 3,829 46% 4,571
2028 370 135 3,964 47% 4,436
2029 366 134 4,098 49% 4,302
2030 363 132 4,230 50% 4,170
2031 359 131 4,361 52% 4,039
2032 355 130 4,491 53% 3,909
2033 352 128 4,619 55% 3,781
2034 348 127 4,746 57% 3,654
2035 345 126 4,872 58% 3,528
2036 341 125 4,997 59% 3,403
2037 338 123 5,120 61% 3,280
2038 335 122 5,242 62% 3,158
2039 331 121 5,363 64% 3,037
2040 328 120 5,483 65% 2,917
2041 325 119 5,602 67% 2,798
2042 321 117 5,719 68% 2,681
2043 318 116 5,835 69% 2,565
2044 315 115 5,950 71% 2,450
2045 312 114 6,064 72% 2,336
2046 309 113 6,176 74% 2,224
2047 306 112 6,288 75% 2,112
2048 303 110 6,398 76% 2,002

109
Table C.14. Zuluf Production Forecast
Year Production Depletion
Rate
RRR
(MMbbl) Daily (Mbpd) Annual (MMbbl) Cumulative (MMbbl)
2019 551 201 6,462 26% 18,238
2020 541 197 6,660 27% 18,040
2021 531 194 6,854 28% 17,846
2022 522 190 7,044 29% 17,656
2023 512 187 7,231 29% 17,469
2024 503 184 7,415 30% 17,285
2025 494 180 7,595 31% 17,105
2026 485 177 7,772 31% 16,928
2027 476 174 7,946 32% 16,754
2028 468 171 8,116 33% 16,584
2029 459 168 8,284 34% 16,416
2030 451 165 8,449 34% 16,251
2031 443 162 8,610 35% 16,090
2032 435 159 8,769 36% 15,931
2033 427 156 8,925 36% 15,775
2034 419 153 9,078 37% 15,622
2035 412 150 9,228 37% 15,472
2036 404 148 9,376 38% 15,324
2037 397 145 9,521 39% 15,179
2038 390 142 9,663 39% 15,037
2039 383 140 9,803 40% 14,897
2040 376 137 9,941 40% 14,759
2041 369 135 10,075 41% 14,625
2042 363 132 10,208 41% 14,492
2043 356 130 10,338 42% 14,362
2044 350 128 10,465 42% 14,235
2045 343 125 10,591 43% 14,109
2046 337 123 10,714 43% 13,986
2047 331 121 10,835 44% 13,865
2048 325 119 10,953 44% 13,747

110
Table C.15. Other Fields Production Forecast
Year Production
Daily (Mbpd) Annual (MMbbl) Cumulative (MMbbl)
2019 710 259 12,425
2020 678 247 12,672
2021 647 236 12,908
2022 618 226 13,134
2023 603 220 13,354
2024 588 215 13,569
2025 561 205 13,773
2026 535 195 13,969
2027 511 186 14,155
2028 487 178 14,333
2029 465 170 14,503
2030 444 162 14,665
2031 423 155 14,819
2032 404 147 14,966
2033 386 141 15,107
2034 367 134 15,241
2035 350 128 15,369
2036 334 122 15,491
2037 318 116 15,607
2038 303 111 15,718
2039 289 105 15,823
2040 275 100 15,923
2041 262 96 16,019
2042 250 91 16,111
2043 238 87 16,198
2044 227 83 16,281
2045 217 79 16,360
2046 207 75 16,435
2047 197 72 16,507
2048 188 69 16,576

111
Table C.16. Production Model for Unexplored Giant Fields
Year Production Depletion
Rate
RRR
(MMbbl) Daily (Mbpd) Annual (MMbbl) Cumulative (MMbbl)
1 Development
2
3 46 17 17 1.68% 983
4 53 19 19 1.92% 981
5 60 22 22 2.19% 978
6 68 25 25 2.50% 975
7 78 28 53 5.34% 947
8 89 32 86 8.59% 914
9 102 37 123 12.30% 877
10 116 42 165 16.53% 835
11 132 48 214 21.36% 786
12 151 55 269 26.87% 731
13 172 63 332 33.15% 668
14 172 63 394 39.44% 606
15 172 63 457 45.72% 543
16 172 63 520 52.01% 480
17 172 63 583 58.29% 417
18 155 56 639 63.94% 361
19 139 51 690 69.00% 310
20 125 46 736 73.56% 264
21 112 41 776 77.64% 224
22 101 37 813 81.31% 187
23 90 33 846 84.61% 154
24 81 30 876 87.57% 124
25 73 27 902 90.23% 98
26 65 24 926 92.61% 74
27 59 21 948 94.76% 52
28 53 19 967 96.68% 33
29 47 17 984 98.41% 16
30 43 16 1,000 99.96% 0

112
Table C.17. Crude Oil Production Forecast, Fields (Ghawar to Khursaniyah)
Year Ghawar Abqaiq Safaniya Abu Sa'fah Berri Khurais Khursaniyah
2019 4,050 405 972 243 243 1,272 426
2020 3,973 394 957 241 233 1,244 409
2021 3,898 383 943 238 223 1,217 392
2022 3,824 372 929 236 214 1,190 376
2023 3,751 362 915 233 206 1,164 360
2024 3,680 351 901 231 197 1,138 346
2025 3,610 342 888 229 189 1,113 331
2026 3,542 332 874 226 181 1,089 318
2027 3,474 323 861 224 174 1,065 305
2028 3,409 314 848 222 167 1,041 292
2029 3,344 305 836 220 160 1,018 280
2030 3,281 296 823 218 153 996 269
2031 3,219 288 811 215 147 974 258
2032 3,158 280 799 213 141 953 247
2033 3,098 272 787 211 135 932 237
2034 3,039 265 775 209 130 911 227
2035 2,982 257 763 207 124 891 218
2036 2,925 250 752 205 119 871 209
2037 2,870 243 740 203 114 852 201
2038 2,816 236 729 201 110 834 192
2039 2,763 229 718 199 105 815 184
2040 2,711 223 708 197 101 797 177
2041 2,659 217 697 195 97 780 170
2042 2,609 211 687 193 93 763 163
2043 2,560 205 676 191 89 746 156
2044 1,583 199 666 189 85 729 150
2045 1,556 194 656 187 82 713 143
2046 1,530 188 646 185 78 698 138
2047 1,504 183 637 183 75 682 132
2048 1,478 178 627 182 72 667 127

113
Table C.18. Crude Oil Production Forecast, Fields (Manifa to Total)
Year Manifa Marjan Qatif Shaybah Zuluf Others Total
2019 900 365 405 810 551 710 11,229
2020 887 359 401 802 541 678 10,997
2021 873 354 397 794 531 647 10,770
2022 860 348 393 786 522 618 10,549
2023 847 343 389 778 512 603 10,347
2024 834 588 385 770 503 588 10,398
2025 822 579 381 763 494 561 10,187
2026 810 570 377 755 485 535 9,982
2027 798 562 374 747 476 511 9,781
2028 786 553 370 740 468 487 9,586
2029 774 545 366 733 459 465 9,395
2030 762 537 363 725 451 444 9,209
2031 751 529 359 718 443 423 9,027
2032 739 521 355 711 435 404 8,849
2033 728 513 352 704 427 386 8,676
2034 717 505 348 697 419 367 8,506
2035 707 498 345 690 412 350 8,340
2036 696 490 341 683 404 334 8,178
2037 686 483 338 676 397 318 8,020
2038 675 476 335 669 390 303 7,865
2039 665 469 331 663 383 289 7,714
2040 655 462 328 656 376 275 7,567
2041 645 455 325 649 369 262 7,423
2042 636 448 321 643 363 250 7,282
2043 626 441 318 636 356 238 7,144
2044 617 435 315 630 350 227 6,081
2045 608 428 312 624 343 217 5,969
2046 598 422 309 617 337 207 5,861
2047 589 415 306 611 331 197 5,754
2048 581 409 303 605 325 188 5,650
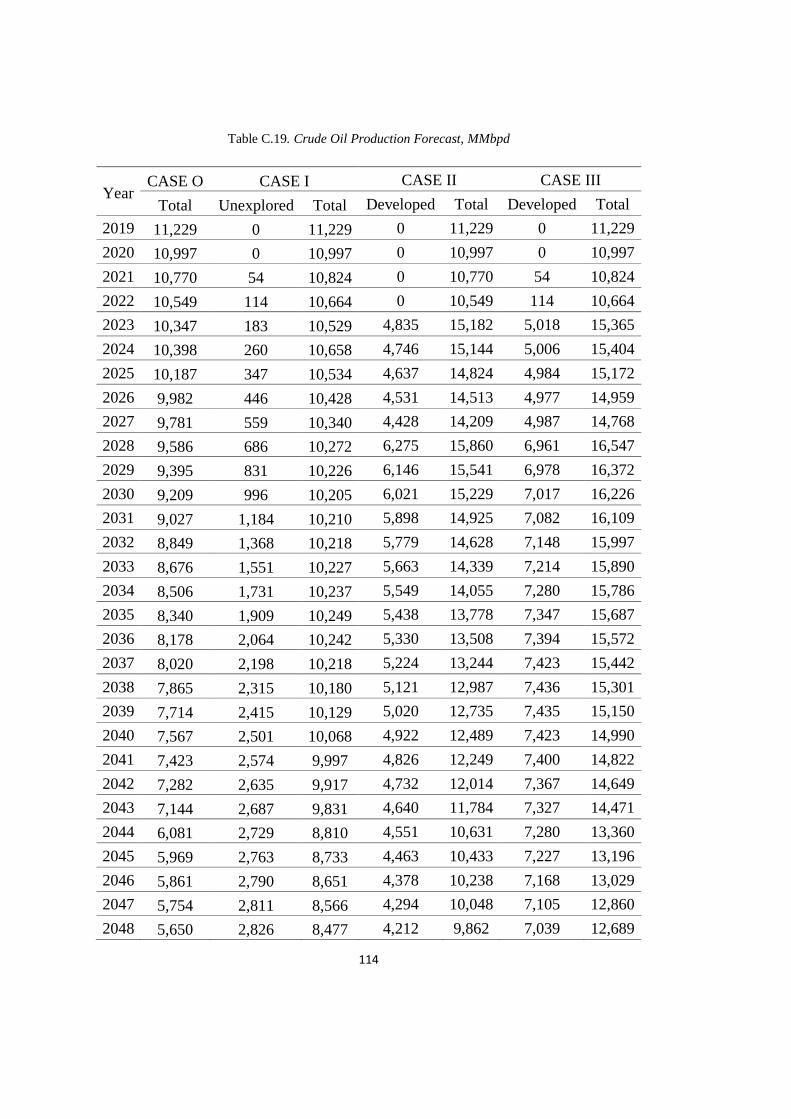
114
Table C.19. Crude Oil Production Forecast, MMbpd
Year CASE O CASE I CASE II CASE III
Total Unexplored Total Developed Total Developed Total
2019 11,229 0 11,229 0 11,229 0 11,229
2020 10,997 0 10,997 0 10,997 0 10,997
2021 10,770 54 10,824 0 10,770 54 10,824
2022 10,549 114 10,664 0 10,549 114 10,664
2023 10,347 183 10,529 4,835 15,182 5,018 15,365
2024 10,398 260 10,658 4,746 15,144 5,006 15,404
2025 10,187 347 10,534 4,637 14,824 4,984 15,172
2026 9,982 446 10,428 4,531 14,513 4,977 14,959
2027 9,781 559 10,340 4,428 14,209 4,987 14,768
2028 9,586 686 10,272 6,275 15,860 6,961 16,547
2029 9,395 831 10,226 6,146 15,541 6,978 16,372
2030 9,209 996 10,205 6,021 15,229 7,017 16,226
2031 9,027 1,184 10,210 5,898 14,925 7,082 16,109
2032 8,849 1,368 10,218 5,779 14,628 7,148 15,997
2033 8,676 1,551 10,227 5,663 14,339 7,214 15,890
2034 8,506 1,731 10,237 5,549 14,055 7,280 15,786
2035 8,340 1,909 10,249 5,438 13,778 7,347 15,687
2036 8,178 2,064 10,242 5,330 13,508 7,394 15,572
2037 8,020 2,198 10,218 5,224 13,244 7,423 15,442
2038 7,865 2,315 10,180 5,121 12,987 7,436 15,301
2039 7,714 2,415 10,129 5,020 12,735 7,435 15,150
2040 7,567 2,501 10,068 4,922 12,489 7,423 14,990
2041 7,423 2,574 9,997 4,826 12,249 7,400 14,822
2042 7,282 2,635 9,917 4,732 12,014 7,367 14,649
2043 7,144 2,687 9,831 4,640 11,784 7,327 14,471
2044 6,081 2,729 8,810 4,551 10,631 7,280 13,360
2045 5,969 2,763 8,733 4,463 10,433 7,227 13,196
2046 5,861 2,790 8,651 4,378 10,238 7,168 13,029
2047 5,754 2,811 8,566 4,294 10,048 7,105 12,860
2048 5,650 2,826 8,477 4,212 9,862 7,039 12,689

115
12. D.SUBSTITUTES
Table D.1. Crude Oil Exporters and Top 5 Target Markets
Country Japan China US S. Korea India
Saudi Arabia 40.00% 13.00% 13.00% 27.00% 17.00%
Algeria 0.30% 0.00% 0.90% 0.00% 1.00%
Angola 0.00% 12.00% 1.70% 0.00% 3.80%
Azerbaijan 0.00% 0.00% 0.00% 0.00% 5.00%
Iran 2.00% 7.50% 0.00% 1.00% 11.00%
Iraq 1.60% 8.60% 7.70% 10.00% 19.00%
Kazakhstan 0.70% 0.00% 0.00% 1.40% 0.90%
Kuwait 6.90% 4.40% 1.90% 13.00% 5.30%
Libya 6.00% 0.90% 0.90% 1.00% 0.00%
Mexico 1.50% 0.00% 8.00% 2.20% 3.30%
Nigeria 0.00% 0.30% 4.50% 0.10% 9.70%
Norway 0.00% 0.40% 0.60% 0.00% 0.00%
Oman 0.90% 7.70% 0.00% 0.40% 1.70%
Qatar 7.30% 0.00% 0.00% 5.90% 1.60%
Russia 5.70% 14.00% 0.00% 7.00% 1.40%
UAE 24.00% 2.60% 0.30% 8.20% 8.00%

116
Table D.2. Crude Oil Exporters and Other Target Markets
Country Singapore S. Africa France Spain Italy
Saudi Arabia 18.00% 46.00% 12.00% 9.70% 8.60%
Algeria 0.80% 0.00% 10.00% 2.20% 2.00%
Angola 0.00% 21.00% 1.40% 3.80% 1.30%
Azerbaijan 0.00% 0.00% 2.40% 1.40% 19.00%
Iran 0.00% 0.00% 11.00% 6.30% 12.00%
Iraq 1.70% 0.00% 0.60% 5.60% 12.00%
Kazakhstan 0.40% 0.00% 15.00% 6.20% 5.70%
Kuwait 11.00% 0.00% 0.30% 0.00% 4.60%
Libya 1.10% 0.00% 6.80% 8.80% 7.80%
Mexico 0.00% 0.00% 0.00% 13.00% 0.30%
Nigeria 0.10% 26.00% 9.70% 15.00% 2.70%
Norway 0.00% 0.00% 9.00% 4.20% 1.10%
Oman 0.30% 0.10% 0.00% 0.00% 0.00%
Qatar 20.00% 0.00% 0.00% 0.00% 0.00%
Russia 1.90% 0.00% 11.00% 4.20% 12.00%
UAE 27.00% 0.00% 0.50% 0.00% 0.00%