A Systems Biology Approach to Understand Leaf Growth ...
287
University of Antwerp Laboratory for Molecular Plant Physiology and Biotechnology Department of Biology A Systems Biology Approach to Understand Leaf Growth Regulation in Arabidopsis thaliana Een systeembiologische benadering voor het begrijpen van de regulatie van bladgroei in Arabidopsis thaliana Shweta Kalve Promotor Prof. dr. ir. Gerrit T.S. Beemster Thesis submitted in partial fulfillment of the requirements to obtain the degree of Doctor of Philosophy (PhD) in Biology Academic year 2014-2015 University of Antwerp CGB building U 6 th floor, 171 Groenenborgerlaan, B-2020 Antwerp, Belgium
-
Upload
khangminh22 -
Category
Documents
-
view
2 -
download
0
Transcript of A Systems Biology Approach to Understand Leaf Growth ...
University of Antwerp Laboratory for Molecular Plant Physiology and Biotechnology
Department of Biology
A Systems Biology Approach to Understand Leaf Growth Regulation in Arabidopsis thaliana
Een systeembiologische benadering voor het begrijpen van
de regulatie van bladgroei in Arabidopsis thaliana
Shweta Kalve
Promotor Prof. dr. ir. Gerrit T.S. Beemster
Thesis submitted in partial fulfillment of the requirements to obtain the degree of Doctor of Philosophy (PhD) in Biology
Academic year 2014-2015
University of Antwerp CGB building U 6th floor, 171 Groenenborgerlaan,
B-2020 Antwerp, Belgium

ISBN: 9789057284670
Depot Number: D/2014/12.293/29
@ Shweta KalveThe author and promotor allow to consult and copy parts of this work for personal use. Further reproduction or transmission in any form or by any means, without the prior permission of the author is strictly forbidden.

This work is dedicated to my father and late mother, Kishor Kalve and Kirti Kalve, who
have always loved me unconditionally and emphasized the importance of education
and whose good examples have taught me to work hard for the things that I aspire to
achieve. This work is also dedicated to my husband and best friend, Shree Kulkarni, I
give my deepest expression of love and appreciation for the encouragement that you
gave and the sacrifices you made during this graduate program. I am truly thankful
for having you in my life.

Examination Board
Chair
Prof. dr. Els Prinsen Department of Plant Growth and Development University of Antwerp
Promotor
Prof. dr. ir. Gerrit T.S. Beemster Laboratory for Molecular Plant Physiology and Biotechnology University of Antwerp
Members
Prof. dr. Kris Vissenberg Department of Plant Growth and Development University of Antwerp
Prof. dr. Arp Schnittger Department of Developmental Biology University of Hamburg
Prof. dr. Lieven De Veylder Department of Plant Systems Biology VIB, Ghent University
Prof. dr. Han Asard Laboratory for Molecular Plant Physiology and Biotechnology University of Antwerp
Dr. Dirk De Vos Laboratory for Molecular Plant Physiology and Biotechnology University of Antwerp

TABLE OF CONTENTS
Summary 1 Samenvatting 4 Scope, aims and thesis outline 7 Chapter1 Leaf development: a cellular perspective
Abstract 11
Introduction 12
Process that control leaf growth
The shoot apical meristem (SAM) 14
Leaf initiation 17
Leaf polarity 19
Cytoplasmic growth 22
Cell division 25
Endoreduplication 32
Regulation of transition between cell division
and expansion 36
Turgor driven cell growth 40
Cell differentiation
o Guard cell formation 43
o Vascular differentiation 46
o Trichome development 49
A system’s perspective on leaf growth 51
Acknowledgements 55
Chapter 2 Three-dimensional patterns of cell division and expansion throughout the development of Arabidopsis thaliana leaves Abstract 91
Introduction 92
Results
Whole leaf expansion 95
Cell type specific anticlinal expansion 96
Anticlinal cell division and periclinal expansion
rates 97
Effect of light on leaf growth 100
Discussion
Differences in growth rates across the developing
leaf 105
Cell layer specific contributions to leaf thickness 107
Anticlinal cell division and size evolution differ
between cell layers 108
Low light differentially affects leaf growth in
three dimensions 110
Implications of kinematic analysis 112
Conclusion 112
Material and Methods 113
Acknowledgements 115
Chapter 3 Crosstalk between auxin signaling and osmotic stress response in the regulation of leaf growth of Arabidopsis thaliana Abstract 125
Introduction 126
Results
Crosstalk between osmotic stress response
induced by mannitol and NAA 128
Cellular basis of the leaf growth response to
NAA and mannitol 131
Kinematic analysis of leaf growth 131
DR5::GUS expression 134
Endogenous IAA concentration 135
Transcriptome analysis 136
Gene enrichment 139
Auxin biosynthesis pathway 142
Auxin conjugation and degradation 144
Auxin transport 147
Auxin signaling 148
Cell cycle regulation 149
Regulation of cell expansion 151
Regulation of redox metabolism 152
Discussion
The cellular basis of the growth response
to auxin and osmotic stress 154
Osmotic stress affects auxin homeostasis
and signaling 155
Growth regulation 157
Material and Methods 159
Supplemental Data 165
Acknowledgements 165
Chapter 4 Downregulation of KRPs promotes cell division and endoreduplication in the leaves of Arabidopsis thaliana Abstract 185
Introduction 186
Results
Identification of the T-DNA insertion mutants 188
Differential expression of seven Arabidopsis
KRPs during leaf development 189
Inhibition of KRPs causes enhanced leaf growth
by increasing cell number 191
Kinematic analysis shows no difference in cell division
rates between Col-0 and the krp4/6/7 mutant 192
Increased leaf size in the krp4/6/7 mutant is the
result of enlarged seed and embryo size 194
Transcriptome analysis of krp4/6/7 reveals upregulation
of genes related to cell cycle and DNA replication
in leaves 196
Downregulation of KRP genes stimulates
endoreplication 202
Discussion 205
Material and Methods 209
Supplemental data 215
Acknowledgements 216
Chapter 5 Mild overexpression of CDKB2;2 accelerates plant growth in Arabidopsis thaliana Abstract 233
Introduction 234
Results
Mild overexpression of CDKB2;2 enhances plant
growth 235
Enhanced leaf growth of PROCDKA;1:CDKB2;2 is mainly
due to an increase in cell number 237
CDKB2;2 overexpression line makes larger seeds
and embryo 240
Transcriptome analysis 241
Discussion 245
Material and Methods 247
Supplemental Data 251
Acknowledgements 251
Chapter 6 General discussion and future perspectives 259 Curriculum Vitae 271
Acknowledgements 275
1
SUMMARY
Adaptation of growth of individual organs in the context of an entire organism is crucial for
plants, and influenced by various genetic and environmental factors. Besides its direct
function as a food source, the leaf is the main photosynthetic organ that perceives light and
converts solar energy into organic carbon. Moreover, from an evolutionary point of view,
all floral organs (e.g. flowers and fruits) are modified leaves. Therefore, understanding the
regulation of leaf growth is important and has two main objectives. The first one is to
comprehend the molecular/biological processes that control leaf growth and development,
and determine the final shape and size in response to the surrounding environment. The
second aim is to improve crop yield in the context of changing climatic conditions, such as
increase in temperature, salinity and drought by means of genetic engineering approaches.
The development of leaves is an intriguing process, which is the result of a complex
interplay of different (yet often overlapping) pathways. At the cellular level, leaf growth is
strictly determined by spatial and temporal regulation of (only) two processes: cell
proliferation which involves cell growth (i.e. enlargement of cell volume by increasing
cytoplasmic volume) in combination with cell division (the process of dividing cellular
content over two daughter cells and placing a new cell wall) and cell expansion (mostly
vacuolar enlargement and turgor driven cell wall extension in absence of cell division),
which are regulated at the molecular level by chemical concentrations (metabolites such as
sugars, hormones and signaling peptides) and physical interactions (particularly turgor,
wall stresses). This means that the plethora of molecular pathways, that have been
demonstrated to be involved in leaf development, must be linked to these two processes.
Therefore, it is essential to use an interdisciplinary approach to unravel the complex
networks involved in leaf growth and development, instead of studying these regulatory
processes separately.
To comprehend leaf growth regulation in more detail, we performed a first analysis of the
dynamics of cell division and expansion in all three dimensions throughout the
development of Arabidopsis leaf. To achieve this, we extended the existing kinematic
analysis from a single tissue layer to the full three dimensional structure of the leaf. The
2
analysis showed that the leaf growth is highly anisotropic, where expansion rates in the
lateral direction are higher than in the longitudinal direction. While, expansion rates in the
anticlinal direction are an order of magnitude lower throughout leaf development.
Moreover, petiole elongation rates are higher than longitudinal expansion rates in the
blade. Detailed analysis of tissue layers showed that anticlinal expansion rates differ
between cell types, with mesophyll tissues having higher expansion rates than epidermal
cells. We subsequently demonstrated that low light affects cell division and expansion at
different developmental stages of the leaf. Low light reduces leaf expansion rates, which
are partly compensated by an increased duration of expansion. We found that the reduced
leaf thickness caused by low light is associated with a reduced number of palisade cell
layers, established prior to emergence of the leaf.
We also studied the role of the phytohormone auxin in the response of leaf development to
osmotic stress. Our work provides the first evidence of crosstalk between auxin signaling
and osmotic stress response. Kinematic analysis showed the dual nature of auxin where it
promotes leaf growth under optimal concentration but increases sensitivity under osmotic
stress. Interestingly, transcript profiling of proliferating leaves shows the upregulation of
auxin biosynthesis genes under stress while downregulation in response to exogenous
auxin. In contrast, increased expression of transcripts related to deconjugation and
degradation suggest low levels of conjugated auxin under osmotic stress, which was
confirmed by detailed hormone measurements. Moreover, increased growth by exogenous
auxin is also reflected by increased expression of transcripts related to cell division and
expansion, while their reduced expression under stress is consistent with the decreased
leaf growth under osmotic stress.
One of the key findings from our work is that cell division plays a central role in leaf growth
responses to environmental conditions. Therefore, to increase the understanding of the
regulators controlling cell cycle, we studied the role of negative regulators of the cell cycle,
Kip Related Proteins (KRPs) during leaf development. As KRPs is a family of seven genes
having redundant function, single and multiple mutants were studied. It is demonstrated
that single mutants cause only minor or no significant change in leaf growth, while double
3
and triple mutants display increased leaf growth as a result of enhanced cell proliferation.
Remarkably, the enlarged leaf of these mutants is a consequence of an increased embryo
size. Furthermore, transcriptome analysis revealed the upregulation of the DNA synthesis
machinery during leaf growth, which was also reflected in increased endoreduplication. In
addition, we developed a mathematical model of the cell cycle which provides a theoretical
explanation for the two-fold increase in endoreplication by inhibition of KRPs.
In addition to KRPs, we also studied the effect of mild overexpression of positive cell cycle
regulator CDKB2, which also results in enlarged leaves due to increased cell proliferation
while cell expansion is not affected. In addition, embryo development is also found to be
responsible for part of the increased leaf growth in the CDKB2 overexpression line.
4
SAMENVATTING
Aanpassing van de groei van individuele organen is cruciaal voor planten en wordt
beïnvloed door meerdere omgevings- en genetische factoren. Het blad is, naast een
voorname voedselbron, een belangrijk fotosynthetisch orgaan, dat zonne-energie omzet
naar organische koolstof. Vanuit een evolutionair standpunt zijn alle bloemorganen (vb.
bloemen en vruchten) eveneens gemodificeerde bladeren. Bijgevolg is een goed begrip van
de werking van bladgroei zeer belangrijk en deze werking kan worden bestudeerd met
meerdere doelen voor ogen. Een eerste doel is het begrip van de moleculaire/biologische
processen die bladgroei en –ontwikkeling beïnvloeden en de definitieve vorm en grootte
van het blad bepalen in respons op omgevingsfactoren. Een tweede doel is het verbeteren
van gewasopbrengsten bij snel veranderende klimaatcondities zoals een toename in
temperatuur, zoutgehalte en droogte, met behulp van genetische modificatie.
Bladontwikkeling is een intrigerend proces, bestaande uit een complex samenspel van
verschillende (vaak overlappende) mechanismen. Op cellulair niveau wordt bladgroei
bepaald door ruimtelijke en temporele regeling van (slechts) twee processen:
celproliferatie, wat celgroei (de toename in celvolume door een verhoging van het
cytoplasmatisch volume) inhoudt, in combinatie met celdeling (het proces waarbij de
cellulaire inhoud wordt verdeeld over twee dochtercellen door de aanmaak van een
nieuwe celwand) en celexpansie (voornamelijk vacuolaire vergroting en turgor-gedreven
celwandextensie die niet gevolgd wordt door een celdeling). Deze processen worden op
hun beurt op het moleculair niveau gereguleerd door chemische concentraties
(metabolieten zoals suikers, hormonen and signaalpeptiden) en fysische interacties (vooral
turgor en wandstress). Dit betekent dat de overvloed aan moleculaire mechanismen die
betrokken zijn in bladontwikkeling, gelinkt moeten zijn met deze processen. Het is
essentieel om gebruik te maken van een geïntegreerde visie op de regulerende processen
om zo het complexe netwerk, betrokken bij bladgroei en –ontwikkeling, te begrijpen. Deze
visie is mogelijk met behulp van een interdisciplinaire aanpak.
Om de regeling van bladgroei in meer detail te begrijpen, voerden we een eerste analyse uit
van de dynamiek van celdeling en –expansie in drie dimensies gedurende de volledige
5
ontwikkeling van het Arabidopsis blad. Om dit te bereiken, hebben we de bestaande
kinematische analyse uitgebreid van een enkele weefsellaag naar de volledige
driedimensionele structuur van het blad. De analyse toonde aan dat bladgroei
anisotropisch is, waarbij de expansiesnelheid in de laterale richting groter is dan die in de
longitudinale richting. Expansiesnelheden in de anticlinale richting zijn daarentegen een
grootteorde kleiner gedurende de bladontwikkeling. Bovendien is de elongatiesnelheid van
de bladsteel groter dan de longitudinale expansiesnelheid van het blad. Een gedetailleerde
analyse van weefsellagen toonde aan dat anticlinale expansiesnelheden verschillen tussen
celtypes, waarbij mesofiele cellen hogere expansiesnelheden hebben dan epidermale
cellen. We hebben vervolgens aangetoond dat een lage lichtintensiteit de celdeling en –
expansie beïnvloeden tijdens verschillende ontwikkelingsfasen van het blad. Een lage
lichtintensiteit reduceert de expansiesnelheid van bladeren, maar dit wordt deels
gecompenseerd door de duur van expansie. We vonden ook dat de gereduceerde bladdikte
veroorzaakt door een lage lichtintensiteit, wordt veroorzaakt door een gereduceerd aantal
cellagen in het palissadeweefsel en dat dit reeds wordt bepaald voor de verschijning van
het blad.
We bestudeerden ook de rol van het plantenhormoon auxine in de response van
bladontwikkeling op osmotische stress. Ons werk levert het eerste bewijs voor een
verband tussen auxine signalering en osmotische stress. Een kinematische analyse toonde
de dualiteit van auxine aan, waarbij het bladgroei promoot onder optimale concentraties,
maar gevoeligheid voor osmotische stess verhoogt. Transcript profiling van prolifererende
bladeren toont een opregulatie aan van auxinebiosynthese-genen tijdens stress, en een
neerregulatie als respons op exogeen auxine. Omgekeerd suggereerde een verhoogde
expressie van transcripten, gerelateerd aan deconjugatie en afbraak, lage niveaus van
geconjugeerd auxine tijdens osmotische stress. Dit werd bevestigd door gedetailleerde
hormoonmetingen. Daarnaast wordt een toegenomen groei bij exogeen auxine
weerspiegeld door een verhoogde expressie van transcripten gerelateerd aan celdeling en
–expansie, terwijl hun verlaagde expressie tijdens stress overeenstemt met de afgenomen
bladgroei tijdens osmotische stress.
6
Eén van de belangrijkste bevindingen is dat celdeling een belangrijke rol speelt in de
respons van bladgroei op omgevingsfactoren. Daarom bestudeerden we om de rol van
celcyclusregulatie tijdens bladgroei beter te begrijpen, de functie van Kip Related Proteins
(KRP’s), een klasse van negatieve regulatoren van de celcyclus. Omdat de KRP-familie 7
genen omvat, met een redundante functie, bestudeerden we het effect op bladgroei van
zowel enkele als meervoudige mutanten. We toonden daarbij aan dat enkelvoudige
mutanten weinig tot geen significante verschil vertonen in bladgroei, terwijl meervoudige
mutanten een toegenomen bladgroei hebben, als resultaat van een verhoogde
celproliferatie. Opvallend is dat de toegenomen bladgrootte bij de mutanten het gevolg is
van een toegenomen embryogrootte. Transcriptoom-analyse wees ook op een opregulatie
van het DNA-synthesemechanisme tijdens de bladgroei. Dit werd eveneens weerspiegeld in
een toegenomen endoreplicatie. Daarnaast ontwikkelden we een nieuw mathematisch
model van de celcyclus dat een theoretisch mechanisme beschijft dat de tweevoudige
toename in endoreplicatie door de remming van KRP’s verklaart.
Naast KRPs bestudeerden we ook het effect van milde overexpressie van de positieve
celcyclusregulator CDKB2, wat ook resulteert in vergrote bladeren dankzij een toegenomen
celproliferatie, terwijl celexpansie niet wordt beïnvloed. De embryonale ontwikkeling blijkt
ook hier een belangrijk proces te zijn dat die de verhoogde bladgroei in de CDKB2
overexpressie-lijnen gedeeltelijk verklaart.
7
SCOPE, AIMS AND THESIS OUTLINE
The aim of this PhD is to study the mechanisms whereby cell division and cell expansion
control leaf growth. The present work utilizes the model species Arabidopsis thaliana
because of it’s short life cycle, self-pollinating characteristic, small and fully sequenced
genome. We aimed to study how cell division and expansion translate the effect of
environmental and genetic factors through a number of recognized regulatory pathways,
including phytohormone signaling into a whole leaf phenotype. Finally, we aimed to
integrate the obtained knowledge into a mathematical model to improve the understanding
of cell cycle regulation in the context of the leaf growth processes. The research work
during PhD is described in following 6 chapters:
Chapter 1 includes a review of the regulatory processes controlling the development of
individual cells in the context of leaf growth and development. This chapter serves as an
introduction and gives an overview of the current knowledge of the major regulatory
mechanisms essential for leaf growth.
In Chapter 2, we expand the kinematic analysis to enable quantification of the spatial
dynamics of cell division and expansion in 3D. Hereby, it allows us to determine how the
rates of cell division and expansion vary in three dimensions (length, width and thickness)
of the leaf to determine the final leaf morphology in normal conditions and in response to
low light conditions.
Leaf growth and development are controlled by the concerted action of various
phytohormones and auxin is a key growth regulator, whereas water deficit is a major
growth limiting environmental factor. In Chapter 3, we explore the crosstalk between
auxin and osmotic stress in the control of leaf growth. This crosstalk is studied by
combining organ and cell level growth analysis with measurements of auxin
concentrations, response activity and genome-wide transcriptional study.
Cell division is a key process to control leaf growth and development. Therefore, to expand
our knowledge about the regulation of cell cycle activity during leaf growth, the role of Kip
8
Related Proteins (KRPs), a class of CDK inhibitors is studied in Chapter 4, whereas the
function of the plant specific B2-type cyclin dependent kinase is studied in Chapter 5. In
addition, mathematical modeling is used to gain a better and more detailed insight into the
complex molecular interactions of cell cycle regulation that are at the basis of leaf growth.
Finally, Chapter 6 contains a general discussion, which summarizes the main results and
gives an integrated overview of all the studied processes controlling leaf growth. Moreover,
it provides a common conclusion drawn from all the findings and possibilities for further
research.
Chapter 1
Leaf development: a cellular perspective
Shweta Kalve1, Dirk De Vos1, 2 and Gerrit T.S. Beemster1*
1Department of Biology, University of Antwerp, Antwerp, Belgium
2Department of Mathematics and Computer Science, University of Antwerp,
Antwerp, Belgium
*Corresponding Author
This chapter is published as a Review in Frontiers in Plant Science, 5:362, 2014
(doi:10.3389/fpls.2014.00362)
Contribution of S.K.- Performed the literature survey and wrote the manuscript

Leaf development: a cellular perspective
11
Abstract
Through its photosynthetic capacity the leaf provides the basis for growth of the whole
plant. In order to improve crops for higher productivity and resistance for future climate
scenarios, it is important to obtain a mechanistic understanding of leaf growth and
development and the effect of genetic and environmental factors on the process. Cells are
both the basic building blocks of the leaf and the regulatory units that integrate genetic and
environmental information into the developmental program. Therefore, to fundamentally
understand leaf development, one needs to be able to reconstruct the developmental
pathway of individual cells (and their progeny) from the stem cell niche to their final
position in the mature leaf. To build the basis for such understanding, we review current
knowledge on the spatial and temporal regulation mechanisms operating on cells,
contributing to the formation of a leaf. We focus on the molecular networks that control
exit from stem cell fate, leaf initiation, polarity, cytoplasmic growth, cell division,
endoreduplication, transition between division and expansion, expansion and
differentiation and their regulation by intercellular signaling molecules, including plant
hormones, sugars, peptides, proteins and microRNAs. We discuss to what extent the
knowledge available in the literature is suitable to be applied in systems biology
approaches to model the process of leaf growth, in order to better understand and predict
leaf growth starting with the model species Arabidopsis thaliana.
Leaf development: a cellular perspective
12
Introduction
Understanding the regulation of plant growth and its constituent organs is an important
objective in biology. It forms the basis for crop yield, turn-over in ecosystems and the
means for the plant to adapt to environmental conditions and experimental treatments.
The development of leaves in dicotyledonous plant species is an intriguing process,
resulting from a complex interplay of a multitude of regulatory pathways. On the one hand
it is so strictly regulated that the resultant leaf morphology is a reliable characteristic for
taxonomic classification. On the other hand however, the process is so plastic that
environmental factors can affect mature leaf size by an order of magnitude. Curiously, leaf
shape is often largely conserved between related species with genetic variations in
thousands of genes, while a single mutation can sometimes induce morphological
differences similar to those that distinguish species and even families (e.g. Barkoulas et al.,
2008). Due to these intriguing characteristics and the importance of leaves for plant
performance and function, many aspects of leaf development have been extensively
studied.
In recent decades, remarkable progress has been made in understanding the regulation of
leaf development via molecular/genetic approaches. Moreover, increasing use of high-
throughput technologies is constantly providing new biological information at various
organizational levels. In this context, systems biology provides a means to integrate the
accumulating knowledge into holistic mechanistic models to get a complete understanding
of biological processes. These models are often implemented through computer
simulations of normal and/or experimentally perturbed systems to test how well they
resemble the real situation and increase our understanding of its mechanistic basis.
A mechanistic understanding of leaf development should encompass an integrated view on
the regulatory networks that control developmental decisions and processes of cells as
they migrate in space and time from the shoot apical meristem (SAM) to their final position
in the leaf (Figure 1). Therefore, we review the subsequently acting developmental
Leaf development: a cellular perspective
13
networks that guide individual cells on their way from the SAM to their differentiated state
somewhere in a fully differentiated leaf. Based on this description we delineate to what
extent we understand how variations in the regulation at the cell level affect the shape and
size of the leaf as a whole, and what the implications are for implementing this knowledge
into fully-fledged simulation models.
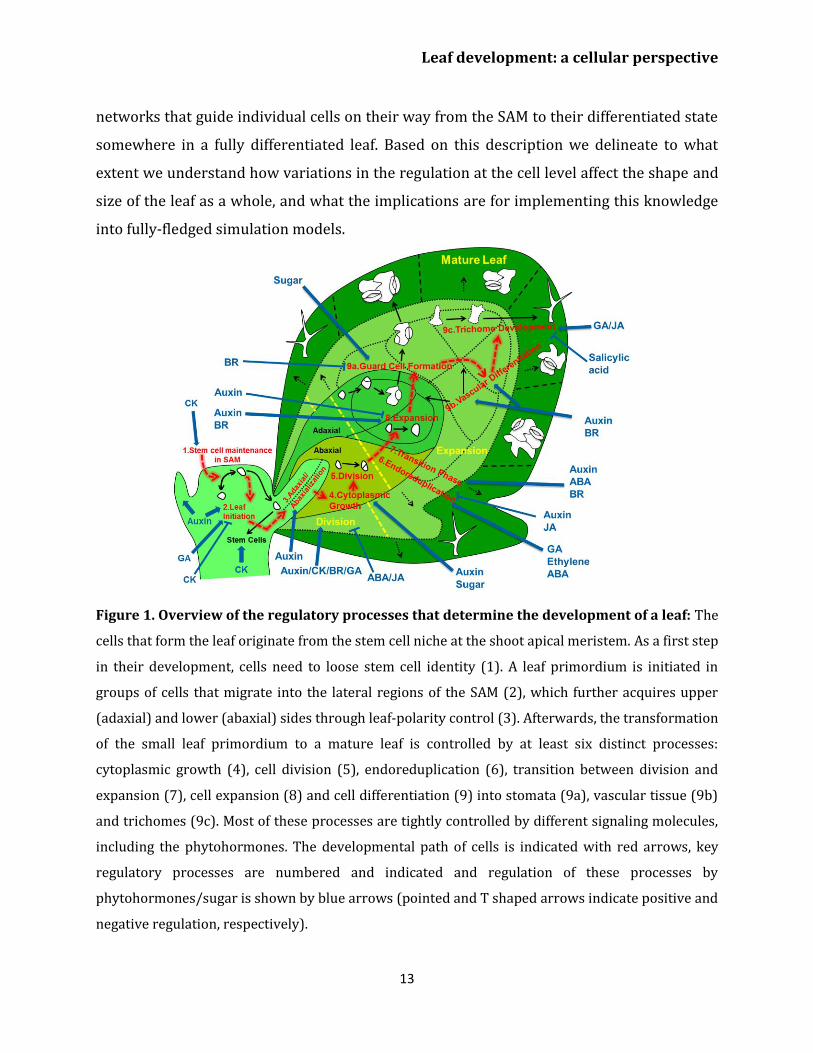
Figure 1. Overview of the regulatory processes that determine the development of a leaf: The
cells that form the leaf originate from the stem cell niche at the shoot apical meristem. As a first step
in their development, cells need to loose stem cell identity (1). A leaf primordium is initiated in
groups of cells that migrate into the lateral regions of the SAM (2), which further acquires upper
(adaxial) and lower (abaxial) sides through leaf-polarity control (3). Afterwards, the transformation
of the small leaf primordium to a mature leaf is controlled by at least six distinct processes:
cytoplasmic growth (4), cell division (5), endoreduplication (6), transition between division and
expansion (7), cell expansion (8) and cell differentiation (9) into stomata (9a), vascular tissue (9b)
and trichomes (9c). Most of these processes are tightly controlled by different signaling molecules,
including the phytohormones. The developmental path of cells is indicated with red arrows, key
regulatory processes are numbered and indicated and regulation of these processes by
phytohormones/sugar is shown by blue arrows (pointed and T shaped arrows indicate positive and
negative regulation, respectively).
Leaf development: a cellular perspective
14
Process That Control Leaf Growth
The development of a leaf is a dynamic process where independent regulatory pathways
instruct component cells at different stages of their development to make differentiation
switches and to regulate the rate at which developmental processes are executed. Each of
these regulatory control points is essential to steer the development of individual cells.
When integrated over the entire cell population of a leaf, its growth and ultimately size and
shape are emergent properties that can be compared to real leaves. Because developmental
signals are perceived and executed at the level of individual cells, it is essential to
understand how these signals are integrated in the leaf developmental process, which can
be achieved by modeling the path of an individual cell (and its progeny) from shoot apical
meristem to the mature leaf. Although many of the pathways involved have been
extensively reviewed, to our mind the perspective of the individual cells has not been
explored systematically. Therefore the main aim of the present review is to provide this
cellular perspective to leaf development.
The shoot apical meristem (SAM)
The SAM is the source of all cells that ultimately form the shoot, including the subset that
ends up building the leaves. Generally, cells in the central zone (CZ) of the SAM divide at a
relatively low rate and remain in an undifferentiated state, whereas cells at the peripheral
zone (PZ) divide faster and differentiate into organs such as leaves, axillary nodes and
floral parts (Braybrook and Kuhlemeier, 2010; Veit, 2004). In dicots, the SAM consists of
three layers L1, L2 and L3; epidermal (L1) and subepidermal (L2) layers are known as
tunica and the inner layer (L3) is called the corpus (Satina et al., 1940).
From the cellular perspective, on-going (slow) division in the stem cell niche will cause
cells to become displaced away from the quiescent centre, where at some well-defined
place they lose their stem cell fate and acquire the actively dividing state. This transition is
controlled by the interplay of a regulatory loop involving the homeodomain transcription
factor WUSCHEL (WUS) in the rib zone (RZ) and CLAVATA gene products (CLV1, CLV2 and
Leaf development: a cellular perspective
15
CLV3) expressed in the central zone (CZ) of the SAM (Brand et al., 2000; Carles and
Fletcher, 2003; Schoof et al., 2000; Yadav and Reddy, 2011). The WUS and CLV based
pathway operates through two mobile signals: CLV3 and a hypothetical WUS mediated
signal (Figure 2). CLV3 encodes a small secreted ligand that is produced specifically in L1
and L2 cells, and moves into the underlying L3 cells where it binds with receptor like
proteins CLV1 (LRR receptor kinase) and/or CLV2 (receptor-like protein), which in turn
inhibit WUS activity (Carles and Fletcher, 2003; Clark, 2001). WUS activity in the L3 cells
induces the production of a non-cell-autonomous signal that moves to the stem cells and
activates the expression of CLV3 there (Braybrook and Kuhlemeier, 2010; Haecker and
Laux, 2001). It was proposed that the L1 produced miR394 signal is necessary for spatial
organization of the SAM. This mobile microRNA regulates WUS mediated stem cell
maintenance by inhibition of F box protein LEAF CURLING RESPONSIVENESS (LCR)
(Knauer et al., 2013).
Upon mutation in WUS the stem cells precociously transit into the peripheral actively
dividing zone, ultimately consuming the stem cell niche and thereby the meristem.
Inversely, in clv1 and clv3 mutants WUS activity of SAM cells is maintained much longer,
whereby the stem cell niche and consequently the SAM as a whole enlarge dramatically
(Laux et al., 1996; Steven E. Clark, 1993, 1995). Several mathematical models have focused
on the WUS-CLV interaction, predicting to various degrees how their expression domains
are modulated through mutation or misexpression (Hohm et al., 2010; Jonsson et al., 2005;
Nikolaev et al., 2007). Recent experimental studies supported by mathematical modeling
have shown that WUS movement is essential for direct transcriptional repression of the
differentiation program (Yadav et al., 2013) as well as in restricting its own accumulation
through activating its negative regulator CLV3 (Yadav et al., 2011).
Leaf development: a cellular perspective
16
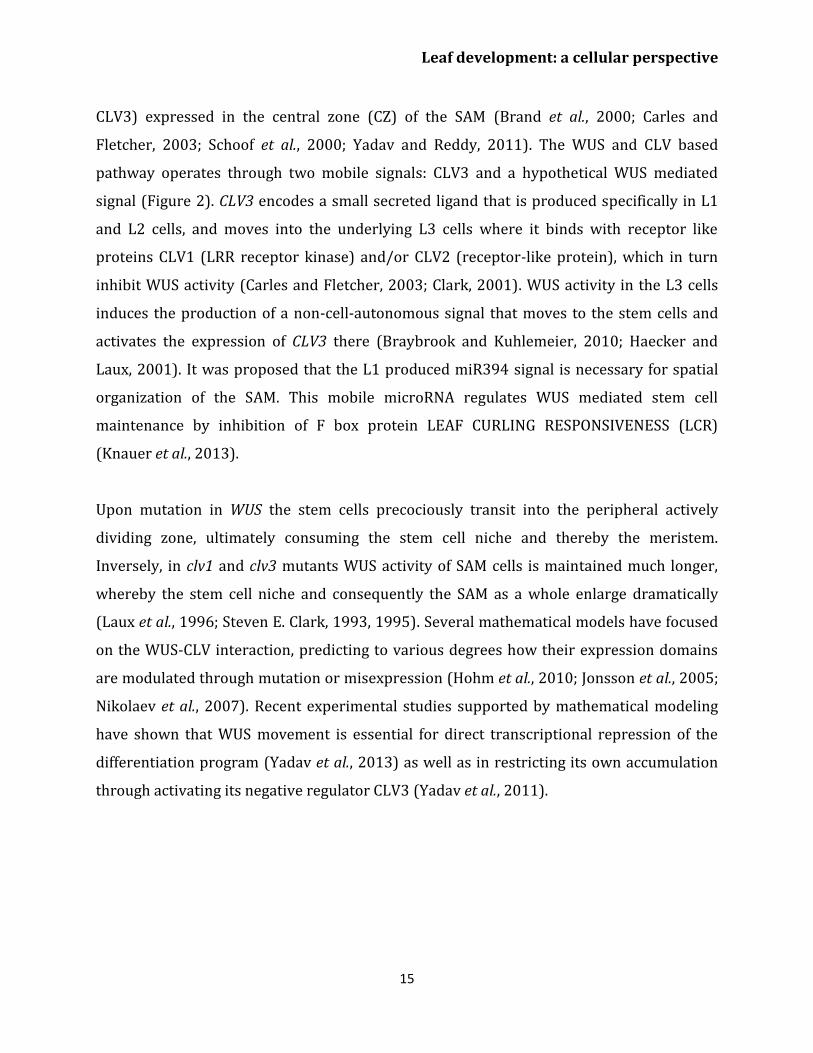
Figure 2. Maintenance of stem cells in shoot apical meristem: The SAM is organized in three
functional zones [central zone (CZ), peripheral zone (PZ) and rib zone (RZ)] and three layers where
the antagonistic relation between WUS and CLV is essential to preserve cells in the meristem. WUS
activates CLV3, which further binds with CLV1/2 and in turn inhibits expression of WUS. Cytokinin
positively controls WUS expression where ARRs are negative regulators of cytokinin and are
inhibited by WUS. The L1 specific miR394 negatively affects the LCR protein, which interferes in
WUS/CLV based stem cell maintenance (pointed and T shaped arrows indicate positive and
negative regulation, respectively).
It has been postulated that signaling by the plant hormone cytokinin regulates WUS
expression via CLV-dependent and CLV-independent mechanisms (Gordon et al., 2009) to
promote SAM growth and maintenance with WUS repressing the transcription of
ARABIDOPSIS type-A RESPONSE REGULATORS (ARRs), which are the negative regulators of
cytokinin signaling (Leibfried et al., 2005; Sablowski, 2007; Figure 2) (Figure 2). Indeed,
mutations in cytokinin receptors (Higuchi et al., 2004) and over-expression of the cytokinin
dehydrogenase gene family of Arabidopsis (AtCKX) (Werner et al., 2003) reduce meristem
size and leaf area, indicating a relation between the SAM and leaf size. It appears however
that that the number of leaf founder cells is not an important determinant of the final leaf
size. For instance, a meta-analysis across a wide range of cactus species indicates that the
size of the SAM correlates closely to the number of leaves formed and has only minor
implications for their ultimate size (Mauseth, 2004).
Leaf development: a cellular perspective
17
Leaf initiation
Once progenitor cells are outside the stem cell niche, they need to decide whether they will
contribute to the main axis or will differentiate into lateral appendices such as leaf
primordia. This decision is primarily governed by the accumulation of the plant hormone
auxin it’s influx carrier [AUXIN RESISTANT (AUX1)] and its PIN1 (PIN-FORMED1) efflux
transporter (Bayer et al., 2009; Guenot et al., 2012). The efflux carriers orient the transport
of auxin towards neighboring cells with a higher auxin concentration, leading to the
formation of accumulation patterns across the cell population. Several mathematical
modeling studies (reviewed in De Vos et al., 2012) have simulated phyllotactic patterning
based on feedback interactions between auxin and PIN distribution. Some models postulate
that AUX1 creates auxin accumulation mainly in L1 layer cells, whereas PIN1 is initially
localized in the protodermal (L1) layer cells and causes drainage of auxin towards the base
of the shoot by inducing vascular strand differentiation in L2/3 layer cells of the SAM (de
Reuille et al., 2006; Reinhardt et al., 2003) (Figure 3).
Arabidopsis leaf differentiation from the apical meristem is abolished in the auxin
biosynthetic triple mutant yuc1 yuc4 pin1 (Cheng et al., 2007), whereas longer plastochron
and irregular vegetative growth occurs in the pin1 mutant (Guenot et al., 2012). Cells in the
SAM, which serve as a stem cell population, differ from the cells in the leaf primordium.
This distinction is controlled by complex and still poorly characterized regulatory
networks in which the antagonistic relation between two families of transcription factors,
KNOX1 (KNOTTED-like homeobox) and ARP (ASYMMETRIC LEAF1/ROUGH
SHEATH2/PHANTASTICA) proteins (Byrne et al., 2002; Hay and Tsiantis, 2006, 2010)
plays a crucial role (Figure 3). KNOX is expressed in all meristem cells except those at the
site of the organ initiation (Jackson et al., 1994; Long et al., 1996), whereas the (ARP family)
AS1 mRNA is expressed in the primordia forming cells, but not in the meristem (Byrne et
al., 2000). KNOX1 is required to maintain undifferentiated cells in the SAM (Scofield and
Murray, 2006) and increases cytokinin biosynthesis (Yanai et al., 2005), whereas ARP
initiates differentiation in the leaf primordium (Byrne et al., 2002). High levels of auxin
restrain cytokinin biosynthesis by the repression of KNOX1 activity (Su et al., 2011) (Figure
Leaf development: a cellular perspective
18
3). High auxin and AS1 expression also suppress the expression of the KNOX gene
BREVIPEDICELLUS (BP), which is required for leaf initiation (Hay et al., 2006). In
Arabidopsis, the KNOX1 gene SHOOTMERISTEMLESS (STM) acts antagonistically with ARP
gene products to control the induction of leaf primordia. The loss of function mutant stm
fails to produce a SAM, also preventing leaf formation (Long et al., 1996), whereas the as1
and as2 mutants have small and round leaves (Byrne et al., 2002).
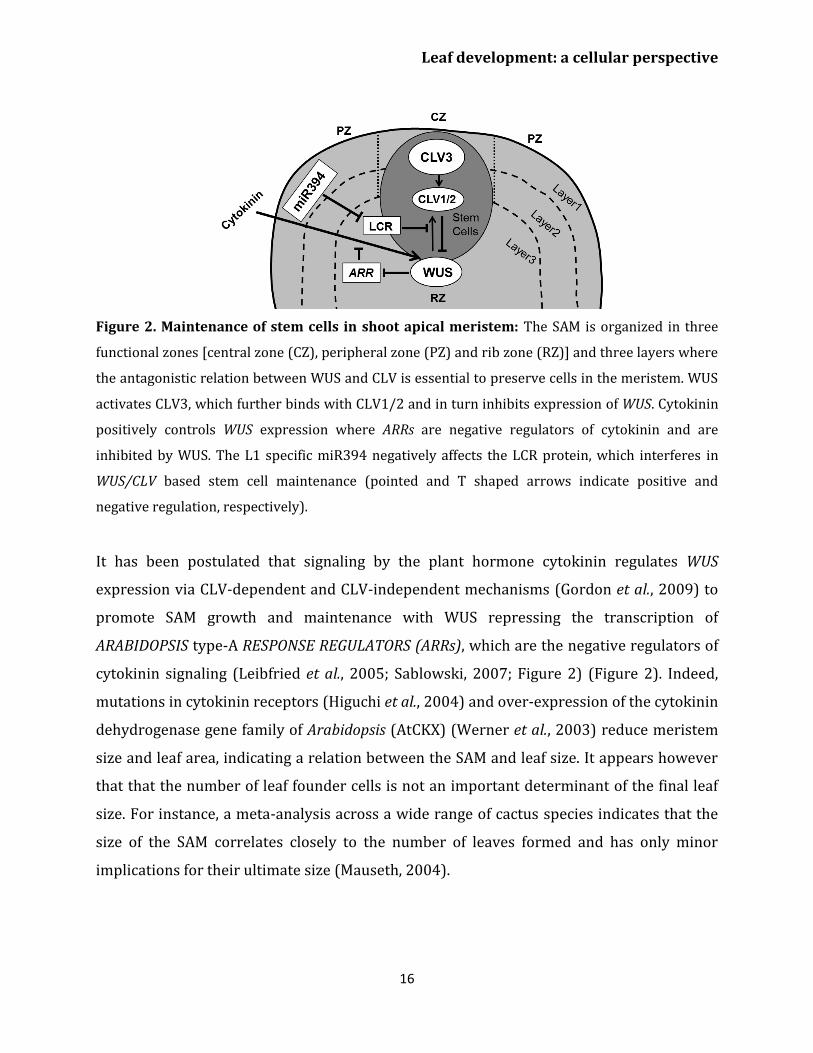
Figure 3. Decision of leaf initiation: Accumulation peaks of auxin at the flank of the SAM through
PIN1/AUX1 mediate polar auxin transport, triggers development of a primordium where KNOX1
plays key role in stem cell maintenance. Additionally, KNOX1 positively regulates CK whereas it
negatively affects GA signaling through IPT7 and GA20 oxidases respectively. Opposite to it, ARP
regulates the emergence of a young primordium (pointed and T shaped arrows indicate positive
and negative regulation, respectively).
It has been demonstrated that the KNOX proteins trigger cytokinin (CK) biosynthesis
through the activation of IPT7 (encodes the CK biosynthetic enzyme isopentenyl
transferase) and repress the transcription of gibberellin (GA) biosynthetic genes that
encode GA20-oxidases (Jasinski et al., 2005; Sakamoto et al., 2001) (Figure 3). Thus, high
CK and low GA maintain stem cell identity in SAM cells by preventing cell differentiation
(Gordon et al., 2009; Veit, 2009).
Leaf development: a cellular perspective
19
Leaf polarity
After acquiring ‘leaf’ identity, the cells in the primordium have to develop a polarity
gradient along the dorso-ventral axis. Once the position of the leaf primordium is
established, a further increase in cell proliferation rates stimulates primordium outgrowth
from the SAM. If this growing primordium is removed by tangential incision, another
primordium arises which is cylindrical and abaxialized (lacking a flat leaf blade). This
highlights the importance of signals originating in the SAM and received by cells in the
primordium to determine polarity. This so called Sussex signal is yet to be identified
(Sussex, 1951). Waites and Hudson (1995) proposed that the dorsal and ventral sides of
the leaf are specified in the early development of the leaf primordium, when it is still
located within the SAM. They showed that the PHAN gene (encoding a MYB type
transcription factor) in Antirrhinum majus is involved in ab/ad-axial leaf polarity.
Subsequently the phabulosa-1 (phb-1d) mutant was characterized in Arabidopsis, whose
leaves were unable to develop a blade and were radially symmetrical (McConnell and
Barton, 1998).
Our knowledge of the regulation of antagonistic transcription factors specifying upper and
lower sides has greatly increased, but the molecular signals exchanged between cells on
both sides of the primordium to create this polarity are yet to be identified. Adaxial domain
identity is determined by the expression of PHABULOSA (PHB), PHAVOLUTA (PHV) and
REVOLUTA (REV) genes, which encode class III homeodomain-leucine zipper (HD-ZIPIII)
proteins (McConnell et al., 2001). The identity of cells in the abaxial domain depends on the
expression of KANADI (KAN; which encodes a Golden2/Arabidopsis response-
regulator/Psr1 (GARP) transcription factor) (Eshed et al., 2001; Kerstetter et al., 2001) and
the YABBY gene family (Eshed et al., 2004; Siegfried et al., 1999). These two classes of genes
produce signals that suppress each other’s expression: the expression of PHB/PHV/REV
genes in cells located at the abaxial side is inhibited by KAN and inversely KAN expression
in abaxially located cells in inhibited by the activity of PHB/PHV/REV genes, providing a
feedback communication between the two sides (Tsukaya, 2013b) (Figure 4).
Leaf development: a cellular perspective
20
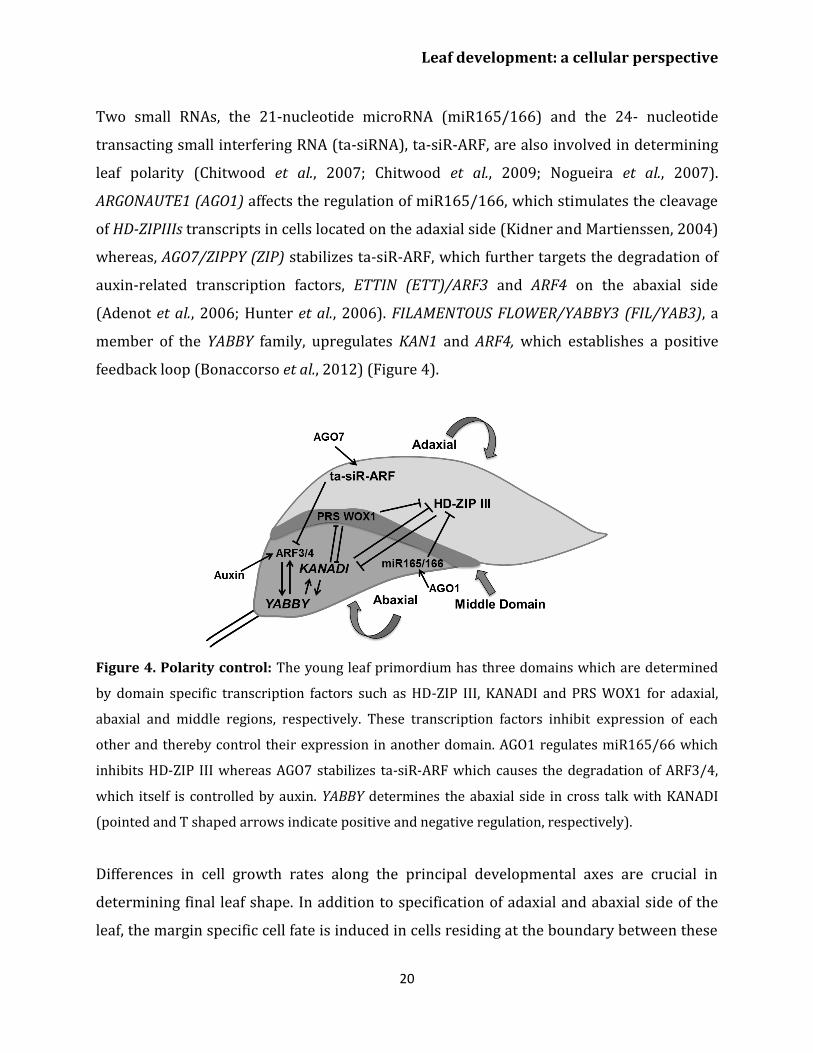
Two small RNAs, the 21-nucleotide microRNA (miR165/166) and the 24- nucleotide
transacting small interfering RNA (ta-siRNA), ta-siR-ARF, are also involved in determining
leaf polarity (Chitwood et al., 2007; Chitwood et al., 2009; Nogueira et al., 2007).
ARGONAUTE1 (AGO1) affects the regulation of miR165/166, which stimulates the cleavage
of HD-ZIPIIIs transcripts in cells located on the adaxial side (Kidner and Martienssen, 2004)
whereas, AGO7/ZIPPY (ZIP) stabilizes ta-siR-ARF, which further targets the degradation of
auxin-related transcription factors, ETTIN (ETT)/ARF3 and ARF4 on the abaxial side
(Adenot et al., 2006; Hunter et al., 2006). FILAMENTOUS FLOWER/YABBY3 (FIL/YAB3), a
member of the YABBY family, upregulates KAN1 and ARF4, which establishes a positive
feedback loop (Bonaccorso et al., 2012) (Figure 4).
Figure 4. Polarity control: The young leaf primordium has three domains which are determined
by domain specific transcription factors such as HD-ZIP III, KANADI and PRS WOX1 for adaxial,
abaxial and middle regions, respectively. These transcription factors inhibit expression of each
other and thereby control their expression in another domain. AGO1 regulates miR165/66 which
inhibits HD-ZIP III whereas AGO7 stabilizes ta-siR-ARF which causes the degradation of ARF3/4,
which itself is controlled by auxin. YABBY determines the abaxial side in cross talk with KANADI
(pointed and T shaped arrows indicate positive and negative regulation, respectively).
Differences in cell growth rates along the principal developmental axes are crucial in
determining final leaf shape. In addition to specification of adaxial and abaxial side of the
leaf, the margin specific cell fate is induced in cells residing at the boundary between these
Leaf development: a cellular perspective
21
two surfaces (McHale, 1993). In contrast to regulation of leaf blade outgrowth, the
influence of ad/abaxial specific genes on marginal cells is yet to be explored. Recently,
middle leaf domain specific WUSCHEL-RELATED HOMEOBOX (WOX) genes were reported,
which affect leaf blade outgrowth and margin specific development (Figure 4). These
transcription factors (WOX1 and PRESSED FLOWER (PRS) i.e. WOX3) are repressed by
KANADI. The loss of function of WOX1 and PRS causes instable organization of ad-abaxial
polarity (Nakata et al., 2012; Nakata and Okada, 2012).
A relatively simple computational model supported by time-lapse data and clonal analysis
by Kuchen et al. (2012) accounts for local differences in cell growth rates and direction
driving organ level shape changes during early Arabidopsis leaf development. A central
model assumption is a yet uncharacterised early tissue polarity system that deforms during
growth. CUP-SHAPED COTYLEDON (CUC) genes are emerging as prime candidate organizers
of tissue polarity (Hasson et al., 2011). Correspondence of cell polarity and PIN1 auxin
transporter patterns points to their involvement in such an organizer-based model
(Scarpella et al., 2006). Moreover, it was reported that the outgrowth of lobes at the leaf
margin is specified by a local auxin maximum as a result of the polar distribution of the
PIN1 transporter (Hay et al., 2006). The transcription factor CUC2 which is expressed at the
leaf sinuses and is negatively regulated by miR164 (Nikovics et al., 2006), promotes the
generation of these PIN1-dependent auxin maxima, which was supported by computer
simulations (Bilsborough et al., 2011). Recently, a homeodomain protein REDUCED
COMPEXITY (RCO) was reported to enhance serration by repressing growth at the flanks of
initiating leaves (Vlad et al., 2014). Interestingly, CUC2, PIN1, TCP (TEOSINTE BRANCHED/
CYCLOIDEA/PCF) and KNOX have been implicated in compound leaf development
illustrating that this regulatory system has the capacity to take more extreme forms than
observed in Arabidopsis leaves (Barkoulas et al., 2008; Hay and Tsiantis, 2010; Koyama et
al., 2010). A better understanding of the regulatory mechanisms operating at the cell level
during the early phases of leaf outgrowth will likely provide invaluable insights into how
diverse leaf morphologies are established.
Leaf development: a cellular perspective
22
Cytoplasmic growth
In contrast to the morphology of the leaf primordium, the final size and shape of the leaf
differ widely among species. Differences in leaf outgrowth are often interpreted as the
result of cell division producing a certain number of cells and subsequent cell expansion
determining their mature size. However, this is an overly simplistic view. Firstly, the
relationship between cell division and expansion is complex and the two processes can
mutually compensate each other (Beemster et al., 2003; Tsukaya, 2002). A theoretical
framework to understand this phenomenon was provided by Green (1976), who proposed
that cell growth and partitioning (division sensu-strictu) are two processes that co-occur in
proliferating cells, whereas in expanding cells cell-growth continues in absence of
partitioning. Clearly, this framework allows for continued growth irrespective of inhibited
or stimulated cell division activity, at least until cells get too small or too large to function
normally. However, the view that cell growth in proliferating cells is equivalent to that in
expanding cells is overly simplistic. It is clear that whereas dividing cells grow by
increasing cytoplasmic volume, expanding cells primarily increase their internal volume by
expanding their vacuolar volume.
Cytoplasmic growth is mainly based on macromolecular synthesis and therefore consumes
a lot of energy. A crucial role in ensuring a sufficient supply of elementary building blocks is
played by the TOR pathway. Target of Rapamycin (TOR), a Serine/Threonine kinase of the
phosphatidylinositol-3-kinase-related kinase (PIKK) family is an essential controller of
cytoplasmic growth and metabolism in plant cells. It controls a range of cellular responses
such as ribosome biogenesis, translational initiation, cell proliferation, cell expansion and
autophagy (Sablowski and Dornelas, 2013; Zhang et al., 2013) (Figure 5).
Leaf development: a cellular perspective
23
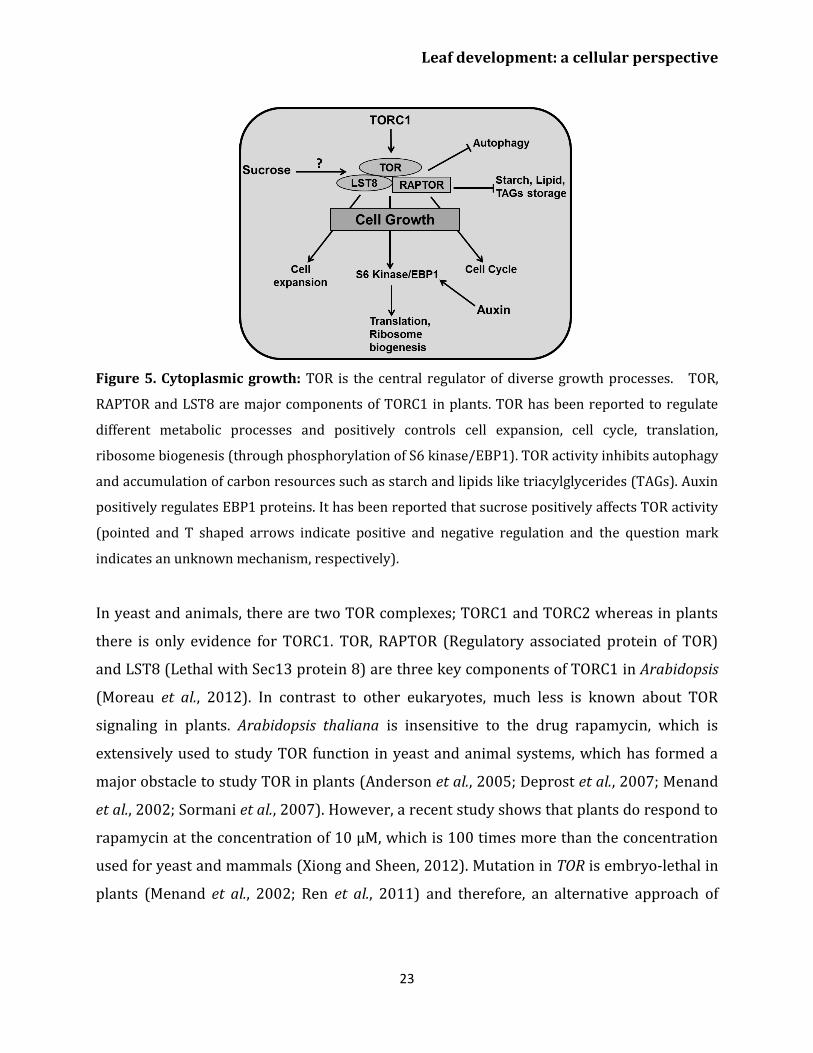
Figure 5. Cytoplasmic growth: TOR is the central regulator of diverse growth processes. TOR,
RAPTOR and LST8 are major components of TORC1 in plants. TOR has been reported to regulate
different metabolic processes and positively controls cell expansion, cell cycle, translation,
ribosome biogenesis (through phosphorylation of S6 kinase/EBP1). TOR activity inhibits autophagy
and accumulation of carbon resources such as starch and lipids like triacylglycerides (TAGs). Auxin
positively regulates EBP1 proteins. It has been reported that sucrose positively affects TOR activity
(pointed and T shaped arrows indicate positive and negative regulation and the question mark
indicates an unknown mechanism, respectively).
In yeast and animals, there are two TOR complexes; TORC1 and TORC2 whereas in plants
there is only evidence for TORC1. TOR, RAPTOR (Regulatory associated protein of TOR)
and LST8 (Lethal with Sec13 protein 8) are three key components of TORC1 in Arabidopsis
(Moreau et al., 2012). In contrast to other eukaryotes, much less is known about TOR
signaling in plants. Arabidopsis thaliana is insensitive to the drug rapamycin, which is
extensively used to study TOR function in yeast and animal systems, which has formed a
major obstacle to study TOR in plants (Anderson et al., 2005; Deprost et al., 2007; Menand
et al., 2002; Sormani et al., 2007). However, a recent study shows that plants do respond to
rapamycin at the concentration of 10 µM, which is 100 times more than the concentration
used for yeast and mammals (Xiong and Sheen, 2012). Mutation in TOR is embryo-lethal in
plants (Menand et al., 2002; Ren et al., 2011) and therefore, an alternative approach of
Leaf development: a cellular perspective
24
inducible knockout for conditional inhibition of TOR have to be used for functional studies
(Caldana et al., 2013; Deprost et al., 2007).
An Arabidopsis T-DNA insertion line which overexpresses AtTOR produces bigger leaves
containing larger cells (Deprost et al., 2007). Accordingly, downregulation of TOR by
inducible artificial microRNA produced smaller leaves with fewer cells along with
upregulation of metabolic pathways like the Krebs cycle. These lines also accumulated
storage products such as starch and lipids like triacylglycerides (TAGs) displaying reduced
growth (Caldana et al., 2013). Mutation of LST8, a member of the TOR complex (TORC1)
decreased plant size by producing fewer and smaller leaves alongside a higher amount of
starch and amino acids and reduced sucrose concentrations. Moreover, downregulation of
genes involved in cell wall formation like expansins and CELLULOSE SYNTHASE-LIKE G3 in
this mutant demonstrates a role for TOR in cell expansion (Moreau et al., 2012). The TORC1
component RAPTOR accumulates in dividing and expanding cells whereas mutation in
AtRaptor1B slows down the leaf initiation. A double mutant of AtRaptor1A and AtRaptor1B
exhibited normal seedling growth, but was unable to maintain post embryonic
development (Anderson et al., 2005).
TORC1 promotes the phosphorylation of S6 kinase (S6K) and eIF4E-binding proteins (E-
BP1), which controls translation and ribosome biogenesis (Krizek, 2009). Again, auxin is
involved through the regulation of EBP1 protein stability in Arabidopsis (Horvath et al.,
2006) (Figure 5). TORC1 also regulates autophagocytosis which ensures synthesis,
degradation and recycling of cellular components (Sablowski and Dornelas, 2013). Recent
studies have revealed that the TOR pathway is an essential controller for cellular
development, which regulates cell expansion and cell cycle simultaneously. The TOR
pathway is directly connected to cell cycle regulation by mediating E2Fa phosphorylation
and activation of DNA synthesis genes (Xiong et al., 2013) and regulates cell wall
modification and degradation processes like senescence and autophagy (Caldana et al.,
2013). Importantly, there is a link between the TOR pathway and the nutrient status. TOR
Leaf development: a cellular perspective
25
plays a central role in connecting growth related genes to glucose signaling (Xiong et al.,
2013).
Given this central role in connecting growth regulation to nutritional status, the TOR
pathway is a key regulatory hub in organ development. Although molecular insight of its
functioning in animal systems is rapidly increasing, currently we are not aware of
mechanistic models that include this knowledge, a void that we expect to be filled in the
coming years.
Cell division
In addition to cell volume increase by cytoplasmic growth, cell proliferation exponentially
increases the number of cells in the developing leaf. In general cell growth needs to be
sufficiently balanced by cell division for stable tissue growth (Sablowski and Dornelas,
2013). The cell division cycle is a unidirectional process, tightly regulated by a molecular
mechanism that is largely conserved between all eukaryotes (Dewitte and Murray, 2003;
Inze and De Veylder, 2006; Inze et al., 1999) (Figure 6).
The plant cell cycle is controlled by the activity of complexes consisting of a cyclin-
dependent kinase as the catalytic subunit and a cyclin as the regulatory subunit. CDKA (A-
type cyclin dependent kinase) and CYCD (D-type cyclin) are central to the G1/S phase
transition in which the cell activates DNA duplication. CDKA is a key protein to control cell
division in Arabidopsis thaliana, and is present at a constant level throughout the cell cycle
(Gaamouche et al., 2010; Joubes et al., 2004; Porceddu et al., 2001). Overexpression of a
dominant negative CDKA;1 of Arabidopsis thaliana in tobacco plants inhibited cell division
rate, resulting in the formation of fewer, but larger cells resulting in an overall reduction of
leaf area (Hemerly et al., 1995). It has also been demonstrated that the CDKA;1 activity
maintains the SAM cells in an undifferentiated state. Expressing a dominant negative allele
of CDKA;1 in the SHOOTMERISTEMLESS (STM) domain of the shoot apex produces smaller
leaves with a reduced number of epidermal cells (Gaamouche et al., 2010). Interestingly,
irregularly shaped epidermal cells observed in a CDKA;1 dominant negative mutant
Leaf development: a cellular perspective
26
expressed from the STM promoter point towards CDKA influencing cell wall and
cytoskeleton properties (Borowska-Wykret et al., 2013). A triple cycd3;1-3 loss of function
mutant in the Arabidopsis leaf shows a decreased cell number and reduced cytokinin
response (Dewitte et al., 2007). The plant hormones auxin, cytokinin (CK), brassinosteroid
(BR) and gibberellins (GAs) increase the level of CYCD, thereby activating CDKA (Francis
and Sorrell, 2001; Inze and De Veylder, 2006; Perrot-Rechenmann, 2010; Riou-Khamlichi et
al., 1999). The repression of ABP1 (AUXIN BINDING PROTEIN1) negatively influences
transcript levels of D-type cyclins, which results in impaired cell division in the leaf (Braun
et al., 2008), whereas brassinosteroids upregulate the expression of CYCD3 and promote
cell division through a mechanism that requires de novo protein synthesis (Hu et al., 2000).
The BR biosynthesis mutant det2 (de-etiolated2 = cro1) and dwf1 (dwarf1 = cro2) produce
fewer cells and a smaller leaf, which can be reversed by brassinolide application, indicating
a dual role of BR in division and expansion (Nakaya et al., 2002).
The activity of CDKA/CYCD complexes is itself controlled by CDK activating kinases CDKD
and CDKF coupled with CYCH, which activates the complex through a phosphorylation
cascade. CDKF;1 was also found to activate CDKD;2 and CDKD;3 by T-loop phosphorylation
(Takatsuka et al., 2009; Umeda et al., 2005). The active CDKA/CYCD complex triggers the
dissociation of E2F/DP heterodimeric complex from RBR (retinoblastoma-related protein)
through phosphorylation. Additionally, it initiates the destruction of E2Fc/DP/RBR
transcriptional repressor complex by the Skp-Cullin1-F-Box (SCF) E3-ubiquitin protein
ligase (Inze and De Veylder, 2006). The RBR protein regulates the activity of E2F
transcription factors to control cell proliferation. It is an essential regulator of the cell cycle
to coordinate between cell division, differentiation and homeostasis (Borghi et al., 2010;
Desvoyes et al., 2006). Once the E2F/DP complex is separated from RBR, it initiates G1 to S
transition by activating the transcription of genes required for DNA duplication.
Furthermore, the E2F-like DEL transcription factors compete with E2F/DP for DNA binding
sites (Figure 6).
Leaf development: a cellular perspective
27
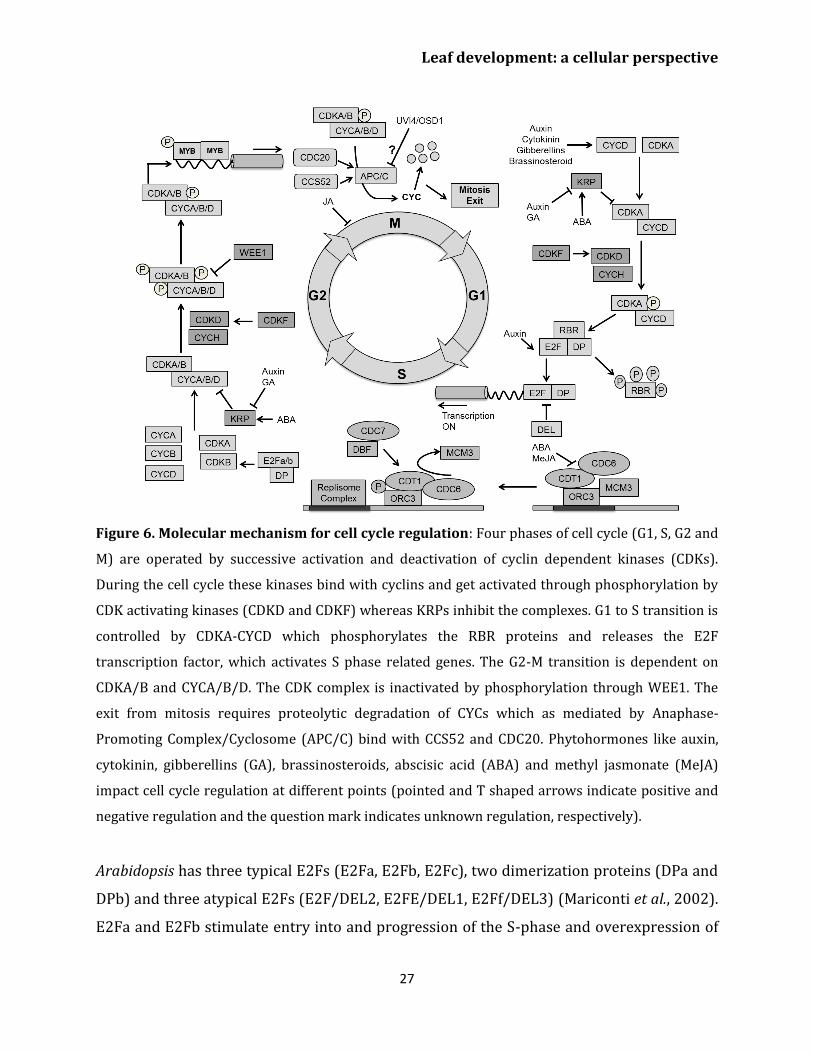
Figure 6. Molecular mechanism for cell cycle regulation: Four phases of cell cycle (G1, S, G2 and
M) are operated by successive activation and deactivation of cyclin dependent kinases (CDKs).
During the cell cycle these kinases bind with cyclins and get activated through phosphorylation by
CDK activating kinases (CDKD and CDKF) whereas KRPs inhibit the complexes. G1 to S transition is
controlled by CDKA-CYCD which phosphorylates the RBR proteins and releases the E2F
transcription factor, which activates S phase related genes. The G2-M transition is dependent on
CDKA/B and CYCA/B/D. The CDK complex is inactivated by phosphorylation through WEE1. The
exit from mitosis requires proteolytic degradation of CYCs which as mediated by Anaphase-
Promoting Complex/Cyclosome (APC/C) bind with CCS52 and CDC20. Phytohormones like auxin,
cytokinin, gibberellins (GA), brassinosteroids, abscisic acid (ABA) and methyl jasmonate (MeJA)
impact cell cycle regulation at different points (pointed and T shaped arrows indicate positive and
negative regulation and the question mark indicates unknown regulation, respectively).
Arabidopsis has three typical E2Fs (E2Fa, E2Fb, E2Fc), two dimerization proteins (DPa and
DPb) and three atypical E2Fs (E2F/DEL2, E2FE/DEL1, E2Ff/DEL3) (Mariconti et al., 2002).
E2Fa and E2Fb stimulate entry into and progression of the S-phase and overexpression of
Leaf development: a cellular perspective
28
these transcription factors leads to an enlarged phenotype due to enhanced cell
proliferation (De Veylder et al., 2002; Sozzani et al., 2006). Auxin positively regulates E2Fb
protein levels (Magyar et al., 2005). Additionally, the AXR1 transcript level was found to be
high in an E2Fb overexpression line (Sozzani et al., 2006). On the other hand, E2Fc is a
negative regulator of the S-phase where a decreased level leads to leaves and cotyledons
with more but smaller cells (del Pozo et al., 2006). Auxin affects the E2Fc protein level in
Arabidopsis. Mutation in the AXR1 gene leads to impaired modification of the CUL1 protein,
a structural component of the E3-SCF complex, with the Ub-related protein RUB, and shows
increased E2Fc protein levels (del Pozo et al., 2002). Atypical E2Fs/DELs are
transcriptional regulators for endoploidization, which act independently of DPs and RBR. It
is still unclear if they compete with typical E2Fs for binding sites or actively repress gene
transcription (Berckmans and De Veylder, 2009; Vlieghe et al., 2005).
Activated E2Fs in Arabidopsis target the expression of genes involved in DNA repair and
chromatin dynamics such as CDC6, CDT1, MCM3, ORC1 and ORC3, RNR, PCNA. However,
they also influence the expression of genes responsible for G2-M transition like CDKB1,
MYB and APC/C (Boudolf et al., 2004b; de Jager et al., 2001; Lammens et al., 2008; Naouar
et al., 2009; Ramirez-Parra et al., 2003; Vandepoele et al., 2005). Replication origin sites are
silenced in the G1 phase where CDC6 and CDT1 together with ORC allow the loading of
MCM to the replication origins; hence promoting the complex for activation of the S phase.
Later, the DBF-CDC7 complex phosphorylates ORC which then moves and exposes the
replication initiation site for the replisome complex, allowing replication to start (Blow and
Dutta, 2005; Francis, 2007). The plant hormone ABA negatively regulates the expression of
the CDT1a gene (Castellano Mdel et al., 2004). Methyl jasmonate (MeJA) was also reported
to affect initiation of DNA replication by inhibiting the pre-replication complex (Noir et al.,
2013) (Figure 6).
The Kip related proteins (KRPs) are direct inhibitors of CDK activity (ICKs). ICK1 inhibits
the CDKA/CYCD complex in response to negative stimuli like abscisic acid (ABA) (Van
Leene et al., 2011; Wang et al., 1998). Kinematic analysis showed that the overexpression
Leaf development: a cellular perspective
29
of KRP genes inhibits cell division rate, resulting in serrated leaves of reduced size with
fewer but enlarged cells (De Veylder et al., 2001; Kang et al., 2007). Beemster et al. (2006)
could simulate the effect on cell numbers using a computational model. Mutation of a single
KRP gene doesn’t have any effect on leaf growth, while downregulation of multiple KRP
genes increases final leaf area and cell proliferation (Cheng et al., 2013). The mechanism
behind this enhanced leaf growth is yet to be explained. Auxin and cytokinin activate CDKA
and CYCD, while KRP4 transcription is downregulated (Cho et al., 2010). It has been
reported that auxin signaling is translated into modified KRP expression through PRZ1-
mediated chromatin remodeling (Anzola et al., 2010). The mutual antagonistic effect of
CDKA;1 and KRPs was highlighted in a model of the G1/S transition control in pollen (Zhao
et al., 2012). The plant-specific F-box protein F-BOX LIKE 17 (FBL-17) is central in the
proposed regulatory network, in particular by mediating the degradation of KRP1,3,4,6,7
(Kim et al., 2008). The plant-specific SIM/SMR family also inhibits CDK activity in a number
of specific tissues, for instance the repression of the mitotic cycle in trichomes (Walker et
al., 2000). Gibberellin (GA) is proposed to promote mitotic cycles by lowering expression of
both KRP and SIM. CKIs act in a DELLA-dependent manner (Achard et al., 2009) and
enhance expression of E2Fe/DEL1 (Claeys et al., 2012).
After DNA duplication, cells enter the G2 phase to prepare them for division through
mitosis. CDKA and CDKB as well as CYCA, CYCB and CYCD are involved in this process. The
plant-specific B-type CDKs are subdivided into two groups: CDKB1 (with CDKB1;1 and
CDKB1;2) and CDKB2 (with CDKB2;1 and CDKB2;2). CDKB1 accumulates from late S to M
phase while CDKB2 is specifically expressed from G2 to M phase (Menges et al., 2005).
Overexpression of a dominant negative CDKB1;1 causes early exit from the M phase, which
increases the ploidy level in the leaf (Boudolf et al., 2004b). It has been reported that
CDKB1;1 forms a functional complex with CYCA2;3 to trigger mitosis in Arabidopsis
(Boudolf et al., 2009). Inhibition of CDKB2;1 and CDKB2;2 via the expression of an amiRNA
leads to a dwarf phenotype with an abnormal shoot apical meristem (Andersen et al.,
2008). Jasmonates (JAs) cause G2 arrest in tobacco (Nicotiana tabacum) Bright Yellow-2
cell cultures by reducing CYCB1;1 and CDKB (Swiatek et al., 2004). Similarly, inhibition of

Leaf development: a cellular perspective
30
mitotic phase genes by methyl JA causes G2 arrest in Arabidopsis cell cultures (Pauwels et
al., 2008).
An additional level of regulation of CDKA/CYCD complex activity involves inactivation
through phosphorylation by the WEE1 protein kinase. Overexpression of WEE1 inhibits
plant growth by arresting cell division (De Schutter et al., 2007). However, in plants WEE1
is probably not a core cell cycle regulator, but rather a DNA damage checkpoint kinase
(Dissmeyer et al., 2009).
Dissmeyer et al. (2009) have proposed and implemented alternative G2 phase modules in
the form of mathematical models starting from an existing generic model. The primitive
unicellular algae, Ostreococcus tauri, contain a bona fide CDC25, which antagonises WEE1
phosphorilation (Inze and De Veylder, 2006). In Arabidopsis a small CDC25 like
phosphatase can counteract the role of WEE1 kinase in vitro (Landrieu et al., 2004), but this
CDC25-like protein has arsenate reductase activity and is most likely not involved in cell
cycle regulation (Dissmeyer et al., 2010). The Arabidopsis genome therefore lacks a
functional copy of the CDC25 gene, which means that generic cell cycle models (Novak and
Tyson, 1993) need to be adapted to reflect the situation in plants.
Similar to the G1 phase, the CDK/CYC complex can be activated in G2 by a CDK-activating
kinase pathway, involving CDKF and CDKD coupled with CYCH. The activated CDK/CYC
complex promotes MYB repeat (MYB3R) transcription factors to bind with M phase Specific
Activators (MAS) elements at the promoter region of the target genes. Afterwards, MYB3R
phosphorylation activates the expression of M phase specific genes such as KNOLLE, CDC20,
CYCA and CYCB and NACK1 (Berckmans and De Veylder, 2009) (Figure 6).
There are two E3 ubiquitin ligase complexes involved in cell cycle control, SKPL-CULLIN-F-
BOX-PROTEIN (SCF) and ANAPHASE-PROMOTING COMPLEX/CYCLOSOME (APC/C), which
mark targets for degradation by the 26S proteasome. In analogy to the SCF complex playing
an important role in G1 to S phase by degrading cell cycle inhibitors (KRPs) (Fulop et al.,
Leaf development: a cellular perspective
31
2005; Hershko, 2005; Ren et al., 2008) the APC/C is essential for the G2 to M transition. The
exit from the M phase is regulated by the degradation of cyclins through ubiquitination by
the APC/C in association with the activators CCS52 (CELL CYCLE SWITCH 52) and CDC20
(Fulop et al., 2005; Marrocco et al., 2010; Sullivan and Morgan, 2007).
Overexpression of APC10 promotes the cell division rate by degradation of CYCB1;1 which
causes enlarged leaves (Eloy et al., 2011). Mutation of HOBBIT, a CDC27 subunit of the APC,
in the SAM leads to accumulation of high levels of the auxin response inhibitor
AXR3/IAA17, indicating that its activity would be involved in targeting AUX/IAA proteins
for degradation (Blilou et al., 2002). CCS52 is an important regulator for controlling exit of
mitosis. There are two classes of CCS52 in Arabidopsis thaliana, CCS52A (CCS52A1 and
CCS52A2) and CCS52B (Fulop et al., 2005). A-type CCS52 activators are typically expressed
from late M to late S-G2 and regulate the onset of endoreduplication in leaves (Fulop et al.,
2005; Lammens et al., 2008). CCS52B, like the APC/C activator CDC20, peaks from early G2
to M phase exit (Fulop et al., 2005; Kevei et al., 2011). Induced expression of CCS52B affects
branching in trichomes where CCS52BOE line forms four to five branches, while the wild
type has only three branches (Engler et al., 2012). However, more study is needed in
particular to understand role of CCS52B in leaf development. It has been suggested that
complementary phase-dependent expression of A and B-type CCS52 activators enable a
fine-tuned APC/C regulation during the cell cycle (Tarayre et al., 2004). Expression of the
negative regulator of CCS52A1 activity, ULTRAVIOLET-B-INSENSITIVE 4 (UVI4) peaks at
the G1-to-S transition (Heyman et al., 2011) and determines cell number and size of leaves,
likely through stabilisation of CYCA2;3 required for mitotic cell divisions (Boudolf et al.,
2009; Heyman et al., 2011; Imai et al., 2006). Its homolog UVI-Like/OMISSION OF SECOND
DIVISION 1 (OSD1) influences meiosis and does not directly impact leaf size. However, it is
expressed during the mitotic cell cycle peaking at the G2-to-M transition, possibly
preventing endomitosis (=incomplete mitosis) (Heyman and De Veylder, 2012). Besides
the mechanism of the inhibitory action of the UVI4 and OSD1 regulators, not much is
known about the specific targets of the APC/C (Heyman and De Veylder, 2012). Apart from
a recent study pointing to cytokinin upregulating CCS52A1 in the Arabidopsis root
Leaf development: a cellular perspective
32
(Takahashi et al., 2013), not much is known about the role of hormone signaling on APC/C
regulation. However, in stress-conditions GA likely modulates APC/C activity through
DELLA dependent downregulation of the UVI4 and DEL1 negative regulators (Claeys et al.,
2012).
Despite of the high level of conservation of the core cell cycle machinery (Harashima et al.,
2013), many plant-specific features exist. Plants are characterized for instance by a
remarkably broad cyclin family with many species-specific isoforms (at least 49 in
Arabidopsis, cf. Sablowski and Dornelas, 2013). The involvement of different orthologous of
many core cell cycle genes goes together with a functional diversity which manifests itself
in gene expression differences between species, developmental and environmental
conditions. Indeed, Beemster et al. (2005) showed by means of a microarray study that the
expression profile of roughly half of all cell cycle genes differed between roots and leaf
primordia. de Almeida Engler et al. (2009) found generally high expression of core cell
cycle genes in leaf primordia, in the lamina of young leaves and in vascular tissue of
expanding leaves. A number of cases of developmental stage-specific expression are
described in the relevant sections throughout this review. However, for many others the
functional significance has yet to be clarified.
Endoreduplication
Generally cells go through a regular cell cycle with the S phase (DNA duplication) followed
by the M phase (mitosis). Endoreduplication, endoreplication, endoploidization or, in short,
the endocycle is the process whereby DNA replicates repeatedly without alternating
divisions through mitosis, causing a high ploidy level in the cell.
To establish endoreduplication, the CDK activity essentially has to be kept low enough and
several ways have been proposed to achieve this (Berckmans and De Veylder, 2009; De
Veylder et al., 2011). For instance, CYCD3;1 which is specifically expressed in proliferating
tissues, reduces endoploidization (Dewitte et al., 2003). CDKB1 activity is also essential for
the G2 to M transition (Beemster et al., 2005). Overexpression of a dominant negative
Leaf development: a cellular perspective
33
CDKB1;1 interferes with cell cycle progression causing G2 arrest (Boudolf et al., 2004a).
CDKB1;1 forms an active complex with CYCA2;3 to suppress endoreplication in the leaf
(Boudolf et al., 2009). Loss of CYCA2;3 function increases ploidy in mature leaves (Imai et
al., 2006). The ILP1 (INCREASE LEVELS OF PLOIDY) gene, which encodes a protein
homologous to the C terminal region of mammalian GC binding factor, is proposed to be
involved in transcriptional repression of A2-type cyclins (Yoshizumi et al., 2006).
Expression of B-type cyclins, on the other hand, was repressed by decreased
phosphorylation of three-repeat MYB proteins (MYB3Rs) (De Veylder et al., 2011; Ito et al.,
2001). The E3 ubiquitin ligase complex, APC/C coupled with CCS52 influences endocycle
onset by controlling proteolytic degradation of G2-M specific cyclins like CYCB1;1 and
CYCB1;2 (Kasili et al., 2010) as well as CYCA2;3 (Boudolf et al., 2009) (Figure 7). CCS52A1
and CCS52A2 knockout plants have reduced DNA ploidy levels in leaves (Kasili et al., 2010;
Lammens et al., 2008). The previously mentioned plant-specific CCS52A1 inhibitor UVI4 is
likely involved in securing the G2-to-M transition and therefore preventing endocycle onset
(Heyman and De Veylder, 2012). Cells with increased ploidy levels in osd1 cotyledons and
the developmentally severely compromised uvi4 osd1 suggest some functional redundancy
between UVI4 and its homolog OSD1 (Cromer et al., 2012; Iwata et al., 2011). Mutation in
SAMBA, a plant specific subunit of the APC complex which probably activates A2-type
cyclin degradation, induces enhanced endoreplication in Arabidopsis leaves (Eloy et al.,
2012). Other factors such as the DP/E2F like transcription factor E2Fe/DEL1 are involved
in controlling APC/C activity. Downregulation of DEL1 triggers the expression of the
CCS52A2 gene, forcing cells to enter endoreduplication (Lammens et al., 2008).
Leaf development: a cellular perspective
34
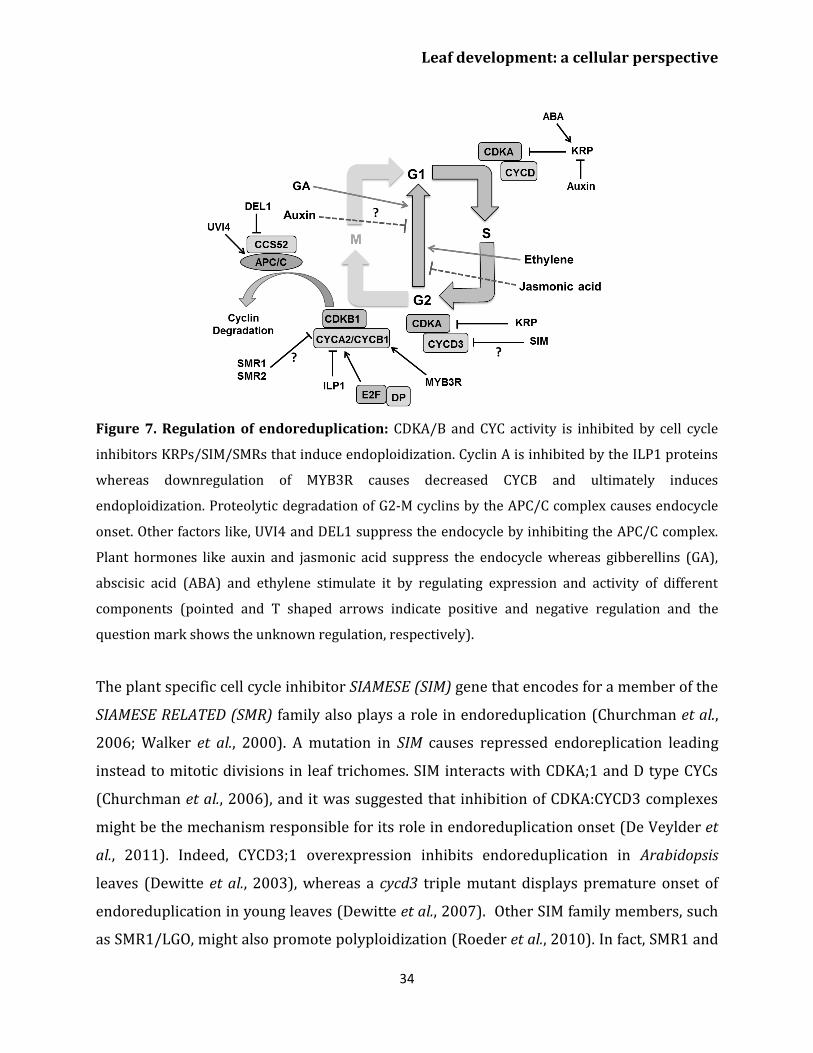
Figure 7. Regulation of endoreduplication: CDKA/B and CYC activity is inhibited by cell cycle
inhibitors KRPs/SIM/SMRs that induce endoploidization. Cyclin A is inhibited by the ILP1 proteins
whereas downregulation of MYB3R causes decreased CYCB and ultimately induces
endoploidization. Proteolytic degradation of G2-M cyclins by the APC/C complex causes endocycle
onset. Other factors like, UVI4 and DEL1 suppress the endocycle by inhibiting the APC/C complex.
Plant hormones like auxin and jasmonic acid suppress the endocycle whereas gibberellins (GA),
abscisic acid (ABA) and ethylene stimulate it by regulating expression and activity of different
components (pointed and T shaped arrows indicate positive and negative regulation and the
question mark shows the unknown regulation, respectively).
The plant specific cell cycle inhibitor SIAMESE (SIM) gene that encodes for a member of the
SIAMESE RELATED (SMR) family also plays a role in endoreduplication (Churchman et al.,
2006; Walker et al., 2000). A mutation in SIM causes repressed endoreplication leading
instead to mitotic divisions in leaf trichomes. SIM interacts with CDKA;1 and D type CYCs
(Churchman et al., 2006), and it was suggested that inhibition of CDKA:CYCD3 complexes
might be the mechanism responsible for its role in endoreduplication onset (De Veylder et
al., 2011). Indeed, CYCD3;1 overexpression inhibits endoreduplication in Arabidopsis
leaves (Dewitte et al., 2003), whereas a cycd3 triple mutant displays premature onset of
endoreduplication in young leaves (Dewitte et al., 2007). Other SIM family members, such
as SMR1/LGO, might also promote polyploidization (Roeder et al., 2010). In fact, SMR1 and
Leaf development: a cellular perspective
35
SMR2 interact with CDKB1;1 and its interactor CYCB2;4 associates with SMR11 (Van Leene
et al., 2010).
Contrary to the emerging insights into endoreduplication onset, it is only poorly
understood how the endocycle is sustained. It has been envisaged that the cell cycle
inhibitor KRP controls CDKA activity by inhibiting the CDKA/CYCD complex to maintain the
CDK oscillations needed for DNA replication in the endocycle. KRPs were reported to
regulate mitosis and endoreplication in a dose dependent manner where low
concentrations promote the endocycle while high levels cause cell cycle arrest (Verkest et
al., 2005b). On the one hand, overexpression of KRP2/KRP5 in mitotically active cells
inhibits cell division and enhances endoreplication (Jegu et al., 2013; Verkest et al., 2005a)
while on the other hand its overexpression in postmitotic cells inhibits endocycle in
Arabidopsis leaves (Schnittger et al., 2003). This implicates that KRPs are an important
candidate for the regulation of rate and duration of endoreduplication in expanding leaf
cells.
Arabidopsis leaves, cells enter into the endoreduplication process as a consequence of
decreasing auxin concentrations. It has been observed that the mutants in auxin signaling,
biosynthesis and transport show a rapid transition from mitotis to endocycle causing
increased ploidy level in cotyledons (Ishida et al., 2010) but the detail of this mechanism is
still not known. Ethylene and gibberellins are hypothesized to positively affect
endoreduplication (Gendreau et al., 1999; Perazza et al., 1999; Swain et al., 2002). JAs were
shown to inhibit cell proliferation as well as endoploidization in a COI1 (encoding an F-box
protein which is a part of the SCF complex) dependent manner in Arabidopsis leaves (Noir
et al., 2013). It also negatively regulates the expression of key determinants of DNA
replication like CDC6A (Noir et al., 2013).
Despite of our increasing knowledge on the molecular mechanism of endoreduplication, its
actual function remains ambiguous with proposed roles in promoting cell expansion, stress
resistance or DNA damage protection (De Veylder et al., 2011). In any case, modulating
Leaf development: a cellular perspective
36
CDK-CYC activity levels in various ways remains a central principle. This pertains to the
ubiquitin dependent degradation of KRPs or the mechanism by which plant specific cell
cycle inhibitors (SIM/SMR) as well as developmental and environmental signals influence
the endocycle. Roodbarkelari et al. (2010) have modelled the endocycle onset in
Arabidopsis trichomes with KRP and the CULLIN4 ubiquitin ligase controlling G1/S and SIM
and APC/C controlling G2/M transitions. Computational approaches to predict tissue
distributions of cell ploidy combined with in vivo ploidy maps (Boudolf et al., 2004b) would
provide powerful insights to better understand its regulation and relationship to cell
expansion.
Regulation of transition between cell division and expansion
Leaf development involves two major phases. The first phase is dominated by proliferative
activity and the second phase by cell expansion (Figure 8). There is a correlation between
cell division activity and organ growth, so the timing of cell division has a large influence on
the final leaf size (Gonzalez et al., 2012; Korner et al., 1989; Meyerowitz, 1997). As cell
division ceases the cell continues expanding. This transition from division to expansion is
manifested as a cell cycle arrest front which remains fixed at some position for a particular
time period and then moves rapidly towards the base of the leaf blade (Andriankaja et al.,
2012). Several regulators appear to control the transition from proliferation to expansion.
Auxin plays an important role in the transition phase. It induces the expression of ARGOS
(AUXIN-REGULATED GENE INVOLVED IN ORGAN SIZE) gene, encoding for an ER localized
protein of unknown function (Hu et al., 2003). Overexpression and downregulation of
ARGOS increases and decreases leaf size, respectively. It regulates the action of a DNA-
binding protein ANT (AINTEGUMENTA) and of CYCD3;1 (Hu et al., 2003) (Figure 8). Loss of
function of ANT blocks the increase in leaf growth in ARGOS overexpressing plants. The
Arabidopsis ORS1 (ORGAN SIZE RELATED1) shares a conserved domain with ARGOS and
ARGOS LIKE (ARL), and positively regulates cell division and expansion in the leaf (Feng et
al., 2011; Hu et al., 2003). Like the ANT family proteins, the GRF (GROWTH REGULATING
FACTOR) and TCP (TEOSINTE BRANCHED/ CYCLOIDEA/PCF) transcription factors are
Leaf development: a cellular perspective
37
essential regulators of leaf growth (Figure 8). The Arabidopsis GRF family comprises nine
members. Overexpression of AtGRF1 and AtGRF2 results in larger leaves whereas the
grf1/2/3 triple mutant reduces leaf size, both as a result of alterations in cell size (Kim et
al., 2003). Overexpression of GRF5 increased cell number with prolonged growth, whereas
the grf5-1 mutant shows narrow leaves with reduced cell numbers. GIF1 (GRF-
INTERACTING FACTOR1), also known as ANGUSTIFOLIA3 (AN3) interacts with GRF5
(Horiguchi et al., 2005). GIF1 overexpression increases leaf size with leaves having more
cells, whereas its absence reduces cell proliferation (Lee et al., 2009).
miR396 negatively regulates six members of Arabidopsis Growth Regulating Factor (GRF)
together with GIF1 (Liu et al., 2009) (Figure 8). Interestingly, overexpression of miR396 in
a mutant deficient for GRF1 reduces shoot apical meristem size (Rodriguez et al., 2010).
The miR396 targeted GRFs are also essential for leaf polarity (Wang et al., 2011). The TCP
family of transcription factors regulates the expression of miR396 and miR319 (Palatnik et
al., 2003; Rodriguez et al., 2010). A point mutation in the miR319 target site of TCP4
induces miR396 which in turn decreases GRF expression and results in smaller leaves
(Figure 8). Similarly, overexpression of TPC4 decreases leaf size (Rodriguez et al., 2010).
Transcription factors from the TCP family such as CINCINNATA (CIN) of Antirrhinum,
LANCEOLATE (LA) of tomato and CINCINNATA (CIN)-TCPs of Arabidopsis thaliana control
cell cycle arrest (Nath et al., 2003; Ori et al., 2007; Palatnik et al., 2003). In Arabidopsis,
upregulation of miR319 in the jaw-D mutant reduces the expression of TCP2, TCP3, TCP4,
TCP10 and TCP24 producing large and wrinkled leaves (Palatnik et al., 2003).
Downregulation of single, double and triple TPC genes resulted in proportional increase in
leaf size and crinkliness (Schommer et al., 2008).
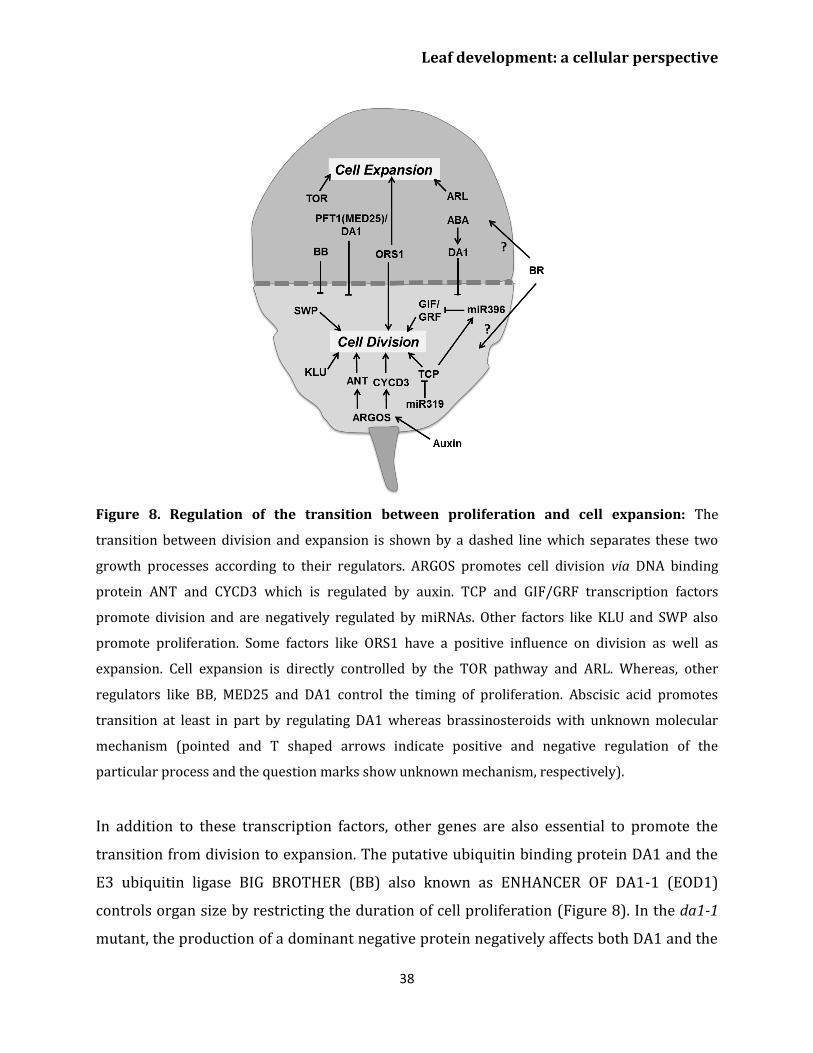
Leaf development: a cellular perspective
38
Figure 8. Regulation of the transition between proliferation and cell expansion: The
transition between division and expansion is shown by a dashed line which separates these two
growth processes according to their regulators. ARGOS promotes cell division via DNA binding
protein ANT and CYCD3 which is regulated by auxin. TCP and GIF/GRF transcription factors
promote division and are negatively regulated by miRNAs. Other factors like KLU and SWP also
promote proliferation. Some factors like ORS1 have a positive influence on division as well as
expansion. Cell expansion is directly controlled by the TOR pathway and ARL. Whereas, other
regulators like BB, MED25 and DA1 control the timing of proliferation. Abscisic acid promotes
transition at least in part by regulating DA1 whereas brassinosteroids with unknown molecular
mechanism (pointed and T shaped arrows indicate positive and negative regulation of the
particular process and the question marks show unknown mechanism, respectively).
In addition to these transcription factors, other genes are also essential to promote the
transition from division to expansion. The putative ubiquitin binding protein DA1 and the
E3 ubiquitin ligase BIG BROTHER (BB) also known as ENHANCER OF DA1-1 (EOD1)
controls organ size by restricting the duration of cell proliferation (Figure 8). In the da1-1
mutant, the production of a dominant negative protein negatively affects both DA1 and the
Leaf development: a cellular perspective
39
DA1-related (DAR) protein and the overexpression of DA1 results in large leaves with
increased cell numbers. Abscisic acid (ABA) induces the expression of DA1, whereas the
da1-1 mutant was less sensitive to ABA, implicating a role for ABA in determining the final
leaf size through the control of mitotic exit (Li et al., 2008). Mediator complex subunit 25
(MED25 also known as PFT1), functions together with DA1 in controlling leaf growth by
restricting cell proliferation (Figure 8). Overexpression of MED25 causes smaller leaves
with reduced cell numbers and cell sizes, whereas a loss of function mutant enhances organ
size with increased duration of cell proliferation and expansion (Xu and Li, 2011). Loss of
function mutation of the RING- finger protein encoding BIG BROTHER (BB) leads to
enlarged leaves and small changes in expression levels substantially alter organ size
suggesting it controls cell division and leaf size in a dose dependent manner (Disch et al.,
2006). The KLUH (KLU)/CYP78A5 gene, encoding for a cytochrome P450, required for
generating a mobile growth signal distinct from the classical phytohormones, is also an
essential regulator for leaf size control. Overexpression of KLU induces enlarged leaves
having more cells whereas in the klu mutant premature arrest of cell proliferation causes
smaller leaves (Anastasiou et al., 2007; Stransfeld et al., 2010). The SWP gene encodes a
protein with similarities to subunits of the Mediator transcriptional regulatory complex of
RNA polymerase II. It also plays a role in defining the period of cell proliferation. In the swp
mutant leaf size was reduced due to less cells, which was partially compensated by an
increase in final cell size (Autran et al., 2002) (Figure 8).
Like auxin, sugar signaling controls leaf growth possibly via the ARGOS pathway (Hu et al.,
2003; Wang and Ruan, 2013). BR also regulates leaf growth by controlling cell division and
expansion. The BR deficient mutant constitutive photomorphogenesis and dwarfism (cpd)
produces smaller leaves with fewer cells of reduced size (Zhiponova et al., 2013), however
the molecular mechanism controlling this process is yet to be clarified. The progressive
general cell proliferation arrest front of epidermal and mesophyll cells is followed by a
second cell cycle arrest front for dispersed meristematic cells (DMCs) that is controlled by
the putative transcription factors PPD1 (PEAPOD1) and PPD2 (White, 2006).
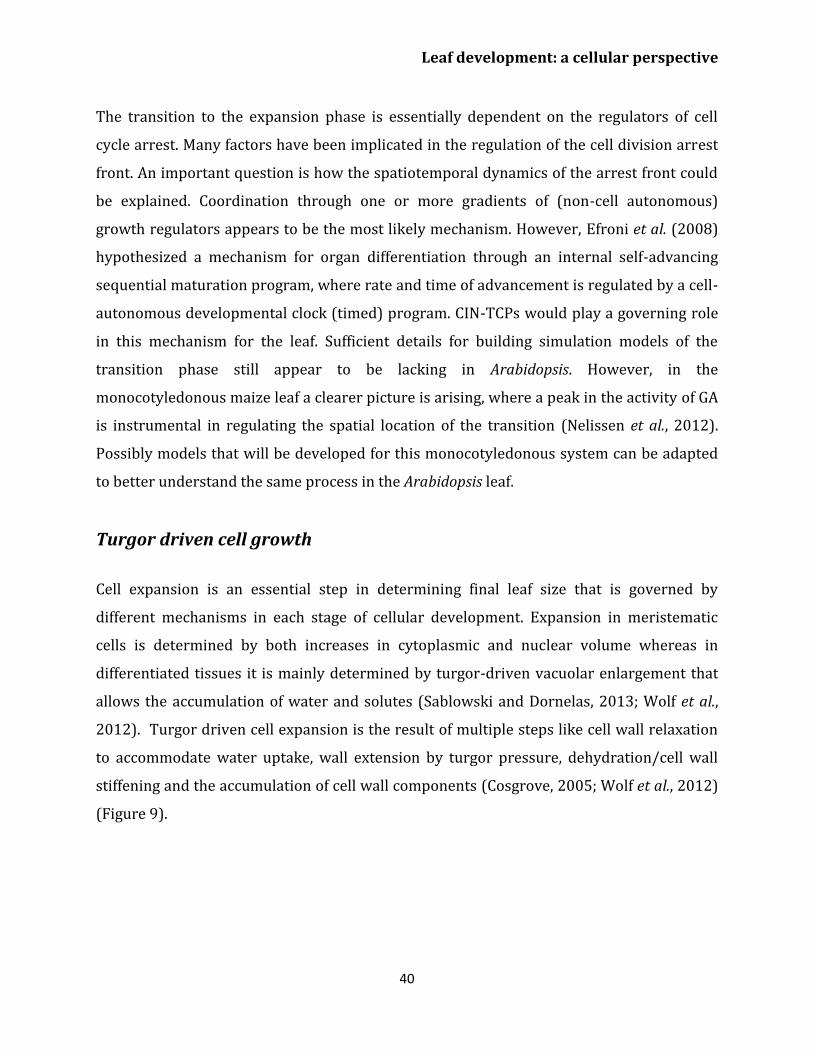
Leaf development: a cellular perspective
40
The transition to the expansion phase is essentially dependent on the regulators of cell
cycle arrest. Many factors have been implicated in the regulation of the cell division arrest
front. An important question is how the spatiotemporal dynamics of the arrest front could
be explained. Coordination through one or more gradients of (non-cell autonomous)
growth regulators appears to be the most likely mechanism. However, Efroni et al. (2008)
hypothesized a mechanism for organ differentiation through an internal self-advancing
sequential maturation program, where rate and time of advancement is regulated by a cell-
autonomous developmental clock (timed) program. CIN-TCPs would play a governing role
in this mechanism for the leaf. Sufficient details for building simulation models of the
transition phase still appear to be lacking in Arabidopsis. However, in the
monocotyledonous maize leaf a clearer picture is arising, where a peak in the activity of GA
is instrumental in regulating the spatial location of the transition (Nelissen et al., 2012).
Possibly models that will be developed for this monocotyledonous system can be adapted
to better understand the same process in the Arabidopsis leaf.
Turgor driven cell growth
Cell expansion is an essential step in determining final leaf size that is governed by
different mechanisms in each stage of cellular development. Expansion in meristematic
cells is determined by both increases in cytoplasmic and nuclear volume whereas in
differentiated tissues it is mainly determined by turgor-driven vacuolar enlargement that
allows the accumulation of water and solutes (Sablowski and Dornelas, 2013; Wolf et al.,
2012). Turgor driven cell expansion is the result of multiple steps like cell wall relaxation
to accommodate water uptake, wall extension by turgor pressure, dehydration/cell wall
stiffening and the accumulation of cell wall components (Cosgrove, 2005; Wolf et al., 2012)
(Figure 9).
Leaf development: a cellular perspective
41
Figure 9. Regulation of the cell expansion process with unknown molecular mechanism: Cell
expansion is the result of vacuolar enlargement as well as of turgor driven cell wall yielding. The
vacuole expands while taking up water and solutes whereas turgor driven cell wall yielding is the
result of multiple steps, including hydration and cell wall loosening, cell wall extension by turgor
pressure, dehydration/cell wall stiffening by release of apoplastic reactive oxygen species, cross-
linking and dehydration and lastly synthesis and accumulation of cell wall components. Cell wall
loosening is controlled by expansin (EXP) proteins and the xyloglucan endohydrolase (XEH) and
xyloglucan endotransglucosylase (XET) activites of xyloglucan endotransglucosylase/hydrolases
(XTHs). Auxin and brassinosteroid (BR) enhance activity of P-type plasma membrane proton
ATPase (AHA) (pointed and T shaped arrows indicate positive and negative regulation and the
question mark shows the unknown regulation, respectively).
In the plant cell wall cellulose microfibrils are associated through hemicellulose tethers to
form the cellulose-hemicellulose network, which is embedded in a pectin matrix. Primarily,
auxin or brassinolide induce activity of P-type plasma membrane proton ATPases (AHA)
that causes acidification of the apoplast and in turn activates hydration and cell wall
loosening by expansin (EXP) proteins, xyloglucanendotransglucosylase/hydrolases (XTHs),
xyloglucan endohydrolase (XEH) and xyloglucan endotransglucosylase (XET) (Caesar et al.,
2011; Rose et al., 2002; Wolf et al., 2012; Yokoyama and Nishitani, 2001). Dyson et al.
Leaf development: a cellular perspective
42
(2012) developed a model of hemicellulose dynamics in an expanding cell wall, showing
how the action of XTH and expansin family enzymes determine yield and extensibility of
the wall as encapsulated by the classical Lockhart equation (Lockhart, 1965). The
mechanism controlling cell wall swelling/hydration is yet to be clarified. Antisense and
sense constructs of the Arabidopsis EXP10 gene produce smaller leaves with altered
morphology and larger leaves having bigger cells, respectively (Cho and Cosgrove, 2000).
Wall hydration allows cell wall extension through structural alterations. Cell wall
relaxation stretches the plasma membrane which promotes opening of Ca2+ channels. The
resulting increase in cytoplasmic calcium affects growth by inhibiting P-ATPases that cause
alkalization of the apoplast and inhibition of expansin activity. It also activates NADPH-
oxidase which promotes secretion of superoxide into the cell wall, which is further
converted into hydrogen peroxide. These reactive oxygen species promote cross linking of
cell wall components, which causes cell wall dehydration and strengthening. At the end,
wall thickness is reinstated by biosynthesis of membrane lipids, cell wall components and
proteins, and appropriate channelization of these materials to their final cellular
destination (Wolf et al., 2012).
Auxin does not always promote cell expansion as its concentration has also been observed
to fall during leaf expansion (Braun et al., 2008), suggesting a more complicated dose-
response relation. The yucca and sur mutant of Arabidopsis have elevated auxin levels and
smaller leaves (Boerjan et al., 1995; Zhao et al., 2001). Mutation in EXIGUA (EXI) genes,
which encode for different subunits of the cellulose synthase complex required for
secondary cell wall biosynthesis, produces small leaves having defects in cell expansion
(Rubio-Dı´az et al., 2012). Growth anisotropy, the existence of directions with distinct
growth properties is determined by the orientation of the stiff cellulose microfibrils, which
in turn is controlled by the orientation of cortical microtubule (CMT) arrays guiding
cellulose synthase (Paredez et al., 2006). Uyttewaal et al. (2012) showed by experimental
and modeling approaches that the microtubule severing protein katanin mediates the
response of cells to mechanical stress in the Arabidopsis SAM. The alignment between PIN1
polarity and microtubule orientation in the SAM indicates a tight biophysical coupling
Leaf development: a cellular perspective
43
between morphogenesis and auxin transport as further corroborated by mathematical
modeling (Heisler et al., 2010).
Cell ploidy level is strongly correlated with mature cell size in many plant species
(Sugimoto-Shirasu and Roberts, 2003). Alteration in genes specific for G2-M transition
affects the onset of endocycle with earlier onset typically leading to enhanced ploidy. A
notable exception is downregulation of Arabidopsis REGULATORY PARTICLE AAA-ATPASE
(RPT2a), which encodes a subunit of the 26S proteasome that causes enlarged plant organs
having less but bigger cells. DNA content was higher in some organs but not in all which
suggests that the increase in organ size was not the result of endoploidization (Kurepa et
al., 2009). Another exception is KRP2 overexpression in Arabidopsis, which does not alter
timing of cell cycle exit, but induces fewer and enlarged cells in combination with lower
endoploidy levels (De Veylder et al., 2001). A recent study of different Arabidopsis mutant
and transgenic lines with altered cell sizes showed strong differences in the effect of a same
doubling of nuclear ploidy levels, by tetraploidization, on mature cell size (Tsukaya,
2013a). This indicates that genetic factors strongly affect and complicate the general
relationship between endoploidy and size, by thus far unknown mechanisms.
Cell differentiation
In the process of leaf development, cells have the ability to differentiate into distinct cell
types such as guard cells, vascular tissue cells, and trichomes, enabling them to perform
diverse specialized functions. All these cell types develop from undifferentiated
proliferating cells in the young primordium under the control of regulatory pathways that
are increasingly being elucidated.
a) Guard cell formation
In Arabidopsis, guard cell development is initiated by an asymmetric cell division of a
protodermal cell. The two daughter cells obtain different identities; the larger one
maintains protodermal cell identity, whereas the smaller one becomes a meristemoid
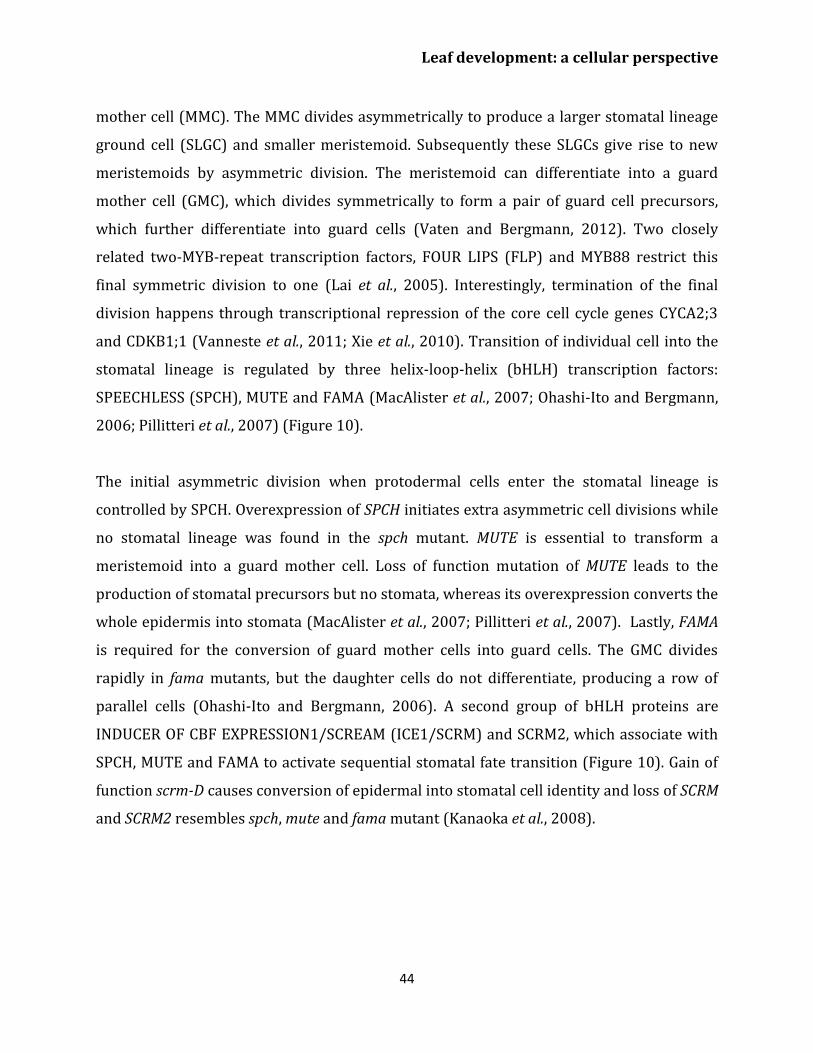
Leaf development: a cellular perspective
44
mother cell (MMC). The MMC divides asymmetrically to produce a larger stomatal lineage
ground cell (SLGC) and smaller meristemoid. Subsequently these SLGCs give rise to new
meristemoids by asymmetric division. The meristemoid can differentiate into a guard
mother cell (GMC), which divides symmetrically to form a pair of guard cell precursors,
which further differentiate into guard cells (Vaten and Bergmann, 2012). Two closely
related two-MYB-repeat transcription factors, FOUR LIPS (FLP) and MYB88 restrict this
final symmetric division to one (Lai et al., 2005). Interestingly, termination of the final
division happens through transcriptional repression of the core cell cycle genes CYCA2;3
and CDKB1;1 (Vanneste et al., 2011; Xie et al., 2010). Transition of individual cell into the
stomatal lineage is regulated by three helix-loop-helix (bHLH) transcription factors:
SPEECHLESS (SPCH), MUTE and FAMA (MacAlister et al., 2007; Ohashi-Ito and Bergmann,
2006; Pillitteri et al., 2007) (Figure 10).
The initial asymmetric division when protodermal cells enter the stomatal lineage is
controlled by SPCH. Overexpression of SPCH initiates extra asymmetric cell divisions while
no stomatal lineage was found in the spch mutant. MUTE is essential to transform a
meristemoid into a guard mother cell. Loss of function mutation of MUTE leads to the
production of stomatal precursors but no stomata, whereas its overexpression converts the
whole epidermis into stomata (MacAlister et al., 2007; Pillitteri et al., 2007). Lastly, FAMA
is required for the conversion of guard mother cells into guard cells. The GMC divides
rapidly in fama mutants, but the daughter cells do not differentiate, producing a row of
parallel cells (Ohashi-Ito and Bergmann, 2006). A second group of bHLH proteins are
INDUCER OF CBF EXPRESSION1/SCREAM (ICE1/SCRM) and SCRM2, which associate with
SPCH, MUTE and FAMA to activate sequential stomatal fate transition (Figure 10). Gain of
function scrm-D causes conversion of epidermal into stomatal cell identity and loss of SCRM
and SCRM2 resembles spch, mute and fama mutant (Kanaoka et al., 2008).
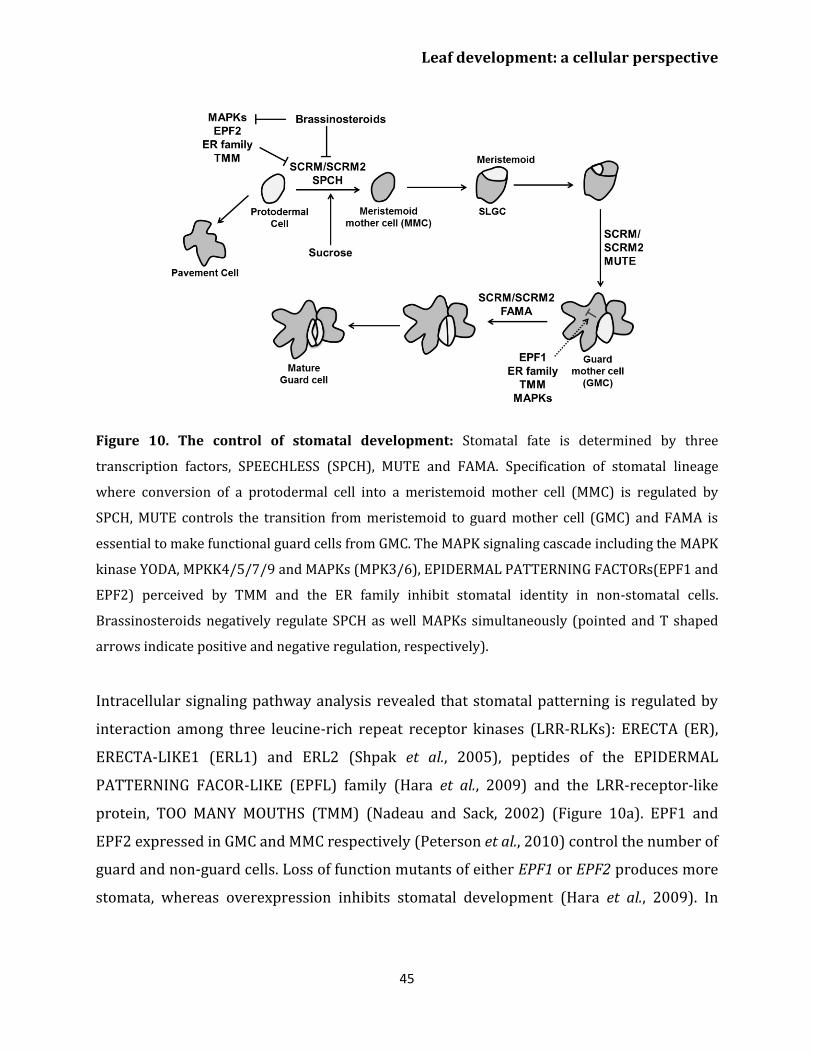
Leaf development: a cellular perspective
45
Figure 10. The control of stomatal development: Stomatal fate is determined by three
transcription factors, SPEECHLESS (SPCH), MUTE and FAMA. Specification of stomatal lineage
where conversion of a protodermal cell into a meristemoid mother cell (MMC) is regulated by
SPCH, MUTE controls the transition from meristemoid to guard mother cell (GMC) and FAMA is
essential to make functional guard cells from GMC. The MAPK signaling cascade including the MAPK
kinase YODA, MPKK4/5/7/9 and MAPKs (MPK3/6), EPIDERMAL PATTERNING FACTORs(EPF1 and
EPF2) perceived by TMM and the ER family inhibit stomatal identity in non-stomatal cells.
Brassinosteroids negatively regulate SPCH as well MAPKs simultaneously (pointed and T shaped
arrows indicate positive and negative regulation, respectively).
Intracellular signaling pathway analysis revealed that stomatal patterning is regulated by
interaction among three leucine-rich repeat receptor kinases (LRR-RLKs): ERECTA (ER),
ERECTA-LIKE1 (ERL1) and ERL2 (Shpak et al., 2005), peptides of the EPIDERMAL
PATTERNING FACOR-LIKE (EPFL) family (Hara et al., 2009) and the LRR-receptor-like
protein, TOO MANY MOUTHS (TMM) (Nadeau and Sack, 2002) (Figure 10a). EPF1 and
EPF2 expressed in GMC and MMC respectively (Peterson et al., 2010) control the number of
guard and non-guard cells. Loss of function mutants of either EPF1 or EPF2 produces more
stomata, whereas overexpression inhibits stomatal development (Hara et al., 2009). In
Leaf development: a cellular perspective
46
contrast, another member of the EPF family EPFL9/STOMAGEN is a positive intercellular
signaling factor involved in stomatal development (Sugano et al., 2010).
Members of the ER family also work as negative regulators with their downregulation
causing over-proliferation of stomata (Shpak et al., 2005). TMM affects stomatal spacing
and density and its loss of function mutant tmm forms clusters of stomata in leaves
(Nadeau and Sack, 2002). These intracellular signals in turn activate a mitogen-activated
protein kinase (MAPK) signaling cascade including the MAPK kinase YODA, MPKK4/5/7/9
and MAPKs (MPK3/6) to inhibit stomatal development in neighboring cells (Bergmann et
al., 2004; Lampard et al., 2009) (Figure 10). MAPK mediated phosphorylation negatively
regulates SPCH activity (Lampard et al., 2008), whereas the target in a later stage of
stomatal development is unknown. A recent study adds to the complexity of this network
since the brassinosteroid (BR) pathway phosphorylates YODA (Kim et al., 2012) and SPCH
(Gudesblat et al., 2012) (Figure 10). Thus, it is essential to understand the regulation of
MAPK pathway in later stages of the stomatal development and shed light on the complex
interaction between YODA and SPCH with BR. It is an interesting question how the
stomatal lineage is established and which regulators cause the initiation of SPCH
expression. In relation to that, a polarity-switching model for individual lineage behavior
was able to predict the location of the polarity determinant BASL (BREAKING OF
ASYMMETRY IN THE STOMATAL LINEAGE) over multiple divisions leading to stereotypical
spatial patterns of stomata lineages (Robinson et al., 2011). Sugar signaling is also involved
as an early signal, as sucrose, glucose and fructose all induce ectopic stomatal formation by
inducing stomatal lineage markers in non-stomatal lineage cells (Akita et al., 2013).
b) Vascular differentiation
At the time of leaf initiation, high local concentrations of auxin induce provascular identity
leading to the differentiation of midvein and lateral veins preceded by enhanced expression
of early markers for vascularization e.g. ATHB8 (Arabidopsis homeobox transcription
factor) (Bayer et al., 2009; Scarpella et al., 2004; Scarpella et al., 2006). A Dual Polarization
Leaf development: a cellular perspective
47
model proposed by Bayer et al. (2009) explains PIN1 protein localization at the time of leaf
initiation and midvein formation. Generally, vasculature development begins with the
formation of pre-procambium cells, which later differentiate into procambium cells under
control of an increased auxin flow (Kang and Soh, 2001; Scarpella et al., 2006). Xylem and
phloem cells are produced by the vascular meristem with xylem produced on the dorsal
(adaxial) side and phloem produced on the ventral (abaxial) side of the procambium. The
radial patterning of the vascular bundle is the result of an antagonistic relation between
Class III HD-ZIP (Class III Homeodomain Leucine Zipper) in the xylem domain and KANADI
(KAN) transcription factors in phloem precursor cells (Jung and Park, 2007) (Figure 11).
Of all five members of the HD-ZIP III family, PHV, PHB and REV are expressed in
vasculature, apical and floral meristems, and the adaxial domain of lateral organs (Emery et
al., 2003; McConnell et al., 2001) whereas ATHB8 and ATHB15 are exclusively expressed in
vascular tissue (Baima et al., 2001; Ohashi-Ito and Fukuda, 2003) and these factors are
negatively regulated by microRNA 165/166 (Emery et al., 2003). HD ZIP-III transcription
factors are regulated by two members of GARS family of transcription factors, SHR (SHORT
ROOT) and SCR (SCARECROW) which activate the genes encoding miR165/166
(Miyashima et al., 2013). Recently, it has been reported that the synchronous expression of
SHR and ATHB8 is important for the transition to the pre-procambial cell state that
precedes vein formation in leaf (Gardiner et al., 2011). The phb-6 phv-5 rev-9 loss of
function mutant produces abaxialized radial cotyledons in which phloem surrounds xylem
(Emery et al., 2003). The quintuple mutant rev-6 phb-13 phv-11 cna-2 athb8-11/athb8-12
has a severely compromised vascular phenotype similar to the phb phv rev triple mutant
(Prigge et al., 2005). Loss of ATHB8 and ATHB15 has no evident phenotypic effects, though
vascular development is slightly perturbed in athb15.
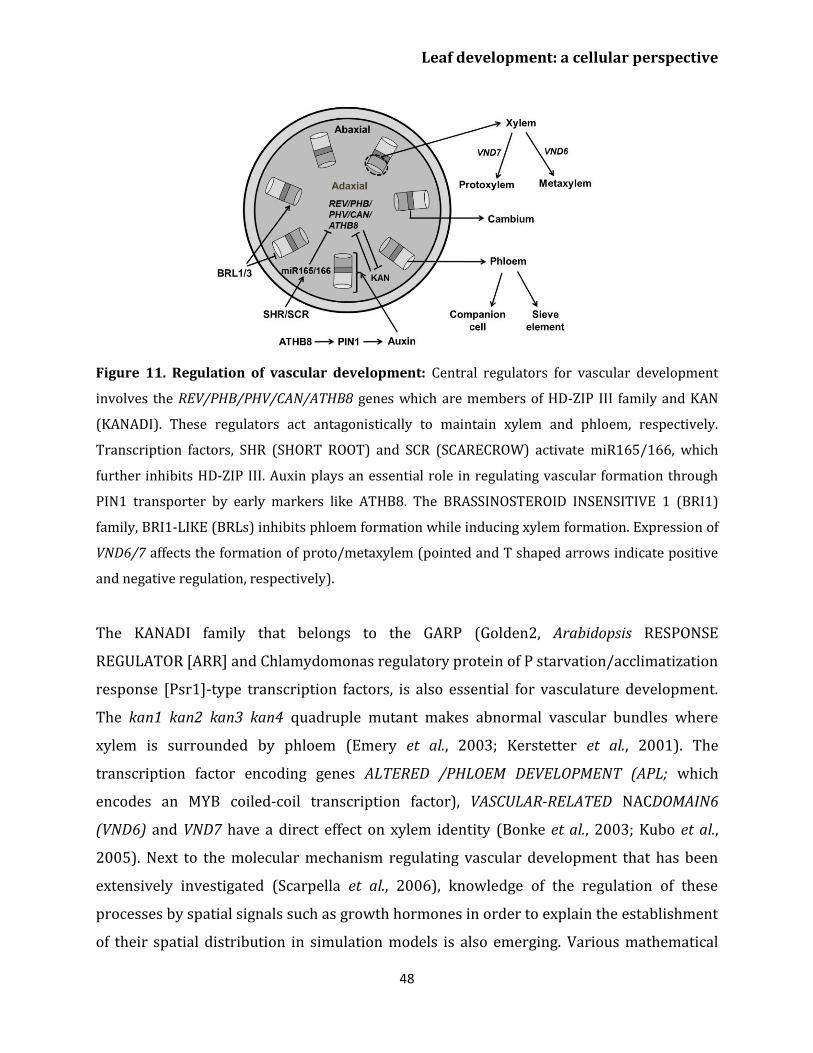
Leaf development: a cellular perspective
48
Figure 11. Regulation of vascular development: Central regulators for vascular development
involves the REV/PHB/PHV/CAN/ATHB8 genes which are members of HD-ZIP III family and KAN
(KANADI). These regulators act antagonistically to maintain xylem and phloem, respectively.
Transcription factors, SHR (SHORT ROOT) and SCR (SCARECROW) activate miR165/166, which
further inhibits HD-ZIP III. Auxin plays an essential role in regulating vascular formation through
PIN1 transporter by early markers like ATHB8. The BRASSINOSTEROID INSENSITIVE 1 (BRI1)
family, BRI1-LIKE (BRLs) inhibits phloem formation while inducing xylem formation. Expression of
VND6/7 affects the formation of proto/metaxylem (pointed and T shaped arrows indicate positive
and negative regulation, respectively).
The KANADI family that belongs to the GARP (Golden2, Arabidopsis RESPONSE
REGULATOR [ARR] and Chlamydomonas regulatory protein of P starvation/acclimatization
response [Psr1]-type transcription factors, is also essential for vasculature development.
The kan1 kan2 kan3 kan4 quadruple mutant makes abnormal vascular bundles where
xylem is surrounded by phloem (Emery et al., 2003; Kerstetter et al., 2001). The
transcription factor encoding genes ALTERED /PHLOEM DEVELOPMENT (APL; which
encodes an MYB coiled-coil transcription factor), VASCULAR-RELATED NACDOMAIN6
(VND6) and VND7 have a direct effect on xylem identity (Bonke et al., 2003; Kubo et al.,
2005). Next to the molecular mechanism regulating vascular development that has been
extensively investigated (Scarpella et al., 2006), knowledge of the regulation of these
processes by spatial signals such as growth hormones in order to explain the establishment
of their spatial distribution in simulation models is also emerging. Various mathematical
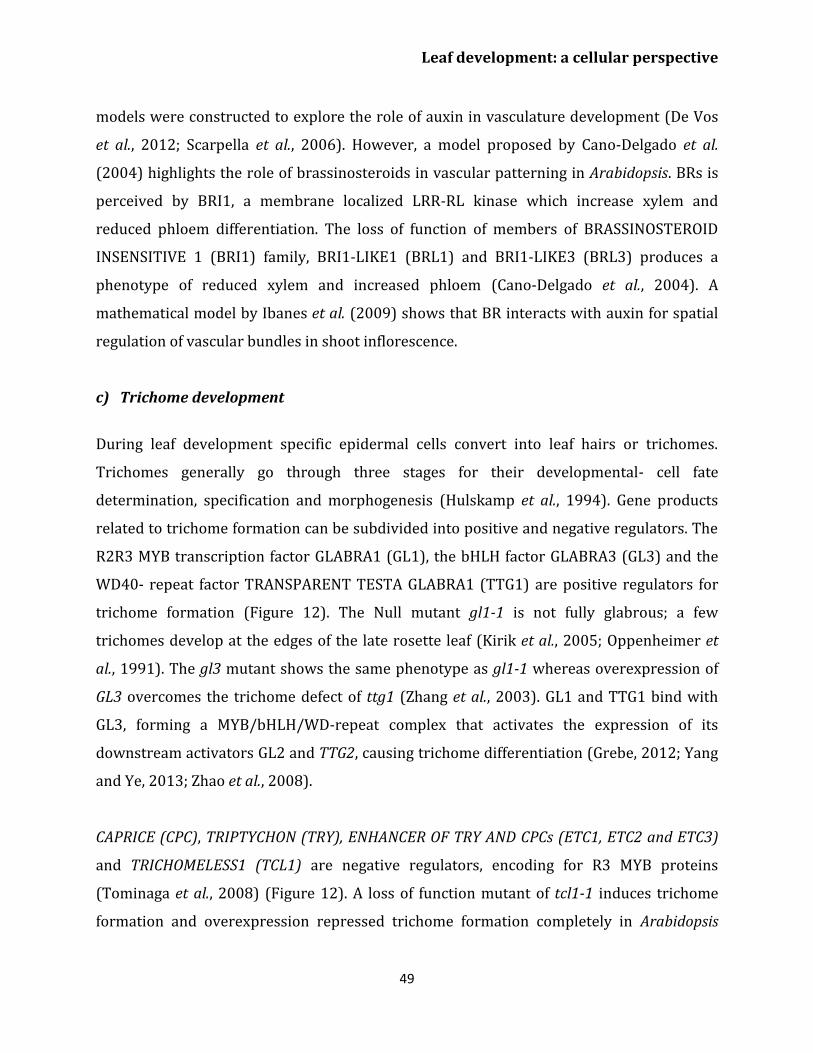
Leaf development: a cellular perspective
49
models were constructed to explore the role of auxin in vasculature development (De Vos
et al., 2012; Scarpella et al., 2006). However, a model proposed by Cano-Delgado et al.
(2004) highlights the role of brassinosteroids in vascular patterning in Arabidopsis. BRs is
perceived by BRI1, a membrane localized LRR-RL kinase which increase xylem and
reduced phloem differentiation. The loss of function of members of BRASSINOSTEROID
INSENSITIVE 1 (BRI1) family, BRI1-LIKE1 (BRL1) and BRI1-LIKE3 (BRL3) produces a
phenotype of reduced xylem and increased phloem (Cano-Delgado et al., 2004). A
mathematical model by Ibanes et al. (2009) shows that BR interacts with auxin for spatial
regulation of vascular bundles in shoot inflorescence.
c) Trichome development
During leaf development specific epidermal cells convert into leaf hairs or trichomes.
Trichomes generally go through three stages for their developmental- cell fate
determination, specification and morphogenesis (Hulskamp et al., 1994). Gene products
related to trichome formation can be subdivided into positive and negative regulators. The
R2R3 MYB transcription factor GLABRA1 (GL1), the bHLH factor GLABRA3 (GL3) and the
WD40- repeat factor TRANSPARENT TESTA GLABRA1 (TTG1) are positive regulators for
trichome formation (Figure 12). The Null mutant gl1-1 is not fully glabrous; a few
trichomes develop at the edges of the late rosette leaf (Kirik et al., 2005; Oppenheimer et
al., 1991). The gl3 mutant shows the same phenotype as gl1-1 whereas overexpression of
GL3 overcomes the trichome defect of ttg1 (Zhang et al., 2003). GL1 and TTG1 bind with
GL3, forming a MYB/bHLH/WD-repeat complex that activates the expression of its
downstream activators GL2 and TTG2, causing trichome differentiation (Grebe, 2012; Yang
and Ye, 2013; Zhao et al., 2008).
CAPRICE (CPC), TRIPTYCHON (TRY), ENHANCER OF TRY AND CPCs (ETC1, ETC2 and ETC3)
and TRICHOMELESS1 (TCL1) are negative regulators, encoding for R3 MYB proteins
(Tominaga et al., 2008) (Figure 12). A loss of function mutant of tcl1-1 induces trichome
formation and overexpression repressed trichome formation completely in Arabidopsis
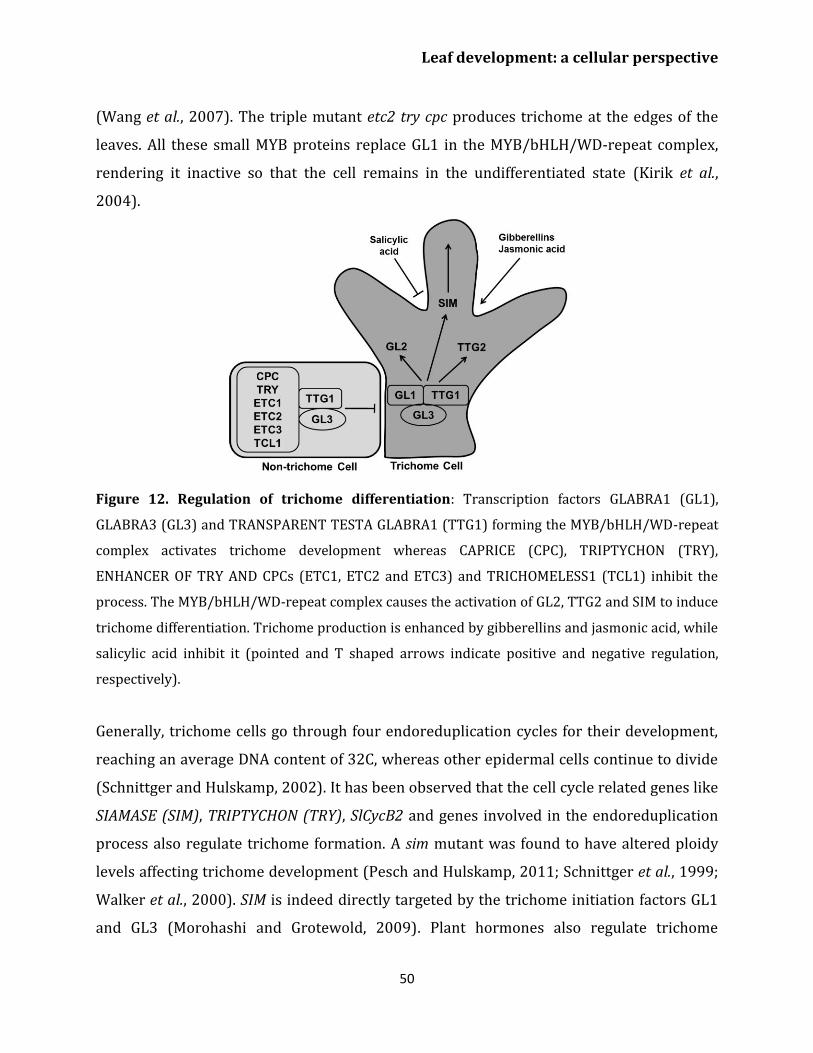
Leaf development: a cellular perspective
50
(Wang et al., 2007). The triple mutant etc2 try cpc produces trichome at the edges of the
leaves. All these small MYB proteins replace GL1 in the MYB/bHLH/WD-repeat complex,
rendering it inactive so that the cell remains in the undifferentiated state (Kirik et al.,
2004).
Figure 12. Regulation of trichome differentiation: Transcription factors GLABRA1 (GL1),
GLABRA3 (GL3) and TRANSPARENT TESTA GLABRA1 (TTG1) forming the MYB/bHLH/WD-repeat
complex activates trichome development whereas CAPRICE (CPC), TRIPTYCHON (TRY),
ENHANCER OF TRY AND CPCs (ETC1, ETC2 and ETC3) and TRICHOMELESS1 (TCL1) inhibit the
process. The MYB/bHLH/WD-repeat complex causes the activation of GL2, TTG2 and SIM to induce
trichome differentiation. Trichome production is enhanced by gibberellins and jasmonic acid, while
salicylic acid inhibit it (pointed and T shaped arrows indicate positive and negative regulation,
respectively).
Generally, trichome cells go through four endoreduplication cycles for their development,
reaching an average DNA content of 32C, whereas other epidermal cells continue to divide
(Schnittger and Hulskamp, 2002). It has been observed that the cell cycle related genes like
SIAMASE (SIM), TRIPTYCHON (TRY), SlCycB2 and genes involved in the endoreduplication
process also regulate trichome formation. A sim mutant was found to have altered ploidy
levels affecting trichome development (Pesch and Hulskamp, 2011; Schnittger et al., 1999;
Walker et al., 2000). SIM is indeed directly targeted by the trichome initiation factors GL1
and GL3 (Morohashi and Grotewold, 2009). Plant hormones also regulate trichome
Leaf development: a cellular perspective
51
formation with GA and jasmonic acid enhancing trichome number and density while
salicylic acid reducing trichome number (Traw and Bergelson, 2003). Still, more studies are
needed to explore the role of phytohormone signaling pathways in trichome formation.
Two main theoretical models have been proposed to explain trichome patterning in
Arabidopsis leaves: an activator-inhibitor model and an activator-depletion model. In the
activator-inhibitor model, the activator (trimer complex of WD40, bHLH and MYB factors)
triggers its own inhibitor (R3MYB) which moves into the neighbouring cell and impedes
activation of the complex whereas, the activator-depletion model explains GL3 dependent
depletion of TTG1 in non trichome cells (Pesch and Hulskamp, 2009). Computational
modeling of the trichome pattern was used by Bouyer et al. (2008) to evaluate these
conceptual models indicating that both models may act in concert.
A System’s Perspective on Leaf Growth
In Systems Biology the aim is to acquire a mechanistic understanding of biological
processes. In most cases the detailed knowledge is formulated in mathematical models that
can simulate the behavior of the system and predict the effect of environmental and genetic
perturbations. Such predictions can then be experimentally tested and the results used to
improve the models further. This way models and experiments reinforce each other
leading to increased understanding of the system (Kitano, 2002).
Here we adopt the view that cells are the units that direct development by integrating local
signals into developmental decisions. Therefore, to build a mechanistic model for leaf
growth we need to be able to model a single cell and its progeny as it progresses from the
stem cell niche into the various positions in the mature leaf. The outcome of the integrated
behavior of all cells ultimately forming the leaf is an organ of realistic size and morphology.
This is currently still a very ambitious goal, but as a first step we addressed here the
question what the current state of knowledge is with regards to regulatory networks that
operate in cells as they progress in their individual developmental pathway.
Leaf development: a cellular perspective
52
During their developmental journey plant cells or rather their cell lineages are exposed to
diverse biochemical and biophysical conditions, despite being tied into a symplastic mesh-
work. Whereas, their final fate can be very different, ending up as a light harvesting
mesophyll cell versus an epidermal hair cell for instance, many similarities exist in the
events along their paths starting from the stem cell niche of the shoot apical meristem. We
have associated the different processes described above in separate sections with separate
regulatory networks. However, by comparing the corresponding network diagrams, it
readily becomes clear that many regulators and relations are shared; indicating that
considering them as isolated systems is a radical assumption.
All presented networks are subject to intense investigation and some are far from the
finished article, yet from a structural or topological perspective there are some recurring
themes or motifs that emerge. A first case is the negative feedback loop which is a typical
control structure that works like a thermostat: one factor stimulates a second factor which
switches the first one off above a certain threshold. Not surprisingly this motif is active in
the SAM where the WUS-CLV interaction ensures that sufficient stem cells are maintained
for indeterminate growth, at the same time avoiding over-proliferation. A second case we
have encountered is the CDK-APC/C interaction of the cell cycle. Here, the CDK-CYC activity
required for cell proliferation eventually turns on the degradation machinery that
inactivates CDK-CYC. Rather than providing spatial bounds the latter mechanism confers
temporal control on cell proliferation. A somewhat related type of periodicity is a result of
the auxin-PIN interaction crucial to phyllotactic patterning but likely also for determining
leaf venation and serration (Bilsborough et al., 2011). By polarizing PINs towards auxin
maxima, auxin levels are depleted in the surroundings. Another recurring motif is that of
mutual negative feedback inhibition which can lead to switch like (bistable) behavior. An
example is the proposed role of CDKA-KRP in the G1/S module of the cell cycle (Zhao et al.,
2012). Such a motif can also provide a strong basis to support two spatially distinct and
stable developmental domains. The antagonistic relation between ARP family and KNOX
family transcription factors for instance appears to operate as a mechanism that enables
primordium outgrowth while keeping the surrounding regions of the SAM undifferentiated.
Leaf development: a cellular perspective
53
We have encountered other cases where such a duality appears to be crucial:
determination of ab/adaxial leaf polarity on the one hand and vascular differentiation on
the other hand are both governed by the antagonistic relation between HD-ZIPIII and
KANADI family transcription factors. Importantly, here to exert such spatial inhibitory
effects additional mobile signals are in principle required, since the before mentioned TFs
as far as we know are immobile. Various small RNAs are prime candidates for such a role
(Braybrook and Kuhlemeier, 2010). In fact, many superimposed interactions with other
factors are typically present to further increase robustness to deleterious perturbations or
in contrast to increase the response to important developmental or environmental cues.
As we have seen how well the described regulatory networks are understood varies
considerably. Despite many plant-specific features and intricacies, the universal role and
conserved character of the cell cycle has helped in uncovering its regulation to a
considerable extent. Nevertheless, the precise functioning of KRPs and ubiquitin mediated
degradation in cell cycle transitions remains to be elucidated. For the regulation of the
transition between division and expansion for instance the coherency in the corresponding
network diagram is weaker indicating that our knowledge is still more scattered and
circumstantial. This lack of conceptual understanding is reflected in the absence of
published computational models for this process and similarly for others. Our
understanding of the regulation of cell growth is also relatively limited, in particular its
relation to cell division (Sablowski and Dornelas, 2013). Whereas, the core machinery is
relatively well understood, little is known about the way that primary growth determinants
such as water or nutrient availability are translated into cell growth differences. The role of
the TOR pathway in the regulation of growth and division, crucial in other eukaryotes, is
only starting to emerge for plants (Xiong et al., 2013).
Because of the symplastic nature of plant tissue and the lack of a central nervous system,
organ growth is more dependent on mobile growth signals that produce local gradients,
such as phytohormones, mobile proteins and miRNAs. Since evolution tends to take a
parsimonious approach it is not surprising that several growth signals are shared by
Leaf development: a cellular perspective
54
different processes (and organisms as well). As illustrated above (see Figure 1), auxin has
indeed been implicated in many developmental stages. If cytokinins are involved then they
typically act antagonistically with auxin and gibberellins (cf. primordium initiation). BRs at
the one hand positively regulate many growth processes, while on the other hand they
negatively regulate guard cell development. Some of the stress induced hormones such as
ABA and ethylene modulate cellular processes for example division, endoreplication and
the transition phase. Other growth hormones like JA and salicylic acid exert a negative
control on the endocycle and on leaf hair development respectively. These phytohormones
have complex interactions where one affects other’s synthesis, transport and signaling
cascades.
Obviously a generalization of the role of specific hormones would imply over-simplification
given the complexity of the regulatory interactions involved. Vernoux et al. (2011)
demonstrated indeed that the control of gene expression by auxin not only depends on its
distribution but also the expression patterns of the signaling network which consists of
over 50 potentially interacting transcriptional activators and repressors. This study further
highlights the importance of an integrative strategy which mathematical modeling
supported by detailed expression maps, live imaging of biosensors, and high-throughput
(interactome) data analysis. Given the crucial and complex role of non-cell-autonomous
signals such as phytohormones the development of sensitive (fluorescent) biosensors to
monitor their spatial and temporal distribution is an important trend (Brunoud et al., 2012;
Shani et al., 2013; Wells et al., 2013).
Other experimental data becoming invaluable for developing improved mathematical
models of leaf growth are quantitative growth data ranging from kinematic output
(Nelissen et al., 2013) to cellular-resolution digital data extracted form confocal images
(Kierzkowski et al., 2012). As repeatedly indicated above, multiple connections exist
between the discussed developmental stages, suggesting that an important challenge will
be to construct computational models that can reproduce these stages in a spontaneous
way. This will likely require a more advanced geometrical representation than a flat plane
Leaf development: a cellular perspective
55
or a simple sphere or cylinder. Developing coupled dynamical models of different tissues or
organs interacting through an interface might provide a useful first step. However,
eventually fully integrated three-dimensional models will be developed to grasp the
complex cross-talk between various internal and external signals. Next to biological insight,
increased computing power, for instance through improved parallelization algorithms, will
likely become the limiting factor in that process. Ultimately, a mechanistic model for leaf
development should integrate the regulatory networks that control developmental
decisions and processes of cells as they migrate in space and time from the shoot apical
meristem (SAM) to their final position in the leaf. Besides spatially and temporally highly
resolved experimental techniques combined with advanced top down data-extraction
techniques an important aspect will still remain to apply Ockham’s razor in a sensible way.
Choosing a minimal set of variables to produce the desired behavior will present a
challenge given the number of factors that are known to be involved or that are still to be
discovered. As we have attempted to demonstrate, in a number of cases it is already clear
which are the central regulators of the respective regulatory networks and some are
indeed central to existing computational models. Furthermore, the non-cell autonomous
signals and their gradients will inevitably be part of those future leaf developmental
models and connect them to the rest of the plant and even the environment.
Acknowledgements
This work was supported by a concerted research activity (GOA) research grant, ‘A Systems
Biology Approach of Leaf Morphogenesis’ from the research council of the University of
Antwerp and an Interuniversity Attraction Poles (IUAP) from the Belgian Federal Science
Policy Office (BELSPO). Dirk De Vos was funded by a return grant and grant IAP7/29 from
BELSPO and Shweta Kalve by a training grant from the Department of Science and
Education of the Flemish Government.
Leaf development: a cellular perspective
56
References
Achard P, Gusti A, Cheminant S, Alioua M, Dhondt S, Coppens F, Beemster GT,
Genschik P. 2009. Gibberellin signaling controls cell proliferation rate in Arabidopsis. Curr
Biol 19, 1188-1193.
Adenot X, Elmayan T, Lauressergues D, Boutet S, Bouche N, Gasciolli V, Vaucheret H.
2006. DRB4-dependent TAS3 trans-acting siRNAs control leaf morphology through AGO7.
Curr Biol 16, 927-932.
Akita K, Hasezawa S, Higaki T. 2013. Breaking of plant stomatal one-cell-spacing rule by
sugar solution immersion. PLoS ONE 8, e72456.
Anastasiou E, Kenz S, Gerstung M, MacLean D, Timmer J, Fleck C, Lenhard M. 2007.
Control of plant organ size by KLUH/CYP78A5-dependent intercellular signaling. Dev Cell
13, 843-856.
Andersen SU, Buechel S, Zhao Z, Ljung K, Novak O, Busch W, Schuster C, Lohmann JU.
2008. Requirement of B2-type cyclin-dependent kinases for meristem integrity in
Arabidopsis thaliana. Plant Cell 20, 88-100.
Anderson GH, Veit B, Hanson MR. 2005. The Arabidopsis AtRaptor genes are essential for
post-embryonic plant growth. BMC Biol 3, 12.
Andriankaja M, Dhondt S, De Bodt S, Vanhaeren H, Coppens F, De Milde L,
Muhlenbock P, Skirycz A, Gonzalez N, Beemster GT, Inze D. 2012. Exit from
proliferation during leaf development in Arabidopsis thaliana: a not-so-gradual process.
Dev Cell 22, 64-78.
Anzola JM, Sieberer T, Ortbauer M, Butt H, Korbei B, Weinhofer I, Mullner AE,
Luschnig C. 2010. Putative Arabidopsis transcriptional adaptor protein (PROPORZ1) is
required to modulate histone acetylation in response to auxin. Proc Natl Acad Sci U S A
107, 10308-10313.

Leaf development: a cellular perspective
57
Autran D, Jonak C, Belcram K, Beemster GT, Kronenberger J, Grandjean O, Inze D,
Traas J. 2002. Cell numbers and leaf development in Arabidopsis: a functional analysis of
the STRUWWELPETER gene. EMBO J 21, 6036-6049.
Baima S, Possenti M, Matteucci A, Wisman E, Altamura MM, Ruberti I, Morelli G. 2001.
The Arabidopsis ATHB-8 HD-zip protein acts as a differentiation-promoting transcription
factor of the vascular meristems. Plant Physiol 126, 643-655.
Barkoulas M, Hay A, Kougioumoutzi E, Tsiantis M. 2008. A developmental framework
for dissected leaf formation in the Arabidopsis relative Cardamine hirsuta. Nat Genet 40,
1136-1141.
Bayer EM, Smith RS, Mandel T, Nakayama N, Sauer M, Prusinkiewicz P, Kuhlemeier C.
2009. Integration of transport-based models for phyllotaxis and midvein formation. Genes
Dev 23, 373-384.
Beemster GT, De Veylder L, Vercruysse S, West G, Rombaut D, Van Hummelen P,
Galichet A, Gruissem W, Inze D, Vuylsteke M. 2005. Genome-wide analysis of gene
expression profiles associated with cell cycle transitions in growing organs of Arabidopsis.
Plant Physiol 138, 734-743.
Beemster GT, Fiorani F, Inze D. 2003. Cell cycle: the key to plant growth control? Trends
Plant Sci 8, 154-158.
Beemster GTS, Vercruysse S, De Veylder L, Kuiper M, Inze D. 2006. The Arabidopsis leaf
as a model system for investigating the role of cell cycle regulation in organ growth. J Plant
Res 119, 43-50.
Berckmans B, De Veylder L. 2009. Transcriptional control of the cell cycle. Curr Opin Plant
Biol 12, 599-605.
Bergmann DC, Lukowitz W, Somerville CR. 2004. Stomatal development and pattern
controlled by a MAPKK kinase. Science 304, 1494-1497.
Leaf development: a cellular perspective
58
Bilsborough GD, Runions A, Barkoulas M, Jenkins HW, Hasson A, Galinha C, Laufs P,
Hay A, Prusinkiewicz P, Tsiantis M. 2011. Model for the regulation of Arabidopsis
thaliana leaf margin development. Proc Natl Acad Sci U S A 108, 3424-3429.
Blilou I, Frugier F, Folmer S, Serralbo O, Willemsen V, Wolkenfelt H, Eloy NB, Ferreira
PC, Weisbeek P, Scheres B. 2002. The Arabidopsis HOBBIT gene encodes a CDC27
homolog that links the plant cell cycle to progression of cell differentiation. Genes Dev 16,
2566-2575.
Blow JJ, Dutta A. 2005. Preventing re-replication of chromosomal DNA. Nat Rev Mol Cell
Biol 6, 476-486.
Boerjan W, Cervera MT, Delarue M, Beeckman T, Dewitte W, Bellini C, Caboche M,
Van Onckelen H, Van Montagu M, Inze D. 1995. Superroot, a recessive mutation in
Arabidopsis, confers auxin overproduction. Plant Cell 7, 1405-1419.
Bonaccorso O, Lee JE, Puah L, Scutt CP, Golz JF. 2012. FILAMENTOUS FLOWER controls
lateral organ development by acting as both an activator and a repressor. BMC Plant Biol
12.
Bonke M, Thitamadee S, Mahonen AP, Hauser MT, Helariutta Y. 2003. APL regulates
vascular tissue identity in Arabidopsis. Nature 426, 181-186.
Borghi L, Gutzat R, Futterer J, Laizet Y, Hennig L, Gruissem W. 2010. Arabidopsis
RETINOBLASTOMA-RELATED is required for stem cell maintenance, cell differentiation,
and lateral organ production. Plant Cell 22, 1792-1811.
Borowska-Wykret D, Elsner J, De Veylder L, Kwiatkowska D. 2013. Defects in leaf
epidermis of Arabidopsis thaliana plants with CDKA;1 activity reduced in the shoot apical
meristem. Protoplasma 250, 955-961.
Boudolf V, Barroco R, Engler Jde A, Verkest A, Beeckman T, Naudts M, Inze D, De
Veylder L. 2004a. B1-type cyclin-dependent kinases are essential for the formation of
stomatal complexes in Arabidopsis thaliana. Plant Cell 16, 945-955.
Leaf development: a cellular perspective
59
Boudolf V, Lammens T, Boruc J, Van Leene J, Van Den Daele H, Maes S, Van Isterdael
G, Russinova E, Kondorosi E, Witters E, De Jaeger G, Inze D, De Veylder L. 2009.
CDKB1;1 forms a functional complex with CYCA2;3 to suppress endocycle onset. Plant
Physiol 150, 1482-1493.
Boudolf V, Vlieghe K, Beemster GT, Magyar Z, Torres Acosta JA, Maes S, Van Der
Schueren E, Inze D, De Veylder L. 2004b. The plant-specific cyclin-dependent kinase
CDKB1;1 and transcription factor E2Fa-DPa control the balance of mitotically dividing and
endoreduplicating cells in Arabidopsis. Plant Cell 16, 2683-2692.
Bouyer D, Geier F, Kragler F, Schnittger A, Pesch M, Wester K, Balkunde R, Timmer J,
Fleck C, Hulskamp M. 2008. Two-dimensional patterning by a trapping/depletion
mechanism: the role of TTG1 and GL3 in Arabidopsis trichome formation. PLoS Biol 6, e141.
Brand U, Fletcher JC, Hobe M, Meyerowitz EM, Simon R. 2000. Dependence of stem cell
fate in Arabidopsis on a feedback loop regulated by CLV3 activity. Science 289, 617-619.
Braun N, Wyrzykowska J, Muller P, David K, Couch D, Rechenmann CP, Fleming AJ.
2008. Conditional repression of AUXIN BINDING PROTEIN1 reveals that it coordinates cell
division and cell expansion during postembryonic shoot development in Arabidopsis and
Tobacco. Plant Cell 20, 2746–2762.
Braybrook SA, Kuhlemeier C. 2010. How a plant builds leaves. Plant Cell 22, 1006-1018.
Brunoud G, Wells DM, Oliva M, Larrieu A, Mirabet V, Burrow AH, Beeckman T,
Kepinski S, Traas J, Bennett MJ, Vernoux T. 2012. A novel sensor to map auxin response
and distribution at high spatio-temporal resolution. Nature 482, 103-106.
Byrne ME, Barley R, Curtis M, Arroyo JM, Dunham M, Hudson A, Martienssen RA.
2000. Asymmetric leaves1 mediates leaf patterning and stem cell function in Arabidopsis.
Nature 408, 967-971.
Byrne ME, Simorowski J, Martienssen RA. 2002. ASYMMETRIC LEAVES1 reveals knox
gene redundancy in Arabidopsis. Development 129, 1957-1965.
Leaf development: a cellular perspective
60
Caesar K, Elgass K, Chen Z, Huppenberger P, Witthoft J, Schleifenbaum F, Blatt MR,
Oecking C, Harter K. 2011. A fast brassinolide-regulated response pathway in the plasma
membrane of Arabidopsis thaliana. Plant J 66, 528-540.
Caldana C, Li Y, Leisse A, Zhang Y, Bartholomaeus L, Fernie AR, Willmitzer L,
Giavalisco P. 2013. Systemic analysis of inducible target of rapamycin mutants reveal a
general metabolic switch controlling growth in Arabidopsis thaliana. Plant J 73, 897-909.
Cano-Delgado A, Yin YH, Yu C, Vafeados D, Mora-Garcia S, Cheng JC, Nam KH, Li JM,
Chory J. 2004. BRL1 and BRL3 are novel brassinosteroid receptors that function in
vascular differentiation in Arabidopsis. Development 131, 5341-5351.
Carles CC, Fletcher JC. 2003. Shoot apical meristem maintenance: the art of a dynamic
balance. Trends Plant Sci 8, 394-401.
Castellano Mdel M, Boniotti MB, Caro E, Schnittger A, Gutierrez C. 2004. DNA
replication licensing affects cell proliferation or endoreplication in a cell type-specific
manner. Plant Cell 16, 2380-2393.
Cheng Y, Cao L, Wang S, Li Y, Shi X, Liu H, Li L, Zhang Z, Fowke LC, Wang H, Zhou Y.
2013. Downregulation of multiple CDK inhibitor ICK/KRP genes upregulates the E2F
pathway and increases cell proliferation, and organ and seed sizes in Arabidopsis. Plant J
75, 642-655.
Cheng Y, Dai X, Zhao Y. 2007. Auxin synthesized by the YUCCA Flavin Monooxygenases is
essential for embryogenesis and leaf formation in Arabidopsis. Plant Cell 19, 2430–2439.
Chitwood DH, Guo M, Nogueira FT, Timmermans MC. 2007. Establishing leaf polarity:
the role of small RNAs and positional signals in the shoot apex. Development 134, 813-823.
Chitwood DH, Nogueira FT, Howell MD, Montgomery TA, Carrington JC, Timmermans
MC. 2009. Pattern formation via small RNA mobility. Genes Dev 23, 549-554.
Leaf development: a cellular perspective
61
Cho HJ, Kwon HK, Wang MH. 2010. Expression of Kip-related protein 4 gene (KRP4) in
response to auxin and cytokinin during growth of Arabidopsis thaliana. BMB Rep 43, 273-
278.
Cho HT, Cosgrove DJ. 2000. Altered expression of expansin modulates leaf growth and
pedicel abscission in Arabidopsis thaliana. Proc Natl Acad Sci U S A 97, 9783-9788.
Churchman ML, Brown ML, Kato N, Kirik V, Hulskamp M, Inze D, De Veylder L, Walker
JD, Zheng Z, Oppenheimer DG, Gwin T, Churchman J, Larkin JC. 2006. SIAMESE, a plant-
specific cell cycle regulator, controls endoreplication onset in Arabidopsis thaliana. Plant
Cell 18, 3145-3157.
Claeys H, Skirycz A, Maleux K, Inze D. 2012. DELLA signaling mediates stress-induced cell
differentiation in Arabidopsis leaves through modulation of anaphase-promoting
complex/cyclosome activity. Plant Physiol 159, 739-747.
Clark SE. 2001. Cell signalling at the shoot meristem. Nat Rev Mol Cell Biol 2, 276-284.
Cosgrove DJ. 2005. Growth of the plant cell wall. Nat Rev Mol Cell Biol 6, 850-861.
Cromer L, Heyman J, Touati S, Harashima H, Araou E, Girard C, Horlow C, Wassmann
K, Schnittger A, De Veylder L, Mercier R. 2012. OSD1 promotes meiotic progression via
APC/C inhibition and forms a regulatory network with TDM and CYCA1;2/TAM. Plos Genet
8, e1002865.
de Almeida Engler J, De Veylder L, De Groodt R, Rombauts S, Boudolf V, De Meyer B,
Hemerly A, Ferreira P, Beeckman T, Karimi M, Hilson P, Inze D, Engler G. 2009.
Systematic analysis of cell-cycle gene expression during Arabidopsis development. Plant J
59, 645-660.
de Jager SM, Menges M, Bauer UM, Murray JAH. 2001. Arabidopsis E2F1 binds a
sequence present in the promoter of S-phase-regulated gene AtCDC6 and is a member of a
multigene family with differential activities. Plant Mol Biol 47, 555-568.
Leaf development: a cellular perspective
62
de Reuille PB, Bohn-Courseau I, Ljung K, Morin H, Carraro N, Godin C, Traas J. 2006.
Computer simulations reveal properties of the cell-cell signaling network at the shoot apex
in Arabidopsis. Proc Natl Acad Sci U S A 103, 1627-1632.
De Schutter K, Joubes J, Cools T, Verkest A, Corellou F, Babiychuk E, Van Der Schueren
E, Beeckman T, Kushnir S, Inze D, De Veylder L. 2007. Arabidopsis WEE1 kinase controls
cell cycle arrest in response to activation of the DNA integrity checkpoint. Plant Cell 19,
211-225.
De Veylder L, Beeckman T, Beemster GT, de Almeida Engler J, Ormenese S, Maes S,
Naudts M, Van Der Schueren E, Jacqmard A, Engler G, Inze D. 2002. Control of
proliferation, endoreduplication and differentiation by the Arabidopsis E2Fa-DPa
transcription factor. EMBO J 21, 1360-1368.
De Veylder L, Beeckman T, Beemster GTS, Krols L, Terras P, Landrieu I, Van der
Schueren E, Maes S, Naudts M, Inze D. 2001. Functional analysis of cyclin-dependent
kinase inhibitors of Arabidopsis. Plant Cell 13, 1653-1667.
De Veylder L, Larkin JC, Schnittger A. 2011. Molecular control and function of
endoreplication in development and physiology. Trends Plant Sci 16, 624-634.
De Vos D, Dzhurakhalov A, Draelants D, Bogaerts I, Kalve S, Prinsen E, Vissenberg K,
Vanroose W, Broeckhove J, Beemster GT. 2012. Towards mechanistic models of plant
organ growth. J Exp Bot 63, 3325-3337.
del Pozo JC, Boniotti MB, Gutierrez C. 2002. Arabidopsis E2Fc functions in cell division
and is degraded by the ubiquitin-SCFAtSKP2 pathway in response to light. Plant Cell 14,
3057-3071.
del Pozo JC, Diaz-Trivino S, Cisneros N, Gutierrez C. 2006. The balance between cell
division and endoreplication depends on E2FC-DPB, transcription factors regulated by the
ubiquitin-SCFSKP2A pathway in Arabidopsis. Plant Cell 18, 2224-2235.
Leaf development: a cellular perspective
63
Deprost D, Yao L, Sormani R, Moreau M, Leterreux G, Nicolai M, Bedu M, Robaglia C,
Meyer C. 2007. The Arabidopsis TOR kinase links plant growth, yield, stress resistance and
mRNA translation. EMBO Rep 8, 864-870.
Desvoyes Bnd, Ramirez-Parra E, Xie Q, Chua N-H, Gutierrez C. 2006. Cell type-specific
role of the retinoblastoma/E2F pathway during Arabidopsis leaf development. Plant Physiol
140, 67–80.
Dewitte W, Murray JA. 2003. The plant cell cycle. Annu Rev Plant Biol 54, 235-264.
Dewitte W, Riou-Khamlichi C, Scofield S, Healy JMS, Jacqmard A, Kilby NJ, Murray JAH.
2003. Altered cell cycle distribution, hyperplasia, and inhibited differentiation in
Arabidopsis caused by the D-type cyclin CYCD3. Plant Cell 15, 79–92.
Dewitte W, Scofield S, Alcasabas AA, Maughan SC, Menges M, Braun N, Collins C,
Nieuwland J, Prinsen E, Sundaresan V, Murray JA. 2007. Arabidopsis CYCD3 D-type
cyclins link cell proliferation and endocycles and are rate-limiting for cytokinin responses.
Proc Natl Acad Sci U S A 104, 14537-14542.
Disch S, Anastasiou E, Sharma VK, Laux T, Fletcher JC, Lenhard M. 2006. The E3
ubiquitin ligase BIG BROTHER controls Arabidopsis organ size in a dosage-dependent
manner. Curr Biol 16, 272-279.
Dissmeyer N, Weimer AK, Pusch S, De Schutter K, Kamei CLA, Nowack MK, Novak B,
Duan GL, Zhu YG, De Veylder L, Schnittger A. 2009. Control of cell proliferation, organ
growth, and DNA damage response operate independently of dephosphorylation of the
Arabidopsis Cdk1 homolog CDKA;1. Plant Cell 21, 3641-3654.
Dissmeyer N, Weimer AK, Veylder LD, Novak B, Schnittger A. 2010. The regulatory
network of cell cycle progression is fundamentally different in plants versus yeast or
metazoans. Plant Signal Behav 5, 1613-1618.
Dyson RJ, Band LR, Jensen OE. 2012. A model of crosslink kinetics in the expanding plant
cell wall: yield stress and enzyme action. J Theor Biol 307, 125-136.
Leaf development: a cellular perspective
64
Efroni I, Blum E, Goldshmidt A, Eshed Y. 2008. A protracted and dynamic maturation
schedule underlies Arabidopsis leaf development. Plant Cell 20, 2293-2306.
Eloy NB, de Freitas Lima M, Van Damme D, Vanhaeren H, Gonzalez N, De Milde L,
Hemerly AS, Beemster GT, Inze D, Ferreira PC. 2011. The APC/C subunit 10 plays an
essential role in cell proliferation during leaf development. Plant J 68, 351-363.
Eloy NB, Gonzalez N, Van Leene J, Maleux K, Vanhaeren H, De Milde L, Dhondt S,
Vercruysse L, Witters E, Mercier R, Cromer L, Beemster GT, Remaut H, Van Montagu
MC, De Jaeger G, Ferreira PC, Inze D. 2012. SAMBA, a plant-specific anaphase-promoting
complex/cyclosome regulator is involved in early development and A-type cyclin
stabilization. Proc Natl Acad Sci U S A 109, 13853-13858.
Emery JF, Floyd SK, Alvarez J, Eshed Y, Hawker NP, Izhaki A, Baum SF, Bowman JL.
2003. Radial patterning of Arabidopsis shoots by class III HD-ZIP and KANADI genes. Curr
Biol 13, 1768-1774.
Engler JD, Kyndt T, Vieira P, Van Cappelle E, Boudolf V, Sanchez V, Escobar C, De
Veylder L, Engler G, Abad P, Gheysen G. 2012. CCS52 and DEL1 genes are key
components of the endocycle in nematode-induced feeding sites. Plant J 72, 185-198.
Eshed Y, Baum SF, Perea JV, Bowman JL. 2001. Establishment of polarity in lateral organs
of plants. Curr Biol 11, 1251-1260.
Eshed Y, Izhaki A, Baum SF, Floyd SK, Bowman JL. 2004. Asymmetric leaf development
and blade expansion in Arabidopsis are mediated by KANADI and YABBY activities.
Development 131, 2997-3006.
Feng G, Qin Z, Yan J, Zhang X, Hu Y. 2011. Arabidopsis ORGAN SIZE RELATED1 regulates
organ growth and final organ size in orchestration with ARGOS and ARL. New Phytol 191,
635–646.
Francis D. 2007. The plant cell cycle-15 years on. New Phytol 174, 261-278.
Leaf development: a cellular perspective
65
Francis D, Sorrell DA. 2001. The interface between the cell cycle and plant growth
regulators: a mini review. Plant Growth Regul 33, 1-12.
Fulop K, Tarayre S, Kelemen Z, Horvath G, Kevei Z, Nikovics K, Bako L, Brown S,
Kondorosi A, Kondorosi E. 2005. Arabidopsis anaphase-promoting complexes: Multiple
activators and wide range of substrates might keep APC perpetually busy. Cell Cycle 4,
1084-1092.
Gaamouche T, Manes CL, Kwiatkowska D, Berckmans B, Koumproglou R, Maes S,
Beeckman T, Vernoux T, Doonan JH, Traas J, Inze D, De Veylder L. 2010. Cyclin-
dependent kinase activity maintains the shoot apical meristem cells in an undifferentiated
state. Plant J 64, 26-37.
Gardiner J, Donner TJ, Scarpella E. 2011. Simultaneous activation of SHR and ATHB8
expression defines switch to preprocambial cell state in Arabidopsis leaf development. Dev
Dyn 240, 261-270.
Gendreau E, Orbovic V, Hofte H, Traas J. 1999. Gibberellin and ethylene control
endoreduplication levels in the Arabidopsis thaliana hypocotyl. Planta 209, 513-516.
Gonzalez N, Vanhaeren H, Inze D. 2012. Leaf size control: complex coordination of cell
division and expansion. Trends Plant Sci 17, 332-340.
Gordon SP, Chickarmane VS, Ohno C, Meyerowitz EM. 2009. Multiple feedback loops
through cytokinin signaling control stem cell number within the Arabidopsis shoot
meristem. Proc Natl Acad Sci U S A 106, 16529-16534.
Grebe M. 2012. The patterning of epidermal hairs in Arabidopsis-updated. Curr Opin Plant
Biol 15, 31-37.
Green PB. 1976. Growth and cell pattern formation on an axis: critique of concepts,
terminology and modes of study. Bot Gaz 137, 187-202.
Leaf development: a cellular perspective
66
Gudesblat GE, Schneider-Pizon J, Betti C, Mayerhofer J, Vanhoutte I, van Dongen W,
Boeren S, Zhiponova M, de Vries S, Jonak C, Russinova E. 2012. SPEECHLESS integrates
brassinosteroid and stomata signalling pathways. Nat Cell Biol 14, 548-554.
Guenot B, Bayer E, Kierzkowski D, Smith RS, Mandel T, Zadnikova P, Benkova E,
Kuhlemeier C. 2012. Pin1-independent leaf initiation in Arabidopsis. Plant Physiol 159,
1501-1510.
Haecker A, Laux T. 2001. Cell-cell signaling in the shoot meristem. Curr. Opin. Plant Biol 4,
441-446.
Hara K, Yokoo T, Kajita R, Onishi T, Yahata S, Peterson KM, Torii KU, Kakimoto T.
2009. Epidermal cell density is autoregulated via a secretory peptide, EPIDERMAL
PATTERNING FACTOR 2 in Arabidopsis leaves. Plant Cell Physiol 50, 1019-1031.
Harashima H, Dissmeyer N, Schnittger A. 2013. Cell cycle control across the eukaryotic
kingdom. Trends Cell Biol 23, 345-356.
Hay A, Barkoulas M, Tsiantis M. 2006. ASYMMETRIC LEAVES1 and auxin activities
converge to repress BREVIPEDICELLUS expression and promote leaf development in
Arabidopsis. Development 133, 3955-3961.
Hay A, Tsiantis M. 2006. The genetic basis for differences in leaf form between Arabidopsis
thaliana and its wild relative Cardamine hirsuta. Nat Genet 38, 942-947.
Hay A, Tsiantis M. 2010. KNOX genes: versatile regulators of plant development and
diversity. Development 137, 3153-3165.
Heisler MG, Hamant O, Krupinski P, Uyttewaal M, Ohno C, Jonsson H, Traas J,
Meyerowitz EM. 2010. Alignment between PIN1 polarity and microtubule orientation in
the shoot apical meristem reveals a tight coupling between morphogenesis and auxin
transport. PLoS Biol 8, e1000516.
Leaf development: a cellular perspective
67
Hemerly A, Engler Jde A, Bergounioux C, Van Montagu M, Engler G, Inze D, Ferreira P.
1995. Dominant negative mutants of the Cdc2 kinase uncouple cell division from iterative
plant development. EMBO J 14, 3925-3936.
Hershko A. 2005. The ubiquitin system for protein degradation and some of its roles in the
control of the cell division cycle. Cell Death Differ 12, 1191-1197.
Heyman J, De Veylder L. 2012. The anaphase-promoting complex/cyclosome in control of
plant development. Mol Plant 5, 1182-1194.
Heyman J, Van den Daele H, De Wit K, Boudolf V, Berckmans B, Verkest A, Alvim
Kamei CL, De Jaeger G, Koncz C, De Veylder L. 2011. Arabidopsis ULTRAVIOLET-B-
INSENSITIVE4 maintains cell division activity by temporal inhibition of the anaphase-
promoting complex/cyclosome. Plant Cell 23, 4394-4410.
Higuchi M, Pischke MS, Mahonen AP, Miyawaki K, Hashimoto Y, Seki M, Kobayashi M,
Shinozaki K, Kato T, Tabata S, Helariutta Y, Sussman MR, Kakimoto T. 2004. In planta
functions of the Arabidopsis cytokinin receptor family. Proc Natl Acad Sci U S A 101, 8821-
8826.
Hohm T, Zitzler E, Simon R. 2010. A dynamic model for stem cell homeostasis and
patterning in Arabidopsis meristems. PLoS ONE 5, e9189.
Horiguchi G, Kim GT, Tsukaya H. 2005. The transcription factor AtGRF5 and the
transcription coactivator AN3 regulate cell proliferation in leaf primordia of Arabidopsis
thaliana. Plant J 43, 68-78.
Horvath BM, Magyar Z, Zhang Y, Hamburger AW, Bako L, Visser RG, Bachem CW,
Bogre L. 2006. EBP1 regulates organ size through cell growth and proliferation in plants.
EMBO J 25, 4909-4920.
Hu Y, Bao F, Li J. 2000. Promotive effect of brassinosteroids on cell division involves a
distinct CycD3-induction pathway in Arabidopsis. Plant J 24, 693-701.
Leaf development: a cellular perspective
68
Hu Y, Xie Q, Chua NH. 2003. The Arabidopsis auxin-inducible gene ARGOS controls lateral
organ size. Plant Cell 15, 1951-1961.
Hulskamp M, Misra S, Jurgens G. 1994. Genetic dissection of trichome cell development in
Arabidopsis. Cell 76, 555-566.
Hunter C, Willmann MR, Wu G, Yoshikawa M, de la Luz Gutierrez-Nava M, Poethig SR.
2006. Trans-acting siRNA-mediated repression of ETTIN and ARF4 regulates heteroblasty
in Arabidopsis. Development 133, 2973-2981.
Ibanes M, Fabregas N, Chory J, Cano-Delgado AI. 2009. Brassinosteroid signaling and
auxin transport are required to establish the periodic pattern of Arabidopsis shoot vascular
bundles. Proc Natl Acad Sci U S A 106, 13630-13635.
Imai KK, Ohashi Y, Tsuge T, Yoshizumi T, Matsui M, Oka A, Aoyama T. 2006. The A-type
cyclin CYCA2;3 is a key regulator of ploidy levels in Arabidopsis endoreduplication. Plant
Cell 18, 382-396.
Inze D, De Veylder L. 2006. Cell cycle regulation in plant development. Annu Rev Genet 40,
77-105.
Inze D, Gutierrez C, Chua NH. 1999. Trends in plant cell cycle research. Plant Cell 11, 991-
994.
Ishida T, Adachi S, Yoshimura M, Shimizu K, Umeda M, Sugimoto K. 2010. Auxin
modulates the transition from the mitotic cycle to the endocycle in Arabidopsis.
Development 137, 63-71.
Ito M, Araki S, Matsunaga S, Itoh T, Nishihama R, Machida Y, Doonan JH, Watanabe A.
2001. G2/M-phase-specific transcription during the plant cell cycle is mediated by c-Myb-
like transcription factors. Plant Cell 13, 1891-1905.
Iwata E, Ikeda S, Matsunaga S, Kurata M, Yoshioka Y, Criqui MC, Genschik P, Ito M.
2011. GIGAS CELL1, a novel negative regulator of the anaphase-promoting
Leaf development: a cellular perspective
69
complex/cyclosome, is required for proper mitotic progression and cell fate determination
in Arabidopsis. Plant Cell 23, 4382-4393.
Jackson D, Veit B, Hake S. 1994. Expression of maize KNOTTED1 related homeobox genes
in the shoot apical meristem predicts patterns of morphogenesis in the vegetative shoot.
Development 120, 405-413.
Jasinski S, Piazza P, Craft J, Hay A, Woolley L, Rieu I, Phillips A, Hedden P, Tsiantis M.
2005. KNOX action in Arabidopsis is mediated by coordinate regulation of cytokinin and
gibberellin activities. Curr Biol 15, 1560–1565.
Jegu T, Latrasse D, Delarue M, Mazubert C, Bourge M, Hudik E, Blanchet S, Soler MN,
Charon C, De Veylder L, Raynaud C, Bergounioux C, Benhamed M. 2013. Multiple
functions of Kip-related protein5 connect endoreduplication and cell elongation. Plant
Physiol 161, 1694-1705.
Jonsson H, Heisler M, Reddy GV, Agrawal V, Gor V, Shapiro BE, Mjolsness E,
Meyerowitz EM. 2005. Modeling the organization of the WUSCHEL expression domain in
the shoot apical meristem. Bioinformatics 21 Suppl 1, i232-240.
Joubes J, De Schutter K, Verkest A, Inze D, De Veylder L. 2004. Conditional,
recombinase-mediated expression of genes in plant cell cultures. Plant J 37, 889-896.
Jung JH, Park CM. 2007. Vascular development in plants: Specification of xylem and
phloem tissues. J Plant Biol 50, 301-305.
Kanaoka MM, Pillitteri LJ, Fujii H, Yoshida Y, Bogenschutz NL, Takabayashi J, Zhu JK,
Torii KU. 2008. SCREAM/ICE1 and SCREAM2 specify three cell-state transitional steps
leading to Arabidopsis stomatal differentiation. Plant Cell 20, 1775-1785.
Kang J, Mizukami Y, Wang H, Fowke L, Dengler NG. 2007. Modification of cell
proliferation patterns alters leaf vein architecture in Arabidopsis thaliana. Planta 226,
1207-1218.
Leaf development: a cellular perspective
70
Kang JS, Soh WY. 2001. The origin and development of vascular cambium in girdled stems
of Eucommia ulmoides Oliv. . J Plant Biol 44, 148-156
Kasili R, Walker JD, Simmons LA, Zhou J, Veylder LD, Larkin JC. 2010. SIAMESE
cooperates with the CDH1-like protein CCS52A1 to establish endoreplication in Arabidopsis
thaliana trichomes. Genetics 185, 257–268.
Kerstetter RA, Bollman K, Taylor RA, Bomblies K, Poethig RS. 2001. KANADI regulates
organ polarity in Arabidopsis. Nature 411, 706-709.
Kevei Z, Baloban M, Da Ines O, Tiricz H, Kroll A, Regulski K, Mergaert P, Kondorosi E.
2011. Conserved CDC20 cell cycle functions are carried out by two of the five isoforms in
Arabidopsis thaliana. PLoS ONE 6.
Kidner CA, Martienssen RA. 2004. Spatially restricted microRNA directs leaf polarity
through ARGONAUTE1. Nature 428, 81-84.
Kierzkowski D, Nakayama N, Routier-Kierzkowska AL, Weber A, Bayer E, Schorderet
M, Reinhardt D, Kuhlemeier C, Smith RS. 2012. Elastic domains regulate growth and
organogenesis in the plant shoot apical meristem. Science 335, 1096-1099.
Kim HJ, Oh SA, Brownfield L, Hong SH, Ryu H, Hwang I, Twell D, Nam HG. 2008. Control
of plant germline proliferation by SCF(FBL17) degradation of cell cycle inhibitors. Nature
455, 1134-1137.
Kim JH, Choi D, Kende H. 2003. The AtGRF family of putative transcription factors is
involved in leaf and cotyledon growth in Arabidopsis. Plant J 36, 94-104.
Kim TW, Michniewicz M, Bergmann DC, Wang ZY. 2012. Brassinosteroid regulates
stomatal development by GSK3-mediated inhibition of a MAPK pathway. Nature 482, 419-
422.
Leaf development: a cellular perspective
71
Kirik V, Lee MM, Wester K, Herrmann U, Zheng Z, Oppenheimer D, Schiefelbein J,
Hulskamp M. 2005. Functional diversification of MYB23 and GL1 genes in trichome
morphogenesis and initiation. Development 132, 1477-1485.
Kirik V, Simon M, Wester K, Schiefelbein J, Hulskamp M. 2004. ENHANCER of TRY and
CPC 2 (ETC2) reveals redundancy in the region-specific control of trichome development of
Arabidopsis. Plant Mol Biol 55, 389-398.
Kitano H. 2002. Computational systems biology. Nature 420, 206-210.
Knauer S, Holt AL, Rubio-Somoza I, Tucker EJ, Hinze A, Pisch M, Javelle M,
Timmermans MC, Tucker MR, Laux T. 2013. A protodermal miR394 signal defines a
region of stem cell competence in the Arabidopsis shoot meristem. Dev Cell 24, 125-132.
Korner C, Menendezriedl SP, John PCL. 1989. Why are bonsai plants small? a
consideration of cell size. Aust J Plant Physiol 16, 443-448.
Krizek BA. 2009. Making bigger plants: key regulators of final organ size. Curr Opin Plant
Biol 12, 17-22.
Kubo M, Udagawa M, Nishikubo N, Horiguchi G, Yamaguchi M, Ito J, Mimura T, Fukuda
H, Demura T. 2005. Transcription switches for protoxylem and metaxylem vessel
formation. Genes Dev 19, 1855-1860.
Kuchen EE, Fox S, de Reuille PB, Kennaway R, Bensmihen S, Avondo J, Calder GM,
Southam P, Robinson S, Bangham A, Coen E. 2012. Generation of Leaf Shape Through
Early Patterns of Growth and Tissue Polarity. Science 335, 1092-1096.
Kurepa J, Wang S, Li Y, Zaitlin D, Pierce AJ, Smalle JA. 2009. Loss of 26S proteasome
function leads to increased cell size and decreased cell number in Arabidopsis shoot organs.
Plant Physiol 150, 178-189.
Leaf development: a cellular perspective
72
Lai LB, Nadeau JA, Lucas J, Lee E-K, Nakagawa T, Zhao L, Geisler M, Sack FD. 2005. The
Arabidopsis R2R3 MYB proteins FOUR LIPS and MYB88 restrict divisions late in the
stomatal cell lineage. Plant Cell 17, 2754-2767.
Lammens T, Boudolf V, Kheibarshekan L, Zalmas LP, Gaamouche T, Maes S,
Vanstraelen M, Kondorosi E, La Thangue NB, Govaerts W, Inze D, De Veylder L. 2008.
Atypical E2F activity restrains APC/CCCS52A2 function obligatory for endocycle onset.
Proc Natl Acad Sci U S A 105, 14721-14726.
Lampard GR, Lukowitz W, Ellis BE, Bergmann DC. 2009. Novel and expanded roles for
MAPK signaling in Arabidopsis stomatal cell fate revealed by cell type-specific
manipulations. Plant Cell 21, 3506-3517.
Lampard GR, MacAlister CA, Bergmann DC. 2008. Arabidopsis stomatal initiation is
controlled by MAPK-mediated regulation of the bHLH SPEECHLESS. Science 322, 1113-
1116.
Landrieu I, da Costa M, De Veylder L, Dewitte F, Vandepoele K, Hassan S, Wieruszeski
JM, Corellou F, Faure JD, Van Montagu M, Inze D, Lippens G. 2004. A small CDC25 dual-
specificity tyrosine-phosphatase isoform in Arabidopsis thaliana. Proc Natl Acad Sci U S A
101, 13380-13385.
Laux T, Mayer KF, Berger J, Jurgens G. 1996. The WUSCHEL gene is required for shoot
and floral meristem integrity in Arabidopsis. Development 122, 87-96.
Lee BH, Ko J-H, Lee S, Lee Y, Pak J-H, Kim JH. 2009. The Arabidopsis GRF-INTERACTING
FACTOR gene family performs an overlapping function in determining organ size as well as
multiple developmental properties. Plant Physiol 151, 655–668.
Leibfried A, To JP, Busch W, Stehling S, Kehle A, Demar M, Kieber JJ, Lohmann JU.
2005. WUSCHEL controls meristem function by direct regulation of cytokinin-inducible
response regulators. Nature 438, 1172-1175.
Leaf development: a cellular perspective
73
Li Y, Zheng L, Corke F, Smith C, Bevan MW. 2008. Control of final seed and organ size by
the DA1 gene family in Arabidopsis thaliana. Genes Dev 22, 1331-1336.
Liu D, Song Y, Chen Z, Yu D. 2009. Ectopic expression of miR396 suppresses GRF target
gene expression and alters leaf growth in Arabidopsis. Physiol Plant 136, 223-236.
Lockhart JA. 1965. An analysis of irreversible plant cell elongation. J Theor Biol 8, 264-275.
Long JA, Moan EI, Medford JI, Barton MK. 1996. A member of the KNOTTED class of
homeodomain proteins encoded by the STM gene of Arabidopsis. Nature 379, 66-69.
MacAlister CA, Ohashi-Ito K, Bergmann DC. 2007. Transcription factor control of
asymmetric cell divisions that establish the stomatal lineage. Nature 445, 537-540.
Magyar Z, De Veylder L, Atanassova A, Bako L, Inze D, Bogre L. 2005. The role of the
Arabidopsis E2FB transcription factor in regulating auxin-dependent cell division. Plant Cell
17, 2527-2541.
Mariconti L, Pellegrini B, Cantoni R, Stevens R, Bergounioux C, Cella R, Albani D. 2002.
The E2F family of transcription factors from Arabidopsis thaliana. Novel and conserved
components of the retinoblastoma/E2F pathway in plants. J Biol Chem 277, 9911-9919.
Marrocco K, Bergdoll M, Achard P, Criqui MC, Genschik P. 2010. Selective proteolysis
sets the tempo of the cell cycle. Curr Opin Plant Biol 13, 631-639.
Mauseth JD. 2004. Giant shoot apical meristems in cacti have ordinary leaf primordia but
altered phyllotaxy and shoot diameter. Ann Bot 94, 145-153.
McConnell JR, Barton MK. 1998. Leaf polarity and meristem formation in Arabidopsis.
Development 125, 2935-2942.
McConnell JR, Emery J, Eshed Y, Bao N, Bowman J, Barton MK. 2001. Role of
PHABULOSA and PHAVOLUTA in determining radial patterning in shoots. Nature 411, 709-
713.
Leaf development: a cellular perspective
74
McHale NA. 1993. LAM-l and FAT genes control development of the leaf blade in Nicotiana
sylwestris. Plant Cell 5, 1029-1038.
Menand B, Desnos T, Nussaume L, Berger F, Bouchez D, Meyer C, Robaglia C. 2002.
Expression and disruption of the Arabidopsis TOR (target of rapamycin) gene. Proc Natl
Acad Sci U S A 99, 6422-6427.
Menges M, de Jager SM, Gruissem W, Murray JAH. 2005. Global analysis of the core cell
cycle regulators of Arabidopsis identifies novel genes, reveals multiple and highly specific
profiles of expression and provides a coherent model for plant cell cycle control. Plant J 41,
546–566.
Meyerowitz EM. 1997. Control of cell division patterns in developing shoots and flowers of
Arabidopsis thaliana. Cold Spring Harb Symp Quant Biol 62, 369-375.
Miyashima S, Sebastian J, Lee JY, Helariutta Y. 2013. Stem cell function during plant
vascular development. EMBO J 32, 178-193.
Moreau M, Azzopardi M, Clement G, Dobrenel T, Marchive C, Renne C, Martin-
Magniette ML, Taconnat L, Renou JP, Robaglia C, Meyer C. 2012. Mutations in the
Arabidopsis homolog of LST8/GbetaL, a partner of the target of Rapamycin kinase, impair
plant growth, flowering, and metabolic adaptation to long days. Plant Cell 24, 463-481.
Morohashi K, Grotewold E. 2009. A systems approach reveals regulatory circuitry for
Arabidopsis trichome initiation by the GL3 and GL1 selectors. PLoS Genet 5, e1000396.
Nadeau JA, Sack FD. 2002. Control of stomatal distribution on the Arabidopsis leaf surface.
Science 296, 1697-1700.
Nakata M, Matsumoto N, Tsugeki R, Rikirsch E, Laux T, Okada K. 2012. Roles of the
middle domain-specific WUSCHEL-RELATED HOMEOBOX genes in early development of
leaves in Arabidopsis. Plant Cell 24, 519-535.
Leaf development: a cellular perspective
75
Nakata M, Okada K. 2012. The three-domain model: a new model for the early
development of leaves in Arabidopsis thaliana. Plant Signal Behav 7, 1423-1427.
Nakaya M, Tsukaya H, Murakami N, Kato M. 2002. Brassinosteroids control the
proliferation of leaf cells of Arabidopsis thaliana. Plant Cell Physiol 43, 239-244.
Naouar N, Vandepoele K, Lammens T, Casneuf T, Zeller G, van Hummelen P, Weigel D,
Ratsch G, Inze D, Kuiper M, De Veylder L, Vuylsteke M. 2009. Quantitative RNA
expression analysis with Affymetrix Tiling 1.0R arrays identifies new E2F target genes.
Plant J 57, 184-194.
Nath U, Crawford BC, Carpenter R, Coen E. 2003. Genetic control of surface curvature.
Science 299, 1404-1407.
Nelissen H, Rymen B, Coppens F, Dhondt S, Fiorani F, Beemster GT. 2013. Kinematic
analysis of cell division in leaves of mono- and dicotyledonous species: a basis for
understanding growth and developing refined molecular sampling strategies. Methods Mol
Biol 959, 247-264.
Nelissen H, Rymen B, Jikumaru Y, Demuynck K, Van Lijsebettens M, Kamiya Y, Inze D,
Beemster GT. 2012. A local maximum in gibberellin levels regulates maize leaf growth by
spatial control of cell division. Curr Biol 22, 1183-1187.
Nikolaev SV, Penenko AV, Lavrekha VV, Melsness ED, Kolchanov NA. 2007. A model
study of the role of proteins CLV1, CLV2, CLV3, and WUS in regulation of the structure of
the shoot apical meristem. Ontogenez 38, 457-462.
Nikovics K, Blein T, Peaucelle A, Ishida T, Morin H, Aida M, Laufs P. 2006. The balance
between the MIR164A and CUC2 genes controls leaf margin serration in Arabidopsis. Plant
Cell 18, 2929-2945.
Nogueira FT, Madi S, Chitwood DH, Juarez MT, Timmermans MC. 2007. Two small
regulatory RNAs establish opposing fates of a developmental axis. Genes Dev 21, 750-755.
Leaf development: a cellular perspective
76
Noir S, Bomer M, Takahashi N, Ishida T, Tsui TL, Balbi V, Shanahan H, Sugimoto K,
Devoto A. 2013. Jasmonate controls leaf growth by repressing cell proliferation and the
onset of endoreduplication while maintaining a potential stand-by mode. Plant Physiol 161,
1930-1951.
Novak B, Tyson JJ. 1993. Numerical analysis of a comprehensive model of M-phase control
in Xenopus oocyte extracts and intact embryos. J Cell Sci 106, 1153-1168.
Ohashi-Ito K, Bergmann DC. 2006. Arabidopsis FAMA controls the final
proliferation/differentiation switch during stomatal development. Plant Cell 18, 2493-
2505.
Ohashi-Ito K, Fukuda H. 2003. HD-Zip III homeobox genes that include a novel member,
ZeHB-13 (Zinnia)/ATHB-15 (Arabidopsis), are involved in procambium and xylem cell
differentiation. Plant Cell Physiol 44, 1350-1358.
Oppenheimer DG, Herman PL, Sivakumaran S, Esch J, Marks. MD. 1991. A myb gene
required for leaf trichome differentiation in Arabidopsis is expressed in stipules. Cell 67,
483-493.
Ori N, Cohen AR, Etzioni A, Brand A, Yanai O, Shleizer S, Menda N, Amsellem Z, Efroni
I, Pekker I, Alvarez JP, Blum E, Zamir D, Eshed Y. 2007. Regulation of LANCEOLATE by
miR319 is required for compound-leaf development in tomato. Nat Genet 39, 787-791.
Palatnik JF, Allen E, Wu X, Schommer C, Schwab R, Carrington JC, Weigel D. 2003.
Control of leaf morphogenesis by microRNAs. Nature 425, 257-263.
Paredez AR, Somerville CR, Ehrhardt DW. 2006. Visualization of cellulose synthase
demonstrates functional association with microtubules. Science 312, 1491-1495.
Pauwels L, Morreel K, De Witte E, Lammertyn F, Van Montagu M, Boerjan W, Inze D,
Goossens A. 2008. Mapping methyl jasmonate-mediated transcriptional reprogramming of
metabolism and cell cycle progression in cultured Arabidopsis cells. Proc Natl Acad Sci U S A
105, 1380-1385.
Leaf development: a cellular perspective
77
Perazza D, Herzog M, Hulskamp M, Brown S, Dorne AM, Bonneville JM. 1999. Trichome
cell growth in Arabidopsis thaliana can be derepressed by mutations in at least five genes.
Genetics 152, 461-476.
Perrot-Rechenmann C. 2010. Cellular responses to auxin: division versus expansion. Cold
Spring Harb Perspect Biol 2, a001446.
Pesch M, Hulskamp M. 2009. One, two, three...models for trichome patterning in
Arabidopsis? Curr Opin Plant Biol 12, 587-592.
Pesch M, Hulskamp M. 2011. Role of TRIPTYCHON in trichome patterning in Arabidopsis.
BMC Plant Biol 11, 130.
Peterson KM, Rychel AL, Torii KU. 2010. Out of the mouths of plants: the molecular basis
of the evolution and diversity of stomatal development. Plant Cell 22, 296-306.
Pillitteri LJ, Sloan DB, Bogenschutz NL, Torii KU. 2007. Termination of asymmetric cell
division and differentiation of stomata. Nature 445, 501-505.
Porceddu A, Stals H, Reichheld J, Segers G, De Veylder L, Barroco R, Casteels P, Van
Montagu M, Inzé D, Mironov V. 2001. A Plant-specific Cyclin-dependent Kinase Is
Involved in the Control of G2/M Progression in Plants. J Biol Chem 276, 36354-36360.
Prigge MJ, Otsuga D, Alonso JM, Ecker JR, Drews GN, Clark SE. 2005. Class III
homeodomain-leucine zipper gene family members have overlapping, antagonistic, and
distinct roles in Arabidopsis development. Plant Cell 17, 61-76.
Ramirez-Parra E, Frundt C, Gutierrez C. 2003. A genome-wide identification of E2F-
regulated genes in Arabidopsis. Plant J 33, 801-811.
Reinhardt D, Pesce ER, Stieger P, Mandel T, Baltensperger K, Bennett M, Traas J,
Friml J, Kuhlemeier C. 2003. Regulation of phyllotaxis by polar auxin transport. Nature
426, 255-260.
Leaf development: a cellular perspective
78
Ren H, Santner A, del Pozo J, Murray J, Estelle M. 2008. Degradation of the cyclin-
dependent kinase inhibitor KRP1 is regulated by two different ubiquitin E3 ligases. Plant J
53, 705-716.
Ren M, Qiu S, Venglat P, Xiang D, Feng L, Selvaraj G, Datla R. 2011. Target of rapamycin
regulates development and ribosomal RNA expression through kinase domain in
Arabidopsis. Plant Physiol 155, 1367-1382.
Riou-Khamlichi C, Huntley R, Jacqmard A, Murray JAH. 1999. Cytokinin activation of
Arabidopsis cell division through a D-type cyclin. Science 283, 1541-1543.
Robinson S, de Reuille PB, Chan J, Bergmann D, Prusinkiewicz P, Coen E. 2011.
Generation of spatial patterns through cell polarity switching. Science 333, 1436-1440.
Rodriguez RE, Mecchia MA, Debernardi JM, Schommer C, Weigel D, Palatnik JF. 2010.
Control of cell proliferation in Arabidopsis thaliana by microRNA miR396. Development
137, 103-112.
Roeder AH, Chickarmane V, Cunha A, Obara B, Manjunath BS, Meyerowitz EM. 2010.
Variability in the control of cell division underlies sepal epidermal patterning in
Arabidopsis thaliana. PLoS Biol 8, e1000367.
Roodbarkelari F, Bramsiepe J, Weinl C, Marquardt S, Novak B, Jakoby MJ, Lechner E,
Genschik P, Schnittger A. 2010. Cullin 4-ring finger-ligase plays a key role in the control of
endoreplication cycles in Arabidopsis trichomes. Proc Natl Acad Sci U S A 107, 15275-
15280.
Rose JK, Braam J, Fry SC, Nishitani K. 2002. The XTH family of enzymes involved in
xyloglucan endotransglucosylation and endohydrolysis: current perspectives and a new
unifying nomenclature. Plant Cell Physiol 43, 1421-1435.
Rubio-Dı´az S, Pe´rez-Pe´rez JM, Gonza´lez-Bayo´n R, Mun˜oz-Viana R, Borrega N,
Mouille G, Herna´ndez-Romero D, Robles P, Ho¨fte H, Ponce MaR, Micol JL. 2012. Cell
Leaf development: a cellular perspective
79
expansion-mediated organ growth is affected by mutations in three EXIGUA genes. PLoS
ONE 7, 1-13.
Sablowski R. 2007. The dynamic plant stem cell niches. Curr Opin Plant Biol 10, 639-644.
Sablowski R, Dornelas M. 2013. Interplay between cell growth and cell cycle in plants. J
Exp Bot 65(10), 2703-14.
Sakamoto T, Kamiya N, Ueguchi-Tanaka M, Iwahori S, Matsuoka M. 2001. KNOX
homeodomain protein directly suppresses the expression of a gibberellin biosynthetic gene
in the tobacco shoot apical meristem. Genes Dev 15, 581-590.
Satina S, Blakeslee A, Avery A. 1940. Demonstration of the three germ layers in the shoot
apex of Datura by means of induced polyploidy in periclinal chimeras. Am J Bot 27, 895–
905.
Scarpella E, Francis P, Berleth T. 2004. Stage-specific markers define early steps of
procambium development in Arabidopsis leaves and correlate termination of vein
formation with mesophyll differentiation. Development 131, 3445-3455.
Scarpella E, Marcos D, Friml J, Berleth T. 2006. Control of leaf vascular patterning by
polar auxin transport. Genes Dev 20, 1015-1027.
Schnittger A, Folkers U, Schwab B, Jurgens G, Hulskamp M. 1999. Generation of a
spacing pattern: the role of triptychon in trichome patterning in Arabidopsis. Plant Cell 11,
1105-1116.
Schnittger A, Hulskamp M. 2002. Trichome morphogenesis: a cell-cycle perspective.
Philos Trans R Soc Lond B Biol Sci 357, 823-826.
Schnittger A, Weinl C, Bouyer D, Schobinger U, Hulskamp M. 2003. Misexpression of the
cyclin-dependent kinase inhibitor ICK1/KRP1 in single-celled Arabidopsis trichomes
reduces endoreduplication and cell size and induces cell death. Plant Cell 15, 303-315.
Leaf development: a cellular perspective
80
Schommer C, Palatnik JF, Aggarwal P, Chetelat A, Cubas P, Farmer EE, Nath U, Weigel
D. 2008. Control of jasmonate biosynthesis and senescence by miR319 targets. PLoS Biol 6,
e230.
Schoof H, Lenhard M, Haecker A, Mayer KFX, Jürgens G, Laux T. 2000. The stem cell
population of Arabidopsis shoot meristems is maintained by a regulatory loop between the
CLAVATA and WUSCHEL genes. Cell 100, 635–644.
Scofield S, Murray JA. 2006. KNOX gene function in plant stem cell niches. Plant Mol Biol
60, 929-946.
Shani E, Weinstain R, Zhang Y, Castillejo C, Kaiserli E, Chory J, Tsien RY, Estelle M.
2013. Gibberellins accumulate in the elongating endodermal cells of Arabidopsis root. Proc
Natl Acad Sci U S A 110, 4834-4839.
Shpak ED, McAbee JM, Pillitteri LJ, Torii KU. 2005. Stomatal patterning and
differentiation by synergistic interactions of receptor kinases. Science 309, 290-293.
Siegfried KR, Eshed Y, Baum SF, Otsuga D, Drews GN, Bowman JL. 1999. Members of the
YABBY gene family specify abaxial cell fate in Arabidopsis. Development 126, 4117-4128.
Sormani R, Yao L, Menand B, Ennar N, Lecampion C, Meyer C, Robaglia C. 2007.
Saccharomyces cerevisiae FKBP12 binds Arabidopsis thaliana TOR and its expression in
plants leads to rapamycin susceptibility. BMC Plant Biol 7, 26.
Sozzani R, Maggio C, Varotto S, Canova S, Bergounioux C, Albani D, Cella R. 2006.
Interplay between Arabidopsis activating factors E2Fb and E2Fa in cell cycle progression
and development. Plant Physiol 140, 1355-1366.
Steven E. Clark MPRaEMM. 1993. CLAVATA1, a regulator of meristem and flower
development in Arabidopsis. Development 119, 397-418.
Leaf development: a cellular perspective
81
Steven E. Clark MPRaEMM. 1995. CLAVATA3 is a specific regulator of shoot and floral
meristem development affecting the same processes as CLAVATA1 Development 121,
2057-2067.
Stransfeld L, Eriksson S, Adamski NM, Breuninger H, Lenhard M. 2010.
KLUH/CYP78A5 promotes organ growth without affecting the size of the early
primordium. Plant Signal Behav 5, 982-984.
Su YH, Liu YB, Zhang XS. 2011. Auxin-cytokinin interaction regulates meristem
development. Mol Plant 4, 616-625.
Sugano SS, Shimada T, Imai Y, Okawa K, Tamai A, Mori M, Hara-Nishimura I. 2010.
Stomagen positively regulates stomatal density in Arabidopsis. Nature 463, 241-244.
Sugimoto-Shirasu K, Roberts K. 2003. ‘‘Big it up’’: endoreduplication and cell-size control
in plants. Curr Opin Plant Biol 6, 544–553.
Sullivan M, Morgan DO. 2007. Finishing mitosis, one step at a time. Nature Rev Mol Cell
Biol 8, 894-903.
Sussex IM. 1951. Experiments on the cause of dorsiventrality in leaves. Nature 167, 651-
652.
Swain SM, Tseng TS, Thornton TM, Gopalraj M, Olszewski NE. 2002. SPINDLY is a
nuclear-localized repressor of gibberellin signal transduction expressed throughout the
plant. Plant Physiol 129, 605-615.
Swiatek A, Azmi A, Stals H, Inze D, Van Onckelen H. 2004. Jasmonic acid prevents the
accumulation of cyclin B1;1 and CDK-B in synchronized tobacco BY-2 cells. FEBS Lett 572,
118-122.
Takahashi N, Kajihara T, Okamura C, Kim Y, Katagiri Y, Okushima Y, Matsunaga S,
Hwang I, Umeda M. 2013. Cytokinins control endocycle onset by promoting the expression
of an APC/C activator in Arabidopsis roots. Curr Biol 23, 1812-1817.
Leaf development: a cellular perspective
82
Takatsuka H, Ohno R, Umeda M. 2009. The Arabidopsis cyclin-dependent kinase-
activating kinase CDKF;1 is a major regulator of cell proliferation and cell expansion but is
dispensable for CDKA activation. Plant J 59, 475-487.
Tarayre S, Vinardell JM, Cebolla A, Kondorosi A, Kondorosi E. 2004. Two classes of the
Cdh1-type activators of the anaphase-promoting complex in plants: Novel functional
domains and distinct regulation. Plant Cell 16, 422-434.
Tominaga R, Iwata M, Sano R, Inoue K, Okada K, Wada T. 2008. Arabidopsis CAPRICE-
LIKE MYB 3 (CPL3) controls endoreduplication and flowering development in addition to
trichome and root hair formation. Development 135, 1335-1345.
Traw MB, Bergelson J. 2003. Interactive effects of jasmonic acid, salicylic acid, and
gibberellin on induction of trichomes in Arabidopsis. Plant Physiol 133, 1367-1375.
Tsukaya H. 2002. Interpretation of mutants in leaf morphology: genetic evidence for a
compensatory system in leaf morphogenesis that provides a new link between cell and
organismal theories. Int Rev Cytol 217, 1-39.
Tsukaya H. 2013a. Does ploidy level directly control cell size? Counterevidence from
Arabidopsis genetics. PLoS ONE 8(12), e83729.
Tsukaya H. 2013b. Leaf development. Arabidopsis Book 11, e0163.
Umeda M, Shimotohno A, Yamaguchi M. 2005. Control of cell division and transcription
by cyclin-dependent kinase-activating kinases in plants. Plant Cell Physiol 46, 1437-1442.
Uyttewaal M, Burian A, Alim K, Landrein B, Borowska-Wykret D, Dedieu A, Peaucelle
A, Ludynia M, Traas J, Boudaoud A, Kwiatkowska D, Hamant O. 2012. Mechanical stress
acts via katanin to amplify differences in growth rate between adjacent cells in Arabidopsis.
Cell 149, 439-451.
Van Leene J, Boruc J, De Jaeger G, Russinova E, De Veylder L. 2011. A kaleidoscopic view
of the Arabidopsis core cell cycle interactome. Trends Plant Sci 16, 141-150.
Leaf development: a cellular perspective
83
Van Leene J, Hollunder J, Eeckhout D, Persiau G, Van De Slijke E, Stals H, Van Isterdael
G, Verkest A, Neirynck S, Buffel Y, De Bodt S, Maere S, Laukens K, Pharazyn A,
Ferreira PC, Eloy N, Renne C, Meyer C, Faure JD, Steinbrenner J, Beynon J, Larkin JC,
Van de Peer Y, Hilson P, Kuiper M, De Veylder L, Van Onckelen H, Inze D, Witters E, De
Jaeger G. 2010. Targeted interactomics reveals a complex core cell cycle machinery in
Arabidopsis thaliana. Mol Syst Biol 6, 397.
Vandepoele K, Vlieghe K, Florquin K, Hennig L, Beemster GTS, Gruissem W, Van De
Peer Y, Inze D, De Veylder L. 2005. Genome-wide identification of potential plant E2F
target genes. Plant Physiol 139, 316-328.
Vanneste S, Coppens F, Lee E, Donner TJ, Xie Z, Van Isterdael G, Dhondt S, De Winter
F, De Rybel B, Vuylsteke M. 2011. Developmental regulation of CYCA2s contributes to
tissue‐specific proliferation in Arabidopsis. EMBO J 30, 3430-3441.
Vaten A, Bergmann DC. 2012. Mechanisms of stomatal development: an evolutionary
view. Evodevo 3, 11.
Veit B. 2004. Determination of cell fate in apical meristems. Curr Opin Plant Biol 7, 57-64.
Veit B. 2009. Hormone mediated regulation of the shoot apical meristem. Plant Mol Biol 69,
397-408.
Verkest A, Manes CLD, Vercruysse S, Maes S, Van der Schueren E, Beeckman T,
Genschik P, Kuiper M, Inze D, De Veylder L. 2005a. The cyclin-dependent kinase
inhibitor KRP2 controls the onset of the endoreduplication cycle during Arabidopsis leaf
development through inhibition of mitotic CDKA;1 kinase complexes. Plant Cell 17, 1723-
1736.
Verkest A, Weinl C, Inze D, De Veylder L, Schnittger A. 2005b. Switching the cell cycle.
Kip-related proteins in plant cell cycle control. Plant Physiol 139, 1099-1106.
Leaf development: a cellular perspective
84
Vernoux T, Brunoud G, Farcot E, Morin V, Van den Daele H, Legrand J, Oliva M, Das P,
Larrieu A, Wells D, Guedon Y, Armitage L, Picard F, Guyomarc'h S, Cellier C, Parry G,
Koumproglou R, Doonan JH, Estelle M, Godin C, Kepinski S, Bennett M, De Veylder L,
Traas J. 2011. The auxin signalling network translates dynamic input into robust
patterning at the shoot apex. Mol Syst Biol 7, 508.
Vlad D, Kierzkowski D, Rast MI, Vuolo F, Ioio RD, Galinha C, Gan X, Hajheidari M, Hay
A, Smith RS, Huijser P, Bailey CD, Tsiantis M. 2014. Leaf shape evolution through
duplication, regulatory diversification, and loss of a homeobox gene. Science 343, 780-783.
Vlieghe K, Boudolf V, Beemster GT, Maes S, Magyar Z, Atanassova A, de Almeida
Engler J, De Groodt R, Inze D, De Veylder L. 2005. The DP-E2F-like gene DEL1 controls
the endocycle in Arabidopsis thaliana. Curr Biol 15, 59-63.
Waites R, Hudson A. 1995. Phantastica: a gene required for dorsoventrality of leaves in
Antirrhinum Majus. Development 121, 2143-2154.
Walker JD, Oppenheimer DG, Concienne J, Larkin JC. 2000. SIAMESE, a gene controlling
the endoreduplication cell cycle in Arabidopsis thaliana trichomes. Development 127, 3931-
3940.
Wang H, Qi Q, Schorr P, Cutler A, Crosby W, Fowke L. 1998. ICK1, a cyclin dependent
protein kinase inhibitor from Arabidopsis thaliana interacts with both Cdc2a and CycD3,
and its expression is induced by abscisic acid. Plant J 15, 501-510.
Wang L, Gu X, Xu D, Wang W, Wang H, Zeng M, Chang Z, Huang H, Cui X. 2011. miR396-
targeted AtGRF transcription factors are required for coordination of cell division and
differentiation during leaf development in Arabidopsis. J Exp Bot 62, 761-773.
Wang L, Ruan YL. 2013. Regulation of cell division and expansion by sugar and auxin
signaling. Front Plant Sci 4, 163.

Leaf development: a cellular perspective
85
Wang S, Kwak SH, Zeng Q, Ellis BE, Chen XY, Schiefelbein J, Chen JG. 2007.
TRICHOMELESS1 regulates trichome patterning by suppressing GLABRA1 in Arabidopsis.
Development 134, 3873-3882.
Wells DM, Laplaze L, Bennett MJ, Vernoux T. 2013. Biosensors for phytohormone
quantification: challenges, solutions, and opportunities. Trends Plant Sci 18, 244-249.
Werner T, Motyka V, Laucou V, Smets R, Van Onckelen H, Schmulling T. 2003.
Cytokinin-deficient transgenic Arabidopsis plants show multiple developmental alterations
indicating opposite functions of cytokinins in the regulation of shoot and root meristem
activity. Plant Cell 15, 2532-2550.
White DW. 2006. PEAPOD regulates lamina size and curvature in Arabidopsis. Proc Natl
Acad Sci U S A 103, 13238-13243.
Wolf S, Hematy K, Hofte H. 2012. Growth control and cell wall signaling in plants. Annu
Rev Plant Biol 63, 381-407.
Xie Z, Lee E, Lucas JR, Morohashi K, Li D, Murray JA, Sack FD, Grotewold E. 2010.
Regulation of cell proliferation in the stomatal lineage by the Arabidopsis MYB FOUR LIPS
via direct targeting of core cell cycle genes. Plant Cell 22, 2306-2321.
Xiong Y, McCormack M, Li L, Hall Q, Xiang C, Sheen J. 2013. Glucose-TOR signalling
reprograms the transcriptome and activates meristems. Nature 496, 181-186.
Xiong Y, Sheen J. 2012. Rapamycin and glucose-target of rapamycin (TOR) protein
signaling in plants. J Biol Chem 287, 2836-2842.
Xu R, Li Y. 2011. Control of final organ size by Mediator complex subunit 25 in Arabidopsis
thaliana. Development 138, 4545-4554.
Yadav RK, Perales M, Gruel J, Girke T, Jonsson H, Reddy GV. 2011. WUSCHEL protein
movement mediates stem cell homeostasis in the Arabidopsis shoot apex. Genes Dev 25,
2025-2030.
Leaf development: a cellular perspective
86
Yadav RK, Perales M, Gruel J, Ohno C, Heisler M, Girke T, Jonsson H, Reddy GV. 2013.
Plant stem cell maintenance involves direct transcriptional repression of differentiation
program. Mol Syst Biol 9, 654.
Yadav RK, Reddy GV. 2011. WUSCHEL-mediated cellular feedback network imparts
robustness to stem cell homeostasis. Plant Signal Behav 6, 544-546.
Yanai O, Shani E, Dolezal K, Tarkowski P, Sablowski R, Sandberg G, Samach A, Ori N.
2005. Arabidopsis KNOXI proteins activate cytokinin biosynthesis. Curr Biol 15, 1566-1571.
Yang CX, Ye ZB. 2013. Trichomes as models for studying plant cell differentiation. Cell Mol
Life Sci 70, 1937-1948.
Yokoyama R, Nishitani K. 2001. A comprehensive expression analysis of all members of a
gene family encoding cell-wall enzymes allowed us to predict cis-regulatory regions
involved in cell-wall construction in specific organs of Arabidopsis. Plant Cell Physiol 42,
1025-1033.
Yoshizumi T, Tsumoto Y, Takiguchi T, Nagata N, Yamamoto YY, Kawashima M,
Ichikawa T, Nakazawa M, Yamamoto N, Matsui M. 2006. Increased level of polyploidy1, a
conserved repressor of CYCLINA2 transcription, controls endoreduplication in Arabidopsis.
Plant Cell 18, 2452-2468.
Zhang F, Gonzalez A, Zhao M, Payne CT, Lloyd A. 2003. A network of redundant bHLH
proteins functions in all TTG1-dependent pathways of Arabidopsis. Development 130, 4859-
4869.
Zhang Y, Persson S, Giavalisco P. 2013. Differential Regulation of Carbon Partitioning by
the Central Growth Regulator Target of Rapamycin (TOR). Mol Plant 6, 1731-1733.
Zhao M, Morohashi K, Hatlestad G, Grotewold E, Lloyd A. 2008. The TTG1-bHLH-MYB
complex controls trichome cell fate and patterning through direct targeting of regulatory
loci. Development 135, 1991-1999.
Leaf development: a cellular perspective
87
Zhao X, Harashima H, Dissmeyer N, Pusch S, Weimer AK, Bramsiepe J, Bouyer D,
Rademacher S, Nowack MK, Novak B, Sprunck S, Schnittger A. 2012. A general G1/S-
phase cell-cycle control module in the flowering plant Arabidopsis thaliana. Plos Genet 8,
e1002847.
Zhao Y, Christensen SK, Fankhauser C, Cashman JR, Cohen JD, Weigel D, Chory J. 2001.
A role for flavin monooxygenase-like enzymes in auxin biosynthesis. Science 291, 306-309.
Zhiponova MK, Vanhoutte I, Boudolf V, Betti C, Dhondt S, Coppens F, Mylle E, Maes S,
Gonzalez-Garcia MP, Cano-Delgado AI, Inze D, Beemster GT, De Veylder L, Russinova
E. 2013. Brassinosteroid production and signaling differentially control cell division and
expansion in the leaf. New Phytol 197, 490-502.

Chapter 2
Three-dimensional patterns of cell division and
expansion throughout the development of
Arabidopsis thaliana leaves
Shweta Kalve1, Joanna Fotschki2, Tom Beeckman3,4, Kris
Vissenberg1 and Gerrit T.S. Beemster1*
1Department of Biology, University of Antwerp, Belgium
2Department of Food Sciences, IAR & FR, Polish Academy of Sciences, Olsztyn,
Poland
3Department of Plant Systems Biology, VIB, Gent, Belgium
4Department of Plant Biotechnology and Bioinformatics, Ghent University,
Gent, Belgium
*Corresponding Author
This chapter is published as a research paper in Journal of Experimental
Botany, 2014 (doi:10.1093/jxb/eru358)
Contribution of S.K.- Performed most experiments, supervised J.F. and wrote the
manuscript

Three-dimensional leaf growth analysis
91
Abstract
Variations in size and shape of multicellular organs depend on the spatio-temporal
regulation of cell division and expansion. Here, cell division and expansion rates were
quantified relative to the three spatial axes in the first leaf pair of Arabidopsis thaliana. The
results show striking differences in expansion rates: the expansion rate in the petiole is
higher than the leaf blade; expansion rates in the lateral direction are higher than
longitudinal rates between 5 and 10 days after stratification, but become equal at later
stages of leaf blade development; and anticlinal expansion co-occurs with, but is an order of
magnitude slower than periclinal expansion. Anticlinal expansion rates also differed greatly
between tissues: the highest rates occurred in the spongy mesophyll and the lowest in the
epidermis. Cell division rates were higher and continued for longer in the epidermis
compared with the palisade mesophyll causing a larger increase of palisade than epidermal
cell area over the course of leaf development. The cellular dynamics underlying the effect of
shading on petiole length and leaf thickness were then investigated. Low light reduced leaf
expansion rates, which was partly compensated by increased duration of the growth phase.
Inversely, shading enhanced expansion rates in the petiole, so that the blade to petiole ratio
was reduced by 50%. Low light reduced leaf thickness by inhibiting anticlinal cell
expansion rates. This effect on cell expansion was preceded by an effect on cell division,
leading to one less layer of palisade cells. The two effects could be uncoupled by shifting
plants to contrasting light conditions immediately after germination. This extended
kinematic analysis maps the spatial and temporal heterogeneity of cell division and
expansion, providing a framework for further research to understand the molecular
regulatory mechanisms involved.
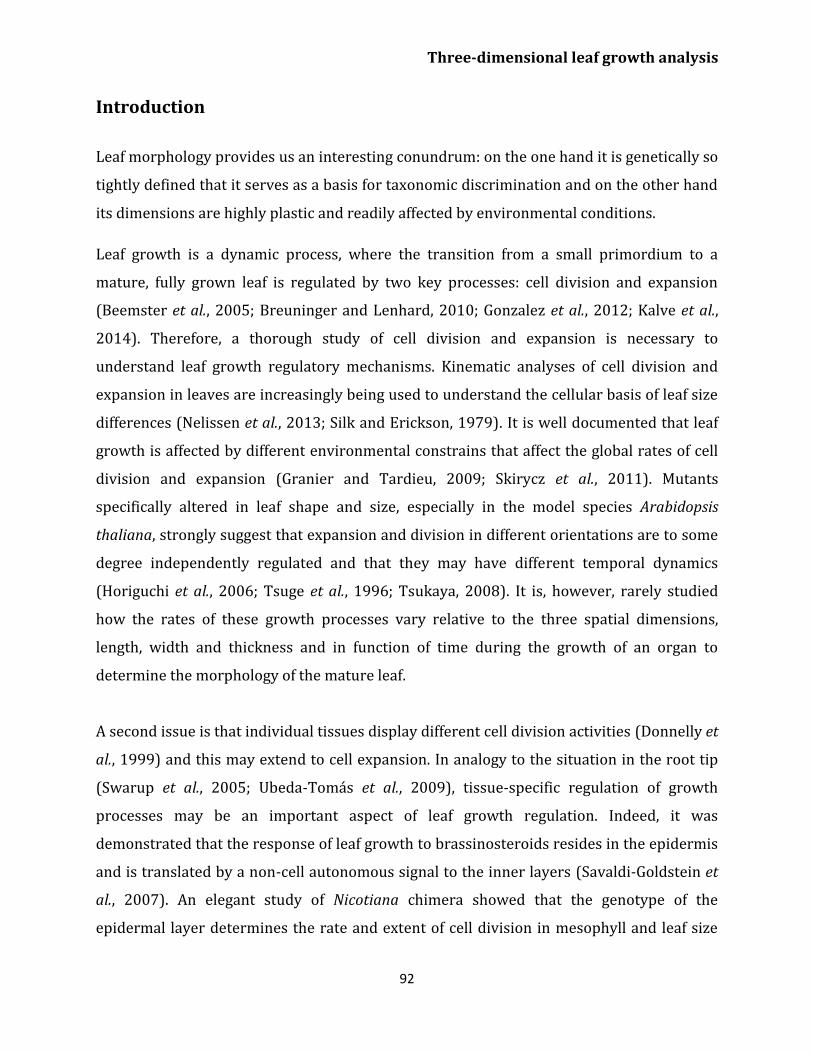
Three-dimensional leaf growth analysis
92
Introduction
Leaf morphology provides us an interesting conundrum: on the one hand it is genetically so
tightly defined that it serves as a basis for taxonomic discrimination and on the other hand
its dimensions are highly plastic and readily affected by environmental conditions.
Leaf growth is a dynamic process, where the transition from a small primordium to a
mature, fully grown leaf is regulated by two key processes: cell division and expansion
(Beemster et al., 2005; Breuninger and Lenhard, 2010; Gonzalez et al., 2012; Kalve et al.,
2014). Therefore, a thorough study of cell division and expansion is necessary to
understand leaf growth regulatory mechanisms. Kinematic analyses of cell division and
expansion in leaves are increasingly being used to understand the cellular basis of leaf size
differences (Nelissen et al., 2013; Silk and Erickson, 1979). It is well documented that leaf
growth is affected by different environmental constrains that affect the global rates of cell
division and expansion (Granier and Tardieu, 2009; Skirycz et al., 2011). Mutants
specifically altered in leaf shape and size, especially in the model species Arabidopsis
thaliana, strongly suggest that expansion and division in different orientations are to some
degree independently regulated and that they may have different temporal dynamics
(Horiguchi et al., 2006; Tsuge et al., 1996; Tsukaya, 2008). It is, however, rarely studied
how the rates of these growth processes vary relative to the three spatial dimensions,
length, width and thickness and in function of time during the growth of an organ to
determine the morphology of the mature leaf.
A second issue is that individual tissues display different cell division activities (Donnelly et
al., 1999) and this may extend to cell expansion. In analogy to the situation in the root tip
(Swarup et al., 2005; Ubeda-Tomás et al., 2009), tissue-specific regulation of growth
processes may be an important aspect of leaf growth regulation. Indeed, it was
demonstrated that the response of leaf growth to brassinosteroids resides in the epidermis
and is translated by a non-cell autonomous signal to the inner layers (Savaldi-Goldstein et
al., 2007). An elegant study of Nicotiana chimera showed that the genotype of the
epidermal layer determines the rate and extent of cell division in mesophyll and leaf size
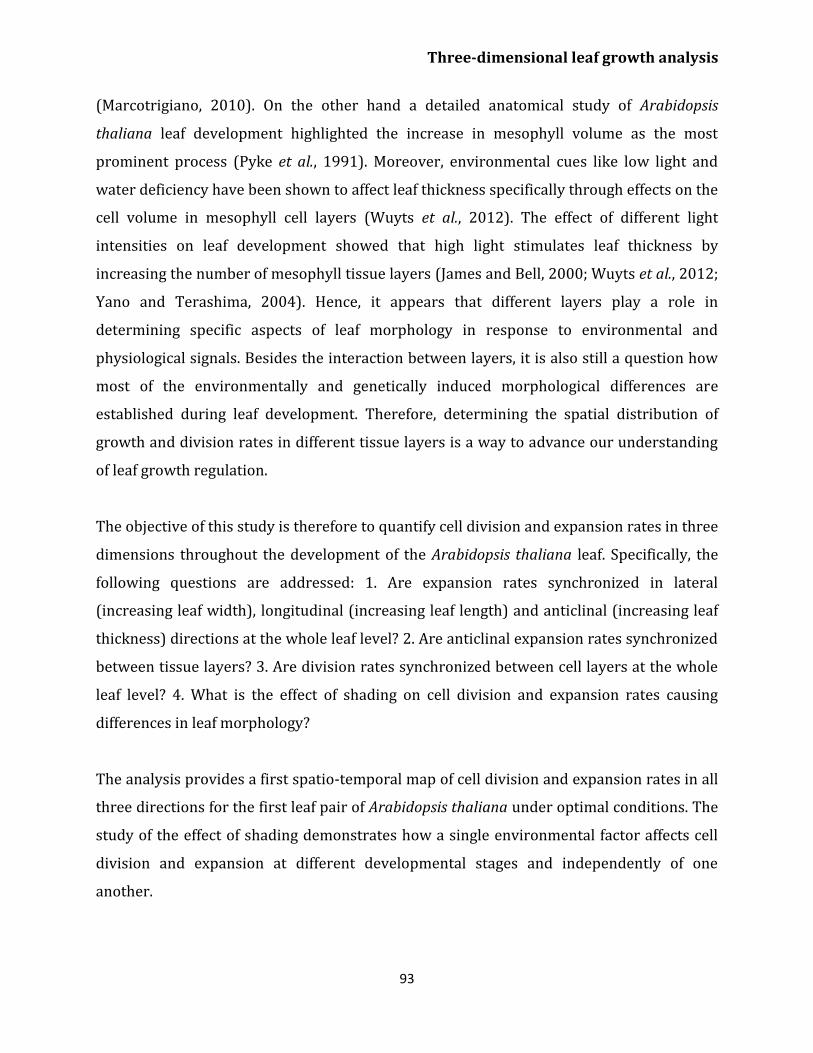
Three-dimensional leaf growth analysis
93
(Marcotrigiano, 2010). On the other hand a detailed anatomical study of Arabidopsis
thaliana leaf development highlighted the increase in mesophyll volume as the most
prominent process (Pyke et al., 1991). Moreover, environmental cues like low light and
water deficiency have been shown to affect leaf thickness specifically through effects on the
cell volume in mesophyll cell layers (Wuyts et al., 2012). The effect of different light
intensities on leaf development showed that high light stimulates leaf thickness by
increasing the number of mesophyll tissue layers (James and Bell, 2000; Wuyts et al., 2012;
Yano and Terashima, 2004). Hence, it appears that different layers play a role in
determining specific aspects of leaf morphology in response to environmental and
physiological signals. Besides the interaction between layers, it is also still a question how
most of the environmentally and genetically induced morphological differences are
established during leaf development. Therefore, determining the spatial distribution of
growth and division rates in different tissue layers is a way to advance our understanding
of leaf growth regulation.
The objective of this study is therefore to quantify cell division and expansion rates in three
dimensions throughout the development of the Arabidopsis thaliana leaf. Specifically, the
following questions are addressed: 1. Are expansion rates synchronized in lateral
(increasing leaf width), longitudinal (increasing leaf length) and anticlinal (increasing leaf
thickness) directions at the whole leaf level? 2. Are anticlinal expansion rates synchronized
between tissue layers? 3. Are division rates synchronized between cell layers at the whole
leaf level? 4. What is the effect of shading on cell division and expansion rates causing
differences in leaf morphology?
The analysis provides a first spatio-temporal map of cell division and expansion rates in all
three directions for the first leaf pair of Arabidopsis thaliana under optimal conditions. The
study of the effect of shading demonstrates how a single environmental factor affects cell
division and expansion at different developmental stages and independently of one
another.
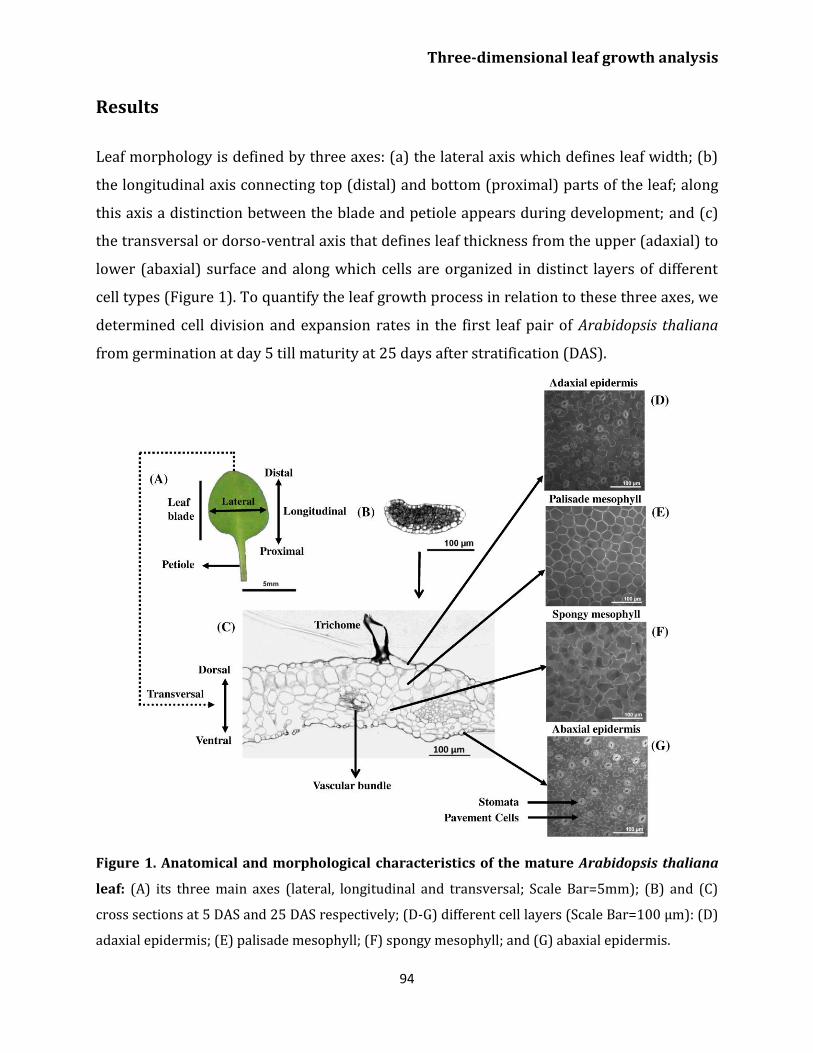
Three-dimensional leaf growth analysis
94
Results
Leaf morphology is defined by three axes: (a) the lateral axis which defines leaf width; (b)
the longitudinal axis connecting top (distal) and bottom (proximal) parts of the leaf; along
this axis a distinction between the blade and petiole appears during development; and (c)
the transversal or dorso-ventral axis that defines leaf thickness from the upper (adaxial) to
lower (abaxial) surface and along which cells are organized in distinct layers of different
cell types (Figure 1). To quantify the leaf growth process in relation to these three axes, we
determined cell division and expansion rates in the first leaf pair of Arabidopsis thaliana
from germination at day 5 till maturity at 25 days after stratification (DAS).
Figure 1. Anatomical and morphological characteristics of the mature Arabidopsis thaliana
leaf: (A) its three main axes (lateral, longitudinal and transversal; Scale Bar=5mm); (B) and (C)
cross sections at 5 DAS and 25 DAS respectively; (D-G) different cell layers (Scale Bar=100 µm): (D)
adaxial epidermis; (E) palisade mesophyll; (F) spongy mesophyll; and (G) abaxial epidermis.
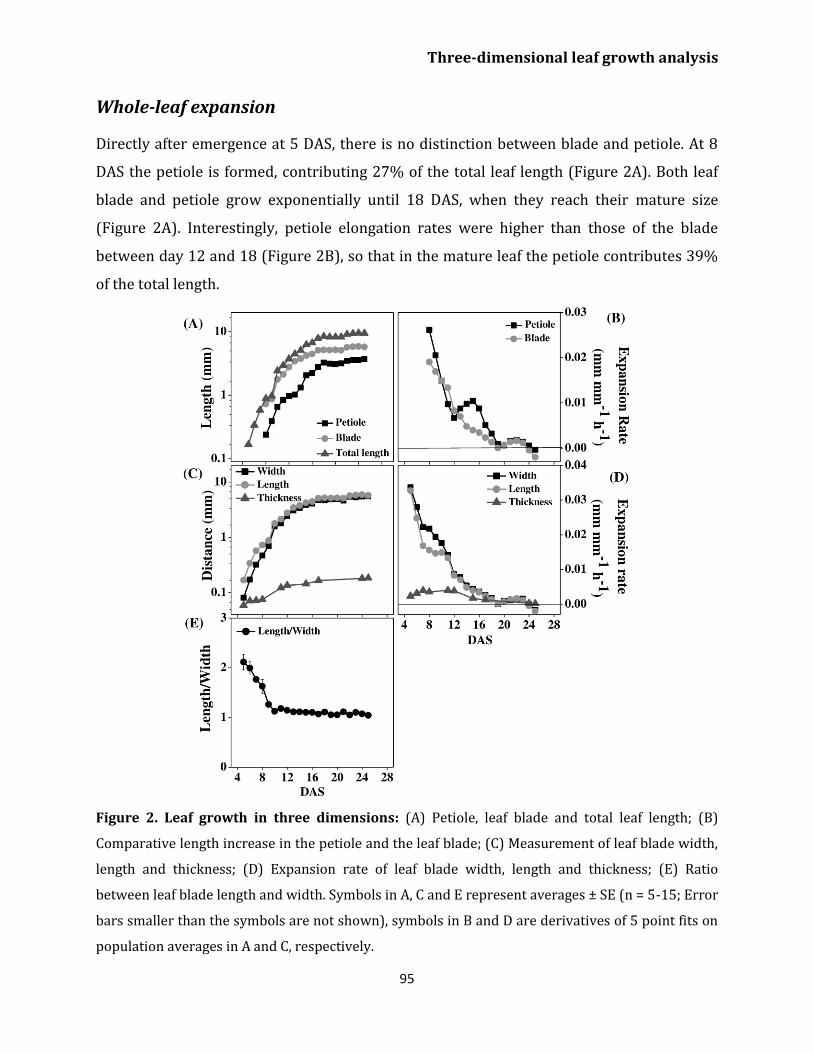
Three-dimensional leaf growth analysis
95
Whole-leaf expansion
Directly after emergence at 5 DAS, there is no distinction between blade and petiole. At 8
DAS the petiole is formed, contributing 27% of the total leaf length (Figure 2A). Both leaf
blade and petiole grow exponentially until 18 DAS, when they reach their mature size
(Figure 2A). Interestingly, petiole elongation rates were higher than those of the blade
between day 12 and 18 (Figure 2B), so that in the mature leaf the petiole contributes 39%
of the total length.
Figure 2. Leaf growth in three dimensions: (A) Petiole, leaf blade and total leaf length; (B)
Comparative length increase in the petiole and the leaf blade; (C) Measurement of leaf blade width,
length and thickness; (D) Expansion rate of leaf blade width, length and thickness; (E) Ratio
between leaf blade length and width. Symbols in A, C and E represent averages ± SE (n = 5-15; Error
bars smaller than the symbols are not shown), symbols in B and D are derivatives of 5 point fits on
population averages in A and C, respectively.
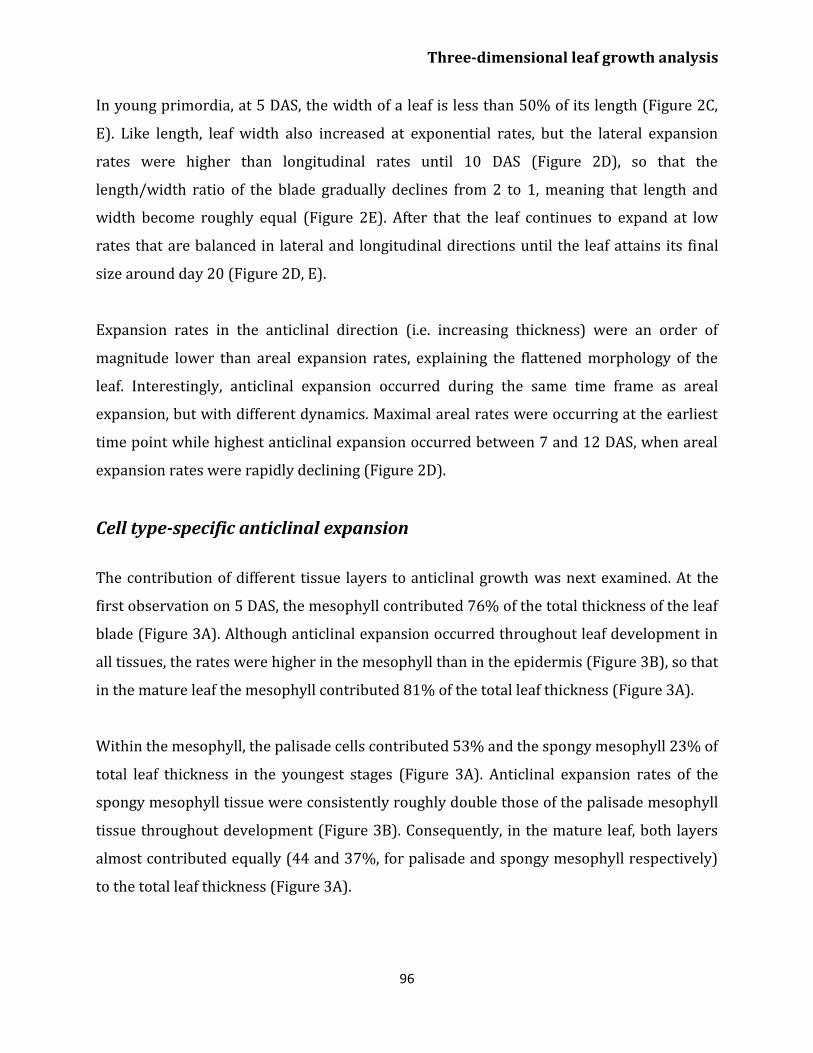
Three-dimensional leaf growth analysis
96
In young primordia, at 5 DAS, the width of a leaf is less than 50% of its length (Figure 2C,
E). Like length, leaf width also increased at exponential rates, but the lateral expansion
rates were higher than longitudinal rates until 10 DAS (Figure 2D), so that the
length/width ratio of the blade gradually declines from 2 to 1, meaning that length and
width become roughly equal (Figure 2E). After that the leaf continues to expand at low
rates that are balanced in lateral and longitudinal directions until the leaf attains its final
size around day 20 (Figure 2D, E).
Expansion rates in the anticlinal direction (i.e. increasing thickness) were an order of
magnitude lower than areal expansion rates, explaining the flattened morphology of the
leaf. Interestingly, anticlinal expansion occurred during the same time frame as areal
expansion, but with different dynamics. Maximal areal rates were occurring at the earliest
time point while highest anticlinal expansion occurred between 7 and 12 DAS, when areal
expansion rates were rapidly declining (Figure 2D).
Cell type-specific anticlinal expansion
The contribution of different tissue layers to anticlinal growth was next examined. At the
first observation on 5 DAS, the mesophyll contributed 76% of the total thickness of the leaf
blade (Figure 3A). Although anticlinal expansion occurred throughout leaf development in
all tissues, the rates were higher in the mesophyll than in the epidermis (Figure 3B), so that
in the mature leaf the mesophyll contributed 81% of the total leaf thickness (Figure 3A).
Within the mesophyll, the palisade cells contributed 53% and the spongy mesophyll 23% of
total leaf thickness in the youngest stages (Figure 3A). Anticlinal expansion rates of the
spongy mesophyll tissue were consistently roughly double those of the palisade mesophyll
tissue throughout development (Figure 3B). Consequently, in the mature leaf, both layers
almost contributed equally (44 and 37%, for palisade and spongy mesophyll respectively)
to the total leaf thickness (Figure 3A).
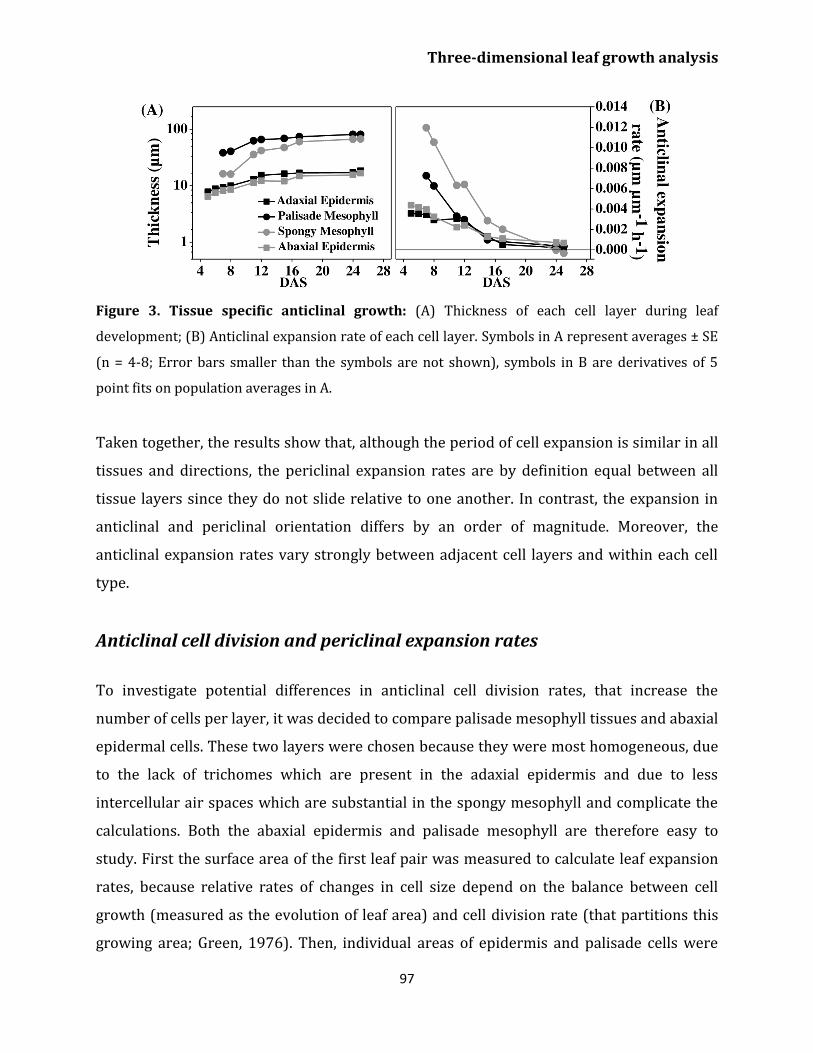
Three-dimensional leaf growth analysis
97
Figure 3. Tissue specific anticlinal growth: (A) Thickness of each cell layer during leaf
development; (B) Anticlinal expansion rate of each cell layer. Symbols in A represent averages ± SE
(n = 4-8; Error bars smaller than the symbols are not shown), symbols in B are derivatives of 5
point fits on population averages in A.
Taken together, the results show that, although the period of cell expansion is similar in all
tissues and directions, the periclinal expansion rates are by definition equal between all
tissue layers since they do not slide relative to one another. In contrast, the expansion in
anticlinal and periclinal orientation differs by an order of magnitude. Moreover, the
anticlinal expansion rates vary strongly between adjacent cell layers and within each cell
type.
Anticlinal cell division and periclinal expansion rates
To investigate potential differences in anticlinal cell division rates, that increase the
number of cells per layer, it was decided to compare palisade mesophyll tissues and abaxial
epidermal cells. These two layers were chosen because they were most homogeneous, due
to the lack of trichomes which are present in the adaxial epidermis and due to less
intercellular air spaces which are substantial in the spongy mesophyll and complicate the
calculations. Both the abaxial epidermis and palisade mesophyll are therefore easy to
study. First the surface area of the first leaf pair was measured to calculate leaf expansion
rates, because relative rates of changes in cell size depend on the balance between cell
growth (measured as the evolution of leaf area) and cell division rate (that partitions this
growing area; Green, 1976). Then, individual areas of epidermis and palisade cells were
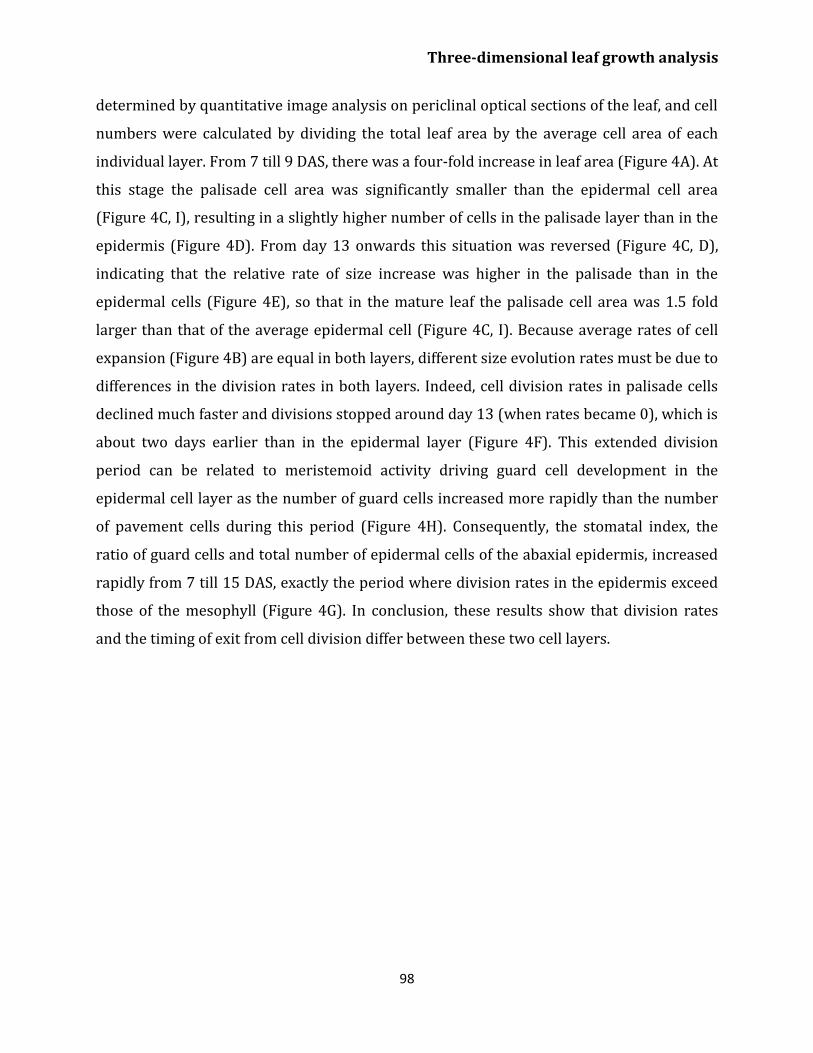
Three-dimensional leaf growth analysis
98
determined by quantitative image analysis on periclinal optical sections of the leaf, and cell
numbers were calculated by dividing the total leaf area by the average cell area of each
individual layer. From 7 till 9 DAS, there was a four-fold increase in leaf area (Figure 4A). At
this stage the palisade cell area was significantly smaller than the epidermal cell area
(Figure 4C, I), resulting in a slightly higher number of cells in the palisade layer than in the
epidermis (Figure 4D). From day 13 onwards this situation was reversed (Figure 4C, D),
indicating that the relative rate of size increase was higher in the palisade than in the
epidermal cells (Figure 4E), so that in the mature leaf the palisade cell area was 1.5 fold
larger than that of the average epidermal cell (Figure 4C, I). Because average rates of cell
expansion (Figure 4B) are equal in both layers, different size evolution rates must be due to
differences in the division rates in both layers. Indeed, cell division rates in palisade cells
declined much faster and divisions stopped around day 13 (when rates became 0), which is
about two days earlier than in the epidermal layer (Figure 4F). This extended division
period can be related to meristemoid activity driving guard cell development in the
epidermal cell layer as the number of guard cells increased more rapidly than the number
of pavement cells during this period (Figure 4H). Consequently, the stomatal index, the
ratio of guard cells and total number of epidermal cells of the abaxial epidermis, increased
rapidly from 7 till 15 DAS, exactly the period where division rates in the epidermis exceed
those of the mesophyll (Figure 4G). In conclusion, these results show that division rates
and the timing of exit from cell division differ between these two cell layers.
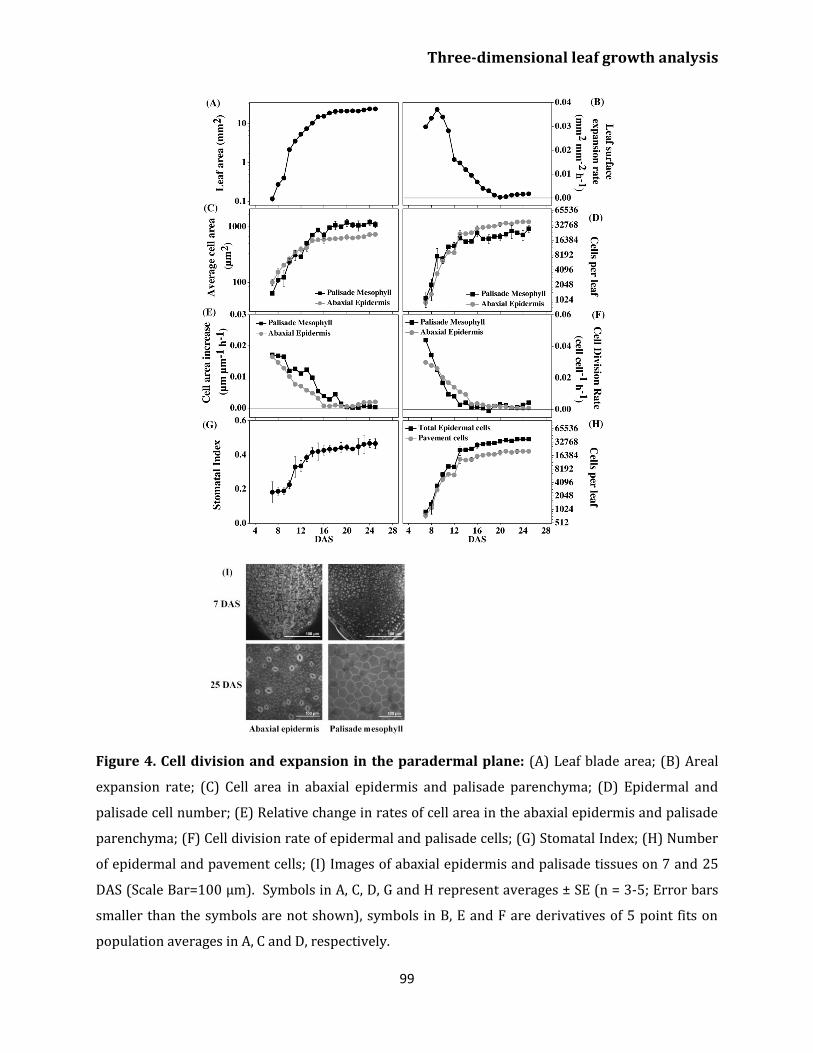
Three-dimensional leaf growth analysis
99
Figure 4. Cell division and expansion in the paradermal plane: (A) Leaf blade area; (B) Areal
expansion rate; (C) Cell area in abaxial epidermis and palisade parenchyma; (D) Epidermal and
palisade cell number; (E) Relative change in rates of cell area in the abaxial epidermis and palisade
parenchyma; (F) Cell division rate of epidermal and palisade cells; (G) Stomatal Index; (H) Number
of epidermal and pavement cells; (I) Images of abaxial epidermis and palisade tissues on 7 and 25
DAS (Scale Bar=100 µm). Symbols in A, C, D, G and H represent averages ± SE (n = 3-5; Error bars
smaller than the symbols are not shown), symbols in B, E and F are derivatives of 5 point fits on
population averages in A, C and D, respectively.
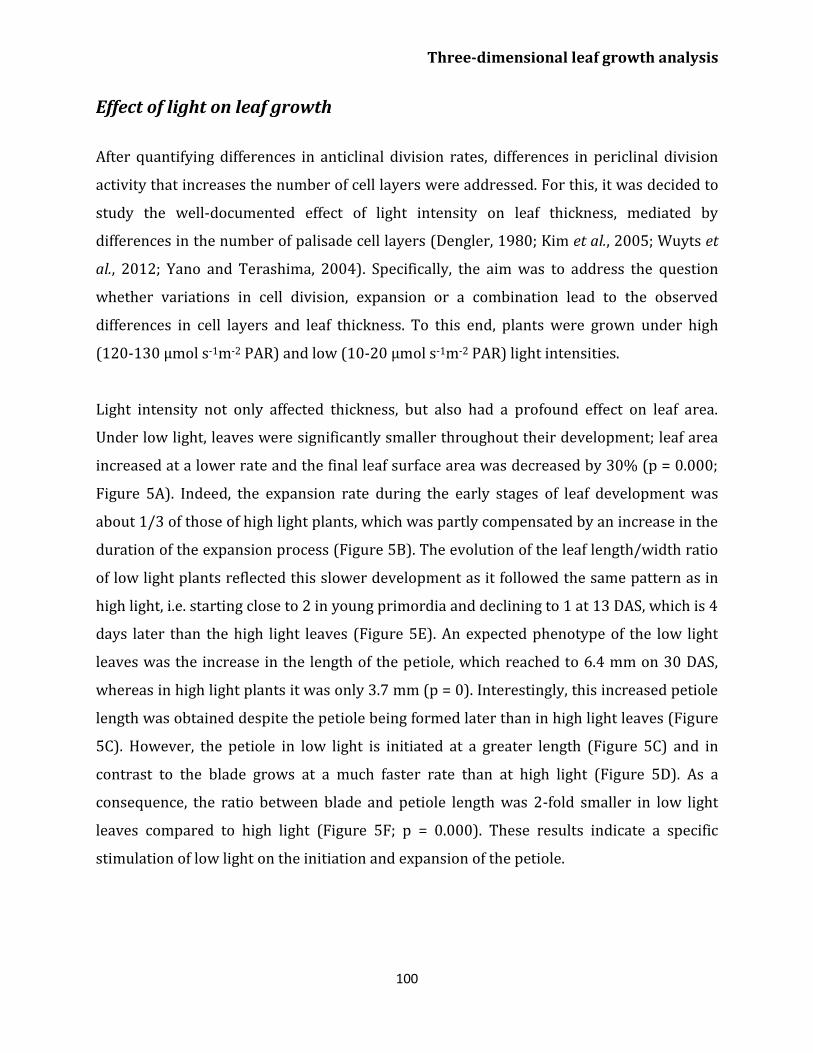
Three-dimensional leaf growth analysis
100
Effect of light on leaf growth
After quantifying differences in anticlinal division rates, differences in periclinal division
activity that increases the number of cell layers were addressed. For this, it was decided to
study the well-documented effect of light intensity on leaf thickness, mediated by
differences in the number of palisade cell layers (Dengler, 1980; Kim et al., 2005; Wuyts et
al., 2012; Yano and Terashima, 2004). Specifically, the aim was to address the question
whether variations in cell division, expansion or a combination lead to the observed
differences in cell layers and leaf thickness. To this end, plants were grown under high
(120-130 µmol s-1m-2 PAR) and low (10-20 µmol s-1m-2 PAR) light intensities.
Light intensity not only affected thickness, but also had a profound effect on leaf area.
Under low light, leaves were significantly smaller throughout their development; leaf area
increased at a lower rate and the final leaf surface area was decreased by 30% (p = 0.000;
Figure 5A). Indeed, the expansion rate during the early stages of leaf development was
about 1/3 of those of high light plants, which was partly compensated by an increase in the
duration of the expansion process (Figure 5B). The evolution of the leaf length/width ratio
of low light plants reflected this slower development as it followed the same pattern as in
high light, i.e. starting close to 2 in young primordia and declining to 1 at 13 DAS, which is 4
days later than the high light leaves (Figure 5E). An expected phenotype of the low light
leaves was the increase in the length of the petiole, which reached to 6.4 mm on 30 DAS,
whereas in high light plants it was only 3.7 mm (p = 0). Interestingly, this increased petiole
length was obtained despite the petiole being formed later than in high light leaves (Figure
5C). However, the petiole in low light is initiated at a greater length (Figure 5C) and in
contrast to the blade grows at a much faster rate than at high light (Figure 5D). As a
consequence, the ratio between blade and petiole length was 2-fold smaller in low light
leaves compared to high light (Figure 5F; p = 0.000). These results indicate a specific
stimulation of low light on the initiation and expansion of the petiole.
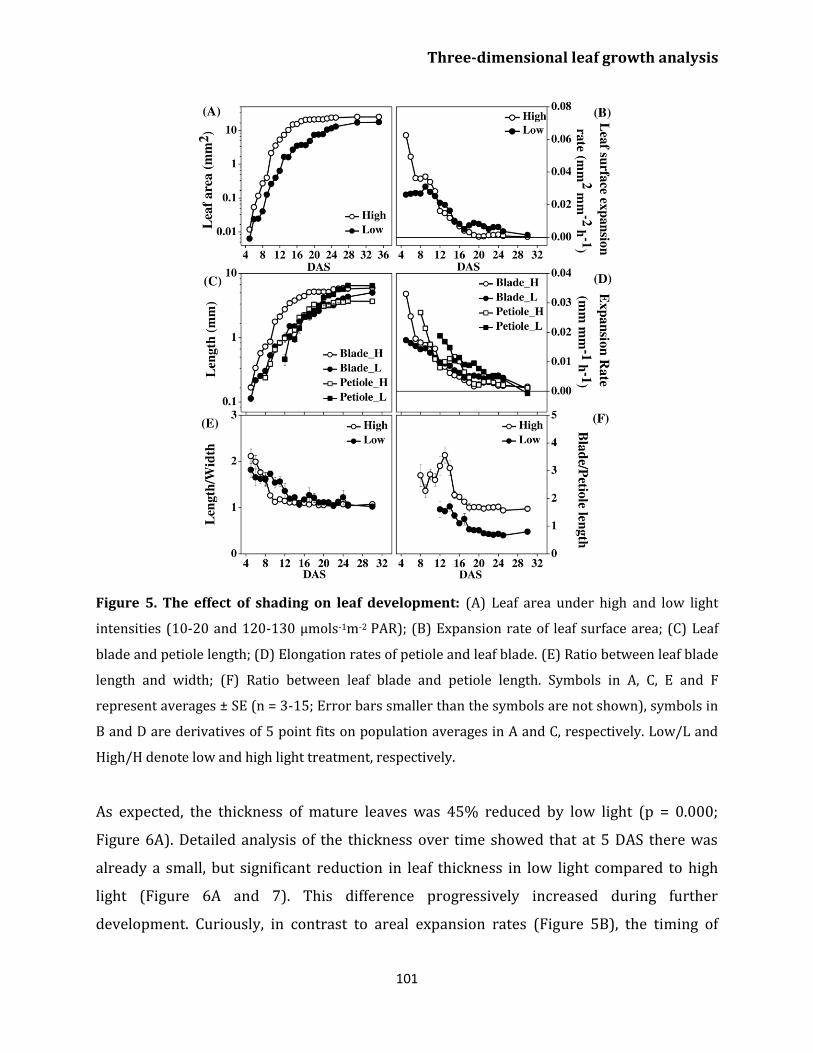
Three-dimensional leaf growth analysis
101
Figure 5. The effect of shading on leaf development: (A) Leaf area under high and low light
intensities (10-20 and 120-130 µmols-1m-2 PAR); (B) Expansion rate of leaf surface area; (C) Leaf
blade and petiole length; (D) Elongation rates of petiole and leaf blade. (E) Ratio between leaf blade
length and width; (F) Ratio between leaf blade and petiole length. Symbols in A, C, E and F
represent averages ± SE (n = 3-15; Error bars smaller than the symbols are not shown), symbols in
B and D are derivatives of 5 point fits on population averages in A and C, respectively. Low/L and
High/H denote low and high light treatment, respectively.
As expected, the thickness of mature leaves was 45% reduced by low light (p = 0.000;
Figure 6A). Detailed analysis of the thickness over time showed that at 5 DAS there was
already a small, but significant reduction in leaf thickness in low light compared to high
light (Figure 6A and 7). This difference progressively increased during further
development. Curiously, in contrast to areal expansion rates (Figure 5B), the timing of
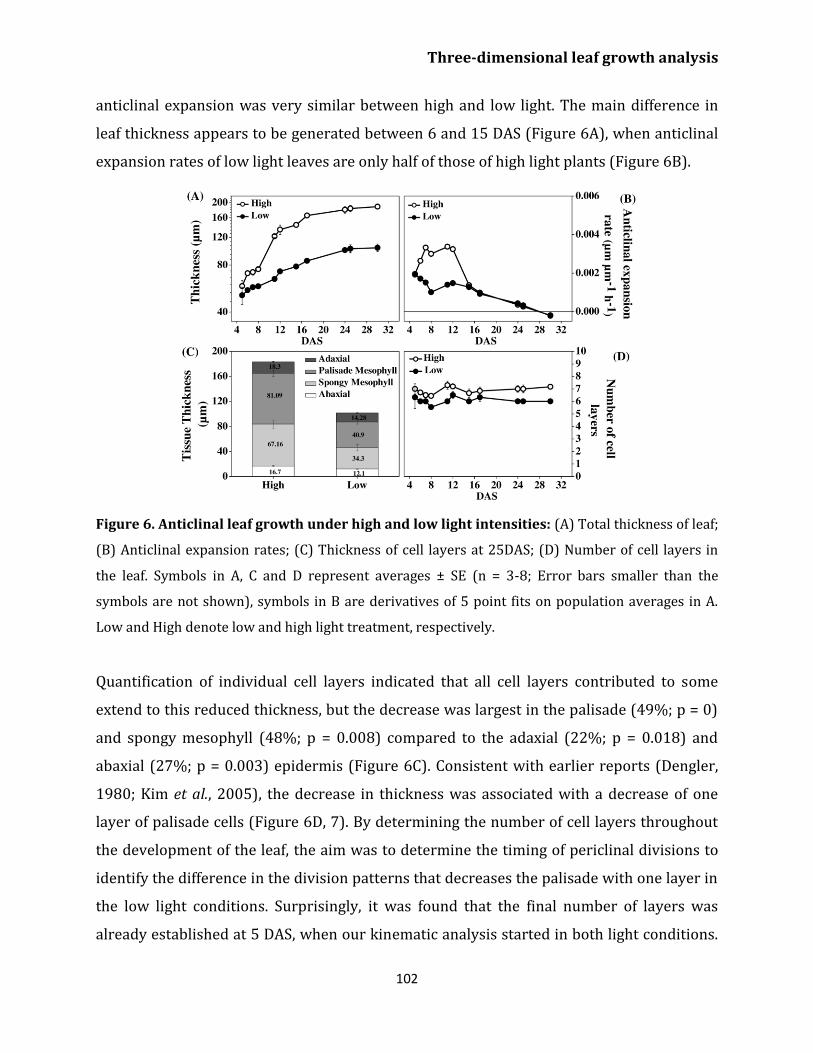
Three-dimensional leaf growth analysis
102
anticlinal expansion was very similar between high and low light. The main difference in
leaf thickness appears to be generated between 6 and 15 DAS (Figure 6A), when anticlinal
expansion rates of low light leaves are only half of those of high light plants (Figure 6B).
Figure 6. Anticlinal leaf growth under high and low light intensities: (A) Total thickness of leaf;
(B) Anticlinal expansion rates; (C) Thickness of cell layers at 25DAS; (D) Number of cell layers in
the leaf. Symbols in A, C and D represent averages ± SE (n = 3-8; Error bars smaller than the
symbols are not shown), symbols in B are derivatives of 5 point fits on population averages in A.
Low and High denote low and high light treatment, respectively.
Quantification of individual cell layers indicated that all cell layers contributed to some
extend to this reduced thickness, but the decrease was largest in the palisade (49%; p = 0)
and spongy mesophyll (48%; p = 0.008) compared to the adaxial (22%; p = 0.018) and
abaxial (27%; p = 0.003) epidermis (Figure 6C). Consistent with earlier reports (Dengler,
1980; Kim et al., 2005), the decrease in thickness was associated with a decrease of one
layer of palisade cells (Figure 6D, 7). By determining the number of cell layers throughout
the development of the leaf, the aim was to determine the timing of periclinal divisions to
identify the difference in the division patterns that decreases the palisade with one layer in
the low light conditions. Surprisingly, it was found that the final number of layers was
already established at 5 DAS, when our kinematic analysis started in both light conditions.
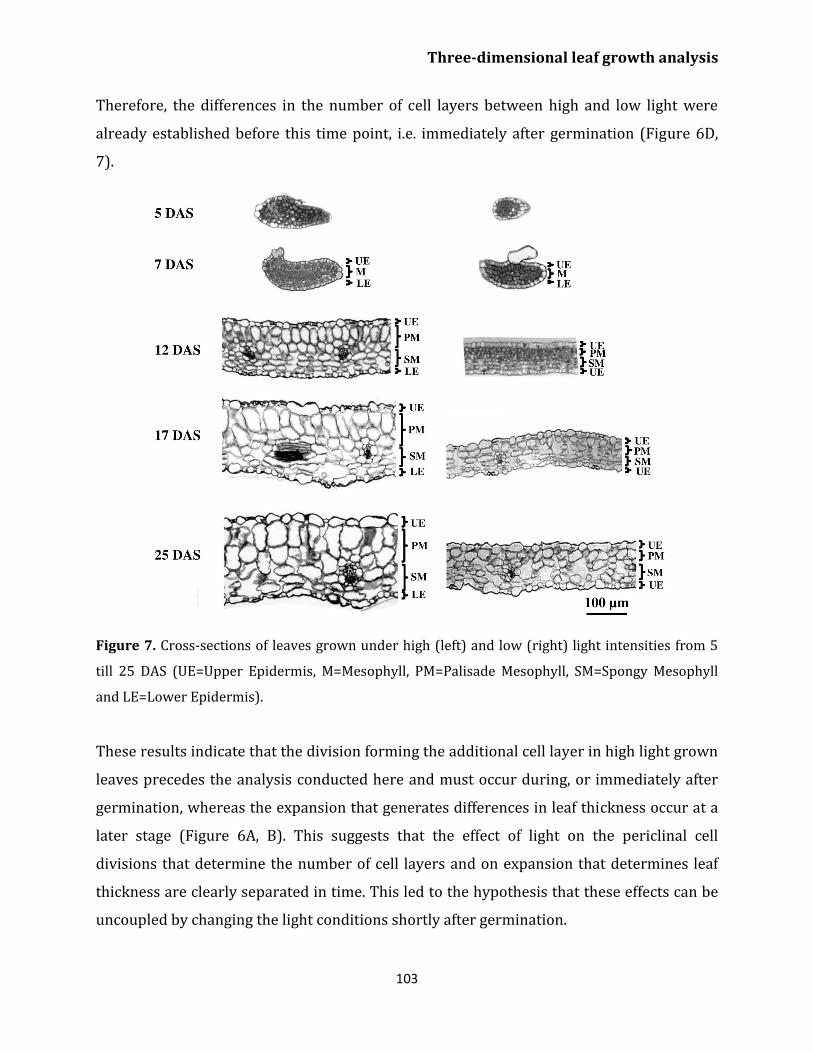
Three-dimensional leaf growth analysis
103
Therefore, the differences in the number of cell layers between high and low light were
already established before this time point, i.e. immediately after germination (Figure 6D,
7).
Figure 7. Cross-sections of leaves grown under high (left) and low (right) light intensities from 5
till 25 DAS (UE=Upper Epidermis, M=Mesophyll, PM=Palisade Mesophyll, SM=Spongy Mesophyll
and LE=Lower Epidermis).
These results indicate that the division forming the additional cell layer in high light grown
leaves precedes the analysis conducted here and must occur during, or immediately after
germination, whereas the expansion that generates differences in leaf thickness occur at a
later stage (Figure 6A, B). This suggests that the effect of light on the periclinal cell
divisions that determine the number of cell layers and on expansion that determines leaf
thickness are clearly separated in time. This led to the hypothesis that these effects can be
uncoupled by changing the light conditions shortly after germination.
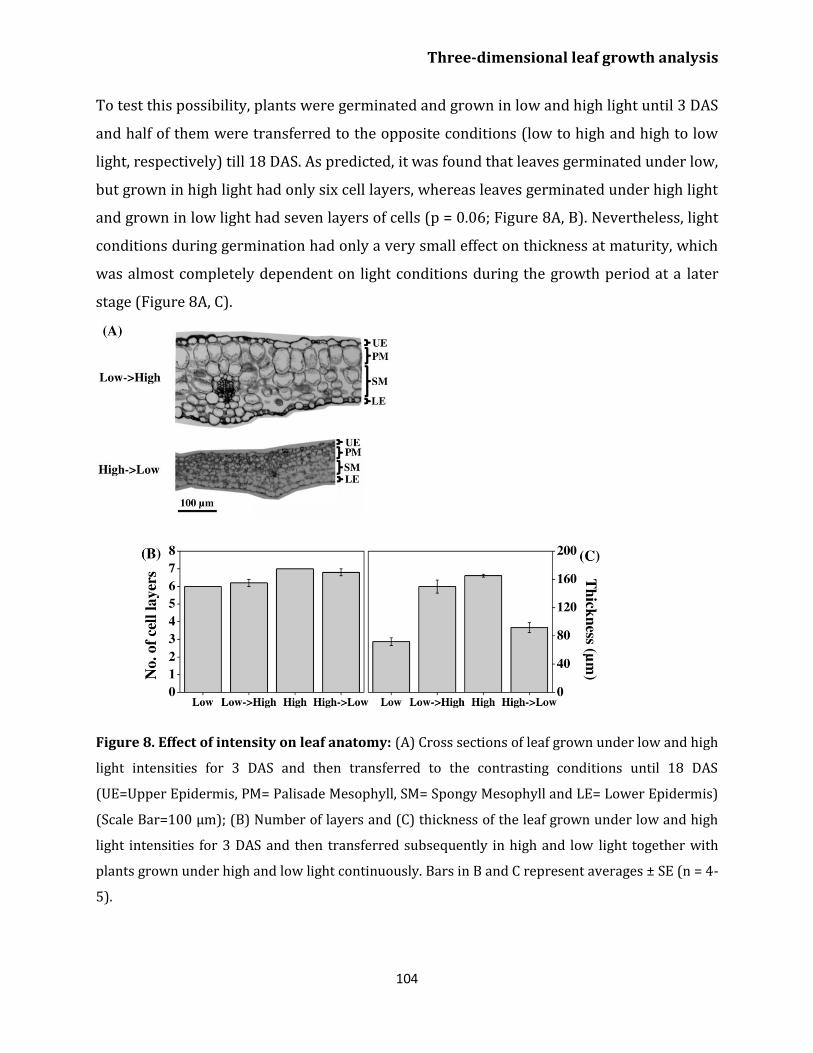
Three-dimensional leaf growth analysis
104
To test this possibility, plants were germinated and grown in low and high light until 3 DAS
and half of them were transferred to the opposite conditions (low to high and high to low
light, respectively) till 18 DAS. As predicted, it was found that leaves germinated under low,
but grown in high light had only six cell layers, whereas leaves germinated under high light
and grown in low light had seven layers of cells (p = 0.06; Figure 8A, B). Nevertheless, light
conditions during germination had only a very small effect on thickness at maturity, which
was almost completely dependent on light conditions during the growth period at a later
stage (Figure 8A, C).
Figure 8. Effect of intensity on leaf anatomy: (A) Cross sections of leaf grown under low and high
light intensities for 3 DAS and then transferred to the contrasting conditions until 18 DAS
(UE=Upper Epidermis, PM= Palisade Mesophyll, SM= Spongy Mesophyll and LE= Lower Epidermis)
(Scale Bar=100 µm); (B) Number of layers and (C) thickness of the leaf grown under low and high
light intensities for 3 DAS and then transferred subsequently in high and low light together with
plants grown under high and low light continuously. Bars in B and C represent averages ± SE (n = 4-
5).
Three-dimensional leaf growth analysis
105
Discussion
Leaf development is a multi-dimensional process, where temporal variation in the spatial
distribution of growth and division rates determines shape and size. To determine
quantitatively how cell division and cell expansion contribute to differences in leaf area in
response to environment and genetic differences, kinematic analyses have been developed
(Nelissen et al., 2013). For leaves of eudicot plants, such as Arabidopsis thaliana, these
methods typically involve measurements of the growth of the leaf as a whole, assuming a
large degree of homogeneity. For determination of cell division, the focus is usually on the
abaxial epidermis as a cell layer representative for the whole of the leaf. This approach
provides a good insight into the developmental progression of the leaf as a whole, given the
strong correlation between kinematic and transcriptome data obtained from whole leaf
samples (Beemster et al., 2005).
Nevertheless, detailed qualitative studies of cell division (Andriankaja et al., 2012; Donnelly
et al., 1999), cell expansion (Kuchen et al., 2012; Walter et al., 2002; Wiese et al., 2007) and
cellular development (Pyke et al., 1991) in the leaves of Arabidopsis thaliana showed large
differences across the leaf and between tissue layers. In order to obtain a more quantitative
insight into spatio-temporal variations in cell division and expansion we have adapted the
kinematic approach here to determine cell division and expansion rates in function of the
major axes of leaf development. The results obtained illustrate the high degree of
heterogeneity across the developing leaf.
Differences in growth rates across the developing leaf
Generally, leaf morphology is divided into leaf blade and petiole. Consistent with the
present findings, other studies also showed that leaf petioles become significantly shorter
under white or strong light, while the length and width of leaf blades were less affected
(Tsukaya et al., 2002; Kozuka et al., 2005). Similar to the present observations, Donnelly et
al. (1999) observed the late emergence and higher elongation rates of the petiole compared
to the leaf blade.
Three-dimensional leaf growth analysis
106
Furthermore, the present results showed that the longitudinal growth outpaced lateral
expansion in early stages of development of the leaf primordium, resulting in an oblong
shape. During subsequent development, the blade of the first leaf pair became round due to
expansion rates in lateral direction outpacing those in longitudinal direction. Ultimately,
during the final stages of leaf development, expansion rates became roughly similar in the
longitudinal and lateral direction, indicating isodiametric surface expansion of the whole
leaf blade.
The differential dynamics of longitudinal and lateral growth relate to genetic findings
indicating that expansion in both directions is regulated by separate regulatory pathways.
Longitudinal expansion is positively governed by ROT3 or ROT4 (ROTUNDIFOLIA), whereas
ANGUSTIFOLIA (AN) regulates lateral expansion (Narita et al., 2004; Tsuge et al., 1996;
Tsukaya, 2006). Hence, an elliptical shape of the leaf was observed in the early stages of its
development, which became more spherical because of the higher expansion rate in leaf
width. The gene expression data of Beemster et al. (2005) show that the expression of the
AN gene is highest at 9 DAS when lateral growth outpaces longitudinal growth, and AN
expression decreases till the maturity. In contrast, ROT3 expression increases from
proliferation till maturity. The opposite expression patterns of ROT3 and AN thus reflect
the relative increase in longitudinal expansion around 15 DAS where lateral and
longitudinal leaf growth become equal. Therefore, it can be predicted that the change in
growth rates in lateral and longitudinal directions is regulated by the crosstalk between
ROT3 and AN.
The present study showed that the rates of leaf blade expansion in the dorso-ventral
direction are an order of magnitude lower than in longitudinal and lateral directions, which
illustrates that in 3D leaf growth is highly anisotropic. Superimposed on this anisotropy is
the effect of environmental conditions on anticlinal cell expansion, where several studies in
different plant species demonstrated strong effects on leaf thickness by light intensity and
water deficiency (Dengler, 1980; Kim et al., 2005; Wuyts et al., 2012; Yano and Terashima,
2004). To our knowledge this study provides a first quantitative 3D analysis of cell
expansion in the Arabidopsis thaliana leaf and the results clearly illustrate the magnitude of
Three-dimensional leaf growth analysis
107
spatio-temporal variations that contribute to the final leaf shape. The results indicate that
individual cells differentially regulate the expansion of their walls depending on their
orientation. To address the question how this is achieved is a cell biological challenge due
to the 3D aspect that is not easily accessed by approaches using microscopy. Nevertheless,
the present data provide a framework in which such studies can be performed, providing
information of timing and the location at which differences are occurring.
Cell layer-specific contributions to leaf thickness
Leaf growth in the anticlinal direction is determined by growth of the individual cell layers.
The present analysis of tissue layers shows that anticlinal expansion rates differ strongly
between cell types, with mesophyll tissues having distinctly higher expansion rates than
epidermal cells. These results are consistent with observations that epidermal cells grew
substantially in area while there is little increase in cell height in Helianthus annuus
(Dengler, 1980). A developmental study of Arabidopsis thaliana leaves demonstrated the
role of mesophyll tissues in determining leaf thickness (Pyke et al., 1991). The
developmental importance of the mesophyll in determining leaf thickness in Arabidopsis
thaliana was demonstrated by Wuyts et al. (2012) who correlated the resulting decrease in
leaf thickness with a reduced proportion of mesophyll tissues. This shows that differential
growth in the mesophyll tissue is the primary determinant of anticlinal leaf growth. The
present results provide the dynamics of cell division and expansion that are at the basis of
the observed differences in number of cell layers and thickness of the leaf.
Under the standard conditions used here, the leaf lamina of Arabidopsis thaliana forms
seven layers of cells, which comprised two epidermal layers (adaxial and abaxial), two
layers of palisade and three layers of spongy mesophyll, which was similar to other studies
(Dengler, 1980; Wuyts et al., 2012). A developmental study of the Arabidopsis thaliana leaf
by Pyke et al. (1991) indicates that the increase in leaf thickness is associated with the
degree of elongation of the palisade tissue. The present observation illustrates that the
palisade mesophyll tissues contribute more to leaf thickness than spongy mesophyll tissues
in the early days of leaf development and that this difference was partially overcome by a
Three-dimensional leaf growth analysis
108
higher anticlinal expansion rate in the spongy mesophyll. This shows that palisade
mesophyll tissues establish and differentiate earlier than spongy mesophyll tissues. Despite
having knowledge about the role of different cell layers in anticlinal growth, the reason for
the pronounced difference between cell expansion in anticlinal and in periclinal direction is
not clear. In roots and stems anisotropy of cell expansion is determined by the orientation
of cellulose microfibrils (Baskin, 2005; Baskin et al., 1999; Roudier et al., 2005). To our
knowledge this aspect has not yet been addressed in the context of the more complex
morphology of the eudicot leaf. The present detailed analysis of the time evolution of
expansion in different cell layers during the development of the leaf of Arabidopsis thaliana
can provide a basis for such studies.
Anticlinal cell division and size evolution differ between cell layers
The cellular measurements conducted in this study show that different cell layers have a
distinct growth evolution in response to leaf development. Changes in leaf growth have
mostly been evaluated by measuring cellular changes in the epidermal and/or mesophyll
cell layers (Andriankaja et al., 2012; Beemster et al., 2005; Donnelly et al., 1999; Granier
and Tardieu, 1998; Wuyts et al., 2010) and different mutants have been used to explain the
molecular basis of the observed growth differences (Cheng et al., 2013; De Veylder et al.,
2001; Horiguchi et al., 2006). However, spatial and temporal differences in the rates of cell
division and expansion processes between these cell layers have not been analyzed so far.
According to Green (1976) relative rates of cell size changes are determined by the balance
between relative surface extension and cell division rate. Thus, when cell growth and
division are perfectly balanced, the leaf area will increase, but the average cell size will be
constant. Because expansion rates are the same for all layers, the author concluded that
differences in cell size evolution must therefore be due to differences in cell division rates
between the layers. In this study, variations in cell division rates between palisade and
epidermal cells that cause differences in cell size evolution between these layers have been
quantified. Specifically, lower rates of cell division were found in palisade cells than in
epidermal cells, so that cell size increase is faster in palisade than in epidermal cells. It is
Three-dimensional leaf growth analysis
109
interesting that those two layers, which drive organ growth, have significant differences in
proliferation rate. This raises the question what the factors are that regulate tissue-specific
division rates and if there is communication between the different layers to appropriately
coordinate these rates, and thereby relative cell sizes and numbers in each tissue.
L1 layer-specific expression of two cyclin-dependent kinase (CDK) inhibitor genes, KRP1
and KRP4 by the AtML1 promoter inhibited cell division and reduced overall leaf size
(Bemis and Torii, 2007). Surprisingly, the number of cells in the sub-epidermal layer was
unchanged as compared to wild type. However, these cells were significantly smaller with
distorted organization. This clearly suggests that the L1 layer does not control the cell
division of inner layers. In contrast to this result, studies of sectoral chimeras in Nicotiana
demonstrated that the cell division rate of mesophyll cells is inhibited by reduced cell
division of the epidermis, resulting in smaller leaf sections with normal sized cells
(Marcotrigiano, 2010). This result suggests that that the epidermis communicates with
inner layers to stimulate or inhibit their growth.
HOBBIT (HBT) is a CDC27 homolog, which encodes a subunit of the Anaphase Promoting
Complex or Cyclosome (APC/C), is a candidate for involvement in this communication.
Postembryonic excision of a single complementing HBT gene copy in hbt mutant rescued
the mutant phenotype, demonstrating that the removal of HBT reduced cell division, which
was accompanied by increased cell expansion in all the layers of Arabidopsis thaliana
leaves. Interestingly, in L1-derived sectors (representing excised HBT); cell division could
be rescued by the presence of wild type HBT in the cells from the underlying layers. In
contrast, no rescue was found in sectors spanning all three layers; suggesting a role of non-
cell autonomous signal in controlling cell division between layers (Serralbo et al., 2006).
Additionally, AN3/GIF1, a transcriptional co-activator also mediates inter cell layer
signaling to balance cell proliferation in epidermis and mesophyll cells in leaves. Mutation
in AN3 reduces epidermal and sub-epidermal cell number, resulting in smaller leaves, and
recent studies have placed AN3 as a central component in the regulation of the transition
from cell proliferation to differentiation (Kawade et al., 2013; Vercruyssen et al., 2014).
Three-dimensional leaf growth analysis
110
Savaldi-Goldstein et al. (2007) studied inter cell communication during cell expansion by
using the L1-specific promoter AtML1 to trigger the expression of the brassinosteroid
receptor (BRI1) or a brassinosteroid biosynthetic enzyme CPD in the background of their
corresponding mutants (bri1 and cpd). The cells of epidermal and sub-epidermal layers in
these lines were rescued to wild type size, demonstrating that upon brassinosteroid
perception non-autonomous growth signals are sent from the epidermis to inner layers. It
will be interesting to determine the exact nature of the signaling molecules involved as well
as the potential role of other hormones by which different layers communicate to regulate
cell division and expansion.
Low light differentially affects leaf growth in three dimensions
The study of leaf growth under control conditions revealed large differences in rates of cell
division and expansion in virtually all dimensions tested. Low light intensity added another
level of complexity, which generally inhibits cell division and expansion throughout the
leaf, with the notable exception of petiole expansion rates, which are stimulated (Figure
5D).
Many previous studies in various plant species have shown that darkness or low light
reduced final leaf area, leaf thickness and epidermal cell number (Cookson and Granier,
2006; Dengler, 1980; Kim et al., 2005; Wuyts et al., 2012; Yano and Terashima, 2004). The
present study showed that shading reduced leaf surface area through decreased leaf
expansion rate, which is partly compensated by an increased duration of expansion. A
similar effect on leaf expansion was seen after UV-B treatment in Arabidopsis thaliana
(Hectors et al., 2010).
The enhancement of petiole length in combination with decreased leaf blade length by
shading of Arabidopsis thaliana plants is consistent with earlier reports (Tsukaya et al.,
2002). The present results demonstrate that these increased petiole lengths are primarily
related to enhanced petiole elongation rates, whereas the reduced size of the leaf blade is
due to a parallel inhibition of cell expansion in the blade. This contrasting response is
Three-dimensional leaf growth analysis
111
consistent with studies of photoreceptor mutants showing that PHYB and CRY1 promote
leaf blade expansion and inhibition of petiole elongation in red light and blue light,
respectively. Moreover, sucrose appears to promote leaf blade and petiole growth in the
dark, whereas it inhibits them in the light (Kozuka et al., 2005). Therefore, the contrasting
effect of light on leaf blade and petiole under low light is likely to be controlled by the
interaction of sugars and photoreceptors.
The results show that the well-documented effect of low light on leaf thickness was
associated with a reduction in thickness of all cell layers. However, the best-documented
effect of low light is the inhibition of the number of palisade cell layers (Dengler, 1980; Kim
et al., 2005; Wuyts et al., 2012; Yano and Terashima, 2001). Indeed, a one-layer reduction
in palisade cells was observed under low light compared with high light. Surprisingly, it
was found that this difference was already established prior to leaf emergence (Figure 6D),
whereas the differences in anticlinal cell expansion only occurred between 5 and 15 DAS
(Figure 6E). By moving plants from high to low and from low to high light conditions at 3
DAS, when seeds are germinating and start to unfold their cotyledons, the effects of the
light intensity on division and expansion were almost completely uncoupled. The
relationship between cell division and expansion is complex and compensation in size
occurs in response to inhibition of cell division (Beemster et al., 2003; Horiguchi and
Tsukaya, 2011). Here, it is shown that in addition to areal growth, compensation can also
occur in the anticlinal orientation.
Light can be perceived by seedlings prior to germination as can be seen from effects on
seed germination, where darkness significantly reduces the germination percentage (Qu et
al., 2008). Different phytochromes are involved to control seed germination and shade
avoidance responses in plants where phytochrome B is expressed from seedling till mature
plant stages (Chen et al., 2004; Somers and Quail, 1995). Consequently, it is conceivable
that the effect on periclinal divisions in the non-emerged primordium is mediated by
internal signals induced in response to light perception in the seed coat, the unfolded
cotyledons or the radicle, which can sense the low light before the primordium of the first
leaf pair is exposed to it. The present study shows the importance of the early stages of leaf
Three-dimensional leaf growth analysis
112
development, which is consistent with mathematical models that link early primordial
morphology to final leaf shape to through spatial regulation of the growth distribution
(Kuchen et al., 2012).
Implications of kinematic analysis
One of the reasons for performing kinematic analyses on the (abaxial) epidermal layer,
despite of its more complex composition of cell types (pavement cells, meristemoids and
guard cells) compared to the palisade mesophyll layer is the absence of potential periclinal
divisions in the latter tissue (De Veylder et al., 2001). Such divisions would lead to an
underestimation of cell division activity when the analysis is solely based on paradermal
(optical) sections of the leaf. However, the present study shows that such divisions are
restricted to a time window that precedes that of kinematic analyses and therefore
validates kinematic studies based on palisade cells.
Conclusion
Leaf growth is a multidimensional process, which involves well-defined cellular
arrangement of cell types in lateral, longitudinal and dorso-ventral directions. To our
knowledge this is the first quantitative kinematic study of the spatiotemporal dynamics of
cell division and expansion rates along the three different axes, which adds an extra
dimension to our knowledge of leaf development. This study opens up new possibilities for
further research, which can explain a number of interesting questions such as when exactly
division at early stage establishes the number of mesophyll cell layers and which are the
factors involved in regulating this process. Another area of research is to determine the
mechanisms that establish the variation between leaf expansion in anticlinal and areal
directions. Moreover, the study forms a framework for further in-depth studies of the
cellular and molecular basis to explain the observed differences in cell division and
expansion rates across the eudicot leaf.
Three-dimensional leaf growth analysis
113
Material and Methods
Plant material and growth conditions
Arabidopsis thaliana wild type Col-0 seeds were sterilized in 70% ethanol for 1 minute and
5% bleach for 10 minutes followed by rinsing with water and sown on half-strength MS
(Murashige and Skoog, 1962) medium (Duchefa, The Netherlands) supplemented with 1%
sucrose in 150x25 mm round petri dishes (Falcon® tissue culture dishes). After sowing, the
plates were placed at 4°C for 2 days to synchronize germination. After stratification, the
plates were transferred to a growth chamber with an air temperature of 22°C and shelves
cooled to 19°C. Two different light intensities (10-20 and 120-130 µmol s-1m-2 PAR) were
applied in a 16 h day and 8 h night regime.
Leaf growth analysis
Growth analysis was performed on the first leaf pair. Leaves were fixed and cleared with
70% ethanol for 24 h and subsequently in 100% lactic acid, which was also used as a
mounting agent. Leaf images were obtained with a binocular microscope (Nikon SMZ1000)
fitted with a digital camera (Zeiss AxioCam Cc1) from 5 to 25 days after stratification
(DAS). For each day leaf surface area, blade length, blade width and petiole length of 5-15
leaves were measured using ImageJ (http://rsbweb.nih.gov/ij/). Logarithmic values of the
means of leaf area, leaf blade length, blade width and petiole length were used and locally
fitted with a 5-point quadratic function (Erickson, 1976) of which the first derivative was
used to determine the relative expansion rates.
Transverse sectioning
From 5 to 25 DAS, 4 to 8 leaves were fixed under a vacuum in a solution of 5% acetic acid,
5% formaldehyde and 50% ethanol for an hour. Fixed leaves were rinsed with phosphate
buffer, pH 7.2 and dehydrated by sequential 4 h incubations in 30%, 50%, 70%, 80%, 90%,
95% and 1 h incubation in 98%, 99% and twice in 100% ethanol. The dehydrated seedlings
Three-dimensional leaf growth analysis
114
were incubated at room temperature in 30%, 50%, 70% (v/v) Technovit 7100 resin with
ethanol and in 100% resin for 15 h. These incubated leaves were embedded in resin with
hardener and allowed to harden for 24 h at room temperature. Cross sections of middle
part of the leaf were cut (2 μm thick) with a rotary microtome (Leica Reichert-Jung 2040),
stained with 0.05% (w/v) solution of toluidine blue for 10 min and rinsed with distilled
water for 1 min. Slides with the sections were dried at 40˚C and mounted using DePeX as
mounting agent. Pictures of the sections were taken with a bright field microscope (Zeiss
Axio Scope A1 at 20x magnification) fitted with a digital camera (Zeiss AxioCam Cm1). The
number of cell layers was counted and total leaf thickness and the thickness of each cell
layer were measured with ImageJ. The logarithmic values of average leaf thickness and the
thickness of each cell layer per day were used and locally fitted using a 5 point quadratic
function of which the first derivative was used to determine the relative expansion rate.
Cellular measurements
We performed a kinematic analysis of the abaxial epidermal cells using 3-5 average leaves
for each time point from 7 to 25 DAS as described by Nelissen et al. (2013). Leaves of early
days, i.e. 7-10 DAS, were stained with propidium iodide followed by the protocol of Wuyts
et al. (2010) and cell images were obtained with a Nikon C1 confocal microscope mounted
on a Nikon Eclipse E600. Leaf samples of later time points were cleared with 70% ethanol
and subsequently stored and mounted in 100% lactic acid on object slides for microscopy.
Epidermal and palisade cells located between 25 to 75% of the leaf blade from tip to base
were imaged using DIC optics on a Zeiss Axio Scope A1 at 20x and 40x magnification fitted
with a digital camera (Zeiss AxioCam Cm1). The outlines of imaged epidermal and palisade
cells were hand drawn on an LCD tablet (Wacom drawing pad) connected to an iMac
computer running ImageJ. Cell analysis of drawn cells was done with an automated image
analysis software that discriminates guard cells from pavement cells based on the presence
of the stomatal pore, measures the area of all cells and counts the number of cells
(Andriankaja et al., 2012). From these data we calculated the average cell area, estimated
the number of cells per leaf by dividing leaf blade area by average cell area and determined
the stomatal index as the fraction of guard cells relative to all epidermal cells (pavement +
Three-dimensional leaf growth analysis
115
guard cells). We calculated rates of cell division and cell area increase as the relative rate of
increase in cell number and cell size in each layer over time, respectively. For this, the
logarithmic values of means of cell size and cell number were locally fitted with a 5 point
quadratic function of which the first derivative was used as the relative growth and
division rates, respectively.
Statistical analysis
Standard error was calculated from different replicates on each time point for leaf area, cell
area, cell number, stomatal index, thickness and cell layer. Statistical analysis to compare
light effects was conducted using SPSS 16.0 statistical software and significant differences
between the means of parameters were determined by t test (p value < 0.01). Because the
calculation of expansion and division rates are based on a single fit on the population
averages of 5 successive points, a single value is obtained for each time point, this
precludes further statistical analysis.
Acknowledgments
This work was supported by a concerted research activity (GOA) research grant, ‘A Systems
Biology Approach of Leaf Morphogenesis’ from the research council of the University of
Antwerp and an Interuniversity Attraction Poles (IUAP) from the Belgian Federal Science
Policy Office (BELSPO). Shweta Kalve was funded by a training grant from the Department
of Science and Education of the Flemish Government. Joanna Fotschki was co-financed by
European Social Fund, Polish Government and Podlasie Voivodeship. The authors
acknowledge the financial support of the Research Foundation-Flanders (FWO-
Vlaanderen)
Three-dimensional leaf growth analysis
116
References
Andriankaja M, Dhondt S, De Bodt S, Vanhaeren H, Coppens F, De Milde L,
Muhlenbock P, Skirycz A, Gonzalez N, Beemster GTS, Inzé D. 2012. Exit from
proliferation during leaf development in Arabidopsis thaliana: a not-so-gradual process.
Dev Cell 22, 64-78.
Baskin TI. 2005. Anisotropic expansion of the plant cell wall. Annu Rev Cell Dev Biol 21,
203-222.
Baskin TI, Meekes HT, Liang BM, Sharp RE. 1999. Regulation of growth anisotropy in
well-watered and water-stressed maize roots. II. Role Of cortical microtubules and
cellulose microfibrils. Plant Physiol 119, 681-692.
Beemster GT, De Veylder L, Vercruysse S, West G, Rombaut D, Van Hummelen P,
Galichet A, Gruissem W, Inzé D, Vuylsteke M. 2005. Genome-wide analysis of gene
expression profiles associated with cell cycle transitions in growing organs of Arabidopsis.
Plant Physiol 138, 734-743.
Beemster GT, Fiorani F, Inzé D. 2003. Cell cycle: the key to plant growth control? Trends
Plant Sci 8, 154-158.
Bemis SM, Torii KU. 2007. Autonomy of cell proliferation and developmental programs
during Arabidopsis aboveground organ morphogenesis. Dev Biol 304, 367-381.
Breuninger H, Lenhard M. 2010. Control of tissue and organ growth in plants. Curr Top
Dev Biol 91, 185-220.
Chen M, Chory J, Fankhauser C. 2004. Light signal transduction in higher plants. Annu Rev
Genet 38, 87-117.
Three-dimensional leaf growth analysis
117
Cheng Y, Cao L, Wang S, Li Y, Shi X, Liu H, Li L, Zhang Z, Fowke LC, Wang H, Zhou Y.
2013. Downregulation of multiple CDK inhibitor ICK/KRP genes upregulates the E2F
pathway and increases cell proliferation, and organ and seed sizes in Arabidopsis. Plant J
75, 642-655.
Cookson SJ, Granier C. 2006. A dynamic analysis of the shade-induced plasticity in
Arabidopsis thaliana rosette leaf development reveals new components of the shade-
adaptative response. Ann Botany 97, 443-452.
De Veylder L, Beeckman T, Beemster GTS, Krols L, Terras P, Landrieu I, Van der
Schueren E, Maes S, Naudts M, Inzé D. 2001. Functional analysis of cyclin-dependent
kinase inhibitors of Arabidopsis. Plant Cell 13, 1653-1667.
Dengler NG. 1980. Comparative histological basis of sun and shade leaf dimorphism in
Helianthus annuus. Canadian Journal of Botany-Revue Canadienne De Botanique 58, 717-
730.
Donnelly PM, Bonetta D, Tsukaya H, Dengler RE, Dengler NG. 1999. Cell cycling and cell
enlargement in developing leaves of Arabidopsis. Dev Biol 215, 407-419.
Erickson RO. 1976. Modeling of plant growth. Annu Rev Plant Physiol 27, 407-434.
Gonzalez N, Vanhaeren H, Inzé D. 2012. Leaf size control: complex coordination of cell
division and expansion. Trends Plant Sci 17, 332-340.
Granier C, Tardieu F. 1998. Spatial and temporal analyses of expansion and cell cycle in
sunflower leaves. A common pattern of development for all zones of a leaf and different
leaves of a plant. Plant Physiol 116, 991-1001.
Three-dimensional leaf growth analysis
118
Granier C, Tardieu F. 2009. Multi-scale phenotyping of leaf expansion in response to
environmental changes: the whole is more than the sum of parts. Plant Cell Environ 32,
1175-1184.
Green PB. 1976. Growth and cell pattern formation on an axis: critique of concepts,
terminology and modes of study. Bot Gaz 137 (3), 187-202.
Hectors K, Jacques E, Prinsen E, Guisez Y, Verbelen JP, Jansen MA, Vissenberg K. 2010.
UV radiation reduces epidermal cell expansion in leaves of Arabidopsis thaliana. J Exp Bot
61, 4339-4349.
Horiguchi G, Fujikura U, Ferjani A, Ishikawa N, Tsukaya H. 2006. Large-scale
histological analysis of leaf mutants using two simple leaf observation methods:
identification of novel genetic pathways governing the size and shape of leaves. Plant J 48,
638-644.
Horiguchi G, Tsukaya H. 2011. Organ size regulation in plants: insights from
compensation. Front Plant Sci 2, 24.
Ichihashi Y, Kawade K, Usami T, Horiguchi G, Takahashi T, Tsukaya H. 2011. Key
proliferative activity in the junction between the leaf blade and leaf petiole of Arabidopsis.
Plant Physiol 157, 1151-1162.
James SA, Bell DT. 2000. Influence of light availability on leaf structure and growth of two
Eucalyptus globulus ssp. globulus provenances. Tree Physiol 20, 1007-1018.
Kalve S, De Vos D, Beemster GTS. 2014. Leaf development: a cellular perspective. Front
Plant Sci 5 (362).
Kawade K, Horiguchi G, Usami T, Hirai MY, Tsukaya H. 2013. ANGUSTIFOLIA3 signaling
coordinates proliferation between clonally distinct cells in leaves. Curr Biol 23, 788-792.
Three-dimensional leaf growth analysis
119
Kim GT, Yano S, Kozuka T, Tsukaya H. 2005. Photomorphogenesis of leaves: shade-
avoidance and differentiation of sun and shade leaves. Photochem Photobiol Sci 4, 770-774.
Kozuka T, Horiguchi G, Kim GT, Ohgishi M, Sakai T, Tsukaya H. 2005. The different
growth responses of the Arabidopsis thaliana leaf blade and the petiole during shade
avoidance are regulated by photoreceptors and sugar. Plant Cell Physiol 46, 213-223.
Kuchen EE, Fox S, de Reuille PB, Kennaway R, Bensmihen S, Avondo J, Calder GM,
Southam P, Robinson S, Bangham A, Coen E. 2012. Generation of leaf shape through
early patterns of growth and tissue polarity. Science 335, 1092-1096.
Marcotrigiano M. 2010. A role for leaf epidermis in the control of leaf size and the rate and
extent of mesophyll cell division. Am J Bot 97, 224-233.
Murashige T, Skoog F. 1962. A revised medium for rapid growth and bioassays with
tobacco tissue cultures. Physiol Plant 15, 473–497.
Narita NN, Moore S, Horiguchi G, Kubo M, Demura T, Fukuda H, Goodrich J, Tsukaya
H. 2004. Overexpression of a novel small peptide ROTUNDIFOLIA4 decreases cell
proliferation and alters leaf shape in Arabidopsis thaliana. Plant J 38, 699-713.
Nelissen H, Rymen B, Coppens F, Dhondt S, Fiorani F, Beemster GT. 2013. Kinematic
analysis of cell division in leaves of mono- and dicotyledonous species: a basis for
understanding growth and developing refined molecular sampling strategies. Methods Mol
Biol 959, 247-264.
Pyke KA, Marrison JL, Leech RM. 1991. Temporal and spatial development of the cells of
the expanding 1st leaf of Arabidopsis thaliana (L) Heynh. J Exp Bot 42, 1407-1416.
Three-dimensional leaf growth analysis
120
Qu XX, Huang ZY, Baskin JM, Baskin CC. 2008. Effect of temperature, light and salinity on
seed germination and radicle growth of the geographically widespread halophyte shrub
Halocnemum strobilaceum. Ann Botany 101, 293-299.
Roudier F, Fernandez AG, Fujita M, Himmelspach R, Borner GH, Schindelman G, Song
S, Baskin TI, Dupree P, Wasteneys GO, Benfey PN. 2005. COBRA, an Arabidopsis
extracellular glycosyl-phosphatidyl inositol-anchored protein, specifically controls highly
anisotropic expansion through its involvement in cellulose microfibril orientation. Plant
Cell 17, 1749-1763.
Savaldi-Goldstein S, Peto C, Chory J. 2007. The epidermis both drives and restricts plant
shoot growth. Nature 446, 199-202.
Serralbo O, Perez-Perez JM, Heidstra R, Scheres B. 2006. Non-cell-autonomous rescue
of anaphase-promoting complex function revealed by mosaic analysis of HOBBIT, an
Arabidopsis CDC27 homolog. Proc Natl Acad Sci U S A 103, 13250-13255.
Silk WK, Erickson RO. 1979. Kinematics of plant growth. J Theor Biol 76, 481-501.
Skirycz A, Claeys H, De Bodt S, Oikawa A, Shinoda S, Andriankaja M, Maleux K, Eloy
NB, Coppens F, Yoo SD, Saito K, Inzé D. 2011. Pause-and-stop: the effects of osmotic
stress on cell proliferation during early leaf development in Arabidopsis and a role for
ethylene signaling in cell cycle arrest. Plant Cell 23, 1876-1888.
Somers DE, Quail PH. 1995. Temporal and spatial expression patterns of PHYA and PHYB
genes in Arabidopsis. Plant J 7, 413-427.
Swarup R, Kramer EM, Perry P, Knox K, Leyser HM, Haseloff J, Beemster GTS,
Bhalerao R, Bennett MJ. 2005. Root gravitropism requires lateral root cap and epidermal
cells for transport and response to a mobile auxin signal. Nature Cell Biol 7, 1057-1065.
Three-dimensional leaf growth analysis
121
Tsuge T, Tsukaya H, Uchimiya H. 1996. Two independent and polarized processes of cell
elongation regulate leaf blade expansion in Arabidopsis thaliana (L.) Heynh. Development
122, 1589-1600.
Tsukaya H. 2006. Mechanism of leaf-shape determination. Annu Rev Plant Biol 57, 477-
496.
Tsukaya H. 2008. Controlling size in multicellular organs: Focus on the leaf. PLoS Biol 6,
1373-1376.
Tsukaya H, Kozuka T, Kim GT. 2002. Genetic control of petiole length in Arabidopsis
thaliana. Plant Cell Physiol 43, 1221-1228.
Ubeda-Tomás S, Federici F, Casimiro I, Beemster GTS, Bhalerao R, Swarup R, Doerner
P, Haseloff J, Bennett MJ. 2009. Gibberellin signalling in the endodermis controls
Arabidopsis root cell production by regulating meristem size. Curr Biol 19, 1194 - 1199.
Vercruyssen L, Verkest A, Gonzalez N, Heyndrickx KS, Eeckhout D, Han SK, Jegu T,
Archacki R, Van Leene J, Andriankaja M, De Bodt S, Abeel T, Coppens F, Dhondt S, De
Milde L, Vermeersch M, Maleux K, Gevaert K, Jerzmanowski A, Benhamed M, Wagner
D, Vandepoele K, De Jaeger G, Inze D. (2014). ANGUSTIFOLIA3 binds to SWI/SNF
chromatin remodeling complexes to regulate transcription during Arabidopsis leaf
development. Plant Cell 26, 210-229.
Walter A, Feil R, Schurr U. 2002. Restriction of nyctinastic movements and application of
tensile forces to leaves affects diurnal patterns of expansion growth. Funct Plant Biol 29,
1247-1258.
Wiese A, Christ MM, Virnich O, Schurr U, Walter A. 2007. Spatio-temporal leaf growth
patterns of Arabidopsis thaliana and evidence for sugar control of the diel leaf growth cycle.
New Phytol 174, 752-761.
Three-dimensional leaf growth analysis
122
Wuyts N, Massonnet C, Dauzat M, Granier C. 2012. Structural assessment of the impact of
environmental constraints on Arabidopsis thaliana leaf growth: a 3D approach. Plant Cell
Environ 35, 1631-1646.
Wuyts N, Palauqui JC, Conejero G, Verdeil JL, Granier C, Massonnet C. 2010. High-
contrast three-dimensional imaging of the Arabidopsis leaf enables the analysis of cell
dimensions in the epidermis and mesophyll. Plant Methods 6.
Yano S, Terashima I. 2001. Separate localization of light signal perception for sun or shade
type chloroplast and palisade tissue differentiation in Chenopodium album. Plant Cell
Physiol 42, 1303-1310.
Yano S, Terashima I. 2004. Developmental process of sun and shade leaves in
Chenopodium album L. Plant Cell Environ 27, 781-793.
Chapter 3
Crosstalk between Auxin Signaling and Osmotic
Stress Response in the Regulation of Leaf Growth
of Arabidopsis thaliana
Shweta Kalve1, Marios Nektarios Markakis1, Céline
Helsmoortel2, Frederik Coppens4, Geert Vandeweyer2,3, Kris
Laukens3, Manou Sommen2, Stephan Naulaers3, Kris
Vissenberg1, Els Prinsen1 and Gerrit T.S. Beemster1*
1Department of Biology, University of Antwerp, Belgium
2Department of Medical Genetics, University of Antwerp, Antwerp, Belgium
3Biomedical Informatics Research Center Antwerp (Biomina), Department of
Mathematics and Computer Science, University of Antwerp, Belgium
4Department of Plant Systems Biology, VIB, Gent, Belgium
*Corresponding Author
This chapter is to be submitted to The Plant Cell
Contribution of S.K.- Performed most experiments and wrote the manuscript


Crosstalk between auxin signaling and osmotic stress
125
Abstract
To understand the role of auxin in the response of leaf growth to water stress, we studied
the development of the first leaf pair of Arabidopsis thaliana seedlings growing in vitro,
using mannitol as an osmoticum and external application of NAA (α-Naphthalene acetic
acid) to change the auxin homeostasis. We observed that 25 mM mannitol reduced leaf size
by 25%, whereas 0.1 µM NAA increased it by 37%. Interestingly, leaves grown in
combination of NAA and mannitol were 30% smaller than untreated controls, showing that
exogenous supply of NAA increased the sensitivity to osmotic stress. Kinematic analysis
revealed that the decrease in leaf size induced by osmotic stress was mostly due to reduced
cell division rates. In contrast, increasing concentrations of NAA up to 0.4 µM increased
mature cell size by up to 40%, whereas cell numbers were maximal at 0.04 µM. DR5::GUS
analysis demonstrates that both NAA and mannitol enhanced the transcriptional response
to auxin. However, auxin measurements showed that NAA and mannitol had no significant
effect on the concentrations of endogenous free IAA, but additively reduced the levels of
conjugated IAA in the dividing cells. Transcriptome analysis of proliferating leaves by
mRNA sequencing demonstrated that 301 out of the 654 genes differentially expressed in
response to exogenous NAA were also affected by mannitol, confirming that auxin is an
integral part of the stress signal in young leaves. More detailed analysis showed that NAA
transcriptionally inhibits the expression of auxin biosynthesis genes, whereas osmotic
stress stimulates them. However, both stimuli induce auxin deconjugation and degradation
genes, explaining the reduced levels of conjugates. At the same time both treatments
increase auxin sensitivity by stimulating the expression of TIR1 and several ARFs, while
downregulating Aux/IAA genes, explaining the enhanced transcriptional response
demonstrated by the DR5 activity. Stimulation of cell division and expansion by NAA and
inhibition of the same processes by mannitol could be associated with specific subsets of
regulatory genes being regulated in response to both factors. In conclusion, our results
demonstrate that there is a crosstalk between auxin signaling and osmotic stress in the
regulation of leaf growth.
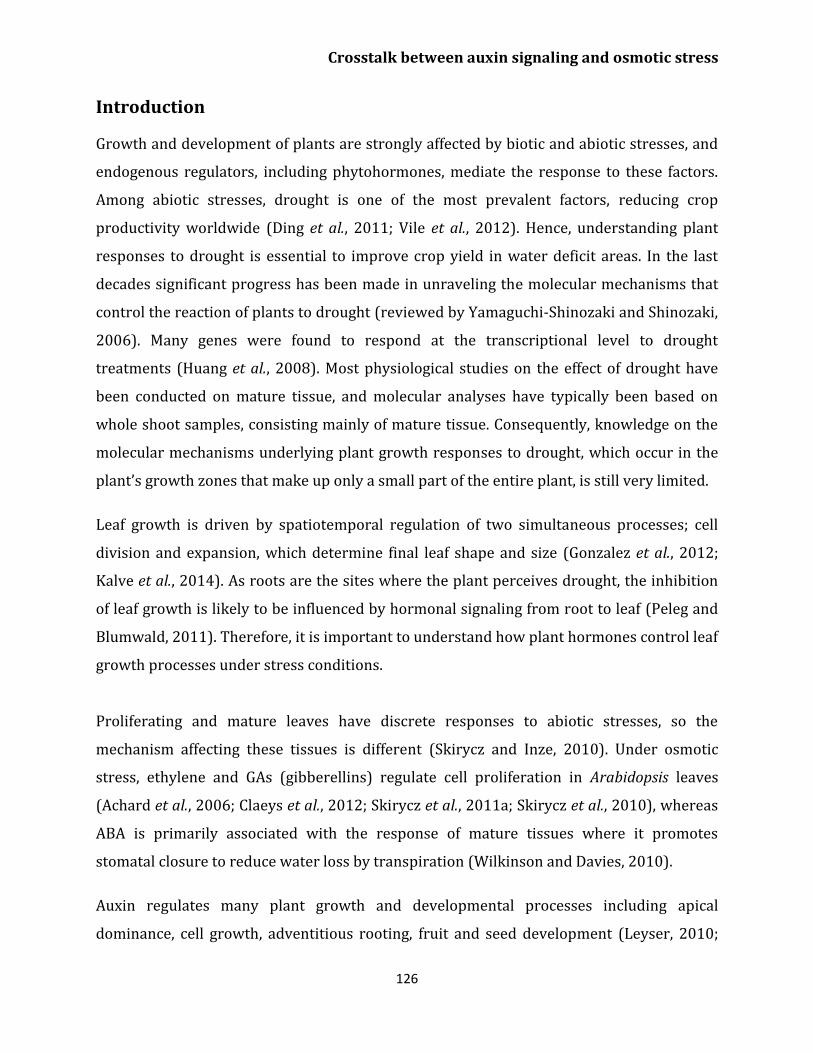
Crosstalk between auxin signaling and osmotic stress
126
Introduction
Growth and development of plants are strongly affected by biotic and abiotic stresses, and
endogenous regulators, including phytohormones, mediate the response to these factors.
Among abiotic stresses, drought is one of the most prevalent factors, reducing crop
productivity worldwide (Ding et al., 2011; Vile et al., 2012). Hence, understanding plant
responses to drought is essential to improve crop yield in water deficit areas. In the last
decades significant progress has been made in unraveling the molecular mechanisms that
control the reaction of plants to drought (reviewed by Yamaguchi-Shinozaki and Shinozaki,
2006). Many genes were found to respond at the transcriptional level to drought
treatments (Huang et al., 2008). Most physiological studies on the effect of drought have
been conducted on mature tissue, and molecular analyses have typically been based on
whole shoot samples, consisting mainly of mature tissue. Consequently, knowledge on the
molecular mechanisms underlying plant growth responses to drought, which occur in the
plant’s growth zones that make up only a small part of the entire plant, is still very limited.
Leaf growth is driven by spatiotemporal regulation of two simultaneous processes; cell
division and expansion, which determine final leaf shape and size (Gonzalez et al., 2012;
Kalve et al., 2014). As roots are the sites where the plant perceives drought, the inhibition
of leaf growth is likely to be influenced by hormonal signaling from root to leaf (Peleg and
Blumwald, 2011). Therefore, it is important to understand how plant hormones control leaf
growth processes under stress conditions.
Proliferating and mature leaves have discrete responses to abiotic stresses, so the
mechanism affecting these tissues is different (Skirycz and Inze, 2010). Under osmotic
stress, ethylene and GAs (gibberellins) regulate cell proliferation in Arabidopsis leaves
(Achard et al., 2006; Claeys et al., 2012; Skirycz et al., 2011a; Skirycz et al., 2010), whereas
ABA is primarily associated with the response of mature tissues where it promotes
stomatal closure to reduce water loss by transpiration (Wilkinson and Davies, 2010).
Auxin regulates many plant growth and developmental processes including apical
dominance, cell growth, adventitious rooting, fruit and seed development (Leyser, 2010;
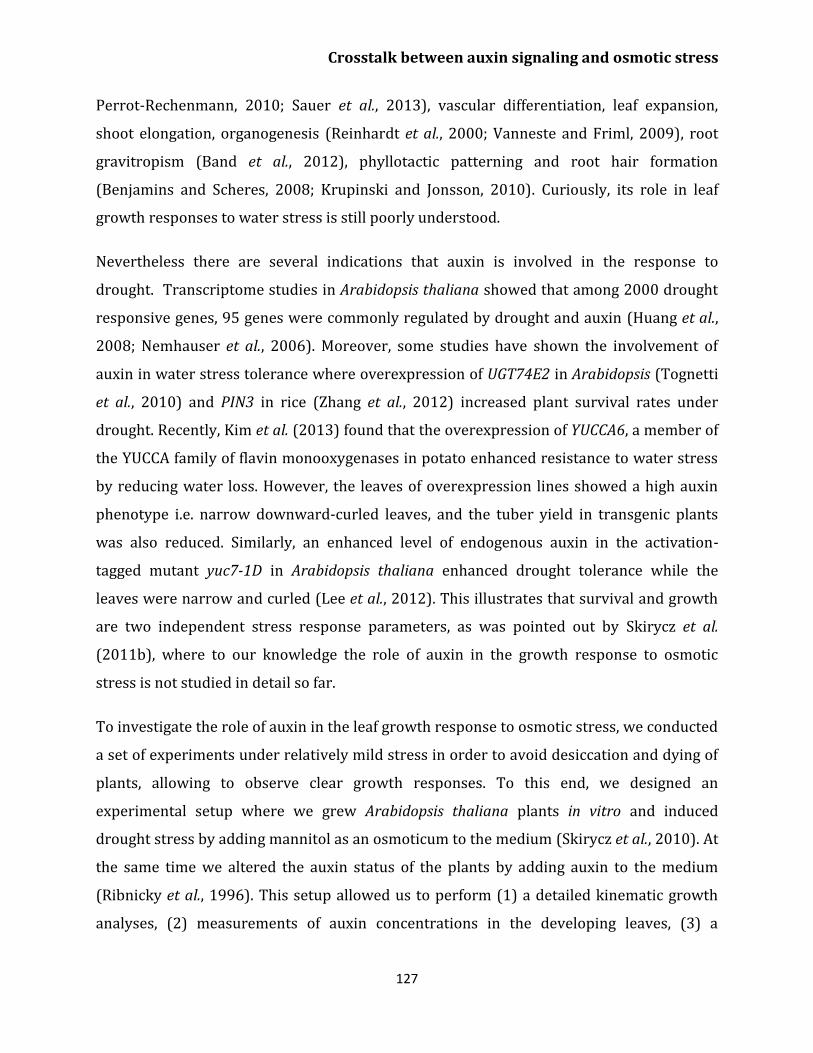
Crosstalk between auxin signaling and osmotic stress
127
Perrot-Rechenmann, 2010; Sauer et al., 2013), vascular differentiation, leaf expansion,
shoot elongation, organogenesis (Reinhardt et al., 2000; Vanneste and Friml, 2009), root
gravitropism (Band et al., 2012), phyllotactic patterning and root hair formation
(Benjamins and Scheres, 2008; Krupinski and Jonsson, 2010). Curiously, its role in leaf
growth responses to water stress is still poorly understood.
Nevertheless there are several indications that auxin is involved in the response to
drought. Transcriptome studies in Arabidopsis thaliana showed that among 2000 drought
responsive genes, 95 genes were commonly regulated by drought and auxin (Huang et al.,
2008; Nemhauser et al., 2006). Moreover, some studies have shown the involvement of
auxin in water stress tolerance where overexpression of UGT74E2 in Arabidopsis (Tognetti
et al., 2010) and PIN3 in rice (Zhang et al., 2012) increased plant survival rates under
drought. Recently, Kim et al. (2013) found that the overexpression of YUCCA6, a member of
the YUCCA family of flavin monooxygenases in potato enhanced resistance to water stress
by reducing water loss. However, the leaves of overexpression lines showed a high auxin
phenotype i.e. narrow downward-curled leaves, and the tuber yield in transgenic plants
was also reduced. Similarly, an enhanced level of endogenous auxin in the activation-
tagged mutant yuc7-1D in Arabidopsis thaliana enhanced drought tolerance while the
leaves were narrow and curled (Lee et al., 2012). This illustrates that survival and growth
are two independent stress response parameters, as was pointed out by Skirycz et al.
(2011b), where to our knowledge the role of auxin in the growth response to osmotic
stress is not studied in detail so far.
To investigate the role of auxin in the leaf growth response to osmotic stress, we conducted
a set of experiments under relatively mild stress in order to avoid desiccation and dying of
plants, allowing to observe clear growth responses. To this end, we designed an
experimental setup where we grew Arabidopsis thaliana plants in vitro and induced
drought stress by adding mannitol as an osmoticum to the medium (Skirycz et al., 2010). At
the same time we altered the auxin status of the plants by adding auxin to the medium
(Ribnicky et al., 1996). This setup allowed us to perform (1) a detailed kinematic growth
analyses, (2) measurements of auxin concentrations in the developing leaves, (3) a
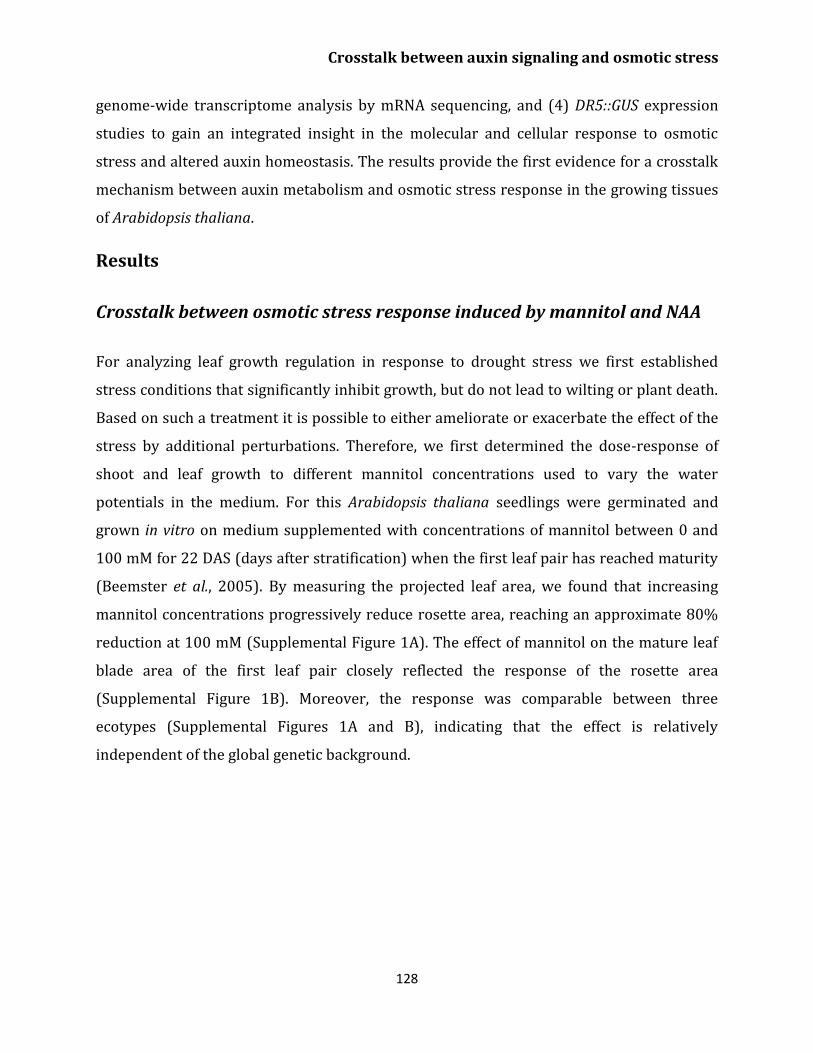
Crosstalk between auxin signaling and osmotic stress
128
genome-wide transcriptome analysis by mRNA sequencing, and (4) DR5::GUS expression
studies to gain an integrated insight in the molecular and cellular response to osmotic
stress and altered auxin homeostasis. The results provide the first evidence for a crosstalk
mechanism between auxin metabolism and osmotic stress response in the growing tissues
of Arabidopsis thaliana.
Results
Crosstalk between osmotic stress response induced by mannitol and NAA
For analyzing leaf growth regulation in response to drought stress we first established
stress conditions that significantly inhibit growth, but do not lead to wilting or plant death.
Based on such a treatment it is possible to either ameliorate or exacerbate the effect of the
stress by additional perturbations. Therefore, we first determined the dose-response of
shoot and leaf growth to different mannitol concentrations used to vary the water
potentials in the medium. For this Arabidopsis thaliana seedlings were germinated and
grown in vitro on medium supplemented with concentrations of mannitol between 0 and
100 mM for 22 DAS (days after stratification) when the first leaf pair has reached maturity
(Beemster et al., 2005). By measuring the projected leaf area, we found that increasing
mannitol concentrations progressively reduce rosette area, reaching an approximate 80%
reduction at 100 mM (Supplemental Figure 1A). The effect of mannitol on the mature leaf
blade area of the first leaf pair closely reflected the response of the rosette area
(Supplemental Figure 1B). Moreover, the response was comparable between three
ecotypes (Supplemental Figures 1A and B), indicating that the effect is relatively
independent of the global genetic background.
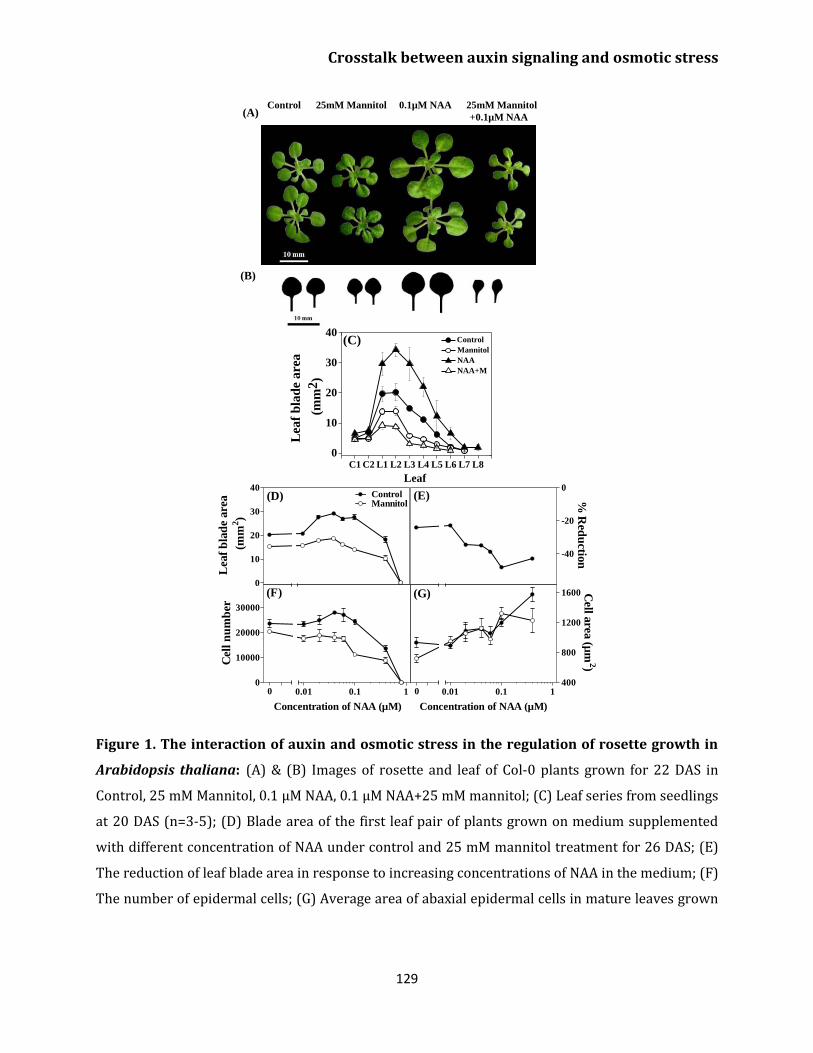
Crosstalk between auxin signaling and osmotic stress
129
Figure 1. The interaction of auxin and osmotic stress in the regulation of rosette growth in
Arabidopsis thaliana: (A) & (B) Images of rosette and leaf of Col-0 plants grown for 22 DAS in
Control, 25 mM Mannitol, 0.1 µM NAA, 0.1 µM NAA+25 mM mannitol; (C) Leaf series from seedlings
at 20 DAS (n=3-5); (D) Blade area of the first leaf pair of plants grown on medium supplemented
with different concentration of NAA under control and 25 mM mannitol treatment for 26 DAS; (E)
The reduction of leaf blade area in response to increasing concentrations of NAA in the medium; (F)
The number of epidermal cells; (G) Average area of abaxial epidermal cells in mature leaves grown
Control 25mM Mannitol 0.1µM NAA 25mM Mannitol
+0.1µM NAA
(B)
(A)
C1 C2 L1 L2 L3 L4 L5 L6 L7 L8
0
10
20
30
40
Lea
f b
lad
e are
a
(mm
2)
Leaf
Control
Mannitol
NAA
NAA+M
(C)
0
10
20
30
40ControlMannitol
(D)
Lea
f b
lad
e are
a
(m
m2)
-40
-20
0(E) %
Red
uctio
n
0
10000
20000
30000
0.01 0.1 1
(F)
0
Concentration of NAA (µM)
Cel
l n
um
ber
400
800
1200
1600
0.01 0.1 1
Concentration of NAA (µM)
(G)
0
Cell a
rea (µ
m2)
Crosstalk between auxin signaling and osmotic stress
130
on increasing concentrations of NAA in presence or absence of 25 mM mannitol. Symbols denote
averages and error bars represent standard error (n=20-80 for leaf area and 3 for cellular analysis).
To study the effect of increasing auxin levels in the leaf, we added the synthetic auxin NAA
(α-Naphthalene acetic acid) to the growth medium. Low concentrations of NAA increased
leaf area to a maximum of approximately 37% at 0.1 μM NAA, whereas concentrations
above 0.1 μM had a negative effect (Figure 1D), and 1 μM completely inhibited the growth
of the leaves. These results show that whereas mannitol inhibits leaf growth, low
concentrations of NAA can increase it. This led to the question whether NAA addition could
overcome the effect of the low water potential of the medium.
To investigate this, we studied the interaction of auxin and osmotic stress on leaf growth by
determining the effect of 25 mM mannitol (because it gives a clear, but relatively mild
response), with different concentrations of NAA. Surprisingly, in addition to reducing leaf
size in absence of NAA, mannitol almost completely inhibited the stimulating effect of low
doses of NAA and increased the effect of supra-optimal doses (Figure 1D). As a
consequence, under increasing concentrations of NAA, the growth inhibitory effect of
mannitol progressively increased, roughly doubling the reduction in leaf size at a
concentration of 0.1 μM (Figure 1E). Thus by adding concentrations of up to 0.1 μM NAA,
we stimulate leaf growth on control medium, but at the same time increase the sensitivity
to low water potentials. This response was reproducible in three different ecotypes
(Supplemental Figure 1C and D) and occurred at the whole rosette scale (Figure 1A) and
individual leaf level (Figure 1B). More detailed analysis of the impact of the treatments on
the individual leaf positions showed that mannitol alone had little or no effect on the
number of leaves in the rosette but reduced their sizes at all positions. In contrast, 0.1 μM
NAA increased both their number and size, whereas in combination with mannitol it
reduced both number and size at all positions (Figure 1C).
Crosstalk between auxin signaling and osmotic stress
131
Cellular basis of the leaf growth response to NAA and mannitol
Leaf area is determined by the number of cells produced by cell division and their size,
established by cell expansion (Gonzalez et al., 2012). To investigate the cellular basis of the
crosstalk between auxin and water stress, we measured the number of cells and their size
in mature leaves grown on different concentrations of NAA in presence or absence of 25
mM mannitol. Interestingly, both processes showed a different response. The cell number
responded in a similar fashion as the whole leaf area: NAA increased the number of cells up
to the concentration of 0.1 μM NAA, while higher concentrations reduced it. Mannitol
reduced cell number and prevented the increase in cell number at low auxin
concentrations (Figure 1F). In contrast, cell size increased progressively with increasing
NAA concentrations up to 0.4 μM (Figure 1G). Curiously, mannitol had no effect on cell size
in the presence of growth stimulating concentrations of NAA, but reduced cell size in
absence of NAA as well as in combination with the supra-optimal NAA concentration of 0.4
μM (Figure 1G). These results show that repressed cell division and expansion is
responsible for the growth inhibition by mannitol, whereas auxin differentially affects cell
division and cell expansion depending on its concentration. Moreover, the increased
sensitivity to mannitol in the presence of NAA can be attributed to enhanced sensitivity of
cell division.
Kinematic analysis of leaf growth
To study the effect of mannitol and auxin on cell division and expansion during leaf growth
in more detail, we performed a kinematic analysis (De Veylder et al., 2001). To this end, we
focused on leaves 1 and 2 of plants grown on control medium and medium supplemented
with 25 mM mannitol, 0.1 µM NAA, or the combination of the two. Leaves were harvested
daily from 8 to 29 days after stratification, allowing for measurements of leaf blade area,
size of abaxial epidermal cells, number of these cells per leaf, stomatal index and the rates
of division and expansion. Leaf blade area increased exponentially until around 13 DAS,
after which the expansion rate started to decrease gradually until maturity, which was
reached about 25 DAS in all the treatments (Figure 2A). The growth reduction due to
Crosstalk between auxin signaling and osmotic stress
132
osmotic stress in comparison to the control was clearly observed from 11 DAS onwards,
whereas increased growth induced by NAA was observed from around 15 DAS (Figure 2A).
The combined treatment of NAA and mannitol reduced leaf size from the beginning of the
observations. This reduction was partially compensated by faster growth towards the end
of the growth period around 20 DAS (Figure 2A). Consistent with the reduced
developmental rate of the shoot as a whole (Figure 1C), this pattern suggests that the
development of leaves in this treatment was delayed. The calculated relative rates of leaf
expansion (RLER), a measure for average cell growth rates across the blade, indicate that
growth inhibition in mannitol treated leaves occurred between 9 and 12 DAS (Figure 2B).
The growth stimulation of NAA around 15 DAS was barely visible, illustrating that a very
small change in growth rate over a number of days can lead to significant effects on whole
leaf size. Similar to the effect of mannitol alone, the combination of NAA and mannitol
reduced the RLER until 12 DAS. However, the effect was stronger, demonstrating the
increased sensitivity to drought in the presence of NAA during this period. The increased
duration of leaf expansion in response to the combination of NAA and mannitol was
conspicuous around 20 DAS (Figure 2B).
At the cellular level, mature cell size was increased by 0.1 µM NAA and reduced by 25 mM
mannitol, whereas mannitol had no effect on cell size in the presence of NAA (Figures 1G
and 2E). The increased cell size in NAA treated leaves is not present in very young leaves,
but developed from around 16 DAS. Cells in mannitol grown leaves were also initially of
similar size as the control leaves, but started to grow slower from around 15 DAS. The cell
area of leaves treated with NAA and mannitol was smaller than control leaves from the
beginning of the observations, reflecting the developmental delay of the leaves, but due to
prolonged expansion they reach a mature size that is identical to that of the controls
(Figure 2E).
0.1 µM NAA caused an increase in the number of cells in mature leaves by 12% (p = 0.029;
Figures 1F and 2C), which can be attributed to a small increase in division rates between 8
and 9 DAS upon NAA treatment (Figure 2D). 25 mM mannitol reduced the number of cells
in mature leaves by 14% (p = 0.005; Figures 1F and 2C), which was related to an inhibition
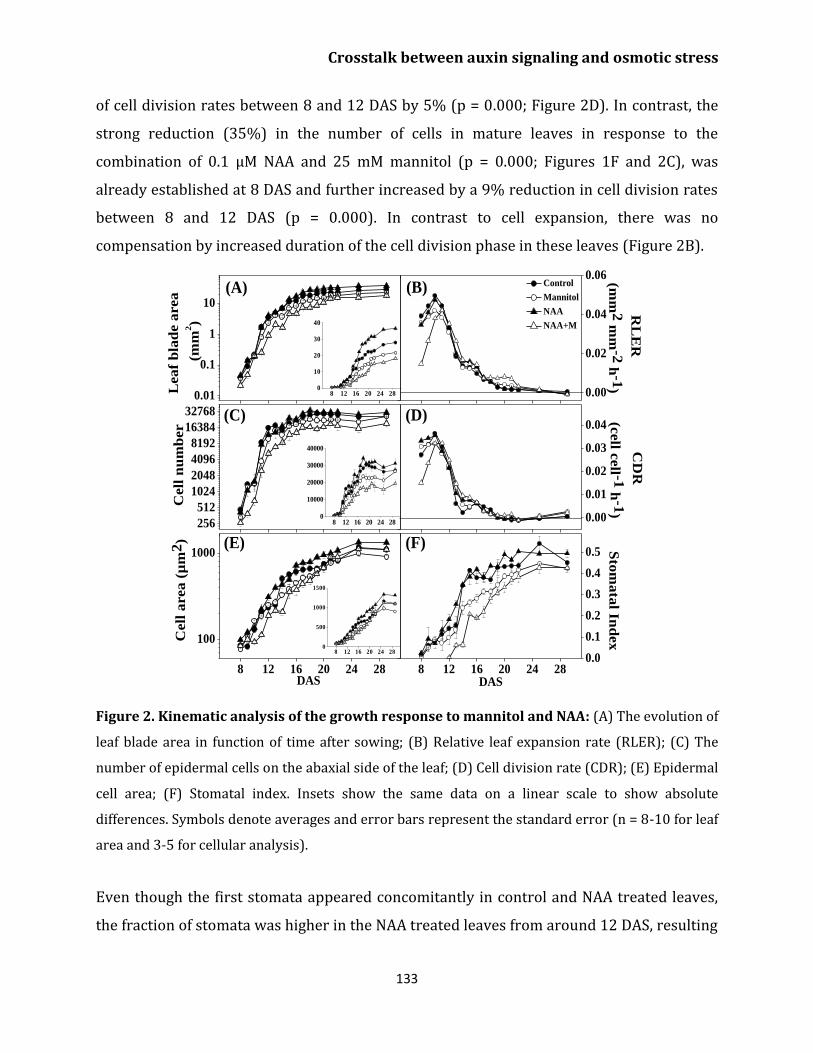
Crosstalk between auxin signaling and osmotic stress
133
of cell division rates between 8 and 12 DAS by 5% (p = 0.000; Figure 2D). In contrast, the
strong reduction (35%) in the number of cells in mature leaves in response to the
combination of 0.1 µM NAA and 25 mM mannitol (p = 0.000; Figures 1F and 2C), was
already established at 8 DAS and further increased by a 9% reduction in cell division rates
between 8 and 12 DAS (p = 0.000). In contrast to cell expansion, there was no
compensation by increased duration of the cell division phase in these leaves (Figure 2B).
Figure 2. Kinematic analysis of the growth response to mannitol and NAA: (A) The evolution of
leaf blade area in function of time after sowing; (B) Relative leaf expansion rate (RLER); (C) The
number of epidermal cells on the abaxial side of the leaf; (D) Cell division rate (CDR); (E) Epidermal
cell area; (F) Stomatal index. Insets show the same data on a linear scale to show absolute
differences. Symbols denote averages and error bars represent the standard error (n = 8-10 for leaf
area and 3-5 for cellular analysis).
Even though the first stomata appeared concomitantly in control and NAA treated leaves,
the fraction of stomata was higher in the NAA treated leaves from around 12 DAS, resulting
0.01
0.1
1
10
256
512
1024
2048
4096
8192
16384
32768
8 12 16 20 24 28
100
1000
8 12 16 20 24 28
RL
ER
(mm
2 m
m-2
h-1
)
Control
Mannitol
NAA
NAA+M
0.00
0.02
0.04
0.06
Lea
f b
lad
e a
rea
(mm
2)
Cell
nu
mb
er
CD
R
(cell c
ell -1
h-1
)
0.00
0.01
0.02
0.03
0.04
(F)(E)
(D)(C)
(B)
Cell
area (
µm
2)
(A)
DAS
Sto
mata
l Ind
ex
DAS
0.0
0.1
0.2
0.3
0.4
0.5
8 12 16 20 24 280
500
1000
1500
8 12 16 20 24 280
10000
20000
30000
40000
8 12 16 20 24 280
10
20
30
40
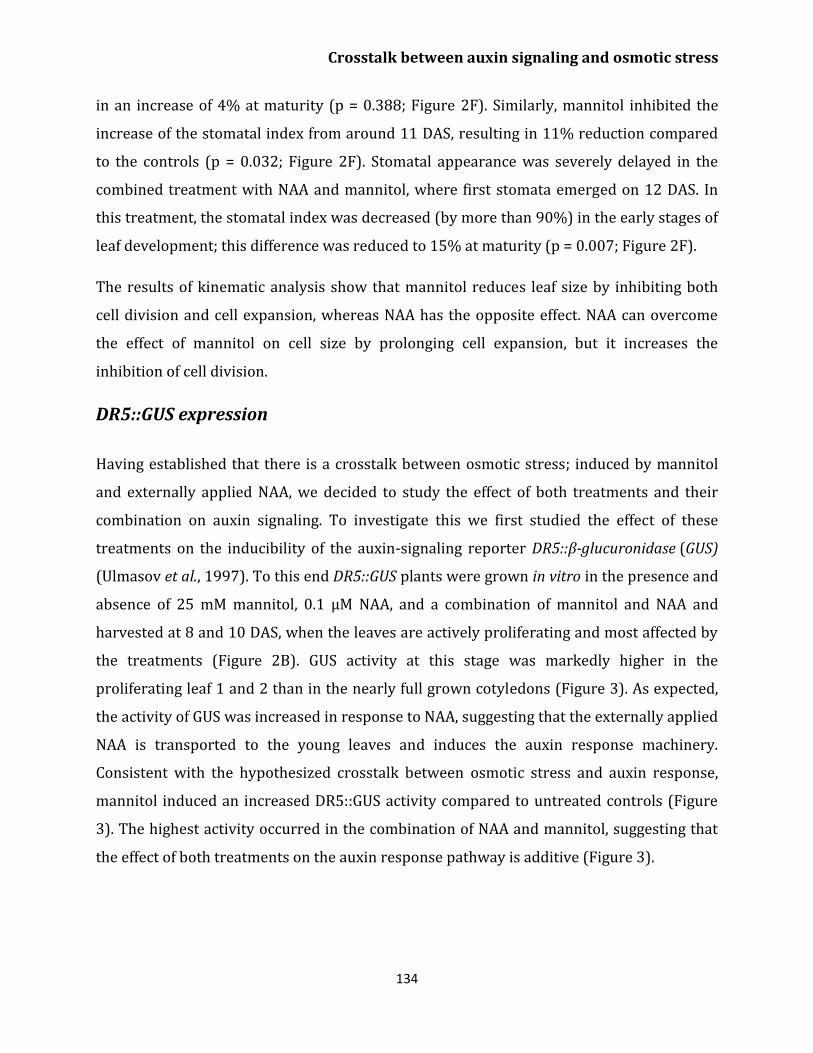
Crosstalk between auxin signaling and osmotic stress
134
in an increase of 4% at maturity (p = 0.388; Figure 2F). Similarly, mannitol inhibited the
increase of the stomatal index from around 11 DAS, resulting in 11% reduction compared
to the controls (p = 0.032; Figure 2F). Stomatal appearance was severely delayed in the
combined treatment with NAA and mannitol, where first stomata emerged on 12 DAS. In
this treatment, the stomatal index was decreased (by more than 90%) in the early stages of
leaf development; this difference was reduced to 15% at maturity (p = 0.007; Figure 2F).
The results of kinematic analysis show that mannitol reduces leaf size by inhibiting both
cell division and cell expansion, whereas NAA has the opposite effect. NAA can overcome
the effect of mannitol on cell size by prolonging cell expansion, but it increases the
inhibition of cell division.
DR5::GUS expression
Having established that there is a crosstalk between osmotic stress; induced by mannitol
and externally applied NAA, we decided to study the effect of both treatments and their
combination on auxin signaling. To investigate this we first studied the effect of these
treatments on the inducibility of the auxin-signaling reporter DR5::β-glucuronidase (GUS)
(Ulmasov et al., 1997). To this end DR5::GUS plants were grown in vitro in the presence and
absence of 25 mM mannitol, 0.1 µM NAA, and a combination of mannitol and NAA and
harvested at 8 and 10 DAS, when the leaves are actively proliferating and most affected by
the treatments (Figure 2B). GUS activity at this stage was markedly higher in the
proliferating leaf 1 and 2 than in the nearly full grown cotyledons (Figure 3). As expected,
the activity of GUS was increased in response to NAA, suggesting that the externally applied
NAA is transported to the young leaves and induces the auxin response machinery.
Consistent with the hypothesized crosstalk between osmotic stress and auxin response,
mannitol induced an increased DR5::GUS activity compared to untreated controls (Figure
3). The highest activity occurred in the combination of NAA and mannitol, suggesting that
the effect of both treatments on the auxin response pathway is additive (Figure 3).
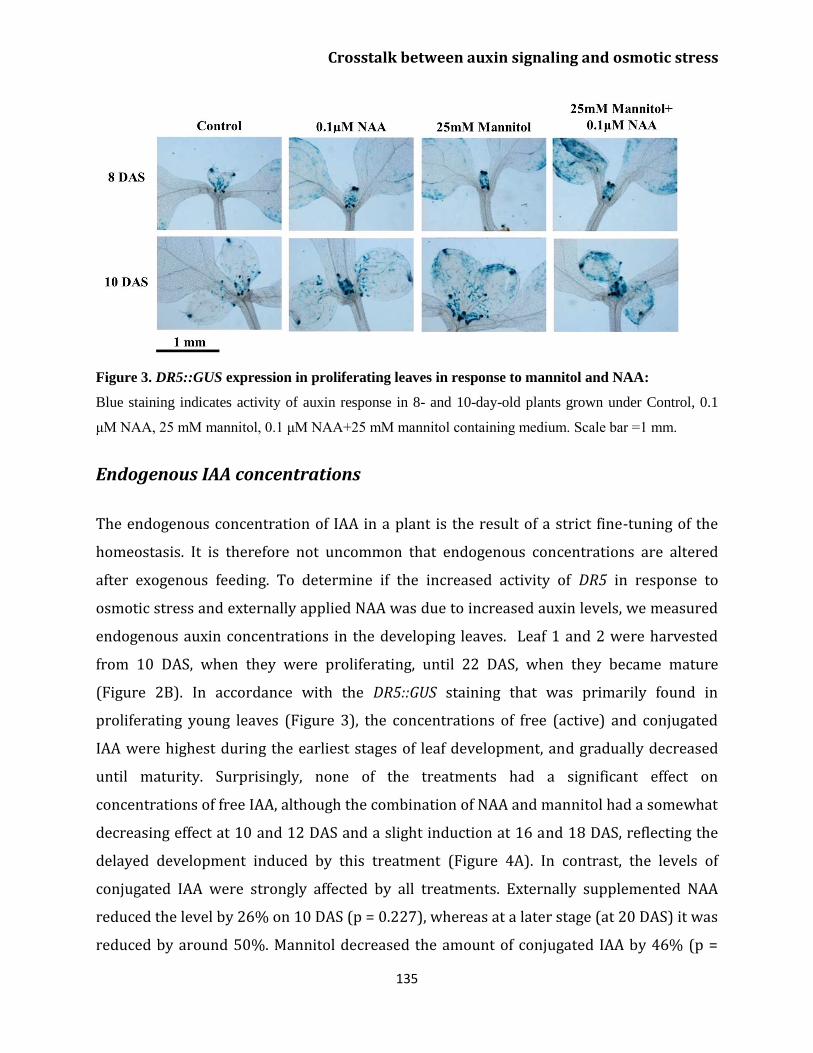
Crosstalk between auxin signaling and osmotic stress
135
Figure 3. DR5::GUS expression in proliferating leaves in response to mannitol and NAA:
Blue staining indicates activity of auxin response in 8- and 10-day-old plants grown under Control, 0.1
μM NAA, 25 mM mannitol, 0.1 μM NAA+25 mM mannitol containing medium. Scale bar =1 mm.
Endogenous IAA concentrations
The endogenous concentration of IAA in a plant is the result of a strict fine-tuning of the
homeostasis. It is therefore not uncommon that endogenous concentrations are altered
after exogenous feeding. To determine if the increased activity of DR5 in response to
osmotic stress and externally applied NAA was due to increased auxin levels, we measured
endogenous auxin concentrations in the developing leaves. Leaf 1 and 2 were harvested
from 10 DAS, when they were proliferating, until 22 DAS, when they became mature
(Figure 2B). In accordance with the DR5::GUS staining that was primarily found in
proliferating young leaves (Figure 3), the concentrations of free (active) and conjugated
IAA were highest during the earliest stages of leaf development, and gradually decreased
until maturity. Surprisingly, none of the treatments had a significant effect on
concentrations of free IAA, although the combination of NAA and mannitol had a somewhat
decreasing effect at 10 and 12 DAS and a slight induction at 16 and 18 DAS, reflecting the
delayed development induced by this treatment (Figure 4A). In contrast, the levels of
conjugated IAA were strongly affected by all treatments. Externally supplemented NAA
reduced the level by 26% on 10 DAS (p = 0.227), whereas at a later stage (at 20 DAS) it was
reduced by around 50%. Mannitol decreased the amount of conjugated IAA by 46% (p =
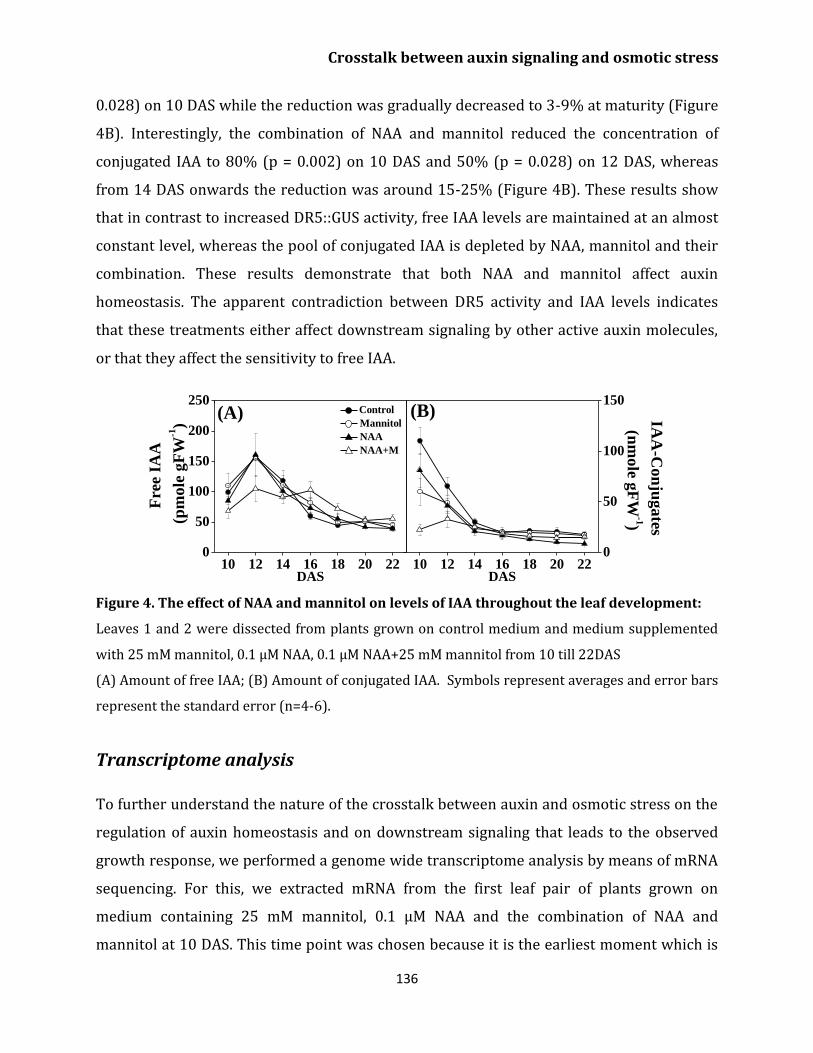
Crosstalk between auxin signaling and osmotic stress
136
0.028) on 10 DAS while the reduction was gradually decreased to 3-9% at maturity (Figure
4B). Interestingly, the combination of NAA and mannitol reduced the concentration of
conjugated IAA to 80% (p = 0.002) on 10 DAS and 50% (p = 0.028) on 12 DAS, whereas
from 14 DAS onwards the reduction was around 15-25% (Figure 4B). These results show
that in contrast to increased DR5::GUS activity, free IAA levels are maintained at an almost
constant level, whereas the pool of conjugated IAA is depleted by NAA, mannitol and their
combination. These results demonstrate that both NAA and mannitol affect auxin
homeostasis. The apparent contradiction between DR5 activity and IAA levels indicates
that these treatments either affect downstream signaling by other active auxin molecules,
or that they affect the sensitivity to free IAA.
Figure 4. The effect of NAA and mannitol on levels of IAA throughout the leaf development:
Leaves 1 and 2 were dissected from plants grown on control medium and medium supplemented
with 25 mM mannitol, 0.1 μM NAA, 0.1 μM NAA+25 mM mannitol from 10 till 22DAS
(A) Amount of free IAA; (B) Amount of conjugated IAA. Symbols represent averages and error bars
represent the standard error (n=4-6).
Transcriptome analysis
To further understand the nature of the crosstalk between auxin and osmotic stress on the
regulation of auxin homeostasis and on downstream signaling that leads to the observed
growth response, we performed a genome wide transcriptome analysis by means of mRNA
sequencing. For this, we extracted mRNA from the first leaf pair of plants grown on
medium containing 25 mM mannitol, 0.1 µM NAA and the combination of NAA and
mannitol at 10 DAS. This time point was chosen because it is the earliest moment which is
10 12 14 16 18 20 220
50
100
150
200
250
10 12 14 16 18 20 22
Fre
e IA
A
(pm
ole
gF
W-1)
DAS
Control
Mannitol
NAA
NAA+M
(A) IAA
-Co
nju
ga
tes
(nm
ole g
FW
-1)
DAS
(B)
0
50
100
150
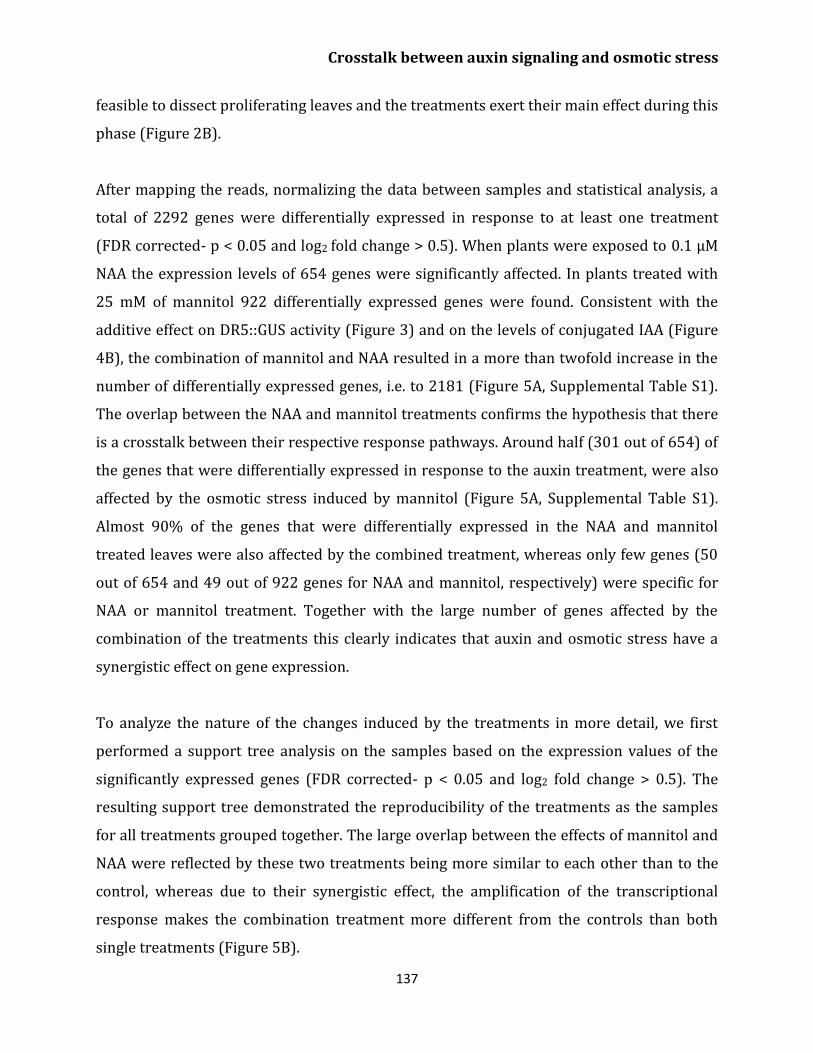
Crosstalk between auxin signaling and osmotic stress
137
feasible to dissect proliferating leaves and the treatments exert their main effect during this
phase (Figure 2B).
After mapping the reads, normalizing the data between samples and statistical analysis, a
total of 2292 genes were differentially expressed in response to at least one treatment
(FDR corrected- p < 0.05 and log2 fold change > 0.5). When plants were exposed to 0.1 µM
NAA the expression levels of 654 genes were significantly affected. In plants treated with
25 mM of mannitol 922 differentially expressed genes were found. Consistent with the
additive effect on DR5::GUS activity (Figure 3) and on the levels of conjugated IAA (Figure
4B), the combination of mannitol and NAA resulted in a more than twofold increase in the
number of differentially expressed genes, i.e. to 2181 (Figure 5A, Supplemental Table S1).
The overlap between the NAA and mannitol treatments confirms the hypothesis that there
is a crosstalk between their respective response pathways. Around half (301 out of 654) of
the genes that were differentially expressed in response to the auxin treatment, were also
affected by the osmotic stress induced by mannitol (Figure 5A, Supplemental Table S1).
Almost 90% of the genes that were differentially expressed in the NAA and mannitol
treated leaves were also affected by the combined treatment, whereas only few genes (50
out of 654 and 49 out of 922 genes for NAA and mannitol, respectively) were specific for
NAA or mannitol treatment. Together with the large number of genes affected by the
combination of the treatments this clearly indicates that auxin and osmotic stress have a
synergistic effect on gene expression.
To analyze the nature of the changes induced by the treatments in more detail, we first
performed a support tree analysis on the samples based on the expression values of the
significantly expressed genes (FDR corrected- p < 0.05 and log2 fold change > 0.5). The
resulting support tree demonstrated the reproducibility of the treatments as the samples
for all treatments grouped together. The large overlap between the effects of mannitol and
NAA were reflected by these two treatments being more similar to each other than to the
control, whereas due to their synergistic effect, the amplification of the transcriptional
response makes the combination treatment more different from the controls than both
single treatments (Figure 5B).
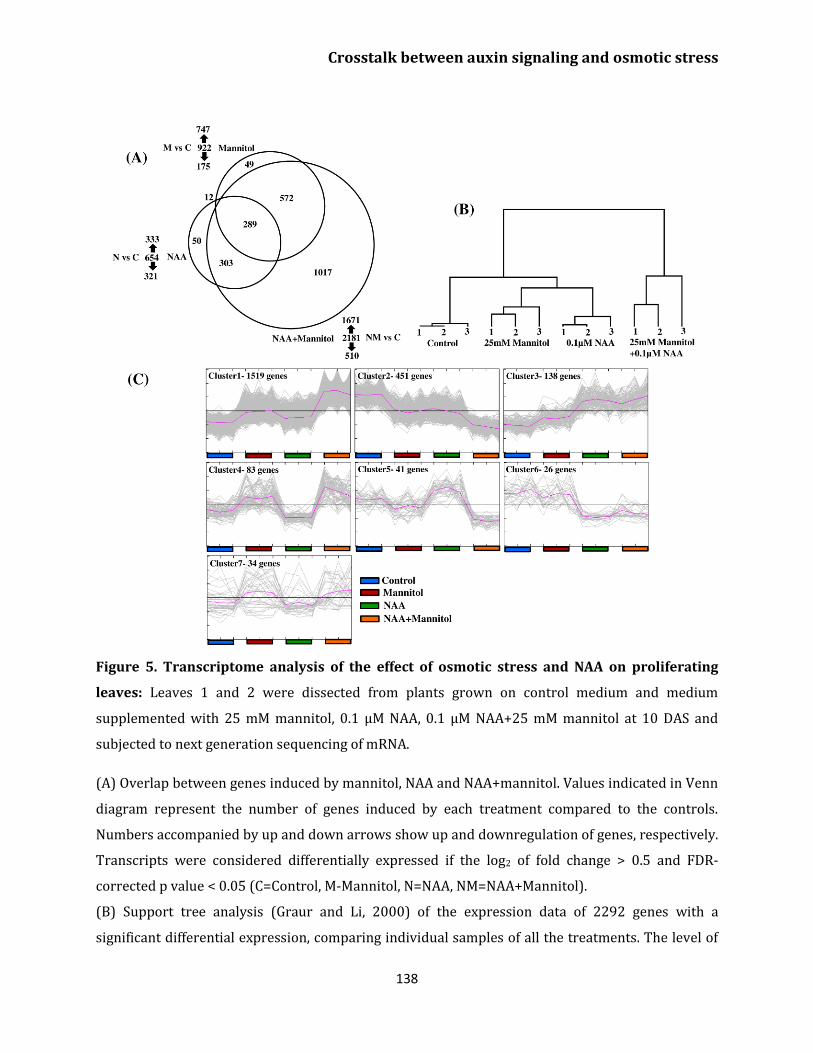
Crosstalk between auxin signaling and osmotic stress
138
Figure 5. Transcriptome analysis of the effect of osmotic stress and NAA on proliferating
leaves: Leaves 1 and 2 were dissected from plants grown on control medium and medium
supplemented with 25 mM mannitol, 0.1 μM NAA, 0.1 μM NAA+25 mM mannitol at 10 DAS and
subjected to next generation sequencing of mRNA.
(A) Overlap between genes induced by mannitol, NAA and NAA+mannitol. Values indicated in Venn
diagram represent the number of genes induced by each treatment compared to the controls.
Numbers accompanied by up and down arrows show up and downregulation of genes, respectively.
Transcripts were considered differentially expressed if the log2 of fold change > 0.5 and FDR-
corrected p value < 0.05 (C=Control, M-Mannitol, N=NAA, NM=NAA+Mannitol).
(B) Support tree analysis (Graur and Li, 2000) of the expression data of 2292 genes with a
significant differential expression, comparing individual samples of all the treatments. The level of
Crosstalk between auxin signaling and osmotic stress
139
support for each branch of the tree is 90-100%, which indicates the confidence for each branch. The
treatments are indicated below the tree and numbers represent the replicates for each treatment.
(C) Clustering of gene expression profiles by QT-Clust analysis (Heyer et al., 1999) of the expression
profile of 2292 significantly modulated genes (Pearson correlation measure; cluster diameter=0.5,
minimum cluster size= 25). Data are expressed as normalized expression values. Clusters elucidate
the major patterns of the gene dataset of four treatments. Treatments are shown in colored bars
and cluster number and size are indicated.
We next investigated the major expression profiles at the gene level induced by the three
treatments by means of a Quality Threshold (QT) Clustering (Heyer et al., 1999) of all 2292
differentially expressed genes. This resulted in 6 clusters, each containing 26 or more
genes that shared the similar pattern and one cluster (Cluster 7) comprising the remaining
34 genes (Figure 5C). All these clusters share some remarkable characteristics with regards
to the effect of the treatments:
1. NAA, mannitol and their combination affect the expression of all differentially
expressed genes in the same direction.
2. Clusters 1, 4 and 5 represent genes that are more sensitive to the osmotic stress,
whereas clusters 2, 3 and 6 encompass genes that are most sensitive to the auxin
treatment.
3. The effect of the combined treatment is stronger (Clusters 1, 2, 3, 4 and 5, Cluster 6
being an exception) than the individual treatments.
Gene enrichment
To better understand the link between transcriptional changes and the observed growth
phenotypes, we next wanted to know which biological processes are regulated by auxin,
osmotic stress and their combination in proliferating leaves. For this we performed a gene
enrichment analysis using PageMan on the genes that were up or downregulated by each of
the treatments. The results of this analysis have some striking features (Figure 6):
1. Over and underrepresentation were opposite among up and downregulated genes for
most categories.
Crosstalk between auxin signaling and osmotic stress
140
2. Reflecting the amplitude of the effect on the number of differentially expressed genes
(Figure 5A) and gene expression profile (Figure 5C), the combination treatment
induced the largest number of over or under represented classes among both the up
and downregulated genes.
3. Minor changes were observed in NAA treated samples which include
overrepresentation among downregulated genes of transcripts related to major and
minor carbohydrate metabolism, cell wall degradation and modification, cellulose
synthesis, aliphatic and indole glucosinolate synthesis. Moreover, genes related to the
metabolism of auxin and brassinosteroid metabolism were overrepresented in up and
downregulated genes.
4. Biological pathways that were overrepresented among genes upregulated by mannitol
and the combination of NAA and mannitol treatments include glycolysis, mitochondrial
electron transport, hemicellulose and pectin synthesis, tryptophan and indole
glucosinolate synthesis, receptor and MAP kinase signaling and ethylene metabolism.
Pathways that were overrepresented among downregulated genes include
photosynthesis machinery, minor carbohydrate metabolism, cellulose synthesis, cell
wall proteins, cell wall degradation and modification, aliphatic glucosinolates and the
metabolism of auxin, brassinosteroids, ethylene and gibberellins.
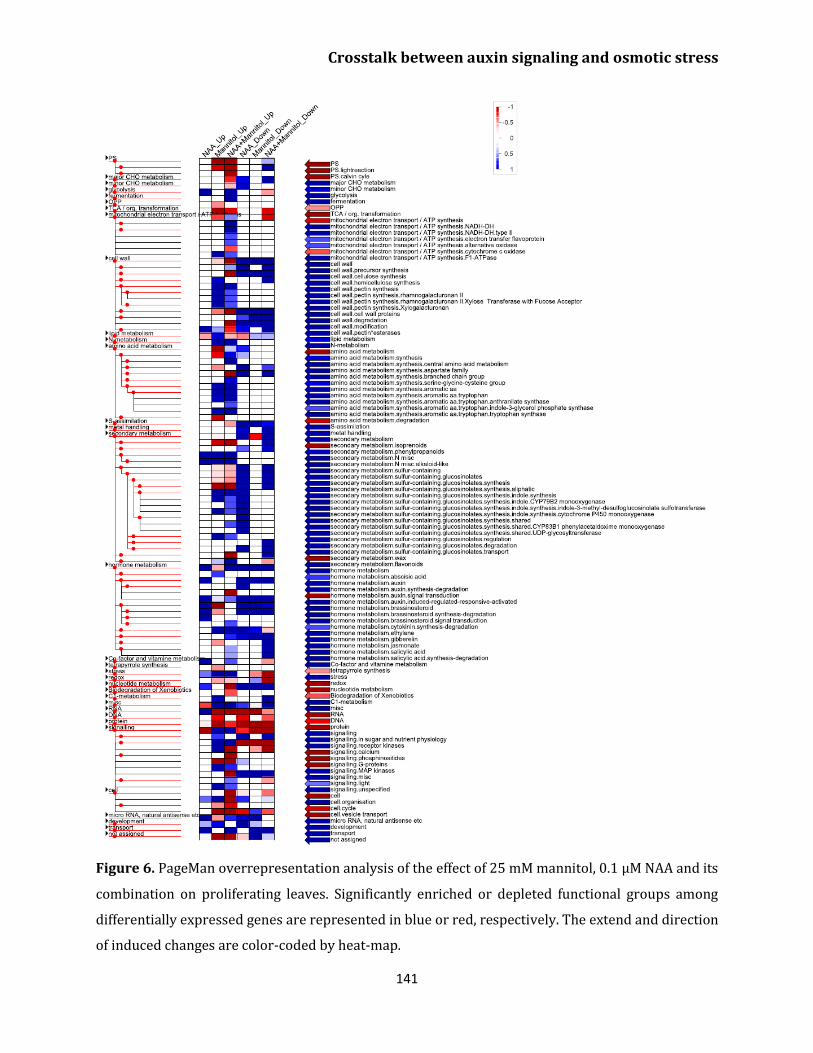
Crosstalk between auxin signaling and osmotic stress
141
Figure 6. PageMan overrepresentation analysis of the effect of 25 mM mannitol, 0.1 μM NAA and its
combination on proliferating leaves. Significantly enriched or depleted functional groups among
differentially expressed genes are represented in blue or red, respectively. The extend and direction
of induced changes are color-coded by heat-map.
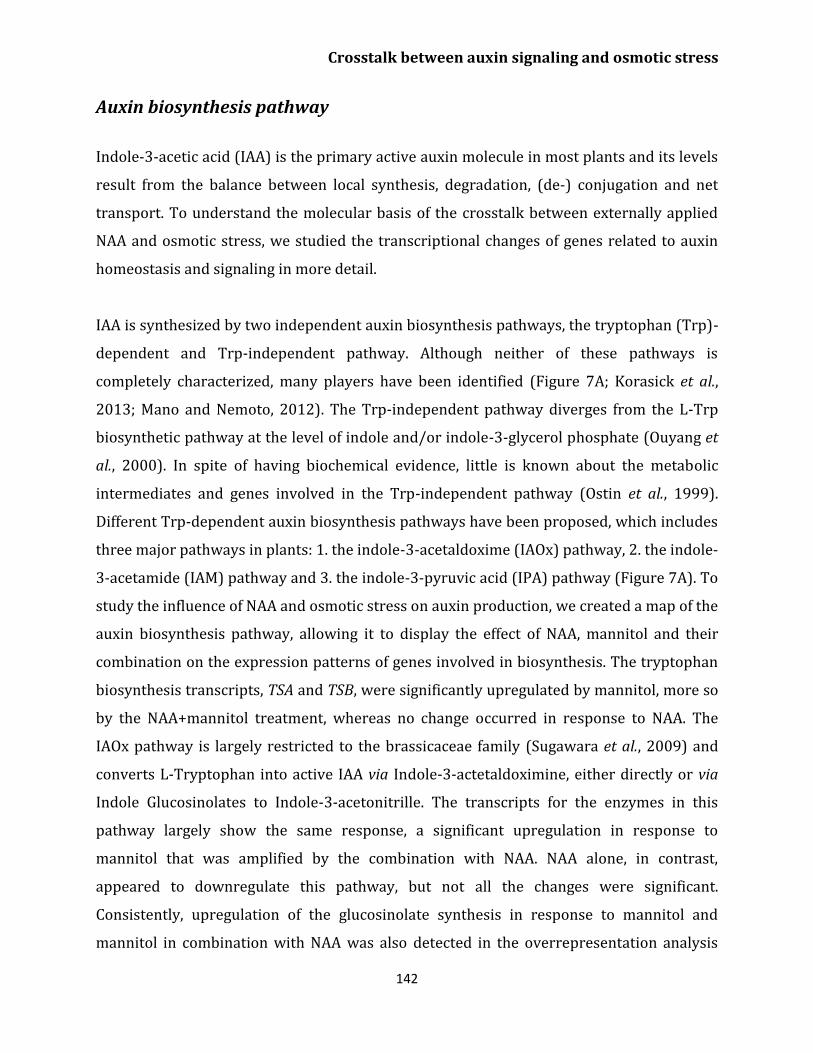
Crosstalk between auxin signaling and osmotic stress
142
Auxin biosynthesis pathway
Indole-3-acetic acid (IAA) is the primary active auxin molecule in most plants and its levels
result from the balance between local synthesis, degradation, (de-) conjugation and net
transport. To understand the molecular basis of the crosstalk between externally applied
NAA and osmotic stress, we studied the transcriptional changes of genes related to auxin
homeostasis and signaling in more detail.
IAA is synthesized by two independent auxin biosynthesis pathways, the tryptophan (Trp)-
dependent and Trp-independent pathway. Although neither of these pathways is
completely characterized, many players have been identified (Figure 7A; Korasick et al.,
2013; Mano and Nemoto, 2012). The Trp-independent pathway diverges from the L-Trp
biosynthetic pathway at the level of indole and/or indole-3-glycerol phosphate (Ouyang et
al., 2000). In spite of having biochemical evidence, little is known about the metabolic
intermediates and genes involved in the Trp-independent pathway (Ostin et al., 1999).
Different Trp-dependent auxin biosynthesis pathways have been proposed, which includes
three major pathways in plants: 1. the indole-3-acetaldoxime (IAOx) pathway, 2. the indole-
3-acetamide (IAM) pathway and 3. the indole-3-pyruvic acid (IPA) pathway (Figure 7A). To
study the influence of NAA and osmotic stress on auxin production, we created a map of the
auxin biosynthesis pathway, allowing it to display the effect of NAA, mannitol and their
combination on the expression patterns of genes involved in biosynthesis. The tryptophan
biosynthesis transcripts, TSA and TSB, were significantly upregulated by mannitol, more so
by the NAA+mannitol treatment, whereas no change occurred in response to NAA. The
IAOx pathway is largely restricted to the brassicaceae family (Sugawara et al., 2009) and
converts L-Tryptophan into active IAA via Indole-3-actetaldoximine, either directly or via
Indole Glucosinolates to Indole-3-acetonitrille. The transcripts for the enzymes in this
pathway largely show the same response, a significant upregulation in response to
mannitol that was amplified by the combination with NAA. NAA alone, in contrast,
appeared to downregulate this pathway, but not all the changes were significant.
Consistently, upregulation of the glucosinolate synthesis in response to mannitol and
mannitol in combination with NAA was also detected in the overrepresentation analysis
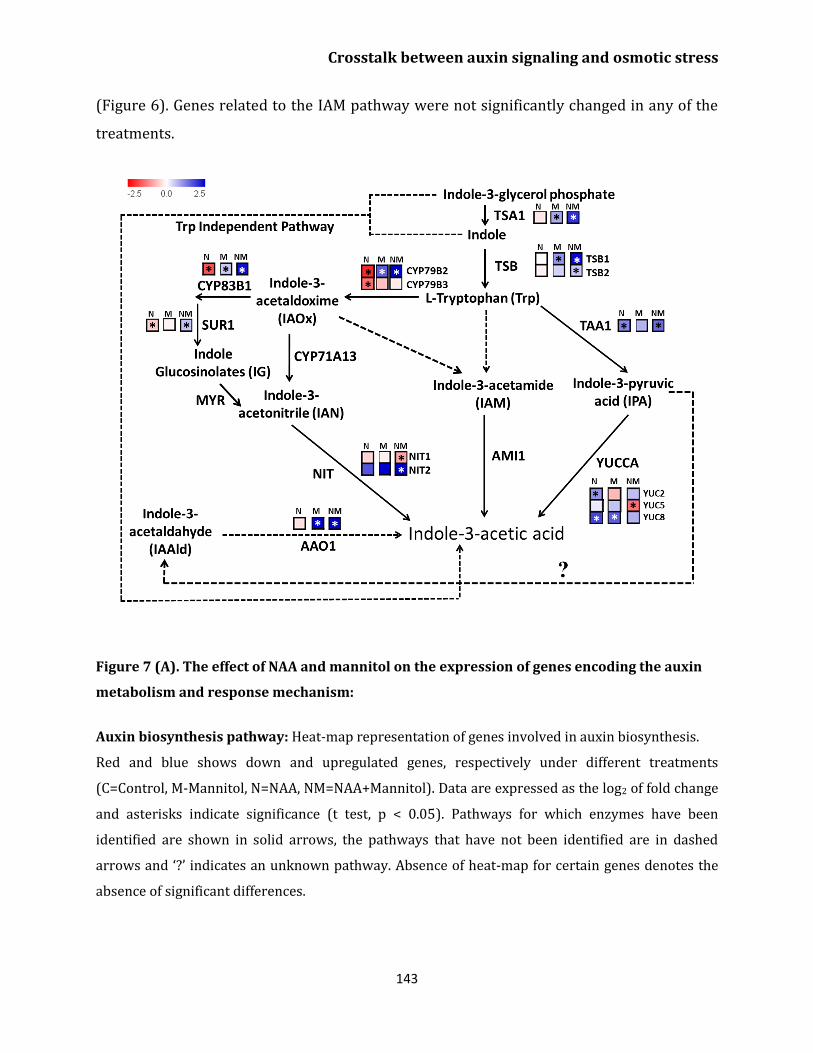
Crosstalk between auxin signaling and osmotic stress
143
(Figure 6). Genes related to the IAM pathway were not significantly changed in any of the
treatments.
Figure 7 (A). The effect of NAA and mannitol on the expression of genes encoding the auxin
metabolism and response mechanism:
Auxin biosynthesis pathway: Heat-map representation of genes involved in auxin biosynthesis.
Red and blue shows down and upregulated genes, respectively under different treatments
(C=Control, M-Mannitol, N=NAA, NM=NAA+Mannitol). Data are expressed as the log2 of fold change
and asterisks indicate significance (t test, p < 0.05). Pathways for which enzymes have been
identified are shown in solid arrows, the pathways that have not been identified are in dashed
arrows and ‘?’ indicates an unknown pathway. Absence of heat-map for certain genes denotes the
absence of significant differences.
Crosstalk between auxin signaling and osmotic stress
144
The expression of TAA1, the gene responsible for the first step in the IPA pathway, was
significantly increased by both NAA and the combination of NAA and mannitol. The second
step in this pathway is mediated by the family of YUCCA genes, of which three were found
to be significantly changed. The expression changes of these three genes were quite
different; YUC2 was upregulated in response to NAA and YUC5 was downregulated in
response to the combination of NAA and mannitol, whereas YUC8 was upregulated in NAA
and mannitol treatment.
Another pathway from IPA to IAA was suggested to run via indole-3-acetaldehyde (IAAld)
by ARABIDOPSIS ALDEHYDE OXIDASE1 (AAO1) (Mashiguchi et al., 2011; Sekimoto et al.,
1998; Woodward and Bartel, 2005). Our results showed significant upregulation of AAO1
by mannitol alone and in combination with NAA, whereas no change occurred in response
to NAA (Figure 7A).
Overall this pathway analysis shows a pronounced difference in the effect of NAA and
osmotic stress. Osmotic stress upregulates almost all IAA biosynthetic pathways; whereas
NAA inhibits the IAN pathway while activating the IPA pathway, so that the net effect is not
clear. It is interesting to note that the effect of NAA generally enhances the effect of
mannitol even in the case that the single treatments have opposite effects.
Auxin conjugation and degradation
The active free IAA is only a small fraction of the total auxin pool in the plant, as most IAA is
present in the form of a multitude of conjugates, which was confirmed by our studies
(Figure 4A and B). The conversion between the two forms is regulated by enzymatic
reactions and many of the genes encoding the related enzymes have been identified. Auxin
conjugates play a major role in storage, transport and compartmentalization and can
provide free IAA upon hydrolysis or β-oxidation (Cohen and Bandurski, 1982). We
summarized current knowledge regarding auxin conjugation in a pathway map (Figure
7B). IAA conjugation occurs in three ways: amide-linked to amino acids, ester-linked to
Crosstalk between auxin signaling and osmotic stress
145
sugars, and amide-linked to peptides and proteins (Ludwig-Muller, 2011; Woodward and
Bartel, 2005).
Figure 7 (B). The auxin conjugation pathway: Heat-map representation of genes involved in
auxin conjugation. Red and blue shows down and upregulated genes, respectively under different
treatments (C=Control, M-Mannitol, N=NAA, NM=NAA+Mannitol). Data are expressed as the log2 of
fold change and asterisks indicate significance (t test, p < 0.05). Pathways for which enzymes have
been identified are shown in solid arrows and the pathways that have not been identified are in
dashed arrows. Absence of heat-map for genes denotes the absence of significant differences.
Group II of the GRETCHEN HAGEN3 (GH3) family of acyl amido synthetases plays an
important role in conjugating IAA to amino acids (Westfall et al., 2010). Curiously, two of
its isozymes respond in opposite ways to NAA, mannitol and their combination, so it is
unclear what the net effect would be. Inversely, various enzymes such as ILR1, ILR1-LIKE1
(ILL1), ILL2, ILL3, ILL5, and IAR3 hydrolyze amino acid conjugates back to free IAA. Three
Crosstalk between auxin signaling and osmotic stress
146
of the genes encoding these enzymes were significantly changed in our studies. IAR3 and
ILL2, which convert IAA-alanine into free IAA (Bitto et al., 2009; Korasick et al., 2013) are
upregulated by mannitol, NAA and to a larger extend by their combination, providing an
explanation for the reduced pool of conjugated auxin (Figure 4B). No significant change
was found in ILR1, an amidohydrolase that releases active IAA from IAA-leucine (Bartel
and Fink, 1995). Whereas, the expression of ILR2 that is essential to modulate metal
transport and auxin conjugate metabolism (Magidin et al., 2003), was downregulated in all
treatments. Other amino acid conjugates, IAA-aspartate and glutamate form intermediates
in the IAA degradation pathway and IAA-tryptophan is important for inhibition of auxin
action (Korasick et al., 2013; Ludwig-Muller, 2011). GH3.5 is the only transcript for these
reactions that was significantly changed in our transcriptome data, being upregulated by
NAA (albeit not significantly) and osmotic stress and more so by the combination,
suggesting increased rates of IAA degradation.
IAA-sugar conjugates are responsible for auxin storage and IAA inactivation. UGT84B1 and
UGT74D1 convert IAA into IAA-sugar conjugate while UGT74D1 inactivates IAA by its
oxidization to 2-oxindole-3-acetic acid (OxIAA) (Tanaka et al., 2014). Finally, IAA can also
be conjugated to its methyl ester form by IAMT1 in Arabidopsis thaliana (Qin et al., 2005).
Curiously, none of these genes were significantly changed in our transcriptome data in any
of the treatments.
In addition to IAA-amino acid and sugar conjugates, IAA-peptide conjugates have also been
identified but the enzymes that form and hydrolyse IAA-peptides is still under investigation
(Ludwig-Muller, 2011; Seidel et al., 2006).
Indole-3-butyric acid (IBA) is a second auxin molecule in plants that may have auxin
activity by itself (Ludwig-Muller, 2000), or by conversion into free IAA upon β-oxidation by
peroxisomal enzymes like IBR1, IBR3, IBR10 and ECH2 (Strader et al., 2010; Strader et al.,
2011). Out of all these genes only IBR3 was significantly altered in our studies. The levels of
IBR3 were upregulated by all three treatments, albeit not significantly by NAA, and most
strongly by the combination of NAA and mannitol, suggesting an increase conversion
Crosstalk between auxin signaling and osmotic stress
147
towards IAA. IBA also gets converted to an alanine conjugate by GH3 and deconjugated by
wheat hydrolase TaIAR3 (Campanella et al., 2004). The TaIAR3 protein has high specificity
for the hydrolysis of indole-3-butyric acid conjugates with alanine, unlike its orthologue
Arabidopsis IAR3, which has affinity for IAA-alanine. UGT74D1 and UGT74E2 encoding UDP
glucosyltransferase activity, convert IBA to the inactive IBA-glucose conjugate (Jin et al.,
2013; Ross et al., 2001). UGT74E2 was upregulated by all treatments, but only significantly
in response to osmotic stress in the presence of NAA.
In conclusion, the expression of genes related to auxin conjugation indicates that NAA,
mannitol and the combination of NAA and mannitol stimulate both auxin deconjugation
and degradation, which can be reconciled with the depletion of conjugated IAA and
relatively stable free IAA contents (Figure 4).
Auxin transport
The spatial distribution of auxin across tissues and presumably between organs is directed
by the activity of auxin influx and efflux transporters (Petrasek and Friml, 2009;
Zazimalova et al., 2010) (Figure 7C). The expression of the auxin influx carrier AUX1
(Swarup et al., 2001) was enhanced only in the NAA treatment. The expression of two
members of the LAX family (LIKE AUX1) LAX2 and LAX3, (Peret et al., 2012; Swarup et al.,
2008), was slightly, but not significantly upregulated by NAA and mannitol. Curiously, the
combination of the two treatments significantly downregulated LAX2, while the expression
of LAX3 was induced. On the other hand, expression of auxin efflux protein PIN7 (PIN-
FORMED) (Friml et al., 2003) was enhanced only under osmotic stress whereas NAA and
the combination of both had no significant effect. Curiously, the expression of the other
seven PIN genes (Krecek et al., 2009) was not altered significantly by any of the treatments
(Figure 7C). The expression of AXR4 that encodes for a protein that is essential for the polar
trafficking of auxin influx protein AUX1 to the plasma membrane (Dharmasiri et al., 2006),
increased under mannitol and in combination of NAA and mannitol, whereas a small, but
no significant change in the same direction was found after NAA treatment.

Crosstalk between auxin signaling and osmotic stress
148
Taken together, these results suggest that NAA and osmotic stress enhance both auxin in-
and efflux.
Figure 7 (C). The auxin transport and signaling pathway: Heat-map representation of genes
involved in auxin signaling. Red and blue shows down and upregulated genes, respectively under
different treatments (C=Control, M-Mannitol, N=NAA, NM=NAA+Mannitol). Data are expressed as
the log2 of fold change and asterisks indicate significance (t test, p < 0.05). Absence of heat-map for
genes denotes the absence of significant differences.
Auxin signaling
Over the last decades, auxin perception and gene regulation has been extensively
characterized. We incorporated this knowledge into the pathway map of auxin signaling
(Figure 7C). The SCFTIR1 ubiquitin ligase complex is the central regulator of auxin signaling,
which mediates the proteolytic degradation of the Aux/IAA family of transcriptional
regulators (Chapman and Estelle, 2009; Hayashi, 2012). In the presence of low auxin,
Aux/IAA (AUXIN/INDOLE-3-ACETIC ACID) proteins form dimers with ARF (AUXIN
RESPONSE FACTOR) transcription factors, inhibiting the transcriptional activation of
Crosstalk between auxin signaling and osmotic stress
149
auxin-responsive genes. At high concentrations, auxin binds to Aux/IAA, which stimulates
ubiquitination by the SCFTIR1 complex targeting it for degradation by the 26S proteasome,
which in turn releases ARF transcription factors, leading to the transcriptional activation of
auxin responsive genes (Woodward and Bartel, 2005). Our transcriptome analysis showed
that the expression of TIR1 was upregulated by NAA, mannitol and their combination. With
the exception of IAA 20, 26 and 29, most IAA genes were downregulated by the three
treatments, which should lower the level of these transcriptional inhibitors and stimulate
ARF activity. In addition, the expressions of significantly affected ARFs, ARF4, ARF6 and
ARF18 were increased in response to NAA, whereas ARF6 was significantly upregulated by
the osmotic stress and NAA and mannitol combination.
Taken together, these results show that both NAA and osmotic stress stimulate auxin-
regulated gene expression at multiple levels, which is consistent with the increased
DR5::GUS activity and the strong overlap between the differentially expressed genes
(Figures 3 and 5A).
Cell cycle regulation
To understand the molecular basis for the changes in cell division, we analyzed the
expression of known cell cycle genes (de Almeida Engler et al., 2009; de Jager et al., 2009;
Vandepoele et al., 2002). Consistent with altered cell division rates playing a crucial role in
the growth response, 18 out of 93 cell cycle genes were significantly affected by at least one
of the treatments (Supplemental Table S2). Despite having opposite effects on cell division,
but similar to the overall gene expression patterns (Figure 5C), NAA, mannitol and their
combination affected the expression of nearly all cell cycle genes in the same direction.
Therefore the net effect on cell division rates must be related to the relative strength of the
effects exerted by these treatments on the various classes of regulators. A notable
exception to this general picture is several B and a D-type cyclins, which are upregulated by
NAA and mannitol, but downregulated by their combination (Supplemental Table S2). This
may explain the strong inhibition of cell division rates by the latter treatment.
Crosstalk between auxin signaling and osmotic stress
150
To get a global picture of how altered cell cycle gene expression relates to the opposite
effects of NAA and mannitol on cell division rates, the number of significantly affected
genes in each class is most instructive:
- The expression of the growth promoting CDK activating cyclin CYCA2;1 (Vanneste et al.,
2011) was strongly reduced by mannitol (and the combination treatment), but was little
affected by NAA.
- The expression of growth promoting CYCB (Doerner et al., 1996) and CYCD family
members (Cockcroft et al., 2000) was more upregulated by NAA than by mannitol.
- The expression of genes CDC27B and CCS52B encoding components of the anaphase
promoting complex (APC) (Blilou et al., 2002; Tarayre et al., 2004) was enhanced under
NAA treatment, whereas no significant change in mannitol and combination of NAA and
mannitol was found.
- ORC2 and MCM5 genes act downstream of CDK and its interactors in the control of DNA
duplication (de Jager et al., 2009). Consistent with the inhibited cell division activity they
were downregulated in mannitol and in the combination treatment.
- E2Fc, a regulator for the balance between cell division and endoreplication (del Pozo et
al., 2006) was upregulated by all treatments, but most strongly in the NAA treatment,
predicting an increased endoreduplication. To test this possibility, we performed
flowcytometry on mature leaves. In complete agreement with the prediction, we found that
NAA, mannitol and the combination of the two enhanced endoreduplication, with NAA
alone exerting the strongest effect (Figure 8).
- CDK-activating kinases CDKD and CDKF were upregulated by all treatments. This is
opposite to what is expected in treatments that inhibit cell division rate and may therefore
represent a compensation mechanism. Inversely, the expression of cell cycle inhibitors
KRP2 and KRP4 (De Veylder et al., 2001) were also upregulated to similar extends in all
treatments, which would induce a counteracting effect.
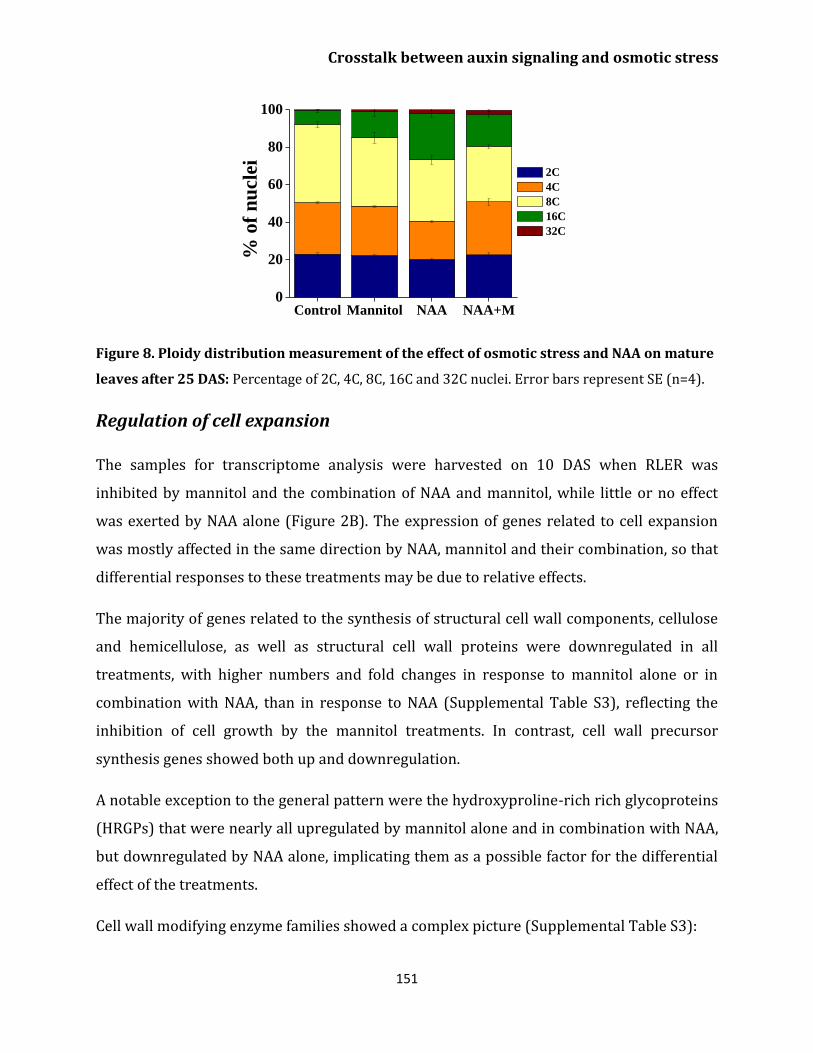
Crosstalk between auxin signaling and osmotic stress
151
Figure 8. Ploidy distribution measurement of the effect of osmotic stress and NAA on mature
leaves after 25 DAS: Percentage of 2C, 4C, 8C, 16C and 32C nuclei. Error bars represent SE (n=4).
Regulation of cell expansion
The samples for transcriptome analysis were harvested on 10 DAS when RLER was
inhibited by mannitol and the combination of NAA and mannitol, while little or no effect
was exerted by NAA alone (Figure 2B). The expression of genes related to cell expansion
was mostly affected in the same direction by NAA, mannitol and their combination, so that
differential responses to these treatments may be due to relative effects.
The majority of genes related to the synthesis of structural cell wall components, cellulose
and hemicellulose, as well as structural cell wall proteins were downregulated in all
treatments, with higher numbers and fold changes in response to mannitol alone or in
combination with NAA, than in response to NAA (Supplemental Table S3), reflecting the
inhibition of cell growth by the mannitol treatments. In contrast, cell wall precursor
synthesis genes showed both up and downregulation.
A notable exception to the general pattern were the hydroxyproline-rich rich glycoproteins
(HRGPs) that were nearly all upregulated by mannitol alone and in combination with NAA,
but downregulated by NAA alone, implicating them as a possible factor for the differential
effect of the treatments.
Cell wall modifying enzyme families showed a complex picture (Supplemental Table S3):
Control Mannitol NAA NAA+M0
20
40
60
80
100
% o
f n
ucl
ei 2C
4C
8C
16C
32C
Crosstalk between auxin signaling and osmotic stress
152
- Transcripts encoding cell wall degrading enzymes were overall downregulated by all
three treatments, although specific genes showed the opposite effect. Among the cell
wall modifying enzymes both up and downregulation is also observed, but several
(including EXLB3, ATXTH18, ATXTH19, ATEXPA16) in contrast to the global picture,
show opposite effects in response to NAA and mannitol.
- Interestingly, two genes related to pectin synthesis were highly upregulated in
response to mannitol alone or in combination with NAA, while pectin esterases were
also primarily upregulated, with some specific genes showing the opposite in response
to NAA (AT3G09405 and AT4G02330).
Overall these results indicate global changes in cell wall synthesis and the regulation of its
extensibility, which broadly correlate with the observed differences in cell growth rates.
Regulation of redox metabolism
Drought induces production of reactive oxygen species (ROS) which lead to oxidative
damage and cell death in plants (reviewed by Miller et al., 2010). Moreover, ROS
homeostasis during stress greatly depends on the balance between the production of ROS
and ROS scavenging enzymes which creates a baseline from which ROS spears function as a
signal in different cellular processes (Mittler et al., 2004). Therefore, ROS are important
signaling molecules that regulate growth and development under drought stress. To
investigate the involvement of auxin in altering redox metabolism under osmotic stress, we
studied the expression of transcripts related to major antioxidant enzymes. Few significant
genes were observed in mannitol and NAA treatment which were majorly up and
downregulated, respectively (Supplemental Table S4). Interestingly, we found that most of
the important genes belong to superoxide dismutase (SOD), ascorbate peroxidase (APX),
glutathione peroxidase (GPX), ascorbate oxidase (AO), glutathione-S-transferase (GST) and
peroxidase (POX) family were significantly upregulated under combination treatment of
NAA and mannitol (Supplemental Table S4). Our results clearly suggest that auxin has an
influence on redox status under osmotic stress.
Crosstalk between auxin signaling and osmotic stress
153
Discussion
Auxin plays a central role in plant growth and development under standard growth
conditions (Benjamins and Scheres, 2008; Sauer et al., 2013). Based on the observed
correlation between auxin and drought induced gene-expression (Huang et al., 2008), we
hypothesized that auxin may also play an important role in the regulation of the growth
response to osmotic stress. Therefore, we performed a detailed study of the interaction
between auxin signaling and osmotic stress in growing Arabidopsis leaves. Our results
prove that there is clearly a crosstalk between the response to osmotic stress
(experimentally induced by adding mannitol) and altering auxin homeostasis (by applying
NAA to the growth medium).
The dose-response experiments in combination with DR5::GUS expression studies and a
genome wide transcriptome analysis provide the physiological basis for the nature of this
crosstalk. Consistent with earlier findings (Collett et al., 2000; Polak et al., 2011) we show
that a modest increase of auxin levels increases plant growth, but that supra-optimal levels
will inhibit it. Osmotic stress increases sensitivity to auxin, stimulating the auxin signaling
cascade as evidenced by the high overlap between auxin and osmotic stress induced genes.
This means that leaves grown under osmotic stress behave as if they have supra-optimal
auxin levels. Increasing the auxin levels even further, by adding NAA to the medium, will
therefore increase the effect of the osmotic stress. Thus, the dose of 0.1 µM NAA studied
here in detail, by itself increased auxin levels to optimal for stimulating leaf growth,
whereas in combination with 25 mM of mannitol it pushes plants further into the supra-
optimal region of the response curve, making their growth effectively hypersensitive to
drought.
This crosstalk between auxin and drought may be more general as it was demonstrated
recently that the exogenous addition of auxin increases the sensitivity of seed germination
to salinity stress (Park et al., 2011).
Two recent studies demonstrated that overexpressing YUCCA genes improved drought
tolerance of Arabidopsis and potato plants, measured as plant survival rates (Kim et al.,
Crosstalk between auxin signaling and osmotic stress
154
2013; Lee et al., 2012). In both studies the enhanced expression of auxin biosynthesis genes
increased drought tolerance, but reduced plant growth. The increased drought tolerance
was related to the induction of specific drought response genes in mature tissues (Lee et al.,
2012). In our study, we also found the upregulation of the well-known stress induced
secondary metabolites, indole glucosinolates in proliferating leaves (Figure 6), which has
been reported to play a role in osmotic adjustments under water stress (del Carmen
Martínez-Ballesta et al., 2013; Lopez-Berenguer et al., 2008; Schreiner et al., 2009).
Additionally, our study shows that there is a crosstalk between auxin and ROS under
osmotic stress that ultimately affects leaf growth. We found that the expression of
antioxidant enzymes increased under osmotic stress and was more enhanced in the
presence of NAA under stress. Consistently, previous study showed that auxin modulates
ROS homeostasis by inducing ROS detoxification enzymes, glutathione S-transferases (GSH)
and quinone reductases (Laskowaski et al., 2002). Moreover, many studies suggested that
mutual interaction between auxin and ROS under environmental stresses affect plant
growth (reviewed by Tognetti et al., 2012). This indicates that the elevation of antioxidant
capacity, which protects the plant from oxidative damage and thereby enhances drought
tolerance (de Campos et al., 2011; Kim et al., 2013; Nakabayashi et al., 2014), maybe under
auxin control and it can explains the improved survival in plants with an elevated auxin
production (Kim et al., 2013; Lee et al., 2012).
The cellular basis of the growth response to auxin and osmotic stress
Auxin controls growth by regulating the cellular growth processes (reviewed by Perrot-
Rechenmann, 2010). Indeed, we found that exogenous supply of NAA affected cell division
and expansion in a concentration dependent manner. Interestingly, our data show that
both processes have a distinct response profile, with cell expansion being stimulated up to
concentrations of 0.4 μM, whereas cell division shows an optimum at a 10-fold lower
concentration (Figure 1F and G). In contrast, our data confirm earlier findings (Skirycz et
al., 2010; 2011a) that osmotic stress reduced leaf growth by reducing cell number and size.
Moreover, the reduced stomatal index in response to mannitol showed the effect on
meristemoid activity allowing for morphological adjustment to reduce water loss (Skirycz
Crosstalk between auxin signaling and osmotic stress
155
et al., 2010). Remarkably, NAA by itself or in combination with mannitol did not affect the
stomatal index, suggesting that meristemoid activity under osmotic stress is under control
of an auxin independent regulatory pathway.
Osmotic stress affects auxin homeostasis and signaling
Based on the auxin response curves of leaf size in presence or absence of mannitol we
hypothesized a role for auxin signaling upstream of the growth response in dividing and
expanding leaf cells. The increased activity of the DR5::GUS response marker (Figure 3) and
the large overlap between genome-wide expression changes induced by NAA and mannitol
(Figure 5), demonstrate that a large part of the drought signaling is mediated by the auxin
signal.
Our measurements of IAA levels, however, complicate the interpretation. In contrast to
what could be expected, the concentrations of free IAA are not upregulated, but unaffected
or possibly even downregulated by the combination of mannitol and NAA. Moreover, the
levels of conjugated IAA, constituting the bulk of the auxin pool, are downregulated by both
NAA and mannitol in an additive way (Figure 4). This implies that 1. there is a major effect
of both treatments on auxin homeostasis and 2. the increased auxin response is not directly
related to levels of IAA. Detailed analysis of auxin metabolism and response mediators
provided us with an explanation for this conundrum.
Our data show that osmotic stress upregulates almost the entire IAA biosynthetic pathway.
However, both auxin deconjugation and degradation are also upregulated, which can be
reconciled with the depletion of conjugated IAA and relatively stable free IAA contents. The
effect of NAA on IAA synthesis is less clear, but it also stimulates the deconjugation and
degradation. Together this means that although auxin homeostasis is significantly affected
the net effects of osmotic stress and NAA on free active IAA are small, implying that the
increased response may be related to increased sensitivity to the auxin levels or increased
signaling. Indeed, we found that all three treatments increased the level of the TIR1
receptor and reduced the expression of the majority of Aux/IAA inhibitors of Auxin
Responsive transcription Factors (ARF), three of which were upregulated. Together, these
Crosstalk between auxin signaling and osmotic stress
156
changes should comprise a strong increase in auxin sensitivity, consistent with increased
gene expression.
Many aspects of this global picture can be corroborated with earlier findings:
- Similar to our observations Ribnicky et al. (1996) found that exogenous supply of auxin
has limited effects on the endogenous IAA concentration.
- We found an upregulation of the biosynthesis of the precursor for IAA biosynthesis,
tryptophan (Tzin and Galili, 2010; Zhao, 2012) in response to osmotic stress (Figure 7A),
which corresponds with its enhanced production under various stresses (Nikiforova et al.,
2003; Zhao et al., 1998). Mild osmotic stress increased auxin biosynthesis mainly via IAOx,
the specific pathway for brassicaceae (Sugawara et al., 2009) through the NIT2 and AAO1
pathway (Woodward and Bartel, 2005). Expression of NIT2 was also reported to increase
under salt stress in Arabidopsis thaliana (Fang and Yang, 2002).
- It has also been shown before that stresses induce auxin deconjugation (Kinoshita et al.,
2012; Ludwig-Muller, 2011). Park et al. (2007) showed that overproduction of
WES1/GH3.5, a stress inducible IAA-Asp conjugating enzyme, caused growth reduction and
altered leaf shape whereas it enhanced stress tolerance.
- Finally, a global analysis of stress responsive genes showed that the expression of TIR
increased under drought and osmotic stress (Kilian et al., 2007).
Thus it appears that fractions of the response mechanism we have deciphered here are
supported by previous findings. Some of these responses demonstrate their functional
significance in terms of increased tolerance to drought and related stresses.
We think that the main reason for obtaining such a clear picture of the role for auxin
signaling in our analysis is that we focused specifically on very young, proliferating tissues
where this mechanism has it’s role. Sampling of whole plants, even at the seedling stage,
probably biases the analysis to the mature tissues that form the bulk of the material and
where entirely different responses predominate, which has been shown in previous studies
(Fujita et al., 2007; Kant et al., 2007; Papdi et al., 2008).
Crosstalk between auxin signaling and osmotic stress
157
Growth regulation
Our kinematic analysis shows that a decrease in cell division and expansion causes leaf
growth reduction under osmotic stress and in the combination of NAA and mannitol,
whereas NAA alone enhances cell cycle activity (Figure 2). The contrasting effect of the
treatments on this process requires differential effects. Indeed, the main explanation for
the enhanced cell division activity in response to NAA is the upregulation of B and D type
cyclins and members of the Anaphase Promoting Complex (APC), whereas the main effect
of mannitol appears to be a downregulation of CYCA2;1.
A reduced level of A-type cyclins has been observed earlier in response to different stresses
(Kakumanu et al., 2012; Kitsios and Doonan, 2011) and it has been demonstrated that
reducing their expression inhibits cell division during Arabidopsis leaf growth (Vanneste et
al., 2011).
KRP2 and KRP4 are reported to inhibit cell division and ultimately to decrease leaf growth
(Bemis and Torii, 2007; De Veylder et al., 2001). Consistent with the studies we also
observed increased expression of KRP2 and KRP4 and reduced proliferation under osmotic
stress in the presence and absence of NAA. Earlier, auxin was reported to decrease the
expression of KRP4 in Arabidopsis (Cho et al., 2010; Sanz et al., 2011). In contrast, we found
increased expressions of KRP2 and KRP4 in response to NAA. From our dose-response
experiments we can hypothesize that the effect of auxin on KRP expression is dose
dependent, where low concentrations inhibit its expression and higher concentrations
promote it.
Recently, auxin was found to stimulate degradation of the F-box protein SKP2A through the
ubiquitin proteasome system (Jurado et al., 2010). Moreover, the majority of cell cycle
regulators are controlled by ubiquitin dependent proteolysis by SCF or APC (Teixeira and
Reed, 2013). In accordance with the upregulation of CDC27B and CCS52B in response to
NAA, this suggests that the APC complex is connected with auxin signaling (Del Pozo and
Manzano, 2014). It has been demonstrated that its upregulation can stimulate cell division
and leaf growth in Arabidopsis (Eloy et al., 2011; 2012).
Crosstalk between auxin signaling and osmotic stress
158
Next to the effects on cell division, our kinematic analysis shows that osmotic stress
reduced cell size by reducing cell expansion rates. As typically turgor is not affected by
relatively mild drought stress, changes in cell wall synthesis and the production of essential
cell wall loosening proteins such as expansins (Cosgrove, 2000) and xyloglucan
endotransglucosylase/hydrolases (XTHs; Van Sandt et al., 2007) are important for the
observed alterations in cell expansion (Li et al., 2014; Wolf et al., 2012). Consistently we
found major changes in the expression of these genes in our transcriptome analysis
(Supplemental Table S3). Similarly, reduced cellulose content was observed also in tobacco
cell cultures under osmotic stress, which ultimately decreased cell expansion (Iraki et al.,
1989). The structural proteins extensins are extracellular basic hydroxyproline (Hyp)-rich
structural glycoproteins (HRGPs) (Lamport et al., 2011), they are important for the
crosslinking of cell wall components, cell wall dehydration and strengthening (Wolf et al.,
2012), and their expression was enhanced under osmotic stress in our dataset. This is
consistent with earlier findings that various biotic and abiotic stresses promote extensin
crosslinking (Merkouropoulos and Shirsat, 2003; Tseng et al., 2013; Zagorchev et al., 2014).
Pectins form a major fraction of the primary cell wall in plants and they help to determine
cell wall stiffening under stress and reduced growth (Willats et al., 2001; Zagorchev et al.,
2014). We also found an increased pectin biosynthesis while pectin esterases are
downregulated (Bray, 2004) under osmotic stress.
Taken together, the reduced cell expansion under osmotic stress can be attributed to
inhibited cell wall synthesis, altered composition, as well as altered expression of cell wall
loosening proteins, that all impact the extensibility of the wall and thus cell expansion.
In conclusion, our findings clearly indicate that auxin signaling plays a central role in the
growth response to drought. The plant response to drought is intricate and complex and
often overly simplified. It is well established that in different parts of the plant, drought
exerts even completely opposite responses. One well-known example of this is the
stimulation of root growth, whereas at the same time shoot growth is inhibited (Lee et al.,
2012). It is also more than likely that the response of growing tissues is entirely different
from mature tissues, which are the subject of the majority of published studies to date. Our
study yields important new insights on the drought response in young growing leaves. If
Crosstalk between auxin signaling and osmotic stress
159
indeed the nature of the response of different parts and developmental stages of the plant
is different, it is important to precisely understand communalities and specific aspects of
each. This will allow us to develop specific combinations of genotypes that result in
increased tolerance to drought, in absence of negative side effects such as diminished
growth. Translating such knowledge to crops will then provide a valuable tool to increase
productivity and/or to maintain it in light of increased frequency of drought spells,
predicted for many regions of the world in the context of global climate changes (Cazale et
al., 2009).
Material and Methods
Plant material and growth conditions
Arabidopsis wild type Col-0, Ler-0 and WS-0 seeds were sterilized in 70% ethanol for 1
minute and 5% bleach for 10 minutes, followed by rinsing with water for 3-5 times. The
seeds were sown on half-strength (Murashige and Skoog, 1962) medium (Duchefa
Biochemie) supplemented with 1% sucrose and 0.8% plant agar (Duchefa Biochemie). To
study osmotic stress 25, 50 or 100 mM mannitol was added to the media. The response to
externally applied auxin was analyzed by addition of NAA (α-Naphthalene acetic acid) in
0.01% DMSO (Dimethyl sulphoxide) at final concentrations of 0.01, 0.02, 0.04, 0.06, 0.1, 0.4,
0.8 and 1 µM. An equivalent volume of DMSO was added to control medium to exclude
effects of the solvent. 28 seeds were sown in 150x25 mm round petri dishes (Falcon®
tissue culture dishes, VWR). After stratification at 4°C for 2 days, plates were transferred to
a growth chamber with an air temperature of 22°C and shelves cooled to 19°C to avoid
condensation against the lid and a 16h day [80-90 µmols-1m-2 s-1 photosynthetically active
radiation (PAR), supplied by fluorescent tubes (cool white, LUMILUX, Germany)] and 8 h
night regime.
Rosette and leaf growth analysis
Images of rosettes were taken with a digital camera at 22 DAS and the area was measured
using ImageJ v 1.48 (http://rsbweb.nih.gov/ij/). Leaf growth analysis was performed on
Crosstalk between auxin signaling and osmotic stress
160
the first leaf pair. For this purpose, leaves were harvested from 8 to 29 DAS, after which
they were fixed and cleared with 70% ethanol for 24hrs and subsequently in 100% lactic
acid, which was also used as a mounting agent for subsequent microscopic observations.
Whole leaf dark field images were obtained with a binocular microscope (Nikon SMZ1000)
fitted with a digital camera (Zeiss [AxioCam Cc1]). For kinematic analysis, the surface area
of 8-20 leaves was measured using ImageJ. We calculated cell expansion rates as the
relative rate of increase in leaf area over time. For this, the logarithmic values of the mean
of cell numbers were locally fitted with a 5 point quadratic function (Erickson, 1976), using
the first derivative as the relative leaf expansion rate.
Cellular measurements
To determine the effect of auxin and mannitol on cell division and expansion, we
performed a kinematic analysis of the abaxial epidermal cells of 3-5 average leaves from 8
to 29 DAS as described in more detail by Nelissen et al. (2013). Young leaves, i.e. 8-10 DAS,
were stained with propidium iodide according to the protocol of Wuyts et al. (2010) and
cell images were obtained with a Nikon C1 confocal microscope using a Nikon Eclipse E600.
Samples of older leaves were cleared with 70% ethanol and subsequently stored and
mounted in 100% lactic acid on object slides for microscopy, whereby abaxial epidermis
cells were imaged using DIC optics on a Zeiss Axio Scope A1 at 20x and 40x magnification
fitted with a digital camera (Zeiss, AxioCam Cm1). The outlines of the cells were hand
drawn on an LCD tablet (Wacom drawing pad) connected to an iMac computer running
ImageJ. Morphometric analysis of the drawn cells was performed with automated image
analysis software that measures total area of the drawn cells and counts the number of
pavement and guard cells (Andriankaja et al., 2012). From these data we calculated average
cell area and estimated the number of cells per leaf by dividing leaf blade area by cell area.
Stomatal index was calculated as the percentage of stomata in the total number of
epidermal cells. We calculated cell division rates as the relative rate of increase in cell
number over time. For this, the logarithmic values of the mean of cell numbers were locally
fitted with a 5 point quadratic function (Erickson, 1976), using the first derivative as the
division rate. An average cell division rate over the period between 8 and 12 DAS was
Crosstalk between auxin signaling and osmotic stress
161
determined by calculating the increase in number of cells per hour during this period.
Number of cells and stomatal index of 22, 25 and 29 DAS were used to calculate the average
number of cells and stomatal index of the mature leaves.
Auxin measurements
15 to 300 leaves were harvested every second day from 10 to 22 DAS. The analyses were
repeated six times in independent experiments and from multiple plates within each
experiment. Samples of all treatments were harvested at the same time of the day, between
9 and 13 h, to avoid variation related to diurnal patterns. Because of their small size, leaves
on 10 and 11 DAS were dissected under a binocular microscope with microscissors
(Student Vannas Spring Scissors, Fine Science Tools) whereas at later stage leaves were
easily visible, therefore dissected without the microscope. Dissected leaves were collected
in tubes, cooled with liquid nitrogen and stored at -80˚C. Before analysis, the samples were
ground and homogenized using a MagNALyser (Roche) with 2mm glass beads.
IAA and IAA conjugates were extracted overnight in 80% methanol. An internal standard
(200 pmol [13C6-phenyl]- IAA (Cambridge Isotope Laboratory Inc., Andover, MA, USA))
was added for recovery and quantification purpose. Pigments were removed by binding in
80% MeOH on a reversed phase C18 cartridge (500 mg, BondElut Varian, Middelburg, the
Netherlands). One-third of the effluent was subjected to alkaline hydrolysis at 100°C
(Bialek and Cohen, 1989) to analyze IAA conjugates. The remaining fraction was used for
the separation and purification of free IAA. Samples were diluted to 50% MeOH and
transferred to a DEAE cartridge (DEAE-Sephadex A-25, GE Healthcare, Uppsala, Sweden,
500mg, formiate conditions) and C18 cartridge (500mg, BondElut Varian, Middelburg, the
Netherlands) as described by Prinsen et al. (2000). Prior to analysis, all samples were
methylated (Schlenk and Gellerman, 1960). An ACQUITY UPLC System combined with an
ACQUITY TQD mass spectrometer (Waters, Milford, MA, USA) for quantification. Samples
were injected on a VanGuard pre-column (BEH C18, 1.7 µm, 2.1 x 5 mm; Waters, Milford,
MA, USA) coupled to a reversed-phase column (BEH C18, 1.7 µm, 2.1 x 50 mm; Waters,
Milford, MA, USA). After 2 min equilibration at 10:90 A:B (with A: methanol and B: 1mM
Crosstalk between auxin signaling and osmotic stress
162
ammonium acetate), samples were eluted from the column by changing solvent
composition to 90:10 A:B in a 2 min linear gradient, using a constant flow-rate of 300 µl
min-1 and a column temperature of 30°C. ESI(+)-MRM mode was used for quantification
based on specific diagnostic transitions for IAA and 13C6-IAA (190>130 and 196>136
respectively). Chromatograms obtained were processed using QuanLynx v4.1 (Waters,
Milford, MA, USA). Concentrations were calculated using the principle of isotope dilution.
GUS staining
To determine the spatio-temporal patterns of auxin activity, Arabidopsis thaliana Col-0
plants harboring the DR5::GUS reporter were grown in vitro and whole plantlets were
harvested on 8 and 10 DAS, when the first pair of leaves was still actively proliferating. The
samples were incubated in 100% acetone for 10 minutes at room temperature. Acetone
was replaced with GUS assay buffer (Phosphate buffer [pH-7], 0.1% Triton X-100, 0.5 mM
K4[Fe(CN)6].3H20, 0.5 mM K3[Fe(CN)6]) and placed under vacuum for 10 minutes. This
buffer was replaced by a GUS assay buffer supplemented with 958 µM X-gluc in 1% DMF
(Dimethyl sulfoxide) and vacuum infiltrated for 10 minutes. Samples were incubated
overnight at 37°C, after which the reaction was stopped by replacing the X-gluc GUS assay
buffer with fixative (4% Glutareldehyde and 10.8% Formaldehyde) for overnight
incubation at 4°C. After fixation the samples were cleared overnight with absolute ethanol
and transferred to 100% lactic acid. For microscopy, plantlets were mounted in lactic acid
on an object slide and covered with a coverslip. Photographs of the samples were obtained
on a binocular microscope (Nikon SMZ1000) fitted with a digital camera (Zeiss AxioCam
Cc1) using bright field illumination.
Transcriptome analysis
To study the effect of osmotic stress and auxin on the transcriptome of proliferating cells,
plants were grown on control medium, medium supplemented with 0.1 μM NAA, 25 mM
mannitol, and 0.1 μM NAA + 25 mM mannitol, respectively. For each of these treatments,
primordia of leaves 1 and 2 were dissected under a binocular at 10 DAS, frozen in liquid
nitrogen and stored at -80°C. Before analysis, the samples were ground and homogenized
Crosstalk between auxin signaling and osmotic stress
163
using a MagNALyser (Roche) with 2 mm glass beads. Total RNA of three replicates, each
containing 100 to 250 leaves was isolated using Trizol Reagent (Life Technologies). The
quantity and integrity of the RNA was measured spectrophotometrically on a QIAxcel
system (Qiagen). Library preparation was done using the TruSeq® Stranded mRNA sample
preparation 96 rcx kit (Illumina™) following the low sample protocol according to the
Illumina™ guidelines. Briefly, approximately 2.5 µg of total RNA was purified using RNA
purification beads targeting the poly-A tail of the mRNA and subsequently the mRNA was
fragmented by means of the enzymes provided in the kit. After the cDNA synthesis
adenylation of 3’ ends and ligation of the adaptors were performed. Adaptors were ligated
in 12-plex formation, allowing the pooling of 12 or more samples after the PCR enrichment
of the library. Subsequently, the library was quantified using PicoGreen® dye (Life
Technologies™). A combination of 18 samples (from which 12 were used for this
experiment) was pooled to run in the same lane on the flowcel on the sequencer. In order
to accurately quantify the concentration in nM of our pools, the Kapa SYBR® FAST
universal qPCR kit (KAPA Biosystems ™) for Illunima™ sequencing was used to quantify the
number of the amplifiable molecules in the pools and the Bioanalyzer® (Agilent
Technologies™) to determine the average fragment size of our pool. Sequencing was done
on an Illumina HiSeq 1500 used in the rapid mode together with the TruSeq® Rapid SBS
Kit for 50 cycles.
Transcriptome data analysis
Transcriptome data analysis was performed using CLC Genomics Workbench v.6
(http://www.clcbio.com/blog/clc-genomics-workbench-7-0/) with the Arabidopsis
thaliana (Col-0 TAIR10) sequence database (http://www.arabidopsis.org/) as reference
genome. After the trimming of adaptors from the sequences, they were mapped against the
reference genome. The expression values were calculated based on “reads per kilobase of
exon model per million mapped reads” (RPKM) values (Mortazavi et al., 2008). RNAseq
data was grouped accordingly and two group comparisons (unpaired) were performed.
The expression values were normalized by scaling to an arbitrarily chosen reference
sample. Moderated t statistics for pairwise contrasts were calculated using the Baggerley’s
Crosstalk between auxin signaling and osmotic stress
164
test (Baggerly et al., 2003). Statistical analysis for the effect of mannitol and NAA
treatments was conducted by a two-way ANOVA on the MeV software (Multi Experiment
Viewer 4.9.0). The obtained p values were corrected for multiple testing for each contrast
separately by means of false discovery rate (FDR; Benjamini and Hochberg, 1995) using
only genes for which expression was detected in all three replicates of at least one
treatment. A FDR < 0.05 and log2 fold change > 0.5 was used as a cutoff. Raw RNA
sequencing data have been deposited with NCBI’s Gene Expression Omnibus (GEO
accession no. GSE60870, http://www.ncbi.nlm.nih.gov/geo/query/acc.cgi?acc=GSE60870).
Expression profiles for differentially expressed genes were visualized and clustered using
Quality Threshold clustering on MeV.
For all significant genes according to ANOVA and FDR, the corrected p values for the pair-
wise contrasts were used for Venn diagram construction, overrepresentation analyses by
PageMan (Usadel et al., 2006) and to study individual pathways where significantly
induced or repressed genes with known functions were classified into groups based on
gene ontology (GO) information obtained from the TAIR Database
(http://www.arabidopsis.org/) and plotted in newly constructed regulatory pathway maps
using MapMan 3.5.0 (Thimm et al., 2004).
Statistical analysis
Statistical analysis of the rosette and leaf area measurements of mannitol, NAA and
NAA+mannitol treatments was performed by one-way ANOVA using SPSS 16.0 statistical
software and significant differences between the means of the treatments were determined
using the LSD test (p < 0.05). Statistical analyses for auxin measurements and kinematic
data were conducted by t tests in Microsoft Excel. To study the interaction effect of NAA
and mannitol on leaf growth in the combined treatments, a two-way ANOVA was
performed using the LSD test (p < 0.05).
Crosstalk between auxin signaling and osmotic stress
165
Supplemental Data
All supplemental data is listed below. Supplemental figure can be found at the end of the
chapter and supplemental tables are available upon request.
Supplemental Figure 1. The interacting effect of mannitol and NAA on leaf growth in
different Arabidopsis ecotypes.
Supplemental Table S1. All the genes for which expression was detected in all three
replicates of at least one treatment.
Supplemental Table S2. Significantly affected cell cycle genes.
Supplemental Table S3. Significant genes related to cell wall.
Supplemental Table S4. List of significantly expressed genes that encode for key
antioxidant enzymes under mannitol (M), NAA (N) and NAA+mannitol (NM).
Acknowledgements
We thank Sevgi Oden for the help in IAA measurements. We also thank Dr. Malgorzata A.
Domagalska, Gaurav Zinta and Hamada Abdelgawad for useful discussions related to
experiments and manuscript writing. This work was supported by a concerted research
activity (GOA) research grant, ‘A Systems Biology Approach of Leaf Morphogenesis’ from
the research council of the University of Antwerp and an Interuniversity Attraction Poles
(IUAP: MARS IUAP VII/29) from the Belgian Federal Science Policy Office (BELSPO).
Shweta Kalve was funded by a training grant from the Department of Science and
Education of the Flemish Government.
Crosstalk between auxin signaling and osmotic stress
166
References
Achard P, Cheng H, De Grauwe L, Decat J, Schoutteten H, Moritz T, Van Der Straeten D,
Peng J, Harberd NP. 2006. Integration of plant responses to environmentally activated
phytohormonal signals. Science 311, 91-94.
Andriankaja M, Dhondt S, De Bodt S, Vanhaeren H, Coppens F, De Milde L,
Muhlenbock P, Skirycz A, Gonzalez N, Beemster GT, Inze D. 2012. Exit from
proliferation during leaf development in Arabidopsis thaliana: a not-so-gradual process.
Dev Cell 22, 64-78.
Baggerly KA, Deng L, Morris JS, Aldaz CM. 2003. Differential expression in SAGE:
accounting for normal between-library variation. Bioinformatics 19, 1477-1483.
Band LR, Wells DM, Larrieu A, Sun JY, Middleton AM, French AP, Brunoud G, Sato EM,
Wilson MH, Peret B, Oliva M, Swarup R, Sairanen I, Parry G, Ljung K, Beeckman T,
Garibaldi JM, Estelle M, Owen MR, Vissenberg K, Hodgman TC, Pridmore TP, King JR,
Vernoux T, Bennett MJ. 2012. Root gravitropism is regulated by a transient lateral auxin
gradient controlled by a tipping-point mechanism. Proc Natl Acad Sci U S A 109, 4668-
4673.
Bartel B, Fink GR. 1995. ILR1, an amidohydrolase that releases active indole-3-acetic acid
from conjugates. Science 268, 1745-1748.
Beemster GTS, De Veylder L, Vercruysse S, West G, Rombaut D, Van Hummelen P,
Galichet A, Gruissem W, Inze D, Vuylsteke M. 2005. Genome-wide analysis of gene
expression profiles associated with cell cycle transitions in growing organs of Arabidopsis.
Plant Physiol 138, 734-743.
Bemis SM, Torii KU. 2007. Autonomy of cell proliferation and developmental programs
during Arabidopsis aboveground organ morphogenesis. Dev Biol 304, 367-381.
Crosstalk between auxin signaling and osmotic stress
167
Benjamini Y, Hochberg Y. 1995. Controlling the false discovery rate: a practical and
powerful approach to multiple testing. J R Stat Soc 57, 289-300.
Benjamins R, Scheres B. 2008. Auxin: the looping star in plant development. Annu Rev
Plant Biol 59, 443-465.
Bialek K, Cohen JD. 1989. Free and conjugated indole-3-acetic acid in developing bean
seeds. Plant Physiol 91, 775-779.
Bitto E, Bingman CA, Bittova L, Houston NL, Boston RS, Fox BG, Phillips GN. 2009. X‐
ray structure of ILL2, an auxin‐conjugate amidohydrolase from Arabidopsis thaliana.
Proteins: Struct, Funct, Bioinf 74, 61-71.
Blilou I, Frugier F, Folmer S, Serralbo O, Willemsen V, Wolkenfelt H, Eloy NB, Ferreira
PCG, Weisbeek P, Scheres B. 2002. The Arabidopsis HOBBIT gene encodes a CDC27
homolog that links the plant cell cycle to progression of cell differentiation. Genes Dev 16,
2566-2575.
Bray EA. 2004. Genes commonly regulated by water-deficit stress in Arabidopsis thaliana. J
Exp Bot 55, 2331–2341.
Cazale AC, Clement M, Chiarenza S, Roncato MA, Pochon N, Creff A, Marin E,
Leonhardt N, Noel LD. 2009. Altered expression of cytosolic/nuclear HSC70-1 molecular
chaperone affects development and abiotic stress tolerance in Arabidopsis thaliana. J Exp
Bot 60, 2653-2664.
Chapman EJ, Estelle M. 2009. Mechanism of auxin-regulated gene expression in plants.
Annu Rev Genet 43, 265-285.
Crosstalk between auxin signaling and osmotic stress
168
Cho HJ, Kwon HK, Wang MH. 2010. Expression of Kip-related protein 4 gene (KRP4) in
response to auxin and cytokinin during growth of Arabidopsis thaliana. BMB Rep 43, 273-
278.
Claeys H, Skirycz A, Maleux K, Inze D. 2012. DELLA signaling mediates stress-induced cell
differentiation in Arabidopsis leaves through modulation of anaphase-promoting
complex/cyclosome activity. Plant Physiol 159, 739-747.
Cockcroft CE, den Boer BG, Healy JS, Murray JA. 2000. Cyclin D control of growth rate in
plants. Nature 405, 575-579.
Cohen JD, Bandurski RS. 1982. Chemistry and Physiology of the Bound Auxins. Annu Rev
Plant Physiol 33, 403-430.
Collett CE, Harberd NP, Leyser O. 2000. Hormonal interactions in the control of
Arabidopsis hypocotyl elongation. Plant Physiol 124, 553-562.
Cosgrove DJ. 2000. Loosening of plant cell walls by expansins. Nature 407, 321-326.
de Almeida Engler J, De Veylder L, De Groodt R, Rombauts S, Boudolf V, De Meyer B,
Hemerly A, Ferreira P, Beeckman T, Karimi M, Hilson P, Inze D, Engler G. 2009.
Systematic analysis of cell-cycle gene expression during Arabidopsis development. Plant J
59, 645-660.
de Campos MKF, de Carvalho K, de Souza FS, Marur CJ, Pereira LFP, Vieira LGE. 2011.
Drought tolerance and antioxidant enzymatic activity in transgenic ‘Swingle’citrumelo
plants over-accumulating proline. Environ Exp Bot 72, 242-250.
de Jager SM, Scofield S, Huntley RP, Robinson AS, den Boer BG, Murray JA. 2009.
Dissecting regulatory pathways of G1/S control in Arabidopsis: common and distinct
targets of CYCD3;1, E2Fa and E2Fc. Plant Mol Biol 71, 345-365.
Crosstalk between auxin signaling and osmotic stress
169
De Veylder L, Beeckman T, Beemster GT, Krols L, Terras F, Landrieu I, van der
Schueren E, Maes S, Naudts M, Inze D. 2001. Functional analysis of cyclin-dependent
kinase inhibitors of Arabidopsis. Plant Cell 13, 1653-1668.
del Carmen Martínez-Ballesta M, Moreno DA, Carvajal M. 2013. The physiological
importance of glucosinolates on plant response to abiotic stress in Brassica. Int J Mol Sci 14,
11607-11625.
del Pozo JC, Diaz-Trivino S, Cisneros N, Gutierrez C. 2006. The balance between cell
division and endoreplication depends on E2FC-DPB, transcription factors regulated by the
ubiquitin-SCFSKP2A pathway in Arabidopsis. Plant Cell 18, 2224-2235.
del Pozo JC, Manzano C. 2014. Auxin and the ubiquitin pathway. Two players-one target:
the cell cycle in action. J Exp Bot 65, 2617-2632.
Dharmasiri S, Swarup R, Mockaitis K, Dharmasiri N, Singh SK, Kowalchyk M,
Marchant A, Mills S, Sandberg G, Bennett MJ, Estelle M. 2006. AXR4 is required for
localization of the auxin influx facilitator AUX1. Science 312, 1218-1220.
Ding Y, Hayes MJ, Widhalm M. 2011. Measuring economic impacts of drought: a review
and discussion. Disaster Prev Manage 20, 434 - 446.
Doerner P, Joergensen J-E, You R, Steppuhn J, Lamb C. 1996. Control of root growth and
development by cyclin expression. Nature 380, 520-523.
Eloy NB, de Freitas Lima M, Van Damme D, Vanhaeren H, Gonzalez N, De Milde L,
Hemerly AS, Beemster GT, Inzé D, Ferreira PC. 2011. The APC/C subunit 10 plays an
essential role in cell proliferation during leaf development. Plant J 68, 351-363.
Eloy NB, Gonzalez N, Van Leene J, Maleux K, Vanhaeren H, De Milde L, Dhondt S,
Vercruysse L, Witters E, Mercier R. 2012. SAMBA, a plant-specific anaphase-promoting
Crosstalk between auxin signaling and osmotic stress
170
complex/cyclosome regulator is involved in early development and A-type cyclin
stabilization. Proc Natl Acad Sci U S A 109, 13853-13858.
Erickson RO. 1976. Modeling of Plant Growth. Annu Rev Plant Physiol 27, 407-434.
Fang B, Yang LJ. 2002. Evidence that the auxin signaling pathway interacts with plant
stress response. Acta Bot Sin 44, 532-536.
Friml J, Vieten A, Sauer M, Weijers D, Schwarz H, Hamann T, Offringa R, Jurgens G.
2003. Efflux-dependent auxin gradients establish the apical-basal axis of Arabidopsis.
Nature 426, 147-153.
Fujita M, Mizukado S, Fujita Y, Ichikawa T, Nakazawa M, Seki M, Matsui M,
Yamaguchi-Shinozaki K, Shinozaki K. 2007. Identification of stress-tolerance-related
transcription-factor genes via mini-scale Full-length cDNA Over-eXpressor (FOX) gene
hunting system. Biochem Biophys Res Commun 364, 250-257.
Gonzalez N, Vanhaeren H, Inze D. 2012. Leaf size control: complex coordination of cell
division and expansion. Trends Plant Sci 17, 332-340.
Hayashi K. 2012. The interaction and integration of auxin signaling components. Plant Cell
Physiol 53, 965-975.
Heyer LJ, Kruglyak S, Yooseph S. 1999. Exploring expression data: identification and
analysis of coexpressed genes. Genome Res 9, 1106-1115.
Huang D, Wu W, Abrams SR, Cutler AJ. 2008. The relationship of drought-related gene
expression in Arabidopsis thaliana to hormonal and environmental factors. J Exp Bot 59,
2991-3007.
Crosstalk between auxin signaling and osmotic stress
171
Iraki NM, Singh N, Bressan RA, Carpita NC. 1989. Cell walls of tobacco cells and changes
in composition associated with reduced growth upon adaptation to water and saline stress.
Plant Physiol 91, 48-53.
Jin SH, Ma XM, Han P, Wang B, Sun YG, Zhang GZ, Li YJ, Hou BK. 2013. UGT74D1 is a
novel auxin glycosyltransferase from Arabidopsis thaliana. PLoS ONE 8, e61705.
Jurado S, Abraham Z, Manzano C, Lopez-Torrejon G, Pacios LF, Del Pozo JC. 2010. The
Arabidopsis cell cycle F-box protein SKP2A binds to auxin. Plant Cell 22, 3891-3904.
Kakumanu A, Ambavaram MM, Klumas C, Krishnan A, Batlang U, Myers E, Grene R,
Pereira A. 2012. Effects of drought on gene expression in maize reproductive and leaf
meristem tissue revealed by RNA-Seq. Plant Physiol 160, 846-867.
Kalve S, Beemster GTS, De Vos D. 2014. Leaf development: a cellular perspective. Front
Plant Sci 5 (362).
Kant P, Kant S, Gordon M, Shaked R, Barak S. 2007. STRESS RESPONSE SUPPRESSOR1
and STRESS RESPONSE SUPPRESSOR2, two DEAD-box RNA helicases that attenuate
Arabidopsis responses to multiple abiotic stresses. Plant Physiol 145, 814-830.
Kilian J, Whitehead D, Horak J, Wanke D, Weinl S, Batistic O, D'Angelo C, Bornberg-
Bauer E, Kudla J, Harter K. 2007. The AtGenExpress global stress expression data set:
protocols, evaluation and model data analysis of UV-B light, drought and cold stress
responses. Plant J 50, 347-363.
Kim JI, Baek D, Park HC, Chun HJ, Oh DH, Lee MK, Cha JY, Kim WY, Kim MC, Chung WS,
Bohnert HJ, Lee SY, Bressan RA, Lee SW, Yun DJ. 2013. Overexpression of Arabidopsis
YUCCA6 in potato results in high-auxin developmental phenotypes and enhanced resistance
to water deficit. Mol Plant 6, 337-349.
Crosstalk between auxin signaling and osmotic stress
172
Kinoshita N, Wang H, Kasahara H, Liu J, Macpherson C, Machida Y, Kamiya Y, Hannah
MA, Chua NH. 2012. IAA-Ala Resistant3, an evolutionarily conserved target of miR167,
mediates Arabidopsis root architecture changes during high osmotic stress. Plant Cell 24,
3590-3602.
Kitsios G, Doonan JH. 2011. Cyclin dependent protein kinases and stress responses in
plants. Plant Signal Behav 6, 204-209.
Korasick DA, Enders TA, Strader LC. 2013. Auxin biosynthesis and storage forms. J Exp
Bot 64, 2541-2555.
Krecek P, Skupa P, Libus J, Naramoto S, Tejos R, Friml J, Zazimalova E. 2009. The PIN-
FORMED (PIN) protein family of auxin transporters. Genome Biol 10.
Krupinski P, Jonsson H. 2010. Modeling auxin-regulated development. Cold Spring Harb
Perspect Biol 2, a001560.
Lamport DT, Kieliszewski MJ, Chen Y, Cannon MC. 2011. Role of the extensin
superfamily in primary cell wall architecture. Plant Physiol 156, 11-19.
Laskowaski MJ, Dreher KA, Gehring MA, Abel S, Gensler AL, Sussex IM. 2002. FRQ1, a
novel primary auxin-response gene, encodes a flavin mononucleotide-binding quinone
reductase. Plant Physiol 128, 578-590.
Lee M, Jung JH, Han DY, Seo PJ, Park WJ, Park CM. 2012. Activation of a flavin
monooxygenase gene YUCCA7 enhances drought resistance in Arabidopsis. Planta 235, 923-
938.
Leyser O. 2010. The power of auxin in plants. Plant Physiol 154, 501-505.
Crosstalk between auxin signaling and osmotic stress
173
Li S, Bashline L, Lei L, Gu Y. 2014. Cellulose synthesis and its regulation. Arabidopsis Book
12, e0169.
Lopez-Berenguer C, Martinez-Ballesta MC, Garcia-Viguera C, Carvajal M. 2008. Leaf
water balance mediated by aquaporins under salt stress and associated glucosinolate
synthesis in broccoli. Plant Science 174, 321-328.
Ludwig-Muller J. 2000. Indole-3-butyric acid in plant growth and development. Plant
Growth Regul 32, 219-230.
Ludwig-Muller J. 2011. Auxin conjugates: their role for plant development and in the
evolution of land plants. J Exp Bot 62, 1757-1773.
Magidin M, Pittman JK, Hirschi KD, Bartel B. 2003. ILR2, a novel gene regulating IAA
conjugate sensitivity and metal transport in Arabidopsis thaliana. Plant J 35, 523-534.
Mano Y, Nemoto K. 2012. The pathway of auxin biosynthesis in plants. J Exp Bot 63, 2853-
2872.
Mashiguchi K, Tanaka K, Sakai T, Sugawara S, Kawaide H, Natsume M, Hanada A,
Yaeno T, Shirasu K, Yao H, McSteen P, Zhao Y, Hayashi K, Kamiya Y, Kasahara H. 2011.
The main auxin biosynthesis pathway in Arabidopsis. Proc Natl Acad Sci U S A 108, 18512-
18517.
Merkouropoulos G, Shirsat AH. 2003. The unusual Arabidopsis extensin gene atExt1 is
expressed throughout plant development and is induced by a variety of biotic and abiotic
stresses. Planta 217, 356-366.
Miller G, Suzuki N, Ciftci-Yilmaz S, Mittler R. 2010. Reactive oxygen species homeostasis
and signalling during drought and salinity stresses. Plant Cell Environ 33, 453-467.
Crosstalk between auxin signaling and osmotic stress
174
Mittler R, Vanderauwera S, Gollery M, Van Breusegem F. 2004. Reactive oxygen gene
network of plants. Trends Plant Sci 9, 490–498.
Mortazavi A, Williams BA, McCue K, Schaeffer L, Wold B. 2008. Mapping and quantifying
mammalian transcriptomes by RNA-Seq. Nat Methods 5, 621-628.
Murashige T, Skoog F. 1962. A revised medium for rapid growth and bioassays with
tobacco tissue cultures. Physiol Plant 15, 473-497.
Nakabayashi R, Yonekura‐Sakakibara K, Urano K, Suzuki M, Yamada Y, Nishizawa T,
Matsuda F, Kojima M, Sakakibara H, Shinozaki K. 2014. Enhancement of oxidative and
drought tolerance in Arabidopsis by overaccumulation of antioxidant flavonoids. Plant J 77,
367-379.
Nelissen H, Rymen B, Coppens F, Dhondt S, Fiorani F, Beemster GT. 2013. Kinematic
analysis of cell division in leaves of mono- and dicotyledonous species: a basis for
understanding growth and developing refined molecular sampling strategies. Methods Mol
Biol 959, 247-264.
Nemhauser JL, Hong FX, Chory J. 2006. Different plant hormones regulate similar
processes through largely nonoverlapping transcriptional responses. Cell 126, 467-475.
Nikiforova V, Freitag J, Kempa S, Adamik M, Hesse H, Hoefgen R. 2003. Transcriptome
analysis of sulfur depletion in Arabidopsis thaliana: interlacing of biosynthetic pathways
provides response specificity. Plant J 33, 633-650.
Ostin A, Ilic N, Cohen JD. 1999. An in vitro system from maize seedlings for tryptophan-
independent indole-3-acetic acid biosynthesis. Plant Physiol 119, 173-178.
Ouyang J, Shao X, Li J. 2000. Indole-3-glycerol phosphate, a branchpoint of indole-3-acetic
acid biosynthesis from the tryptophan biosynthetic pathway in Arabidopsis thaliana. Plant J
24, 327-333.
Crosstalk between auxin signaling and osmotic stress
175
Papdi C, Ábrahám E, Joseph MP, Popescu C, Koncz C, Szabados L. 2008. Functional
identification of Arabidopsis stress regulatory genes using the controlled cDNA
overexpression system. Plant Physiol 147, 528-542.
Park J, Kim YS, Kim SG, Jung JH, Woo JC, Park CM. 2011. Integration of auxin and salt
signals by the NAC transcription factor NTM2 during seed germination in Arabidopsis. Plant
Physiol 156, 537-549.
Park JE, Park JY, Kim YS, Staswick PE, Jeon J, Yun J, Kim SY, Kim J, Lee YH, Park CM.
2007. GH3-mediated auxin homeostasis links growth regulation with stress adaptation
response in Arabidopsis. J Biol Chem 282, 10036-10046.
Peleg Z, Blumwald E. 2011. Hormone balance and abiotic stress tolerance in crop plants.
Curr Opin Plant Biol 14, 290-295.
Peret B, Swarup K, Ferguson A, Seth M, Yang YD, Dhondt S, James N, Casimiro I, Perry
P, Syed A, Yang HB, Reemmer J, Venison E, Howells C, Perez-Amador MA, Yun JG,
Alonso J, Beemster GTS, Laplaze L, Murphy A, Bennett MJ, Nielsen E, Swarup R. 2012.
AUX/LAX genes encode a family of auxin influx transporters that perform distinct functions
during Arabidopsis development. Plant Cell 24, 2874-2885.
Perrot-Rechenmann C. 2010. Cellular responses to auxin: division versus expansion. Cold
Spring Harb Perspect Biol 2, a001446.
Petrasek J, Friml J. 2009. Auxin transport routes in plant development. Development 136,
2675-2688.
Polak M, Tukaj Z, Karcz W. 2011. Effect of temperature on the dose-response curves for
auxin-induced elongation growth in maize coleoptile segments. Acta Physiol Plant 33, 437-
442.
Crosstalk between auxin signaling and osmotic stress
176
Prinsen E, Van Laer S, Öden S, Van Onckelen H. 2000. Quantifying phytohormones in
transformed plants In: Methods in Molecular Biology, Totowa, NJ, USA:Humana Press. 49–
65.
Qin G, Gu H, Zhao Y, Ma Z, Shi G, Yang Y, Pichersky E, Chen H, Liu M, Chen Z, Qu LJ.
2005. An indole-3-acetic acid carboxyl methyltransferase regulates Arabidopsis leaf
development. Plant Cell 17, 2693-2704.
Reinhardt D, Mandel T, Kuhlemeier C. 2000. Auxin regulates the initiation and radial
position of plant lateral organs. Plant Cell 12, 507-518.
Ribnicky DM, Ilic N, Cohen JD, Cooke TJ. 1996. The Effects of exogenous auxins on
endogenous indole-3-acetic acid metabolism (The implications for carrot somatic
embryogenesis). Plant Physiol 112, 549-558.
Ross J, Li Y, Lim E, Bowles DJ. 2001. Higher plant glycosyltransferases. Genome Biol 2,
REVIEWS3004.
Sanz L, Dewitte W, Forzani C, Patell F, Nieuwland J, Wen B, Quelhas P, De Jager S,
Titmus C, Campilho A, Ren H, Estelle M, Wang H, Murray JA. 2011. The Arabidopsis D-
type cyclin CYCD2;1 and the inhibitor ICK2/KRP2 modulate auxin-induced lateral root
formation. Plant Cell 23, 641-660.
Sauer M, Robert S, Kleine-Vehn J. 2013. Auxin: simply complicated. J Exp Bot 64, 2565-
2577.
Schlenk H, Gellerman JL. 1960. Esterification of fatty acids with diazomethane on a small
scale. Anal Chem 32, 1412-1414.
Crosstalk between auxin signaling and osmotic stress
177
Schreiner M, Beyene B, Krumbein A, Stutzel H. 2009. Ontogenetic changes of 2-propenyl
and 3-indolylmethyl glucosinolates in Brassica carinata leaves as affected by water supply.
J Agric Food Chem 57, 7259-7263.
Seidel C, Walz A, Park S, Cohen JD, Ludwig-Muller J. 2006. Indole-3-acetic acid protein
conjugates: novel players in auxin homeostasis. Plant Biol (Stuttg) 8, 340-345.
Sekimoto H, Seo M, Kawakami N, Komano T, Desloire S, Liotenberg S, Marion-Poll A,
Caboche M, Kamiya Y, Koshiba T. 1998. Molecular cloning and characterization of
aldehyde oxidases in Arabidopsis thaliana. Plant Cell Physiol 39, 433-442.
Skirycz A, Claeys H, De Bodt S, Oikawa A, Shinoda S, Andriankaja M, Maleux K, Eloy
NB, Coppens F, Yoo SD, Saito K, Inze D. 2011a. Pause-and-stop: the effects of osmotic
stress on cell proliferation during early leaf development in Arabidopsis and a role for
ethylene signaling in cell cycle arrest. Plant Cell 23, 1876-1888.
Skirycz A, De Bodt S, Obata T, De Clercq I, Claeys H, De Rycke R, Andriankaja M, Van
Aken O, Van Breusegem F, Fernie AR, Inze D. 2010. Developmental stage specificity and
the role of mitochondrial metabolism in the response of Arabidopsis leaves to prolonged
mild osmotic stress. Plant Physiol 152, 226-244.
Skirycz A, Inze D. 2010. More from less: plant growth under limited water. Curr Opin
Biotechnol 21, 197-203.
Skirycz A, Vandenbroucke K, Clauw P, Maleux K, De Meyer B, Dhondt S, Pucci A,
Gonzalez N, Hoeberichts F, Tognetti VB, Galbiati M, Tonelli C, Van Breusegem F,
Vuylsteke M, Inze D. 2011b. Survival and growth of Arabidopsis plants given limited water
are not equal. Nat Biotechnol 29, 212-214.
Crosstalk between auxin signaling and osmotic stress
178
Strader LC, Culler AH, Cohen JD, Bartel B. 2010. Conversion of endogenous indole-3-
butyric acid to indole-3-acetic acid drives cell expansion in Arabidopsis seedlings. Plant
Physiol 153, 1577-1586.
Strader LC, Wheeler DL, Christensen SE, Berens JC, Cohen JD, Rampey RA, Bartel B.
2011. Multiple facets of Arabidopsis seedling development require indole-3-butyric acid-
derived auxin. Plant Cell 23, 984-999.
Sugawara S, Hishiyama S, Jikumaru Y, Hanada A, Nishimura T, Koshiba T, Zhao Y,
Kamiya Y, Kasahara H. 2009. Biochemical analyses of indole-3-acetaldoxime-dependent
auxin biosynthesis in Arabidopsis. Proc Natl Acad Sci U S A 106, 5430-5435.
Swarup K, Benkova E, Swarup R, Casimiro I, Peret B, Yang Y, Parry G, Nielsen E, De
Smet I, Vanneste S, Levesque MP, Carrier D, James N, Calvo V, Ljung K, Kramer E,
Roberts R, Graham N, Marillonnet S, Patel K, Jones JD, Taylor CG, Schachtman DP, May
S, Sandberg G, Benfey P, Friml J, Kerr I, Beeckman T, Laplaze L, Bennett MJ. 2008. The
auxin influx carrier LAX3 promotes lateral root emergence. Nat Cell Biol 10, 946-954.
Swarup R, Friml J, Marchant A, Ljung K, Sandberg G, Palme K, Bennett M. 2001.
Localization of the auxin permease AUX1 suggests two functionally distinct hormone
transport pathways operate in the Arabidopsis root apex. Genes Dev 15, 2648-2653.
Tanaka K, Hayashi K, Natsume M, Kamiya Y, Sakakibara H, Kawaide H, Kasahara H.
2014. UGT74D1 catalyzes the glucosylation of 2-oxindole-3-acetic acid in the auxin
metabolic pathway in Arabidopsis. Plant Cell Physiol 55, 218-228.
Tarayre S, Vinardell JM, Cebolla A, Kondorosi A, Kondorosi E. 2004. Two classes of the
CDh1-type activators of the anaphase-promoting complex in plants: novel functional
domains and distinct regulation. Plant Cell 16, 422-434.
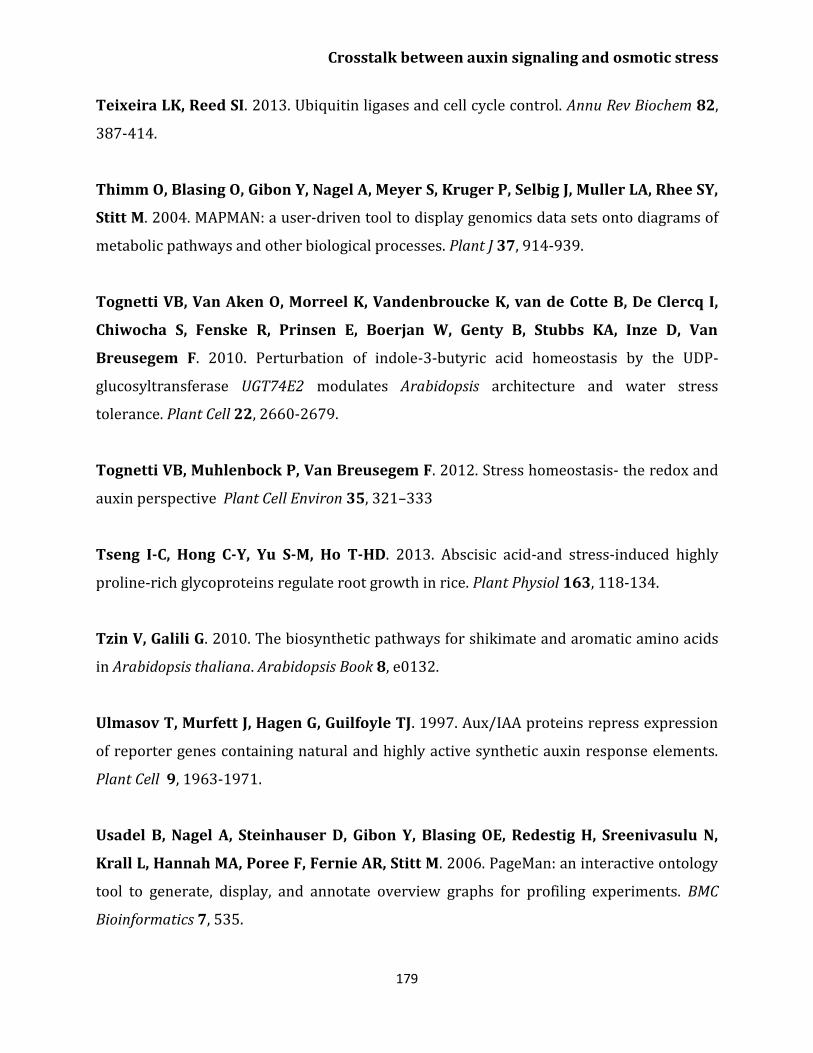
Crosstalk between auxin signaling and osmotic stress
179
Teixeira LK, Reed SI. 2013. Ubiquitin ligases and cell cycle control. Annu Rev Biochem 82,
387-414.
Thimm O, Blasing O, Gibon Y, Nagel A, Meyer S, Kruger P, Selbig J, Muller LA, Rhee SY,
Stitt M. 2004. MAPMAN: a user-driven tool to display genomics data sets onto diagrams of
metabolic pathways and other biological processes. Plant J 37, 914-939.
Tognetti VB, Van Aken O, Morreel K, Vandenbroucke K, van de Cotte B, De Clercq I,
Chiwocha S, Fenske R, Prinsen E, Boerjan W, Genty B, Stubbs KA, Inze D, Van
Breusegem F. 2010. Perturbation of indole-3-butyric acid homeostasis by the UDP-
glucosyltransferase UGT74E2 modulates Arabidopsis architecture and water stress
tolerance. Plant Cell 22, 2660-2679.
Tognetti VB, Muhlenbock P, Van Breusegem F. 2012. Stress homeostasis- the redox and
auxin perspective. Plant Cell Environ 35, 321–333
.
Tseng I-C, Hong C-Y, Yu S-M, Ho T-HD. 2013. Abscisic acid-and stress-induced highly
proline-rich glycoproteins regulate root growth in rice. Plant Physiol 163, 118-134.
Tzin V, Galili G. 2010. The biosynthetic pathways for shikimate and aromatic amino acids
in Arabidopsis thaliana. Arabidopsis Book 8, e0132.
Ulmasov T, Murfett J, Hagen G, Guilfoyle TJ. 1997. Aux/IAA proteins repress expression
of reporter genes containing natural and highly active synthetic auxin response elements.
Plant Cell 9, 1963-1971.
Usadel B, Nagel A, Steinhauser D, Gibon Y, Blasing OE, Redestig H, Sreenivasulu N,
Krall L, Hannah MA, Poree F, Fernie AR, Stitt M. 2006. PageMan: an interactive ontology
tool to generate, display, and annotate overview graphs for profiling experiments. BMC
Bioinformatics 7, 535.
Crosstalk between auxin signaling and osmotic stress
180
Van Sandt VS, Suslov D, Verbelen J-P, Vissenberg K. 2007. Xyloglucan
endotransglucosylase activity loosens a plant cell wall. Ann Bot 100, 1467-1473.
Vandepoele K, Raes J, De Veylder L, Rouze P, Rombauts S, Inze D. 2002. Genome-wide
analysis of core cell cycle genes in Arabidopsis. Plant Cell 14, 903-916.
Vanneste S, Coppens F, Lee E, Donner TJ, Xie Z, Van Isterdael G, Dhondt S, De Winter
F, De Rybel B, Vuylsteke M. 2011. Developmental regulation of CYCA2s contributes to
tissue‐specific proliferation in Arabidopsis. EMBO J 30, 3430-3441.
Vanneste S, Friml J. 2009. Auxin: a trigger for change in plant development. Cell 136,
1005-1016.
Vile D, Pervent M, Belluau M, Vasseur F, Bresson J, Muller B, Granier C, Simonneau T.
2012. Arabidopsis growth under prolonged high temperature and water deficit:
independent or interactive effects? Plant Cell Environ 35, 702-718.
Westfall CS, Herrmann J, Chen Q, Wang S, Jez JM. 2010. Modulating plant hormones by
enzyme action: the GH3 family of acyl acid amido synthetases. Plant Signal Behav 5, 1607-
1612.
Wilkinson S, Davies WJ. 2010. Drought, ozone, ABA and ethylene: new insights from cell
to plant to community. Plant Cell Environ 33, 510-525.
Willats WG, McCartney L, Mackie W, Knox JP. 2001. Pectin: cell biology and prospects for
functional analysis. Plant Mol Biol 47, 9-27.
Wolf S, Hematy K, Hofte H. 2012. Growth control and cell wall signaling in plants. Annu
Rev Plant Biol 63, 381-407.
Woodward AW, Bartel B. 2005. Auxin: regulation, action, and interaction. Ann Bot 95,
707-735.
Crosstalk between auxin signaling and osmotic stress
181
Wuyts N, Palauqui JC, Conejero G, Verdeil JL, Granier C, Massonnet C. 2010. High-
contrast three-dimensional imaging of the Arabidopsis leaf enables the analysis of cell
dimensions in the epidermis and mesophyll. Plant Methods 6, 17.
Yamaguchi-Shinozaki K, Shinozaki K. 2006. Transcriptional regulatory networks in
cellular responses and tolerance to dehydration and cold stresses. Annu Rev Plant Biol 57,
781-803.
Zagorchev L, Kamenova P, Odjakova M. 2014. The role of plant cell wall proteins in
response to salt stress. ScientificWorldJournal 2014, 764089.
Zazimalova E, Murphy AS, Yang HB, Hoyerova K, Hosek P. 2010. Auxin Transporters -
Why So Many? Cold Spring Harb Perspect Biol 2.
Zhang Q, Li J, Zhang W, Yan S, Wang R, Zhao J, Li Y, Qi Z, Sun Z, Zhu Z. 2012. The
putative auxin efflux carrier OsPIN3t is involved in the drought stress response and
drought tolerance. Plant J 72, 805-816.
Zhao J, Williams CC, Last RL. 1998. Induction of Arabidopsis tryptophan pathway enzymes
and camalexin by amino acid starvation, oxidative stress, and an abiotic elicitor. Plant Cell
10, 359-370.
Zhao Y. 2012. Auxin biosynthesis: a simple two-step pathway converts tryptophan to
indole-3-acetic acid in plants. Mol Plant 5, 334-338.
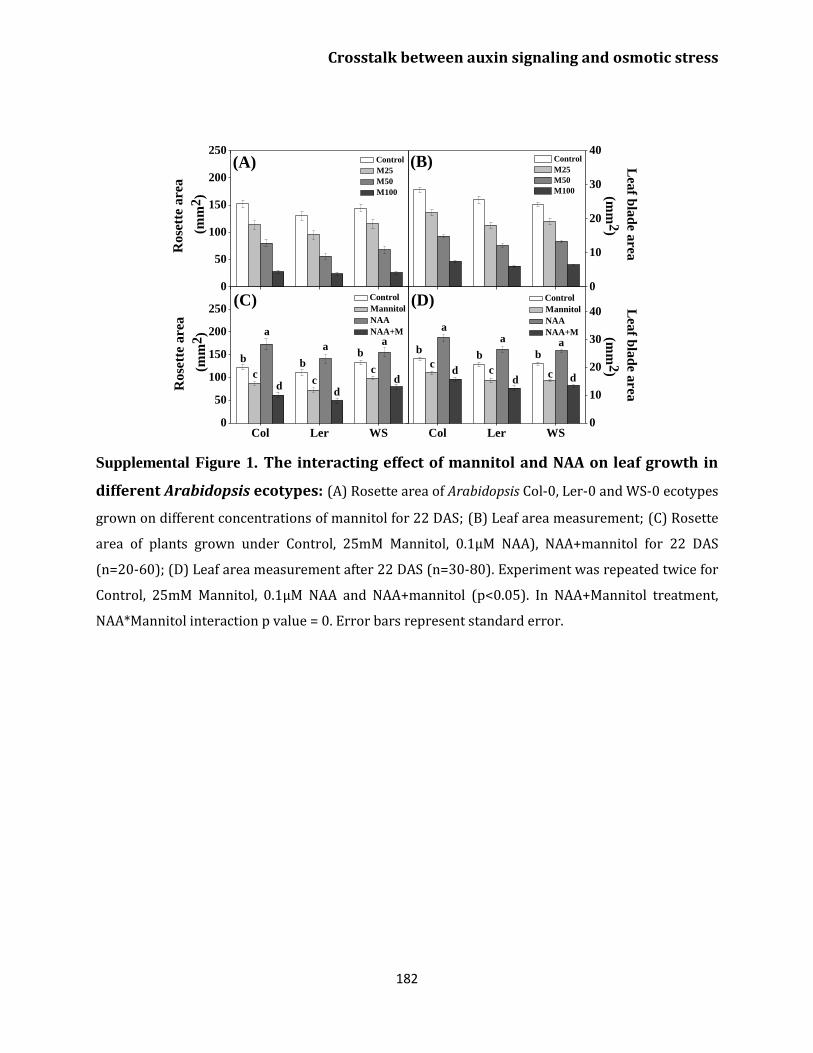
Crosstalk between auxin signaling and osmotic stress
182
Supplemental Figure 1. The interacting effect of mannitol and NAA on leaf growth in
different Arabidopsis ecotypes: (A) Rosette area of Arabidopsis Col-0, Ler-0 and WS-0 ecotypes
grown on different concentrations of mannitol for 22 DAS; (B) Leaf area measurement; (C) Rosette
area of plants grown under Control, 25mM Mannitol, 0.1µM NAA), NAA+mannitol for 22 DAS
(n=20-60); (D) Leaf area measurement after 22 DAS (n=30-80). Experiment was repeated twice for
Control, 25mM Mannitol, 0.1µM NAA and NAA+mannitol (p<0.05). In NAA+Mannitol treatment,
NAA*Mannitol interaction p value = 0. Error bars represent standard error.
0
50
100
150
200
250
Ro
sett
e a
rea
(mm
2)
Control
M25
M50
M100L
eaf b
lad
e area
(mm
2)
Control
M25
M50
M100
0
10
20
30
40
Col Ler WS0
50
100
150
200
250(D)(C)
(B)
d
dd
cc
c
bbb
aa
Ro
sett
e a
rea
(mm
2)
Control
Mannitol
NAA
NAA+Ma
(A)
Col Ler WS
ddd c c
c
a
aa
bbb
Lea
f bla
de a
rea
(mm
2)
Control
Mannitol
NAA
NAA+M
0
10
20
30
40
Chapter 4
Downregulation of KRPs promotes cell division
and endoreduplication in the leaves of Arabidopsis
thaliana
Shweta Kalve1, Dirk De Vos1,2, Markakis Marios Nektarios1,
Malgorzata A. Domagalska1, Joanna Stelmaszewska3, Lieven De
Veylder4, Arp Schnittger5 and Gerrit T.S. Beemster1*
1Department of Biology, University of Antwerp, Belgium
2Department of Mathematics and Computer Science, University of Antwerp,
Antwerp, Belgium
3Department of Reproduction and Gynecological Endocrinology Medical
University of Bialystok, Bialystok, Poland
4Department of Plant Systems Biology, VIB, 9052 Ghent, Belgium
5Department of Developmental Biology, University of Hamburg, Germany
*Corresponding Author
This chapter is an early draft for a publication
Contribution of S.K.- Performed most experiments, supervised J.S. and wrote the
manuscript

Multiple downregulation of KRPs
185
Abstract
Like in other eukaryotes, the plant cell cycle is tightly regulated by CDKs (cyclin-dependent
kinases), and their activity is negatively regulated by low molecular weight proteins known
as Kip-related proteins (KRPs). Seven KRPs have been reported in Arabidopsis and this
redundancy makes that mutation of one of them has no or very limited effect on plant
growth and development. This study focuses on the effect of downregulation of multiple
KRPs in parallel, particularly KRP4, KRP6 and KRP7 on Arabidopsis leaf growth. We used
single, double and triple T-DNA insertion mutants for the study. Our results demonstrate
that the loss of activity of single KRP genes does not affect leaf development except for
KRP4 which leads to growth reduction. Simultaneous reduction of the activity of two or
three KRPs enhances leaf growth, with the triple mutant having the most effect on mature
leaf size. Kinematic analysis showed, as expected, that increased cell proliferation was
responsible for the enlarged leaves of double and triple mutants. However, in combination
with the increased cell number, smaller cells were found in all the mutants. Remarkably,
we found that the increased leaf size was largely established prior to the time frame in
which we performed kinematic analysis, suggesting that the bigger leaves were already
determined in the seed. Indeed, we found that the triple mutant has significantly larger
seeds that contain larger embryos. Moreover, when similarly sized seeds are selected from
the size range found in mutant and wild type, the difference of mature leaf size of the
seedlings was absent. By means of mRNA sequencing we investigated the molecular
changes in proliferating and expanding leaves. The result showed an upregulation of genes
involved in DNA replication. Subsequently, flow-cytometry revealed that the inhibition of
multiple KRPs enhanced not only proliferation, but also endoreduplication. Hence, we
conclude that the downregulation of multiple KRPs promotes leaf growth by increasing cell
proliferation during seed development and DNA replication in growing leaves.
Multiple downregulation of KRPs
186
Introduction
The cell cycle is one of the most studied fundamental processes in multicellular organisms.
Like in all other organisms, the plant cell cycle progresses through four different phases:
G1, S, G2 and M. The transitions between G1 to S and G2 to M are tightly controlled by
phosphorylation of CDK (cyclin-dependent kinase)/CYC (cyclin) complexes, which initiates
the onset of DNA duplication and mitosis, respectively (Dewitte and Murray, 2003; Inze and
De Veylder, 2006). The KRPs (Kip related proteins) or ICKs (interactors/inhibitors of
cyclin-dependent kinase) are an important class of cell cycle inhibitors that regulate the
cell cycle progression by controlling CDK activity (De Veylder et al., 2007; Verkest et al.,
2005b; Wang et al., 2006). Plant KRPs share a limited homology with mammalian p27Kip1
proteins (Wang et al., 1997) and have been identified in many plant species, including
Arabidopsis (De Veylder et al., 2001; Lui et al., 2000; Zhou et al., 2002), tobacco (Jasinski et
al., 2002; 2003), tomato (Bisbis et al., 2006), alfalfa (Pettko-Szandtner et al., 2006), maize
(Coelho et al., 2005) and rice (Barroco et al., 2006; Yang et al., 2011).
All plant KRPs share a conserved C-terminally located 31-amino-acid CDK-binding domain
(De Veylder et al., 2001; Torres Acosta et al., 2011). Removal of this domain in KRP1 leads
to loss of CDK binding and inhibition activity (Zhou et al., 2003). Arabidopsis has seven KRP
genes which are divided into two groups according to their exon-intron organization, one
with three and another with four exons (Torres Acosta et al., 2011). These seven KRP genes
have distinct expression patterns in plants (De Veylder et al., 2001; Menges et al., 2005;
Ormenese et al., 2004; Wang et al., 2006).
Domain studies have elucidated that all the KRPs have a CDK/CYC binding site to interact
with A-type CDKs and D-type cyclins, while none of them were found to interact with B-
type cyclins (De Veylder et al., 2001; Van Leene et al., 2010; Wang et al., 1998; Zhou et al.,
2002). Moreover, in maize endosperm KRP1 and KRP2 inhibit CYCA1;3-associated CDK
activity (Coelho et al., 2005). Some reports suggest the interaction of KRPs with CDKB as
well (Nakai et al., 2006; Pettko-Szandtner et al., 2006). In addition to the CDK/CYC binding
site, KRPs contain several other functional domains and motifs, including a nuclear
Multiple downregulation of KRPs
187
localization domain, a CDK phosphorylation site, a protein degradation domain (PEST) and
a coiled-coil domain (Torres Acosta et al., 2011). Consistently, all Arabidopsis KRPs have
been shown to localize in the nucleus (Bird et al., 2007). Furthermore, CDK
phosphorylation sites were reported in KRP3, KRP4, KRP6 and KRP7 but the experimental
verification of the functionality of these phosphorylation sites is needed. PEST domains,
which are involved in protein degradation (Rogers et al., 1986) are present in Arabidopsis
KRP2, KRP4, KRP5 and KRP6 (De Veylder et al., 2001; Torres Acosta et al., 2011). Several
studies postulated that the level of KRPs are regulated by a 26S proteasome mediated
degradation pathway (Gusti et al., 2009; Jun et al., 2013; Kim et al., 2008; Lai et al., 2009;
Liu et al., 2008; Ren et al., 2008). In addition to other motifs, a coiled-coil domain was
suggested to be present in KRP1 which is important for mediating protein-protein
interaction (De Veylder et al., 2001; Torres Acosta et al., 2011).
In the last decades several overexpression studies of KRPs have been reported. Arabidopsis
plants overexpressing different KRPs have altered plant morphology and exhibit a
reduction in cell number and increased cell size, resulting in small, serrated leaves (Bemis
and Torii, 2007; De Veylder et al., 2001; Jasinski et al., 2002; Jun et al., 2013; Wang et al.,
2000; Zhou et al., 2002). In contrast, the constitutive expression of KRP5 had no effect on
organ size, but resulted in serrated leaves (Jegu et al., 2013). Several studies have also
reported that overexpression of KRP genes repressed endoreduplication (De Veylder et al.,
2001; Jasinski et al., 2002; Schnittger et al., 2003; Zhou et al., 2002) while few KRPs
triggered the endocycle transition (Jegu et al., 2013; Jun et al., 2013; Verkest et al., 2005a;
Weinl et al., 2005). In spite of detailed knowledge regarding the effects of KRP
overexpression, only few studies presented the consequences of downregulation, as KRP
genes are highly redundant and may compensate the reduced expression of other KRP gene
in the family. Silencing of six KRP genes led to dedifferentiation and hyperproliferation
(Anzola et al., 2010). On the contrary, downregulation of five KRPs was recently shown to
enhance plant growth and to upregulate the E2F pathway (Cheng et al., 2013).
Furthermore, a mutation in KRP2 increased lateral roots in Arabidopsis thaliana (Sanz et al.,
2011). Although, the effect of KRP inhibition on plant growth has been shown, it’s effect on
the regulation of cell division and endoreplication processes is currently not well
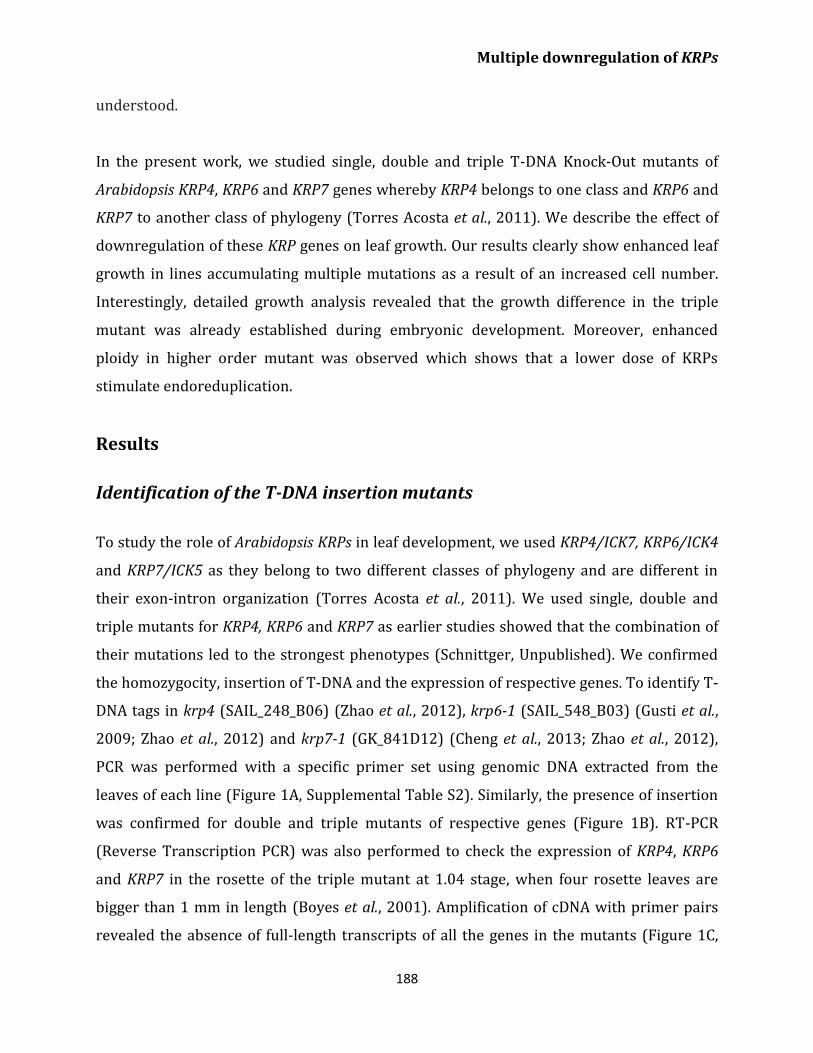
Multiple downregulation of KRPs
188
understood.
In the present work, we studied single, double and triple T-DNA Knock-Out mutants of
Arabidopsis KRP4, KRP6 and KRP7 genes whereby KRP4 belongs to one class and KRP6 and
KRP7 to another class of phylogeny (Torres Acosta et al., 2011). We describe the effect of
downregulation of these KRP genes on leaf growth. Our results clearly show enhanced leaf
growth in lines accumulating multiple mutations as a result of an increased cell number.
Interestingly, detailed growth analysis revealed that the growth difference in the triple
mutant was already established during embryonic development. Moreover, enhanced
ploidy in higher order mutant was observed which shows that a lower dose of KRPs
stimulate endoreduplication.
Results
Identification of the T-DNA insertion mutants
To study the role of Arabidopsis KRPs in leaf development, we used KRP4/ICK7, KRP6/ICK4
and KRP7/ICK5 as they belong to two different classes of phylogeny and are different in
their exon-intron organization (Torres Acosta et al., 2011). We used single, double and
triple mutants for KRP4, KRP6 and KRP7 as earlier studies showed that the combination of
their mutations led to the strongest phenotypes (Schnittger, Unpublished). We confirmed
the homozygocity, insertion of T-DNA and the expression of respective genes. To identify T-
DNA tags in krp4 (SAIL_248_B06) (Zhao et al., 2012), krp6-1 (SAIL_548_B03) (Gusti et al.,
2009; Zhao et al., 2012) and krp7-1 (GK_841D12) (Cheng et al., 2013; Zhao et al., 2012),
PCR was performed with a specific primer set using genomic DNA extracted from the
leaves of each line (Figure 1A, Supplemental Table S2). Similarly, the presence of insertion
was confirmed for double and triple mutants of respective genes (Figure 1B). RT-PCR
(Reverse Transcription PCR) was also performed to check the expression of KRP4, KRP6
and KRP7 in the rosette of the triple mutant at 1.04 stage, when four rosette leaves are
bigger than 1 mm in length (Boyes et al., 2001). Amplification of cDNA with primer pairs
revealed the absence of full-length transcripts of all the genes in the mutants (Figure 1C,
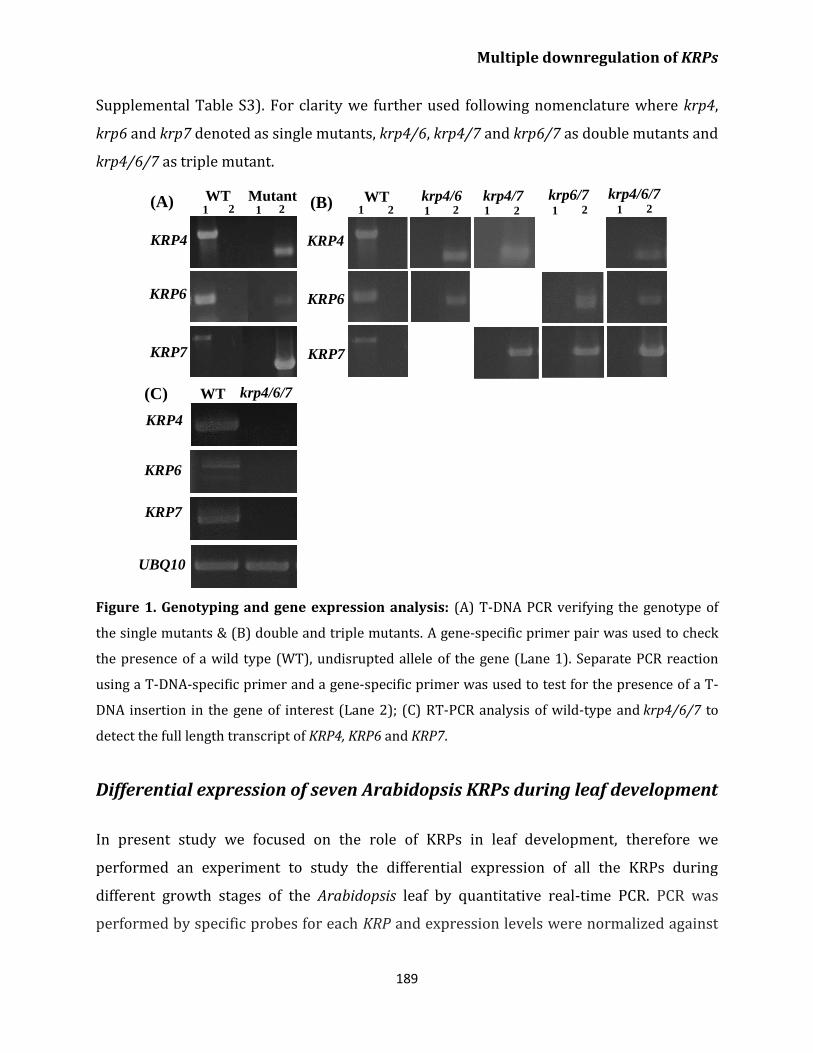
Multiple downregulation of KRPs
189
Supplemental Table S3). For clarity we further used following nomenclature where krp4,
krp6 and krp7 denoted as single mutants, krp4/6, krp4/7 and krp6/7 as double mutants and
krp4/6/7 as triple mutant.
Figure 1. Genotyping and gene expression analysis: (A) T-DNA PCR verifying the genotype of
the single mutants & (B) double and triple mutants. A gene-specific primer pair was used to check
the presence of a wild type (WT), undisrupted allele of the gene (Lane 1). Separate PCR reaction
using a T-DNA-specific primer and a gene-specific primer was used to test for the presence of a T-
DNA insertion in the gene of interest (Lane 2); (C) RT-PCR analysis of wild-type and krp4/6/7 to
detect the full length transcript of KRP4, KRP6 and KRP7.
Differential expression of seven Arabidopsis KRPs during leaf development
In present study we focused on the role of KRPs in leaf development, therefore we
performed an experiment to study the differential expression of all the KRPs during
different growth stages of the Arabidopsis leaf by quantitative real-time PCR. PCR was
performed by specific probes for each KRP and expression levels were normalized against
KRP4
KRP6
KRP7
WT Mutant1 21 2
(A)
KRP6
KRP4
KRP7
WT krp4/6 krp4/7 krp6/7 krp4/6/71 2 1 2 1 2 1 2 1 2(B)
krp4/6/7
UBQ10
KRP4
KRP6
KRP7
WT(C)
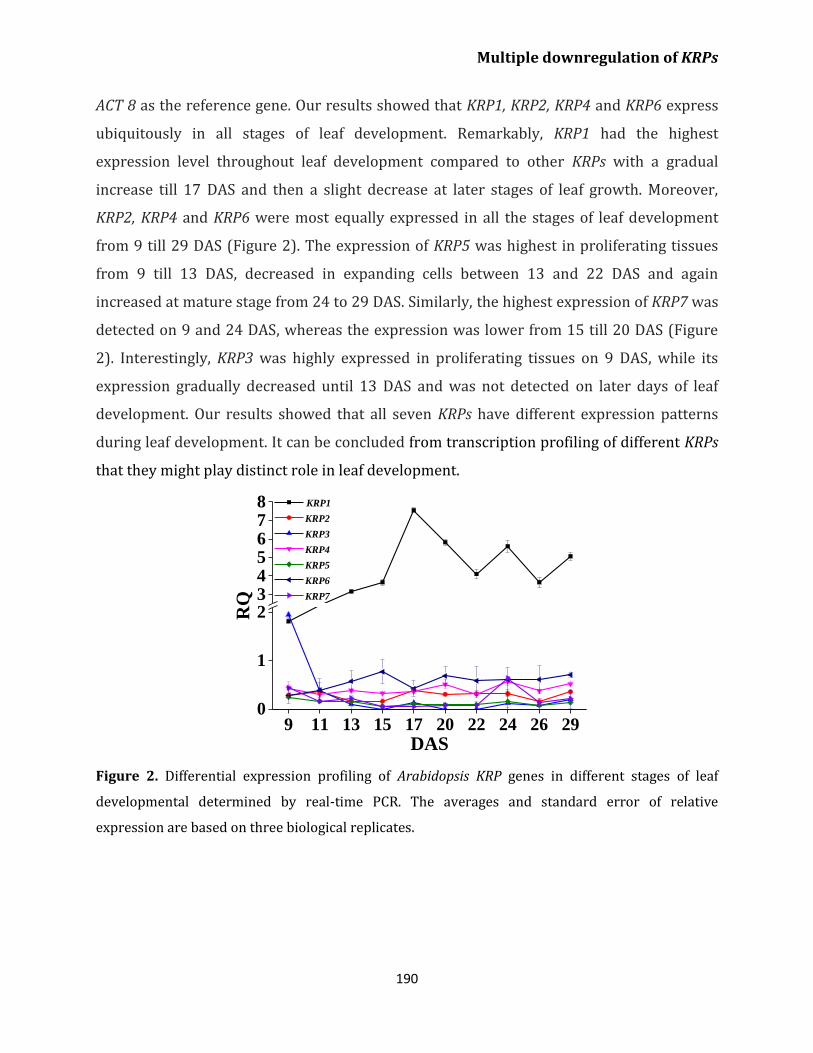
Multiple downregulation of KRPs
190
ACT 8 as the reference gene. Our results showed that KRP1, KRP2, KRP4 and KRP6 express
ubiquitously in all stages of leaf development. Remarkably, KRP1 had the highest
expression level throughout leaf development compared to other KRPs with a gradual
increase till 17 DAS and then a slight decrease at later stages of leaf growth. Moreover,
KRP2, KRP4 and KRP6 were most equally expressed in all the stages of leaf development
from 9 till 29 DAS (Figure 2). The expression of KRP5 was highest in proliferating tissues
from 9 till 13 DAS, decreased in expanding cells between 13 and 22 DAS and again
increased at mature stage from 24 to 29 DAS. Similarly, the highest expression of KRP7 was
detected on 9 and 24 DAS, whereas the expression was lower from 15 till 20 DAS (Figure
2). Interestingly, KRP3 was highly expressed in proliferating tissues on 9 DAS, while its
expression gradually decreased until 13 DAS and was not detected on later days of leaf
development. Our results showed that all seven KRPs have different expression patterns
during leaf development. It can be concluded from transcription profiling of different KRPs
that they might play distinct role in leaf development.
Figure 2. Differential expression profiling of Arabidopsis KRP genes in different stages of leaf
developmental determined by real-time PCR. The averages and standard error of relative
expression are based on three biological replicates.
9 11 13 15 17 20 22 24 26 290
1
2345678
RQ
DAS
KRP1
KRP2
KRP3
KRP4
KRP5
KRP6
KRP7
Multiple downregulation of KRPs
191
Inhibition of KRPs causes enhanced leaf growth by increasing cell number
To study the effect of KRP4, KRP6 and KRP7 downregulation on leaf growth, we measured
leaf blade area and epidermal cell area of first leaf pair at 26 DAS in single (krp4, krp6,
krp7), double (krp4/6, krp4/7, krp6/7) and triple (krp4/6/7) mutants. We found no
significant changes in leaf blade area of krp6 and krp7, whereas krp4 was smaller than the
wild type. Downregulation of multiple KRPs led to significantly enlarged leaves. Among
double mutants krp4/6 and krp6/7 had around 10-15% larger leaves whereas krp4/7
showed the increase of 23% in leaf area compared to Col-0. However, the triple mutant
krp4/6/7 had the most pronounced leaf growth resulting in an increase of 33% in leaf
blade area (Figure 3A; Supplemental Figure 1A).
Figure 3. Growth analysis of mutants: Change in (A) leaf area; (B) Cell size; (C) Cell number; (D)
Stomatal index of the single (krp4, krp6, krp7), double (krp4/6, krp4/7, krp6/7) and triple mutant
(krp4/6/7) relative to the wild type (Col-0). For leaf area measurements 20-100 leaves whereas for
cellular measurements 3-9 leaves were used. Error bars represent standard error. An asterisk
indicates a significant difference at *P<0.05, **P<0.01 and ***P<0.001.
Col
krp4
krp6
krp7
krp4/
6
krp4/
7
krp6/
7
krp4/
6/7
0.0
0.2
0.4
0.6
0.8
1.0
1.2
1.4 ***
******
***
***
R
ela
tiv
e
Lea
f a
rea
(A)
Col
krp4
krp6
krp7
krp4/
6
krp4/
7
krp6/
7
krp4/
6/7
0.0
0.5
1.0
1.5
2.0(C)
******
***
R
ela
tiv
e
Cel
l n
um
ber
Col
krp4
krp6
krp7
krp4/
6
krp4/
7
krp6/
7
krp4/
6/7
0.0
0.2
0.4
0.6
0.8
1.0
1.2(B)
********
R
ela
tiv
e
Cel
l si
ze
Col
krp4
krp6
krp7
krp4/
6
krp4/
7
krp6/
7
krp4/
6/7
0.0
0.2
0.4
0.6
0.8
1.0
1.2(D) * *****
R
ela
tiv
e
Sto
ma
tal
Ind
ex
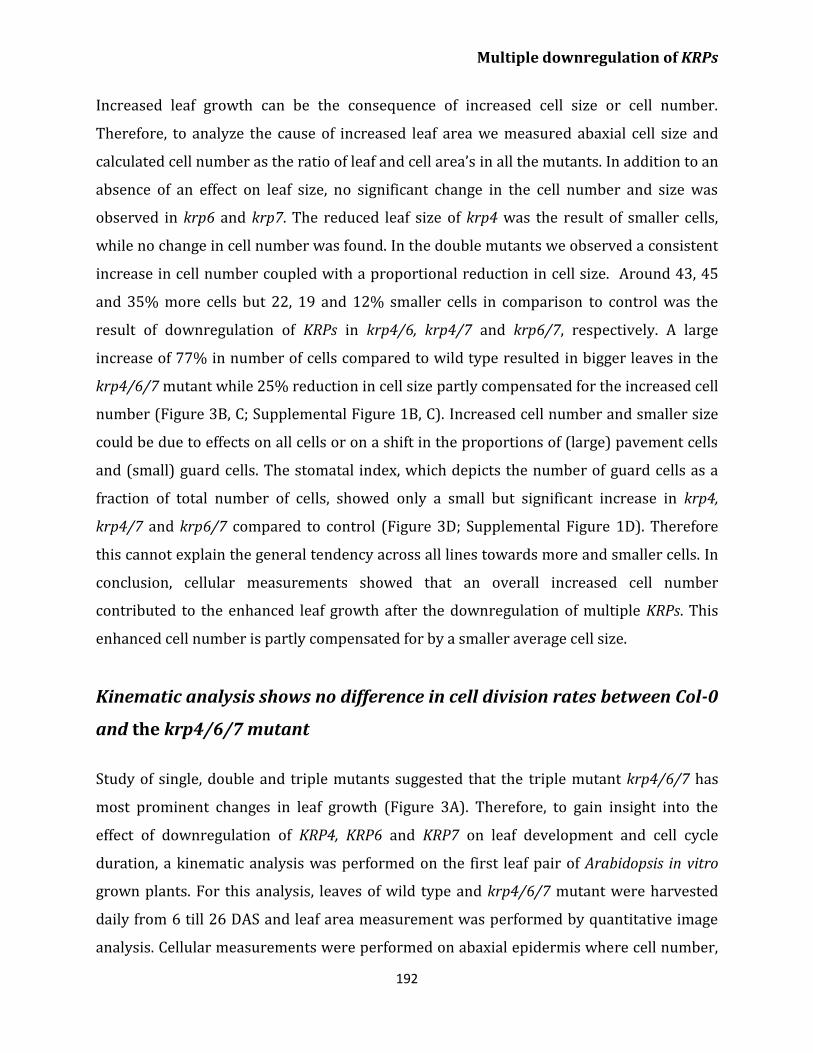
Multiple downregulation of KRPs
192
Increased leaf growth can be the consequence of increased cell size or cell number.
Therefore, to analyze the cause of increased leaf area we measured abaxial cell size and
calculated cell number as the ratio of leaf and cell area’s in all the mutants. In addition to an
absence of an effect on leaf size, no significant change in the cell number and size was
observed in krp6 and krp7. The reduced leaf size of krp4 was the result of smaller cells,
while no change in cell number was found. In the double mutants we observed a consistent
increase in cell number coupled with a proportional reduction in cell size. Around 43, 45
and 35% more cells but 22, 19 and 12% smaller cells in comparison to control was the
result of downregulation of KRPs in krp4/6, krp4/7 and krp6/7, respectively. A large
increase of 77% in number of cells compared to wild type resulted in bigger leaves in the
krp4/6/7 mutant while 25% reduction in cell size partly compensated for the increased cell
number (Figure 3B, C; Supplemental Figure 1B, C). Increased cell number and smaller size
could be due to effects on all cells or on a shift in the proportions of (large) pavement cells
and (small) guard cells. The stomatal index, which depicts the number of guard cells as a
fraction of total number of cells, showed only a small but significant increase in krp4,
krp4/7 and krp6/7 compared to control (Figure 3D; Supplemental Figure 1D). Therefore
this cannot explain the general tendency across all lines towards more and smaller cells. In
conclusion, cellular measurements showed that an overall increased cell number
contributed to the enhanced leaf growth after the downregulation of multiple KRPs. This
enhanced cell number is partly compensated for by a smaller average cell size.
Kinematic analysis shows no difference in cell division rates between Col-0
and the krp4/6/7 mutant
Study of single, double and triple mutants suggested that the triple mutant krp4/6/7 has
most prominent changes in leaf growth (Figure 3A). Therefore, to gain insight into the
effect of downregulation of KRP4, KRP6 and KRP7 on leaf development and cell cycle
duration, a kinematic analysis was performed on the first leaf pair of Arabidopsis in vitro
grown plants. For this analysis, leaves of wild type and krp4/6/7 mutant were harvested
daily from 6 till 26 DAS and leaf area measurement was performed by quantitative image
analysis. Cellular measurements were performed on abaxial epidermis where cell number,
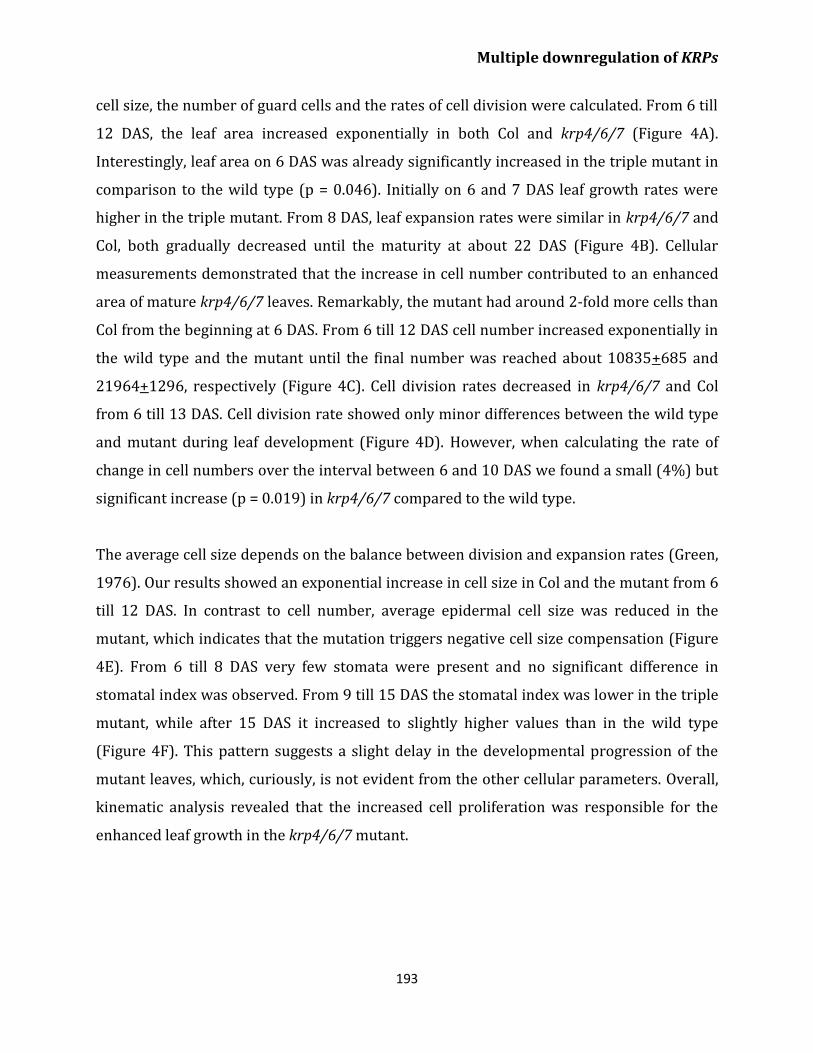
Multiple downregulation of KRPs
193
cell size, the number of guard cells and the rates of cell division were calculated. From 6 till
12 DAS, the leaf area increased exponentially in both Col and krp4/6/7 (Figure 4A).
Interestingly, leaf area on 6 DAS was already significantly increased in the triple mutant in
comparison to the wild type (p = 0.046). Initially on 6 and 7 DAS leaf growth rates were
higher in the triple mutant. From 8 DAS, leaf expansion rates were similar in krp4/6/7 and
Col, both gradually decreased until the maturity at about 22 DAS (Figure 4B). Cellular
measurements demonstrated that the increase in cell number contributed to an enhanced
area of mature krp4/6/7 leaves. Remarkably, the mutant had around 2-fold more cells than
Col from the beginning at 6 DAS. From 6 till 12 DAS cell number increased exponentially in
the wild type and the mutant until the final number was reached about 10835+685 and
21964+1296, respectively (Figure 4C). Cell division rates decreased in krp4/6/7 and Col
from 6 till 13 DAS. Cell division rate showed only minor differences between the wild type
and mutant during leaf development (Figure 4D). However, when calculating the rate of
change in cell numbers over the interval between 6 and 10 DAS we found a small (4%) but
significant increase (p = 0.019) in krp4/6/7 compared to the wild type.
The average cell size depends on the balance between division and expansion rates (Green,
1976). Our results showed an exponential increase in cell size in Col and the mutant from 6
till 12 DAS. In contrast to cell number, average epidermal cell size was reduced in the
mutant, which indicates that the mutation triggers negative cell size compensation (Figure
4E). From 6 till 8 DAS very few stomata were present and no significant difference in
stomatal index was observed. From 9 till 15 DAS the stomatal index was lower in the triple
mutant, while after 15 DAS it increased to slightly higher values than in the wild type
(Figure 4F). This pattern suggests a slight delay in the developmental progression of the
mutant leaves, which, curiously, is not evident from the other cellular parameters. Overall,
kinematic analysis revealed that the increased cell proliferation was responsible for the
enhanced leaf growth in the krp4/6/7 mutant.
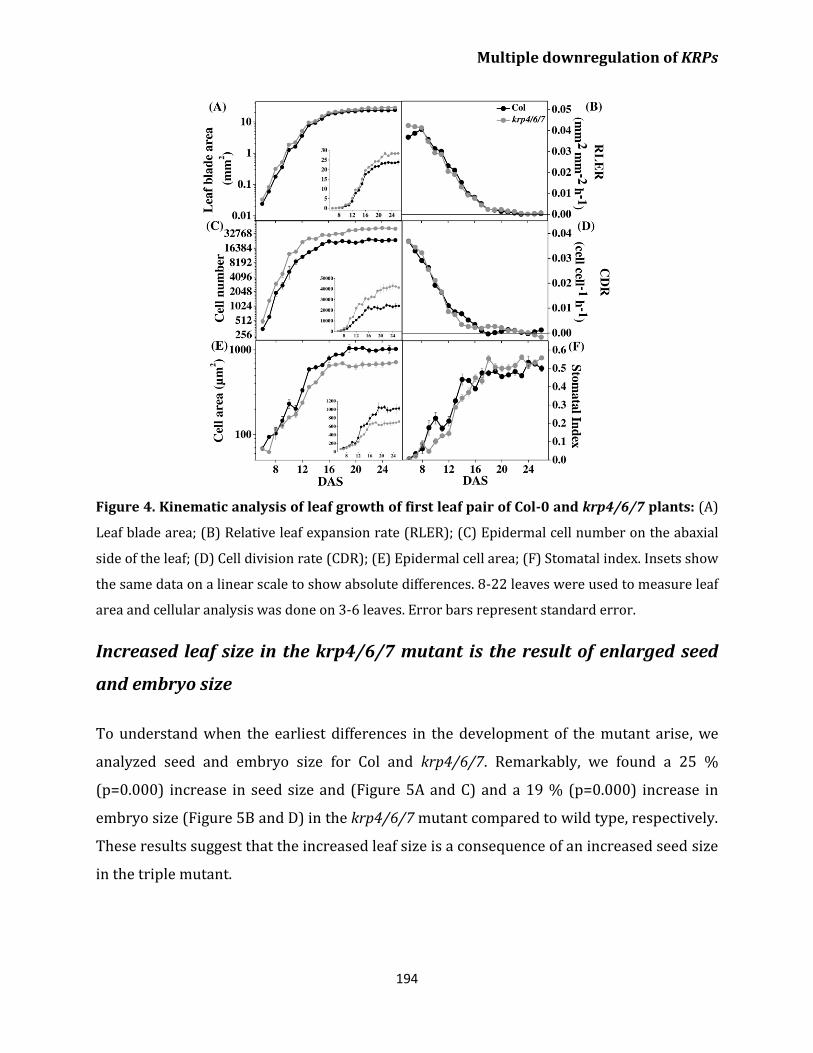
Multiple downregulation of KRPs
194
Figure 4. Kinematic analysis of leaf growth of first leaf pair of Col-0 and krp4/6/7 plants: (A)
Leaf blade area; (B) Relative leaf expansion rate (RLER); (C) Epidermal cell number on the abaxial
side of the leaf; (D) Cell division rate (CDR); (E) Epidermal cell area; (F) Stomatal index. Insets show
the same data on a linear scale to show absolute differences. 8-22 leaves were used to measure leaf
area and cellular analysis was done on 3-6 leaves. Error bars represent standard error.
Increased leaf size in the krp4/6/7 mutant is the result of enlarged seed
and embryo size
To understand when the earliest differences in the development of the mutant arise, we
analyzed seed and embryo size for Col and krp4/6/7. Remarkably, we found a 25 %
(p=0.000) increase in seed size and (Figure 5A and C) and a 19 % (p=0.000) increase in
embryo size (Figure 5B and D) in the krp4/6/7 mutant compared to wild type, respectively.
These results suggest that the increased leaf size is a consequence of an increased seed size
in the triple mutant.
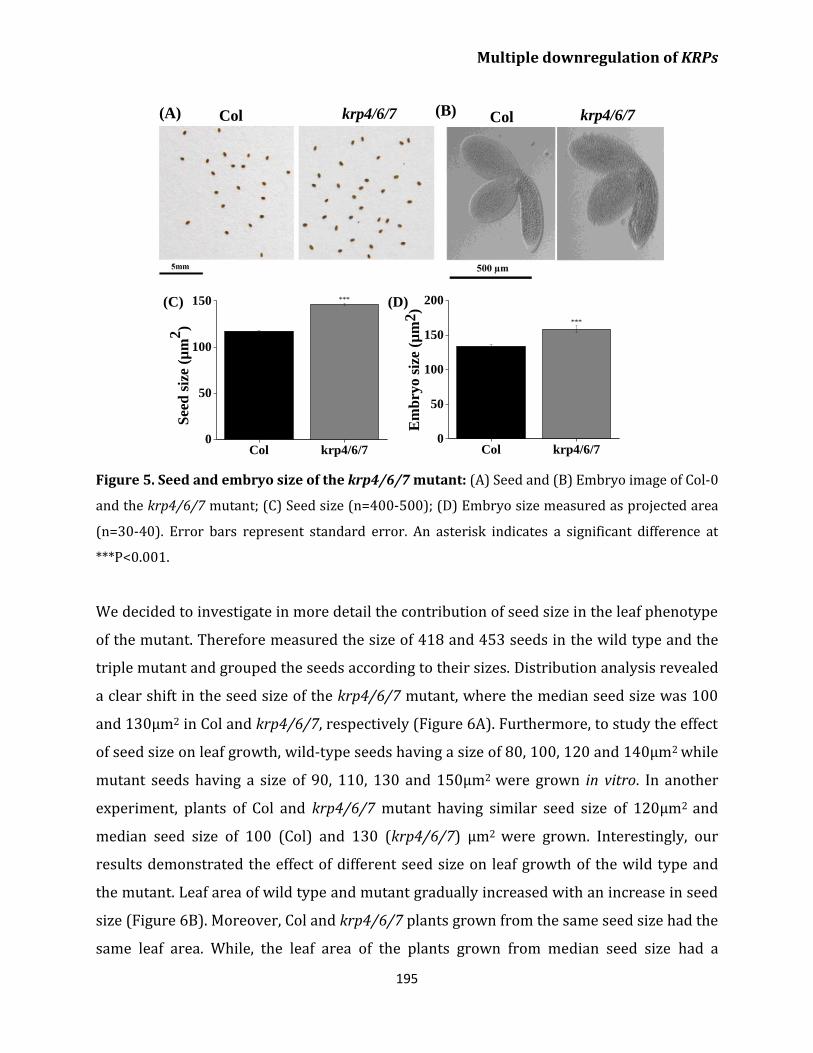
Multiple downregulation of KRPs
195
Figure 5. Seed and embryo size of the krp4/6/7 mutant: (A) Seed and (B) Embryo image of Col-0
and the krp4/6/7 mutant; (C) Seed size (n=400-500); (D) Embryo size measured as projected area
(n=30-40). Error bars represent standard error. An asterisk indicates a significant difference at
***P<0.001.
We decided to investigate in more detail the contribution of seed size in the leaf phenotype
of the mutant. Therefore measured the size of 418 and 453 seeds in the wild type and the
triple mutant and grouped the seeds according to their sizes. Distribution analysis revealed
a clear shift in the seed size of the krp4/6/7 mutant, where the median seed size was 100
and 130µm2 in Col and krp4/6/7, respectively (Figure 6A). Furthermore, to study the effect
of seed size on leaf growth, wild-type seeds having a size of 80, 100, 120 and 140µm2 while
mutant seeds having a size of 90, 110, 130 and 150µm2 were grown in vitro. In another
experiment, plants of Col and krp4/6/7 mutant having similar seed size of 120µm2 and
median seed size of 100 (Col) and 130 (krp4/6/7) µm2 were grown. Interestingly, our
results demonstrated the effect of different seed size on leaf growth of the wild type and
the mutant. Leaf area of wild type and mutant gradually increased with an increase in seed
size (Figure 6B). Moreover, Col and krp4/6/7 plants grown from the same seed size had the
same leaf area. While, the leaf area of the plants grown from median seed size had a
Col krp4/6/70
50
100
150 ***
See
d s
ize
(µm
2)
(C)
Col krp4/6/70
50
100
150
200
***
Em
bry
o s
ize
(µm
2)
(D)
(A) Col krp4/6/7 Col krp4/6/7(B)
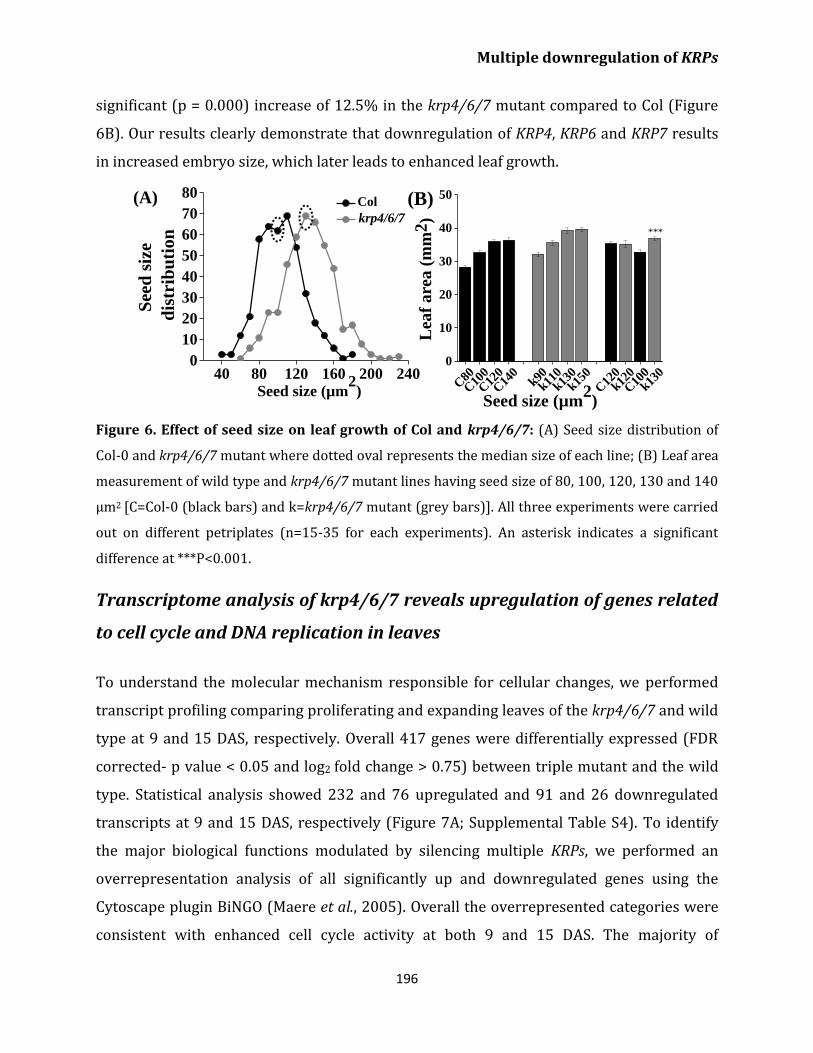
Multiple downregulation of KRPs
196
significant (p = 0.000) increase of 12.5% in the krp4/6/7 mutant compared to Col (Figure
6B). Our results clearly demonstrate that downregulation of KRP4, KRP6 and KRP7 results
in increased embryo size, which later leads to enhanced leaf growth.
Figure 6. Effect of seed size on leaf growth of Col and krp4/6/7: (A) Seed size distribution of
Col-0 and krp4/6/7 mutant where dotted oval represents the median size of each line; (B) Leaf area
measurement of wild type and krp4/6/7 mutant lines having seed size of 80, 100, 120, 130 and 140
µm2 [C=Col-0 (black bars) and k=krp4/6/7 mutant (grey bars)]. All three experiments were carried
out on different petriplates (n=15-35 for each experiments). An asterisk indicates a significant
difference at ***P<0.001.
Transcriptome analysis of krp4/6/7 reveals upregulation of genes related
to cell cycle and DNA replication in leaves
To understand the molecular mechanism responsible for cellular changes, we performed
transcript profiling comparing proliferating and expanding leaves of the krp4/6/7 and wild
type at 9 and 15 DAS, respectively. Overall 417 genes were differentially expressed (FDR
corrected- p value < 0.05 and log2 fold change > 0.75) between triple mutant and the wild
type. Statistical analysis showed 232 and 76 upregulated and 91 and 26 downregulated
transcripts at 9 and 15 DAS, respectively (Figure 7A; Supplemental Table S4). To identify
the major biological functions modulated by silencing multiple KRPs, we performed an
overrepresentation analysis of all significantly up and downregulated genes using the
Cytoscape plugin BiNGO (Maere et al., 2005). Overall the overrepresented categories were
consistent with enhanced cell cycle activity at both 9 and 15 DAS. The majority of
40 80 120 160 200 2400
10
20
30
40
50
60
70
80
See
d s
ize
dis
trib
uti
on
Seed size (µm2)
Col
krp4/6/7
(A)
C80
C10
0
C12
0
C14
0k90
k110k13
0k15
0
C12
0k12
0
C10
0k13
00
10
20
30
40
50
***
Lea
f a
rea
(m
m2
)
Seed size (µm2)
(B)
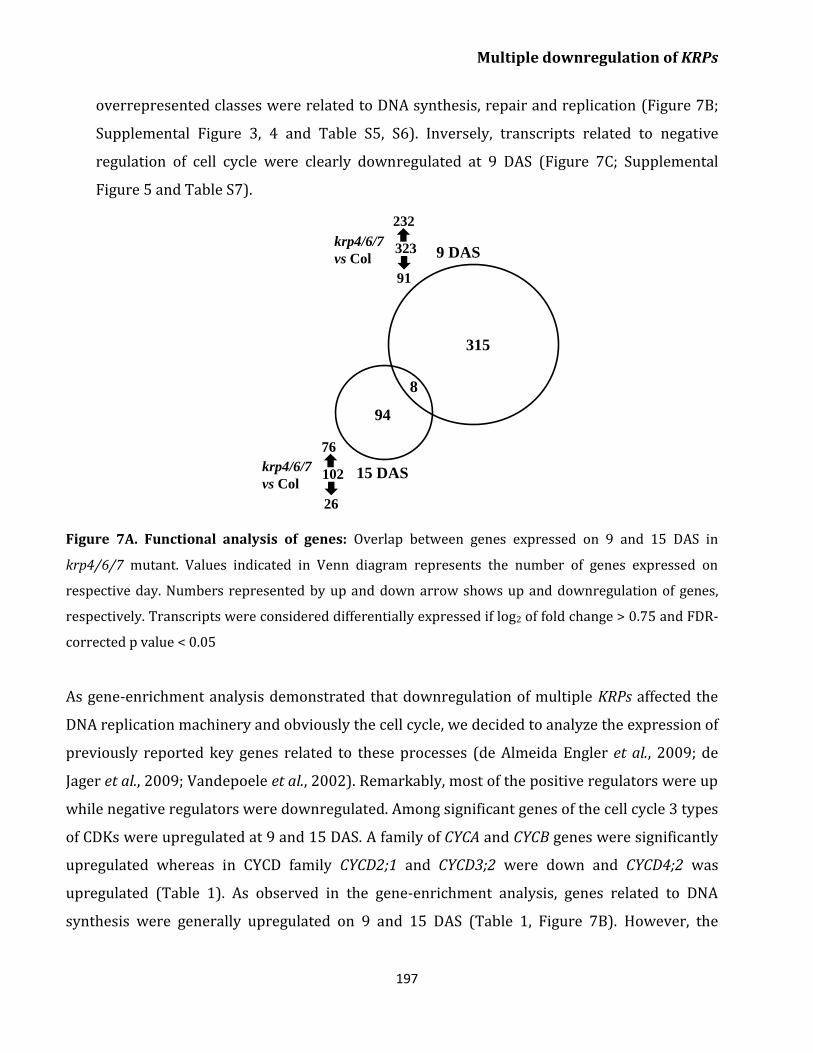
Multiple downregulation of KRPs
197
overrepresented classes were related to DNA synthesis, repair and replication (Figure 7B;
Supplemental Figure 3, 4 and Table S5, S6). Inversely, transcripts related to negative
regulation of cell cycle were clearly downregulated at 9 DAS (Figure 7C; Supplemental
Figure 5 and Table S7).
Figure 7A. Functional analysis of genes: Overlap between genes expressed on 9 and 15 DAS in
krp4/6/7 mutant. Values indicated in Venn diagram represents the number of genes expressed on
respective day. Numbers represented by up and down arrow shows up and downregulation of genes,
respectively. Transcripts were considered differentially expressed if log2 of fold change > 0.75 and FDR-
corrected p value < 0.05
As gene-enrichment analysis demonstrated that downregulation of multiple KRPs affected the
DNA replication machinery and obviously the cell cycle, we decided to analyze the expression of
previously reported key genes related to these processes (de Almeida Engler et al., 2009; de
Jager et al., 2009; Vandepoele et al., 2002). Remarkably, most of the positive regulators were up
while negative regulators were downregulated. Among significant genes of the cell cycle 3 types
of CDKs were upregulated at 9 and 15 DAS. A family of CYCA and CYCB genes were significantly
upregulated whereas in CYCD family CYCD2;1 and CYCD3;2 were down and CYCD4;2 was
upregulated (Table 1). As observed in the gene-enrichment analysis, genes related to DNA
synthesis were generally upregulated on 9 and 15 DAS (Table 1, Figure 7B). However, the
8
94
315
9 DAS
15 DAS
323
232
91
krp4/6/7
vs Col
102
76
26
krp4/6/7
vs Col
Multiple downregulation of KRPs
198
expression of DEL3 and RBR was also enhanced. Expression of KRP4, KRP6 and KRP7, targeted
genes of the triple mutant, were decreased. Few reads in KRP7 was found in RNAseq (Table 1;
Supplemental Figure 6) but the absence of a full length transcript by RT-PCR confirmed the
downregulation of KRP7 in GK_841D12 (Figure 1C). Previous studies have also reported the
absence of KRP7 transcript in krp7-1 (GK_841D12) (Cheng et al., 2013; Zhao et al., 2012).
Interestingly, expression of other KRPs was significantly increased on 9 DAS. Furthermore,
transcripts related to CCS52B and WEE1 were increased on 9 and 15 DAS, respectively (Table
1). In conclusion, our transcriptome profiling suggests that downregulation of KRP4, KRP6 and
KRP7 enhances the expression of other genes related to the cell cycle and DNA replication not
only in proliferating cells at 9 DAS, but also in expanding cells at 15 DAS.
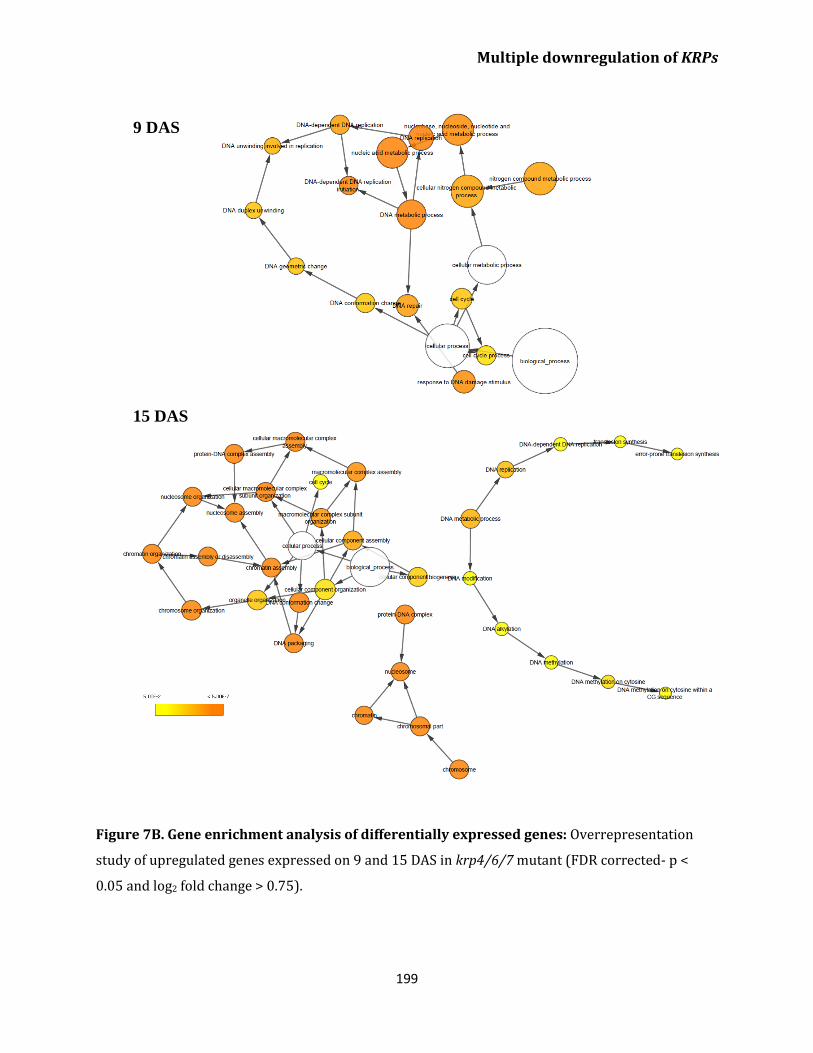
Multiple downregulation of KRPs
199
Figure 7B. Gene enrichment analysis of differentially expressed genes: Overrepresentation
study of upregulated genes expressed on 9 and 15 DAS in krp4/6/7 mutant (FDR corrected- p <
0.05 and log2 fold change > 0.75).
9 DAS
15 DAS
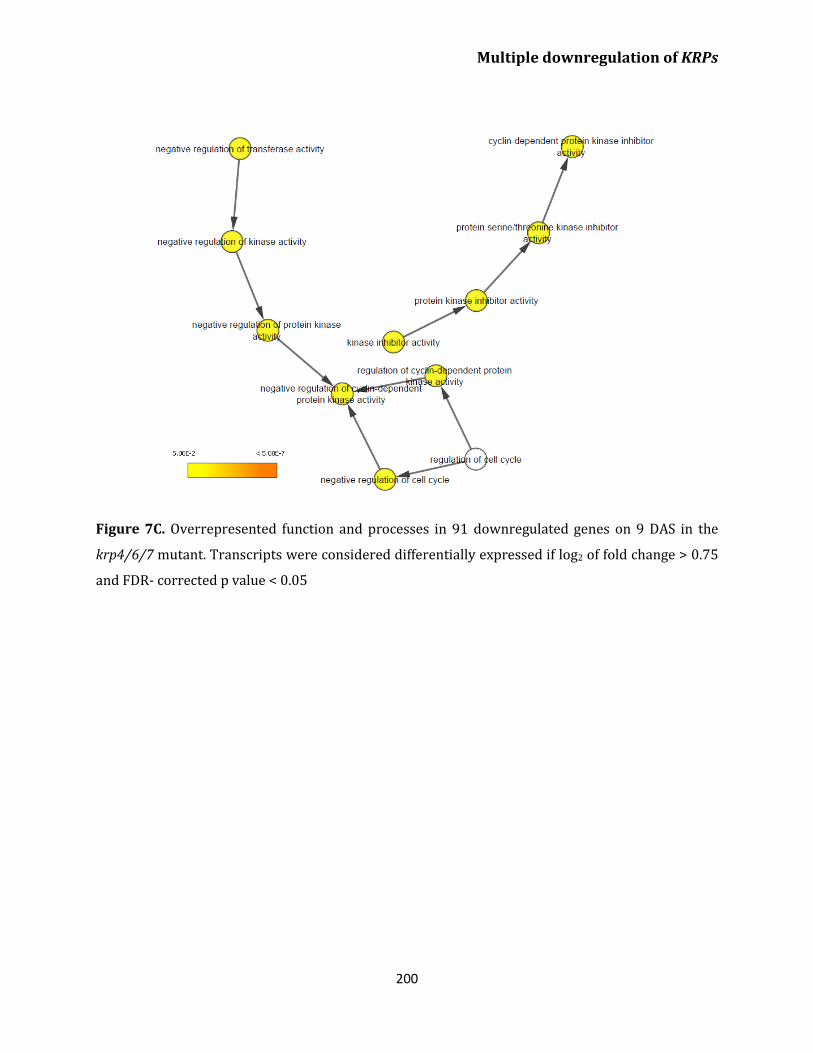
Multiple downregulation of KRPs
200
Figure 7C. Overrepresented function and processes in 91 downregulated genes on 9 DAS in the
krp4/6/7 mutant. Transcripts were considered differentially expressed if log2 of fold change > 0.75
and FDR- corrected p value < 0.05
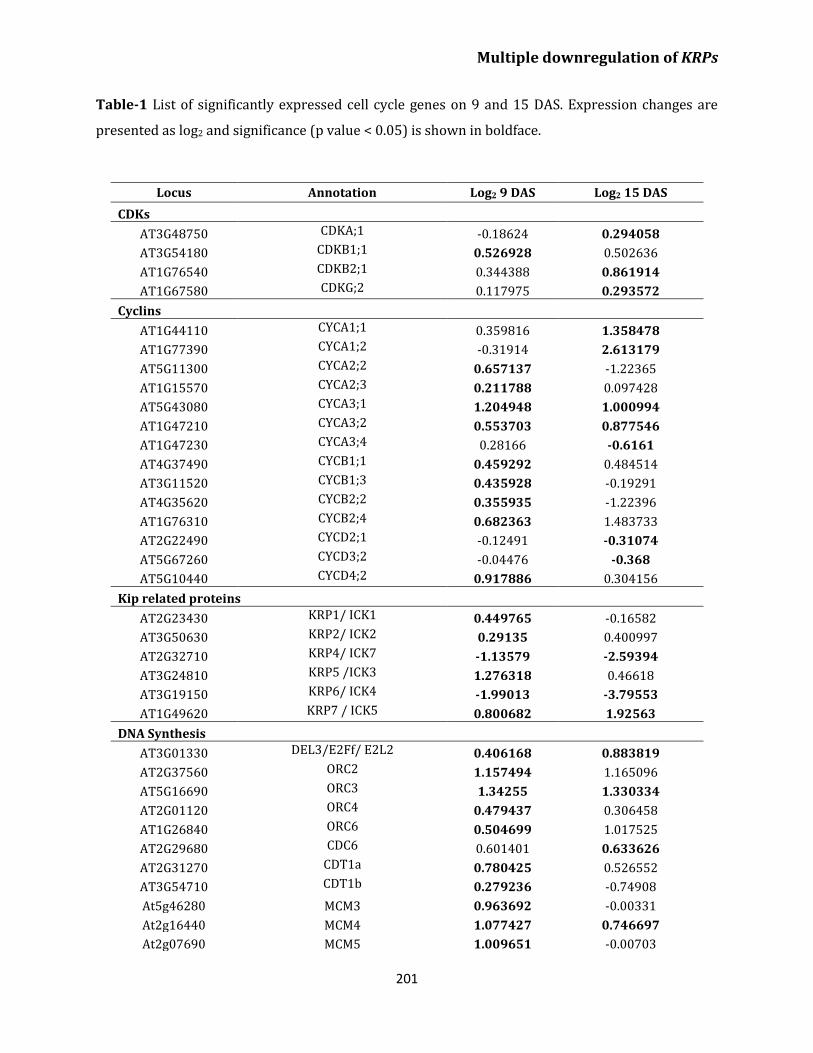
Multiple downregulation of KRPs
201
Table-1 List of significantly expressed cell cycle genes on 9 and 15 DAS. Expression changes are
presented as log2 and significance (p value < 0.05) is shown in boldface.
Locus Annotation Log2 9 DAS Log2 15 DAS
CDKs
AT3G48750 CDKA;1 -0.18624 0.294058
AT3G54180 CDKB1;1 0.526928 0.502636
AT1G76540 CDKB2;1 0.344388 0.861914
AT1G67580 CDKG;2 0.117975 0.293572
Cyclins
AT1G44110 CYCA1;1 0.359816 1.358478
AT1G77390 CYCA1;2 -0.31914 2.613179
AT5G11300 CYCA2;2 0.657137 -1.22365
AT1G15570 CYCA2;3 0.211788 0.097428
AT5G43080 CYCA3;1 1.204948 1.000994
AT1G47210 CYCA3;2 0.553703 0.877546
AT1G47230 CYCA3;4 0.28166 -0.6161
AT4G37490 CYCB1;1 0.459292 0.484514
AT3G11520 CYCB1;3 0.435928 -0.19291
AT4G35620 CYCB2;2 0.355935 -1.22396
AT1G76310 CYCB2;4 0.682363 1.483733
AT2G22490 CYCD2;1 -0.12491 -0.31074
AT5G67260 CYCD3;2 -0.04476 -0.368
AT5G10440 CYCD4;2 0.917886 0.304156
Kip related proteins
AT2G23430 KRP1/ ICK1 0.449765 -0.16582
AT3G50630 KRP2/ ICK2 0.29135 0.400997
AT2G32710 KRP4/ ICK7 -1.13579 -2.59394
AT3G24810 KRP5 /ICK3 1.276318 0.46618
AT3G19150 KRP6/ ICK4 -1.99013 -3.79553
AT1G49620 KRP7 / ICK5 0.800682 1.92563
DNA Synthesis
AT3G01330 DEL3/E2Ff/ E2L2 0.406168 0.883819
AT2G37560 ORC2 1.157494 1.165096
AT5G16690 ORC3 1.34255 1.330334
AT2G01120 ORC4 0.479437 0.306458
AT1G26840 ORC6 0.504699 1.017525
AT2G29680 CDC6 0.601401 0.633626
AT2G31270 CDT1a 0.780425 0.526552
AT3G54710 CDT1b 0.279236 -0.74908
At5g46280 MCM3 0.963692 -0.00331
At2g16440 MCM4 1.077427 0.746697
At2g07690 MCM5 1.009651 -0.00703
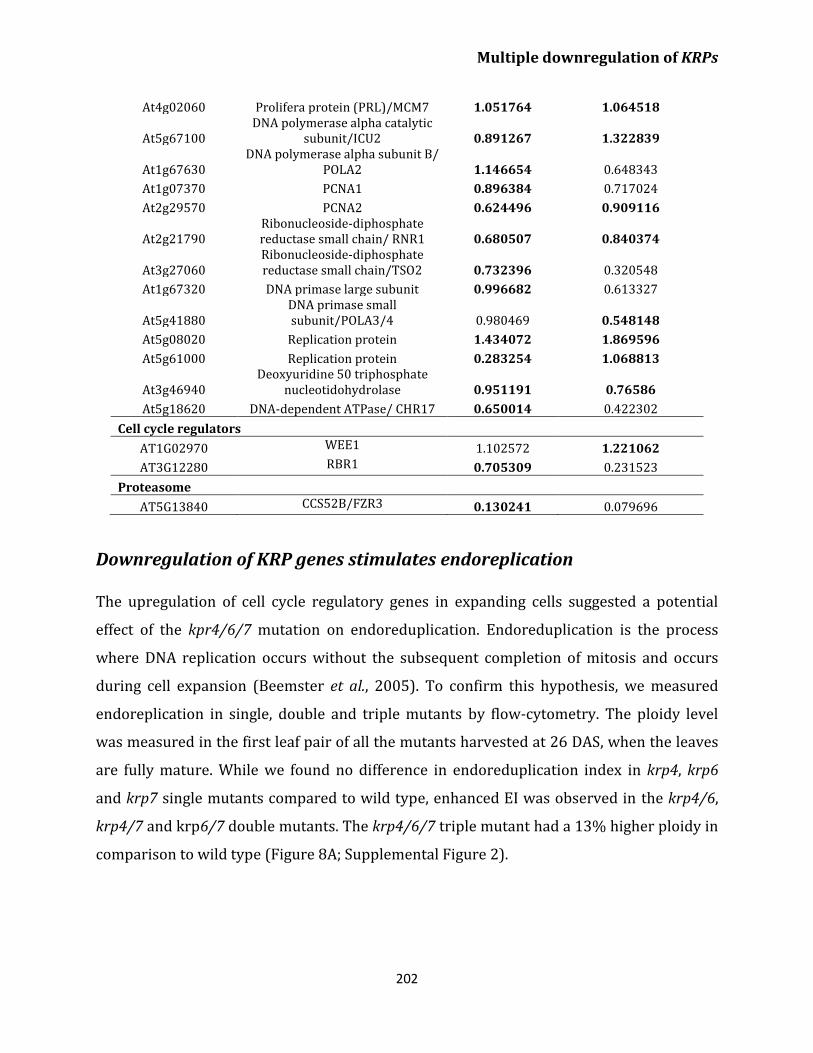
Multiple downregulation of KRPs
202
Downregulation of KRP genes stimulates endoreplication
The upregulation of cell cycle regulatory genes in expanding cells suggested a potential
effect of the kpr4/6/7 mutation on endoreduplication. Endoreduplication is the process
where DNA replication occurs without the subsequent completion of mitosis and occurs
during cell expansion (Beemster et al., 2005). To confirm this hypothesis, we measured
endoreplication in single, double and triple mutants by flow-cytometry. The ploidy level
was measured in the first leaf pair of all the mutants harvested at 26 DAS, when the leaves
are fully mature. While we found no difference in endoreduplication index in krp4, krp6
and krp7 single mutants compared to wild type, enhanced EI was observed in the krp4/6,
krp4/7 and krp6/7 double mutants. The krp4/6/7 triple mutant had a 13% higher ploidy in
comparison to wild type (Figure 8A; Supplemental Figure 2).
At4g02060 Prolifera protein (PRL)/MCM7 1.051764 1.064518
At5g67100 DNA polymerase alpha catalytic
subunit/ICU2 0.891267 1.322839
At1g67630 DNA polymerase alpha subunit B/
POLA2 1.146654 0.648343
At1g07370 PCNA1 0.896384 0.717024
At2g29570 PCNA2 0.624496 0.909116
At2g21790 Ribonucleoside-diphosphate reductase small chain/ RNR1 0.680507 0.840374
At3g27060 Ribonucleoside-diphosphate reductase small chain/TSO2 0.732396 0.320548
At1g67320 DNA primase large subunit 0.996682 0.613327
At5g41880 DNA primase small subunit/POLA3/4 0.980469 0.548148
At5g08020 Replication protein 1.434072 1.869596
At5g61000 Replication protein 0.283254 1.068813
At3g46940 Deoxyuridine 50 triphosphate
nucleotidohydrolase 0.951191 0.76586
At5g18620 DNA-dependent ATPase/ CHR17 0.650014 0.422302
Cell cycle regulators
AT1G02970 WEE1 1.102572 1.221062
AT3G12280 RBR1 0.705309 0.231523
Proteasome
AT5G13840 CCS52B/FZR3 0.130241 0.079696
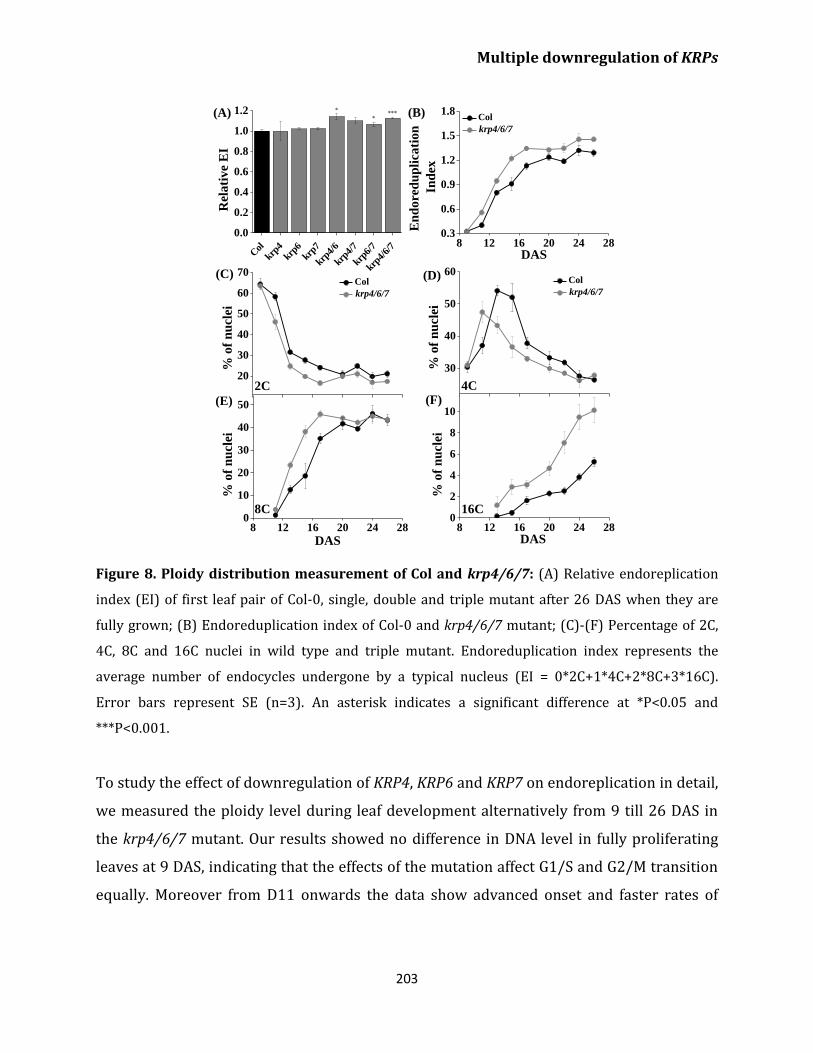
Multiple downregulation of KRPs
203
Figure 8. Ploidy distribution measurement of Col and krp4/6/7: (A) Relative endoreplication
index (EI) of first leaf pair of Col-0, single, double and triple mutant after 26 DAS when they are
fully grown; (B) Endoreduplication index of Col-0 and krp4/6/7 mutant; (C)-(F) Percentage of 2C,
4C, 8C and 16C nuclei in wild type and triple mutant. Endoreduplication index represents the
average number of endocycles undergone by a typical nucleus (EI = 0*2C+1*4C+2*8C+3*16C).
Error bars represent SE (n=3). An asterisk indicates a significant difference at *P<0.05 and
***P<0.001.
To study the effect of downregulation of KRP4, KRP6 and KRP7 on endoreplication in detail,
we measured the ploidy level during leaf development alternatively from 9 till 26 DAS in
the krp4/6/7 mutant. Our results showed no difference in DNA level in fully proliferating
leaves at 9 DAS, indicating that the effects of the mutation affect G1/S and G2/M transition
equally. Moreover from D11 onwards the data show advanced onset and faster rates of
20
30
40
50
60
70
% o
f n
ucl
ei
Col
krp4/6/7
2C
(C)
8 12 16 20 24 280
10
20
30
40
50
% o
f n
ucl
ei
DAS
8C
(E)
8 12 16 20 24 280
2
4
6
8
10
% o
f n
ucl
ei
DAS
16C
(F)
30
40
50
60
% o
f n
ucl
ei
Col
krp4/6/7
4C
(D)
Col
krp4
krp6
krp7
krp4/
6
krp4/
7
krp6/
7
krp4/
6/7
0.0
0.2
0.4
0.6
0.8
1.0
1.2(A) ****
*
Rel
ati
ve
EI
8 12 16 20 24 280.3
0.6
0.9
1.2
1.5
1.8
En
dore
du
pli
cati
on
Ind
ex
DAS
Col
krp4/6/7
(B)
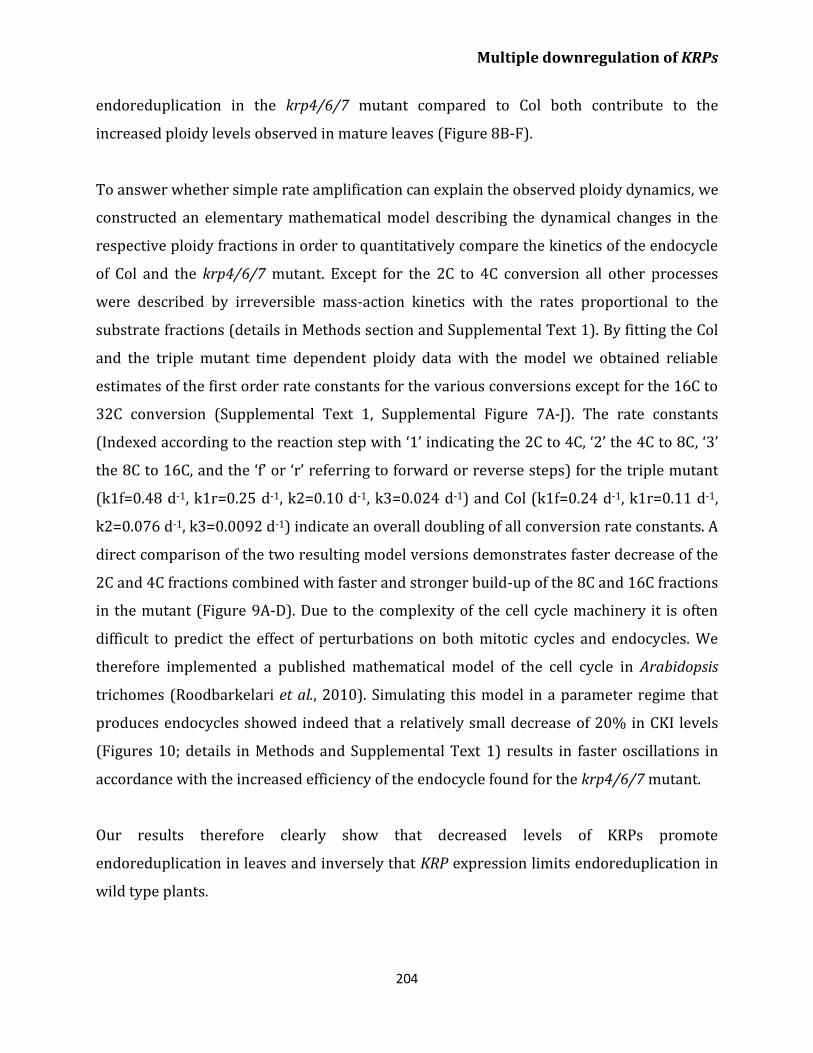
Multiple downregulation of KRPs
204
endoreduplication in the krp4/6/7 mutant compared to Col both contribute to the
increased ploidy levels observed in mature leaves (Figure 8B-F).
To answer whether simple rate amplification can explain the observed ploidy dynamics, we
constructed an elementary mathematical model describing the dynamical changes in the
respective ploidy fractions in order to quantitatively compare the kinetics of the endocycle
of Col and the krp4/6/7 mutant. Except for the 2C to 4C conversion all other processes
were described by irreversible mass-action kinetics with the rates proportional to the
substrate fractions (details in Methods section and Supplemental Text 1). By fitting the Col
and the triple mutant time dependent ploidy data with the model we obtained reliable
estimates of the first order rate constants for the various conversions except for the 16C to
32C conversion (Supplemental Text 1, Supplemental Figure 7A-J). The rate constants
(Indexed according to the reaction step with ‘1’ indicating the 2C to 4C, ‘2’ the 4C to 8C, ‘3’
the 8C to 16C, and the ‘f’ or ‘r’ referring to forward or reverse steps) for the triple mutant
(k1f=0.48 d-1, k1r=0.25 d-1, k2=0.10 d-1, k3=0.024 d-1) and Col (k1f=0.24 d-1, k1r=0.11 d-1,
k2=0.076 d-1, k3=0.0092 d-1) indicate an overall doubling of all conversion rate constants. A
direct comparison of the two resulting model versions demonstrates faster decrease of the
2C and 4C fractions combined with faster and stronger build-up of the 8C and 16C fractions
in the mutant (Figure 9A-D). Due to the complexity of the cell cycle machinery it is often
difficult to predict the effect of perturbations on both mitotic cycles and endocycles. We
therefore implemented a published mathematical model of the cell cycle in Arabidopsis
trichomes (Roodbarkelari et al., 2010). Simulating this model in a parameter regime that
produces endocycles showed indeed that a relatively small decrease of 20% in CKI levels
(Figures 10; details in Methods and Supplemental Text 1) results in faster oscillations in
accordance with the increased efficiency of the endocycle found for the krp4/6/7 mutant.
Our results therefore clearly show that decreased levels of KRPs promote
endoreduplication in leaves and inversely that KRP expression limits endoreduplication in
wild type plants.
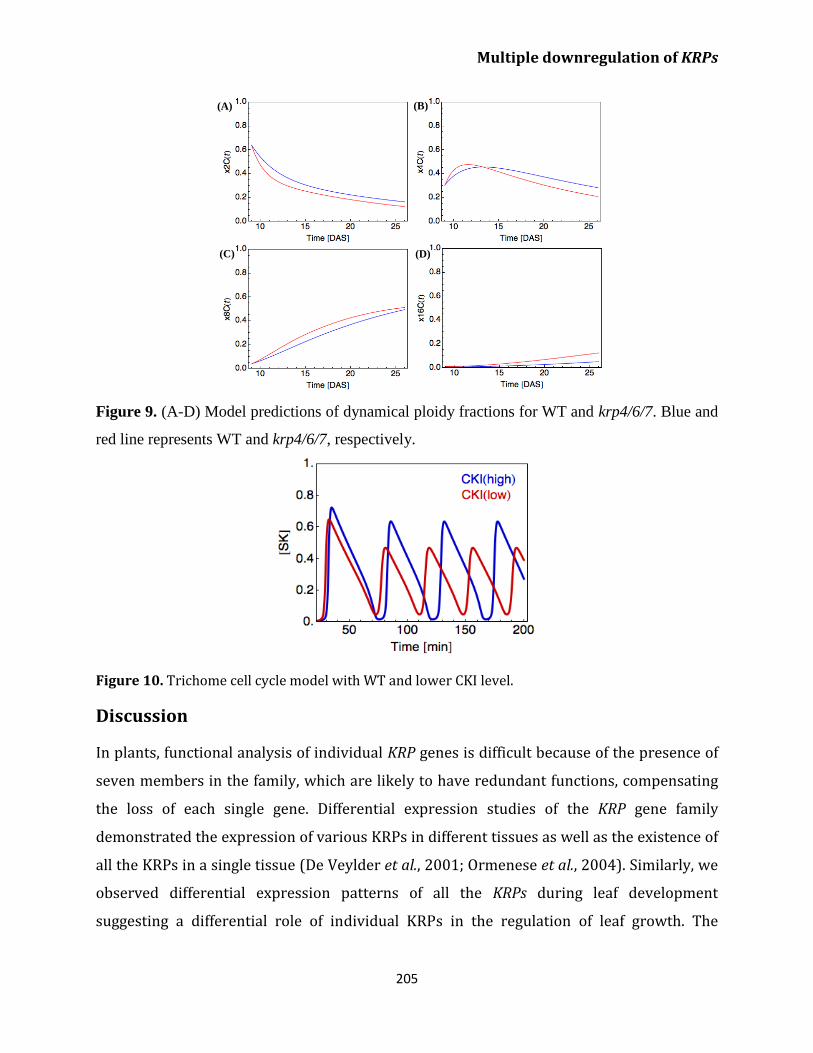
Multiple downregulation of KRPs
205
Figure 9. (A-D) Model predictions of dynamical ploidy fractions for WT and krp4/6/7. Blue and
red line represents WT and krp4/6/7, respectively.
Figure 10. Trichome cell cycle model with WT and lower CKI level.
Discussion
In plants, functional analysis of individual KRP genes is difficult because of the presence of
seven members in the family, which are likely to have redundant functions, compensating
the loss of each single gene. Differential expression studies of the KRP gene family
demonstrated the expression of various KRPs in different tissues as well as the existence of
all the KRPs in a single tissue (De Veylder et al., 2001; Ormenese et al., 2004). Similarly, we
observed differential expression patterns of all the KRPs during leaf development
suggesting a differential role of individual KRPs in the regulation of leaf growth. The
(A) (B)
(C) (D)
Multiple downregulation of KRPs
206
presence of multiple CDK inhibitors in leaves can be predicted to regulate the activity of
various CDKs in different developmental stages.
To obtain more insight for the role of individual KRP, downregulation of an individual gene
is important. However, due to the functional redundancy of the KRP gene family
phenotypes are typically not observed in mutants of individual family members. Therefore,
most of the studies were based on over/mild/miss-expression of KRP genes (De Veylder et
al., 2001; Jegu et al., 2013; Jun et al., 2013; Schnittger et al., 2003; Verkest et al., 2005a).
These studies showed that the enhanced expression of KRPs negatively affect leaf growth
by inhibiting cell division. Therefore, to explore the function of KRP4, KRP6 and KRP7 genes
in leaf growth and development, we used a downregulation approach and studied single,
double and triple T-DNA insertion mutants for respective genes. Our result showed no
major changes in single mutants while concurrent silencing of two or three genes
accelerates leaf growth. This could be the reason of the functional similarity of KRPs in
plants (Torres Acosta et al., 2011). Similarly, a recent study has also demonstrated that
downregulation of multiple KRP genes increased plant growth (Cheng et al., 2013).
One of the important finding of our results is that the increased leaf size in the krp4/6/7
triple mutant was influenced by enhanced embryonic development which suggests that the
mutation in KRPs affects early development which ultimately results in enhanced organ
growth. Seed size is an important parameter for improving crop yield and the plants having
large seeds were reported to enhance plant growth and development and were competent
to survive under different environmental stress conditions (Harper et al., 1970; Kaydan
and Yagmur, 2008; Khurana and Singh, 2000). Moreover, previous studies in monocots
have shown a role of KRPs in seed development. Overexpression of KRP1 was reported to
reduce seed filling and affects the production of endosperm cells in rice (Barroco et al.,
2006). Moreover, KRP1 and KRP2 were found to inhibit CDK activity in maize endosperm
(Coelho et al., 2005). Our study opens a new field of research which can demonstrate the
role of KRPs in embryonic development as the specific role of KRPs in seed development is
not well defined.
Multiple downregulation of KRPs
207
Furthermore, our study in leaves focusing in proliferating and expanding tissues however,
provides a clear insight into how cell cycle activity is affected and how this translates into
organ size differences. Kinematic analysis showed that the increased leaf growth was the
result of increased proliferation in double and triple mutants. Consistent with the growth
analysis, the transcriptome study also showed upregulation of cell cycle related genes.
KRPs were reported to interact with CDKA and/or CYCD, demonstrates that the key target
of KRPs is CDKA-CYCD complexes (Van Leene et al., 2010, Wang et al., 2006). Indeed,
downregulation of three KRPs showed enhanced expression of CDKA and CYCD4 in the
triple mutant. Curiously, the expression of other CYCDs such as CYCD2 and CYCD3 were
decreased. Recent study showed that KRP5 and CYCD3 has antagonistic activity (Jegu et al.,
2013) which was also reflected in our results as the expression of KRP5 was induced after
the inhibition of KRP4, KRP6 and KRP7. Remarkably, we also observed the increased
expression of the CYCA and CYCB family. It has been shown before that KRP1 and KRP2
repress CYCA-CDK activity in maize (Coelho et al., 2005) whereas the interaction with
CYCB was not observed. Increased expression of CDKB after the inhibition of three KRP
genes in the krp4/6/7 mutant suggests transcriptional interaction between CDKB and KRP.
In vitro pull-down assay has also indicated that KRP interacts with CYCD2/CDKB in
Arabidopsis (Nakai et al., 2006). Increased expression of CDKB1 and CDKB2 reveals that
downregulation of KRPs promote G2-M transition and therefore increase proliferation.
Remarkably, the downregulation of KRP4, KRP6 and KRP7 increased the expression of
KRP1, KRP2 and KRP5 in the triple mutant suggesting a functional compensation in the KRP
gene family. This could be the reason that the downregulation phenotype of KRP genes in
triple mutant was not as strong as the phenotype of the KRP overexpression lines (De
Veylder et al., 2001; Jun et al., 2013; Verkest et al., 2005a). Analogous to our results Cheng
et al. (2013) also demonstrated enhanced expression of different CDKs and cyclin genes in
the ick1/2/5/6/7 quintuple mutant.
Our results also showed the upregulation of the retinoblastoma-related (RBR) protein, a
transcriptional repressor for E2F/DP complex in the triple mutant. Increased expression of
RBR can be the result of high CDK activity as the phosphorylation of RBR by CDKs releases
RBR from E2F/DP and activates the expression of S phase genes (Boniotti and Gutierrez,
Multiple downregulation of KRPs
208
2001; Nakagami et al., 2002). Enhanced RBR expression in the triple mutant could activate
the E2F pathway. We also observed the enhanced expression of DEL3, a member of atypical
E2F family that encodes DP-E2F-Like Protein (Lammens et al., 2009). A previous study has
shown that DEL3 controls cell expansion by repressing cell wall biosynthesis genes in roots
and hypocotyls of Arabidopsis (Ramirez-Parra et al., 2004). Therefore, it is tempting to
suggest that the smaller cells of triple mutant are the result of increased expression of DEL3
which in turn inhibit cell expansion. Consistent with the observation of enhanced
expression of RBR and DEL, our results also showed increased expression of E2F target
genes such as MCM3, ICU2, POLA, TSO1, HTA6, KLP2 and ORC1 (de Jager et al., 2009)
(Supplemental Tables S5 and 6), suggests that the downregulation of KRPs upregulate E2F
pathway. We also found the upregulation of G2-M specific negative regulator of cell cycle
such as WEE1. DNA damage conditions were seen to induce the expression of WEE1 which
is putatively involved in the inhibitory phosphorylation of CDKs (De Schutter et al., 2007).
Our transcriptome results clearly showed the enhancement of DNA synthesis and repair
machinery in the triple mutant which can be correlated with the increased expression of
WEE1.
In addition to a stimulation of proliferation, the triple mutant also showed upregulation of
endoreplication (reviewed by De Veylder et al., 2011; Massonnet et al., 2011), which
suggests that together with G1-S, G2-M transition is also upregulated by inhibition of KRPs.
This is consistent with the study which showed that KRP2 suppress both cell cycle and
endocycle (De Veylder et al., 2001). Moreover, endocycle is regulated separately in
developmental window (Jacqmard et al., 1999) which could be the cause of an enhanced
endoreduplication in krp4/6/7. Secondly, CYCD3s have been reported to restrain endocycle
(Dewitte et al., 2007) and a recent study showed that KRP5 promote endoreduplication by
inhibiting CYCD3;1 (Jegu et al., 2013). Similarly, our transcript profiling showed enhanced
expression of KRP5 and downregulation of CYCD3;2 in krp4/6/7, which can also be
predicted as a cause of enhanced endoreplication. Additionally, mathematical simulation of
the cell cycle also provides a theoretical mechanism explaining a twofold rate-enhancement
in endoreplication by inhibition of KRPs.
Multiple downregulation of KRPs
209
Previous studies have shown that endoreduplication is positively correlated with cell size
where changes in ploidy levels affect cell size in leaves (del Pozo et al., 2006; Tojo et al.,
2009; Verkest et al., 2005a). In contrast, our study showed negative covariation between
endoreduplication and cell size where increased endoreplication was accompanied by
decreased cell area.
According to Green (1976) relative rate change of cell size is determined by the balance
between the relative surface extension and cell division rates. Therefore, it can be
predicted that the smaller cell size of krp4/6/7 is the result of increased cell proliferation
while constant leaf surface expansion. Moreover, previous studies have postulated that
reduced cell number cause increased cell size in leaves of plants overexpressing KRPs (De
Veylder et al., 2001; Verkest et al., 2005a) and this phenomenon was called as
compensation (Beemster et al., 2003; Ferjani et al., 2010; Horiguchi and Tsukaya, 2011;
Tsukaya, 2002). Our results showed enhanced cell proliferation and reduced cell size in the
leaves of krp4/6/7 mutant which seems to be opposite of the prototypic compensation.
Similarly, the more and smaller cells (msc) mutants have increased cell number and smaller
cells in leaves (Usami et al., 2009). This suggests that the increase in cell number can
negatively influence cell size during leaf development.
Material and Methods
Plant material and growth conditions
The Arabidopsis T-DNA insertion lines for KRP/ICK genes used in this study were krp4
(At2g32710, SAIL_248_B06), krp6-1 (At3g19150, SAIL_548_B03) and krp7-1 (At1g49620,
GK_841D12). Double and triple mutants of these T-DNA insertion lines were created by
crosses. The SAIL and GABI-Kat lines are in Col-0 background. Mutant and wild type seeds
were sterilized in 70% ethanol for 1 minute and 5% bleach for 10 minutes followed by
rinsing with water and sown on half-strength MS (Murashige and Skoog, 1962) medium
(Duchefa, The Netherlands) supplemented with 1% sucrose and 0.8% plant agar (Duchefa
Multiple downregulation of KRPs
210
Biochemie) in 150x25 mm round petri dishes (Falcon® tissue culture dishes, VWR). After
stratification at 4°C for 2 days plates were transferred to a growth chamber with an air
temperature of 22°C and shelves cooled to 19°C under a 16 h day [80-90 µmols-1m-2 s-1
photosynthetically active radiation (PAR), supplemented by fluorescent tubes (cool white,
brand)] and 8 h night regime.
Genotyping and gene expression analysis
Genomic DNA of T-DNA insertion lines and Col-0 was isolated from rosette leaves for
genotyping analysis by PCR. Total RNA of whole rosette at 1.04 stage (Boyes et al., 2001)
was extracted using Trizol Reagent (Life Technologies) followed by the purification with
RNeasy mini kit (Quiagen) and the quantity of RNA was measured with a nanodrop ND
1000 (Thermo Scientific). For RT-PCR, first-strand cDNA was synthesized from 2 µg of total
RNA according to “Maxima® First Strand cDNA Synthesis Kit” (Fermentas,
Cambridgeshire). The primer pairs for genotyping and RT-PCR are listed in supplemental
table S1 and S2, respectively. Primers for RT-PCR were designed using the AmplifX primer
designing tool.
Leaf growth analysis
Growth analysis was performed on the first leaf pair. Leaves were fixed and cleared with
70% ethanol for 24 h and subsequently in 100% lactic acid, which was also used as a
mounting agent. Leaf images were obtained with a binocular microscope (Nikon SMZ1000)
fitted with a digital camera (Zeiss [AxioCam Cc1]). For phenotyping of mutants, leaf images
were taken on 26 DAS (days after stratification) whereas for the kinematic analysis images
were taken from 6 to 26 DAS. For each day leaf surface area of 10-25 leaves were measured
using ImageJ (http://rsbweb.nih.gov/ij/). Logarithmic values of means of leaf surface area
were used for locally fitting a 5 point quadratic function (Erickson, 1976) of which the first
derivative was used to determine the relative expansion rate.
Multiple downregulation of KRPs
211
Cellular measurements
We performed a kinematic analysis (De Veylder et al., 2001) of the abaxial epidermal cells
of 3-6 average leaves from 6 to 26 DAS as described by Nelissen et al. (2013). Leaves of
early days, i.e. 6-10 DAS, were stained with propidium iodide following the protocol of
Wuyts et al. (2010) and cell images were obtained with a Nikon C1 confocal microscope
using a Nikon Eclipse E600. Leaf samples of later days were cleared with 70% ethanol and
subsequently stored and mounted in 100% lactic acid on object slides for microscopy.
Abaxial epidermal cells located on top, middle and bottom part of the leaf were imaged
using DIC optics on a Zeiss Axio Scope A1 at 20x magnification fitted with a digital camera
(Zeiss [AxioCam Cm1]). The outlines of imaged epidermal cells were hand drawn on an LCD
tablet (Wacom drawing pad) connected to an iMac computer running ImageJ. Cell analysis
of drawn cells was done with automated image analysis software that measures the total
area of drawn cells and that counts the number of cells (Andriankaja et al., 2012). From
these data we calculated average cell area, estimated the number of cells per leaf by
dividing leaf blade area by cell area and stomatal index was calculated as the percentage of
stomata across all epidermal cells. We calculated cell division rates as the relative rate of
increase in cell number over time. For this, the logarithmic values of mean of cell number
were locally fitted with a 5 point quadratic function of which the first derivative was used
as the division rate.
Flow cytometric analysis
First leaf pair of wild type and mutant was harvested, frozen in liquid nitrogen, and kept at
-80°C until analysis. For flow cytometry analysis, nuclei were extracted by chopping 3 to 30
leaves with a razor blade in 200 μl of Cystain UV Precise P Nuclei extraction buffer (Partec),
supplemented with 800 μl of staining buffer. The mix was filtered through a 50 μm filter
and read through the Cyflow MB flow cytometer (Partec). The nuclei were analyzed with
the CyFlow flow cytometer and the FloMax software (Partec).
Multiple downregulation of KRPs
212
Embryo and seed size measurements
Seeds of Col-0 and the krp4/6/7 mutant were stratified in darkness at 4°C for 4 days, and
then sown in potting mix (Tref EGO substrates, Moerdijk, The Netherlands, 5×5 cm pots),
filled with a mixture (1:1, v/v) of a loamy soil and organic compost at a humidity of 0.30 g
water/g dry soil. Pots were transferred to a controlled growth chamber with an air
temperature of 21/18°C and 50-55% humidity under a 16 h day (90-100 µmols-1m-2 s-1
PAR) and 8 h night regime. Siliques were harvested at stage 10 (Bowman, 1994) and the
seeds were dissected under the binocular to isolate embryos. Embryos were treated for 1 h
in Hoyer’s solution according to Ohto et al. (2005). The images of around 30-40 embryos
were obtained with DIC microscope and their areas were measured by ImageJ
(http://rsbweb.nih.gov/ij/).
Around 500 dried seeds from four different plants of wild type and mutant grown next to
each other were used to study seed size. Seed images were taken with a digital camera and
their areas were also measured by ImageJ. To study the effect of seed size on leaf growth in
mutant and wild type, seed size distribution of 400-450 seeds were analyzed. Seeds were
grouped according to their sizes and the median seed size was calculated for both wild type
and mutant.
Quantitative RT-PCR analysis
RNA was extracted from approximately 5 to 200 leaves using the Trizol Reagent (see above
for details). Real time PCR was performed using TaqMan® Universal Master Mix II with
UNG (Life Technologies). Multiplex PCR was performed with ACT 8 (Probe id
At02270958_gH) as an endogenous control and TaqMan® probes for all the KRP genes as
specified in supplemental table S1. Three technical and 4 to 5 biological repeats were
performed. The results were analyzed with the StepOne-Plus™ Real-Time Software.
Multiple downregulation of KRPs
213
Transcriptome analysis
Total RNA of the first leaf pair was isolated on 9 and 15 DAS using Trizol Reagent (Life
Technologies) and the quantity and integrity of the RNA was measured
spectrophotometrically on QIAxcel system (Qiagen). Library preparation was done using
the TruSeq® Stranded mRNA sample preparation 96 rcx kit (Illumina™) following the low
sample protocol according to Illumina™ guidelines. Briefly, approximately 2.5 µg of total
RNA was purified using RNA purification beads targeting the poly-A tail of the mRNA and
subsequently was fragmented by means of the enzymes provided in the kit. After the cDNA
synthesis adenylation of 3’ ends and ligation of the adaptors were employed. Adaptors
were ligated in 12-plex formations, allowing the pooling of 12 samples after the PCR
enrichment of the library. Subsequently, the library was quantified using PicoGreen® dye
(Life Technologies™). Thereafter 12 samples were pooled at equal concentrations to create
the eight pools. In order to accurately quantify the concentration in nM of our pools, the
Kapa SYBR® FAST universal qPCR kit (KAPA Biosystems ™) for Illunima™ sequencing was
used to quantify the number of the amplifiable molecules in the pools and the
Bioanalyzer® (Agilent Technologies™) to determine the average fragment size of our pools.
These both allowed optimizing the flow cell clustering and proceed with the run.
Data analysis
A preliminary analysis was performed by means CLC Genomics Workbench v.6 using
Arabidopsis thaliana (Col-0 TAIR10) sequence database (http://www.arabidopsis.org/) as
reference genome. The RNA-Seq analysis was carried out for sequence reads obtained from
mutant harvested at 9 and 15 DAS. Throughout the analysis with CLC default settings were
used. Briefly, after the trimming of the sequences they were mapped against the reference
genome with the default settings. The expression values were calculated based on “reads
per kilobase of exon model per million mapped reads” (RPKM) values (Mortazavi et al.,
2008). RNA-seq data was grouped accordingly and two group comparisons (unpaired)
were performed. The expression values were normalized by scaling to corresponding
controls and for comparisons of interest, moderated t statistics were calculated using the
Multiple downregulation of KRPs
214
Baggerley’s test and p values were corrected for multiple testing for each contrast
separately (Baggerly et al., 2003). Genes for which no counts were detected in all three
replicates for at least one of the genotype/time combinations, were discarded as not
detectable above the background. False discovery rate (FDR) corrected p-value < 0.05 and
log2 of fold change > 0.75 was used as a cutoff (Benjamini and Hochberg, 1995).
All significantly induced or repressed genes with known functions were classified into
groups based on gene ontology (GO) information obtained from the TAIR Database
(http://www.arabidopsis.org/) and overrepresented functions and gene enrichment
studies were carried out by Cytoscape using the BiNGO plugin (Maere et al., 2005).
Statistical analysis
Standard error was calculated from different replicates on each time point for leaf area, cell
area, cell number and stomatal index. Statistical analysis of leaf area, cell number, cell size
enoreduplication index, leaf series, seed and embryo size was conducted by t test on excel.
Model construction and analysis
An elementary model was defined to describe dynamical changes in ploidy fractions and
was subsequently implemented with Mathematica (www.wolfram.com/mathematica/).
The model represents the leaf as a single compartment with fractions of 2C, 4C, 8C, 16C,
and 32C nuclei as the state variables. Simple mass-action kinetic equations were assigned
to the various conversions with only the 2C 4C as a reversible process. The
corresponding ordinary differential equations were solved using the NDSolve function.
Parameter estimates were obtained through fitting of the experimentally obtained ploidy
data using the NMinimize function with default search algorithms and according to the
procedure in De Vos et al., 2011, with the 9 DAS data points as fixed initial fractions.
For the Arabidopsis trichome cell cycle model the published parameter set was used (cf.
Supporting Information in Roodbarkelari et al., 2010), with two changes. First the
parameter kssim (SIM synthesis rate) was set ten times higher to induce an endocyclic
Multiple downregulation of KRPs
215
regime (SPF and not MPF oscillating). To simulate a decrease in KRP levels the CKIT
production rate k11 was reduced by ten percent to 0.18. A stronger reduction leads to a
more pronounced effect eventually leading to the disappearance of the endocycle
oscillations when reducing by 50 %.
Supplemental Data
All supplemental data is listed below. Supplemental figures can be found at the end of the
chapter or available upon request. Supplemental text is also found at the end of the chapter
and tables are available upon request.
Supplemental Figure 1. Growth analysis of mutants.
Supplemental Figure 2. Ploidy distribution measurement.
Supplemental Figure 3. BiNGO analysis of the genes upregulated on 9 DAS.
Supplemental Figure 4. BiNGO analysis of the genes upregulated on 15 DAS.
Supplemental Figure 5. BiNGO analysis of the genes downregulated on 9 DAS.
Supplemental Figure 6. The position of T-DNA insertion at in krp7-1 (GK_841D12) and
RNAseq mapping of KRP7 gene in Col-0 and krp4/6/7.
Supplemental Figure 7. Model for time dependent ploidy level.
Supplemental Table S1. Probes used to perform qPCR of seven Arabidopsis KRP.
Supplemental Table S2. Primers for genotyping of SAIL and GABI-Kat lines.
Supplemental Table S3. Primers for RT-PCR.
Supplemental Table S4. Differentially expressed genes in krp4/6/7 compared to Col-0 on 9
and 15 DAS.
Supplemental Table S5. Overrepresentation analysis of upregulated genes on 9 DAS in
krp4/6/7 compared to Col-0.
Supplemental Table S6. Overrepresentation analysis of upregulated genes on 15 DAS in
krp4/6/7 compared to Col-0.
Supplemental Table S7. Overrepresentation analysis of downregulated genes on 9 DAS in
krp4/6/7 compared to Col-0.
Multiple downregulation of KRPs
216
Supplemental Text 1. The text describes the reactions involved which represent the
mechanical basis. This in accordance with the fact that doubling the DNA content to 4C
level can be reverted by cell division but not any longer at higher ploidy levels.
Acknowledgments
We thank Sevgi Oden for the help in drawing cells for kinematic analysis. This work was
supported by a concerted research activity (GOA) research grant, ‘A Systems Biology
Approach of Leaf Morphogenesis’ from the research council of the University of Antwerp
and an Interuniversity Attraction Poles (IUAP) from the Belgian Federal Science Policy
Office (BELSPO). Dirk De Vos was funded by a return grant from BELSPO and Shweta Kalve
by a training grant from the Department of Science and Education of the Flemish
Government.
References
Andriankaja M, Dhondt S, De Bodt S, Vanhaeren H, Coppens F, De Milde L,
Muhlenbock P, Skirycz A, Gonzalez N, Beemster GT, Inze D. 2012. Exit from
proliferation during leaf development in Arabidopsis thaliana: a not-so-gradual process.
Dev Cell 22, 64-78.
Anzola JM, Sieberer T, Ortbauer M, Butt H, Korbei B, Weinhofer I, Mullner AE,
Luschnig C. 2010. Putative Arabidopsis Transcriptional Adaptor Protein (PROPORZ1) is
required to modulate histone acetylation in response to auxin. Proc Natl Acad Sci U S A 107,
10308-10313.
Baggerly KA, Deng L, Morris JS, Aldaz CM. 2003. Differential expression in SAGE:
accounting for normal between-library variation. Bioinformatics 19, 1477-1483.
Barroco RM, Peres A, Droual AM, De Veylder L, Nguyen le SL, De Wolf J, Mironov V,
Peerbolte R, Beemster GT, Inze D, Broekaert WF, Frankard V. 2006. The cyclin-
Multiple downregulation of KRPs
217
dependent kinase inhibitor Orysa;KRP1 plays an important role in seed development of
rice. Plant Physiol 142, 1053-1064.
Beemster GT, Fiorani F, Inze D. 2003. Cell cycle: the key to plant growth control? Trends
Plant Sci 8, 154-158.
Bemis SM, Torii KU. 2007. Autonomy of cell proliferation and developmental programs
during Arabidopsis aboveground organ morphogenesis. Dev Biol 304, 367-381.
Benjamini Y, Hochberg Y. 1995. Controlling the false discovery rate: a practical and
powerful approach to multiple testing. J R Stat Soc 57, 289-300.
Bird DA, Buruiana MM, Zhou Y, Fowke LC, Wang H. 2007. Arabidopsis cyclin-dependent
kinase inhibitors are nuclear-localized and show different localization patterns within the
nucleoplasm. Plant Cell Rep 26, 861-872.
Bisbis B, Delmas F, Joubes J, Sicard A, Hernould M, Inze D, Mouras A, Chevalier C.
2006. Cyclin-dependent kinase (CDK) inhibitors regulate the CDK-cyclin complex activities
in endoreduplicating cells of developing tomato fruit. J Biol Chem 281, 7374-7383.
Boniotti MB, Gutierrez C. 2001. A cell-cycle-regulated kinase activity phosphorylates
plant retinoblastoma protein and contains, in Arabidopsis, a CDKA/cyclin D complex. Plant J
28, 341-350.
Bowman J. 1994. Arabidopsis: An atlas of morphology and development. Springer New
York.
Boyes DC, Zayed AM, Ascenzi R, McCaskill AJ, Hoffman NE, Davis KR, Gorlach J. 2001.
Growth stage-based phenotypic analysis of Arabidopsis: a model for high throughput
functional genomics in plants. Plant Cell 13, 1499-1510.
Multiple downregulation of KRPs
218
Cheng Y, Cao L, Wang S, Li Y, Shi X, Liu H, Li L, Zhang Z, Fowke LC, Wang H, Zhou Y.
2013. Downregulation of multiple CDK inhibitor ICK/KRP genes upregulates the E2F
pathway and increases cell proliferation, and organ and seed sizes in Arabidopsis. Plant J
75, 642-655.
Coelho CM, Dante RA, Sabelli PA, Sun YJ, Dilkes BP, Gordon-Kamm WJ, Larkins BA.
2005. Cyclin-dependent kinase inhibitors in maize endosperm and their potential role in
endoreduplication. Plant Physiol 138, 2323-2336.
de Almeida Engler J, De Veylder L, De Groodt R, Rombauts S, Boudolf V, De Meyer B,
Hemerly A, Ferreira P, Beeckman T, Karimi M, Hilson P, Inze D, Engler G. 2009.
Systematic analysis of cell-cycle gene expression during Arabidopsis development. Plant J
59, 645-660.
de Jager SM, Scofield S, Huntley RP, Robinson AS, den Boer BG, Murray JA. 2009.
Dissecting regulatory pathways of G1/S control in Arabidopsis: common and distinct
targets of CYCD3;1, E2Fa and E2Fc. Plant Mol Biol 71, 345-365.
De Schutter K, Joubes J, Cools T, Verkest A, Corellou F, Babiychuk E, Van Der Schueren
E, Beeckman T, Kushnir S, Inze D, De Veylder L. 2007. Arabidopsis WEE1 kinase controls
cell cycle arrest in response to activation of the DNA integrity checkpoint. Plant Cell 19,
211-225.
De Veylder L, Beeckman T, Beemster GT, Krols L, Terras F, Landrieu I, van der
Schueren E, Maes S, Naudts M, Inze D. 2001. Functional analysis of cyclin-dependent
kinase inhibitors of Arabidopsis. Plant Cell 13, 1653-1668.
De Veylder L, Beeckman T, Inze D. 2007. The ins and outs of the plant cell cycle. Nat Rev
Mol Cell Biol 8, 655-665.
Multiple downregulation of KRPs
219
De Veylder L, Larkin JC, Schnittger A. 2011. Molecular control and function of
endoreplication in development and physiology. Trends Plant Sci 16, 624-634.
De Vos D, Frederiks F, Terweij M, van Welsem T, Verzijlbergen KF, Iachina E, de Graaf
EL, Maarten Altelaar A, Oudgenoeg G, Heck AJ. 2011. Progressive methylation of ageing
histones by Dot1 functions as a timer. EMBO Rep 12, 956-962.
del Pozo JC, Diaz-Trivino S, Cisneros N, Gutierrez C. 2006. The balance between cell
division and endoreplication depends on E2FC-DPB, transcription factors regulated by the
ubiquitin-SCFSKP2A pathway in Arabidopsis. Plant Cell 18, 2224-2235.
Dewitte W, Murray JA. 2003. The plant cell cycle. Annu Rev Plant Biol 54, 235-264.
Dewitte W, Scofield S, Alcasabas AA, Maughan SC, Menges M, Braun N, Collins C,
Nieuwland J, Prinsen E, Sundaresan V, Murray JA. 2007. Arabidopsis CYCD3 D-type
cyclins link cell proliferation and endocycles and are rate-limiting for cytokinin responses.
Proc Natl Acad Sci U S A 104, 14537-14542.
Erickson RO. 1976. Modeling of plant growth. Annu Rev Plant Physiol 27, 407-434.
Ferjani A, Horiguchi G, Tsukaya H. 2010. Organ size control in Arabidopsis: insights from
compensation studies. Plant Morphol 22, 65-71
Green PB. 1976. Growth and Cell Pattern Formation on an Axis - Critique of Concepts,
Terminology, and Modes of Study. Bota Gaz 137, 187-202.
Gusti A, Baumberger N, Nowack M, Pusch S, Eisler H, Potuschak T, De Veylder L,
Schnittger A, Genschik P. 2009. The Arabidopsis thaliana F-Box Protein FBL17 is essential
for progression through the second mitosis during pollen development. PLOS ONE 4.
Multiple downregulation of KRPs
220
Harper JL, Lovell P, Moore K. 1970. The shapes and sizes of seeds. Annu Rev Ecol Syst,
327-356.
Horiguchi G, Tsukaya H. 2011. Organ size regulation in plants: insights from
compensation. Front Plant Sci 2, 24.
Inze D, De Veylder L. 2006. Cell cycle regulation in plant development. Annu Rev Genet 40,
77-105.
Jacqmard A, De Veylder L, Segers G, Engler JA, Bernier G, Van Montagu M, Inze D.
1999. Expression of CKS1At in Arabidopsis thaliana indicates a role for the protein in both
the mitotic and the endoreduplication cycle. Planta 207, 496-504.
Jasinski S, Leite CS, Domenichini S, Stevens R, Raynaud C, Perennes C, Bergounioux C,
Glab N. 2003. NtKIS2, a novel tobacco cyclin-dependent kinase inhibitor is differentially
expressed during the cell cycle and plant development. Plant Physiol Bioch 41, 667-676.
Jasinski S, Riou-Khamlichi C, Roche O, Perennes C, Bergounioux C, Glab N. 2002. The
CDK inhibitor NtKIS1a is involved in plant development, endoreduplication and restores
normal development of cyclin D3;1-overexpressing plants. J Cell Sci 115, 973-982.
Jegu T, Latrasse D, Delarue M, Mazubert C, Bourge M, Hudik E, Blanchet S, Soler MN,
Charon C, De Veylder L, Raynaud C, Bergounioux C, Benhamed M. 2013. Multiple
functions of Kip-related protein5 connect endoreduplication and cell elongation. Plant
Physiol 161, 1694-1705.
Jun SE, Okushima Y, Nam J, Umeda M, Kim GT. 2013. Kip-related protein 3 is required for
control of endoreduplication in the shoot apical meristem and leaves of Arabidopsis. Mol
Cells 35, 47-53.
Multiple downregulation of KRPs
221
Kaydan D, Yagmur M. 2008. Germination, seedling growth and relative water content of
shoot in different seed sizes of triticale under osmotic stress of water and NaCl. Afr J
Biotechnol 7, 2862-2868.
Khurana E, Singh J. 2000. Influence of seed size on seedling growth of Albizia procera
under different soil water levels. Ann Bot 86, 1185-1192.
Kim HJ, Oh SA, Brownfield L, Hong SH, Ryu H, Hwang I, Twell D, Nam HG. 2008. Control
of plant germline proliferation by SCF(FBL17) degradation of cell cycle inhibitors. Nature
455, 1134-U1114.
Lai JB, Chen H, Teng KL, Zhao QZ, Zhang ZH, Li Y, Liang LM, Xia R, Wu YR, Guo HS, Xie
Q. 2009. RKP, a RING finger E3 ligase induced by BSCTV C4 protein, affects geminivirus
infection by regulation of the plant cell cycle. Plant J 57, 905-917.
Lammens T, Li J, Leone G, De Veylder L. 2009. Atypical E2Fs: new players in the E2F
transcription factor family. Trends Cell Biol 19, 111-118.
Liu JJ, Zhang YY, Qin GJ, Tsuge T, Sakaguchi N, Luo G, Sun KT, Shi DQ, Aki S, Zheng NY,
Aoyama T, Oka A, Yang WC, Umeda M, Xie Q, Gu HY, Qu LJ. 2008. Targeted degradation
of the cyclin-dependent kinase inhibitor ICK4/KRP6 by RING-type E3 ligases is essential for
mitotic cell cycle progression during Arabidopsis gametogenesis. Plant Cell 20, 1538-1554.
Lui H, Wang H, DeLong C, Fowke LC, Crosby WL, Fobert PR. 2000. The Arabidopsis
Cdc2a-interacting protein ICK2 is structurally related to ICK1 and is a potent inhibitor of
cyclin-dependent kinase activity in vitro. Plant J 21, 379-385.
Maere S, Heymans K, Kuiper M. 2005. BiNGO: a Cytoscape plugin to assess
overrepresentation of gene ontology categories in biological networks. Bioinformatics 21,
3448-3449.
Multiple downregulation of KRPs
222
Massonnet C, Tisne S, Radziejwoski A, Vile D, De Veylder L, Dauzat M, Granier C. 2011.
New insights into the control of endoreduplication: endoreduplication could be driven by
organ growth in Arabidopsis leaves. Plant Physiol 157, 2044-2055.
Menges M, de Jager SM, Gruissem W, Murray JAH. 2005. Global analysis of the core cell
cycle regulators of Arabidopsis identifies novel genes, reveals multiple and highly specific
profiles of expression and provides a coherent model for plant cell cycle control. Plant J 41,
546-566.
Mortazavi A, Williams BA, McCue K, Schaeffer L, Wold B. 2008. Mapping and quantifying
mammalian transcriptomes by RNA-Seq. Nat Methods 5, 621-628.
Murashige T, Skoog F. 1962. A revised medium for rapid growth and bioassays with
tobacco tissue cultures. Physiol Plant 15, 473–497.
Nakagami H, Kawamura K, Sugisaka K, Sekine M, Shinmyo A. 2002. Phosphorylation of
retinoblastoma-related protein by the cyclin D/cyclin-dependent kinase complex is
activated at the G1/S-phase transition in tobacco. Plant Cell 14, 1847-1857.
Nakai T, Kato K, Shinmyo A, Sekine M. 2006. Arabidopsis KRPs have distinct inhibitory
activity toward cyclin D2-associated kinases, including plant-specific B-type cyclin-
dependent kinase. FEBS Lett 580, 336-340.
Nelissen H, Rymen B, Coppens F, Dhondt S, Fiorani F, Beemster GT. 2013. Kinematic
analysis of cell division in leaves of mono- and dicotyledonous species: a basis for
understanding growth and developing refined molecular sampling strategies. Methods Mol
Biol 959, 247-264.
Ohto MA, Fischer RL, Goldberg RB, Nakamura K, Harada JJ. 2005. Control of seed mass
by APETALA2. Proc Natl Acad Sci U S A 102, 3123-3128.
Multiple downregulation of KRPs
223
Ormenese S, de Almeida Engler J, De Groodt R, De Veylder L, Inze D, Jacqmard A.
2004. Analysis of the spatial expression pattern of seven Kip related proteins (KRPs) in the
shoot apex of Arabidopsis thaliana. Ann Bot 93, 575-580.
Pettko-Szandtner A, Meszaros T, Horvath GV, Bako L, Csordas-Toth E, Blastyak A,
Zhiponova M, Miskolczi P, Dudits D. 2006. Activation of an alfalfa cyclin-dependent
kinase inhibitor by calmodulin-like domain protein kinase. Plant J 46, 111-123.
Ramirez-Parra E, Lopez-Matas MA, Frundt C, Gutierrez C. 2004. Role of an atypical E2F
transcription factor in the control of Arabidopsis cell growth and differentiation. Plant Cell
16, 2350-2363.
Ren H, Santner A, del Pozo JC, Murray JAH, Estelle M. 2008. Degradation of the cyclin-
dependent kinase inhibitor KRP1 is regulated by two different ubiquitin E3 ligases. Plant J
53, 705-716.
Rogers S, Wells R, Rechsteiner M. 1986. Amino acid sequences common to rapidly
degraded proteins: the PEST hypothesis. Science 234, 364-368.
Roodbarkelari F, Bramsiepe J, Weinl C, Marquardt S, Novák B, Jakoby MJ, Lechner E,
Genschik P, Schnittger A. 2010. CULLIN 4-RING FINGER-LIGASE plays a key role in the
control of endoreplication cycles in Arabidopsis trichomes. Proc Natl Acad Sci U S A 107,
15275-15280.
Sanz L, Dewitte W, Forzani C, Patell F, Nieuwland J, Wen B, Quelhas P, De Jager S,
Titmus C, Campilho A, Ren H, Estelle M, Wang H, Murray JA. 2011. The Arabidopsis D-
type cyclin CYCD2;1 and the inhibitor ICK2/KRP2 modulate auxin-induced lateral root
formation. Plant Cell 23, 641-660.
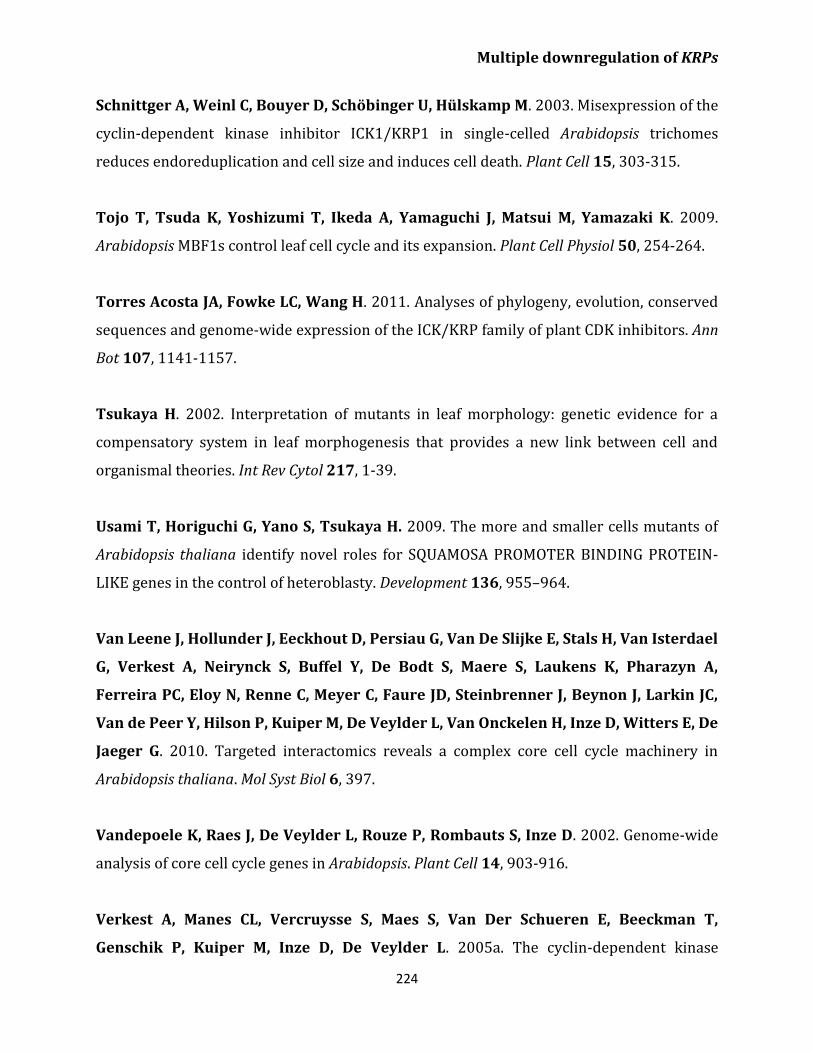
Multiple downregulation of KRPs
224
Schnittger A, Weinl C, Bouyer D, Schöbinger U, Hülskamp M. 2003. Misexpression of the
cyclin-dependent kinase inhibitor ICK1/KRP1 in single-celled Arabidopsis trichomes
reduces endoreduplication and cell size and induces cell death. Plant Cell 15, 303-315.
Tojo T, Tsuda K, Yoshizumi T, Ikeda A, Yamaguchi J, Matsui M, Yamazaki K. 2009.
Arabidopsis MBF1s control leaf cell cycle and its expansion. Plant Cell Physiol 50, 254-264.
Torres Acosta JA, Fowke LC, Wang H. 2011. Analyses of phylogeny, evolution, conserved
sequences and genome-wide expression of the ICK/KRP family of plant CDK inhibitors. Ann
Bot 107, 1141-1157.
Tsukaya H. 2002. Interpretation of mutants in leaf morphology: genetic evidence for a
compensatory system in leaf morphogenesis that provides a new link between cell and
organismal theories. Int Rev Cytol 217, 1-39.
Usami T, Horiguchi G, Yano S, Tsukaya H. 2009. The more and smaller cells mutants of
Arabidopsis thaliana identify novel roles for SQUAMOSA PROMOTER BINDING PROTEIN-
LIKE genes in the control of heteroblasty. Development 136, 955–964.
Van Leene J, Hollunder J, Eeckhout D, Persiau G, Van De Slijke E, Stals H, Van Isterdael
G, Verkest A, Neirynck S, Buffel Y, De Bodt S, Maere S, Laukens K, Pharazyn A,
Ferreira PC, Eloy N, Renne C, Meyer C, Faure JD, Steinbrenner J, Beynon J, Larkin JC,
Van de Peer Y, Hilson P, Kuiper M, De Veylder L, Van Onckelen H, Inze D, Witters E, De
Jaeger G. 2010. Targeted interactomics reveals a complex core cell cycle machinery in
Arabidopsis thaliana. Mol Syst Biol 6, 397.
Vandepoele K, Raes J, De Veylder L, Rouze P, Rombauts S, Inze D. 2002. Genome-wide
analysis of core cell cycle genes in Arabidopsis. Plant Cell 14, 903-916.
Verkest A, Manes CL, Vercruysse S, Maes S, Van Der Schueren E, Beeckman T,
Genschik P, Kuiper M, Inze D, De Veylder L. 2005a. The cyclin-dependent kinase
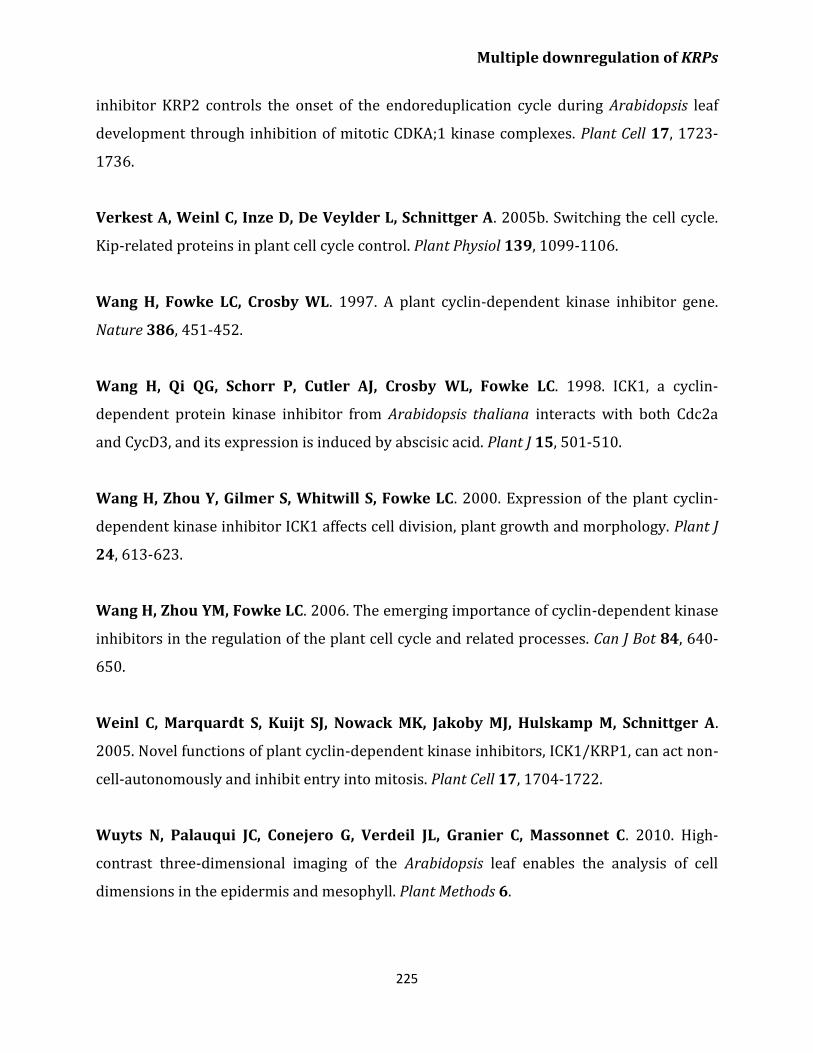
Multiple downregulation of KRPs
225
inhibitor KRP2 controls the onset of the endoreduplication cycle during Arabidopsis leaf
development through inhibition of mitotic CDKA;1 kinase complexes. Plant Cell 17, 1723-
1736.
Verkest A, Weinl C, Inze D, De Veylder L, Schnittger A. 2005b. Switching the cell cycle.
Kip-related proteins in plant cell cycle control. Plant Physiol 139, 1099-1106.
Wang H, Fowke LC, Crosby WL. 1997. A plant cyclin-dependent kinase inhibitor gene.
Nature 386, 451-452.
Wang H, Qi QG, Schorr P, Cutler AJ, Crosby WL, Fowke LC. 1998. ICK1, a cyclin-
dependent protein kinase inhibitor from Arabidopsis thaliana interacts with both Cdc2a
and CycD3, and its expression is induced by abscisic acid. Plant J 15, 501-510.
Wang H, Zhou Y, Gilmer S, Whitwill S, Fowke LC. 2000. Expression of the plant cyclin-
dependent kinase inhibitor ICK1 affects cell division, plant growth and morphology. Plant J
24, 613-623.
Wang H, Zhou YM, Fowke LC. 2006. The emerging importance of cyclin-dependent kinase
inhibitors in the regulation of the plant cell cycle and related processes. Can J Bot 84, 640-
650.
Weinl C, Marquardt S, Kuijt SJ, Nowack MK, Jakoby MJ, Hulskamp M, Schnittger A.
2005. Novel functions of plant cyclin-dependent kinase inhibitors, ICK1/KRP1, can act non-
cell-autonomously and inhibit entry into mitosis. Plant Cell 17, 1704-1722.
Wuyts N, Palauqui JC, Conejero G, Verdeil JL, Granier C, Massonnet C. 2010. High-
contrast three-dimensional imaging of the Arabidopsis leaf enables the analysis of cell
dimensions in the epidermis and mesophyll. Plant Methods 6.
Multiple downregulation of KRPs
226
Yang R, Tang Q, Wang H, Zhang X, Pan G, Tu J. 2011. Analyses of two rice (Oryza sativa)
cyclin-dependent kinase inhibitors and effects of transgenic expression of OsiICK6 on plant
growth and development. Ann Bot 107, 1087-1101.
Zhao X, Harashima H, Dissmeyer N, Pusch S, Weimer AK, Bramsiepe J, Bouyer D,
Rademacher S, Nowack MK, Novak B, Sprunck S, Schnittger A. 2012. A general G1/S-
phase cell-cycle control module in the flowering plant Arabidopsis thaliana. PLoS Genet 8,
e1002847.
Zhou Y, Fowke LC, Wang H. 2002. Plant CDK inhibitors: studies of interactions with cell
cycle regulators in the yeast two-hybrid system and functional comparisons in transgenic
Arabidopsis plants. Plant Cell Rep 20, 967-975.
Zhou YM, Li GY, Brandizzi F, Fowke LC, Wang H. 2003. The plant cyclin-dependent
kinase inhibitor ICK1 has distinct functional domains for in vivo kinase inhibition, protein
instability and nuclear localization. Plant J 35, 476-489.
Multiple downregulation of KRPs
227
Supplemental Figure 1. Growth analysis of mutants: (A) leaf area; (B) Cell size; (C) Cell number;
(D) Stomatal index of the wild type (Col-0) and the single (krp4, krp6, krp7), double (krp4/6, krp4/7,
krp6/7) and triple mutant (krp4/6/7). For leaf area measurements 20-100 leaves whereas for
cellular measurements 3-9 leaves were used. Error bars represent standard error. An asterisk
indicates a significant difference at *P<0.05, **P<0.01 and ***P<0.001.
Supplemental Figure 2. Ploidy distribution
measurement: Endoreduplication index of first
leaf pair of Col-0, single, double and triple mutant
after 26 DAS when they are fully grown.
Endoreduplication index represents the average
number of endocycles undergone by a typical
nucleus (EI = 0*2C+1*4C+2*8C +3*16C). Error bars
represent standard error (n=3). An asterisk
indicates a significant difference at *P<0.05 and
**P<0.01. **P<0.01.
Col
krp4Col
krp6Col
krp7Col
krp4/
6Col
krp4/
7Col
krp6/
7Col
krp4/
6/7
0
10
20
30
40
*
***L
ea
f b
lad
e a
rea
(mm
2)
***
*****
(A)
Col
krp4Col
krp6Col
krp7Col
krp4/
6Col
krp4/
7Col
krp6/
7Col
krp4/
6/7
0
10000
20000
30000
40000
50000(C)
*****
Cel
l n
um
ber
***
Col
krp4Col
krp6Col
krp7Col
krp4/
6Col
krp4/
7Col
krp6/
7Col
krp4/
6/7
0
200
400
600
800
1000
1200
1400(B)
**
**
Cel
l si
ze (
µm
2)
***
Col
krp4Col
krp6Col
krp7Col
krp4/
6Col
krp4/
7Col
krp6/
7Col
krp4/
6/7
0.0
0.2
0.4
0.6(D)*
Sto
mata
l In
dex
Col
krp4Col
krp6Col
krp7Col
krp4/
6Col
krp4/
7Col
krp6/
7Col
krp4/
6/7
0.0
0.4
0.8
1.2
1.6*
***
En
do
red
up
lica
tio
n
Ind
ex
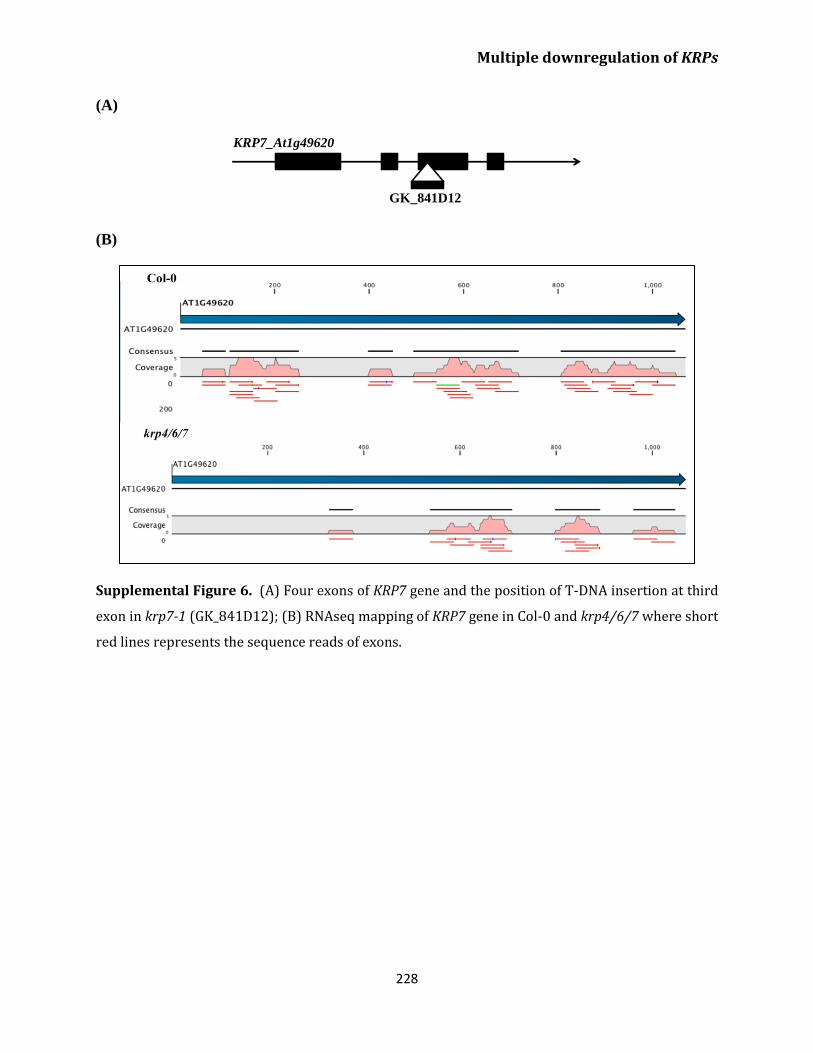
Multiple downregulation of KRPs
228
(A)
(B)
Supplemental Figure 6. (A) Four exons of KRP7 gene and the position of T-DNA insertion at third
exon in krp7-1 (GK_841D12); (B) RNAseq mapping of KRP7 gene in Col-0 and krp4/6/7 where short
red lines represents the sequence reads of exons.
KRP7_At1g49620
GK_841D12
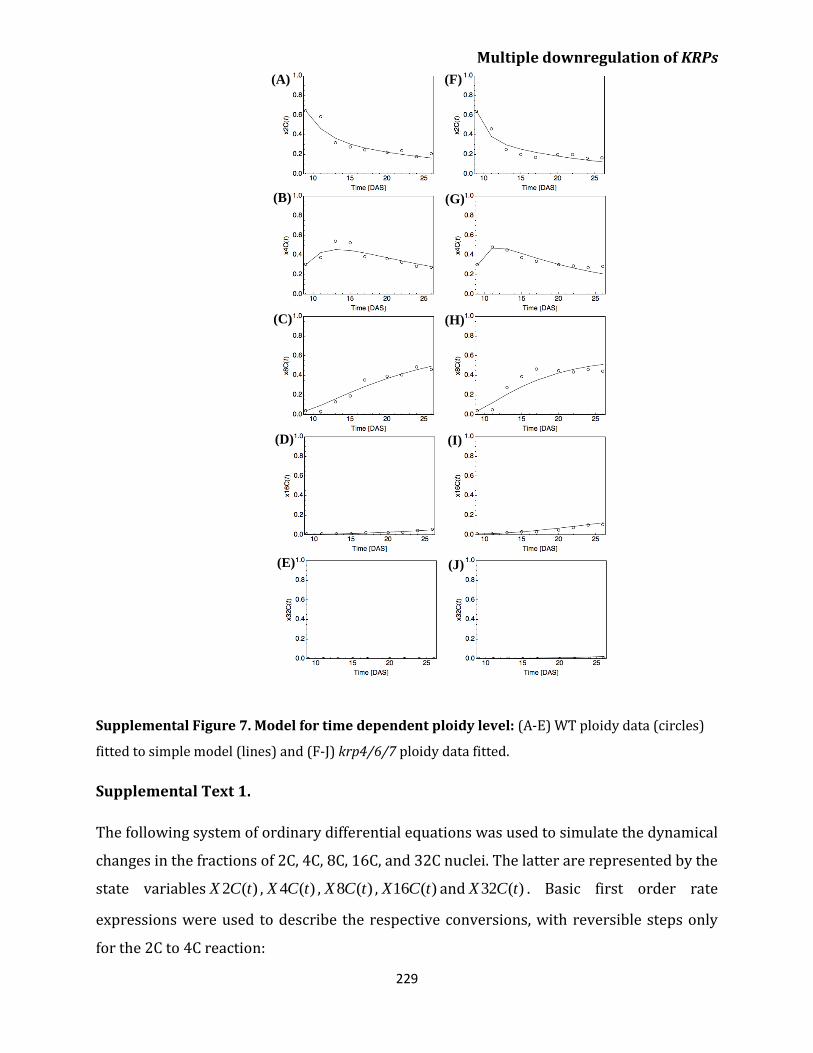
Multiple downregulation of KRPs
229
Supplemental Figure 7. Model for time dependent ploidy level: (A-E) WT ploidy data (circles)
fitted to simple model (lines) and (F-J) krp4/6/7 ploidy data fitted.
Supplemental Text 1.
The following system of ordinary differential equations was used to simulate the dynamical
changes in the fractions of 2C, 4C, 8C, 16C, and 32C nuclei. The latter are represented by the
state variables )(2 tCX , )(4 tCX , )(8 tCX , )(16 tCX and )(32 tCX . Basic first order rate
expressions were used to describe the respective conversions, with reversible steps only
for the 2C to 4C reaction:
(A)
(B)
(C)
(D)
(E)
(F)
(G)
(H)
(I)
(J)

Multiple downregulation of KRPs
230
)(16)(32
)(16)(8)(16
)(8)(4)(8
)(4)(4)(2)(4
)(4)(2)(2
4
43
32
211
11
tCXkdt
tCdX
tCXktCXkdt
tCdX
tCXktCXkdt
tCdX
tCXktCXktCXkdt
tCdX
tCXktCXkdt
tCdX
rf
rf
The equations were numerically integrated with the NDSolve function of Mathematica 7,
using the 9 day ploidy fractions as initial conditions. The NMinimize function was used with
the sum of the squared differences between experimental and predicted fractions as the
objective function to be minimized (final sum of the squares for the final WT fit: 0.054, for
the triple mutant: 0.070). Parameter constraints were set to (0.0001, 1) intervals to speed
up calculations.
Chapter 5
Mild overexpression of CDKB2;2 accelerates plant
growth in Arabidopsis thaliana
Shweta Kalve1, Markakis Marios Nektarios1, Arp Schnittger2 and
Gerrit T.S. Beemster1*
1Department of Biology, University of Antwerp, Belgium
2Department of Developmental Biology, University of Hamburg, Germany
*Corresponding Author
This chapter is an early draft for a publication
Contribution of S.K.- Performed most experiments and wrote the manuscript

Effect of mild overexpression of CDKB2;2
233
Abstract
Cyclin-dependent kinases (CDKs) are major regulators of the eukaryotic cell cycle. Here, we
focused on the role of a B2-type plant specific cyclin-dependent kinase on leaf growth. We
have used the CDKA;1 promoter for moderate overexpression of CDKB2;2 in Arabidopsis
thaliana. Our results clearly demonstrate that the enhanced expression of CDKB2;2
promotes leaf growth and development. Kinematic analysis revealed that increased cell
proliferation was entirely responsible for enhanced leaf growth as CDKB2;2 was not found
to affect the cell size in leaves. Additionally, increased 2C DNA content in leaves also
suggests that overproduction of CDKB2;2 increases the mitotic cycle while reducing the
endocycle. Improved growth was not only restricted to leaves, it was also observed that the
whole shoot and root growth was also accelerated in response to enhanced CDKB2;2
expression. Interestingly, we found that the enhanced leaf growth in PROCDKA;1:CDKB2;2 was
influenced by increased seed and embryo size which shows that the stimulation of CDKB2;2
promotes embryo development which results in larger organs. In addition, moderate
induction of CDKB2;2 resulted in enhanced cytokinin signaling. Thus, our results show that
CDKB2;2 promotes embryonic development in a hormone-dependent manner, which
further translates into enhanced plant growth.
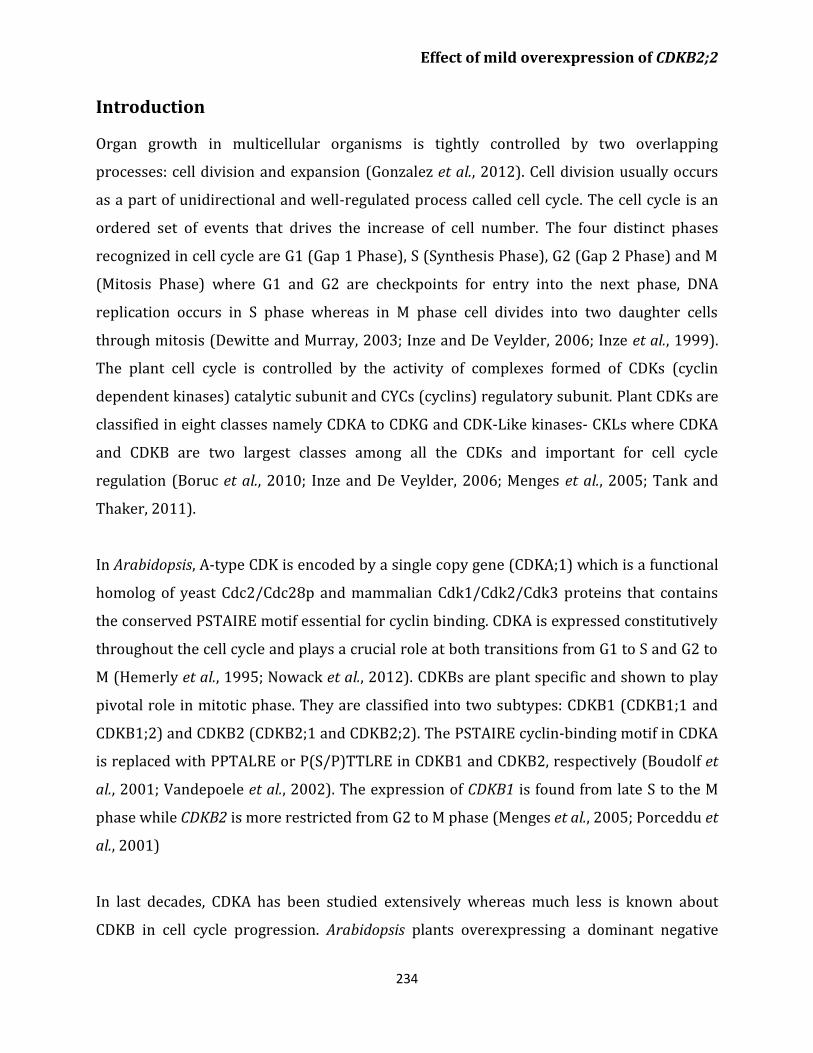
Effect of mild overexpression of CDKB2;2
234
Introduction Organ growth in multicellular organisms is tightly controlled by two overlapping
processes: cell division and expansion (Gonzalez et al., 2012). Cell division usually occurs
as a part of unidirectional and well-regulated process called cell cycle. The cell cycle is an
ordered set of events that drives the increase of cell number. The four distinct phases
recognized in cell cycle are G1 (Gap 1 Phase), S (Synthesis Phase), G2 (Gap 2 Phase) and M
(Mitosis Phase) where G1 and G2 are checkpoints for entry into the next phase, DNA
replication occurs in S phase whereas in M phase cell divides into two daughter cells
through mitosis (Dewitte and Murray, 2003; Inze and De Veylder, 2006; Inze et al., 1999).
The plant cell cycle is controlled by the activity of complexes formed of CDKs (cyclin
dependent kinases) catalytic subunit and CYCs (cyclins) regulatory subunit. Plant CDKs are
classified in eight classes namely CDKA to CDKG and CDK-Like kinases- CKLs where CDKA
and CDKB are two largest classes among all the CDKs and important for cell cycle
regulation (Boruc et al., 2010; Inze and De Veylder, 2006; Menges et al., 2005; Tank and
Thaker, 2011).
In Arabidopsis, A-type CDK is encoded by a single copy gene (CDKA;1) which is a functional
homolog of yeast Cdc2/Cdc28p and mammalian Cdk1/Cdk2/Cdk3 proteins that contains
the conserved PSTAIRE motif essential for cyclin binding. CDKA is expressed constitutively
throughout the cell cycle and plays a crucial role at both transitions from G1 to S and G2 to
M (Hemerly et al., 1995; Nowack et al., 2012). CDKBs are plant specific and shown to play
pivotal role in mitotic phase. They are classified into two subtypes: CDKB1 (CDKB1;1 and
CDKB1;2) and CDKB2 (CDKB2;1 and CDKB2;2). The PSTAIRE cyclin-binding motif in CDKA
is replaced with PPTALRE or P(S/P)TTLRE in CDKB1 and CDKB2, respectively (Boudolf et
al., 2001; Vandepoele et al., 2002). The expression of CDKB1 is found from late S to the M
phase while CDKB2 is more restricted from G2 to M phase (Menges et al., 2005; Porceddu et
al., 2001)
In last decades, CDKA has been studied extensively whereas much less is known about
CDKB in cell cycle progression. Arabidopsis plants overexpressing a dominant negative
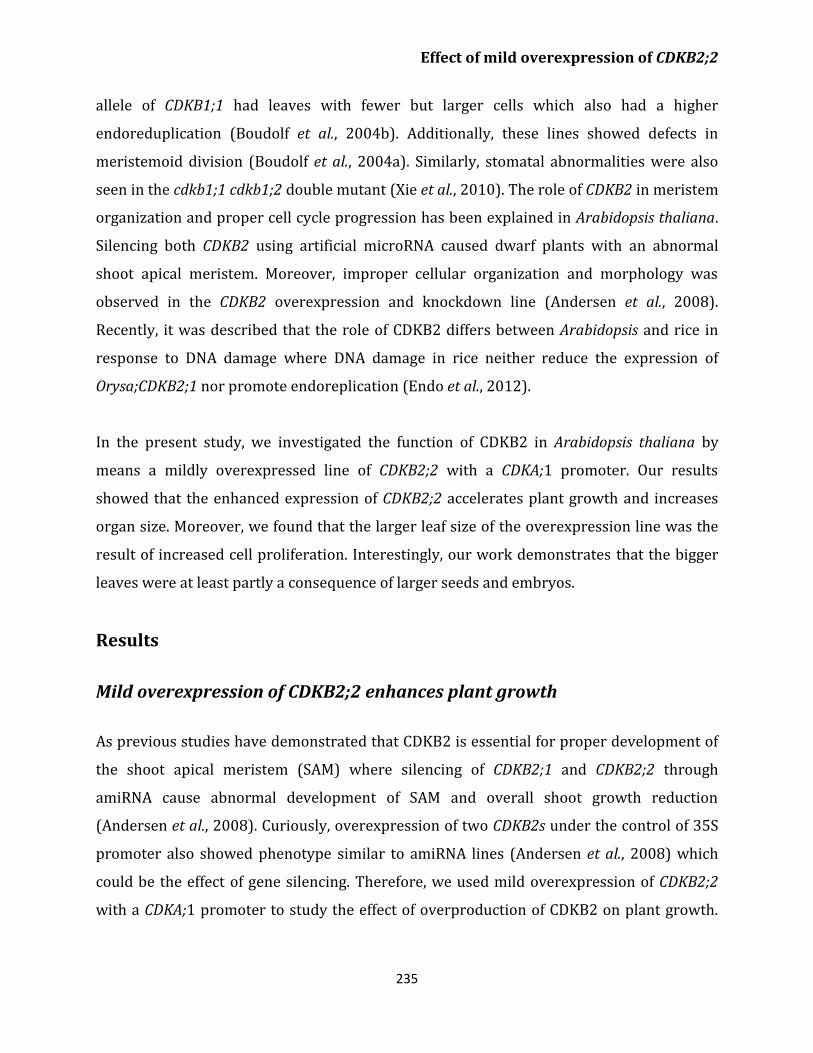
Effect of mild overexpression of CDKB2;2
235
allele of CDKB1;1 had leaves with fewer but larger cells which also had a higher
endoreduplication (Boudolf et al., 2004b). Additionally, these lines showed defects in
meristemoid division (Boudolf et al., 2004a). Similarly, stomatal abnormalities were also
seen in the cdkb1;1 cdkb1;2 double mutant (Xie et al., 2010). The role of CDKB2 in meristem
organization and proper cell cycle progression has been explained in Arabidopsis thaliana.
Silencing both CDKB2 using artificial microRNA caused dwarf plants with an abnormal
shoot apical meristem. Moreover, improper cellular organization and morphology was
observed in the CDKB2 overexpression and knockdown line (Andersen et al., 2008).
Recently, it was described that the role of CDKB2 differs between Arabidopsis and rice in
response to DNA damage where DNA damage in rice neither reduce the expression of
Orysa;CDKB2;1 nor promote endoreplication (Endo et al., 2012).
In the present study, we investigated the function of CDKB2 in Arabidopsis thaliana by
means a mildly overexpressed line of CDKB2;2 with a CDKA;1 promoter. Our results
showed that the enhanced expression of CDKB2;2 accelerates plant growth and increases
organ size. Moreover, we found that the larger leaf size of the overexpression line was the
result of increased cell proliferation. Interestingly, our work demonstrates that the bigger
leaves were at least partly a consequence of larger seeds and embryos.
Results
Mild overexpression of CDKB2;2 enhances plant growth
As previous studies have demonstrated that CDKB2 is essential for proper development of
the shoot apical meristem (SAM) where silencing of CDKB2;1 and CDKB2;2 through
amiRNA cause abnormal development of SAM and overall shoot growth reduction
(Andersen et al., 2008). Curiously, overexpression of two CDKB2s under the control of 35S
promoter also showed phenotype similar to amiRNA lines (Andersen et al., 2008) which
could be the effect of gene silencing. Therefore, we used mild overexpression of CDKB2;2
with a CDKA;1 promoter to study the effect of overproduction of CDKB2 on plant growth.
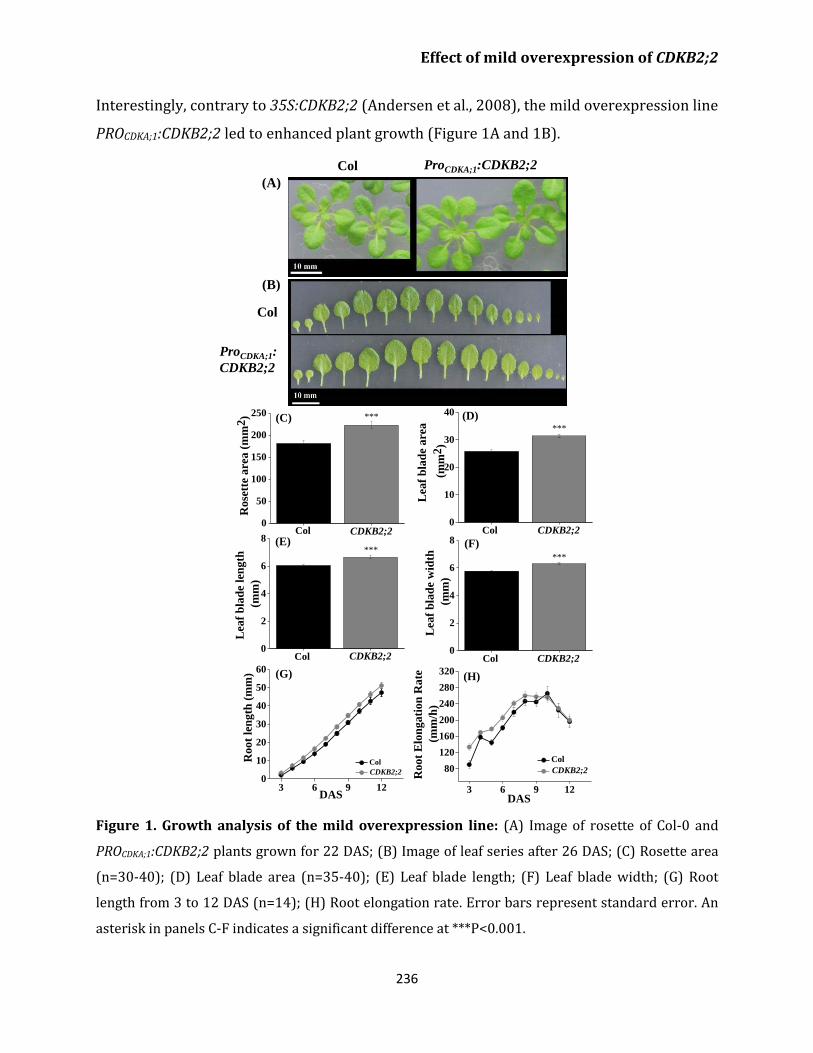
Effect of mild overexpression of CDKB2;2
236
Interestingly, contrary to 35S:CDKB2;2 (Andersen et al., 2008), the mild overexpression line
PROCDKA;1:CDKB2;2 led to enhanced plant growth (Figure 1A and 1B).
Figure 1. Growth analysis of the mild overexpression line: (A) Image of rosette of Col-0 and
PROCDKA;1:CDKB2;2 plants grown for 22 DAS; (B) Image of leaf series after 26 DAS; (C) Rosette area
(n=30-40); (D) Leaf blade area (n=35-40); (E) Leaf blade length; (F) Leaf blade width; (G) Root
length from 3 to 12 DAS (n=14); (H) Root elongation rate. Error bars represent standard error. An
asterisk in panels C-F indicates a significant difference at ***P<0.001.
Col CDKB2;20
50
100
150
200
250
Col
***
Rose
tte
are
a (
mm
2) (C)
CDKB2;2 Col CDKB2;20
10
20
30
40
Col CDKB2;2
***L
eaf
bla
de
are
a
(mm
2)
(D)
Col ProCDKA;1:CDKB2;2
(A)
(B)
Col CDKB2;20
2
4
6
8
Col CDKB2;2
***
Lea
f b
lad
e le
ng
th
(mm
)
(E)
Col CDKB2;20
2
4
6
8
Col CDKB2;2
***
Lea
f b
lad
e w
idth
(mm
)
(F)
3 6 9 12
80
120
160
200
240
280
320
Root
Elo
ngati
on
Rate
(mm
/h)
DAS
Col
CDKB2;2
(H)
Col
ProCDKA;1:
CDKB2;2
3 6 9 120
10
20
30
40
50
60 (G)
Ro
ot
len
gth
(m
m)
DAS
Col
CDKB2;2
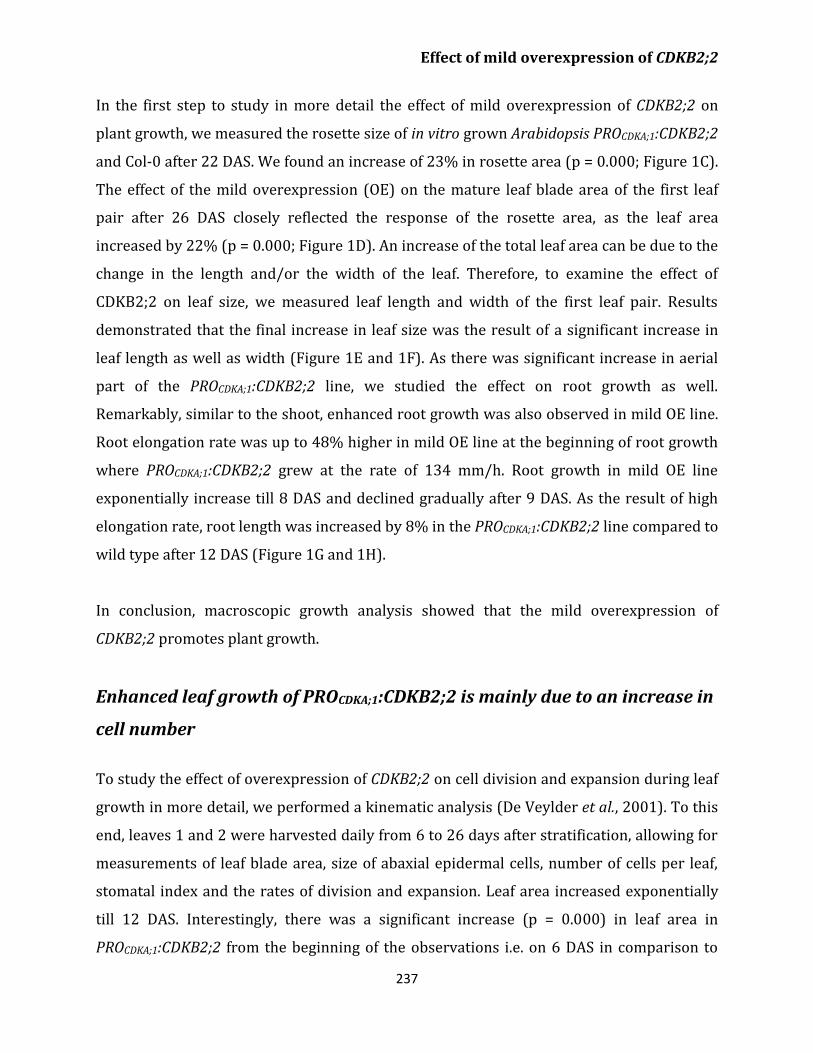
Effect of mild overexpression of CDKB2;2
237
In the first step to study in more detail the effect of mild overexpression of CDKB2;2 on
plant growth, we measured the rosette size of in vitro grown Arabidopsis PROCDKA;1:CDKB2;2
and Col-0 after 22 DAS. We found an increase of 23% in rosette area (p = 0.000; Figure 1C).
The effect of the mild overexpression (OE) on the mature leaf blade area of the first leaf
pair after 26 DAS closely reflected the response of the rosette area, as the leaf area
increased by 22% (p = 0.000; Figure 1D). An increase of the total leaf area can be due to the
change in the length and/or the width of the leaf. Therefore, to examine the effect of
CDKB2;2 on leaf size, we measured leaf length and width of the first leaf pair. Results
demonstrated that the final increase in leaf size was the result of a significant increase in
leaf length as well as width (Figure 1E and 1F). As there was significant increase in aerial
part of the PROCDKA;1:CDKB2;2 line, we studied the effect on root growth as well.
Remarkably, similar to the shoot, enhanced root growth was also observed in mild OE line.
Root elongation rate was up to 48% higher in mild OE line at the beginning of root growth
where PROCDKA;1:CDKB2;2 grew at the rate of 134 mm/h. Root growth in mild OE line
exponentially increase till 8 DAS and declined gradually after 9 DAS. As the result of high
elongation rate, root length was increased by 8% in the PROCDKA;1:CDKB2;2 line compared to
wild type after 12 DAS (Figure 1G and 1H).
In conclusion, macroscopic growth analysis showed that the mild overexpression of
CDKB2;2 promotes plant growth.
Enhanced leaf growth of PROCDKA;1:CDKB2;2 is mainly due to an increase in
cell number
To study the effect of overexpression of CDKB2;2 on cell division and expansion during leaf
growth in more detail, we performed a kinematic analysis (De Veylder et al., 2001). To this
end, leaves 1 and 2 were harvested daily from 6 to 26 days after stratification, allowing for
measurements of leaf blade area, size of abaxial epidermal cells, number of cells per leaf,
stomatal index and the rates of division and expansion. Leaf area increased exponentially
till 12 DAS. Interestingly, there was a significant increase (p = 0.000) in leaf area in
PROCDKA;1:CDKB2;2 from the beginning of the observations i.e. on 6 DAS in comparison to
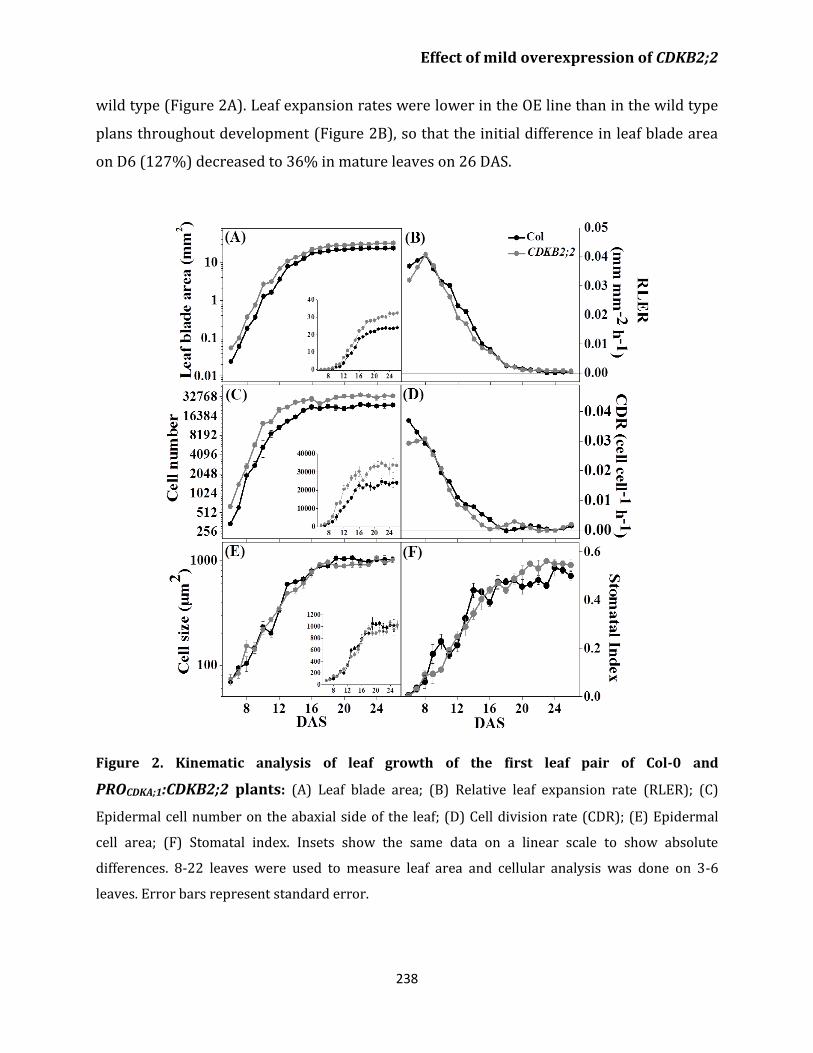
Effect of mild overexpression of CDKB2;2
238
wild type (Figure 2A). Leaf expansion rates were lower in the OE line than in the wild type
plans throughout development (Figure 2B), so that the initial difference in leaf blade area
on D6 (127%) decreased to 36% in mature leaves on 26 DAS.
Figure 2. Kinematic analysis of leaf growth of the first leaf pair of Col-0 and
PROCDKA;1:CDKB2;2 plants: (A) Leaf blade area; (B) Relative leaf expansion rate (RLER); (C)
Epidermal cell number on the abaxial side of the leaf; (D) Cell division rate (CDR); (E) Epidermal
cell area; (F) Stomatal index. Insets show the same data on a linear scale to show absolute
differences. 8-22 leaves were used to measure leaf area and cellular analysis was done on 3-6
leaves. Error bars represent standard error.
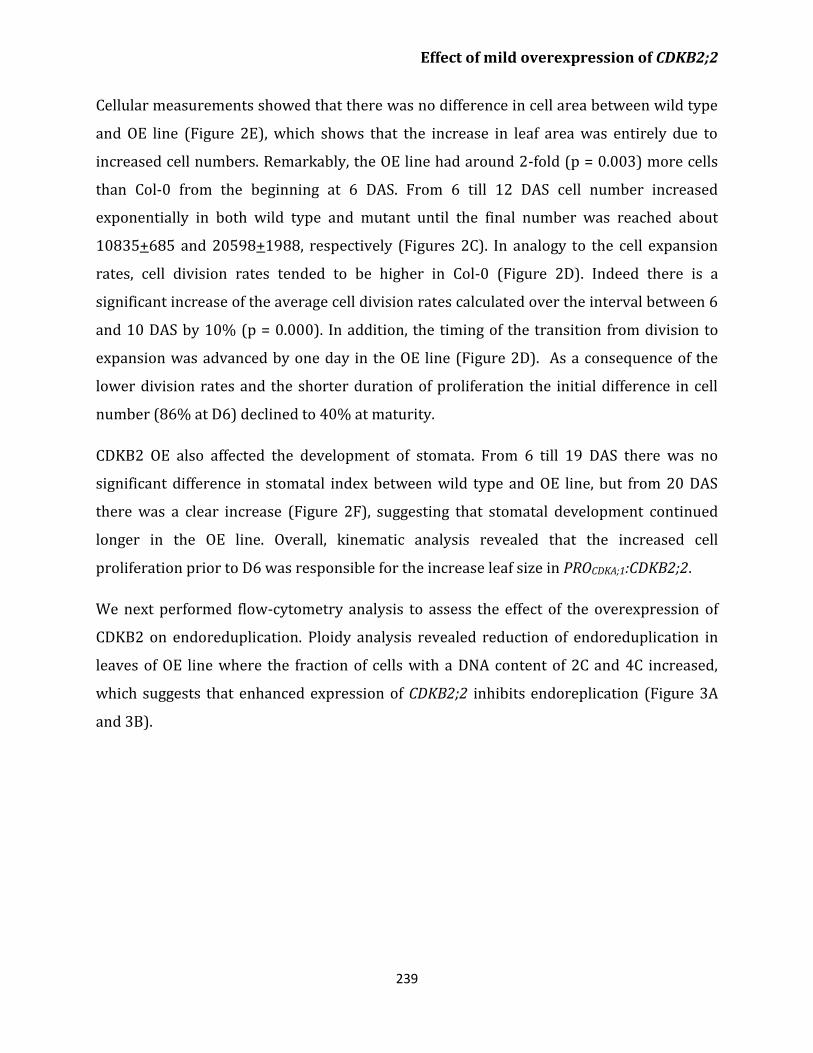
Effect of mild overexpression of CDKB2;2
239
Cellular measurements showed that there was no difference in cell area between wild type
and OE line (Figure 2E), which shows that the increase in leaf area was entirely due to
increased cell numbers. Remarkably, the OE line had around 2-fold (p = 0.003) more cells
than Col-0 from the beginning at 6 DAS. From 6 till 12 DAS cell number increased
exponentially in both wild type and mutant until the final number was reached about
10835+685 and 20598+1988, respectively (Figures 2C). In analogy to the cell expansion
rates, cell division rates tended to be higher in Col-0 (Figure 2D). Indeed there is a
significant increase of the average cell division rates calculated over the interval between 6
and 10 DAS by 10% (p = 0.000). In addition, the timing of the transition from division to
expansion was advanced by one day in the OE line (Figure 2D). As a consequence of the
lower division rates and the shorter duration of proliferation the initial difference in cell
number (86% at D6) declined to 40% at maturity.
CDKB2 OE also affected the development of stomata. From 6 till 19 DAS there was no
significant difference in stomatal index between wild type and OE line, but from 20 DAS
there was a clear increase (Figure 2F), suggesting that stomatal development continued
longer in the OE line. Overall, kinematic analysis revealed that the increased cell
proliferation prior to D6 was responsible for the increase leaf size in PROCDKA;1:CDKB2;2.
We next performed flow-cytometry analysis to assess the effect of the overexpression of
CDKB2 on endoreduplication. Ploidy analysis revealed reduction of endoreduplication in
leaves of OE line where the fraction of cells with a DNA content of 2C and 4C increased,
which suggests that enhanced expression of CDKB2;2 inhibits endoreplication (Figure 3A
and 3B).
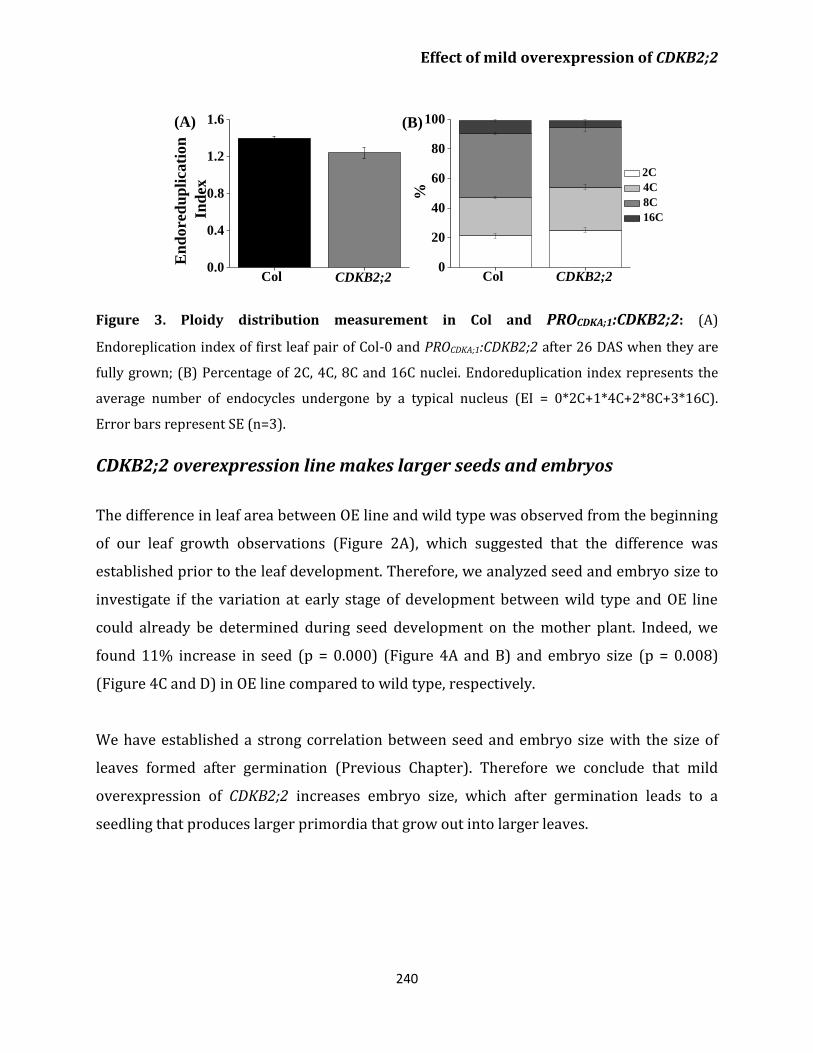
Effect of mild overexpression of CDKB2;2
240
Figure 3. Ploidy distribution measurement in Col and PROCDKA;1:CDKB2;2: (A)
Endoreplication index of first leaf pair of Col-0 and PROCDKA;1:CDKB2;2 after 26 DAS when they are
fully grown; (B) Percentage of 2C, 4C, 8C and 16C nuclei. Endoreduplication index represents the
average number of endocycles undergone by a typical nucleus (EI = 0*2C+1*4C+2*8C+3*16C).
Error bars represent SE (n=3).
CDKB2;2 overexpression line makes larger seeds and embryos
The difference in leaf area between OE line and wild type was observed from the beginning
of our leaf growth observations (Figure 2A), which suggested that the difference was
established prior to the leaf development. Therefore, we analyzed seed and embryo size to
investigate if the variation at early stage of development between wild type and OE line
could already be determined during seed development on the mother plant. Indeed, we
found 11% increase in seed (p = 0.000) (Figure 4A and B) and embryo size (p = 0.008)
(Figure 4C and D) in OE line compared to wild type, respectively.
We have established a strong correlation between seed and embryo size with the size of
leaves formed after germination (Previous Chapter). Therefore we conclude that mild
overexpression of CDKB2;2 increases embryo size, which after germination leads to a
seedling that produces larger primordia that grow out into larger leaves.
Col CDKB2;20
20
40
60
80
100
Col CDKB2;2
%
2C
4C
8C
16C
(B)
Col CDKB2;20.0
0.4
0.8
1.2
1.6
Col
En
do
red
up
lica
tio
n
Ind
ex
(A)
CDKB2;2
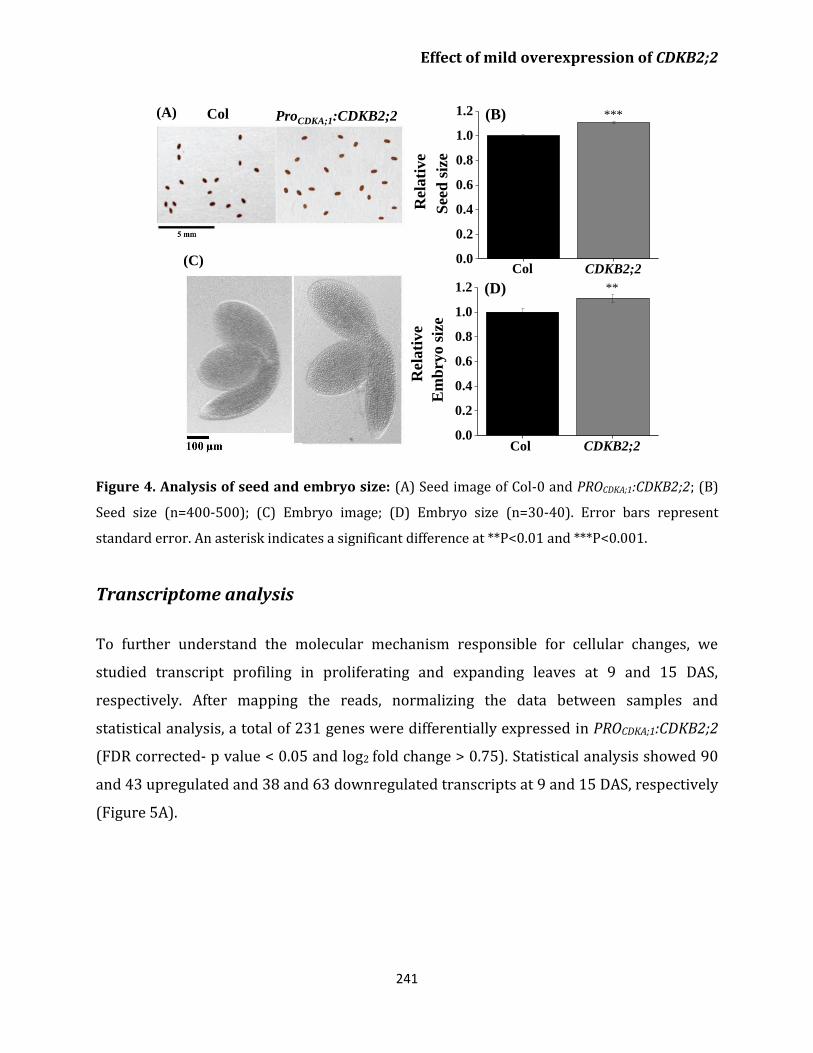
Effect of mild overexpression of CDKB2;2
241
Figure 4. Analysis of seed and embryo size: (A) Seed image of Col-0 and PROCDKA;1:CDKB2;2; (B)
Seed size (n=400-500); (C) Embryo image; (D) Embryo size (n=30-40). Error bars represent
standard error. An asterisk indicates a significant difference at **P<0.01 and ***P<0.001.
Transcriptome analysis
To further understand the molecular mechanism responsible for cellular changes, we
studied transcript profiling in proliferating and expanding leaves at 9 and 15 DAS,
respectively. After mapping the reads, normalizing the data between samples and
statistical analysis, a total of 231 genes were differentially expressed in PROCDKA;1:CDKB2;2
(FDR corrected- p value < 0.05 and log2 fold change > 0.75). Statistical analysis showed 90
and 43 upregulated and 38 and 63 downregulated transcripts at 9 and 15 DAS, respectively
(Figure 5A).
ProCDKA;1:CDKB2;2Col(A)
(C)Col CDKB2;2
0.0
0.2
0.4
0.6
0.8
1.0
1.2
Col
***
Rel
ati
ve
See
d s
ize
(B)
CDKB2;2
Col CDKB2;20.0
0.2
0.4
0.6
0.8
1.0
1.2
Col CDKB2;2
**
R
ela
tiv
e
Em
bry
o s
ize
(D)
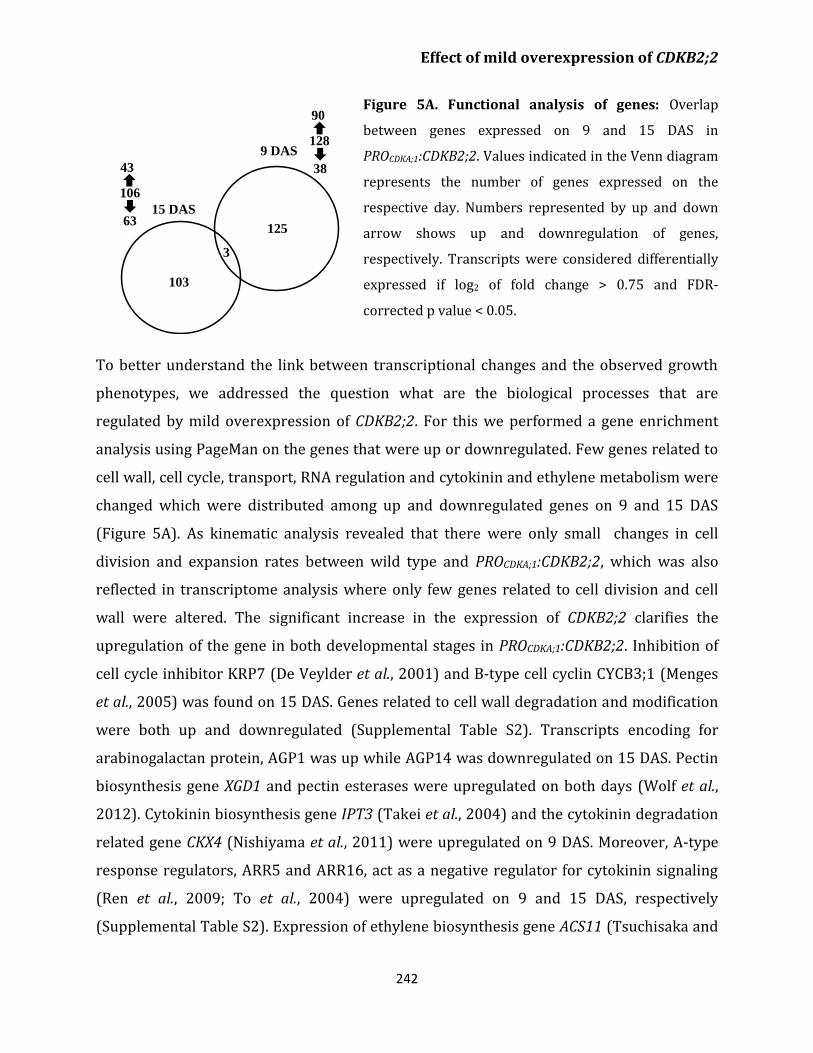
Effect of mild overexpression of CDKB2;2
242
Figure 5A. Functional analysis of genes: Overlap
between genes expressed on 9 and 15 DAS in
PROCDKA;1:CDKB2;2. Values indicated in the Venn diagram
represents the number of genes expressed on the
respective day. Numbers represented by up and down
arrow shows up and downregulation of genes,
respectively. Transcripts were considered differentially
expressed if log2 of fold change > 0.75 and FDR-
corrected p value < 0.05.
To better understand the link between transcriptional changes and the observed growth
phenotypes, we addressed the question what are the biological processes that are
regulated by mild overexpression of CDKB2;2. For this we performed a gene enrichment
analysis using PageMan on the genes that were up or downregulated. Few genes related to
cell wall, cell cycle, transport, RNA regulation and cytokinin and ethylene metabolism were
changed which were distributed among up and downregulated genes on 9 and 15 DAS
(Figure 5A). As kinematic analysis revealed that there were only small changes in cell
division and expansion rates between wild type and PROCDKA;1:CDKB2;2, which was also
reflected in transcriptome analysis where only few genes related to cell division and cell
wall were altered. The significant increase in the expression of CDKB2;2 clarifies the
upregulation of the gene in both developmental stages in PROCDKA;1:CDKB2;2. Inhibition of
cell cycle inhibitor KRP7 (De Veylder et al., 2001) and B-type cell cyclin CYCB3;1 (Menges
et al., 2005) was found on 15 DAS. Genes related to cell wall degradation and modification
were both up and downregulated (Supplemental Table S2). Transcripts encoding for
arabinogalactan protein, AGP1 was up while AGP14 was downregulated on 15 DAS. Pectin
biosynthesis gene XGD1 and pectin esterases were upregulated on both days (Wolf et al.,
2012). Cytokinin biosynthesis gene IPT3 (Takei et al., 2004) and the cytokinin degradation
related gene CKX4 (Nishiyama et al., 2011) were upregulated on 9 DAS. Moreover, A-type
response regulators, ARR5 and ARR16, act as a negative regulator for cytokinin signaling
(Ren et al., 2009; To et al., 2004) were upregulated on 9 and 15 DAS, respectively
(Supplemental Table S2). Expression of ethylene biosynthesis gene ACS11 (Tsuchisaka and
9 DAS
15 DAS
3
103
125
128
90
38
106
43
63
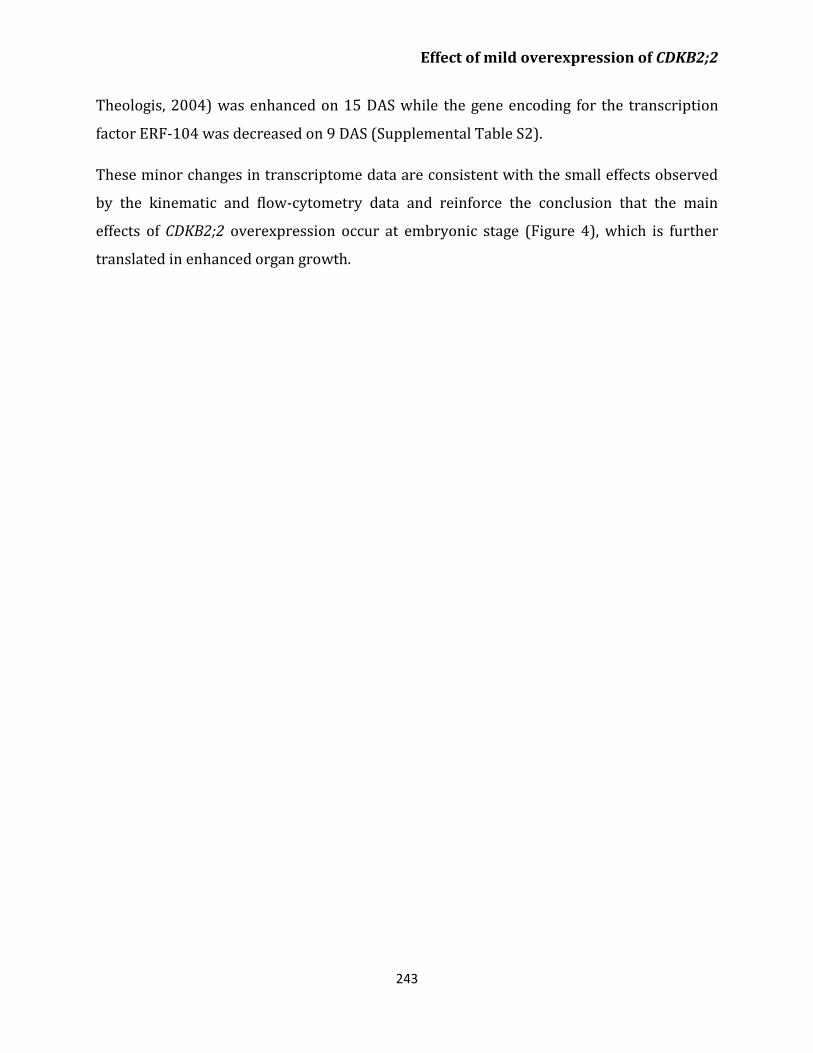
Effect of mild overexpression of CDKB2;2
243
Theologis, 2004) was enhanced on 15 DAS while the gene encoding for the transcription
factor ERF-104 was decreased on 9 DAS (Supplemental Table S2).
These minor changes in transcriptome data are consistent with the small effects observed
by the kinematic and flow-cytometry data and reinforce the conclusion that the main
effects of CDKB2;2 overexpression occur at embryonic stage (Figure 4), which is further
translated in enhanced organ growth.
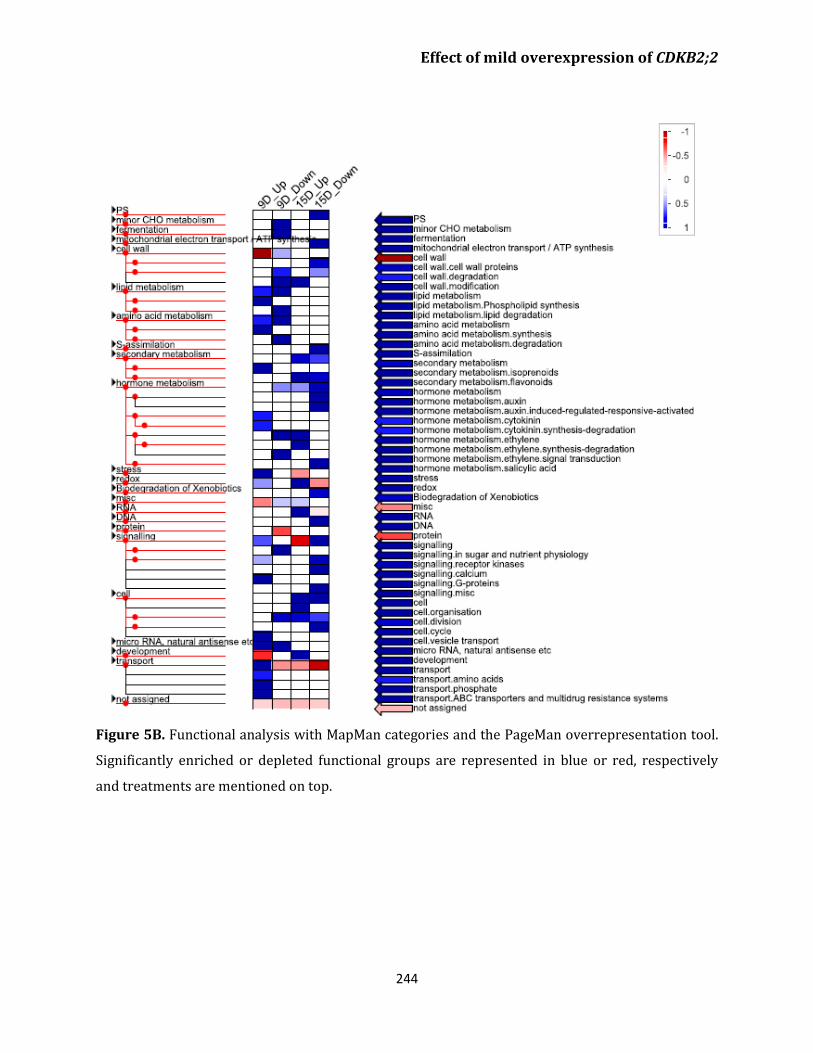
Effect of mild overexpression of CDKB2;2
244
Figure 5B. Functional analysis with MapMan categories and the PageMan overrepresentation tool.
Significantly enriched or depleted functional groups are represented in blue or red, respectively
and treatments are mentioned on top.
Effect of mild overexpression of CDKB2;2
245
Discussion
CDKB is the only plant specific CDK family. It has been reported that silencing of the
CDKB2s as well as overexpression by 35S promoter caused abnormal SAM formation and
reduced plant growth (Andersen et al., 2008). We hypothesize that more modest
upregulation may be less detrimental for plant development. Indeed, we show that a mild
overexpression of CDKB2;2 in fact enhances plant growth. Moreover, role of CDKB2 in leaf
growth has not been explored in detail. One study showed that overexpressing a dominant
negative CDKB1;1 reduced the number of cells while increasing the cell size as well
endoreplication (Boudolf et al., 2004b). Here, we show that in addition to CDKB1, CDKB2
affects leaf growth as our study demonstrate that a mild stimulation of CDKB2;2 increases
leaf growth. Interestingly and in contrast to Boudolf et al. (2004b) no change in cell size
was observed. So, the enhanced leaf growth was only influenced by increased cell
proliferation.
One of the main findings of our research was that increased CDKB2 expression stimulates
seedling growth through enhanced embryonic development. The data on leaf development
are consistent with the idea that a larger seedling would have a larger SAM allowing for a
larger number of cells to be recruited in the primordium, which influence the later stage of
leaf development. In support of this hypothesis, previous studies have shown that the
number of cells in leaf primordium affects the final leaf size. Mutation in SWP, encodes for
RNA polymerase II transcription mediator, reduced leaf size by decreasing cell size. It was
found that the reduction in cell number was established at an early stage of primordium
initiation (Autran et al., 2002). Moreover, according to the AtGenExpress developmental
dataset, CDKB2s are highly expressed during the development of seeds and shoot apical
meristem (Schmid et al., 2003). Additionally, manipulation in CDKB2 expression was also
seen to inhibit growth of the shoot apical meristem (Andersen et al., 2008). This suggests
that the CDKB2 plays an important role in the seed development and organ initiation stage
in plants.
Effect of mild overexpression of CDKB2;2
246
Another important finding of moderate upregulation of CDKB2;2 was the decreased
endoreplication, which suggests that a decreased activity of CDKB2;2 is necessary for the
initiation of endoreplication. Consistently, downregulation of CDKB2 was found to have
higher DNA content (Andersen et al., 2008, Adachi et al., 2011). On the other hand opposite
to our results overexpression of CDKB2 was also found to increase endoreplication in
Arabidopsis (Andersen et al., 2008). Moreover, endoreplication is often associated with
differentiation processes (Breuer et al., 2010; De Veylder et al., 2011), and thus, the results
of the ploidy analysis are consistent with a delayed onset of cell differentiation in CDKB2;2-
overexpressing plants where upregulation of CDKB2;2 stimulates stomatal development by
extending the time frame during which the stomates are formed.
Cytokinin is essential for controlling cell division by modulating expression of D-type cyclin
(Riou-Khamlichi et al., 1999). Moreover, it controls initiation of shoot apical meristem, leaf
and root differentiation, chloroplast biogenesis, stress tolerance and inhibition of leaf
senescence (Haberer and Kieber, 2002; Riefler et al., 2006; Zwack and Rashotte, 2013). One
of the more prominent features in our transcriptome study was the upregulation of
cytokinin synthesis and feedback regulator (Supplemental Table S2), which suggest that
the mild overexpression of CDKB2;2 stimulate cytokinin production which enhances cell
division and ultimately increases leaf growth. Consistent with our results, Andersen et al.
(2008) has also found that the inhibition of CDKB2s downregulates cytokinin level in
Arabidopsis thaliana. In conclusion, our study clearly shows that CDKB2;2 is an important
regulator for embryonic development. It promotes cell division in leaves in a hormone-
dependent manner. Moreover, detailed cellular and molecular analysis at shoot apical
meristem can resolve the mechanism that causes enhanced leaf growth and can also
highlight other cell cycle regulators that promote the activity of CDKB2;2.
Effect of mild overexpression of CDKB2;2
247
Material and Methods
Plant material and growth conditions
The Arabidopsis PROCDKA;1:CDKB2;2 line was used to study the role of CKDB2;2 in plant
growth. The overexpression line is in Col-0 background and was kindly provided by Arp
Schnittger (CNRS, France). Seeds from CDKB2;2 overexpression line and wild type were
sterilized in 70% ethanol for 1 minute and 5% bleach for 10 minutes followed by rinsing
with water and sown on half-strength MS (Murashige and Skoog, 1962) medium (Duchefa,
The Netherlands) supplemented with 1% sucrose and 0.8% plant agar (Duchefa
Biochemie) in 150x25 mm round petri dishes (Falcon® tissue culture dishes, VWR) for
shoot and 120x120x17 mm square petri dishes (Greiner Bio One) for root growth. After
stratification at 4°C for 2 days plates were transferred to a growth chamber with an air
temperature of 22°C and shelves cooled to 19°C under a 16 h day [80-90 µmols-1m-2 s-1
photosynthetically active radiation (PAR), supplemented by fluorescent tubes (cool white, ,
LUMILUX, Germany)] and 8 h night regime.
Leaf and root growth analysis
Growth analysis was performed on the first leaf pair. Leaves were fixed and cleared with
70% ethanol for 24 h and subsequently in 100% lactic acid, which was also used as a
mounting agent. Leaf images were obtained with a binocular microscope (Nikon SMZ1000)
fitted with a digital camera (Zeiss [AxioCam Cc1]). For phenotyping of mutants, leaf images
were taken on 26 DAS (days after stratification) whereas for the kinematic analysis images
were taken from 6 to 26 DAS. For each day leaf surface area of 10-25 leaves were measured
using ImageJ 1.48v (http://rsbweb.nih.gov/ij/). Logarithmic values of means of leaf surface
area was used and locally fitted with a 5 point quadratic function (Erickson, 1976) of which
the first derivative was used to determine the relative expansion rate.
Effect of mild overexpression of CDKB2;2
248
For the root growth, plants of Col-0 and PROCDKA;1:CDKB2;2 were grown on vertically
inclined petriplates for 12 DAS and root length was measured every day at the same time
and root length and elongation rate was measured using ImageJ.
Cellular measurements
We performed a kinematic analysis of the abaxial epidermal cells of 3-6 average leaves
from 6 to 26 DAS as described by Nelissen et al. (2013). Leaves of early days, i.e. 6-10 DAS,
were stained with propidium iodide followed by the protocol of Wuyts et al. (2010) and cell
images were obtained with a Nikon C1 confocal microscope using a Nikon Eclipse E600.
Leaf samples of later days were cleared with 70% ethanol and subsequently stored and
mounted in 100% lactic acid on object slides for microscopy. Epidermal cells located on
top, middle and bottom were imaged using DIC optics on a Zeiss Axio Scope A1 at 20x and
40x magnification fitted with a digital camera (Zeiss [AxioCam Cm1]). The outlines of
imaged epidermal cells were hand drawn on an LCD tablet (Wacom drawing pad)
connected to an iMac computer running ImageJ. Cell analysis of drawn cells was done with
automated image analysis software that measures the total area of drawn cells and that
counts the number of cells (Andriankaja et al., 2012). From these data we calculated
average cell area, estimated the number of cells per leaf by dividing leaf blade area by cell
area and stomatal index was calculated as the percentage of stomata across all epidermal
cells. We calculated cell division rates as the relative rate of increase in cell number over
time. For this, the logarithmic values of mean of cell number were locally fitted with 5 point
quadratic function of which the first derivative was used as the division rate.
Flow cytometric analysis
First leaf pair of wild type and OE (overexpression) line was harvested, frozen in liquid
nitrogen, and kept at -80°C until analysis. For flow cytometry analysis, nuclei were
extracted by chopping 3 to 5 leaves with a razor blade in 200 μl of Cystain UV Precise P
Nuclei extraction buffer (Partec), supplemented with 800 μl of staining buffer. The mix was
filtered through a 50 μm filter and read through the Cyflow MB flow cytometer (Partec).
Effect of mild overexpression of CDKB2;2
249
The nuclei were analyzed with the CyFlow flow cytometer and the FloMax software
(Partec).
Embryo and seed size measurements
Seeds of Col-0 and PROCDKA;1:CDKB2;2 line were stratified in darkness at 4°C for 4 days, and
then sown in potting mix (Tref EGO substrates, Moerdijk, The Netherlands, 5×5 cm pots),
filled with a mixture (1:1, v/v) of a loamy soil and organic compost at a humidity of 0.30 g
water /g dry soil. Pots were transferred to a controlled growth chamber with an air
temperature of 21/18°C and 50-55% humidity under a 16 h day (90-100 µmols-1m-2 s-1
PAR) and 8 h night regime. Siliques were harvested at stage 10 (Bowman, 1994) and the
seeds were dissected under the binocular to isolate embryos. Embryos were treated for 1 h
in Hoyer’s solution according to Ohto et al. (2005). The images of around 30-40 embryos
were obtained with DIC microscope and their areas were measured by ImageJ.
Around 500 dried seeds from four different plants of wild type and mutant grown next to
each other were used to study seed size. Seed images were taken with digital camera and
their areas were also measured by ImageJ.
Transcriptome analysis
To study the effect of overexpression of CDKB2;2 on leaf growth, primordia of leaves 1 and
2 were dissected under a binocular at 9 and 15 DAS. Total RNA of three replicates each
containing around 50-250 leaves was isolated using Trizol Reagent (Life Technologies) and
the quantity and integrity of the RNA was measured spectrophotometrically on QIAxcel
system (Qiagen). Library preparation was done using the TruSeq® Stranded mRNA sample
preparation 96 rcx kit (Illumina™) following the low sample protocol according to
Illumina™ guidelines. Briefly, approximately 2.5 µg of total RNA was purified using RNA
purification beads targeting the poly-A tail of the mRNA and subsequently was fragmented
by means of the enzymes provided in the kit. After the cDNA synthesis adenylation of 3’
ends and ligation of the adaptors were employed. Adaptors were ligated in 12-plex
Effect of mild overexpression of CDKB2;2
250
formations, allowing the pooling of 12 samples after the PCR enrichment of the library.
Subsequently, the library was quantified using PicoGreen® dye (Life Technologies™).
Thereafter 12 samples were pooled at equal concentrations to create the pool. In order to
accurately quantify the concentration in nM of our pools, the Kapa SYBR® FAST universal
qPCR kit (KAPA Biosystems ™) for Illunima™ sequencing was used to quantify the number
of the amplifiable molecules in the pools and the Bioanalyzer® (Agilent Technologies™) to
determine the average fragment size of our pools. In order to precede with the run the
HiSeq 1500 was used in the rapid mode together with the TruSeq® Rapid SBS Kit for 50
cycles, to sequencing the samples.
Data analysis
Transcriptome analysis ware performed by means of CLC Genomics Workbench v.6 using
Arabidopsis thaliana (Col-0 TAIR10) sequence database (http://www.arabidopsis.org/) as
reference genome. The RNA-Seq analysis was carried out for sequence reads obtained from
mutant harvested at 9 and 15 DAS. Briefly, after the trimming of adaptors from the
sequences, they were mapped against the reference genome. The expression values were
calculated based on “reads per kilobase of exon model per million mapped reads” (RPKM)
values (Mortazavi et al., 2008). RNA-seq data was grouped accordingly and two group
comparisons (unpaired) were performed. The expression values were normalized by
scaling to corresponding controls and for comparisons of interest, moderated t statistics
were calculated using the Baggerley’s test and p values were corrected for multiple testing
for each contrast separately (Baggerly et al., 2003). False discovery rate (FDR) corrected p
value < 0.05 was used as a cutoff (Benjamini and Hochberg, 1995). Gene enrichment
analysis of all differentially expressed genes was carried out by PageMan (Usadel et al.,
2006).
Statistical analysis
Standard error was calculated from different replicates on each time point for rosette area,
leaf area, leaf length, leaf width, root length, cell area, cell number and stomatal index.
Effect of mild overexpression of CDKB2;2
251
Statistical analysis of rosette area, leaf area, leaf length, leaf width, seed and embryo size
was conducted by t test on excel.
Supplemental Data
The following materials are available upon request.
Supplemental Table S1. All the genes for which expression was detected in all three
replicates of at least one treatment.
Supplemental Table S2. Significant genes according to cutoff (FDR p value<0.05, log2 fold
change>0.75).
Acknowledgments
This work was supported by a concerted research activity (GOA) research grant, ‘A Systems
Biology Approach of Leaf Morphogenesis’ from the research council of the University of
Antwerp and an Interuniversity Attraction Poles (IUAP) from the Belgian Federal Science
Policy Office (BELSPO). Shweta Kalve was funded by a training grant from the Department
of Science and Education of the Flemish Government.
References
Adachi S, Minamisawa K, Okushima Y, Inagaki S, Yoshiyama K, Kondou Y, Kaminuma
E, Kawashima M, Toyoda T, Matsui M, Kurihara D, Matsunaga S, Umeda M. 2011.
Programmed induction of endoreduplication by DNA double-strand breaks in Arabidopsis.
Proc Natl Acad Sci U S A 108, 10004–10009.
Andersen SU, Buechel S, Zhao Z, Ljung K, Novak O, Busch W, Schuster C, Lohmann JU.
2008. Requirement of B2-type cyclin-dependent kinases for meristem integrity in
Arabidopsis thaliana. Plant Cell 20, 88-100.
Andriankaja M, Dhondt S, De Bodt S, Vanhaeren H, Coppens F, De Milde L,
Muhlenbock P, Skirycz A, Gonzalez N, Beemster GT, Inze D. 2012. Exit from
Effect of mild overexpression of CDKB2;2
252
proliferation during leaf development in Arabidopsis thaliana: a not-so-gradual process.
Dev Cell 22, 64-78.
Autran D, Jonak C, Belcram K, Beemster GT, Kronenberger J, Grandjean O, Inze D,
Traas J. 2002. Cell numbers and leaf development in Arabidopsis: a functional analysis of
the STRUWWELPETER gene. EMBO J 21, 6036-6049.
Baggerly KA, Deng L, Morris JS, Aldaz CM. 2003. Differential expression in SAGE:
accounting for normal between-library variation. Bioinformatics 19, 1477-1483.
Benjamini Y, Hochberg Y. 1995. Controlling the false discovery rate: a practical and
powerful approach to multiple testing. J R Stat Soc 57, 289-300.
Boruc J, Van den Daele H, Hollunder J, Rombauts S, Mylle E, Hilson P, Inze D, De
Veylder L, Russinova E. 2010. Functional modules in the Arabidopsis core cell cycle binary
protein-protein interaction network. Plant Cell 22, 1264-1280.
Boudolf V, Barroco R, Engler Jde A, Verkest A, Beeckman T, Naudts M, Inze D, De
Veylder L. 2004a. B1-type cyclin-dependent kinases are essential for the formation of
stomatal complexes in Arabidopsis thaliana. Plant Cell 16, 945-955.
Boudolf V, Rombauts S, Naudts M, Inze D, De Veylder L. 2001. Identification of novel
cyclin-dependent kinases interacting with the CKS1 protein of Arabidopsis. J Exp Bot 52,
1381-1382.
Boudolf V, Vlieghe K, Beemster GT, Magyar Z, Torres Acosta JA, Maes S, Van Der
Schueren E, Inze D, De Veylder L. 2004b. The plant-specific cyclin-dependent kinase
CDKB1;1 and transcription factor E2Fa-DPa control the balance of mitotically dividing and
endoreduplicating cells in Arabidopsis. Plant Cell 16, 2683-2692.
Effect of mild overexpression of CDKB2;2
253
Bowman J. 1994. Arabidopsis: An atlas of morphology and development. Springer New
York.
Breuer C, Ishida T, Sugimoto K. 2010. Developmental control of endocycles and cell
growth in plants. Curr Opin Plant Biol 13, 654-660.
De Veylder L, Larkin JC, Schnittger A. 2011. Molecular control and function of
endoreplication in development and physiology. Trends Plant Sci 16, 624-634.
De Veylder L, Beeckman T, Beemster GT, Krols L, Terras F, Landrieu I, van der
Schueren E, Maes S, Naudts M, Inze D. 2001. Functional analysis of cyclin-dependent
kinase inhibitors of Arabidopsis. Plant Cell 13, 1653-1668.
Dewitte W, Murray JA. 2003. The plant cell cycle. Annu Rev Plant Biol, Vol 61 54, 235-264.
Endo M, Nakayama S, Umeda-Hara C, Ohtsuki N, Saika H, Umeda M, Toki S. 2012.
CDKB2 is involved in mitosis and DNA damage response in rice. Plant J 69, 967–977.
Erickson RO. 1976. Modeling of plant growth. Annu Rev Plant Physiol 27, 407-434.
Gonzalez N, Vanhaeren H, Inze D. 2012. Leaf size control: complex coordination of cell
division and expansion. Trends Plant Sci 17, 332-340.
Haberer G, Kieber JJ. 2002. Cytokinins. New insights into a classic phytohormone. Plant
Physiol 128, 354-362.
Hemerly A, Engler Jde A, Bergounioux C, Van Montagu M, Engler G, Inze D, Ferreira P.
1995. Dominant negative mutants of the Cdc2 kinase uncouple cell division from iterative
plant development. EMBO J 14, 3925-3936.

Effect of mild overexpression of CDKB2;2
254
Inze D, De Veylder L. 2006. Cell cycle regulation in plant development. Annu Rev Genet 40,
77-105.
Inze D, Gutierrez C, Chua NH. 1999. Trends in plant cell cycle research. Plant Cell 11, 991-
994.
Menges M, de Jager SM, Gruissem W, Murray JA. 2005. Global analysis of the core cell
cycle regulators of Arabidopsis identifies novel genes, reveals multiple and highly specific
profiles of expression and provides a coherent model for plant cell cycle control. Plant J 41,
546-566.
Mortazavi A, Williams BA, McCue K, Schaeffer L, Wold B. 2008. Mapping and quantifying
mammalian transcriptomes by RNA-Seq. Nat Methods 5, 621-628.
Murashige T, Skoog F. 1962. A revised medium for rapid growth and bioassays with
tobacco tissue cultures. Physiol Plant 15, 473–497.
Nelissen H, Rymen B, Coppens F, Dhondt S, Fiorani F, Beemster GT. 2013. Kinematic
analysis of cell division in leaves of mono- and dicotyledonous species: a basis for
understanding growth and developing refined molecular sampling strategies. Methods Mol
Biol 959, 247-264.
Nishiyama R, Watanabe Y, Fujita Y, Le DT, Kojima M, Werner T, Vankova R,
Yamaguchi-Shinozaki K, Shinozaki K, Kakimoto T, Sakakibara H, Schmulling T, Tran
LS. 2011. Analysis of cytokinin mutants and regulation of cytokinin metabolic genes reveals
important regulatory roles of cytokinins in drought, salt and abscisic acid responses, and
abscisic acid biosynthesis. Plant Cell 23, 2169-2183.
Nowack MK, Harashima H, Dissmeyer N, Zhao X, Bouyer D, Weimer AK, De Winter F,
Yang F, Schnittger A. 2012. Genetic framework of cyclin-dependent kinase function in
Arabidopsis. Dev Cell 22, 1030-1040.
Effect of mild overexpression of CDKB2;2
255
Ohto MA, Fischer RL, Goldberg RB, Nakamura K, Harada JJ. 2005. Control of seed mass
by APETALA2. Proc Natl Acad Sci U S A 102, 3123-3128.
Porceddu A, Stals H, Reichheld J, Segers G, De Veylder L, Barroˆco RP, Casteels P,
Montagu MV, Inze´ D, Mironov V. 2001. A plant-specific cyclin-dependent kinase is
involved in the control of G2/M progression in plants. J Biol Chem 276, 36354-36360.
Ren B, Liang Y, Deng Y, Chen QG, Zhang J, Yang XH, Zuo JR. 2009. Genome-wide
comparative analysis of type-A Arabidopsis response regulator genes by overexpression
studies reveals their diverse roles and regulatory mechanisms in cytokinin signaling. Cell
Res 19, 1178-1190.
Riefler M, Novak O, Strnad M, Schmulling T. 2006. Arabidopsis cytokinin receptor
mutants reveal functions in shoot growth, leaf senescence, seed size, germination, root
development, and cytokinin metabolism. Plant Cell 18, 40-54.
Riou-Khamlichi C, Huntley R, Jacqmard A, Murray JA. 1999. Cytokinin activation of
Arabidopsis cell division through a D-type cyclin. Science 283, 1541-1544.
Schmid M, Uhlenhaut NH, Godard F, Demar M, Bressan R, Weigel D, Lohmann JU.
2003. Dissection of floral induction pathways using global expression analysis.
Development 130, 6001-6012.
Takei K, Ueda N, Aoki K, Kuromori T, Hirayama T, Shinozaki K, Yamaya T, Sakakibara
H. 2004. AtIPT3 is a key determinant of nitrate-dependent cytokinin biosynthesis in
Arabidopsis. Plant Cell Physiol 45, 1053-1062.
To JPC, Haberer G, Ferreira FJ, Deruere J, Mason MG, Schaller GE, Alonso JM, Ecker JR,
Kieber JJ. 2004. Type-A Arabidopsis response regulators are partially redundant negative
regulators of cytokinin signaling. Plant Cell 16, 658-671.
Effect of mild overexpression of CDKB2;2
256
Tsuchisaka A, Theologis A. 2004. Unique and overlapping expression patterns among the
Arabidopsis 1-amino-cyclopropane-1-carboxylate synthase gene family members. Plant
Physiol 136, 2982-3000.
Usadel B, Nagel A, Steinhauser D, Gibon Y, Blasing OE, Redestig H, Sreenivasulu N,
Krall L, Hannah MA, Poree F, Fernie AR, Stitt M. 2006. PageMan: an interactive ontology
tool to generate, display, and annotate overview graphs for profiling experiments. BMC
Bioinformatics 7, 535.
Vandepoele K, Raes J, De Veylder L, Rouze P, Rombauts S, Inze D. 2002. Genome-wide
analysis of core cell cycle genes in Arabidopsis. Plant Cell 14, 903-916.
Wolf S, Hematy K, Hofte H. 2012. Growth control and cell wall signaling in plants. Annu
Rev Plant Biol 63, 381-407.
Wuyts N, Palauqui JC, Conejero G, Verdeil JL, Granier C, Massonnet C. 2010. High-
contrast three-dimensional imaging of the Arabidopsis leaf enables the analysis of cell
dimensions in the epidermis and mesophyll. Plant Methods 6.
Xie Z, Lee E, Lucas JR, Morohashi K, Li D, Murray JA, Sack FD, Grotewold E. 2010.
Regulation of cell proliferation in the stomatal lineage by the Arabidopsis MYB FOUR LIPS
via direct targeting of core cell cycle genes. Plant Cell 22, 2306-2321.
Zwack PJ, Rashotte AM. 2013. Cytokinin inhibition of leaf senescence. Plant Signal Behav
8, e24737.

Chapter 6
General Discussion and Future Perspectives

General discussion and future perspectives
259
Why Leaf Growth is Important?
The world population is predicted to increase by 2 billion over the next 36 years, which
extrapolates to 9 billion people by 2050. FAO’s (The Food and Agriculture Organization of
the United Nations) evaluation also shows the requirement to increase food production by
60% by 2050. Moreover, rising consumption of meat, dairy products and bio-fuel will also
require more agricultural growth (Godfray et al., 2010; Tilman et al., 2011). On the other
hand, this expected rapid increase in global food demand is even more challenging in the
context of global climate changes such as an increase in temperature, salinity and drought
(Dai, 2010; Ding et al., 2011; Hawkins et al., 2013; Tester and Langridge, 2010). To improve
crop yield under rapidly changing climatic conditions next to ongoing conventional
breeding, plant biotechnology, which in principle enables faster crop improvement, could
provide solutions. Therefore, to augment crop yield through biotechnological interventions,
molecular understanding of plant growth regulation is crucial.
Leaf is a major part of the shoot and a basic photosynthetic unit of the plant, which
provides the energy driving most ecosystems on the planet and the production of food for
the human population. Moreover, the leaf has a tendency to adapt to environmental
changes by modifying its size and anatomy to maximize life span and propagation.
Therefore, it is essential to understand the mechanisms regulating leaf growth and
development. Leaf growth is defined by two successive processes i.e. cell division followed
by cell expansion. This suggests that to understand the leaf growth, exploration of these
two processes is crucial. Over these years, it is becoming clear that many aspects of these
processes are controlled by various phytohormones. Additionally, different environmental
factors influence cellular processes by altering the regulation of growth hormones, which
in turn impinges on the regulation of the basic growth regulatory processes, cell division
and cell expansion. Taken together, the leaf is a vital plant organ and its development is
controlled by multiple endogenous and exogenous factors.
Mostly, understanding leaf biology has been restricted by the contracted focus of individual
studies. Regardless of its scientific importance, resultant conclusion is not enough to
elaborate the multifaceted issues regarding leaf biology. Therefore, interdisciplinary
General discussion and future perspectives
260
studies are essential to understand the complex system of leaf growth and development.
Hence, the goal of this thesis was to investigate leaf growth and development from a
systems perspective, and to understand how the environment affects leaf growth processes
through transcriptional networks and plant growth hormones.
Importance of Early Events in Leaf Development
Seed development is determined by the coordinated growth of the embryo, endosperm and
maternal tissues. Moreover, seed size is a crucial agronomic trait to improve crop yield and
large-seeded plants are also able to tolerate various stresses during seedling development
(Harper et al., 1970; Kaydan and Yagmur, 2008; Khurana and Singh, 2000). It has been
reported that the final leaf growth is influenced by the seed size (Howe and Richter, 1982;
Lima et al., 2005). Moreover, genes such as DA1 (Li et al., 2008) and FERONIA (FER) (Yu et
al., 2014) have also been found to control seed development therefore affecting organ size.
The role of the cell cycle inhibitor KRP1 has been reported in seed and leaf development
where overexpression of KRP1 reduced seed filling and leaf growth (Barroco et al., 2006).
In chapter 4 we clearly demonstrated that the inhibition of multiple KRPs enhances leaf
growth and induce cell proliferation, which was influenced by increased seed and embryo
size. A similar response was also observed in plants mildly overexpressing CDKB2;2
(Chapter 5). These results indicate that the cell cycle regulators, KRPs and CDKB influence
early stages of leaf development, which ultimately results in enhanced leaf growth.
Moreover, it can be predicted that the increase in cell proliferation in krp4/6/7 and
CDKB2;2 overexpression line is due to more cells in the leaf primordium at the time of
initiation (Chapter 4 and 5). However, further investigations are necessary to explore the
intrinsic signals generated by these cell cycle regulators to promote initial processes of leaf
development. Additionally, in chapter 2 we have explained that periclinal cell divisions that
determine leaf thickness in response to light intensity already occur prior to leaf
emergence. However, the molecular signals controlling these early stages of the leaf growth
process clearly need further investigation. To conclude, early developmental events have a
major impact on final leaf growth and should be explored in more details.
General discussion and future perspectives
261
Regulation of Leaf Development by Genetic Regulators and
Phytohormones
Leaf growth is a complex process where individual cells from a stem cell niche go through a
series of developmental events to reach their final destination as a part of a mature leaf
(Chapter 1). Out of these events cell division and expansion play an important role in
deciding the future of a cell (and its progeny), which ultimately reflect final shape and size
of the leaf. In chapter 2 we have demonstrated by 3D kinematic analysis that leaf growth is
an anisotropic process where cell division and expansion rates show large differences with
respect to directions and tissues, explaining plasticity in leaf shape and size.
The cell division cycle in plants is tightly regulated by the action of positive (e.g. CDKs and
CYCs) and negative regulators (e.g. KRPs, SIM and SMRs). In chapter 4 and 5 we have
explored the function of plant specific B type CDKs and KRPs. Our study demonstrates that
the inhibition of multiple members of the KRP family of negative regulators promotes cell
division, while it inhibits cell expansion, resulting in more, but smaller cells in the leaf. This
phenomenon of mutual adjustment, called compensation of cell number and size has been
observed in many mutants (Beemster et al., 2003; Horiguchi and Tsukaya, 2011; Tsukaya,
2002). On the other hand, mild overexpression of B2 type CDK also increases cell
proliferation but it does not affect mature cell size. Being cell cycle regulators it is obvious
that altering these genes will affect cell division, however their effects on cell expansion
raises new question whether these regulators also influence process of cell expansion.
These growth processes are also regulated by the complex network of phytohormones.
Auxin is a major growth regulator which is involved in various aspects of plant
development from seed development till senescence (Leyser, 2010; Sauer et al., 2013).
Auxin has been reported to promote cell proliferation by the induction of CDKA and
CYCD3;1, while it inhibits cell cycle inhibitors KRP (Cho et al., 2010; Perrot-Rechenmann,
2010). On the contrary, ARF2 (Auxin Response Factor 2) inhibits cell division by inhibiting
ANT and CYCD3;1 in Arabidopsis thaliana (Schruff et al., 2006). Additionally, auxin is also a
positive regulator of cell expansion, which lowers the extracellular pH, thereby enhancing
the activity of cell wall proteins, expansins (EXPs) and xyloglucanendotransglucosylase/
General discussion and future perspectives
262
hydrolases (XTHs) that stimulate cell wall loosening (Perrot-Rechenmann, 2010). In
Chapter 3 we have elucidated the dual role of auxin as it promotes and inhibits cell division
and expansion in a concentration dependent manner. Moreover, cytokinin is also involved
in different processes of plant development (Haberer and Kieber, 2002). It promotes cell
division by increasing the level of CYCD (Riou-Khamlichi et al., 1999). The loss of function
mutant of CYCD3;1 was found to reduce cell number as well as cytokinin response (Dewitte
et al., 2007). Consistently, we found that CDKB2;2 promotes cell division and cytokinin
response (Chapter 5). Therefore, the role of phytohormones in leaf growth and
development is crucial, and our study suggests that these hormones decide the fate of plant
cell processes in a dose dependent manner.
A specific variant of the plant cell cycle, endoreduplication where DNA replicates
constantly without subsequent completion of mitosis, is also under control of the KRPs. It
has been reported that KRPs regulate cell cycle and endocycle in dose dependent manner
where low amounts repress the mitotic cycle while high level arrest cell division and
endoreduplication (Verkest et al., 2005). To understand the role of KRPs in the regulation
of endocycle, we used loss of function mutants. We clearly demonstrated that multiple
inhibition of KRPs increases endoreduplication (Chapter 4). Moreover, we also confirmed
the role of KRPs in endoreduplication by mathematical modeling which shows that the
downregulation of KRPs enhances endoreplication by two-fold. Simultaneous increase in
cell proliferation and endoreplication suggest that the cell cycle and endocycle are
regulated in different time frame of leaf development (Chapter 4). However, detailed
analysis is required to decipher the role of KRPs in controlling the endocycle.
Influence of Environmental Factors on Leaf Growth
Different environmental factors affect cell division and expansion and thereby affect leaf
growth. Water deficit is one of the most common limitations affecting leaf growth causing
alterations in leaf size and shape. It has been reported that osmotic stress influences
dividing and mature tissues by diverse mechanisms (Skirycz and Inze, 2010). The growth
hormone ethylene and GAs were reported to regulate cell proliferation in the leaves
whereas ABA was more associated with the response in mature tissues (Achard et al.,
General discussion and future perspectives
263
2006; Claeys et al., 2012; Skirycz et al., 2011; Skirycz et al., 2010; Wilkinson and Davies,
2010).
In the present thesis, we uncovered the importance of the crosstalk between auxin
signaling and osmotic stress in proliferating leaves. We showed that altering auxin
homeostasis resulted in leaf growth reduction by inhibiting cell division and expansion
under osmotic stress (Chapter 3). Supra optimal levels of externally applied auxin enhance
the expression of KRPs, which inhibits CDK/CYC activity and therefore reduces cell
proliferation under stress (Chapter 4). Additionally, in our results upregulation of ethylene
metabolism under osmotic stress (Chapter 3, Figure 6) suggest that high auxin levels
promote ethylene biosynthesis (Hentrich et al., 2013; Swarup et al., 2007; Tsuchisaka and
Theologis, 2004; Zheng et al., 2013) that affects GA metabolism and stabilize the DELLA
proteins, which inhibit cell proliferation under osmotic stress (Achard et al., 2003; Dubois
et al., 2013). Therefore, it can be conceived that there is a crosstalk between auxin and
ethylene under osmotic stress to reduce leaf growth. However, targeted studies are
required to demonstrate their interaction in response to stress. Like cell division, cell
expansion was also reduced by osmotic stress (Chapter 3). The expression of expansion
related genes like EXPs and XTHs were affected in proliferating leaves under osmotic stress
in the presence and absence of exogenous auxin (Chapter 3). Furthermore, we also found
evidence for cell wall weakening through decreased expression of cellulose synthesis genes
under osmotic stress in combination with NAA, suggesting that a high auxin level is
inhibitory for cell expansion (Chapter 3). Taken together, it can be concluded that high
auxin concentration is inhibitory for leaf growth but the downstream mechanisms involved
needs to be further illustrated. Our transcriptome dataset provides a unique starting point
for such studies.
Light is another environmental factor that affects cellular processes during leaf
development (Chapter 2). Previous studies showed that under high light leaves are larger,
thicker and develop more palisade cells while under low light leaves are smaller, thinner
and have less developed palisades (Terashima et al., 2006). Our detailed three dimensional
analysis shows that these light dependent changes in leaf growth are regulated by specific
General discussion and future perspectives
264
effects on cell division and expansion (Chapter 2). Moreover, we found that low light
increases petiole elongation rates, which results in increased petiole length while reduced
expansion rate inhibits final leaf size (Chapter 2). This differential growth response under
low light has been shown to be under control of various phytohormones including auxin,
ethylene and brassinosteroids (Kozuka et al., 2010; Millenaar et al., 2009; Vandenbussche
et al., 2003). In addition, a recent study showed that the shade induced petiole elongation
was the result of changes in microtubule dynamics and increased auxin biosynthesis which,
stimulates the expression of XTHs (Sasidharan et al., 2014). Furthermore, it will also be
interesting to explore how cell cycle regulators control the ratio of leaf blade and petiole
under low light.
In conclusion, this work gives an overview of the complex network of growth regulators
and environmental stimuli in leaf growth and development. We demonstrated that leaf
growth is not only regulated by cellular and molecular processes occurring during actual
leaf growth, but also affected by events prior to leaf emergence such as embryonic
development. Moreover, hormones play a key roles in growth regulation in a concentration
dependent manner under optimal as well as in stress conditions. This work provides
fundamental knowledge on the interaction between various growth regulators and
environmental factors, which can be further used to resolve agronomic difficulties. Overall,
we showed that growth regulation is a multidirectional process and studying only one
parameter does not provide a complete picture of the underlying mechanisms. Therefore,
taking all the controlling factors together will deepen our knowledge and will provide
significant information, which could be used for mathematical modeling to obtain a
mechanistic view on the growth regulating processes.

General discussion and future perspectives
265
References
Achard P, Cheng H, De Grauwe L, Decat J, Schoutteten H, Moritz T, Van Der Straeten D,
Peng J, Harberd NP. 2006. Integration of plant responses to environmentally activated
phytohormonal signals. Science 311, 91-94.
Achard P, Vriezen WH, Van Der Straeten D, Harberd NP. 2003. Ethylene regulates
Arabidopsis development via the modulation of DELLA protein growth repressor function.
Plant Cell 15, 2816-2825.
Barroco RM, Peres A, Droual AM, De Veylder L, Nguyen le SL, De Wolf J, Mironov V,
Peerbolte R, Beemster GT, Inze D, Broekaert WF, Frankard V. 2006. The cyclin-
dependent kinase inhibitor Orysa;KRP1 plays an important role in seed development of
rice. Plant Physiol 142, 1053-1064.
Beemster GT, Fiorani F, Inze D. 2003. Cell cycle: the key to plant growth control? Trends
Plant Sci 8, 154-158.
Cho HJ, Kwon HK, Wang MH. 2010. Expression of Kip-related protein 4 gene (KRP4) in
response to auxin and cytokinin during growth of Arabidopsis thaliana. BMB Rep 43, 273-
278.
Claeys H, Skirycz A, Maleux K, Inze D. 2012. DELLA signaling mediates stress-induced cell
differentiation in Arabidopsis leaves through modulation of anaphase-promoting
complex/cyclosome activity. Plant Physiol 159, 739-747.
Dai A. 2010. Drought under global warming: a review. Wiley Interdisciplinary Reviews:
Climate Change 2, 45-65.
General discussion and future perspectives
266
Dewitte W, Scofield S, Alcasabas AA, Maughan SC, Menges M, Braun N, Collins C,
Nieuwland J, Prinsen E, Sundaresan V, Murray JA. 2007. Arabidopsis CYCD3 D-type
cyclins link cell proliferation and endocycles and are rate-limiting for cytokinin responses.
Proc Natl Acad Sci U S A 104, 14537-14542.
Ding Y, Hayes MJ, Widhalm M. 2011. Measuring economic impacts of drought: a review
and discussion. Disaster Prev Manage 20, 434 - 446.
Dubois M, Skirycz A, Claeys H, Maleux K, Dhondt S, De Bodt S, Bossche RV, De Milde L,
Yoshizumi T, Matsui M. 2013. ETHYLENE RESPONSE FACTOR6 acts as a central regulator
of leaf growth under water-limiting conditions in Arabidopsis. Plant Physiol 162, 319-332.
Godfray HCJ, Beddington JR, Crute IR, Haddad L, Lawrence D, Muir JF, Pretty J,
Robinson S, Thomas SM, Toulmin C. 2010. Food Security: The Challenge of Feeding 9
Billion People. Science 327, 812-818.
Haberer G, Kieber JJ. 2002. Cytokinins. New insights into a classic phytohormone. Plant
Physiol 128, 354-362.
Harper JL, Lovell P, Moore K. 1970. The shapes and sizes of seeds. Annu Rev Ecol Syst,
327-356.
Hawkins E, Fricker TE, Challinor AJ, Ferro CAT, Ho CK, Osborne TM. 2013. Increasing
influence of heat stress on French maize yields from the 1960s to the 2030s. Glob Change
Biol 19, 937–947.
Hentrich M, Sánchez-Parra B, Alonso M-MP, Loba VC, Carrillo L, Vicente-Carbajosa J,
Medina J, Pollmann S. 2013. YUCCA8 and YUCCA9 overexpression reveals a link between
auxin signaling and lignification through the induction of ethylene biosynthesis. Plant
Signal Behav 8, e26363.
General discussion and future perspectives
267
Horiguchi G, Tsukaya H. 2011. Organ size regulation in plants: insights from
compensation. Front Plant Sci 2, 24.
Howe HF, Richter WM. 1982. Effects of seed size on seedling size in Virola surinamensis; a
within and between tree analysis. Oecologia 53, 347-351.
Kaydan D, Yagmur M. 2008. Germination, seedling growth and relative water content of
shoot in different seed sizes of triticale under osmotic stress of water and NaCl. Afr J
Biotechnol 7, 2862-2868.
Khurana E, Singh J. 2000. Influence of seed size on seedling growth of Albizia procera
under different soil water levels. Ann Bot 86, 1185-1192.
Kozuka T, Kobayashi J, Horiguchi G, Demura T, Sakakibara H, Tsukaya H, Nagatani A.
2010. Involvement of auxin and brassinosteroid in the regulation of petiole elongation
under the shade. Plant Physiol 153, 1608-1618.
Leyser O. 2010. The power of auxin in plants. Plant Physiol 154, 501-505.
Li Y, Zheng L, Corke F, Smith C, Bevan MW. 2008. Control of final seed and organ size by
the DA1 gene family in Arabidopsis thaliana. Genes Dev 22, 1331-1336.
Lima ER, Santiago AS, Araújo AP, Teixeira MG. 2005. Effects of the size of sown seed on
growth and yield of common bean cultivars of different seed sizes. Braz J Plant Physiol 17,
273-281.
Millenaar FF, van Zanten M, Cox MC, Pierik R, Voesenek LA, Peeters AJ. 2009.
Differential petiole growth in Arabidopsis thaliana: photocontrol and hormonal regulation.
New Phytol 184, 141-152.
General discussion and future perspectives
268
Perrot-Rechenmann C. 2010. Cellular responses to auxin: division versus expansion. Cold
Spring Harb Perspect Biol 2, a001446.
Riou-Khamlichi C, Huntley R, Jacqmard A, Murray JAH. 1999. Cytokinin activation of
Arabidopsis cell division through a D-type cyclin. Science 283, 1541-1543.
Sasidharan R, Keuskamp DH, Kooke R, Voesenek LA, Pierik R. 2014. Interactions
between Auxin, Microtubules and XTHs mediate green shade-induced petiole elongation in
Arabidopsis. PLoS One 9, e90587.
Sauer M, Robert S, Kleine-Vehn J. 2013. Auxin: simply complicated. J Exp Bot 64, 2565-
2577.
Schruff MC, Spielman M, Tiwari S, Adams S, Fenby N, Scott RJ. 2006. The AUXIN
RESPONSE FACTOR 2 gene of Arabidopsis links auxin signalling, cell division, and the size of
seeds and other organs. Development 133, 251-261.
Skirycz A, Claeys H, De Bodt S, Oikawa A, Shinoda S, Andriankaja M, Maleux K, Eloy
NB, Coppens F, Yoo SD, Saito K, Inze D. 2011. Pause-and-stop: the effects of osmotic
stress on cell proliferation during early leaf development in Arabidopsis and a role for
ethylene signaling in cell cycle arrest. Plant Cell 23, 1876-1888.
Skirycz A, De Bodt S, Obata T, De Clercq I, Claeys H, De Rycke R, Andriankaja M, Van
Aken O, Van Breusegem F, Fernie AR, Inze D. 2010. Developmental stage specificity and
the role of mitochondrial metabolism in the response of Arabidopsis leaves to prolonged
mild osmotic stress. Plant Physiol 152, 226-244.
Skirycz A, Inze D. 2010. More from less: plant growth under limited water. Curr Opin
Biotechnol 21, 197-203.
General discussion and future perspectives
269
Swarup R, Perry P, Hagenbeek D, Van Der Straeten D, Beemster GT, Sandberg G,
Bhalerao R, Ljung K, Bennett MJ. 2007. Ethylene upregulates auxin biosynthesis in
Arabidopsis seedlings to enhance inhibition of root cell elongation. Plant Cell 19, 2186-
2196.
Tank JG, Thaker VS. 2011. Cyclin dependent kinases and their role in regulation of plant
cell cycle. Biol Plantarum 55, 201-212.
Terashima I, Hanba YT, Tazoe Y, Vyas P, Yano S. 2006. Irradiance and phenotype:
comparative eco-development of sun and shade leaves in relation to photosynthetic CO2
diffusion. J Exp Bot 57, 343-354.
Tester M, Langridge P. 2010. Breeding technologies to increase crop production in a
changing world. Science 327, 818-822.
Tilman D, Balzer C, Hill J, Befort BL. 2011. Global food demand and the sustainable
intensification of agriculture. Proc Natl Acad Sci U S A 108, 20260-20264.
Tsuchisaka A, Theologis A. 2004. Unique and overlapping expression patterns among the
Arabidopsis 1-amino-cyclopropane-1-carboxylate synthase gene family members. Plant
Physiol 136, 2982-3000.
Tsukaya H. 2002. Interpretation of mutants in leaf morphology: genetic evidence for a
compensatory system in leaf morphogenesis that provides a new link between cell and
organismal theories. Int Rev Cytol 217, 1-39.
Vandenbussche F, Vriezen WH, Smalle J, Laarhoven LJ, Harren FJ, Van Der Straeten D.
2003. Ethylene and auxin control the Arabidopsis response to decreased light intensity.
Plant Physiol 133, 517-527.
General discussion and future perspectives
270
Verkest A, Weinl C, Inze D, De Veylder L, Schnittger A. 2005. Switching the cell cycle.
Kip-related proteins in plant cell cycle control. Plant Physiol 139, 1099-1106.
Wilkinson S, Davies WJ. 2010. Drought, ozone, ABA and ethylene: new insights from cell
to plant to community. Plant Cell Environ 33, 510-525.
Yu F, Li J, Huang Y, Liu L, Li D, Chen L, Luan S. 2014. FERONIA receptor kinase controls
seed size in Arabidopsis thaliana. Mol Plant 7, 920-922.
Zheng Z, Guo Y, Novák O, Dai X, Zhao Y, Ljung K, Noel JP, Chory J. 2013. Coordination of
auxin and ethylene biosynthesis by the aminotransferase VAS1. Nat Chem Biol 9, 244-246.
271
CURRICULUM VITAE
Personal Name: Shweta Kalve
Current address: Platanenlaan 1, Wilrijk, Antwerp, Belgium-2610
Permanent address: J-101, Grevillea, Magarpatta City, Hadapsar
Pune, Maharashtra, India-411028
Email: [email protected]
Mobile: +32(0)489004133
Date of birth: September 11, 1983
Place of birth: Gwalior, India
Nationality: Indian
Marital status: married to Shrikrishna Kulkarni
Languages: English, Hindi, Marathi
Current Position Position: Pre-doctoral fellow
Research group: Laboratory for Molecular Plant Physiology and Biotechnology
Institute: University of Antwerp
Address: CGB building U 6th floor, 171 Groenenborgerlaan, B-2020 Antwerp, Belgium
Email: [email protected]
Tel: +32(0)32653826
Education 2010 - 2014: Ph.D. Student
Laboratory for Molecular Plant Physiology and Biotechnology, Department of Biology, University of Antwerp, Antwerp, Belgium under the supervision of Prof. dr. ir. Gerrit T.S. Beemster 2005 - 2007: Masters in Biotechnology
Obtained at the RTM Nagpur University, Nagpur, Maharashtra, India
272
Master dissertation
“Analysis of protein profiles of bamboo treated with different concentration of salt and protoplast isolation from leaf tissue” performed in the research group of Environmental Biotechnology Division under the supervision of Dr. Bijaya K. Sarangi at National Environmental Engineering Research Institute (NEERI), Nagpur, Maharashtra, India
2002-2005: Bachelors in Biotechnology
Obtained at the RDVV University, Jabalpur, Madhya Pradesh, India
Experience Nov 2010 - Oct 2014: PhD fellow in University of Antwerp
Jan 2010 - Oct 2010: Flemish Research Fellow
Laboratory for Molecular Plant Physiology and Biotechnology, Department of Biology, University of Antwerp, Antwerp, Belgium under the supervision of Prof. dr. ir. Gerrit T.S. Beemster on “Drought response in Arabidopsis thaliana leaves”
2007 - 2009: Project Fellow
Environmental Biotechnology Division, National Environmental Engineering Research Institute (NEERI) on “Molecular characterization of Pteris, Veteveria, Bamboo and Mimosa plant species for arsenic and chromium stress for Phytoremediation” 2012 – 2013: Supervising Mehtap Cakiroglu with her bachelor thesis entitled “Role of
SMR2 in leaf development, an inhibitor of cell cycle regulation”.
2012 – 2013: Supervising Joanna Stelmaszewska with her master thesis entitled “Role of Kip-related proteins in leaf development”.
2011 – 2012: Supervising Joanna Dabk with her master thesis entitled “Effect of light
on leaf development - researches in vitro”. 2010 - 2011: Assist master practical courses on Plant Physiology
Awarded Grants/Awards Belgium Government Research Fellowship
January 2010- October 2010: Laboratory for Molecular Plant Physiology and Biotechnology, Department of Biology, University of Antwerp, Antwerp, Belgium under the supervision of Prof. dr. ir. Gerrit T.S. Beemster on “Drought response in Arabidopsis thaliana leaves”
273
FWO Travel Grant
Travel grant to attend 23rd International Conference on Arabidopsis Research (ICAR) July 2012, Vienna, Austria
Irene Manton Poster Prize
Best poster award for the poster on “Three-dimensional analysis of cell division and expansion in leaves of Arabidopsis thaliana subjected to different light intensities”, Society of Experimental Biology (SEB), Valencia, Spain, July, 2013 219
Publications Shweta Kalve, Dirk De Vos, Gerrit T.S. Beemster, “Leaf development: a cellular
perspective”, Frontiers in Plant Science, 5(362), 2014.
Shweta Kalve, Joanna Fotschki, Tom Beeckman, Kris Vissenberg and Gerrit T.S. Beemster, “Three-Dimensional patterns of cell division and expansion throughout the development of Arabidopsis thaliana leaves”, Journal of Experimental Botany, 2014 (doi:10.1093/jxb/eru358).
Dirk De Vos*, Abdiravuf Dzhurakhalov*, Delphine Draelants*, Irissa Bogaerts*, Shweta Kalve*, Els Prinsen, Kris Vissenberg, Wim Vanroose, Jan Broeckhove and Gerrit T.S. Beemster, “Towards mechanistic models of plant organ growth”, Journal of Experimental Botany, 63(9), 3325–3337, 2012. (*: shared first author)
Shweta Kalve, Bijaya Ketan Sarangi, Ram Awatar Pandey and Tapan Chakrabarti, “Arsenic and chromium hyperaccumulation by an ecotype of Pteris vittata – prospective for phytoextraction from contaminated water and soil”, Current Science, 100(6), 2011.
Meetings Attended
Presenting speaker
Scientific meeting organized by the Belgian Plant Biotechnology Association (BPBA) on Plant Stress Biotechnology”, Leuven, Belgium on 3rd December 2010: Shweta Kalve, Els Prinsen, Kris Vissenberg, Gerrit T.S. Beemster, “Auxin plays a role in the response of leaf development to drought stress”.
Poster presentation Conference of Society of Experimental Biology (SEB), Valencia, Spain, 3rd-6th July, 2013:
Shweta Kalve, Joanna Dąbkowsk, Kris Vissenberg and Gerrit T.S. Beemster, “Three-
274
dimensional analysis of cell division and expansion in leaves of Arabidopsis thaliana subjected to different light intensities”.
23rd International Conference on Arabidopsis Research (ICAR), Vienna, Austria, 3rd-7th July 2012: Shweta Kalve, Els Prinsen, Kris Vissenberg and Gerrit T.S. Beemster, “Auxin plays a role in the growth response of Arabidopsis leaves to osmotic stress”.
International Conference on Toxic Exposure related Biomarker- Genomes and Health
related effects, Nagpur, India from 10-11th January 2008: Shweta Kalve, Bijaya K. Sarangi and Tapan Chakrabarti, “An assessment of plant biomarkers for strategic application in bioremediation of arsenic”.
International Congress on Bioprocesses in Food Industries (ICBF-2008) & 5th Convention of the Biotech Research Society of India (BRSI), Hyderabad, India from 6-8th December 2008: Shweta Kalve, Bijaya K. Sarangi, Ram A. Pandey, Asha A. Juwarkar and Tapan Chakrabarti, “Potentiality of Pteris vittata for Cr accumulation in plant biomass for phytoremediation of chromium”.

275
ACKNOWLEDGEMENTS
At the end of my thesis, it is a pleasant task to express my thanks to all those who
contributed in many ways to the success of this study and made it an unforgettable
experience for me. First and foremost, I thank my supervisor Prof. dr. ir. Gerrit T.S.
Beemster, whose expertise, understanding, motivation, enthusiasm, and positive attitude
added considerably to my graduate experience. You have been a steady influence
throughout my PhD career. Despite of your busy schedule, you have always been there at
all times of need. Your wide knowledge and logical way of thinking have been a great value
for me. You are always helpful in directing, correcting and giving positive criticism for the
experiments and the writing. I doubt that I will ever be able to convey my appreciation
fully, but I owe you my eternal gratitude.
I would like to specially thank the members of my committee Prof. dr. Els Prinsen and Prof.
dr. Kris Vissenberg for your valuable time, interest, constructive criticism and insightful
comments. I am immensely indebted to your timely feedback and for keeping a check on
my yearly progress. I wish to extend my thanks to Prof. dr. Yves Guisez and Prof. dr. Han
Asard for scientific discussions and support during these years. My warmest thanks goes to
Prof. dr. Arp Schnittger and Prof. dr. Lieven De Veylder for taking time out from your busy
schedule to serve as external readers of my thesis. I would again like to thank Prof. dr. Arp
Schnittger for providing me the cell cycle related mutants and overexpression line which
helped me in exploring the role of cell cycle regulators in detail. I am also grateful to Prof.
dr. Tom Beeckman and Prof. dr. Lieven De Veylder for allowing me to use the facility in
their labs.
I would like to thank Dr. Stijn Dhondt for designing software for cell analysis which made
my PhD work easy. I am indebted to Dr. Domagalska Malgorzata Anna, for sharing her
genius with me, and for teaching me all the molecular techniques. I was fortunate to have a
chance to work with Dr. Dirk De Vos, whose wisdom and keen scientific insight greatly
benefited my work. My sincere thanks goes to Dr. Marios Nektarios Markakis for your

276
important contribution in my research work. Your help in RNA sequencing is highly
appreciated.
Furthermore, I acknowledge my fellow lab-mates and friends, Hamada AbdElgawad and
Viktoriya Avramova, for the stimulating discussions, for the calm weekends when we were
working together, and for all the fun we had in the last five years. I also would like to thank
my other lab mates Dr. Abdiravuf Dzhurakhalov, Dr. Evelyn Farfan, Bulelani Sizani and
Katrien Sprangers for the fun and support. I am grateful to Irissa Bogaerts, for being the
best colleague and friend I could wish for.
The technical assistant of Annette Geldmeyer and Sevgi Oden is highly appreciated. Thank
you very much for your kind help. A special thanks to Danny Huybrecht, Suzanne Pooters
and Sophie Nys for the friendly atmosphere and for countless much-needed coffee breaks.
Master students Bernhardt Vankerckhoven, Joanna Dabk, Joanna Stelmaszewska and
Mehtap Cakiroglu deserve great thanks for helping me in my experiments. I also owe my
sincere gratitude to all the members of PGO (Plant Growth and Development) group for
social and scientific discussions.
I would like to extend my special thanks to Gaurav Zinta, Kumud Saini, Aziz Hasan and
Nitin Gedam; you have been unwavering support in all my endeavours. I thank you all for
your friendship, love, and unyielding support. My sincere acknowledgement goes to Dr.
Amit Sinha, Dr. Nissy Nevil, Tanmay Nath, Dr. Sandeep Singh, Dr. Khushbu Kushwaha, Dr.
Hemant Dixit, Dipti Kulkarni, Dr. Ravi Kishor, Sai Ratna Manjari, Ajay Kumar, Bala
Narsimha, Nitin Pipralia and Neelava Das for providing me a warm home away from
home during these years and supporting me like a family during tough times.
Last but not least, my sincere thanks to my granny, my stepmother, mother- and father-in-
law, brothers- and sisters-in-law, uncles, aunts and cousins for their continuous support.
My most heartfelt thanks to my brother and friend Sushant Kalway for his support, love
and care.

277
If I failed to include your name above, but you helped me in one way or another, my sincere
thanks goes out to you.
Shweta