Relationship Between Entrepreneurial Process and Success ...
Upload
khangminh22Category
view
2download
0
i
A STUDY ON THE ENTREPRENEURIAL TRAITS AND
ACHIEVEMENT MOTIVATION AMONG COLLEGE
STUDENTS IN THOOTHUKUDI DISTRICT
Thesis submitted to
Manonmaniam Sundaranar University
In partial fulfillment of the requirements
for the award of the Degree of
DOCTOR OF PHILOSOPHY IN COMMERCE
By
N.HARIPRAKASH
Reg. No. 5495
Under the supervision of
Dr. LOURDES POOBALA RAYEN M.Com., M.Phil., M.B.A., Ph.D.,
P.G AND RESEARCH DEPARTMENT OF COMMERCE
St. XAVIER’S COLLEGE (AUTONOMOUS)
MANONMANIAM SUNDARANAR UNIVERSITY
PALAYAMKOTTAI - 627 002
JULY 2014

ii
Dr. LOURDES POOBALA RAYEN, M.Com., M.Phil., M.B.A., Ph.D.,
Associate Professor in Commerce,
St.Xavier’s College (Autonomous),
Palayamkottai.
CERTIFICATE
This thesis entitled “A STUDY ON THE ENTREPRENEURIAL TRAITS
AND ACHIEVEMENT MOTIVATION AMONG COLLEGE STUDENTS IN
THOOTHUKUDI DISTRICT” submitted by N. HARIPRAKASH for the Degree of
Doctor of Philosophy in Commerce of Manonmaniam Sundaranar University is a
record of bonafide research work done by him and it has not been submitted for the
award of any degree, diploma, associateship, fellowship of any university or institution.
Place : Palayamkottai Signature of the Guide
Date :
(Dr. LOURDES POOBALA RAYEN)
iii
N. HARIPRAKASH,
Reg. No. 5495,
Research Scholar,
Department of Commerce,
St. Xavier’s College,
Palayamkottai.
DECLARATION
I N. HARIPRAKASH hereby declare that the thesis entitled “A STUDY ON
THE ENTREPRENEURIAL TRAITS AND ACHIEVEMENT MOTIVATION
AMONG COLLEGE STUDENTS IN THOOTHUKUDI DISTRICT” submitted by
me for the Degree of Doctor of Philosophy in Commerce is the result of my original
and independent research work carried out under the guidance of
Dr. LOURDES POOBALA RAYEN, Associate Professor in Commerce in St.
Xavier’s College (Autonomous), Palayamkottai and it has not been submitted for the
award of any degree, diploma, associateship, fellowship of any university or institution.
Place : Palayamkottai Signature of the Candidate
Date :
Counter signed by
Dr. LOURDES POOBALA RAYEN
Guide and Supervisor,

iv
ACKNOWLEDGEMENT
First and foremost I thank the Lord Almighty for giving me the opportunity to
do this research work successfully.
I extend my sincere thanks to Dr. Lourdes Poobala Rayen, Associate
Professor of Commerce, St. Xavier’s College (Autonomous) for his valuable guidance
from the selection of the topic till the completion of the research.
I am extremely grateful to Rev. Dr. V. Gilburt Camillus S.J, Principal,
St. Xavier’s College, Palayamkottai for having given me permission to do this research.
I express my sincere thanks to Rev. Fr. R. Jesu Michael Das S.J, Secretary,
St. Xavier’s College, Palayamkottai for the encouragement extended to me for doing
this research.
I extend my sincere thanks to Dr. E. John Jothi Prakash, Dr. K. Pazhani,
former principal, T.D.M.N.S College, T. Kallikulam for their encouragement extended
to me for doing this research.
I extend my sincere thanks to Dr. V. Gopalakrishnan, Principal & Head
Department of Commerce, Aditanar College of Arts and Science, Tirunchendur for his
encouragement extended to me for doing this research.
I am extremely grateful to Dr. R. Pon Murugan, Principal, T.D.M.N.S
College, T. Kallikulam, for his support and encouragement extended to me for doing
this research.

v
I express my sincere thanks to Dr. A. Soundrarajan, Dr. P. Jeyabaskaran,
Associate Professor of Commerce, Aditanar College of Arts and Science for his support
and encouragement extended to me for doing this research.
I extend my sincere thanks to Dr.A. Lawrence Mary, Dr. A. Ramachandran,
Dr. A. Pushparaj, Dr. J. Jeyson and Mr. S. Raja for their encouragement in carrying
out the research.
I am extremely grateful to my lovable friends for their help in the completion
of my research in a successful manner.
I would like to thank my family, especially my father, mother, uncle, aunty,
sisters and brothers for their support throughout the research.
N. HARIPRAKASH

vi
CONTENTS
Chapter
No. Title Page No.
ACKNOWLEDGEMENT iv
LIST OF TABLES vii
LIST OF FIGURES xii
LIST OF ABBREVIATIONS xiii
I INTRODUCTION AND DESIGN OF THE STUDY 1-15
II REVIEW OF LITERATURE 16-68
III PROFILE OF THE STUDY AREA 69-104
IV PROFILE OF THE RESPONDENTS AND THEIR
ENTREPRENEURIAL TRAITS
105-157
V ACHIEVEMENT MOTIVATION AND
ENTREPRENEURIAL TRAITS AMONG THE
COLLEGE STUDENTS
158-199
VI ENTREPRENEURIAL MOTIVATION AND ITS
DETERMINANTS
200-242
VII SUMMARY OF FINDINGS AND SUGGESTIONS 243-272
BIBLIOGRAPHY
APPENDIX-I
APPENDIX-II

vii
LIST OF TABLES
Table
No. Title
Page
No.
1.1 Place of college wise stratification 9
4.1 Distribution of the respondents according to the location of the
college
106
4.2 Gender of the respondents 107
4.3 Age of the students 108
4.4 Place of residence among the respondents 109
4.5 Branch of study among the students 110
4.6 Social group among the respondents 111
4.7 Religion among the respondents 113
4.8 Respondents family type 114
4.9 Size of family among the respondents 116
4.10 Monthly family income of the respondents 117
4.11 Father’s occupation among the respondents 119
4.12 Mother’s occupation among the respondents 120
4.13 Entrepreneurial traits (ET) among the respondents 121
4.14 Reliability and validity of variables in entrepreneurial traits 122
4.15 Score of entrepreneurial traits (SOET) among the respondents 123
4.16 Association between profile of the respondents and their score of
entrepreneurial traits
124
4.17 Factors leading to entrepreneurial traits among the respondents 126
4.18 Reliability and validity of variables relating to coordination 128
4.19 Reliability and validity of variables relating to innovativeness 129
4.20 Reliability and validity of variables relating to optimism 130
4.21 Reliability and validity of variables relating to informativeness 131
4.22 Reliability and validity of variables relating to decision making 133
4.23 Reliability and validity of variables relating to hard work 134
viii
Table
No. Title
Page
No.
4.24 Reliability and validity of variables relating to problem solving skills 135
4.25 Reliability and validity of variables relating to confidence 136
4.26 Reliability and validity of variables relating to enterprising 137
4.27 Reliability and validity of variables relating to punctuality 138
4.28 Reliability and validity of variables relating to sincerity 139
4.29 Reliability and validity of variables in foretelling ability 140
4.30 Respondents view about the factors leading to entrepreneurial traits 141
4.31 Association between profile of the respondents and their views
towards the factors leading to entrepreneurial traits
143
4.32 Discriminant factor leading to entrepreneurial traits among urban
and semi-urban college students
146
4.33 Relative contribution of discriminant factors in total discriminant
scores (TDS)
148
4.34 Discriminant factor leading to entrepreneurial traits among urban and
rural college students
149
4.35 Relative contribution of discriminant factors in total discriminant
scores (TDS)
151
4.36 Discriminant factor leading to entrepreneurial traits among semi-
urban and rural college students
152
4.37 Relative contribution of discriminant factors in total discriminant
sores (TDS)
153
4.38 Impact of factors leading to entrepreneurial traits on the level of
entrepreneurial traits among the college students
155
5.1 Respondents view about academic motivation 159
5.2 Reliability and validity of variables relating to academic motivation 160
5.3 Score on academic motivation (SOAM) among the college students 161
5.4 Students view about need for achievement (NFA) 162
5.5 Reliability and validity of variables relating to need for achievement 163
5.6 Score on need for achievement (SONFA) among the students 164
5.7 Students view about the academic challenge (AC) 165

ix
Table
No. Title
Page
No.
5.8 Reliability and validity variables in academic challenge 166
5.9 Score on academic challenge (SOAC) among the students 167
5.10 Students view about attitude towards education 169
5.11 Reliability and validity variables relating to attitude towards
education (ATE)
170
5.12 Score on attitude towards education (SOATE) among the students 171
5.13 Meaningfulness of task and work methods (MTWM) among the
students
172
5.14 Reliability and validity of variables relating to meaningfulness of task
and work methods (MTWM)
173
5.15 Score on mtwm (SOMTWM) among the students 174
5.16 Attitude towards teachers (ATT) among the students 175
5.17 Reliability and validity of variables relating to attitude towards
teachers (ATT)
176
5.18 Score on attitude towards teachers (SOATT) among the students 177
5.19 General interests and sports (GIS) among the students 178
5.20 Reliability and validity of variables relating to general interests and
sports
179
5.21 Score on general interests and sports (SOGIS) among the students 180
5.22 Importance of marks (IOM) among the students 181
5.23 Reliability and validity of variables relating to importance of marks 182
5.24 Score on importance given to marks (SOIOM) among the students 183
5.25 Students view about the achievement motivation 184
5.26 Level of achievement motivation and the profile of the students 186
5.27 Mean difference and discriminant power of components of
achievement motivation among urban and semi urban college
students
188
5.28 Relative contribution of discriminant CAM in total discriminant
score (TDS)
190
5.29 Mean difference and discrimmant power of CAM among urban and
rural students
191
x
Table
No. Title
Page
No.
5.30 Relative contribution of discriminant CAM in total discriminant
score (TDS)
192
5.31 Mean difference and discriminant power of achievement motivation
among semi-urban and rural students
194
5.32 Relative contribution of discriminant CAM in total discriminant
score (TDS)
195
5.33 Impact of achievement motivation on entrepreneurial traits 197
6.1 Important components of entrepreneurial motivation 201
6.2 Students view relating to confidence 203
6.3 Reliability and validity of variables included in confidence 204
6.4 Level of confidence among students 205
6.5 Problem solving ability among the students 206
6.6 Reliability and validity of variables in problem solving ability 207
6.7 Level of problem solving ability among the students 208
6.8 Variables in opportunity seeking among the students 209
6.9 Reliability and validity of variables relating to opportunity seeking 211
6.10 Level of opportunity seeking among the students 212
6.11 Students’ view about the variables in independency 213
6.12 Reliability and validity of variables in independency 214
6.13 Level of independency among the students 215
6.14 Variables in planning skills among the students 216
6.15 Reliability and validity of variables in planning skills 217
6.16 Level of planning skills among the students 218
6.17 Variables in managerial skills among the students 219
6.18 Reliability and validity of variables in managerial skills 220
6.19 Levels of managerial skills among students 221
6.20 Variables in social interaction among the students 222
6.21 Reliability and validity of variables in social interaction 223

xi
Table
No. Title
Page
No.
6.22 Level of social interaction among the students 224
6.23 Students level in entrepreneurial motivation (EM) 225
6.24 Association between profile of students and their level of
entrepreneurial motivation
227
6.25 Mean difference and discriminate power of entrepreneurial
motivation among urban and semi- urban students
229
6.26 Relative contribution of entrepreneurial motivation in total
discriminant score
230
6.27 Mean difference and discriminant power of entrepreneurial
motivation among urban and rural college students
232
6.28 Relative contribution of entrepreneurial motivation in total
discriminant score
233
6.29 Mean difference and discriminant power of entrepreneurial
motivation among semi-urban and rural college students
234
6.30 Relative contribution of entrepreneurial motivation in total
discriminant score
235
6.31 Impact of factors leading to entrepreneurial traits on entrepreneurial
motivation
238
6.32 Impact of achievement motivation on entrepreneurial motivation
among students
241

xii
LIST OF FIGURES
Figure
No. Title
Page
No.
3.1 District map 73
4.1 Distribution of the respondents according to the location of the
college
106
4.2 Gender of the respondents 107
4.3 Place of residence among the respondents 110
4.4 Social group among the respondents 112
4.5 Religion among the respondents 113
4.6 Respondents family type 115
4.7 Monthly family income of the respondents 118
5.1 Linkage between achievement motivation and entrepreneurial
traits
158
6.1 Linkage between entrepreneurial motivation and its determinants 200
xiii
LIST OF ABBREVIATIONS
AC - Academic Challenge
AD - Anno Domini
ADP - Agriculture Development Programme
ATE - Attitude Towards Education
ATT - Attitude Towards Teachers
CAM - Components of Achievement Motivation
CEI - Carl and Entrepreneurship Index
CFA - Confirmatory Factor Analysis
CIPET - Central Institute of Plastics Engineering and Technology
CITRA - Center for International Regulatory Assistance
CLRI - Central Leather Research Institute
CSIR - Council of Scientific and Industrial Research
DCMSME - Development Commissioner for Micro, Small and Medium Enterprises
DIC - District Industries Centers
EAC - Entrepreneurship Awareness Camp
EDP - Entrepreneurship Development Programmes
EEZ - Exclusive Economic Zone
EFA - Exploratory Factor Analysis
EPPS - Edwards Personal Preference Schedule
ESDP - Entrepreneurship cum Skill Development Programme
ET - Entrepreneurial Trait
FCRI - Fisheries College and Research Institute
FDP - Faculty Development Programme
GDP - Gross Domestic Product

xiv
GEM - Global Entrepreneurship Monitor
GIS - General Interests and Sports
HEI - Higher Education Institution
IIE - Indian Institute of Entrepreneurship
IOM - Importance of Marks
ITI - Industrial Training Institute
JPI - Jackson Personality Index
KMO - Kaiser-Mayer-Olkin
KVIC - Khadi and Village Industries Commission
MSME - Micro, Small and Medium Enterprise
MTWM - Meaningfulness of Task and Work Method
NFA - Need for Achievement
NIESBUD - National Institute for Entrepreneurship and Small Business Development
NI-MSME - National Institute for Micro, Small and Medium Enterprises
NISIET - National Institute for Small Industries Extension Training
NSDC - National Skill Development Corporation
OIS - Occupational Interest Survey
PRF-E - Personality Research Form-E
R&D - Research and Development
SESEY - Self-Employment Scheme for Educated Youth
SEZ - Special Economic Zones
SHG - Self Help Group
SIPCOT - State Industries Promotion Corporation of Tamilnadu
SIV - Survey of Interpersonal Values
SME - Small and Medium Enterprises

xv
SOAC - Score on Academic Challenge
SOAM - Score on Academic Motivation
SOATE - Score on Attitude Towards Education
SOATT - Score on Attitude Towards Teachers
SOET - Score of Entrepreneurial Trait
SOGIS - Score on General Interests and Sports
SOIOM - Score on Importance given to Marks
SOMTWM - Score on Meaningfulness of Task and Work Method
SONFA - Score on Need for Achievement
SSI - Small Scale Industries
TDS - Total Discriminant Score
TEDP - Technology Based Entrepreneurship Development Programme
WEDP - Women Entrepreneur Development Programme

Chapter - I
Introduction and design of the
study

CHAPTER - I
INTRODUCTION AND DESIGN OF THE STUDY
1.0 Introduction
1.1 Statement of the problem
1.2 Objectives of the study
1.3 Scope of the study
1.4 Operational definition of concepts
1.5 Study area
1.6 Period of study
1.7 Hypotheses
1.8 Methodology
1.9 Limitations of the present study
1.10 Scheme of report
1.11 Conclusion
1
CHAPTER - I
INTRODUCTION AND DESIGN OF THE STUDY
1.0 INTRODUCTION
Entrepreneurs are individuals who recognize opportunities where others see
chaos or confusion. They are the aggressive catalysts for change within the market
place. Entrepreneurship is more than the mere creation of business. The characteristics
of seeking opportunities, taking risks beyond security and having tenacity to push an
idea through reality combine into a special perspective that permeates entrepreneurs.
India is currently one of the leaders in economic growth. India‟s economic growth is
the result of the exploitation of opportunities by those individuals who have able to
think beyond the traditional concept of a job or profession. The economic development
largely depends on human resources. Again, human resources alone cannot produce
economic development. It requires an agent who is nothing but a dynamic entrepreneur.
Entrepreneurship plays a crucial role in the growth of any society particularly in
a fast developing country like India. The entrepreneur is an important agent in our
society, who can be a catalyst of social and economic changes.1 As a career, it can offer
unlimited scope for development and diversity of choices. It is the only profession
where there is absolutely no bar of any sort, be it age, sex, education or any other.2
The entrepreneur is one of the most important inputs in the economic
development of a country or of regions within the country. Entrepreneurial competence
makes all the difference in the rate of economic growth. Entrepreneurial talent exists in
1 Patel V.G., “Entrepreneurs are Made Not Born”, Economic Times, July 1990, p. 16.
2 Nalinaksha Mutsuddi, “You Too Can Become an Entrepreneur”, Wheeler Publishing, New Delhi,
1996, p.183.

2
all sections of the society. A high level of entrepreneurship is found in developed
economy. Once it was considered that entrepreneurs are born and not made.
Entrepreneurial talents can be developed by motivating people and making them
capable of perceiving and exploiting business opportunities. Hence the entrepreneurs
can be „Made‟ by proper motivation and training. Realising the importance of
entrepreneurship development the planners and policy makers have formulated
Entrepreneurship Development Programmes (EDP) for various target groups of
population in the country.
An entrepreneurial mindset can be developed in individuals. This mind set can
be exhibited inside or outside an organization, in profit or not for profit enterprises, and
in business or non business activities for the purpose of bringing forth creative ideas.
Thus entrepreneurship is an integrated concept that permeates an individual‟s business
in an innovative manner. It is this mindset that has revolutionized the way business is
conducted at every level and in every country. Imitative entrepreneur has a vital role to
play in developing countries. Innovative entrepreneurs are scarce in developing
countries. To add fuel to fire, there is also a problem of scarcity of capital and skilled
labour in the developing countries, which hinder innovative entrepreneurship. In this
context, the imitative entrepreneur fills up this gap very admirably by simply imitating
the technology, skill and techniques already developed by innovative entrepreneurs
from the developed countries.
The role of entrepreneurship in economic development caries from economy to
economy depending upon its material resources, industrial climate and the
responsiveness of the political system to the entrepreneurial function. The
entrepreneurs contribute more in favorable opportunity conditions than in the less

3
favorable opportunity conditions. Entrepreneurs are the prime movers of economy.
They perform overall co-ordinating function of bringing together the factors of
production, locating new ideas and putting them into effect. These casual people see
things as opportunities for creative goal setting and putting events into motion.
Institutions of higher learning play a vital role in developing entrepreneurship. An
equally challenging role is that of instilling the traits that successful future
entrepreneurs, intrapreneurs and mangers must possess, including that of transferring /
diffusing entrepreneurial knowledge and values to all of its constituents. A formal
education with special emphasis on entrepreneurship can help to prepare a person to
start a business. The entrepreneurial traits and values could be intensified through
education system.
Thoothukudi district have numerous educational institutions, Polytechnic
Colleges, Schools which provide quality education. There are eighteen arts and science
colleges which produces nearly six thousand graduates every year. They have lot of
opportunities in the district to become an entrepreneur but they are not focusing on this.
Most of the students are preferring job instead of becoming an entrepreneur. As the
entrepreneurship is playing a vital role in the economic development of a nation,
initiatives needs to be taken to infuse the need for entrepreneurship in the minds of the
students.
1.1 STATEMENT OF THE PROBLEM
Entrepreneurial development in a country accelerates industrial growth of a
nation. Development of entrepreneur in a country contributes industrial growth.
Industrial growth depends upon the growth of the young entrepreneurs in the country.
But the involvement of the youngsters in entrepreneurship activities is very low.

4
Majority of the youngster are showing interest to grasp a job after their graduation.
They are not ready to take risk to become entrepreneur. Today‟s youth are the
tomorrows pillar stone of a nation. So the educated youth need to be motivated to take
up this challenging task. Instead of searching for job the youth must become the job
provider.
In India the institutes of higher learning produce approximately 3.1 million
graduates every year. India currently has around 347 institutes of higher learning and
16,885 colleges with a total enrollment of over 9.9 million. These institutes produce
around 495,000 technical graduates, nearly 2.3 million other graduates and over
3,00,000 post-graduates every year. Among this a majority are from Arts and Science
Colleges. Out of that most of them are job seekers. In Tamil Nadu this case remains the
same. The same trend prevails in the Thoothukudi district where the aspiration of the
students is getting a good job and they are not ready to take risk to become a provider
of job. Though Thoothukudi district is having a major port, the industrial scenario has
not changed much. The District administration is also taking necessary steps to improve
the industrial development. So there is an urgent need to encourage the younger
generation to pursue entrepreneurship especially the college students.
Taking into account the need for industrial growth and the steps to be taken to
encourage the freshers from the college to opt for entrepreneurship as the career, the
researcher wish to study the entrepreneurial traits and achievement motivation of the
college students. This study will give an insight in to the entrepreneurial traits and
achievement motivation among the arts and science college students. The research
findings will help the planners and policy makers to do the necessary to promote
entrepreneurial acumen among the college students.

5
1.2 OBJECTIVES OF THE STUDY
The study has the following objectives.
1. To study the socio economic background of the final year college
students.
2. To ascertain the entrepreneurial traits among the final year college
students.
3. To analyses the factors leading to entrepreneurial traits.
4. To examine the achievement motivation of the final year college
students.
5. To assess the entrepreneurial motivation of the final year college
students.
6. To study the relationship between the profile variables and the
entrepreneurial traits of the college students.
7. To examine association between factors leading to entrepreneurial traits
and entrepreneurial motivation.
1.3 SCOPE OF THE STUDY
The main aim of the study is to assess the entrepreneurial traits and achievement
motivation of college students in Thoothukudi district. This study was conducted
among the outgoing under graduate arts and science college students of Thoothukudi
district. The study also examines the factors leading to entrepreneurial traits,
relationship between the profile variables and the entrepreneurial traits of the college
6
students. Moreover, the study also examines the association between factors leading to
entrepreneurial traits and entrepreneurial motivation.
1.4 OPERATIONAL DEFINITION OF CONCEPTS
Entrepreneurship
Entrepreneurship is the purposeful activity of an individual or a group of
associated individuals, undertaken to initiate, maintain or aggrandize profit by
production or distribution of goods and services.
Motivation
Motivation refers to the way in which urges, drives, desires, striving, aspirations
or needs direct, control or explain the behavior of human being.
Achievement Motivation
The need for achievement plays an important role in making an entrepreneur as
successful. It is an inner sprit that activates an entrepreneur to strive for success. The
need for achievement is the desire to do well.
Entrepreneurial Traits
The possession of certain knowledge, skill or personality profile is called
entrepreneurial competencies or traits. In other words the underlying characteristics
possessed by an entrepreneur which result in superior performance are called
entrepreneurial traits.

7
1.5 STUDY AREA
Thoothukudi district was purposively selected for this study for many reasons.
Thoothukudi being the port town more number of opportunities are available for the
business people to thrive and succeed. Moreover, industries are also concentrated in
Thoothukudi. This throws a lot of opportunities for the prospective entrepreneurs to
step in to the business. Considering entrepreneurial potentials of the district, the
researcher wish to study the entrepreneurial traits and achievement motivation among
college students.
1.6 PERIOD OF STUDY
The primary data relevant to the study was collected from June 2012 to April
2013 from the final year undergraduate students of arts and science colleges in
Thoothukudi district.
1.7 HYPOTHESES
The following hypotheses are framed by the researcher and it will be tested
using appropriate statistical tools to draw inferences.
There is no significant difference in factors leading to entrepreneurial
traits and profile variables.
There is no significant relationship between factors leading to
entrepreneurial traits and entrepreneurial traits.
There is no significant relationship between factors leading to
entrepreneurial traits and achievement motivation.
8
There is no association between profile of the students and their level of
achievement motivation.
There is no relationship between components of achievement motivation
and entrepreneurial traits.
There is no association between profiles of the students and their level
of entrepreneurial motivation.
There is no relationship between entrepreneurial traits and achievement
motivation.
There is no relationship between achievement motivation and
entrepreneurial motivation.
1.8 METHODOLOGY
The present study was based on both primary and secondary data. Interview
schedule was used to collect the primary data from the sample respondents. A well
structured interview schedule was prepared after consulting the experts in the field.
Before finalizing the interview schedule, a pilot study was made and with that response,
final interview schedule was prepared to collect the information required for the study.
The relevant secondary data were collected from the books, journals, magazines, and
published materials. The information available in the website was also collected for the
study.
1.8.1 Sampling
The study attempts to measure the entrepreneurial traits and achievement
motivation of college students in Thoothukudi district. Hence it is decided to select
sample respondents from final year undergraduate students of arts and science colleges

9
in Thoothukudi district. Stratified proportionate random sampling method was used to
select the sample respondents from the population. The arts and science colleges were
stratified in to three categories such as urban, semi-urban and rural on the basis of place
where the college is situated. From among the final year undergraduate arts and science
students ten per cent of the students were selected from each category at random as
detailed in Table 1.1.
Table 1.1
Place of College wise stratification
S.No Place of College Final year undergraduate Arts
and Science students
Sample
Respondents
1 Urban 1,484 148
2 Semi-urban 2,942 294
3 Rural 1,340 134
Total 5,766 576
1.8.2 Plan of Analysis
The collected data were classified and grouped according to the purpose for
which it was collected. Necessary tables were prepared and the tabulated data were
analysed with the help of appropriate following statistical tools exploratory factor
analysis, confirmatory factor analysis, analysis of variance, multiple regression and
discriminant analysis to interpret the data to arrive at relevant inferences.
Exploratory factor analysis
Factor analysis is a very useful method of reducing data complexity by reducing
the number of variables being studied. It is a good way of resolving the confusion and
identifying latent or underlying factors from an array of seemingly important variables.

10
Exploratory factor analysis is used to analyse the factors leading to
entrepreneurial traits among the college students. The validity of data for EFA have
been tested with the help of Kaiser - Meyer - Olkin measure of sampling adequacy and
Bartletts test of sphericity.
In order to narrate the important components of entrepreneurial motivation,
variables in entrepreneurial motivation have been included for Exploratory Factor
Analysis. The validity of data for EFA is tested with the help of KMO measure of
sampling adequately and Bartlett‟s test of sphericity.
Confirmatory factor analysis
The Confirmatory Factor Analysis is one of the multivariate statistical tools
which is applied to confirm the extracted variables in the factor which explains the
factor in a reliable manner or not. It explains the reliability and validity of variables in
each construct developed in the present study. The content validity, convergent validity
and discriminant validity have been tested through the Confirmatory Factor Analysis.
In the present study, the CFA has been administered to examine the reliability
and the validity of variables related to entrepreneurial traits, achievement motivation
and entrepreneurial motivation.
The score of variables in entrepreneurial traits have been included for
confirmatory factor analysis in order to examine the reliability and validity of variables
in entrepreneurial traits. The overall reliability of variable in entrepreneurial traits has
been estimated with the help of Cronbach alpha.

11
Analysis of Variance
The one way analysis of variance has been administrated to find the significant
differences existing among the three or more sample groups in relation to a variable.
The total variance in a set of data is divided into variation within groups and variation
between groups.
In this study analysis of variance has been administered to find out the
significant difference among urban, semi-urban and rural students regarding their
entrepreneurial traits, achievement motivation and entrepreneurial motivation.
The analysis of variance has also been used to find out the association between
the profile of the respondents and level of entrepreneurial traits, level of achievement
motivation and entrepreneurial motivation.
The association between the profile of the respondents and their level of
entrepreneurial traits has been estimated with the help of one way analysis of variance.
The achievement motivation has been measured with the help of variables under
eight dimensions. The one way analysis of variance has been executed to find out the
significant difference among the urban, semi-urban and rural college students towards
each dimension.
The one way analysis of variance has been executed to examine the significant
difference among the three groups of students regarding their views relating to
entrepreneurial motivation.

12
Multiple Regression analysis
Multiple regression analysis has been administrated to find out the impact of
factors leading to entrepreneurial traits on the level of entrepreneurial traits.
The fitted regression model is:
y = a + b1 X1 + b2 X2 + …………….+b12 X12 + e
Whereas y – score on entrepreneurial traits among the students
X1 - Score on coordination among the students
X2 - Score on innovativeness among the students
X3 - Score on optimism among the students
X4 - Score on informativeness among the students
X5 - Score on decision making among the students
X6 - Score on hard work among the students
X7 - Score on problem solving among the students
X8 - Score on confidence among the students
X9 - Score on enterprising among the students
X10 - Score on punctuality among the students
X11 - Score on sincerity among the students
X12 - Score on forecasting ability among the students
b1, b2, . . . , b12 - Regression coefficient of independent variables
a - intercept and
e - error term
Multiple regression analysis has also been administrated to find out the impact
of achievement motivation on the entrepreneurial traits, the impact of factors leading to

13
entrepreneurial traits on the entrepreneurial motivation and the impact of achievement
motivation on entrepreneurial motivation.
Discriminant analysis
The discriminant analysis has been applied to study the important discriminant
factors regarding entrepreneurial traits, achievement motivation and entrepreneurial
motivation among urban, semi-urban and rural college students.
The Discriminant factors leading to entrepreneurial traits, achievement
motivation and entrepreneurial motivation among the urban, semi-urban and rural
respondents has been examined with its statistical significance. The discriminant power
of factor has been estimated with the help of wilks lambda.
1.9 LIMITATIONS OF THE PRESENT STUDY
The present study is subjected with the following limitation.
1. The sample size of the study is arbitrarily assigned as ten per cent of the
total population.
2. The scope of the study is limited to Thoothukudi district only. Further
the scope is confined to undergraduate arts and science college students
only.
3. The present study on the entrepreneurial traits and achievement
motivation is based on the data collected from the sample respondents.

14
1.10 SCHEME OF REPORT
The present study on entrepreneurial traits and achievement motivation among
college students in Thoothukudi District is presented in seven chapters as detailed
below.
The first chapter deals with the design of the study. This chapter includes
statement of the problem, scope of the study, objectives of the study, hypotheses,
methodology, plan of analysis, limitations of the study and chapter scheme.
The second chapter presents the review of literature. Reviews of previous
studies organized according to topics of importance in the chronological order have
been presented in this chapter.
The third chapter gives the profile of the study area. The study area is
Thoothukudi district. This chapter gives information about the history of Thoothukudi
district and the entrepreneurial opportunities which are available in the district.
The fourth chapter deals with the socio economic background of the students
and their entrepreneurial traits. All the information relating to socio-economic
conditions of the undergraduate students of arts and science colleges were classified
and grouped on the basis of the location of the college like urban, semi-urban and rural.
The fifth chapter deals with the analysis of achievement motivation and
entrepreneurial traits among undergraduate students of arts and science colleges in
Thoothukudi district.
15
The sixth chapter deals with entrepreneurial motivation and its determinants
among urban, semi-urban and rural undergraduate students of arts and science colleges
in Thoothukudi district.
The seventh chapter highlights the summary of findings and suggestions based
on the analysis and interpretation of the study.
1.11 CONCLUSION
The design of the study helped the researcher to draw the detailed plan or
outline for the research work to be conducted. The objectives of the study shows the
action plan and the direction of the study. This chapter also gives information about the
tool to be used for the data collection, the sampling methods and the size of the sample,
the plan of analysis and the limitations of the study.

Chapter - II
Review of Literature
CHAPTER - II
REVIEW OF LITERATURE
2.0 Introduction
2.1 Entrepreneurial traits
2.2 Factors influencing entrepreneurship
2.3 Achievement motivation
2.4 Entrepreneurial motivation
2.5 Conclusion
16
CHAPTER - II
REVIEW OF LITERATURE
2.0 INTRODUCTION
Review of literature paves the way for a clear understanding of the areas of
research already undertaken and throws a light on the potential areas which are yet to
be covered. Keeping this fact in mind, an attempt has been made to make a brief survey
of the previous works undertaken in the related field of the present study.
For any research, the survey of related literature is of utmost importance
because it throws light on the issues relating to the study. It helps the researcher for a
well conceived and planned approach in conducting the study. A review of literature
relevant to study has been presented in this chapter and it covers earlier research studies
relating to entrepreneurial traits and other related aspects of the entrepreneurial
development.
2.1 ENTREPRENEURIAL TRAITS
Dunhof1 (1949) found that at the initial stage of economic development,
entrepreneurship had less initiative and drive but as economic development preceded it
became more innovative and enthusiastic.
Hazlehurst L.W2 (1966) compared two native trading castes (Agarwal Banias
and Suds) with two refugee castes from Pakistan (Khatris and Aroras). He found that
1 Donh of Clarence, Observations on Entrepreneurship in Agriculture, In Arthur Cole (Ed.) Change and
the Entrepreneur, Harvard University Press, 1949, pp.22-24. 2 Hazlehurst L.W, Entrepreneurship and the Merchant Castes in Punjab City, Monograph and
Occasional Paper Series, no.1, Duke University Press, Durham, 1966.

17
the caste traders achieved more than the refugees, since they had both willingness and
ability to adjust to changing conditions.
Hornaday J.A. and Bunker C.S3 (1970) conducted a study to identify and
measure the personal traits of a successful entrepreneur. To develop an instrument for
the study, twenty entrepreneurs were interviewed individually. Background information
of these entrepreneurs was obtained through these interviews. To determine what traits
these entrepreneurs believed were essential for the successful start-up of a business, a
self-rating scale of twenty one personality traits and a series of questions were used.
This information was formulated into an interview guide sheet. In addition, three
objective tests also were utilized to determine personality and motivational traits of
entrepreneurs: Occupational Interest Survey (OIS), Edwards Personal Preference
Schedule (EPPS), and Survey of Interpersonal Values (SIV). They administered the
five-point Likert scale survey of traits to entrepreneurs. The traits the entrepreneurs
rated were risk-taking, leadership effectiveness, ability to relate effectively to others,
physical health, desire for money, innovation, and accuracy in perceiving reality.
Das T.K and Bing Sheng Teng4 (1977) stated that risk and risk behavior form
an important segment of the entrepreneurship literature. Entrepreneurial risk behaviour
has been studied with both trait and cognitive approaches, but the findings do not
adequately explain either how entrepreneurs differ from non-entrepreneurs, or how
different types of entrepreneurs can be specified in terms of their risk behavior. This
paper is an attempt to address these issues by introducing two temporal attributes that
we consider significant for understanding risk behaviour, given that risk is inherently
3 Hornaday J.A and Bunker C.S, “The Nature of the Entrepreneur”, Personnel Psychology, 23, 1970,
pp. 47-54. 4 Das T.K and Bing-Sheng Teng, “Time and Entrepreneurial Risk Behavior”, Winter, 1042- 2587, 1977,
pp. 69-88.
18
embedded in time. First, we suggest the notion of risk horizon, differentiating
short-range risk from long-range risk. Second, we examine the risk behavior of
entrepreneurs in terms of their individual future orientation, in tandem with their risk
propensity. We propose a temporal frame work that seeks to explain, at once, the
different types of risk behavior among entrepreneurs as well as the distinction between
entrepreneurs and non-entrepreneurs. The framework is also applied to networking and
alliancing activities of entrepreneurs. Finally, a number of propositions are developed
to facilitate empirical testing of the insights implicit in the temporal framework of
entrepreneurial risk behavior.
Brockhaus R.H5 (1980) concluded that the risk taking propensities of
entrepreneurs were not significantly distinguishable from managers or the population in
general. Risk-taking propensity cannot easily be measured as it has several dimensions.
Although much of the risk-taking propensity one has is predisposed, there are
environmental factors that can alter one‟s perception of a risk situation. For example,
the amount of uncertainty one perceives in a decision-making environment affects the
degree of risk the decision maker will take.
Brockhaus R.A6 (1982) determined that risk-taking in varying degrees was
indicative of entrepreneurs. He indicated that when there is greatest uncertainty of the
outcome of a situation, performance level should be the greatest. He studied the risk-
taking propensity of entrepreneurs and managers. He found no significant difference in
risk-taking between the two groups. He concluded that both entrepreneurs and
managers were moderate risk-takers. However, Brockhaus concluded that both
5 Brockhaus R.H, “Risk-taking Propensity of Entrepreneurs”, Academy of Management Journal, 3,
September 1980, pp.509-520. 6 Brockhaus R.A, “The Psychology of Entrepreneurs” in C.A. Kent, D.L. Sexton and K.H. Vesper
(Eds). Encyclopedia of Entrepreneurship, New Jersey: Prentice Hall Inc., 1982, pp.39-57.

19
compared the entire range of scores he obtained with the scores from Kogan and
Wallach‟s study of the risk-taking propensity of the general population. The study
found no distinguishable difference in risk-taking scores among the three groups.
Therefore, Brockhaus concluded that there was no risk-taking difference in
entrepreneurs, managers, and the general population.
Thangamuthu and Iyyam Pillai7 (1983) stated that the new generation of
entrepreneurship had gained very little from their own family background. Particularly
education and occupational attainments of their parents had not contributed much to
their entrepreneurial achievements. The extended family relations and caste
connections had however facilitated the emergence of entrepreneurs and concentration
of entrepreneurship within certain caste groups.
Donald L. Sexton and Nancy B. Bowman8 (1983) administered the Jackson
Personality Inventory, personality research Form-E, Kogan and Wallach choice
Dilemmas questionnaire, and the Williams work values inventory to 401 students
majoring in entrepreneurship and other areas to identify psychological characteristics,
risk-taking propensity and work values. A comparative analysis of the data indicated
that the characteristics normally associated with entrepreneurs were significantly
different between entrepreneurship major (Budding entrepreneurs) and other students
on eleven of the 35 personality scales and on three work values. Significant differences
were found in the risk-taking personality scale of the Jackson personality inventory but
7 Thangamuthu C and Iyyampillai, “A Social Profile Entrepreneurship”, The Indian Economic Journal,
October, Vol.31, No.3, December 1983, p.107. 8 Donald L. Sexton and Nancy B. Bowman, “Comparative Entrepreneurship Characteristics of
Students: Preliminary Results”, Frontiers of Entrepreneurship Research, Proceedings of the Babson
College Conference on Entrepreneurship, Babson College, Wellesley, Massachusetts, 1983,
pp.213-225.

20
not on risk taking propensity as measured by the choice dilemmas questionnaire.
Achievement was not found to be a statistically significant value.
Bhattacharya S.N9 (1983) studied the industrial and agricultural entrepreneurs
of South East Asian countries, namely Brunei, Combodia, Indonesia, India, Laos,
Malaysia, North Vietnam, Singapore, South Vietnam, Philliphines and Thailand. He
developed a model of entrepreneurial development for these countries. However he
opined that the model itself would not work miracles unless followed by a sustained
herculean effort to solve the numerous gigantic and deep-rooted problems.
Donald L. Sexton and Nancy B. Bowman10
(1984) presented results of a
validation study of modified Jackson personality index (JPI) and personality research
form-E (PRF-E) tests designed to measure nine psychological characteristics which
previous research has found to discriminate students majoring in entrepreneurship from
other students majoring in the more functional business areas and from students
majoring in non-business areas. The modified test was administered to 43
entrepreneurship majors, 41 business majors in areas other than entrepreneurship and to
51 non-business majors. Statistical techniques consisting of a multivariate analysis of
differences between group means and two multiple comparison tests; Scheffe‟s
multiple comparison procedure and Bonferroni‟s t-test of differences at a alpha level of
0.05, showed significant differences occurred in the means of the nine variables
measured. It was demonstrated that the reliability and validity of the modified JPI/PRF-
9 Bhattacharya S.N, Entrepreneurship Development in India and South East Asian Countries,
Metropolitan Book Co. (P) Ltd., New Delhi, 1983, p.113. 10
Donald L. Sexton and Nancy B. Bowman, “Personality Inventory for Potential Entrepreneurs:
Evaluation of a modified UPI/PRE-E test instrument”, Frontiers of Entrepreneurship Research,
Proceedings of the Babson College Conference on Entrepreneurship, Entrepreneurial Studies, Babson
College, Wellesley, Massachusetts, 1984, pp.513-528.

21
E tests were not adversely affected by reducing the variables measured and combining
the tests.
Subhi Reddi and Shoba Reddi11
(1985) stated that the reasons for their high
success were having attained the age of 50 years, moving technical education from the
agricultural background, holding investment more than 10 lakhs with previous
experience in service and adopting a limited company type of ownership.
Rao12
(1986) stated that most of the entrepreneurs started their enterprises on
their own initiative and were motivated by their familiarity with the industry, and
expectation of high profits which guided them in choosing their particular line of
manufacture.
McClelland13
(1986) enlisted the assistance of McBer and Company to develop
an instrument which would measure an individual‟s need for achievement. After
refining the instrument, it was administered to many individuals, particularly in
countries economically deprived. McClelland found that individuals could be trained to
develop a high need for achievement. If such courses included an experimental
component, McClelland found that performance of these small businesses also
improved significantly. These findings led McClelland to seek the answer to if, or
what, traits are common to successful entrepreneurs. Once again, he worked with
McBer to develop an Instrument which would determine if successful entrepreneurs
possessed more key traits for success than average entrepreneurs. The research revealed
that successful entrepreneurs were more proactive, achievement oriented, and
11
Subbi Reddi and Shoba Reddi, “Sucessful Entrepreneurship”, A Study of Productivity, 1985,
Vol.XXVI, No.1. 12
Rao, Entrepreneurship: Reflections and Investigations, Chug Publications, Allahabad, 1986, p.16. 13
McClelland, “Characteristics of Successful Entrepreneurs”, The Journal of the Creative Behavior,
Vol.21, No.3, 1986. pp.219-233.

22
committed to others than average entrepreneurs. In addition, both sets of entrepreneurs
were found to posses the following traits at the same level: self-confidence, persistence,
and persuasion, use of influence strategies, expertise, and information seeking. The
study did have its limitations. One limitation, which is pertinent to this study, was that
no non-entrepreneur was studied. Therefore, it could be possible that all of the
competencies were more characteristic of entrepreneurs that non-entrepreneurs. In
addition, the instruments developed by McClelland and McBer needed to be
administered, interpreted, and evaluated by psychologists because the results were
difficult for a layman to interpret.
John D. Van Slooten et.al,14
(1986) surveyed the collegiate entrepreneurs
regarding their characteristics and the characteristics of their ventures. The student
characteristics studied were individual demographic data, personality measures,
responses prior business and entrepreneurial experience, effect on school work, and
future plans. The venture characteristics studied were reasons for starting, source of
ideas, objectives and goals, type of venture, strategies and overall performance.
Medha Dubhasi Vinze15
(1987) stated that women in general faced many
difficulties, whenever and wherever they attempted to compete with one another. New
ground they were ridiculed and discouraged. As they moved into the modern economic
sector women encountered barriers of tradition and prejudice, which too often
diminished the productive impact, they should have on national development. In most
third world countries women were still struggling against many obstacles in-built in
their social status. They had shown a great deal of initiative, persistence and tenacity,
14
John D. Van Slooten, Robert Layne Hild and H. Keith Hunt, “Frontiers of Entrepreneurship
Research”, Proceedings of the Babson College Conference on Entrepreneurship, Entrepreneurial
Studies, Babson College, Wellesley, Massachusetts, 1986, pp.52-63. 15
Medha Dubhasi Vinze, “Women Entrepreneurs in India”, Mittal Publications, New Delhi, 1987.
23
which were essential qualities of entrepreneurs. Women‟s education should be
promoted and only then one could think of a variety of opportunities of employment
welfare of the family.
Robert F. Scherer et.al,16
(1991) assessed on relationships between personality
variables and entrepreneurial career preference variables. Promoter and entrepreneurial
career preference were complementary for individuals with a wand perceived to be a
high performer. An inverse relationship between personality and entrepreneurial career
preference was observed for both individuals with a parent entrepreneur around to be a
low performer and those without a parent entrepreneur.
Sharma D.D et.al,17
(1994) has made an attempt to identify a list of
entrepreneurial traits which are desirable in the potential entrepreneurs amongst
polytechnic students. A relationship has been established between socio-economic
background and presence of entrepreneurial traits in polytechnic students of different
background. It has been found that degree of potential for entrepreneurial career vary
from one given demographic profile to another. Thus, the study leads to conclude that a
specific target group of potential entrepreneurs exists in the polytechnics and needs
special training in entrepreneurship and management. An entrepreneurial culture in
polytechnic system of education can be inculcated in social-economic background of
the students vis-à-vis entrepreneurial traits are systematically analysed.
16
Robert F. Scherer, James D. Brodzinski and Frank A. Wiebe, “Examining the Relationship Between
Personality Entrepreneurial Career Preference”, Entrepreneurship and Regional Development, 3,
1991, pp.195-206. 17
Sharma D.D, Singla S.K and Prof. Saini J.S, “Application of Demographic Profile and
Entrepreneurial Traits in identification of Potential Entrepreneurs” paper presented in National
Seminar on Current Research in Indian Entrepreneurship, Entrepreneurship Development Institute of
India, Ahmedabad, 1994, pp. 1-13.

24
Aurora C. Barcelona and Abelardo C. Valida18
attempted to establish the
profile and entrepreneurial potentials of eight hundred randomly selected, senior
students of the UUM, who were enrolled during the school year 1991-1992 and
attempted to analyse the inter-relationships among them. It was hypothesized that there
were no significant relationships between the student‟s personal variables and their
mean entrepreneurial character traits ratings. A set of Questionnaire made up to two
parts, namely: Respondents Profile and Character Traits of Potential Entrepreneurs, was
used. The latter part of the instrument has been employed in at least four other prior
research studies. The findings show that the subjects exhibited “medium”
entrepreneurial character trait ratings, except for knowledge ability which was reported
to be “low”. A good number of significant linear relationships or associations were
found between the personal variables and the character trait ratings. The significant
relationships identified can help educational strategy and services at the UUM. The
study is anchored upon a firm belief that entrepreneurial development, a major
challenge facing Institutions of Higher Learning, especially among developing
countries, will ultimately be the major means towards achieving quality and
productivity by effectively minimizing the problem of social economic inequality.
Pillai. J19
(1995) pointed out that empowerment is not something which could
be bought, sold or given away. According to her it is women who must empower
themselves if they are to attain rural development. The total development includes
development in political, economic, social, cultural and other dimensions of human life
as also the physical, moral, intellectual and cultural growth of the human person.
18
http:/mgu.mim.epu.my.com 19
Pillai J, “Women Empowerment”, Gyan Publishing House, New Delhi, 1995, pp.3-6.
25
Hian Chye Koh20
(1996) analysed the hypothesis of entrepreneurial
characteristics. In particular, the study investigates if entrepreneurial inclination is
significantly associated with the psychological characteristics of need for achievement,
locus of control, propensity to take risk, tolerance of ambiguity self-confidence and
innovativeness. T-test results and logit analysis at a 0.05 level of significance indicate
that those who are with entrepreneurial inclination have greater innovativeness, more
tolerance of ambiguity and higher propensity to take risk, as compared to those who are
not entrepreneurially inclined. The logit model has an overall holdout accuracy rate of
87.04 per cent.
Nalinaksha Mutsuddi21
(1996) stated that by nature, women were endowed
with certain qualities found favourable for the growth of entrepreneurship. They
possessed the inherent gift to motivate others by raising their self worth and self-
esteem, making them feels important. This affability and helpful nature brought out the
best in others without hurting their age or creating any tension or conflict. By
encouraging active participation and sharing power and information, women could
contribute better performance and higher productivity. Women skillfully integrated
professional life with family life.
Hyrsky et.al,22
(1999) in his study centers on innovativeness and risk- taking.
These two personality traits are among the most distinctive entrepreneurial
characteristics. They provide a good starting point for a comparison of entrepreneurial
behavior between the Finnish and the U.S entrepreneurs and small business owners.
20
Hian Chye Koh, “Testing hypothesis of entrepreneurial characteristics a study of Hong Kong MBA
students”, Journal of Managerial Psychology, Vol. 10, No.3, 1996, pp.12-25. 21
Nalinaksha Mutsuddi, “You too Can Become an Entrepreneur”, Wheeler Publishing, New Delhi,
1996. 22
Hyrsky, Kimmo and Tuunanen, Mika, “Innovativeness and Risk-Taking Propensity: A Cross-
Cultural Study of Finnish and the U.S. Entrepreneurs and Small Business Owners”,
Leiketaloudelliness Aikkauskirja, 48(3), 1999, pp.238-56.
26
The Carl and Entrepreneurship Index (CEI) was employed to measure the varying
degrees of innovativeness and risk-taking displayed by the Finnish and the U.S
entrepreneurs and small business owners. The Americans (N=456) had greater
risk-taking propensity than the Finns (N=434) who tended to be more conservative and
the risk-averse. Americans also exhibited slightly higher levels of innovation.
Regarding gender, in the combined Finnish and U.S sample, the females had higher
levels of innovation preference than the males. Meanwhile, the male respondents
scored significantly higher on risk-taking. In both countries respondents with detailed
business plans had much higher risk-taking propensity and preference for innovation
than those with no detailed plans. Finally, profit and growth oriented informants in both
countries scored higher on both scales compared to those oriented to earning family
income.
Hannu Littunen23
(2000) examined the characteristics of the entrepreneurial
personality and the effects of changes in the entrepreneur‟s personal relationships.
According to the empirical findings, becoming an entrepreneur and acting as an
entrepreneur are both aspects of the entrepreneur‟s learning process, which in turn has
an effect on the personality characteristic of the entrepreneur. The entrepreneur‟s drive
to solve problems (equal to mastery) had increased, and control by powerful others
decreased since the start-up phase. Change in the entrepreneur‟s relations with others is
also observed to have an effect on the entrepreneur‟s personality characteristics. The
empirical findings also show that as the number of co-operative partners decreased,
control by powerful others also decreased, and that, since the start-up phase,
entrepreneurs whose personal relations had increased also showed a clear increase in
mastery.
23
Hannu Littunen, “Entrepreneurship and the Characteristics of the Entrepreneurial Personality”,
International Journal of Entrepreneurial Behaviour and Research, Vol.6, No.6, 2000, pp.295-309.

27
Hein Erasmus and Pieter S. Nel24
(2001) stated that most of the individuals
were born with some degree of entrepreneurial ability but without the necessary
confidence, they would not pursue careers as entrepreneurs. The findings of the
research further affirmed that individuals needed to learn practical skills that would
give them the confidence to pursue entrepreneurial careers.
Nirmala Mary25
(2001) considered ten entrepreneurial traits for her analysis
namely innovation, perseverance and hardwork, leadership and motivation ability, need
for achievement, risk-taking ability, decision-making, planning, foresight and problem
solving, information seeking and receiving feedback, inter-personal skills and positive
self-concept. She analysed these traits framing ten variables under each trait. She found
that the branches of study influenced the level of entrepreneurial traits like Risk-taking
ability and decision-making. Irrespective of the branch of study the major numbers of
respondents were associated with a medium level of entrepreneurial traits, showing that
they needed motivation to become successful entrepreneurs. She also found that there
was no significant relationship between both parental occupation and the level of
entrepreneurial traits. She also stated that the various branches of study offered by
colleges had failed to provide entrepreneurial skills to students who wanted to become
entrepreneurs.
Shelley Van Eeden26
(2003) formulated the aim of the research as to learn
more about the entrepreneurial traits of undergraduate Commerce students at selected
tertiary institutions in each of the following countries, namely South Africa, the United
States of America and the Netherlands. The objective of this research are to report on
24
www.usfca.edu/sobam/nvc/conf/proceedings.html 25
Nirmala Mary, “Assessment of Entrepreneurial Skills among Women College Students in Madurai
City”, Unpublished PhD Thesis submitted to Madurai Kamaraj University, Madurai, 2001 26
www.upe.ac.za.

28
the levels of students entrepreneurial traits in the different countries and to establish
whether significant differences exist between the countries with regard to the level of
entrepreneurial traits of students. Inferential statistical analysis (ANOVA) was
conducted to establish whether significant differences existed between the countries
with regard to the level of entrepreneurial traits of students. It appears that
undergraduate students from the United States score higher on most of the
entrepreneurial traits investigated than the students from the other two countries. The
Dutch students, on the other hand, scored the lowest on most of the traits investigated.
Significant differences were found between countries with regard to all the
entrepreneurial traits investigated. These findings provide important of a trait in one
country could provide the answer as to how to develop them in another.
Sergio Postigo et.al,27
(2003), found that there is a growing consensus that in
the „information society‟ education is one of the key factors for the emergence of new
firms and their development prospects. In this context, new ventures set up by
graduates to play a critical role especially for the emergence of knowledge and
technology-based firms. The main aim of the paper is to analyze the influence of
different contexts- developed and developing countries- on: a) the image that students
have about entrepreneurs; b) the influence of social background on the motivation to
become an entrepreneur; c) the perception about what positive or negative factors affect
the creation of new ventures. The countries analyzed are Argentina (San Andres
University) and Italy (Universitia Politecnica della Marche). Overall there are more
similarities than differences between Argentinian and Italian students in their
perception of entrepreneurship and in their attitude to setting up their own firms.
27
Sergio Postigo, Donato Lacobucci and Maria Fernanda Tamborini, “Undergraduate Students as a
Source of Potential Entrepreneurs: A Comparative Study between Italy and Argentina”, paper
presented at the 13th
Global Inter- Internationalizing Conference, Grenoble, France, September 8-10,
2003.

29
However, the social background of the students plays a major role. Although this can
be considered a preliminary study, it offers interesting indications for the design of
entrepreneurship programme for university students.
David F. Llewellyn and Kerry M. Wilson28
(2003) stated that the usefulness
of personality traits in the explanation and prediction of entrepreneurship is critically
evaluated, and both contemporary theory and existing empirical findings are reviewed,
emphasizing the need for conceptual clarity and methodological reform. Detailed
recommendations for future research are outlined, and this critique is complemented by
a detailed case study of a practical research design drawn from an ongoing project.
Taken together, these provide a powerful illustration of how abstract principles can be
used to inform research practices and the underlying message emanating from this
evolving body of knowledge can be used enrich teaching materials and educational
activities.
Louw. L et.al,29
(2003) stated that developments in the global and national
economies as well as the labor market have made it necessary that more attention be
paid to entrepreneurship and the updating of curricula presented by tertiary institutions.
For this purpose reliable and valid information is required. The primary objectives of
this article are to report on the levels of student‟s entrepreneurial traits, to establish
whether these traits are interrelated, and to determine the extent of the impact that
demographic variables have on these entrepreneurial traits. A convenience sampling
method (n= 1,215) was used. The best developed entrepreneurial traits observed
included: “Competing against self-imposed standards”, “Self-confidence” and “Dealing
28
David F. Llewellyn and Kerry M. Wilson, “The Controversial Role of Personality Traits in
Entrepreneurial Psychology”, Emerald, Vol.45, No.6, 2003, pp.241-345. 29
Louw L, Van Eden S.M and Bosch J.K, “Entrepreneurial Traits of Undergraduate Students at Selected
South African Tertiary Institutions” International Journal of Entrepreneurial Behaviour and
Research, Vol.9, No.1, 2003, pp.5-26.
30
with Failure”. Statistically significant relationships were also identified between the
entrepreneurial traits of students and the tertiary institution attended, and student
gender, race and age.
Stephen L. Muller30
(2004) measured the differences between men and women
with respect to traits associated with the potential for undertaking entrepreneurial
activities to determine whether gender “gaps” in these traits vary across countries and
cultures. In this seventeen-country study, the male-female gap in internal locus of
control orientation was found to be negatively correlated with Hofstede‟s masculinity
dimension of culture. The gender gap in risk-taking propensity was positively
correlated with the individualism dimension of culture and negatively correlated with
the uncertainty avoidance dimension of culture. Gender gaps in entrepreneurial traits
were greatest among advanced economies and least among the less developed
economies.
Robert Baum J. and Edwin A. Locke31
(2004) found that previous research
on entrepreneurship as well as goal, social-cognitive, and leadership theories has
guided hypothesis regarding the relationship between entrepreneurial traits and skill
(passion, tenacity, and new resource skill) and situationally specific motivation
(communicated vision, self-efficacy, and goals) to subsequent venture growth. Data
from 229 entrepreneur- chief executive officers and 106 associates in a single industry
were obtained in a 6-year longitudinal study. Structural equation modeling revealed a
web of relationships that impact venture growth. Goals, self-efficacy, and
communicated vision had direct effects on venture growth, and these factors mediated
30
Stephen L. Muller, “Gender Gaps in Potential for Entrepreneurship Across Countries and Cultures”,
Journal of Developmental Entrepreneurship, Vol. 9, No.3, December 2004, pp.199-220. 31
Robert Baum J and Edwin A. Locke, “The Relationship of Entrepreneurial Traits, Skill, and
Motivation to Subsequent Venture Growth”, Journal of Applied Psychology, Vol.89, No.4, 2004,
pp.587-598.
31
the effects of passion, tenacity, and new resource skill on subsequent growth.
Furthermore, communicated visions and self-efficacy were related to goals, and
tenacity was related to new resource skill.
Chawala A.S and Albert Butare32
(2005) stated that the development of
entrepreneurship is essential both for solving the problems of unemployment and for
industrial development and balanced regional development. Most of the developing
countries have, of late, adopted a deliberate policy of developing and encouraging small
entrepreneurs as a strategy for the overall development. Entrepreneurship development
is a human resource development process which deals with the human motivation,
skills, competence, social and economic risks and investment of financial and physical
resources of the individual and the State. It is crucial for industrial development and for
alleviating the problem of unemployment which is attaining alarming proportions all
over the world. It is often felt that in the developing countries educated persons do not
seek entrepreneurial options but prefer government or private jobs. Thus,
entrepreneurship gets a lower priority in the career plans of educated youth. Though
everyone is not expected to become an entrepreneur, yet experience of the last few
decades all over the world clearly shows that it is possible to develop entrepreneurship
through planned efforts.
Maryam Sharifzadeh33
(2005) measures the entrepreneurial traits of students
and relates these traits to the discipline the students chose to study, and whether they
are sophomores or seniors. The results reveal that there is no significant difference
between students as far as their study area (discipline) and their level of education
32
Chawala A.S and Albert Butare, “Developing Entrepreneurial Competencies Amongst Rwandan
Youth”, Indian Marketing Studies Journal, Vol.9, No. 1, April 2005, pp.25-36. 33
Maryam Sharifzadeh, Entrepreneurship and Agricultural College Students; A Case of Shiraz
University, AIAEE 2005, Proceedings of the 21st Annual Conference

32
(sophomore/senior) concerns. The findings suggest a need to expose university students
to entrepreneurial thinking. Therefore, it should be noted that education as a catalyst for
creating entrepreneurs and entrepreneurial attitudes, should create entrepreneurs by
motivating and developing the right entrepreneurial direction. To promote need for
achievement, need for power, competitiveness and risk taking propensity, required
skills, knowledge and ideas should be provided to the students.
Gaurav34
(2006) stated that successful entrepreneurs were both born and made
as they had a dual composition- a certain set of inborn personality traits that drive them
to seek out and succeed in the entrepreneurial life, as well as a set of learned skills that
enable them to apply their natural gifts most effectively.
Yonca Gurol and Nuray Atsan35
(2006) stated that the purpose of this
research is to explore the entrepreneurship profile of Turkish university students and to
make an evaluation for their entrepreneurship orientation by comparing them with non-
entrepreneurially inclined students. In this study, six traits, namely need for
achievement, locus of control, risk taking propensity, tolerance for ambiguity,
innovativeness and self-confidence, are used to define the entrepreneurial profile of
students. The study is conducted on a random sample of fourth year university students
(n-400) from two Turkish universities. The question “What are you planning to do after
graduation?” was asked to students in order to discriminate between those who are
entrepreneurially inclined and those who are not. Respondents who have a response
saying that “I‟m planning to form my own business venture” are accepted as potential
entrepreneurs. Then, the entrepreneurial traits of these students are subjected to a
34
www.vit.ac.in/ecell/PDF/a3.pdf 35
Yonca Gurol and Nuray Atsan, , “Entrepreneurial Characteristics amongst University Students- Some
Insights for Entrepreneurship Education and Training in Turkey”, Emerald, Vol.48, No.4, 2006,
pp.25-38.

33
comparative analysis with other students who do not plan to start their business, and
thus are not included in the group of potential entrepreneurs. In short, a 40- item
questionnaire is administered to students, with questions related to demographic
variables, entrepreneurial inclination, and six entrepreneurial traits above cited (with
Likert type items). The results of the t-tests showed that, except for tolerance for
ambiguity and self-confidence, all entrepreneurial traits are found to be higher in
entrepreneurially inclined students, as compared to entrepreneurially non – inclined
students. That is, these students are found to have higher risk taking propensity, internal
locus of control, higher need for achievement and higher innovativeness.
Lourdes Poobala Rayen36
(2010) in his study states that significant correlation
exists between entrepreneurship and personality traits variables, namely decision
making ability, economic motivation, managerial ability, problem recognition and risk
taking willingness. Their correlation co-efficient are statistically significant at five per
cent level
Levent Altinay et.al,37
(2012) investigated the influence of family tradition and
psychological traits on the entrepreneurial intention of university hospitality students in
the UK. The empirical study was predicated on the need to consider both socio-
demographic variables and especially family background and personality traits. The
research also tested the suggestion that risk taking propensity may act as a potential
mediator. The findings of the study suggest that family entrepreneurial background and
innovation influence the intention to start a new business; that there is positive
relationship between tolerance of ambiguity and risk taking propensity; and a negative
36
Lourdes Poobala Rayen, “ Entrepreneurship in Tiny Sector Industries” Discovery Publishing House
Pvt. Ltd, New Delhi, 2010, p.222 37
Levent Altinay, Melih Madanoglu, Roberto Daniele and Conrad Lashley, “The influence of family
tradition and psychological traits on entrepreneurial intention” International Journal of Hospitality
Management Volume 31, Issue 2, June 2012, Pages 489–499
34
relationship between locus of control and risk taking propensity. The paper emphasizes
the importance of taking a more holistic approach when researching the factors that
influence entrepreneurial intention.
Ignas G. Sidik38
(2012) contributed in filling the gap by identifying factors
affecting SME performance and, hence, their development; and to develop a conceptual
framework explaining their relationships. The literature reveals that although there is
positive relationship between entrepreneur traits and firm performance in the context of
SMEs, the relationship is still inconclusive; suggesting that there are intervening
constructs between the two constructs. Field observations and literature reviews suggest
five second- order constructs serving mediating roles between entrepreneur traits and
firm performance that may clarify the relationship, i.e., (1) innovative performance,
(2) innovative capacity, (3) organizational search, (4) market orientation, and
(5) entrepreneurial orientation. Although the relationships among the seven constructs
have been extensively studied in the extant literature, this paper is one of the few
efforts, if any, in investigating the seven constructs in a comprehensive framework as a
basis for further studies. If empirically supported, the proposed framework may provide
an effective alternative in assisting entrepreneurs and SMEs‟ owners to develop their
firms more effectively.
Tushar Chaudhari39
(2013) made an attempt to study entrepreneurial trait
among various course students. It has notified some important qualities enlisted by
students essential for successful entrepreneurs. Furthermore it has study the role of
education institutes in upgrading these qualities. This study shows that the
38
Ignas G. Sidik, “Conceptual Framework of Factors Affecting SME Development: Mediating Factors
on the Relationship of Entrepreneur Traits and SME Performance”, Procedia Economics and
Finance, Volume 4, 2012, Pages 373–383 39
Tushar Chaudhari, “A Study of Entrepreneurial Attitude among Post Graduate Students” Research
Journal of Commerce and Behavioral science, Volume: 02, Number: 06, April-2013.

35
entrepreneurial motive among the respondents is very low. The reason behind this
scenario is mostly due to lack of technical knowledge, unwillingness to take risk and
inferior personality. The effort must be made to incorporate some leadership qualities
among student. The course curriculum must be designed in a way as to give technical
knowledge to students. The education institutions on the other hand must arrange the
guest lecture of local entrepreneur for their students. It was suggested that arranging
these lectures will help student to overcome the problems faced by them in the effort of
becoming an entrepreneur.
Marcela Rodica Luca et.al,40
(2013) analysed the relations between
entrepreneurial personality traits and entrepreneurial intentions in students belonging to
bachelor, master and doctoral level. From the comparison between two paired samples,
one involved in entrepreneurial training and the other one not involved, results a strong
interaction effect between involvement/ non-involvement in entrepreneurial training
and the intent of starting a business on all the entrepreneurial personality traits.
Cynthia Mathieu et.al,41
(2013) established a number of personality features
and behaviours associated with business creation and success. The similarities between
these traits and narcissism, a concept with roots in clinical psychology and psychiatry,
led the authors to conduct this study, which proposes to measure whether entrepreneurs
score higher on a narcissism scale than other vocational groups. The second goal of this
study is to measure the role of narcissism on intention to start a business. Student
entrepreneurs have been compared with non-entrepreneur students, city workers, and
employees and managers from a branch of a large financial institution. Then, students
40
Marcela Rodica Luca, Ana-Maria Cazan and Denisa Tomulescu, “ Entrepreneurial Personality in
Higher Education” Procedia - Social and Behavioral Sciences, Volume 84, 9 July 2013, Pages
1045–1049 41
Cynthia Mathieu and Étienne St-Jean, “Entrepreneurial personality: The role of narcissism”
Personality and Individual Differences, Volume 55, Issue 5, September 2013, Pages 527–531.

36
filled out measures of general self-efficacy, locus of control and risk propensity as well
as a narcissism scale. Results indicate that student entrepreneurs score significantly
higher than all other vocational groups on a measure of narcissism. Results also
indicate that narcissism is positively correlated with general self-efficacy, locus of
control and risk propensity. Moreover, narcissism plays a significant role in explaining
entrepreneurial intentions, even after controlling for self-efficacy, locus of control and
risk propensity. Overall, these findings shed new light on the underlying personality
traits of entrepreneurs and entrepreneurial intentions and suggest new directions in the
study of entrepreneurs‟ personality profile.
Jeya Ani J. and Lourdes Poobala Rayen42
(2014) in their study says that the
rural women entrepreneurs doing family business have higher business management
skills than the family of women entrepreneurs doing private occupation, agriculture and
others. Moreover, the rural women entrepreneurs doing family business are having
higher enterprise skills than the other categories.
2.2 FACTORS INFLUENCING ENTREPRENEURSHIP
Dhar and Lydall43
(1961) stated that small industry was a follower rather than
a pioneer and it was the large industry that had created external economies and
produced potential small entrepreneurs from among the rank of skilled workers.
Industrial estates acted as nursery beds for the growth of small industry rather than
permanent houses. The industry promoted efficiency and growth.
42
Jeya Ani. J, Lourdes Poobala Rayen, Women Entrepreneurship in Rural Areas, Discovery
Publications, New Delhi, 2014, p 232 43
Dhar P.N and Lydall H.F, The Role of Small Enterprises in Indian Economic Development, Asia
Publishing House, Bombay, 1961, pp.10-32.
37
James Berna. J44
(1966) found that the entrepreneurs hailed from diverse
castes. Occupations and classes are only small scale operations. They came up to their
present positions and diversified their production. This is attributed to their youth,
education and technical training.
Papanek45
(1967) in his study stated that educational, occupational and
financial backgrounds were the sources of entrepreneurship in Pakistan.
Kameshwar Jha. S46
(1970) in his study stated that a favourable economic
environment had a positive impact on entrepreneurship.
Peter Killby47
(1971) based on his study of Nigerian experience, observed that
the deficiencies in developing entrepreneurship could be removed over a relatively
short period by providing proper education and training.
Nafziger E.W48
(1975) in his study arrived at two conclusions. Firstly rich
families succeeded as entrepreneurs due to education, work experience, access to
capital and availability of Government assistance. Secondly, the social-economic status
of businessmen was generally higher than that of the general population in the non-
socialistic countries.
44
James Berna J, Industrial Entrepreneurship in Madras State, Bombay Asia Publishing House, 1966. 45
Papanek F and Gustav, Pakistan’s Development: Social Goals and Private Incentives, Harvard
University Press, Cambridge, Mass, 1967. 46
Kameshwar Jha S, Growth of Entrepreneurship in Underdeveloped Region with Special Reference
to Bihar State, Ph.D. Thesis 1970, 47
Peter Killby, “Enterpreneurship and Economic Development” The Free Press, New York, 1971, p.36 48
Nafziger E.W, “Class, Caste and Community of South Indian Industrialists. An Examination of the
Horatio Alger Model”, Journal of Development Studies, Vol.II, No.2, January 1975, pp.131-148.
38
Wilkin P.H49
(1979) stated that in Germany the objective of entrepreneurial
development could not be achieved unless the Government arranged improved supply
of capital and raw materials. Similarly the Meiji Government in Japan provided
improved supply of capital and exploited new foreign markets to compensate for the
lack of raw materials for heavy industries.
Rao50
(1983) in his study reported that technically trained entrepreneurs showed
a higher level of entrepreneurship than what entrepreneurs with no training did.
Chakravarthy T.K51
(1987) stated that the promotion of entrepreneurship to be
effective it has to be designed as a long range plan executed through a well-
orchestrated institutional support system.
Khanka S.S52
(1990) held the view that the emergence and development of
entrepreneurship was not a spontaneous event but a dependent phenomenon of
economic, social, political and psychological factors. These factors have both positive
and negative influences. The positively influencing factors will be facilitative and
create a conducive conditions for the emergence of entrepreneurship whereas negative
influences inhibiting the milieu to the emergence of entrepreneurship.
Ravichandra. K53
(1991) had taken into account their background, personality,
attitudinal and behavior characteristics and managerial perception and practices.
49
Wilkin P.H, Entrepreneurship: A Comparative and Historical Study, Norwood, Ablex Publishing
Corporation, New Jersey, 1979, p.264. 50
Rao B.S.S, “Entrepreneurship Development Among Technical Personnel: A Few Observations”,
SEDME, Vol. X, No.3, September 1983, pp.33-36 51
Chakravarthy T.K, “Entrepreneurship Development: Present Status and Emerging Priorities”, SEDME
14(4) December 1987. 52
Khanka S.S, “Entrepreneurship in Small Scale Industries”, Educational Publishers, New Delhi,
1990. 53
Ravichandra K, “Entrepreneurial Success – A Psychological Study”, Sterling Publishers Private
Limited, 1991, p.120
39
Moreover, the author has examined the trend in the entrepreneurial career. The study
shows that the success of the entrepreneurs in closely linked to the careful identification
and selection of potential opportunities. Hence, the author suggests that the promotional
activities should be organized and revamped.
Garudachar B.N54
(1994) pointed out that an important missing linkage, which
deserved urgent attention, was the absence of responsible liaison machinery. At present
interactions between academics and industry are inhibited by fears that “industrial
problems are mundane” or “academicians prefer sophisticated problems”. The climate
for entrepreneurship development called for a search for a meeting ground and he gave
suggestions to trade unions to resolve these fears.
Baldev Singh55
(1996) says that in India planners and policy-makers realized
that though a rapid rate of economic growth was essential, it could not by itself remove
poverty and unemployment. Consequently, a number of deliberate efforts had to be
made continually by the state for the generation of self-employment opportunities. The
burden of India‟s unemployment problem, especially of the educated class, lay largely
in the lack of entrepreneurial initiative. Therefore, there was a need to have a massive
programme to identify potential entrepreneurs and training should be given to them to
start small industrial units in the sectors and service units in the tertiary sector. He
elaborately explained the Self-Employment Scheme for Educated Youth (SESEY).
54
Garudachar B.N, “Enrichment of Entrepreneurship Culture through University-Industry Interaction”,
Progressive Educational Herald, 9 (1) October 1994, pp 18-19. 55
Baldev Singh, Self-Employment through Entrepreneurship Development, MD Publications Pvt. Ltd.,
New Delhi, 1996.
40
Shanmugakani. C56
(1996) analysed the impact of the growth of educational
facilities on the development of entrepreneurial abilities in Sivakasi region. After
widely analyzing the educational facilities available in schools and colleges functioning
in the region, the researcher noted the absence of illiteracy among the entrepreneurs
surveyed. Most of them felt that school level education was adequate to start any
industry. A sample survey among students of different educational institutions proved
that 18 per cent of them had undergone degree courses in order to look after family
business and another 14 per cent aimed to get business knowledge through courses of
study. The researcher also proved that there was a positive correlation of the study that
practical training and education helped the growth of the entrepreneurial ability in that
region.
Gopal Krishna Dhar Sanapati57
(1997) stated that the development of an
entrepreneurial culture among the students of engineering had been recognized by the
developing countries as an important factor in the field of technical education. There
was a criticism from industries that the quality of technicians trained in the state
engineering institutions was not satisfying the needs of the industries. He suggested that
the industry and technical education should interact with each other in a variety of ways
if maximum benefits of the infrastructure should be obtained. He also identified some
of the important reasons for the indifference of student‟s towards entrepreneurship.
Khanka S.S58
(1998) discussed the factors associated with the making of
entrepreneurs. The factors identified by him are stimulation, support and sustaining.
56
Shanmugakani C, “Growth of Educational Facilities and Development of Entrepreneurial Abilities
in Sivakasi”, Unpublished M.Phil Dissertation submitted to Madurai Kamaraj University, Madurai,
1996. 57
Gopal Krishna Dhar Sanapati, “Developing Entrepreneurship in Engineering Institutions”, University
News, 35(20) 19 May 1997, pp.7-8. 58
Khanka S.S, “Making the Entrepreneurial society”, Yojana, Vol.42, No.2, February, 1998, pp.9-11
41
The stimulation has been coming from the entrepreneurial development programmes
sponsored by some 686 financial institutions functioning all over India. The help from
the Government in the form of the provision of infrastructural facilities, incentives and
concessions are grouped under support. The Development Agencies, which pay too
much attention in the start-up phase of industrial units, pay too little attention in the
operational stage in the industry. So, provision for expansion activities- modernization,
diversification, consultancy service and marketing is to be made for sustaining of
industries.
Sharma D.D59
(1999) stated that India was a developing country and had been
facing acute and chronic problem, of unemployment. Polytechnic diploma holders and
engineering graduates had also been seriously affected by unemployment in recent
years. The promotion of entrepreneurship in the technical education system was thus
the need of the hour. In India tremendous latent entrepreneurial talent existed which, if
properly harnessed, could help in solving many of the serious problems the country was
facing. They also discussed the lacunae in the present activities and suggested possible
solutions to overcome them. They suggested a strategy for further promotion of
entrepreneurship among the technical graduates.
Batra C.S and Dangwala R.C60
(1999) identified the two problems in India,
namely mass poverty and widespread and chronic unemployment. A massive industrial
wealth had created only a couple of thousands of jobs, which proved to be totally
inadequate. India was now left with no alternative but to search for entrepreneurial
talent in order to solve the problems to ensure the rapid growth of the industrial sector
59
Sharma D.D, Dhameja S.K and Gujar B.R, Entrepreneurship, Strategic Management and
Globalisation, Rawat Publications, Jaipur and New Delhi, 1999. 60
Batra C.S and Dangwala R.C, Entrepreneurial and Small Scale Industries New Potentials, Deep &
Deep Publications Pvt. Ltd., New Delhi, 1999.
42
which may need low capital requirement and high labour intensity the authors wanted
an effective mechanism to enlarge the pool of new entrepreneurs from non-traditional
groups who could be trained and guided to establish new ventures. They also explained
the Indian NEC programmes popularly known as Entrepreneurship Development
Programmes.
Cameron Alan et.al,61
(2000) observed that the results from the Global
Entrepreneurship Monitor Project gave new insights into the role of entrepreneurs in
economic growth. They also found that the level of entrepreneurial activity was
positively correlated with the recent gains in GDP for the ten countries covered in the
study.
Kets De Vries M.F.R62
(2001) reviewed the concept of entrepreneurship and
empirical studies of entrepreneurial behavior patters. In addition, his study explores the
social, economic and psychodynamic forces influencing entrepreneurship.
A conceptualization of the entrepreneurial personality is proposed. Finally, the
organizational impact of these entrepreneurial behavior patterns on work environment
and management succession is discussed.
Sharma K.P63
(2002) pointed out that respect for the individual, continued
opportunity for advancement and open door policies were the factors that helped the
development of entrepreneurship.
61
Cameron Alan, Claire Massey and Daniel Tweet, “Entrepreneurs- A Vital Force?” Chartered
Accountants Journal of New Zealand, Vol.79, no.10, 2000 pp. 10-13 62
Kets De Vries M.F.R, “The Entrepreneurial Personality: A Person at the Crossroads”, The Journal of
Management Study, February 2001, pp.34-56. 63
Sharma K.P, Rise of Entrepreneurship in Haryana, A Case Study of Rannog Enterprises, 2002.
43
Tapan K. Panda64
(2004) tried to indentify the key variables of entrepreneurial
success. The various socio-economic parameters selected for the study explained the
level and degree of association with entrepreneurial success. The study showed that
there was association between success levels with factors like technical education,
occupational background of parents and previous job experience of entrepreneurs.
Lorna Collins Paul. D65
(2004) reviewed the gap between student‟s
entrepreneurial needs and aspiration and the entrepreneurship education offerings
within higher education institutions (HEIs) in Leicestershire, the UK. Utilizing data
from three surveys of university fresher students, held in 2001 findings are arrived at.
The findings are used as the basis to assess the gap between fresher students
entrepreneurial needs and aspiration.
A study was conducted by the Elke Schroder66
(2005) and tested with a sample
of 623 students (aged 14-26 years). Apart from teaching entrepreneurship, the
programme particularly focused on the „crystallization‟ of training significantly
improved the „crystallization‟ of entrepreneurial interest. The training proved to be
particularly beneficial to students without any relation to entrepreneurship through role
models in their family. This study found that benefited in terms of general knowledge
and self-awareness out of these programme.
Satya Sundaram. I67
(2006) stated that entrepreneurship among women in
India was at a low level for various reasons. But the situation was slowly improving
thanks to the emergence of Self-help Groups and micro finance programmes. Women
64
http://dspace.iimk.ac.in/bistream/2259/199. 65
Lorna Collins Paul D. Hannon and Alison Smith, “Enacting Entrepreneurial Intent: the gaps between
student needs and higher education capability”, Emerald, Vol.46, No.819, 2004, pp.454-463. 66
http://www.defi.gour.qc.ca/Publications/depliant_defi_en.pdf. p 79. 67
Satya Sundaram I, “Women Empowerment and Globalisation”, Southern Economist, Vol.44, No.13,
November 1, 2005, pp.19-23
44
have now access to institutional credit and training facilities. She concluded that the
future would see women setting their own industrial establishments.
Bhagmar and Verma B.L68
(2006) stated that a nation‟s ability to generate a
steady stream of business opportunities could only come about when its people take to
entrepreneurial activities. Entrepreneurs are essentially the engines of growth for a
nation. There are several factors that go into making a successful entrepreneur, and he
or she need not necessarily possess a strong business and financial background. On the
contrary, well-conceived and well-directed training could always produce an
outstanding entrepreneur.
Nair K.R.G and Anu Pandey69
(2006) examined the social-economic and
attitudinal characteristics of entrepreneurs on the basis of primary data for the state of
Kerala. It does not appear that business acumen runs in families nor is there evidence
that religion has an impact of entrepreneurship. The economic status of the family, age,
technical education/training and work experience in a similar or related field seem to
favour entrepreneurship. In comparison to the rest of the population, entrepreneurs tend
to be more innovative in their attitude, but do not seem to have greater faith in the
internal locus of control.
Urve Venessar et.al,70
(2006) used the Likert Scale for measurement of
students‟ attitudes based on their own opinions about motivations to start in business.
The research results showed that differences exist in the motives like ambition for
freedom, self-realization and pushing factors to start a new venture in the near future.
68
Bhagmar M and Verma B.L, “Spirit of Entrepreneurship: The Only Way to Success”, Southern
Economist, Vol.44, No.18, January 15, 2006, pp.18-21 69
Nair K.R.G and Anu Pandey, “Characteristics of Entrepreneurs: An Empirical Analysis”, The Journal
of Entrepreneurship, 15 (1), 2006, pp. 46-61. 70
http://ideas.repec.org/p/ttu/wpaper/154.html p. 102

45
They further found that business administration students found more often than the
students from non-business specialties that the knowledge obtained during the studies
help most to start a business.
Mathivanan. R and Kumar. D71
(2006) stated that in India what was lacking
was not the spirit of entrepreneurship, but the application of the related skills and the
spirit of enterprise to profitable economic activities. They stressed the need for the
development of rural entrepreneurship in India as labour absorption in agriculture and
in the industrial and service sector had been fast enough to absorb the growing rural
labour force. They concluded that the environment in the family, society and the
support system were generally not conductive to encourage the rural people especially
the young to consider self-employment and the entrepreneurial career as an option.
Lourdes Poobala Rayen72
(2010) in his study states that four important factors
influence a person to start or manage the tiny enterprises namely; achievement and
support factor, interest factor, traditional status factor and economic necessity factor.
Mumtaz Begam et.al,73
(2012) analyzed the relationship between educational
support towards entrepreneurial intention. Data were collected via questionnaire from
183 students of three different programmes offered in MARA Professional Colleges.
The study utilized correlation and regression statistics to analyse the data. The finding
of the survey shows that there is a significant relationship between attitudinal
factor(r=0.5324), behavioural factor (r=0.5668) and educational support(r=0.6241)
71
Mathivanan R and Kumar D, “Strength and Weakness of Rural Entrepreneurship”, Kissan World,
Vol.22, No.11, November, 2006, pp.24-29 72
Lourdes Poobala Rayen, “Entrepreneurship in Tiny Sector Industries” Discovery Publishing House
Pvt. Ltd. New Delhi, 2010, p.223 73
Mumtaz Begam Abdul Kadir, Munirah Salim and Halimahton Kamarudin, “The Relationship Between
Educational Support and Entrepreneurial Intentions in Malaysian Higher Learning Institution”
Procedia - Social and Behavioral Sciences, Volume 69, 24 December 2012, Pages 2164–2173
46
towards entrepreneurial intention. Educational support contributed 40.8 per cent to
attitudinal factor and 57.6 per cent to behavioural factor. All three factors (attitudinal,
behavioural and educational support) contribute 43.3 per cent towards entrepreneurial
intention among MARA Professional College. It is suggested educational support
through professional education in these colleges is an efficient way of obtaining
necessary knowledge about entrepreneurship. The result of the study has valuable
implications for policy makers in Higher Education Division, college administrators
and educators.
Thomas Lans et.al,74
(2014) analysed sustainable entrepreneurs, i.e. those who
proactively facilitate latent demands for sustainable development, are now in higher
demand than ever before. Higher (business) education can play an important role in
laying the foundation for these sustainable entrepreneurs. Traditionally, however,
educational scholars focus either on the issue of education for sustainability or on
entrepreneurship education. There is little work which explores and/or crosses the
boundaries between these two disciplines, let alone work in which an effort is made to
integrate these perspectives. In this article, a competence approach was taken as a first
step to link the worlds of education for entrepreneurship and for sustainability because
we postulate that both, apparently different, worlds can reinforce each other. Based on a
literature review, focus group discussions with teachers in higher education (n = 8) and
a structured questionnaire among students (n = 211), a set of clear, distinct
competencies was developed, providing stepping stones for monitoring students'
sustainable entrepreneurship development in school-based environments.
74
Thomas Lans, Vincent Blok and Renate Wesselink, “Learning apart and together: towards an
integrated competence framework for sustainable entrepreneurship in higher education”, Journal of
Cleaner Production, Volume 62, 1 January 2014, Pages 37–47.

47
Merle Kuttim et.al,75
(2014) identified the content of university
entrepreneurship education and its impact for students‟ entrepreneurial intentions. The
study design used was cross-sectional study and the sample consisted of the students
from 17 European countries that have been grouped for the purpose of analysis by the
level of economic development into two country groups: efficiency-driven and
innovation-driven economies. Frequencies and binary logistic regression was used to
analyze the impact of different factors, including participation in entrepreneurship
education, for entrepreneurial intentions. Results indicate that what is offered is not
necessarily the most demanded in entrepreneurship education as lectures and seminars
are provided more, but networking and coaching activities are expected more by the
students. Participation in entrepreneurship education was found to exert positive impact
on entrepreneurial intentions.
Astri Ghina76
(2014) examined that Indonesia concerns promoting
entrepreneurship to all people in order to develop successful entrepreneurs. Despite
several entrepreneurship programs are developed by government and Higher Education
Institutions (HEIs) to support this entrepreneurship movement, very little is known
about effectiveness of entrepreneurship programs” implementation. Therefore this
study will evaluate to what extent the effectiveness of entrepreneurship education in
Indonesia. This research uses case study methods and will be carried out in two stages.
The first stage is descriptive and evaluative phase. Here the research will focus on
mapping of existing learning and institutional supports within HEIs. Data exploration
regarding learning process within HEIs will be evaluate from internal perspective and
75
Merle Küttim, Marianne Kallaste, Urve Venesaar and Aino Kiis, “Entrepreneurship Education at
University Level and Students‟ Entrepreneurial Intentions”, Procedia - Social and Behavioral
Sciences, Volume 110, 24 January 2014, Pages 658–668 76
Astri Ghina, “Effectiveness of Entrepreneurship Education in Higher Education Institutions” ,
Procedia - Social and Behavioral Sciences, Volume 115, 21 February 2014, Pages 332–345

48
external perspectives in order to get better understanding of learning experiences that
support to become successful entrepreneurs. The second stage is explanatory phase, this
stage lead to discover, develop the concepts, categories, and propositions from the
phenomena to develop entrepreneurial learning theory.
Kare Moberg77
(2014) analysed the influence of two different approaches to
entrepreneurship education at the lower secondary level of education. The influence of
education for entrepreneurship and education through entrepreneurship on pupils' level
of school engagement and entrepreneurial intentions is analysed and assessed. The
paper builds on and extends research about entrepreneurship education for pupils at the
lower secondary and upper secondary levels of education by including theories about
cognitive and non-cognitive skill formation, school engagement, and purposeful
learning in the theoretical framework. It is found that education for entrepreneurship,
which focuses on content and cognitive entrepreneurial skills, has a positive influence
on pupils' entrepreneurial intentions but a negative influence on their level of school
engagement. The opposite is true for education through entrepreneurship, which has a
more pedagogical orientation and focuses on fostering non-cognitive entrepreneurial
skills. Furthermore, the role of supportive teaching styles and action-based teaching
methods in entrepreneurship education at this level of education is investigated. The
analysis is based on data from two surveys including 801 randomly selected Danish
ninth-graders (aged 14–15) and 576 randomly selected Danish tenth-graders (aged 15–
16). The findings have implications for policy makers and curriculum designers,
inasmuch as the influence of two educational approaches is assessed and analysed, but
77
Kare Moberg , “Two approaches to entrepreneurship education: The different effects of education for
and through entrepreneurship at the lower secondary level” The International Journal of
Management Education, 11, June 2014
49
also for the academic community since it presents an alternative way to assess
educational dimensions (content and teaching methods) separately.
2.3 ACHIEVEMENT MOTIVATION
Habibah Elias and Atan Bin Long 78
(1984) stated that the performance of
pupils in the primary five assessment examination was examined in relation to a
number of variables namely achievement motivation, socio-economic status,
intelligence, area of residence, school milieu and parental encouragement to assess the
correlation between them. The subjects were 90 pupils selected from 40 primary
schools in Selangor and represented the Chinese, Malays and Indians. Individual
interviews were conducted by the researcher. Subjects were asked to answer
questionnaires, the Thematic Apperception Test, and the Raven's Progressive Matrices.
The results showed that achievement motivation correlated highly with performance in
the stated examination. The other variables which showed significant correlations with
performance were socio-economic status, intelligence, school milieu and parental
encouragement.
Habibah Elias and Wan Rafae Abdul Rahman79
(1995) examined the
achievement motivation of 1050 University Kebangsaan Malaysia students in relation
to faculty and year of study, ethnic group, gender and place of origin. Three other
dependent variables, locus of control, attitude towards learning and study habits, were
also examined. The results showed that there were significant differences in
achievement motivation among students based on faculty, year of study and ethnic
78
Habibah Elias and Atan Bin Long, “A Correlational Study of Achievement Motivation and Pupils'
Performance in the Standard Five Assessment Examination From Selected Schools in Selangor”
Pertanika Journal of Social Sciences & Humanities 7(2), pp. 31 -38 (1984) 79
Habibah Elias and Wan Rafae Abdul Rahman, “Achievement Motivation of University Students”
Pertanika Journal of Social Sciences & Humanities 3(1): 1-10 (1995)

50
group. On locus of control, it was found that male students were more internal than
female students. Significant differences were also found in attitudes of subjects in
relation to ethnic group, year of study and faculty.
Yonca Gurol and Nuray Atsan80
(2006) explore the entrepreneurship profile
of Turkish university students and to make an evaluation for their entrepreneurship
orientation by comparing them with non-entrepreneurially inclined students. The
results showed that, except for tolerance for ambiguity and self-confidence, all
entrepreneurial traits are found to be higher in entrepreneurially inclined students, as
compared to entrepreneurially non-inclined students. That is, these students are found
to have higher risk taking propensity, internal locus of control, higher need for
achievement and higher innovativeness.
Ahmet Erdogan81
(2007) examined the variable which affects students‟
mathematics anxiety is their achievement motivation, another variable affecting
students‟ mathematics anxiety is their social comparison. This study aims to determine
if achievement motivation and social comparison are significant predictors of high
school students‟ mathematics anxiety. The study groups were comprised of 166 9th
grade students still attending a private tutoring center. In this study, a multiple linear
regression analysis was used. In multiple linear regression analysis, the relationship
between the predictor variables, students‟ achievement motivation, and social
comparison, and the dependent variable, mathematics anxiety, were tested. It was
determined that achievement motivation alone, and achievement motivation and social
80
Yonca Gürol and Nuray Atsan, (2006) "Entrepreneurial characteristics amongst university students:
Some insights for entrepreneurship education and training in Turkey", Education and Training, Vol.
48 Iss: 1, pp.25 – 38 81
http://ilkogretim-online.org.tr
51
comparison together are significant predictors of high school students‟ mathematics
anxiety.
Paul A. Story et.al,82
(2009) analysed a two-factor theory of achievement
motivation (intrinsic and extrinsic factors) to predict three achievement-related factors:
generalized expectancy for success, need for cognition, and self-reinforcement. As
predicted, intrinsic achievement motivation was positively associated with scores on all
three achievement-related factors, whereas extrinsic achievement motivation was
positively related only to generalized expectancy for success. Subsequent regression
analyses revealed that intrinsic achievement motivation better predicted all three factors
than did extrinsic achievement motivation. Implications for employing a two-factor
model of achievement motivation are presented for both basic and applied applications.
Chao Ching Chen et.al,83
(2011) adopted student personal characteristics as
independent variable, environment cognition as the intervening variable, and attitude
toward entrepreneurship as the dependent variable. The results indicated that student
attitude toward entrepreneurship was affected by environment cognition and personal
traits, which indirectly affected attitude toward entrepreneurship. According to the
analysis result, the need for achievement, locus of control and creative thinking are the
most important characteristics for entrepreneurship. The family, society, education and
economic environment are also important factors. They should enhance the attitude
toward entrepreneurship in students at technological colleges and universities through
entrepreneurship education. There must be supply of entrepreneurial knowledge to
82
Paul A. Story, Jason W. Hart, Mark F. Stasson, John M. Mahoney “Using a two-factor theory of
achievement motivation to examine performance-based outcomes and self-regulatory processes”,
Personality and Individual Differences, Volume 46, Issue 4, March 2009, Pages 391–395 83
Chao Ching Chen, Yu Fen Chen and Ming Chuan Lai (2011) “A study on entrepreneurial attitude
and the influential factors for business department students at technology colleges and universities
in Taiwan”

52
students and also promote more entrepreneurial actions and foster entrepreneurial
personalities.
Farshid Ghasemi et.al,84
(2011) investigated the relationship between
creativity and achievement motivation with high school students‟ entrepreneurship in
Shiraz. In this regard, the relationship of the four dimensions of creativity (fluency,
initiative, flexibility, and elaboration) accompanied by eight characteristics of
achievement motivation (hard working, vision, eagerness, purposefulness, progress,
insistence, primarity of colleague experts, and the utmost use of time) with
entrepreneurship were investigated. 365 (171 male and 194 female) students were
chosen using multistage cluster sampling and were asked to complete the
questionnaires. After collecting and analyzing the data, the results indicated that there
was a meaningful relation between students‟ creativity and entrepreneurship. There was
also meaningful positive relation between achievement motivation and
entrepreneurship. Among the components of creativity, fluency and initiative had
positive relation to entrepreneurship. Among components of achievement motivation,
hardworking, purposefulness, and insistence had positive meaningful relation to
entrepreneurship; however, the utmost use of time had negative relation to
entrepreneurship. Other components of achievement motivation had weak relations
with entrepreneurship. Moreover, the results showed that girls were higher than boys in
creativity, achievement motivation, and entrepreneurship. Among the four regions of
education, region two had better situation regarding the three variables than other
regions.
84
Farshid Ghasemi, Ahmad Rastegar Reza Ghorban Jahromi and Roghayeh Roozegar Marvdashti, The
relationship between creativity and achievement motivation with high school students‟
entrepreneurship Procedia - Social and Behavioral Sciences Volume 30, 2011, Pages 1291–1296

53
Kulwinder Singh85
(2011) one of the most important factors that lead one to
their goals is the drive. This drive is known as motivation. It is a determination with a
kind of excitement that leads one to persevere to reach greater heights, in no matter
what avenue of their life; be it – personal or professional. The drive may come from an
internal or external source. The individual determines this. The factors that motivate an
individual keep changing as one climbs the ladder of age and maturity. And also,
achievement of one goal sets the ball rolling for another one to be achieved. Thus, to be
motivated is a constant need. There are times when one faces a period of de-motivation
and everything seems bleak. It is then that they need to find what would motivate them
back into action.
Adedeji J. Ogunleye86
(2012) attempts to bring the importance of an individual
person‟s traits (personality) in fostering business and economic growth and
development. The objective is to ignite a focus on the need for education and trainings,
enabling environment, gender equality and intellectual property rights as preconditions
for psychological well-being necessary for entrepreneurial behaviours, economic
growth and development. It is thus recommended that education and training systems
be entrenched to create positive attitudes towards entrepreneurship and provide
managerial skills. It is also opined that trainings in the understanding of self and
self-worth could be useful in fostering innovations and encourage risk taking and
independent workings.
85
Kulwinder Singh “Study of Achievement Motivation in Relation to Academic Achievement of
Students” International Journal of Educational Planning & Administration Volume 1, Number 2,
2011, pp. 161-171. 86
Adedeji J. Ogunleye, “Self Esteem and Achievement Motivation: Behavioral Traits for
Entrepreneurship, Business and Economic Growth and Development” Research Journal in
Organizational Psychology & Educational Studies 2012 1(3) 145-148.

54
Ming Te Wang and Jacquelynne S. Eccles87
(2013) adopted a
multidimensional perspective to examine the relationships between middle school
students' perceptions of the school environment (structure support, provision of choice,
teaching for relevance, teacher and peer emotional support), achievement motivation
(academic self-concept and subjective task value), and school engagement (behavioral,
emotional, and cognitive engagement). Participants were from an ethnically diverse,
urban sample of 1157 adolescents. The findings indicated that student perceptions of
distinct aspects of the school environment contributed differentially to the three types
of school engagement. In addition, these associations were fully or partially mediated
by achievement motivation. Specifically, student perceptions of the school environment
influenced their achievement motivation and in turn influenced all three types of school
engagement, although in different ways. Moderation effects of gender, ethnicity, and
academic ability were also discussed.
Muhammad Zaman88
(2013) aims to explore the entrepreneurship profile of
the Pakistan university students (Peshawar region) and evaluates their entrepreneurial
inclination by making comparison with non-entrepreneurially inclined students. In this
study the entrepreneurial profile of the students is constituted by six traits namely need
for achievement, innovativeness, locus of control, risk taking propensity, tolerance for
ambiguity, self-confidence. The results showed that except for tolerance for ambiguity
and self-confidence all entrepreneurial traits are found to be higher in entrepreneurially
inclined students as compared to non-inclined students. This study probes
entrepreneurial characteristic providing a clear understanding of entrepreneurial
87
Ming Te Wang and Jacquelynne S. Eccles “School context, achievement motivation, and academic
engagement: A longitudinal study of school engagement using a multidimensional perspective”,
Learning and Instruction, Volume 28, December 2013, Pages 12–23 88
Muhammad Zaman, “Entrepreneurial characteristics among university students: Implications for
entrepreneurship education and training in Pakistan” African Journal of Business Management
Vol.7(39), pp. 4053-4058, October 2013.

55
education, as to which entrepreneurial characteristics can be developed to produce good
entrepreneurs.
Asanee Tongslip89
(2013) studied the path analysis of relationships between
factors with achievement motivation of students of private Universities in Bangkok.
The sample was 840 students who were randomized by the multi-stage method. The
results of this research were the correlations among academic achievement, classmate
relationships, future expectation and self-directed learning with achievement
motivation were statistically significant. For path analysis, the results of the study
found self-directed learning, academic achievement and future expectation had a direct
effect to achievement motivation. However, classmate relationships did not have direct
effect on relationships with achievement motivation. Moreover, it was found that there
was an indirect effect in three dimensions namely: classmate relationships through self-
directed learning through achievement motivation, classmate relationships through
future expectation, through academic achievement and through achievement
motivation, and classmate relationships through future expectation and through
achievement motivation.
Foluso Ilesanmi Jayeoba et.al,90
(2013) examined the influence of
achievement motivation on entrepreneurial abilities using the factorial analysis that
considered also whether sex differences account for differential entrepreneurial
abilities. The outcome shows that sex plays no significant role in entrepreneurial
abilities. Achievement motivation correlates significantly with entrepreneurial abilities
89
Asanee Tongslip, “A Path Analysis of Relationships between Factors with Achievement Motivation of
Students of Private Universities in Bangkok, Thailand” ,Procedio- Social and Behavioral Sciences,
Volume 88, 10 October 2013, Pages 229–238 90
Foluso Ilesanmi Jayeoba, Olayinka Yusuf Sholesi and Olufemi Akanji Lawal., “Achievement
Motivation, Gender and Entrepreneurial Ability” International Journal of Academic Research in
Accounting, Finance and Management Sciences Vol. 3, No.1, January 2013, pp. 248–256.

56
and has significant influence on entrepreneurial abilities. It is suggested that continuous
observance of correlation between entrepreneurship and some personality variables
should draw attention of government and other stake holders especially in Nigeria to
consideration of these factors in policy formulation and interventions aimed at
jumpstarting an entrepreneurial society.
Tanja91
(2014) investigated the role of three basic motivational needs (need for
power, affiliation, achievement) as antecedents of goals within the 2 × 2 achievement
goal framework, and examined their combined predictive validity with regard to
academic performance in a sample of 120 university students. Structural equation
modeling analysis largely supported our postulated model, linking motivational needs
indirectly to course grades through goals. Achievement goals were formed by a
combination of different motives: need for achievement was a positive predictor of all
four achievement goals, and need for affiliation was negatively related to performance-
approach and performance-avoidance goals. Additionally, need for power was a
positive predictor of performance-avoidance goals. Performance-approach goals had a
direct (positive) effect on performance outcomes. In sum, our results integrate basic
motivational needs with the achievement goals literature and extend therefore
hierarchical achievement motivation models, by showing how basic human motives of
achievement, affiliation, and power are related to goal striving motivation and
performance outcomes in an academic setting.
91
Tanja Bipp Karen Van Dam “Extending hierarchical achievement motivation models: The role of
motivational needs for achievement goals and academic performance”, Personality and Individual
Differences Volume 64, July 2014, Pages 157–162

57
2.4 ENTREPRENEURIAL MOTIVATION
Sharma K.L92
(1978) showed that those who had neither business nor
industrial background before entering into manufacturing had a higher degree of
motivation than those coming from business/industrial families.
Vani and Vinayak93
(1980) showed the possibility of the emergence and
development of entrepreneurship among two less enterprising namely tribals and
woman.
Clifford M. Baumback and Joseph R. Maneuro94
(1981) stated that to
develop autonomous entrepreneurs in the area a long-term remedy were needed. For
this, one should examine the sources of entrepreneurial talent and the forces both
psychological and environmental, which engendered the entrepreneurial personality.
Functional deficiencies might suffice for use as a short-run measure for the most probes
much deeper for an adequate long-run solution.
Patel V.G95
(1985) found that in India 40 per cent of the entrepreneurs were
from the trading background, 30 per cent from service, 10 per cent were fresh graduate
engineers, 10 per cent were from self-employed professionals and the remaining 10 per
cent came from artisans, unemployed farmers and the like. Therefore the study showed
that 60 per cent of the entrepreneurs did not have a business background.
92
Sharma K.L,” A Multivariate Model for the Analysis of Entrepreneurship in Manufacturing
Organisation”, Sociological Bulletin, Vol.27, No.1, March 1978, pp.48-65. 93
Vani and Vinayak, “Entrepreneurship Development (among) Tribals” Yojana, Vol.14, No.16, 1st
April, 1980, pp.8-9. 94
Clifford Baumback M and Joseph Mancuso R, Entrepreneurship and Venture Management, DB.
Taraporevala Sons & Co. Pvt. Ltd., Published by Arrangement with Prentice- Hall, INC, 1981. 95
Patel V.G, Organisation Development for Entrepreneurship Programmes, Entrepreneurship
Development Institute of India, Ahmedabad, 1985, pp.56.

58
Akhouri M.M.P and Mishra S.P 96
(1990) stated that entrepreneurs played an
important role in developing and contributing to the economy of a nation. In most of
the developing countries including India entrepreneurship did not find a place in
educational curriculum. Education was a strong interventional or influencing medium
that set values, developed attitudes and created the drive in people to move in the
profession and vocational direction with confidence. Education had the prime role of
moulding human resources in a particular direction. They felt that there was a need to
develop a conceptual base for evolving a curriculum, which could be used in the school
system that ensured the emergence of Entrepreneurial spirit including values, attitudes,
motivation and competencies among masses at a very early stage of their development
to successfully take up entrepreneurial pursuits.
Mishra D.N97
(1990) found that making money was rated the highest of all
ambitions of entrepreneurs. Independent living and social prestige were also ambitions.
The entrepreneur‟s family members played a useful role though limited in giving shape
to the entrepreneur‟s ambitions. Further the communities with a mercantile background
encouraged their children to have high regard for earning money and saving it.
Unfortunately, only a few from other communities had such an opinion and hence the
mercantile communities were branded as anti-social elements. That attitude was very
unhelpful and it did not promote economic growth through the development of small-
scale industry. According to him what was essentially needed to face difficulties was
not merely the material support from family or friends or a government agency. It was
the moral support that was badly needed. Lack of moral support dampened all the
enthusiasm of the entrepreneur despite adequate or an over-dose of material support. In
96
Akhouri M.M.P and Mishra S.P, “Entrepreneurship Education: A Conceptual Base, Approach and
Methodology”, Indian Management, 29 (11-12) November – December 1990, pp.53-65. 97
Mishra D.N, Entrepreneur and Entrepreneurship Development and Planning in India, Chug
Publications, Allahabad, 1990, 00.224-226.
59
contrast, moral support from the near and dear inspired him, redoubled his confidence,
made him reassuring and prepared him to face new challenges boldly, even if the moral
support was made available in less than adequate quantities.
Ganeshan. R98
(1992) found that the educational level of entrepreneurs was an
important factor motivating entrepreneurship in small-scale industries.
Gangadhara Rao. M99
(1992) stated that in order to change the social and
economic structure of society and to uplift its disadvantaged action like women, greater
emphasis should be given to entrepreneurial development programmes particularly
directed towards women. Such programmes could provide women with economic
security, family and social status and individual dignity. He further stated that it was
necessary to take care of their aspirations by creating an environment and also by
developing entrepreneurial ability which could really help in self-reliance.
Gautam Raj Jain and Debmuni Gupta100
(1994) stated that entrepreneurship
was relatively a new discipline in formal education. The work presented on this theme
included entrepreneurship at different levels of formal education, ranging from school
to college and to professional courses, including those run by management and
technical institutions. The innovations in these areas include motivation to the target
group concerned to take up entrepreneurship courses to spread entrepreneurship in a
large number of institutions to cover as many students as possible, devise course
98
Ganeshan R, “Growth of Entrepreneurship in Small Scale Industries – A study with reference to
Pudukottai District, Tamil Nadu”, Unpublished Ph.D., Thesis submitted to Alagappa university,
Karaikudi, 1992. 99
Gangadhara Rao M, Entrepreneurship and Entrepreneurial Development, Kanishka Publishing
House, New Delhi, 1992. 100
Gautam Raj Jain and Debmuni Gupta (ed.) „New Initiatives in Entrepreneurship Education and
Training, Fredrich – Naumann – Stifung, New Delhi, 1994.

60
curriculum and teaching methods and develop faculty resources. He also discussed the
issues and problems relating to innovations in entrepreneurship education.
Brimmer A.F101
(1995) made an extensive appraisal of the role of an industrial
organization known as the Managing Agency System, which was formed by the British
and Indian entrepreneurs to overcome the limitations of their lack of capital and
business ability. Though the system played a major role in the entrepreneurial
development it led to certain illegal acts by its agents. However he felt that the abolition
of the system was not a good remedy to check those acts.
Nalinaksha Mutsuddi102
(1996) stated that by nature, women were endowed
with certain qualities founded favourable for the growth of entrepreneurship. They
possessed the inherent gift to motivate others by raising their self-worth and
self-esteem, making them feels important. This affability and helpful nature brought out
the best in others without hurting their ego or creating any tension or conflict. By
encouraging active participation and sharing power and information, women could
contribute more towards better performance and higher productivity. Women skillfully
integrated professional life with family life.
Suresh K and Dhameja K103
(1998) stated that inspite of considerable
modifications and changes, the education systems of many developing countries did not
deal adequately with the problem faced by young school-leavers. Instead of promoting
the potentiality for gainful self-employment, the education systems tended to strengthen
the motivation for wage employment often in Government establishments. Most of the
101
Brimmer A.F, “The setting of Entrepreneurship in India”, Quarterly Journal of Economics, Vol.
LXIY, No.4, November 1995. 102
Nalinaksha Mutsuddi, You too can Become an Entrepreneur, Wheeler Publishing, New Delhi, 1996. 103
Suresh K and Dhameja K, Entrepreneurship and Small Business, Rawat Publications, Jaipur and
New Delhi, 1998.

61
educated youth of rural areas flocked to towns and cities in search of jobs. Due to slow
economic growth and increase in population over the years, the ranks of educated
unemployed had swelled. He felt that the expansion of facilities for technical training
provision of vocational courses as part of general Lower and Senior secondary
education and introduction of work experience as an integral part of school curriculum
would be notable attempts to be made by educational institutions to motivate the young
students to become successful entrepreneurs.
Martin Patrick104
(1999) stated that lack of alternative wage employment had
forced many especially the poor to seek employment by setting up their own small
production trade or service. This proves was evident from the tremendous growth of
self-employment in both developed and developing countries.
Stevenson and Lundstrom105
(2001) stated that promoting an entrepreneurial
culture required a combination of specific programmes and initiatives to create positive
attitudes towards entrepreneurship and entrepreneurs. The mentioned that the best
practice countries were probably those like the United States, Canada, Australia and
New Zealand that use a combination of approaches to promote entrepreneurship in their
countries.
Madhushree Nanda Agarwal106
(2004) found that the combination of skills
and motivations was associated with certain entrepreneurial “types”. She identified five
types of entrepreneurs in the five-cluster situations.
104
Martin Patrick, Self Employment and Successful Entrepreneurship, Kaniska Publishers and
Distributors, New Delhi, 1999. 105
www.ilo.org, p.75 106
http://www.immcal.ac.in/programmes/fpm/Thesis Abstract/madhusree2004.pdf.

62
Kamala Balachandran107
(2005) stated that for a country like India, rich in
manpower, it was only by multiplying the number of job provider, we could hope to
take all the Indians on the economic climb up. But there was a strong perception among
the salaried class parents that a substantial capital was needed to start with. In fact, in
the present times when the new economy rules, the essential investment required for
entrepreneurship is not so much money power as powerful idea. She finally suggested
to the current generation of parents to discard the old prejudices against business and
encourage their wards to become entrepreneurs.
Luke Pittaway et.al,108
(2007) provided an illustration of both the forms of
knowledge gained through the use of inquiry-based learning in entrepreneurship
education and could itself be used in teaching about invention, innovation and
commercialization processes. Finally the paper concluded that highlighting the benefits
and challenges of this type of course for the students explained how such a course may
provide a different pedagogic approach for entrepreneurship education targeted at
science and engineering students.
A research and policy guide issued by the Ewing Marion Kauffman
Foundation (U.S.A)109
(2007), stated that entrepreneurship was no different than any
other skill people were born with; it could be, and was likely to be, useless unless the
skill was developed through education and experience. It implied that a central task for
educators and policy makers was not to give students the key skills to thrive in any
work environment – reading, mathematics, science, technology and history- but also to
nurture the creative entrepreneurial skills each of them had by birth. Programs that
107
Kamala Balachandran, “Minding One‟s Own Business”, The Hindu, Madurai, Tamil Nadu,
December 25, 2005, p.14. 108
http://www.usfca.edu/sobam/nvc/conf/procedings.html 109
http://EntrepreneurialRoadmapweb.pdf. P.13

63
teach basic entrepreneurial skills to middle and high school students may be especially
valuable for children from disadvantaged backgrounds. At the college level,
universities need to infuse entrepreneurship and creativity more deeply into their
curricula, for both students majoring in business and those in other subjects. It finally
concluded that it was established through years of economic researches that the most
important driver of economic growth was innovation.
Thomas E.C110
(2007) stated that good education was necessary for young people,
but innovative thinking should be a part of that education and encouraged by design.
He stressed that young persons who had dreams should be saved from the shackles of
suffocating straightjacket education to think freely. He finally suggested that the
parents, universities, private business enterprise and the state should be a holistic
alliance with a hidden agenda to keep the innovative spirit burning in the brilliant
minds of your youngsters.
Amran Awang et.al,111
(2008) examined that the relationship between
personality factors and contextual factors as a means of identifying predictors of
entrepreneurial intention among Malaysian University Students. The finding provides
evidences that Malaysian students‟ belief in the self-efficacy, proactive personality and
needs for achievement capability to reinstate their entrepreneurial intention. The
finding also pointed out the role of family support should not be abandoned in fostering
the emergence of entrepreneurs. It was concluded that entrepreneurship curriculum in
Malaysian Universities should instigate those capabilities as part of the syllabus.
110
Thomas E.C, “Keeping the Fires of Innovative Spirit Burning”, The Hindu, Madurai, Tamil Nadu,
July 29, 2007, p.18 111
Amran Awang, Shaiful Annuar Khalid and Mohammad Ismail, “Personality and Contextual factors
as Determinants of Enterpreneurial Intention among Malaysian Students” 2008
64
Gallaway et.al,112
(2010) found that the students who had completed an
enterprise module at university were more likely to aim for entrepreneurship within
their careers than students who had not included enterprise in their study.
Botsaris. C and Vamvaka. V113
(2012) revealed that intention-based models of
entrepreneurship have moderate to high predictive power in explaining the
entrepreneurial behaviour. Both of the two main intention-based models reviewed in
this study, the theory of planned behaviour and the theory of entrepreneurial event, as
well as their variants, offer researchers a valuable tool for understanding the process of
organizational emergence. It was concluded that, more sophisticated models are
required in order to better understand entrepreneurial behaviors and these models need
to be tested in different entrepreneurial settings.
Reaz Uddin, Tarun Kanti Bose114
(2012) tested a causal model in context of
business students of Bangladesh to identify what determines their intentions to be an
entrepreneur. Variables like risk taking, locus of control, need for achievement,
autonomy, challenges, security of job, environment for staring business and
entrepreneurial education offered by Universities have been tested using multiple
regression model. The model results show tendency of taking risk, need for
achievement, education and environment for starting business, job security are
statistically significant in determining the intention of students where except job
security, variables are found positively related. The outcome reveals that there are few
major variables that trigger entrepreneurship and thus those factors required to be
112
http://www.hi-is/~joner/eaps/deaing2.htm p.86 113
Botsaris C and Vamvaka V., “Models of the determinants of Entrepreneurial Behaviour: A literature
Review” Regional Science Inquiry Journal, Vol. IV, (3), 2012, Special Issue, pp.155 – 172 114
Md Reaz Uddin, Tarun Kanti Bose, “Determinants of Entrepreneurial Intention of Business Students
in Bangladesh” International Journal of Business and Management; Vol. 7, No. 24; 2012

65
boosted in the education and social set up of the country. This study will immensely
help the policy maker into setting such entrepreneurship friendly education system and
social structure which will carry the development activities of the nation in upcoming
years.
Mumtaz Begam et.al,115
(2012) built on psychological model based on Ajzen‟s
theory of planned behaviour to identify the factors influencing the entrepreneurial
intention of these students. It is suggested that educational system which provides
adequate knowledge and inspiration for entrepreneurship develop the students‟
intention to perform entrepreneurial behaviours and the possibility of choosing an
entrepreneurial career might increase among young people. This study confirms the key
role of educational support in the development of entrepreneurial intention. Therefore,
the current study shows that entrepreneurship can be fostered through learning process.
Anisa Kume et.al,116
(2013) Entrepreneurship education is an important
solution to the employment difficulty of university graduates by guiding them to
organize a new business venture. Some questions are frequently posed: What are the
factors that inspire entrepreneurialism in college students in Albania? What kinds of
students are most likely to become entrepreneurs? Are male students more inclined
toward entrepreneurialism than are female students? This study investigates the
tendency towards entrepreneurship among university students in Albania. Specifically,
it aims to examine the relationship between the desire for having your own business
and family business background on university students. The survey centered around
two dimensions: entrepreneurial attitude, defined as the degree of positivity one feels
115
Mumtaz Begam Bt Abdul Kadir and Pn Munirah Bt Salim, (2012) “Factors Affecting Entrepreneurial
Intentions among Mara Professional college students” Academy of Management Journal. 23(3),
509-520 116
Anisa Kume, Vasilika Kume and Besa Shahini (2013)” Entrepreneurial Characteristics Amongst
University Students in Albania” European Scientific Journal, vol.9, No.16
66
towards the idea of becoming an entrepreneur; and motivation factors for growing their
own business. To define the entrepreneurial profile of students four traits are used:
locus of control, entrepreneurial self-efficacy, independence motive, innovation motive.
The question “What are your career expectations for the time directly after your
studies?” was asked to students in order to do a distinction between those who are
entrepreneurially disposed and those who are not. Those who responded “I'm going to
start-up my own business” are considered as potential entrepreneurs. Then, the
entrepreneurial traits of these students are compared with other students who do not
plan to start their own businesses. The study is conducted on a random sample of fourth
year university students (n = 519) from three Albanian universities. This paper argues
that it is very necessary for Albanian universities to introduce sustainable development
ideas to their entrepreneurship education and re-orientate the education objectives,
content and methodology of entrepreneurship education.
Hua Zhang and Ying Zhang117
(2013) in their study investigated the
psychological characteristics of entrepreneurship of 829 college students in China by
questionnaire. The psychological characteristics include five aspects: entrepreneurial
capacity, entrepreneurial belief, entrepreneurial consciousness, entrepreneurial
motivation, and entrepreneurial de- termination. In the five factors, the entrepreneurial
consciousness of college students is the highest, and the other four are almost at the
same level. There is significant difference on entrepreneurial belief, consciousness, and
motivation in different gender of students. Also there is significant difference on
entrepreneurial consciousness in different major students and on entrepreneurial
motivation in different degree students. However, the college students only with high
117
Hua Zhang and Ying Zhang, “Psychological Characteristics of Entrepreneurship of College Students
in China” Psychology Journal 2013. Vol.4, No.3, 159-164

67
entrepreneurial consciousness are not enough to succeed in business. The other four
psychological characteristics are not only essential to entrepreneurship, but also
necessary to their future professional development. College students should have a lot
of preparation and accumulation on the other four psychological characteristics of
entrepreneurship, and give much more effort to improve them.
Anca Draghici et.al,118
(2014), examined the strategy developed by the
European authorities regarding the improvement of the economic performance in a
knowledge- based economy has not provided the expected results. One reason for this
semi-failure is related to a shy entrepreneurial activity stimulus generated in the
member countries. In this context, the paper will show that the entrepreneurial attitude
and perception stand for an important knowledge asset. Furthermore, using linear but
also dynamic panel data analyses for the period 2007-2011, the paper demonstrates that
the entrepreneurial attitude and perception strongly influence the entrepreneurial
activity in Europe. Both the entrepreneurial attitude and the entrepreneurial activity are
measured based on an aggregate index, using Global Entrepreneurship Monitor (GEM)
data.
Fumero et.al,119
(2014), aimed to demonstrate the reliability and validity of the
attitudes to entrepreneurship test in a sample of Spanish adolescents and to detect
differences between curricular diversification and non-diversification groups. For this
study, 145 young completed entrepreneurship, personality and academic motivation
tests. Study 2 used two groups of 55 young (curricular diversification vs.
non-diversification). The results confirmed the reliability of the test; entrepreneurial
118
Anca Draghici, Claudiu Tiberiu Albulescu and Matei Tamasila, “Entrepreneurial Attitude as
Knowledge Asset: Its Impact on the Entrepreneurial Activity in Europe”, Procedia - Social and
Behavioral Sciences, Volume 109, 8 January 2014, Pages 205–209 119
Fumero A, De Miguel A, Marrero R.J and Carballeira M, “ Entrepreneurial potential in adolescents”
Personality and Individual Differences, Volume 60, Supplement, April 2014, Pages S57
68
potential was related to achievement motivation and affected by gender. Attitudes to
entrepreneurship were higher in the non-curricular diversification group for the global
score and mainly in the Leadership factor. The suitability of the scale, as a way of
measuring entrepreneurial potential in a Spanish sample, was confirmed as well as the
need for specific attention of the students in curricular diversification.
2.5 CONCLUSION
Reviews relating to entrepreneurial traits, factors influencing entrepreneurship,
achievement motivation and entrepreneurial motivation helped the researcher to
understand the various studies already conducted in this field. The reviews collected
from various sources paved the way to identify the research gap.

Chapter - III
Profile of the Study Area
CHAPTER - III
PROFILE OF THE STUDY AREA
3.0 Introduction
3.1 History
3.2 Profile of the education avenues
3.3 Economy
3.4 Agriculture
3.5 Industrial scenario in Thoothukudi
3.6 Thoothukudi port
3.7 Clusters
3.8 Role of institution in entrepreneurial development in Thoothukudi
3.9. Government of India supported programmes by the ministry of MSME
3.10 Conclusion

69
CHAPTER - III
PROFILE OF THE STUDY AREA
3.0 INTRODUCTION
Thoothukudi is known as "Pearl City" due to the pearl fishing carried out in the
town. It is a commercial seaport which serves the inland cities of Southern India and is
one of the sea gateways of Tamil Nadu. It is also one of the major seaports in India
with a history dating back to the 6th century AD. The city is believed to be of
significant antiquity and has been ruled, at different times, by the Early
Pandyas, Medieval Cholas, Later Cholas, Later Pandyas, Malbar Sultanate, Tirunelveli
Sultanate, Vijayanagar Empire, Madurai Nayaks, Chanda Sahib, Carnatic kingdom,
Portuguese, Dutch and the British. Thoothukudi was settled by the Portuguese, Dutch
and later by the British East India Company. The city is administered by a Thoothukudi
Municipal Corporation covering an area of 90.663 km (35.005 sq. miles) and had a
population of 237,830 in 2011. The Urban agglomeration had a population of 410,760
as of 2011.
Thoothukudi also known as Tuticorin is a port city and a Municipal
Corporation and an Industrial city in Thoothukudi district of the Indian state of Tamil
Nadu. The City lies in the Coromandel Coast of Bay of Bengal. Thoothukudi is the
headquarters of Thoothukudi District. It is located about 590 kilometres (367 miles)
south of Chennai and 190 kilometres (118 miles) northeast of Thiruvananthapuram
(Trivandrum). According to Confederation of Indian Industry, Thoothukudi has the
second highest Human Development Index in Tamil Nadu next to Chennai.
Thoothukudi City serves as the headquarters of Tamilnad Mercantile Bank Limited.
70
Major Educational establishments in the city includes Thoothukudi Government
Medical College, Fisheries College and Research Institute, Marine Training
Academy, V.O.C. Arts & Science College, Government Polytechnic College, and Anna
University Tuticorin Campus. Tuticorin Port is one of the fastest growing Major Ports
in India in terms of total volume of unit handled.
Majority of the people of the city are employed in salt pans, sea-borne trading,
fishing and tourism. A major attraction in the city is Our Lady of Snows Basilica, a 16th
century shrine. The 21 islands between Thoothukudi and Rameswaram shores in
the Gulf of Mannar are notified as the first Marine Biosphere Reserve of India having
around 36,000 species of flora and fauna. It is a protected area and is called as Gulf of
Mannar Marine National Park. Our Lady of Snows Basilica festival celebrated annually
during August and the Shiva temple festivals like Adi Amavasai, Sasti and Chittirai
chariot festivals are the major festivals of the area. Roadways are the major mode of
transport to Thoothukudi, while the city also has rail, air and sea transport.
3.1 HISTORY
Thoothukudi is one of the major seaports in India with its history dating back to
the 6th century A.D. Traditionally known as “Pearl City” on account of the prevailing
pearl fishing in the area, Thoothukudi has had a fascinating history. It forms part of the
Pandiyan kingdom between 7th
and 9th
century A.D. Thoothukudi remained in the
hands of the Cholas during the period between 9th
and 12th
century. Emergence of
Thoothukudi as a maritime port attracted travellers, adventures, and eventually
colonists. The Portugese were the first to arrive in Thoothukudi in 1932 A.D followed
by the Dutch in 1958 A.D. The English captured Thoothkudi from the Dutch in 1782
and the East India Company established their control over Thoothukudi in the same

71
year. The Thoothukudi district has given India many great freedom fighters, like the
great poet Subramanya Baharathi, V.O.Chidambaram Pillai, Oomaithurai,
Veerapandiya, Kattabomman, Vellaiyathevan, Veeran Sundaralingam etc. From this
Port only V.O.Chidambaram Pillai sailed the first Indian Swadesi Steamer S.S.Gaelia
on 1st June 1907.
Tuticorin (Thoothukudi) is also known by the name 'Thiru mandira Nagar'. It is
also called as "Sea Gateway of Tamil Nadu". Thoothukudi is part of the Pearl Fishery
Coast, and is known for its pearl fishing and ship building industries. Thoothukudi was
the seat of Portuguese during 16th
century, and the Dutch occupied in 17th
century.
During 18th
century the British overpowered and occupied the town. Being a port town,
the town received attention from the rulers for improving their trade, and so it was
brought to Municipal status in 1866.
On the 20th
October 1986, a new district carved out of the erstwhile Tirunelveli
district was born in Tamil Nadu and named after V.O.Chidambaranar, a great national
leader hailing from Ottapidaram who led the Swadeshi Movement in the South. Since
1997 as in the case of other districts of Tamil Nadu, this district has also been named
after its headquarters town, Thoothukudi.
Thoothukudi became the citadel of freedom struggle in the early 20th
century.
It was in Thoothukudi that the illustrious patriot, V.O.Chidambaram established the
first Swadesi Stream Navigation Company, sailing the first steamer S.S.Gaelia to
Thoothukudi on 1st June 1907.
The minor port of the Thoothukudi anchorage port with lighter age facilities has
had flourished traffic for over a century. The first wooden Jetty of this port was
commissioned in 1864. This port was being used for export of salt, cotton yarn, senna

72
leaves, palmyrah stalks, palmyrah fibers, dry fish, country drugs etc. to neighboring
countries and for import of coal, cotton, copra, pulses and grains. The minor port of the
Thoothukudi had the distinction of being intermediate port handling the highest traffic
tonnage of over 1million per annum.
The major harbour of Thoothukudi is well known as a pearl diving and fishing
centre. It is one of the oldest seaports in the world and was the seaport of
the Pandyan kingdom after Korkai, near Palayakayal. It was later taken over by
the Portuguesein 1548, captured by the Dutch in 1658, and ceded to the British in 1825.
The lighthouse built in 1842 marked the beginning of the history of harbour
development in the city.
3.1.1 Location
Thoothukudi district, the study area, is situated in the extreme South Eastern
corner of Tamil Nadu state and bounded on the north by the districts of Tirunelveli,
Viruthunagar and Ramanathapuram, on the East and South East by Gulf of Mannar and
on the west and south west by the district of Tirunelveli. The district of Thoothukudi
was carved out as a separate district on 20th
October 1986 as a result of bifurcation of
the Tirunelveli district of Tamil Nadu State.

73
Figure 3.1
District Map
The salient features of the district include its lengthy, curvy and scenic sea coast
which was an international cynosure in the days of yore for its pearl fishery; beautiful
coastal villages with their sacred temples, churches and mosques like Tiruchendur,
Manappadu and Kayalpattinam respectively, Adhichanallur, one of the cradles of the
ancient civilizations, Korkai, an ancient port of the Sangam Pandyas, Kayal, the
confluence of the river Tamiraparani with the Bay of Bengal, one of the five illustrious
rivers of Tamilnadu.
Panchalamkurichi, the capital of Veerapandiya Kattabomman, an early martyr,
for the cause of freedom, Ettayapuram, the birth place of the great poet Subramanya
Bharathi, Ottapidaram the home town of V.O.Chidambaram Pillai, who dared to sail
74
ships as a measure to combat British imperialism; Maniyachi, where Vanchinathan
assassinated Ashe, the British Collector for this high handedness against the leaders
during Swadeshi Movement; Kulasekarapattinam and Kurumbur where patriots showed
their anger against alien rule.
Temple towns like Srivaikundam, Meignanapuram, one of the cradles of
Christianity, Thoothukudi, besides being a major port, the earliest settlement of the
Portuguese and the Dutch, the tall and dense palmyra groves and the bushy Odai trees,
the Teris and the adjacent coral islands, Idayankudi and Manappadu and the adjacent
places which became the headquarters of great missionaries like G.U.Pope,
Veeramamunivar, Caldwell and others who, besides their missionary work, contributed
a lot for the development of Tamil language and literature and above all the
enterprising and hardworking people who now constitute a major trading community in
the State.
3.2 PROFILE OF THE EDUCATION AVENUES
Education began in the earliest prehistory, as adults trained the young of their
society in the knowledge and skills they would need to master and eventually pass on.
In pre-literate societies this was achieved orally and through imitation. Story-telling
continued from one generation to the next. As cultures began to extend
their knowledge beyond skills that could be readily learned through imitation, formal
education developed.
Education in its general sense is a form of learning in which the knowledge,
skills, and habits of a group of people are transferred from one generation to the next
through teaching, training, or research. Education frequently takes place under the
guidance of others, but may also be autodidactic. Any experience that has a formative

75
effect on the way one thinks, feels, or acts may be considered educational. Education is
commonly divided into stages such as preschool, primary school, secondary school and
then college, university or apprenticeship.
There are numerous educational institutions, Polytechnic Colleges, schools in
and around Thoothukudi giving quality education. Thoothukudi district has high
literacy rates and lower literacy rate gap between males and females. Thoothukudi
district schools usually scores high honours during board examinations.
3.2.1 Pre School
Preschools provide education up to the age of between 4 and 8 when children
enter primary education. Preschool education is important because it can give a child
the edge in a competitive world and education climate. While children who do not
receive the fundamentals during their preschool years will be taught the alphabet,
counting, shapes and colors and designs when they begin their formal education they
will be behind the children who already possess that knowledge. There are several
preschools in Thoothukudi district.
3.2.2 Primary School
Primary (or elementary) education consists of the first 5–7 years of formal,
structured education. In general, primary education consists of six or eight years of
schooling starting at the age of five or six, although this varies between, and sometimes
within, countries. There are 1076 primary schools in Thoothukudi district.
3.2.3 Secondary School
In most contemporary educational systems of the world, secondary education
comprises the formal education that occurs during adolescence. It is characterized by
76
transition from the typically compulsory, comprehensive primary education for minors,
to the optional, selective tertiary, "post-secondary", or "higher" education
(e.g. university, vocational school) for adults. Depending on the system, schools for this
period, or a part of it, may be called secondary or high schools, gymnasiums, lyceums,
middle schools, colleges, or vocational schools. There are 284 middle schools, 73 high
schools, 97 Higher Secondary Schools in Thoothukudi district to nurture the students to
develop good human resource.
3.2.4 Higher Education
Higher education, post-secondary education, tertiary education or third level
education is an optional final stage of formal learning that occurs after secondary
education. Often delivered at universities, academies, colleges, seminaries, and
institutes of technology, higher education is also available through certain college-level
institutions, including vocational schools, trade schools, and other career colleges that
award academic degrees or professional certifications.
3.2.5 Engineering College
Teaching engineering is teaching the application of scientific, economic, social,
and practical knowledge in order to design, build, maintain, and improve structures,
machines, devices, systems, materials and processes. It may encompass using insights
to conceive, model and scale an appropriate solution to a problem or objective. The
discipline of engineering is extremely broad, and encompasses a range of more
specialized fields of engineering, each with a more specific emphasis on particular
areas of technology and types of application. Engineering disciplines include:
aerospace, biological, chemical, computer, electrical, industrial, and mechanical. In
Thoothukudi there is a Government Engineering college affiliated to Anna University
77
on the highway to Tirunelveli, and many private engineering colleges are there in the
district.
3.2.6 Agricultural College
The Agricultural College and Research Institute, Killikulam was established in
1984 – 85 as the third constituent College of Tamil Nadu Agricultural University. At
the beginning, the College started functioning in rented building of MDT Hindu
College, Pettai in Tirunelveli. Subsequently, after the acquisition of land and buildings
from the State Seed Farm, Killikulam, a part of the educational activities was shifted to
Killikulam during 1986–1987. Consequent on the completion of hostel buildings, entire
academic activities were shifted to Killikulam campus from 01.11.1989.The institution
was upgraded as Agricultural College and Research Institute in 1989. The college was
also upgraded as a Post-graduate teaching institute from November 1990. The first
batch of B.Sc. (Ag.), graduates passed out in 1988. The institution was made into a co-
education institution from 1990–1991.
3.2.7 Arts and Science Colleges
While the passion for professional courses continue, arts and science colleges
have a two-pronged strategy as the transition to an exciting future – they are creating
new career oriented courses and industry-linked research opportunities even as they
tout the value of a holistic liberal arts education that offers the life skills needed for
success. In Thoothukudi district there are eighteen arts and science colleges which
provide under graduate and post graduate courses in different disciplines and equip
their knowledge in their discipline.

78
3.2.8 Polytechnic
One of the distinguishing features of polytechnic education is the strong emphas
is on practice-based learning. A polytechnic education also opens doors to a
professional career and other avenues for career advancement. In this district several
polytechnic colleges are offering several courses.
3.2.9 Fisheries College
Fisheries College and Research Institute (FCRI) initially started as Fisheries
College was established in the year 1977 as a constituent unit of Tamil Nadu
Agricultural University at Thoothukkudi, a famed town for Pearl fishing. Thereby it
became the first college in the state of Tamil Nadu and the second one in India
(after College of Fisheries, Mangalore) to offer the Bachelor of Fisheries
Science (B.F.Sc) degree in India. Tamil Nadu is endowed with a long coast line
(1076 kms) and innumerable number of tanks, village ponds and several rivers. All
these water resources have been providing much needed fish to people of the state.
More than one million fishermen are engaged in catching and supplying much needed
fish to the populations.
FCRI functions from four campuses. The Main Campus of FCRI is about 10 km
away from the city of Thoothukkudi and is spread over an area of 24 ha which is
accessible through the Harbour bypass road. The Shore Laboratory Campus is
separated from the main campus by a distance of 11 km, and is located within the
Fishing Harbour Complex, Thoothukkudi over an area of 0.4 ha and is connected by
the North Beach Road. Maritech Research & Extension Center is located on the
outskirts of Tharuvaikulam, a fishing village which is 25 km away from the main
campus, and facilitates research on marine culture activities. It is accessible through the

79
familiar East Coast Road that runs along the coast of Tamil Nadu. There is a separate
campus for residential purposes housing the staff quarters and hostel in an area of 1 ha
which is 3 km away from the main campus and is located at the Teachers Colony,
Thoothukkudi.
'Bachelor of Fisheries Science' (B.F.Sc) is a four year course, The post graduate
degree Master of Fisheries Science (M.F.Sc) is a two year course offered in 10
disciplines, The Doctor of Philosophy (PhD) is a three year course offered in 4
displines and one year Post-graduate Diploma is offered in Fish Quality Management
and Business management in Animal and Fisheries Sciences.
3.2.10 Medical College
There is also a Government Medical college and Hospital. The colleges are
affiliated to the Manonmaniam Sundaranar University in Tirunelveli. The city has
Government Medical College Hospital and new ESI Hospital is being constructed at
the Bypass road.
The Thoothukudi Government Medical College was started functioning from
16.08.2000. In this college, Non-Clinical and Clinical departments are functioning.
Sanction has been given for admission of 100 students for M.B.B.S. course every
academic year from the year 2000-2001.
In Thoothukudi Government Medical College Hospital, departments such as
General Surgery, Plastic Surgery, General Medicine, Ophthalmology, ENT, Paediatrics,
Anaesthesia, Dermatology, Thoracic Medicine, Psychiatry, Obstetrics and
Gynaecology, Orthopaedics, Radiology, Radiotherapy, Physical Medicine, Dentistry,
Neuro Surgery, Neuro Medicine, Onco Surgery, Physiotheraphy, Paediatric Surgery,
80
Urology Surgery, Gaestro Enterology are functioning. Ten Operation Theatres are
available in this hospital. The medical equipments are available in this institution.
3.2.11 Industrial Training Institutes
Industrial Training Institutes which provide training in technical field and
constituted under Directorate General of Employment & Training (DGET), Ministry of
Labour & Employment, Union Government of India. Normally a person who has
passed 10th
standard (SSLC) is eligible for admission to ITI. The objective of opening
of ITI is providing technical manpower to industries. These persons are trained in basic
skills required to do jobs of say operator or a craftsman. The course in ITI is designed
in way to impart basic skill in the trade specified. The duration of course may vary
from one year to three years depending upon trade opted. There are three Industrial
Training Institutes runs in the district.
3.3 ECONOMY
Salt pans in and around the city contribute mainly to the economy of the city.
The salt pans produce 1.2 million tonnes of salt every year, contributing to 90 per cent
of the salt produced in the state and 50 per cent needed by the chemical industries of
the state. The other major industries are shipping, fishing, agriculture, power and
chemical industries. Fishing is one of the largest contributors to the local economy.
Tuticorin Fishing Harbour is one of the oldest and largest in Tamil Nadu. The Tuticorin
Thermal Power Station has five 210 megawatt generators. The first generator was
commissioned in July 1979. The thermal power plants under construction include the
coal-based 1000 MW NLC TNEB Power Plant. In addition to this there are several
private power plants like Ind Barath Power Limited, Coastal Energen, Sterlite
Industries Captive power plant. Southern Petrochemical Industries Corporation,
81
Tuticorin Alkali Chemicals, Heavy Water Board Plant, Sterlite Industries, Venus Home
Appliances, Madura Coats and Mills, Dhrangadhra Chemical works, Kilburn
Chemicals, Nila Sea foods, Diamond Sea foods, Maris Associates, VVD Coconut oil
mill, AVM oil mill, Wartsila India Pvt Ltd, OEG Pvt Ltd, Ramesh flowers, Agsar
Paints, Tuticorin Spinning Mills Ltd and KSPS Salts are some of the small scale and
large scale industries in the town. Thoothukudi is the headquarters of Tamilnad
Mercantile Bank Limited. It is one of the fastest growing banks in India during the
period of 2007-12. Its total business is worth 390 billion. The bank targets a Total
Business of 500 Billion INR in 2014-15. Thoothukudi also has a research institute set
up by Central Marine Fisheries Research Institute and a Spices laboratory set up
by Spices Board of India.
Thoothukudi also has a State Industries Promotion Corporation of Tamil
Nadu, Industrial Estate and SIDCO's Industrial Estate which comprises several Small
scale and Medium scale Industries. Tuticorin is the end point of the proposed Madurai-
Tuticorin Industrial Corridor. The study for this Corridor was completed by the
Government of Tamil Nadu recently. The Corridor would consist of four manufacturing
regions, one agri-business region, two business investment regions, a special tourism
zone, one rural tourism hub and one knowledge hub. The government estimates that
this Corridor would attract 1,90,000 crore industrial investment over a period of 10
years. The State Government recently formed a Special Purpose Vehicle (SPV) for
Speedy implementation of the Project.
3.4 AGRICULTURE
Agriculture is the main occupation on which 70 per cent of the people depend
on. The main food crop in this district is paddy. Out of the total area 470724 hectares,

82
178083 hectares are brought under the cultivation of different crops which of nearly 38
per cent of total area of the district. The important food crops in the district are paddy,
cholam, kambu, Ragi, Varagu, Samai and commercial the important crops like Cotton,
Chilly, sugarcane and Groundnut.
3.5 INDUSTRIAL SCENARIO IN THOOTHUKUDI
The district constitutes 70 per cent of the total salt production of the state and
meets 30 per cent requirement of our country. There are two Industrial Estates one at
Kovilpatti with 11 units and the other at Thoothukudi with 20 units. The former is
managed by SIDCO and the latter by SIPCOT. There are 2,200 and above Small Scale
Industries registered in the district and about 12 major industries. They are engaged in
the production of cotton and staple yarn, caustic soda, PVC resin, fertilizers, soda-ash,
carbon dioxide gas in liquid form etc., Some of the major industries are SPIC, TAC,
Dharangadhara Chemical Works, Loyal Textails Ltd., Madura coats Ltd., Sterlite
Copper Industries, Kilburn Chemicals, Ramesh Flowers, Nila sea foods, Deva and Co.,
and Transworld Granite Industries. Tata steel recently announced plans to set up a
Titanium dioxide project in Thoothukudi. Four national brand products are made in
Thoothukudi they are VVD Coconut Oil, Agsar Paints, BIO Food Ltd. Hip Tea &
Genkii Tea (Herbal Tea) and Venus Water Heaters.
The important public sector undertakings in this district are the Thoothukudi
Thermal Power Station unit of the Tamil Nadu Electricity Board, Heavy Water Plant
(HWP) and Port Trust. During this year 1,128 vessels entered this port and cargo to the
tune of 12.13 lakhs tonnes was handled. Thoothukudi port has been issued the
prestigious ISO-9002 certificate for the port operation and services and has joined the
select group of World ports by becoming the first Indian major port to get such
83
certificate. The Central Government is considering the construction of Titanium and
Zirconium Sponge Plant, which comes under the control of Department of Atomic
Energy at Palayakayal village of Srivaikundam Taluk. The District Industries Centre
and the Tamil Nadu Industrial Investment Corporation are catering to the needs of the
small and large scale industries in this district.
3.5.1 Large and Medium Scale Industries in Thoothukudi District
Travancore Chemical and Manufacturing Co. Ltd produces Sulphate and
alumina ferric, Alkali Chemicals and Fertilizers Ltd., produces Soda Ash (Heavy
chemicals), ammonium chloride (Fertilizers) and Southern Petro Chemical Industries
Corporation Ltd., (SPIC) produces Urea, DAP, aluminium fluoride etc. which are
situated in Thoothukudi block. Dharangadara Chemical works Ltd., in Sahupuram
produces Caustic soda, liquid chlorine, tri-chloro-ethylene, upgraded illuminate and PV
Resin, Shantha Marine Bio Technologies Pvt. Ltd produces Pharmaceuticals (Beta
Carotene) which are situated in Thiruchendur block. Lakshmi Mills Co. Ltd, Loyal
Textile Mills Ltd and The Bharathi Co-op spinning mills Ltd., produces Yarn and cloth
which is situated in Kovilpatti block. Cotton yarn and threads are produced in Tuticorin
spinning mills and Madura Coats Ltd and Arasan Textile Mills Pvt ltd which are
situated in Thoothukudi block. Heavy water plant and Thermal power station is situated
in Thoothukudi block. Copper smelting/ Copper anodes are produced in Sterlite
Industries Thoothukudi. Kilburn chemicals in Thoothukudi block produces Titanium Di
Oxide. Garnet Abrasives are produced in Transworld Garnet India pvt Ltd., in
Thoothukudi block.
84
3.5.2 Non Farm Sector
Non-farm sectors in Alwarthirunagari proposed to produce Bakery products,
Leather goods, readymade garments, country bricks, etc. Wooden toys, stone crusher,
wax candle readymade garments, bricks etc. are proposed to produce in Karungulam.
Bakery, readymade garments, flour mills, masala powder, jewellery etc. are proposed to
produce in Kayathar. Non-farm sector in Kovilpatti proposed to produce match
industries, candles, power loom, bakery etc. Match Factory, readymade garments,
Fabrication of grills and gates, etc. are proposed to produce in Ottapidaram. Charcoal
manufacturing, match factory Appalam and masala powder, etc. are proposed to be
produce in Pudur. Plastic wire, leather goods, timber works, Country bricks, flour mills,
limestone works, etc. are proposed to be produce in Sattankulam. In Thiruchendur, Salt
pans, coir fibre, readymade garments Palmyra products are proposed to produce.
Palmyra products, readymade garments, timber sawing, jewellery, etc. are proposed to
produce in Udangudi. Salt panes, coconut oil, leather goods, dry flower, masala
powder, etc. are proposed to produce in Thoothukudi. Non-farm sector in Vilathikulam
produce matches, handloom/power loom, leather goods etc.
3.5.3 District Industrial Possibilities Location Analysis
Banana powder, Banana based products, fruits and vegetable processing
industries are the proposed industrial sectors in Srivaikuntam, Tiruchendur, Kovilpatti,
Vilathikulam. Dehydration of drumsticks and oil from dry seeds of drumsticks is the
proposed industrial sector in Sathankulam and Vilathikulam. Poultry and Cattle feed,
Sea food Industry, Chemical Industries, Mechanical boats/ small ships building units,
are the proposed industrial sectors in Thoothukudi.` Extraction, refining of edible oils
in Kovilpatti and Karungulam, Oleoresin and spice oils, spice based products in

85
Vilathikulam, Kovilpatti, Thoothukudi are the proposed industrial sectors. Meat
processing industry is the proposed industrial sector in Pudur, Vilathikulam. Textile
based industry, Readymade Garments in Ottapidaram, Kovilpatti, Thoothukudi block.
Coconut based products, Palmyrah based products, Mini Cement Plant are the proposed
industrial sectors in Udangudi and Sathankulam. Flyash/ Chamber bricks in
Karungulam and Cold storage unit in Srivaikundam, Tiruchendur, Vilathikulam blocks.
Dhall milling, Mini Modern Rice Mill, are the proposed industrial sectors in
Thoothukudi, Srivaikundam, Tiruchendur, Vilathikulam, Ottapidaram, Kovilpatti
blocks.
3.5.4 Potential and Viable Projects Under MSME – Blockwise
In Thoothukudi block the following projects are considered potential and viable
under MSME. They are; Sea food industry, sea weeds cultivation, pearl oyster culture,
salt industries, chemical industries, poultry and cattle field, spice based products,
readymade garments, mechanical boats / small ships building units, pulses processing,
dhall mills, coconut oil, masala powder, dry flowers, senna leaves processing, bakery
products, poly bags, general engineering, processing and canning of gherkins etc.
The following viable projects are considered viable under MSME in Kovilpatti
block. They are; Match industries, power loom, cereals and pulses processing, masala
powder, processing of herbals, readymade garments, printing press, bakery products,
vermicelli, etc.
In Thiruchendur block the following projects are considered viable under
MSME. They are; Value added products from banana, palmyrah products, cashew nut
processing, extracting oil from cashew kernals, prawn culture, sea weeds cultivation,
salt industries, sea food industries, bakery products, mini modern rice mills, etc.

86
The following projects are considered viable under MSME in Alwarthirunagari
block. They are; Modern rice mills, processing of pulses and cereals, banana products,
bio fertilizers, bakery products, cattle feed, readymade garments, country/ chamber
bricks, vermicelli, etc.
In Srivaigundam block the following projects are considered viable under
MSME. They are; Country bricks, Modern rice mills, banana products, flour mills, lime
stone works, dry flowers, cold storage, coconut oil, coconut coir, waste pith processing
units, gherkins processing units, fruits and vegetables processing units, etc.
The projects considered viable in Udangudi block under MSME are as follows.
Coconut based products, Palmyrah based products, timber sawing, jewellery works,
Modern rice mills, readymade garments, value added products from drumstick, fish
processing, activated carbon, etc.
In Karungulam block the following projects are considered viable under
MSME. Chamber bricks, stone crusher, wooden toys, wax candle, readymade
garments, products from banana, guava and mango pulp producing units, cereals and
pulses processing, dry flowers, bio fertilizers, modern rice mills, cold storage, etc.
The following projects are considered viable under MSME in Sathankulam
block. They are Value added products from drumstick, cashew nut processing, leather
goods, timber works, pappads, noodles, cattle field, palmyrah based products, bakery
products, etc.
In Kayathar block the following projects are considered viable under MSME.
They are Bakery products, readymade garments, flour mills, masala powder, herbal

87
products, aloevera gel, gherkins processing units, pulses processing, senna leaves
processing, dyes from flower extract, etc.
The following projects are considered viable under MSME in Ottapidaram
block. They are; Salt refinery, readymade garments, tomato processing, herbal
products, curry leaf powder manufacturing, gherkins processing units, aloe vera gel,
roller flour mills, cold storage, sea weed cultivation, etc. In Pudur block the following
projects are considered viable under MSME. They are; Charcoal manufacturing, match
factory, masala powder, cereals and pulses processing, oleoresin extraction units, etc.
The following projects are considered viable under MSME in Vilathikulam
block. They are; Match factory, handloom/power loom, charcoal manufacturing,
masala powder, oleoresin extraction, iodised salt manufacturing, coastal aqua culture,
value added products from amla etc.
3.6 THOOTHUKUDI PORT
One of the various infrastructural facilities, which contribute towards
development of fisheries in general, and marine products export in specific in
Thoothukudi district is the port of Thoothukudi. This port, a major gateway for India‟s
international trade from the sourthern region, is located on the South Eastern coast of
India adjoining the Gulf of Mannar of the state of Tamil Nadu about 600 km., south of
Chennai.
The natural harbour with a rich hirer land activated the development of the port
initially with wooden pies and it was declared as a minor anchorage port in 1868. The
marine port of Thoothukudi, an anchorage port with litharge facilities has had
flourishing traffic for over a century. This port was being used for export of salt, Cotton

88
yarn, sonar leaves, palmyrah stalks, Palmyra fibers, dry fish, country drugs and other
products, to neighboring countries and for import of coal, cotton, copra pulses and
grains.
Thoothukudi became the citadel of the freedom struggle in the early 20th
century. In 1906, one of the greatest freedom fighters of India, Mr. V.O.Chidambaram
Pillai, launched the first Swadeshi “S.S Gaelia” in British India, After Independence;
the minor port of Thoothkudi witnessed a flourshing trade and handled a variety of
cargo meant for the neighbouring countries of Srilanka, Maldives etc, and the coastal
regions of India.
In 1969 the Government of India sanctioned a project for the development of a
major port of Thoothukudi for handling ships of 9.14 km (30‟) draft. An artificial
harbour was constructed within a break water system projecting into the sea for about 4
km and Thoothukudi port became the 10th
major port of India in July 1974. The minor
port of Thoothukudi was merged with the newly commissioned major port in 1979. The
capacity of the port is 20.75 million tonnes and it handled 21.48 million tonnes.
Thoothukudi port is an artificial deep-sea harbour formed with rubble mound
type parallel breakwaters projecting into the sea for about 4 Kms., (Length of North
breakwater is 4098.66 m. length of South breakwater is 3873.37 m and the distance
between the breakwaters is1275m). The port was designed and executed entirely
through indigenous efforts. The harbour basin extends to about 400 hectares of
protected water area and is served by an approach channel of 1450 meters length and
183 meters width1.
1http://www.investingintamilnadu.com/tamilnadu/infrastructure/tuticorin_port_profile.php
89
3.6.1 Shipping Agencies
The informal service of shipping agency which existed at the time of emergence
of Thoothukudi as a port even in A.D. Loading and unloading of cargo was done
manually from the thonies. The informal service continued even after constructing the
jetties in 1894. After independence planned development took place to improve
Thoothukudi harbour and garnishing the prospects of the trade, any families who were
involved in the trade realized the need for dedicated man power for efficiently loading
and unloading the cargo formed informal agencies. They also realized the need for
systematic support service for the ships sailing and reaching the harbour. The smaller
groups grew into 9 at the time when Thoothukudi port was declared as a major port in
the year 1974.
The special features of this all weather port are round the clock operation
navigation, Anchorage operation for lightening cargo, fourteen alongside berth,
adequate warehousing and storage facility, modern cargo handling equipments to
handle variety of cargo, good rail road connectivity for seamless transportation,
integrated computerized system, EDI network, quick turn round of vessels and cordial
industrial relations.
3.6.2 Marine Products
India with a long coast line of 8129 Km, 2 million sq. Km of Exclusive
Economic Zone and 1.2 million hectors of brackish water bodies, offer vast potential
for development of fisheries. Against an estimated potential of 3.9 million tonnes from
marine sector, only 2.6 million tones are tapped. Fishing efforts are largely confined to
the inshore waters through artisanal, traditional and mechanised sectors. The major
marine products exported from the state include Frozen Shrimp, Prawn, Fish, Cuttle

90
Fish, Squid, Dried Items like Shrimp, Shark Fins, Cuttle Fish Bones,Fish Maws,
Canned Shrimps, Fish, Lobster, Crab, Clam, Mussel, Squid Tubes, Aquarium fishes,
Fresh fish, and others.
3.6.3 Marine Product Export
There are four distinct channels by which fish is marketed in the country. They
are Local Fresh Fish Trade, Processed Fish Trade, Export Trade, and Domestic urban
Trade. Exports of marine products have played a key role in developing the fishing and
aquaculture sectors in India and this makes the fishery sector a key player in poverty
alleviation and employment. India has a share of 2.58 per cent of the world seafood
export trade. In terms of shrimp production India occupies the fifth position in the
world and it is the top most suppliers of cephalopods to Europe. Aquaculture
contributes 19 per cent by volume and 55 per cent by value of total seafood exports
whereas farmed shrimp contributes 61 per cent by volume and 83 per cent by value of
the shrimp exports2.
3.6.4 Seafood Exports
Till the end of 1960, export of Indian marine products mainly consisted of dried
items like dried fish and dried shrimp. Although frozen items were present in the
export basket from 1953 onwards in negligible quantities, it was only since 1961 the
export of dried marine products was overtaken by export of frozen items leading to a
steady progress in export earnings. With the devaluation of Indian currency in 1966 the
export of frozen and canned items registered a significant rise. Frozen items continued
to dominate the trade. Markets for Indian products also spread fast to developed
countries from the traditional buyers in neighboring countries.
2MPEDA News letter, Cochin, 2012.
91
3.7 CLUSTERS
Thoothukudi district has the possibilities of cluster development in the
following industries.
3.7.1 Salt industry
3.7.2 Readymade garments
3.7.3 Handmade matches
3.7.4 Fish processing/Fish based products
3.7.1 Salt Industry
Salt industry is the main backbone of economic development of the district. It is
the cluster group of industry of Thoothukudi district and was extended in an area of
15700 Acres with production of 17.12 Lakhs M.T. Thoothukudi district is endowed
with a coastal line of about 121 Kms and territorial waters covering thousands of
Hectares. During the survey it is reported that 2208 Units are engaged in salt
production. The total area found viable for salt cultivation is about 40,000 Acres.
Further it is reported from the survey 126 permitted iodised salt plants and 4 refined
free flow iodised manufacturing units are functioning and produce about 70,000 M.T
per Annum. The concentration of salt unit is centered on Thoothukudi, Srivaikundam
and Thiruchendur Taluks. Also a considerable number of salt units are clustered in
Vilathikulam block. There are about 2000 small scale salt manufactures and traders
in Thoothukudi district
3.7.2 Readymade Garments
Puthiamputhur is one of important village involved in manufacturing ready-
made clothes. The clothes are sent all over Tamil Nadu and even to several parts of
92
India like Mumbai. It provides employment for more than 1500 people mostly hailing
from near villages.
3.7.3 Hand Made Matches
There are about 1100 handmade safety matches manufacturing units available
in Thoothukkudi District. These units are mostly clustered in Kovilpatti and
Villathikulam taluks. These clusters provide employment to about 30,000 persons.
3.7.4 Fish Processing / Fish Based Products Cluster
Thoothukkudi District is blessed with a coastal line of 121 Kms. and fisheries,
fish processing is the ancient and traditional industry. The fisherwomen of this district
can be formed into groups and they can be trained in activities like fish processing,
value added fish products. The Fisheries College and Research Institute,
Thoothukkudi imparts high profile training to the willing entrepreneurs and women
SHGs in value added fish products, ornamental fish culture etc., There is a good scope
in Thoothukkudi District for this cluster which has an excellent market potential.
3.8 ROLE OF INSTITUTION IN ENTREPRENEURIAL DEVELOPMENT IN
THOOTHUKUDI
3.8.1 District Industries Centre
The District Industries Centers programme was launched on May 1, 1978, with
a view to providing an integrated administrative framework at the district level, which
would look at the problems of industrialisation in the district, in a composite manner. In
other words District Industries Centers is the institution at the district level which
provides all the services and support facilities to the entrepreneurs for setting up small
and village industries. DIC identification suitable schemes for SSI units, preparation of

93
feasibility reports, arranging for credit, machinery and equipment, provision of raw
materials and other extension services are the main activities undertaken by these
centers. Broadly DICs are trying to bring change in the attitude of the rural
entrepreneurs and all other connected with economic development in the rural areas.
The important objectives of DICs are as follow :
i) Accelerate the overall efforts for industrialisation of the district.
ii) Rural industrialisation and development of rural industries and
handicrafts.
iii) Attainment of economic equality in various regions of the district.
iv) Providing the benefit of the government schemes to the new
entrepreneurs.
v) Centralisation of procedures required to start a new industrial unit and
minimisation - of the efforts and time required to obtain various
permissions, licenses, registrations, subsidies etc.
The main functions of District Industries Center are as follows.
Acts as the focal point of the industrialisation of the district.
Prepares the industrial profile of the district
Statistics and information about existing industrial units in the district in
the large, Micro, Medium, small as well as co-operative sectors.
Opportunity guidance to entrepreneurs
Compilation of information about local sources of raw materials and
their availability.
Manpower assessment with respect to skilled, semi-skilled workers.

94
Assessment of availability of infrastructure facilities like quality testing,
research and development, transport, prototype development, warehouse
etc.
Conducting Motivation campaigns.
Counseling and guiding the entrepreneurs
Issuing Part I EM Acknowledgements to micro, small and medium
enterprises by manual and online.
Issuing Part II EM Acknowledgements to micro, small and medium
enterprises which commenced production by manual and online.
Conducting Single Window Committee Meeting periodically to get the
clearances fast from different agencies like TNEB, local body etc.,
Preparing technical feasibility report, whenever the financial institution
ask for.
Issuing registration certificate for Cottage Industries
Issuing registration certificates for Handicrafts Industries
Conducting task force committees to select the beneficiaries under
Prime Minister‟s Employment Generation Program (PMEGP) for the
unemployed youth, to set up manufacturing and service industries by
tying up with financial institutions for loan assistance with subsidies.
Conducting task force committees to select the beneficiaries under
Unemployed Youth Employment Generation Program (UYEGP) for the
unemployed educated youth, to set up manufacturing, service and
business enterprises by tying up with financial institutions for loan
assistance with subsidies.

95
Giving incentives such as state capital subsidy, LTPT power tariff
subsidy, generator subsidy, VAT subsidy etc., to Micro and Small
enterprises in Thoothukudi district
Conducting entrepreneur development program at selected institutes for
the probable entrepreneur.
Conducting seminars, workshops, etc., on industrial development and
related subjects.
Formation of industrial co-operatives societies
Recommending the industries for district level and state level awards
Identifying the sick units and assisting them, through district sick units
declaration committee.
Assisting the Micro, Small and Medium enterprises to get their long
pending dues from their borrowers through regional industrial
facilitation council. Assisting SC/ST entrepreneur under twenty point
programme.
Conducting regular meeting with local SSI association to solve any
particular problem.
Assisting the banks in recovering the dues from the PMRY /PMEGP/
UYEGP beneficiaries by conducting regular recovery campaigns
Associating with various Department / Government agencies like
TAHDCO, TABCEDCO etc., for the upliftment of the entrepreneur
belonging to the socially weaker sections

96
Identifying and developing cluster of industries under cluster
development programme
Operating Export Guidance and promotion Cell in District Industries
Centre, Thoothukudi to provide guidance to develop exports of various
products manufactured by Industries
3.8.2 National Skill Development Corporation
National Skill Development Corporation (NSDC), which was formed under the
Ministry of Finance, is one of its kind public-private partnership with 51 per cent equity
held by private sector and the balance 49 per cent by the Union Government. Formed in
2010, NSDC is a professionally run not-for-profit company that includes 39 sector skill
councils and 136 training partners with over 2500 training centres spread across 366
districts in the country. NSDC is mandated to provide skill to 150 million Indians by
2022.
3.8.3 State Industries Promotion Corporation of Tamilnadu
State Industries Promotion Corporation of Tamilnadu Ltd (SIPCOT) was
established in the year 1971 to develop industrial growth in Tamilnadu. To give main
thrust to area development activities, the organization involves in the formation of
industrial complexes by providing basic and comprehensive infrastructure facilities for
the industries to set up their units. SIPCOT has so far developed 20 Industrial
Complexes in 12 districts and Six Sector Specific Special Economic Zones (SEZs)
across Tamil Nadu. SIPCOT also acts as a Nodal Agency of Government of Tamil
Nadu in the sanction / disbursement of Structured Package of Assistance to large
industrial units.
97
3.8.4 Entrepreneurship Development Institute
Established in 2001, the Entrepreneurship Development Institute (EDI),
Chennai is an apex organisation in the field of entrepreneurship education and self-
employment promotion in the state of Tamil Nadu. Entrepreneurship Development
Institute, Chennai (EDI) was constituted by Government of Tamil Nadu and is
administered by Department of Micro, Small and Medium Enterprises (MSME). EDI
has embarked on a multipronged strategy to be executed in the next few years which
involves a series of programs to be introduced with the objective of promoting
Entrepreneurship in Tamilnadu.
The different training programs which are provided by the department will
certainly help the individuals who have an ambition to start their own enterprise and
thereby follow their dreams. EDI is partnering with the best HR and training companies
in the country to deliver these programs. These companies have experienced trainers in
specific domains who will be able to deliver the programs in an effective manner.
3.9 MINISTRY OF MICRO, SMALL AND MEDIUM ENTERPRISES
Micro, Small and Medium Enterprises (MSME) contribute nearly 8 percent of
the country‟s GDP, 45 percent of the manufacturing output and 40 percent of the
exports. They provide the largest share of employment after agriculture. They are the
nurseries for entrepreneurship and innovation. They are widely dispersed across the
country and produce a diverse range of products and services to meet the needs of the
local markets, the global market and the national and international value chains.
The Ministry has a number of programmes to help and assist entrepreneurs and
small businesses. If you are planning to set up business, you may contact National

98
Institute for Entrepreneurship and Small Business Development (NIESBUD), National
Institute for Micro, Small and Medium Enterprises (NI-MSME), Indian Institute of
Entrepreneurship (IIE) or the Development Commissioner (DCMSME) for details
about their programmes. If you are an existing entrepreneur and would like to improve
your competitiveness, you may contact DC, MSME who can be of assistance in various
ways. If you want to set up a village industry or want to know more about Khadi or
Coir Products, you may contact KVIC or Coir Board.
Ministry of MSME encourages and honors innovation and enterprise. We work
in close coordination with the State Governments, Industry Associations, Banks and
other stakeholders through our numerous field offices and technical institutions to help
the „engines of growth‟ throughout the country.
3.9.1 Entrepreneurship Development Programmes
Entrepreneurship development is one of the key elements for promotion of
micro and small enterprises, particularly, the first generation entrepreneurs.
Entrepreneurship, and resultant creation of employment and wealth, is a major means
for inclusive development. Hence, entrepreneurship development has been one of the
priorities in countries the world over. The Entrepreneurship Development Institute,
Chennai has organised a series of Entrepreneurship Development Programmes entitled
“you can be an entrepreneur” at various Districts. The programme is designed to equip
first generation entrepreneurs with business ideas, project report preparation and ways
to tap financial assistance for their business plan. This programme is exclusively for
unemployed SC/ST graduates / Diploma holders only. EDI will conduct the programme
at an Institution in the district selected by the EDI. The programme is entirely free for
all SC/ST candidates.

99
Entrepreneurship Development Institute (EDI), Chennai, organise
entrepreneurship development programmes to benefit educated youths (graduates in
engineering / management, arts and science and diploma holders in engineering, both
men and women) who aspire to be self-employed. The participants will be motivated
and thoroughly guided to set up and manage small-scale industrial or service
projects. This one month, full-time intensive programme will cover all aspects of
entrepreneurship / self-employment guidance. Topics such as (i) product / project
identification, (ii) procedures of starting small-scale enterprises, (ii) business plan
preparation and (iv) financial and subsidy schemes for new entrepreneurs, will be
discussed by specialist officers from govt. promotional depts., commercial banks /
financial institutions. Renowned industrial consultants specialised in micro and small
projects, chartered accountants and prominent successful entrepreneurs will be invited
to deliver lectures and offer mentoring services3.
3.9.2 Women Entrepreneurship Development Program (WEDP) and
Entrepreneurship Cum Skill Development Programmes for Women (WESDP)
The EDI will organise Women Entrepreneur Development Programmes
[WEDPs] in order to create a business environment that encourages the initiative of
rural and urban women entrepreneurs and to enhance the human and institutional
capacities required to foster entrepreneurial dynamism and enhance productivity.
The Women Entrepreneur Development Programme aims at providing
entrepreneurship training to women, mentoring women entrepreneurs and technical
skills upgrading. The WEDPs will help women entrepreneurs to improve their
production processes and management techniques and support their initiatives to start
new enterprises. The Entrepreneurship cum Skill Development Programme (ESDP)
3 http://www.editn.in/govtof_india.aspx
100
will combine skill training in a variety of sectors with modules in management,
marketing, finance and business plan preparation to help women set up skill based
enterprises4.
3.9.3 General Entrepreneurship Development Program (EDP) and General
Entrepreneurship Development Program (EDP)
An Entrepreneurship Development Programme (EDP), aims at providing
training in the essentials of conceiving, planning, initiating and launching an economic
activity or an enterprise successfully. The programme content includes class room
training on essentials of entrepreneurship, identification of business opportunities,
schemes of assistance offered by various constituents of the support system,
preparation of a technically feasible and economically viable project report,
Achievement Motivation Training and also the nuances of management of an
enterprise. Target Group: The Diploma Holders /Graduates and above - for 4 Weeks
Programmes. 10th pass/+2 pass - for 2 Weeks Programmes. Duration : 2 Weeks and 4
Weeks Age : 18 Years to 35 Years.
3.9.4 Entrepreneurship and Skill Development Program (ESDP) General
Candidates
The objective of the ESDP is to provide training for skill upgradation so as to
equip the trainees with modern technological skills. Typical ESDPs may be conducted
in Machine Shop Practice, CNC, Heat Treatments, Electroplating, Sheet metal,
Welding, Tool and Die Making, Glass and Ceramics, Industrial and Art Wares, Herbal
Cosmetics, Fashion Garments, Hosiery, Food and Fruit Processing Industries,
Information Technology, Hardware Maintenance, Soap and Detergents, Leather
4 http://www.editn.in/compendium.aspx
101
Products/Novelties, Servicing of Household Electrical Appliances and Electronic
Gadgets, Gem Cutting and Polishing, Engineering Plastics etc. However, the above list
is only illustrative and not exhaustive. Based on Market need and demand, more skills
can be identified and Skill Development Programmes will be designed and offered.
There will also be a management module on how to establish and manage an enterprise.
Target Group: The Diploma Holders / ITIs / any Certified Trade Course / VTP.
Duration : 180 hours - over 30 days Age : 18 Years and above
3.9.5 Technology Based Entrepreneurship Development Program (TEDP)
A TEDP is designed to motivate and develop entrepreneurs in specific
products/processes/ cutting edge / intermediate technologies developed by CSIR labs,
CLRI, CIPET, CITRA, FTDI, R&D institutions, State Universities etc., for the
qualified graduates/ diploma holders in various disciplines of Science and Technology
who can generate ideas and develop Business Plan and Business Ventures. The EDI
will identify the above institutions as knowledge partner who will give technological
training and EDI will give the management training. Based on the Technological input,
entrepreneurs will be encouraged to prepare Business Plans in collaboration with the
partner institutions. A Technology Based EDP primarily focuses on the training and
development needs of S&T entrepreneurs in a specific technology area (for example,
Leather, Plastic, Electronics and Communication, Fragrance and Flavour,
Instrumentation, Sports Goods, Bio-technology, IT Computer Hardware, Food
Processing, Bio-medical Equipment, Glass and Ceramics, Jute Products, Sustainable
Building Materials, Herbs and Medical Plants Processing, etc.). The above list is only
illustrative and not exhaustive. Based on Market requirement, more sunrise industries
will be identified and designed according to the market demand. The participants will
102
be provided with hands-on training in indigenous technologies developed by R&D
institutions that may be available for commercial exploitation.
Target Group: B.E. Graduates/Graduates/Post Graduates in any branch of
Science/ Diploma/Degree in a specified branch of Engineering/Technology depending
on the nature of TEDP. Duration : 6-weeks duration Age :18-35 Years,(relaxable in
exceptional circumstances).
3.9.6 Entrepreneurship Awareness Camp
In order to create awareness among faculty and students of Engineering and
Science courses about various facets of entrepreneurship as an alternative career option
as also to highlight the merits of pursuing such an option. In each EAC, about 75
students will be exposed to different aspects of entrepreneurship, including
Achievement Motivation, Identification of opportunities for entrepreneurs, How to start
a SSI unit, Government regulations, rules & procedures, location, Creativity and
business, Communication skills etc., will be covered. A visit to the industries located in
the region will also be arranged to bring the students in direct touch with practicing
entrepreneurs.
Target Group: Science and Technology graduates/diploma holders or those
who are doing their final year diploma / degree in engineering / technology / science.
Duration : 3- days duration Age :18 Years and above.
3.9.7 Scheme of Mentorship for New Entrepreneurs
The main lacuna standing in the way of potential entrepreneurs from becoming
successful is the absence of a mentor. Quite often, the absence of timely information
relating to the market, trends in the economy, a proper understanding of how to

103
approach financial institutions and potential investors, ignorance of the plethora of acts,
rules and regulations - these can make the difference between success and failure for
the first generation entrepreneur.
3.9.8 Technology Based Entrepreneurship Development Program
The objective of the scheme is to supplement the efforts of public extension in
the agriculture sector by technology and management inputs to promote a new brand of
entrepreneurs in Agriculture called Agri-preneurs. Identification of Agripreneurs will
be based on experience and educational background. The ADP will support agricultural
development and create gainful self-employment opportunities to unemployed
agricultural graduates. Target Group Agricultural graduates, agricultural Diploma
holders, Intermediate in agriculture and biological science graduates with PG in
agri-related courses. Duration : 2 month (Residential) - 60 days Age : 18-35
Years,(relaxable in exceptional circumstances).
3.9.9 Cluster Based Awareness Programmes
The Cluster Development Programme is aimed at the development of MSMEs
in the various Industry clusters in the State to face various challenges which are
common to that industry. The programme will improve their operational performance
and help them to sustain themselves in the face of Global competition. Prominent
clusters in the State cover Tannery, Textiles, cashew, coir, Engineering, silk etc. Target
Group MSMEs clusters in various of Districts namely leather, coir, cashew,
Automobile / Engineering, etc. will be covered. The list is, however, not exhaustive,
but only indicative. New clusters will be identified and covered by continuous survey.

104
3.10 CONCLUSION
This chapter explains about the profile of the educational avenues available and
the industrial scenario in Thoothukudi district. The role of Government in the
development of entrepreneurship is also presented in this chapter.

Chapter - IV
Profile of the Respondents and their
Entrepreneurial Traits

CHAPTER - IV
PROFILE OF THE RESPONDENTS AND THEIR
ENTREPRENEURIAL TRAITS
4.0 Introduction
4.1 Location of the college
4.2 Gender of the respondents
4.3 Age of the respondents
4.4 Place of residence of the respondents
4.5 Respondents branch of study
4.6 Social group among the respondents
4.7 Religion among the respondents
4.8 Family type of the respondents
4.9 Family size of the respondents
4.10 Monthly family income of the respondents
4.11 Father’s occupation of the respondents
4.12 Mother’s occupation among the respondents
4.13 Entrepreneurial traits of the respondents
4.14 Variables in entrepreneurial traits (ET) and its reliability
4.15 Level of entrepreneurial traits among the respondents
4.16 Association between the profile of respondents and their SOET
4.17 Factors leading to entrepreneurial traits among the respondents
4.18 Reliability and validity of variables relating to coordination
4.19 Variables in innovations and its reliability
4.20 Reliability and validity of variables relating to optimism
4.21 Reliability and validity of variables relating to informativeness

4.22 Reliability and validity of variables relating to decision making
4.23 Variables relating to hard work and its reliability
4.24 Variables relating to problem solving and its reliability
4.25 Variables relating to confidence and its reliability
4.26 Reliability and validity of variables relating to enterprising
4.27 Variables relating to punctuality factor and its reliability
4.28 Variables relating to sincerity factor and its reliability
4.29 Variables relating to forecasting ability factor and its reliability
4.30 Respondents view about the factors leading to entrepreneurial traits
4.31 Association between profile of the respondents and their views about the factors
leading to entrepreneurial traits
4.32 Discriminant factors among the urban and semi-urban college students
4.34 Discriminant factors among the urban and rural college students
4.35 Discriminant factors among the semi-urban and rural college students
4.36 Impact of factors leading to entrepreneurial traits on the level of entrepreneurial
traits among the college students
4.37 Conclusion
105
CHAPTER - IV
PROFILE OF THE RESPONDENTS AND THEIR
ENTREPRENEURIAL TRAITS
4.0 INTRODUCTION
The profile of the respondents provides the background information of the
students. Since the study is about the entrepreneurial traits and achievement motivation
among the college students, the background of the students, the entrepreneurial traits
and their achievement motivation needs to be studied. The entrepreneurial traits of the
students are the fundamental concept which is essential for the purpose of
entrepreneurial motivation among the students. In this chapter, the entrepreneurial
traits, the factors leading to entrepreneurial traits and the impact of the factors leading
to entrepreneurial traits on the entrepreneurial traits have also been discussed.
4.1 LOCATION OF THE COLLEGE
The location of the college refers to the place at which the college located at
present. Since the place of college is one of the important factors which play the vital
role in shaping the behavior, ambition, aspirations and attitude of the students, it is
included as a basic profile variable to classify and group the students. In the present
study, the location of college is classified in to urban, semi-urban and rural. The
distribution respondents on the basis of the location of the college are given in
Table 4.1.
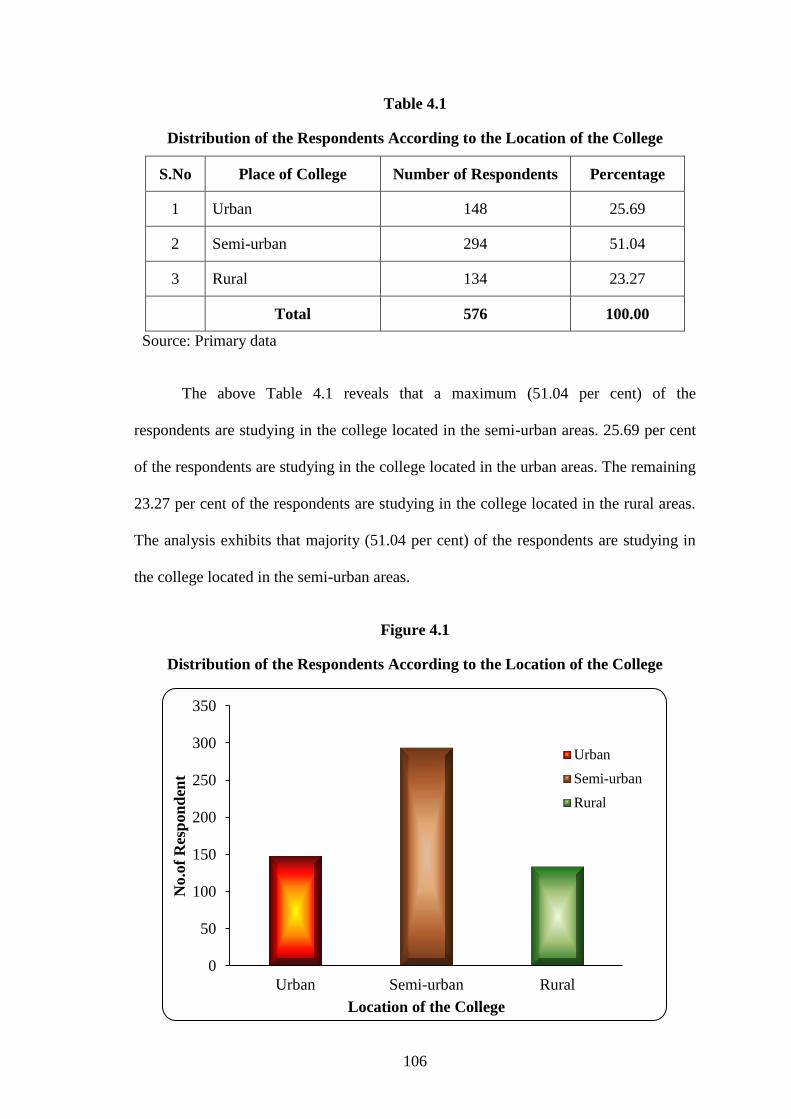
106
Table 4.1
Distribution of the Respondents According to the Location of the College
S.No Place of College Number of Respondents Percentage
1 Urban 148 25.69
2 Semi-urban 294 51.04
3 Rural 134 23.27
Total 576 100.00
Source: Primary data
The above Table 4.1 reveals that a maximum (51.04 per cent) of the
respondents are studying in the college located in the semi-urban areas. 25.69 per cent
of the respondents are studying in the college located in the urban areas. The remaining
23.27 per cent of the respondents are studying in the college located in the rural areas.
The analysis exhibits that majority (51.04 per cent) of the respondents are studying in
the college located in the semi-urban areas.
Figure 4.1
Distribution of the Respondents According to the Location of the College
0
50
100
150
200
250
300
350
Urban Semi-urban Rural
No.o
f R
esp
on
den
t
Location of the College
Urban
Semi-urban
Rural
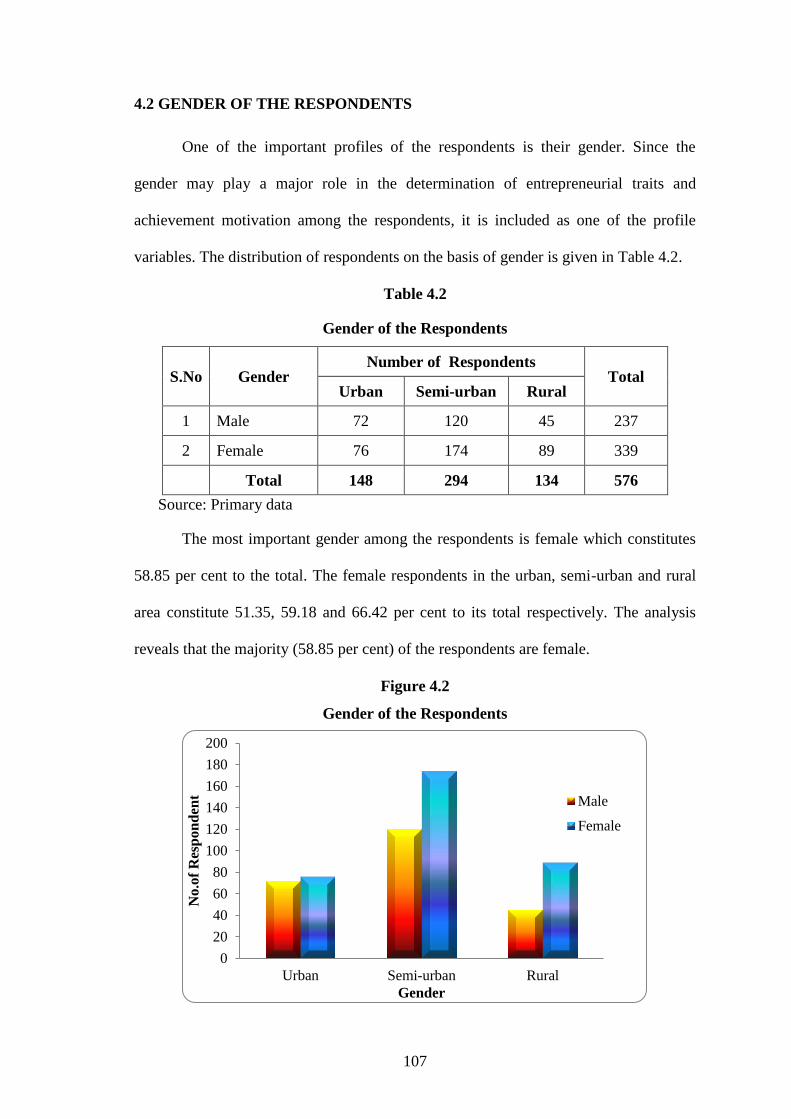
107
4.2 GENDER OF THE RESPONDENTS
One of the important profiles of the respondents is their gender. Since the
gender may play a major role in the determination of entrepreneurial traits and
achievement motivation among the respondents, it is included as one of the profile
variables. The distribution of respondents on the basis of gender is given in Table 4.2.
Table 4.2
Gender of the Respondents
S.No Gender Number of Respondents
Total Urban Semi-urban Rural
1 Male 72 120 45 237
2 Female 76 174 89 339
Total 148 294 134 576
Source: Primary data
The most important gender among the respondents is female which constitutes
58.85 per cent to the total. The female respondents in the urban, semi-urban and rural
area constitute 51.35, 59.18 and 66.42 per cent to its total respectively. The analysis
reveals that the majority (58.85 per cent) of the respondents are female.
Figure 4.2
Gender of the Respondents
0
20
40
60
80
100
120
140
160
180
200
Urban Semi-urban Rural
No
.of
Res
po
nd
ent
Gender
Male
Female

108
4.3 AGE OF THE RESPONDENTS
The age of the respondents may have its own influence on the entrepreneurial
traits and achievement motivation among the respondents. Hence, it is included as one
of the profile variables. The age of the students in the present study is classified in to
below 19 years, 19 to 21, and 22 and above. The distribution of respondents on the
basis of their age is given in the Table 4.3.
Table 4.3
Age of the Students
S.No Age in years Number of Respondents
Total Urban Semi-urban Rural
1 Below 19 19 26 14 59
2 19 – 21 111 236 92 439
3 22 and above 18 32 28 78
Total 148 294 134 576
Source: Primary data
The important age group among the respondents is 19 to 21 years which
constitutes 76.22 per cent to the total. The most important age group among the urban
and semi-urban students is 19 to 21 years which constitutes 75.00 and 80.27 percent to
its total of 148 and 294 students respectively. Among the rural students, it is also 19 to
21 years which constitutes 68.66 percent to its total. The analysis reveals that the
important age group among the students is 19 to 21 years.

109
4.4 PLACE OF RESIDENCE OF THE RESPONDENTS
The place of residence of the respondents represents the area where the
respondents are living. Since the place of residence may be associated with the
entrepreneurial traits and achievement motivation among the respondents, it is included
as one of the profile variable of the respondents. The place of residence in the present
study is classified into urban, semi-urban and rural areas. The distribution of
respondents on the basis of the place of residence is given in Table 4.4.
Table 4.4
Place of Residence among the Respondents
S.No Place of Residence Number of Respondents
Total Urban Semi-urban Rural
1 Urban 89 87 17 193
2 Semi-urban 47 186 85 318
3 Rural 12 21 32 65
Total 148 294 134 576
Source: Primary data
It is evident from Table 4.4 that majority (55.21 per cent) of the respondents are
residing in semi-urban areas. 46.11 per cent of the respondents living in the urban areas
are studying in the college situated in the urban areas. 58.49 per cent of the respondents
living in the semi-urban areas are studying in the college situated in the semi-urban
areas. 49.23 per cent of the respondents living in the rural areas are studying in the
college situated in the rural areas. The above analysis clearly shows that most of the
respondents are doing their collegiate education in the college where they are residing.

110
Figure 4.3
Place of Residence among the Respondents
4.5 RESPONDENTS BRANCH OF STUDY
Respondents‟ branch of study represents the branch chosen by the respondents
for their collegiate education. As the branch of study chosen by the respondents may
have its own influence on their level of achievement motivation, it is included as one of
the profile variables. As study is conducted among the arts and science college
students, the branch of study is classified into arts and science. The distribution of
respondents on the basis of their branch of study is presented in Table 4.5.
Table 4.5
Branch of study among the students
S.No Branch of Study Number of Respondents
Total Urban Semi-urban Rural
1 Arts 61 156 71 288
2 Science 87 138 63 288
Total 148 294 134 576
Source: Primary data
0
50
100
150
200
250
300
350
Urban Semi-urban Rural
No
.of
Res
po
nd
ent
Place of Residence
Rural college
Semi-urban
college
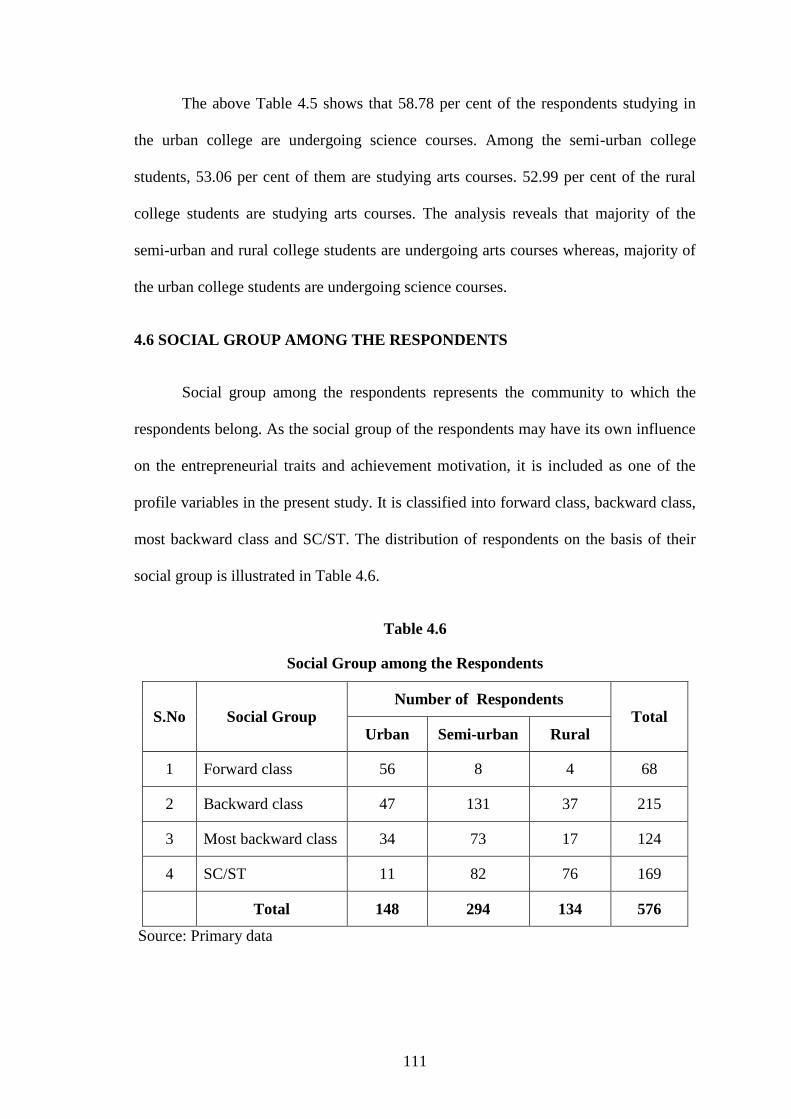
111
The above Table 4.5 shows that 58.78 per cent of the respondents studying in
the urban college are undergoing science courses. Among the semi-urban college
students, 53.06 per cent of them are studying arts courses. 52.99 per cent of the rural
college students are studying arts courses. The analysis reveals that majority of the
semi-urban and rural college students are undergoing arts courses whereas, majority of
the urban college students are undergoing science courses.
4.6 SOCIAL GROUP AMONG THE RESPONDENTS
Social group among the respondents represents the community to which the
respondents belong. As the social group of the respondents may have its own influence
on the entrepreneurial traits and achievement motivation, it is included as one of the
profile variables in the present study. It is classified into forward class, backward class,
most backward class and SC/ST. The distribution of respondents on the basis of their
social group is illustrated in Table 4.6.
Table 4.6
Social Group among the Respondents
S.No Social Group Number of Respondents
Total Urban Semi-urban Rural
1 Forward class 56 8 4 68
2 Backward class 47 131 37 215
3 Most backward class 34 73 17 124
4 SC/ST 11 82 76 169
Total 148 294 134 576
Source: Primary data

112
It is evident from Table 4.6 that 37.84 per cent of the urban college students
belong to forward class community. 44.56 of the semi-urban college students belong to
backward class community whereas, 56.71 per cent rural college students belong to
SC/ST community. The analysis reveals that forward and backward class community
respondents are more in the urban colleges whereas backward and SC/ST community
respondents are dominating in the semi-urban and rural colleges.
Figure 4.4
Social Group among the Respondents
4.7 RELIGION AMONG THE RESPONDENTS
Religion among the respondents represents the religion to which the
respondents belong. The religion is included as one of the profile variables of the
respondents since it may have its own influences on the entrepreneurial traits and
achievement motivation. In the present study, the religion among the respondents is
classified into Hindu, Muslim, Christian and others. The distribution of respondents on
the basis of their religion is illustrated in Table 4.7.
0
20
40
60
80
100
120
140
Forward class Backward class Most backward
class
SC/ST
No.o
f R
esp
on
den
t
Social group
Urban
Semi-urban
Rural
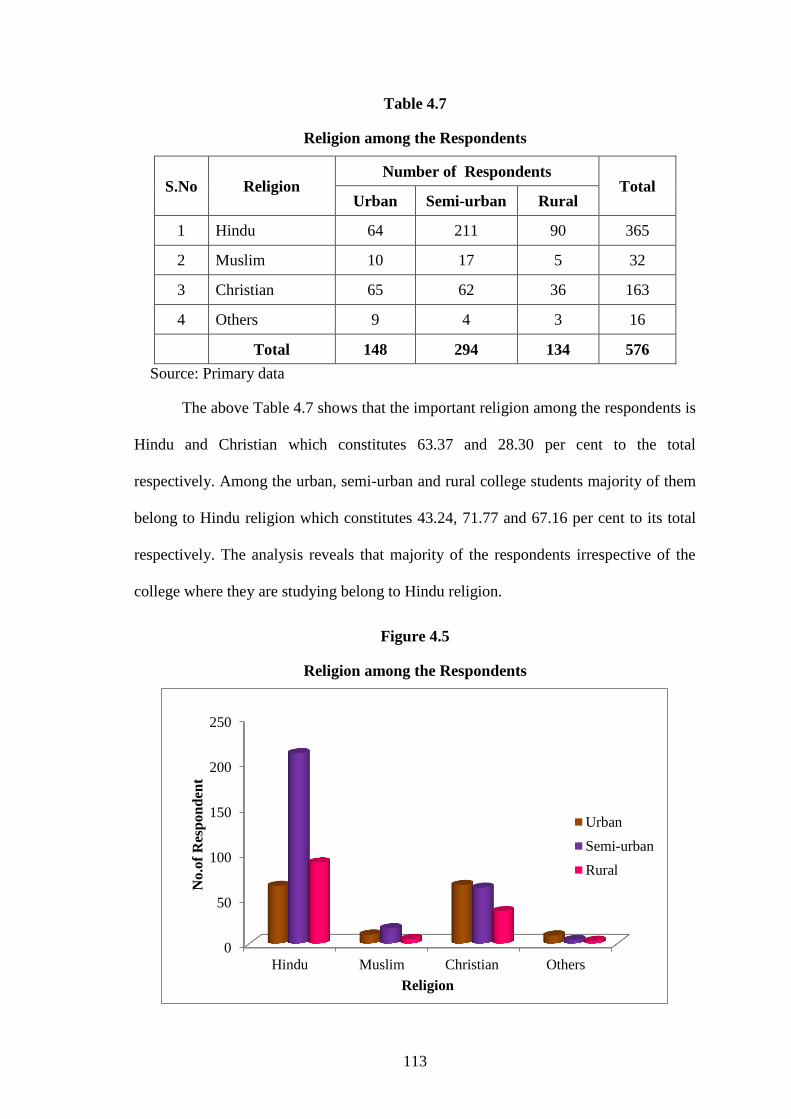
113
Table 4.7
Religion among the Respondents
S.No Religion Number of Respondents
Total Urban Semi-urban Rural
1 Hindu 64 211 90 365
2 Muslim 10 17 5 32
3 Christian 65 62 36 163
4 Others 9 4 3 16
Total 148 294 134 576
Source: Primary data
The above Table 4.7 shows that the important religion among the respondents is
Hindu and Christian which constitutes 63.37 and 28.30 per cent to the total
respectively. Among the urban, semi-urban and rural college students majority of them
belong to Hindu religion which constitutes 43.24, 71.77 and 67.16 per cent to its total
respectively. The analysis reveals that majority of the respondents irrespective of the
college where they are studying belong to Hindu religion.
Figure 4.5
Religion among the Respondents
0
50
100
150
200
250
Hindu Muslim Christian Others
No
.of
Res
po
nd
ent
Religion
Urban
Semi-urban
Rural
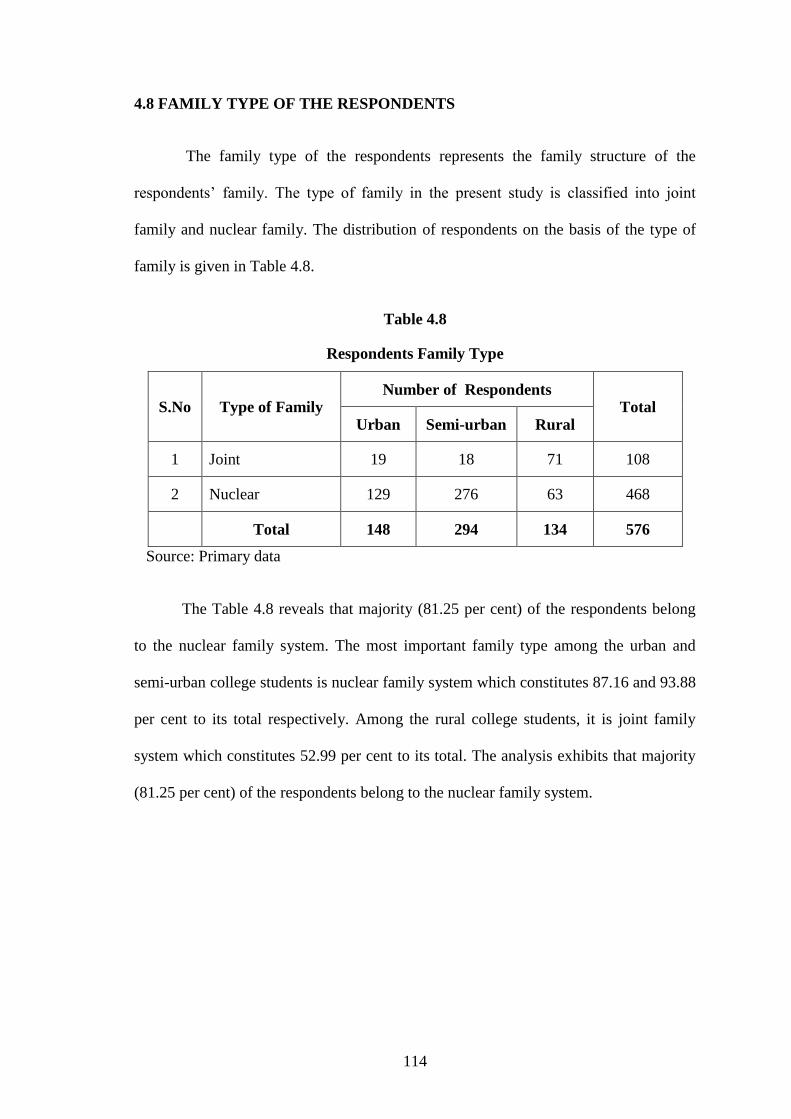
114
4.8 FAMILY TYPE OF THE RESPONDENTS
The family type of the respondents represents the family structure of the
respondents‟ family. The type of family in the present study is classified into joint
family and nuclear family. The distribution of respondents on the basis of the type of
family is given in Table 4.8.
Table 4.8
Respondents Family Type
S.No Type of Family Number of Respondents
Total Urban Semi-urban Rural
1 Joint 19 18 71 108
2 Nuclear 129 276 63 468
Total 148 294 134 576
Source: Primary data
The Table 4.8 reveals that majority (81.25 per cent) of the respondents belong
to the nuclear family system. The most important family type among the urban and
semi-urban college students is nuclear family system which constitutes 87.16 and 93.88
per cent to its total respectively. Among the rural college students, it is joint family
system which constitutes 52.99 per cent to its total. The analysis exhibits that majority
(81.25 per cent) of the respondents belong to the nuclear family system.

115
Figure 4.6
Respondents Family Type
4.9 FAMILY SIZE OF THE RESPONDENTS
The size of the family of the respondents represents the total family members in
the respondent‟s family. As the number of family members in the respondents‟ family
may have its own influence on their level of achievement and entrepreneurial
motivation, it is included as one of the profile variable in the study. The family size
among the respondents in the present study is confined to below 4, 5 to 6 and above 6.
The distribution of respondents on the basis of the family size is given in Table 4.9.
0 50 100 150 200 250 300
Urban
Semi-urban
Rural
No.of Respondent
Nuclear
Joint

116
Table 4.9
Size of Family among the Respondents
S.No Size of Family Number of Respondents
Total Urban Semi – urban Rural
1 Below 4 76 32 17 125
2 5 – 6 65 251 68 384
3 Above 6 7 11 49 67
Total 148 294 134 576
Source: Primary data
The above Table 4.9 exhibits that majority (66.67 per cent) of the respondents
family have 5 to 6 members. Among the urban college students family majority (51.35
per cent) of them are having less than 4 members whereas among the semi-urban and
rural college students family majority of them are having 5 to 6 members which
constitutes 85.37 and 50.75 per cent to its total respectively. The analysis reveals that
majority (66.67 per cent) of the respondents family are having 5 to 6 members.
4.10 MONTHLY FAMILY INCOME OF THE RESPONDENTS
Monthly family income of the respondents represents the family income of the
respondent per month. As the family income will play a vital role in influencing the
family members as regards their achievement and motivation, the family income is
considered as one of the important profile variable in the present study. The family
income of the respondents is confined to less than ` 10,000, ` 10,000 to 20,000,
` 20,001 to 30,000, ` 30,001 to 40,000, ` 40,001 to 50,000 and above `50,000. The
distribution of respondents on the basis of their monthly family income is given in
Table 4.10.
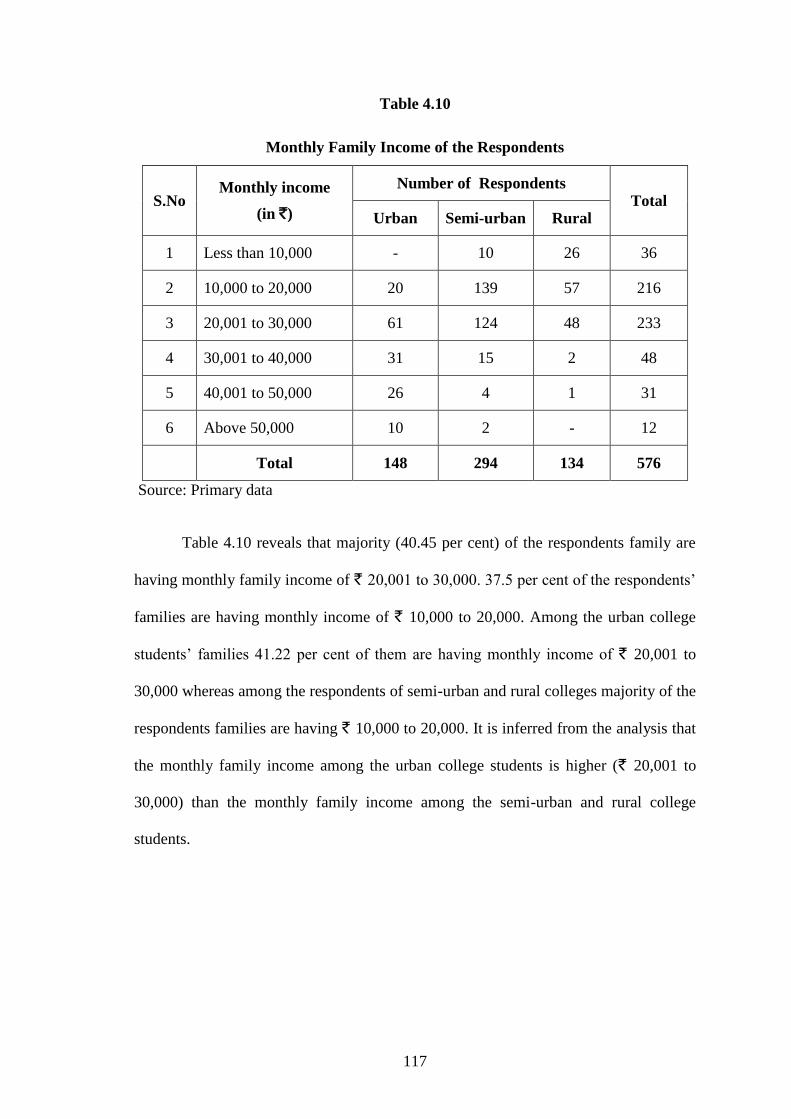
117
Table 4.10
Monthly Family Income of the Respondents
S.No Monthly income
(in `)
Number of Respondents Total
Urban Semi-urban Rural
1 Less than 10,000 - 10 26 36
2 10,000 to 20,000 20 139 57 216
3 20,001 to 30,000 61 124 48 233
4 30,001 to 40,000 31 15 2 48
5 40,001 to 50,000 26 4 1 31
6 Above 50,000 10 2 - 12
Total 148 294 134 576
Source: Primary data
Table 4.10 reveals that majority (40.45 per cent) of the respondents family are
having monthly family income of ` 20,001 to 30,000. 37.5 per cent of the respondents‟
families are having monthly income of ` 10,000 to 20,000. Among the urban college
students‟ families 41.22 per cent of them are having monthly income of ` 20,001 to
30,000 whereas among the respondents of semi-urban and rural colleges majority of the
respondents families are having ` 10,000 to 20,000. It is inferred from the analysis that
the monthly family income among the urban college students is higher (` 20,001 to
30,000) than the monthly family income among the semi-urban and rural college
students.

118
Figure 4.7
Monthly Family Income of the Respondents
4.11 FATHER‟S OCCUPATION OF THE RESPONDENTS
Father‟s occupation of the respondents represents the nature of work or
occupation of the respondents‟ father. Since the father‟s occupation may play its own
role in the determination of the entrepreneurial traits and achievement motivation
among the respondents, it is included as one of the profile variables in this study.
Father‟s occupation is confined to Government employment, private employment,
business, farmers, professional and others. The distribution of respondents on the basis
of their father‟s occupation is illustrated in Table 4.11.
0 20 40 60 80 100 120 140 160
Less than 10,000
10,000 to 20,000
20,001 to 30,000
30,001 to 40,000
40,001 to 50,000
Above 50,000
No.of Respondent
Rural
Semi-urban
Urban
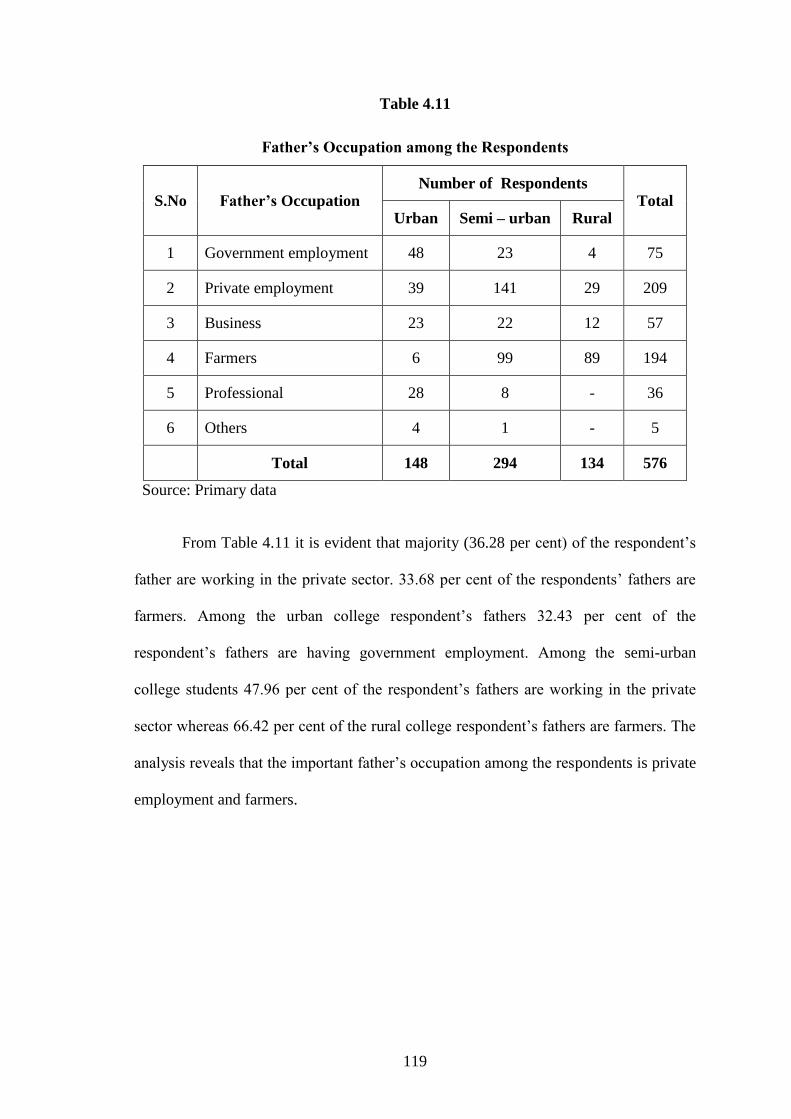
119
Table 4.11
Father‟s Occupation among the Respondents
S.No Father‟s Occupation Number of Respondents
Total Urban Semi – urban Rural
1 Government employment 48 23 4 75
2 Private employment 39 141 29 209
3 Business 23 22 12 57
4 Farmers 6 99 89 194
5 Professional 28 8 - 36
6 Others 4 1 - 5
Total 148 294 134 576
Source: Primary data
From Table 4.11 it is evident that majority (36.28 per cent) of the respondent‟s
father are working in the private sector. 33.68 per cent of the respondents‟ fathers are
farmers. Among the urban college respondent‟s fathers 32.43 per cent of the
respondent‟s fathers are having government employment. Among the semi-urban
college students 47.96 per cent of the respondent‟s fathers are working in the private
sector whereas 66.42 per cent of the rural college respondent‟s fathers are farmers. The
analysis reveals that the important father‟s occupation among the respondents is private
employment and farmers.

120
4.12 MOTHER‟S OCCUPATION AMONG THE RESPONDENTS
The mother‟s occupation among the respondents in the present study is confined
to Government employment, private employment, business, farmer, professional and
others (House wife). The distribution of respondents on the basis of their mother‟s
occupation is given in Table 4.12.
Table 4.12
Mother‟s Occupation among the Respondents
S.No Mother‟s Occupation Number of Respondents
Total Urban Semi – urban Rural
1 Government employment 5 10 2 17
2 Private employment 9 19 18 46
3 Business - 1 2 6
4 Farmers - 6 32 38
5 Professional - - - -
6 Others (House wife) 134 258 80 472
Total 148 294 134 576
Source: Primary data
Table 4.12 reveals that majority (81.94 per cent) of the respondent‟s mothers are
house wife. The important occupation of mother‟s of urban, semi-urban and rural
college students is house wife. The analysis reveals that majority of the respondent‟s
mothers are house wife.

121
4.13 ENTREPRENEURIAL TRAITS OF THE RESPONDENTS
The entrepreneurial traits of the respondents in the present study are measured
with the help of eight variables. The respondents are asked to rate these eight variables
at five point scale according to the order of existence among them. The mean score of
each variable among the urban, semi-urban and rural college students have been
computed separately along with its „F‟ statistics. The results are given in Table 4.13.
Table 4.13
Entrepreneurial Traits (ET) among the Respondents
S.No Variables in
Entrepreneurial Traits
Mean score among Respondents F Statistics
Urban Semi – urban Rural
1 Risk Taking 3.6503 3.0175 3.0086 3.2676*
2 Hard Work 3.1172 3.4542 3.8917 3.1071*
3 Ability to take decision 3.7375 3.2676 3.0172 3.4569*
4 Self Confidence 3.8891 3.1173 2.8973 3.9092
5 Capacity to Solve Problem 3.6069 2.9098 2.6696 3.9773*
6 Leadership 3.7308 3.1109 2.9037 3.5173*
7 Creativity 3.8587 3.2676 3.0176 3.6568*
8 Ability to Foresee future 3.7808 3.0179 2.8676 3.8141*
*Significant at five per cent level
The highly possessed entrepreneurial traits among the urban college students are
self-confidence and creativity since their mean scores are 3.8891 and 3.8587
respectively. Among the semi-urban college students the highly possessed
entrepreneurial traits are handwork, ability to take decision and creativity since their
mean sure are 3.4542 and 3.2676 respectively. Among the rural college students the
highly possessed entrepreneurial traits are handwork and creativity since their mean

122
scores are 3.8971 and 3.0176 respectively. Regarding the possession of entrepreneurial
traits, significant difference among the three group of respondents have been noticed in
the case of all eight variables since their respective „F‟ statistics are significant at five
per cent level.
4.14 VARIABLES IN ENTREPRENEURIAL TRAITS (ET) AND ITS RELIABILITY
The score of eight variables in ET have been included for confirmatory factor
analysis (CFA) in order to examine the reliability and validity of variables in ET. The
overall reliability of variable in ET has been estimated with the help of Cronbach alpha.
The results are given in Table 4.14.
Table 4.14
Reliability and validity of variables in Entrepreneurial Traits
S.
No
Variables in
Entrepreneurial
Traits
Standardized
factor
loading
t
Statistics
Cronbach
alpha
Composite
Reliability
Average
variable
extracted
1 Self confidence 0.9089 4.1711* 0.8108 0.7911 56.68
2 Ability to foresee
future 0.8667 3.5881*
3 Ability to take
decision 0.8334 3.4546*
4 Risk Taking 0.8117 4.3884*
5 Creativity 0.7508 3.0994*
6 Leadership 0.7331 2.8081*
7 Hard work 0.6886 2.5089*
8 Capacity to solve
problem 0.6245 2.1786*
*Significant at five per cent level
The standardized factor loading of the variables in ET are varying from 0.6245
to 0.9089 which reveals the content validity. The significance of „t‟ statistics of the
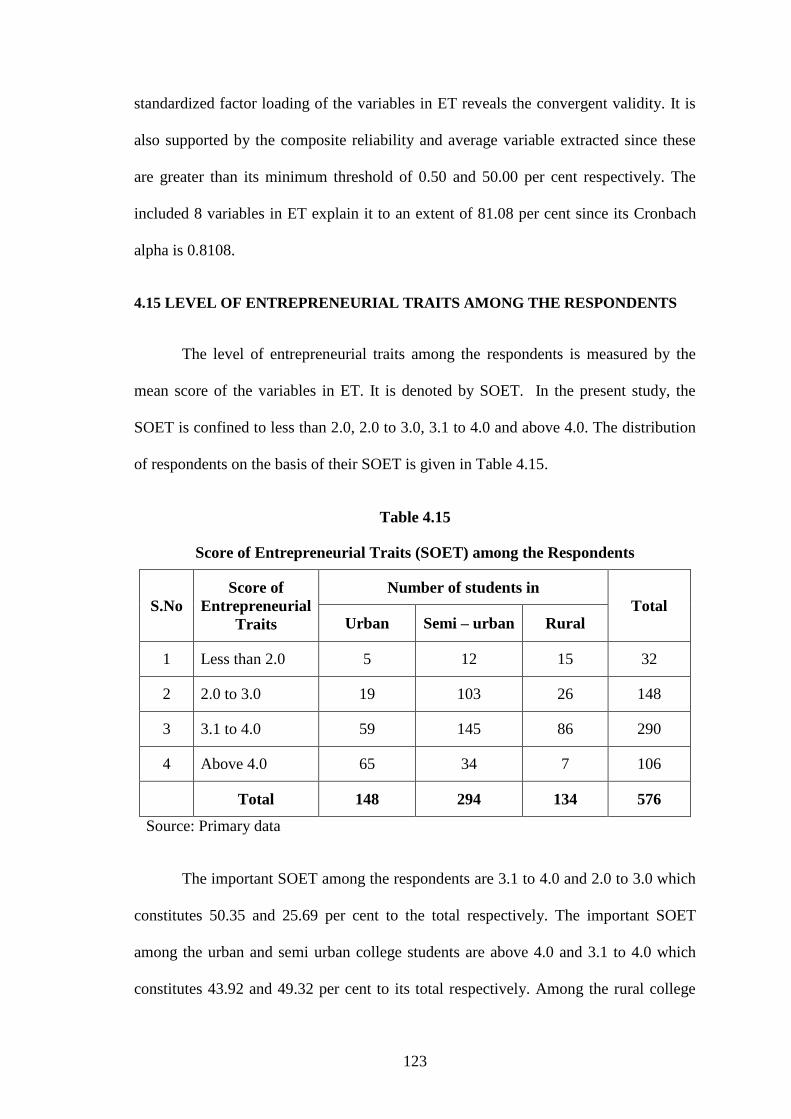
123
standardized factor loading of the variables in ET reveals the convergent validity. It is
also supported by the composite reliability and average variable extracted since these
are greater than its minimum threshold of 0.50 and 50.00 per cent respectively. The
included 8 variables in ET explain it to an extent of 81.08 per cent since its Cronbach
alpha is 0.8108.
4.15 LEVEL OF ENTREPRENEURIAL TRAITS AMONG THE RESPONDENTS
The level of entrepreneurial traits among the respondents is measured by the
mean score of the variables in ET. It is denoted by SOET. In the present study, the
SOET is confined to less than 2.0, 2.0 to 3.0, 3.1 to 4.0 and above 4.0. The distribution
of respondents on the basis of their SOET is given in Table 4.15.
Table 4.15
Score of Entrepreneurial Traits (SOET) among the Respondents
S.No
Score of
Entrepreneurial
Traits
Number of students in
Total Urban Semi – urban Rural
1 Less than 2.0 5 12 15 32
2 2.0 to 3.0 19 103 26 148
3 3.1 to 4.0 59 145 86 290
4 Above 4.0 65 34 7 106
Total 148 294 134 576
Source: Primary data
The important SOET among the respondents are 3.1 to 4.0 and 2.0 to 3.0 which
constitutes 50.35 and 25.69 per cent to the total respectively. The important SOET
among the urban and semi urban college students are above 4.0 and 3.1 to 4.0 which
constitutes 43.92 and 49.32 per cent to its total respectively. Among the rural college
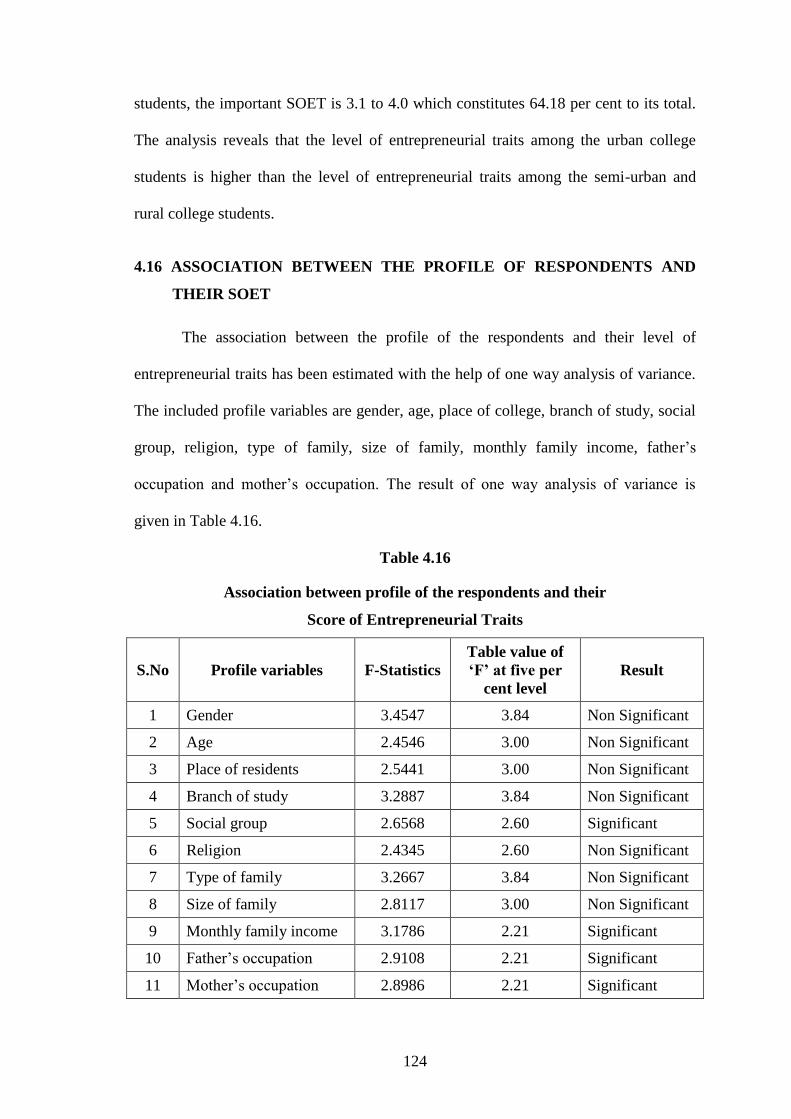
124
students, the important SOET is 3.1 to 4.0 which constitutes 64.18 per cent to its total.
The analysis reveals that the level of entrepreneurial traits among the urban college
students is higher than the level of entrepreneurial traits among the semi-urban and
rural college students.
4.16 ASSOCIATION BETWEEN THE PROFILE OF RESPONDENTS AND
THEIR SOET
The association between the profile of the respondents and their level of
entrepreneurial traits has been estimated with the help of one way analysis of variance.
The included profile variables are gender, age, place of college, branch of study, social
group, religion, type of family, size of family, monthly family income, father‟s
occupation and mother‟s occupation. The result of one way analysis of variance is
given in Table 4.16.
Table 4.16
Association between profile of the respondents and their
Score of Entrepreneurial Traits
S.No Profile variables F-Statistics
Table value of
„F‟ at five per
cent level
Result
1 Gender 3.4547 3.84 Non Significant
2 Age 2.4546 3.00 Non Significant
3 Place of residents 2.5441 3.00 Non Significant
4 Branch of study 3.2887 3.84 Non Significant
5 Social group 2.6568 2.60 Significant
6 Religion 2.4345 2.60 Non Significant
7 Type of family 3.2667 3.84 Non Significant
8 Size of family 2.8117 3.00 Non Significant
9 Monthly family income 3.1786 2.21 Significant
10 Father‟s occupation 2.9108 2.21 Significant
11 Mother‟s occupation 2.8986 2.21 Significant

125
Regarding the level of entrepreneurial traits, the significantly associating profile
variables are social group, monthly family income, father‟s occupation and mother‟s
occupation since their respective „F‟ statistics are significant at five per cent level. The
analysis reveals the importance of above said significant profile variables in the
determination of entrepreneurial traits among the respondents.
4.17 FACTORS LEADING TO ENTREPRENEURIAL TRAITS AMONG THE
RESPONDENTS
There are too many variables influencing the entrepreneurial traits of the
respondents. The present study confines these in to 70 variables. The respondents are
asked to rate these variables at five point scale according to the order of importance
attached with these variables as a factor leading to determine their entrepreneurial
traits. The scores of the variables are taken for Exploratory Factor Analysis (EFA) in
order to narrate the variable into factors. Initially, the validity of data for EFA have
been tested with the help of Kaiser - Meyer - Olkin measure of sampling adequacy and
Bartletts test of sphericity. Both these two tests satisfy the validity of data for EFA. The
EFA results in 12 factors. The Eigen value and per cent of variation explained by each
factor is shown in Table 4.17.

126
Table 4.17
Factors leading to Entrepreneurial Traits among the Respondents
S.No Factors
Number
of
variables
Eigen
value
Per cent of
variation
explained
Cumulative per
cent of variation
explained
1 Co-ordination 12 7.8974 11.28 11.28
2 Innovativeness 8 4.9175 7.03 18.31
3 Optimism 9 4.5609 6.52 24.83
4 Informativeness 7 3.8865 5.55 30.38
5 Decision making 7 3.7091 5.30 35.68
6 Hard work 7 3.6945 5.28 40.96
7 Problem solving 5 2.9808 4.25 45.21
8 Confidence 5 2.8227 4.03 49.24
9 Enterprising 3 2.2965 3.28 52.52
10 Personality 3 2.1173 3.02 55.54
11 Sincerity 2 1.8986 2.71 58.25
12 Forecasting ability 2 1.7345 2.47 60.72
Total 70
KMO measures of sampling
adequacy: 0.7379
Bartletts test of sphericity: Chi square
value: 80.79*
*Significant at five per cent level
The first three important factors are co-ordination, innovativeness and optimism
since their Eigen values are 7.8974, 4.9175 and 4.5609 respectively. The per cent of
variation explained by these factors are 11.28, 7.03 and 6.52 per cent respectively. The
next three factors identified by the EFA are informativeness, decision making and hard
work since their Eigen values are 3.8865, 3.7091 and 3.6945 respectively. The per cent

127
of variation explained by these three factors are 5.55, 5.30 and 5.28 per cent,
respectively.
The next three factors identified by the EFA are problem solving, confidence
and enterprising since their Eigen values are 2.9808, 2.8227 and 2.2965 respectively.
The per cent of variation explained by these three factors are 4.25, 4.03 and 3.28 per
cent respectively. The last three factors identified by the factor analysis are personality,
sincerity and Forecasting ability since their Eigen values are 2.1173, 1.8986 and 1.7345
respectively. The per cent of variation explained by these three factors are 3.02, 2.71
and 2.47 per cent respectively. All the 12 factors explain the 70 variables to an extent of
60.72 per cent. The analysis result in 12 factors leading to entrepreneurial traits among
the respondents.
4.18 RELIABILITY AND VALIDITY OF VARIABLES RELATING TO
COORDINATION
In total, there are twelve variables included in coordination. It is important to
examine the reliability and validity of variables in coordination. The confirmatory
factors analysis (CFA) has been administered for their purpose. The reliability has been
tested with the help of Cronbach alpha. The results are given in Table 4.18.

128
Table 4.18
Reliability and validity of variables relating to Coordination
S.No Variables in
Coordination
Standardised
factor
loading
„t‟
Statistics
Cronbach
alpha
Composite
reliability
Average
variables
Extracted
1 Capable of
encouraging others 0.8988 3.9969* 0.8088 0.7819 55.96
2 Inspiring others 0.8504 3.8118*
3 Moving friendly with
others 0.8099 3.5961*
4 Guiding other in their
work 0.7842 3.4509*
5
Accommodating
others to carryout
task
0.7596 3.3896*
6 Getting helps from
others 0.7417 3.2483*
7 Helping others 0.7226 3.0971*
8 Accepting others
with open minded 0.6909 2.9661*
9 Appreciating others 0.68170 2.8089*
10 Taking effort to
encourage others 0.6549 2.5969*
11 Interested in working
with others 0.6308 2.3117*
12
Like challenges
giving scope for
thinking differently
0.6211 2.1084*
*Significant at five per cent level
The standardised factor loading of the variables in coordination are greater than
0.60 which shows the content validity. The significance of „t‟ statistics of the
standardized factor loading of the variables in coordination reveals the convergent
validity. It is also proved by the composite reliability and average variance extracted
since these are greater than it‟s minimum threshold of 0.50 and 50.00 per cent
respectively. The twelve variables included in coordination explain it to an extent of
80.88 per cent since its Cronbach alpha is 0.8088.
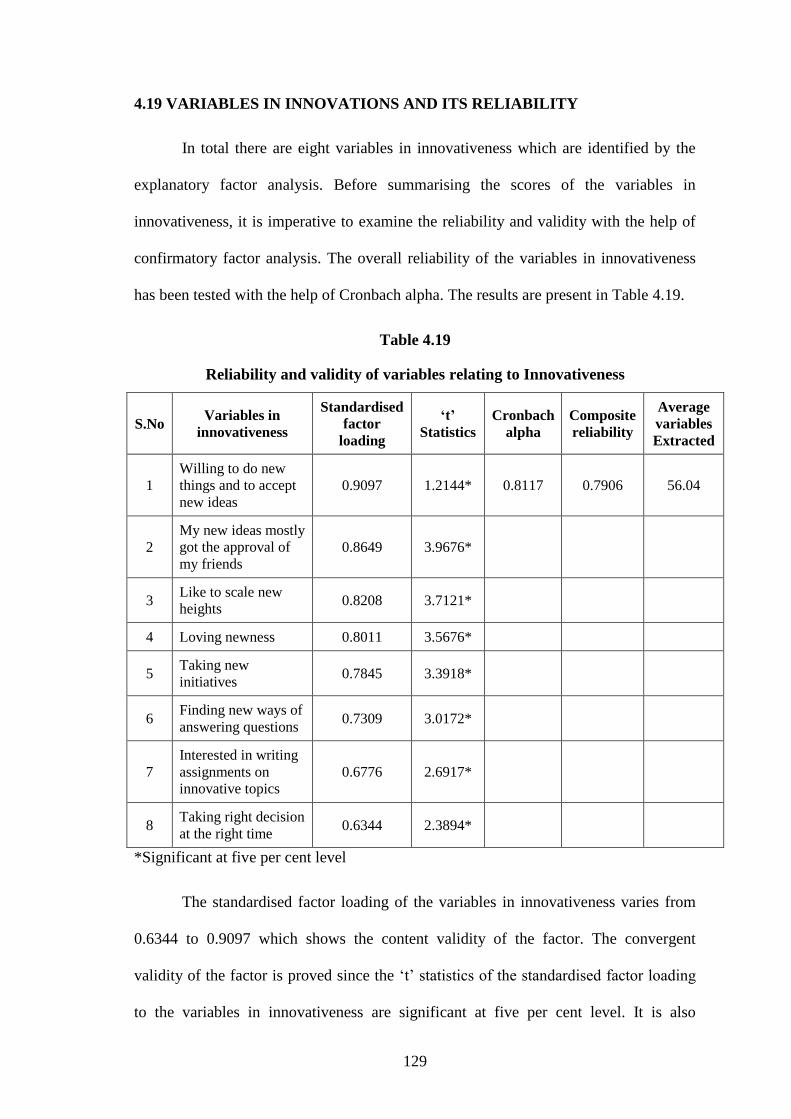
129
4.19 VARIABLES IN INNOVATIONS AND ITS RELIABILITY
In total there are eight variables in innovativeness which are identified by the
explanatory factor analysis. Before summarising the scores of the variables in
innovativeness, it is imperative to examine the reliability and validity with the help of
confirmatory factor analysis. The overall reliability of the variables in innovativeness
has been tested with the help of Cronbach alpha. The results are present in Table 4.19.
Table 4.19
Reliability and validity of variables relating to Innovativeness
S.No Variables in
innovativeness
Standardised
factor
loading
„t‟
Statistics
Cronbach
alpha
Composite
reliability
Average
variables
Extracted
1
Willing to do new
things and to accept
new ideas
0.9097 1.2144* 0.8117 0.7906 56.04
2
My new ideas mostly
got the approval of
my friends
0.8649 3.9676*
3 Like to scale new
heights 0.8208 3.7121*
4 Loving newness 0.8011 3.5676*
5 Taking new
initiatives 0.7845 3.3918*
6 Finding new ways of
answering questions 0.7309 3.0172*
7
Interested in writing
assignments on
innovative topics
0.6776 2.6917*
8 Taking right decision
at the right time 0.6344 2.3894*
*Significant at five per cent level
The standardised factor loading of the variables in innovativeness varies from
0.6344 to 0.9097 which shows the content validity of the factor. The convergent
validity of the factor is proved since the „t‟ statistics of the standardised factor loading
to the variables in innovativeness are significant at five per cent level. It is also
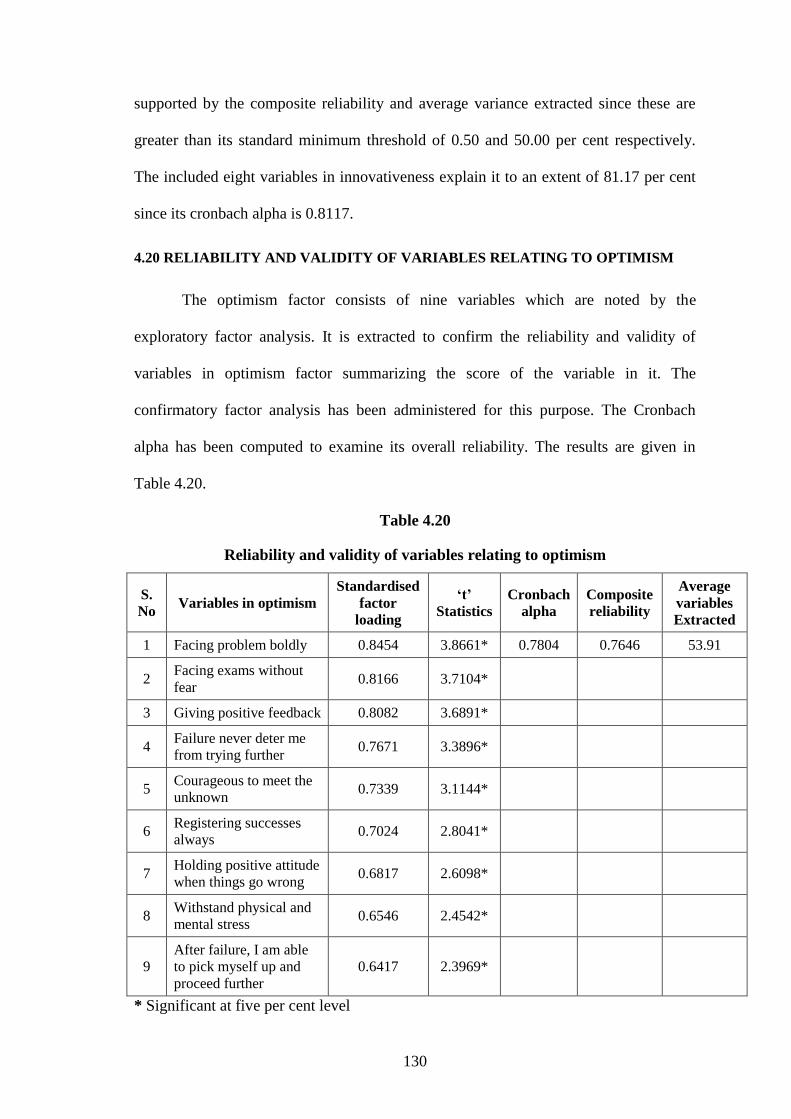
130
supported by the composite reliability and average variance extracted since these are
greater than its standard minimum threshold of 0.50 and 50.00 per cent respectively.
The included eight variables in innovativeness explain it to an extent of 81.17 per cent
since its cronbach alpha is 0.8117.
4.20 RELIABILITY AND VALIDITY OF VARIABLES RELATING TO OPTIMISM
The optimism factor consists of nine variables which are noted by the
exploratory factor analysis. It is extracted to confirm the reliability and validity of
variables in optimism factor summarizing the score of the variable in it. The
confirmatory factor analysis has been administered for this purpose. The Cronbach
alpha has been computed to examine its overall reliability. The results are given in
Table 4.20.
Table 4.20
Reliability and validity of variables relating to optimism
S.
No Variables in optimism
Standardised
factor
loading
„t‟
Statistics
Cronbach
alpha
Composite
reliability
Average
variables
Extracted
1 Facing problem boldly 0.8454 3.8661* 0.7804 0.7646 53.91
2 Facing exams without
fear 0.8166 3.7104*
3 Giving positive feedback 0.8082 3.6891*
4 Failure never deter me
from trying further 0.7671 3.3896*
5 Courageous to meet the
unknown 0.7339 3.1144*
6 Registering successes
always 0.7024 2.8041*
7 Holding positive attitude
when things go wrong 0.6817 2.6098*
8 Withstand physical and
mental stress 0.6546 2.4542*
9
After failure, I am able
to pick myself up and
proceed further
0.6417 2.3969*
* Significant at five per cent level
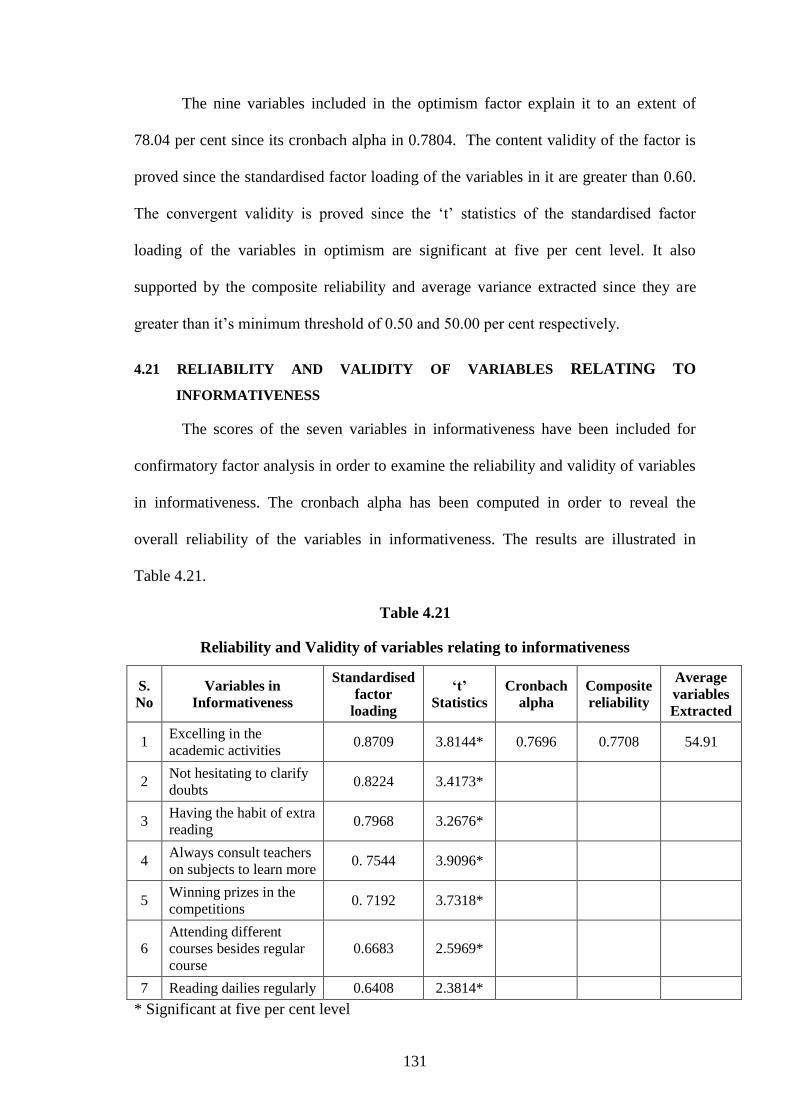
131
The nine variables included in the optimism factor explain it to an extent of
78.04 per cent since its cronbach alpha in 0.7804. The content validity of the factor is
proved since the standardised factor loading of the variables in it are greater than 0.60.
The convergent validity is proved since the „t‟ statistics of the standardised factor
loading of the variables in optimism are significant at five per cent level. It also
supported by the composite reliability and average variance extracted since they are
greater than it‟s minimum threshold of 0.50 and 50.00 per cent respectively.
4.21 RELIABILITY AND VALIDITY OF VARIABLES RELATING TO
INFORMATIVENESS
The scores of the seven variables in informativeness have been included for
confirmatory factor analysis in order to examine the reliability and validity of variables
in informativeness. The cronbach alpha has been computed in order to reveal the
overall reliability of the variables in informativeness. The results are illustrated in
Table 4.21.
Table 4.21
Reliability and Validity of variables relating to informativeness
S.
No
Variables in
Informativeness
Standardised
factor
loading
„t‟
Statistics
Cronbach
alpha
Composite
reliability
Average
variables
Extracted
1 Excelling in the
academic activities 0.8709 3.8144* 0.7696 0.7708 54.91
2 Not hesitating to clarify
doubts 0.8224 3.4173*
3 Having the habit of extra
reading 0.7968 3.2676*
4 Always consult teachers
on subjects to learn more 0. 7544 3.9096*
5 Winning prizes in the
competitions 0. 7192 3.7318*
6
Attending different
courses besides regular
course
0.6683 2.5969*
7 Reading dailies regularly 0.6408 2.3814*
* Significant at five per cent level
132
The standardised factor loading of variables in informatiness varies from 0.6408
to 0.8709 which reveals the content validity of the factor. The significance of „t‟
statistics of the standardised factor loading of the variables in informatiness are
revealing the convergent validity. It is also proved by the composite reliability and
average variance extracted since these are greater than its standard minimum threshold
of 0.50 and 50.00 per cent respectively. The included seven variables in
informativeness explain it to an extent of 76.96 per cent since its cronbach alpha is
0.7696.
4.22 RELIABILITY AND VALIDITY OF VARIABLES RELATING TO
DECISION MAKING
Seven variables are included in the decision making factor. It is essential to
examine the reliability and validity of variables in decision making factor. In order to
examine its reliability and validity the confirmatory factor analysis has been executed
for this purpose. The cronbach alpha has been computed in order to reveal the overall
reliability. The results are presented in Table 4.22.
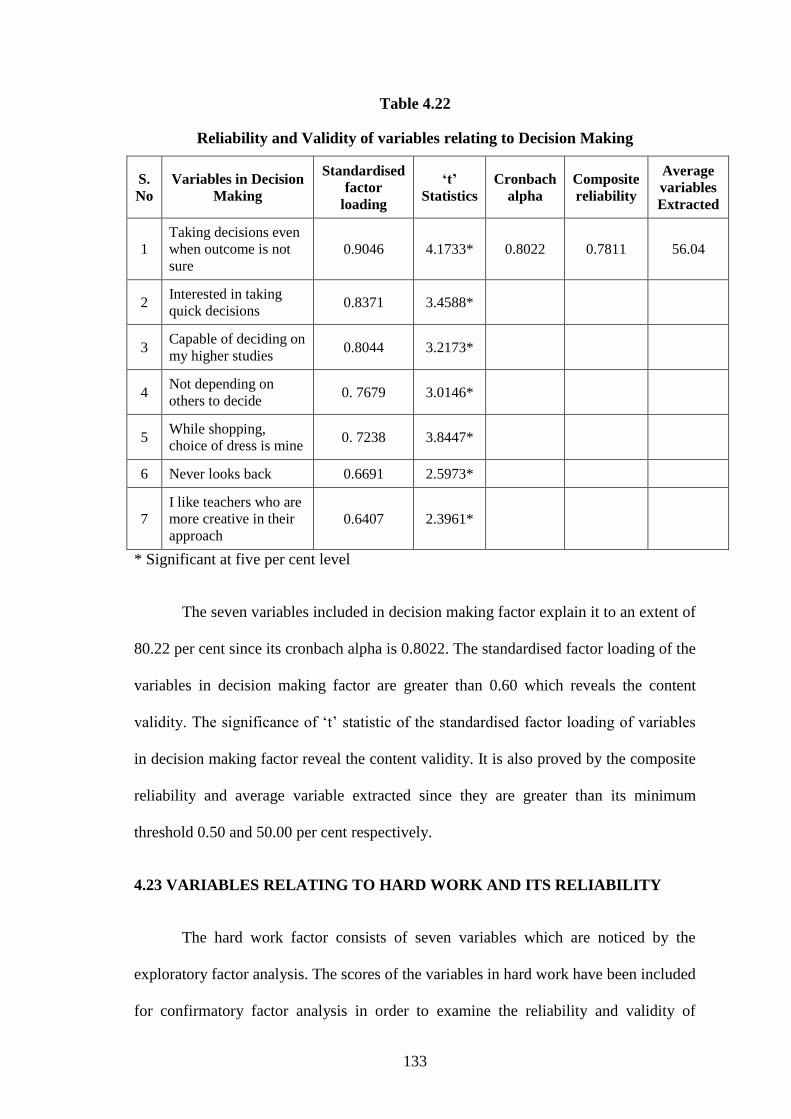
133
Table 4.22
Reliability and Validity of variables relating to Decision Making
S.
No
Variables in Decision
Making
Standardised
factor
loading
„t‟
Statistics
Cronbach
alpha
Composite
reliability
Average
variables
Extracted
1
Taking decisions even
when outcome is not
sure
0.9046 4.1733* 0.8022 0.7811 56.04
2 Interested in taking
quick decisions 0.8371 3.4588*
3 Capable of deciding on
my higher studies 0.8044 3.2173*
4 Not depending on
others to decide 0. 7679 3.0146*
5 While shopping,
choice of dress is mine 0. 7238 3.8447*
6 Never looks back 0.6691 2.5973*
7
I like teachers who are
more creative in their
approach
0.6407 2.3961*
* Significant at five per cent level
The seven variables included in decision making factor explain it to an extent of
80.22 per cent since its cronbach alpha is 0.8022. The standardised factor loading of the
variables in decision making factor are greater than 0.60 which reveals the content
validity. The significance of „t‟ statistic of the standardised factor loading of variables
in decision making factor reveal the content validity. It is also proved by the composite
reliability and average variable extracted since they are greater than its minimum
threshold 0.50 and 50.00 per cent respectively.
4.23 VARIABLES RELATING TO HARD WORK AND ITS RELIABILITY
The hard work factor consists of seven variables which are noticed by the
exploratory factor analysis. The scores of the variables in hard work have been included
for confirmatory factor analysis in order to examine the reliability and validity of
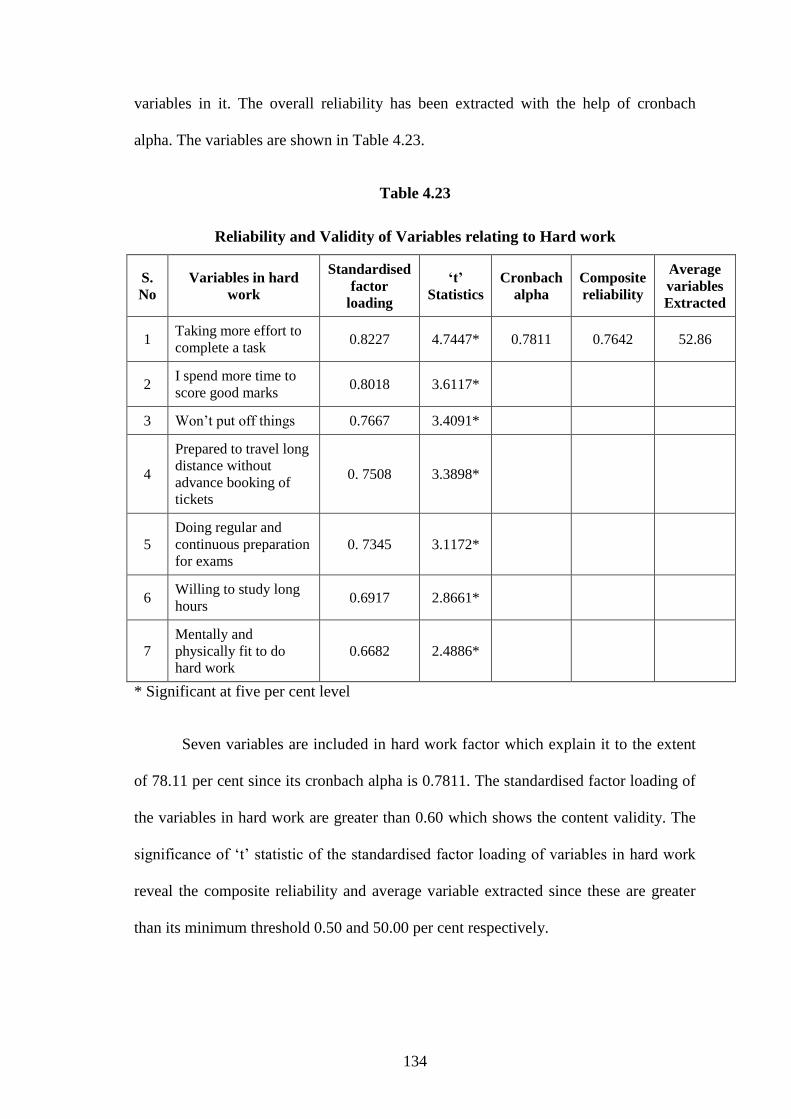
134
variables in it. The overall reliability has been extracted with the help of cronbach
alpha. The variables are shown in Table 4.23.
Table 4.23
Reliability and Validity of Variables relating to Hard work
S.
No
Variables in hard
work
Standardised
factor
loading
„t‟
Statistics
Cronbach
alpha
Composite
reliability
Average
variables
Extracted
1 Taking more effort to
complete a task 0.8227 4.7447* 0.7811 0.7642 52.86
2 I spend more time to
score good marks 0.8018 3.6117*
3 Won‟t put off things 0.7667 3.4091*
4
Prepared to travel long
distance without
advance booking of
tickets
0. 7508 3.3898*
5
Doing regular and
continuous preparation
for exams 0. 7345 3.1172*
6 Willing to study long
hours 0.6917 2.8661*
7
Mentally and
physically fit to do
hard work
0.6682 2.4886*
* Significant at five per cent level
Seven variables are included in hard work factor which explain it to the extent
of 78.11 per cent since its cronbach alpha is 0.7811. The standardised factor loading of
the variables in hard work are greater than 0.60 which shows the content validity. The
significance of „t‟ statistic of the standardised factor loading of variables in hard work
reveal the composite reliability and average variable extracted since these are greater
than its minimum threshold 0.50 and 50.00 per cent respectively.
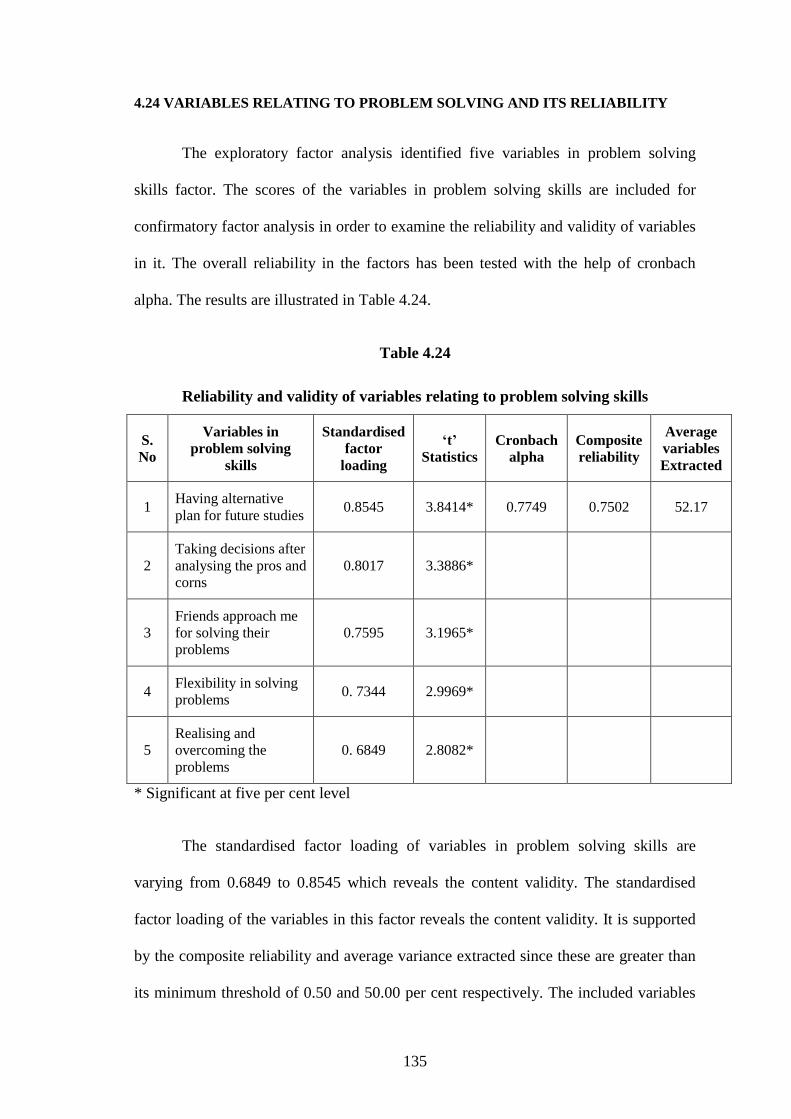
135
4.24 VARIABLES RELATING TO PROBLEM SOLVING AND ITS RELIABILITY
The exploratory factor analysis identified five variables in problem solving
skills factor. The scores of the variables in problem solving skills are included for
confirmatory factor analysis in order to examine the reliability and validity of variables
in it. The overall reliability in the factors has been tested with the help of cronbach
alpha. The results are illustrated in Table 4.24.
Table 4.24
Reliability and validity of variables relating to problem solving skills
S.
No
Variables in
problem solving
skills
Standardised
factor
loading
„t‟
Statistics
Cronbach
alpha
Composite
reliability
Average
variables
Extracted
1 Having alternative
plan for future studies 0.8545 3.8414* 0.7749 0.7502 52.17
2
Taking decisions after
analysing the pros and
corns
0.8017 3.3886*
3
Friends approach me
for solving their
problems
0.7595 3.1965*
4 Flexibility in solving
problems 0. 7344 2.9969*
5
Realising and
overcoming the
problems
0. 6849 2.8082*
* Significant at five per cent level
The standardised factor loading of variables in problem solving skills are
varying from 0.6849 to 0.8545 which reveals the content validity. The standardised
factor loading of the variables in this factor reveals the content validity. It is supported
by the composite reliability and average variance extracted since these are greater than
its minimum threshold of 0.50 and 50.00 per cent respectively. The included variables

136
in problem solving factor explain it to an extent of 77.49 per cent since its cronbach
alpha is 0.7749.
4.25 VARIABLES RELATING TO CONFIDENCE AND ITS RELIABILITY
The confidence factor consists of five variables which were identified by the
exploratory factor analysis. Before summarising the scores of variables in confidence, it
is essential to examine its reliability and validity. The confirmatory factor analysis has
been administered for this purpose. The overall reliability has been estimated with the
help of cronbach alpha. The variables are illustrated in Table 4.25.
Table 4.25
Reliability and validity of variables relating to confidence
S.
No
Variables in
confident
Standardised
factor
loading
„t‟
Statistics
Cronbach
alpha
Composite
reliability
Average
variables
Extracted
1 Taking initiation for
doing things 0.9117 4.0868* 0.8021 0.7844 55.92
2 Always going in for
excellence 0.8408 3.3969*
3 Accepting the task
without hesitation 0.7668 2.9117*
4
Bold enough to visit
unknown places
independently
0. 7349 2.6919*
5
When I take a job, I
am always confident
that I can carry it
out
0. 6546 2.3891*
* Significant at five per cent level
The five variables included in confidence factor explain the reliability and
validity of the variables to an extent of 80.21 per cent since its cronbach alpha is
0.8021. The standardised factor loading of the variables in confidence factor reveals the

137
content validity. The significance of „t‟ statistic of the standardised factor loading of the
variables shows its content validity. It is also proved by the composite reliability and
average variable extracted since these are greater than its standard minimum threshold
of 0.50 and 50.00 per cent respectively.
4.26 RELIABILITY AND VALIDITY OF VARIABLES RELATING TO
ENTERPRISING
The exploratory factor analysis identified the variables included in the
enterprising factor. The scores of the variables in enterprising are included for
confirmatory factor analysis in order to confirm the reliability and validity of variables
in it. The overall reliability has been estimated with the help of cronbach alpha. The
results are shown in the Table 4.26.
Table 4.26
Reliability and validity of variables relating to Enterprising
S.
No
Variables in
Enterprising
Standardised
factor loading
„t‟
Statistics
Cronbach
alpha
Composite
reliability
Average
variables
Extracted
1
Talk openly and
give straight
answers
0.8491 3.7331* 0.8091 0.7842 53.45
2
Creative in
writing
assignments
0.7608 3.3844*
3
Maintaining
physical and
emotional
balance
0.6886 2.5969*
* Significant at five per cent level
The standardised factor loading of variables in enterprising factor is varying
from 0.6886 to 0.8491 which reveals the content validity. The significance of „t‟

138
statistics of the standardised factor loading reveals the convergent validity. It is also
supported by the composite reliability and average variance extracted since these are
greater than its standard minimum threshold of 0.50 and 50.00 per cent respectively.
The variables included in enterprising factor explain its reliability and validity to an
extent of 80.91 per cent since its cronbach alpha is 0.8091.
4.27 VARIABLES RELATING TO PUNCTUALITY FACTOR AND ITS RELIABILITY
The punctuality factor consists of three variables. It is informative to examine
the reliability and validity of variables in punctuality factor before summarising the
scores of the variables in it. The confirmatory factor analysis has been administrated for
this purpose. The overall reliability has been estimated with the help of cronbach alpha.
The results are shown in Table 4.27.
Table 4.27
Reliability and validity of variables relating to punctuality
S.
No
Variables in
punctuality
Standardised
factor
loading
„t‟
Statistics
Cronbach
alpha
Composite
reliability
Average
variables
Extracted
1
Submission of
assignments and
home work in time
0.8117 3.2673* 0.7242 0.7041 51.49
2
Taking right
decision at right
time
0.7228 2.8868*
3 Don‟t keep
problems pending 0.6089 2.0917*
* Significant at five per cent level
The three variables included in punctuality factor explain to an extent of 72.42
per cent since its cronbach alpha is 0.7242. The standardised factor loading of the
variables in punctuality factor are greater than 0.60 which shows the content validity.

139
The significance of „t‟ statistics of the standardised factor loading in punctuality factor
shows the convergent validity. It is also supported by the composite reliability and
average variable extracted since these are greater than its minimum threshold of 0.50
and 50.00 per cent respectively.
4.28 VARIABLES RELATING TO SINCERITY FACTOR AND ITS RELIABILITY
The sincerity factor consists of two variables in it. Before summarising the
scores of the variables in sincerity factor, it is essential to examine the reliability and
validity of variables in sincerity factor. The confirmatory factor analysis has been
administrated for this purpose. The overall reliability has been tested with the help of
cronbach alpha. The results are presented in Table 4.28.
Table 4.28
Reliability and validity of variables relating to sincerity
S.
No
Variables in
sincerity
Standardised
factor
loading
„t‟
Statistics
Cronbach
alpha
Composite
reliability
Average
variables
Extracted
1
Use to attend
the examination
with full
preparation
0.8099 3.1738* 0.7394 0.7102 52.76
2 Spend holidays
usefully 0.6593 2.3969*
* Significant at five per cent level
The standardised factor loading of variables in sincerity factor varies from
0.6593 to 0.8099 which shows the content validity. The convergent validity is proved
since the „t‟ statistics of the standardised factor loading of the variables in sincerity
factor are significant at five per cent level. It is also proved by the composite validity
and average variance extracted since these are greater than 0.50 and 50.00 per cent

140
respectively. The included two variables in sincerity factor explain it to an extent of
73.94 per cent since its cronbach alpha is 0.7394.
4.29 VARIABLES RELATING TO FORECASTING ABILITY FACTOR AND ITS
RELIABILITY
The forecasting ability factor included two variables in it. Before summarising
the scores of the variables in it, it is necessary to examine the reliability and validity of
variables in forecasting ability factor with the help of confirmatory factor analysis. The
overall reliability has been tested with the help of cronbach alpha. The results are given
in Table 4.29.
Table 4.29
Reliability and validity of variables relating to foretelling ability
S.
No
Variables in
foretelling
ability
Standardised
factor
loading
„t‟
Statistics
Cronbach
alpha
Composite
reliability
Average
variables
Extracted
1 Planning things
in advance 0.8644 3.4962* 0.7889 0.7642 52.91
2
Preparation for
future carrier
planning
0.7279 2.5969*
* Significant at five per cent level
The two variables included in forecasting ability factor explain to an extent of
78.89 per cent since its cronbach alpha is 0.7889. The standardised factor loading of the
variables in forecasting ability factor are greater than 0.60 which shows its content
validity. The significance of „t‟ statistics of the standardised factor loading shows the
overall convergent validity. It is also proved by the composite reliability and average
variable extracted since they are greater than its minimum threshold of 0.50 and 50.00
per cent respectively.

141
4.30 RESPONDENTS VIEW ABOUT THE FACTORS LEADING TO
ENTREPRENEURIAL TRAITS
The respondents view about the factors leading to entrepreneurial traits are
examined with the help of 12 factors namely coordination, innovativeness, optimism,
informativeness, decision making skill, hard work, problem solving, confidence,
enterprising, punctuality, sincerity and forecasting ability. The scores of the above said
factors have been computed by the mean score of the variables in each factor. The
mean score of each factor among the groups of respondents have been computed along
with its „F‟ statistics. The results are given in Table 4.30.
Table 4.30
Respondents view about the Factors leading to Entrepreneurial Traits
S.No Factors Mean score of the Respondents
F statistics Urban Semi – urban Rural
1 Coordination 3.0889 3.5869 3.9197 3.6557*
2 Innovativeness 3.9197 3.3441 3.0461 3.3841*
3 Optimism 3.8082 3.4509 3.2671 3.0991*
4 Informativeness 3.6889 3.1703 3.3089 2.9969
5 Decision making 3.7172 3.8684 3.5341 2.0441
6 Hard work 3.3038 3.8991 3.9677 3.1172*
7 Problem solving 3.8917 3.3842 3.0441 3.4509*
8 Confidence 3.8084 3.6674 3.5084 1.8967
9 Enterprising 3.9692 3.3845 3.2171 3.2676*
10 Punctuality 3.1171 3.2671 3.3089 1.0946
11 Sincerity 3.8844 3.6649 3.7334 0.9697
12 Forecasting ability 3.8911 3.5344 3.1782 3.2673*
* Significant at five per cent level

142
The highly viewed factors leading to entrepreneurial traits by the urban college
students are enterprising and innovativeness since their mean sores are 3.9692 and
3.9197 respectively. Among the semi-urban college students, the highly viewed factors
leading to entrepreneurial traits are hard work and decision making skills since their
mean score are 3.8991 and 3.8684 respectively. Among the rural college students, the
highly viewed factors leading to entrepreneurial traits are hard work and coordination
since their mean sores are 3.9677 and 3.9197 respectively.
Regarding the respondents view about the factors leading to entrepreneurial
traits, significant difference among the three groups of respondents have been noticed
in the case of seven out of 12 factors since their respective „F‟ statistics are significant
at five per cent level.
4.31 ASSOCIATION BETWEEN PROFILE OF THE RESPONDENTS AND THEIR
VIEWS ABOUT THE FACTORS LEADING TO ENTREPRENEURIAL TRAITS
The profile of the respondents may be associated with their views towards the
factors leading to entrepreneurial traits. The present study has made an attempt to
examine these associations with the help of one way analysis of variance. The profile
variables included in the study are gender, age, place of college, branch of study, social
group, religion, type of family, size of family, monthly family income, father‟s
occupation and mother‟s occupation. The result of one way analysis of variance is
given in Table 4.31.

143
Table 4.31
Association between Profile of the Respondents and their views towards the factors leading to Entrepreneurial Traits
S.
No Profile variables
F statistics
Co
ordination
Innovative
ness Optimism
Informative
ness
Decision
making
Hard
work
Problem
solving Confidence
Enter
prising
Punctu
ality
Sin
cerity
Fore
casting
ability
1 Gender 3.1186 3.2788 3.3996 3.7643 2.9798 2.8084 3.4661 3.0996 3.5672 3.8011 3.7162 3.5673
2 Age 3.3011* 3.2891* 2.7084 2.6686 2.5868 3.2868* 3.8343* 2.1179 3.6208* 3.4541* 2.9739 3.0869*
3 Place of college 3.1173* 3.0886* 2.8117 2.9083 2.6584 2.7173 3.4118* 3.6562* 2.7341 2.9667 2.8331 3.1765*
4 Branch of study 3.0845 3.5996 3.7676 3.8314 3.9182* 3.9091* 3.1172 3.0996 3.1145 3.5089 3.6282 3.7585
5 Social group 2.8673* 2.9082* 2.7978* 2.8224* 2.4543 2.5082 2.7344* 2.8646* 2.7484* 2.2673 2.8184* 2.6568*
6 Religion 2.0881 2.0616 1.8991 2.0443 2.4311 2.2109 2.4165 2.5051 2.7389* 2.8119* 2.6861* 2.5894*
7 Type of family 3.4516 3.6611 3.8084 3.5886 3.4108 3.5224 3.0899 3.3349 3.5911 3.7333 3.8661* 3.4546
8 Size of family 3.6567* 3.0891* 2.4546 2.9172 3.2459* 3.3996* 3.1145* 3.2676* 2.9192 2.6562 2.8086 2.4509
9 Monthly family
income 2.6063* 2.9117* 2.8028* 2.9029* 2.5969* 2.4886* 2.5941* 2.5661* 2.3899* 2.6076* 2.9194* 2.6562*
10 Father‟s occupation 2.7139* 2.5889* 2.7661* 2.5919* 2.7331* 2.5969* 2.6081* 2.4084* 2.4085* 2.7339* 2.8045* 2.8149*
11 Mother‟s
occupation 2.8028* 2.4544* 2.6089* 2.6086* 2.8081* 2.6886* 2.4889* 2.6117* 2.6162* 2.8084* 2.6546* 2.7244*
Significant at five per cent level

144
Regarding the association between profile of respondents and their views on the
factors leading to entrepreneurial traits, the significantly associating profile variables
with the „coordination‟ and „innovativeness‟ factors are age, place of college, social
group, size of family, monthly family income, father‟s occupation and mother‟s
occupation since their respective „F‟ statistics are significant at five per cent level.
The significantly associating profile variables of the respondents with their
views on „optimism‟ and „informativeness‟ factors are social group, monthly family
income, father‟s occupation and mother‟s occupation since their respective „F‟ statistics
are significant at five per cent level.
Regarding the respondents view on „decision making‟ factor, the significantly
associating profile variables are branch of study, size of family, monthly family
income, father‟s occupation and mother‟s occupation since their respective „F‟ statistics
are significant at five per cent level.
The significantly associating profile variables of the respondents regarding their
views towards „hard work‟ factor are age, branch of study, size of family, monthly
family income, father‟s occupation and mother‟s occupation since their respective „F‟
statistics are significant at five per cent level.
Regarding the respondents view on „problem solving‟ factor, the significantly
associating profile variables are age, place of college, social group, size of family,
monthly family income, father‟s occupation and mother‟s occupation since their
respective „F‟ statistics are significant at five per cent level.
The significantly associating profile variables with the factor „confidence‟ are
place of college, social group, size of family, monthly family income, father‟s
145
occupation and mother‟s occupation since their respective „F‟ statistics are significant
at five per cent level.
The significantly associating profile variables of the respondents regarding the
„enterprising‟ factor are age, social group, religion, monthly family income, father‟s
occupation and mother‟s occupation since their respective „F‟ statistics are significant
at five per cent level.
Regarding the significantly associating profile variables of the respondents
with the „punctuality‟ factor are age, religion, monthly family income, father‟s
occupation and mother‟s occupation since their respective „F‟ statistics are significant
at five per cent level.
The significantly associating profile variables with the „sincerity‟ factor are
social group, religion, type of family, monthly family income, father‟s occupation and
mother‟s occupation since their respective „F‟ statistics are significant at five per cent
level.
Regarding the respondents view on „forecasting ability‟ factor, the significantly
associating profile variables are age, place of college, social group, religion, monthly
family income, father‟s occupation and mother‟s occupation since their respective „F‟
statistics are significant at five per cent level.
4.32 DISCRIMINANT FACTORS AMONG THE URBAN AND SEMI-URBAN
COLLEGE STUDENTS
The factors leading to entrepreneurial traits among the urban college students
differ from the semi-urban college students. The present study has made an attempt to
identify the important discriminant factors among the two groups of respondents.

146
Initially, the mean difference among the two groups of respondents has been examined
with its statistical significance. The discriminant power of factor has been estimated
with the help of wilks lambda. The results are given in the Table 4.32.
Table 4.32
Discriminant factor leading to Entrepreneurial Traits among
Urban and Semi-urban College students
S.
No Factors
Mean score among
Respondents Mean
difference
t-
statistics
Wilks
lambda Urban Semi-
urban
1 Coordination (X1) 3.0889 3.5869 -0.4980 2.4919* 0.1396
2 Innovativeness (X2) 3.9197 3.3441 0.5756 3.1173* 0.1173
3 Optimism (X3) 3.8082 3.4509 0.3573 2.1903* 0.2865
4 Informativeness
(X4) 3.6889 3.1703 0.5186 2.7391* 0.2733
5 Decision making
(X5) 3.7172 3.8684 -0.1512 1.3318 0.5549
6 Hard work (X6) 3.3038 3.8991 -0.5953 3.3965* 0.1946
7 Problem solving
(X7) 3.8917 3.3842 0.5075 2.6891* 0.2132
8 Confidence (X8) 3.8084 3.6674 0.1410 0.8417 0.4881
9 Enterprising (X9) 3.9692 3.3845 0.5847 3.9173* 0.1045
10 Punctuality (X10) 3.1171 3.2671 -0.1500 0.9696 0.4733
11 Sincerity (X11) 3.8844 3.6649 0.2195 1.3388 0.3892
12 Forecasting ability
(X12) 3.8911 3.5344 0.3567 2.1211* 0.1817
* Significant at five per cent level

147
It is observed from Table 4.32 that the discriminant factor among the urban and
semi-urban college students regarding the entrepreneurial traits, significant mean
difference is noticed in the case of coordination, innovativeness, optimism,
informativeness, hard work, problem solving, enterprising and forecasting ability since
their respective „t‟ statistics are statically significant at five per cent level. Higher mean
differences are noticed in the case of hard work and enterprising since their mean
differences are 0.5953, 0.5847 respectively. The higher discriminant power is noticed
in the case of the entrepreneurial traits factors „enterprising‟ and „innovativeness‟
among the urban and semi-urban respondents since their wilks lambda are 0.1045 and
0.1173 respectively.
The significant factors have been included to estimate the two group
discriminant function. The unstandardised procedure has been followed to estimate the
two group discriminant functions. The estimated function is:
Y = 0.7384 - 0.0845 X1 + 0.1244 X3 + 0.1865 X4 – 0.0733 X6 + 0.1459
X7 + 0.1738 X9 + 0.1673 X12
The relative contribution of factors in total discriminant score is computed by
the products of discriminant coefficient and the mean difference of the respective
factors. The results are given in Table 4.33.

148
Table 4.33
Relative contribution of Discriminant factors in Total Discriminant Scores (TDS)
S.
No Factors
Discriminant
coefficient
Mean
difference Product
Relative
contribution
in TDS
1 Coordination (X1) -0.0845 -0.4980 0.0421 7.77
2 Innovativeness (X2) 0.1379 0.5756 0.0794 14.66
3 Optimism (X3) 0.1244 0.3573 0.0444 8.21
4 Informativeness (X4) 0.1865 0.5186 0.0967 17.86
5 Hard work (X6) -0.0733 -0.5953 0.0436 8.05
6 Problem solving (X7) 0.1459 0.5075 0.0740 13.67
7 Enterprising (X9) 0.1738 0.5847 0.1016 18.76
8 Forecasting ability (X12) 0.1673 0.3567 0.0597 11.02
Total 0.5415 100.00
Per cent of cases currently classified: 71.82
The higher discriminant coefficient is noticed in the case of the entrepreneurial
traits „informativeness‟ and „enterprising‟ since their coefficient are 0.1865 and 0.1738
respectively. It shows the higher influence of the above said two factors in the
discriminant function. The dominant discriminant factors among the urban and semi-
urban college students are „enterprising‟ and „infromativness‟ since their relative
contribution are 18.76 and 17.86 per cent respectively. The estimated two group
discriminant analysis correctly classifies the cases to the extent of 71.82 per cent.
The analysis reveals that the important discriminant factors among the urban and
semi-urban college students are „enterprising‟ and „infromativness‟ which are higher
among the urban college students than among the semi-urban college students.

149
4.34 DISCRIMINANT FACTORS AMONG THE URBAN AND RURAL COLLEGE
STUDENTS
The factors leading to entrepreneurial traits among the urban college students
may differ from the rural college students. It is imperative to exhibit the important
discriminant factors among these two groups of college students with the help of
discriminant analysis. Initially, the mean difference and its statistical significance have
been computed. The discriminant power of factor has been estimated with the help of
wilks lambda. The results are given in the Table 4.34.
Table 4.34
Discriminant Factor leading to Entrepreneurial Traits among
Urban and Rural College Students
S.
No Factors
Mean score among
students in Mean
difference
t-
statistics
Wilks
Lambda Urban Rural
1 Coordination (X1) 3.0889 3.9197 -0.8308 3.4676* 0.1817
2 Innovativeness (X2) 3.9197 3.0461 0.8736 3.6874* 0.1458
3 Optimism (X3) 3.8082 3.2671 0.5411 2.4517* 0.1702
4 Informativeness (X4) 3.6889 3.3089 0.3800 2.0196* 0.1667
5 Decision making (X5) 3.7172 3.5341 0.1831 1.4331 0.2886
6 Hard work (X6) 3.3038 3.9677 -0.6639 2.6968* 0.1497
7 Problem solving (X7) 3.8917 3.0441 0.8476 3.5133* 0.1082
8 Confidence (X8) 3.8084 3.5084 0.3000 1.8646 0.1997
9 Enterprising (X9) 3.9692 3.2171 0.7521 3.3969* 0.1452
10 Punctuality (X10) 3.1171 3.3089 -0.1918 1.5889 0.2667
11 Sincerity (X11) 3.8844 3.7334 0.1510 1.2673 0.3045
12 Forecasting ability
(X12) 3.8911 3.1782 0.7129 3.1884* 0.1173
* Significant at five per cent level

150
Significant mean differences are noticed in the case of coordination,
innovativeness, optimism, informativeness, hard work, problem solving skills,
enterprising and forecasting ability since their respective „t‟ statistics are significant at
five per cent level. The higher mean differences are found in the case of
„innovativeness‟ and „problem solving‟ factor since their mean difference are 0.8736
and 0.8476 respectively. The higher discriminant power is noticed in the case of
„problem solving‟ and „forecasting ability‟ factor since their wilks lambda are 0.1082
and 0.1173 respectively.
The significant factors are included to estimate the two group discriminant
function. The unstandardised procedure is followed to estimate it. The estimated
functions is:
Z = 0.9908 - 0.0456 X1 + 0.1887 X2 + 0.1336 X3 + 0.0917 X4 - 0.1776
X6 +0.1887 X7 + 0.0997 X9 + 0.0456 X12
The relative contribution of factors in total discriminant scores have been
estimated with the help of the products of discriminant coefficient and the mean
difference of the respective factors. The results are given in Table 4.35.

151
Table 4.35
Relative Contribution of Discriminant Factors in Total Discriminant Scores (TDS)
S.
No Factors
Discriminant
coefficient
Mean
difference Product
Relative
contribution
in TDS
1 Coordination (X1) -0.0456 -0.8308 0.0379 5.45
2 Innovativeness (X2) 0.1887 0.8736 0.1648 23.71
3 Optimism (X3) 0.1336 0.5411 0.0722 10.38
4 Informativeness (X4) 0.0917 0.3800 0.0348 5.02
5 Hard work (X6) -0.1776 -0.6639 0.1179 16.97
6 Problem solving (X7) 0.1887 0.8476 0.1599 23.01
7 Enterprising (X9) 0.0997 0.7521 0.0749 10.78
8 Forecasting ability (X12) 0.0456 0.7129 0.0325 4.68
Total 0.6949 100.00
Per cent of cases currently classified: 78.86
The higher discriminant coefficients are noticed in the case of „innovativeness‟
and „problem solving‟ since their discriminant coefficient are 0.1887 and 0.1887
respectively. It shows the higher influence of the above said two factors in discriminant
functions. The higher relative contributions of factors in total discriminant scores is
noticed in the case of aforesaid two factors since its relative contribution are 23.71 and
23.01 per cent respectively. The estimated two groups discriminant analysis correctly
classifies the cases to an extent of 78.86 per cent.
The analysis reveals that the important discriminant factors among the urban and
rural college students are „innovativeness‟ and „problem solving‟ which are higher
among the urban college students than among the rural college students.

152
4.35 DISCRIMINANT FACTORS AMONG THE SEMI-URBAN AND RURAL
COLLEGE STUDENTS
The factors leading to entrepreneurial traits among the semi-urban college
students may be different from the rural college students. It is estimated to identify the
important discriminant factors among the two groups of college students. Initially, the
mean difference and its statistical significance have been estimated along with wilks
lambda. The results are given in the Table 4.36.
Table 4.36
Discriminant Factor leading to Entrepreneurial Traits among
Semi-urban and Rural College Students
S.
No Factors
Mean score among
Respondents Mean
difference
t-
statistics
Wilks
Lambda Semi –urban Rural
1 Coordination (X1) 3.5869 3.9197 -0.3328 3.0141* 0.1279
2 Innovativeness (X2) 3.3441 3.0461 0.2980 2.7616* 0.1302
3 Optimism (X3) 3.4509 3.2671 0.1838 2.0145* 0.1455
4 Informativeness (X4) 3.1703 3.3089 -0.1386 -0.8667 0.4173
5 Decision making
(X5) 3.8684 3.5341 0.3343 3.2661*
0.1177
6 Hard work (X6) 3.8991 3.9677 -0.0686 -0.4557 0.5886
7 Problem solving (X7) 3.3842 3.0441 0.3401 3.3969* 0.1072
8 Confidence (X8) 3.6674 3.5084 0.1590 1.1771 0.4177
9 Enterprising (X9) 3.3845 3.2171 0.1674 1.2496 0.4542
10 Punctuality (X10) 3.2671 3.3089 -0.0418 -0.4991 0.6227
11 Sincerity (X11) 3.6649 3.7334 -0.0685 -0.6447 0.5889
12 Forecasting ability
(X12) 3.5344 3.1782 0.3562 3.6562*
0.1526
* Significant at five per cent level
The higher mean differences are noticed in the case of „forecasting ability‟ and
„problem solving‟ since their mean difference are 0.3562 and 0.3401 respectively. The

153
significant mean differences are noticed in the case of „coordination‟, „innovativeness‟,
„optimism‟, „decision making‟, „problem solving‟ and „forecasting ability‟ since their
mean difference are significant at five per cent level. The higher discriminant power is
noticed in the case of „problem solving‟ and „decision making‟ since their wilks lambda
are 0.1072 and 0.1177 respectively. The significant factors are included to estimate the
two group discriminant function. The estimated functions is:
Z = 0.6026 - 0.0361 X1 + 0.0445 X2 + 0.1088 X3 + 0.1396 X5 + 0.1788
X7 + 0.0773 X12
The relative contribution of each discriminant factor in TDS is estimated by the
products of discriminant coefficient and the mean difference of the respective factors.
The results are given in Table 4.37.
Table 4.37
Relative contribution of Discriminant factors in Total Discriminant sores (TDS)
S.
No Factors
Discriminant
coefficient
Mean
difference Product
Relative
contribution
in TDS
1 Coordination (X1) -0.0361 -0.3328 0.0121 6.71
2 Innovativeness (X2) 0.0445 0.2980 0.0133 7.38
3 Optimism (X3) 0.1088 0.1838 0.0199 11.04
4 Decision making (X5) 0.1396 0.3343 0.0467 25.90
5 Problem solving (X7) 0.1788 0.3401 0.0608 33.72
6 Forecasting ability
(X12) 0.0773 0.3562 0.0275 15.25
Total 0.1803 100.00
Per cent of cases currently classified: 68.84
154
The higher discriminant coefficients are noticed in the case of „problem solving‟
and „decision making‟ since their respective coefficient are 0.1788 and 0.1396
respectively. It shows the higher influence of the above said two factors in discriminant
functions. The higher relative contributions in total discriminant scores is noticed in the
case of „problem solving‟ and „decision making‟ since their relative contribution are
33.72 and 25.90 per cent respectively. The estimated two groups discriminant analysis
correctly classifies the cases to an extent of 68.84 per cent.
The analysis reveals that the important discriminant factors among the
semi-urban and rural college students are „problem solving‟ and „decision making‟
which are higher among the semi-urban college students than among the rural college
students.
4.36 IMPACT OF FACTORS LEADING TO ENTREPRENEURIAL TRAITS ON THE
LEVEL OF ENTREPRENEURIAL TRAITS AMONG THE COLLEGE
STUDENTS
The factors leading to entrepreneurial traits among the college students may
have its own influence on the level of entrepreneurial traits among the college students.
It is essential to examine the impact of factors on the level of entrepreneurial traits. The
multiple regression analysis has been administered for this purpose. The fitted
regression model is:
y = a + b1 X1 + b2 X2 + …………….+b12 X12 + e
Whereas y – score on entrepreneurial traits among the students
X1 - Score on coordination among the students
X2 - Score on innovativeness among the students
X3 - Score on optimism among the students

155
X4 - Score on informativeness among the students
X5 - Score on decision making among the students
X6 - Score on hard work among the students
X7 - Score on problem solving among the students
X8 - Score on confidence among the students
X9 - Score on enterprising among the students
X10 - Score on punctuality among the students
X11 - Score on sincerity among the students
X12 - Score on forecasting ability among the students
b1, b2, . . . , b12 - Regression coefficient of independent variables
a - intercept and
e - error term
The impact of factors on the level of entrepreneurial traits among the urban,
semi-urban, rural college students have been examined separately and also for pooled
data. The results are given in Table 4.38.
Table 4.38
Impact of Factors leading to Entrepreneurial Traits on the level of
Entrepreneurial Traits among the College Students
S.No Factors leading to
Entrepreneurial Traits
Mean score among the students Pooled
Data Urban Semi – urban Rural
1 Coordination -0.0459 -0.0733 0.1449* 0.0227
2 Innovativeness 0.1987* 0.1039 0.0997 0.1042
3 Optimism 0.1404* 0.1541* 0.1664* 0.1331*
4 Informativeness 0.1229* 0.0988 0.0446 0.0736
5 Decision making 0.1138 0.1024 0.0773 0.0918

156
S.No Factors leading to
Entrepreneurial Traits
Mean score among the students Pooled
Data Urban Semi – urban Rural
6 Hard work 0.1339* 0.1396* 0.1505* 0.1309*
7 Problem solving 0.1709* 0.0538 0.0441 0.0736
8 Confident 0.1311* 0.0911 0.0577 0.0838
9 Enterprising 0.1298* 0.1237* 0.1667* 0.1503*
10 Punctuality 0.0587 0.1019 0.0456 0.0229
11 Sincerity 0.0991 0.0733 0.0338 0.551
12 Forecasting ability 0.1208* 0.1334* 0.0996 0.1171
Constant 1.2899 0.8582 0.5884 0.7179
R2 0.7919 0.7504 0.7143 0.8042
F statistics 8.9814* 8.3445* 7.8996* 9.1173*
* Significant at five per cent level
Among the urban college students, the significantly influencing factors on the
level of entrepreneurial traits are their innovativeness, optimism, informativeness, hard
work, problem solving, confidence, enterprising and forecasting ability since their
regression coefficient are significant at five per cent level. A unit increase in the above
said factors results in an increase in their level of entrepreneurial traits by 0.1987,
0.1404, 0.1229, 0.1339, 0.1709, 0.1311, 0.1298 and 0.1208 units respectively. The
changes in the level of factors among the urban college students explain the changes in
their entrepreneurial traits to an extent of 79.19 per cent since its R2 is 0. 7919.
Among the semi-urban college students unit increase in the level of optimism,
hard work, enterprising and forecasting ability result in an increase in the level of
entrepreneurial traits by 0.1541, 0.1396, 0.1237 and 0.1334 units respectively. The

157
changes in the level of factors among the urban college students explain the changes in
their entrepreneurial traits to an extent of 75.04per cent since its R2 is 0. 7504.
Among the rural college students, a unit increase in the level of coordination,
optimism, hard work and enterprising results in an increase in the level of
entrepreneurial traits by 0.1449, 0.1664, 0.1505 and 0.1667 units respectively. The
changes in the level of factors among the urban college students explain the changes in
their entrepreneurial traits to an extent of 71.43 per cent since its R2 is 0. 7143.
The analysis of pooled data reveals the importance of „optimism‟, „hard work‟
and „enterprising‟ factors in the determination of their entrepreneurial traits among the
college students. The changes in the level of factors leading to entrepreneurial traits
explain the changes in the level of entrepreneurial traits among the college students to
an extent of 80.42 per cent since its R2 is 0.8042.
4.37 CONCLUSION
The profile of the students undergoing college education in the Arts and
Science courses in the urban, semi-urban and rural colleges and their entrepreneurial
traits have been dealt with in this chapter. The factors leading to entrepreneurial traits,
the association between the profile variables and the factors leading to entrepreneurial
traits revealed the significantly associating profile variables with the entrepreneurial
traits. The discriminant factor analysis helped to identify the factors which discriminate
the urban, semi-urban and rural college students. The impact of factors on
entrepreneurial traits of the urban, semi-urban and rural college students has shown the
degree of influence of the factors on the entrepreneurial traits of the college students.

Chapter - V
Achievement Motivation and Entrepreneurial Traits among the College Students

CHAPTER - V
ACHIEVEMENT MOTIVATION AND ENTREPRENEURIAL
TRAITS AMONG THE COLLEGE STUDENTS
5.0 Introduction
5.1 Academic motivation among the college students
5.2 Variables relating to academic motivation and its reliability
5.3 Level of academic motivation among the college students
5.4 Need for achievement (NFA) among the college students
5.5 Reliability and validity of variables relating to need for achievement
5.6 Level of need for achievement among the students
5.7 Academic challenge among the students
5.8 Variables in academic challenge and its reliability
5.9 Level of academic challenge among the students
5.10 Attitude towards education among the students
5.11 Reliability and validity of variables relating to attitude toward education
5.12 Level of attitude toward education among the students
5.13 Meaningfulness of task and work methods (MTWM) among students
5.14 Reliability and validity of variables relating to meaningfulness of task and work
methods
5.15 Level of meaningfulness of task and work methods among the students
5.16 Attitude towards teachers (ATT) among the students
5.17 Reliability and validity of variables relating to attitude towards teachers (ATT)
5.18 Level of attitude towards teachers among the students
5.19 General interests and sports (GIS) among the students
5.20 Reliability and validity of variables relating to general interests and sports (GIS)
5.21 Level of general interests and sports among the students
5.22 Student’s view about the importance of marks (IOM)
5.23 Reliability and validity of variables relating to importance of marks (IOM)
5.24 Level of importance given to marks among the students
5.25 Students achievement motivation
5.26 Association between the profile of students and their level of achievement
motivation
5.27 Discriminant components of achievement motivation (CAM) among the urban
and semi-urban college students.
5.28 Discriminant cams among the urban and rural college students
5.29 Discriminant components of achievement motivation (CAM) among the
semi-urban and rural students.
5.30 Impact of achievement motivation on the entrepreneurial traits among the
students
5.31 Conclusion
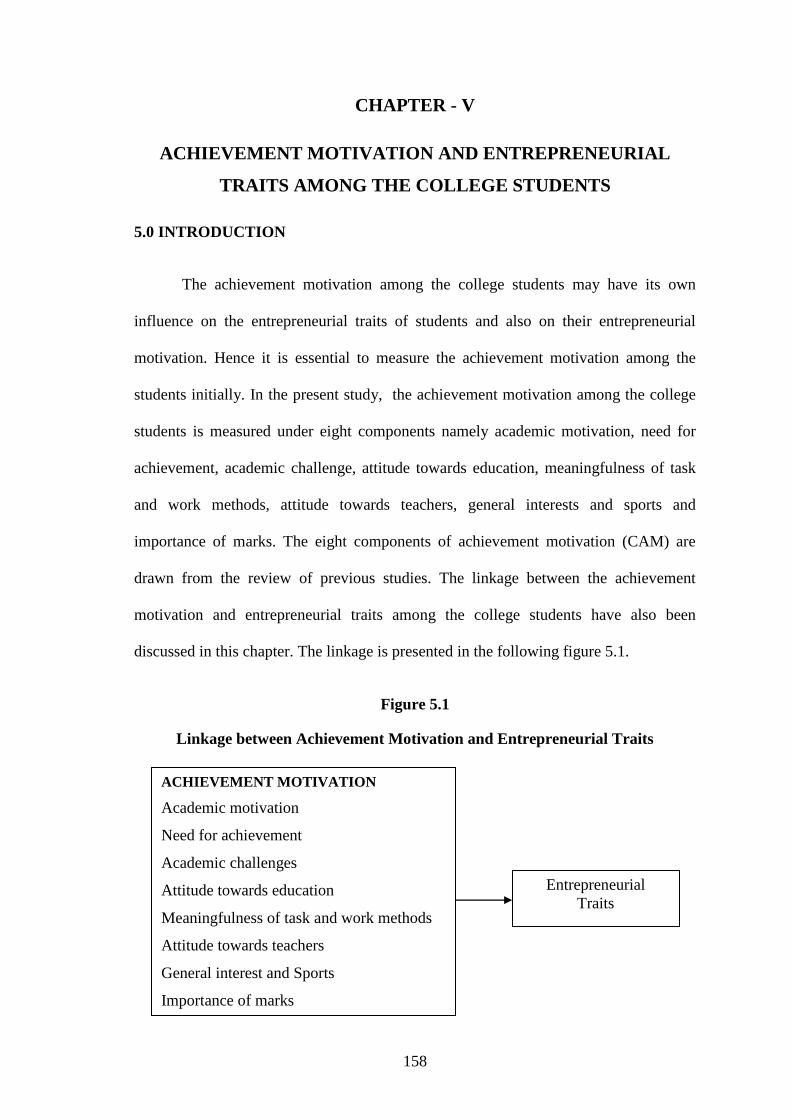
158
CHAPTER - V
ACHIEVEMENT MOTIVATION AND ENTREPRENEURIAL
TRAITS AMONG THE COLLEGE STUDENTS
5.0 INTRODUCTION
The achievement motivation among the college students may have its own
influence on the entrepreneurial traits of students and also on their entrepreneurial
motivation. Hence it is essential to measure the achievement motivation among the
students initially. In the present study, the achievement motivation among the college
students is measured under eight components namely academic motivation, need for
achievement, academic challenge, attitude towards education, meaningfulness of task
and work methods, attitude towards teachers, general interests and sports and
importance of marks. The eight components of achievement motivation (CAM) are
drawn from the review of previous studies. The linkage between the achievement
motivation and entrepreneurial traits among the college students have also been
discussed in this chapter. The linkage is presented in the following figure 5.1.
Figure 5.1
Linkage between Achievement Motivation and Entrepreneurial Traits
ACHIEVEMENT MOTIVATION
Academic motivation
Need for achievement
Academic challenges
Attitude towards education
Meaningfulness of task and work methods
Attitude towards teachers
General interest and Sports
Importance of marks
Entrepreneurial
Traits
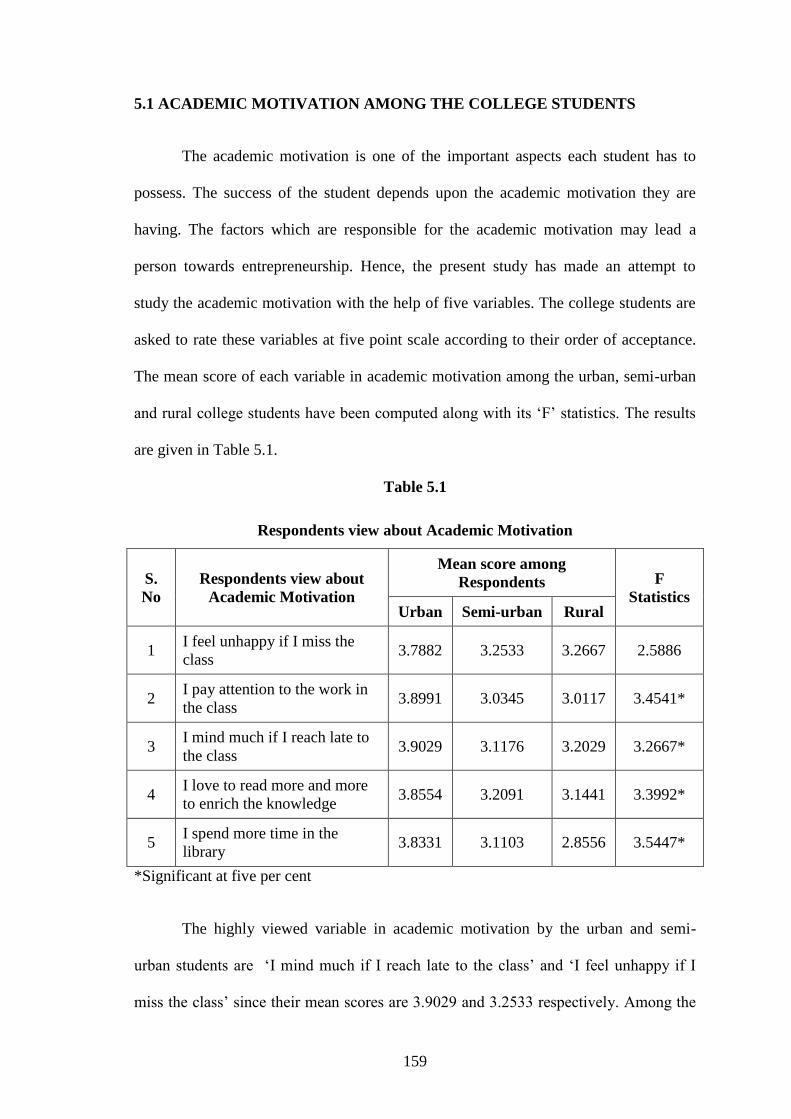
159
5.1 ACADEMIC MOTIVATION AMONG THE COLLEGE STUDENTS
The academic motivation is one of the important aspects each student has to
possess. The success of the student depends upon the academic motivation they are
having. The factors which are responsible for the academic motivation may lead a
person towards entrepreneurship. Hence, the present study has made an attempt to
study the academic motivation with the help of five variables. The college students are
asked to rate these variables at five point scale according to their order of acceptance.
The mean score of each variable in academic motivation among the urban, semi-urban
and rural college students have been computed along with its „F‟ statistics. The results
are given in Table 5.1.
Table 5.1
Respondents view about Academic Motivation
S.
No
Respondents view about
Academic Motivation
Mean score among
Respondents F
Statistics Urban Semi-urban Rural
1 I feel unhappy if I miss the
class 3.7882 3.2533 3.2667 2.5886
2 I pay attention to the work in
the class 3.8991 3.0345 3.0117 3.4541*
3 I mind much if I reach late to
the class 3.9029 3.1176 3.2029 3.2667*
4 I love to read more and more
to enrich the knowledge 3.8554 3.2091 3.1441 3.3992*
5 I spend more time in the
library 3.8331 3.1103 2.8556 3.5447*
*Significant at five per cent
The highly viewed variable in academic motivation by the urban and semi-
urban students are „I mind much if I reach late to the class‟ and „I feel unhappy if I
miss the class‟ since their mean scores are 3.9029 and 3.2533 respectively. Among the

160
rural college students, it is „I feel unhappy if I miss the classes since its mean score is
3.2667. Regarding the respondents view about academic motivation, significant
difference among three group of students have been noticed in four out of five variables
in academic motivation since its „F‟ statistics are significant at five per cent level.
5.2 VARIABLES RELATING TO ACADEMIC MOTIVATION AND ITS
RELIABILITY
The reliability and validity of the variables included in the academic motivation
have been tested with the help of confirmatory factor analysis. The overall reliability of
variables in academic motivation has been estimated with the help of cronbach alpha.
The results are given in Table 5.2.
Table 5.2
Reliability and validity of variables relating to Academic Motivation
S.
No
Variables in
Academic
Motivation
Standardized
factor
loading
„t‟
Statistics
Cronbach
alpha
Composite
reliability
Average
variance
extracted
1
I pay attention to
the work in the
class
0.9148 4.1786* 0.8249 0.7909 56.87
2 I spend more time
in the library 0.8337 3.4582*
3
I love to read
more and more to
enrich the
knowledge
0.8042 3.1173*
4 I feel unhappy if I
miss the class 0.7509 2.8919*
5
I mind much if I
reach late in the
class
0.6881 2.5889*
*Significant at five per cent level

161
The standardized factor loading of the variables in academic motivation varies
from 0.6881 to 0.9148 which reveals the content validity. The significance of „t‟
statistics of the standardized factor loading of the academic motivation reveals the
convergent validity. It is also supported by the composite reliability and average
variance extracted since these are greater than its minimum threshold of 0.50 and 50.00
per cent respectively. The five variables included in the academic motivation explain it
to an extent of 82.49 per cent since its cronbach alpha is 0.8249.
5.3 LEVEL OF ACADEMIC MOTIVATION AMONG THE COLLEGE STUDENTS
The level of academic motivation among the college students is measured by
the mean score of the variables in it. It is denoted by SOAM. In the present study, the
SOAM is confined to less than 2.0, 2.0 to 3.0, 3.1 to 4.0 and above 4.0. The distribution
of students on the basis of their SOAM is illustrated in Table 5.3.
Table 5.3
Score on Academic Motivation (SOAM) among the College Students
S.No Score on Academic
Motivation
Number of Students Total
Urban Semi-urban Rural
1 Less than 2.0 10 23 38 71
2 2.0 - 3.0 23 73 46 142
3 3.1- 4.0 58 136 39 233
4 Above 4.0 57 62 11 130
Total 148 294 134 576
Source : Primary data
The important SOAM among the students are 3.1 to 4.0 and 2.0 to 3.0 which
constitutes 40.45 and 24.65 per cent to the total respectively. The important SOAM
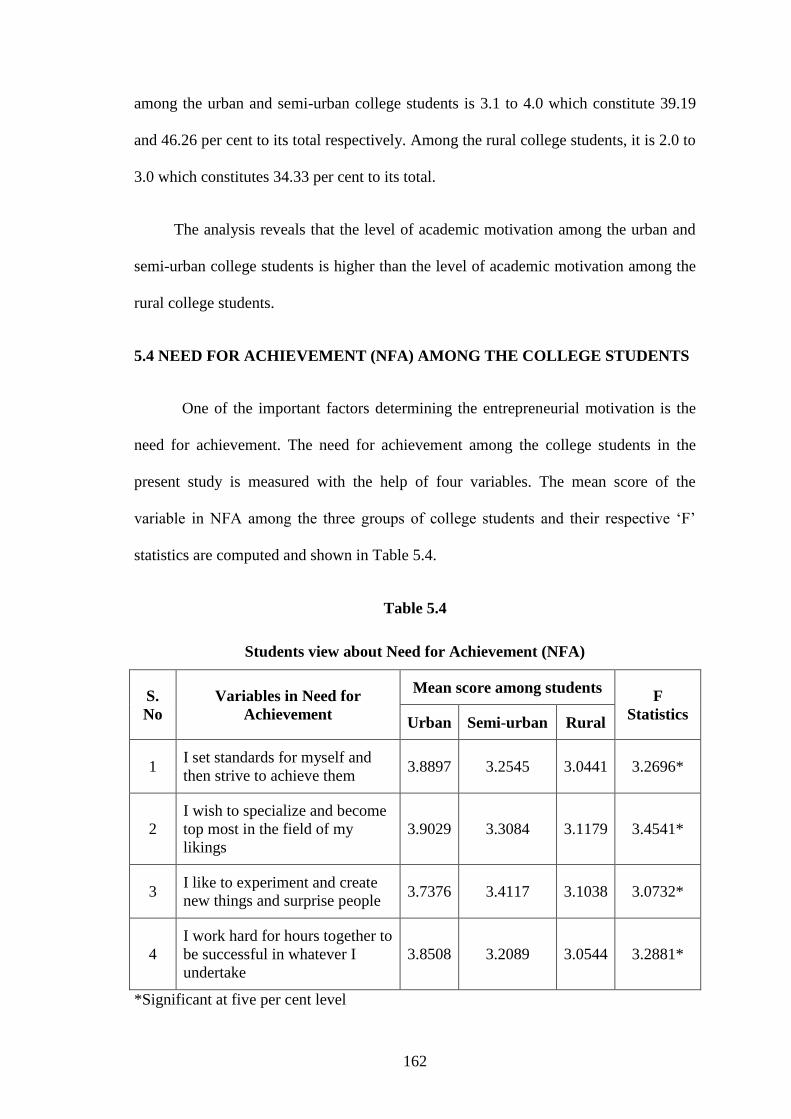
162
among the urban and semi-urban college students is 3.1 to 4.0 which constitute 39.19
and 46.26 per cent to its total respectively. Among the rural college students, it is 2.0 to
3.0 which constitutes 34.33 per cent to its total.
The analysis reveals that the level of academic motivation among the urban and
semi-urban college students is higher than the level of academic motivation among the
rural college students.
5.4 NEED FOR ACHIEVEMENT (NFA) AMONG THE COLLEGE STUDENTS
One of the important factors determining the entrepreneurial motivation is the
need for achievement. The need for achievement among the college students in the
present study is measured with the help of four variables. The mean score of the
variable in NFA among the three groups of college students and their respective „F‟
statistics are computed and shown in Table 5.4.
Table 5.4
Students view about Need for Achievement (NFA)
S.
No
Variables in Need for
Achievement
Mean score among students F
Statistics Urban Semi-urban Rural
1 I set standards for myself and
then strive to achieve them 3.8897 3.2545 3.0441 3.2696*
2
I wish to specialize and become
top most in the field of my
likings
3.9029 3.3084 3.1179 3.4541*
3 I like to experiment and create
new things and surprise people 3.7376 3.4117 3.1038 3.0732*
4
I work hard for hours together to
be successful in whatever I
undertake
3.8508 3.2089 3.0544 3.2881*
*Significant at five per cent level

163
The highly viewed variables in NFA among the urban and semi-urban college
students is „I wish to specialize and become top most in the field of my likings‟ and „I
like to experiment and create new things and surprise people‟ since their respective
mean scores are 3.9029 and 3.4117 respectively. Among the rural college students, it is
„I wish to specialize and become top most in the field of my likings‟ since its mean
score is 3.1179. Regarding the need for achievement, significant difference among the
three group of college students have been noticed in all the four variables since their
respective „F‟ statistics are significant at five per cent level.
5.5 RELIABILITY AND VALIDITY OF VARIABLES RELATING TO NEED FOR
ACHIEVEMENT
Before summarizing the scores of the variables in NFA, it is imperative to
examine the reliability and validity of variables in it. The confirmatory factor analysis
has been administered for this purpose. The overall reliability of the variables in NFA
is estimated with the help of Cronbach Alpha. The results are presented in Table 5.5.
Table 5.5
Reliability and validity of variables relating to need for Achievement
S.
No
Variables in Need for
Achievement
Standardised
factor
loading
„t‟
Statistics
Cronbach
alpha
Composite
reliability
Average
variance
extracted
1
I set standards for myself
and then strive to achieve
them
0.8173 3.1782* 0.7606 0.7417 52.63
2
I wish to specialize and
become top most in the
field of my likings
0.7233 2.8586*
3
I like to experiment and
create new things and
surprise people
0.6509 2.3982*
4
I work hard for hours
together to be successful
in whatever I undertake
0.6175 2.1774*
*Significant at five per cent level

164
The standardized factor loading of the variables in NFA are greater than 0.60
which reveals that content validity of the factor. The significance of „t‟ statistics of the
variables in NFA shows the convergent validity. It is also proved by the composite
reliability and average variance extracted since these are greater than its standard
minimum threshold of 0.50 and 50.00 per cent respectively. The variables included in
NFA explain it to an extent of 76.06 per cent since its cronbach alpha is 0.7606.
5.6 LEVEL OF NEED FOR ACHIEVEMENT AMONG THE STUDENTS
The level of need for achievement among the college students is measured by
the mean score of the variables in NFA. It is denoted by SONFA. In the present study,
the SONFA is confined to less than 2.0, 2.0 to 3.0, 3.1 to 4.0 and above 4.0. The
distribution of students on the basis of their SONFA is given in Table 5.6.
Table 5.6
Score on Need for Achievement (SONFA) among the students
S. No Score on Need for
Achievement
Number of students Total
Urban Semi-urban Rural
1 Less than 2.0 10 35 20 65
2 2.0-3.0 12 72 78 162
3 3.1- 4.0 68 133 26 227
4 Above 4.0 58 54 10 122
Total 148 294 134 576
Source : Primary data
The important SONFA among the college students in the present study are 3.1
to 4.0 and 2.0 to 3.0 which constitutes 39.41 and 28.13 per cent to the total
respectively. The important SONFA among the urban and semi-urban college students

165
is 3.1 to 4.0 which constitute 45.95 and 45.24 per cent to its total respectively. Among
the rural college students the important SONFA is 2.0 to 3.0 which constitutes 58.21
per cent to the total.
The analysis reveals that the scores on need for achievement is higher among the
urban and semi-urban college students than the rural college students.
5.7 ACADEMIC CHALLENGE AMONG THE STUDENTS
It shows the students view about the challenges faced by the students in their
academic career. Since the view on academic challenge among the students may have
its own influence on the achievement motivation, it is included as one of the
achievement motivation variable in this study. It is measured with the help of two
variables. The mean score of each variable in academic challenge among the urban,
semi-urban and rural college students have been computed separately along with its „F‟
statistics. The results are shown in Table 5.7.
Table 5.7
Students view about the Academic Challenge (AC)
S.
No
Variables in Academic
Challenge
Mean score among students F
Statistics Urban Semi-urban Rural
1
I have a tendency to find
solution to problems which
others unable to succeed.
3.9969 3.2153 3.1109 3.6564*
2
I aspire to get excellent
results in all academic
competitions
3.8438 3.4541 3.0996 3.5901*
*Significant at five per cent level
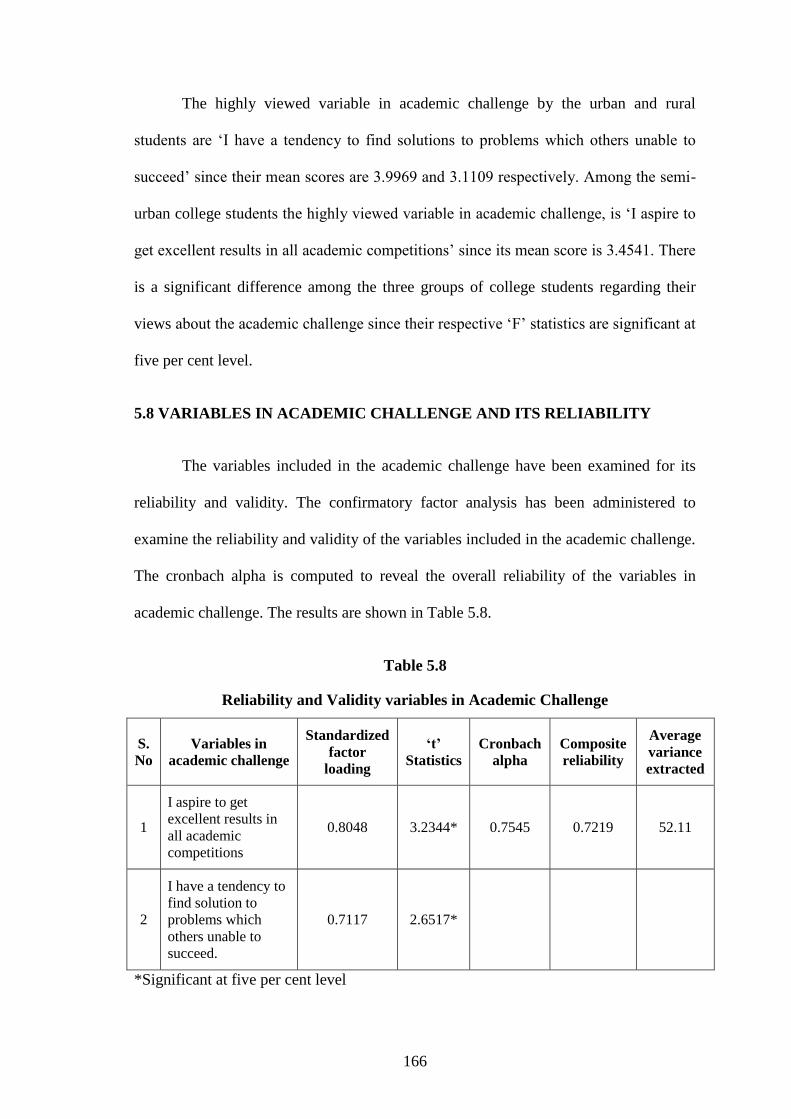
166
The highly viewed variable in academic challenge by the urban and rural
students are „I have a tendency to find solutions to problems which others unable to
succeed‟ since their mean scores are 3.9969 and 3.1109 respectively. Among the semi-
urban college students the highly viewed variable in academic challenge, is „I aspire to
get excellent results in all academic competitions‟ since its mean score is 3.4541. There
is a significant difference among the three groups of college students regarding their
views about the academic challenge since their respective „F‟ statistics are significant at
five per cent level.
5.8 VARIABLES IN ACADEMIC CHALLENGE AND ITS RELIABILITY
The variables included in the academic challenge have been examined for its
reliability and validity. The confirmatory factor analysis has been administered to
examine the reliability and validity of the variables included in the academic challenge.
The cronbach alpha is computed to reveal the overall reliability of the variables in
academic challenge. The results are shown in Table 5.8.
Table 5.8
Reliability and Validity variables in Academic Challenge
S.
No
Variables in
academic challenge
Standardized
factor
loading
„t‟
Statistics
Cronbach
alpha
Composite
reliability
Average
variance
extracted
1
I aspire to get
excellent results in
all academic
competitions
0.8048 3.2344* 0.7545 0.7219 52.11
2
I have a tendency to
find solution to
problems which
others unable to
succeed.
0.7117 2.6517*
*Significant at five per cent level
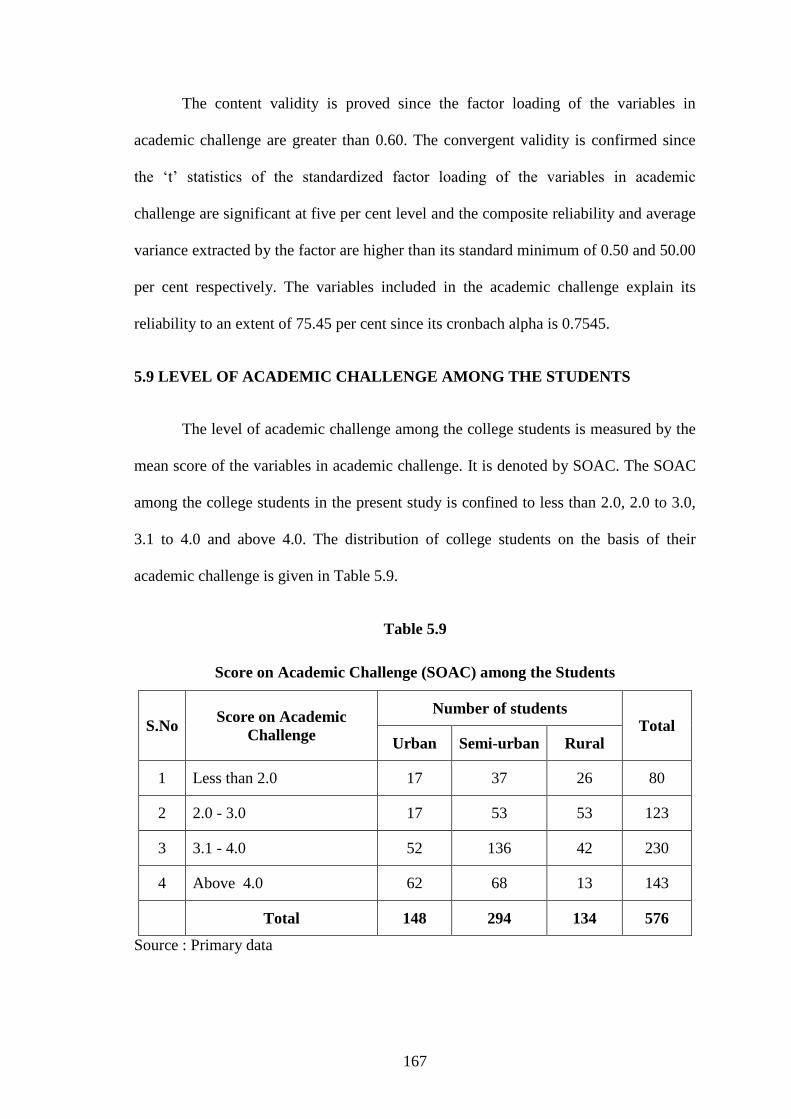
167
The content validity is proved since the factor loading of the variables in
academic challenge are greater than 0.60. The convergent validity is confirmed since
the „t‟ statistics of the standardized factor loading of the variables in academic
challenge are significant at five per cent level and the composite reliability and average
variance extracted by the factor are higher than its standard minimum of 0.50 and 50.00
per cent respectively. The variables included in the academic challenge explain its
reliability to an extent of 75.45 per cent since its cronbach alpha is 0.7545.
5.9 LEVEL OF ACADEMIC CHALLENGE AMONG THE STUDENTS
The level of academic challenge among the college students is measured by the
mean score of the variables in academic challenge. It is denoted by SOAC. The SOAC
among the college students in the present study is confined to less than 2.0, 2.0 to 3.0,
3.1 to 4.0 and above 4.0. The distribution of college students on the basis of their
academic challenge is given in Table 5.9.
Table 5.9
Score on Academic Challenge (SOAC) among the Students
S.No Score on Academic
Challenge
Number of students Total
Urban Semi-urban Rural
1 Less than 2.0 17 37 26 80
2 2.0 - 3.0 17 53 53 123
3 3.1 - 4.0 52 136 42 230
4 Above 4.0 62 68 13 143
Total 148 294 134 576
Source : Primary data
168
The important SOAC among the college students is 3.1 to 4.0 and above 4.0
which constitutes 39.93 and 24.83 per cent to the total respectively. The important
SOAC among the urban college students is above 4.0 which constitute 41.89 per cent to
its total. Among the semi-urban college students it is 3.1 to 4.0 which constitutes 46.26
per cent to its total whereas among the rural college students the important SOAC is 2.0
to 3.0 which constitutes 39.55 per cent to the total.
The analysis reveals that the level of academic challenge among the urban
college students is higher than the semi-urban college students whereas among the
semi-urban college students the level of academic challenge is higher than the rural
college students.
5.10 ATTITUDE TOWARDS EDUCATION AMONG THE STUDENTS
The student‟s attitude towards education is one of the factors influencing the
achievement motivation which in turn may have its own impact on the entrepreneurial
motivation among the students. Hence it is included as one of the variables of
achievement motivation. It is measured with the help of five variables. The mean scores
of all the five variables towards attitude towards education among the three groups of
college students and their respective „F‟ statistics are computed and presented in
Table 5.10.

169
Table 5.10
Students view about Attitude towards Education
S. No Variables in attitude
towards education
Mean score among students F Statistics
Urban Semi-urban Rural
1 I like my studies. 3.7991 3.5081 3.3996 2.4509*
2 I like to attend the class
regularly. 3.8284 3.3994 3.0884 3.6579*
3 I prefer to enrich my
knowledge. 3.9099 3.4045 3.0226 3.7345*
4 Education plays a vital
role in my life. 3.9344 3.3891 3.1773 3.7011*
5 Education gives a status
in the society. 3.9909 3.3224 3.0667 3.8583*
*Significant at five per cent level
The highly viewed variable as regards the attitude towards education among the
urban college students are „education gives a status in the society‟ and „education plays
a vital role in my life‟ since their mean scores are 3.9909 and 3.9344 respectively
whereas among the semi-urban college students the highly viewed variable are „I like
my studies‟ and „I prefer to enrich my knowledge‟ since their mean scores are and
3.5081 and 3.4045 respectively. Among the rural college students the highly viewed
variable are „I like my studies‟ and „education plays a vital role in my life‟ since their
mean scores are 3.3996 and 3.1773 respectively.
Regarding the college students view about the attitude towards education,
significant difference among the three groups of students have been noticed in all the
five variables since their respective „F‟ statistics are significant at five per cent level.

170
5.11 RELIABILITY AND VALIDITY OF VARIABLES RELATING TO ATTITUDE
TOWARD EDUCATION
Before summarizing the scores of the variables relating to attitude towards
education, it is imperative to examine its reliability and validity. The confirmatory
factor analysis has been applied to examine the reliability and validity of variables in it.
The overall reliability has been tested with the help of cronbach alpha. The results are
shown in Table 5.11.
Table 5.11
Reliability and validity variables relating to Attitude towards Education (ATE)
S.
No
Variables in
Attitude towards
Education
Standardized
factor
loading
„t‟
Statistics
Cronbach
alpha
Composite
reliability
Average
variance
extracted
1 I like to attend the
class regularly. 0.8914 3.8183* 0.7949 0.7709 54.48
2 Education plays a
vital role in my life. 0.8025 3.4091*
3
Education gives a
status in the
society. 0.7906 3.3884*
4 I like my studies. 0.7143 3.9139*
5 I prefer to enrich
my knowledge. 0.6824 2.6879*
*Significant at five per cent level
The standardized factor loading of the variables relating to attitude towards
education are greater than 0.60 which reveals the content validity. The significance of
„t‟ statistics of the standardized factor loading of the variables relating to attitude
towards education reveals the convergent validity. It is also proved by the composite
reliability and average variance extracted since these are greater than its minimum
threshold of 0.50 and 50.00 per cent respectively. The five variables included in the
attitude towards education explain it to an extent of 79.49 per cent since its cronbach
alpha is 0.7949.

171
5.12 LEVEL OF ATTITUDE TOWARD EDUCATION AMONG THE STUDENTS
The level of attitude towards education among the college students is measured
with the help of the mean scores of the variables. It is denoted by SOATE. In the
present study, the SOATE is confined to less than 2.0, 2.0 to 3.0, 3.1 to 4.0 and above
4.0. The distribution of students on the basis of their SOATE is illustrated in
Table 5.12.
Table 5.12
Score on Attitude towards Education (SOATE) among the students
S. No Score on Attitude towards
Education
Number of students Total
Urban Semi-urban Rural
1 Less than 2.0 9 37 27 73
2 2.0-3.0 30 43 42 115
3 3.1-4.0 65 165 49 279
4 Above 4.0 44 49 16 109
Total 148 294 134 576
Source : Primary data
The important SOATE among the college students are 3.1 to 4.0 and 2.0 to 3.0
which constitutes 43.58 and 21.18 per cent to the total respectively. The important
SOATE among the urban college students is above 4.0 which constitute 43.92 per cent
to its total whereas among semi-urban college students, it is 3.1 to 4.0 which constitutes
56.12 per cent to its total. Among the rural college students the important SOATE is
2.0 to 3.0 which constitute 36.57 per cent to its total.
The analysis reveals that the level of attitude towards education among the
urban college students is higher than the level of attitude towards education among the
semi-urban and rural students.

172
5.13 MEANINGFULNESS OF TASK AND WORK METHODS (MTWM) AMONG
STUDENTS
The students understanding and involvement in the task and work methods in
their education may influence their achievement motivation which may lead to
entrepreneurial motivation. Hence, it is included as one of the variable in the
achievement motivation. It is measured with the help of seven variables. The mean
scores of each variable in meaningfulness of task and work methods among the three
groups of students and their respective „F‟ statistics have been computed and shown in
Table 5.13.
Table 5.13
Meaningfulness of Task and Work methods (MTWM) among the students
S.
No
Variables in Meaningfulness of
Task and Work methods
Mean score among students F
Statistics Urban Semi-urban Rural
1 I do task which is result oriented. 3.7376 3.3042 3.0244 3.1173*
2 The present course of my study will
help me to prosper in my life. 3.8117 3.3911 3.1775 3.0044*
3
I feel very much frustrated if I do
not get a chance to compete in the
field of my choice. 3.8024 3.2545 3.0969 3.2673*
4 I regularly take down notes in the
class and complete my assignments. 3.9179 3.1889 3.1088 3.4541*
5 I do a lot of preparation at home for
the next day‟s work in the class. 3.9208 3.2673 3.1177 3.5949*
6 I study according to time schedule. 3.9345 3.3117 3.2604 3.4083*
7 I follow the work method which is
results oriented. 3.9909 3.2609 3.1803 3.6617*
*Significant at five per cent level
The highly viewed variables in the meaningfulness of task and work methods
by the urban and semi-urban college students are „I follow the work method which is
result oriented‟ and „the present course of study will help me to prosper in life‟ since
their mean scores are 3.9909 and 3.3911 respectively. Among the rural college students

173
the highly viewed variable is „I study according to time schedule‟ since its mean score
is 3.2604. Regarding the students view about the variables in meaningfulness of task
and work methods, significant difference among the three group of students have been
noticed in the case of all seven variables in it since their respective „F‟ statistics are
significant at five per cent level.
5.14 RELIABILITY AND VALIDITY OF VARIABLES RELATING TO
MEANINGFULNESS OF TASK AND WORK METHODS
The score of seven variables in the „meaningfulness of task and work methods‟
have been included for confirmatory factor analysis in order to examine its reliability
and validity. The overall reliability of variables relating to meaningfulness of task and
work methods has been tested with the help of cronbach alpha. The results are
illustrated in Table 5.14.
Table 5.14
Reliability and Validity of variables relating to Meaningfulness of Task and
Work Methods (MTWM)
S.
No
Variables in Meaningfulness
of Task and Work Methods
Standardized
factor
loading
„t‟
Statistics
Cronbach
alpha
Composite
reliability
Average
variance
extracted
1
I regularly take down notes in
the class and complete my
assignments
0.8548 3.7341* 0.7667 0.7413 52.17
2 I study according to time
schedule. 0.8011 3.6173*
3
I do a lot of preparation at
home for the next day‟s work
in the class.
0.7883 3.5969*
4 I do task which is result
oriented. 0.7549 3.3894*
5 I follow the work method
which is results oriented. 0.7317 3.1108*
6
I frustrated if I do not get a
chance to compete in the field
of my choice.
0.7076 2.8991*
7
The present course of my study
will help me to prosper in my
life.
0.6539 2.5887*
*Significant at five per cent level

174
The standardized factor loading of the variables relating to meaningfulness of
task and work methods varies from 0.6539 to 0.8548 which reveals the content validity.
The significance of „t‟ statistics of the standardized factor loading of the variables in
meaningfulness of task and work methods reveals the convergent validity. It is also
proved by the composite reliability and average variance extracted since these are
greater than its minimum threshold of 0.50 and 50.00 per cent respectively. The seven
variables included in the meaningfulness of task and work methods explain it to an
extent of 76.67 per cent since its cronbach alpha is 0.7667.
5.15 LEVEL OF MEANINGFULNESS OF TASK AND WORK METHODS AMONG
THE STUDENTS
The level of meaningfulness of task and work methods among the students is
measured by the mean scores of the variables relating to meaningfulness of task and
work methods. It is denoted by SOMTWM. In the present study, the SOMTWM is
confined to less than 2.0, 2.0 to 3.0, 3.1 to 4.0 and above 4.0. The distribution of
students on the basis of their SOMTWM is illustrated in Table 5.15.
Table 5.15
Score on Meaningfulness of Task and Work Methods (SOMTWM)
among the students
S.No
Score on Meaningfulness
of task and work
Methods
Number of students
Total Urban Semi-urban Rural
1 Less than 2.0 11 35 22 68
2 2.0-3.0 23 68 38 129
3 3.1-4.0 61 128 53 242
4 Above 4.0 53 63 21 137
Total 148 294 134 576
Source : Primary data
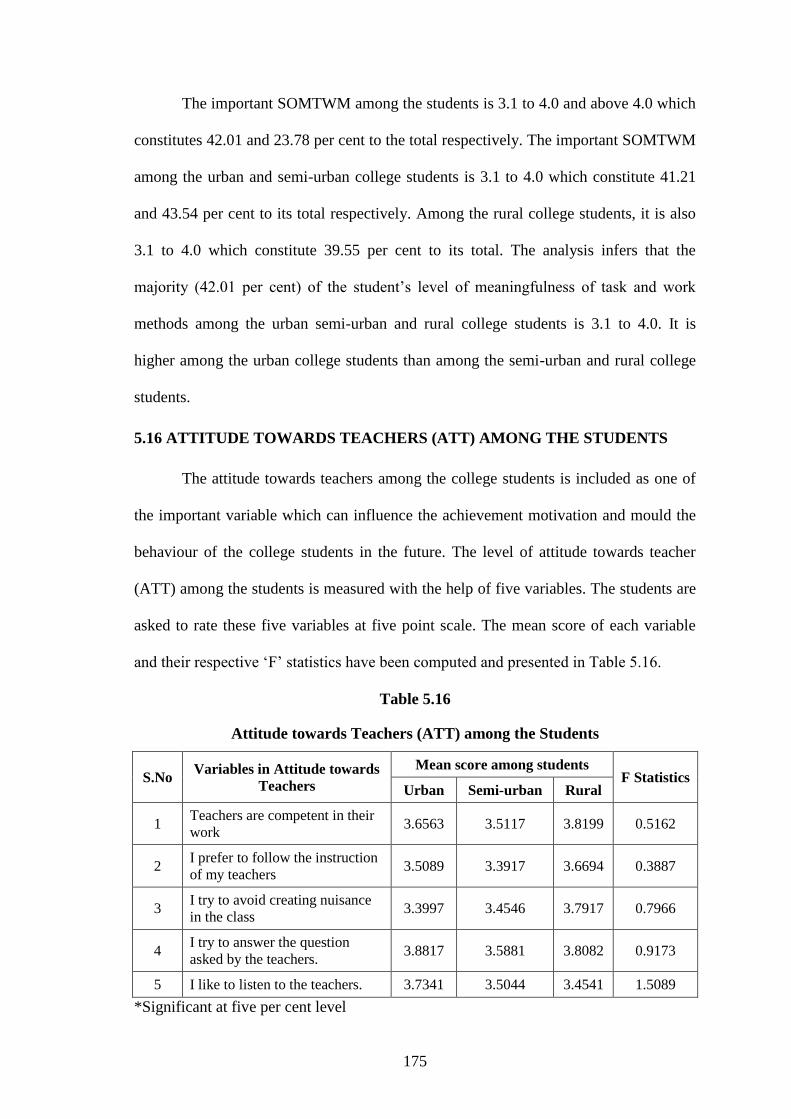
175
The important SOMTWM among the students is 3.1 to 4.0 and above 4.0 which
constitutes 42.01 and 23.78 per cent to the total respectively. The important SOMTWM
among the urban and semi-urban college students is 3.1 to 4.0 which constitute 41.21
and 43.54 per cent to its total respectively. Among the rural college students, it is also
3.1 to 4.0 which constitute 39.55 per cent to its total. The analysis infers that the
majority (42.01 per cent) of the student‟s level of meaningfulness of task and work
methods among the urban semi-urban and rural college students is 3.1 to 4.0. It is
higher among the urban college students than among the semi-urban and rural college
students.
5.16 ATTITUDE TOWARDS TEACHERS (ATT) AMONG THE STUDENTS
The attitude towards teachers among the college students is included as one of
the important variable which can influence the achievement motivation and mould the
behaviour of the college students in the future. The level of attitude towards teacher
(ATT) among the students is measured with the help of five variables. The students are
asked to rate these five variables at five point scale. The mean score of each variable
and their respective „F‟ statistics have been computed and presented in Table 5.16.
Table 5.16
Attitude towards Teachers (ATT) among the Students
S.No Variables in Attitude towards
Teachers
Mean score among students F Statistics
Urban Semi-urban Rural
1 Teachers are competent in their
work 3.6563 3.5117 3.8199 0.5162
2 I prefer to follow the instruction
of my teachers 3.5089 3.3917 3.6694 0.3887
3 I try to avoid creating nuisance
in the class 3.3997 3.4546 3.7917 0.7966
4 I try to answer the question
asked by the teachers. 3.8817 3.5881 3.8082 0.9173
5 I like to listen to the teachers. 3.7341 3.5044 3.4541 1.5089
*Significant at five per cent level
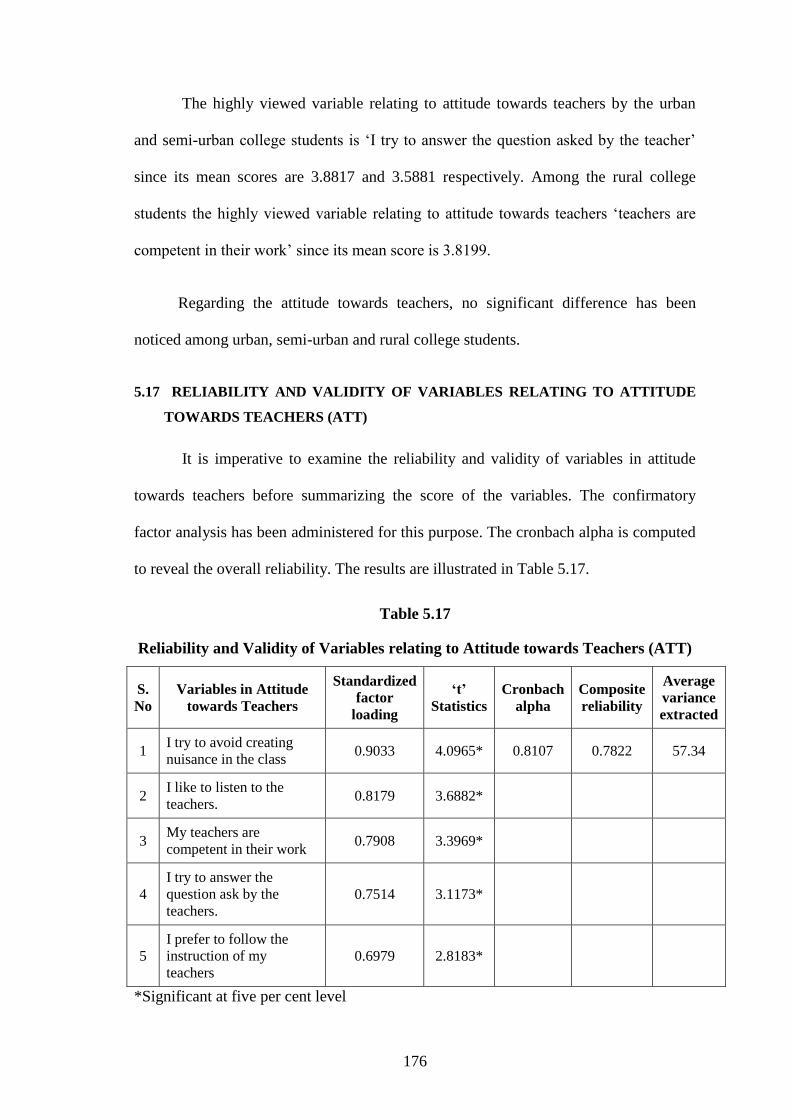
176
The highly viewed variable relating to attitude towards teachers by the urban
and semi-urban college students is „I try to answer the question asked by the teacher‟
since its mean scores are 3.8817 and 3.5881 respectively. Among the rural college
students the highly viewed variable relating to attitude towards teachers „teachers are
competent in their work‟ since its mean score is 3.8199.
Regarding the attitude towards teachers, no significant difference has been
noticed among urban, semi-urban and rural college students.
5.17 RELIABILITY AND VALIDITY OF VARIABLES RELATING TO ATTITUDE
TOWARDS TEACHERS (ATT)
It is imperative to examine the reliability and validity of variables in attitude
towards teachers before summarizing the score of the variables. The confirmatory
factor analysis has been administered for this purpose. The cronbach alpha is computed
to reveal the overall reliability. The results are illustrated in Table 5.17.
Table 5.17
Reliability and Validity of Variables relating to Attitude towards Teachers (ATT)
S.
No
Variables in Attitude
towards Teachers
Standardized
factor
loading
„t‟
Statistics
Cronbach
alpha
Composite
reliability
Average
variance
extracted
1 I try to avoid creating
nuisance in the class 0.9033 4.0965* 0.8107 0.7822 57.34
2 I like to listen to the
teachers. 0.8179 3.6882*
3 My teachers are
competent in their work 0.7908 3.3969*
4
I try to answer the
question ask by the
teachers.
0.7514 3.1173*
5
I prefer to follow the
instruction of my
teachers
0.6979 2.8183*
*Significant at five per cent level

177
The standardized factor loading of the variables relating to attitude towards
teachers are greater than 0.60 which shows the content validity. The significance of „t‟
statistics of the standardized factor loading of the variables relating to attitude towards
teachers reveals the convergent validity. It is also confirmed by the composite
reliability and average variance extracted since these are greater than its minimum
threshold of 0.50 and 50.00 per cent respectively. The five variables included in the
„attitude towards teachers‟ explain it to an extent of 81.09 per cent since its cronbach
alpha is 0.8109.
5.18 LEVEL OF ATTITUDE TOWARDS TEACHERS AMONG THE STUDENTS
The level of attitude towards teachers among the students is measured with the
help of mean score of the variables in it. It is denoted by SOATT. In the present study,
the SOATT is confined to less than 2.0, 2.0 to 3.0, 3.1 to 4.0 and above 4.0. The
distribution of students on the basis of their SOATT is given in Table 5.18.
Table 5.18
Score on Attitude Towards Teachers (SOATT) among the Students
S.
No
Score on Attitude
Towards Teachers
Number of students Total
Urban Semi-urban Rural
1 Less than 2.0 20 52 13 85
2 2.0-3.0 32 59 26 117
3 3.1-4.0 53 126 58 237
4 Above 4.0 43 57 37 137
Total 148 294 134 576
Source : Primary data
The important SOATT among the students are 3.1 to 4.0 and above 4.0 which
constitutes 41.15 and 23.78 per cent to the total respectively. The important SOATT
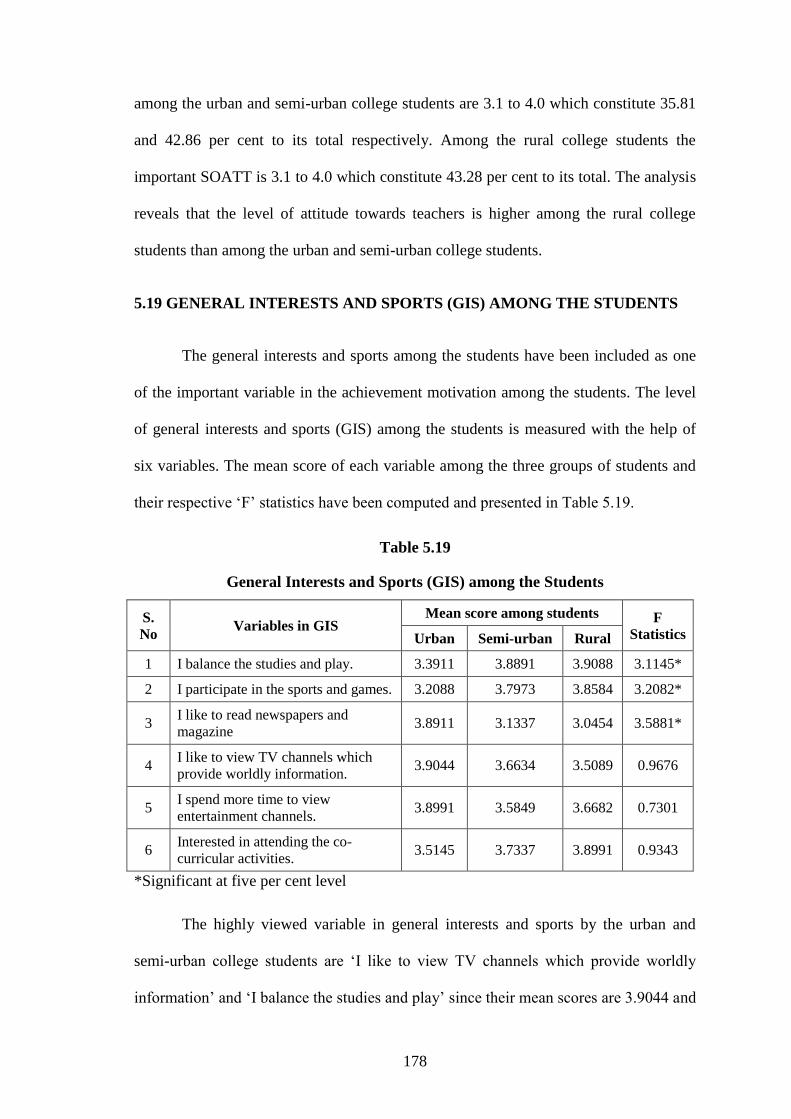
178
among the urban and semi-urban college students are 3.1 to 4.0 which constitute 35.81
and 42.86 per cent to its total respectively. Among the rural college students the
important SOATT is 3.1 to 4.0 which constitute 43.28 per cent to its total. The analysis
reveals that the level of attitude towards teachers is higher among the rural college
students than among the urban and semi-urban college students.
5.19 GENERAL INTERESTS AND SPORTS (GIS) AMONG THE STUDENTS
The general interests and sports among the students have been included as one
of the important variable in the achievement motivation among the students. The level
of general interests and sports (GIS) among the students is measured with the help of
six variables. The mean score of each variable among the three groups of students and
their respective „F‟ statistics have been computed and presented in Table 5.19.
Table 5.19
General Interests and Sports (GIS) among the Students
S.
No Variables in GIS
Mean score among students F
Statistics Urban Semi-urban Rural
1 I balance the studies and play. 3.3911 3.8891 3.9088 3.1145*
2 I participate in the sports and games. 3.2088 3.7973 3.8584 3.2082*
3 I like to read newspapers and
magazine 3.8911 3.1337 3.0454 3.5881*
4 I like to view TV channels which
provide worldly information. 3.9044 3.6634 3.5089 0.9676
5 I spend more time to view
entertainment channels. 3.8991 3.5849 3.6682 0.7301
6 Interested in attending the co-
curricular activities. 3.5145 3.7337 3.8991 0.9343
*Significant at five per cent level
The highly viewed variable in general interests and sports by the urban and
semi-urban college students are „I like to view TV channels which provide worldly
information‟ and „I balance the studies and play‟ since their mean scores are 3.9044 and

179
3.8891 respectively. Among the rural college students, it is also „I balance the studies
and play‟ since its mean score is 3.9088. Regarding the college students view on
variables relating to general interests and sports, significant difference among the three
group of students have been noticed in the case of three out of six variables in general
interests and sports since their respective „F‟ statistics are significant at five per cent
level.
5.20 RELIABILITY AND VALIDITY OF VARIABLES RELATING TO GENERAL
INTERESTS AND SPORTS (GIS)
The score of the variables relating to general interests and sports have been
included for confirmatory factor analysis in order to examine the reliability and validity
of variables. The cronbach alpha is computed to examine the overall reliability. The
results are shown in Table 5.20.
Table 5.20
Reliability and Validity of variables relating to General Interests and Sports
S.
No
Variables in General
Interests and Sports
Standardized
factor
loading
„t‟
Statistics
Cronbach
alpha
Composite
reliability
Average
variance
extracted
1
Interested in attending
the co-curricular
activities.
0.9033 4.1082* 0.8143 0.7829 54.92
2
I like to view TV
channels which provide
worldly information.
0.8644 3.6884*
3
I spend more time to
view entertainment
channels.
0.8021 3.3919*
4 I balance the studies and
play. 0.7667 3.1391*
5 I like to read newspapers
and magazine 0.7209 2.7309*
6 I participate in the sports
and games. 0.6557 2.3991*
*Significant at five per cent level
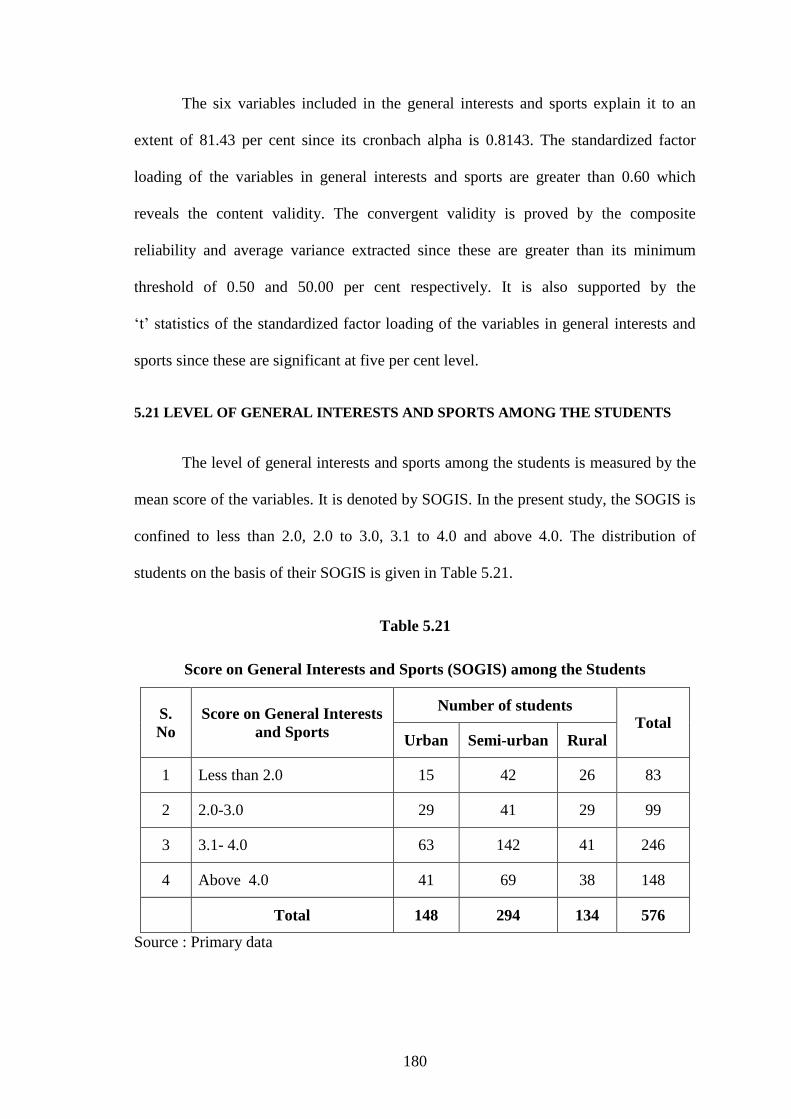
180
The six variables included in the general interests and sports explain it to an
extent of 81.43 per cent since its cronbach alpha is 0.8143. The standardized factor
loading of the variables in general interests and sports are greater than 0.60 which
reveals the content validity. The convergent validity is proved by the composite
reliability and average variance extracted since these are greater than its minimum
threshold of 0.50 and 50.00 per cent respectively. It is also supported by the
„t‟ statistics of the standardized factor loading of the variables in general interests and
sports since these are significant at five per cent level.
5.21 LEVEL OF GENERAL INTERESTS AND SPORTS AMONG THE STUDENTS
The level of general interests and sports among the students is measured by the
mean score of the variables. It is denoted by SOGIS. In the present study, the SOGIS is
confined to less than 2.0, 2.0 to 3.0, 3.1 to 4.0 and above 4.0. The distribution of
students on the basis of their SOGIS is given in Table 5.21.
Table 5.21
Score on General Interests and Sports (SOGIS) among the Students
S.
No
Score on General Interests
and Sports
Number of students Total
Urban Semi-urban Rural
1 Less than 2.0 15 42 26 83
2 2.0-3.0 29 41 29 99
3 3.1- 4.0 63 142 41 246
4 Above 4.0 41 69 38 148
Total 148 294 134 576
Source : Primary data
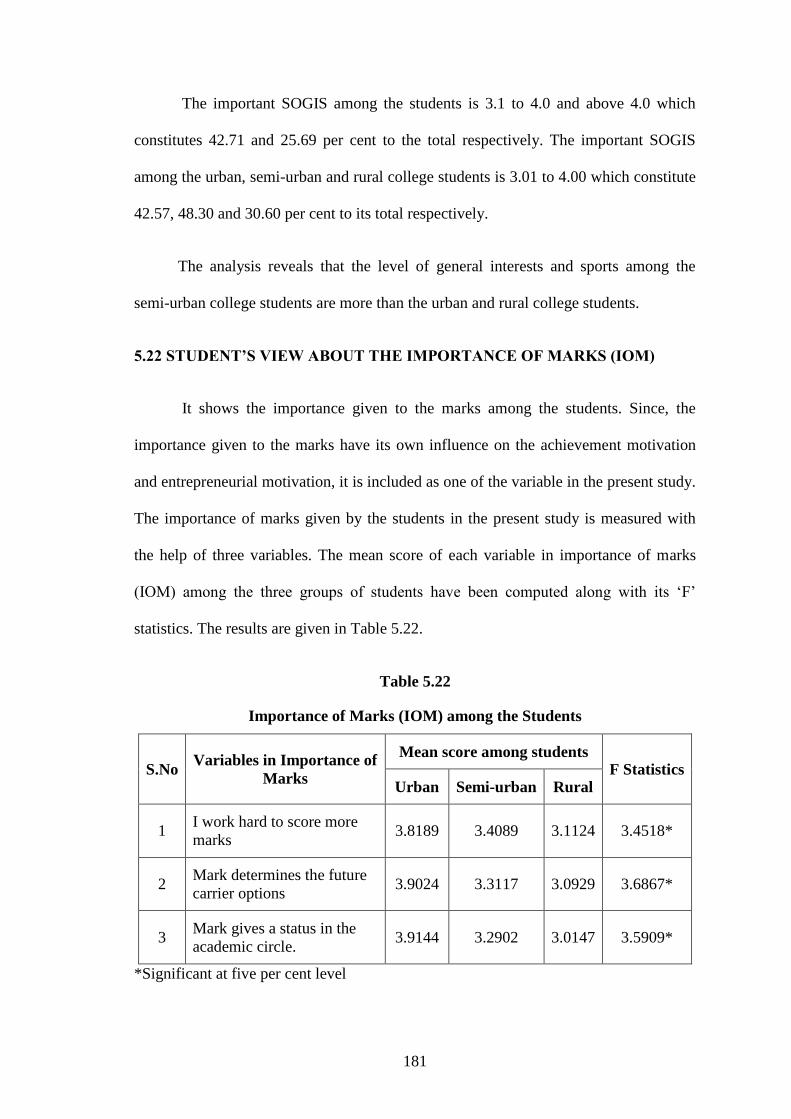
181
The important SOGIS among the students is 3.1 to 4.0 and above 4.0 which
constitutes 42.71 and 25.69 per cent to the total respectively. The important SOGIS
among the urban, semi-urban and rural college students is 3.01 to 4.00 which constitute
42.57, 48.30 and 30.60 per cent to its total respectively.
The analysis reveals that the level of general interests and sports among the
semi-urban college students are more than the urban and rural college students.
5.22 STUDENT‟S VIEW ABOUT THE IMPORTANCE OF MARKS (IOM)
It shows the importance given to the marks among the students. Since, the
importance given to the marks have its own influence on the achievement motivation
and entrepreneurial motivation, it is included as one of the variable in the present study.
The importance of marks given by the students in the present study is measured with
the help of three variables. The mean score of each variable in importance of marks
(IOM) among the three groups of students have been computed along with its „F‟
statistics. The results are given in Table 5.22.
Table 5.22
Importance of Marks (IOM) among the Students
S.No Variables in Importance of
Marks
Mean score among students F Statistics
Urban Semi-urban Rural
1 I work hard to score more
marks 3.8189 3.4089 3.1124 3.4518*
2 Mark determines the future
carrier options 3.9024 3.3117 3.0929 3.6867*
3 Mark gives a status in the
academic circle. 3.9144 3.2902 3.0147 3.5909*
*Significant at five per cent level

182
Among the urban college students the highly viewed variable in „importance of
marks‟ is „marks gives a status in the academic circle‟ since its mean score is 3.9144.
Among the semi-urban and rural college students the highly viewed variable are „I
work hard to score more marks‟ since their mean score are 3.4089 and 3.1124
respectively. Regarding the students‟ view on variables relating to „importance of
marks‟ significant difference among the three group of students have been noticed in
the case of all the three variables included in the importance of marks since their
respective „F‟ statistics are significant at five per cent level.
5.23 RELIABILITY AND VALIDITY OF VARIABLES RELATING TO
IMPORTANCE OF MARKS (IOM)
The mean score of the variables in the importance of marks has been included to
examine the reliability and validity of the variables. The confirmatory factor analysis
has been administered for this purpose. The overall reliability has been tested with the
help of cronbach alpha. The results are given in Table 5.23.
Table 5.23
Reliability and Validity of variables relating to the Importance of Marks
S.
No
Variables in
Importance of
Marks
Standardized
factor
loading
„t‟
Statistics
Cronbach
alpha
Composite
reliability
Average
variance
extracted
1
Mark determines
the future carrier
options
0.8184 3.5089* 0.7336 0.7049 50.94
2
Mark gives a status
in the academic
circle.
0.7503 2.7169*
3 I work hard to
score more marks. 0.6592 2.4573*
*Significant at five per cent level

183
The standardized factor loading of the variables in importance of marks varies
from 0.6592 to 0.8184 which reveals the content validity of the factor. the significance
of „t‟ statistics of the standardized factor loading of the variables in importance of
marks indicates the convergent validity. It is also proved by the composite reliability
and average threshold of 0.50 and 50.00 per cent respectively. The included three
variables in importance of marks explain it to an extent of 73.36 per cent since its
cronbach alpha is 0.7336.
5.24 LEVEL OF IMPORTANCE GIVEN TO MARKS AMONG THE STUDENTS
The level of importance given to the marks among the students is measured by
the mean score of the variables. It is denoted by SOIOM. In the present study, the
SOIOM is classified into less than 2.0, 2.0 to 3.0, 3.1 to 4.0 and above 4.0. The
distribution of students on the basis of their SOIOM is given in Table 5.24.
Table 5.24
Score on Importance given to Marks (SOIOM) among the Students
S.
No
Score on Importance
given to Marks
Number of students Total
Urban Semi-urban Rural
1 Less than 2.0 13 50 26 89
2 2.0-3.0 26 70 52 148
3 3.1-4.0 72 123 37 232
4 Above 4.0 37 51 19 107
Total 148 294 134 576
Source : Primary data
The important SOIOM among the students are 3.1 to 4.0 and 2.0 to 3.0 which
constitutes 40.28 and 25.69 per cent to the total respectively. The important SOIOM
among the urban and semi-urban college students is 3.1 to 4.0 which constitutes 48.65
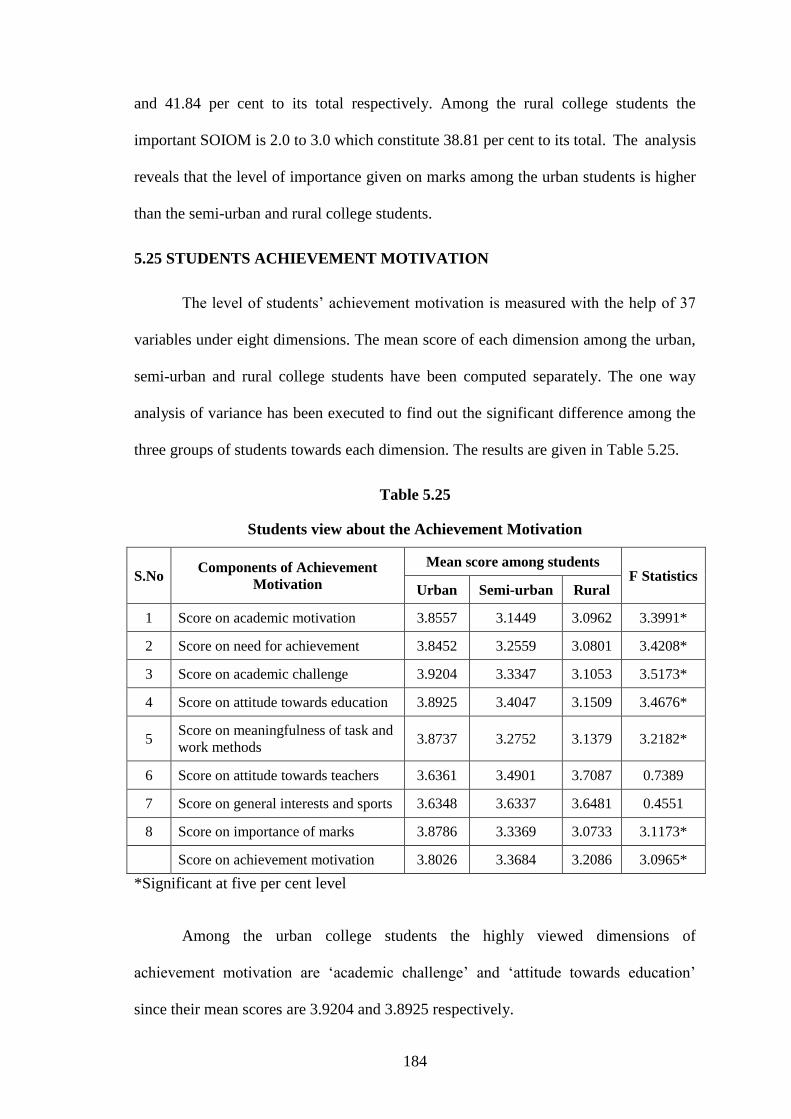
184
and 41.84 per cent to its total respectively. Among the rural college students the
important SOIOM is 2.0 to 3.0 which constitute 38.81 per cent to its total. The analysis
reveals that the level of importance given on marks among the urban students is higher
than the semi-urban and rural college students.
5.25 STUDENTS ACHIEVEMENT MOTIVATION
The level of students‟ achievement motivation is measured with the help of 37
variables under eight dimensions. The mean score of each dimension among the urban,
semi-urban and rural college students have been computed separately. The one way
analysis of variance has been executed to find out the significant difference among the
three groups of students towards each dimension. The results are given in Table 5.25.
Table 5.25
Students view about the Achievement Motivation
S.No Components of Achievement
Motivation
Mean score among students F Statistics
Urban Semi-urban Rural
1 Score on academic motivation 3.8557 3.1449 3.0962 3.3991*
2 Score on need for achievement 3.8452 3.2559 3.0801 3.4208*
3 Score on academic challenge 3.9204 3.3347 3.1053 3.5173*
4 Score on attitude towards education 3.8925 3.4047 3.1509 3.4676*
5 Score on meaningfulness of task and
work methods 3.8737 3.2752 3.1379 3.2182*
6 Score on attitude towards teachers 3.6361 3.4901 3.7087 0.7389
7 Score on general interests and sports 3.6348 3.6337 3.6481 0.4551
8 Score on importance of marks 3.8786 3.3369 3.0733 3.1173*
Score on achievement motivation 3.8026 3.3684 3.2086 3.0965*
*Significant at five per cent level
Among the urban college students the highly viewed dimensions of
achievement motivation are „academic challenge‟ and „attitude towards education‟
since their mean scores are 3.9204 and 3.8925 respectively.
185
The highly viewed dimensions of achievement motivation among the semi-urban
college students are „general interests and sports‟ and „attitude towards teachers‟ since
their mean scores are 3.6337 and 3.4901 respectively.
As regards the rural college students the highly viewed dimensions of
achievement motivation are „attitude towards teachers‟ and „general interests and
sports‟ since their mean scores are 3.7087 and 3.6481 respectively.
Regarding the students view towards the various dimensions of achievement
motivation, significant difference among the three group of students have been noticed
in the case of six out of eight dimensions since their „F‟ statistics are significant at five
per cent level.
The overall achievement motivation among the urban college students is higher
than the overall achievement motivation among the semi-urban and rural students.
There is a significant difference among the three group of students have also been
noticed regarding their view on achievement motivation since its „F‟ statistics is
significant at five per cent level.
5.26 ASSOCIATION BETWEEN THE PROFILE OF STUDENTS AND THEIR
LEVEL OF ACHIEVEMENT MOTIVATION
The profile of the students may be associated with their level of achievement
motivation. The present study has made an attempt to examine this association between
profile variables and achievement motivation with the help of one way analysis of
variance. The profile variables included for this purpose are gender, age, place of
college, branch of study, social group, religion, type of family, size of family, monthly
family income, father‟s occupation and mother‟s occupation. The results are shown in
Table 5.26.

186
Table 5.26
Level of Achievement Motivation and the Profile of the Students
S.No Profile variables
F statistics
Academic
motivation
Need for
achievement
Academic
challenge
Attitude
towards
education
Meaningfulness
of task and
work methods
Attitude
towards
teachers
General
interest
and sports
Importance
of marks
Achievement
motivation
1 Gender 3.6671 3.2378 3.0178 3.1792 3.1007 3.2672 3.3341 2.5676 2.4172
2 Age 3.4542* 3.6082* 3.2773* 3.6561* 2.4541 2.0996 2.5884 2.6082 3.4541*
3 Place of College 2.4505 2.1779 2.8991 2.0892 2.8667 2.9414 3.1787* 3.2868* 2.9146
4 Branch of Study 3.1771 3.2609 3.1184 3.3996 3.2676 3.3881 3.4541 3.9142* 3.0945
5 Social Group 2.4332 2.2779 2.5082 2.5085 2.7172* 2.0896 2.2661 2.8182* 2.5011
6 Religion 2.5117 2.4546 2.6567* 2.1331 2.8996* 2.2676 2.1889 2.0917 2.2114
7 Type of family 3.2666 3.8182* 3.4546 3.3894 3.2676 3.3884 3.6771 3.3991 3.4546
8 Size of family 3.0079* 3.1174* 2.6564 2.8667 3.7173* 3.8229* 3.9091* 3.7673* 3.4089*
9 Monthly family
income 2.4547* 2.5869* 2.6089* 2.5845* 2.6566* 2.6089* 2.3886* 2.0917 2.0173
10 Fathers
occupation 2.3997* 2.7331* 2.9141* 2.9098* 2.7339* 2.7374* 2.5919* 2.1224 2.1791
11 Mothers
occupation 2.6084* 2.8089* 2.7676* 2.8182* 2.8117* 2.9098* 2.5889* 2.4773* 2.5044*
*Significant at five per cent level

187
As regards academic motivation, the significantly associating profile variables
are age, size of family, monthly family income, father‟s occupation and mother‟s
occupation since their respective „F‟ statistics are significant at five per cent level.
The significantly associating profile variables with the need for achievement
variables are age, type of family, size of family, monthly family income, father‟s
occupation and mother‟s occupation whereas in the case of academic challenge, the
associating profile variables are age, religion, monthly family income, father‟s
occupation and mother‟s occupation. since their respective „F‟ statistics are significant
at five per cent level. Regarding the attitude towards education, the significantly
associating profile variables are age, monthly family income, father‟s occupation and
mother‟s occupation since their respective „F‟ statistics are significant at five per cent
level.
Regarding meaningfulness of task and work method, the significantly
associating profile variables are social group, religion, size of family, monthly family
income, father‟s occupation and mother‟s occupation. Whereas in the case of attitude
towards teachers, the significantly associating profile variables are size of family,
monthly family income, father‟s occupation and mother‟s occupation since their
respective „F‟ statistics are significant at five per cent level.
The significantly associating profile variables as regards the general interest and
sports, are place of college, size of family, monthly family income, father‟s occupation
and mother‟s occupation. Whereas regarding the importance of marks, the associating
profile variables are place of college, branch of study, social group, size of family and
mother‟s occupation since their respective „F‟ statistics are significant at five per cent
level.
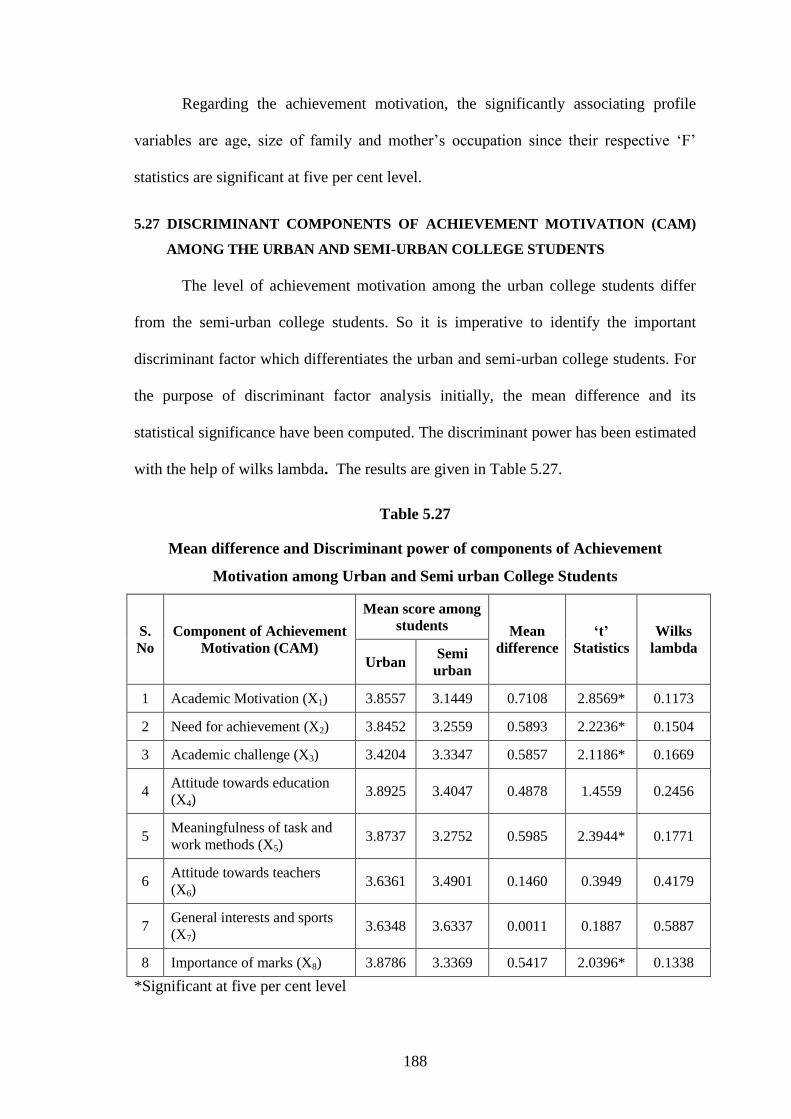
188
Regarding the achievement motivation, the significantly associating profile
variables are age, size of family and mother‟s occupation since their respective „F‟
statistics are significant at five per cent level.
5.27 DISCRIMINANT COMPONENTS OF ACHIEVEMENT MOTIVATION (CAM)
AMONG THE URBAN AND SEMI-URBAN COLLEGE STUDENTS
The level of achievement motivation among the urban college students differ
from the semi-urban college students. So it is imperative to identify the important
discriminant factor which differentiates the urban and semi-urban college students. For
the purpose of discriminant factor analysis initially, the mean difference and its
statistical significance have been computed. The discriminant power has been estimated
with the help of wilks lambda. The results are given in Table 5.27.
Table 5.27
Mean difference and Discriminant power of components of Achievement
Motivation among Urban and Semi urban College Students
S.
No
Component of Achievement
Motivation (CAM)
Mean score among
students Mean
difference
„t‟
Statistics
Wilks
lambda Urban
Semi
urban
1 Academic Motivation (X1) 3.8557 3.1449 0.7108 2.8569* 0.1173
2 Need for achievement (X2) 3.8452 3.2559 0.5893 2.2236* 0.1504
3 Academic challenge (X3) 3.4204 3.3347 0.5857 2.1186* 0.1669
4 Attitude towards education
(X4) 3.8925 3.4047 0.4878 1.4559 0.2456
5 Meaningfulness of task and
work methods (X5) 3.8737 3.2752 0.5985 2.3944* 0.1771
6 Attitude towards teachers
(X6) 3.6361 3.4901 0.1460 0.3949 0.4179
7 General interests and sports
(X7) 3.6348 3.6337 0.0011 0.1887 0.5887
8 Importance of marks (X8) 3.8786 3.3369 0.5417 2.0396* 0.1338
*Significant at five per cent level
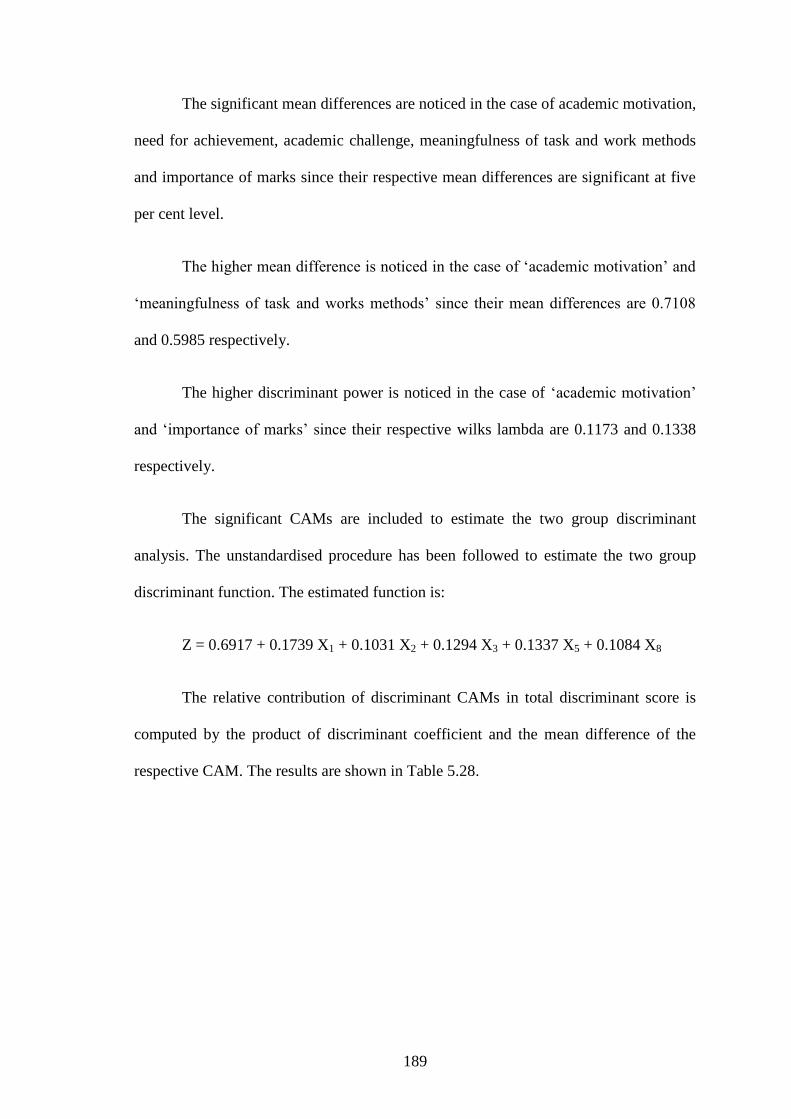
189
The significant mean differences are noticed in the case of academic motivation,
need for achievement, academic challenge, meaningfulness of task and work methods
and importance of marks since their respective mean differences are significant at five
per cent level.
The higher mean difference is noticed in the case of „academic motivation‟ and
„meaningfulness of task and works methods‟ since their mean differences are 0.7108
and 0.5985 respectively.
The higher discriminant power is noticed in the case of „academic motivation‟
and „importance of marks‟ since their respective wilks lambda are 0.1173 and 0.1338
respectively.
The significant CAMs are included to estimate the two group discriminant
analysis. The unstandardised procedure has been followed to estimate the two group
discriminant function. The estimated function is:
Z = 0.6917 + 0.1739 X1 + 0.1031 X2 + 0.1294 X3 + 0.1337 X5 + 0.1084 X8
The relative contribution of discriminant CAMs in total discriminant score is
computed by the product of discriminant coefficient and the mean difference of the
respective CAM. The results are shown in Table 5.28.

190
Table 5.28
Relative contribution of Discriminant CAM in Total Discriminant Score (TDS)
S.No
Component of
Achievement Motivation
(CAM)
Discriminant
coefficient
Mean
difference Product
Relative
contribution
in TDS
1 Academic Motivation (X1) 0.1739 0.7180 0.1236 30.98
2 Need for achievement (X2) 0.1031 0.5893 0.0608 15.24
3 Academic challenge (X3) 0.1294 0.5857 0.0758 19.00
4 Meaningfulness of task and
work methods (X5) 0.1337 0.5985 0.0800 20.06
5 Importance of marks (X8) 0.1084 0.5417 0.0587 14.72
Total 0.3989 100.00
Per cent of cases currently classified : 74.88
The higher discriminant coefficients are identified in the case of „academic
motivation‟ and „meaningfulness of task and work methods‟ since their discriminant
coefficients are 0.1739 and 0.1337 respectively. It shows the higher significance of
above said two CAMs in discriminant function.
The highest relative contribution in total discriminant score is noticed in the
case of above said two CMAs since their relative contribution are 30.98 and 20.06 per
cent respectively. The estimated two group discriminant analysis currently classified
the cases to an extant of 74.88 per cent.
The analysis reveals that the important discriminant CAMs among the urban
and semi-urban college students are „academic motivation‟ and „meaningfulness of task
and work methods‟ which are higher among the urban college students than among the
semi urban students.
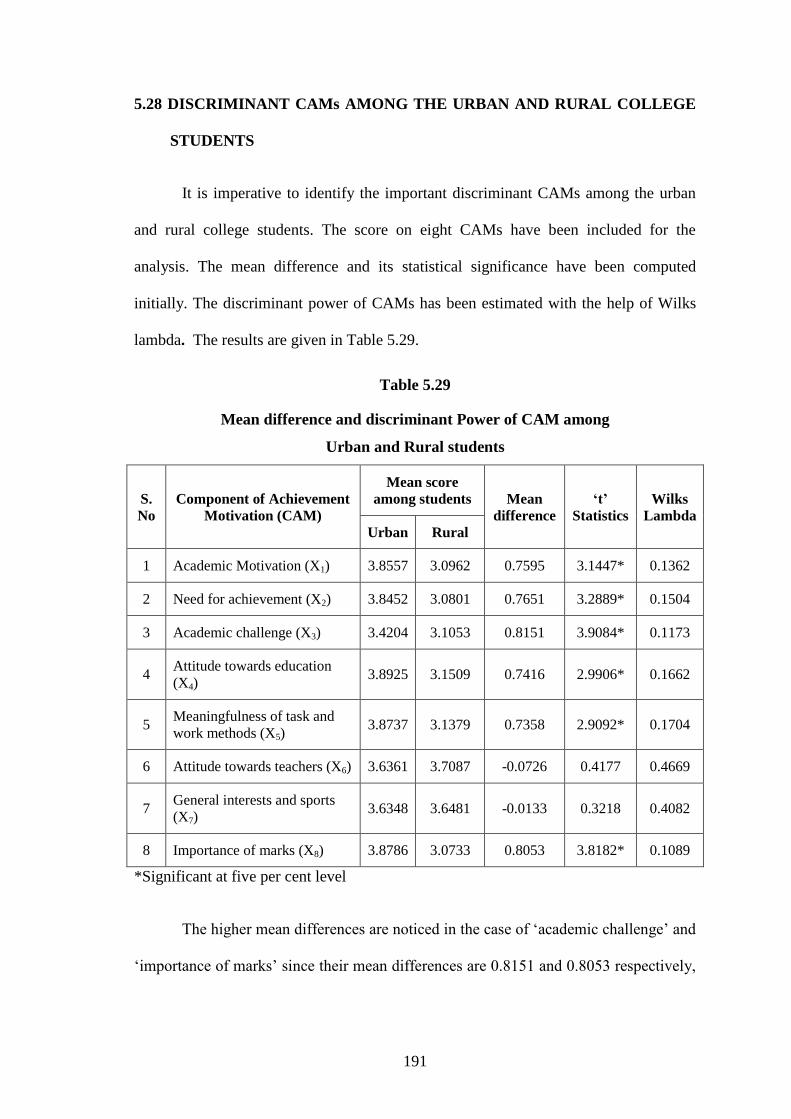
191
5.28 DISCRIMINANT CAMs AMONG THE URBAN AND RURAL COLLEGE
STUDENTS
It is imperative to identify the important discriminant CAMs among the urban
and rural college students. The score on eight CAMs have been included for the
analysis. The mean difference and its statistical significance have been computed
initially. The discriminant power of CAMs has been estimated with the help of Wilks
lambda. The results are given in Table 5.29.
Table 5.29
Mean difference and discriminant Power of CAM among
Urban and Rural students
S.
No
Component of Achievement
Motivation (CAM)
Mean score
among students Mean
difference
„t‟
Statistics
Wilks
Lambda
Urban Rural
1 Academic Motivation (X1) 3.8557 3.0962 0.7595 3.1447* 0.1362
2 Need for achievement (X2) 3.8452 3.0801 0.7651 3.2889* 0.1504
3 Academic challenge (X3) 3.4204 3.1053 0.8151 3.9084* 0.1173
4 Attitude towards education
(X4) 3.8925 3.1509 0.7416 2.9906* 0.1662
5 Meaningfulness of task and
work methods (X5) 3.8737 3.1379 0.7358 2.9092* 0.1704
6 Attitude towards teachers (X6) 3.6361 3.7087 -0.0726 0.4177 0.4669
7 General interests and sports
(X7) 3.6348 3.6481 -0.0133 0.3218 0.4082
8 Importance of marks (X8) 3.8786 3.0733 0.8053 3.8182* 0.1089
*Significant at five per cent level
The higher mean differences are noticed in the case of „academic challenge‟ and
„importance of marks‟ since their mean differences are 0.8151 and 0.8053 respectively,
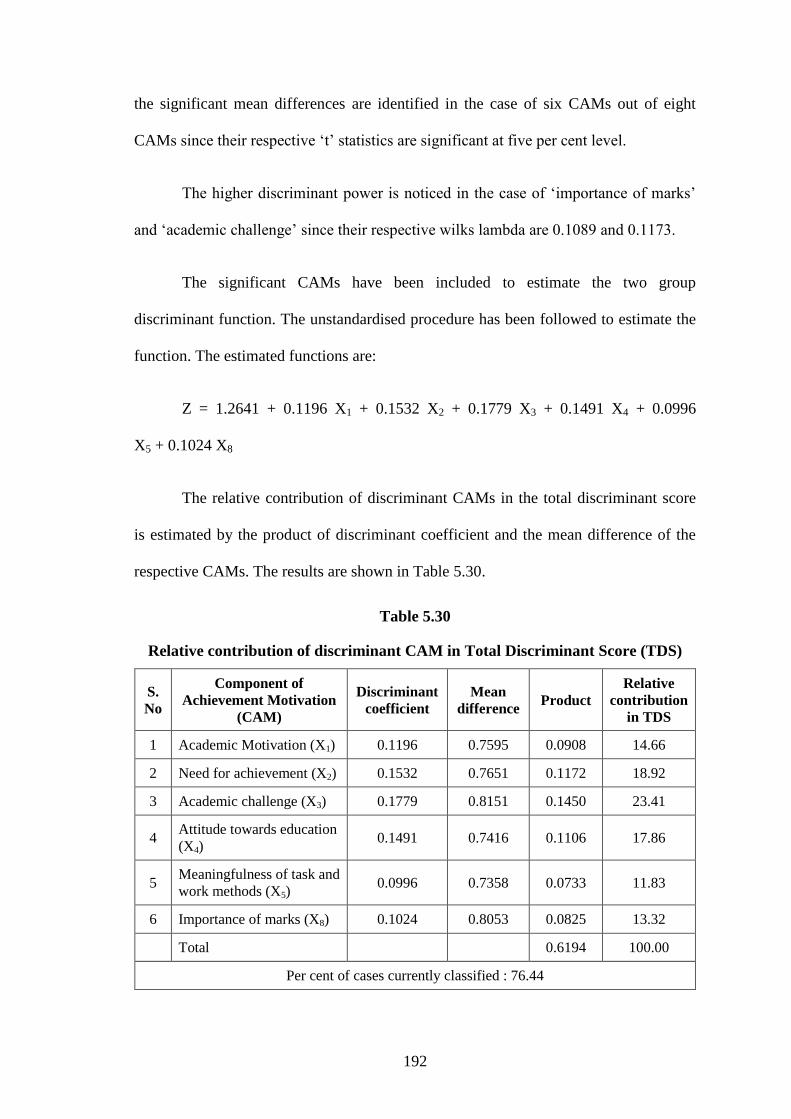
192
the significant mean differences are identified in the case of six CAMs out of eight
CAMs since their respective „t‟ statistics are significant at five per cent level.
The higher discriminant power is noticed in the case of „importance of marks‟
and „academic challenge‟ since their respective wilks lambda are 0.1089 and 0.1173.
The significant CAMs have been included to estimate the two group
discriminant function. The unstandardised procedure has been followed to estimate the
function. The estimated functions are:
Z = 1.2641 + 0.1196 X1 + 0.1532 X2 + 0.1779 X3 + 0.1491 X4 + 0.0996
X5 + 0.1024 X8
The relative contribution of discriminant CAMs in the total discriminant score
is estimated by the product of discriminant coefficient and the mean difference of the
respective CAMs. The results are shown in Table 5.30.
Table 5.30
Relative contribution of discriminant CAM in Total Discriminant Score (TDS)
S.
No
Component of
Achievement Motivation
(CAM)
Discriminant
coefficient
Mean
difference Product
Relative
contribution
in TDS
1 Academic Motivation (X1) 0.1196 0.7595 0.0908 14.66
2 Need for achievement (X2) 0.1532 0.7651 0.1172 18.92
3 Academic challenge (X3) 0.1779 0.8151 0.1450 23.41
4 Attitude towards education
(X4) 0.1491 0.7416 0.1106 17.86
5 Meaningfulness of task and
work methods (X5) 0.0996 0.7358 0.0733 11.83
6 Importance of marks (X8) 0.1024 0.8053 0.0825 13.32
Total 0.6194 100.00
Per cent of cases currently classified : 76.44

193
The higher discriminant coefficients are noticed in the case of „academic
challenge‟ and „need for achievement‟ since their discriminant coefficients are 0.1779
and 0.1532 respectively. It shows the higher influence of the above said two CAMs in
discriminant function.
The highest relative contribution of discriminant CMA in TDS is noticed in the
case of „academic challenge‟ and „need for achievement‟ since their relative
contribution are 23.41 and 18.92 per cent respectively. The estimated two group
discriminant function currently classifies the cases to an extant of 76.44 percent.
The analysis reveals that the important discriminant CAMs among the urban
and rural college students are „academic challenge‟ and „need for achievement‟ which
are higher among the urban college students than among the rural college students.
5.29 DISCRIMINANT COMPONENTS OF ACHIEVEMENT MOTIVATION
(CAM) AMONG THE SEMI-URBAN AND RURAL STUDENTS
The level of achievement motivation among the semi-urban college students
may differ from the rural college students. It is essential to analyse the important
discriminant CAM among the two groups of college students. Initially, the mean
difference for all the eight components of achievement motivation and their respective
statistical significance has been computed. The discriminant power of each CAM has
been estimated with the help of Wilks lambda. The results are given in Table 5.31.
194
Table 5.31
Mean difference and Discriminant Power of Achievement Motivation among
Semi-urban and Rural students
S.
No
Component of Achievement
Motivation (CAM)
Mean score
among students Mean
difference
„t‟
Statistics
Wilks
lambda Semi
urban Rural
1 Academic Motivation (X1) 3.8557 3.0962 0.7595 3.0542* 0.1663
2 Need for achievement (X2) 3.8452 3.0801 0.7651 3.2673* 0.1504
3 Academic challenge (X3) 3.9204 3.1053 0.8151 3.8084* 0.1667
4 Attitude towards education (X4) 3.8925 3.1509 0.7416 2.9911* 0.1391
5 Meaningfulness of task and work
methods (X5) 3.8737 3.1379 0.7358 2.7334* 0.1492
6 Attitude towards teachers (X6) 3.6361 3.7087 -0.0726 -0.7919 0.4919
7 General interests and sports (X7) 3.6348 3.6481 -0.0133 -0.3994 0.4033
8 Importance of marks (X8) 3.8786 3.0733 0.8053 3.6696* 0.1399
*Significant at five per cent level
The significant mean differences are identified in the case of „academic
motivation‟, „need for achievement‟, „academic challenge‟, „attitude towards
education‟, „meaningfulness of task and work methods‟ since their respective „t‟
statistics are significant at five per cent level.
The higher mean difference is noticed in the case of „academic challenge‟ and
„important of marks‟ since their mean differences are 0.8151 and 0.8053 respectively.
The significant CAM are included to estimate the two group discriminant
function. The estimated functions are:
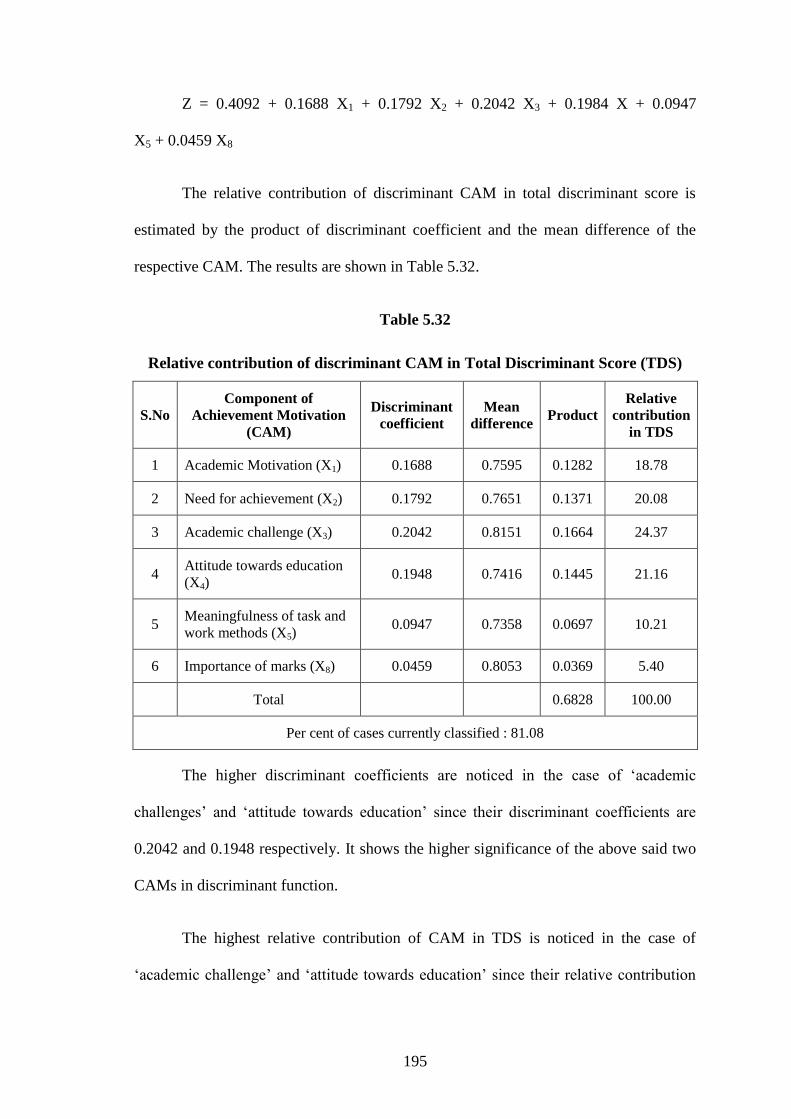
195
Z = 0.4092 + 0.1688 X1 + 0.1792 X2 + 0.2042 X3 + 0.1984 X + 0.0947
X5 + 0.0459 X8
The relative contribution of discriminant CAM in total discriminant score is
estimated by the product of discriminant coefficient and the mean difference of the
respective CAM. The results are shown in Table 5.32.
Table 5.32
Relative contribution of discriminant CAM in Total Discriminant Score (TDS)
S.No
Component of
Achievement Motivation
(CAM)
Discriminant
coefficient
Mean
difference Product
Relative
contribution
in TDS
1 Academic Motivation (X1) 0.1688 0.7595 0.1282 18.78
2 Need for achievement (X2) 0.1792 0.7651 0.1371 20.08
3 Academic challenge (X3) 0.2042 0.8151 0.1664 24.37
4 Attitude towards education
(X4) 0.1948 0.7416 0.1445 21.16
5 Meaningfulness of task and
work methods (X5) 0.0947 0.7358 0.0697 10.21
6 Importance of marks (X8) 0.0459 0.8053 0.0369 5.40
Total 0.6828 100.00
Per cent of cases currently classified : 81.08
The higher discriminant coefficients are noticed in the case of „academic
challenges‟ and „attitude towards education‟ since their discriminant coefficients are
0.2042 and 0.1948 respectively. It shows the higher significance of the above said two
CAMs in discriminant function.
The highest relative contribution of CAM in TDS is noticed in the case of
„academic challenge‟ and „attitude towards education‟ since their relative contribution

196
are 24.37 and 21.16 per cent respectively. The estimated two group discriminant
analysis currently classified the cases to an extant of 81.08 percent.
The analysis reveals that the important discriminant factor relating to
achievement motivation among the semi-urban and rural college students are „academic
challenge‟ and „attitude towards education‟ which are higher among the semi-urban
college students than the rural college students.
5.30 IMPACT OF ACHIEVEMENT MOTIVATION ON THE ENTREPRENEURIAL
TRAITS AMONG THE STUDENTS
The achievement motivation among the college students may have been its own
influence on the entrepreneurial traits among the students. It is imperative to examine
the relative importance of each of the components of achievement motivation (CAM) in
the determination of entrepreneurial traits among the students. The multiple regression
analysis has been applied for this purpose. The fitted regression model is:
Y = a + b1x1 + b2x2 + . . . . . . . . + b8x8 + e
Whereas y – score on entrepreneurial traits among the students
X1 - Score on academic motivation among the students
X2 - Score on need for achievement among the students
X3 - Score on academic challenge among the students
X4 - Score on attitude towards education among the students
X5 - Score on meaningfulness of task and work methods
among the students
X6 - Score on attitude towards teachers among the students
X7 - Score on general interests and sports among the students

197
X8 - Score on importance of marks among the students
b1, b2, . . . , b8 - Regression coefficient of independent variables
a - intercept and
e - error term
The impact of achievement motivation on the entrepreneurial traits among the
three group of students and also for pooled data have been computed separately. The
results are shown in Table 5.33.
Table 5.33
Impact of Achievement Motivation on Entrepreneurial Traits
S.No Factors
Regression coefficient among students Pooled
Data Urban Semi – urban Rural
1 Academic Motivation 0.1496* 0.1033 0.0739 0.0991
2 Need for achievement 0.1778* 0.1594* 0.1436* 0.1506*
3 Academic challenge 0.1884* 0.1881* 0.1509* 0.1632*
4 Attitude towards education 0.1629* 0.1997* 0.1493* 0.1517*
5 Meaningfulness of task and
work methods 0.1133 0.0989 0.0594 0.0996
6 Attitude towards teachers 0.1011 0.1534* 0.1491* 0.1338*
7 General interests and sports 0.1994* -0.0491 0.0669 0.0779
8 Importance of marks -0.0885 0.1024 0.1541* 0.0886
Constant 0.9096 -0.4917 0.6293 0.8217
R2 0.7684 0.7242 0.7191 0.8086
F statistics 8.3991* 7.9048* 7.8942* 8.8917
* Significant at five per cent level.
The significantly influencing achievement motivation variables on the
entrepreneurial traits among the urban college students are their level of academic

198
motivation, need for achievement, academic challenge, attitude towards education and
general interests and sports since these regression coefficients are significant at five per
cent level. A unit increase in the above said achievement motivation results in an
increase in entrepreneurial traits by 0.1496, 0.1778, 0.1884, 0.1629 and 0.1994 units
respectively. The changes in level of achievement motivation among the urban college
students explain the changes in the entrepreneurial traits to an extant of 76.84 per cent
since its R2 is 0.7684.
Among the semi-urban college students, a unit increase in the level on need for
achievement, academic challenge, attitude towards education and attitude towards
teacher result in an increase in their entrepreneurial traits by 0.1594, 0.1881,0.1997 and
0.1534 units respectively. The changes in the level of achievement motivation explain
the changes in their entrepreneurial traits to extant of 72.42 per cent since its R2 is
0.7242 whereas among the rural college students, it is explained to an extent of 71.91
per cent. A unit increase in the level of need for achievement, academic challenges,
attitude towards education, attitude towards teachers and importance of marks result in
an increase in the entrepreneurial traits by 0.1436, 0.1509, 0.1493, 0.1491 and 0.1541
units respectively.
The analysis of pooled data reveals the relative influence of „need for
achievement‟, „academic challenges‟, „attitude towards education‟ and „attitude towards
teachers‟ on the entrepreneurial traits among the students.
In total, the change in the achievement motivation explains the changes in
entrepreneurial traits to an extant of 80.86 per cent since the R2 is 0.8086.

199
5.31 CONCLUSION
The achievement motivation and entrepreneurial traits among the college
students exhibits the views of the urban, semi-urban and rural college students about
the various components of achievement motivation. The reliability and validity of the
variables included in the various components were tested with the help of confirmatory
factor analysis and cronbach alpha. One way analysis was applied to find out the
significant difference among the three groups of students regarding the various
dimensions of achievement motivation. The association between the profile variables of
the students and the level of achievement motivation highlighted the significantly
associating profile variables with the achievement motivation. The discriminant factor
analysis was applied to find out the factors which discriminate the urban, semi-urban
and rural college students regarding the achievement motivation. The multiple
regression analysis was used to analyse the impact of the achievement motivation on
the entrepreneurial traits.

Chapter - VI
Entrepreneurial Motivation and its Determinants
CHAPTER - VI
ENTREPRENEURIAL MOTIVATION AND ITS DETERMINANTS
6.0 Introduction
6.1 Entrepreneurial motivation among the students
6.2 Students view relating to confidence
6.3 Reliability and validity of variables included in confidence
6.4 Level of confidence among the students
6.5 Problem solving ability among the students
6.6 Reliability and validity of variables in problem solving ability
6.7 Level of problem solving ability among the students
6.8 Opportunity seeking among the students
6.9 Reliability and validity of variables relating to opportunity seeking
6.10 Level of opportunity seeking among the students
6.11 Students view about independency
6.12 Reliability and validity of variables in independency
6.13 Level of independency among the students
6.14 Planning skills among the students
6.15 Reliability and validity of variables in planning skills
6.16 Level of planning skills among the students
6.17 Managerial skills among the students
6.18 Reliability and validity of variables in managerial skills
6.19 Level of managerial skills among the students
6.20 Social interaction among the students
6.21 Reliability and validity of variables in social interaction

6.22 Level of social interaction among the students
6.23 Level of entrepreneurial motivation among the students
6.24 Association between profile of students and their entrepreneurial motivation
6.25 Discriminant component of entrepreneurial motivation among the urban and
semi-urban college students.
6.26 Discriminant components of entrepreneurial motivation among the urban and
rural college students.
6.27 Discriminant component of entrepreneurial motivation among the semi-urban
and rural college students.
6.28 Impact of factors leading to entrepreneurial traits on entrepreneurial motivation
6.29 Impact of achievement motivation on the entrepreneurial motivation among the
students
6.30 Conclusion

200
CHAPTER - VI
ENTREPRENEURIAL MOTIVATION AND ITS DETERMINANTS
6.0 INTRODUCTION
The entrepreneurial motivation among the students is the most important factors
leading to entrepreneurship among the students. Since it is an inner feeling and the
mindset of the students, it is measured with the help of several (38) variables which are
drawn from the various previous studies. The determinants of entrepreneurial
motivation among the students are too many, but the present study combines the factors
leading to entrepreneurial traits and achievement motivation. The linkage between the
above said three concepts are discussed in the present chapter. This linkage is presented
in the Figure 6.1.
Figure 6.1
Linkage between Entrepreneurial Motivation and its Determinants
Factors leading to
Entrepreneurial
Traits
Achievement
Motivation
Entrepreneurial
Motivation

201
6.1 ENTREPRENEURIAL MOTIVATION AMONG THE STUDENTS
The score of 38 variables in entrepreneurial motivation have been included for
Exploratory Factor Analysis (EFA) in order to narrate the important components of
entrepreneurial motivation. Initially, the validity of data for EFA is tested with the help
of KMO measure of sampling adequately and Bartlett‟s test of sphericity. Both these
tests satisfy the validity of data for EFA. The result of EFA is given in Table 6.1.
Table 6.1
Important Components of Entrepreneurial Motivation
S.No
Components of
Entrepreneurial
Motivation
No. of
variables
Eigen
Value
Per cent
variation
explained
Cumulative
per cent of
variation
explained
1 Confidence 7 6.8184 17.94 17.94
2 Problem Solving ability 7 6.0229 15.84 33.78
3 Opportunity Seeking 6 4.9173 12.94 46.72
4 Independency 5 3.8864 10.23 56.95
5 Planning Skill 5 3.0991 8.16 65.11
6 Managerial skills 4 2.5084 6.60 71.71
7 Social interaction 4 2.3343 6.14 77.85
KMO measures of sampling adequacy: 0.7982 Bartlett‟s test of sphericity
Chi Square value: 96.04*
*Significant at five per cent level
The 38 variables included under entrepreneurial motivation are confined to
seven important factors namely confidence, problem solving ability, opportunity
seeking, independency, planning skills, managerial skills, and social interaction. All
these seven factors explain the 38 variables included for this purpose to an extent of
77.85 per cent. The important factors narrated by EFA are confidence and problem

202
solving ability since its Eigen values are 6.8184 and 6.0229 respectively. The per cent
of variation explained by these factors are 17.94 and 15.84 per cent respectively. The
next important factors identified by EFA are opportunity seeking and independency
since its Eigen values are 4.9173 and 3.8864 respectively. The per cent of variations
explained by two factors are 12.94 and 10.23 per cent respectively.
The last three factors identified by the EFA are planning skills, managerial
skills and social interaction since the Eigen values are 3.0991. 2.5084 and 2.3343
respectively. The per cent of variation explained by these factors are 8.16, 6.60 and
6.14 per cent respectively. The analysis reveals that there are seven important
components of entrepreneurial motivation among the students. It -is taken for further
discussion.
6.2 STUDENTS VIEW RELATING TO CONFIDENCE
The confidence factor consists of seven variables. It is essential to examine the
students‟ views about the variables included in the component „confidence‟ in order to
exhibit their level of confidence. The mean score on each variable in „confidence‟
among the urban, semi-urban and rural college students have been computed
separately. The one way analysis of variance has been executed to examine the
significant difference among the three groups of students regarding their views relating
to „confidence‟. The results are shown in Table 6.2.
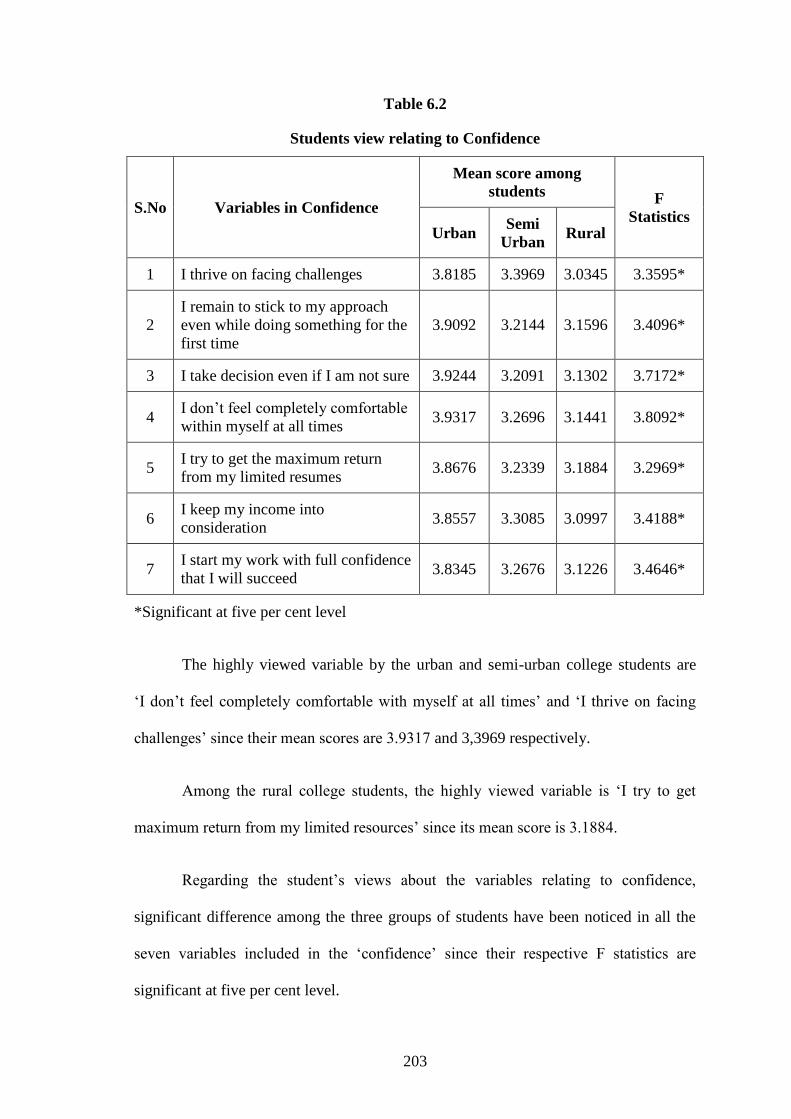
203
Table 6.2
Students view relating to Confidence
S.No Variables in Confidence
Mean score among
students F
Statistics Urban
Semi
Urban Rural
1 I thrive on facing challenges 3.8185 3.3969 3.0345 3.3595*
2
I remain to stick to my approach
even while doing something for the
first time
3.9092 3.2144 3.1596 3.4096*
3 I take decision even if I am not sure 3.9244 3.2091 3.1302 3.7172*
4 I don‟t feel completely comfortable
within myself at all times 3.9317 3.2696 3.1441 3.8092*
5 I try to get the maximum return
from my limited resumes 3.8676 3.2339 3.1884 3.2969*
6 I keep my income into
consideration 3.8557 3.3085 3.0997 3.4188*
7 I start my work with full confidence
that I will succeed 3.8345 3.2676 3.1226 3.4646*
*Significant at five per cent level
The highly viewed variable by the urban and semi-urban college students are
„I don‟t feel completely comfortable with myself at all times‟ and „I thrive on facing
challenges‟ since their mean scores are 3.9317 and 3,3969 respectively.
Among the rural college students, the highly viewed variable is „I try to get
maximum return from my limited resources‟ since its mean score is 3.1884.
Regarding the student‟s views about the variables relating to confidence,
significant difference among the three groups of students have been noticed in all the
seven variables included in the „confidence‟ since their respective F statistics are
significant at five per cent level.
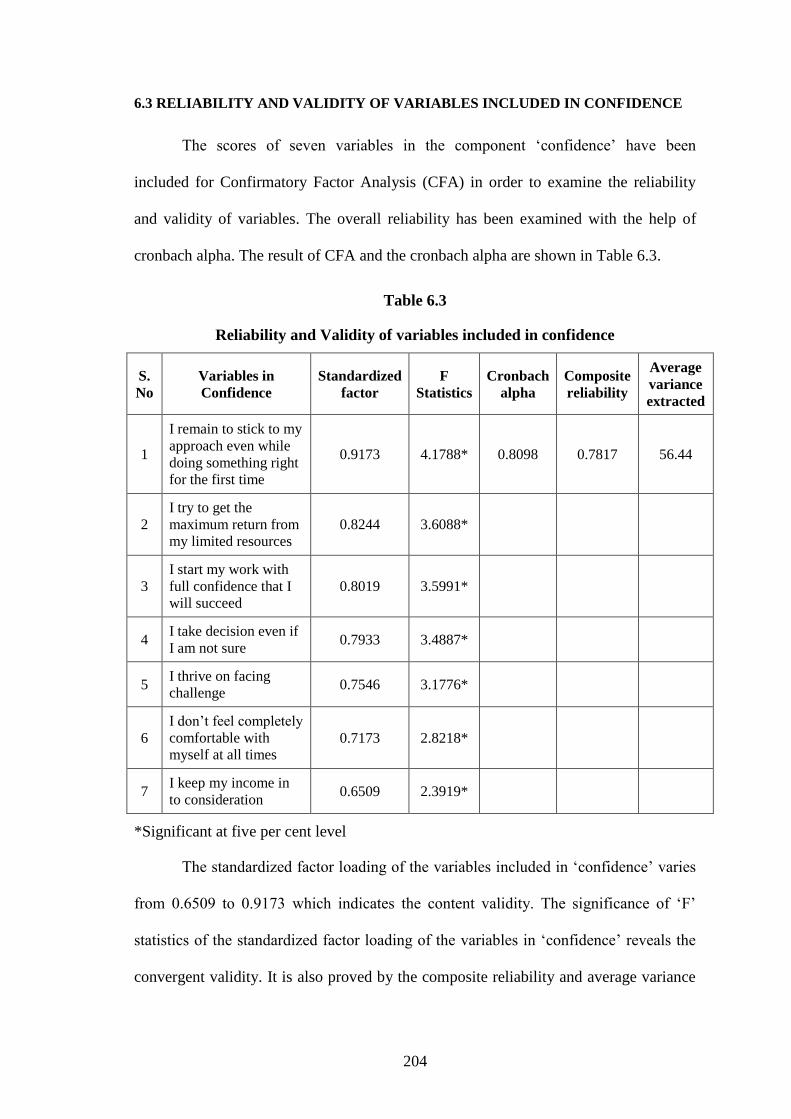
204
6.3 RELIABILITY AND VALIDITY OF VARIABLES INCLUDED IN CONFIDENCE
The scores of seven variables in the component „confidence‟ have been
included for Confirmatory Factor Analysis (CFA) in order to examine the reliability
and validity of variables. The overall reliability has been examined with the help of
cronbach alpha. The result of CFA and the cronbach alpha are shown in Table 6.3.
Table 6.3
Reliability and Validity of variables included in confidence
S.
No
Variables in
Confidence
Standardized
factor
F
Statistics
Cronbach
alpha
Composite
reliability
Average
variance
extracted
1
I remain to stick to my
approach even while
doing something right
for the first time
0.9173 4.1788* 0.8098 0.7817 56.44
2
I try to get the
maximum return from
my limited resources
0.8244 3.6088*
3
I start my work with
full confidence that I
will succeed
0.8019 3.5991*
4 I take decision even if
I am not sure 0.7933 3.4887*
5 I thrive on facing
challenge 0.7546 3.1776*
6
I don‟t feel completely
comfortable with
myself at all times 0.7173 2.8218*
7 I keep my income in
to consideration 0.6509 2.3919*
*Significant at five per cent level
The standardized factor loading of the variables included in „confidence‟ varies
from 0.6509 to 0.9173 which indicates the content validity. The significance of „F‟
statistics of the standardized factor loading of the variables in „confidence‟ reveals the
convergent validity. It is also proved by the composite reliability and average variance
205
extracted since these are greater than its minimum threshold of 0.80 and 50.00 per cent
respectively. The cronbach alpha (0.8098) shows that the included seven variables in
„confidence‟ explain it to and extent of 80.98 per cent. The analysis reveals the
reliability and validity of variables included under the component „confidence‟.
6.4 LEVEL OF CONFIDENCE AMONG THE STUDENTS
The level of confidence among the students is measured by the mean score of
the seven variables relating to „confidence‟. It is denoted by SOC. In the present study,
the SOC is confined to less than 2.0, 2.0 to 3.0, 3.0 to 4.0 and above 4.0. The
distribution of students on the basis of their SOC is given in Table 6.4.
Table 6.4
Level of confidence among Students
S.No
Scores on
Confidence
Number of Students in Total
Urban Semi Urban Rural
1 Less than 2.0 9 64 22 95
2 2.0-3.0 28 65 32 125
3 3.1-4.0 67 119 59 245
4 Above 4.0 44 46 21 111
Total 148 294 134 576
Source : Primary data
The significant levels of confidence among the students are 3.1 to 4.0 and 2.0 to
3.0 which constitutes 37.85 and 26.39 per cent respectively. The most important level
of confidence among the urban and semi-urban college students is 3.1 to 4.0 which
constitutes 45.27 and 40.48 per cent to its total respectively. Among the rural college
students the most important level of confidence is 2.0 to 3.0 which constitute 44.03 per
cent to its total. The analysis reveals that the level of confidence among the urban

206
college students is higher than the level of confidence among the semi-urban and rural
college students.
6.5 PROBLEM SOLVING ABILITY AMONG THE STUDENTS
The problem solving ability among the students is measured with the help of
seven variables. The mean score of all the seven variables in problem solving ability
among the urban, semi-urban and rural college students have been computed separately
in order to analyse their views. The one way analysis of variance has been administered
to find out the significant difference among the three groups of students regarding their
level of problem solving ability. The results are given in Table 6.5.
Table 6.5
Problem Solving ability among the Students
S.No Variables in Problem Solving
Mean score among students F
Statistics Urban Semi
Urban Rural
1 I always try to find new solutions to
overcome problems 3.8183 3.5817 3.2673 3.2676*
2 I apply alternative approaches to
solve the problem 3.9024 3.4092 3.3896 3.1782*
3 I take problems as a challenge 3.8684 3.3997 3.2109 3.0994*
4 Facing problems makes me stronger
in decision making 3.8548 3.2909 3.3414 2.7318
5 While dealing with problems, I tend
to get struck 3.9196 3.3083 3.2558 3.2676*
6 I am good at tackling with several
problem at a time 3.8734 3.2149 3.0884 3.4519*
7 I try to solve the problems in new
ways and means 3.9081 3.3884 3.1777 3.6173*
*Significant at five per cent level
The highly viewed variables in problem solving ability among the urban and
semi-urban college students are „while dealing with a problem, I tend to get struck‟ and
„I always try to find a new solution to overcome problems‟ since its mean score are
3.9196 and 3.5817 respectively. Among the rural college students the highly viewed

207
variable is „I apply alternative approaches to solve the problem‟, since its mean score is
3.3896. Regarding the students view about the variables in problem solving, significant
difference among three group of students have been noticed in the case of six out of
seven variables since their respective „F‟ statistics are significant at five per cent level.
6.6 RELIABILITY AND VALIDITY OF VARIABLES IN PROBLEM SOLVING
ABILITY
Before summarizing the variables in problem solving ability, it is imperative to
examine the reliability and validity of same. The confirmatory factor analysis has been
administered for this purpose. The cronbach alpha has been computed to find out the
overall reliability of variables in problem solving ability. The results are given in
Table 6.6.
Table 6.6
Reliability and Validity of variables in problem solving ability
S.
No Variables in Confidence
Standardized
factor
loading
F
Statistics
Cronbach
alpha
Composite
reliability
Average
variance
extracted
1
Facing problems makes
me stronger in decision
making
0.8917 3.9418* 0.7919 0.7702 54.02
2 I take problem as a
challenge 0.8244 3.6818*
3 I try to solve the problems
in new ways and means 0.7991 3.4408*
4
I apply alternative
approaches to solve the
problems
0.7808 3.3919*
5 I am good at tackling with
several problem at a time 0.7045 3.0144*
6
I always try to find new
solutions to overcome
problems
0.6911 2.8949*
7
While dealing with a
problem, I tend to get
struck
0.6433 2.3949*
*Significant at five per cent level
208
The standardized factor loading of the variables in problem solving ability
varies from 0.6433 to 0.8917 which reveals the content validity. The „F‟ statistics of the
standardized factor loading of the variables in problem solving ability are significant at
five per cent level which conveys the convergent validity. It is also supported by the
composite reliability and average variance extracted since these are greater than its
standard minimum threshold of 0.50 and 50.00 per cent respectively. The seven
variables included in problem solving ability explain it to an extent of 79.19 per cent
since its cronbach alpha is 0.7919.
6.7 LEVEL OF PROBLEM SOLVING ABILITY AMONG THE STUDENTS
Level of problem solving ability among the students is computed by the mean
score of the variables. In the present study, the level of problem solving ability is
confined to less than 2.0, 2.0- 3.0, 3.1-4.0 and above 4.0. The distribution of students
on the basis of their level of problem solving ability is illustrated in Table 6.7.
Table 6.7
Level of Problem Solving Ability among the Students
S.No Level of Problem
Solving Ability
Number of Students Total
Urban Semi Urban Rural
1 Less than 2.0 10 45 22 77
2 2.0-3.0 24 76 56 156
3 3.1-4.0 63 129 29 221
4 Above 4.0 51 44 27 122
Total 148 294 134 576
Source : Primary data
The important level of problem solving ability among the students is 3.1 to 4.0
and 2.0 to 3.0 which constitutes 38.37 and 27.08 per cent to the total respectively. The
most important problem solving ability among the urban and semi urban college

209
students is 3.1 to 4.0 which constitutes 42.57 and 43.88 per cent to its total respectively.
Among the rural college students the important level of problem solving ability is 2.0 to
3.0 which constitutes 41.79 per cent to its total. The analysis reveals that the level of
problem solving ability among the semi-urban college students is higher than the urban
and rural college students.
6.8 OPPORTUNITY SEEKING AMONG THE STUDENTS
The opportunity seeking among the students is measured with the help of six
variables identified by the exploratory factor analysis. The mean score of each variable
in opportunity seeking among the urban, semi-urban and rural students have been
computed separately in order to exhibit their views about the opportunity seeking
among the students. One way analysis of variance has been used to find out the
significant difference among the three groups of students. The results are given in
Table 6.8.
Table 6.8
Variables in Opportunity Seeking among the Students
S.No Variables in Opportunity seeking Mean score among students
F Statistics Urban Semi Urban Rural
1 I look for new opportunities like a
watch dog 3.9197 3.1884 3.0918 3.4592*
2 I try to find ways to do things for less
cost 3.8668 3.2917 3.1447 3.2996*
3 I welcome challenges and
opportunities 3.9245 3.2886 3.2086 3.1881*
4 I take the advantage of opportunities
as and when that arise 3.9009 3.3969 3.1045 3.2089*
5 I derive satisfaction after facing
challenges 3.8544 3.5041 3.1146 3.2267*
6 I prefer to do task that I know-well 3.8039 3.6065 3.2046 3.1979*
*Significant at five per cent level

210
The Table 6.8 shows the mean score of the variables in opportunity seeking
among the students. The important variable in opportunity seeking by the urban and
rural college students is „I welcome challenges and opportunities‟ since its mean scores
are 3.9245 and 3.2086 respectively. Among the semi-urban college students the
important variable in opportunity seeking is „I prefer to do tasks that I know well‟ since
its mean score is 3.6065.
Regarding the students view about opportunity seeking, significant difference
among the three groups of students has been noticed in the case of all the six variables.
Since their respective „F‟ statistics are significant at five per cent level.
6.9 RELIABILITY AND VALIDITY OF VARIABLES RELATING TO
OPPORTUNITY SEEKING
In order to examine the reliability and validity of variables included in the
„opportunity seeking‟ confirmatory factor analysis is administered. The overall
reliability of the variables have been examined with the help of cronbach alpha. The
results of the confirmatory factor analysis and the cronbach alpha is presented in
Table 6.9.

211
Table 6.9
Reliability and Validity of variables relating to Opportunity Seeking
S.No
Variables in
Opportunity
Seeking
Standardized
factor
loading
F
Statistics
Cronbach
alpha
Composite
reliability
Average
variance
extracted
1 I prefer to do task
that I know well 0.8582 3.6961* 0.7814 0.7602 53.39
2 I derive satisfaction
after facing
challenges
0.8019 3.3994*
3
I welcome
challenges and
opportunities
0.7842 3.1446*
4
I take the advantage
of opportunities as
and when that arise
0.7509 2.9961*
5 I look for new
opportunities like a
watch dog
0.7172 2.6504*
6 I try to find ways to
do things for less
cost
0.6673 2.3989*
*Significant at five per cent level
The six variables included in „opportunity seeking‟ explain it to an extent of
78.14 per cent since its cronbach alpha is 0.7814. The content validity is proved since
the standardized factor loading of the variables in opportunity seeking are greater than
0.60. The convergent validity is proved since the „F‟ statistics of the standardized factor
loading of the variables in opportunity seeking are significant at five per cent level. It is
also confirmed by the composite reliability and average variance extracted since these
are greater than its minimum threshold of 0.50 and 50.00 per cent respectively.
212
6.10 LEVEL OF OPPORTUNITY SEEKING AMONG THE STUDENTS
The level of opportunity seeking among the students is measured by the mean
score of the variables in it. In the present study, the level of opportunity seeking among
the students is confined to less than 2.0, 2.0 to 3.0, 3.1 to 4.0 and above 4.0. The
distribution of students on the basis of level of opportunity seeking is illustrated in
Table 6.10.
Table 6.10
Level of Opportunity Seeking among the Students
S.No Level of Opportunity Seeking
Number of Students in Total
Urban Semi Urban Rural
1 Less than 2.0 21 20 39 80
2 2.0-3.0 27 53 42 122
3 3.1-4.0 41 178 36 255
4 Above 4.0 59 43 17 119
Total 148 294 134 576
*Significant at five per cent level
The important levels of opportunity seeking among the students are 3.1 to 4.0
and 2.0 to 3.0 which constitutes 44.27 and 21.18 per cent to the total respectively. The
most important levels of opportunity seeking among the urban and semi-urban college
students are „above 4.00‟ and „3.1 to 4.0‟ which constitutes 39.86 and 60.54 per cent to
its total.
Among the rural college students the most important level of opportunity
seeking is 2.0-3.0 which constitute 31.34 per cent to the total.

213
The analysis reveals that the level of opportunity seeking among the urban
students are higher than the semi-urban and rural college students.
6.11 STUDENTS VIEW ABOUT INDEPENDENCY
The independency is identified as one of the important components of
entrepreneurial motivation. It consists of five variables. The mean of all five variables
among the urban, semi-urban and rural college students have been computed separately
in order to exhibit their views about independency. The one way analysis of variance
has been executed to find out the significant difference among the three groups of
students. The results are given in Table 6.11.
Table 6.11
Students‟ View about the Variables in Independency
S.No Variables in Independency Mean score among students
F Statistics Urban Semi Urban Rural
1 I don‟t depend on others for
directing 3.7378 3.3094 3.0142 3.1997*
2 When I am confused, I seek
others advice 3.8244 3.1909 3.0496 3.2647*
3 I don‟t let my work interfered
by others 3.8691 3.3144 3.2908 3.0233*
4 I find myself quite resourceful
to tide over tight situation 3.9089 3.2088 3.2144 3.3099
5 I stick with my decision even if
other disagree with me 3.9244 3.2291 3.1703 3.5144*
*Significant at five per cent level
The highly viewed variable relating to „independency‟ by the urban and semi-
urban college students is „I stick with my decision even if others disagree with me‟ and
„I don‟t let my work interfered by others‟ since their mean scores are 3.9244 and
3.3144 respectively.

214
Among the rural college students the highly viewed variable is „I don‟t let my
work interfered by others‟ since its mean score is 3.2908.
Regarding the students views about the variables included in „independency‟,
significant difference among the three groups of students have been noticed in the case
of all the five variables included in „independency‟ since their respective „F‟ statistics
are significant at five per cent level.
6.12 RELIABILITY AND VALIDITY OF VARIABLES IN INDEPENDENCY
The variables under „independency‟ have been included to examine its
reliability and validity. The confirmatory factor analysis has been executed to examine
it. The overall reliability has been estimated with the help of cronbach alpha. The
results are given in Table 6.12.
Table 6.12
Reliability and Validity of variables in Independency
S.No Variables in
independency
Standardized
factor loading
F
Statistics
Cronbach
alpha
Composite
reliability
Average
variance
extracted
1 I don‟t let my work
interfered by others 0.8642 3.6089* 0.7829 0.7601 53.04
2
I stick with my
decision even if
other disagree with
me
0.8299 3.4331*
3 I find myself quite 0.7608 2.9909*
4 I don‟t depend on
others for directing 0.7344 2.6339*
5
When I am
confused, I seek
others advice
0.6591 2.3996*
*Significant at five per cent level

215
The standardized factor loading of the variables in independency are greater
than 0.60 which reveals the content validity. The significance of „F‟ statistics of the
standardized factor loading shows the convergent validity. It is also proved by the
composite reliability and average variance extracted since these are greater than the
standard minimum threshold of 0.50 and 50.00 per cent respectively. The five variables
included in independency explain it to an extent of 78.29 per cent since its cronbach
alpha is 0.7829.
6.13 LEVEL OF INDEPENDENCY AMONG THE STUDENTS
The level of independency among the students is computed by the mean score
of the variables in it. In the present study, the level of independency among the students
is confined to less than 2.0, 2.0 to 3.0, 3.1 to 4.0 and above 4.0. The distribution of
students on the basis of their level of independency is given in Table 6.13.
Table 6.13
Level of Independency among the Students
S.No Level of Independency Number of Students
Total Urban Semi Urban Rural
1 Less than 2.0 20 24 29 73
2 2.0-3.0 26 55 41 122
3 3.1-4.0 53 163 43 259
4 Above 4.0 49 52 21 122
Total 148 294 134 576
Source : Primary data
The important levels of independency among the students are 3.1 to 4.0 and
above 4.0 which constitutes 44.97 and 21.18 per cent to the total respectively. The
important level of independency among the urban and semi-urban and rural college
students is 3.1 to 4.0 which constitutes 35.81, 55.44 and 32.09 per cent to its total
216
respectively. The analysis reveals that the level of independency among the urban
students is higher than the semi-urban and rural college students.
6.14 PLANNING SKILLS AMONG THE STUDENTS
The planning skills among the students are identified as one of the important
components of entrepreneurial motivation. It consists of five variables. The mean score
of each variable in planning skills among the urban, semi-urban and rural college
students have been computed separately in order to exhibit the views of the students
about the planning skills along with its „F‟ statistics. The results are given in
Table 6.14.
Table 6.14
Variables in planning skills among the students
S.No Variables in Planning Skills Mean score among students
F Statistics Urban Semi Urban Rural
1 I have my plan for ten years 3.8184 3.4543 3.6025 0.6543
2 I devote most of my time to
my work 3.7308 3.5081 3.4417 0.8844
3 I work for long hours to
complete my work 3.7676 3.5152 3.3994 0.9698
4 I begin day with a list of
things to be done 3.8049 3.4916 3.2507 3.1492*
5 I prepare a plan before
actually working on a project 3.7991 3.4504 3.3043 1.9098
*Significant at five per cent level
The highly viewed planning skills variable by the urban and semi-urban college
students are „I have my plan for ten years‟ and „I work for long hours to complete my
work‟ since their mean scores are 3.8184 and 3.5152 respectively.
217
Among the rural college students the highly viewed planning skills variable is „I
have my plan for ten years‟ since its mean score is 3.6025. Regarding the students‟
views about the planning skills, significant difference among the three groups of
students have been noticed in the case of variable „I begin my day with a list of things
to be done‟ since their respective „F‟ statistics is significant at five per cent level.
6.15 RELIABILITY AND VALIDITY OF VARIABLES IN PLANNING SKILLS
The variables in planning skills have been included for confirmatory factor
analysis in order to examine its reliability and validity. The overall reliability has been
tested with the help of cronbach alpha. The result of the confirmatory factor analysis
and respective cronbach alpha are shown in Table 6.15.
Table 6.15
Reliability and Validity of variables in Planning Skills
S.
No.
Variables in
Planning Skills
Standardized
factor
loading
F
Statistics
Cronbach
alpha
Composite
reliability
Average
variance
extracted
1
I prepare a plan before
actually working on a
project
0.9024 4.0896* 0.8149 0.7842 56.46
2 I begin day with a list
of things to be done 0.8449 3.7371*
3 I have my plan for ten
years 0.7886 3.4541*
4 I work for long hours
to complete my work 0.7117 2.8149*
5 I devote most of my
time to my work 0.6564 2.4334*
*Significant at five per cent level
The five variables included in planning skills explain the reliability and validity
to the extent of 81.49 per cent since its cronbach alpha is 0.8149. The standardized
factor loading of the variables in planning skills are greater than 0.60 which reveals the
218
content validity. The convergent validity is proved since the „F‟ statistics of the
standardized factor loading of the variables are significant at five per cent level. The
composite reliability and average variance extracted are greater than 0.50 and 50.00
which also supports the convergent validity.
6.16 LEVEL OF PLANNING SKILLS AMONG THE STUDENTS
The levels of planning skills among the students are derived by the mean scores
of the variables. In the present study, the levels of planning skills is confined to less
than 2.0, 2.0 to 3.0, 3.1 to 4.0 and above 4.0. The distribution of students on the basis of
their levels of planning skills is illustrated in Table 6.16.
Table 6.16
Level of Planning Skills among the Students
S.No
Level of Planning
Skills
Number of Students in Total
Urban Semi Urban Rural
1 Less than 2.0 18 50 29 97
2 2.0-3.0 29 67 38 134
3 3.1-4.0 56 128 46 230
4 Above 4.0 45 49 21 115
Total 148 294 134 576
Source : Primary data
The important levels of planning skills among the students are 3.1 to 4.0 and 2.0
to 3.0 which constitutes 38.54 and 24.65 per cent to the total respectively. The
important levels of planning skills among the urban and semi-urban college students is
3.1 to 4.0 which constitutes 37.84 and 43.54 per cent to its total respectively. Among
the rural college students the important levels of planning skills is 3.1 to 4.0 which
constitutes 34.33 per cent to its total.

219
The analysis reveals that the level of planning skills among the semi-urban
college students is higher than the urban and rural college students.
6.17 MANAGERIAL SKILLS AMONG THE STUDENTS
The EFA has identified the managerial skills as one of the important
components of the entrepreneurial motivation among the students. It consist of four
variables. The mean score of each variable in managerial skills among the three group
of students have been computed along with its „F‟ statistics. The results are presented in
Table 6.17.
Table 6.17
Variables in Managerial Skills among the Students
S.No Variables in
Managerial Skills
Mean score among students F Statistics
Urban Semi Urban Rural
1 I think of many new
ideas 3.8088 3.2889 3.0445 3.4082*
2 I think over how to
improve my working 3.9117 3.1773 3.0171 3.5996*
3
I do my work
systematically and
logically
3.9204 3.2668 3.1789 3.4589*
4
I do my level best to
satisfy others through
my work
3.8914 3.5149 3.2345 3.1782*
*Significant at five per cent level
The highly viewed variables in managerial skills by the urban and semi-urban
college students are „I do my work systematically and logically‟ and „I do my level best
to satisfy others through my work‟ since their mean sores are 3.9204 and 3.5149
respectively. Among the rural college students the highly viewed variable is „I do my
level best to satisfy others through my work‟ since its mean sores is 3.2345.
220
Regarding the students‟ views about managerial skills, significant difference
among the three groups of students have been noticed in the case of all four variables
since their respective „F‟ statistics are significant at five per cent level.
6.18 RELIABILITY AND VALIDITY OF VARIABLES IN MANAGERIAL SKILLS
The managerial skills among the students consist of four variables. The score of
each variable in managerial skills among the students have been included to examine
the reliability and validity. The confirmatory factor analysis has been administered for
this purpose. The cronbach alpha is computed to examine the overall reliability. The
results are given in Table 6.18.
Table 6.18
Reliability and Validity of variables in Managerial Skills
S.No Variables in
Managerial Skills
Standardized
factor
loading
F
Statistics
Cronbach
alpha
Composite
reliability
Average
variance
extracted
1 I do my level best
to satisfy others
through my work
0.8703 3.7321* 0.7818 0.7509 53.01
2 I do my work
systematically and
logically
0.7917 3.3919*
3 I think of many
new ideas 0.7029 2.8616*
4 I think over how to
improve my
working
0.6334 2.4517*
*Significant at five per cent level
The standardized factor loading of the variables in managerial skills are varying
from 0.6334 to 0.8703 which shows the content validity of the factor. The significance
of „F‟ statistics of the standardized factor loading of the variables in it shows
convergent validity. It is also supported by the composite reliability and average
variance extracted since these are greater than its standard minimum threshold of 0.50

221
and 50.00 per cent respectively. The four variables included in managerial skills
explain it to an extent of 78.18 per cent since its cronbach alpha is 0.7818.
6.19 LEVEL OF MANAGERIAL SKILLS AMONG THE STUDENTS
The level of managerial skills among the students is measured by the mean
score of the variables. In the present study, the level of managerial skills among the
students is confined to less than 2.0, 2.0 to 3.0, 3.1 to 4.0 and above 4.0. The
distribution of students on the basis on their level of managerial skills is given in
Table 6.19.
Table 6.19
Levels of Managerial Skills among Students
S.No
Levels of
Managerial Skills
Number of Students Total
Urban Semi Urban Rural
1 Less than 2.0 13 46 28 87
2 2.0-3.0 21 63 39 123
3 3.1-4.0 63 126 46 235
4 Above 4.0 51 59 21 131
Total 148 294 134 576
Source : Primary data
The important levels of managerial skills among the students are 3.1 to 4.0 and
above 4.0 which constitutes 40.80 and 22.74 per cent to the total respectively. The
important levels of managerial skills among the urban and semi-urban college students
are 3.1 to 4.0 which constitutes 42.57 and 42.86 per cent to its total respectively.
Among the rural college students the important level of managerial skills is also 2.0 to
3.0 which constitutes 34.33 per cent to its total respectively.

222
The analysis reveals that the level of managerial skills among the urban college
students is higher than the semi-urban and rural college students.
6.20 SOCIAL INTERACTION AMONG THE STUDENTS
The social interaction is noted as one of the important components of
entrepreneurial motivation by the EFA. It consists of four variables. The mean score of
each variable in social interaction among the three groups of students have been
computed separately in order to exhibit the level of social interaction among the
students. The one way analysis of variance has been executed to find out the significant
difference among the three groups of students regarding their level on each variable in
social interaction.
Table 6.20
Variables in Social Interaction among the Students
S.No Variables in Social
Interaction
Mean score among students F Statistics
Urban Semi Urban Rural
1 I have strong desire for
social interaction 3.7389 3.9676 3.8182 0.4547
2 I persuade people to do
what I want 3.6082 3.9221 3.7974 0.9676
3 I like to work with
others 3.5911 3.7308 3.9091 1.7378
4
I am always in search
of people who can help
me in my work
3.4332 3.9973 3.9733 2.0239
*Significant at five per cent level
The Table 6.20 shows the mean score of each variable in social interaction
among the three group students along with their „F‟ statistics. The highly viewed
variable in social interaction by the urban and semi-urban college students are ‟I have
223
strong desire for social interaction‟ and „I am always in search of people who can help
me in my work‟ since this means score are 3.7389 and 3.9973 respectively. Among the
rural college students the highly viewed variable is „I am always in search of people
who can help me in my work‟ since its mean score is 3.9733.
Regarding the level of social interaction the significant difference among the
three groups of students have not been noticed in all four variables since the respective
„F‟ statistics are not significant at five per cent level.
6.21 RELIABILITY AND VALIDITY OF VARIABLES IN SOCIAL INTERACTION
The score of the variables in social interaction have been included to examine
the reliability and validity of variables. In order to examine the same, the confirmatory
factor analysis has been administered for this purpose. The overall reliability has been
estimated with the help of cronbach alpha. The results are shown in Table 6.21.
Table 6.21
Reliability and Validity of variables in Social Interaction
S.No
Variables in
Social
Interaction
Standardized
factor
loading
F
Statistics
Cronbach
alpha
Composite
reliability
Average
variance
extracted
1 I like to work
with others 0.9143 4.0389* 0.8089 0.7817 56.46
2 I persuade people
to do what I want 0.8089 3.3187*
3
I am always in
search of people
who can help me
in my work
0.7293 2.9149*
4
I have strong
desire for social
interaction
0.6739 2.7382*
*Significant at five per cent level

224
The standardized factor loading of variables in social interaction varies from
0.6739 to 0.9143 which reveals the content validity. The significance of „F‟ statistics of
the standardized factor loading of the variables in social interaction reveals the
convergent validity. It is also supported by the composite reliability and average
variance extracted since these are greater than its standard minimum threshold of 0.50
and 50.00 per cent respectively. The four variables included in social interaction
explain it to an extent of 80.89 per cent since its cronbach alpha is 0.8089.
6.22 LEVEL OF SOCIAL INTERACTION AMONG THE STUDENTS
The level of social interaction among the students has been measured by the
mean score of the variables. In the present study the level of social interaction among
the students is confined to less than 2.0, 2.0 to 3.0, 3.1 to 4.0 and above 4.0. The
distribution of students on the basis of the level of social interaction is illustrated in
Table 6.22.
Table 6.22
Level of Social Interaction among the Students
S.No
Level of Social
Interaction
Number of Students Total
Urban Semi Urban Rural
1 Less than 2.0 25 38 22 85
2 2.0-3.0 36 43 21 100
3 3.1-4.0 58 126 53 237
4 Above 4.0 29 87 38 154
Total 148 294 134 576
Source : Primary data
The important levels of social interaction among the students are 3.1 to 4.0 and
above 4.0 which constitutes 41.15 and 26.74 per cent to the total respectively. The
important level of social interaction among the urban and semi-urban college students
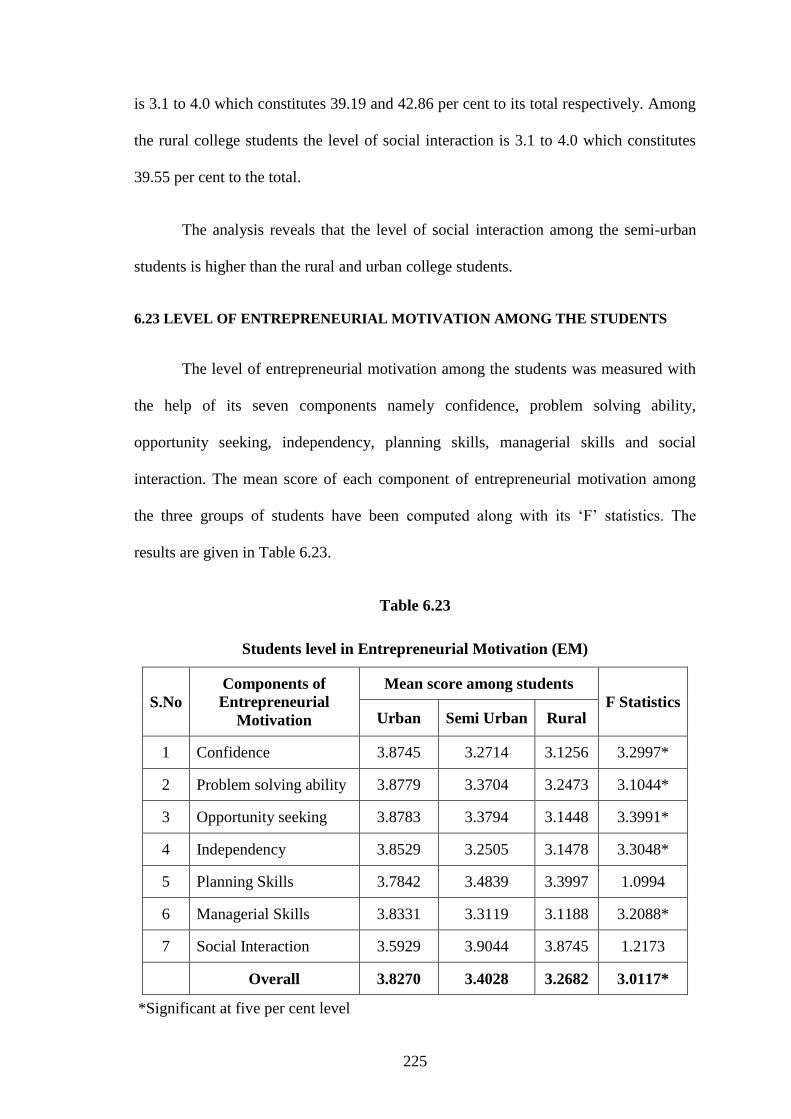
225
is 3.1 to 4.0 which constitutes 39.19 and 42.86 per cent to its total respectively. Among
the rural college students the level of social interaction is 3.1 to 4.0 which constitutes
39.55 per cent to the total.
The analysis reveals that the level of social interaction among the semi-urban
students is higher than the rural and urban college students.
6.23 LEVEL OF ENTREPRENEURIAL MOTIVATION AMONG THE STUDENTS
The level of entrepreneurial motivation among the students was measured with
the help of its seven components namely confidence, problem solving ability,
opportunity seeking, independency, planning skills, managerial skills and social
interaction. The mean score of each component of entrepreneurial motivation among
the three groups of students have been computed along with its „F‟ statistics. The
results are given in Table 6.23.
Table 6.23
Students level in Entrepreneurial Motivation (EM)
S.No
Components of
Entrepreneurial
Motivation
Mean score among students
F Statistics Urban Semi Urban Rural
1 Confidence 3.8745 3.2714 3.1256 3.2997*
2 Problem solving ability 3.8779 3.3704 3.2473 3.1044*
3 Opportunity seeking 3.8783 3.3794 3.1448 3.3991*
4 Independency 3.8529 3.2505 3.1478 3.3048*
5 Planning Skills 3.7842 3.4839 3.3997 1.0994
6 Managerial Skills 3.8331 3.3119 3.1188 3.2088*
7 Social Interaction 3.5929 3.9044 3.8745 1.2173
Overall 3.8270 3.4028 3.2682 3.0117*
*Significant at five per cent level

226
The highly existing components of entrepreneurial motivation among the urban
college students are opportunity seeking and problem solving ability since their mean
scores are 3.8783 and 3.8779 respectively. Among the semi-urban college students,
these are social interaction and planning skills since their mean score are 3.9044 and
3.4839 respectively. Among the rural college students the highly existing components
of entrepreneurial motivation are social interaction and planning skills since their mean
score are 3.8745 and 3.3997 respectively.
Regarding the existence of entrepreneurial motivation, significant difference
among the three groups of students have been noticed in the case of five out of seven
entrepreneurial motivation components since their respective „F‟ statistics are
significant at five per cent level.
6.24 ASSOCIATION BETWEEN PROFILE OF STUDENTS AND THEIR
ENTREPRENEURIAL MOTIVATION
The profile of the students may be associated with their level of entrepreneurial
motivation. The present study has made an attempt to examine the association between
the profile variable and the entrepreneurial motivation with the help of one way
analysis of variance. The profile variables included for this purpose are gender, age,
place of college, branch of study, social groups, religion, type of family, size of family,
monthly family income, father‟s occupation and mother‟s occupation. The results are
given in Table 6.24.
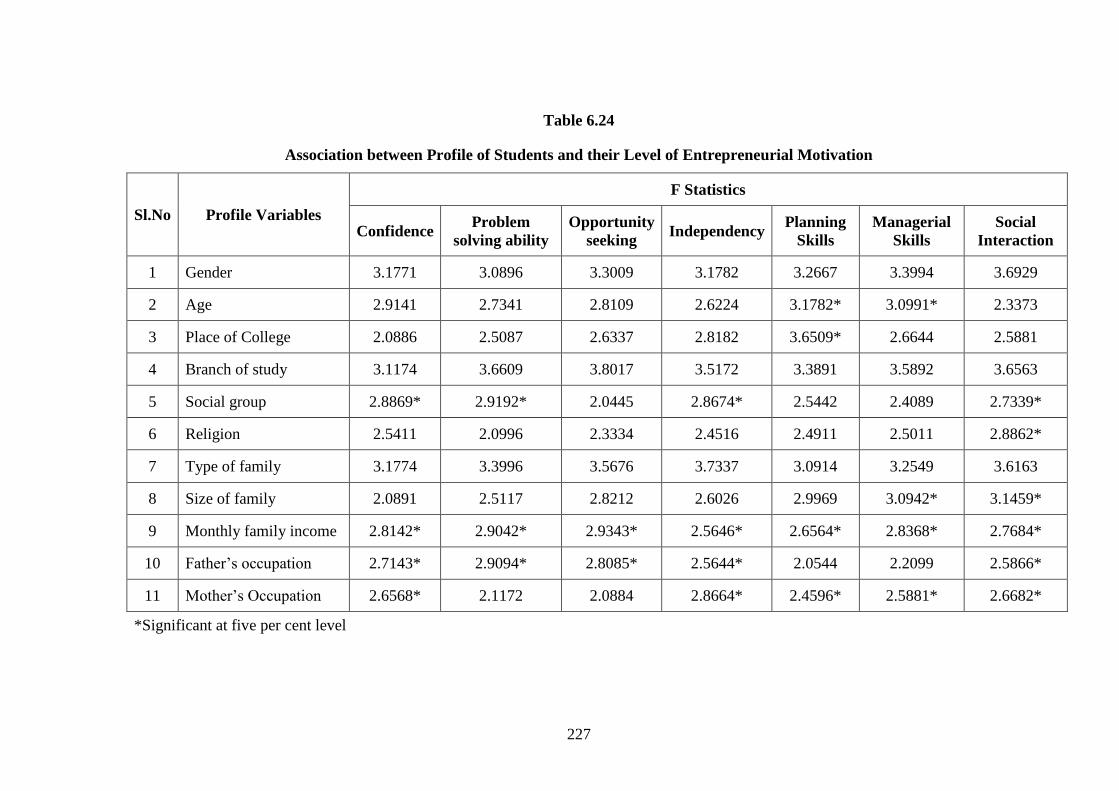
227
Table 6.24
Association between Profile of Students and their Level of Entrepreneurial Motivation
Sl.No Profile Variables
F Statistics
Confidence Problem
solving ability
Opportunity
seeking Independency
Planning
Skills
Managerial
Skills
Social
Interaction
1 Gender 3.1771 3.0896 3.3009 3.1782 3.2667 3.3994 3.6929
2 Age 2.9141 2.7341 2.8109 2.6224 3.1782* 3.0991* 2.3373
3 Place of College 2.0886 2.5087 2.6337 2.8182 3.6509* 2.6644 2.5881
4 Branch of study 3.1174 3.6609 3.8017 3.5172 3.3891 3.5892 3.6563
5 Social group 2.8869* 2.9192* 2.0445 2.8674* 2.5442 2.4089 2.7339*
6 Religion 2.5411 2.0996 2.3334 2.4516 2.4911 2.5011 2.8862*
7 Type of family 3.1774 3.3996 3.5676 3.7337 3.0914 3.2549 3.6163
8 Size of family 2.0891 2.5117 2.8212 2.6026 2.9969 3.0942* 3.1459*
9 Monthly family income 2.8142* 2.9042* 2.9343* 2.5646* 2.6564* 2.8368* 2.7684*
10 Father‟s occupation 2.7143* 2.9094* 2.8085* 2.5644* 2.0544 2.2099 2.5866*
11 Mother‟s Occupation 2.6568* 2.1172 2.0884 2.8664* 2.4596* 2.5881* 2.6682*
*Significant at five per cent level
228
Regarding the entrepreneurial motivation component „confidence, the
significantly associating profile variables are social group, monthly family income,
father‟s and mother‟s occupation since their respective „F‟ statistics are significant at
five per cent level.
The significantly associating profile variables regarding the entrepreneurial
motivation component „problem solving ability‟ among the students are social group,
monthly family income and father‟s occupation whereas regarding the „opportunity
seeking‟ component of entrepreneurial motivation, the associating profile variables are
monthly family income and father‟s occupation since their respective „F‟ statistics are
significant at five per cent level.
Regarding the entrepreneurial motivation component „independency‟, the
significantly associating profile variables are social group, monthly income, father‟s
and mother‟s occupation since their respective „F‟ statistics are significant at five per
cent level.
The significantly associating profile variables regarding the entrepreneurial
motivation component „planning skills‟ are age, place of college, monthly family
income and mother‟s occupation whereas regarding the entrepreneurial motivation
component „managerial skills‟, the associating profile variables are age, size of family,
monthly family income and mother‟s occupation since their respective „F‟ statistics are
significant at five per cent level.
Regarding the entrepreneurial motivation component „social interaction‟ the
significantly associating profile variables are social group, religion, size of family,

229
monthly family income, father‟s and mother‟s occupation since their respective „F‟
statistics are significant at five per cent level.
6.25 DISCRIMINANT COMPONENT OF ENTREPRENEURIAL MOTIVATION
AMONG THE URBAN AND SEMI-URBAN COLLEGE STUDENTS
Regarding the entrepreneurial motivation the urban college students may be
differing from the semi-urban college students. It is imperative to identify the important
discriminant component of entrepreneurial motivation among the two group of
students. Initially, the mean difference and its statistical significance have been
computed. The discriminant power of entrepreneurial motivation has been computed
with the help of wilks lambda. The results are presented in Table 6.25.
Table 6.25
Mean Difference and Discriminate Power of Entrepreneurial Motivation among
Urban and Semi- urban Students
Sl.
No
Components of
Entrepreneurial
Motivation
Mean score
among students Mean
Difference
„t‟
Statistics
Wilks
lambda Urban
Semi
Urban
1 Confidence (X1) 3.8745 3.2714 0.6031 3.0886* 1.1084
2 Problem solving
ability (X2) 3.8779 3.3704 0.5075 2.5969* 0.1337
3 Opportunity seeking
(X3) 3.8783 3.3794 0.4989 1.8084 0.2177
4 Independency (X4) 3.8529 3.2505 0.6024 2.9197* 0.1766
5 Planning Skills (X5) 3.7842 3.4839 0.3003 1.3637 0.2866
6 Managerial Skills (X6) 3.8331 3.3119 0.5212 2.7313* 0.1544
7 Social Interaction (X7) 3.5929 3.9044 -0.3115 -0.7331 0.3996
* Significant at five per cent level

230
The significant mean differences are noticed in the case of confidence, problem
solving ability, independence and managerial skills since they are significant at five per
cent level. The higher mean differences are noticed in the case of „confidence‟ and
„independency‟ since their mean difference is 0.6031 and 0.6024 respectively. The
higher discriminant power is noticed in the case of „confidence‟ and „problem solving
ability‟ since their wilks lambda are 0.1084 and 0.1337 respectively. The significant
entrepreneurial motivation has been included to estimate the two group discriminant
function. The unstandardised procedure has been followed to estimate the function. The
estimated function is:
Z = 0.541 x1 + 0.1732 x2 + 0.1448 x4 + 0.1676 x6
The relative contribution of each discriminant entrepreneurial motivation in
total discriminant score is computed by the product of discriminant coefficient and the
mean difference of the respective entrepreneurial motivation. The results are shown in
Table 6.26.
Table 6.26
Relative contribution of Entrepreneurial Motivation in Total Discriminant score
Sl.
No
Components of
Entrepreneurial
Motivation
Discriminant
Coefficient
Mean
Difference Product
Relative
contribution
in TDS
1 Confidence (X1) 0.1817 0.6031 0.1096 29.45
2 Problem solving
ability (X2) 0.1732 0.5075 0.0879 23.62
3 Independency (X4) 0.1448 0.6024 0.0872 23.44
4 Managerial skills (X6) 0.1676 0.5212 0.0874 23.49
Total 0.3721 100.00
Per cent of cases currently classified : 76.69
* Significant at five per cent level

231
The higher discriminant coefficients are noticed in the case of „confidence‟ and
„managerial skills‟ since their discriminant coefficients are 0.1817 and 0.1676
respectively. It shows the higher influencer of above said two components of
entrepreneurial motivation in discriminant function. The highest relative contribution of
components of entrepreneurial motivation in total discriminant score is noticed in the
case of „confidence‟ and „problem solving ability‟ since their relative contribution are
29.45 and 23.62 per cent respectively. The estimated two group discriminant function
currently classifies the cases to an extant of 76.69 per cent.
The analysis reveals that the important discriminant components of
entrepreneurial motivation among the urban and semi-urban college students are their
level of „confidence‟ and „problem solving ability‟ which are higher among the urban
college students than among the semi-urban college students.
6.26 DISCRIMINANT COMPONENTS OF ENTREPRENEURIAL MOTIVATION
AMONG THE URBAN AND RURAL COLLEGE STUDENTS
The level of entrepreneurial motivation among the urban and rural college
students may differ from each other. So it is essential to analyse and to exhibit the
important discriminant components of entrepreneurial motivation among the two
groups of students. The mean difference and its statistical significance have been
computed. The discriminant power of each components of entrepreneurial motivation
has been computed with the help of cronbach alpha. The results are illustrated in
Table 6.27.

232
Table 6.27
Mean difference and Discriminant Power of Entrepreneurial Motivation among
Urban and Rural College Students
Sl.
No
Components of
Entrepreneurial
Motivation
Mean Score
among students Mean
Difference
„t‟
Statistics
Wilks
lambda Urban Rural
1 Confidence (X1) 3.8745 3.1256 0.7489 3.6634* 0.1082
2 Problem solving ability
(X2) 3.8779 3.2473 0.6306 2.6089* 0.1733
3 Opportunity seeking
(X3) 3.8783 3.1448 0.7335 3.5889* 0.1581
4 Independency (X4) 3.8529 3.1478 0.7051 3.1171* 0.1394
5 Planning Skills (X5) 3.7842 3.3997 0.3845 1.8084 0.2693
6 Managerial Skills (X6) 3.8331 3.1188 0.7143 3.6049* 0.1389
7 Social Interaction (X7) 3.5929 3.8745 -0.2816 -1.3945 0.2976
*Significant at five per cent level
The significant mean differences are noticed in the case of confidence, problem
solving ability, opportunity seeking, independency and managerial skills since their
respective mean difference are significant at five per cent level. The higher mean
differences are noticed in the case of „confidence‟ and „opportunity seeking‟ since their
mean differences are 0.7489 and 0.7335 respectively.
The higher Discriminant powers is noticed in the case of „confidence‟ and
„managerial skills‟ since their respective Wilks lambda are 0.1082 and 0.1389.
The significant components of entrepreneurial motivation are included to
estimate the two group discriminant function. The unstandardised procedure has been
followed to estimate the function. The estimated functions is:
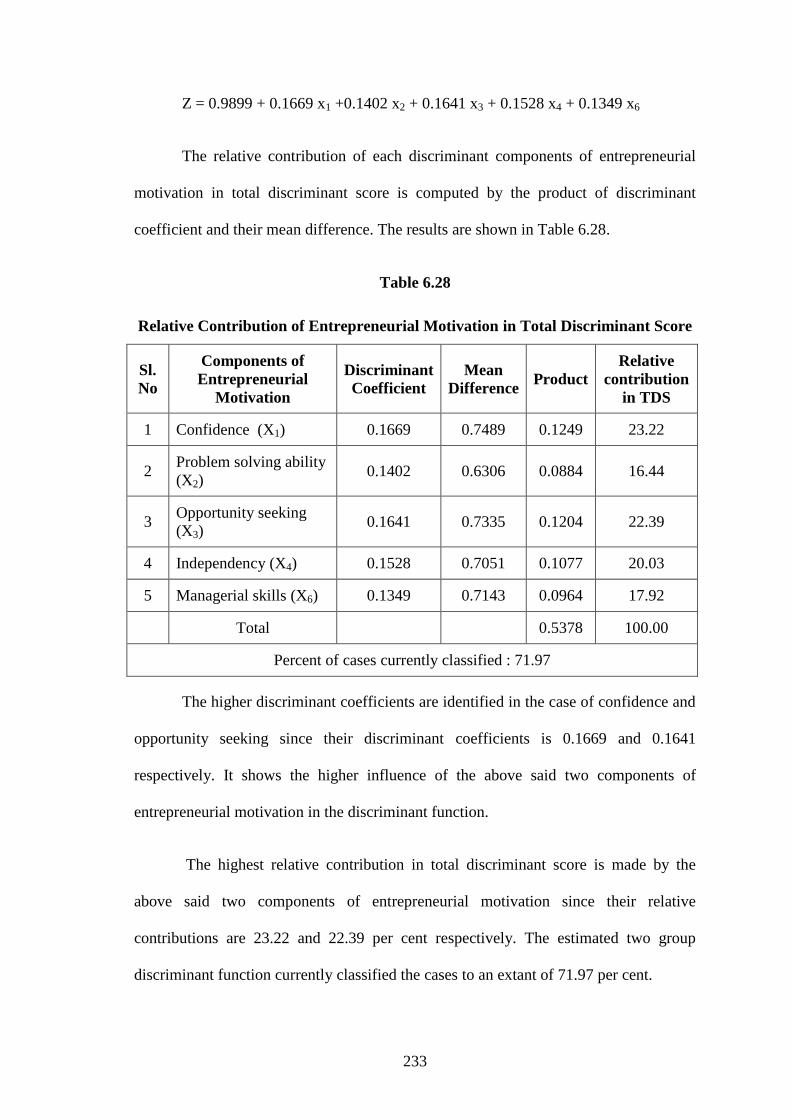
233
Z = 0.9899 + 0.1669 x1 +0.1402 x2 + 0.1641 x3 + 0.1528 x4 + 0.1349 x6
The relative contribution of each discriminant components of entrepreneurial
motivation in total discriminant score is computed by the product of discriminant
coefficient and their mean difference. The results are shown in Table 6.28.
Table 6.28
Relative Contribution of Entrepreneurial Motivation in Total Discriminant Score
Sl.
No
Components of
Entrepreneurial
Motivation
Discriminant
Coefficient
Mean
Difference Product
Relative
contribution
in TDS
1 Confidence (X1) 0.1669 0.7489 0.1249 23.22
2 Problem solving ability
(X2) 0.1402 0.6306 0.0884 16.44
3 Opportunity seeking
(X3) 0.1641 0.7335 0.1204 22.39
4 Independency (X4) 0.1528 0.7051 0.1077 20.03
5 Managerial skills (X6) 0.1349 0.7143 0.0964 17.92
Total 0.5378 100.00
Percent of cases currently classified : 71.97
The higher discriminant coefficients are identified in the case of confidence and
opportunity seeking since their discriminant coefficients is 0.1669 and 0.1641
respectively. It shows the higher influence of the above said two components of
entrepreneurial motivation in the discriminant function.
The highest relative contribution in total discriminant score is made by the
above said two components of entrepreneurial motivation since their relative
contributions are 23.22 and 22.39 per cent respectively. The estimated two group
discriminant function currently classified the cases to an extant of 71.97 per cent.
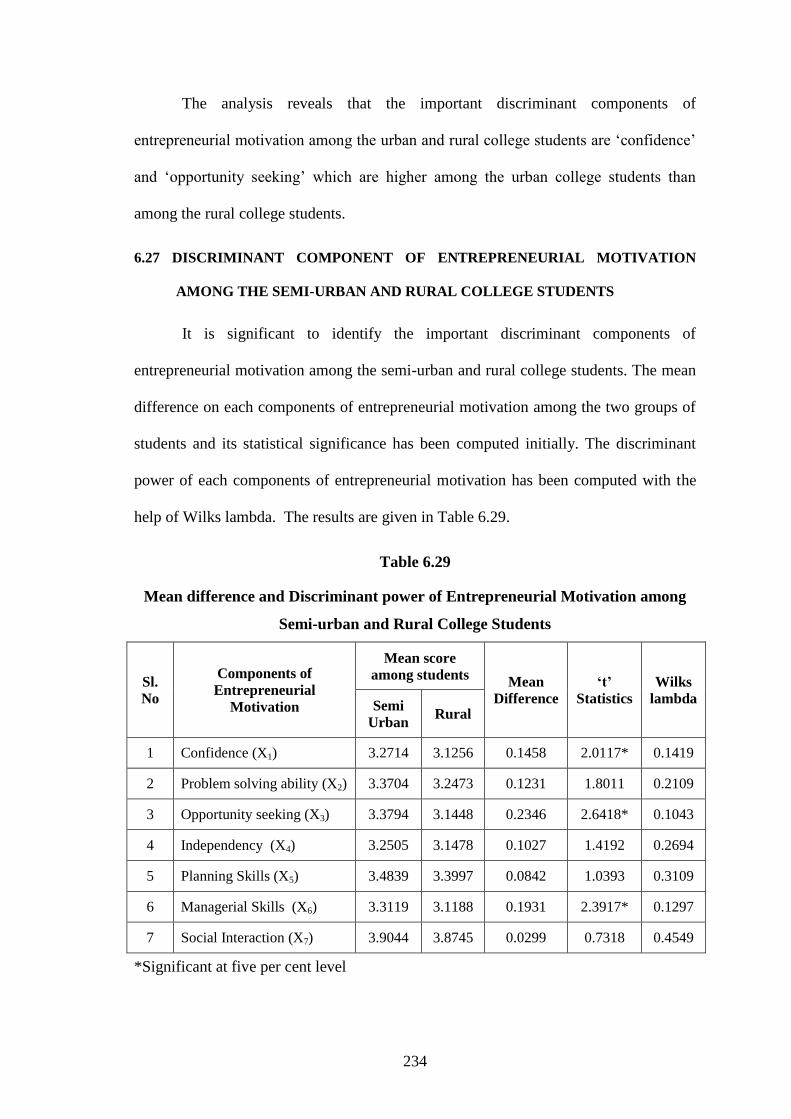
234
The analysis reveals that the important discriminant components of
entrepreneurial motivation among the urban and rural college students are „confidence‟
and „opportunity seeking‟ which are higher among the urban college students than
among the rural college students.
6.27 DISCRIMINANT COMPONENT OF ENTREPRENEURIAL MOTIVATION
AMONG THE SEMI-URBAN AND RURAL COLLEGE STUDENTS
It is significant to identify the important discriminant components of
entrepreneurial motivation among the semi-urban and rural college students. The mean
difference on each components of entrepreneurial motivation among the two groups of
students and its statistical significance has been computed initially. The discriminant
power of each components of entrepreneurial motivation has been computed with the
help of Wilks lambda. The results are given in Table 6.29.
Table 6.29
Mean difference and Discriminant power of Entrepreneurial Motivation among
Semi-urban and Rural College Students
Sl.
No
Components of
Entrepreneurial
Motivation
Mean score
among students Mean
Difference
„t‟
Statistics
Wilks
lambda Semi
Urban Rural
1 Confidence (X1) 3.2714 3.1256 0.1458 2.0117* 0.1419
2 Problem solving ability (X2) 3.3704 3.2473 0.1231 1.8011 0.2109
3 Opportunity seeking (X3) 3.3794 3.1448 0.2346 2.6418* 0.1043
4 Independency (X4) 3.2505 3.1478 0.1027 1.4192 0.2694
5 Planning Skills (X5) 3.4839 3.3997 0.0842 1.0393 0.3109
6 Managerial Skills (X6) 3.3119 3.1188 0.1931 2.3917* 0.1297
7 Social Interaction (X7) 3.9044 3.8745 0.0299 0.7318 0.4549
*Significant at five per cent level

235
The significant mean differences are noticed in the case of confidence,
opportunity seeking and managerial skills since their mean differences are significant at
five per cent level. The higher mean differences are noticed in the case of „opportunity
seeking‟ and „managerial skills‟ since their mean differences are 0.2346 and 0.1931
respectively.
The higher discriminate power is identified in the case of „opportunity seeking‟
and „managerial skills‟ since their respective Wilks lambda are 0.1043 and 0.1297.
The significant components of entrepreneurial motivation have been included to
estimate the two group discriminant function. The unstandardised procedure has been
followed to estimate the function. The estimated functions is:
Z = 0.3497 + 0.1042 X1 + 0.1827 X3 + 0.1949 X6
The relative contribution of discriminant components of entrepreneurial
motivation in total discriminant score is estimated by the product of discriminant
coefficient and their mean difference. The results are shown in Table 6.30.
Table 6.30
Relative contribution of Entrepreneurial Motivation in Total Discriminant Score
Sl.
No
Significant
Components of
Entrepreneurial
Motivation
Discriminant
Coefficient
Mean
Difference Product
Relative
contribution
in TDS
1 Confidence (X1) 0.1042 0.1458 0.0152 15.89
2 Opportunity seeking
(X3) 0.1827 0.2346 0.0428 44.78
3 Managerial skills (X6) 0.1949 0.1931 0.0376 39.33
Total 0.0956 100.00
Per cent of cases currently classified : 73.28

236
The important components of entrepreneurial motivation among the significant
entrepreneurial motivation is „managerial ability‟ since its discriminant coefficient is
0.1949. it shows that the above said component of entrepreneurial motivation has more
influence in the discriminant function.
The highest relative contribution of important components of entrepreneurial
motivation in total discriminant score is noticed in the case of „opportunity seeking‟
and „managerial skills‟ since their relative contribution are 44.78 and 39.33 per cent
respectively. The estimated two group discriminant analysis currently estimates the
cases to an extant of 73.28 per cent.
The analysis reveals that the important discriminant components of
entrepreneurial motivation among the semi-urban and rural college students are
„opportunity seeking‟ and „managerial skills‟ which are higher among the semi-urban
college students than among the rural college students.
6.28 IMPACT OF FACTORS LEADING TO ENTREPRENEURIAL TRAITS
ON ENTREPRENEURIAL MOTIVATION
The factors leading to entrepreneurial traits among the students may have its‟
own influence on the entrepreneurial motivation among the students. It is important to
examine the impact of each factor on the entrepreneurial motivation among the
students. The multiple regression analysis has been applied for this purpose. The fixed
regression model is:
Y = a+b1x1 + b2x2 + . . . . . . . . + b12x12 + e
237
Whereas y – score on entrepreneurial motivation among the students
X1 - Score on coordination among the students
X2 - Score on innovativeness among the students
X3 - Score on optimism among the students
X4 - Score on informativeness among the students
X5 - Score on decision making skill among the students
X6 - Score on hard work among the students
X7 - Score on problem solving skills among the students
X8 - Score on confidence among the students
X9 - Score on enterprising among the students
X10 - Score on punctuality among the students
X11 - Score on sincerity among the students
X12 - Score on forecasting ability among the students
b1, b2, ….. b12 - Regression coefficient of independent variables
a - intercept and
e - error term
The impact has been measured among the urban, semi-urban and rural college
students and also for the pooled data. The results are illustrated in Table 6.31.

238
Table 6.31
Impact of Factors Leading to Entrepreneurial Traits on
Entrepreneurial Motivation
Sl.No Factors Leading to
Entrepreneurial Traits
Regression Coefficient among students
Urban Semi-urban Rural Pooled Data
1 Coordination 0.1847* 0.1309* 0.1511* 0.1602*
2 Innovativeness 0.2102* 0.0447 0.1033 0.0917
3 Optimism 0.1641* 0.0991 0.0594 0.0788
4 Informativeness 0.1229* -0.0497 -0.0774 0.0334
5 Decision making skills 0.1007 0.1392* 0.1991* 0.1517*
6 Hard work 0.0949 0.1447* 0.2173* 0.1494*
7 Problem solving skills 0.1391* 0.0779 0.1589* 0.1207*
8 Confidence 0.1508* 0.1411* 0.1634* 0.1491*
9 Enterprising 0.1617* 0.0337 0.1509* 0.1294*
10 Punctuality 0.0446 0.1022 0.0734 0.0649
11 Sincerity 0.0571 0.0776 0.0411 0.0391
12 Forecasting ability 0.0669 0.0441 0.0279 0.0492
Constant 0.9383 0.5891 0.3894 0.6991
R2 0.7919 0.7337 0.7049 0.7994
F Statistics 8.5614* 7.9319* 7.3244* 8.6541*
The significantly and positively influencing factors on entrepreneurial
motivation among the urban college students are coordination, innovativeness,
optimism, infromativeness, problem solving skills, confidence and enterprising since
their respective regression coefficients are significant at five per cent level. Unit
increase in the above said factors results in an increase in their entrepreneurial
motivation by 0.1847, 0.2102, 0.1641, 0.1229, 0.1391, 0.1508 and 0.1617 units
respectively. The changes in the factors influencing entrepreneurial traits among the

239
students explain their entrepreneurial motivation to an extent of 79.19 per cent since
their R2 is 0.7919.
Among the semi-urban college students, a unit increase in the level on
coordination, decision making skills, hard work, and confidence results in an increase
in their entrepreneurial motivation by 0.1309, 0.1392, 0.1447 and 0.1411 units
respectively. The R2 (0.7337) reveals that the changes in the entrepreneurial motivation
among the semi-urban college students to an extent of 73.37 per cent.
Among the rural college students, it is explained to an extent of 70.49 per cent
since its R2 is 0.7049. The significantly influencing factors are coordination, decision
making skills, hard work, problem solving skills, confidence and enterprising.
The analysis of pooled data reveals the importance of coordination, decision
making skills, hard work, problem solving skills, confidence and enterprising in the
determination of entrepreneurial motivation among the students to an extent of 79.94
per cent since its R2 is 0.7994.
6.29 IMPACT OF ACHIEVEMENT MOTIVATION ON THE ENTREPRENEURIAL
MOTIVATION AMONG THE STUDENTS
The achievement motivation among the students may have its own influence on
their entrepreneurial motivation. So it is essential to examine the impact of achievement
motivation on entrepreneurial motivation. The multiple regression analysis has been
administrated for this purpose. The fitted regression model is:
Y = a+b1x1 + b2x2 + . . . . . . . . + b8x8 + a
240
Whereas y – score on entrepreneurial motivation among the students
X1 - Score on achievement motivation among the students
X2 - Score on need for achievement among the students
X3 - Score on academic challenge among the students
X4 - Score on attitude towards education among the students
X5 - Score on meaningfulness of task and work methods among
the students
X6 - Score on attitude towards teachers among the students
X7 - Score on general interests and sports among the students
X8 - Score on importance of marks among the students
b1, b2, ….. b8 - regression coefficient of independent variables
a - constant and
e - error term
The impact of achievement motivation on the entrepreneurial motivation among
the students has been examined among the three groups of students and also for pooled
data separately. The results are shown in Table 6.32.
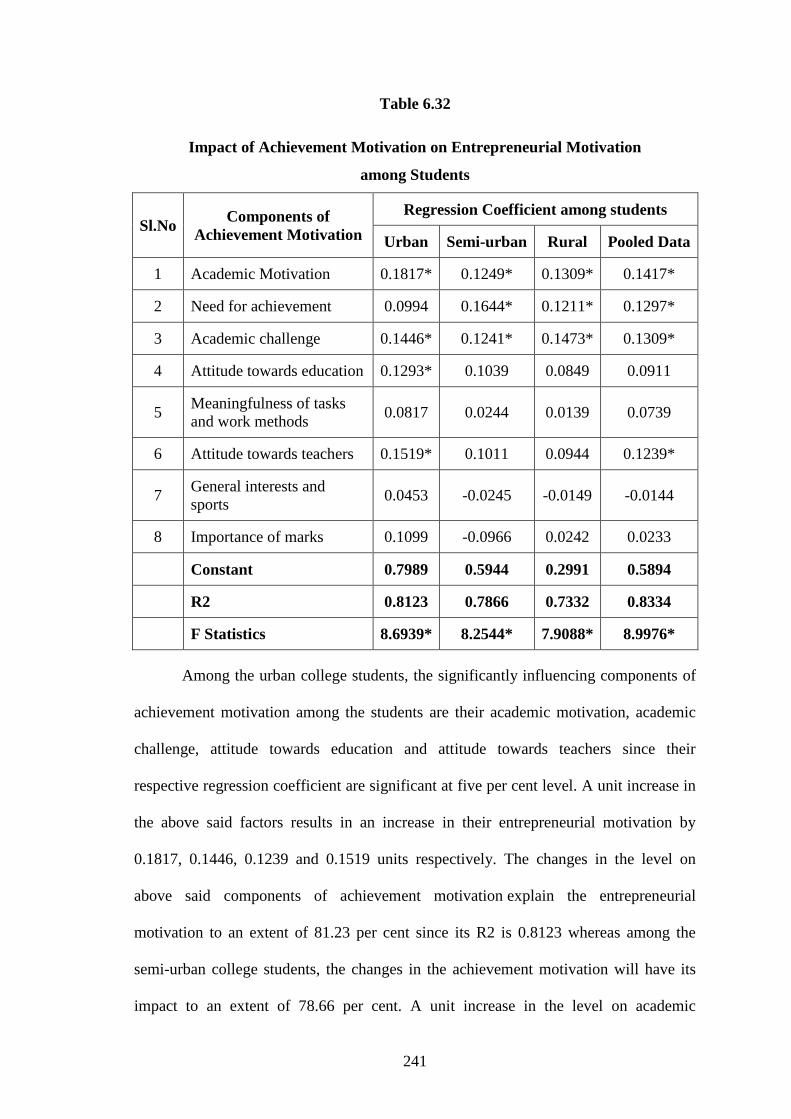
241
Table 6.32
Impact of Achievement Motivation on Entrepreneurial Motivation
among Students
Sl.No Components of
Achievement Motivation
Regression Coefficient among students
Urban Semi-urban Rural Pooled Data
1 Academic Motivation 0.1817* 0.1249* 0.1309* 0.1417*
2 Need for achievement 0.0994 0.1644* 0.1211* 0.1297*
3 Academic challenge 0.1446* 0.1241* 0.1473* 0.1309*
4 Attitude towards education 0.1293* 0.1039 0.0849 0.0911
5 Meaningfulness of tasks
and work methods 0.0817 0.0244 0.0139 0.0739
6 Attitude towards teachers 0.1519* 0.1011 0.0944 0.1239*
7 General interests and
sports 0.0453 -0.0245 -0.0149 -0.0144
8 Importance of marks 0.1099 -0.0966 0.0242 0.0233
Constant 0.7989 0.5944 0.2991 0.5894
R2 0.8123 0.7866 0.7332 0.8334
F Statistics 8.6939* 8.2544* 7.9088* 8.9976*
Among the urban college students, the significantly influencing components of
achievement motivation among the students are their academic motivation, academic
challenge, attitude towards education and attitude towards teachers since their
respective regression coefficient are significant at five per cent level. A unit increase in
the above said factors results in an increase in their entrepreneurial motivation by
0.1817, 0.1446, 0.1239 and 0.1519 units respectively. The changes in the level on
above said components of achievement motivation explain the entrepreneurial
motivation to an extent of 81.23 per cent since its R2 is 0.8123 whereas among the
semi-urban college students, the changes in the achievement motivation will have its
impact to an extent of 78.66 per cent. A unit increase in the level on academic

242
motivation, need for achievement and academic challenges among the semi urban
college student results in an increase in their entrepreneurial motivation by 0.1249,
0.1644 and 0.1241 units respectively.
Among the rural college students, the significantly influencing components of
achievement motivation on the entrepreneurial motivation are academic motivation,
need for achievement and academic challenge. A unit increase in the level on above
said components results in an increase in entrepreneurial motivation by 0.1309, 0.1211
and 0.1473 units respectively.
The analysis of pooled data reveals the relative importance of academic
motivation, need for achievement, academic challenges and attitude towards teachers in
the determination of their entrepreneurial motivation.
6.30 CONCLUSION
In this chapter a detailed analysis of entrepreneurial motivation and its
determinants is given. Seven important factors influencing the entrepreneurial
motivation have been identified by applying exploratory factor analysis. The reliability
and validity tests have been applied to find out the reliability and validity of the
variables identified under each factor. The application of one way analysis of variance
highlighted the association between the profile of the students and their entrepreneurial
motivation. The discriminant factor analysis exposed the discriminant components of
entrepreneurial motivation among the urban, semi-urban and rural college students. The
multiple regression analysis revealed the influence of the entrepreneurial traits on the
entrepreneurial motivation. The evidences of impact of achievement motivation on
entrepreneurial motivation have been identified with the help of multiple regression
analysis.

Chapter - VII
Summary of Findings and Suggestions

CHAPTER - VII
SUMMARY OF FINDINGS AND SUGGESTIONS
7.0 Introduction
7.1 Summary of findings
7.2 Findings relating to achievement motivation
7.3 Findings relating to entrepreneurial motivation
7.4 Suggestions
7.5 Conclusion
243
CHAPTER - VII
SUMMARY OF FINDINGS AND SUGGESTIONS
7.0 INTRODUCTION
The college education provides innumerable avenues and career opportunities to
the students. The present study is an attempt to assess the entrepreneurial traits and
achievement motivation among the arts and science college students in Thoothukudi
district. The major objectives of the present study are; (i) to study the socio economic
background of the final year college students (ii) to ascertain the entrepreneurial traits
and to analyse the same among the urban, semi-urban and rural college students (iii) to
examine the achievement motivation and entrepreneurial motivation (iv) to study the
relationship between the personal profile variables and the entrepreneurial traits and
achievement motivation of the college students (v) and to assess the impact of
entrepreneurial traits and achievement motivation on entrepreneurial motivation.
In order to fulfill the objective of the study, the colleges in Thoothukudi District
have been classified in to urban, semi-urban and rural. In total there are 19 Arts and
Science colleges in Thoothukudi District and 5766 students are undergoing Arts and
Science courses. The present study covers ten per cent of the population as sample.
Proportionate random sampling method was applied for the selection of the sample
units. Interview schedule had been prepared to collect the relevant data from the
students. Before preparing the interview schedule earlier studies were reviewed and
opinions were collected from the experts in the field to identify the appropriate
variables for the study. Pilot study was also conducted to test the appropriateness of the
questions included for the study. The data had been collected from the students giving

244
representation to the colleges located in the urban, semi-urban and rural colleges. In
order to process the collected data, appropriate statistical tools have been used.
The analysis consists of three parts. In the first part the background of students
and their entrepreneurial traits have been analysed. This part also deals with the
association between the personal profile of the students and their entrepreneurial traits.
Various components of achievement motivation and their association with the personal
profile of the students have been dealt with in the second part. The application of
discriminant factor analysis highlighted the achievement motivation factors which
discriminate the urban, semi-urban and rural college students. In the final part of the
analysis the significant factors leading to entrepreneurial motivation and their
association with the personal profile of the students have been presented. The
discriminant components of entrepreneurial motivation among the urban, semi-urban
and rural college students have been identified. The application of multiple regression
analysis traced the impact of the entrepreneurial traits and achievement motivation on
entrepreneurial motivation among the urban, semi-urban and rural college students.
Based on the analysis inferences were drawn and the findings emerged out of
the study are listed below.
7.1 SUMMARY OF FINDINGS
7.1.1 Findings relating to Socio-economic Conditions of the students
Majority (51.04 per cent) of the college students are studying in semi-
urban colleges in the study area.
It is found that most (58.85 per cent) of the college students are girl
students. Among them majority (51.33 per cent) of the students are
studying in the semi-urban colleges.
245
It is observed that majority (76.22 per cent) of the students belong to the
age group of 19 to 21 years. Among them most (53.76 per cent) of the
students are studying in the semi-urban colleges.
It is found that most (55.21 per cent) of the students are coming to the
colleges from the semi-urban areas. Among them majority (58.49 per
cent) of the students are studying in the semi-urban colleges. Only 14.78
per cent of the semi-urban students are going to the colleges situated in
the urban areas. Among the students living in the rural areas, majority
(49.23 per cent) of them are studying in the rural colleges and only
18.46 per cent of the rural area students are going to the urban colleges.
It is identified that majority (58.78 per cent) of the college students
studying in the urban colleges are undergoing science courses, whereas
among the semi-urban college students majority (53.06per cent) of them
are studying arts courses and in the rural colleges 52.99 per cent of the
students are undergoing arts courses.
It is observed that most (37.33 per cent) of the students are coming
under the backward class community. The most dominating social class
among the urban, semi-urban and rural college students are forward
class, backward class and SC/ST which constitute 37.84, 44.56 and
56.71 per cent respectively.
It is found that most (63.37 per cent) of the students belongs to Hindu
religion. The dominant religion among the urban, semi-urban and rural
college students are Christians and Hindus which constitute 43.92, 71.77
and 67.16 per cent respectively.
246
It is identified that most (81.25 per cent) of the students belongs to
nuclear family system. Among them 87.16, 93.88 per cent of the
students are studying in urban and semi-urban colleges. Among the rural
college students 52.99 per cent of the students are coming from joint
family system.
It is observed that most (66.67 per cent) of the college students family
size is 5 to 6 members. Among the urban college students majority
(51.35 per cent) of them are having below 4 members in their family.
The most dominating size of the family is 5-6 members among the semi-
urban and rural college students which constitute 85.37 and 50.75 per
cent respectively.
It is found that majority (40.45 per cent) of the college students‟ family
income ranges from `20,001 to 30,000. The dominant family monthly
income group among the semi-urban and rural college students is
`10,000-20,000 which constitutes 47.28, 45.54 per cent respectively.
Among the urban college students the dominating family monthly
income group is ` 20,000 – 30,000.
It is identified that majority (36.28 per cent) of the college students
father‟s occupation is private employment. Among the urban college
students most (32.43 per cent) of the college students fathers are
government employees. Among the semi-urban college students most
(47.96 per cent) of the college students fathers are private sector
employees and 66.42 per cent of the college students fathers are farmers.

247
It is found that most (81.94 per cent) of the college students‟ mothers are
house wife. Irrespective of the category the college students‟ mothers
are house wives.
7.1.2 Findings relating to Entrepreneurial traits
The analysis of entrepreneurial traits among the college students reveals
that the urban college students are having more self confidence and
creativity since their mean scores are 3.8891, 3.8587 respectively.
Among the semi-urban and rural college students the highly viewed
entrepreneurial variables are hard work and creativity since their mean
scores are more in each category. Among the three groups of college
students significant difference exists regarding risk taking, hard work,
ability to take decision, self-confidence, capacity to solve problem,
leadership, creativity and ability to foresee future since their „F‟
statistics are significant at five per cent level.
The scores of the entrepreneurial traits among the college students
reveals that the urban college students are having more than 4.0 whereas
these scores are 3.1- 4.0 among the semi-urban and rural college
students.
The association between the profile variables of the college students and
the scores of the entrepreneurial traits shows that the profile variables
social group, monthly family income, father‟s occupation and mother‟s
occupation are significantly associating with the entrepreneurial traits of
the college students since their „F‟ statistics are significant at five per
cent level.

248
7.1.3 Findings relating to factors leading to Entrepreneurial Traits among the
students
It is identified that the important factors leading to entrepreneurial traits
among the college students are coordination, innovativeness, optimism,
informativeness, decision making, hard work, problem solving,
confidence, enterprising, personality, sincerity and forecasting ability.
Among the various factors the dominant factors which leads to
entrepreneurial traits are coordination, innovativeness and optimism
since their Eigen values are 7.8974, 4.9175 and 4.5609 respectively.
It is observed that the highly viewed factors leading to entrepreneurial
traits among the urban college students are enterprising and
innovativeness since their mean scores are 3.9692 and 3.9197
respectively.
Among the semi-urban college students, the highly viewed factors
leading to entrepreneurial traits are hard work and decision making since
their mean score are 3.8991 and 3.8684 respectively.
Among the rural college students the highly viewed factors leading to
entrepreneurial traits are hard work and coordination since their mean
sores are 3.9677 and 3.9197 respectively.
Among the urban, semi-urban and rural college students significant
difference has been noticed in the case of coordination, innovativeness,
optimism, hard work, problem solving, enterprising and forecasting
ability as their „F‟ statistics are significant at five per cent level.
249
Regarding the association between profile of college students and their
views relating to the factors leading to entrepreneurial traits, the
significantly associating profile variables with the „coordination‟ and
„innovativeness‟ factors are age, place of college, social group, size of
family, monthly family income, father‟s occupation and mother‟s
occupation since their respective „F‟ statistics are significant at five per
cent level.
The significantly associating profile variables with the college students
view about „optimism‟ and „informativeness‟ are social group, monthly
family income, father‟s occupation and mother‟s occupation since their
respective „F‟ statistics are significant at five per cent level.
Regarding the college students view about „decision making‟ factor, the
significantly association profile variables are branch of study, size of
family, monthly family income, father‟s occupation and mother‟s
occupation since their respective „F‟ statistics are significant at five per
cent level.
The significantly associating profile variables regarding the college
students view about „hard work‟ are age, branch of study, size of family,
monthly family income, father‟s occupation and mother‟s occupation
since their respective „F‟ statistics are significant at five per cent level.
Regarding the view about „problem solving factor‟, the significantly
associating profile variables are age, place of college, social group, size
of family, monthly family income, father‟s occupation and mother‟s

250
occupation since their respective „F‟ statistics are significant at five per
cent level.
The significantly associating profile variables with the entrepreneurial
traits factor „confidence‟ are place of college, social group, size of
family, monthly family income, father‟s occupation and mother‟s
occupation since their respective „F‟ statistics are significant at five per
cent level.
The significantly associating profile variables regarding the
entrepreneurial traits factor „enterprising‟ are age, social group, religion,
monthly family income, father‟s occupation and mother‟s occupation
since their respective „F‟ statistics are significant at five per cent level.
Regarding the significantly associating profile variables with the
entrepreneurial traits „punctuality‟ are age, religion, monthly family
income, father‟s occupation and mother‟s occupation since their
respective „F‟ statistics are significant at five per cent level.
The significantly associating profile variables with the entrepreneurial
traits factor „sincerity‟ are social group, religion, type of family, monthly
family income, father‟s occupation and mother‟s occupation since their
respective „F‟ statistics are significant at five per cent level.
Regarding the view about entrepreneurial traits „forecasting ability‟, the
significantly associating profile variables are age, place of college,
social group, religion, monthly family income, father‟s occupation and
mother‟s occupation since their respective „F‟ statistics are significant at
five per cent level.

251
7.1.4 Discriminant factors of Entrepreneurial Traits among the urban and semi-
urban College students
It is observed that the discriminant factor among the urban and semi-
urban college students regarding the entrepreneurial traits, significant
mean difference is noticed in the case of coordination, innovativeness,
optimism, informativeness, hard work, problem solving, enterprising
and forecasting ability since their respective „t‟ statistics are statically
significant at five per cent level.
Higher mean differences are noticed in the case of „hard work‟ and
„enterprising‟ since their mean differences are 0.5953, 0.5847
respectively. The higher discriminant power is noticed in the case of the
entrepreneurial traits factors „enterprising‟ and „innovativeness‟ among
the urban and semi-urban college students since their wilks lambda are
0.1045 and 0.1173 respectively. The higher discriminant coefficients are
noticed in the case of the entrepreneurial traits „informativeness‟ and
„enterprising‟. It shows the higher influence of the above said two
factors in the discriminant function. The analysis reveals that the
dominant discriminant factors among the urban and semi-urban s college
students are enterprising and infromativness, which are higher among
the urban college students than among the semi-urban college students.
252
7.1.5 Discriminant factors of Entrepreneurial Traits among the Urban and Rural
Students
Significant mean differences are noticed in the case of coordination,
innovativeness, optimism, informativeness, hard work, problem solving
skills, enterprising and forecasting ability since their respective „t‟
statistics are significant at five per cent level. The higher mean
differences are found in the case of „innovativeness‟ and „problem
solving‟ since their mean difference are 0.8736 and 0.8476 respectively.
The higher discriminant power is noticed in the case of „problem solving
skill‟ and „forecasting ability‟ since their Wilks lambda are 0.1082 and
0.1173 respectively.
As regards the relative contribution of discriminant factors in the total
discriminant scores, the analysis reveals that the important discriminant
factors among the urban and rural college students are „innovativeness‟
and „problem solving skills‟ which are higher among the urban students
than among the rural college students.
7.1.6 Discriminant factors of Entrepreneurial Traits among the Semi-urban and
Rural Students
Significant mean differences are noticed in the case of coordination,
innovativeness, optimism, decision making, problem solving and
forecasting ability since their respective „t‟ statistics are significant at
five per cent level. The higher mean differences are noticed in the case
of „forecasting ability‟ and „problem solving‟ since their mean
differences are 0.3562 and 0.3401 respectively.

253
The higher discriminant coefficients are noticed in the case of „problem
solving skills‟ and „decision making skills‟ since their respective
coefficient are 0.1788 and 0.1396 respectively. The analysis reveals that
the dominant discriminant factors among the semi-urban and rural
college students are „problem solving skills‟ and „decision making‟
which are higher among the semi-urban college students than among the
rural college students.
7.1.7 Impact of factors leading to Entrepreneurial Traits on the level of
Entrepreneurial Traits among the students
It is inferred that the significantly influencing factors leading to
entrepreneurial traits on the level of entrepreneurial traits among the
urban college students are their innovativeness, optimism,
infromativeness, hard work, problem solving skills, confidence,
enterprising and forecasting ability since their regression coefficient are
significant at five per cent level.
Among the semi-urban college students the significantly influencing
factors leading to entrepreneurial traits on the level of entrepreneurial
traits are optimism, hard work, enterprising and forecasting ability since
their respective regression coefficients are significant at five per cent
level.
Among the rural college students the significantly influencing factors
leading to entrepreneurial traits on the level of entrepreneurial traits are
coordination, optimism, hard work and enterprising since their
respective regression coefficients are significant at five per cent level.

254
The analysis of Pooled data reveals the importance of „optimism‟, „hard
work‟ and „enterprising‟ in the determination of their level of
entrepreneurial traits among the college students.
7.2 FINDINGS RELATING TO ACHIEVEMENT MOTIVATION
Eight factors were identified as the important components of
achievement motivation among the college students. They are academic
motivation, need for achievement, academic challenge, attitude towards
education, meaningfulness of task and work methods, attitude towards
teachers, general interests and sports and importance of marks. The
variables included under each component were tested using the
confirmatory factor analysis for its reliability and validity. The overall
reliability of the variables has been estimated with the help of cronbach
alpha.
It is observed that the highly viewed components of achievement
motivation by the urban college students are „academic challenge‟ and
„attitude towards education‟ since their mean score are 3.9204 and
3.8925 respectively.
As regards the semi-urban college students, the highly viewed
components of achievement motivation are „general interests and sports‟
and „attitude towards teachers‟ since their mean score are 3.6337 and
3.4901 respectively.

255
Among the rural college students the highly viewed components of
achievement motivation are „attitude towards teachers‟ and „general
interests and sports‟ since their mean score are 3.7087 and 3.6481
respectively.
Significant difference has been noticed among the three groups of
college students in respect of achievement motivation. They are
academic motivation, need for achievement, academic challenge,
attitude towards education, meaningfulness of task and work methods
and importance of marks since their „F‟ statistics are significant at five
per cent level.
The overall achievement motivation among the urban college students is
higher than the semi-urban and rural college students.
7.2.1 Association between profile of students and their views on components
leading to Achievement Motivation.
Regarding the academic motivation, the significantly associating profile
variables are age, size of the family, monthly family income, father‟s
occupation and mother‟s occupation since their respective „F‟ statistics
are significant at five per cent level.
The significantly associating profile variables with the „need for
achievement‟ are age, type of family, size of the family, monthly family
income, father‟s occupation and mother‟s occupation since their
respective „F‟ statistics are significant at five per cent level.

256
In the case of academic challenge, the associating profile variables are
age, religion, monthly family income, father‟s occupation and mother‟s
occupation since their respective „F‟ statistics are significant at five per
cent level.
Regarding the attitude towards education, the significantly associating
profile variables are age, monthly family income, father‟s occupation
and mother‟s occupation since their respective „F‟ statistics are
significant at five per cent level.
The significantly association profile variables regarding the
„meaningfulness task and work methods‟ are social group, religion, size
of family, monthly family income, father‟s occupation and mother‟s
occupation since their respective „F‟ statistics are significant at five per
cent level.
The significantly associating profile variables regarding the „attitude
towards teachers‟ are size of family, monthly family income, father‟s
occupation and mother‟s occupation since their respective „F‟ statistics
are significant at five per cent level.
Regarding the general interest and sports, the significantly associating
profile variables are place of college, size of family, monthly family
income, father‟s occupation and mother‟s occupation since their
respective „F‟ statistics are significant at five per cent level.

257
The significantly associating profile variables regarding the „importance
of marks‟, are place of college, branch of study, social group, size of
family, and mother‟s occupation since their respective „F‟ statistics are
significant at five per cent level.
Regarding the view of the overall achievement motivation, the
significantly associating profile variables are age, size of family and
mothers occupation.
7.2.2 Discriminant factors of Achievement motivation among the Urban and
Semi-urban students
It is observed that discriminant power of achievement motivation among
the urban and semi-urban college students significant mean difference
are noticed in the case of academic motivation, need for achievement,
academic challenge, meaningfulness of task and work methods and
importance of marks as their „t‟ statistics are significant at five per cent
level.
The higher discriminant coefficient is identified in the case of academic
motivation since its discriminant coefficient is 0.1739. The analysis
reveals that the important discriminant achievement motivation
component among the urban and semi-urban college students is
„academic motivation‟ which is higher among the urban students than
the semi-urban students.
258
7.2.3 Discriminant factors of Achievement Motivation among the urban and rural
students
It is identified that discriminant power of achievement motivation
among the urban and rural college students significant mean difference
are noticed in the case of academic motivation, need for achievement,
academic challenge, attitude towards education, meaningfulness of task
and work methods and importance of marks since their „t‟ statistics are
significant at five per cent level.
The higher discriminant coefficient is identified in the case of „academic
challenge‟ since its discriminant coefficient is 0.1779. The analysis
reveals that the important discriminant achievement motivation
component among the urban and rural students is „academic challenge‟
which is higher among the urban students than the rural students.
7.2.4 Discriminant factors of Achievement Motivation among the Semi-urban and
Rural students
It is found that discriminant power of component of achievement
motivation among the semi-urban and rural college students significant
mean difference is noticed in the case of academic motivation, need for
achievement, academic challenge, attitude towards education,
meaningfulness of task and work methods and importance of marks
since their „t‟ statistics are significant at five per cent level.
The higher discriminant coefficient is identified in the case of „academic
challenge‟ since its discriminant coefficient is 0.2042. The analysis
reveals that the important discriminant achievement motivation

259
component among the semi-urban and rural students is „academic
challenge‟ which is higher among the semi-urban college students than
the rural college students.
7.2.5 Impact of Achievement Motivation on the Entrepreneurial Traits among the
students
Among the urban college students it is observed that the significantly
influencing „achievement motivation‟ variables on the entrepreneurial
traits are general interest and sports, academic challenge, need for
achievement, attitude towards education and academic motivation since
their regression coefficients are significant at five per cent level.
The dominantly influencing achievement motivation variable on the
entrepreneurial traits among the urban college students is „general
interest‟.
Among the semi-urban college students the significantly influencing
achievement motivation‟ variables on „entrepreneurial traits‟ are attitude
towards education, academic challenge, need for achievement and
attitude towards teachers since their regression coefficients are
significant at five per cent level.
The dominantly influencing achievement motivation variable on the
entrepreneurial traits among the semi-urban college students is „attitude
towards education‟.
260
Among the rural college students the significantly influencing
achievement motivation variables on the entrepreneurial traits are
important of marks, academic challenge, attitude towards education
attitude towards teachers and need for achievement since their
regression coefficients are significant at five per cent level.
The dominantly influencing achievement motivation variable on the
entrepreneurial traits among the rural college students is „importance of
marks‟.
The analysis of pooled data reveals that the significantly influencing
achievement motivation variables on entrepreneurial traits among the
students are academic challenges, attitude towards education, need for
achievement and attitude towards teachers.
7.3 FINDINGS RELATING TO ENTREPRENEURIAL MOTIVATION
The important entrepreneurial motivation factors identified by the
Exploratory Factor Analysis among the students are confidence,
problem solving ability, opportunity seeking, independency, planning,
managerial skills and social interaction.
It is observed that the highly viewed entrepreneurial motivation factors
by the urban students are „opportunity seeking‟ and „problem solving
ability‟ since their mean score are 3.8783 and 3.8779 respectively.
Among the semi-urban college students the highly viewed
entrepreneurial motivation factors are „social interaction‟ and „planning
skills‟ since their mean scores are 3.9044 and 3.4839 respectively.

261
The highly viewed entrepreneurial motivation factors among the rural
college students are „social interaction‟ and „planning skills‟ since their
mean scores are 3.8745 and 3.3997 respectively.
Among the three groups of college students significant difference has
been noticed in the case of confidence, problem solving ability,
opportunity seeking, independency and managerial skills since their „F‟
statistics are significant at five per cent level.
The overall entrepreneurial motivation among the urban college students
is higher than the semi-urban and rural college students.
7.3.1 Association between profile of students and their views on components
leading to Entrepreneurial Motivation
The significantly associating profile variables with the entrepreneurial
motivation component „confidence‟ are social group, monthly family
income, father‟s occupation and mother‟s occupation since their
respective „F‟ statistics are significant at five per cent level.
The significantly associating profile variables with the entrepreneurial
motivation component „problem solving ability‟ are social group,
monthly family income and father‟s occupation since their respective „F‟
statistics are significant at five per cent level.
In the case of „opportunity seeking‟ component of entrepreneurial
motivation, the significantly associating profile variables are monthly
family income and father‟s occupation since their respective „F‟
statistics are significant at five per cent level.
262
The significantly associating profile variables regarding the component
„independency‟ of entrepreneurial motivation are social group, monthly
family income, father‟s occupation and mother‟s occupation since their
respective „F‟ statistics are significant at five per cent level.
In the case of „planning skills‟ component of entrepreneurial motivation,
the significantly associating profile variables are age, place of college,
monthly family income and mother‟s occupation since their respective
„F‟ statistics are significant at five per cent level.
The significantly associating profile variables regarding the „managerial
skills‟ component of entrepreneurial motivation are age, size of family,
monthly family income and mother‟s occupation since their respective
„F‟ statistics are significant at five per cent level.
Regarding the „social interaction‟ component of entrepreneurial
motivation, the significantly associating profile variables are social
group, religion, size of family, monthly family income, father‟s
occupation and mother‟s occupation since their respective „F‟ statistics
are significant at five per cent level.
7.3.2 Discriminant factors of Entrepreneurial Motivation among the Urban and
Semi-urban college students
It is observed that discriminant power of entrepreneurial motivation
among the urban and semi-urban college students significant mean
difference are noticed in the case of confidence, problem solving ability,
independency and managerial skills since their „t‟ statistics are
significant at five per cent level.
263
Among the urban and semi-urban college students higher discriminant
coefficient are noticed in the case of „confidence‟ and „problem solving
ability‟ components of entrepreneurial motivation. It is higher among
the urban college students than the semi-urban college students.
7.3.3 Discriminant factors of Entrepreneurial Motivation among the Urban and
Rural college students
As regards the discriminant power of entrepreneurial motivation among
the urban and rural college students significant mean differences are
noticed in the case of confidence, problem solving ability, opportunity
seeking, independency and managerial skills since their „t‟ statistics are
significant at five per cent level.
Among the urban and rural college students higher discriminant
coefficient are noticed in the case of „confidence‟ and „opportunity
seeking‟ components of entrepreneurial motivation. It is higher among
the urban college students than the rural college students.
7.3.4 Discriminant factors of Entrepreneurial Motivation among the Semi-urban
and Rural students
Regarding the discriminant power of entrepreneurial motivation among
the semi-urban and rural college students significant mean differences
are noticed in the case of confidence, opportunity seeking and
managerial skills since their „t‟ statistics are significant at five per cent
level.

264
Among the semi-urban and rural college students higher discriminant
coefficient are noticed in the case of „managerial skills‟ and „opportunity
seeking‟ components of entrepreneurial motivation. It is higher among
the semi-urban college students than the rural college students.
7.3.5 Impact of Entrepreneurial Traits on Entrepreneurial Motivation
The analysis reveals that the significantly influencing factors leading to
entrepreneurial traits on entrepreneurial motivation among the urban
college students are „innovativeness‟ and „coordination‟ since their
regression coefficient are 0.2102 and 0.1847 respectively at five per cent
significance level.
Among the semi-urban college students the significantly influencing
factors leading to entrepreneurial traits on entrepreneurial motivation are
„hard work‟ and „confidence‟ since their regression coefficients are
0.1447 and 0.1411 respectively at five per cent significance level.
As regards the rural college students the significantly influencing factors
leading to entrepreneurial traits on entrepreneurial motivation are „hard
work‟ and „decision making skills‟ since their regression coefficients are
0.2173 and 0.1991 respectively at five per cent significance level.
The analysis of pooled data reveals that the significantly influencing
factors leading to entrepreneurial traits on entrepreneurial motivation
among the college students are coordination, decision making skills,
hard work, confidence, enterprising and problem solving skills since
their regression coefficients are significant at five per cent level.
265
7.3.6 Impact of Achievement Motivation on Entrepreneurial Motivation
It is evident from the analysis that the significantly influencing
components leading to achievement motivation on entrepreneurial
motivation among the urban college students are „academic motivation‟
and attitude towards teachers since their regression coefficient are
0.1817 and 0.1519 respectively at five per cent significance level.
Among the semi-urban college students the significantly influencing
components leading to achievement motivation on entrepreneurial
motivation are „achievement motivation‟ and „academic motivation‟
since their regression coefficients are 0.1644 and 0.1249 respectively at
five per cent significance level.
As regards the rural college students the significantly influencing
components leading to achievement motivation on entrepreneurial
motivation are „academic challenge‟ and „academic motivation‟ since
their regression coefficients are 0.1473 and 0.1309 respectively at five
per cent significance level.
The analysis of pooled data reveals that the significantly influencing
components leading to achievement motivation on entrepreneurial
motivation among the college students are academic motivation, need
for achievement, academic challenge and attitude towards teachers since
their regression coefficients are significant at five per cent level.

266
7.4 SUGGESTIONS
7.4.1 Suggestions to the Students
The study reveals that the „self confidence‟ is comparatively less among
the semi-urban and rural college students. In order to improve the self
confidence the semi-urban and rural college students must try to take
part in the class room and college level activities. This will help the
students to gain confidence to face any situation.
The entrepreneurial traits like the ability to take decisions and to face
risk are less among the semi-urban and rural college students. These
competencies can be developed by involving themselves in organizing
seminars and conferences at the regional or state level programmes. The
initiatives taken by them will give lot of opportunities for developing the
decision making competencies and to face the risk boldly.
The urban college students though they are having higher level of self
confidence compared to the semi-urban and rural college students, they
are having lesser mean scores as regards „hard work‟, and so the urban
college students should realize the importance of hard work for
achieving greater things.
The discriminant analysis reveals that the discriminant coefficient as
regards the informativeness and enterprising factors which leads to
entrepreneurial traits is more among the urban college students than the
semi-urban college students. This high lights the need to improve the
thirst for seeking information and to take initiatives to do things
differently. Information seeking initiatives can be developed through

267
searching information through web sites, referring books and journals
etc.
Discriminant analysis reveals that the important discriminant factors
among urban and rural college students are „innovativeness‟ and
„problem solving‟ which are higher among the urban college students
than the rural students. The rural college students must develop their
creative and innovative thinking and learn the ways and means to solve
the problems effectively by taking part in the inter departmental or inter
college competitions.
The dominant discriminant factors among the semi-urban and rural
college students are „problem solving‟ and „decision making‟ which are
higher among the semi-urban college students than rural college
students. So rural college students need to improve the problem solving
and decision making skills.
As the scores on achievement motivation among the semi-urban and
rural college students are less compared to the urban college students,
the semi-urban and rural college students must realize the need to this
need and set some goals to achieve greater things in their life.
7.4.2 Suggestions to the Educational Institution
As the semi-urban and rural college students are lacking in the
innovative thinking and problem solving, the semi-urban and rural
colleges may induce the students to organize programmes and
competitions. While organizing programmes and participating in the

268
competitions the students can display their innovativeness and they can
sharpen their problem solving abilities.
The colleges must organize programmes to show the students the
different ways and means available to achieve greater things in their life.
For this purpose the college may invite people who have achieved
greater things. This will inspire the students to think big in their life.
The college can create „Innovation Centre‟ and motivate the students to
register their innovative or creative ideas. The students should be guided
and nurtured properly to develop a product or process using their
creative ideas. The college may honour the students during the college
day for their creative and innovative ideas by giving certificates or
prizes. This will motivate other students to come forward and do
something.
The college can motivate the students to write the information about the
achievers daily in the black board in front of each department under the
caption „Achiever of the Day‟. This will help the students to know about
the achievers and their achievements and in turn this practice will inspire
the students to become the achievers in future. Through this,
achievement motivation can be inculcated to the students.
In order to instill the entrepreneurial motivation among the college
students, the colleges may open a separate „Entrepreneurship
Development Cell‟ guided by a trained staff to motivate the students to
develop the entrepreneurial traits and to give information about the
entrepreneurial opportunities available in the locality.
269
The college students may be asked to conduct surveys about the
entrepreneurial opportunities and resource mapping. The collected
information can be documented in the „Entrepreneurship Development
Cell‟. This will encourage the students to identify the new business
ideas.
Students may be encouraged to visit the cottage and small scale
industries to during their college days. The industrial visit will expose
the students to know the various business opportunities in the locality.
7.4.3 Suggestions to the University
The university while modifying the syllabus can introduce a paper on
Entrepreneurship Development and Training with practical exposure in
the fourth and sixth semester for all the arts and science courses like
Environmental Science.
During the summer vacation of the second year the students must be
asked to undergo internship training in the business establishment
connected to their course.
Survey based practical assignment may be given to the students for the
entrepreneurship related papers.
The university may insist all the affiliated colleges to create a
„Entrepreneurship Development Centre‟ to motivate the students and for
initiating entrepreneurship related programmes at the college level.
During the sixth semester along with the paper they must be guided to
prepare the project report for a potential business opportunity.

270
The colleges may be asked to apply for the central government Rajeev
Gandhi Udayami Mithra programme and Business Incubator
programme. Through these programme the prospective young
entrepreneurs can be motivated further and be guided to start the
business establishment after the completion of the college studies.
The affiliated colleges must be instructed to organize programmes in
collaboration with the DIC, KVIC, SISI and Handicraft board.
7.4.4 Suggestions to the Government
The government must ask all the universities to monitor the activities of
the Entrepreneurship Development Cell created at the college level just
like the NSS programme.
The government should ask the institutions supporting the
entrepreneurship to organize orientation programmes in the colleges to
create awareness about the need for choosing entrepreneurship as their
career.
The government should give necessary assistance for the colleges to
create the Entrepreneurship Development Cell.
The government can initiate special assistance programmes to nurture
the students who are having creative and innovative ideas to transform
their ideas in to a product or a process.
Government may initiate special scholarship programme for motivating
the students to nurture their creative and innovative ideas.
271
7.5 CONCLUSION
As there are emerging needs in the field of education, there is a need for an
appropriate curriculum to satisfy the demands of the students. Today most of the
students pursue higher education in order to acquire jobs. If education can be offered
with entrepreneurship orientation it would wipe out the rush for jobs, as students would
take up self-employment careers. Such an option would help the family and the society
indirectly. The researcher was able to identify the entrepreneurial traits of the college
students and their achievement motivation. Further the study analysed the impact of
entrepreneurial traits and achievement motivation on the entrepreneurial motivation.
The findings and the suggestions highlights the steps to be taken to create the
awareness about the need for promoting entrepreneurship as the career. The researcher
will be amply rewarded if the planners or the policy makers consider some of the
suggestions given based on the findings of the study. The role of the government,
universities, educational institutions and the students becomes a paramount importance
for the development of entrepreneurial inclination among the students. Any step in this
direction will pave the way to scale new height and lead the country towards prosperity.
272
SCOPE FOR FUTURE STUDIES
1. A study on the entrepreneurial characteristics among University students
with special reference to Tamil Nadu.
2. A study on the entrepreneurial inclination among the vocational
education students in Higher Secondary in Tamil Nadu.
3. A study on the role of colleges in promoting entrepreneurship in Tamil
Nadu.
4. A study on the determinants of entrepreneurial intensions among the
college students in Tamil Nadu.

Bibliography
BIBLIOGRAPHY
I. BOOKS
1. Baldev Singh, Self-Employment through Entrepreneurship Development, MD
Publications Pvt. Ltd., New Delhi, 1996.
2. Batra C.S and Dangwala R.C, Entrepreneurial and Small Scale Industries
New Potentials, Deep & Deep Publications Pvt. Ltd., New Delhi, 1999.
3. Bhattacharya S.N, Entrepreneurship Development in India and South East
Asian Countries, Metropolitan Book Co. (P) Ltd., New Delhi, 1983, p.113.
4. Brockhaus R.A, “The Psychology of Entrepreneurs” in C.A. Kent, D.L. Sexton
and K.H. Vesper (Eds). Encyclopedia of Entrepreneurship, New Jersey:
Prentice Hall Inc., 1982, pp.39-57.
5. Das T.K and Bing-Sheng Teng, “Time and Entrepreneurial Risk Behavior”,
Winter, 1042- 2587, 1977, pp. 69-88.
6. Dhar P.N and Lydall H.F, The Role of Small Enterprises in Indian Economic
Development, Asia Publishing House, Bombay, 1961, pp.10-32.
7. Donald L. Sexton and Nancy B. Bowman, “Comparative Entrepreneurship
Characteristics of Students: Preliminary Results”, Frontiers of
Entrepreneurship Research, Proceedings of the Babson College Conference on
Entrepreneurship, Babson College, Wellesley, Massachusetts, 1983,
pp.213-225.
8. Donald L. Sexton and Nancy B. Bowman, “Personality Inventory for Potential
Entrepreneurs: Evaluation of a modified UPI/PRE-E test instrument”,
Frontiers of Entrepreneurship Research, Proceedings of the Babson College
Conference on Entrepreneurship, Entrepreneurial Studies, Babson College,
Wellesley, Massachusetts, 1984, pp.513-528.
9. Donh of Clarence, Observations on Entrepreneurship in Agriculture, In
Arthur Cole (Ed.) Change and the Entrepreneur, Harvard University Press,
1949, pp.22-24.
10. Gangadhara Rao M, Entrepreneurship and Entrepreneurial Development,
Kanishka Publishing House, New Delhi, 1992.
11. Gautam Raj Jain and Debmuni Gupta (ed.) New Initiatives in
Entrepreneurship Education and Training, Fredrich – Naumann – Stifung,
New Delhi, 1994.
12. Hazlehurst L.W, Entrepreneurship and the Merchant Castes in Punjab City,
Monograph and Occasional Paper Series, no.1, Duke University Press, Durham,
1966.
13. Hornaday J.A and Bunker C.S, “The Nature of the Entrepreneur”, Personnel
Psychology, 23, 1970, pp. 47-54.
14. Hyrsky, Kimmo and Tuunanen, Mika, “Innovativeness and Risk-Taking
Propensity: A Cross-Cultural Study of Finnish and the U.S. Entrepreneurs
and Small Business Owners”, Leiketaloudelliness Aikkauskirja, 48(3), 1999,
pp.238-56.

15. James Berna J, Industrial Entrepreneurship in Madras State, Bombay Asia
Publishing House, 1966.
16. John A. Welsh and Jerry F White, “Converging on the Characteristics of
Entrepreneurs”, Frontier of Entrepreneurship Research, Proceedings of the
Babson College Conference, Babson College, Wellesley, Massachusetts, 1981,
pp. 504-515.
17. Khanka S.S, “Entrepreneurship in Small Scale Industries”, Educational
Publishers, New Delhi, 1990.
18. Lindsey, William H, “An exploratory study of entrepreneurial personality
traits evident among advanced nurse practice students in Texas using the
Myerrs-Briggs Type Indicator (RTM)”, MAI, 37/06, December 1999, p.1653.
19. Martin Patrick, Self Employment and Successful Entrepreneurship, Kaniska
Publishers and Distributors, New Delhi, 1999.
20. Medha Dubhasi Vinze, “Women Entrepreneurs in India”, Mittal Publications,
New Delhi, 1987.
21. Nalinaksha Mutsuddi, “You Too Can Become an Entrepreneur”, Wheeler
Publishing, New Delhi, 1996, p.183.
22. Papanek F and Gustav, Pakistan’s Development: Social Goals and Private
Incentives, Harvard University Press, Cambridge, Mass, 1967 Peter Killby,
“Enterpreneurship and Economic Development” The Free Press, New York,
1971, p.36.
23. Patel V.G, Organisation Development for Entrepreneurship Programmes,
Entrepreneurship Development Institute of India, Ahmedabad, 1985, pp.56.
24. Pillai J, “Women Empowerment”, Gyan Publishing House, New Delhi, 1995,
pp.3-6.
25. Rao, Entrepreneurship: Reflections and Investigations, Chug Publications,
Allahabad, 1986, p.16.
26. Ravichandra K, “Entrepreneurial Success – A Psychological Study”, Sterling
Publishers Private Limited, 1991, p.120.
27. Robert F. Scherer, James D. Brodzinski and Frank A. Wiebe, “Examining the
Relationship Between Personality Entrepreneurial Career Preference”,
Entrepreneurship and Regional Development, 3, 1991, pp.195-206.
28. Sharma D.D, Dhameja S.K and Gujar B.R, Entrepreneurship, Strategic
Management and Globalisation, Rawat Publications, Jaipur and New Delhi,
1999.
29. Sharma K.P, Rise of Entrepreneurship in Haryana, A Case Study of Rannog
Enterprises, 2002.
30. Suresh K and Dhameja K, Entrepreneurship and Small Business, Rawat
Publications, Jaipur and New Delhi, 1998.
31. Wilkin P.H, Entrepreneurship: A Comparative and Historical Study,
Norwood, Ablex Publishing Corporation, New Jersey, 1979, p.264.
II. JOURNALS
1. Adedeji J. Ogunleye, “Self Esteem and Achievement Motivation: Behavioral
Traits for Entrepreneurship, Business and Economic Growth and Development”
Research Journal in Organizational Psychology & Educational Studies 2012
1(3) 145-148.
2. Akhouri M.M.P and Mishra S.P, “Entrepreneurship Education: A Conceptual
Base, Approach and Methodology”, Indian Management, 29 (11-12)
November – December 1990, pp.53-65.
3. Amran Awang, Shaiful Annuar Khalid and Mohammad Ismail, “Personality and
Contextual factors as Determinants of Entrepreneurial Intention among
Malaysian Students” 2008.
4. Anca Draghici, Claudiu Tiberiu Albulescu and Matei Tamasila,
“Entrepreneurial Attitude as Knowledge Asset: Its Impact on the
Entrepreneurial Activity in Europe”, Procedia - Social and Behavioral
Sciences, Volume 109, 8 January 2014, Pages 205–209.
5. Anisa Kume, Vasilika Kume and Besa Shahini (2013) “Entrepreneurial
Characteristics Amongst University Students in Albania” European Scientific
Journal J vol.9, No.16.
6. Asanee Tongslip, “A Path Analysis of Relationships between Factors with
Achievement Motivation of Students of Private Universities in Bangkok,
Thailand”, Procedio- Social and Behavioral Sciences, Volume 88, 10 October
2013, Pages 229–238.

7. Astri Ghina, “Effectiveness of Entrepreneurship Education in Higher Education
Institutions” , Procedia - Social and Behavioral Sciences, Volume 115, 21
February 2014, Pages 332–345.
8. Bhagmar M and Verma B.L, “Spirit of Entrepreneurship: The Only Way to
Success”, Southern Economist, Vol.44, No.18, January 15, 2006, pp.18-21
9. Bhatia B.S, “New Industrial Entrepreneurs; Their origins and problems”,
Journal of General Management, Vol.2, No.1. Autumn, 1974.
10. Botsaris C and Vamvaka V., “Models of the determinants of Entrepreneurial
Behaviour: A literature Review” Regional Science Inquiry Journal, Vol. IV,
(3), 2012, Special Issue, pp.155 – 172.
11. Brimmer A.F, “The setting of Entrepreneurship in India”, Quarterly Journal of
Economics, Vol. LXIY, No.4, November 1995.
12. Brockhaus R.H, “Risk-taking Propensity of Entrepreneurs”, Academy of
Management Journal, 3, September 1980, pp.509-520.
13. Cameron Alan, Claire Massey and Daniel Tweet, “Entrepreneurs - A Vital
Force?” Charatered Accountants Journal of New Zealand, Vol.79, no.10,
2000 pp. 10-13.
14. Chakravarthy T.K, “Entrepreneurship Development: Present Status and
Emerging Priorities”, SEDME 14(4) December 1987.
15. Chao Ching Chen, Yu Fen Chen and Ming Chuan Lai (2011) “A study on
entrepreneurial attitude and the influential factors for business department
students at technology colleges and universities in Taiwan”.
16. Chawala A.S and Albert Butare, “Developing Entrepreneurial Competencies
Amongst Rwandan Youth”, Indian Marketing Studies Journal, Vol.9, No. 1
April 2005, pp.25-36.
17. Clifford Baumback M and Joseph Mancuso R, Entrepreneurship and Venture
Management, DB. Taraporevala Sons & Co. Pvt. Ltd., Published by
Arrangement with Prentice- Hall, INC, 1981.
18. Cynthia Mathieu and Étienne St-Jean, “Entrepreneurial personality: The role of
narcissism” Personality and Individual Differences, Volume 55, Issue 5,
September 2013, Pages 527–531.
19. David F. Llewellyn and Kerry M. Wilson, “The Controversial Role of
Personality Traits in Entrepreneurial Psychology”, Emerald, Vol.45, No.6,
2003, pp.241-345.
20. Farshid Ghasemi, Ahmad Rastegar Reza Ghorban Jahromi and Roghayeh
Roozegar Marvdashti, The relationship between creativity and achievement
motivation with high school students’ entrepreneurship Procedia - Social and
Behavioral Sciences Volume 30, 2011, Pages 1291–1296.
21. Foluso Ilesanmi Jayeoba, Olayinka Yusuf Sholesi and Olufemi Akanji Lawal.,
“Achievement Motivation, Gender and Entrepreneurial Ability” International
Journal of Academic Research in Accounting, Finance and Management
Sciences Vol. 3, No.1, January 2013, pp. 248–256.
22. Fumero A, De Miguel A, Marrero R.J and Carballeira M, “Entrepreneurial
potential in adolescents” Personality and Individual Differences, Volume 60,
Supplement, April 2014, Pages S57.
23. Garudachar B.N, “Enrichment of Entrepreneurship Culture through University-
Industry Interaction”, Progressive Educational Herald, 9 (1) October 1994,
pp 18-19.
24. Gopal Krishna Dhar Sanapati, “Developing Entrepreneurship in Engineering
Institutions”, University News, 35(20) 19 May 1997, pp.7-8.
25. Guha A, “Persia Seths as Entrepreneurs”, 1750-1850, Economic and Political
Weekly, Vol. V, No.35, August 29, 1970, pp. M107-M115.
26. Habibah Elias and Atan Bin Long, “A Correlational Study of Achievement
Motivation and Pupils' Performance in the Standard Five Assessment
Examination From Selected Schools in Selangor” Pertanika 7(2), pp. 31 -38
(1984).
27. Habibah Elias and Wan Rafae Abdul Rahman, “Achievement Motivation of
University Students” Pertanika J. Soc. Sci. & Hum. 3(1): 1-10 (1995).
28. Hannu Littunen, “Entrepreneurship and the Characteristics of the
Entrepreneurial Personality”, International Journal of Entrepreneurial
Behaviour and Research, Vol.6, No.6, 2000, pp.295-309.
29. Hian Chye Koh, “Testing hypothesis of entrepreneurial characteristics a study
of Hong Kong MBA students”, Journal of Managerial Psychology, Vol. 10,
No.3, 1996, pp.12-25.
30. Hua Zhang and Ying Zhang, “Psychological Characteristics of Entrepreneurship
of College Students in China” Psychology Journal 2013. Vol.4, No.3, 159-164.

31. Ignas G. Sidik, “Conceptual Framework of Factors Affecting SME
Development: Mediating Factors on the Relationship of Entrepreneur Traits and
SME Performance”, Procedia Economics and Finance, Volume 4, 2012, Pages
373–383.
32. John D. Van Slooten, Robert Layne Hild and H. Keith Hunt, ”, Frontiers of
Entrepreneurship Research, Proceedings of the Babson College Conference on
Entrepreneurship, Entrepreneurial Studies, Babson College, Wellesley,
Massachusetts, 1986, pp.52-63.
33. Kare Moberg, “Two approaches to entrepreneurship education: The different
effects of education for and through entrepreneurship at the lower secondary
level” The International Journal of Management Education, 11 June 2014.
34. Kets De Vries M.F.R, “The Entrepreneurial Personality: A Person at the
Crossroads”, The Journal of Management Study, February 2001, pp.34-56.
35. Khanka S.S, “Making the Entrepreneurial Society”, Yojana, Vol.42, No.2,
February, 1998, pp.9-11.
36. Kulwinder Singh “Study of Achievement Motivation in Relation to Academic
Achievement of Students” International Journal of Educational Planning &
Administration Volume 1, Number 2, 2011, pp. 161-171.
37. Levent Altinay, Melih Madanoglu, Roberto Daniele and Conrad Lashley, “The
influence of family tradition and psychological traits on entrepreneurial
intention” International Journal of Hospitality Management Volume 31, Issue
2, June 2012, Pages 489–499.
38. Lorna Collins Paul D. Hannon and Alison Smith, “Enacting Entrepreneurial
Intent: the gaps between student needs and higher education capability”,
Emerald, Vol.46, No.819, 2004, pp.454-463.
39. Louw L, Van Eden S.M and Bosch J.K, “Entrepreneurial Traits of
Undergraduate Students at Selected South African Tertiary Institutions”
International Journal of Entrepreneurial Behaviour and Research, Vol.9,
No.1, 2003, pp.5-26.
40. Marcela Rodica Luca, Ana-Maria Cazan and Denisa Tomulescu,
“Entrepreneurial Personality in Higher Education” Procedia - Social and
Behavioral Sciences, Volume 84, 9 July 2013, Pages 1045–1049.
41. Maryam Sharifzadeh, Entrepreneurship and Agricultural College Students;
A Case of Shiraz University, AIAEE 2005, Proceedings of the 21st Annual
Conference.
42. Mathivanan R and Kumar D, “Strength and Weakness of Rural
Entrepreneruship”, Kissan World, Vol.22, No.11, November, 2006, pp.24-29.
43. McClelland, “Characteristics of Successful Entrepreneurs”, The Journal of the
Creative Behavior, Vol.21, No.3, 1986. pp. 219-233.
44. Md Reaz Uddin, Tarun Kanti Bose, “Determinants of Entrepreneurial Intention
of Business Students in Bangladesh” International Journal of Business and
Management; Vol. 7, No. 24; 2012.
45. Merle Küttim, Marianne Kallaste, Urve Venesaar and Aino Kiis,
“Entrepreneurship Education at University Level and Students’ Entrepreneurial
Intentions”, Procedia - Social and Behavioral Sciences, Volume 110, 24
January 2014, Pages 658–668.
46. Ming Te Wang and Jacquelynne S. Eccles “School context, achievement
motivation, and academic engagement: A longitudinal study of school
engagement using a multidimensional perspective”, Learning and Instruction,
Volume 28, December 2013, Pages 12–23.
47. Mishra D.N, Entrepreneur and Entrepreneurship Development and Planning in
India, Chug Publications, Allahabad, 1990, 00.224-226.
48. Muhammad Zaman, “Entrepreneurial characteristics among university students:
Implications for entrepreneurship education and training in Pakistan” African
Journal of Business Management Vol.7(39) , pp. 4053-4058 , October 2013.
49. Mumtaz Begam Abdul Kadir, Munirah Salim and Halimahton Kamarudin, “The
Relationship Between Educational Support and Entrepreneurial Intentions in
Malaysian Higher Learning Institution” Procedia - Social and Behavioral
Sciences, Volume 69, 24 December 2012, Pages 2164–2173.
50. Mumtaz Begam Bt Abdul Kadir and Pn Munirah Bt Salim, (2012) “Factors
Affecting Entrepreneurial Intentions among Mara Professional college students”
Academy of Management Journal. 23(3), 509-520.
51. Nafziger E.W, “Class, Caste and Community of South Indian Industrialists. An
Examination of the Horatio Alger Model”, Journal of Development Studies,
Vol.II, No.2, January 1975, pp.131-148.

52. Nair K.R.G and Anu Pandey, “Characteristics of Entrepreneurs: An Empirical
Analysis”, The Journal of Entrepreneurship, 15 (1), 2006, pp. 46-61.
53. Paul A. Story, Jason W. Hart, Mark F. Stasson, John M. Mahoney “Using a
two-factor theory of achievement motivation to examine performance-based
outcomes and self-regulatory processes”, Personality and Individual
Differences, Volume 46, Issue 4, March 2009, Pages 391–395.
54. Rao B.S.S, “Entrepreneurship Development Among Technical Personnel: A
Few Observations”, SEDME, Vol. X, No.3, September 1983, pp.33-36.
55. Robert Baum J and Edwin A. Locke, “The Relationship of Entrepreneurial
Traits, Skill, and Motivation to Subsequent Venture Growth”, Journal of
Applied Psychology, Vol.89, No.4, 2004, pp.587-598.
56. Satya Sundaram I, “Women Empowerment and Globalisation”, Southern
Economist, Vol.44, No.13, November 1, 2005, pp.19-23.
57. Sergio Postigo, Donato Lacobucci and Maria Fernanda Tamborini,
“Undergraduate Students as a Source of Potential Entrepreneurs :
A Comparative Study between Italy and Argentina”, paper presented at the 13th
Global Inter- Internationalizing Conference, Grenoble, France, September 8-10,
2003.
58. Sharma D.D, Singla S.K and Prof. Saini J.S, “Application of Demographic
Profile and Entrepreneurial Traits in identification of Potential Entrepreneurs”
paper presented in National Seminar on Current Research in Indian
Entrepreneurship, Entrepreneurship Development Institute of India,
Ahmedabad, 1994, pp. 1-13.
59. Sharma K.L,” A Multivariate Model for the Analysis of Entrepreneurship in
Manufacturing Organisation”, Sociological Bulletin, Vol.27, No.1, March
1978, pp.48-65.
60. Stephen L. Muller, “Gender Gaps in Potential for Entrepreneurship Across
Countries and Cultures”, Journal of Developmental Entrepreneurship, Vol. 9,
No.3, December 2004, pp.199-220.
61. Subbi Reddi and Shoba Reddi, “Sucessful Entrepreneurship”, A Study of
Productivity, 1985, Vol. XXVI, No.1.
62. Tanja Bipp Karen Van Dam “Extending hierarchical achievement motivation
models: The role of motivational needs for achievement goals and academic
performance”, Personality and Individual Differences Volume 64, July 2014,
Pages 157–162.
63. Thangamuthu C and Iyyampillai, “A Social Profile Entrepreneurship”, The
Indian Economic Journal, October, Vol.31, No.3, December 1983, p.107.
64. Thomas Lans, Vincent Blok and Renate Wesselink, “Learning apart and
together: towards an integrated competence framework for sustainable
entrepreneurship in higher education”, Journal of Cleaner Production, Volume
62, 1 January 2014, Pages 37–47.
65. Tushar Chaudhari, “A Study of Entrepreneurial Attitude among Post Graduate
Students” Research Journal of Commerce and Behavioral science, Volume:
02, Number: 06, April-2013.
66. Vani and Vinayak, “Entrepreneurship Development (among) Tribals” Yojana,
Vol.14, No.16, 1st April, 1980, pp.8-9.
67. Yonca Gürol and Nuray Atsan, (2006) "Entrepreneurial characteristics amongst
university students: Some insights for entrepreneurship education and training
in Turkey", Education + Training, Vol. 48 Iss : 1, pp.25 – 38.
68. Yonca Gurol and Nuray Atsan, “Entrepreneurial Characteristics amongst
University Students- Some Insights for Entrepreneurship Education and
Training in Turkey”, Emerald, Vol.48, No.4, 2006, pp.25-38.
III. Ph.D THESIS
1. Ganeshan R, “Growth of Entrepreneurship in Small Scale Industries – A
Study with Reference to Pudukottai District, Tamil Nadu”, Unpublished
Ph.D., Thesis submitted to Alagappa university, Karaikudi, 1992.
2. Kameshwar Jha S, Growth of Entrepreneurship in Underdeveloped Region
with Special Reference to Bihar State, Ph.D. Thesis 1970.
3. Mekala N.M, “A study on entrepreneurial Behaviour among the members of
self help groups in Madurai district” Madurai Kamaraj University, Dec, 2007.
4. Muralitharan J, “Entrepreneurial Traits of college students of Thoothukudi
district: An exploratory study” Manonmaniam Sundaranar University, Nov.
2007.
5. Nirmala Mary, “Assessment of Entrepreneurial Skills among Women College
Students in Madurai City”, Unpublished PhD Thesis submitted to Madurai
Kamaraj University, Madurai, 2001.
6. Saleem Khan K, “A study on Entrepreneurial Traits of college students in
Theni district, Tamil Nadu” Madurai Kamaraj University, Dec, 2007.

7. Shanmugakani C, “Growth of Educational Facilities and Development of
Entrepreneurial Abilities in Sivakasi”, Unpublished Ph.D thesis submitted to
Madurai Kamaraj University, Madurai, 1996.
8. Sujatha A, “A study of the Entrepreneurial Traits among women industrialists
in small scale industries of Theni district” Madurai Kamaraj University, Dec,
2007.
IV. WEBSITES
1. http:/mgu.mim.epu.my.com
2. www.usfca.edu/sobam/nvc/conf/proceedings.html
3. www.upe.ac.za.
4. www.vit.ac.in/ecell/PDF/a3.pdf
5. http://dspace.iimk.ac.in/bistream/2259/199.
6. http://www.defi.gour.qc.ca/Publications/depliant_defi_en.pdf. p 79.
7. http://ideas.repec.org/p/ttu/wpaper/154.html p. 102
8. http://ilkogretim-online.org.tr
9. www.ilo.org, p.75
10. http://www.immcal.ac.in/programmes/fpm/Thesis Abstract/madhusree2004.pdf
11. http://www.usfca.edu/sobam/nvc/conf/procedings.html
12. http://EntrepreneurialRoadmapweb.pdf. P.13
13. http://www.hi-is/~joner/eaps/deaing2.htm p.86
14. http://www.investingintamilnadu.com/tamilnadu/infrastructure/tuticorin_port_p
rofile.php
15. http://www.editn.in/govtof_india.aspx
16. http://www.editn.in/compendium.aspx

Appendix - I

APPENDIX - I
A STUDY ON ENTREPRENEURIAL TRAITS AND ACHIEVEMENT MOTIVATION
AMONG COLLEGE STUDENTS IN THOOTHUKUDI DISTRICT
INTERVIEW SCHEDULE
1. Name of the student :
2. Gender
a) Male b) Female
3. Name of the college :
4. Area where the college situated
a) Urban b) Semi urban c) Rural
5. Age
a) Below 18 b) 19 to 21 c) 22 and above
6. Branch of study
a) Arts b) Science
7. Social group
a) FC b) BC c) MBC
d) SC/ST
8. Religion
a) Hindu b) Muslim c) Christian
d) Other
9. Type of family
a) Joint b) Nuclear
10. Place of residence
a) Urban b) Semi urban c) Rural
11. Size of the family
a) Below 4 b) 5 to 6 c) Above 6
12. Monthly family income
a) Less than 10,000 b) 10,000-20,000 c) 21,000-30,000
d) 31,000-40,000 e) 41,000-50,000 f) Above 50,000
13. Fathers’ occupation
a) Government employee b) Private employed c) Business
d) Farmer e) Professional f) Other

14. Mothers’ occupation
a) Government employee b) Private employed c) Business
d) Farmer e) Professional f) Other
15. ENTREPRENEURIAL TRAITS
Please ‘’ in the appropriate box according to your practices.
A-Always F-Frequently S-Sometime R-Rarely N-Never
FACTORS LEADING ENTREPRENEURIAL TRAITS
S.No Particulars A F S R N
1. Creative in writing assignments
2. I like teachers who are more creative in their
approach
3. Loving newness
4. Finding new ways of answering questions
5. Willing to do new things and to accept new ideas
6. Interested in writing assignments on innovative
topics
7. My new ideas mostly got the approval of my
friends
8. Interested in taking quick decisions
9. While shopping choice of dress is mine
10. Taking decisions even when outcome is not sure
11. Not depending on others to decide
12. Friends approaching me for solving their problems
S.No Particulars A F S R N
1. Risk Taking
2. Hard Work
3. Ability to take decision
4. Self Confidence
5. Capacity to Solve Problem
6. Leadership
7. Creativity
8. Ability to Foresee future

S.No Particulars A F S R N
13. Taking decisions firmly
14. Taking decision after analyzing the pros and cons
15. Mentally and physically fit to do hard work
16. Submission of assignments and home work in time
17. Use to attend the examination with full preparation
18. I spend more time to score good marks
19. Willing to study long hours
20. Won’t put off things
21. Spend holidays usefully
22. Registering success always
23. Doing regular and continuous preparation for
exams
24. Capable of deciding on my higher studies
25. Have alternative plans for future studies
26. Preparation for the future carrier planning
27. Planning things in advance
28. Failures never deter me from trying further
29. Withstand Physical and mental stress
30. Don’t keep problems pending
31. Flexibility in solving problem
32. Realising and overcoming the problems
33. Facing problem boldly
34. Courageous to meet the unknown
35. Moving friendly with others
36. Getting help from others
37. Accepting other with open minded
38. Helping others
39. Interested in working with others
40. Holding a positive attitude when things go wrong
41. Facing the exams without fear
42. Bold enough to visit unknown places independently
S.No Particulars A F S R N
43. When I take a job, I am always confident that I can
carry it out
44. Always going in for excellence
45. Prepared to travel long distance without advance
booking of tickets
46. Taking more effort to complete a task
47. Like to scale new heights
48. Never look back
49. Accepting the task without hesitation
50. Guiding other in their work
51. Talk openly and give straight answers
52. Maintaining physical and emotional balance
53. After a failure, I am able to pick myself up and
proceed further
54. Taking right decision at the right time
55. Taking initiation for doing things
56. Accommodating others to carryout task
57. Capable of encouraging others
58. Appreciating others
59. Inspiring others
60. Giving positive feedback
61. Taking new initiatives
62. Taking efforts to encourage others
63. Love classes giving scope for thinking differently
64. Always consult teachers on subjects to learn more
65. Attending different courses besides regular course
66. Excelling in the academic activities
67. Winning prizes in the competitions
68. Not hesitating to clarify doubts
69. Reading dailies regularly
70. Having the habit of extra-reading

16. ACHIEVEMENT MOTIVATION
ACADEMIC MOTIVATION
S.No Particulars A F S R N
1. I feel unhappy if I miss the class.
2. I pay attention to the work in the class.
3. I mind much if I reach late in the class
4. I love to read more and more to enrich the
knowledge
5. I spend more time in the library
NEED FOR ACHIEVEMENT
S.No Particulars A F S R N
1. I set standards for myself and then strive to
achieve them
2. I wish to specialize and become top most in
the field of my likings.
3. I like to experiment and create new things
and surprise people
4. I work hard for hours together to be
successful in whatever I undertake
ACADEMIC CHALLENGE
ATTITUDE TOWARDS EDUCATION
S.No Particulars A F S R N
1. I like my studies.
2. I like to attend the class regularly.
3. I prefer to enrich my knowledge.
4. Education plays a vital role in my life.
5. Education gives a status in the society.
S.No Particulars A F S R N
1. I have a tendency to find solution to
problems which others unable to succeed.
2. I aspire to get excellent results in all
academic competitions
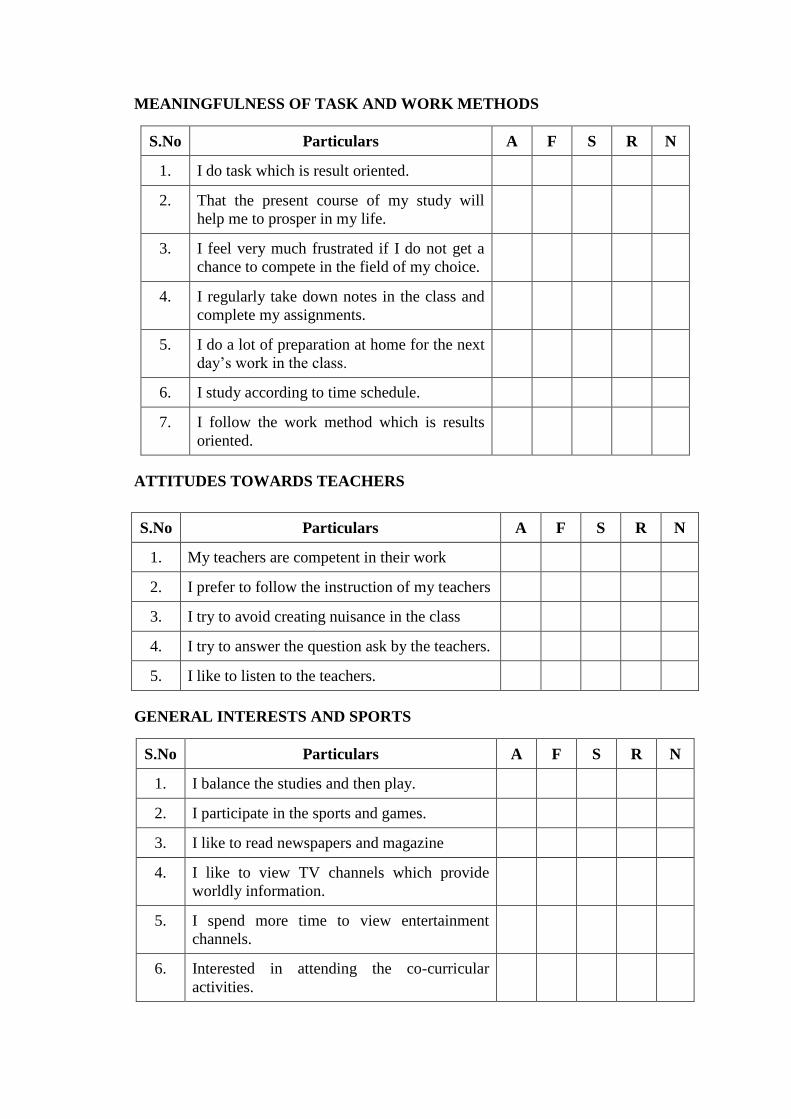
MEANINGFULNESS OF TASK AND WORK METHODS
S.No Particulars A F S R N
1. I do task which is result oriented.
2. That the present course of my study will
help me to prosper in my life.
3. I feel very much frustrated if I do not get a
chance to compete in the field of my choice.
4. I regularly take down notes in the class and
complete my assignments.
5. I do a lot of preparation at home for the next
day’s work in the class.
6. I study according to time schedule.
7. I follow the work method which is results
oriented.
ATTITUDES TOWARDS TEACHERS
S.No Particulars A F S R N
1. My teachers are competent in their work
2. I prefer to follow the instruction of my teachers
3. I try to avoid creating nuisance in the class
4. I try to answer the question ask by the teachers.
5. I like to listen to the teachers.
GENERAL INTERESTS AND SPORTS
S.No Particulars A F S R N
1. I balance the studies and then play.
2. I participate in the sports and games.
3. I like to read newspapers and magazine
4. I like to view TV channels which provide
worldly information.
5. I spend more time to view entertainment
channels.
6. Interested in attending the co-curricular
activities.

IMPORTANCE OF MARKS
S.No Particulars A F S R N
1. I prefer for the examination instead of
attending entertainments.
2. Mark determines the future carrier options
3. Mark gives a status in the academic circle.
17. ENTREPRENEURIAL MOTIVATION
S.No Particulars A F S R N
1. I always try to find a new solution to
overcome problems.
2. I apply alternative approaches to solve the
problems.
3. I think of many new ideas
4. I look for new opportunities like a watch-dog
5. I try to find ways to do things for less cost.
6. I take decisions even if I am not sure of
outcome.
7. I welcome challenges and opportunities.
8. I take the advantages of opportunities as and
when that arise.
9. I stick with my decision seven if others
disagree with me.
10. I have strong desire for social interaction
11. I remain stick to my approach even while
doing something right for the first time.
12. I have my plan for ten years.
13. I devote the most of my time to my work.
14. I work for long hours to complete my work.
15. I start my work with full confidence that I will
succeed
16. I persuade people to do what I want.
17. I take problems as challenges

S.No Particulars A F S R N
18. Continuous problem facing makes me weaker
indecision-making
19. I try to get the maximum return from my
limited resources.
20. I keep my income into consideration.
21. While dealing with a problem, I tend to get
struck.
22. I thrive on facing challenges.
23. I do not depend on other for directions
24. When I am confused, I seek others advice.
25. I prefer to do tasks that I know-well
26. I do not let my work interfered by others.
27. I think over how to improve my working
28. I do my work systematically and logically.
29. I derive satisfaction after facing a challenges
30. I begin my day with a list of things to be
done.
31. I like to work with others
32. I am always in search of people who can help
me in my work.
33. I do my level best to satisfy others through
my work.
34. I am not good at tackling with several
problems at a time
35. I find myself quite resourceful to tide over
tight situations.
36. I prepare a plan before actually working on a
project.
37. I try to solve problems by newer ways and
means.
38. I do not feel completely comfortable with
myself at all times.
Appendix - II
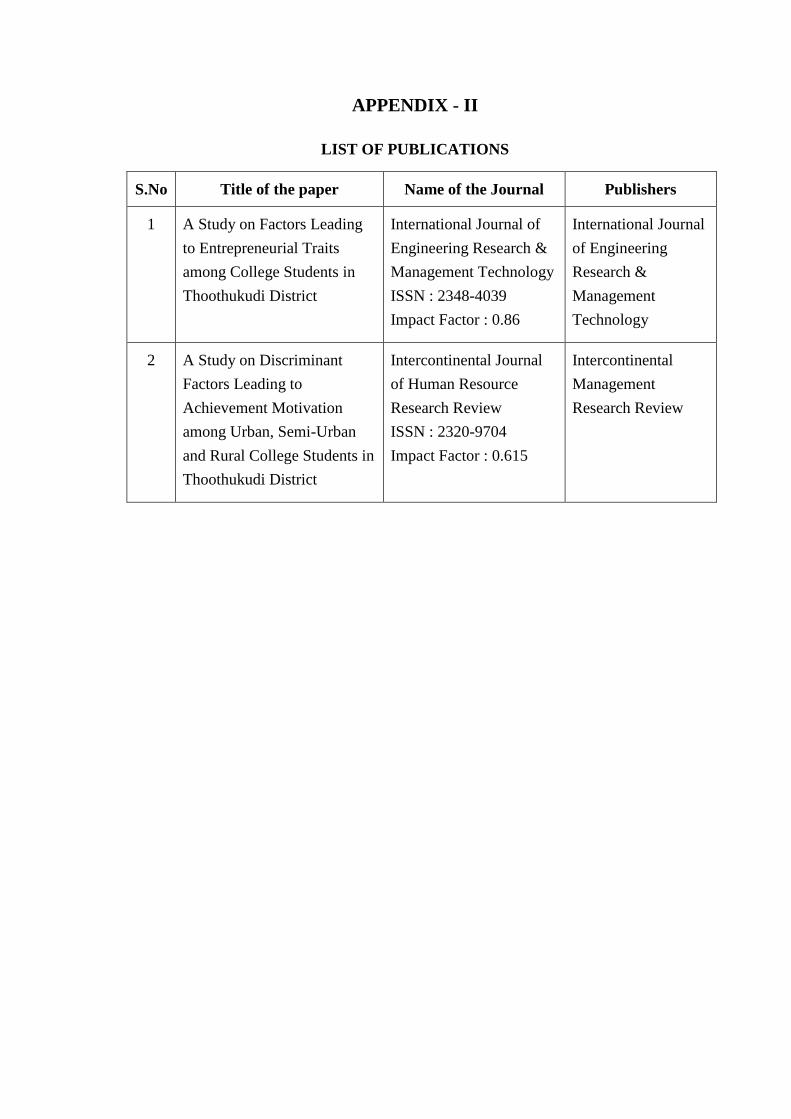
APPENDIX - II
LIST OF PUBLICATIONS
S.No Title of the paper Name of the Journal Publishers
1 A Study on Factors Leading
to Entrepreneurial Traits
among College Students in
Thoothukudi District
International Journal of
Engineering Research &
Management Technology
ISSN : 2348-4039
Impact Factor : 0.86
International Journal
of Engineering
Research &
Management
Technology
2 A Study on Discriminant
Factors Leading to
Achievement Motivation
among Urban, Semi-Urban
and Rural College Students in
Thoothukudi District
Intercontinental Journal
of Human Resource
Research Review
ISSN : 2320-9704
Impact Factor : 0.615
Intercontinental
Management
Research Review
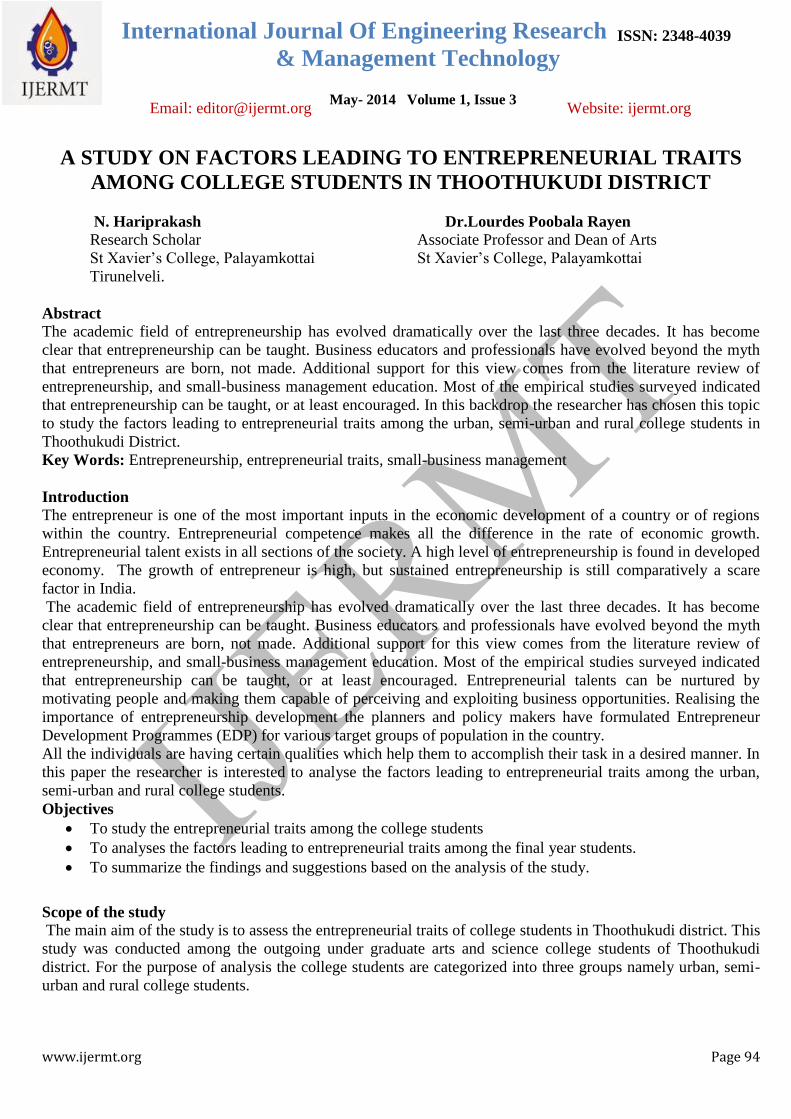
International Journal Of Engineering Research
& Management Technology
Email: [email protected] Website: ijermt.org
www.ijermt.org Page 94
May- 2014 Volume 1, Issue 3
ISSN: 2348-4039
A STUDY ON FACTORS LEADING TO ENTREPRENEURIAL TRAITS
AMONG COLLEGE STUDENTS IN THOOTHUKUDI DISTRICT
N. Hariprakash Dr.Lourdes Poobala Rayen
Research Scholar Associate Professor and Dean of Arts
St Xavier‟s College, Palayamkottai St Xavier‟s College, Palayamkottai
Tirunelveli.
Abstract
The academic field of entrepreneurship has evolved dramatically over the last three decades. It has become
clear that entrepreneurship can be taught. Business educators and professionals have evolved beyond the myth
that entrepreneurs are born, not made. Additional support for this view comes from the literature review of
entrepreneurship, and small-business management education. Most of the empirical studies surveyed indicated
that entrepreneurship can be taught, or at least encouraged. In this backdrop the researcher has chosen this topic
to study the factors leading to entrepreneurial traits among the urban, semi-urban and rural college students in
Thoothukudi District.
Key Words: Entrepreneurship, entrepreneurial traits, small-business management
Introduction
The entrepreneur is one of the most important inputs in the economic development of a country or of regions
within the country. Entrepreneurial competence makes all the difference in the rate of economic growth.
Entrepreneurial talent exists in all sections of the society. A high level of entrepreneurship is found in developed
economy. The growth of entrepreneur is high, but sustained entrepreneurship is still comparatively a scare
factor in India.
The academic field of entrepreneurship has evolved dramatically over the last three decades. It has become
clear that entrepreneurship can be taught. Business educators and professionals have evolved beyond the myth
that entrepreneurs are born, not made. Additional support for this view comes from the literature review of
entrepreneurship, and small-business management education. Most of the empirical studies surveyed indicated
that entrepreneurship can be taught, or at least encouraged. Entrepreneurial talents can be nurtured by
motivating people and making them capable of perceiving and exploiting business opportunities. Realising the
importance of entrepreneurship development the planners and policy makers have formulated Entrepreneur
Development Programmes (EDP) for various target groups of population in the country.
All the individuals are having certain qualities which help them to accomplish their task in a desired manner. In
this paper the researcher is interested to analyse the factors leading to entrepreneurial traits among the urban,
semi-urban and rural college students.
Objectives
To study the entrepreneurial traits among the college students
To analyses the factors leading to entrepreneurial traits among the final year students.
To summarize the findings and suggestions based on the analysis of the study.
Scope of the study
The main aim of the study is to assess the entrepreneurial traits of college students in Thoothukudi district. This
study was conducted among the outgoing under graduate arts and science college students of Thoothukudi
district. For the purpose of analysis the college students are categorized into three groups namely urban, semi-
urban and rural college students.
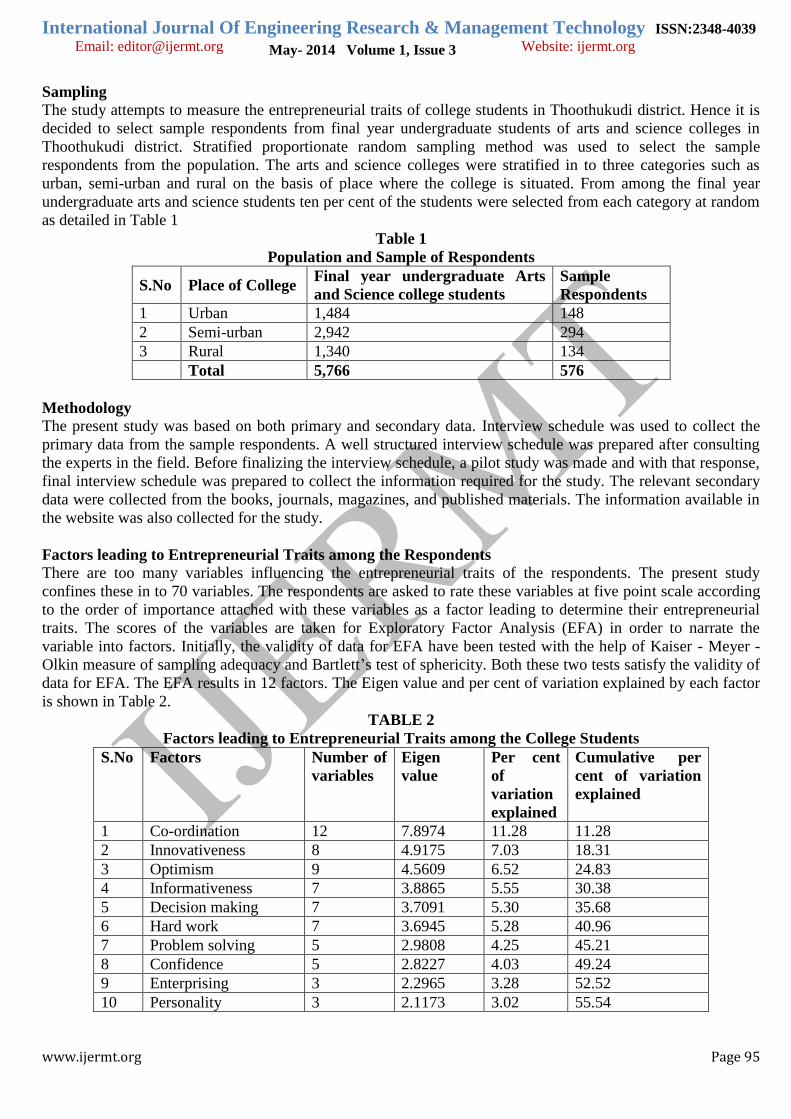
International Journal Of Engineering Research & Management Technology ISSN:2348-4039
Email: [email protected] Website: ijermt.org
www.ijermt.org Page 95
May- 2014 Volume 1, Issue 3
Sampling
The study attempts to measure the entrepreneurial traits of college students in Thoothukudi district. Hence it is
decided to select sample respondents from final year undergraduate students of arts and science colleges in
Thoothukudi district. Stratified proportionate random sampling method was used to select the sample
respondents from the population. The arts and science colleges were stratified in to three categories such as
urban, semi-urban and rural on the basis of place where the college is situated. From among the final year
undergraduate arts and science students ten per cent of the students were selected from each category at random
as detailed in Table 1
Table 1
Population and Sample of Respondents
S.No Place of College Final year undergraduate Arts
and Science college students
Sample
Respondents
1 Urban 1,484 148
2 Semi-urban 2,942 294
3 Rural 1,340 134
Total 5,766 576
Methodology
The present study was based on both primary and secondary data. Interview schedule was used to collect the
primary data from the sample respondents. A well structured interview schedule was prepared after consulting
the experts in the field. Before finalizing the interview schedule, a pilot study was made and with that response,
final interview schedule was prepared to collect the information required for the study. The relevant secondary
data were collected from the books, journals, magazines, and published materials. The information available in
the website was also collected for the study.
Factors leading to Entrepreneurial Traits among the Respondents
There are too many variables influencing the entrepreneurial traits of the respondents. The present study
confines these in to 70 variables. The respondents are asked to rate these variables at five point scale according
to the order of importance attached with these variables as a factor leading to determine their entrepreneurial
traits. The scores of the variables are taken for Exploratory Factor Analysis (EFA) in order to narrate the
variable into factors. Initially, the validity of data for EFA have been tested with the help of Kaiser - Meyer -
Olkin measure of sampling adequacy and Bartlett‟s test of sphericity. Both these two tests satisfy the validity of
data for EFA. The EFA results in 12 factors. The Eigen value and per cent of variation explained by each factor
is shown in Table 2.
TABLE 2
Factors leading to Entrepreneurial Traits among the College Students
S.No Factors Number of
variables
Eigen
value
Per cent
of
variation
explained
Cumulative per
cent of variation
explained
1 Co-ordination 12 7.8974 11.28 11.28
2 Innovativeness 8 4.9175 7.03 18.31
3 Optimism 9 4.5609 6.52 24.83
4 Informativeness 7 3.8865 5.55 30.38
5 Decision making 7 3.7091 5.30 35.68
6 Hard work 7 3.6945 5.28 40.96
7 Problem solving 5 2.9808 4.25 45.21
8 Confidence 5 2.8227 4.03 49.24
9 Enterprising 3 2.2965 3.28 52.52
10 Personality 3 2.1173 3.02 55.54

International Journal Of Engineering Research & Management Technology ISSN:2348-4039
Email: [email protected] Website: ijermt.org
www.ijermt.org Page 96
May- 2014 Volume 1, Issue 3
11 Sincerity 2 1.8986 2.71 58.25
12 Forecasting ability 2 1.7345 2.47 60.72
Total 70
KMO measures of sampling
adequacy: 0.7379
Bartlett’s test of sphericity: Chi square
value: 80.79*
*Significant at five per cent level
The first three important factors are co-ordination, innovativeness and optimism since their Eigen values are
7.8974, 4.9175 and 4.5609 respectively. The per cent of variation explained by these factors are 11.28, 7.03 and
6.52 per cent respectively. The next three factors identified by the EFA are informativeness, decision making
and hard work since their Eigen values are 3.8865, 3.7091 and 3.6945 respectively. The per cent of variation
explained by these three factors are 5.55, 5.30 and 5.28 per cent, respectively.
The next three factors identified by the EFA are problem solving, confidence and enterprising since their Eigen
values are 2.9808, 2.8227 and 2.2965 respectively. The per cent of variation explained by these three factors are
4.25, 4.03 and 3.28 per cent respectively. The last three factors identified by the factor analysis are personality,
sincerity and forecasting ability since their Eigen values are 2.1173, 1.8986 and 1.7345 respectively. The per
cent of variation explained by these three factors are 3.02, 2.71 and 2.47 per cent respectively. All the 12 factors
explain the 70 variables to an extent of 60.72 per cent. The analysis result in 12 factors leading to
entrepreneurial traits among the respondents.
Reliability and validity of variables in Coordination
In total, there are twelve variables included in coordination. It is important to examine the reliability and
validity of variables in coordination. The confirmatory factors analysis (CFA) has been administered for their
purpose. The reliability has been tested with the help of Cronbach alpha. The results are given in Table 3.
TABLE 3
Reliability and Validity of variables in Coordination
S.No Variables relating
to Coordination
Standardised
factor
loading
‘t’
Statistics
Cronbach
alpha
Composite
reliability
Average
variables
Extracted
1 Capable of
encouraging others
0.8988 3.9969* 0.8088 0.7819 55.96
2 Inspiring others 0.8504 3.8118*
3 Moving friendly
with others
0.8099 3.5961*
4 Guiding other in
their work
0.7842 3.4509*
5 Accommodating
others to carryout
task
0.7596 3.3896*
6 Getting helps from
others
0.7417 3.2483*
7 Helping others 0.7226 3.0971*
8 Accepting others
with open minded
0.6909 2.9661*
9 Appreciating others 0.68170 2.8089*
10 Taking effort to
encourage others
0.6549 2.5969*
11 Interested in 0.6308 2.3117*

International Journal Of Engineering Research & Management Technology ISSN:2348-4039
Email: [email protected] Website: ijermt.org
www.ijermt.org Page 97
May- 2014 Volume 1, Issue 3
working with others
12 Like challenges
giving scope for
thinking differently
0.6211 2.1084*
*Significant at five per cent level
The standardised factor loading of the variables in coordination are greater than 0.60 which shows the content
validity. The significance of „t‟ statistics of the standardized factor loading of the variables in coordination
reveals the convergent validity. It is also proved by the composite reliability and average variance extracted
since these are greater than it‟s minimum threshold of 0.50 and 50.00 per cent respectively. The twelve
variables included in coordination explain it to an extent of 80.88 per cent since its Cronbach alpha is 0.8088.
Reliability and Validity of variables Relating to Innovativeness
In total there are eight variables in innovativeness which are identified by the explanatory factor analysis.
Before summarising the scores of the variables in innovativeness, it is imperative to examine the reliability and
validity with the help of confirmatory factor analysis. The overall reliability of the variables in innovativeness
has been tested with the help of Cronbach alpha. The results are present in Table 4
TABLE 4
Reliability and Validity of variables in Innovativeness
S.No Variables relating
to innovativeness
Standardised
factor
loading
‘t’
Statistics
Cronbach
alpha
Composite
reliability
Average
variables
Extracted
1 Willing to do new
things and to accept
new ideas
0.9097 1.2144* 0.8117 0.7906 56.04
2 My new ideas
mostly got the
approval of my
friends
0.8649 3.9676*
3 Like to scale new
heights
0.8208 3.7121*
4 Loving newness
0.8011 3.5676*
5 Taking new
initiatives
0.7845 3.3918*
6 Finding new ways
of answering
questions
0.7309 3.0172*
7 Interested in writing
assignments on
innovative topics
0.6776 2.6917*
8 Taking right
decision at the right
time
0.6344 2.3894*
*Significant at five per cent level
The standardised factor loading of the variables in innovativeness varies from 0.6344 to 0.9097 which shows
the content validity of the factor. The convergent validity of the factor is proved since the „t‟ statistics of the
standardised factor loading to the variables in innovativeness are significant at five per cent level. It is also
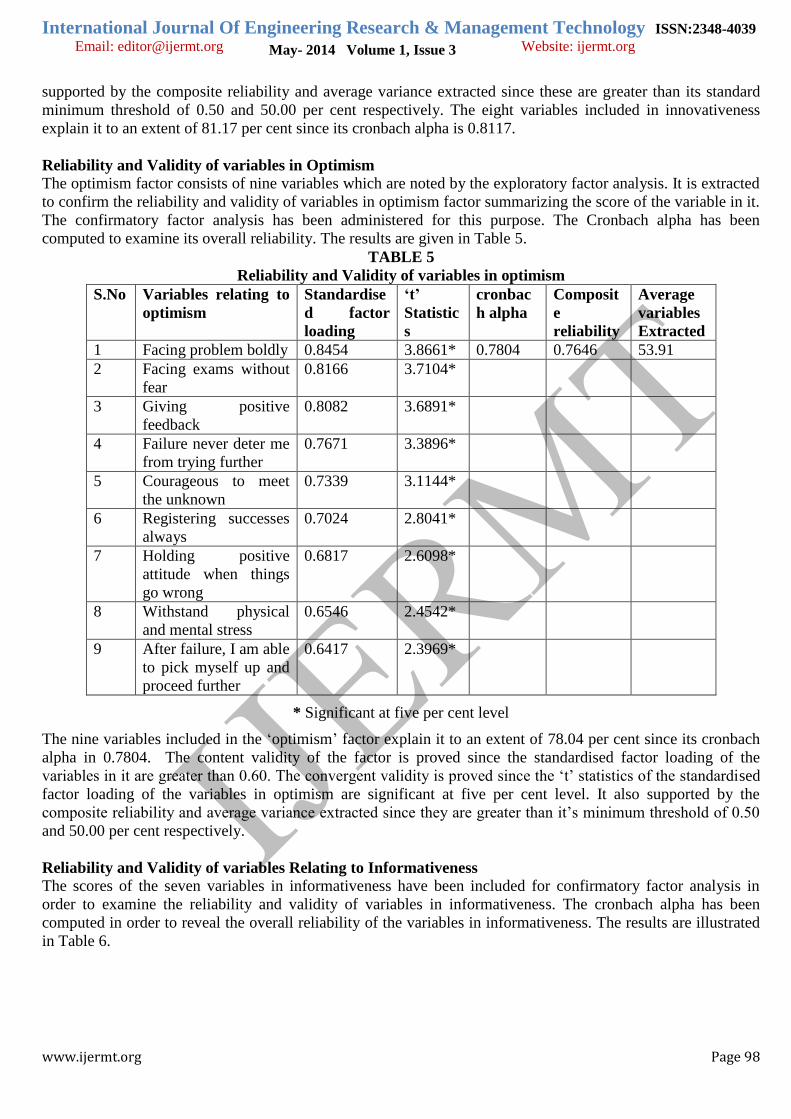
International Journal Of Engineering Research & Management Technology ISSN:2348-4039
Email: [email protected] Website: ijermt.org
www.ijermt.org Page 98
May- 2014 Volume 1, Issue 3
supported by the composite reliability and average variance extracted since these are greater than its standard
minimum threshold of 0.50 and 50.00 per cent respectively. The eight variables included in innovativeness
explain it to an extent of 81.17 per cent since its cronbach alpha is 0.8117.
Reliability and Validity of variables in Optimism
The optimism factor consists of nine variables which are noted by the exploratory factor analysis. It is extracted
to confirm the reliability and validity of variables in optimism factor summarizing the score of the variable in it.
The confirmatory factor analysis has been administered for this purpose. The Cronbach alpha has been
computed to examine its overall reliability. The results are given in Table 5.
TABLE 5
Reliability and Validity of variables in optimism
S.No Variables relating to
optimism
Standardise
d factor
loading
‘t’
Statistic
s
cronbac
h alpha
Composit
e
reliability
Average
variables
Extracted
1 Facing problem boldly 0.8454 3.8661* 0.7804 0.7646 53.91
2 Facing exams without
fear
0.8166 3.7104*
3 Giving positive
feedback
0.8082 3.6891*
4 Failure never deter me
from trying further
0.7671 3.3896*
5 Courageous to meet
the unknown
0.7339 3.1144*
6 Registering successes
always
0.7024 2.8041*
7 Holding positive
attitude when things
go wrong
0.6817 2.6098*
8 Withstand physical
and mental stress
0.6546 2.4542*
9 After failure, I am able
to pick myself up and
proceed further
0.6417 2.3969*
* Significant at five per cent level
The nine variables included in the „optimism‟ factor explain it to an extent of 78.04 per cent since its cronbach
alpha in 0.7804. The content validity of the factor is proved since the standardised factor loading of the
variables in it are greater than 0.60. The convergent validity is proved since the „t‟ statistics of the standardised
factor loading of the variables in optimism are significant at five per cent level. It also supported by the
composite reliability and average variance extracted since they are greater than it‟s minimum threshold of 0.50
and 50.00 per cent respectively.
Reliability and Validity of variables Relating to Informativeness
The scores of the seven variables in informativeness have been included for confirmatory factor analysis in
order to examine the reliability and validity of variables in informativeness. The cronbach alpha has been
computed in order to reveal the overall reliability of the variables in informativeness. The results are illustrated
in Table 6.
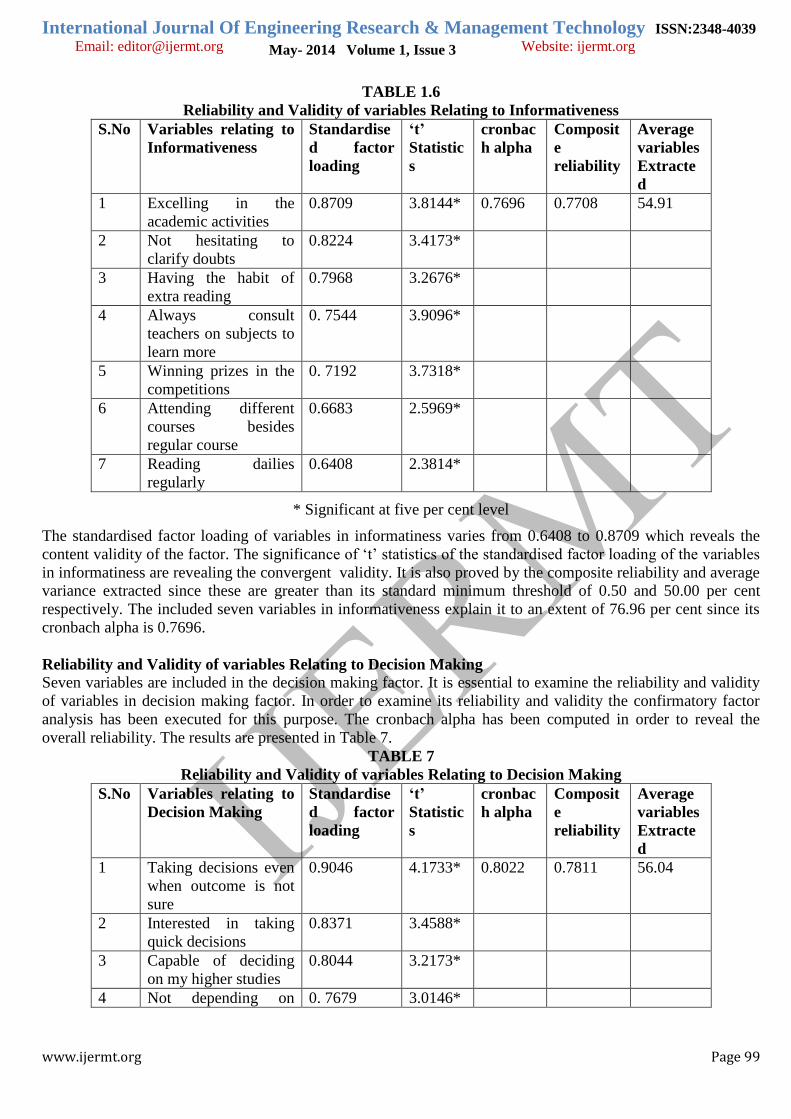
International Journal Of Engineering Research & Management Technology ISSN:2348-4039
Email: [email protected] Website: ijermt.org
www.ijermt.org Page 99
May- 2014 Volume 1, Issue 3
TABLE 1.6
Reliability and Validity of variables Relating to Informativeness
S.No Variables relating to
Informativeness
Standardise
d factor
loading
‘t’
Statistic
s
cronbac
h alpha
Composit
e
reliability
Average
variables
Extracte
d
1 Excelling in the
academic activities
0.8709 3.8144* 0.7696 0.7708 54.91
2 Not hesitating to
clarify doubts
0.8224 3.4173*
3 Having the habit of
extra reading
0.7968 3.2676*
4 Always consult
teachers on subjects to
learn more
0. 7544 3.9096*
5 Winning prizes in the
competitions
0. 7192 3.7318*
6 Attending different
courses besides
regular course
0.6683 2.5969*
7 Reading dailies
regularly
0.6408 2.3814*
* Significant at five per cent level
The standardised factor loading of variables in informatiness varies from 0.6408 to 0.8709 which reveals the
content validity of the factor. The significance of „t‟ statistics of the standardised factor loading of the variables
in informatiness are revealing the convergent validity. It is also proved by the composite reliability and average
variance extracted since these are greater than its standard minimum threshold of 0.50 and 50.00 per cent
respectively. The included seven variables in informativeness explain it to an extent of 76.96 per cent since its
cronbach alpha is 0.7696.
Reliability and Validity of variables Relating to Decision Making
Seven variables are included in the decision making factor. It is essential to examine the reliability and validity
of variables in decision making factor. In order to examine its reliability and validity the confirmatory factor
analysis has been executed for this purpose. The cronbach alpha has been computed in order to reveal the
overall reliability. The results are presented in Table 7.
TABLE 7
Reliability and Validity of variables Relating to Decision Making
S.No Variables relating to
Decision Making
Standardise
d factor
loading
‘t’
Statistic
s
cronbac
h alpha
Composit
e
reliability
Average
variables
Extracte
d
1 Taking decisions even
when outcome is not
sure
0.9046 4.1733* 0.8022 0.7811 56.04
2 Interested in taking
quick decisions
0.8371 3.4588*
3 Capable of deciding
on my higher studies
0.8044 3.2173*
4 Not depending on 0. 7679 3.0146*

International Journal Of Engineering Research & Management Technology ISSN:2348-4039
Email: [email protected] Website: ijermt.org
www.ijermt.org Page 100
May- 2014 Volume 1, Issue 3
others to decide
5 While shopping,
choice of dress is mine
0. 7238 3.8447*
6 Never looks back 0.6691 2.5973*
7 I like teachers who are
more creative in their
approach
0.6407 2.3961*
* Significant at five per cent level
The seven variables included in decision making factor explain it to an extent of 80.22 per cent since its
cronbach alpha is 0.8022. The standardised factor loading of the variables in decision making factor are greater
than 0.60 which reveals the content validity. The significance of „t‟ statistic of the standardised factor loading of
variables in decision making factor reveal the content validity. It is also proved by the composite reliability and
average variable extracted since they are greater than its minimum threshold 0.50 and 50.00 per cent
respectively.
Reliability and Validity of Variables Relating to Hard work
The hard work factor consists of seven variables which are noticed by the exploratory factor analysis. The
scores of the variables in hard work have been included for confirmatory factor analysis in order to examine the
reliability and validity of variables in it. The overall reliability has been extracted with the help of cronbach
alpha. The variables are shown in Table 8.
TABLE 8
Reliability and Validity of Variables in Hard work
S.No Variables relating to
hard work
Standardise
d factor
loading
‘t’
Statistic
s
cronbac
h alpha
Composit
e
reliability
Average
variables
Extracte
d
1 Taking more effort to
complete a task
0.8227 4.7447* 0.7811 0.7642 52.86
2 I spend more time to
score good marks
0.8018 3.6117*
3 Won‟t put off things 0.7667 3.4091*
4 Prepared to travel long
distance without
advance booking of
tickets
0. 7508 3.3898*
5 Doing regular and
continuous preparation
for exams
0. 7345 3.1172*
6 Willing to study long
hours
0.6917 2.8661*
7 Mentally and
physically fit to do
hard work
0.6682 2.4886*
* Significant at five per cent level
Seven variables are included in hard work factor which explain it to the extent of 78.11 per cent since its
cronbach alpha is 0.7811. The standardised factor loading of the variables in hard work are greater than 0.60
which shows the content validity. The significance of „t‟ statistic of the standardised factor loading of variables

International Journal Of Engineering Research & Management Technology ISSN:2348-4039
Email: [email protected] Website: ijermt.org
www.ijermt.org Page 101
May- 2014 Volume 1, Issue 3
in hard work reveal the composite reliability and average variable extracted since these are greater than its
minimum threshold 0.50 and 50.00 per cent respectively.
Reliability and Validity of variables Relating to Problem Solving Skills
The exploratory factor analysis identified five variables in problem solving skills factor. The scores of the
variables in problem solving skills are included for confirmatory factor analysis in order to examine the
reliability and validity of variables in it. The overall reliability in the factors has been tested with the help of
cronbach alpha. The results are illustrated in Table 9.
TABLE 9
Reliability and Validity of variables Relating to Problem Solving Skills
S.No Variables relating to
problem solving
skills
Standardise
d factor
loading
‘t’
Statistic
s
cronbac
h alpha
Composit
e
reliability
Average
variables
Extracte
d
1 Having alternative
plan for future studies
0.8545 3.8414* 0.7749 0.7502 52.17
2 Taking decisions after
analysing the pros and
corns
0.8017 3.3886*
3 Friends approach me
for solving their
problems
0.7595 3.1965*
4 Flexibility in solving
problems
0. 7344 2.9969*
5 Realising and
overcoming the
problems
0. 6849 2.8082*
* Significant at five per cent level
The standardised factor loading of variables in problem solving skills are varying from 0.6849 to 0.8545 which
reveals the content validity. The standardised factor loading of the variables in this factor reveals the content
validity. It is supported by the composite reliability and average variance extracted since these are greater than
its minimum threshold of 0.50 and 50.00 per cent respectively. The included variables in problem solving factor
explain it to an extent of 77.49 per cent since its cronbach alpha is 0.7749.
Reliability and Validity of variables Relating to Confidence
The ‘confidence‟ factor consists of five variables which were identified by the exploratory factor analysis.
Before summarising the scores of variables in confidence, it is essential to examine its reliability and validity.
The confirmatory factor analysis has been administered for this purpose. The overall reliability has been
estimated with the help of cronbach alpha. The variables are illustrated in Table 10.
TABLE 10
Reliability and Validity of variables Relating to Confidence
S.No Variables relating to
confident
Standardise
d factor
loading
‘t’
Statistic
s
cronbac
h alpha
Composit
e
reliability
Average
variables
Extracte
d
1 Taking initiation for
doing things
0.9117 4.0868* 0.8021 0.7844 55.92
2 Always going in for 0.8408 3.3969*

International Journal Of Engineering Research & Management Technology ISSN:2348-4039
Email: [email protected] Website: ijermt.org
www.ijermt.org Page 102
May- 2014 Volume 1, Issue 3
excellence
3 Accepting the task
without hesitation
0.7668 2.9117*
4 Bold enough to visit
unknown places
independently
0. 7349 2.6919*
5 When I take a job, I
am always confident
that I can carry it out
0. 6546 2.3891*
* Significant at five per cent level
The five variables included in confidence factor explain the reliability and validity of the variables to an extent
of 80.21 per cent since its cronbach alpha is 0.8021. The standardised factor loading of the variables in
confidence factor reveals the content validity. The significance of „t‟ statistic of the standardised factor loading
of the variables shows its content validity. It is also proved by the composite reliability and average variable
extracted since these are greater than its standard minimum threshold of 0.50 and 50.00 per cent respectively.
Reliability and validity of variables Relating to Enterprising
The exploratory factor analysis identified the variables included in the enterprising factor. The scores of the
variables in enterprising are included for confirmatory factor analysis in order to confirm the reliability and
validity of variables in it. The overall reliability has been estimated with the help of cronbach alpha. The results
are shown in the Table 11.
TABLE 11
Reliability and Validity of variables Relating to Enterprising
S.No Variables relating to
Enterprising
Standardise
d factor
loading
‘t’
Statistic
s
cronbac
h alpha
Composit
e
reliability
Average
variables
Extracte
d
1 Talk openly and give
straight answers
0.8491 3.7331* 0.8091 0.7842 53.45
2 Creative in writing
assignments
0.7608 3.3844*
3 Maintaining physical
and emotional balance
0.6886 2.5969*
* Significant at five per cent level
The standardised factor loading of variables in enterprising factor is varying from 0.6886 to 0.8491 which
reveals the content validity. The significance of „t‟ statistics of the standardised factor loading reveals the
convergent validity. It is also supported by the composite reliability and average variance extracted since these
are greater than its standard minimum threshold of 0.50 and 50.00 per cent respectively. The variables included
in enterprising factor explain its reliability and validity to an extent of 80.91 per cent since its cronbach alpha is
0.8091.
Reliability and Validity of variables Relating to Punctuality
The punctuality factor consists of three variables. It is informative to examine the reliability and validity of
variables in punctuality factor before summarising the scores of the variables in it. The confirmatory factor
analysis has been administrated for this purpose. The overall reliability has been estimated with the help of
cronbach alpha. The results are shown in Table 12.

International Journal Of Engineering Research & Management Technology ISSN:2348-4039
Email: [email protected] Website: ijermt.org
www.ijermt.org Page 103
May- 2014 Volume 1, Issue 3
TABLE 12
Reliability and Validity of variables Relating to Punctuality
S.No Variables relating to
punctuality
Standardise
d factor
loading
‘t’
Statistic
s
cronbac
h alpha
Composit
e
reliability
Average
variables
Extracte
d
1 Submission of
assignments and home
work in time
0.8117 3.2673* 0.7242 0.7041 51.49
2 Taking right decision
at right time
0.7228 2.8868*
3 Don‟t keep problems
pending
0.6089 2.0917*
* Significant at five per cent level
The three variables included in punctuality factor explain to an extent of 72.42 per cent since its cronbach alpha
is 0.7242. The standardised factor loading of the variables in punctuality factor are greater than 0.60 which
shows the content validity. The significance of „t‟ statistics of the standardised factor loading in punctuality
factor shows the convergent validity. It is also supported by the composite reliability and average variable
extracted since these are greater than its minimum threshold of 0.50 and 50.00 per cent respectively.
Variables in Sincerity Factor and its reliability
The sincerity factor consists of two variables in it. Before summarising the scores of the variables in sincerity
factor, it is essential to examine the reliability and validity of variables in sincerity factor. The confirmatory
factor analysis has been administrated for this purpose. The overall reliability has been tested with the help of
cronbach alpha. The results are presented in Table 13.
TABLE 13
Reliability and Validity of variables Relating to Sincerity
S.No Variables relating to
sincerity
Standardise
d factor
loading
‘t’
Statistic
s
cronbac
h alpha
Composit
e
reliability
Average
variables
Extracted
1 Use to attend the
examination with full
preparation
0.8099 3.1738* 0.7394 0.7102 52.76
2 Spend holidays
usefully
0.6593 2.3969*
* Significant at five per cent level
The standardised factor loading of variables in sincerity factor varies from 0.6593 to 0.8099 which shows the
content validity. The convergent validity is proved since the „t‟ statistics of the standardised factor loading of
the variables in sincerity factor are significant at five per cent level. It is also proved by the composite validity
and average variance extracted since these are greater than 0.50 and 50.00 per cent respectively. The included
two variables in sincerity factor explain it to an extent of 73.94 per cent since its cronbach alpha is 0.7394.
Variables Relating to Forecasting ability factor and its reliability
The forecasting ability factor included two variables in it. Before summarising the scores of the variables in it, it
is necessary to examine the reliability and validity of variables in forecasting ability factor with the help of
confirmatory factor analysis. The overall reliability has been tested with the help of cronbach alpha. The results
are given in Table 14.

International Journal Of Engineering Research & Management Technology ISSN:2348-4039
Email: [email protected] Website: ijermt.org
www.ijermt.org Page 104
May- 2014 Volume 1, Issue 3
TABLE 14
Reliability and validity of variables in Forecasting ability
S.No Variables in
forecasting ability
Standardise
d factor
loading
‘t’
Statistic
s
cronbac
h alpha
Composit
e
reliability
Average
variables
Extracte
d
1 Planning things in
advance
0.8644 3.4962* 0.7889 0.7642 52.91
2 Preparation for future
carrier planning
0.7279 2.5969*
* Significant at five per cent level
The two variables included in forecasting ability factor explain to an extent of 78.89 per cent since its cronbach
alpha is 0.7889. The standardised factor loading of the variables in forecasting ability factor are greater than
0.60 which shows its content validity. The significance of „t‟ statistics of the standardised factor loading shows
the overall convergent validity. It is also proved by the composite reliability and average variable extracted
since they are greater than its minimum threshold of 0.50 and 50.00 per cent respectively.
Respondents view about the Factors leading to Entrepreneurial Traits
The respondents view about the factors leading to entrepreneurial traits are examined with the help of 12 factors
namely coordination, innovativeness, optimism, informativeness, decision making skill, hard work, problem
solving, confidence, enterprising, punctuality, sincerity and forecasting ability. The scores of the above said
factors have been computed by the mean score of the variables in each factor. The mean score of each factor
among the groups of respondents have been computed along with its „F‟ statistics. The results are given in
Table 15.
TABLE 15
Respodents view about the Factors leading to Entrepreneurial Traits
* Significant at five per cent level
The highly viewed factors leading to entrepreneurial traits by the urban college students are enterprising and
innovativeness since their mean sores are 3.9692 and 3.9197 respectively. Among the semi-urban college
students, the highly viewed factors leading to entrepreneurial traits are hard work and decision making skills
since their mean score are 3.8991 and 3.8684 respectively. Among the rural college students, the highly viewed
S.No Factors
Mean score of the Respondents
F statistics Urban
Semi –
urban Rural
1 Coordination 3.0889 3.5869 3.9197 3.6557*
2 Innovativeness 3.9197 3.3441 3.0461 3.3841*
3 Optimism 3.8082 3.4509 3.2671 3.0991*
4 Informativeness 3.6889 3.1703 3.3089 2.9969
5 Decision making 3.7172 3.8684 3.5341 2.0441
6 Hard work 3.3038 3.8991 3.9677 3.1172*
7 Problem solving 3.8917 3.3842 3.0441 3.4509*
8 Confidence 3.8084 3.6674 3.5084 1.8967
9 Enterprising 3.9692 3.3845 3.2171 3.2676*
10 Punctuality 3.1171 3.2671 3.3089 1.0946
11 Sincerity 3.8844 3.6649 3.7334 0.9697
12 Forecasting ability 3.8911 3.5344 3.1782 3.2673*
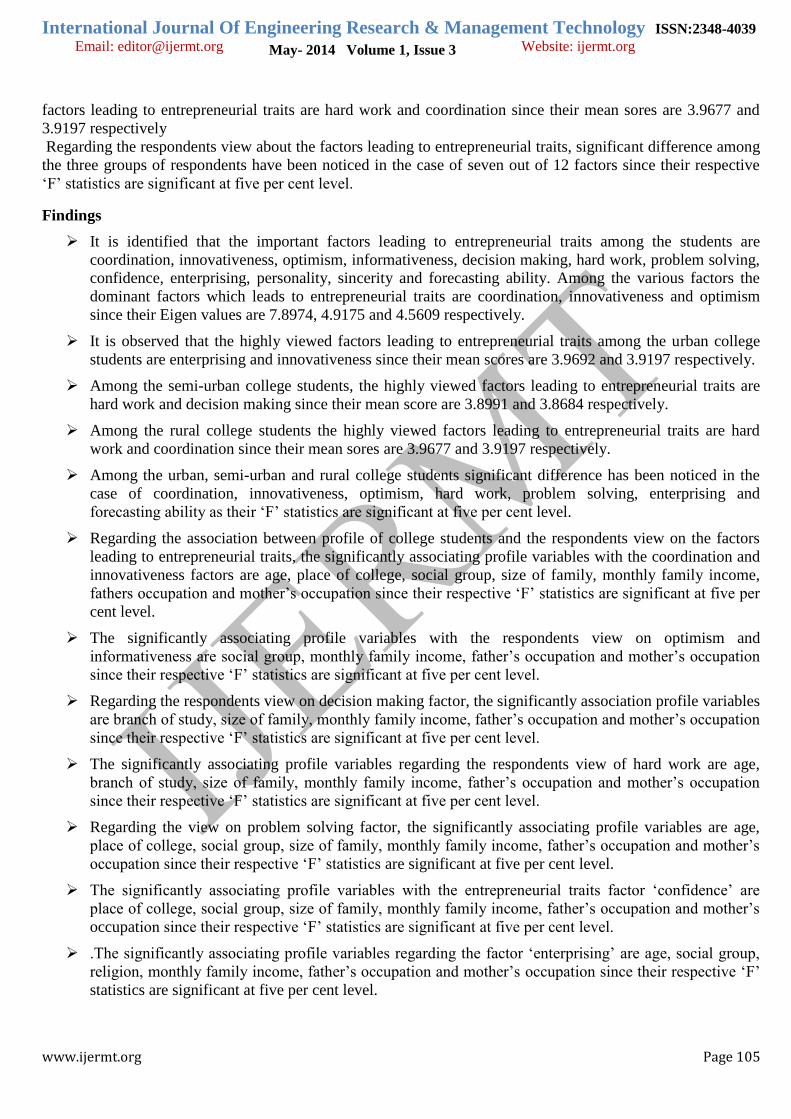
International Journal Of Engineering Research & Management Technology ISSN:2348-4039
Email: [email protected] Website: ijermt.org
www.ijermt.org Page 105
May- 2014 Volume 1, Issue 3
factors leading to entrepreneurial traits are hard work and coordination since their mean sores are 3.9677 and
3.9197 respectively
Regarding the respondents view about the factors leading to entrepreneurial traits, significant difference among
the three groups of respondents have been noticed in the case of seven out of 12 factors since their respective
„F‟ statistics are significant at five per cent level.
Findings
It is identified that the important factors leading to entrepreneurial traits among the students are
coordination, innovativeness, optimism, informativeness, decision making, hard work, problem solving,
confidence, enterprising, personality, sincerity and forecasting ability. Among the various factors the
dominant factors which leads to entrepreneurial traits are coordination, innovativeness and optimism
since their Eigen values are 7.8974, 4.9175 and 4.5609 respectively.
It is observed that the highly viewed factors leading to entrepreneurial traits among the urban college
students are enterprising and innovativeness since their mean scores are 3.9692 and 3.9197 respectively.
Among the semi-urban college students, the highly viewed factors leading to entrepreneurial traits are
hard work and decision making since their mean score are 3.8991 and 3.8684 respectively.
Among the rural college students the highly viewed factors leading to entrepreneurial traits are hard
work and coordination since their mean sores are 3.9677 and 3.9197 respectively.
Among the urban, semi-urban and rural college students significant difference has been noticed in the
case of coordination, innovativeness, optimism, hard work, problem solving, enterprising and
forecasting ability as their „F‟ statistics are significant at five per cent level.
Regarding the association between profile of college students and the respondents view on the factors
leading to entrepreneurial traits, the significantly associating profile variables with the coordination and
innovativeness factors are age, place of college, social group, size of family, monthly family income,
fathers occupation and mother‟s occupation since their respective „F‟ statistics are significant at five per
cent level.
The significantly associating profile variables with the respondents view on optimism and
informativeness are social group, monthly family income, father‟s occupation and mother‟s occupation
since their respective „F‟ statistics are significant at five per cent level.
Regarding the respondents view on decision making factor, the significantly association profile variables
are branch of study, size of family, monthly family income, father‟s occupation and mother‟s occupation
since their respective „F‟ statistics are significant at five per cent level.
The significantly associating profile variables regarding the respondents view of hard work are age,
branch of study, size of family, monthly family income, father‟s occupation and mother‟s occupation
since their respective „F‟ statistics are significant at five per cent level.
Regarding the view on problem solving factor, the significantly associating profile variables are age,
place of college, social group, size of family, monthly family income, father‟s occupation and mother‟s
occupation since their respective „F‟ statistics are significant at five per cent level.
The significantly associating profile variables with the entrepreneurial traits factor „confidence‟ are
place of college, social group, size of family, monthly family income, father‟s occupation and mother‟s
occupation since their respective „F‟ statistics are significant at five per cent level.
.The significantly associating profile variables regarding the factor „enterprising‟ are age, social group,
religion, monthly family income, father‟s occupation and mother‟s occupation since their respective „F‟
statistics are significant at five per cent level.
International Journal Of Engineering Research & Management Technology ISSN:2348-4039
Email: [email protected] Website: ijermt.org
www.ijermt.org Page 106
May- 2014 Volume 1, Issue 3
Regarding the significantly associating profile variables with the entrepreneurial traits „punctuality‟ are
age, religion, monthly family income, father‟s occupation and mother‟s occupation since their respective
„F‟ statistics are significant at five per cent level.
The significantly associating profile variables with the factor „sincerity‟ are social group, religion, type
of family, monthly family income, father‟s occupation and mother‟s occupation since their respective
„F‟ statistics are significant at five per cent level.
Regarding the view on forecasting ability, the significantly associating profile variables are age, place of
college, social group, religion, monthly family income, father‟s occupation and mother‟s occupation
since their respective „F‟ statistics are significant at five per cent level..
Suggestion
The urban college students though they are having higher level of self confidence compared to the semi-
urban and rural college students, they are having lesser mean scores as regards „hard work‟, and so the
urban college students should realize the importance of hard work for achieving greater things.
As the semi-urban and rural college students are lacking in the innovative thinking and problem solving,
the semi-urban and rural colleges may induce the students to organize programmes and competitions.
While organizing programmes and participating in the competitions the students can display their
innovativeness and they can sharpen their problem solving abilities.
The college can create Innovation Centre and motivate the students to register their innovative or
creative ideas. The students should be guided and nurtured properly to develop a product or process
using their creative ideas. The college may honour the students during the college day for their creative
and innovative ideas by giving certificates or prizes. This will motivate other students to come forward
and do something.
Conclusion
The present study concluded that the factors leading to entrepreneurial traits are differing among the urban,
semi-urban, and rural college students. As the factors leading to entrepreneurial traits differ the entrepeneurship
development programmes should be designed in such away to accommodate the different target groups to make
the programme successful.
References 1. Albert Shapero, Entrepreneurship and Economic Development. Wisconsin: Project ISEED, LTD., The Center of Venture
Management, Summer 1975.
2. Baldev Singh, Self-Employment Through Entrepreneurship Development, MD Publication Pvt. Ltd., New Delhi, 1996.
3. Khanka, S.S., Entrepreneurship in Small Scale Industries, Educational Publishers, New Delhi, 1990.
4. Nalinaksha Mutsuddi, You too Can Become an Entrepreneur, Wheeler Publishing, New Delhi, 1996.
5. Takey, N., Perryman, S. and Connor, H., Graduated Business Start-ups, Institute for Employment Studies, UK, 1999.
6. Tondon, B.C., Environment and Entrepreneur. Allahabad: Chugh Publications, 1975.
7. Sayigh, Y.A., Entrepreneurs of Lebanon: The role of the Business Leaser in a Developing Economy, Cambridge: Harvard
University Press, 1962.
8. Brockhaus, R.H., “Risk-taking Propensity of Entrepreneurs”, Academy of Management Journal, 3, September 1980.
9. Gartner, W.B., “Who is an Entrepreneur? Is the wrong Question?” American Journal of Small Business, 12:11-22, 1988.
10. Charney, A., and LIbecap. G., “Impact of Entrepreneurship Education”, Insights: A Kauffman Research Series. Kauffman
Center for Entrepreneurship Leadership, 2000.
11. Cowling, M., ans Taylor, M., “Entrepreneurial Women and Men: Two Different Species?” Small Business Economics, 16
(3), 2001.
12. Hunnu Littunen, “Entrepreneurship and Characteristics of the Entrepreneurial Presonality”, International Journal of
Entrepreneurial Behaviour and Research, Vol.6, No 6, 2000.
13. Hornaday, J.A., and Bunker, C.S., “The nature of the Entrepreneur”, Personnel Psychology, 23, 1970.
14. Kolvereid, L. and Moen, O., “Entrepreneurship among Business Graduates: Does a Major in a entrepreneurship make a
difference?” Journal of European Industrial Training, 21 (4-5), 1997.
15. Patel, V.G., “Entrepreneurs are made not born”, Economic Times, July 1990.

International Journal Of Engineering Research & Management Technology ISSN:2348-4039
Email: [email protected] Website: ijermt.org
www.ijermt.org Page 107
May- 2014 Volume 1, Issue 3
16. Stephen L. Muller, “Gender Gaps in Potential for Entrepreneurship Across Countries and Cultures”, Journal of
Developmental Entrepreneurship, Vol.9, No.3, December 2004.
17. Yonca Gurol and Nuray Astan, “Entrepreneurial Characteristics amongst University Students – Some Insights for
Entrepreneurship Education and Training in Turkey”, Emerald, Vol.48,No.4, 2006.

65
Volume 2, Issue 6 (June, 2014)
INTERCONTINENTAL JOURNAL OF HUMAN RESOURCE RESEARCH REVIEW
Pee
r R
evie
wed
Jo
urn
al o
f In
ter-
Co
nti
nen
tal M
anag
emen
t R
esea
rch
Co
nso
rtiu
m
htt
p:/
/ww
w.ic
mrr
.org
A STUDY ON DISCRIMINANT FACTORS LEADING TO
ACHIEVEMENT MOTIVATION AMONG URBAN, SEMI-URBAN AND
RURAL COLLEGE STUDENTS IN THOOTHUKUDI DISTRICT
N. HARIPRAKASH 1 Dr. LOURDES POOBALA RAYEN
2
1 Research Scholar, St Xavier‟s College, Palayamkottai, Tirunelveli.
2 Associate Professor and Dean of Arts, St Xavier‟s College, Palayamkottai, Tirunelveli.
ABSTRACT
Achievement motivation is the most important characteristic of an entrepreneur. In fact, this achievement
motivation helps a person to surmount the obstacles, suppress anxieties, repair misfortunes and device
plans for success. The academic field of entrepreneurship has evolved dramatically over the last three
decades. It has become clear that entrepreneurship can be taught. Business educators and professionals
have evolved beyond the myth that entrepreneurs are born, not made. Additional support for this view
comes from the literature reviews relating to entrepreneurship, and small-business management
education. Most of the empirical studies surveyed indicated that entrepreneurship can be taught, or at least
encouraged. In this backdrop the researcher has chosen this topic to study the achievement motivation
factors discriminating the urban, semi-urban and rural college students in Thoothukudi District.
Key words: Entrepreneurship, Achievement Motivation, Discriminant factors
Introduction
The factors that motivate an individual keep changing as one climbs the ladder of age and maturity.
And also, achievement of one goal sets the ball rolling for another one to be achieved. Thus, to be
motivated is a constant need. There are times when one faces a period of de-motivation and everything
seems bleak. It is then that they need to find what would motivate them back into action. For every
individual there is a variable driving force. In fact, it is not just a single factor, but a combination of
factors that lead people to achieve their goals. The fact is that with routine monotony steps in and then
everything seems like stagnant waters. It feels like there is nothing new. Breaking this cycle of monotony
has helped many bounce back with enthusiasm.
The entrepreneur is one of the most important inputs in the economic development of a country or
of regions within the country. Entrepreneurial competence makes all the difference in the rate of
economic growth. Entrepreneurial talent exists in all sections of the society. A high level of
entrepreneurship is found in developed economy. The growth of entrepreneur is high, but
entrepreneurship is still comparatively a scare factor in India.
Achievement motivation is the most important characteristic of an entrepreneur. In fact, this
achievement motivation helps him to surmount the obstacles, suppress anxieties, repair misfortunes and
device plans for success. The academic field of entrepreneurship has evolved dramatically over the last
three decades. It has become clear that entrepreneurship can be taught. Business educators and
professionals have evolved beyond the myth that entrepreneurs are born, not made. Additional support
for this view comes from the literature review relating to entrepreneurship, and small-business
WW
W.IC
MRR.ORG
IMPACT FACTOR VALUE: 0.615 ISSN: 2320-9704- Online ISSN:2347-1662-Print

66
Volume 2, Issue 6 (June, 2014)
INTERCONTINENTAL JOURNAL OF HUMAN RESOURCE RESEARCH REVIEW
Pee
r R
evie
wed
Jo
urn
al o
f In
ter-
Co
nti
nen
tal M
anag
emen
t R
esea
rch
Co
nso
rtiu
m
htt
p:/
/ww
w.ic
mrr
.org
management education. Most of the empirical studies surveyed indicated that entrepreneurship can be
taught, or at least encouraged. Entrepreneurial talents can be nurtured by motivating people and making
them capable of perceiving and exploiting business opportunities. Realising the importance of
entrepreneurship development the planners and policy makers have formulated Entrepreneur
Development Programmes (EDP) for various target groups of population in the country.
All the individuals are having certain qualities which help them to accomplish their task in a
desired manner. In this paper the researcher is interested to analyse the factors leading to achievement
motivation among the urban, semi-urban and rural college students.
Objectives
To examine the factors leading to achievement motivation among urban and semi-urban and rural
college students.
To identify the discriminant factors leading to achievement motivation among urban and semi-
urban and rural college students.
To summarize the findings and suggestions based on the analysis and interpretations of the study.
Scope of the study
The main aim of the study is to assess the achievement motivation of college students in
Thoothukudi district and to identify the achievement motivation factors discriminating the urban, semi-
urban and rural college students. This study was conducted among the outgoing under graduate arts and
science college students of Thoothukudi district.
Sampling
The study attempts to measure the achievement motivation of college students in Thoothukudi
district. Hence it is decided to select sample respondents from final year undergraduate students of arts
and science colleges in Thoothukudi district. Stratified proportionate random sampling method was used
to select the sample respondents from the population. The arts and science colleges were stratified in to
three categories such as urban, semi-urban and rural on the basis of place where the college is situated.
From among the final year undergraduate arts and science students ten per cent of the students were
selected from each category at random as detailed in Table 1
Table 1
Population and Sample respondents
S.No Place of College Final year undergraduate Arts and
Science students
Sample
Respondents
1 Urban 1,484 148
2 Semi-urban 2,942 294
3 Rural 1,340 134
Total 5,766 576
Methodology
The present study was based on both primary and secondary data. Interview schedule was used to
collect the primary data from the sample respondents. A well structured interview schedule was prepared
WW
W.IC
MRR.ORG
IMPACT FACTOR VALUE: 0.615 ISSN: 2320-9704- Online ISSN:2347-1662-Print

67
Volume 2, Issue 6 (June, 2014)
INTERCONTINENTAL JOURNAL OF HUMAN RESOURCE RESEARCH REVIEW
Pee
r R
evie
wed
Jo
urn
al o
f In
ter-
Co
nti
nen
tal M
anag
emen
t R
esea
rch
Co
nso
rtiu
m
htt
p:/
/ww
w.ic
mrr
.org
after consulting the experts in the field. Before finalizing the interview schedule, a pilot study was made
and with that response, final interview schedule was prepared to collect the information required for the
study. The relevant secondary data were collected from the books, journals, magazines, and published
materials. The information available in the website was also collected for the study.
Students achievement motivation
The level of students‟ achievement motivation is measured with the help of 37 variables under
eight dimensions. The mean score of each dimension among the urban, semi-urban and rural college
students have been computed separately. The one way analysis of variance has been executed to find out
the significant difference among the three groups of students towards each dimension. The results are
given in Table 2.
Table 2
Students view about the Achievement Motivation
S. No Components of Achievement
Motivation
Mean score among students F Statistics
Urban Semi-urban Rural
1 Score on academic motivation 3.8557 3.1449 3.0962 3.3991*
2 Score on need for achievement 3.8452 3.2559 3.0801 3.4208*
3 Score on academic challenge 3.9204 3.3347 3.1053 3.5173*
4 Score on attitude towards education 3.8925 3.4047 3.1509 3.4676*
5 Score on meaningfulness of task and
work methods
3.8737 3.2752 3.1379 3.2182*
6 Score on attitude towards teachers 3.6361 3.4901 3.7087 0.7389
7 Score on general interests and sports 3.6348 3.6337 3.6481 0.4551
8 Score on importance of marks 3.8786 3.3369 3.0733 3.1173*
Score on achievement motivation 3.8026 3.3684 3.2086 3.0965*
*Significant at five per cent level
Among the urban college students the highly viewed dimensions of achievement motivation are
„academic challenge‟ and „attitude towards education‟ since their mean scores are 3.9204 and 3.8925
respectively.
The highly viewed dimensions of achievement motivation among the semi-urban college students
are „general interests and sports‟ and „attitude towards teachers‟ since their mean scores are 3.6337 and
3.4901 respectively.
WW
W.IC
MRR.ORG
IMPACT FACTOR VALUE: 0.615 ISSN: 2320-9704- Online ISSN:2347-1662-Print
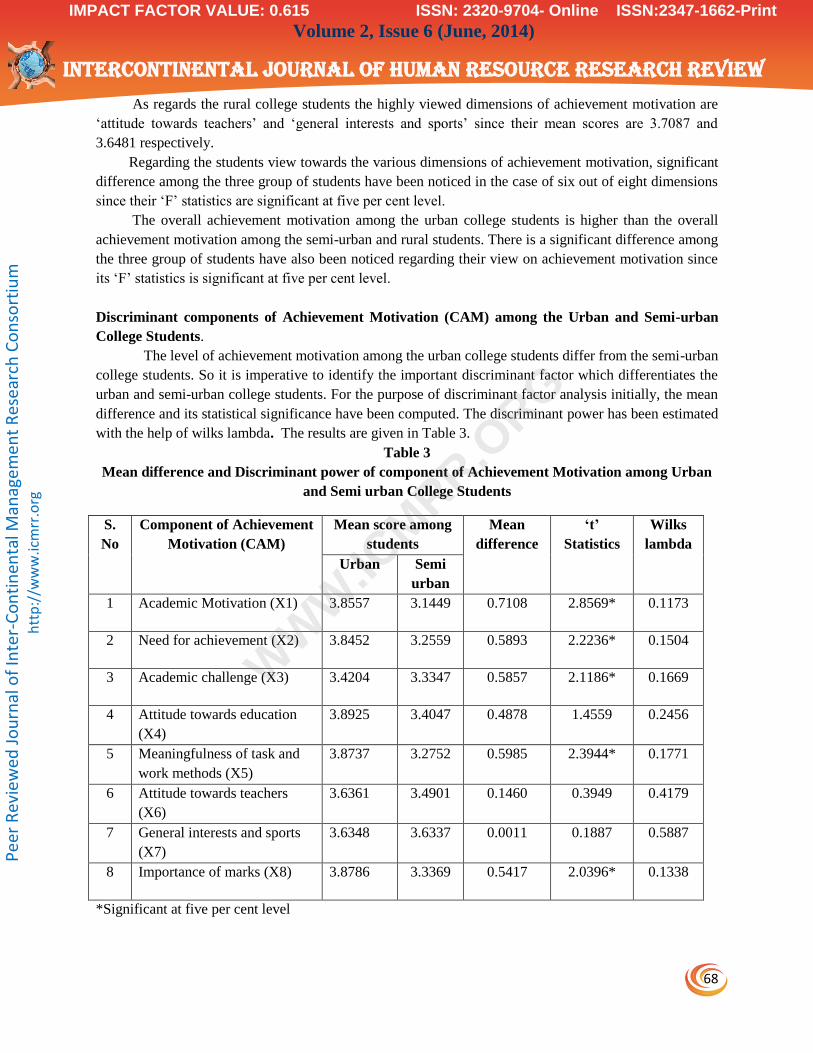
68
Volume 2, Issue 6 (June, 2014)
INTERCONTINENTAL JOURNAL OF HUMAN RESOURCE RESEARCH REVIEW
Pee
r R
evie
wed
Jo
urn
al o
f In
ter-
Co
nti
nen
tal M
anag
emen
t R
esea
rch
Co
nso
rtiu
m
htt
p:/
/ww
w.ic
mrr
.org
As regards the rural college students the highly viewed dimensions of achievement motivation are
„attitude towards teachers‟ and „general interests and sports‟ since their mean scores are 3.7087 and
3.6481 respectively.
Regarding the students view towards the various dimensions of achievement motivation, significant
difference among the three group of students have been noticed in the case of six out of eight dimensions
since their „F‟ statistics are significant at five per cent level.
The overall achievement motivation among the urban college students is higher than the overall
achievement motivation among the semi-urban and rural students. There is a significant difference among
the three group of students have also been noticed regarding their view on achievement motivation since
its „F‟ statistics is significant at five per cent level.
Discriminant components of Achievement Motivation (CAM) among the Urban and Semi-urban
College Students.
The level of achievement motivation among the urban college students differ from the semi-urban
college students. So it is imperative to identify the important discriminant factor which differentiates the
urban and semi-urban college students. For the purpose of discriminant factor analysis initially, the mean
difference and its statistical significance have been computed. The discriminant power has been estimated
with the help of wilks lambda. The results are given in Table 3.
Table 3
Mean difference and Discriminant power of component of Achievement Motivation among Urban
and Semi urban College Students
S.
No
Component of Achievement
Motivation (CAM)
Mean score among
students
Mean
difference
‘t’
Statistics
Wilks
lambda
Urban Semi
urban
1 Academic Motivation (X1) 3.8557 3.1449 0.7108 2.8569* 0.1173
2 Need for achievement (X2) 3.8452 3.2559 0.5893 2.2236* 0.1504
3 Academic challenge (X3) 3.4204 3.3347 0.5857 2.1186* 0.1669
4 Attitude towards education
(X4)
3.8925 3.4047 0.4878 1.4559 0.2456
5 Meaningfulness of task and
work methods (X5)
3.8737 3.2752 0.5985 2.3944* 0.1771
6 Attitude towards teachers
(X6)
3.6361 3.4901 0.1460 0.3949 0.4179
7 General interests and sports
(X7)
3.6348 3.6337 0.0011 0.1887 0.5887
8 Importance of marks (X8) 3.8786 3.3369 0.5417 2.0396* 0.1338
*Significant at five per cent level
WW
W.IC
MRR.ORG
IMPACT FACTOR VALUE: 0.615 ISSN: 2320-9704- Online ISSN:2347-1662-Print
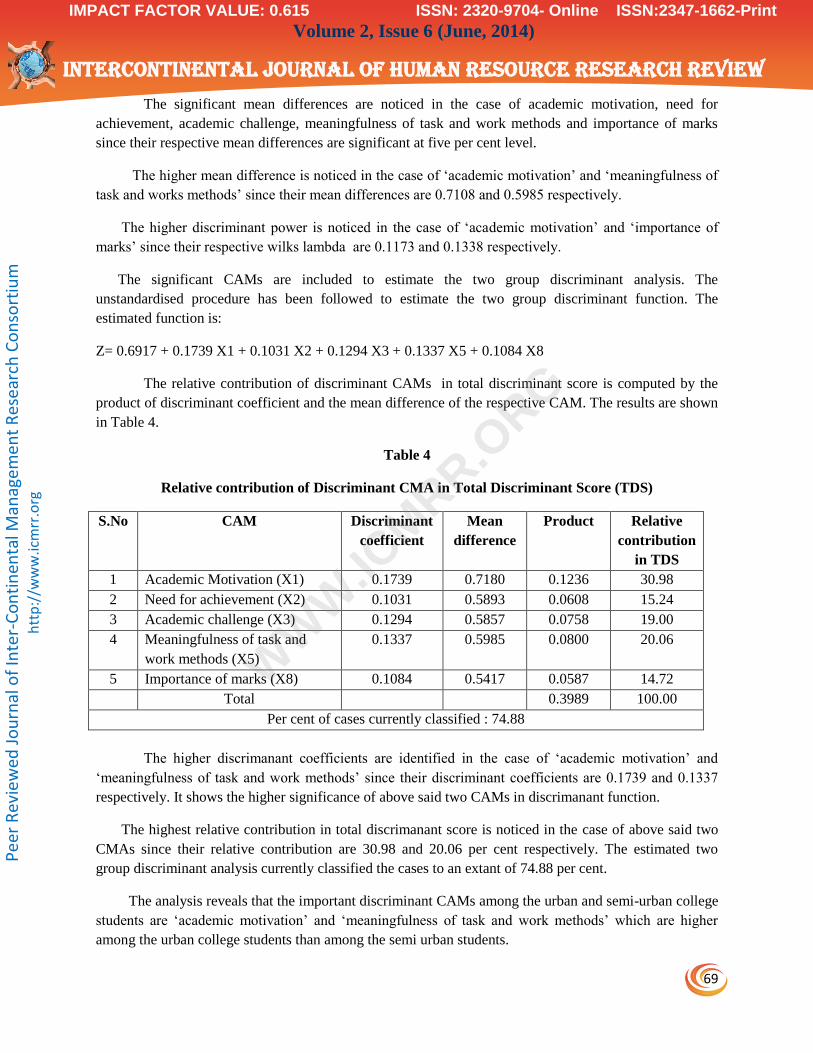
69
Volume 2, Issue 6 (June, 2014)
INTERCONTINENTAL JOURNAL OF HUMAN RESOURCE RESEARCH REVIEW
Pee
r R
evie
wed
Jo
urn
al o
f In
ter-
Co
nti
nen
tal M
anag
emen
t R
esea
rch
Co
nso
rtiu
m
htt
p:/
/ww
w.ic
mrr
.org
The significant mean differences are noticed in the case of academic motivation, need for
achievement, academic challenge, meaningfulness of task and work methods and importance of marks
since their respective mean differences are significant at five per cent level.
The higher mean difference is noticed in the case of „academic motivation‟ and „meaningfulness of
task and works methods‟ since their mean differences are 0.7108 and 0.5985 respectively.
The higher discriminant power is noticed in the case of „academic motivation‟ and „importance of
marks‟ since their respective wilks lambda are 0.1173 and 0.1338 respectively.
The significant CAMs are included to estimate the two group discriminant analysis. The
unstandardised procedure has been followed to estimate the two group discriminant function. The
estimated function is:
Z= 0.6917 + 0.1739 X1 + 0.1031 X2 + 0.1294 X3 + 0.1337 X5 + 0.1084 X8
The relative contribution of discriminant CAMs in total discriminant score is computed by the
product of discriminant coefficient and the mean difference of the respective CAM. The results are shown
in Table 4.
Table 4
Relative contribution of Discriminant CMA in Total Discriminant Score (TDS)
S.No CAM Discriminant
coefficient
Mean
difference
Product Relative
contribution
in TDS
1 Academic Motivation (X1) 0.1739 0.7180 0.1236 30.98
2 Need for achievement (X2) 0.1031 0.5893 0.0608 15.24
3 Academic challenge (X3) 0.1294 0.5857 0.0758 19.00
4 Meaningfulness of task and
work methods (X5)
0.1337 0.5985 0.0800 20.06
5 Importance of marks (X8) 0.1084 0.5417 0.0587 14.72
Total 0.3989 100.00
Per cent of cases currently classified : 74.88
The higher discrimanant coefficients are identified in the case of „academic motivation‟ and
„meaningfulness of task and work methods‟ since their discriminant coefficients are 0.1739 and 0.1337
respectively. It shows the higher significance of above said two CAMs in discrimanant function.
The highest relative contribution in total discrimanant score is noticed in the case of above said two
CMAs since their relative contribution are 30.98 and 20.06 per cent respectively. The estimated two
group discriminant analysis currently classified the cases to an extant of 74.88 per cent.
The analysis reveals that the important discriminant CAMs among the urban and semi-urban college
students are „academic motivation‟ and „meaningfulness of task and work methods‟ which are higher
among the urban college students than among the semi urban students.
WW
W.IC
MRR.ORG
IMPACT FACTOR VALUE: 0.615 ISSN: 2320-9704- Online ISSN:2347-1662-Print
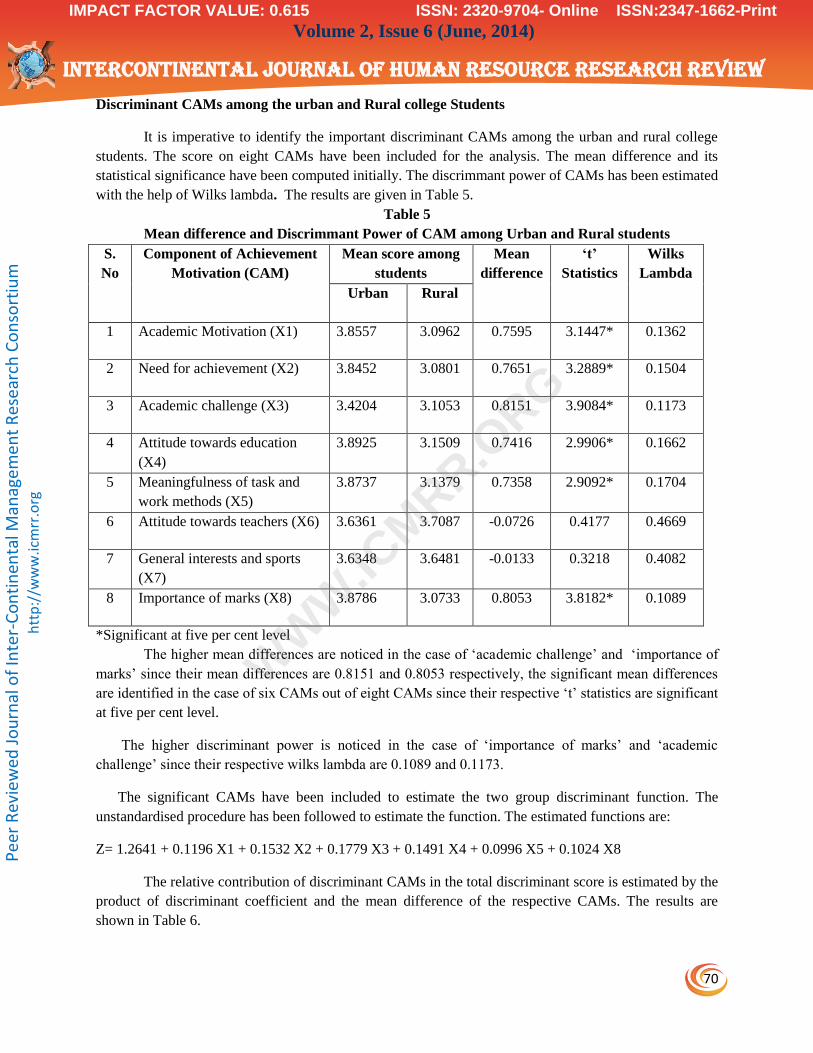
70
Volume 2, Issue 6 (June, 2014)
INTERCONTINENTAL JOURNAL OF HUMAN RESOURCE RESEARCH REVIEW
Pee
r R
evie
wed
Jo
urn
al o
f In
ter-
Co
nti
nen
tal M
anag
emen
t R
esea
rch
Co
nso
rtiu
m
htt
p:/
/ww
w.ic
mrr
.org
Discriminant CAMs among the urban and Rural college Students
It is imperative to identify the important discriminant CAMs among the urban and rural college
students. The score on eight CAMs have been included for the analysis. The mean difference and its
statistical significance have been computed initially. The discrimmant power of CAMs has been estimated
with the help of Wilks lambda. The results are given in Table 5.
Table 5
Mean difference and Discrimmant Power of CAM among Urban and Rural students
S.
No
Component of Achievement
Motivation (CAM)
Mean score among
students
Mean
difference
‘t’
Statistics
Wilks
Lambda
Urban Rural
1 Academic Motivation (X1) 3.8557 3.0962 0.7595 3.1447* 0.1362
2 Need for achievement (X2) 3.8452 3.0801 0.7651 3.2889* 0.1504
3 Academic challenge (X3) 3.4204 3.1053 0.8151 3.9084* 0.1173
4 Attitude towards education
(X4)
3.8925 3.1509 0.7416 2.9906* 0.1662
5 Meaningfulness of task and
work methods (X5)
3.8737 3.1379 0.7358 2.9092* 0.1704
6 Attitude towards teachers (X6) 3.6361 3.7087 -0.0726 0.4177 0.4669
7 General interests and sports
(X7)
3.6348 3.6481 -0.0133 0.3218 0.4082
8 Importance of marks (X8) 3.8786 3.0733 0.8053 3.8182* 0.1089
*Significant at five per cent level
The higher mean differences are noticed in the case of „academic challenge‟ and „importance of
marks‟ since their mean differences are 0.8151 and 0.8053 respectively, the significant mean differences
are identified in the case of six CAMs out of eight CAMs since their respective „t‟ statistics are significant
at five per cent level.
The higher discriminant power is noticed in the case of „importance of marks‟ and „academic
challenge‟ since their respective wilks lambda are 0.1089 and 0.1173.
The significant CAMs have been included to estimate the two group discriminant function. The
unstandardised procedure has been followed to estimate the function. The estimated functions are:
Z= 1.2641 + 0.1196 X1 + 0.1532 X2 + 0.1779 X3 + 0.1491 X4 + 0.0996 X5 + 0.1024 X8
The relative contribution of discriminant CAMs in the total discriminant score is estimated by the
product of discriminant coefficient and the mean difference of the respective CAMs. The results are
shown in Table 6.
WW
W.IC
MRR.ORG
IMPACT FACTOR VALUE: 0.615 ISSN: 2320-9704- Online ISSN:2347-1662-Print
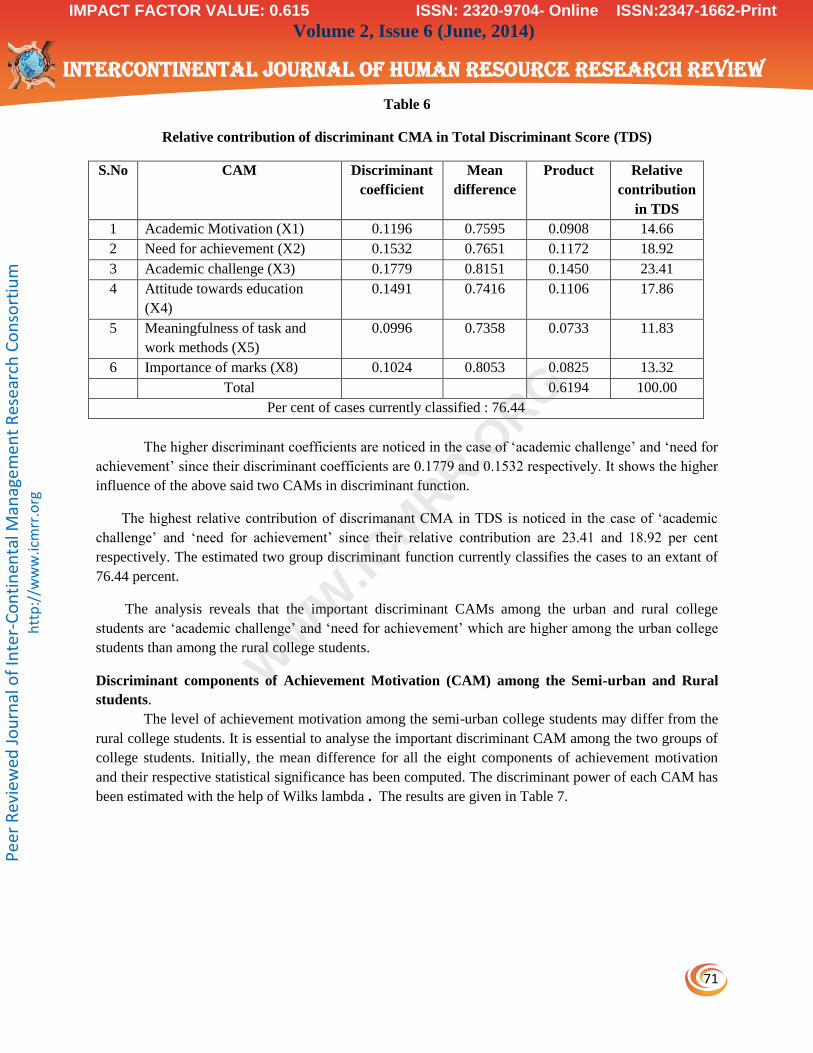
71
Volume 2, Issue 6 (June, 2014)
INTERCONTINENTAL JOURNAL OF HUMAN RESOURCE RESEARCH REVIEW
Pee
r R
evie
wed
Jo
urn
al o
f In
ter-
Co
nti
nen
tal M
anag
emen
t R
esea
rch
Co
nso
rtiu
m
htt
p:/
/ww
w.ic
mrr
.org
Table 6
Relative contribution of discriminant CMA in Total Discriminant Score (TDS)
S.No CAM Discriminant
coefficient
Mean
difference
Product Relative
contribution
in TDS
1 Academic Motivation (X1) 0.1196 0.7595 0.0908 14.66
2 Need for achievement (X2) 0.1532 0.7651 0.1172 18.92
3 Academic challenge (X3) 0.1779 0.8151 0.1450 23.41
4 Attitude towards education
(X4)
0.1491 0.7416 0.1106 17.86
5 Meaningfulness of task and
work methods (X5)
0.0996 0.7358 0.0733 11.83
6 Importance of marks (X8) 0.1024 0.8053 0.0825 13.32
Total 0.6194 100.00
Per cent of cases currently classified : 76.44
The higher discriminant coefficients are noticed in the case of „academic challenge‟ and „need for
achievement‟ since their discriminant coefficients are 0.1779 and 0.1532 respectively. It shows the higher
influence of the above said two CAMs in discriminant function.
The highest relative contribution of discrimanant CMA in TDS is noticed in the case of „academic
challenge‟ and „need for achievement‟ since their relative contribution are 23.41 and 18.92 per cent
respectively. The estimated two group discriminant function currently classifies the cases to an extant of
76.44 percent.
The analysis reveals that the important discriminant CAMs among the urban and rural college
students are „academic challenge‟ and „need for achievement‟ which are higher among the urban college
students than among the rural college students.
Discriminant components of Achievement Motivation (CAM) among the Semi-urban and Rural
students.
The level of achievement motivation among the semi-urban college students may differ from the
rural college students. It is essential to analyse the important discriminant CAM among the two groups of
college students. Initially, the mean difference for all the eight components of achievement motivation
and their respective statistical significance has been computed. The discriminant power of each CAM has
been estimated with the help of Wilks lambda . The results are given in Table 7.
WW
W.IC
MRR.ORG
IMPACT FACTOR VALUE: 0.615 ISSN: 2320-9704- Online ISSN:2347-1662-Print

72
Volume 2, Issue 6 (June, 2014)
INTERCONTINENTAL JOURNAL OF HUMAN RESOURCE RESEARCH REVIEW
Pee
r R
evie
wed
Jo
urn
al o
f In
ter-
Co
nti
nen
tal M
anag
emen
t R
esea
rch
Co
nso
rtiu
m
htt
p:/
/ww
w.ic
mrr
.org
Table 7
Mean difference and Discriminant Power of Achievement Motivation among
Semi-urban and Rural students
S.
No
Component of Achievement
Motivation (CAM)
Mean score among
students
Mean
difference
‘t’
Statistics
Wilks
lambda
Semi
urban
rural
1 Academic Motivation (X1) 3.8557 3.0962 0.7595 3.0542* 0.1663
2 Need for achievement (X2) 3.8452 3.0801 0.7651 3.2673* 0.1504
3 Academic challenge (X3) 3.9204 3.1053 0.8151 3.8084* 0.1667
4 Attitude towards education
(X4)
3.8925 3.1509 0.7416 2.9911* 0.1391
5 Meaningfulness of task and
work methods (X5)
3.8737 3.1379 0.7358 2.7334* 0.1492
6 Attitude towards teachers (X6) 3.6361 3.7087 -0.0726 -0.7919 0.4919
7 General interests and sports
(X7)
3.6348 3.6481 -0.0133 -0.3994 0.4033
8 Importance of marks (X8) 3.8786 3.0733 0.8053 3.6696* 0.1399
*Significant at five per cent level
The significant mean differences are identified in the case of „academic motivation‟, „need for
achievement‟, „academic challenge‟, „attitude towards education‟, „meaningfulness of task and work
methods‟ since their respective „t‟ statistics are significant at five per cent level.
The higher mean difference is noticed in the case of „academic challenge‟ and „important of marks‟
since their mean differences are 0.8151 and 0.8053 respectively.
The significant CAM are included to estimate the two group discriminant function. The estimated
functions are:
Z= 0.4092 + 0.1688 X1 + 0.1792 X2 + 0.2042 X3 + 0.1984 X + 0.0947 X5 + 0.0459 X8
The relative contribution of discriminant CAM in total discriminant score is estimated by the
product of discriminant coefficient and the mean difference of the respective CAM. The results are shown
in Table 8
WW
W.IC
MRR.ORG
IMPACT FACTOR VALUE: 0.615 ISSN: 2320-9704- Online ISSN:2347-1662-Print

73
Volume 2, Issue 6 (June, 2014)
INTERCONTINENTAL JOURNAL OF HUMAN RESOURCE RESEARCH REVIEW
Pee
r R
evie
wed
Jo
urn
al o
f In
ter-
Co
nti
nen
tal M
anag
emen
t R
esea
rch
Co
nso
rtiu
m
htt
p:/
/ww
w.ic
mrr
.org
Table 8
Relative contribution of discriminant CMA in Total Discriminant Score (TDS)
S.No CAM Discriminant
coefficient
Mean
difference
Product Relative
contribution
in TDS
1 Academic Motivation (X1) 0.1688 0.7595 0.1282 18.78
2 Need for achievement (X2) 0.1792 0.7651 0.1371 20.08
3 Academic challenge (X3) 0.2042 0.8151 0.1664 24.37
4 Attitude towards education
(X4)
0.1948 0.7416 0.1445 21.16
5 Meaningfulness of task and
work methods (X5)
0.0947 0.7358 0.0697 10.21
6 Importance of marks (X8) 0.0459 0.8053 0.0369 5.40
Total 0.6828 100.00
Per cent of cases currently classified : 81.08
The higher discriminant coefficients are noticed in the case of „academic challenges‟ and
„attitude towards education‟ since their discriminant coefficients are 0.2042 and 0.1948 respectively. It
shows the higher significance of the above said two CAMs in discriminant function.
The highest relative contribution of CAM in TDS is noticed in the case of „academic challenge‟
and „attitude towards education‟ since their relative contribution are 24.37 and 21.16 per cent
respectively. The estimated two group discriminant analysis currently classified the cases to an extant of
81.08 percent.
The analysis reveals that the important discriminant factor relating to achievement motivation
among the semi-urban and rural college students are „academic challenge‟ and „attitude towards
education‟ which are higher among the semi-urban college students than the rural college students.
FINDINGS
Findings relating to Achievement Motivation
It is observed that the highly viewed components of achievement motivation by the urban college
students are „academic challenge‟ and „attitude towards education‟ since their mean score are
3.9204 and 3.8925 respectively.
As regards the semi-urban college students, the highly viewed components of achievement
motivation are „general interests and sports‟ and „attitude towards teachers‟ since their mean score
are 3.6337 and 3.4901 respectively.
Among the rural college students the highly viewed components of achievement motivation are
„attitude towards teachers‟ and „general interests and sports‟ since their mean score are 3.7087
and 3.6481 respectively.
WW
W.IC
MRR.ORG
IMPACT FACTOR VALUE: 0.615 ISSN: 2320-9704- Online ISSN:2347-1662-Print

74
Volume 2, Issue 6 (June, 2014)
INTERCONTINENTAL JOURNAL OF HUMAN RESOURCE RESEARCH REVIEW
Pee
r R
evie
wed
Jo
urn
al o
f In
ter-
Co
nti
nen
tal M
anag
emen
t R
esea
rch
Co
nso
rtiu
m
htt
p:/
/ww
w.ic
mrr
.org
Significant difference has been noticed among the three groups of college students in respect of
achievement motivation. They are academic motivation, need for achievement, academic
challenge, attitude towards education, meaningfulness of task and work methods and importance
of marks since their „F‟ statistics are significant at five per cent level.
The overall achievement motivation among the urban college students is higher than the semi-
urban and rural college students.
Discriminant factors of Achievement motivation among the urban and semi- urban students
It is observed that discriminant power of achievement motivation among the urban and semi-
urban group of respondents significant mean difference are noticed in the case of academic
motivation, need for achievement, academic challenge, meaningfulness of task and work methods
and importance of marks as their „t‟ statistics are significant at five per cent level.
The higher discriminant coefficient is identified in the case of academic motivation since its
discriminant coefficient is 0.1739. The analysis reveals that the important discriminant
achievement motivation component among the urban and semi-urban respondents is „academic
motivation‟ which is higher among the urban students than the semi-urban students.
Discriminant factors of Achievement Motivation among the urban and rural students
It is identified that discriminant power of achievement motivation among the urban and rural
group of respondents significant mean difference are noticed in the case of academic
motivation, need for achievement, academic challenge, attitude towards education,
meaningfulness of task and work methods and importance of marks since their „t‟ statistics are
significant at five per cent level.
The higher discriminant coefficient is identified in the case of academic challenge since its
discriminant coefficient is 0.1779. The analysis reveals that the important discriminant
achievement motivation component among the urban and rural students is „academic challenge‟
which is higher among the urban students than the rural students.
Discriminant factors of Achievement motivation among the semi-urban and rural students
It is found that discriminant power of component of achievement motivation among the semi-
urban and rural group of respondents significant mean difference is noticed in the case of
academic motivation, need for achievement, academic challenge, attitude towards education,
meaningfulness of task and work methods and importance of marks since their „t‟ statistics are
significant at five per cent level.
The higher discriminant coefficient is identified in the case of academic challenge since its
discriminant coefficient is 0.2042. The analysis reveals that the important discriminant
achievement motivation component among the semi-urban and rural students is „academic
challenge‟ which is higher among the semi-urban students than the rural students.
Suggestion
While comparing urban and semi-urban college students the semi-urban college students are not
giving much important to enrich their knowledge, so the teachers should give more attention to
the semi-urban students.
WW
W.IC
MRR.ORG
IMPACT FACTOR VALUE: 0.615 ISSN: 2320-9704- Online ISSN:2347-1662-Print
75
Volume 2, Issue 6 (June, 2014)
INTERCONTINENTAL JOURNAL OF HUMAN RESOURCE RESEARCH REVIEW
Pee
r R
evie
wed
Jo
urn
al o
f In
ter-
Co
nti
nen
tal M
anag
emen
t R
esea
rch
Co
nso
rtiu
m
htt
p:/
/ww
w.ic
mrr
.org
While comparing urban and rural college students the rural college students are not interested to
get excellent results in academic competition, so the teachers should make them to realize the
important of results in every activity.
While comparing semi-urban and rural college students the rural college students are incapable to
find a solution to problems, so the teachers should improve analytical skill of rural students by
offering some practical exposure.
Conclusion
The present study concluded that the factors leading to achievement motivation are differing among
the urban, semi-urban, and rural college students. It reveals the motivation the students are getting in their
respective colleges. The environment in which the students are undergoing their education will also play a
vital role in the achievement motivation of the students.
References
BOOKS
Albert Shapero, Entrepreneurship and Economic Development. Wisconsin: Project ISEED, LTD., The
Center of Venture Management, Summer 1975.
Baldev Singh, Self-Employment Through Entrepreneurship Development, MD Publication Pvt. Ltd., New
Delhi, 1996.
Khanka, S.S., Entrepreneurship in Small Scale Industries, Educational Publishers, New Delhi, 1990.
Nalinaksha Mutsuddi, You too Can Become an Entrepreneur, Wheeler Publishing, New Delhi, 1996.
Takey, N., Perryman, S. and Connor, H., Graduated Business Start-ups, Institute for Employment Studies,
UK, 1999.
Tondon, B.C., Environment and Entrepreneur. Allahabad: Chugh Publications, 1975.
Sayigh, Y.A., Entrepreneurs of Lebanon: The role of the Business Leaser in a Developing Economy,
Cambridge: Harvard University Press, 1962.
JOURNALS
Brockhaus, R.H., “Risk-taking Propensity of Entrepreneurs”, Academy of Management Journal, 3,
September 1980.
Gartner, W.B., “Who is an Entrepreneur? Is the wrong Question?” American Journal of Small Business,
12:11-22, 1988.
Charney, A., and LIbecap. G., “Impact of Entrepreneurship Education”, Insights: A Kauffman Research
Series. Kauffman Center for Entrepreneurship Leadership, 2000.
Cowling, M., ans Taylor, M., “Entrepreneurial Women and Men: Two Different Species?” Small
Business Economics, 16 (3), 2001.
Hunnu Littunen, “Entrepreneurship and Characteristics of the Entrepreneurial Presonality”, International
Journal of Entrepreneurial Behaviour and Research, Vol.6, No 6, 2000.
WW
W.IC
MRR.ORG
IMPACT FACTOR VALUE: 0.615 ISSN: 2320-9704- Online ISSN:2347-1662-Print
76
Volume 2, Issue 6 (June, 2014)
INTERCONTINENTAL JOURNAL OF HUMAN RESOURCE RESEARCH REVIEW
Pee
r R
evie
wed
Jo
urn
al o
f In
ter-
Co
nti
nen
tal M
anag
emen
t R
esea
rch
Co
nso
rtiu
m
htt
p:/
/ww
w.ic
mrr
.org
Hornaday, J.A., and Bunker, C.S., “The nature of the Entrepreneur”, Personnel Psychology, 23, 1970.
Kolvereid, L. and Moen, O., “Entrepreneurship among Business Graduates: Does a Major in a
entrepreneurship make a difference?” Journal of European Industrial Training, 21 (4-5), 1997.
Kulwinder Singh, Study of Achievement Motivation in Relation to Academic Achievement of Students,
International Journal of Educational Planning & Administration, Volume 1, Number 2 (2011), pp. 161-
171
Patel, V.G., “Entrepreneurs are made not born”, Economic Times, July 1990.
Stephen L. Muller, “Gender Gaps in Potential for Entrepreneurship Across Countries and Cultures”,
Journal of Developmental Entrepreneurship, Vol.9, No.3, December 2004.
Yonca Gurol and Nuray Astan, “Entrepreneurial Characteristics amongst University Students – Some
Insights for Entrepreneurship Education and Training in Turkey”, Emerald, Vol.48,No.4, 2006.
WW
W.IC
MRR.ORG
IMPACT FACTOR VALUE: 0.615 ISSN: 2320-9704- Online ISSN:2347-1662-Print
Copyright © 2022 FDOKUMEN