
a study on financial analysis of top five e- commerce ...
74
1 “A STUDY ON FINANCIAL ANALYSIS OF TOP FIVE E- COMMERCE COMPANIES IN INDIA” Project Report submitted to CHRIST COLLEGE (AUTONOMOUS), IRINJALAKUDA In partial fulfilment of the requirement for the award of the degree of BACHELOR OF COMMERCE Submitted by ATHITH HARIDAS (CCASBCM088) Under the supervision of Prof. P.G. THOMAS DEPARTMENT OF COMMERCE CHRIST COLLEGE (AUTONOMOUS), IRINJALAKUDA MARCH 2021
-
Upload
khangminh22 -
Category
Documents
-
view
0 -
download
0
Transcript of a study on financial analysis of top five e- commerce ...
1
“A STUDY ON FINANCIAL ANALYSIS OF TOP FIVE E-COMMERCE COMPANIES IN INDIA”
Project Report submitted to
CHRIST COLLEGE (AUTONOMOUS), IRINJALAKUDA
In partial fulfilment of the requirement for the award of the degree of
BACHELOR OF COMMERCE
Submitted by
ATHITH HARIDAS
(CCASBCM088)
Under the supervision of
Prof. P.G. THOMAS
DEPARTMENT OF COMMERCE
CHRIST COLLEGE (AUTONOMOUS), IRINJALAKUDA
MARCH 2021
2
CHRIST COLLEGE (AUTONOMOUS), IRINJALAKUDA
CALICUT UNIVERSITY
DEPARTMENT OF COMMERCE
CERTIFICATE
This is to verify that the project report entitled “A STUDY ON
FINANACIAL
ANALYSIS OF TOP 5 E-COMMERCE COMPANIES IN INDIA” is a bonafide record of project done by Athith Haridas, Reg. No. CCASBCM088,
under my guidance and supervision in partial fulfilment of the requirement for
the award of the degree of BACHELOR OF COMMERCE and it has not
previously formed the basis for any Degree, Diploma and Associateship or
Fellowship.
Prof. Joseph Prof. P. G. Thomas Co-Ordinator Project guide
3
DECLARATION
I, Athith Haridas, hereby declare that the project work entitled “A STUDY
ON FINANCIAL ANALYSIS OF TOP 5 E-COMMERCE COMPANIES
IN INDIA” is a record of independent and bonafide project work carried out
by me under the supervision and guidance of Prof. P.G. Thomas, Asst.
Professor-On contract, Department of Commerce and Management Studies,
Christ College, Irinjalakuda.
The information and data given in the report is authentic to the best of my
knowledge. The report has not been previously submitted for the award of any
Degree, Diploma, Associateship or other similar title of any other university or
institute.
Place: Irinjalakuda Athith Haridas
Date: CCASBCM088
4
ACKNOWLEDGEMENT
I would like to take the opportunity to express my preferred thanks and
gratitude to all people who have helped me with sound advice and able
guidance. Above all, I express my eternal gratitude to the Lord Almighty under
whose divine guidance; I have been able to complete this work successfully.
I would like to express my sincere obligation to Fr. Dr. Jolly Andrews,
Principal, Christ College, Irinjalakuda for providing various facilities.
I am thankful to Prof. Joseph, Co-ordinator of the Department, for providing
proper help and encouragement in the preparation of this report.
I am thankful to my class teacher, Prof. Lipin Raj, and Asst. Professor-On
contract, Prof. Thomas for providing proper help and encouragement in the
preparation of this report. I express my sincere gratitude to Prof Thomas, Asst.
Professor-On contract, whose guidance and support throughout the training
period helped me to complete this work successfully.
I would like to express my preferred gratitude to all the faculties of the
department for their interest and cooperation in this regard. I extend my hearty
gratitude to the librarian and other library staffs of my college for their
wholehearted cooperation. I express my sincere thanks to my friends and
family for their support in completing this report successfully.
Place: Irinjalakuda Athith Haridas
Date: CCASBCM088
5
Table of Contents
SL No.
Contents
Page No.
List of tables
Chapter 1 Introduction
Chapter 2 Review of Literature
Chapter 3 Industry profile
Chapter 4 Data analysis
Chapter 5 Findings, suggestions and
conclusions

6
Chapter-1 Introduction
7
1.1. Introduction Although the internet appeared in the late 1960s, e-commerce took off with the
arrival of the World Wide Web and browsers in the early 1990s.This
emergence of e-commerce has brought tremendous changes in how companies
compete in today’s new economy. Though all the companies fall in the stride of
ecommerce, small and Medium size enterprises can now overcome basic
limitations which are in terms of size, machinery, human resources etc.
There is an urgent need to resort to e-commerce utilisation as it can provide
substantial benefits to the enterprises via improved efficiencies and raised
revenues. E-commerce has transformed the way business is done in India. The
Indian E-commerce market is expected to grow to US $200 billion by 2026
from US $38.5 billion as of 2017.
Much of the growth for the industry has been triggered by an increase in
internet and smartphone penetration. Since 2014, the Government of India has
announced various initiatives, namely Digital India, Make in India, Start-up
India, Skill India and Innovation Fund. E-commerce is defined as the activity
of buying and selling of goods and services on online services or over the
internet.
Transaction of money, funds, and data are also considered as E-commerce.
These business transactions can be done in four ways: Business to Business
(B2B), Business to Customer (B2C), Customer to Customer (C2C), Customer
to Business (C2B). The Ministry of Telecommunication has been promoting
the data communication through the establishment of Software Technology
8
Parks of India (Shridhar, 2006), Science Parks and Technology Incubators have
been developed (by the Department of Science and Technology) to promote
this innovation.
The power of e-commerce should not be underestimated as it continues to
pervade everyday life and present significant opportunities for small, medium,
and large businesses and online investors. You don’t need to look far to see the
potential of e-commerce businesses.
Managing an online storefront is far cheaper than an offline, brick and mortar
store. Typically less staff are required to manage an online shop as web-based
management systems enable owners to automate inventory management and
warehousing is not necessarily required (as we discuss later). As such,
ecommerce business owners can afford to pass operational cost savings on to
consumers (in the form of product or service discounts) whilst protecting their
overall margin. Furthermore, with the rise of price comparison websites,
consumers have more transparency with regard to prices and are able to shop
around, typically purchasing from online outlets instead.
Unlike many offline stores, consumers can access e-commerce websites 24
hours a day. Customers can read about services, browse products and place
orders whenever they wish. In that sense, online shopping is extremely
convenient and gives the consumer more control. Furthermore, those living in
more remote areas are able to order from their home at a touch of a button,
saving them time travelling to a shopping centre. For the past twenty years, the
growth of online shopping has to a large extent been based around increased
choice. With an almost endless choice of brands and products to choose from,
consumers are not limited by the availability of specific products in their local
town, city or country. Items can be sourced and shipped globally. Naturally
ecommerce has significant benefits for the consumer, but it has also been useful
for businesses too.
9
1.2 Statement of problem
The e-commerce faces many problems such as threats from hackers, software
advancements, transaction and virus risks. Also in the current Indian
ecommerce, they lack in skilled personnel. At the same time customers also
faces problems like late deliveries, difficult access to customer care and fear to
fraudulent activities. This is from my mere judgement, therefore this story can
be helpful and relevant.
1.3 Scope and Significance
The study intended to understand the financial and profitability position of the
top 5 performing ecommerce companies which helps to examine sources and
users of fund. It helps to understand about the liquidity position of the firm and
efficiency in its assets management and the strength and weakness of liquidity,
solvency and profitability. It also provides various other useful information.
1.4 Objectives of the study
1.4.1 Main objective
1. To study the financial performance of the e-commerce companies.
2. To compare the performance of 5 e-commerce companies with one
another.
1.4.2 Sub objective
1. To know the value and importance of the e-commerce companies in
today’s world.
10
1.5 Hypothesis of the study
1. E-commerce helps to create a better business environment to the
businesses.
2. The customers prefer to shop online than the traditional shopping
because there is no effort and wide variety of choices.
1.6 Research design
1.6.1 Nature of study: The study is analytical and descriptive in nature.
1.6.2 Nature of data: Secondary data is used. Secondary data uses
financial variables and accounting information.
1.6.3 Sources of data: This study used secondary data. The secondary data
is acquired from annual reports and from various company’s website.
1.6.4 Period of study: 2019-2020
1.7 Tools of analysis: the tools used for analysis is ratio analysis
1.8 Limitations of the study
1. It is not possible to show the lifetime of performance of the companies
since the study conducted is of one year.
2. The limitations of financial statements may affect the study.
11
1.9 Chapterisation
• Chapter 1: Introduction
• Chapter 2: Review of literature
• Chapter 3: Industry Profile
• Chapter 4: Data analysis
• Chapter 5: Findings, suggestions and conclusion

12
Chapter 2 Review of Literature
13
Review of literature
A literature review is a description of the literature relevant to a particular field
or topic. It gives an overview of what has been said, who the key writers are,
what are the prevailing theories and hypotheses, what questions are being
asked, and what methods and methodologies are appropriate and useful.
A literature review is not just a summary of everything you have read on the
topic. It is a critical analysis of the existing research relevant to your topic, and
you should show how the literature relates to your topic and identify any gaps
in the area of research.
2.1 Conceptual Review Meaning Financial analysis is the process of evaluating a company's financial statements
for determining the performance and the decision-making purposes. External
stakeholders use it to understand the overall health of an organization as well as
to evaluate financial performance and business value. Internal constituents use it
as a monitoring tool for managing the finances.
Objectives of Financial Analysis:
1. Reviewing the performance of a company over the past periods
To predict the future prospects of the company, past performance is analysed.
Past performance is analysed by reviewing the trend of past sales, profitability,
cash flows, return on investment, debt-equity structure, operating expenses, etc.
14
2. Assessing the current position & operational efficiency
Examining the current profitability & operational efficiency of the enterprise so
that the financial health of the company can be determined. For long-term
decision making, assets & liabilities of the company are reviewed. Analysis helps
in finding out the earning capacity & operating performance of the company.
3. Predicting growth & profitability prospects
The top management is concerned with future prospects of the company.
Financial analysis helps them in reviewing the investment alternatives for
judging the earning potential of the enterprise. With the help of financial
statement analysis, assessment and prediction of the bankruptcy and probability
of business failure can be done.
4. Loan Decision by Financial Institutions and Banks
Financial analysis helps the financial institutions, loan agencies & banks to
decide whether a loan can be given to the company or not. It helps them in
determining the credit risk, deciding the terms and conditions of a loan if
sanctioned, interest rate, maturity date etc.
Limitations of financial analysis:
1. Not a Substitute of Judgement
An analysis of financial statement cannot take place of sound judgement. It is
only a means to reach conclusions. Ultimately, the judgements are taken by an
interested party or analyst on his/ her intelligence and skill.
15
2.Based on Past Data
Only past data of accounting information is included in the financial statements,
which are analysed. The future cannot be just like past. Hence, the analysis of
financial statements cannot provide a basis for future estimation, forecasting,
budgeting and planning.
3.Problem in Comparability
The size of business concern is varying according to the volume of transactions.
Hence, the figures of different financial statements lose the characteristic of
comparability.
4.Reliability of Figures
Sometimes, the contents of the financial statements are manipulated by window
dressing. If so, the analysis of financial statements results will be misleading or
meaningless.
Advantages of financial analysis:
1.Review of cash flow
It shows the financial solvency and the ability of the company to pay liabilities
to pay its liabilities. The statement of cash flow statement breaks the statement
into operating, investing, and financial parts. A review of cash flow helps us
understand whether the business is operating under a cyclical revenue stream
structure or consistent revenue model. This also helps the business to maintain
and keep the expenditure of business inline within the revenue model it operates
in.
16
2.Review of liability
Financial statements presents the short and long-term obligations of the business.
If the owner wants to expand his business, he must look at the statements of
financial position and deduce the logic as to whether he should reduce existing
liabilities to apply for further capital expansion. Lenders look at the financial
statements and determine the prospect of business on the basis of revenues,
assets, and liabilities.
3.Review of inventory and its movement
The levels of opening and closing stock as a percentage of purchase and sales
along with the changes and movements in the levels of stock throughout the year
shows the ability and nature of goods of the business. It shows whether the goods
are in demand, fast-moving or slow-moving or change in the trend of sales and
so on. When the goods are slow-moving as compared to industry, it is considered
as a negative for the business prospect and growth.
4.Identification of trends
The business owner should prepare and compare financial statements over
various periods so as to identify the trend in business. This helps the business in
knowing what products are selling well, what segments are growing well, and
which segment of business needs further review and re-investment or complete
exit at once. Trends are the gospel in the performance of the business. Identifying
trends is, therefore, a necessity for the business to sustain the growth and achieve
higher profits.
17
2.2 Empirical literature:
Shaheena Sultana, 2017: This paper contains a brief discussion of search engine
marketing and e-commerce companies, literature survey, current and future
prospect, comparative study of e-commerce in India perspective on online
shopping. The buzzword e-Commerce is spreading widely in the present world
by its simple applications. The basic objective of this review paper is actually
exploring the difference between the traditional & online shopping and the
effectiveness of e- Commerce in India. From the research, we can come to a
conclusion that convenience and time are the main attributes for making the
decision to shop online rather than traditional shopping in India and we also
found out that young consumers are more comfortable and satisfied to make
online purchases.
S. Subashini, 2016: The purpose of the study is to identify and examine the
drivers of e-commerce business. Perceived value, attitude, customer satisfaction
and loyalty are studied as the drivers of e-commerce business in this research
article. Methods/Statistical Analysis: A deductive approach is used in this
research, which attempts to understand the theory first and the data collected is
tested. A questionnaire form of survey is chosen for the study. The attitude
formed through this value enhances online buying behaviour. The research
projects a positive attitude towards the buying behaviour. This article brings out
the importance of perceived value, attitude, customer satisfaction and customer
loyalty in the e-commerce business sector. There is a significant positive effect
of online customer satisfaction on customer loyalty. The e-commerce businesses,
in order to succeed, must have greater focus on the perceived value and customer
satisfaction. This paper contributes to the enhancement of online customer
relationship pertaining to e-commerce.
18
Dr. Anukrati Sharma ,2013:The article entitled “A study on E-commerce and
Online Shopping: Issues and Influences”. In this article an attempt is made to
study the recent trends, influences, preferences of customers towards
Ecommerce and online shopping and to give the suggestions for the
improvement in online shopping websites. The study found that, most of the
people who are engaged in making the decision of purchasing are in the age of
21-30 years. While making the websites for online shopping it must be designed
in a very planned and strategic way.
Abhijit Mitra ,2013:The article entitled “E-Commerce in India-A review”. In
this article an attempt is made to study the present status and facilitators of
ECommerce in India, analyse the present trends of E-Commerce in India and
examine the barriers of E-Commerce in India. The study found that, there has
been a rise in the number of companies taking up E-Commerce in the recent past.
The study also found that, major Indian portal sites have also shifted towards
ECommerce instead of depending on advertising revenue.
Nisha Chanana and Sangeeta Goele, 2012: The article entitled “Future of
Ecommerce in India”. In this article an attempt is made to study the overview of
the future of E-commerce in India and discusses the future growth segments in
India’s of E-commerce. The study found that, various factors that were essential
for future growth of Indian E-commerce. The study also found that, the overall
E-commerce will increase exponentially in coming years in the emerging market
of India.
19
Sarbapriya Ray 2011:The article entitled “Emerging Trends of E-commerce in
India: Some Crucial Issues Prospects and Challenges”. In this article an attempt
is made to present a snapshot of the evolution of E-commerce business indicating
the chronological order, category of E-commerce business, description of
organizations involved in E-business in India. The study found that, the role of
government should be to provide a legal framework for E-commerce so that
while domestic and international trade are allowed to expand their horizons,
basic rights such as privacy, intellectual property, prevention of fraud, consumer
protection etc are all taken care-of.
Aditi Srivatsan, 2001:The world has witnessed a rather colossal change and
shift in the information technology which has introduced the concept of
marketing that operates in the absence of any physical contact between the buyer
and the seller. The entire transaction is carried out online, with the help of a
computer coupled with associated hardware and software facilities. The internet
has been a reliable and useful medium for any sort of interaction, and has hence
percolated into the core functioning of tasks. Transacting or facilitating business
on the internet is referred to as e-commerce (Electronic communication). The
concept of buying and selling online is said to be the crux idea of e-commerce.
The primary benefits of this mode of exchange revolve around the fact that it
eliminates limitations of time and geographical distance. In the process,
ecommerce usually streamlines operations at lowers costs. E-commerce as a
mode of transacting isn‘t confined to the four walls of an edifice, but is contained
within webbed accounts and transactions. This paper aims to discuss the various
aspects and features of e-commerce by focusing our attention on the eight major
e-commerce companies currently operating in India.
20
Rajendra Sarode, 2003: The paper entitled attempts to study the business
options available in the future with a paradigm shift in the ecommerce industry
keeping in mind the tremendous growth in the sector. The study shows the
current status as well as the future growth. It also examines the major challenges
and barriers faced. The study shows India’s overall retail opportunities and some
serious challenges faced by the same.
Dr Rajeshwari Shettar,2004:Attempted to study and analyse the completely
revolutionized mode of business and the various factors responsible for the
growth of ecommerce in India. It also talks about the advantages and
opportunities of ecommerce and its effects on various retailers, people, producers
and wholesalers. The study found that, producers can directly sell goods to a few
retailers and customers, threatening the existence of wholesaler and retailers.
Pandey.M, 2003: E-commerce firms either sell physical products or
information-based products or services. Consistent with the theory, the findings
of this study confirm that the information goods/service-based business model
has a better or higher valuation (price-to-sales ratio or PSR) compared to physical
goods-based model. However, the valuation gap between both types of business
models reduced over years and became insignificant in the year 2001, which is
the year after the dot-com meltdown. Further, we do not have any evidence of a
difference in their strategy of spending on sales and marketing activities. The
results of the study do confirm that young E-commerce (irrespective of the
business model) start-ups tend to spend a larger percentage of their capital on
marketing and advertising activities than the relatively older firms. This is
consistent with their strategy of building brands on the Internet so as to capture
the first-mover advantage, which is critical for the Internet technology-based E-
commerce companies. We find a negative relationship between marketing
expense-to-revenue ratio and profit margin. The study does not reveal a
significantly strong relationship of price-to-sales ratio with size, or marketing-
to-revenue ratio, or profit margin. It appears that PSR is driven by non-financial
considerations.

21
Chapter 3 Industry profile
22
3.1 E-Commerce Companies in India The online business industry is well established in India. And, everyday some
or the other new player is taking a plunge. Though, a major contribution to its
growth is provided by e-commerce industry. Even so, not many understand the
intricacies involved in e-commerce industry. Some e-commerce portals provide
almost all categories of goods and services under one roof, targeting customers
of every possible products and services. Indian e-commerce portals provide
products like apparel and accessories for men and women, health and beauty
products, books and magazines, computers and peripherals, vehicles,
collectibles, software, consumer electronics, household appliances, jewellery,
audio/video entertainment goods, gift articles, real estate and services, business
and opportunities, employment, travel tickets, matrimony etc.
The gradual increase in literate population and the internet penetration driven
by some of the cheap and most basic cell phones providing access to internet is
helping this substantial growth. The telecommunication technology has
completely changed the way of our living, communication methods, shopping
etc. It has a huge impact on how we communicate with friends and relatives
how we travel, how we access the information and the way we buy or sell
products and services. The growth of E-commerce volumes in India is also
attracting the attention of players around the globe. More importantly,
ecommerce creates more opportunities for business and also opens up
opportunities for education and academics, which seems to have tremendous
potential in the future of e-commerce in India.
23
Market Size Propelled by rising smartphone penetration, launch of 4G network and
increasing consumer wealth, the Indian E-commerce market is expected to
grow to US $200 billion by 2026 from US $38.5 billion in 2017. Online retail
sales in India is expected to grow 31% to touch US$ 32.70 billion in 2018, led
by Flipkart, Amazon India and Paytm Mall. Smartphone shipments in India
increased by~8% y-o-y to reach 50.0 million units in the first quarter of 2020,
driven by positive shipments of all smartphone vendors in the market. Samsung
led the Indian smartphone market with 24% shipping share, followed by
Xiaomi at 23%.During these covid days, however ,we can see a great hike in
the ecommerce sector in India.
Investments
1.In November 2020, Amazon India announced collaboration with Hindustan
Petroleum Corporation Limited. Under this partnership, customers will be able
to book and pay for their LPG cylinders until the delivery.
2.In November 2020, Reliance Retail Ventures Ltd. (RRVL), a subsidiary of
Reliance Industries (RIL), acquired a minority stake of Urban Ladder Home
Decor Solutions Pvt. Ltd. for Rs. 182.12 crore (US$ 24.67 million).
3.In November 2020, Flipkart acquired Scapic, an Augmented Reality (AR)
firm, to boost user experience.
4.In November 2020, Amazon India has opened 'Made in India' toy store, in
line with the government's “Atmanirbhar Bharat” vision. The store will allow
thousands of manufacturers and vendors to sell toys driven by the Indian
culture, folk tales and toys that promote creative thinking and are locally
crafted & manufactured.
24
5.In October 2020, Amazon India collaborated with the Indian Railway
Catering and Tourism Corporation (IRCTC) to enable users to book and
reserve train tickets on Amazon.
6.In October 2020, Flipkart acquired a 140-acre land at Rs. 432 crore (US$
58.87 million) to establish their largest fulfilling centre in Asia, in Manesar,
Gurgaon, in a bid to scale their fulfilment infrastructure to cater to increased
demand post COVID-19.
7.In October 2020, Amazon India invested over Rs. 700 crore (US$ 95.40
million) into its payment unit, Amazon Pay.
Government Initiatives
Since 2014, the Government of India has announced various initiatives, namely
Digital India, Make in India, Start-up India, Skill India and Innovation Fund.
The timely and effective implementation of such programs will likely support
growth of E-commerce in the country. Some of the major initiatives taken by
the Government to promote E-commerce in India are as follows:
1.Government e-Marketplace (GeM) signed a Memorandum of Understanding
(MoU) with Union Bank of India to facilitate a cashless, paperless and
transparent payment system for an array of services in October 2019.
2.Under the Digital India movement, Government launched various initiatives
like Umang, Start-up India Portal, Bharat Interface for Money (BHIM) etc. to
boost digitisation.
3.In October 2020, Minister of Commerce and Industry, Mr. Piyush Goyal
invited start-ups to register at public procurement portal, GeM, and offer goods
and services to government organisations and PSUs.
25
4.In October 2020, amending the equalisation levy rules of 2016, the
government mandated foreign companies operating e-commerce platforms in
India to have permanent account numbers (PAN). It imposed a 2% tax in the
FY21 budget on the sale of goods or delivery of services through a non-resident
ecommerce operator.
5.In order to increase the participation of foreign players in E-commerce,
Indian Government hiked the limit of FDI in E-commerce marketplace model
to up to 100% (in B2B models).
6.Heavy investment made by the Government in rolling out fibre network for
5G will help boost E-commerce in India.
3.2 Company Profile
1.Myntra
Myntra is a one stop shop for all your fashion and lifestyle needs. Being India's
largest e-commerce store for fashion and lifestyle products. Myntra aims at
providing a hassle free and enjoyable shopping experience to shoppers across
the country with the widest range of brands and products on its portal. The
brand is making a conscious effort to bring the power of fashion to shoppers
with an array of the latest and trendiest products available in the country.
History
Myntra is an Indian fashion e-commerce company headquartered in Bengaluru,
Karnataka, India. The company was founded in 2007 to sell personalized gift
items. Established by Mukesh Bansal along with Ashutosh Lawania and Vineet
Saxena; Myntra sold on-demand personalized gift items. It mainly operated on
the B2B (business-to-business) model during its initial years. Between 2007
26
and 2010, the site allowed customers to personalize products such as T-shirts,
mugs, mouse pads, and others.
In 2011, Myntra began selling fashion and lifestyle products and moved away
from personalisation. By 2012 Myntra offered products from 350 Indian and
International brands. The website launched the brands Fastrack Watches and
Being Human.
In 2014 Myntra was acquired by Flipkart in a deal valued at ₹2,000 crore
(US$280 million). The purchase was influenced by two large common
shareholders Tiger Global and Accel Partners. Myntra functions and operates
independently. Myntra continues to operate as a standalone brand under
Flipkart ownership, focusing primarily on "fashion-conscious" consumers.
In 2014, Myntra's portfolio included about 1,50,000 products of over 1000
brands, with a distribution area of around 9000 pin codes in India. In 2015,
Ananth Narayanan became the Chief Executive Officer of Myntra.
On 10 May 2015, Myntra announced that it would shut down its website, and
serve customers exclusively through its mobile app beginning 15 May. The
service had already discontinued its mobile website in favour of the app.
Myntra justified its decision by stating that 95% of traffic on its website came
via mobile devices, and that 70% of its purchases were performed on
smartphones. The move received mixed reception, and resulted in a 10%
decline in sales. In February 2016, acknowledging the failure of the "app-only"
model, Myntra announced that it would revive its website.
In September 2017, Myntra negotiated the rights to manage Esprit Holdings 15
offline stores in India. Myntra reported a net loss of ₹151.20 crore in the
financial year 2017-18.
27
In January 2021, Myntra changed its logo, after a police complaint was
registered that the logo resembles a naked woman. The complaint was filed by
a woman named Naaz Patel, who runs an NGO called Avesta Foundation.
Myntra now has 17 fashion brands under its aegis that includes Roadster, HRX,
Dress berry, Mast & Harbour, All about you, Moda Rapido and Anouk. The
company had recently partnered with Bollywood actor Saif Ali Khan to launch
'House of Pataudi' brand.
Acquisitions and investments
In October 2007, Myntra received its initial funding from Erasmic Venture
Fund (now known as Accel Partners), Sasha Mirchandani from Mumbai Angels
and a few other investors. In November 2008, Myntra raised almost $5 million
from NEA-IndoUS Ventures, IDG Ventures and Accel Partners. Myntra raised
$14 million in a Series B round of funding. This round of investment was led
by Tiger Global, a private equity firm; the existing investors IDG Ventures and
Indo-US Venture Partners also put in substantial amount towards funding
Myntra. Towards the end of 2011, Myntra.com raised $20 million in its third
round of funding, again led by Tiger Global. In February 2014, Myntra raised
additional $50 Million (Rs.310 crore) funding from Premji Invest and few other
Private Investors.
1.In April 2015, Myntra acquired Bengaluru-based mobile app development
platform company Native5, with a view to strengthen and expand Myntra’s
mobile technology team.
2.In July 2016, Myntra acquired mobile-based content aggregation platform
Cubeit, to strengthen and expand its technology team.
28
3.In July, 2016 Myntra acquired their rival Jabong.com to become India’s
largest fashion platform. In October 2017, Myntra partnered with Ministry of
Textiles to promote handloom industry.
4.In April 2017, the company acquired In Logg, a city-based technology
platform for the e-commerce sector.
5.In April 2018, Myntra bought Bengaluru-based start-up Witwork’s, a maker
of wearable devices to strengthen its technology team.
Awards
1.Awarded 'Fashion eRetailer of the Year 2013' by Franchise India – Indian
eRetail Awards.
2.Awarded 'Best E-commerce Website for 2012' by IAMAI – India Digital
Awards.
3.Awarded 'Images Most Admired Retailer of the Year: Non–Store Retail' for
2012 by Images Group.
4.Awarded 'Best E-commerce Partner of the year 2011-2012' by Puma India.
29
2.IndiaMART
IndiaMART InterMESH Ltd. is an Indian e-commerce company that provides
B2C, B2B and customer to customer sales services via its web portal. The
group began in 1996 when Dinesh Agarwal and Brijesh Agrawal founded the
website IndiaMART.com, a business-to-business portal to connect Indian
manufacturers with buyers. The company is headquartered in Noida, Uttar
Pradesh, India.
IndiaMART had an aggregate of 32.5 crore (325.8 million), 55.2 crore (552.6
million) and 72.3 crore (723.5 million) visits in fiscals 2017, 2018 and 2019,
respectively, of which 20.4 crore (204.8 million), 39.6 crore (396.9 million)
and 55 crore (550.3 million) were mobile traffic, which is 63%, 72% and 76%
of total traffic, respectively Currently the IndiaMART app has more than 1
crore (10 million) downloads with a 4.7 App rating on Android
IndiaMart’s revenue registered a 29% CAGR over FY 2014-19 to ₹507 crore
while it reported a net profit of ₹20 crore in FY19, according to a note from
Angel Broking. It has zero debt and sizeable cash balance. As of March 31,
2019, the company had 8.27 crore (82.70 million) registered buyers and had
55.5 lakh (5.55 million) supplier storefronts in India and expect to maintain a
compounded annual growth rate (CAGR) of 29 per cent for the next two years .
In 2016 and 2019, IndiaMART invested in ProcMart and Vyapar.
IndiaMART was the first company to test the IPO market in the Modi
Government’s Second tenure.
30
History
The cousins, Dinesh Agarwal and Brijesh Agrawal [14] launched IndiaMART
as a directory of the websites for customers in the Delhi-NCR region. At that
time India had only 15,000 internet users. By 1999, the directory had more than
1000 listings.
After overcoming the dot-com bust, in 2008-2009, when the recession hit US,
the company decided to pivot the focus from export oriented business to
Indiafocused B2B market and raised $10 million from Intel Capital.
In November 2014, IndiaMART started promotional campaigns featuring
Indian film actor Irrfan Khan as its brand ambassador.
Over the last 10 years, IndiaMART has become the largest e-commerce
platform for businesses with about 60% market share, according to research
firm KPMG. It handles 97,000 product categories — ranging from machine
parts, medical equipment and textile products to cranes, from thousands of
towns and cities of India. Agfa HealthCare India, Case New Holland
Construction Equipment (India), Hilti India, JCB India and Nobel Hygiene are
a few big suppliers on the company’s marketplace.
In 2019, IndiaMART went public, and it was by far the first online B2B
marketplace to go public. IndiaMART opened IPO to raise over ₹474 Crore at
a price brand of ₹970- ₹973 on the 24th of June, 2019. IndiaMART IPO was
fully subscribed by Day 2, and was oversubscribed by 36 times by the end of
the final day of the biding.
31
Acquisitions and investments
In early 2009, the firm received ₹50 crore Series A round funding from Intel
Capital, a part of which was invested in IndiaMART, One97 Communications
and Global Talent Track. In March 2016, it raised Series C Funding from
Amadeus Capital Partners and Quona Capital. It is claimed that these funds will
be used to scale up the activities of IndiaMART and Tolexo. In June 2018
IndiaMART has filled draft papers with SEBI to raise $88.24 million through
IPO and list on NSE and BSE exchange.
Awards
1.Nominated among the top three at Emerging India Awards 2008.
2.Red Herring 100 Asia Awards 2008.
3.Manthan Award 2013 for Buy Leads Under E-Business & Financial Inclusion
Category.
4.IndiaMART Bags Best Business App Award at GMASA 2017.
5.‘Best Business App’ at Drivers of Digital Summit & Awards, 2018.
6.‘Best Online Classified Website’ at Drivers of Digital Summit & Awards,
2018.
7.‘Best Online Classified Application’ at Drivers of Digital Summit & Awards,
2018.
8.India Law Awards 2019 for ‘Technology, Media and Telecommunication
InHouse Legal Team'.
32
3.Reliance Digital
Reliance Digital is a consumer durables and information technology concept
from Reliance Retail. It is a subsidiary of Reliance Retail, which is a wholly
owned subsidiary of Reliance Industries.
Reliance Digital is a consumer electronics company in India. The first Reliance
Digital Store was opened on 24 April 2007 in Delhi. Currently there are around
1000 Reliance Digital and Reliance Digital Xpress Mini Stores in around 100
cities in India. The stores are spread across the states of Andhra Pradesh, Delhi,
Gujarat, Karnataka, Kerala, Maharashtra, Tamil Nadu, Telangana, West
Bengal, Orissa, Assam, Bihar, Jharkhand and NCR. Reliance Digital Stores are
bigger in size than the other format Digital Xpress Mini Stores. The company
plans to ramp up its current store count of 1,200 stores to 2,500 by the end of
2017.
History
In January 2006, Ambani brothers signed a 10-year non-compete contract so as
to avoid rubbing each other the wrong way. By 2008, the telecom arm of R-
Adag, Reliance Communications, had emerged as the country’s second-largest
mobile operator. Anil Ambani was then working on a mega-deal between
Reliance Communications and South African telecom giant MTN that would
have formed a powerful global telecommunications firm spanning India and
South Africa with nearly USD 7080 billion in value. But the talks between the
two companies were called off after Mukesh Ambani interfered and challenged
his brother’s right to sell his controlling shares to MTN as a part of the deal. He
claimed he had the first right of refusal as per the complex arrangement
brokered when the Reliance empire was split up. To put an end to the dissent,
in May 2010, the two brothers scrapped their noncompete agreement, which
33
gave Mukesh Ambani the ticket to enter the telecom sector. Two weeks later,
RIL bought a 95% stake in Infotel Broadband Services, an unknown and the
only company to have won the auction of broadband spectrum for pan-India.
Interestingly, the USD 1-billion-deal was made public hours after the auction
results were announced.
Unless these past events were a series of serendipitous coincidences, Mukesh
Ambani had been planning his entry in the telecom sector all along, even
before his daughter complained about the poor connectivity. In 2013, RIL
renamed Infotel Broadband Services as Reliance Jio Infocomm, which then
became the only company to have a pan-India broadband spectrum, which it
later used to roll out 4G services. To be sure, it took Reliance about six years to
launch commercial mobile network services. But once it commercially
launched in September 2016, it took the market by storm.
Acquisitions and Investments
Reliance Digital, the consumer durables arm of Mukesh Ambani-led Reliance
Retail, invests about Rs110-crore in the current fiscal to roll-out 31 stores
across India.
The company, which resells Apple products through its iStore chain, will open
10 outlets by March 2010 along with 21 Reliance Digital outlets, Reliance
Retail’s president and chief executive (consumer durable, IT & telecom), Ajay
Baijal, told the agency.
Presently, Reliance Digital has a 14-strong network and 10 iStores pan-India in
destinations such as Mumbai, Hyderabad, Bangalore, Chennai, Ahmedabad,
Vadodara, Ludhiana and Jaipur.
“This year, we plan to take the total number of stores (Reliance Digital and
iStore) to 55. Each Reliance Digital store requires an investment of about Rs45
crore, while an iStore takes up to Rs40-lakh," Baijal said.
34
4.Snapdeal
Snapdeal is one of India’s leading e-commerce companies with its
headquarters located in New Delhi. Snapdeal was launched in 2010, a time
when the e-commerce market in India was at a nascent stage. The company
was co-founded by Kunal Bahl and Rohit Bansal. Snapdeal currently offers
more than 60 million products across various categories such as mobiles &
tablets, computers, office & gaming, electronics, home & living, men’s and
women’s fashion, sports, fitness & outdoors, daily needs, motors & accessories,
books, music, real estate, and financial services. The company has more than 3
lakh sellers on its e-commerce platform that cater to millions of users. Snapdeal
has a wide logistics network and it delivers to more than 6000 cities and towns
in India.
History
Snapdeal was founded on 4 February 2010 as a daily deals platform, and
expanded in September 2011 to become an online marketplace. Snapdeal has
grown to become one of the largest online marketplace in India. Snapdeal’s
focus is on the value ecommerce segment - a market that is three times larger
than the size of the branded goods market. Sellers on Snapdeal offer good
quality merchandise, that offers customers value-for-money options, similar to
what would sell in local markets and high streets in a city. Fashion, home and
general merchandise account for a majority of the products sold .
35
Acquisitions
Snapdeal has acquired several business enterprises. In June 2010, Snapdeal's
holding company Jasper Infotech Private Limited acquired Bengaluru-based
group buying website Grabbon.com for an undisclosed amount. In April 2012,
Delhi-based online sports goods retailer esportsbuy.com was acquired. This
was followed in 2013 by the acquisition of Shopo.in, a C2C ecommerce
platform. In 2014, Snapdeal acquired Doozton.com, a fashion product
discovery technology platform, and Wishpicker.com, a tech platform that uses
machine learning to deliver recommendations for gift purchases. Both deals
were for undisclosed amounts.
Snapdeal made majority of its acquisitions in the year 2015. In January, it
acquired a stake in product comparison website, Smartprix.com followed by
the acquisition of luxury fashion products discovery site, Exclusively.in. In
March, the firm acquired 20% stake in logistics service company Gojavas.com.
Two more acquisitions in the same month were eCommerce management
software and fulfilment solution[buzzword] provider, Unicommerce.com and
RupeePower, a digital platform for financial transactions. In April 2015,
mobile-payments company FreeCharge.com was acquired. Programmatic
display advertising platform, Reduce Data was acquired in September of the
same year. In August 2016, logistics firm Pigeon Express acquired a 51% stake
in GoJavas with Snapdeal holding 49% stake in the firm. Snapdeal later exited
GoJavas.
36
Awards
1.Best corporate payment project 2016 from yes bank.
2.ET start up awards 2019.
3.The co-founder of the company, Kunal Bahl, was awarded with Entrepreneur
of the year Award in 2015.
4.In 2015, the company has won Australian Service Excellence Award for the
outstanding experience of customers.
5.In 2012, it was recognized as the eRetailer of the Year & Best Advertising
campaign of the year.
6.The company was awarded with WAT Awards as an E- Commerce site of the
year.
7.Snapdeal was the winner of the Red Herring Asia Awards 2011.
8.It was recognized as India’s busiest brands in annual buzz- making poll in
AFAQS.
37
5.Justdial
Just Dial Limited is India's No. 1 Local Search engine that provides local
search related services to users across India through multiple platforms such as
website, mobile website, Apps (Android, iOS, Windows), over the telephone
and text (SMS).Justdial has also initiated ‘Search Plus’ services for its users.
These services aim at making several day-to-day tasks conveniently actionable
and accessible to users through one App. By doing so, it has transitioned from
being purely a provider of local search and related information to being an
enabler of such transactions. Justdial has also recently launched JD Omni, an
end-to-end business management solution for SMEs, through which it intends
to transition thousands of SMEs to efficiently run their business online and
have adequate online presence via their own website and mobile site. Apart
from this, it has also launched JD Pay, a unique solution for quick digital
payments for its users and vendors, and JD Social, its official social sharing
platform to provide curated content on latest happenings to users. The
organisation also aims to make communication between users and businesses
seamless through its Real Time Chat Messenger.
History
In 1987, while working for a yellow pages company, VSS Mani thought of
replacing yellow pages with a database of information that users could call to
receive current information about local business listings. To launch his venture,
Mani acquired the Mumbai landline phone number. After several years of
seeking financial backing for his idea, Mani launched Justdial in 1996 with a
seed capital of Rs. 50,000, five employees, a few rented computers, and
borrowed furniture.
In 2007 an Internet and mobile app version of the database called Justdial.com
was launched.
38
On 20 May 2013 Justdial went public at a price between INR 897 and 898 Of
the total 17.5 million shares, 13.5 million of them were offered to the public,
while the rest were given to fifteen previous investors at INR 530 per share. To
encourage retail investment, Justdial had promised that they would buy back
shares from retail investors at the IPO price if Justdial's share price fell sharply
within the first six months. By the close of the market on the day of the IPO,
the majority of new investments had come from foreign institutional investors.
On 5 August of the next year, Justdial's share price reached a high of INR
1,894.70, subsequently decreasing to the triple digits[quantify] in 2015.
Investments
The justdial company has invested in "Justdial Social", a service that
aggregates content from social media websites, TV broadcast, news, and other
sources; and also in "Search Plus Service", a service that manages online
transactions via the web and mobile apps.
Awards
1.Ernst & Young Awards – 2013: E&Y Entrepreneur of the Year (Services)
Award.
2.Young Turks Awards – 2012: Jury Special Commendation Award.
3.VCCircle Annual Awards – 2012: Best VC-backed Media & Communication
Company.
4.Amity Global Business School – 2012: Amity Corporate Excellence Award
for Customer Service.

39
Chapter 4 Data Analysis
40
4.1 Introduction Data analysis is the science of analysing raw data in order to make conclusions
about that information. Many of the techniques and processes of data analysis
have been automated into mechanical processes algorithm that work over raw
data for human consumption.
Data analytics techniques can reveal trends and metrics that would otherwise be
lost in the mass of information. This information can then be used to optimize
processes to increase the overall efficiency of a business or system.
4.2 Liquidity ratio
A liquidity ratio is a type of financial ratio used to determine a company’s
ability to pay its short-term debt obligations. The metric helps determine if a
company can use its current, or liquid, assets to cover its current liabilities. The
term liquidity refers to the firm’s ability to pay its current liabilities out of its
current assets. These ratios are highly useful to creditors and commercial banks
that provide short term credit.
41
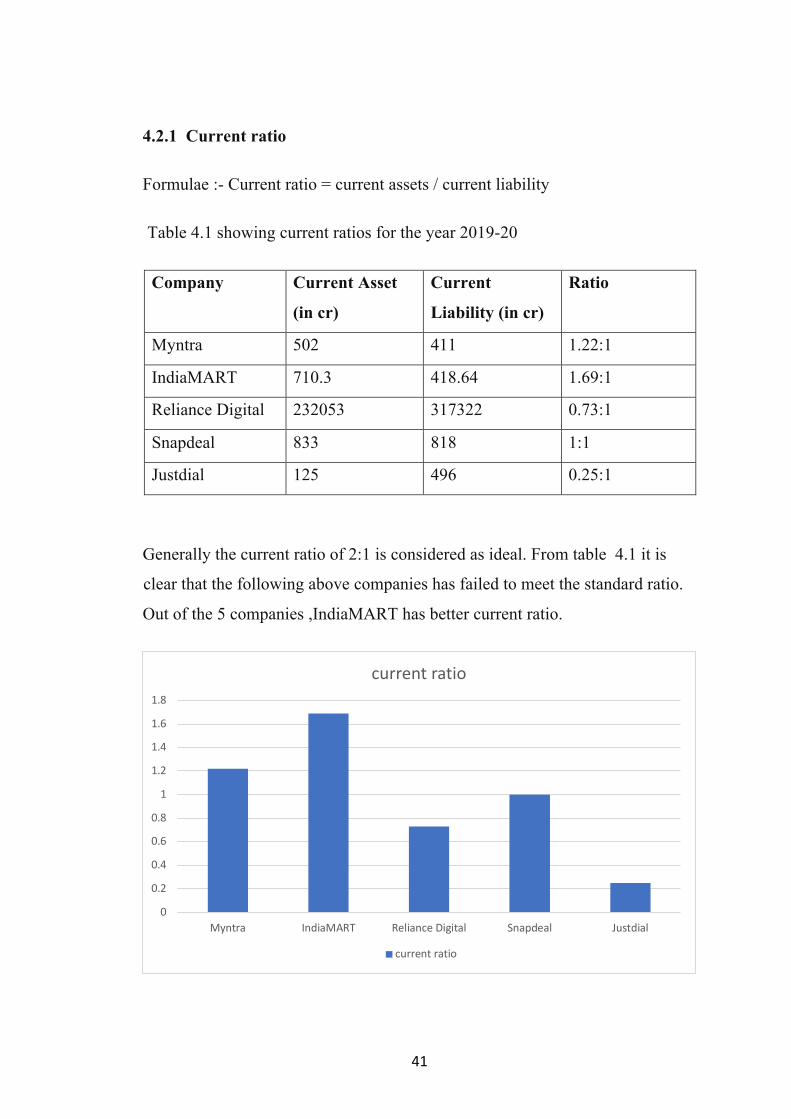
4.2.1 Current ratio
Formulae :- Current ratio = current assets / current liability
Table 4.1 showing current ratios for the year 2019-20
Company Current Asset
(in cr)
Current
Liability (in cr)
Ratio
Myntra 502 411 1.22:1
IndiaMART 710.3 418.64 1.69:1
Reliance Digital 232053 317322 0.73:1
Snapdeal 833 818 1:1
Justdial 125 496 0.25:1
Generally the current ratio of 2:1 is considered as ideal. From table 4.1 it is
clear that the following above companies has failed to meet the standard ratio.
Out of the 5 companies ,IndiaMART has better current ratio.
0
0.2
0.4
0.6
0.8
1
1.2
1.4
1.6
1.8
Myntra IndiaMART Reliance Digital Snapdeal Justdial
current ratio
current ratio
42
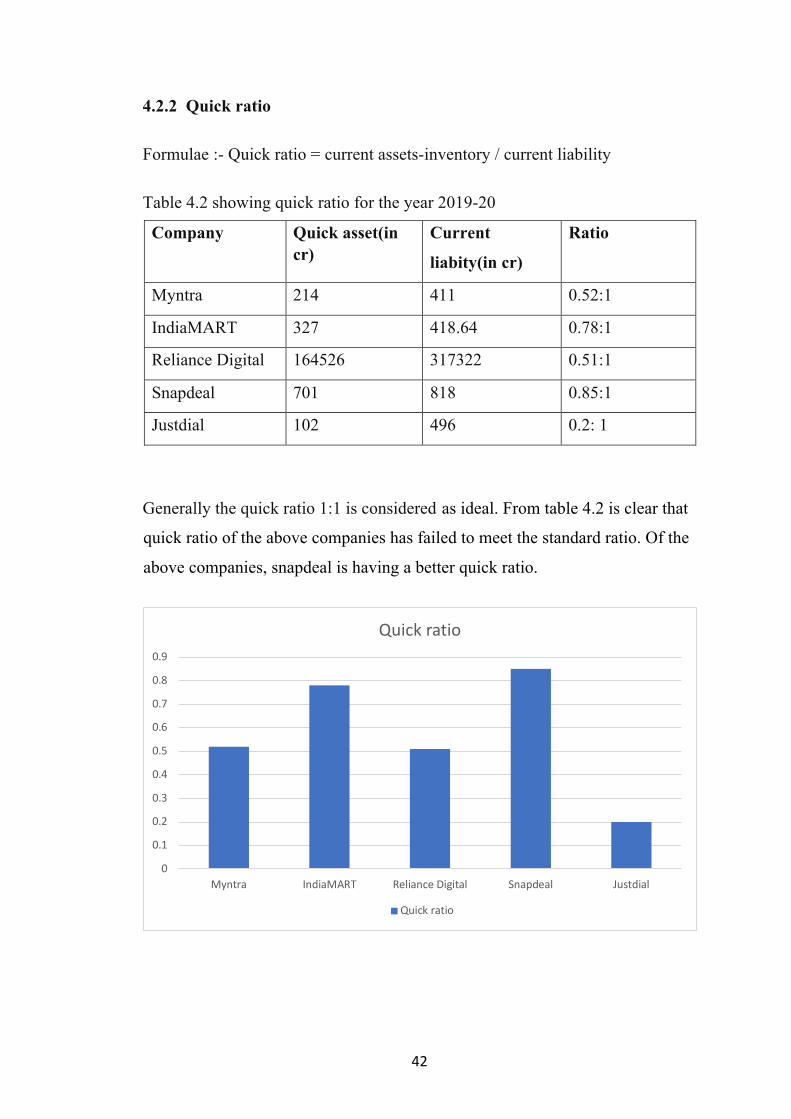
4.2.2 Quick ratio
Formulae :- Quick ratio = current assets-inventory / current liability
Table 4.2 showing quick ratio for the year 2019-20
Company Quick asset(in cr)
Current
liabity(in cr)
Ratio
Myntra 214 411 0.52:1
IndiaMART 327 418.64 0.78:1
Reliance Digital 164526 317322 0.51:1
Snapdeal 701 818 0.85:1
Justdial 102 496 0.2: 1
Generally the quick ratio 1:1 is considered as ideal. From table 4.2 is clear that
quick ratio of the above companies has failed to meet the standard ratio. Of the
above companies, snapdeal is having a better quick ratio.
0
0.1
0.2
0.3
0.4
0.5
0.6
0.7
0.8
0.9
Myntra IndiaMART Reliance Digital Snapdeal Justdial
Quick ratio
Quick ratio
43
4.3 Solvency ratio A solvency ratio is a key metric used to measure an enterprise’s ability to meet
its long-term debt obligations and is used often by prospective business lenders.
A solvency ratio indicates whether a company’s cash flow is sufficient to meet
its long-term liabilities and thus is a measure of its financial health. An
unfavourable ratio can indicate some likelihood that a company will default on
its debt obligations. Long term liabilities include debentures, long term loans
etc. The term solvency means long term solvency.
They are mainly used to analyse the long term financial position of a business.
44
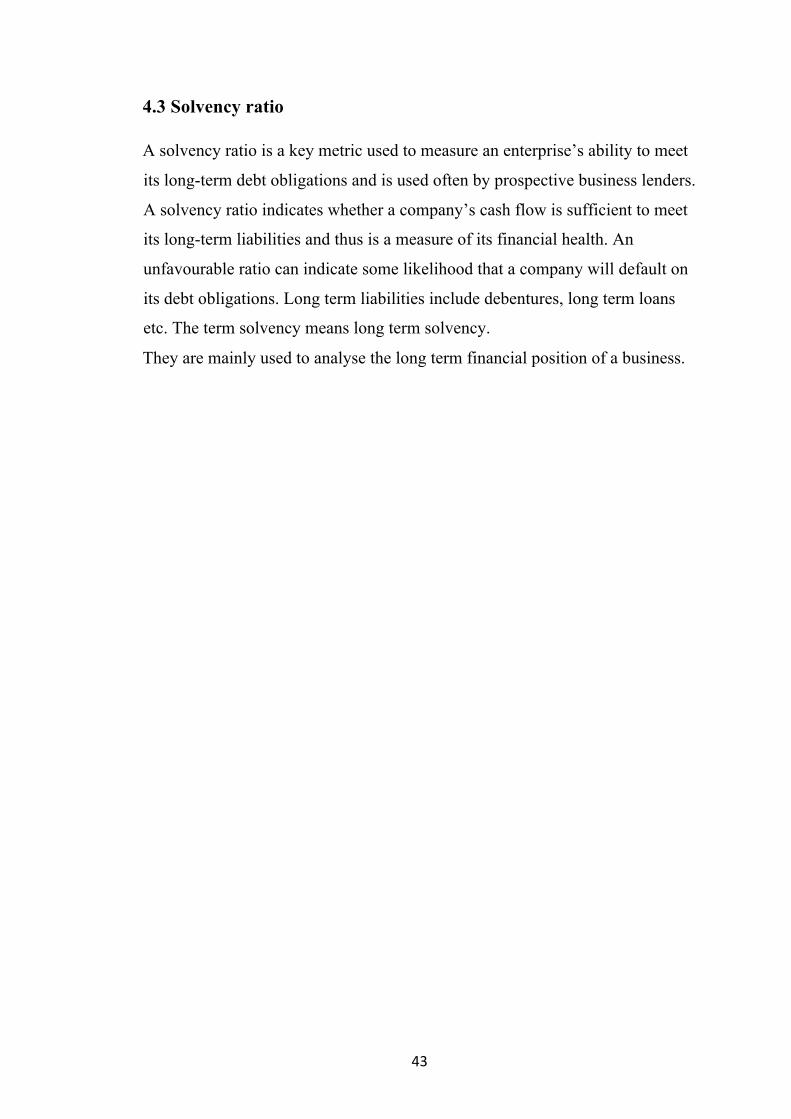
4.3.1 Total Debt Equity ratio Formulae :- Total debt equity ratio = total debt / total equity
Table 4.3 showing total debt equity ratio for the year 2019-20
Company Total Debt(in cr)
Total Equity(in cr)
Ratio
Myntra 418.5 245 1.48:1
IndiaMART 658.1 659.89 0.84:1
Reliance Digital 607014 387112 0.56:1
Snapdeal 926 341 0.97:1
Justdial 550.05 998.8 0.49:1
Generally debt equity ratio of 1:1 is considered as standard. This means that
funds provided by outsiders and shareholders must be equal. From the table 4.3
it is clear the above companies has not attained the ideal ratio except Snapdeal
has achieved close enough and has better ratio.
0
0.2
0.4
0.6
0.8
1
1.2
1.4
1.6
Myntra IndiaMART Relianve Digital Snapdeal Justdial
Total Debt Equity Ratio
Total Debt Equity Ratio
45
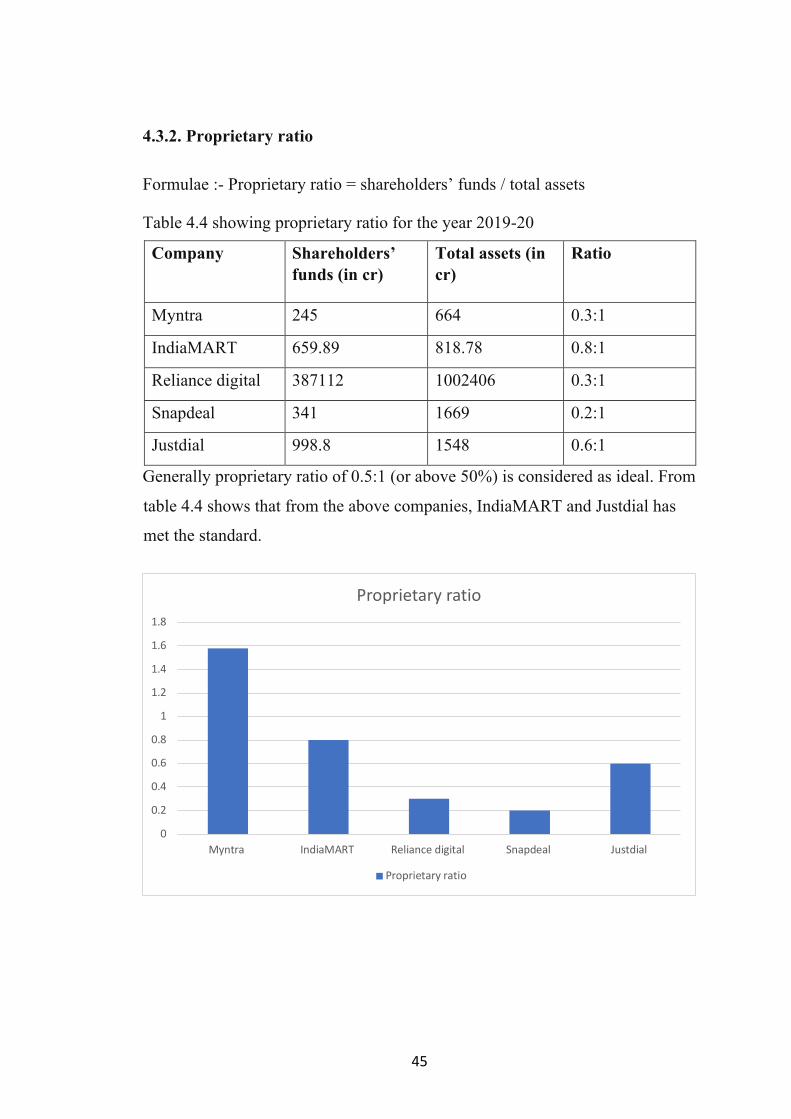
4.3.2. Proprietary ratio
Formulae :- Proprietary ratio = shareholders’ funds / total assets
Table 4.4 showing proprietary ratio for the year 2019-20
Company Shareholders’ funds (in cr)
Total assets (in cr)
Ratio
Myntra 245 664 0.3:1
IndiaMART 659.89 818.78 0.8:1
Reliance digital 387112 1002406 0.3:1
Snapdeal 341 1669 0.2:1
Justdial 998.8 1548 0.6:1
Generally proprietary ratio of 0.5:1 (or above 50%) is considered as ideal. From
table 4.4 shows that from the above companies, IndiaMART and Justdial has
met the standard.
0
0.2
0.4
0.6
0.8
1
1.2
1.4
1.6
1.8
Myntra IndiaMART Reliance digital Snapdeal Justdial
Proprietary ratio
Proprietary ratio
46
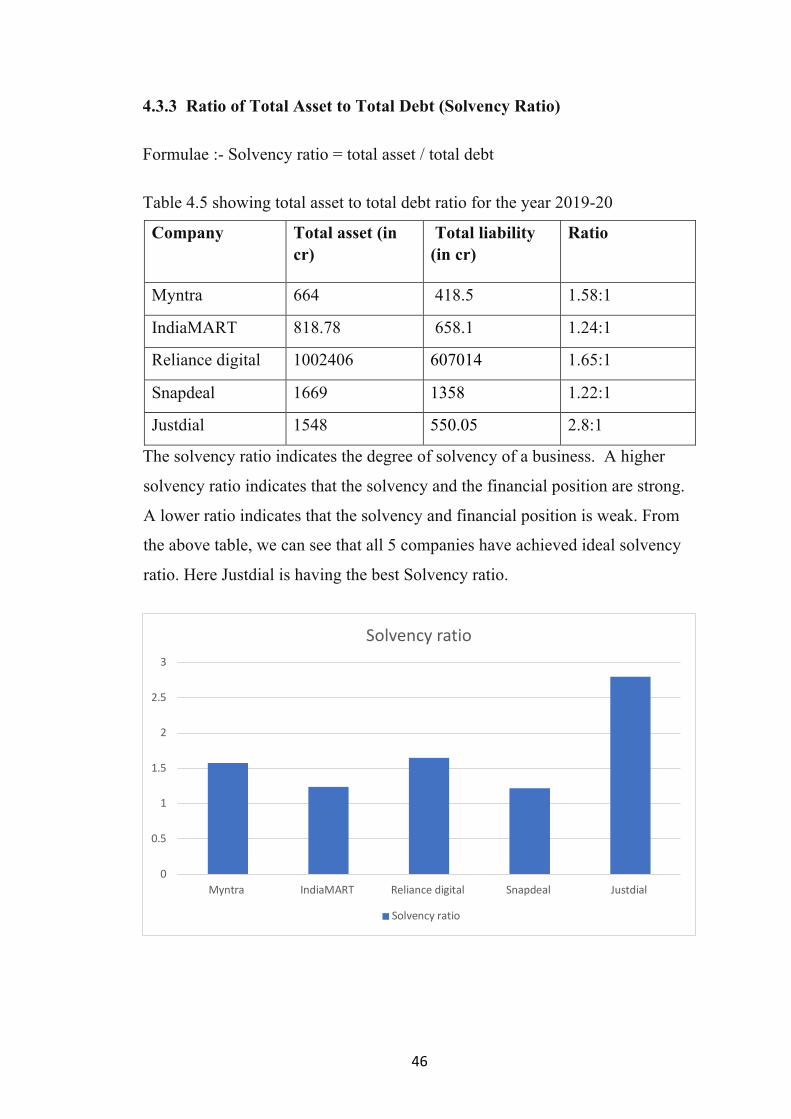
4.3.3 Ratio of Total Asset to Total Debt (Solvency Ratio)
Formulae :- Solvency ratio = total asset / total debt
Table 4.5 showing total asset to total debt ratio for the year 2019-20
Company Total asset (in cr)
Total liability (in cr)
Ratio
Myntra 664 418.5 1.58:1
IndiaMART 818.78 658.1 1.24:1
Reliance digital 1002406 607014 1.65:1
Snapdeal 1669 1358 1.22:1
Justdial 1548 550.05 2.8:1
The solvency ratio indicates the degree of solvency of a business. A higher
solvency ratio indicates that the solvency and the financial position are strong.
A lower ratio indicates that the solvency and financial position is weak. From
the above table, we can see that all 5 companies have achieved ideal solvency
ratio. Here Justdial is having the best Solvency ratio.
0
0.5
1
1.5
2
2.5
3
Myntra IndiaMART Reliance digital Snapdeal Justdial
Solvency ratio
Solvency ratio
47
4.4 Profitability Ratio
The ultimate aim of any business enterprise is to earn maximum profit. The
term profitability means the ability of a firm to earn income. Profitability ratios
are a class of financial metrics that are used to assess a business's ability to
generate earnings relative to its revenue, operating costs, balance sheet assets,
or shareholders' equity over time, using data from a specific point in time. For
most profitability ratios, having a higher value relative to a competitor's ratio or
relative to the same ratio from a previous period indicates that the company is
doing well. Profitability ratios are most useful when compared to similar
companies, the company's own history, or average ratios for the company's
industry.
48
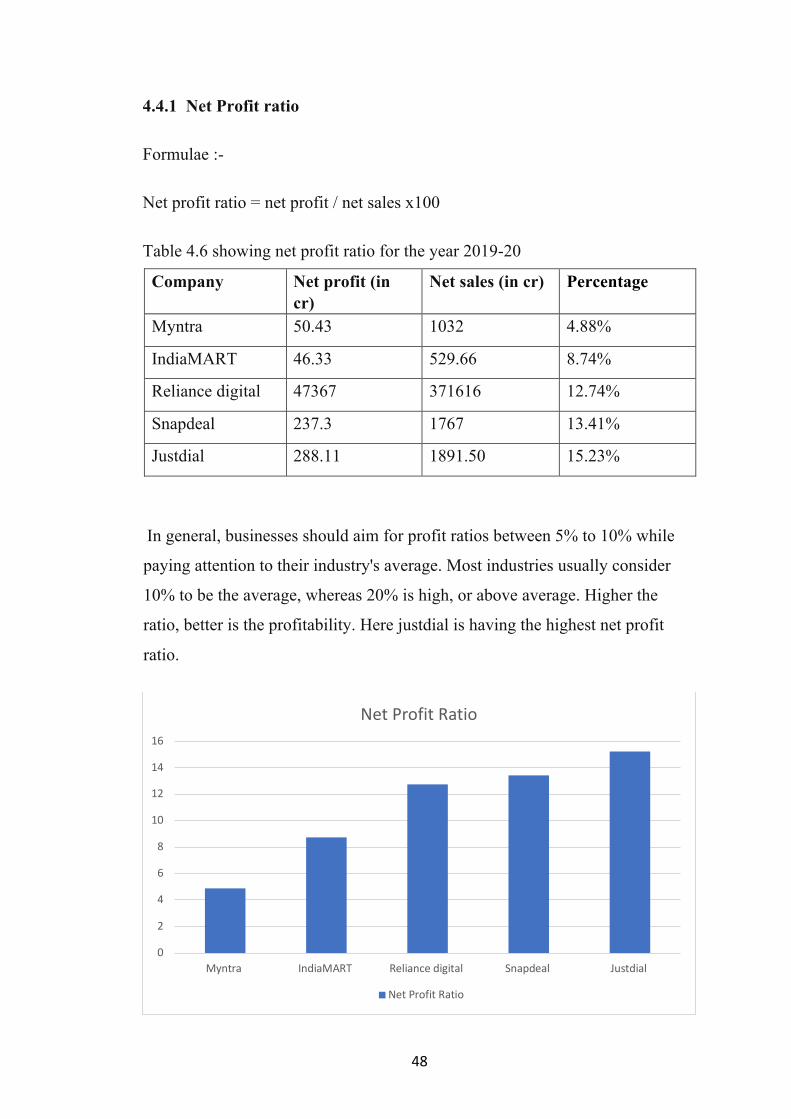
4.4.1 Net Profit ratio
Formulae :-
Net profit ratio = net profit / net sales x100
Table 4.6 showing net profit ratio for the year 2019-20
Company Net profit (in cr)
Net sales (in cr) Percentage
Myntra 50.43 1032 4.88%
IndiaMART 46.33 529.66 8.74%
Reliance digital 47367 371616 12.74%
Snapdeal 237.3 1767 13.41%
Justdial 288.11 1891.50 15.23%
In general, businesses should aim for profit ratios between 5% to 10% while
paying attention to their industry's average. Most industries usually consider
10% to be the average, whereas 20% is high, or above average. Higher the
ratio, better is the profitability. Here justdial is having the highest net profit
ratio.
0
2
4
6
8
10
12
14
16
Myntra IndiaMART Reliance digital Snapdeal Justdial
Net Profit Ratio
Net Profit Ratio
49
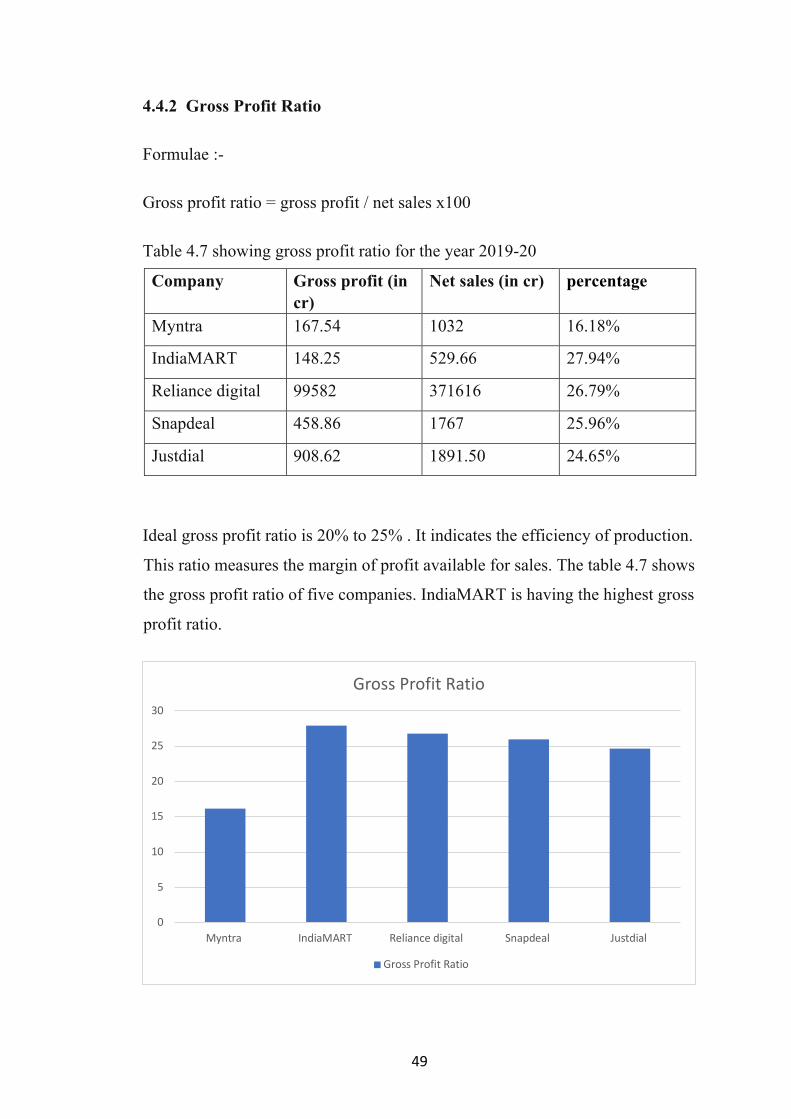
4.4.2 Gross Profit Ratio
Formulae :-
Gross profit ratio = gross profit / net sales x100
Table 4.7 showing gross profit ratio for the year 2019-20
Company Gross profit (in cr)
Net sales (in cr) percentage
Myntra 167.54 1032 16.18%
IndiaMART 148.25 529.66 27.94%
Reliance digital 99582 371616 26.79%
Snapdeal 458.86 1767 25.96%
Justdial 908.62 1891.50 24.65%
Ideal gross profit ratio is 20% to 25% . It indicates the efficiency of production.
This ratio measures the margin of profit available for sales. The table 4.7 shows
the gross profit ratio of five companies. IndiaMART is having the highest gross
profit ratio.
0
5
10
15
20
25
30
Myntra IndiaMART Reliance digital Snapdeal Justdial
Gross Profit Ratio
Gross Profit Ratio
50
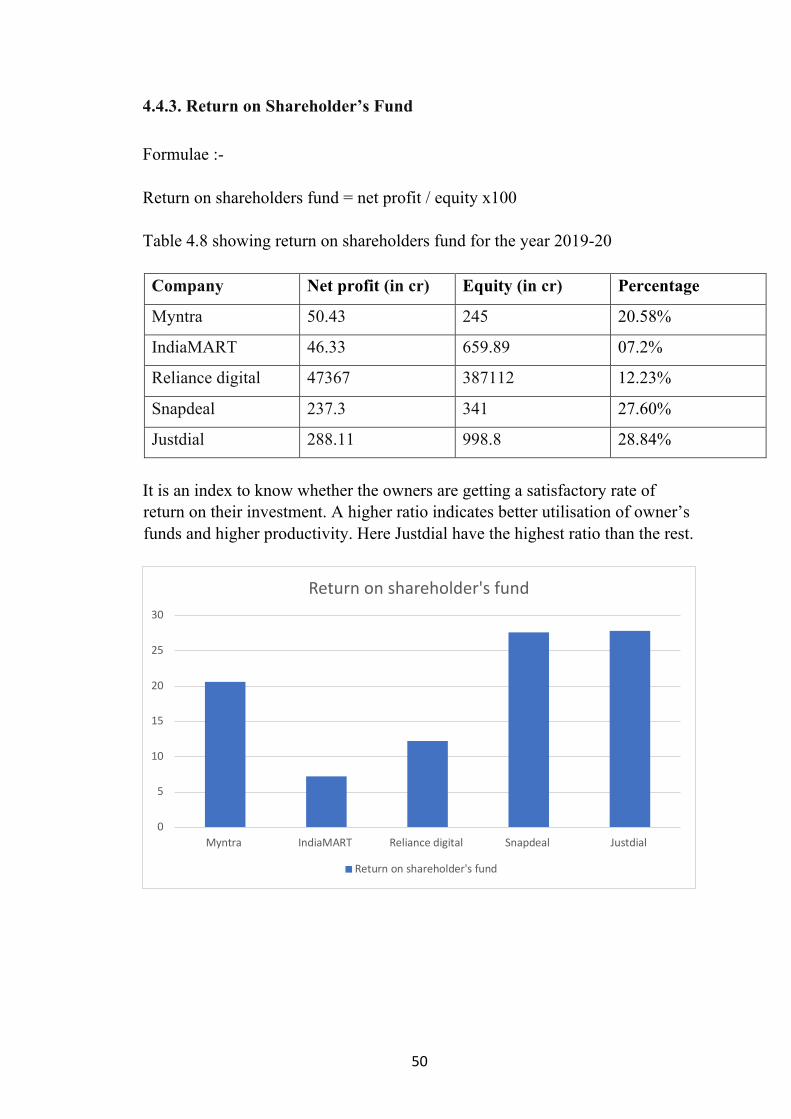
4.4.3. Return on Shareholder’s Fund
Formulae :- Return on shareholders fund = net profit / equity x100 Table 4.8 showing return on shareholders fund for the year 2019-20 Company Net profit (in cr) Equity (in cr) Percentage
Myntra 50.43 245 20.58%
IndiaMART 46.33 659.89 07.2%
Reliance digital 47367 387112 12.23%
Snapdeal 237.3 341 27.60%
Justdial 288.11 998.8 28.84%
It is an index to know whether the owners are getting a satisfactory rate of return on their investment. A higher ratio indicates better utilisation of owner’s funds and higher productivity. Here Justdial have the highest ratio than the rest.
0
5
10
15
20
25
30
Myntra IndiaMART Reliance digital Snapdeal Justdial
Return on shareholder's fund
Return on shareholder's fund
51
4.5 Activity Ratio Activity ratios are used to determine the efficiency of the organisation in utilising its assets for generating cash and revenue. They show how effectively a firm use its available resources or assets. These ratios indicate efficiency in asset management. They are also known as efficiency ratio. They indicate the speed with which the resources are turned over or converted into cash. That is why these ratios are called as turnover ratios. Higher turnover ratios means better use of resources. This means higher profitability.
52
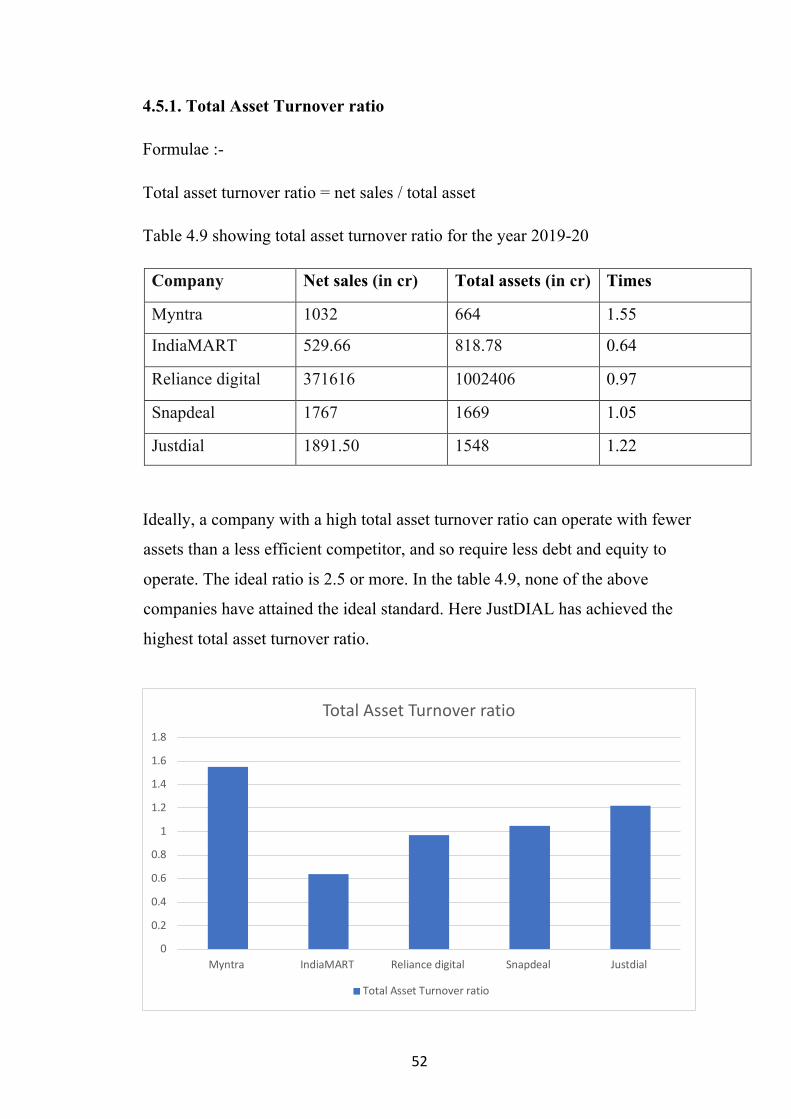
4.5.1. Total Asset Turnover ratio Formulae :- Total asset turnover ratio = net sales / total asset Table 4.9 showing total asset turnover ratio for the year 2019-20 Company Net sales (in cr) Total assets (in cr) Times
Myntra 1032 664 1.55
IndiaMART 529.66 818.78 0.64
Reliance digital 371616 1002406 0.97
Snapdeal 1767 1669 1.05
Justdial 1891.50 1548 1.22
Ideally, a company with a high total asset turnover ratio can operate with fewer
assets than a less efficient competitor, and so require less debt and equity to
operate. The ideal ratio is 2.5 or more. In the table 4.9, none of the above
companies have attained the ideal standard. Here JustDIAL has achieved the
highest total asset turnover ratio.
0
0.2
0.4
0.6
0.8
1
1.2
1.4
1.6
1.8
Myntra IndiaMART Reliance digital Snapdeal Justdial
Total Asset Turnover ratio
Total Asset Turnover ratio
53
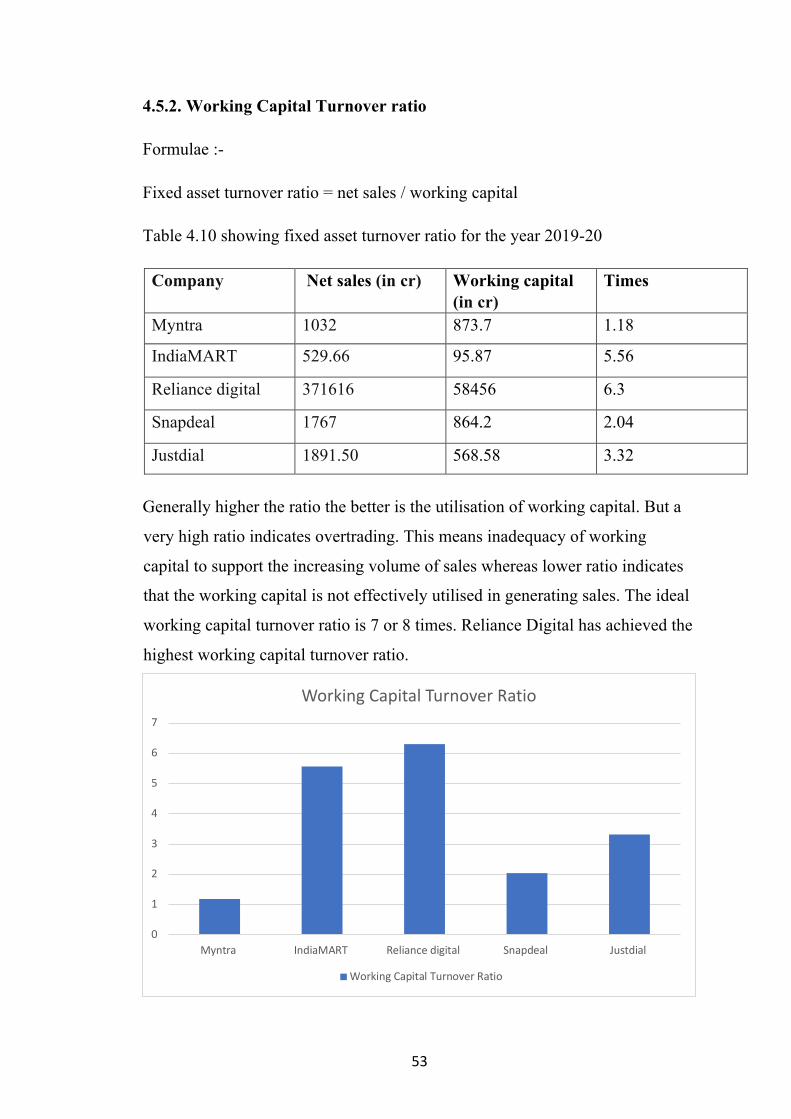
4.5.2. Working Capital Turnover ratio Formulae :- Fixed asset turnover ratio = net sales / working capital Table 4.10 showing fixed asset turnover ratio for the year 2019-20 Company Net sales (in cr) Working capital
(in cr) Times
Myntra 1032 873.7 1.18
IndiaMART 529.66 95.87 5.56
Reliance digital 371616 58456 6.3
Snapdeal 1767 864.2 2.04
Justdial 1891.50 568.58 3.32
Generally higher the ratio the better is the utilisation of working capital. But a
very high ratio indicates overtrading. This means inadequacy of working
capital to support the increasing volume of sales whereas lower ratio indicates
that the working capital is not effectively utilised in generating sales. The ideal
working capital turnover ratio is 7 or 8 times. Reliance Digital has achieved the
highest working capital turnover ratio.
0
1
2
3
4
5
6
7
Myntra IndiaMART Reliance digital Snapdeal Justdial
Working Capital Turnover Ratio
Working Capital Turnover Ratio
54
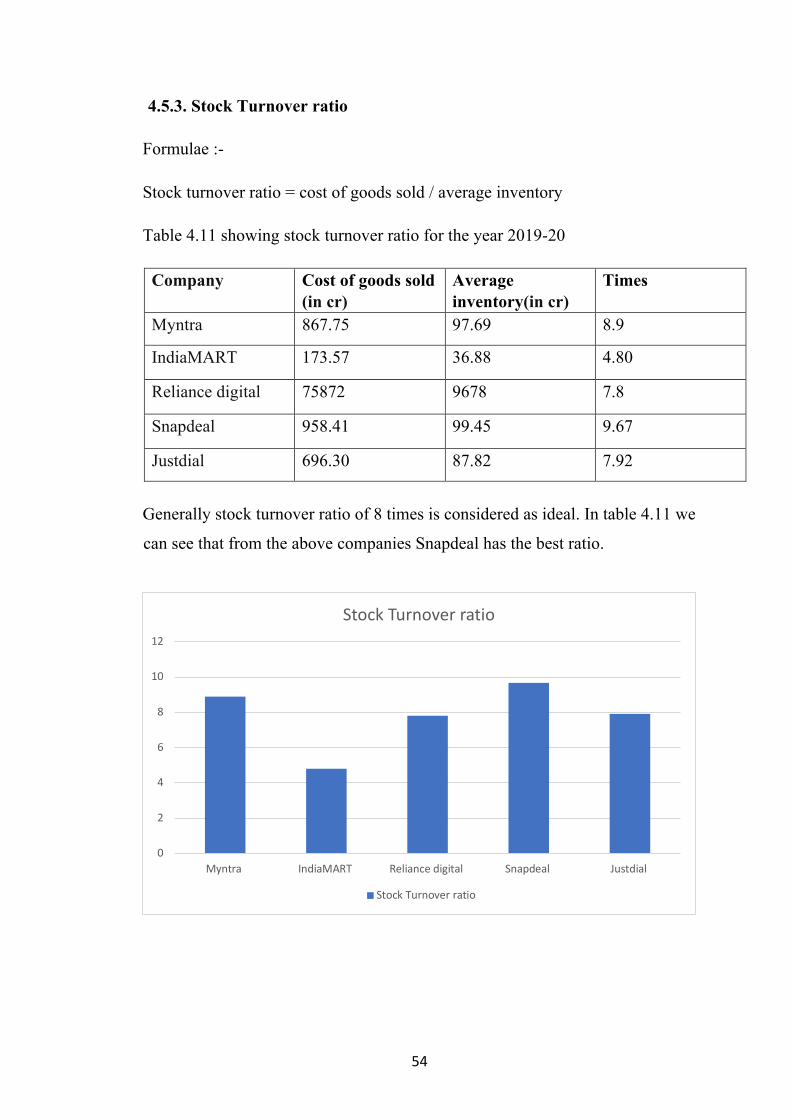
4.5.3. Stock Turnover ratio Formulae :- Stock turnover ratio = cost of goods sold / average inventory Table 4.11 showing stock turnover ratio for the year 2019-20 Company Cost of goods sold
(in cr) Average inventory(in cr)
Times
Myntra 867.75 97.69 8.9
IndiaMART 173.57 36.88 4.80
Reliance digital 75872 9678 7.8
Snapdeal 958.41 99.45 9.67
Justdial 696.30 87.82 7.92
Generally stock turnover ratio of 8 times is considered as ideal. In table 4.11 we
can see that from the above companies Snapdeal has the best ratio.
0
2
4
6
8
10
12
Myntra IndiaMART Reliance digital Snapdeal Justdial
Stock Turnover ratio
Stock Turnover ratio

55
4.6 Market test ratio
Market Test Ratios help investor to estimate the attractiveness of a potential or
existing investment and get an idea of its valuation. These ratios are concerned
with the return on investment for shareholders, and with the relationship
between return and the value of an investment in company's shares. They help
to evaluate the shares and stocks which are traded in the market. If a firm’s
profitability, solvency and turnover ratio are good, then the market test ratios
will be high and its share price is expected to be high.
56
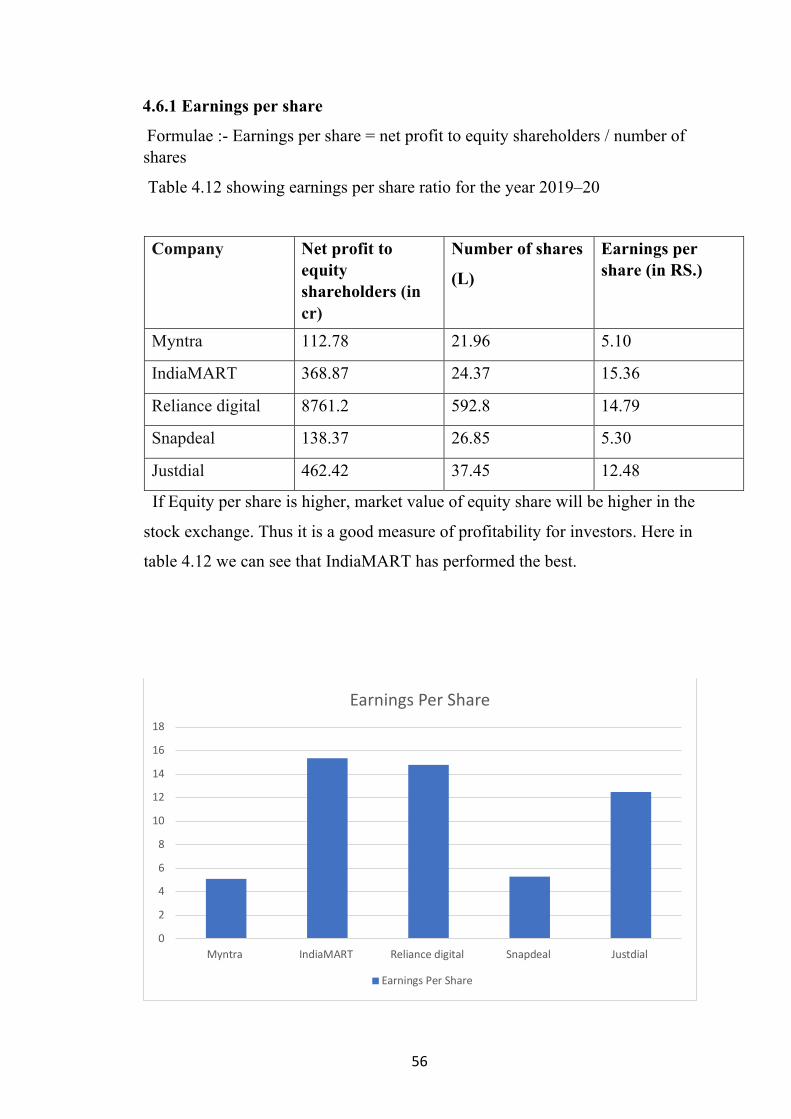
4.6.1 Earnings per share
Formulae :- Earnings per share = net profit to equity shareholders / number of shares
Table 4.12 showing earnings per share ratio for the year 2019–20
Company Net profit to equity shareholders (in cr)
Number of shares
(L)
Earnings per share (in RS.)
Myntra 112.78 21.96 5.10
IndiaMART 368.87 24.37 15.36
Reliance digital 8761.2 592.8 14.79
Snapdeal 138.37 26.85 5.30
Justdial 462.42 37.45 12.48
If Equity per share is higher, market value of equity share will be higher in the
stock exchange. Thus it is a good measure of profitability for investors. Here in
table 4.12 we can see that IndiaMART has performed the best.
0
2
4
6
8
10
12
14
16
18
Myntra IndiaMART Reliance digital Snapdeal Justdial
Earnings Per Share
Earnings Per Share
57
4.6.2. Dividend per share
Formulae:-
Dividend per share ratio = dividend paid to equity shareholders / number of
shares
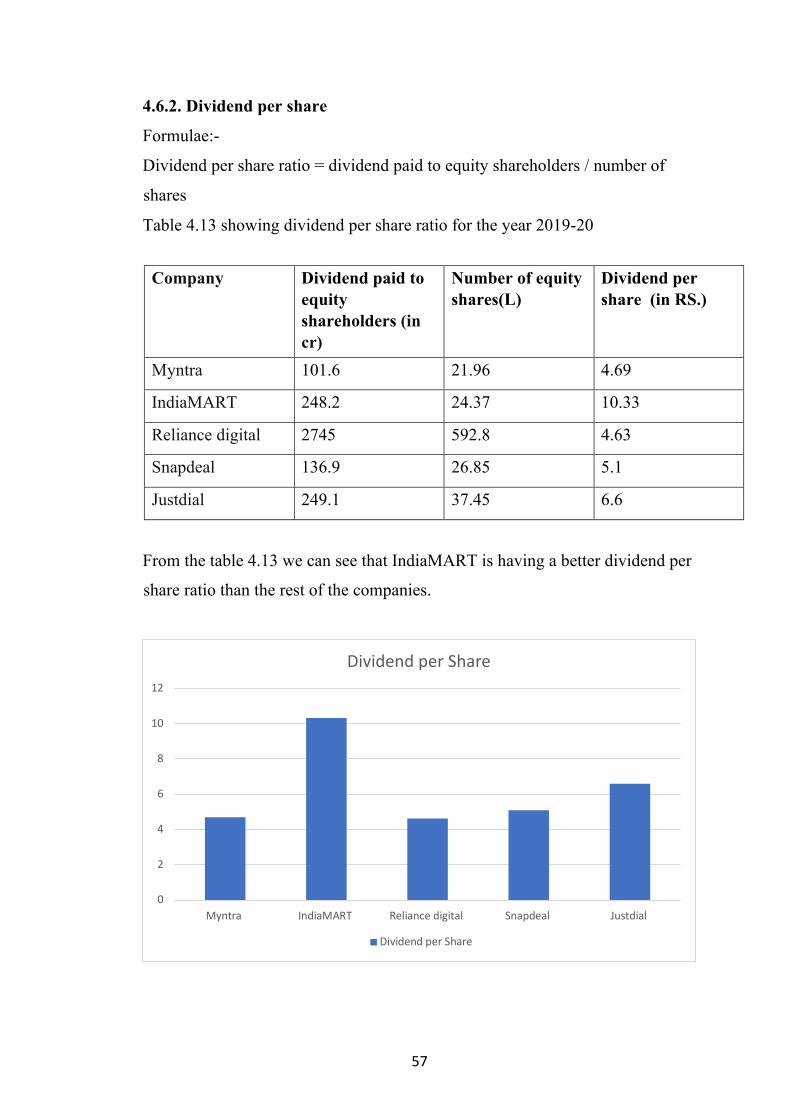
Table 4.13 showing dividend per share ratio for the year 2019-20
Company Dividend paid to
equity shareholders (in cr)
Number of equity shares(L)
Dividend per share (in RS.)
Myntra 101.6 21.96 4.69
IndiaMART 248.2 24.37 10.33
Reliance digital 2745 592.8 4.63
Snapdeal 136.9 26.85 5.1
Justdial 249.1 37.45 6.6
From the table 4.13 we can see that IndiaMART is having a better dividend per
share ratio than the rest of the companies.
0
2
4
6
8
10
12
Myntra IndiaMART Reliance digital Snapdeal Justdial
Dividend per Share
Dividend per Share

58
Chapter-5 Findings, Suggestions and Conclusions
59
5.1 Findings
• Out of the 5 companies IndiaMART is having a better current ratio.
• Quick ratio of the 5 companies has not met the ideal standard. Out of the 5
companies Snapdeal is having a better quick ratio.
• These companies has not attained the standard goal except snapdeal has
achieved close enough and has better debt equity ratio.
• From the 5 companies, IndiaMART and Justdial has met the standard for
proprietary ratio.
• A solvency ratio indicates the degree of solvency of a business. Justdial has the
best solvency ratio.
• Most industries usually consider 10% to be the average, whereas 20% is high,
or above average. Here net profit ratio is highest in Justdial.
• Ideal gross profit ratio is 20% to 25%. Here lndiaMART has attained the ideal
standard.
• Here Justdial has a better return on shareholders fund than the rest.
• The ideal ratio is 2.5 or more. In the above companies Justdial have attained the
highest for total asset turnover ratio.
• Higher the ratio better would be the utilisation of working capital. Reliance
Digital have the best working capital turnover ratio.
• Generally stock turnover ratio of 8 times is considered as ideal. Here we can
see that Snapdeal has the best ratio.
• As a general rule, the higher a company’s EPS, the more profitable it’s likely to
be, though a higher EPS isn’t a guarantee of future performance.
Here we can see that IndiaMART has performed the best.
• we can see that IndiaMART is having a better dividend per share than the rest
of the companies.
60
5.2 Suggestions
• It will be better if the company decreases its current liability to improve
the liquidity ratio and liquidity position.
• Company had to concentrate on debt capital to have smooth running of
company.
• Company must try to use working capital effectively for generating sales
and increasing activity ratio.
• Company has to increase net sales for increasing profitability of the
company and higher profitability will attract more shareholders.
• The debt makes an impact on the profitability of the organisation. The
company should enlarge its capital base immediately by adopting long
term sources of finance.
• The shareholders fund has to be raised more, so as to bring the debt
equity ratio to the standard level.
5.3 Conclusion
The study highlights that the financial performance for Myntra, IndiaMART,
Justdial, Reliance digital and Snapdeal are satisfactory. This study helps to
know the financial strengths and weakness of these 5 ecommerce
companies.
The project entitled on “A STUDY ON FINANACIAL ANAYSIS OF TOP
5 E-COMMERCE COMPANIES IN INDIA”. Financial performance is the
process of measuring the result of a firm’s overall financial health over a
given period of time and can also use to compare similar firm’s across the
same industries or sectors utmost care has been taken at all levels of project
work right the beginning of analysing accounting information provided by
profit and loss account balance sheet. The project is conducted to find out
their financial performance. From the analysis and interpretation we have a
clear comparison about the top 5 ecommerce companies in India

61
BIBLOGRAPHY
62
BIBLIOGRAPHY Books
1. Dr. Venugopalan, “Business Reaches Methods”. Calicut university
Central stories ltd.no.4347
2. M.Pandey, ”financial management” ninth edition Vikas publishing
house.
3. A.Vinod, “Accounting for management”, Calicut university central
cooperative studios ltd no.4347 Calicut university.
Journals
1. Shaheena Sulthana (2017). “An brief discussion of search engine
marketing and ecommerce companies”. Imperical journal of
interdisciplinary studies, vol.3 issue 1 pp 1-34.
2. Subashini(2016). “Identification and examination of the driverws of
ecommerce companies”. A corporative prospective, working paper 301,
centre for development studies, pp 38-89.
3. Dr.Anukrati Sharma (2013). “A study on e commerce and online
shopping”. Science education development education, vol(2), pp 101-
139.
4. Abhijit Mitra (2013). “E commerce in India -A review”. International
research journal of finanace and economics, vol(4), pp 29-49.
5. Nisha Channa and Sangeeta Goele (2012). “Future of e commerce in
India. International management reviews. Vol 4, pp 69-94.
6. Sarbapriya Ray 2011. “Emerging Trends of E-commerce in India:
Some Crucial Issues Prospects and Challenges”. vol 4, pp 401-438.
7. Aditi Srivatsan, 2001. “Shift in the information technology”. Vol4, pp
789-800.
63
8. Rajendra Sarode, 2003. “Paradigm shift in the ecommerce industry”.
Vol 231-253.
9. Dr Rajeshwari Shettar,2004. “Study and analyse the completely
revolutionized mode of business”. Vol 4 pp 432-489.
10. Pandey.M, 2003. “Brief study of indian e commerce sector”. Vol 3 pp
342-378.
Websites
1. www.myntra.com
2. www.justdial.com
3. m.snapdeal.com
4. www.reliancedigital.in
5. M.indiamart.com
6. www.shodhganga.com
7. www.moneycontrol.com
64
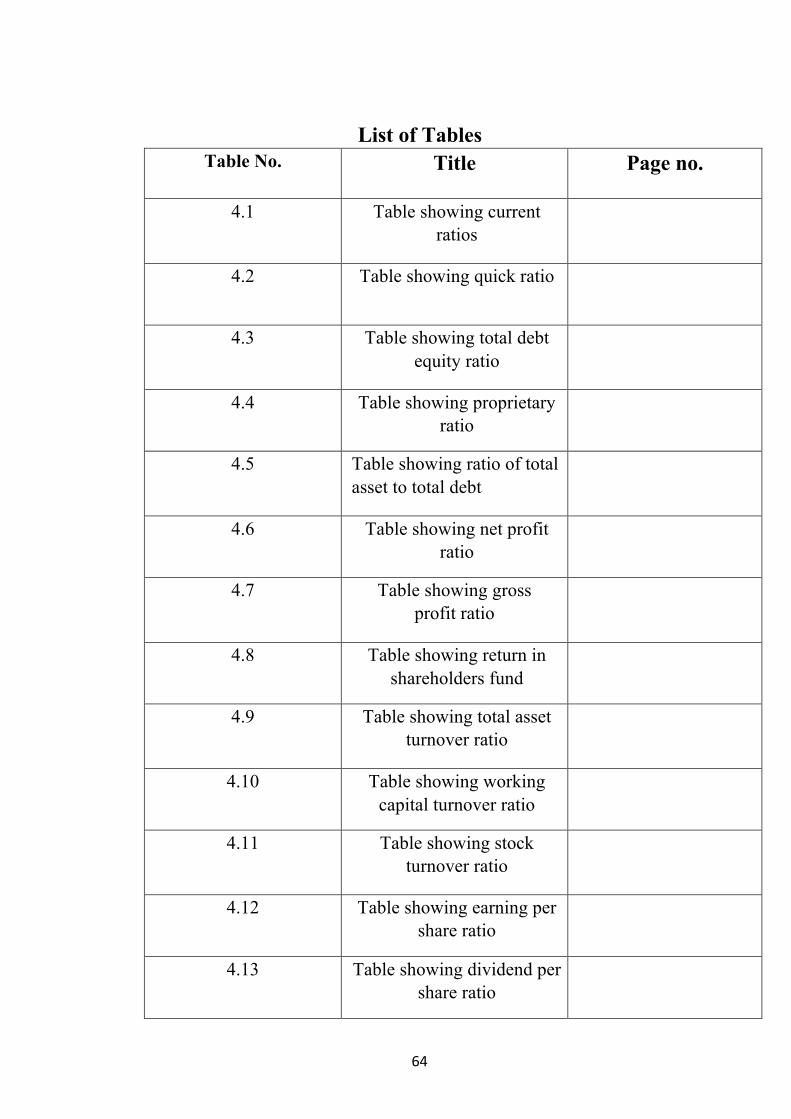
List of Tables
Table No. Title Page no.
4.1 Table showing current ratios
4.2 Table showing quick ratio
4.3 Table showing total debt equity ratio
4.4 Table showing proprietary ratio
4.5 Table showing ratio of total asset to total debt
4.6 Table showing net profit ratio
4.7 Table showing gross profit ratio
4.8 Table showing return in shareholders fund
4.9 Table showing total asset turnover ratio
4.10 Table showing working capital turnover ratio
4.11 Table showing stock turnover ratio
4.12 Table showing earning per share ratio
4.13 Table showing dividend per share ratio

65
APPENDIX
66
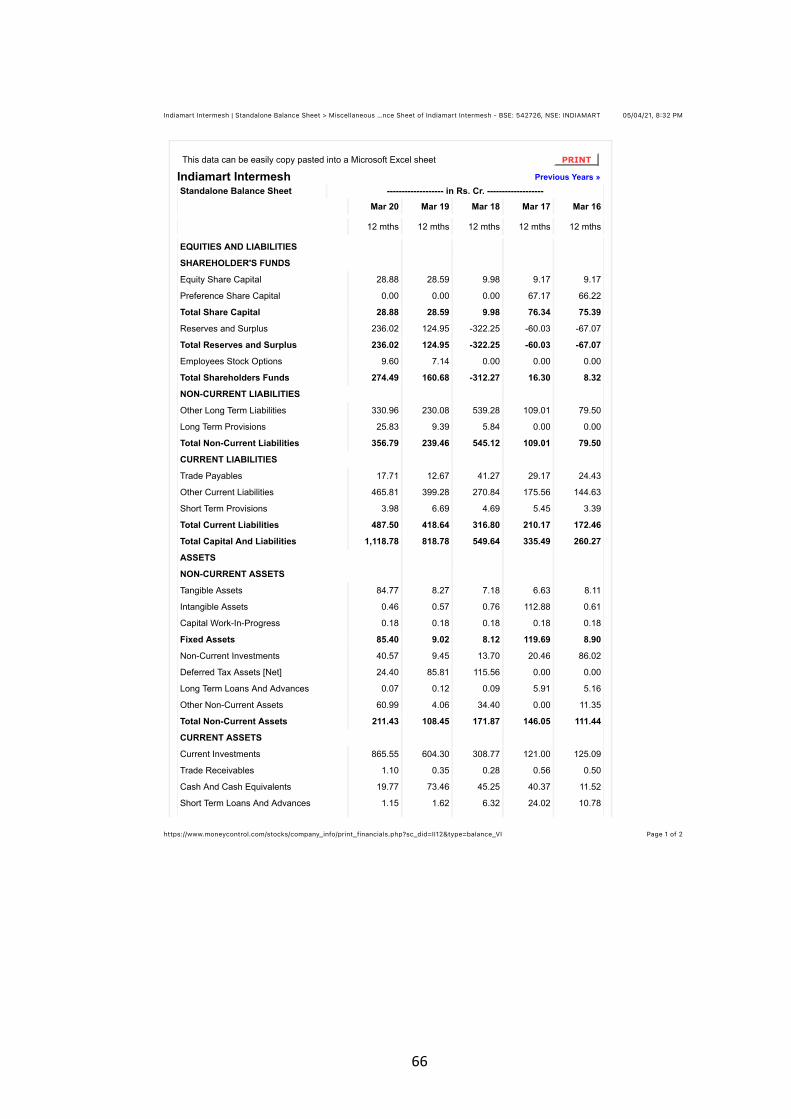
05/04/21, 8:32 PMIndiamart Intermesh | Standalone Balance Sheet > Miscellaneous …nce Sheet of Indiamart Intermesh - BSE: 542726, NSE: INDIAMART
Page 1 of 2https://www.moneycontrol.com/stocks/company_info/print_financials.php?sc_did=II12&type=balance_VI
This data can be easily copy pasted into a Microsoft Excel sheet PRINT
Indiamart Intermesh Previous Years »Standalone Balance Sheet ------------------- in Rs. Cr. -------------------
Mar 20 Mar 19 Mar 18 Mar 17 Mar 16
12 mths 12 mths 12 mths 12 mths 12 mths
EQUITIES AND LIABILITIES
SHAREHOLDER'S FUNDS
Equity Share Capital 28.88 28.59 9.98 9.17 9.17
Preference Share Capital 0.00 0.00 0.00 67.17 66.22
Total Share Capital 28.88 28.59 9.98 76.34 75.39
Reserves and Surplus 236.02 124.95 -322.25 -60.03 -67.07
Total Reserves and Surplus 236.02 124.95 -322.25 -60.03 -67.07
Employees Stock Options 9.60 7.14 0.00 0.00 0.00
Total Shareholders Funds 274.49 160.68 -312.27 16.30 8.32
NON-CURRENT LIABILITIES
Other Long Term Liabilities 330.96 230.08 539.28 109.01 79.50
Long Term Provisions 25.83 9.39 5.84 0.00 0.00
Total Non-Current Liabilities 356.79 239.46 545.12 109.01 79.50
CURRENT LIABILITIES
Trade Payables 17.71 12.67 41.27 29.17 24.43
Other Current Liabilities 465.81 399.28 270.84 175.56 144.63
Short Term Provisions 3.98 6.69 4.69 5.45 3.39
Total Current Liabilities 487.50 418.64 316.80 210.17 172.46
Total Capital And Liabilities 1,118.78 818.78 549.64 335.49 260.27
ASSETS
NON-CURRENT ASSETS
Tangible Assets 84.77 8.27 7.18 6.63 8.11
Intangible Assets 0.46 0.57 0.76 112.88 0.61
Capital Work-In-Progress 0.18 0.18 0.18 0.18 0.18
Fixed Assets 85.40 9.02 8.12 119.69 8.90
Non-Current Investments 40.57 9.45 13.70 20.46 86.02
Deferred Tax Assets [Net] 24.40 85.81 115.56 0.00 0.00
Long Term Loans And Advances 0.07 0.12 0.09 5.91 5.16
Other Non-Current Assets 60.99 4.06 34.40 0.00 11.35
Total Non-Current Assets 211.43 108.45 171.87 146.05 111.44
CURRENT ASSETS
Current Investments 865.55 604.30 308.77 121.00 125.09
Trade Receivables 1.10 0.35 0.28 0.56 0.50
Cash And Cash Equivalents 19.77 73.46 45.25 40.37 11.52
Short Term Loans And Advances 1.15 1.62 6.32 24.02 10.78
67
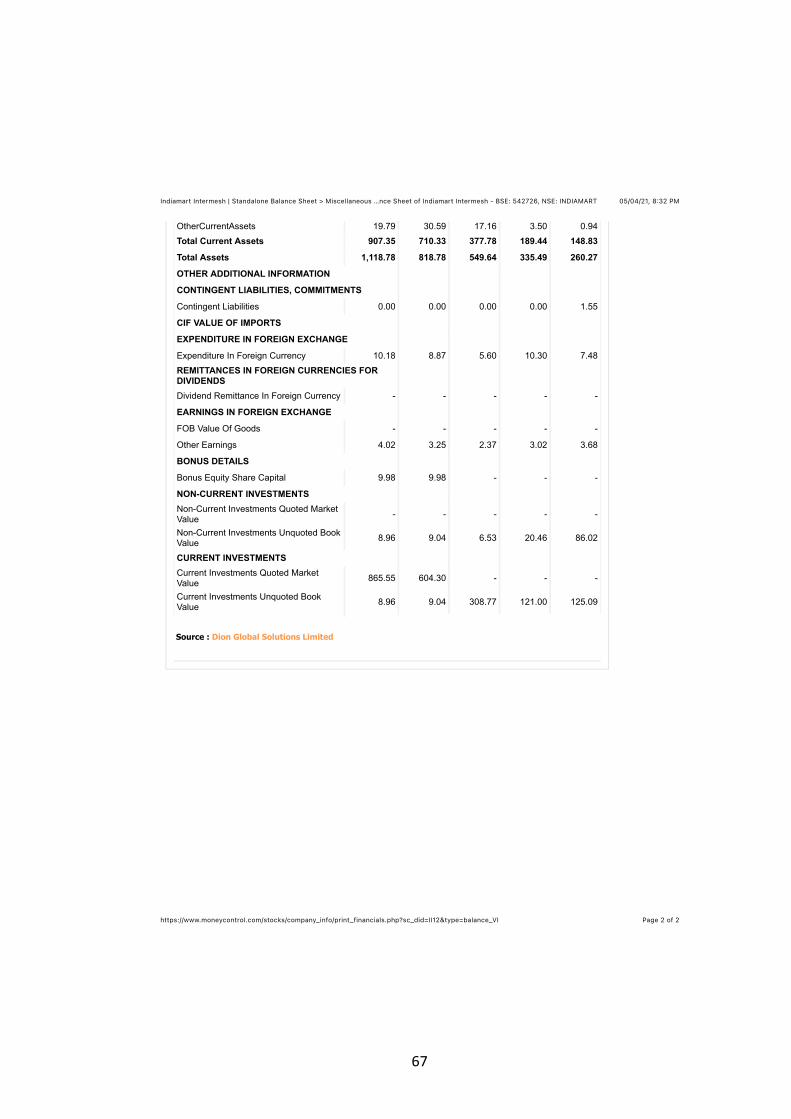
05/04/21, 8:32 PMIndiamart Intermesh | Standalone Balance Sheet > Miscellaneous …nce Sheet of Indiamart Intermesh - BSE: 542726, NSE: INDIAMART
Page 2 of 2https://www.moneycontrol.com/stocks/company_info/print_financials.php?sc_did=II12&type=balance_VI
OtherCurrentAssets 19.79 30.59 17.16 3.50 0.94
Total Current Assets 907.35 710.33 377.78 189.44 148.83
Total Assets 1,118.78 818.78 549.64 335.49 260.27
OTHER ADDITIONAL INFORMATION
CONTINGENT LIABILITIES, COMMITMENTS
Contingent Liabilities 0.00 0.00 0.00 0.00 1.55
CIF VALUE OF IMPORTS
EXPENDITURE IN FOREIGN EXCHANGE
Expenditure In Foreign Currency 10.18 8.87 5.60 10.30 7.48
REMITTANCES IN FOREIGN CURRENCIES FORDIVIDENDSDividend Remittance In Foreign Currency - - - - -
EARNINGS IN FOREIGN EXCHANGE
FOB Value Of Goods - - - - -
Other Earnings 4.02 3.25 2.37 3.02 3.68
BONUS DETAILS
Bonus Equity Share Capital 9.98 9.98 - - -
NON-CURRENT INVESTMENTSNon-Current Investments Quoted MarketValue - - - - -
Non-Current Investments Unquoted BookValue 8.96 9.04 6.53 20.46 86.02
CURRENT INVESTMENTSCurrent Investments Quoted MarketValue 865.55 604.30 - - -
Current Investments Unquoted BookValue 8.96 9.04 308.77 121.00 125.09
Source : Dion Global Solutions Limited
68
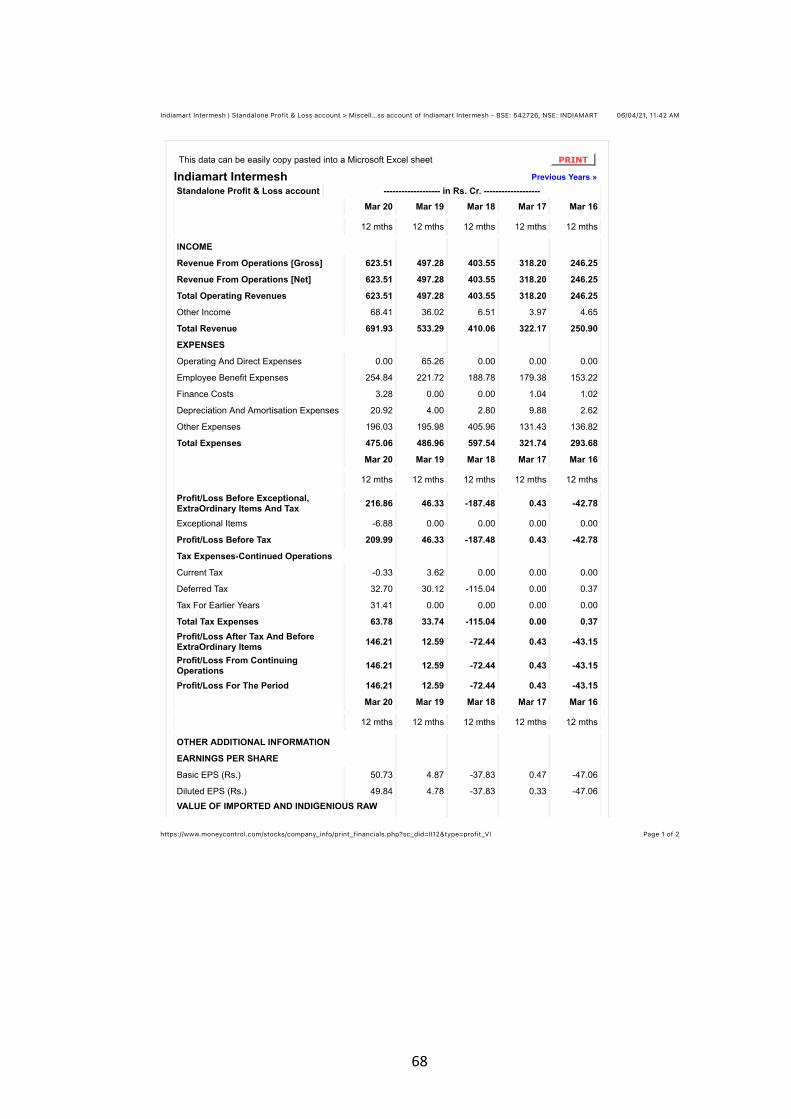
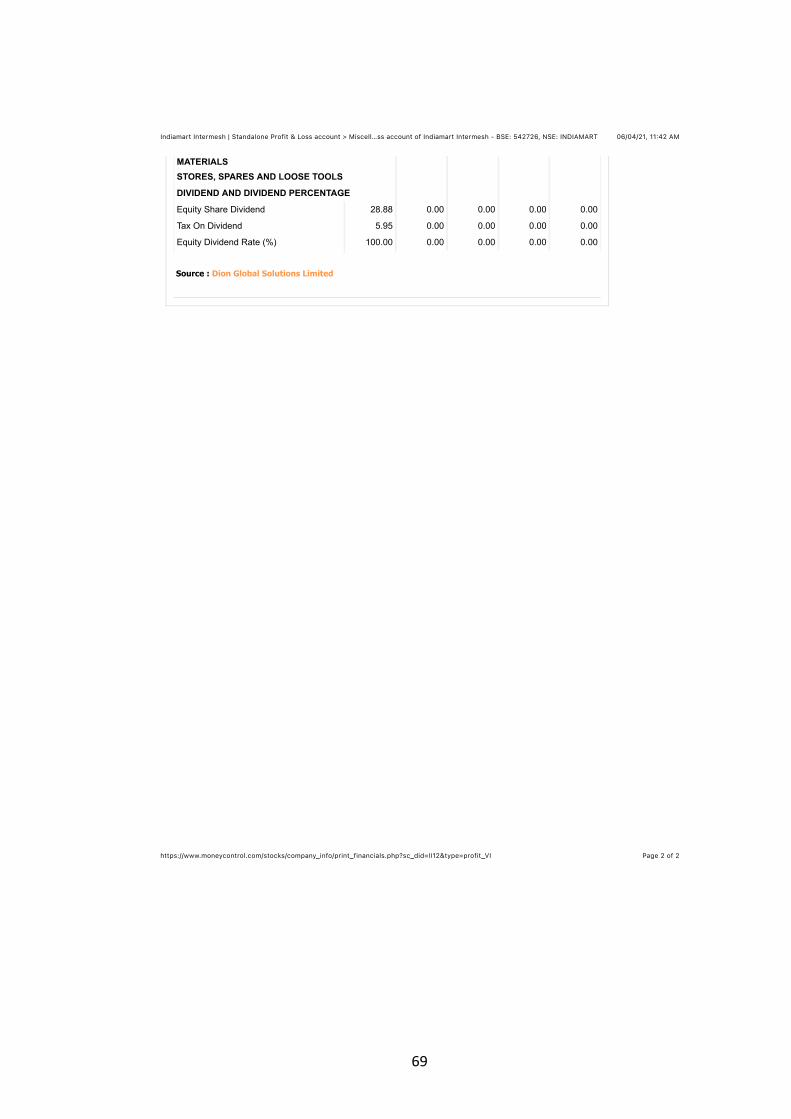
06/04/21, 11:42 AMIndiamart Intermesh | Standalone Profit & Loss account > Miscell…ss account of Indiamart Intermesh - BSE: 542726, NSE: INDIAMART
Page 1 of 2https://www.moneycontrol.com/stocks/company_info/print_financials.php?sc_did=II12&type=profit_VI
This data can be easily copy pasted into a Microsoft Excel sheet PRINT
Indiamart Intermesh Previous Years »Standalone Profit & Loss account ------------------- in Rs. Cr. -------------------
Mar 20 Mar 19 Mar 18 Mar 17 Mar 16
12 mths 12 mths 12 mths 12 mths 12 mths
INCOME
Revenue From Operations [Gross] 623.51 497.28 403.55 318.20 246.25
Revenue From Operations [Net] 623.51 497.28 403.55 318.20 246.25
Total Operating Revenues 623.51 497.28 403.55 318.20 246.25
Other Income 68.41 36.02 6.51 3.97 4.65
Total Revenue 691.93 533.29 410.06 322.17 250.90
EXPENSES
Operating And Direct Expenses 0.00 65.26 0.00 0.00 0.00
Employee Benefit Expenses 254.84 221.72 188.78 179.38 153.22
Finance Costs 3.28 0.00 0.00 1.04 1.02
Depreciation And Amortisation Expenses 20.92 4.00 2.80 9.88 2.62
Other Expenses 196.03 195.98 405.96 131.43 136.82
Total Expenses 475.06 486.96 597.54 321.74 293.68
Mar 20 Mar 19 Mar 18 Mar 17 Mar 16
12 mths 12 mths 12 mths 12 mths 12 mths
Profit/Loss Before Exceptional,ExtraOrdinary Items And Tax 216.86 46.33 -187.48 0.43 -42.78
Exceptional Items -6.88 0.00 0.00 0.00 0.00
Profit/Loss Before Tax 209.99 46.33 -187.48 0.43 -42.78
Tax Expenses-Continued Operations
Current Tax -0.33 3.62 0.00 0.00 0.00
Deferred Tax 32.70 30.12 -115.04 0.00 0.37
Tax For Earlier Years 31.41 0.00 0.00 0.00 0.00
Total Tax Expenses 63.78 33.74 -115.04 0.00 0.37Profit/Loss After Tax And BeforeExtraOrdinary Items 146.21 12.59 -72.44 0.43 -43.15
Profit/Loss From ContinuingOperations 146.21 12.59 -72.44 0.43 -43.15
Profit/Loss For The Period 146.21 12.59 -72.44 0.43 -43.15
Mar 20 Mar 19 Mar 18 Mar 17 Mar 16
12 mths 12 mths 12 mths 12 mths 12 mths
OTHER ADDITIONAL INFORMATION
EARNINGS PER SHARE
Basic EPS (Rs.) 50.73 4.87 -37.83 0.47 -47.06
Diluted EPS (Rs.) 49.84 4.78 -37.83 0.33 -47.06
VALUE OF IMPORTED AND INDIGENIOUS RAW
69
06/04/21, 11:42 AMIndiamart Intermesh | Standalone Profit & Loss account > Miscell…ss account of Indiamart Intermesh - BSE: 542726, NSE: INDIAMART
Page 2 of 2https://www.moneycontrol.com/stocks/company_info/print_financials.php?sc_did=II12&type=profit_VI
MATERIALSSTORES, SPARES AND LOOSE TOOLS
DIVIDEND AND DIVIDEND PERCENTAGE
Equity Share Dividend 28.88 0.00 0.00 0.00 0.00
Tax On Dividend 5.95 0.00 0.00 0.00 0.00
Equity Dividend Rate (%) 100.00 0.00 0.00 0.00 0.00
Source : Dion Global Solutions Limited
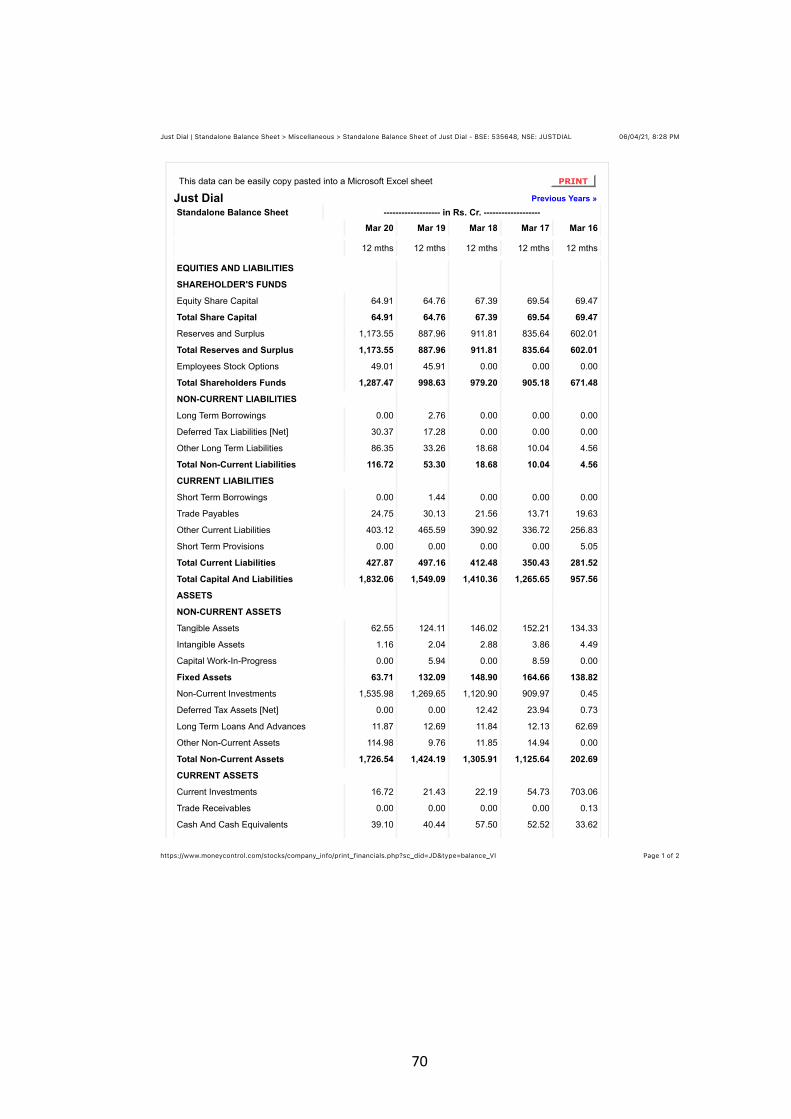
70
06/04/21, 8:28 PMJust Dial | Standalone Balance Sheet > Miscellaneous > Standalone Balance Sheet of Just Dial - BSE: 535648, NSE: JUSTDIAL
Page 1 of 2https://www.moneycontrol.com/stocks/company_info/print_financials.php?sc_did=JD&type=balance_VI
This data can be easily copy pasted into a Microsoft Excel sheet PRINT
Just Dial Previous Years »Standalone Balance Sheet ------------------- in Rs. Cr. -------------------
Mar 20 Mar 19 Mar 18 Mar 17 Mar 16
12 mths 12 mths 12 mths 12 mths 12 mths
EQUITIES AND LIABILITIES
SHAREHOLDER'S FUNDS
Equity Share Capital 64.91 64.76 67.39 69.54 69.47
Total Share Capital 64.91 64.76 67.39 69.54 69.47
Reserves and Surplus 1,173.55 887.96 911.81 835.64 602.01
Total Reserves and Surplus 1,173.55 887.96 911.81 835.64 602.01
Employees Stock Options 49.01 45.91 0.00 0.00 0.00
Total Shareholders Funds 1,287.47 998.63 979.20 905.18 671.48
NON-CURRENT LIABILITIES
Long Term Borrowings 0.00 2.76 0.00 0.00 0.00
Deferred Tax Liabilities [Net] 30.37 17.28 0.00 0.00 0.00
Other Long Term Liabilities 86.35 33.26 18.68 10.04 4.56
Total Non-Current Liabilities 116.72 53.30 18.68 10.04 4.56
CURRENT LIABILITIES
Short Term Borrowings 0.00 1.44 0.00 0.00 0.00
Trade Payables 24.75 30.13 21.56 13.71 19.63
Other Current Liabilities 403.12 465.59 390.92 336.72 256.83
Short Term Provisions 0.00 0.00 0.00 0.00 5.05
Total Current Liabilities 427.87 497.16 412.48 350.43 281.52
Total Capital And Liabilities 1,832.06 1,549.09 1,410.36 1,265.65 957.56
ASSETS
NON-CURRENT ASSETS
Tangible Assets 62.55 124.11 146.02 152.21 134.33
Intangible Assets 1.16 2.04 2.88 3.86 4.49
Capital Work-In-Progress 0.00 5.94 0.00 8.59 0.00
Fixed Assets 63.71 132.09 148.90 164.66 138.82
Non-Current Investments 1,535.98 1,269.65 1,120.90 909.97 0.45
Deferred Tax Assets [Net] 0.00 0.00 12.42 23.94 0.73
Long Term Loans And Advances 11.87 12.69 11.84 12.13 62.69
Other Non-Current Assets 114.98 9.76 11.85 14.94 0.00
Total Non-Current Assets 1,726.54 1,424.19 1,305.91 1,125.64 202.69
CURRENT ASSETS
Current Investments 16.72 21.43 22.19 54.73 703.06
Trade Receivables 0.00 0.00 0.00 0.00 0.13
Cash And Cash Equivalents 39.10 40.44 57.50 52.52 33.62
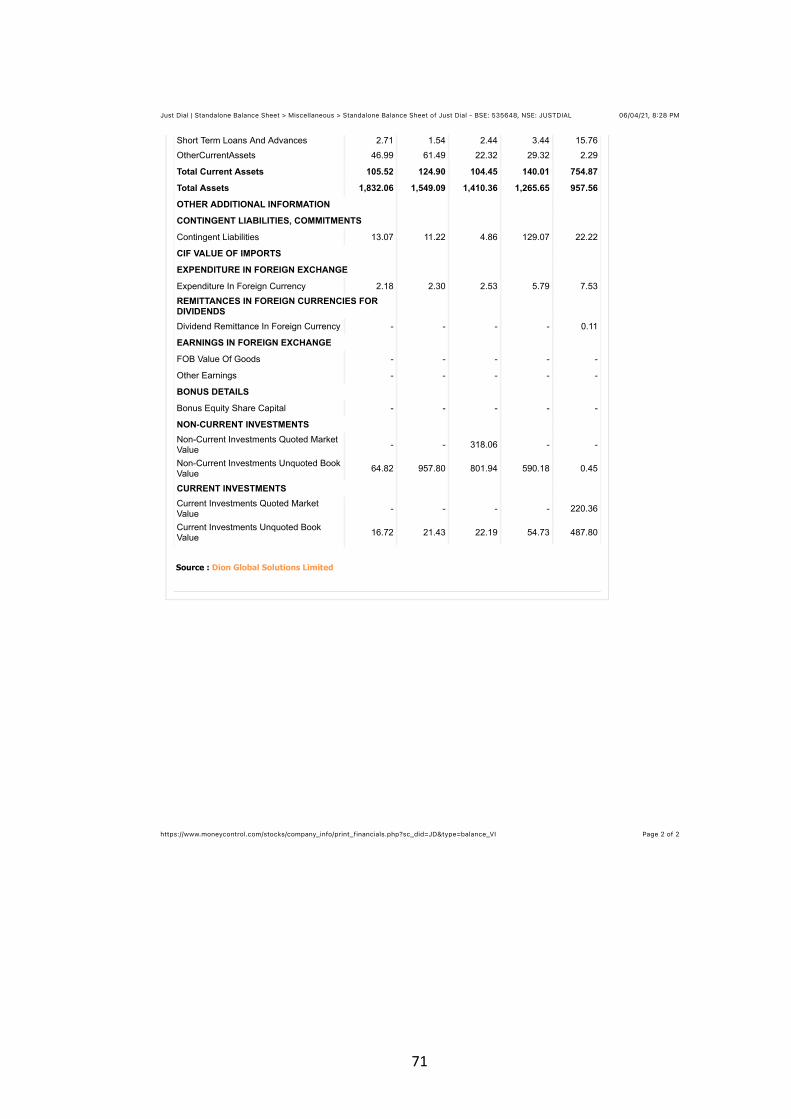
71
06/04/21, 8:28 PMJust Dial | Standalone Balance Sheet > Miscellaneous > Standalone Balance Sheet of Just Dial - BSE: 535648, NSE: JUSTDIAL
Page 2 of 2https://www.moneycontrol.com/stocks/company_info/print_financials.php?sc_did=JD&type=balance_VI
Short Term Loans And Advances 2.71 1.54 2.44 3.44 15.76
OtherCurrentAssets 46.99 61.49 22.32 29.32 2.29
Total Current Assets 105.52 124.90 104.45 140.01 754.87
Total Assets 1,832.06 1,549.09 1,410.36 1,265.65 957.56
OTHER ADDITIONAL INFORMATION
CONTINGENT LIABILITIES, COMMITMENTS
Contingent Liabilities 13.07 11.22 4.86 129.07 22.22
CIF VALUE OF IMPORTS
EXPENDITURE IN FOREIGN EXCHANGE
Expenditure In Foreign Currency 2.18 2.30 2.53 5.79 7.53
REMITTANCES IN FOREIGN CURRENCIES FORDIVIDENDSDividend Remittance In Foreign Currency - - - - 0.11
EARNINGS IN FOREIGN EXCHANGE
FOB Value Of Goods - - - - -
Other Earnings - - - - -
BONUS DETAILS
Bonus Equity Share Capital - - - - -
NON-CURRENT INVESTMENTSNon-Current Investments Quoted MarketValue - - 318.06 - -
Non-Current Investments Unquoted BookValue 64.82 957.80 801.94 590.18 0.45
CURRENT INVESTMENTSCurrent Investments Quoted MarketValue - - - - 220.36
Current Investments Unquoted BookValue 16.72 21.43 22.19 54.73 487.80
Source : Dion Global Solutions Limited
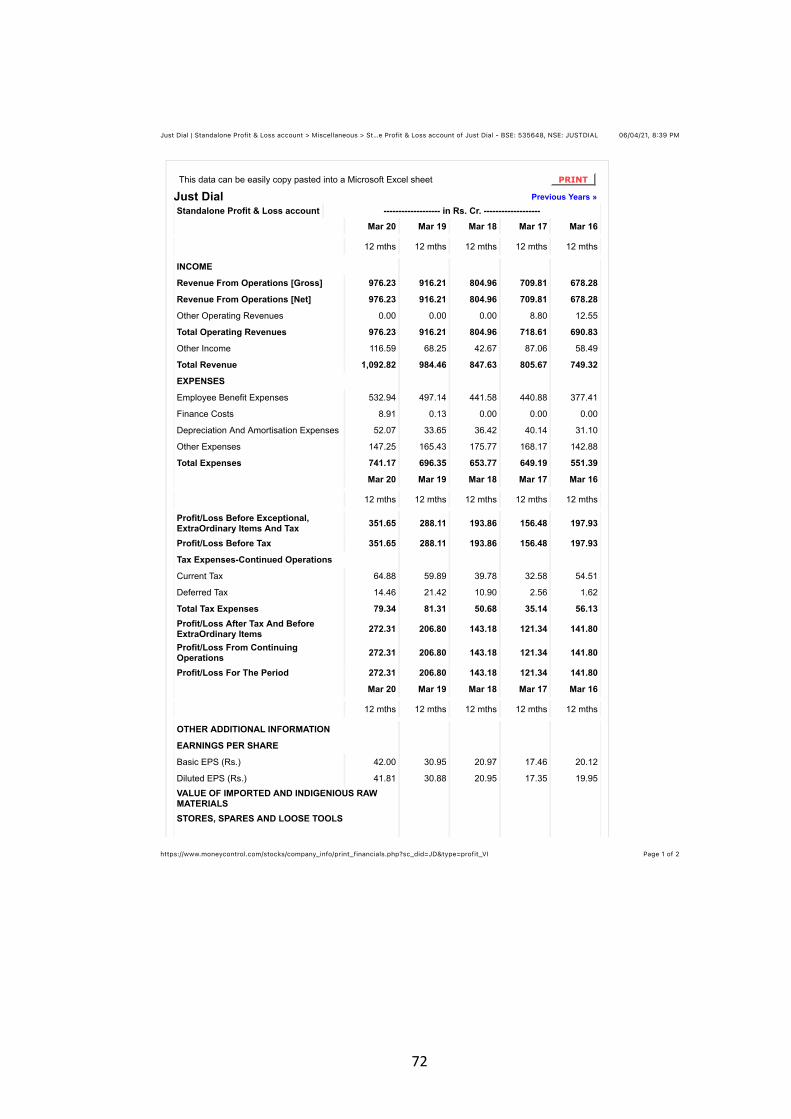
72
06/04/21, 8:39 PMJust Dial | Standalone Profit & Loss account > Miscellaneous > St…e Profit & Loss account of Just Dial - BSE: 535648, NSE: JUSTDIAL
Page 1 of 2https://www.moneycontrol.com/stocks/company_info/print_financials.php?sc_did=JD&type=profit_VI
This data can be easily copy pasted into a Microsoft Excel sheet PRINT
Just Dial Previous Years »Standalone Profit & Loss account ------------------- in Rs. Cr. -------------------
Mar 20 Mar 19 Mar 18 Mar 17 Mar 16
12 mths 12 mths 12 mths 12 mths 12 mths
INCOME
Revenue From Operations [Gross] 976.23 916.21 804.96 709.81 678.28
Revenue From Operations [Net] 976.23 916.21 804.96 709.81 678.28
Other Operating Revenues 0.00 0.00 0.00 8.80 12.55
Total Operating Revenues 976.23 916.21 804.96 718.61 690.83
Other Income 116.59 68.25 42.67 87.06 58.49
Total Revenue 1,092.82 984.46 847.63 805.67 749.32
EXPENSES
Employee Benefit Expenses 532.94 497.14 441.58 440.88 377.41
Finance Costs 8.91 0.13 0.00 0.00 0.00
Depreciation And Amortisation Expenses 52.07 33.65 36.42 40.14 31.10
Other Expenses 147.25 165.43 175.77 168.17 142.88
Total Expenses 741.17 696.35 653.77 649.19 551.39
Mar 20 Mar 19 Mar 18 Mar 17 Mar 16
12 mths 12 mths 12 mths 12 mths 12 mths
Profit/Loss Before Exceptional,ExtraOrdinary Items And Tax 351.65 288.11 193.86 156.48 197.93
Profit/Loss Before Tax 351.65 288.11 193.86 156.48 197.93
Tax Expenses-Continued Operations
Current Tax 64.88 59.89 39.78 32.58 54.51
Deferred Tax 14.46 21.42 10.90 2.56 1.62
Total Tax Expenses 79.34 81.31 50.68 35.14 56.13Profit/Loss After Tax And BeforeExtraOrdinary Items 272.31 206.80 143.18 121.34 141.80
Profit/Loss From ContinuingOperations 272.31 206.80 143.18 121.34 141.80
Profit/Loss For The Period 272.31 206.80 143.18 121.34 141.80
Mar 20 Mar 19 Mar 18 Mar 17 Mar 16
12 mths 12 mths 12 mths 12 mths 12 mths
OTHER ADDITIONAL INFORMATION
EARNINGS PER SHARE
Basic EPS (Rs.) 42.00 30.95 20.97 17.46 20.12
Diluted EPS (Rs.) 41.81 30.88 20.95 17.35 19.95
VALUE OF IMPORTED AND INDIGENIOUS RAWMATERIALSSTORES, SPARES AND LOOSE TOOLS
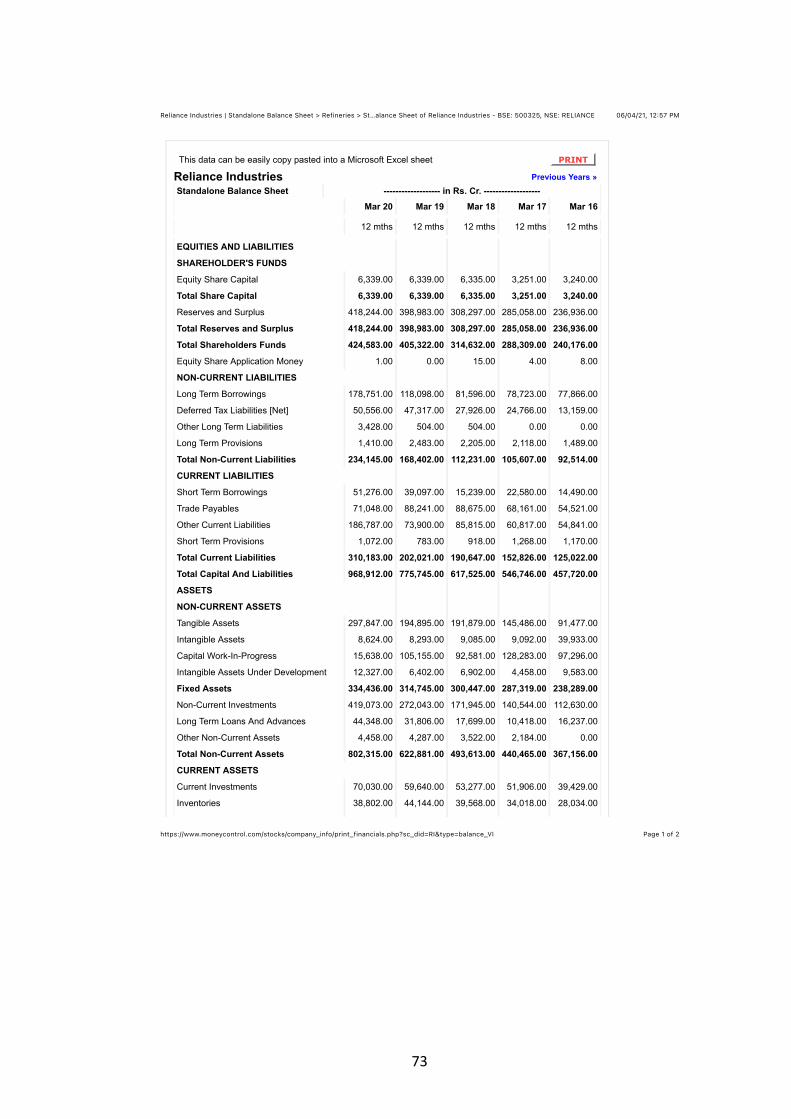
73
06/04/21, 12:57 PMReliance Industries | Standalone Balance Sheet > Refineries > St…alance Sheet of Reliance Industries - BSE: 500325, NSE: RELIANCE
Page 1 of 2https://www.moneycontrol.com/stocks/company_info/print_financials.php?sc_did=RI&type=balance_VI
This data can be easily copy pasted into a Microsoft Excel sheet PRINT
Reliance Industries Previous Years »Standalone Balance Sheet ------------------- in Rs. Cr. -------------------
Mar 20 Mar 19 Mar 18 Mar 17 Mar 16
12 mths 12 mths 12 mths 12 mths 12 mths
EQUITIES AND LIABILITIES
SHAREHOLDER'S FUNDS
Equity Share Capital 6,339.00 6,339.00 6,335.00 3,251.00 3,240.00
Total Share Capital 6,339.00 6,339.00 6,335.00 3,251.00 3,240.00
Reserves and Surplus 418,244.00 398,983.00 308,297.00 285,058.00 236,936.00
Total Reserves and Surplus 418,244.00 398,983.00 308,297.00 285,058.00 236,936.00
Total Shareholders Funds 424,583.00 405,322.00 314,632.00 288,309.00 240,176.00
Equity Share Application Money 1.00 0.00 15.00 4.00 8.00
NON-CURRENT LIABILITIES
Long Term Borrowings 178,751.00 118,098.00 81,596.00 78,723.00 77,866.00
Deferred Tax Liabilities [Net] 50,556.00 47,317.00 27,926.00 24,766.00 13,159.00
Other Long Term Liabilities 3,428.00 504.00 504.00 0.00 0.00
Long Term Provisions 1,410.00 2,483.00 2,205.00 2,118.00 1,489.00
Total Non-Current Liabilities 234,145.00 168,402.00 112,231.00 105,607.00 92,514.00
CURRENT LIABILITIES
Short Term Borrowings 51,276.00 39,097.00 15,239.00 22,580.00 14,490.00
Trade Payables 71,048.00 88,241.00 88,675.00 68,161.00 54,521.00
Other Current Liabilities 186,787.00 73,900.00 85,815.00 60,817.00 54,841.00
Short Term Provisions 1,072.00 783.00 918.00 1,268.00 1,170.00
Total Current Liabilities 310,183.00 202,021.00 190,647.00 152,826.00 125,022.00
Total Capital And Liabilities 968,912.00 775,745.00 617,525.00 546,746.00 457,720.00
ASSETS
NON-CURRENT ASSETS
Tangible Assets 297,847.00 194,895.00 191,879.00 145,486.00 91,477.00
Intangible Assets 8,624.00 8,293.00 9,085.00 9,092.00 39,933.00
Capital Work-In-Progress 15,638.00 105,155.00 92,581.00 128,283.00 97,296.00
Intangible Assets Under Development 12,327.00 6,402.00 6,902.00 4,458.00 9,583.00
Fixed Assets 334,436.00 314,745.00 300,447.00 287,319.00 238,289.00
Non-Current Investments 419,073.00 272,043.00 171,945.00 140,544.00 112,630.00
Long Term Loans And Advances 44,348.00 31,806.00 17,699.00 10,418.00 16,237.00
Other Non-Current Assets 4,458.00 4,287.00 3,522.00 2,184.00 0.00
Total Non-Current Assets 802,315.00 622,881.00 493,613.00 440,465.00 367,156.00
CURRENT ASSETS
Current Investments 70,030.00 59,640.00 53,277.00 51,906.00 39,429.00
Inventories 38,802.00 44,144.00 39,568.00 34,018.00 28,034.00
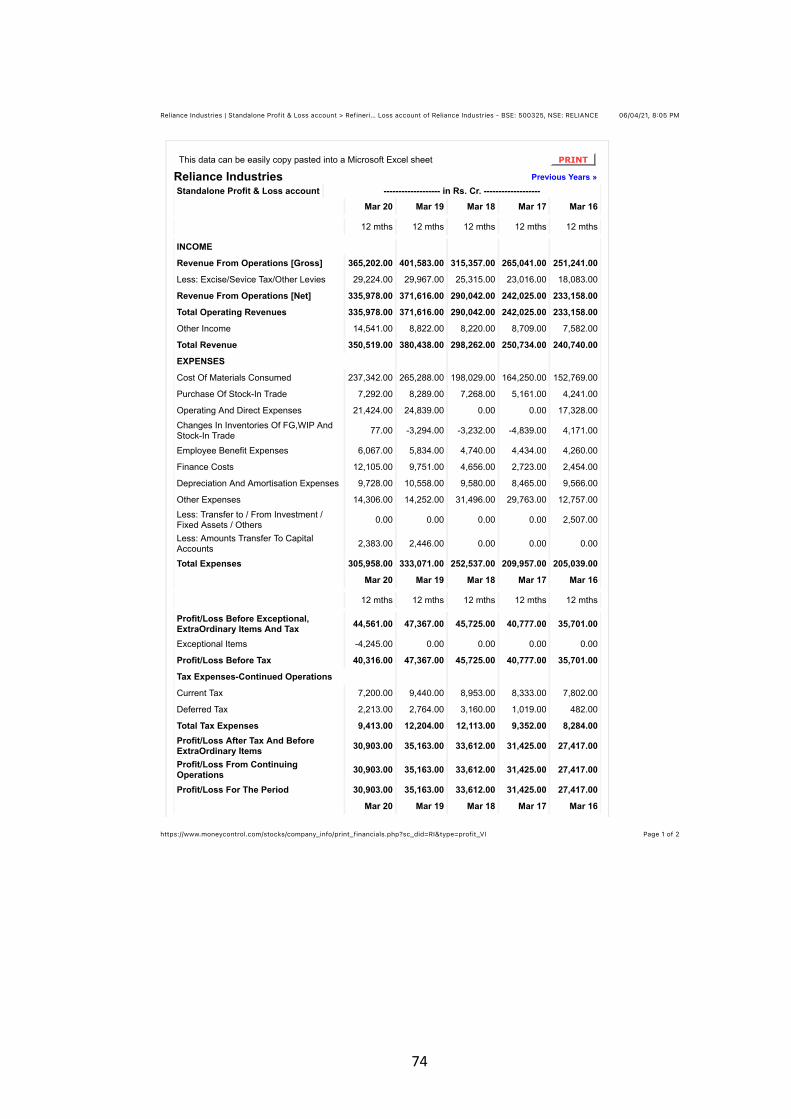
74
06/04/21, 8:05 PMReliance Industries | Standalone Profit & Loss account > Refineri… Loss account of Reliance Industries - BSE: 500325, NSE: RELIANCE
Page 1 of 2https://www.moneycontrol.com/stocks/company_info/print_financials.php?sc_did=RI&type=profit_VI
This data can be easily copy pasted into a Microsoft Excel sheet PRINT
Reliance Industries Previous Years »Standalone Profit & Loss account ------------------- in Rs. Cr. -------------------
Mar 20 Mar 19 Mar 18 Mar 17 Mar 16
12 mths 12 mths 12 mths 12 mths 12 mths
INCOME
Revenue From Operations [Gross] 365,202.00 401,583.00 315,357.00 265,041.00 251,241.00
Less: Excise/Sevice Tax/Other Levies 29,224.00 29,967.00 25,315.00 23,016.00 18,083.00
Revenue From Operations [Net] 335,978.00 371,616.00 290,042.00 242,025.00 233,158.00
Total Operating Revenues 335,978.00 371,616.00 290,042.00 242,025.00 233,158.00
Other Income 14,541.00 8,822.00 8,220.00 8,709.00 7,582.00
Total Revenue 350,519.00 380,438.00 298,262.00 250,734.00 240,740.00
EXPENSES
Cost Of Materials Consumed 237,342.00 265,288.00 198,029.00 164,250.00 152,769.00
Purchase Of Stock-In Trade 7,292.00 8,289.00 7,268.00 5,161.00 4,241.00
Operating And Direct Expenses 21,424.00 24,839.00 0.00 0.00 17,328.00
Changes In Inventories Of FG,WIP AndStock-In Trade 77.00 -3,294.00 -3,232.00 -4,839.00 4,171.00
Employee Benefit Expenses 6,067.00 5,834.00 4,740.00 4,434.00 4,260.00
Finance Costs 12,105.00 9,751.00 4,656.00 2,723.00 2,454.00
Depreciation And Amortisation Expenses 9,728.00 10,558.00 9,580.00 8,465.00 9,566.00
Other Expenses 14,306.00 14,252.00 31,496.00 29,763.00 12,757.00
Less: Transfer to / From Investment /Fixed Assets / Others 0.00 0.00 0.00 0.00 2,507.00
Less: Amounts Transfer To CapitalAccounts 2,383.00 2,446.00 0.00 0.00 0.00
Total Expenses 305,958.00 333,071.00 252,537.00 209,957.00 205,039.00
Mar 20 Mar 19 Mar 18 Mar 17 Mar 16
12 mths 12 mths 12 mths 12 mths 12 mths
Profit/Loss Before Exceptional,ExtraOrdinary Items And Tax 44,561.00 47,367.00 45,725.00 40,777.00 35,701.00
Exceptional Items -4,245.00 0.00 0.00 0.00 0.00
Profit/Loss Before Tax 40,316.00 47,367.00 45,725.00 40,777.00 35,701.00
Tax Expenses-Continued Operations
Current Tax 7,200.00 9,440.00 8,953.00 8,333.00 7,802.00
Deferred Tax 2,213.00 2,764.00 3,160.00 1,019.00 482.00
Total Tax Expenses 9,413.00 12,204.00 12,113.00 9,352.00 8,284.00Profit/Loss After Tax And BeforeExtraOrdinary Items 30,903.00 35,163.00 33,612.00 31,425.00 27,417.00
Profit/Loss From ContinuingOperations 30,903.00 35,163.00 33,612.00 31,425.00 27,417.00
Profit/Loss For The Period 30,903.00 35,163.00 33,612.00 31,425.00 27,417.00
Mar 20 Mar 19 Mar 18 Mar 17 Mar 16