A study on brand awareness at Good Buy soaps and cosmetics Pvt ...
102
“A STUDY ON BRAND AWARENESS AT GOOD BUY SOAPS AND COSMETICS PVT. LTD” SUBMITTED IN PARTIAL FULFILLMENT OF THE DEGREE OF MASTER OF BUSINESS ADMINISTRATION BY VINAY A Reg. no :( 1NZ14MBA86) Under the guidance of INTERNAL GUIDE EXTERNAL GUIDE Mr. RAMESH KUMAR N Mr. Kasi Viswanathan Asst. Professor HR Manager New Horizon College of Engineering Good Buy Soaps and Cosmetics Outer Ring Road, Marthahalli, Pvt. Ltd Bangalore-560 103 5/46 Industrial Development Area Kanjikode (west), Palakkad678623 Ph: 0491-2569060 NEW HORIZON COLLEGE OF ENGINEERING MARATHAHALLI BANGALORE -560103 BATCH: 2014-16
-
Upload
khangminh22 -
Category
Documents
-
view
2 -
download
0
Transcript of A study on brand awareness at Good Buy soaps and cosmetics Pvt ...

“A STUDY ON BRAND AWARENESS
AT
GOOD BUY SOAPS AND COSMETICS PVT. LTD”
SUBMITTED IN PARTIAL FULFILLMENT OF
THE DEGREE OF
MASTER OF BUSINESS ADMINISTRATION
BY
VINAY A
Reg. no :( 1NZ14MBA86)
Under the guidance of
INTERNAL GUIDE EXTERNAL GUIDE
Mr. RAMESH KUMAR N Mr. Kasi Viswanathan
Asst. Professor HR Manager
New Horizon College of Engineering Good Buy Soaps and Cosmetics
Outer Ring Road, Marthahalli, Pvt. Ltd
Bangalore-560 103 5/46 Industrial Development Area
Kanjikode (west), Palakkad678623
Ph: 0491-2569060
NEW HORIZON COLLEGE OF ENGINEERING
MARATHAHALLI BANGALORE -560103
BATCH: 2014-16


ACKNOWLEDGEMENT
The writing of this dissertation has been one of the most significant
academic challenges, I have ever had to face. Without the support, patience and
guidance of the following people, this study would not have been completed. It is
to them I owe my deepest gratitude.
First I would like to thank god for his grace and wisdom, which kept me
going, and help me to complete this project successfully.
Secondly I thank the management of New Horizon College of Engineering,
Visvesvaraya Technological University, Belgaum for the continuous support.
I am grateful to our Principal Dr. Manjunatha for his constant support,
inspiration and suggestion throughout the study. I deem it a great pleasure to
express my esteem gratitude with all respect to Dr. Sheelan Mishra, Head of the
Department, for her interest and kind help in making necessary arrangement to
undertake this study.
Thirdly I would like to express my deep sense of gratitude towards my guide
Mr. Ramesh (Dept. of Management Studies).
I am greatly indebted to Mr. Kasi Viswanathan (HR. MANAGER), Good
buy Soaps and Cosmetics Pvt. Ltd who guided me despite his hectic job
commitment. His wisdom, knowledge, and commitment inspired and motivated me
to accomplish this study. Without his initial consideration for me, this project
would have been a failure.
Finally I thank my parents for their continuous encouragement and valuable
support which helped me to accomplish this project.
Vinay A
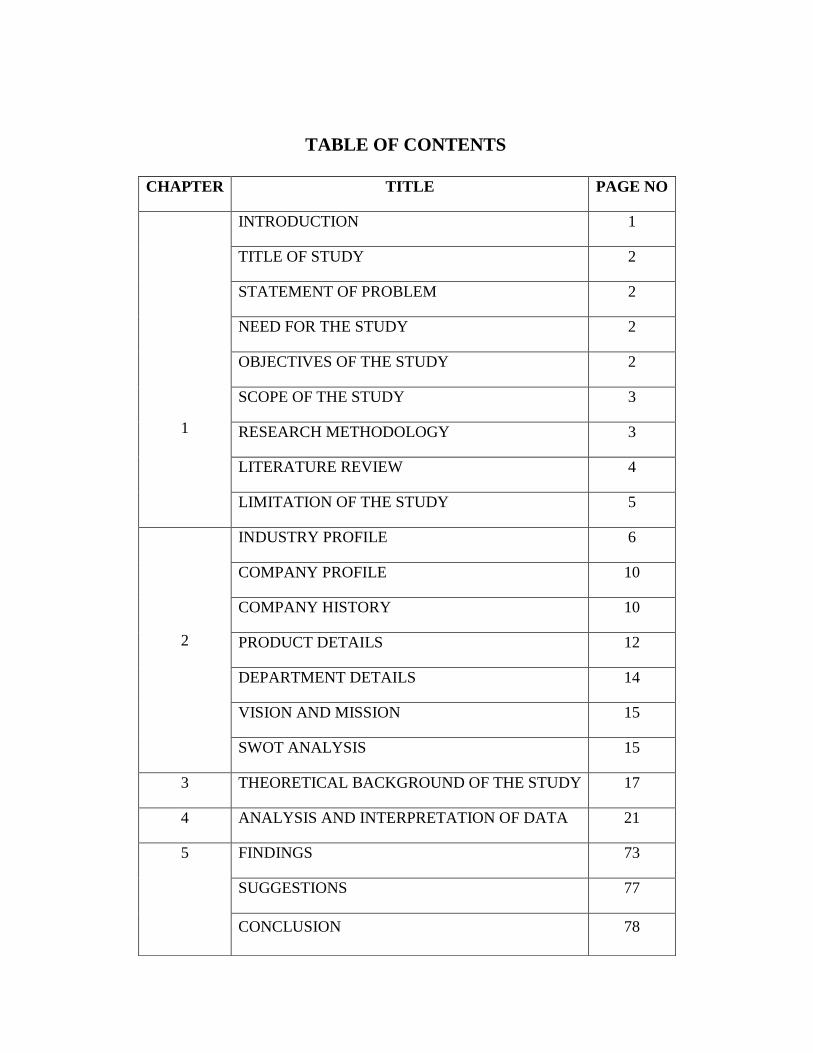
TABLE OF CONTENTS
CHAPTER TITLE PAGE NO
1
INTRODUCTION 1
TITLE OF STUDY 2
STATEMENT OF PROBLEM 2
NEED FOR THE STUDY 2
OBJECTIVES OF THE STUDY 2
SCOPE OF THE STUDY 3
RESEARCH METHODOLOGY 3
LITERATURE REVIEW 4
LIMITATION OF THE STUDY 5
2
INDUSTRY PROFILE 6
COMPANY PROFILE 10
COMPANY HISTORY 10
PRODUCT DETAILS 12
DEPARTMENT DETAILS 14
VISION AND MISSION 15
SWOT ANALYSIS 15
3 THEORETICAL BACKGROUND OF THE STUDY 17
4 ANALYSIS AND INTERPRETATION OF DATA 21
5
FINDINGS 73
SUGGESTIONS 77
CONCLUSION 78
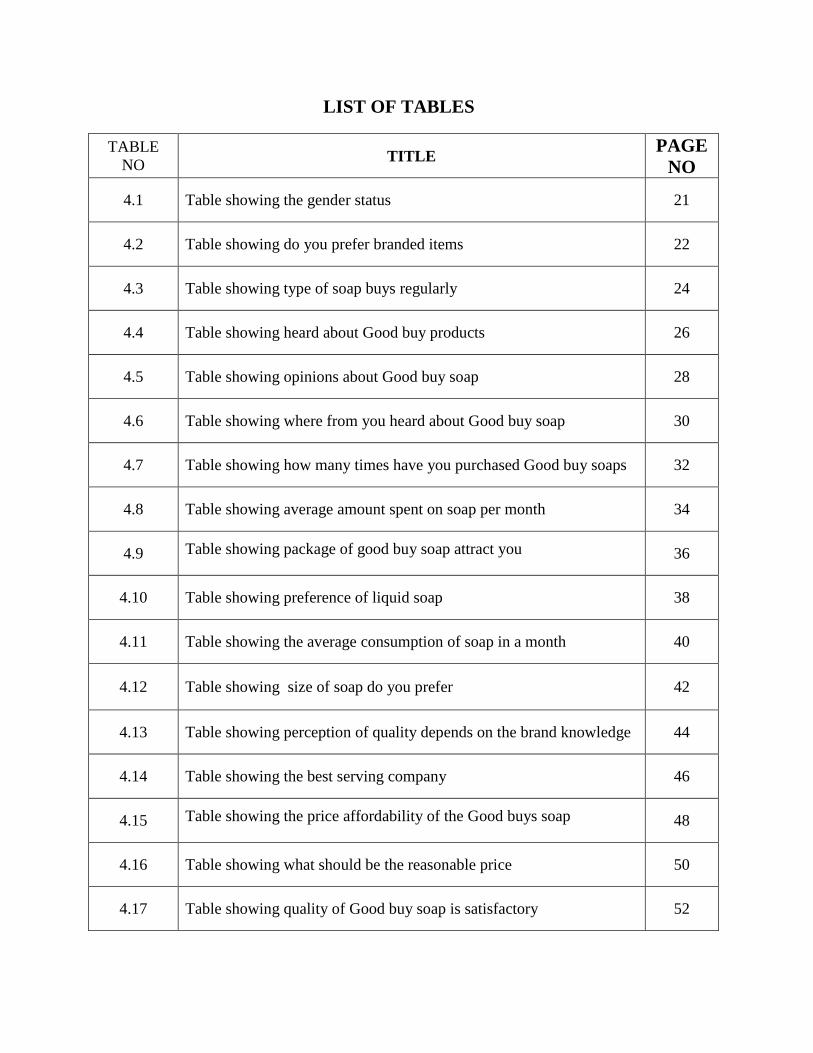
LIST OF TABLES
TABLE
NO TITLE
PAGE
NO
4.1 Table showing the gender status 21
4.2 Table showing do you prefer branded items 22
4.3 Table showing type of soap buys regularly 24
4.4 Table showing heard about Good buy products 26
4.5 Table showing opinions about Good buy soap 28
4.6 Table showing where from you heard about Good buy soap 30
4.7 Table showing how many times have you purchased Good buy soaps 32
4.8 Table showing average amount spent on soap per month 34
4.9 Table showing package of good buy soap attract you 36
4.10 Table showing preference of liquid soap 38
4.11 Table showing the average consumption of soap in a month 40
4.12 Table showing size of soap do you prefer 42
4.13 Table showing perception of quality depends on the brand knowledge 44
4.14 Table showing the best serving company 46
4.15 Table showing the price affordability of the Good buys soap 48
4.16 Table showing what should be the reasonable price 50
4.17 Table showing quality of Good buy soap is satisfactory 52
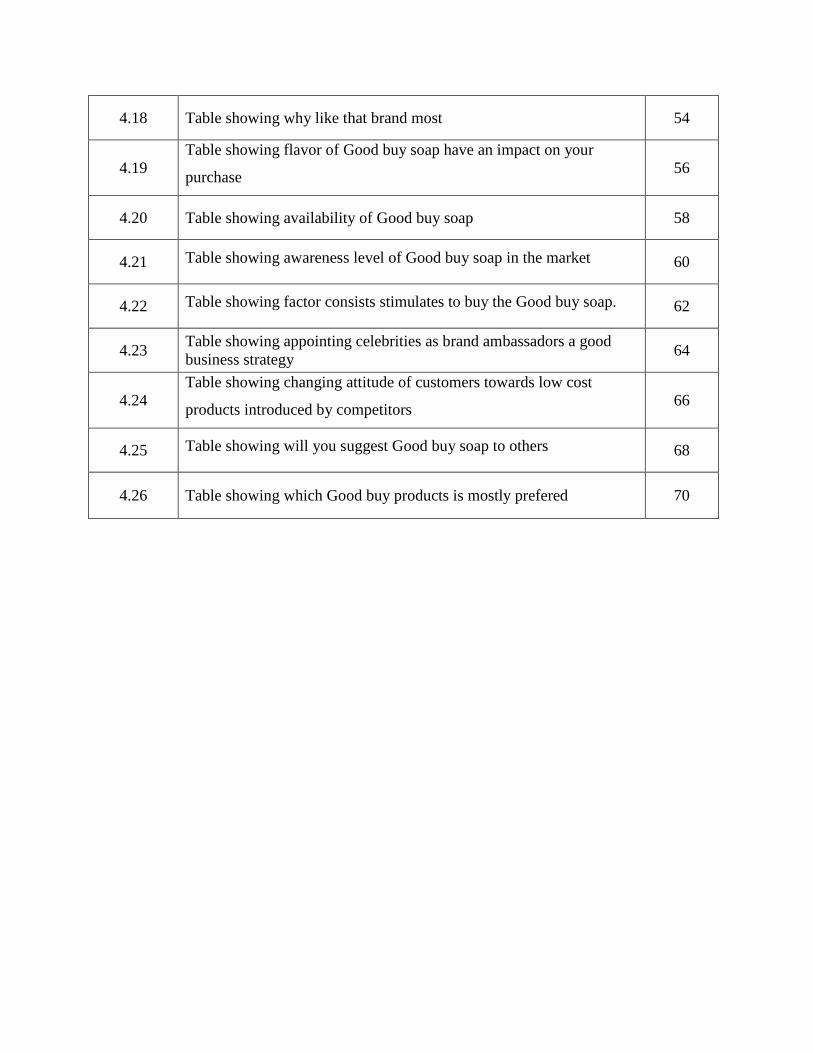
4.18 Table showing why like that brand most 54
4.19
Table showing flavor of Good buy soap have an impact on your
purchase 56
4.20 Table showing availability of Good buy soap 58
4.21 Table showing awareness level of Good buy soap in the market 60
4.22 Table showing factor consists stimulates to buy the Good buy soap. 62
4.23 Table showing appointing celebrities as brand ambassadors a good
business strategy 64
4.24
Table showing changing attitude of customers towards low cost
products introduced by competitors 66
4.25 Table showing will you suggest Good buy soap to others 68
4.26 Table showing which Good buy products is mostly prefered 70
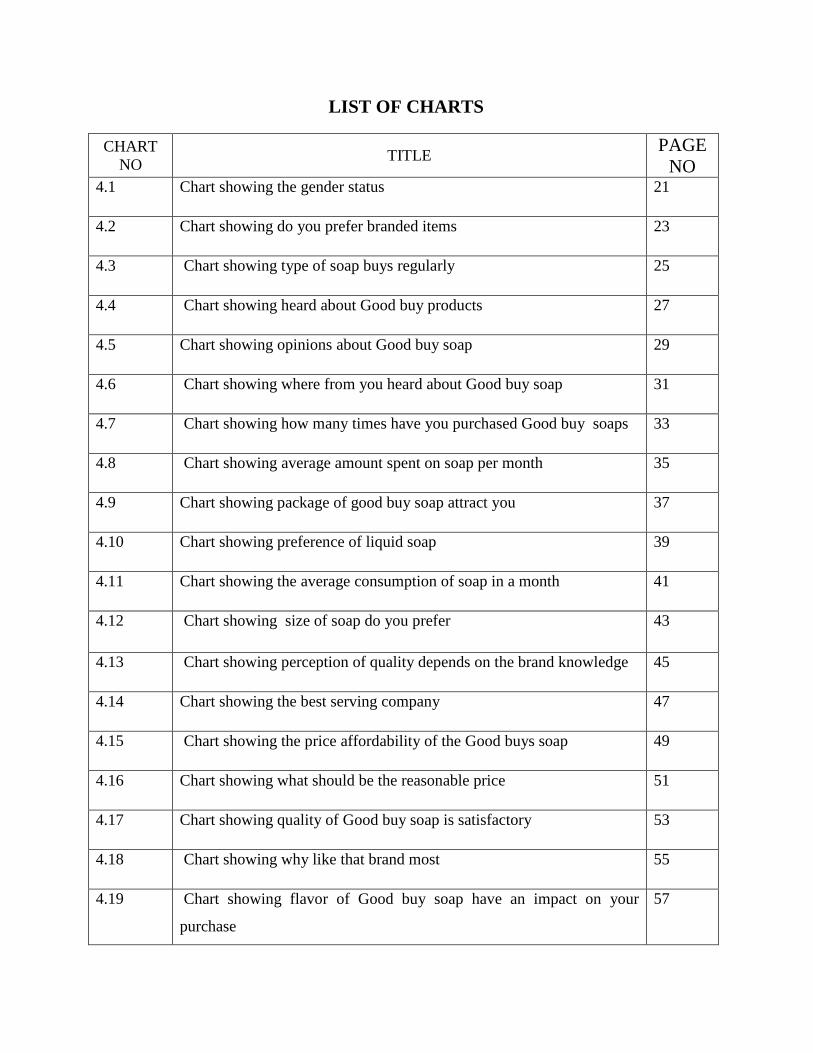
LIST OF CHARTS
CHART
NO TITLE
PAGE
NO 4.1 Chart showing the gender status 21
4.2 Chart showing do you prefer branded items 23
4.3 Chart showing type of soap buys regularly 25
4.4 Chart showing heard about Good buy products 27
4.5 Chart showing opinions about Good buy soap 29
4.6 Chart showing where from you heard about Good buy soap 31
4.7 Chart showing how many times have you purchased Good buy soaps 33
4.8 Chart showing average amount spent on soap per month 35
4.9 Chart showing package of good buy soap attract you 37
4.10 Chart showing preference of liquid soap 39
4.11 Chart showing the average consumption of soap in a month 41
4.12 Chart showing size of soap do you prefer 43
4.13 Chart showing perception of quality depends on the brand knowledge 45
4.14 Chart showing the best serving company 47
4.15 Chart showing the price affordability of the Good buys soap 49
4.16 Chart showing what should be the reasonable price 51
4.17 Chart showing quality of Good buy soap is satisfactory 53
4.18 Chart showing why like that brand most 55
4.19 Chart showing flavor of Good buy soap have an impact on your
purchase
57

4.20 Chart showing availability of Good buy soap 59
4.21 Chart showing awareness level of Good buy soap in the market 61
4.22 Chart Showing factor consists stimulates to buy the Good buy soap. 63
4.23 Chart showing appointing celebrities as brand ambassadors a good
business strategy
65
4.24 Chart showing changing attitude of customers towards low cost
products introduced by competitors
67
4.25 Chart showing will you suggest Good buy soap to others 69
4.26 Chart showing which Good buy products is mostly prefered 71

EXECUTIVE SUMMARY
The project was done at GOOD BUY SOAPS AND COSMETICS PVT LTD, Palakkad in order
to fulfill the requirement of MBA degree from Visvesvaraya Technologiacal University. The
objective of the study is to know the brand awareness of GOOD BUY SOAPS COSMETICS
PVT LTD.
Now a days the study about brand awareness is the most important activity in every type of
organization and the brand awareness study will help the customers to know more about the firm.
It always leads the customers in to the right way and helping the organization to do necessary
steps and measure the various programs done by the firm in the past, so the firm can re-correct it.
The study has totally five chapters that are Introduction, Company profile and industry profile,
Theoretical back ground, Interpretation and finally Findings, recommendation and conclusion.
The introduction part including the introduction about the firm, objective of the study, need of
the study, research methodology, review of the literature etc. In the second chapter have the most
important profiles that are industry profile and company profile. The company profile includes
details about the promoters, history of the company, information about the departments, firm
vision, mission etc. The industry profile includes the growth of the industry and the present
condition. The third chapter is theoretical background and it includes the various theories terms
related with the study topic. The four the chapter is the analysis and interpretation it is the heart
land of the report. The first three chapters most of the data from the secondary source but in the
analysis and interpretation chapter all the data comes from the primary source and it is collected
from the respondents of the study. For the analysis and interpretation of the data usage of tables
and graphs have been made to make it more informative and to give the right interpretations.
Fifth chapter is the final chapter of the study here converting the fourth chapter analysis and
interpretation in to the result of the study that are the findings, recommendation and the
conclusion of the study. This is the essence of the study and the company will help a lot for to
improve in the future.
CHAPTER 1
INTRODUCTION

1
1.1 INTRODUCTION TO THE STUDY
Now a day‟s business always implementing a strategy called as brand image. The brand image
always helps the company to make their own reputation in the market. Trade mark, logo, design
and packaging of the product are the main elements of creating a brand. These elements help the
consumers to compare the products available by competitors.
In the present scenario brand image has an important role because customers have a firm belief
of branded merchandise which most often provides outstanding quality. Customers are the prime
importance for every business in order to improve the sales and profit. Improvement of a
business is in the hands of public, without satisfying their needs and wants no company can
achieve the satisfactory success. Therefore, attracting the customers should be the prime
objective of the company. This objective can only be done through a better brand awareness.
A strong brand is an advantage to the owner of the firm and a threat to its competitors. It‟s a
strong entry barrier to new firms in the industry. It represents a high proportion of loyal
customers who like the brand. The power of the brand is also represented by the cost that its
competitor has to incur in increasing and creating another rival brand. The media cost and
distribution expenses are more observable expenses. Added to those hidden expenses, the
competitors have to strive to position their brand in the customers mind and ensure it is always a
priority for them.
Brand awareness creation is a difficult task in the current era because the high level of
competition in the market. The threat from the foreign company is always a big challenge to a
newly established firm. If a newly established company needs a successful career they have to
execute new strategic movement in the earlier time through effective brand awareness to the
customers otherwise it will be a black mark on their career graph. If they are successful in
executing the brand awareness operations, that will be the milestone of their career graph.

2
1.2 TOPIC OF THE STUDY
A STUDY ON BRAND AWARENESS OF GOOD BUY SOAP AND
COSMETICS PRIVATE LTD
1.3 STATEMENT OF THE PROBLEM
GOODBUY SOAPS & COSMETICS PVT.LTD is a soap manufacturing company. It‟s a well-
established company and due to some problems the company is not getting the expected sales, so
as a part of its business development the company would like to know the awareness level of the
brand in the minds of the customers.
1.4 NEED FOR THE STUDY
Brand awareness instills a type of consciousness which enables any consumer to familiarize with
the product/ brand and also to buy their goods and services. Brand awareness leads the consumer
in to the right way. This study will help to collect an elaborate knowledge about the firm. It will
help the organization go forward with necessary step and also they can avoid unnecessary actions
that have done in the past. Undoubtedly this study will promote and push up entire growth of the
firm.
1.5 OBJECTIVES OF THE STUDY
To analyze the brand awareness among customers.
To identify the factors influencing the brand awareness.
To find out the strategies for implementing effective branding.
To provide valuable suggestions in order to improve the brand value.

3
1.6 SCOPE OF THE STUDY
Brand awareness is very essential for any kind of organization. The success of every
organization depends upon the awareness of the brand among customers. The brand awareness
helps the company to stimulate the sales. The main aim of the study is to know how much the
customers are aware about the company . This study will also suggest the company as to how
much their products are familiar in the market and also to give additional suggestions regarding
the possible ways to improve the brand awareness. Hence it is relevant to conduct a study on
brand awareness of GOODBUY soap and cosmetics.
1.7 RESEARCH METHODOLOGY
The information necessary for this survey is collected by primary data through well structured
questionnaires.
1.7.1 POPULATION SIZE
The project was done in Palakkad district. All the households in palakkad constitute the
population for the study.
1.7.2 SAMPLE SIZE
A sample of 100 was selected using convenient sampling procedure to represent the entire
population.
1.7.3 SAMPLING TECHNIQUE
Since it was hard to determine each and every unit of the population, non-probability sampling
method was employed. Convenient sampling method was used to identify the samples required
for the study.

4
1.7.4 DATA REPRESENTATION
The term representation refers to the way of projecting the raw data with the help of percentage
analysis, charts like pie chart and bar charts etc. this will help in easy interpretation of the
various issues intended to be studied.
1.8 LITERATURE REVIEW
Kanungo and Dutt (1966) who revealed that when decided to give a brand name, there should
have the awareness of the meaning of the brand name. The brand name should be related with
the products quantity and also have a good manufacturing – relation between the brand name and
the product. High utility products have superior brand awareness to that of low utility products.
Moreover the type meaningful brand names create a good platform for advertisement.
In the words of Hoyer and brown (1990), the primary level brand knowledge leads to a
recognition of brand names. So the awareness of a brand is different level in each consumer. It is
from minimum to maximum level based on the detailed knowledge. So the awareness of brand
name who select a particular product.
According to Nedungadi (1990) , the stock have significant role when determining brand
awareness, he said high brand availability and high brand choice promotes brand awareness. He
said that brand awareness is the basic precondition for choice so high brand availability and high
brand choice are very important.
Rositter and Percy (1991) argue that when building a brand, brand awareness is the essential
first step for forming a brand. These are a lot of options at the times of purchase, when the
consumers need a very important for selection. If he does not know the correct brand, he used his
spontaneous awareness there. So brand awareness is a must when the consumers selects good or
services from competitive market.
Aaker (1991) classifies brand awareness in these days format. First the lowest level of
awareness, second the medium level of awareness and third the highest level of awareness, this is
called top – of – mind awareness (TOMA). Aaker explains the conscious level of brand
awareness working in consumers. He points the brand awareness is working not in a same
quantity in different consumers.

5
Huang and Sarigollu (2011) argued the brand awareness can be achieved through some
marketing measures. For e.g. a strong advertisement can capture the consumer‟s mindset. The
repeating of the advertisement slowly or speedily creates awareness about a particular goods or
service. It affects brand awareness positively in a repeated process. Distribution also plays a
dominant role. It makes a link between brand and a product. Price promotion also helps to
develop brand awareness.
1.9 LIMITATIONS OF THE STUDY
The study was conducted in based on primary data collected from selected samples the data
given by the customers may be biased.
Sample size was 100; small size is small and cannot represent the whole population taken for
the study.
Result of the study may not be generalized
Area of the study is limited.
CHAPTER 2
INDUSTRY PROFILE AND COMPANY PROFILE

6
2.1 INDUSTRY PROFILE
In the modern life of man, he gives more importance to hygiene. It leads to the use soaps very
popular. So that here emerged a lot of soap industries. Our markets are filled with different types
of soaps mainly perfumed, carbolic and medicated. In 1840 Cincinnathi of USA become the
major soap-making city. The popular soap making company Procter and Gamble is the very
result of it (1837. The first cosmetic industry was established in London in 1909. Egyptians used
natural cosmetic cleaners in B.C 1000. In B.C 2800 Babylonians made soaps with natural
contents and it used for cleaning and medical purpose. Now a day‟s cosmetic became the
inevitable part of modern life. In recent time the cosmetic industry largely spreading throughout
the world.
FMCG (Fast Moving Consumer Goods) sector is one of the largest one in the Indian economy.
These companies changed people‟s ideas and there is a need for new generation products so this
sector has fast changing. Toilet soap industry was the most preferred and moving soap in olden
days. Increasing trend in brand and number of competitors are the main challenge of the
industry. More than half of our consumers have account in this soaps. From this we have clear
about the influence of soaps especially toilet soaps in the day to day life of Indians.
THE FIRST SOAP
The first soap making were done by Babylonians. But it was not used for cleaning body, it used
for cleaning cotton and wool prepared for cloth. In 1550 BC Egyptians used soaps; they made
soaps by mainly used vegetables and animals oils. The Romans also made with goats tallow and
of beech trees. The Arabs prepared soaps from vegetable oils like Olive oil and thyme oil. They
produced colored soaps with perfume. They are in liquid and hard forms.
Romans are famous for their baths they used soaps for not cleaning body but used doctors as a
handling of sickness. In the era of Roman it shows hygiene, quality in later onwards. From the
word “saipo” the word soap is derived. In the first century AD Romans used urine to produce
soap like substance. Goat‟s tallow and the hashes of beach tree where used for making soaps,
both hard and soft products.

7
HISTORY OF CASTILE SOAP
Castile soap has a prime position at Europe in olden days. It is the very important soap which
was ever created. Castile soap gained much popularity for the abundance of olive oil in the
Spanish city. It is the inevitable substance that decides high quality, it enabled it very mild
effective. Years passed castile soap spread over Europe. Castile soap which considered as the
one of the natural soaps produced by hand. This great soap can be used by everybody without
considering age or anything.
HISTORY OF LIQUID AND GEL SOAP
In recent time there produced liquid soaps and gels. Today we can familiar with all types of
soaps and gels. Today we can familiar with all types of soaps in our stores. In short these are
products in modern time. Liquid soaps started in the mind of 1800. The famous soap companies
not only give importance to body clearing but also they give importance to clothes, bathroom and
kitchen extra. The difference between liquid soaps and shower gels is that it doesn‟t include
saponified oil. Most of shower gels have conditioning agents, so they are perfectly use for body
wash soap as well as hair shampoo.
INDIAN SOAP INDUSTRY
England introduced importing and marketing of modern types of soaps in India. It was done by
lever brothers. They started first company at Meerut in U.P in the year 1897. India‟s first
manufacturing company started by Mr.Jamshedji Tata in 1918. They used coconut oil for
producing it. TATA OIL MILL COMPANY was the name of it. In 1930 branded products began
to appear in our market. After that companies like HILL and Nirma reached in our country. That
time Hindustan lever is the leader of our market, Life buoy, Lux, Cinthol, Rexona extra are
popular brand of that period. This soaps shared 14 -15 % of our market. There are 700
companies in India and 4800 crores revenue about.
8
Today India is one of the largest manufactures of soap in the world. The soap industry of India
basically divided in, to the premium, popular and economy or sub popular segments. The soap
market form major part of FMCG (Fast Moving Consumer Goods) market. The FMCG industry
mainly divided in to organized and unorganized sectors. The size of the organized sector is very
large. This industry has various types of divisions, such as soaps, cosmetics, detergents, bath
soaps, and skin and hair care extra.
In Indian soaps are available in five million retail store. From that from that most of them are in
rural areas. From this we can imagine our use of soaps. The half of the total products is sold in
rural markets. The main distributors of personal wash soaps and HLL, Nirma and P&G. The
herbal products also have a good market here and are also fast growing in recent years. The
increasing of disposable income in rural areas and semi-metros promotes high demand to these
products.
There are 700 companies included in the Indian soap industry and have the total annual revenue
of about $ 17 Billion. The main attempts in this field are P&G, Unilever and Dial. The 90 %
percent of the market is concentrated by the major 50 companies. The volume of Indian soap
industry is Rs 4800 crore, we can see our soap companies re-launching their brands with adding
values forgetting high market. For e.g. Life buoy, Liril, Lux extra
KERALA SOAP INDUSTRY
Mr.Jamshedji Tata who set up the first soap manufacturing industry in India at Cochin (1918), he
named it company of Tata oil mill. In 1930 its branded soaps emerge on the market. Around
1937 soap became inevitable for the prime class. Another soap manufacturing unit started in
Kozhikode. It later known as Kerala soap institute, this institution gave training in soap
manufacturing and helped them to become self sufficient in starting their own manufacturing
units. So the Kerala soap institute has become very popular. It leads to the large scale use of
coconut oil for the manufacturing of soap. Sir, Frederic Nicolson who popularized it.
Gandhiji‟s vision plays a major role in manufacturing field. He encouraged the financial
independence and promoted the small scale manufacturing. The small scale soap industry
9
attained a noticed growth in the commercial growth of Kerala. There started 1500-small scale
units but of many financial and other problems, 70% of them didn‟t see the proper aim. The
multi-national companies prevent the growth of small scale industries in Kerala. “KERALA
SOAPS” a new manufacturing company started by the government of Kerala, it was a new-year
gift to the people of Kerala in a wonderful ceremony. Kerala State Industrial Enterprise Limited
at Vellayil, Kozhikode was set up this unit. The total capacity of this unit is to produce 6000
MT/Annum of Toilet soaps and bathing bars.
Kerala Sandal is one of the premium soaps which created thrill in the market and also a new
sensation among the people, it recommended as beauty soap contains sandal oil. The products
like Kairali bathing bar, Kerala carbolic soap bar, VEP Bathing Bar, Wash Well extra are we get
through from main and leading market.

10
2.2 COMPANY PROFILE
HISTORY OF GOOD BUY SOAPS AND COSMETICS PVT.LTD
February 2007 is the incorporated date of GOOD BUY SOAPS & COSMETICS (P) LTD. Good
buy soaps and cosmetics Pvt. Ltd is a private company within the meaning of SSI registration on
9-07-015-48PMT NIP/955/82 situated at 5/39, Industrial Development Area, Pudussery,
Kanjikode, Palakkad, 678683.GoodBuysoapshas been promoted by Jyothylab, total cost incurred
for the project was around 4.5crore.
GOODBUY Soap & Cosmetics (P) Ltd has a well equipped and Automatic Soap manufacturing
unit at Kanjikode, very fast growing Industrial Development Area in Palakkad, Kerala State. Its
marketing section located at Calicut, a famous town of business historical past. The next aim of
company is to introduce its new Toilet & Cosmetics personal care products in near future. To
serve the society with ethical vision, the Company is now it‟s on route to global market.
The Technology for manufacture of toilet soaps and cosmetics are well proven and the promoters
are having experience in that line. The proposed unit will be having capacity of producing 75
metric tons of toilet soaps and cosmetics. Considering the infrastructure facilities and location
advantage of marketing the promoters wish to convert the existing facilities in Kanjikode,
Industrial Development area for the manufacture of toilet soaps. For smooth functioning of the
unit a minimum build up area of 4000 square feet is required. The existing building can be
suitably renovated and the entire manufacturing facility for toilet soaps can be installed in the
existing premises .The promoters are holding allotment for 50 cents of land in industrial
development area, Kanjikode, Palakkad district. In case of future expansion the free space can be
effectively utilized. The promoters estimate Rs 13 lakhs for the renovation of the building and
shed works.
Main competitors of GOODBUY soaps are Medimix, Chandrika, ayurmixetc, major super
stockiest and distributors in Kerala and neighboring states. Besides two of the promoters are
already in this line of activity and is having an established marketing team and networks
throughout Kerala and Karnataka. This company provides sample scope for study in its varied
departments. But considering the time considering the time constraints, the present study has
been concentrated in the working capital management in good buy soaps and cosmetics (p) Ltd
Kanjikode.
11
DETAILS OF PROMOTERS
Sri.K.P.Khalid who is Managing Director along with Aneesa Khalid who is promoting the
business under the name of GOOD BUY SOAPS AND COSMETICS PVT LTD.
BRIEF DESCRIPTION OF BUSINESS ACTIVITY
The proposed unit is for the manufacturing of herbal beauty products, baby soap, toilet soaps,
and using modern hygienic equipment for which there is demand throughout India. As per latest
survey by leading marketing team there is a yearly increase of 22% consumption at the moment.
MANAGEMENT
The management of the unit will be with the board of directors. For the sake of convenience they
have appointed Mr.K.P Khalid as Managing partner.
TECHNICAL FEASIBILITY OF THE PROPOSED UNIT
Technology for manufacture of toilet soaps and cosmetics are well proven and the promoters are
having experience in that line.
CAPACITY
Proposed unit will be having capacity of producing 75 metric tons of toilet Soaps and cosmetic
LAND AND BUILDING
For the smooth functioning of the unit a minimum build up area of 4000 square feet is required.
The existing building can be suitably renovated and the entire manufacturing facility for toilet
soaps can be installed in the existing premises. The promoters are holding allotment for 50 cents
of land in the industrial development area, expansion the free space can be effectively utilized.
The promoters estimate rs.13lakhs for the renovation of the building and shed works.

12
MACHINERIE
Main machineries required for the proposed unit are as follows
1. Sigma mixer
2. Triple roll mill
3. Noodle
4. Duplex plodder
5. Chilling plant
6. Automatic stamping machine
7. Automatic wrapping machine
RAW MATERIALS
The main raw materials required for the production of toilet soaps is palm based soap noodles.
Titanium dioxide, magnesium sulfates, besides talk, sodium silicates, perfumes etc. All these
items are readily available and around Palakkad & Coimbatore.
PRODUCT DETAILS
Good buy soaps and cosmetics are renowned manufactures of cosmetic products (soaps,
detergents etc). Quality soaps washes away all the germs and leaves behind soft clean with a
fresh and beautiful fragrance.
Wide collection of beauty and toilet soaps is in wide demand among clients for its effective
quality. Soaps are available in various in various colors and fragrances.
KATTAR
Kattar is the premium soap with main ingredient as aloe vera juice. Aloe vera has been used as a
medical herb from thousands of years. Researches founded this herbal plant has many names
such as „nature‟s gift‟ and „the miracle plant‟. Aloe Vera used for health, skin care, and beauty
from many centuries. This plant has been used by Alexander the Great as a medicinal plant to
13
treat the soldier‟s wounds. Cleopatra also has used this plant as a moisturizer for the skin. Kattar
is available in 75g with 72% TFM.
FEMINA
Femina is a leading branded Toilet soaps which is having a wide demand in south India because
of its attractive packets and quality. It is also available in different flavor such as Rose, Lime,
Jasmine and Passion. Toilet soaps are available in various packs of 18g, 75g and 125g with 60%
TFM.
FEMINA JASMINE
Femina jasmine is our top quality toilet soaps for common man‟s consumption, its jasmine
fragrance lasting at body
FEMINA LIME
Lime peel feeling with natural freshness at day long existence.
FEMINA ROSE
Rose effect brings you the memory of fine morning, a fresh Natural Toilet soap.
FEMINA PASSION
Your passion towards bath will fulfilled with old memories of good fragrance.
14
DEPARTMENT DETAILS
SALES DEPARTMENT
A sales department‟s primary aim is to reach the firm‟s products to its customers as an exchange.
A well placement of merchandise is in the hands of sales department in every organization. A
good sale of goods and services always long last the business. The supply and demand of product
and services directly promotion to the sale of the products. To meet customer demand with
appropriate supply by proper market study of customers need.
DUTIES OF SALES DEPARTMENT
Sale department will always find out the exact customer and try to retain the current uses
of the product
Maintaining a value or worth to the product is the main duty of the sales department
New business idea with effective cost is always provide by the sale department.
Maintain a better relationship between the mediators and distributors to attract more and
more customers
Small research on customer satisfaction should do by the sales department to identify the
updated review of the product satisfaction in all level of region.
PRODUCTION DEPARTMENT
The area of raw material turn to finished products is called as production and the department of
production duty is makes sure that the above process is working accurately. TQM (Total Quality
Management) is one of the major functioning of this department.
In this organization there is a vast and different section like supervisors, executives, and workers.
Store and go-down maintenance according to the movement of soaps, according to the purchase
orders and movement of finished goods of quality products, production department target varies
in the case.
15
PRODUCTION DEPARTMENT FUNCTION
Maintaining quality of goods
Preventing shortage of raw materials
Production schedule fixing
Dispersing production duties by categorizing groups
Minimizing cost through better utilization of all resources
Responsible for production orders
VISION
Our dream is to become a reputed firm of soaps and cosmetics industry in India
MISSION
With the support of our diligent and sincere employees, we compete for providing excellent
goods and services to our customers. Our marketing sales and technical services to the personals
consists professionals in the industry, which has the flexibility and ability to conduct
international business transaction.”
SWOT ANALYSIS
The entire evaluation of firm‟s strength, weakness, opportunities and threats is called SWOT
Analysis
STRNGTH
The firm maintains a well organizational set up
Dedicating and hardworking labors
Comparatively higher quality
Availability of raw materials
WEAKNESS
Small in size
Low Research and Development t
Lack of Corporate identity
High attrition rate

16
OPPORTUNITY
Huge market
Increasing revenue
Product is not complex and is suitable for high volume of manufacturing
THREATS
Cutthroat competition
Changing Technology
Changing taste and preference of the customers
Raising Labor cost
CHAPTER 3
THEORETICAL BACKGROUND

17
THEORETICAL BACKGROUND
Marketing is a broader term and it is always helping to achieve the firm and individual goals
through customer demand identification, concept development, pricing, promotion, distribution
and finally creating the transactions. It is the business process of reaching the goods and services
to the ultimate consumer from the producer.
AMERICAN MARKET ASSOCIATION
The ultimate aim of marketing is the result of selling the products and services to the consumers,
through the process of exchanging the value of the product or service to the ultimate consumers.
It is the organizational function of making and developing the consumers. When a customer
buying a branded product two things will be the most important that is less selecting time and
expense of the product if the product is successful in this criteria we can say that product, it‟s a
strong brand.
Buying a strong brand the consumers getting lot of advantages that are decreasing tension,
saving time and feeling satisfaction so when purchasing a good brand the consumer feel the
benefit in two ways first is getting the functional value and next benefit from the psychological
side. A strong brand is converting the customers in to loyalty and promotes the relationship
between the manufacture – wholesale, wholesale – retailer, and retail – customer. So we can say
a strong branded product maximize the value of all engaged in this process.
EVELUTION OF BRANDING
The most important element in the product strategy is the branding; it was the part of product in
the initial time. The olden days the ultimate aim was to find out the product or service from the
competition by the customers. So in that time the brand image helped the consumers a lot
especially from the cheatings of sales person.
The brand divides the products and services in different aspects that are mainly two types
tangible and intangibles. In two ways mainly the consumers are attracting from the branded
18
products that are functional level and emotional level. The tangible aspects play a crucial role in
attracting of the customers and including elements are good quality, innovation, price etc. Those
values have cannot quantified in the branding of the product or the service that are intangible
dimensions. Tangible dimension the presence of the product is the most important thing without
the presence we can‟t imagine but in the case of intangible dimension the process depends upon
the spark of the brain. So without the physical showing of the products the consumers can
respond the brand.
CORPORATE BRAND
The tradition of product branding draws by the corporate branding. Corporate branding and
product branding having the similar objective in the preference stage and when the managers
organizing the strategies related with it in the firm level it should be more complicated and tuff
but in the case of individual product or service while comparing to the organizational level it is
more easy to do and less time consuming. The product brand and corporate brand researchers
find out the major differences in the year of 1991. In this study find out the most important three
aspects this core attributes creating the difference between the product branding and corporate
branding.
INTANGIBILITY
When the firm is intangible the product or services should be under the category of intangible to
every audience excluding the workers of the firm. The image is constructing through the
important signals that are behavior, communication and symbolism based upon the experience of
his / her is the perception of a firm especially an individual.
COMPLEXITY
Continuously experience in products or services are achievable, types of audiences and the
corporate audiences has made by the corporate brand.
19
RESPONSIBILITY
In the organizational point of view the strong favorable corporate brand provides many
advantages and it has a very good social responsibility and commitment. The corporate brand
influencing the organizing and the products of the firm in many ways and it always try to
maximize the life and health of the firm, products and services.
CONSUMER CENTRIC BRANDING
Brand image of a specific product may vary according to the market condition and customer
perception. Brand image always creates a positive set of environment in the minds of customer
and it makes a fake believe that branded merchandise always provide outstanding quality.
Establishing a good brand image is not an easy task because the changing attitude of public and
the threat of already established foreign brands. Brand image always makes a bond between
customers and the company so as to make an outstanding brand image is the main challenge
faced by a newly established company. If the company is successful in implementing the brand
image process the long run success of the company is not too far. A brand image help the
company to change the customer attitude on their product and it help them to retain existing
customers. The relationship between the company and the customers through the brand image
makes more mouth publicity and it creates more and more new customers attraction from the
side of public. The main marketing objectives are easily achieved through the help of brand
image. The main three objectives are customer acquisition, customer experience and customer
retention.
CUSTOMER ACQUSION
Customer acquisition process is mainly concentrating on brand awareness and it is the first stage
and it also includes persuasion and learning of that specific brand.
20
USTOMER EXPERIENCE
The great first time use, usability and benefit delivery are the three important customer
experience need for product “wow”
CUSTOMER RETENTION
The long term usage and satisfaction, the purchase of many services and products and positive
feedback to others are the three important customer experience elements in the retention process.
CONCEPTION OF BRAND IDENTITY
Now a day in the business world many concepts updated and newly came. In the brand related
concepts changes is happening rapidly. In the brand identity the brand vision identity and aim are
the latest concepts. The brand becomes more meaningful and powerful when involving all the
things related with the brand identity. Ultimate aim of the brand identity is always try to reach
the consumers. While reaching the consumers it influencing many things we have need to find
out lot of strategies for to overcome the every obstacle here. Here we have to consider these
importance principles that are the brand should make the consumer delightfulness; the brand can
see the mindset of the consumers and the brand have to change when it require this will help the
brand to achieve the durability.

CHAPTER 4
ANALYSIS AND INTERPRETATION

21
TABLE- 4.1 Showing the Gender Status
OPTION NO OF RESPONDENTS PERCENTAGE
MALE 60 60
FEMALE 40 40
ANALYSIS
According to the study 60 % of respondents are male and 40% of respondents are female.
CHART -4.1 Showing the Gender Status
INTERPRETATION
From the above table 60 % of respondents are male category and 40 % respondents are
female category. Major respondents are male category.
60%
40%
0%
10%
20%
30%
40%
50%
60%
70%
MALE FEMALE
22
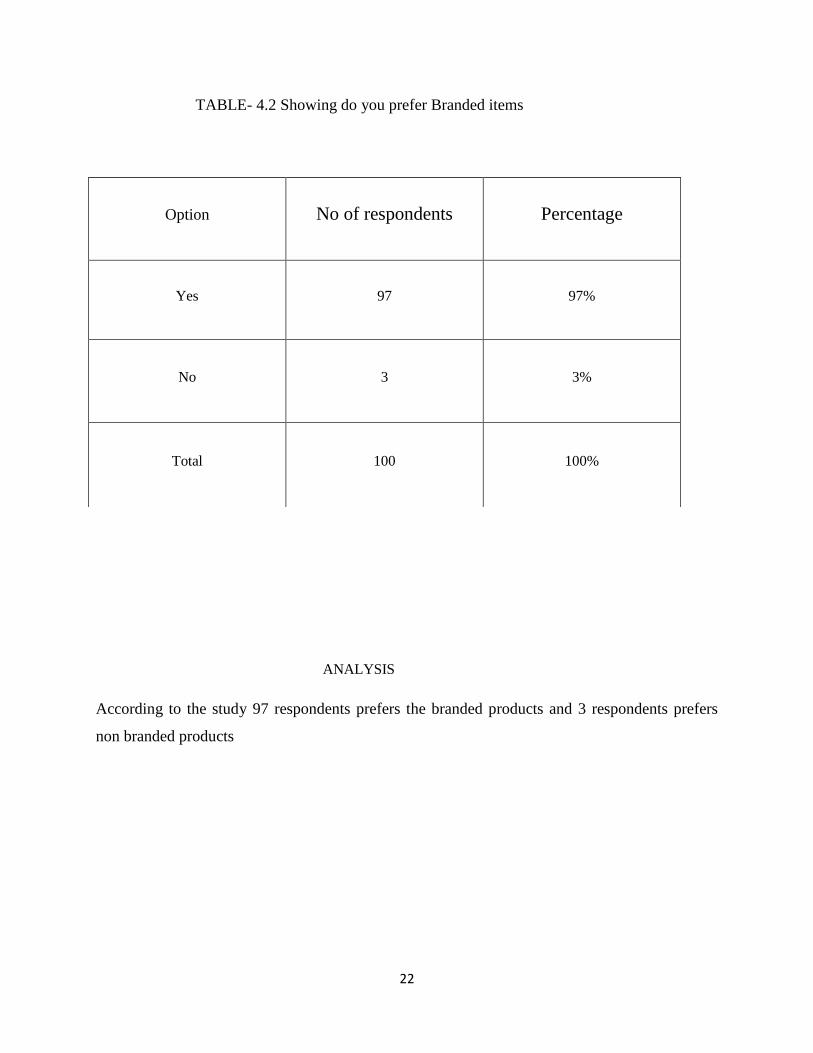
TABLE- 4.2 Showing do you prefer Branded items
ANALYSIS
According to the study 97 respondents prefers the branded products and 3 respondents prefers
non branded products
Option No of respondents Percentage
Yes 97 97%
No 3 3%
Total 100 100%
23
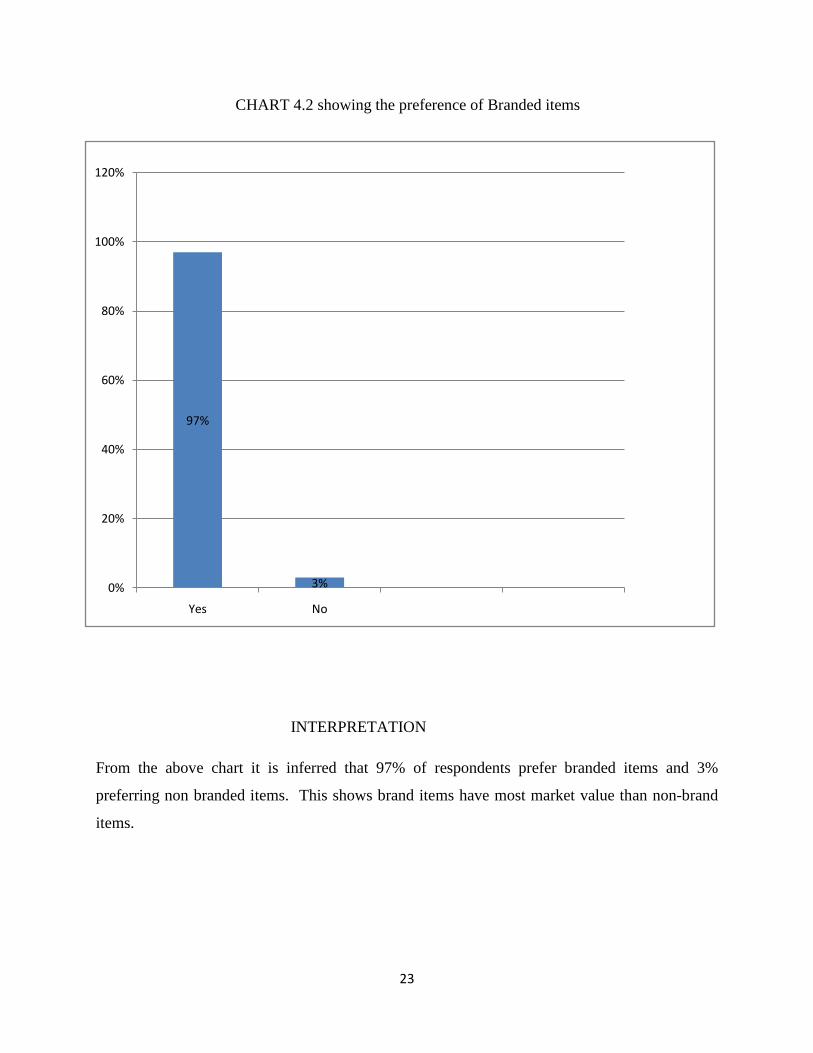
CHART 4.2 showing the preference of Branded items
INTERPRETATION
From the above chart it is inferred that 97% of respondents prefer branded items and 3%
preferring non branded items. This shows brand items have most market value than non-brand
items.
97%
3%0%
20%
40%
60%
80%
100%
120%
Yes No
24
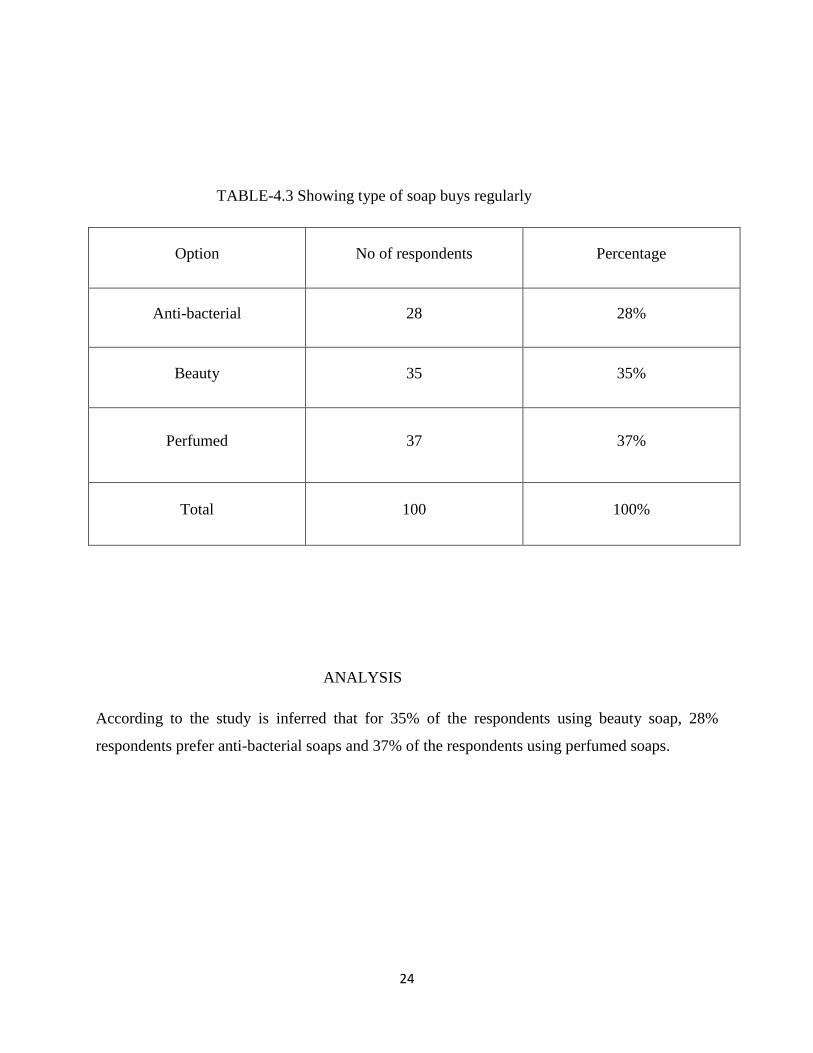
TABLE-4.3 Showing type of soap buys regularly
Option No of respondents Percentage
Anti-bacterial 28 28%
Beauty 35 35%
Perfumed 37 37%
Total 100 100%
ANALYSIS
According to the study is inferred that for 35% of the respondents using beauty soap, 28%
respondents prefer anti-bacterial soaps and 37% of the respondents using perfumed soaps.
25
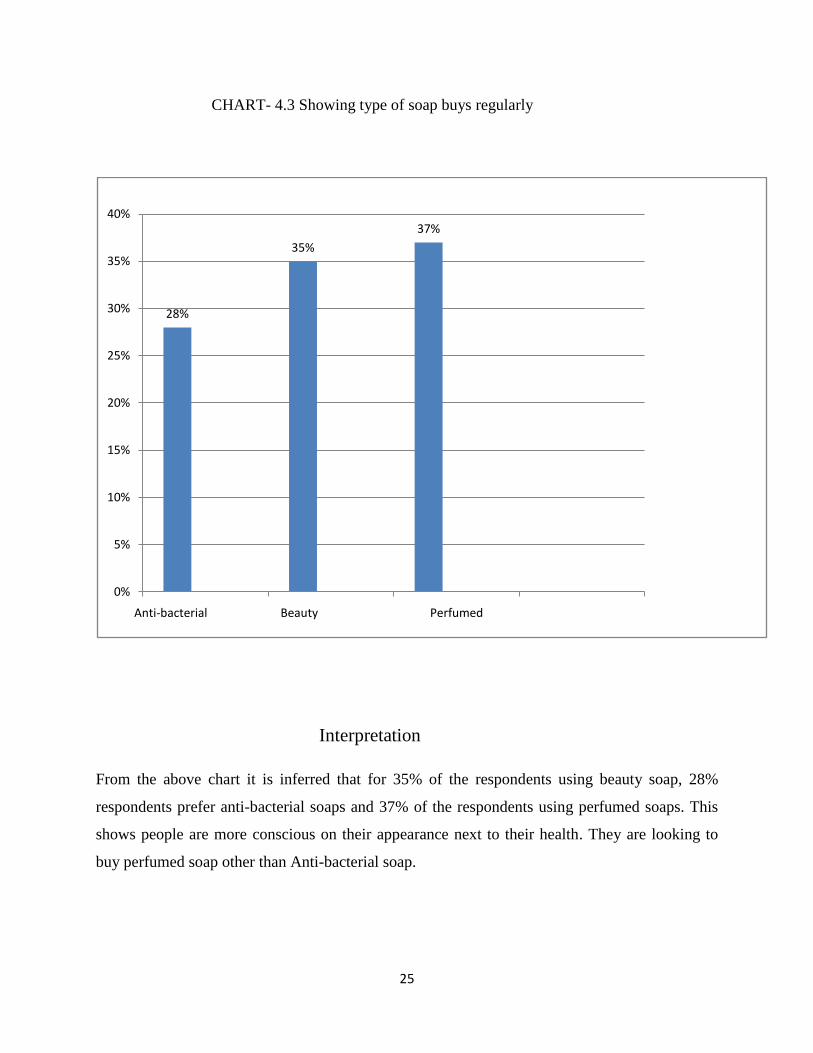
CHART- 4.3 Showing type of soap buys regularly
Interpretation
From the above chart it is inferred that for 35% of the respondents using beauty soap, 28%
respondents prefer anti-bacterial soaps and 37% of the respondents using perfumed soaps. This
shows people are more conscious on their appearance next to their health. They are looking to
buy perfumed soap other than Anti-bacterial soap.
28%
35%
37%
0%
5%
10%
15%
20%
25%
30%
35%
40%
Anti-bacterial Beauty Perfumed
26
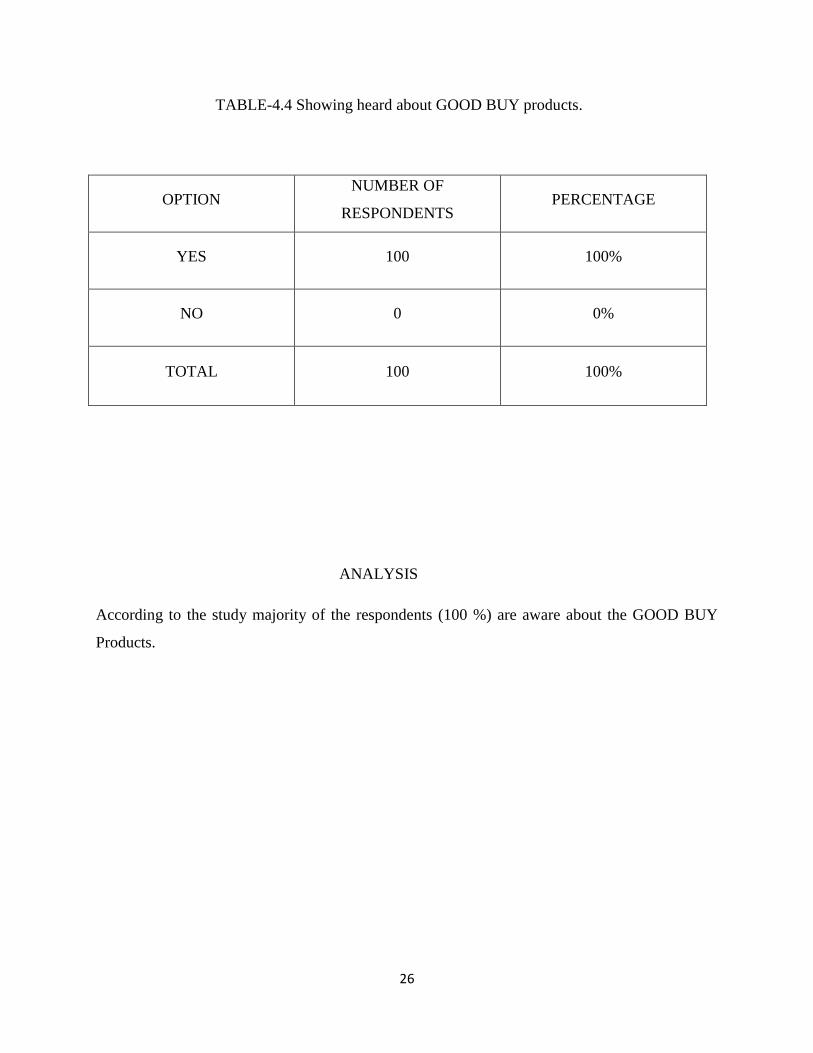
TABLE-4.4 Showing heard about GOOD BUY products.
OPTION NUMBER OF
RESPONDENTS PERCENTAGE
YES 100 100%
NO 0 0%
TOTAL 100 100%
ANALYSIS
According to the study majority of the respondents (100 %) are aware about the GOOD BUY
Products.

27
CHART 4.4 showing the opinions about Good buy soap
INTERPRETATION
From the chart it is clear majority of the respondents 100% are aware about Good Buy soap.
Good buy soap has a good brand identity and people are aware about it.
0%
10%
20%
30%
40%
50%
60%
70%
80%
90%
100%
YesNo
100%
0%
28
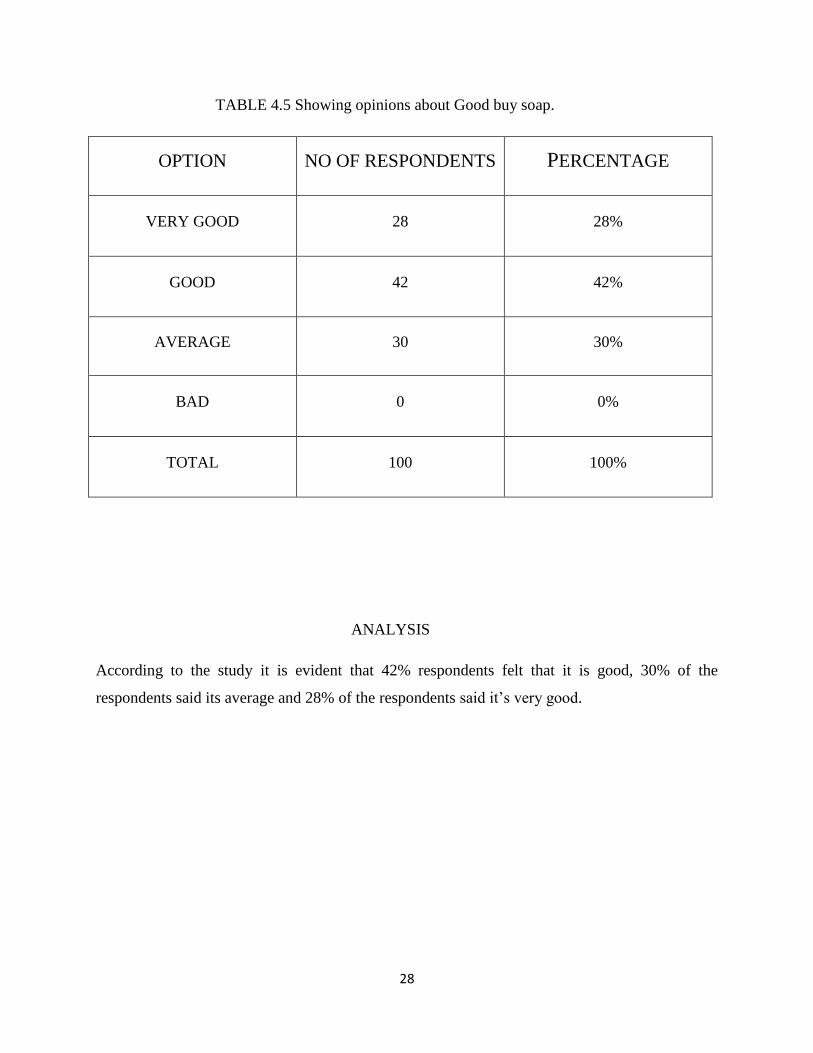
TABLE 4.5 Showing opinions about Good buy soap.
OPTION NO OF RESPONDENTS PERCENTAGE
VERY GOOD 28 28%
GOOD 42 42%
AVERAGE 30 30%
BAD 0 0%
TOTAL 100 100%
ANALYSIS
According to the study it is evident that 42% respondents felt that it is good, 30% of the
respondents said its average and 28% of the respondents said it‟s very good.

29
CHART 4.5 showing the opinions about Good buy soap
INTERPRETATION
From the above chart it is evident that 42% respondents felt that it is good, 30% of the
respondents said its average and 28% of the respondents said it‟s very good. This shows good
will of the good buy soap is very high among the respondents.
28%
42%
30%
0%0%
5%
10%
15%
20%
25%
30%
35%
40%
45%
very good good average Bad
30
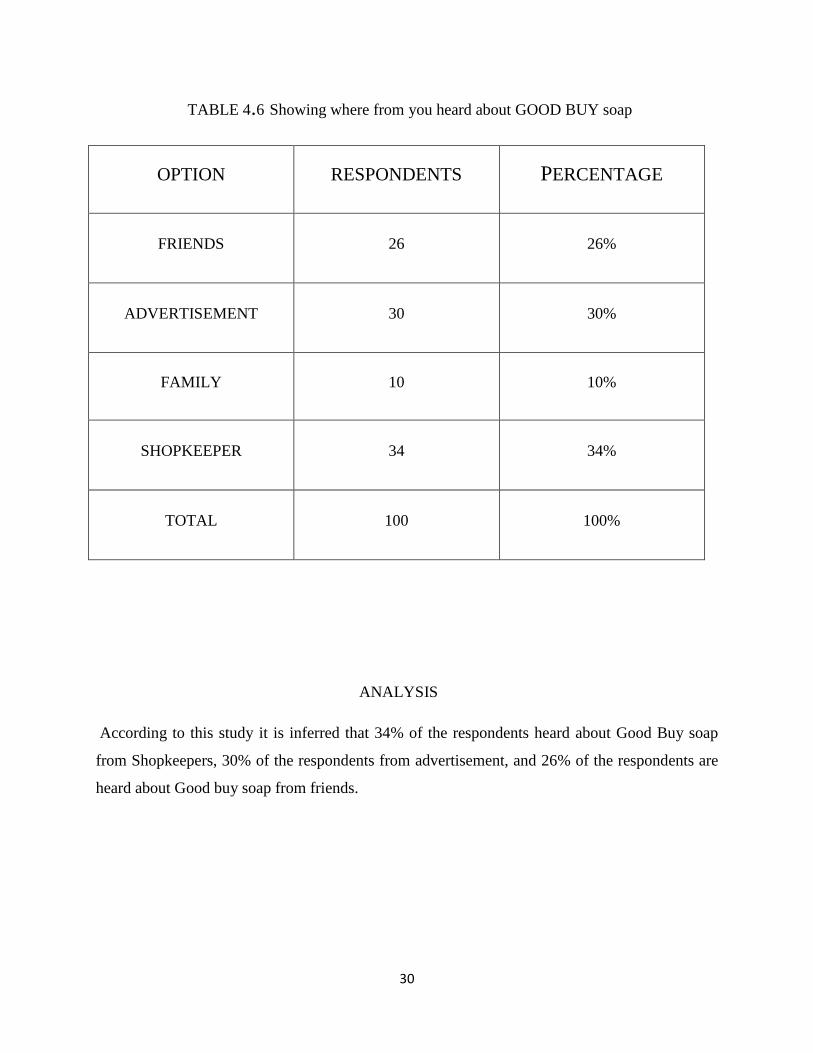
TABLE 4.6 Showing where from you heard about GOOD BUY soap
OPTION RESPONDENTS PERCENTAGE
FRIENDS 26 26%
ADVERTISEMENT 30 30%
FAMILY 10 10%
SHOPKEEPER 34 34%
TOTAL 100 100%
ANALYSIS
According to this study it is inferred that 34% of the respondents heard about Good Buy soap
from Shopkeepers, 30% of the respondents from advertisement, and 26% of the respondents are
heard about Good buy soap from friends.

31
CHART 4.6 Showing where from you heard about GOOD BUY soap
INTERPRETATION
From the above chart it is inferred that 34% of the respondents heard about Good Buy soap from
Shopkeepers, 30% of the respondents from advertisement and 26% of the respondents are heard
about Good buy soap from friends. This shows that the major source of information is from the
shop keepers.
26%
30%
10%
34%
0%
5%
10%
15%
20%
25%
30%
35%
40%
Friends Advertisement Family Shopkeeper
32
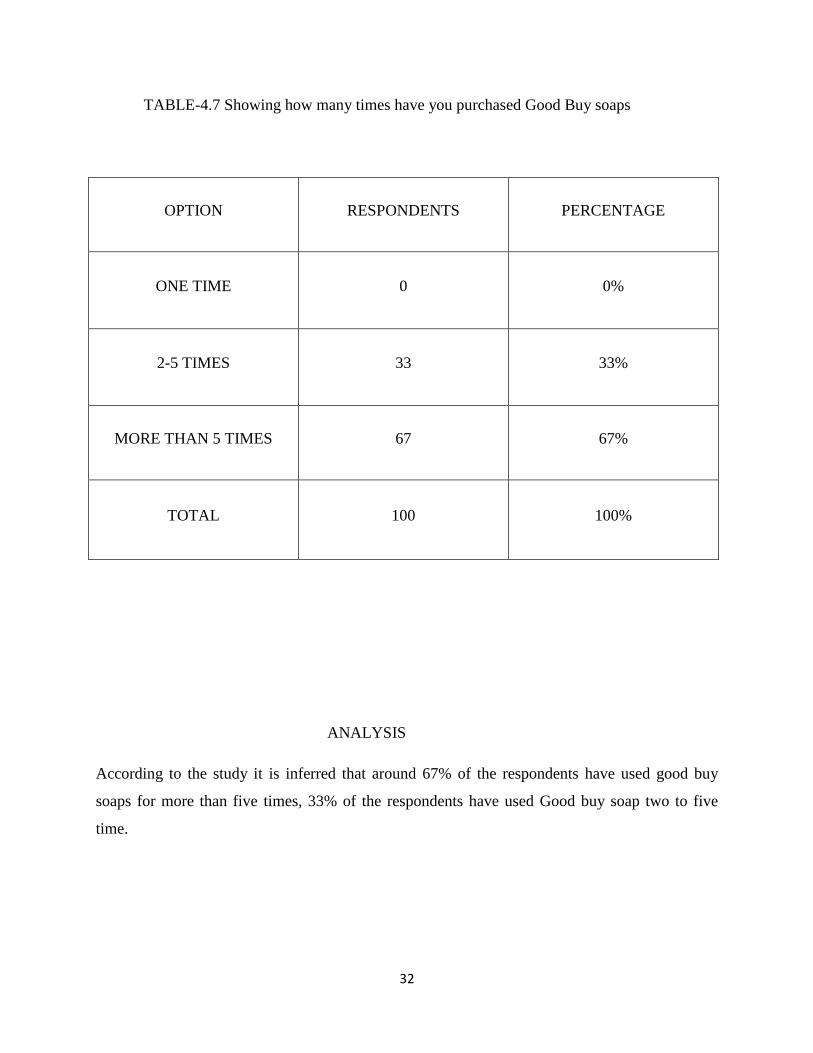
TABLE-4.7 Showing how many times have you purchased Good Buy soaps
OPTION RESPONDENTS PERCENTAGE
ONE TIME 0 0%
2-5 TIMES 33 33%
MORE THAN 5 TIMES 67 67%
TOTAL 100 100%
ANALYSIS
According to the study it is inferred that around 67% of the respondents have used good buy
soaps for more than five times, 33% of the respondents have used Good buy soap two to five
time.

33
CHART-4.7 Showing how many times have you purchased Good Buy soap
INTERPRETATION
From the above chart it is inferred that around 67% of the respondents have used good buy soaps
for more than five times and 33% of the respondents have used Good buy soap two to five time.
This shows that majority of the respondents were using good buy soaps for a considerable period
of time.
0%
10%
20%
30%
40%
50%
60%
70%
One time 2-5 times
More than 5 times
0%
33%
67%

34
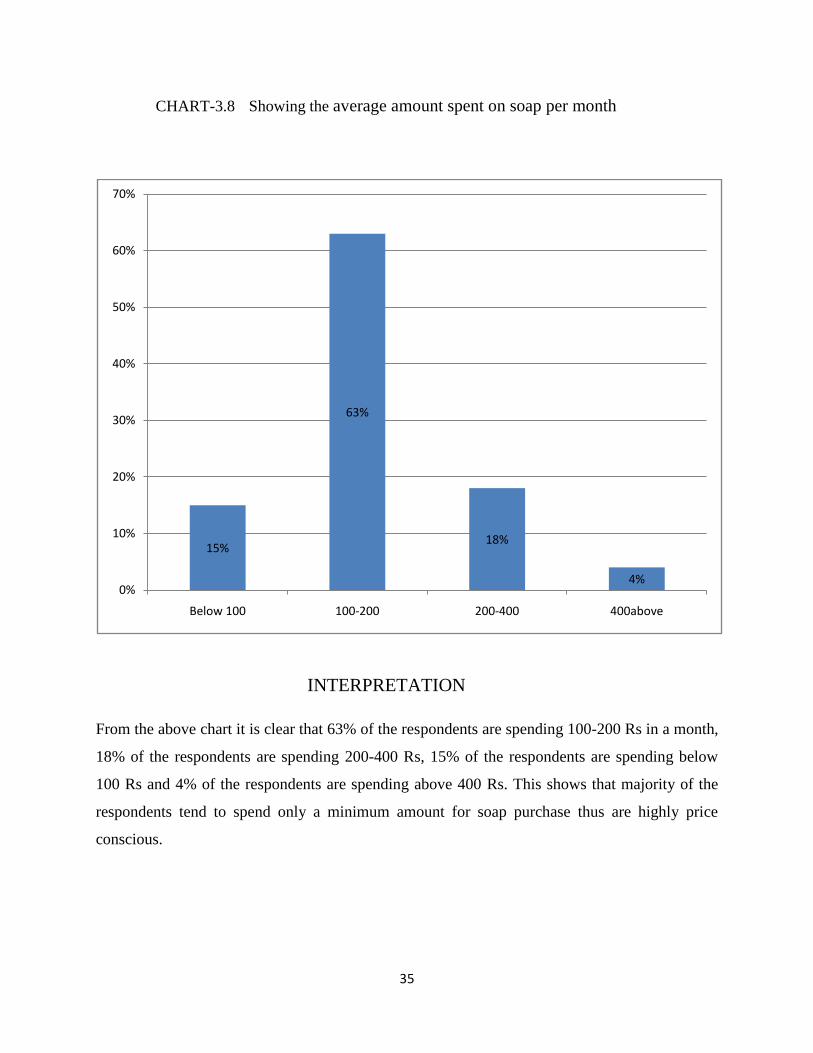
TABLE-4.8 Showing average amount spent on soap per month
OPTION RESPONDENTS PERCENTAGE
BELOW 100 15 15%
100-200 63 63%
200-400 18 18%
400ABOVE 4 4%
TOTAL 100 100%
ANALYSIS
According to the study 63% of the respondents are spending 100-200 Rs in a month, 18% of the
respondents are spending 200-400, 15% of the respondents are spending below 100 Rs and 4%
of the respondents are spending above 400 Rs
35
CHART-3.8 Showing the average amount spent on soap per month
INTERPRETATION
From the above chart it is clear that 63% of the respondents are spending 100-200 Rs in a month,
18% of the respondents are spending 200-400 Rs, 15% of the respondents are spending below
100 Rs and 4% of the respondents are spending above 400 Rs. This shows that majority of the
respondents tend to spend only a minimum amount for soap purchase thus are highly price
conscious.
15%
63%
18%
4%0%
10%
20%
30%
40%
50%
60%
70%
Below 100 100-200 200-400 400above
36
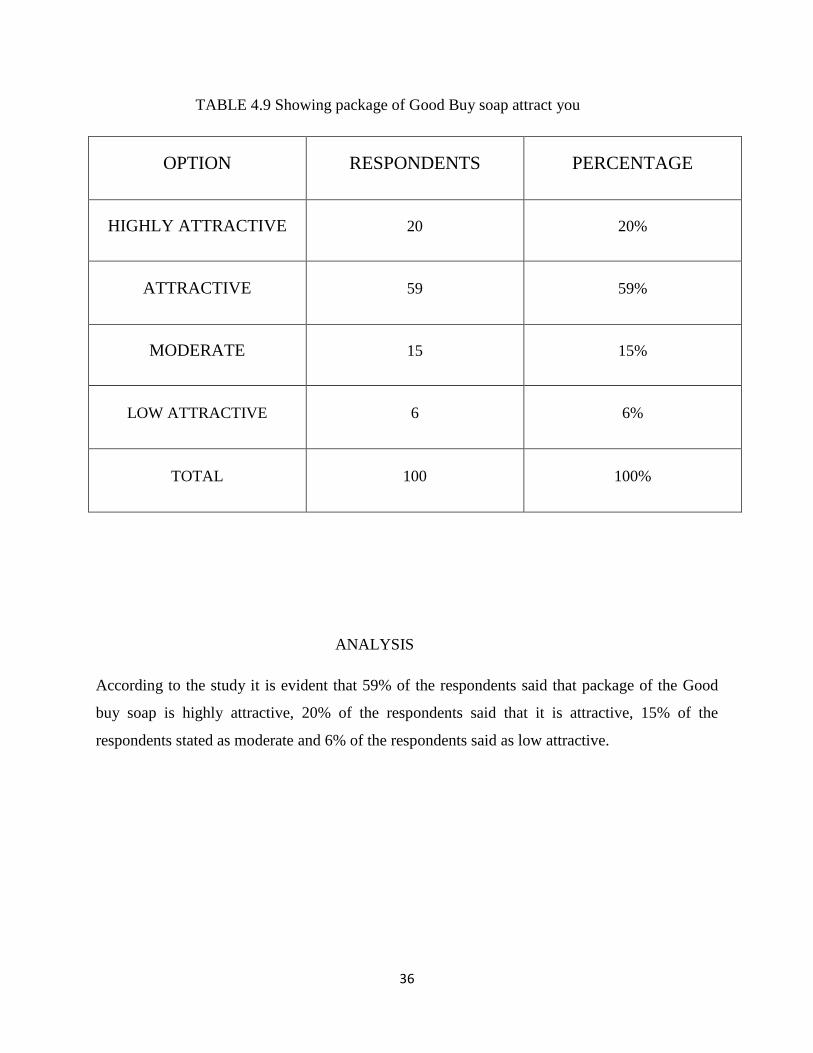
TABLE 4.9 Showing package of Good Buy soap attract you
OPTION RESPONDENTS PERCENTAGE
HIGHLY ATTRACTIVE 20 20%
ATTRACTIVE 59 59%
MODERATE 15 15%
LOW ATTRACTIVE 6 6%
TOTAL 100 100%
ANALYSIS
According to the study it is evident that 59% of the respondents said that package of the Good
buy soap is highly attractive, 20% of the respondents said that it is attractive, 15% of the
respondents stated as moderate and 6% of the respondents said as low attractive.

37
CHART-4.9 Showing package of Good Buy soap attract you
INTERPRETATION
From the above chart it is evident that only 59% of the respondents said that package of the
Good buy soap is highly attractive, 20% of the respondents said that it is attractive, 15% of the
respondents said as moderate and 6% of the respondents stated as low moderate. From this we
can understand the Good Buy soap‟s package is highly attractive and customers really like that.
0%
10%
20%
30%
40%
50%
60%
highly attractiveattractive
moderatelow moderate
20%
59%
15%
6%

38
TABLE-4.10 Showing preference of liquid soap
ANALYSIS
According to the study it is inferred that 98% of the respondents do not prefer liquid soap only
2% of the respondents prefer liquid soap.
OPTION RESPONDENTS PERCENTAGE
YES 2 2%
NO 98 98%
TOTAL 100 100%

39
CHART-4.10 Showing preference of liquid soap
INTERPRETATION
From the above chart it is inferred that 98% of the respondent‟s not preferring liquid soap only
2% of the respondents prefer liquid soap. From this we can understand huge majority of the
respondents do not prefer liquid soap.
2%
98%
0%
20%
40%
60%
80%
100%
120%
Yes No
40
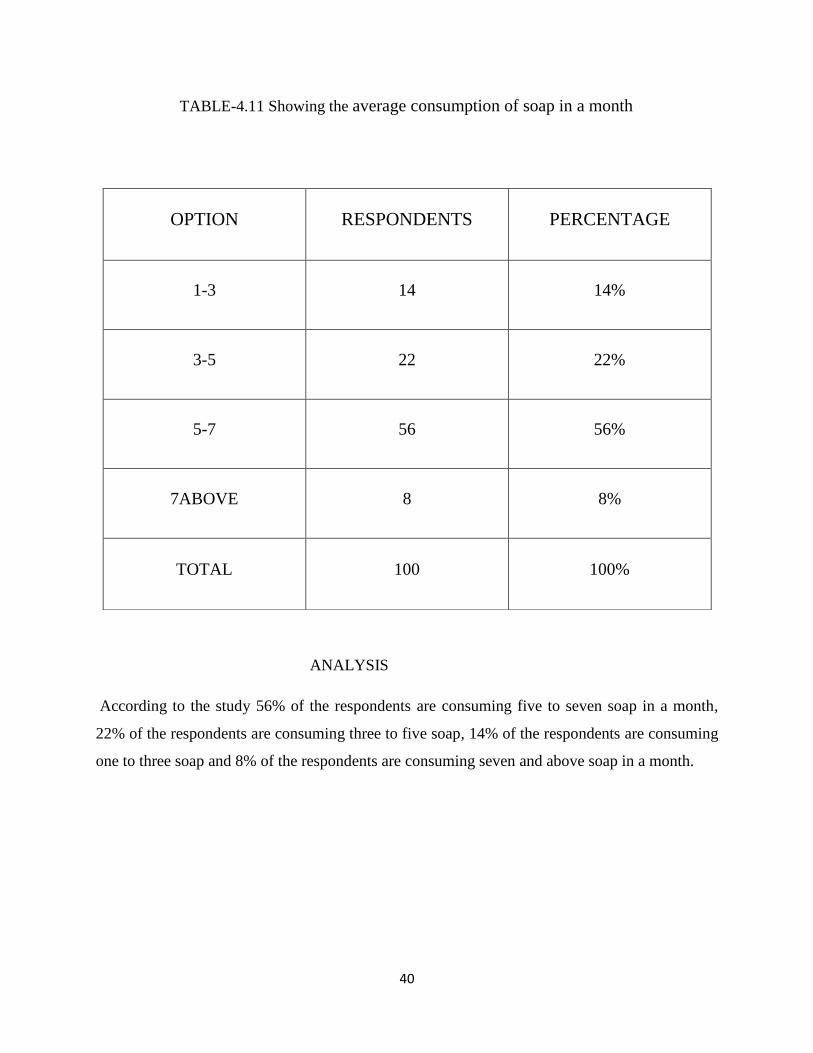
TABLE-4.11 Showing the average consumption of soap in a month
ANALYSIS
According to the study 56% of the respondents are consuming five to seven soap in a month,
22% of the respondents are consuming three to five soap, 14% of the respondents are consuming
one to three soap and 8% of the respondents are consuming seven and above soap in a month.
OPTION RESPONDENTS PERCENTAGE
1-3 14 14%
3-5 22 22%
5-7 56 56%
7ABOVE 8 8%
TOTAL 100 100%
41
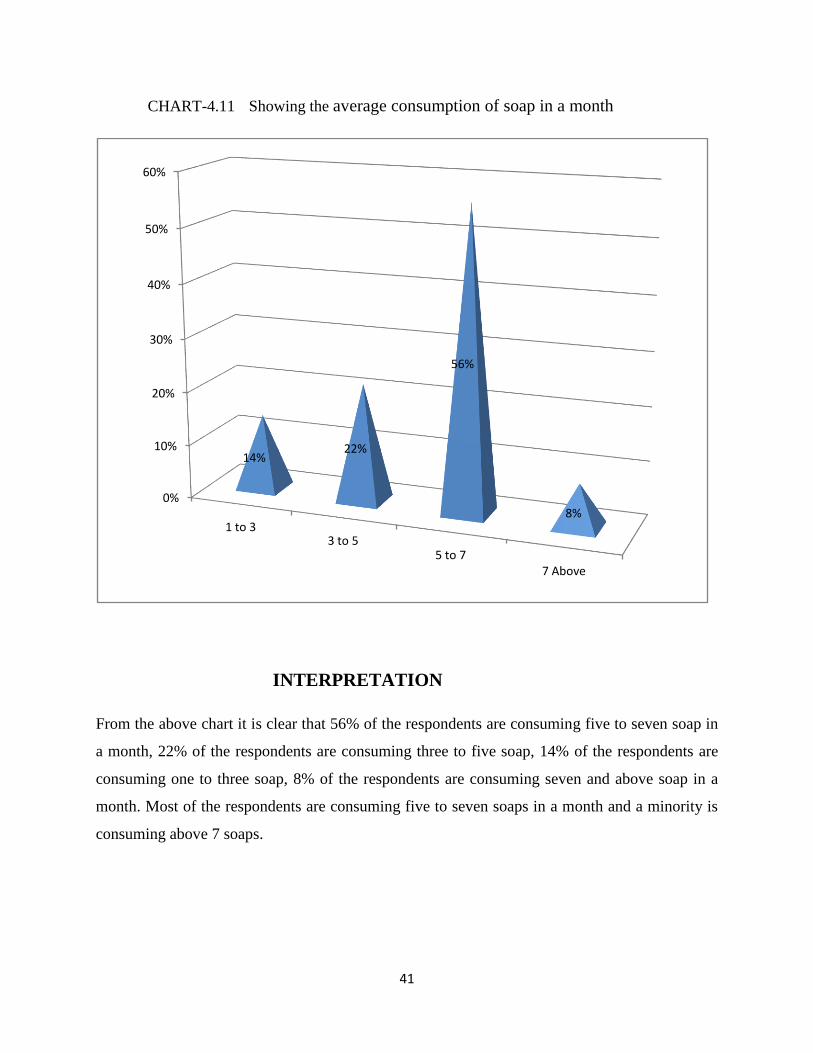
CHART-4.11 Showing the average consumption of soap in a month
INTERPRETATION
From the above chart it is clear that 56% of the respondents are consuming five to seven soap in
a month, 22% of the respondents are consuming three to five soap, 14% of the respondents are
consuming one to three soap, 8% of the respondents are consuming seven and above soap in a
month. Most of the respondents are consuming five to seven soaps in a month and a minority is
consuming above 7 soaps.
0%
10%
20%
30%
40%
50%
60%
1 to 33 to 5
5 to 77 Above
14%22%
56%
8%
42
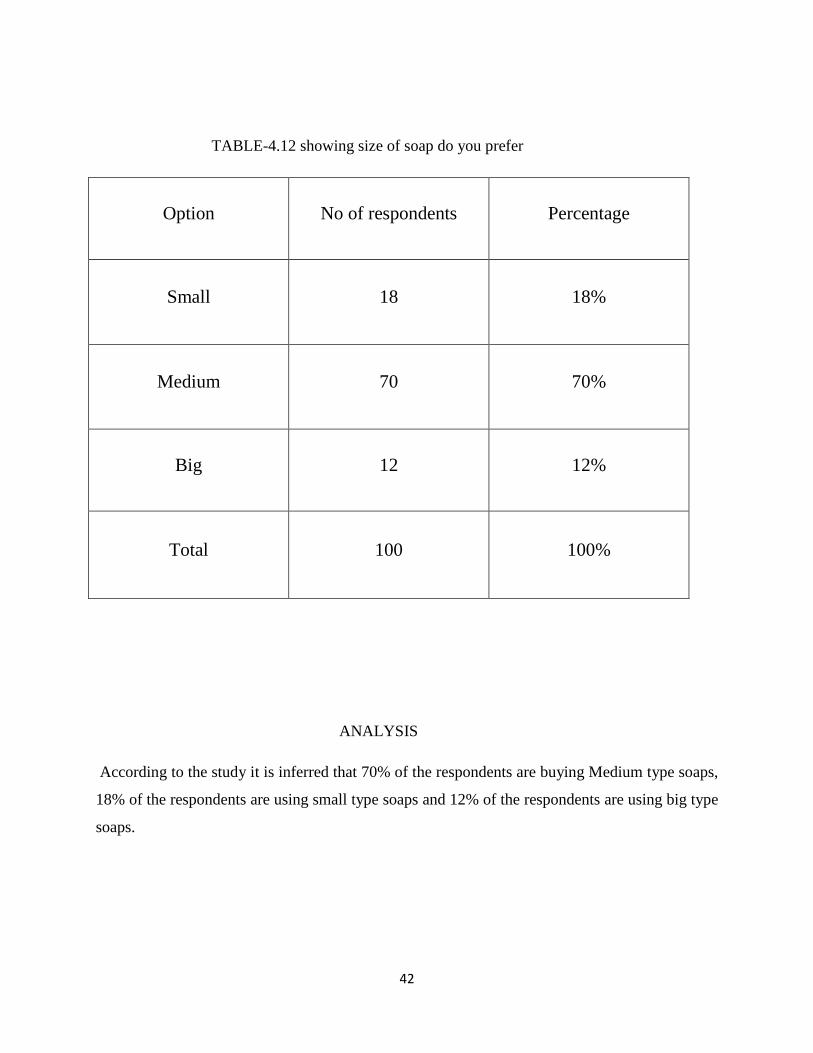
TABLE-4.12 showing size of soap do you prefer
Option No of respondents Percentage
Small 18 18%
Medium 70 70%
Big 12 12%
Total 100 100%
ANALYSIS
According to the study it is inferred that 70% of the respondents are buying Medium type soaps,
18% of the respondents are using small type soaps and 12% of the respondents are using big type
soaps.

43
CHART- 4.12 showing size of soap
INTERPRETATION
From the above chart it is inferred that 70% of the respondents are buying Medium type soaps,
18% of the respondents are using small type soaps and 12% of the respondents are using big type
soaps. From this we can understand majority of the respondents likes medium type soaps and
only a minority likes big soaps.
0%
10%
20%
30%
40%
50%
60%
70%
80%
SmallMedium
Big
18%
70%
12%
44
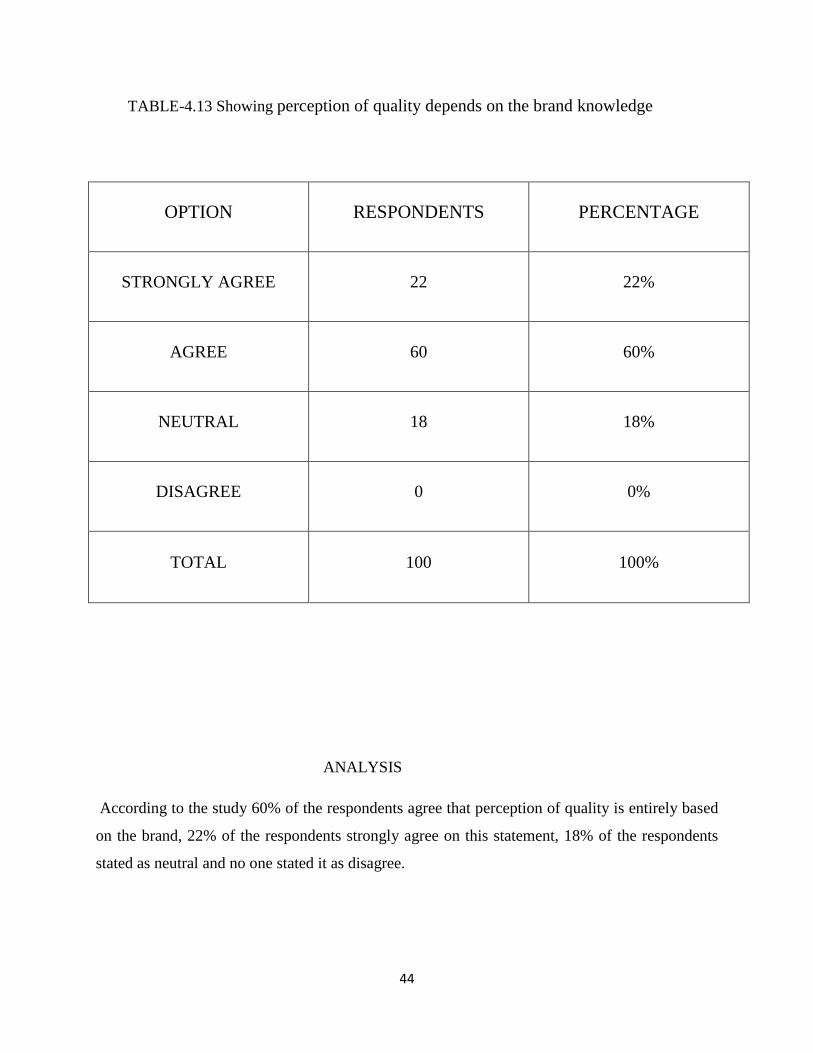
TABLE-4.13 Showing perception of quality depends on the brand knowledge
OPTION RESPONDENTS PERCENTAGE
STRONGLY AGREE 22 22%
AGREE 60 60%
NEUTRAL 18 18%
DISAGREE 0 0%
TOTAL 100 100%
ANALYSIS
According to the study 60% of the respondents agree that perception of quality is entirely based
on the brand, 22% of the respondents strongly agree on this statement, 18% of the respondents
stated as neutral and no one stated it as disagree.
45
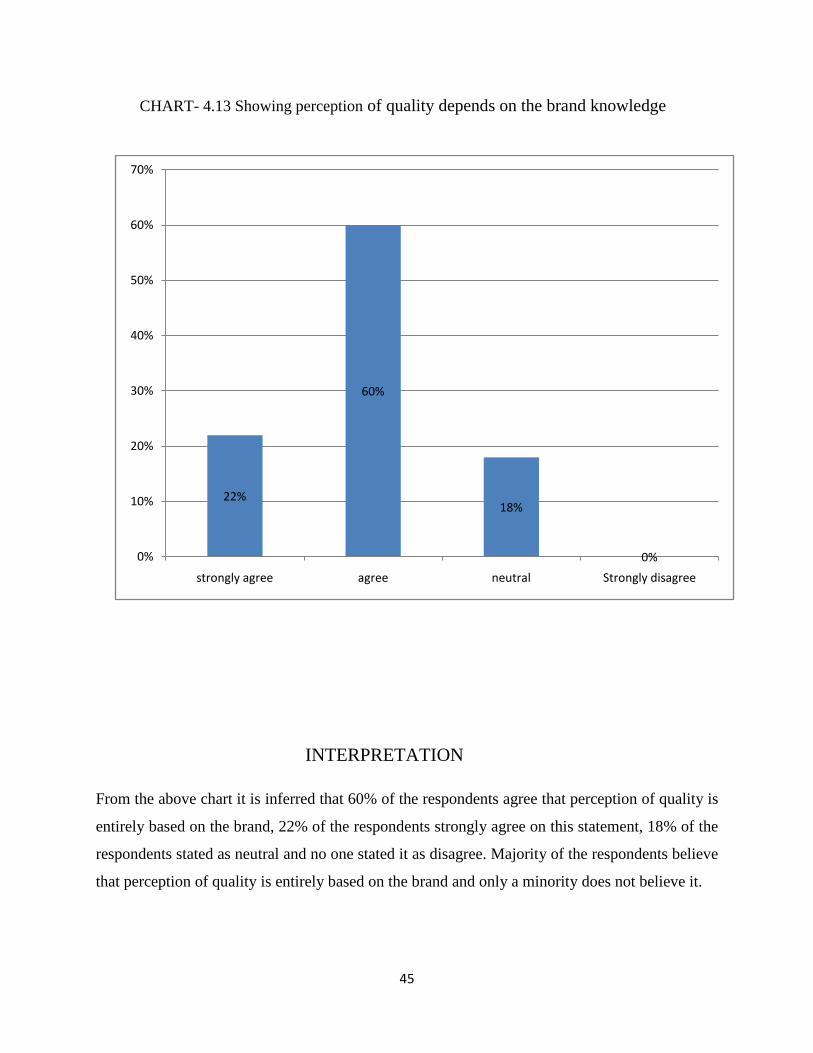
CHART- 4.13 Showing perception of quality depends on the brand knowledge
INTERPRETATION
From the above chart it is inferred that 60% of the respondents agree that perception of quality is
entirely based on the brand, 22% of the respondents strongly agree on this statement, 18% of the
respondents stated as neutral and no one stated it as disagree. Majority of the respondents believe
that perception of quality is entirely based on the brand and only a minority does not believe it.
22%
60%
18%
0%0%
10%
20%
30%
40%
50%
60%
70%
strongly agree agree neutral Strongly disagree
46
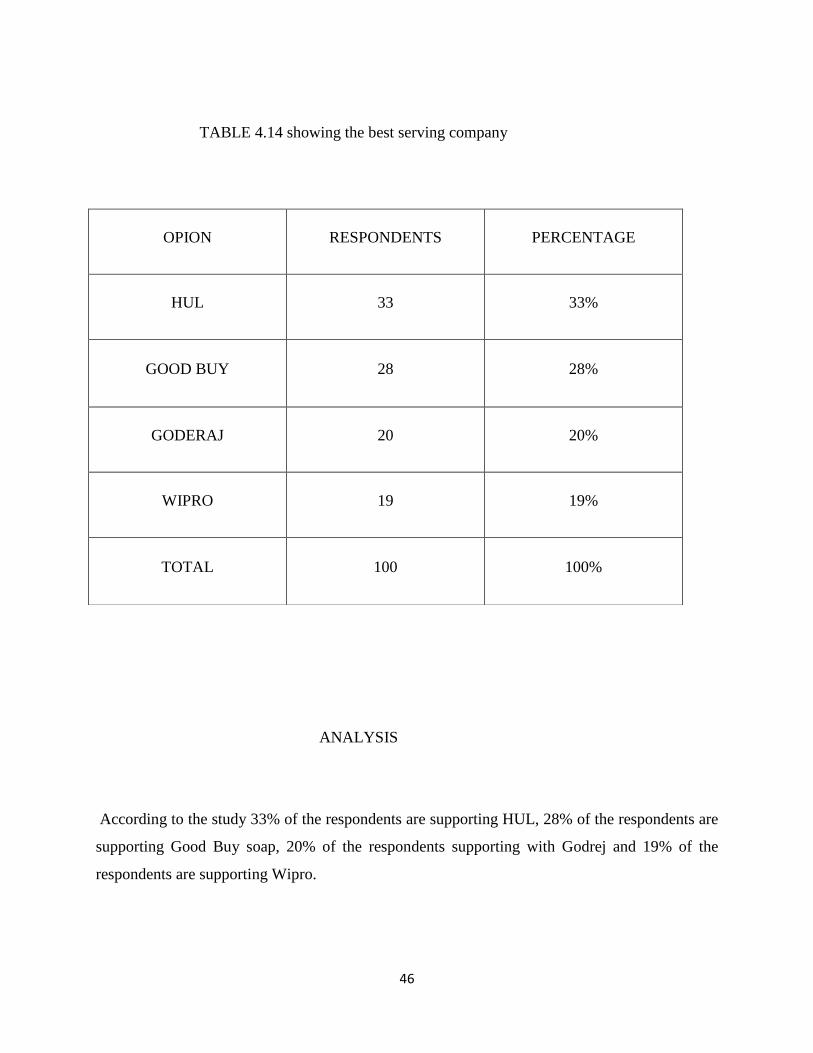
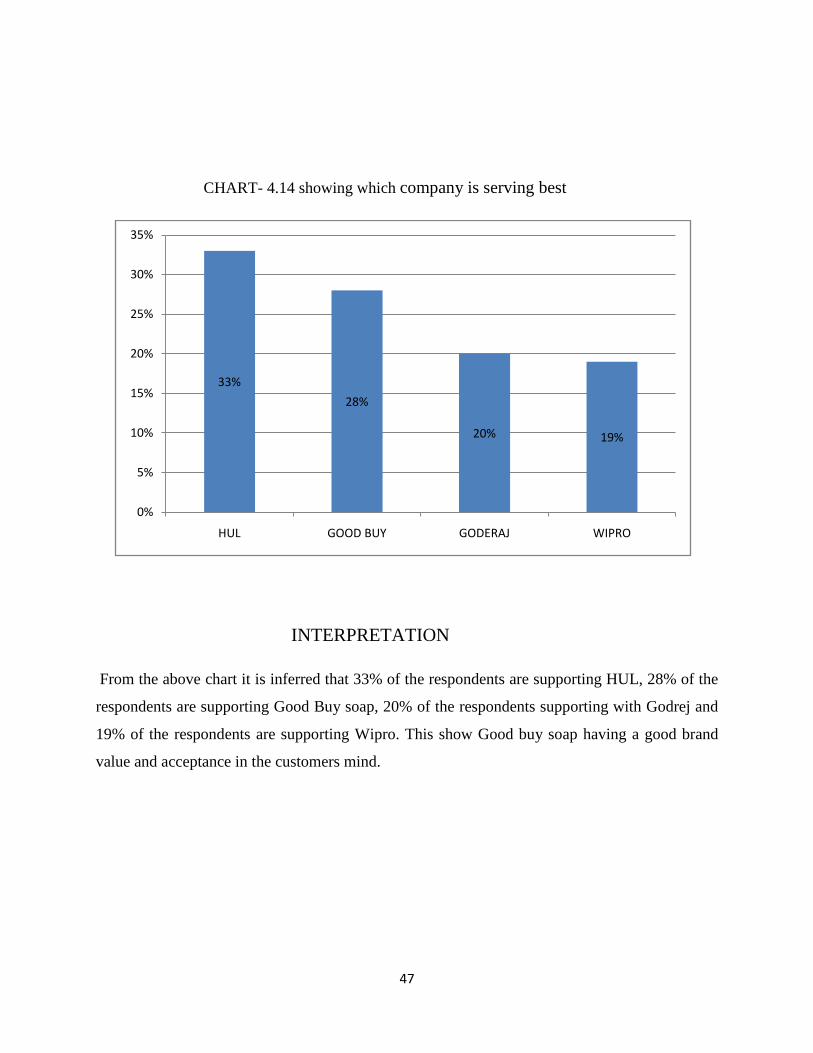
TABLE 4.14 showing the best serving company
ANALYSIS
According to the study 33% of the respondents are supporting HUL, 28% of the respondents are
supporting Good Buy soap, 20% of the respondents supporting with Godrej and 19% of the
respondents are supporting Wipro.
OPION RESPONDENTS PERCENTAGE
HUL 33 33%
GOOD BUY 28 28%
GODERAJ 20 20%
WIPRO 19 19%
TOTAL 100 100%
47
CHART- 4.14 showing which company is serving best
INTERPRETATION
From the above chart it is inferred that 33% of the respondents are supporting HUL, 28% of the
respondents are supporting Good Buy soap, 20% of the respondents supporting with Godrej and
19% of the respondents are supporting Wipro. This show Good buy soap having a good brand
value and acceptance in the customers mind.
33%
28%
20% 19%
0%
5%
10%
15%
20%
25%
30%
35%
HUL GOOD BUY GODERAJ WIPRO
48
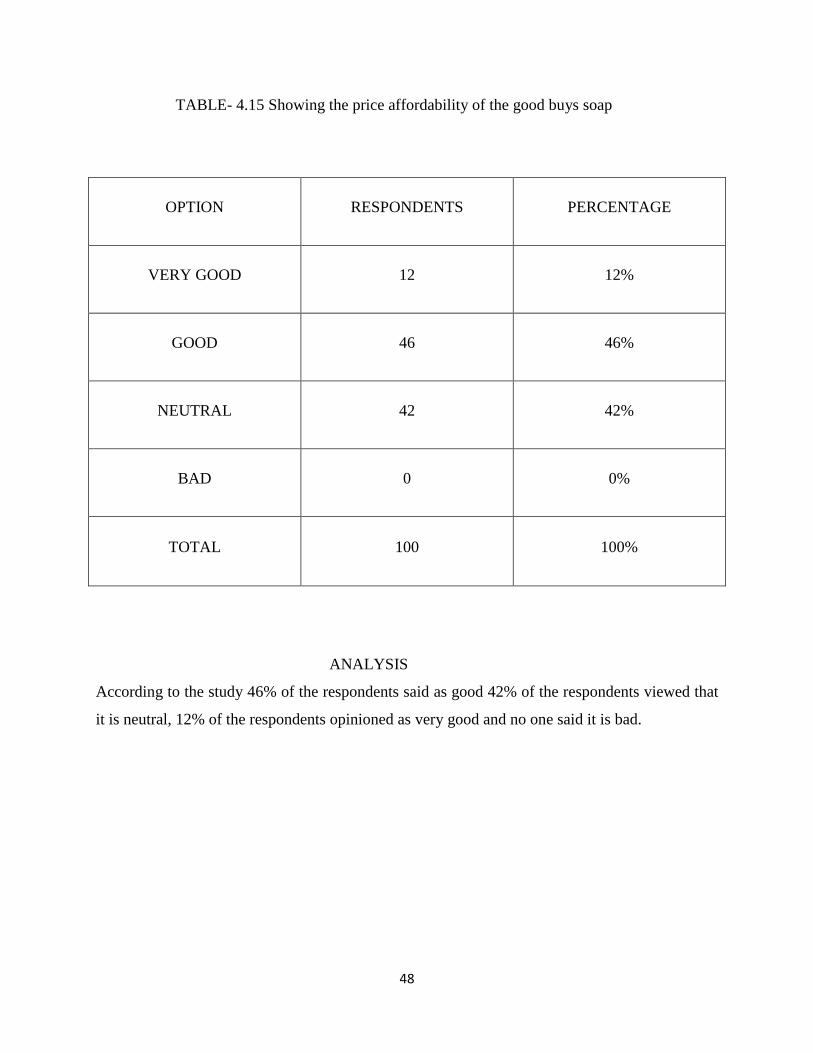
TABLE- 4.15 Showing the price affordability of the good buys soap
OPTION RESPONDENTS PERCENTAGE
VERY GOOD 12 12%
GOOD 46 46%
NEUTRAL 42 42%
BAD 0 0%
TOTAL 100 100%
ANALYSIS
According to the study 46% of the respondents said as good 42% of the respondents viewed that
it is neutral, 12% of the respondents opinioned as very good and no one said it is bad.

49
CHART-4.15 Showing price affordability of the good buys soap
INTERPRETATION
From the above chart it is inferred that According to the study 46% of the respondents said as
good 42% of the respondents viewed that it is neutral, 12% of the respondents opinioned as very
good and no one said it is bad. From this we can understand majority of them agree that the
Good Buy products are affordable.
12%
46%
42%
0%0
0.05
0.1
0.15
0.2
0.25
0.3
0.35
0.4
0.45
0.5
very good good neutral bad

50
TABLE-4.16 Showing what should be the reasonable price
OPTION RESPONDENTS PERCENTAGE
BELOW 10 6 8%
10-20 22 22%
20-30 58 27%
30ABOVE 14 3%
TOTAL 100 100%
ANALYSIS
According to the study 58% of the respondents preferred that the price of the soap should be 20-
30 Rs, 22% of the respondents preferred that the price of soap should be 10-20 Rs, 14% of the
respondents preferred that it should be above 30 Rs and Only 3% of the respondent‟s preferred
price is below 10Rs.
51
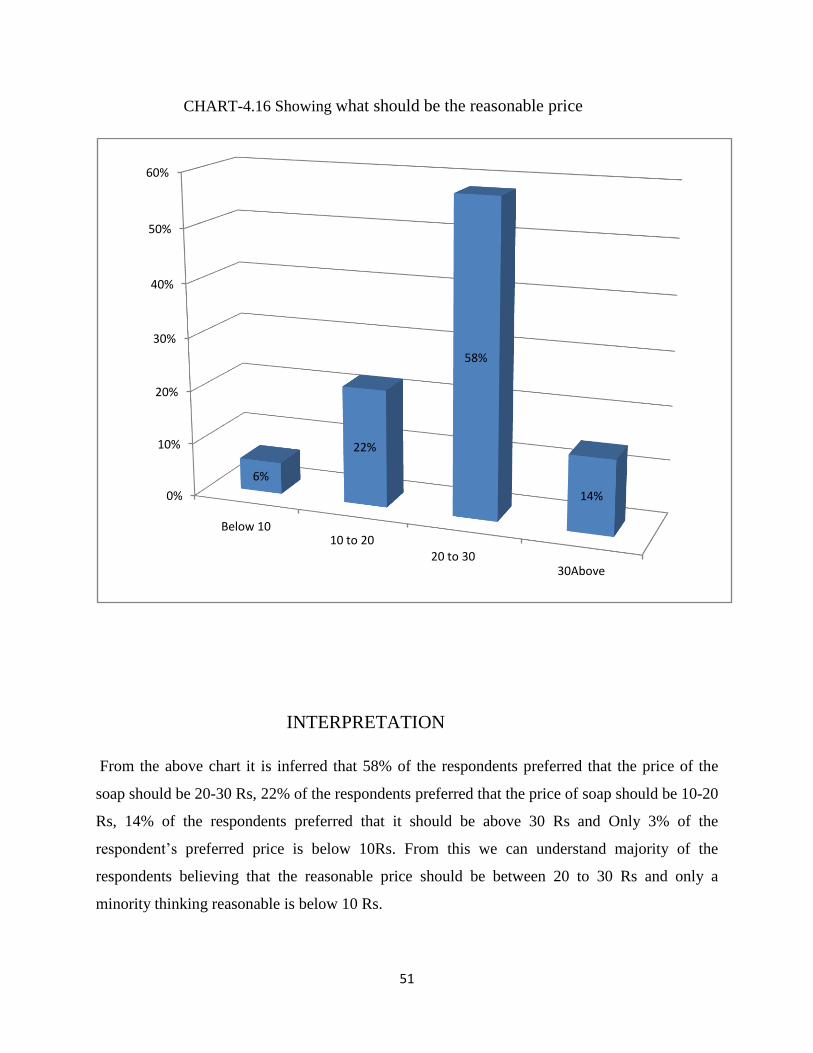
CHART-4.16 Showing what should be the reasonable price
INTERPRETATION
From the above chart it is inferred that 58% of the respondents preferred that the price of the
soap should be 20-30 Rs, 22% of the respondents preferred that the price of soap should be 10-20
Rs, 14% of the respondents preferred that it should be above 30 Rs and Only 3% of the
respondent‟s preferred price is below 10Rs. From this we can understand majority of the
respondents believing that the reasonable price should be between 20 to 30 Rs and only a
minority thinking reasonable is below 10 Rs.
0%
10%
20%
30%
40%
50%
60%
Below 1010 to 20
20 to 30 30Above
6%
22%
58%
14%

52
TABLE-4.17 Showing quality of Good Buy soap is satisfactory
OPTION RESPONDENTS PERCENTAGE
AGREE 66 66%
DISAGREE 8 8%
NEUTRAL 26 26%
TOTAL 100 100%
ANALYSIS
According to the study 66% of the respondents felt that the quality of Good Buy soap is
satisfactory, 26% of the respondent‟s opinioned neutral and 8% of the respondents opinioned that
the quality of the Good Buy soap is not satisfactory.
53
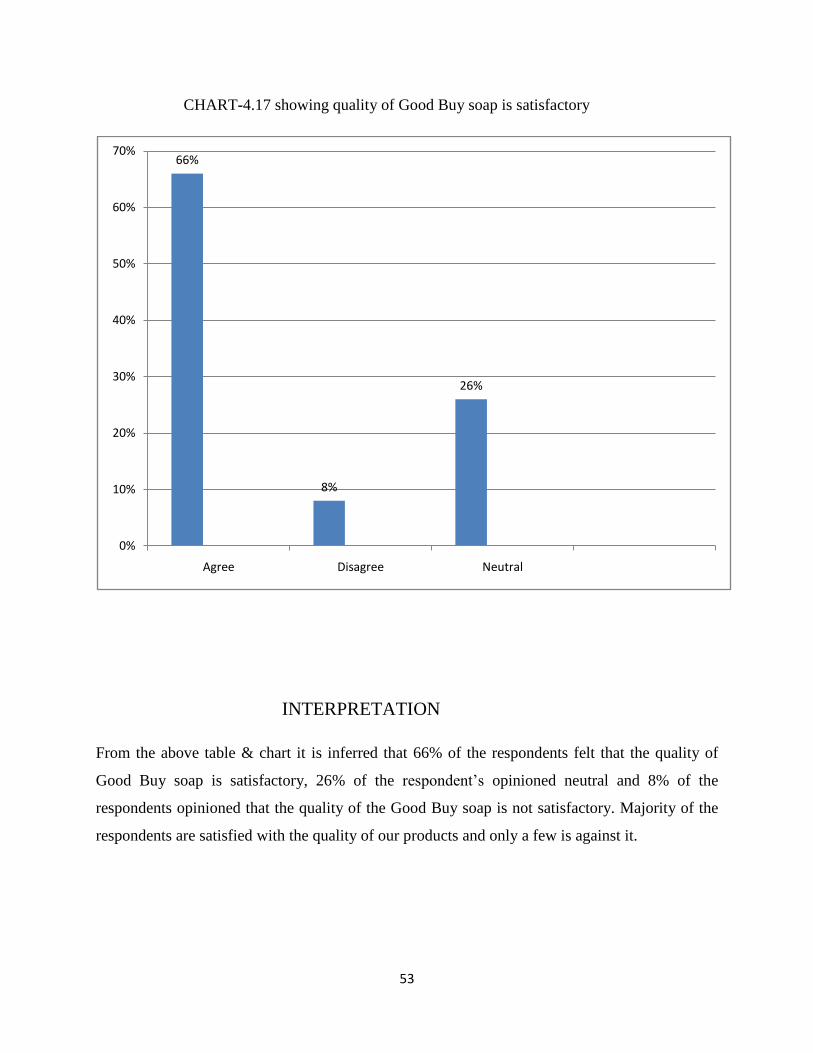
CHART-4.17 showing quality of Good Buy soap is satisfactory
INTERPRETATION
From the above table & chart it is inferred that 66% of the respondents felt that the quality of
Good Buy soap is satisfactory, 26% of the respondent‟s opinioned neutral and 8% of the
respondents opinioned that the quality of the Good Buy soap is not satisfactory. Majority of the
respondents are satisfied with the quality of our products and only a few is against it.
66%
8%
26%
0%
10%
20%
30%
40%
50%
60%
70%
Agree Disagree Neutral
54
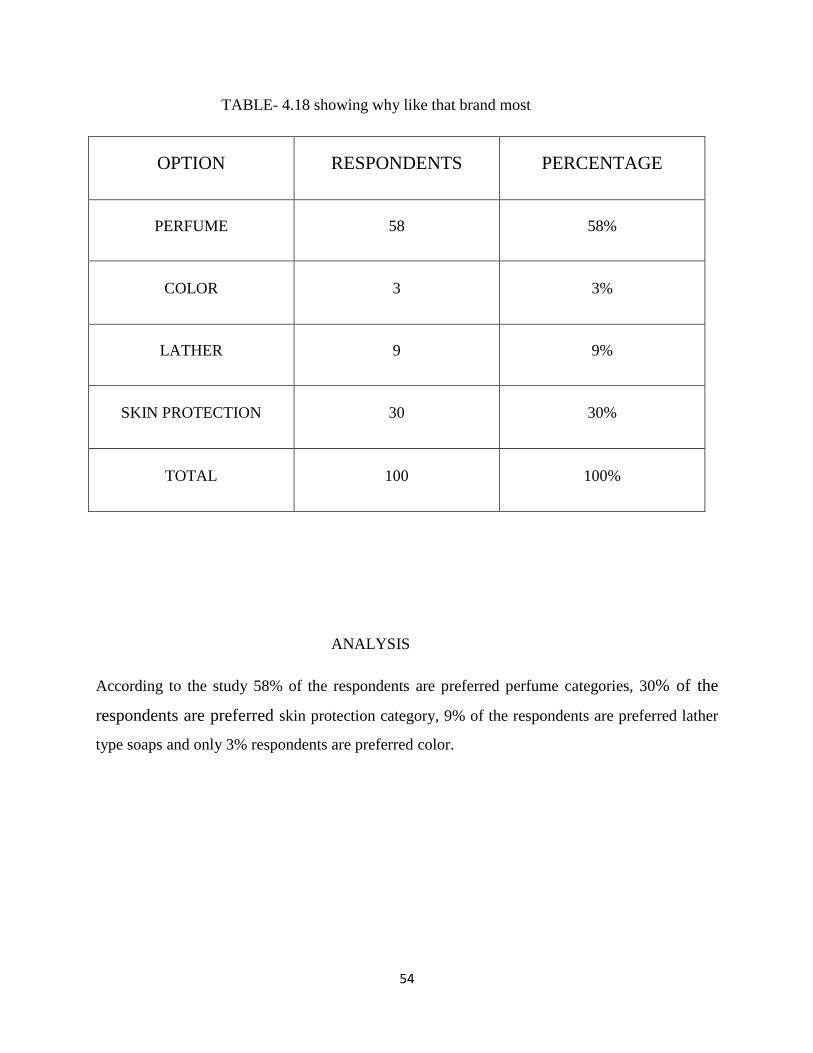
TABLE- 4.18 showing why like that brand most
OPTION RESPONDENTS PERCENTAGE
PERFUME 58 58%
COLOR 3 3%
LATHER 9 9%
SKIN PROTECTION 30 30%
TOTAL 100 100%
ANALYSIS
According to the study 58% of the respondents are preferred perfume categories, 30% of the
respondents are preferred skin protection category, 9% of the respondents are preferred lather
type soaps and only 3% respondents are preferred color.

55
CHART-4.18 showing why like that brand most
INTERPRETATION
From the above chart it is inferred that 58% of the respondents are preferred perfume categories,
30% of the respondents preferred skin protection category, 9% of the respondents preferred
lather type soaps and 3% respondents prefer color. From this we can understand majority
respondents choosing perfume category while buying soaps and only a few is choosing the color
while buying soaps.
0%
10%
20%
30%
40%
50%
60%
Perfumecolor
lather
skin protection
58%
3% 9%
30%
56
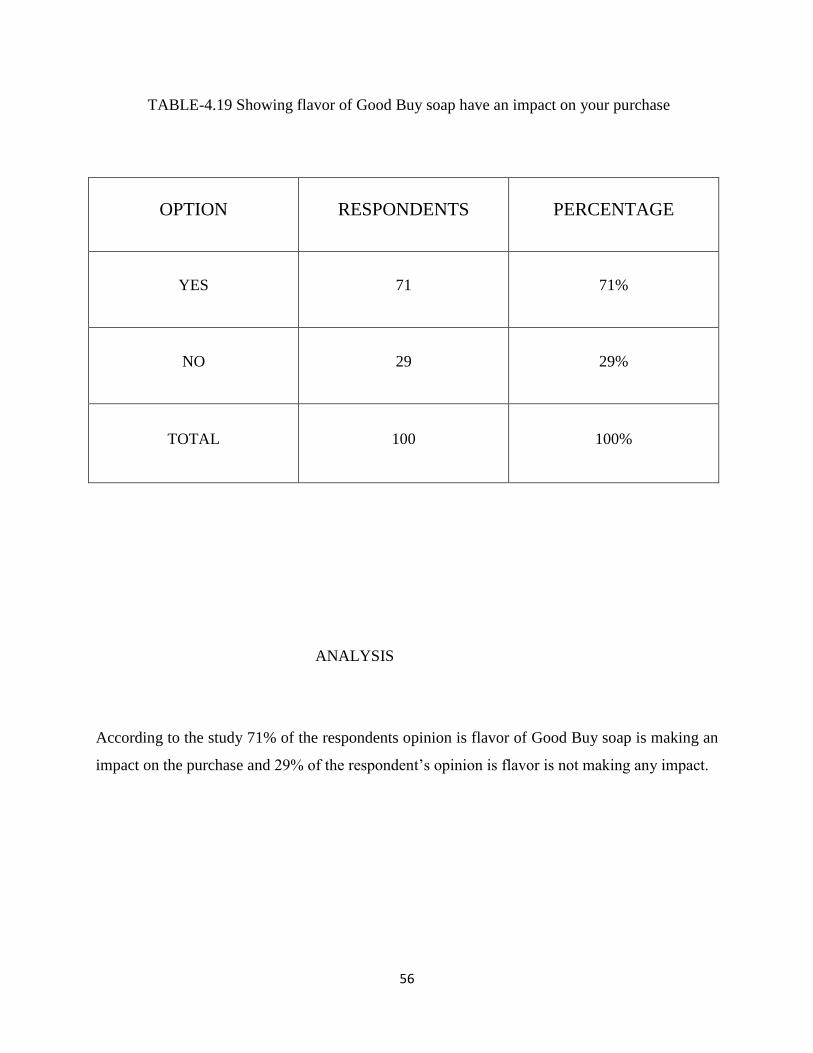
TABLE-4.19 Showing flavor of Good Buy soap have an impact on your purchase
OPTION RESPONDENTS PERCENTAGE
YES 71 71%
NO 29 29%
TOTAL 100 100%
ANALYSIS
According to the study 71% of the respondents opinion is flavor of Good Buy soap is making an
impact on the purchase and 29% of the respondent‟s opinion is flavor is not making any impact.
57
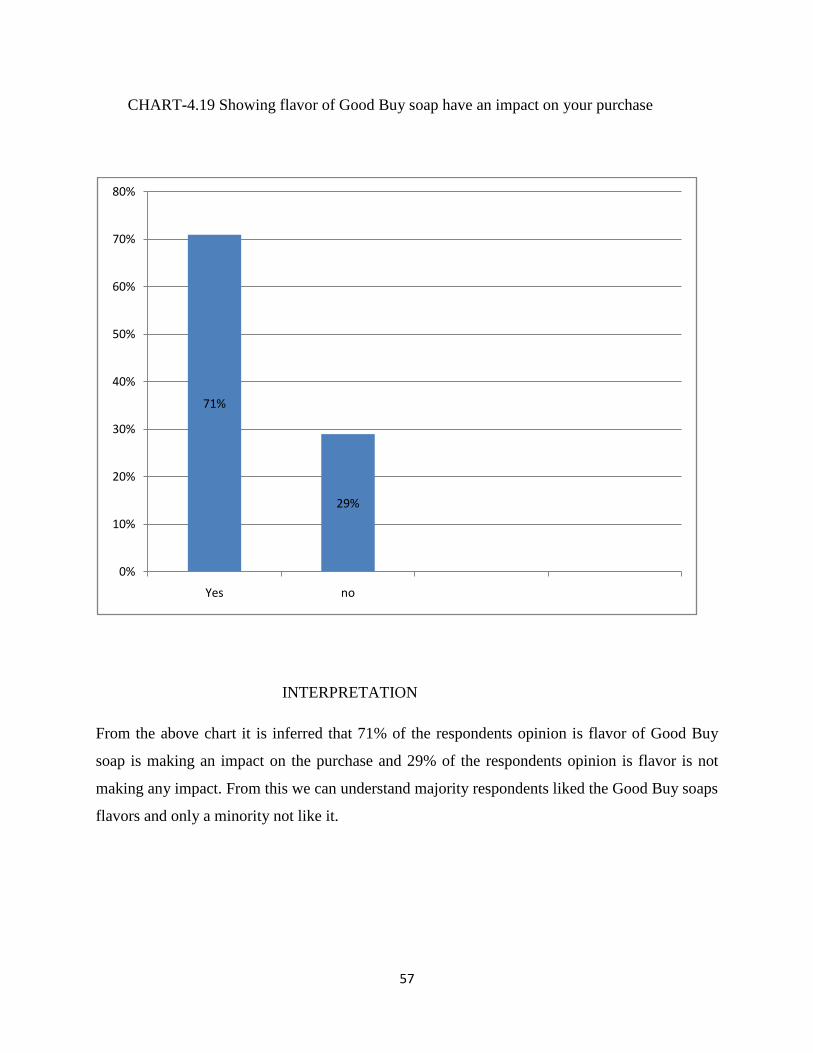
CHART-4.19 Showing flavor of Good Buy soap have an impact on your purchase
INTERPRETATION
From the above chart it is inferred that 71% of the respondents opinion is flavor of Good Buy
soap is making an impact on the purchase and 29% of the respondents opinion is flavor is not
making any impact. From this we can understand majority respondents liked the Good Buy soaps
flavors and only a minority not like it.
71%
29%
0%
10%
20%
30%
40%
50%
60%
70%
80%
Yes no
58
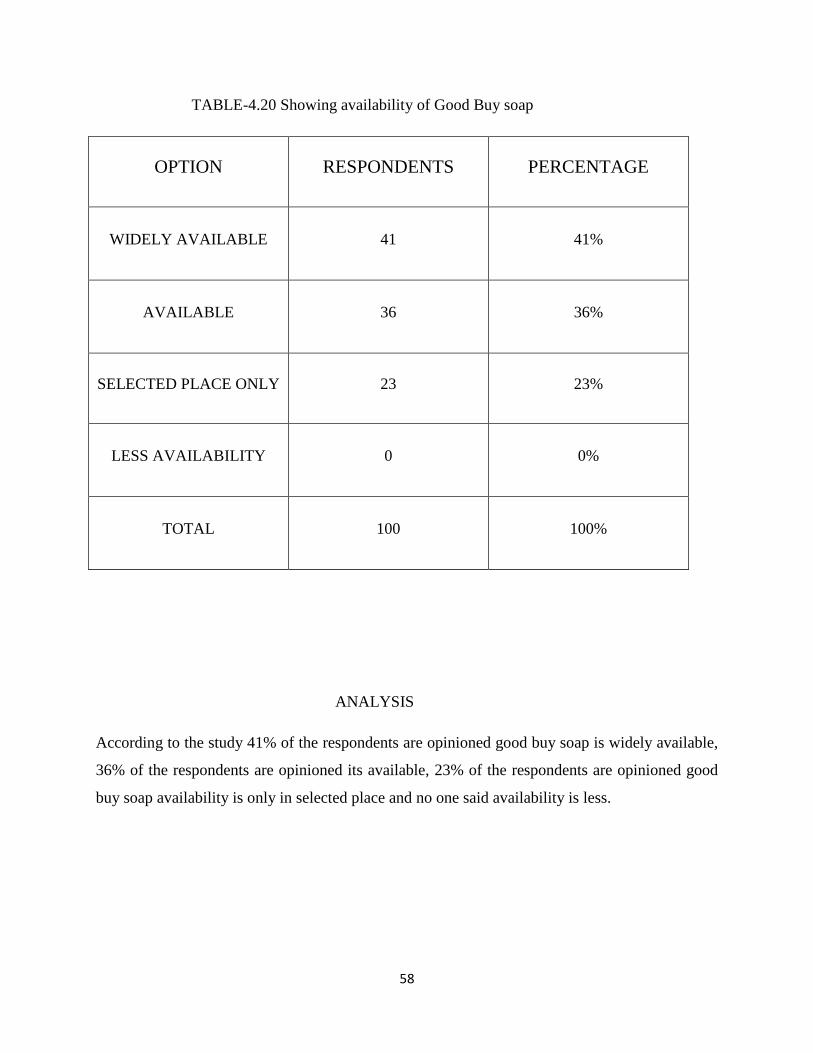
TABLE-4.20 Showing availability of Good Buy soap
OPTION RESPONDENTS PERCENTAGE
WIDELY AVAILABLE 41 41%
AVAILABLE 36 36%
SELECTED PLACE ONLY 23 23%
LESS AVAILABILITY 0 0%
TOTAL 100 100%
ANALYSIS
According to the study 41% of the respondents are opinioned good buy soap is widely available,
36% of the respondents are opinioned its available, 23% of the respondents are opinioned good
buy soap availability is only in selected place and no one said availability is less.
59
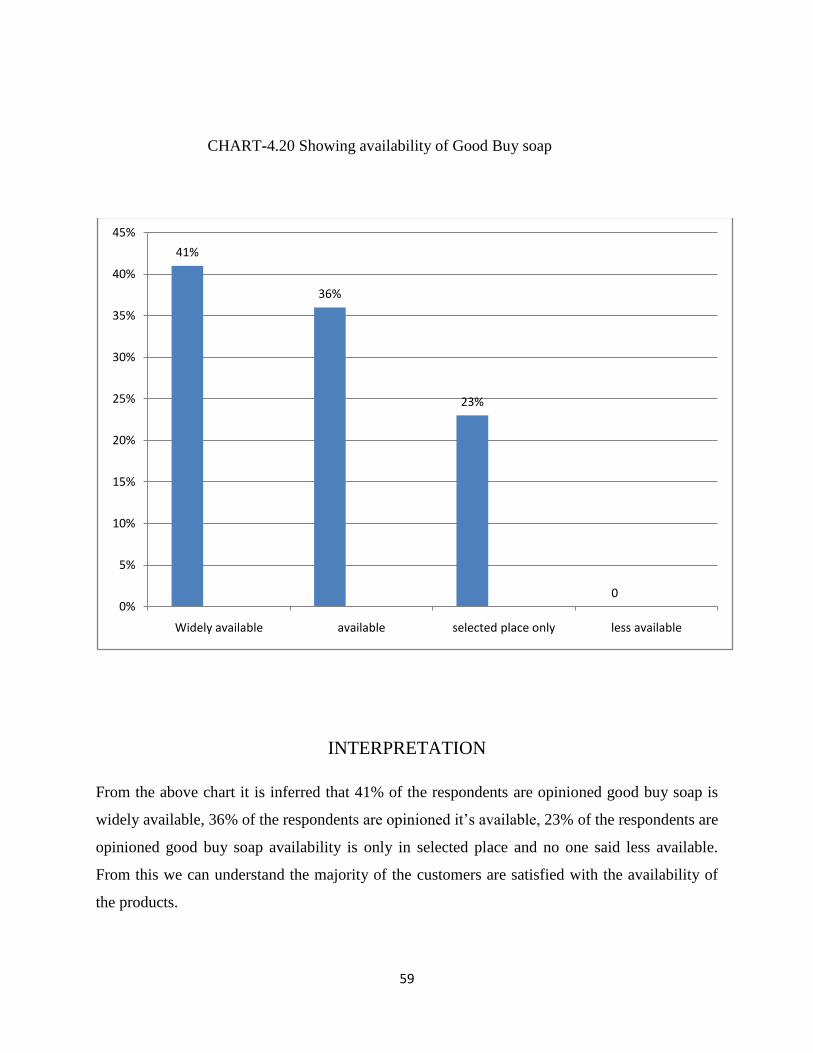
CHART-4.20 Showing availability of Good Buy soap
INTERPRETATION
From the above chart it is inferred that 41% of the respondents are opinioned good buy soap is
widely available, 36% of the respondents are opinioned it‟s available, 23% of the respondents are
opinioned good buy soap availability is only in selected place and no one said less available.
From this we can understand the majority of the customers are satisfied with the availability of
the products.
41%
36%
23%
00%
5%
10%
15%
20%
25%
30%
35%
40%
45%
Widely available available selected place only less available
60
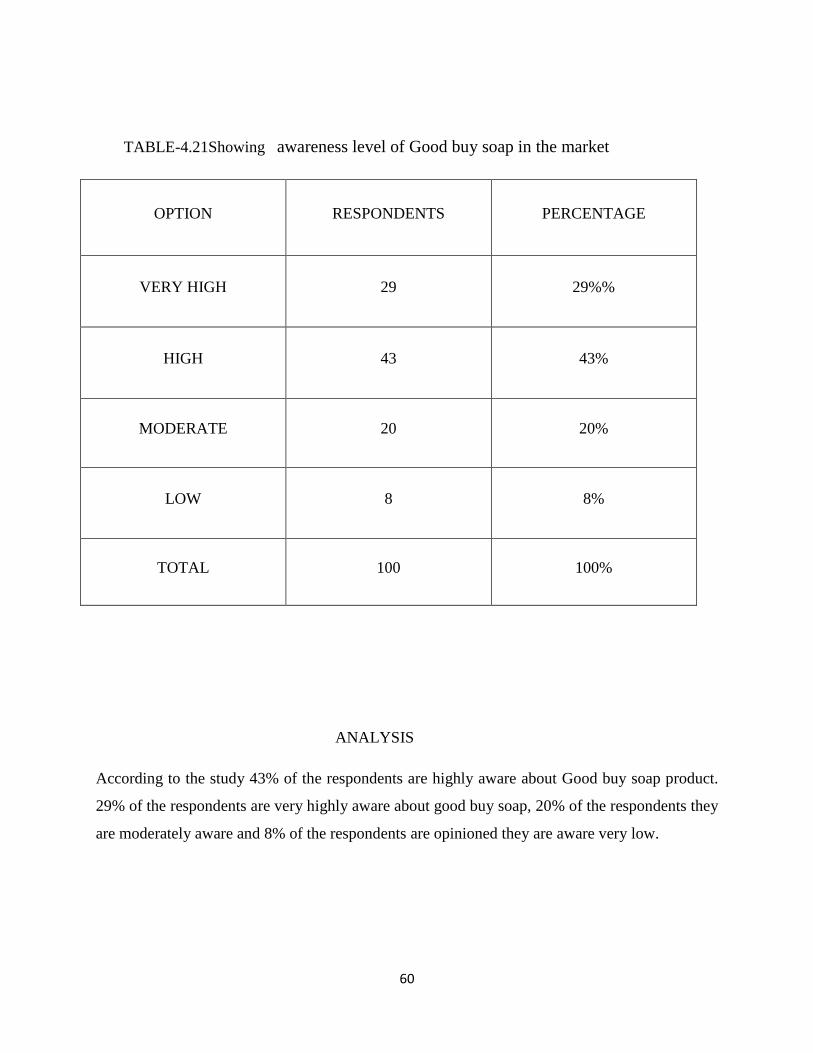
TABLE-4.21Showing awareness level of Good buy soap in the market
OPTION RESPONDENTS PERCENTAGE
VERY HIGH 29 29%%
HIGH 43 43%
MODERATE 20 20%
LOW 8 8%
TOTAL 100 100%
ANALYSIS
According to the study 43% of the respondents are highly aware about Good buy soap product.
29% of the respondents are very highly aware about good buy soap, 20% of the respondents they
are moderately aware and 8% of the respondents are opinioned they are aware very low.

61
CHART-4.21 Showing awareness level of Good buy soap in the market
INTERPRETATION
From the above chart it is inferred that 43% of the respondents are highly aware about Good buy
soap product, 29% of the respondents are very highly aware about good buy soap, 20% of the
respondents they are moderately aware and 8% of the respondents are opinioned they are aware
very low. From this we can understand majority of them are very much aware about the Good
Buy soap and only a minority low aware about it.
29%
43%
20%
8%
0%
5%
10%
15%
20%
25%
30%
35%
40%
45%
50%
very high HIGH moderate low

62
TABLE-4.22 Showing factor consist stimulates to buy the Good Buy soap.
OPTION RESPONDENTS PERCENTAGE
ADVERTISEMENT 25 25%
BRAND 18 18%
PRICE 22 22%
QUALITY 35 35%
TOTAL 100 100%
ANALYSIS
According to the study 35% of the respondents are opinioned quality is consisting to buy the
soap, 25% of the respondents are opinioned advertisement is consisting to buy soap, 22% of the
respondents are opinioned depending up on price they are taking buying decision and 18% of the
respondents are opinioned brand is consisting to buy the soap.
63
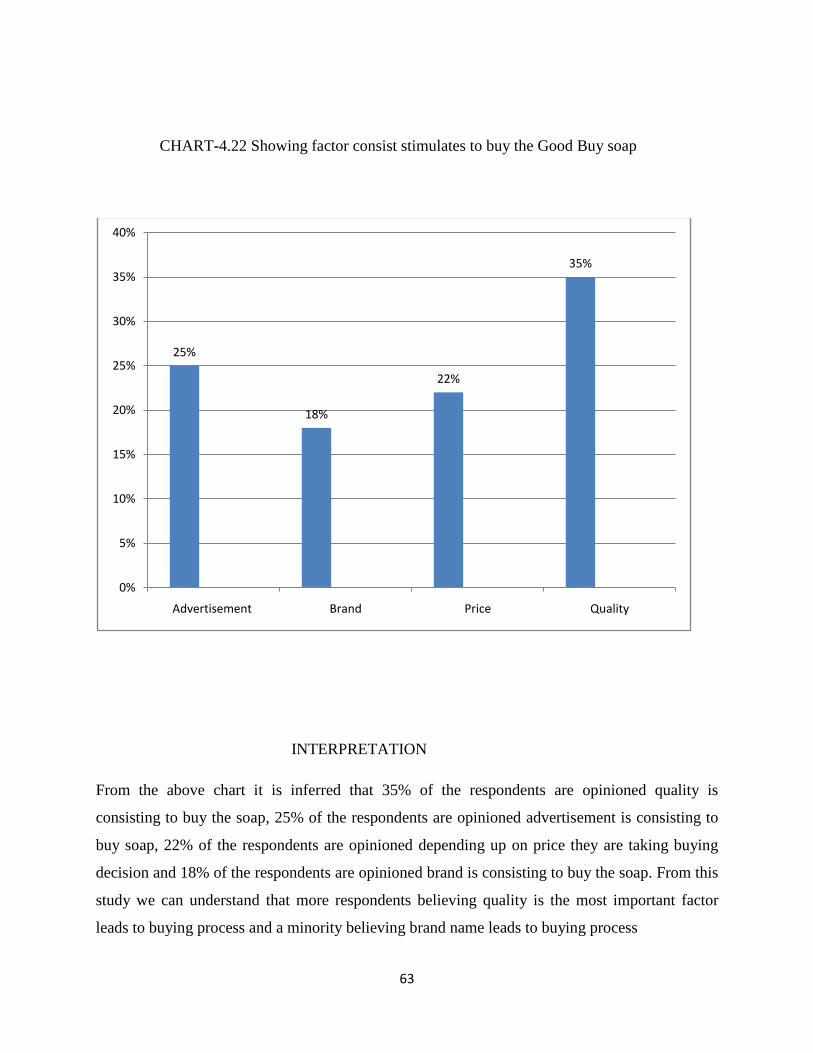
CHART-4.22 Showing factor consist stimulates to buy the Good Buy soap
INTERPRETATION
From the above chart it is inferred that 35% of the respondents are opinioned quality is
consisting to buy the soap, 25% of the respondents are opinioned advertisement is consisting to
buy soap, 22% of the respondents are opinioned depending up on price they are taking buying
decision and 18% of the respondents are opinioned brand is consisting to buy the soap. From this
study we can understand that more respondents believing quality is the most important factor
leads to buying process and a minority believing brand name leads to buying process
25%
18%
22%
35%
0%
5%
10%
15%
20%
25%
30%
35%
40%
Advertisement Brand Price Quality

64
TABLE-4.23 showing appointing celebrities as brand ambassadors a good business strategy
OPTION RESPONDENTS PERCENTAGE
STRONGLY AGREE 34 34%
AGREE 42 42%
NEUTRAL 20 20%
DISAGREE 4 4%
TOTAL 100 100%
ANALYSIS
According to the study 34 % of the respondents are strongly agreed appointing a celebrity as
brand ambassador will be a good business strategy, 34% of the respondents are agreed to
appointing a celebrity as brand ambassador will be a good business strategy, 20% of the
respondents are opinioned neutral and 4% of the respondents are disagreed that appointing a
celebrity as brand ambassador will be a good business strategy.
65
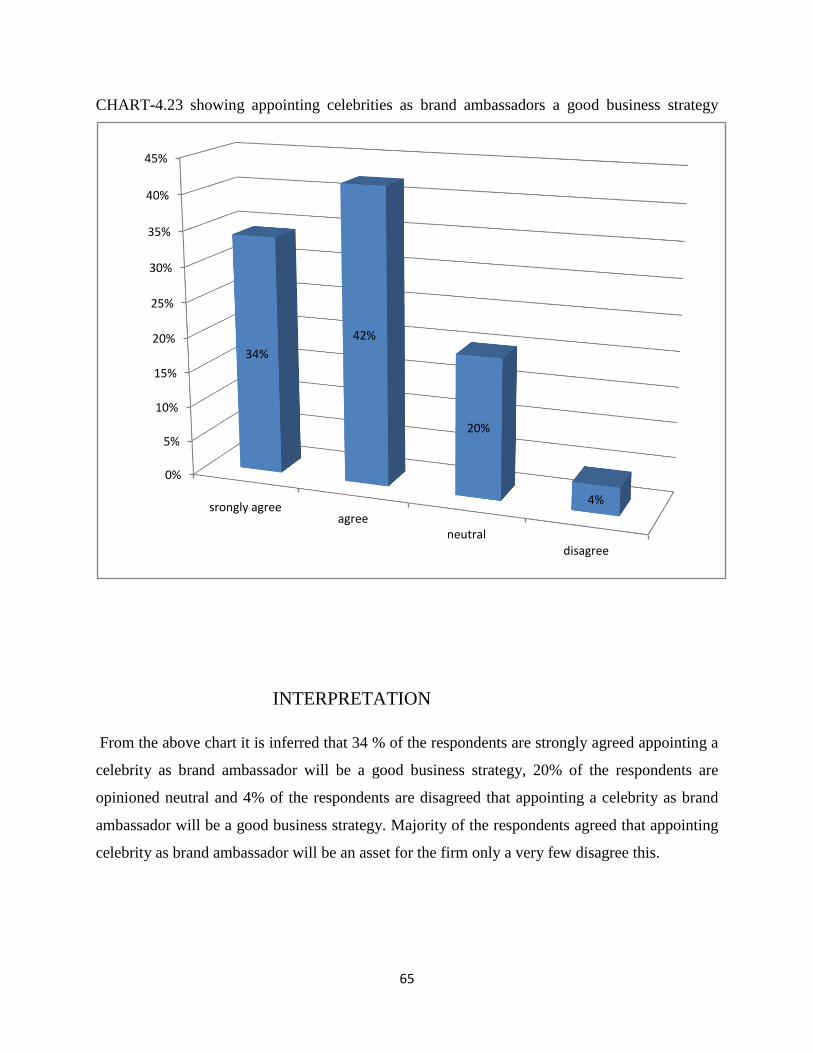
CHART-4.23 showing appointing celebrities as brand ambassadors a good business strategy
INTERPRETATION
From the above chart it is inferred that 34 % of the respondents are strongly agreed appointing a
celebrity as brand ambassador will be a good business strategy, 20% of the respondents are
opinioned neutral and 4% of the respondents are disagreed that appointing a celebrity as brand
ambassador will be a good business strategy. Majority of the respondents agreed that appointing
celebrity as brand ambassador will be an asset for the firm only a very few disagree this.
0%
5%
10%
15%
20%
25%
30%
35%
40%
45%
srongly agreeagree
neutraldisagree
34%
42%
20%
4%
66
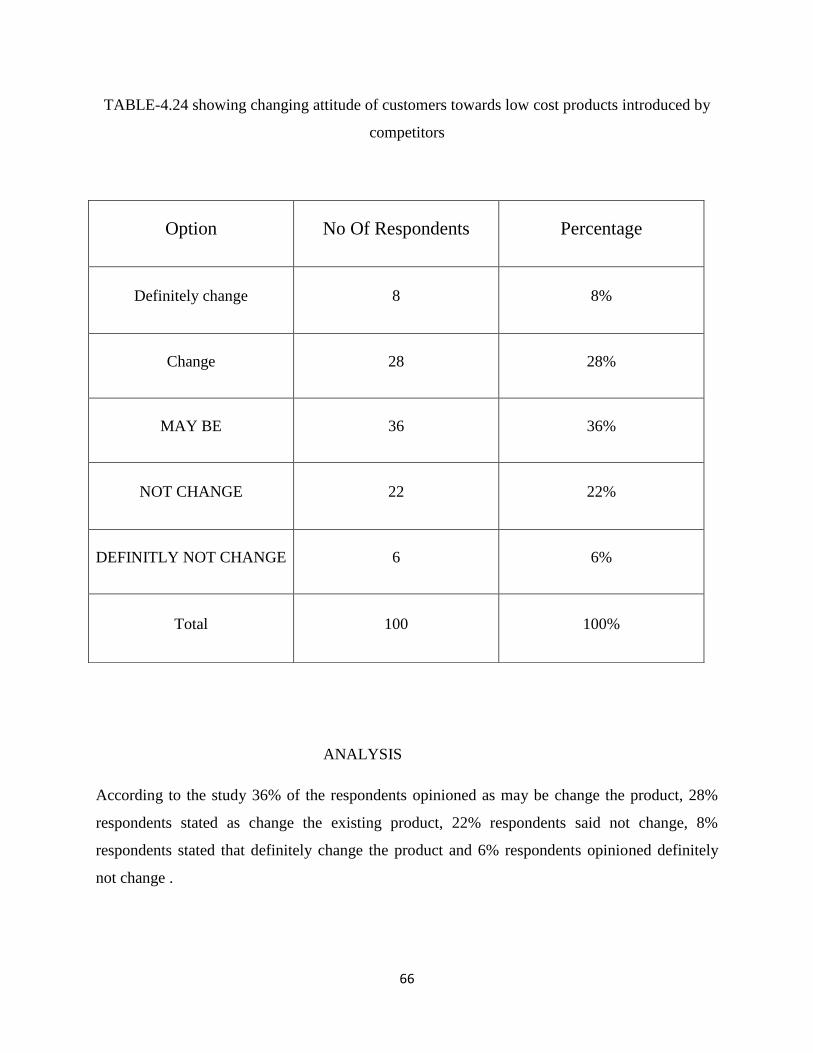
TABLE-4.24 showing changing attitude of customers towards low cost products introduced by
competitors
ANALYSIS
According to the study 36% of the respondents opinioned as may be change the product, 28%
respondents stated as change the existing product, 22% respondents said not change, 8%
respondents stated that definitely change the product and 6% respondents opinioned definitely
not change .
Option No Of Respondents Percentage
Definitely change 8 8%
Change 28 28%
MAY BE 36 36%
NOT CHANGE 22 22%
DEFINITLY NOT CHANGE 6 6%
Total 100 100%
67
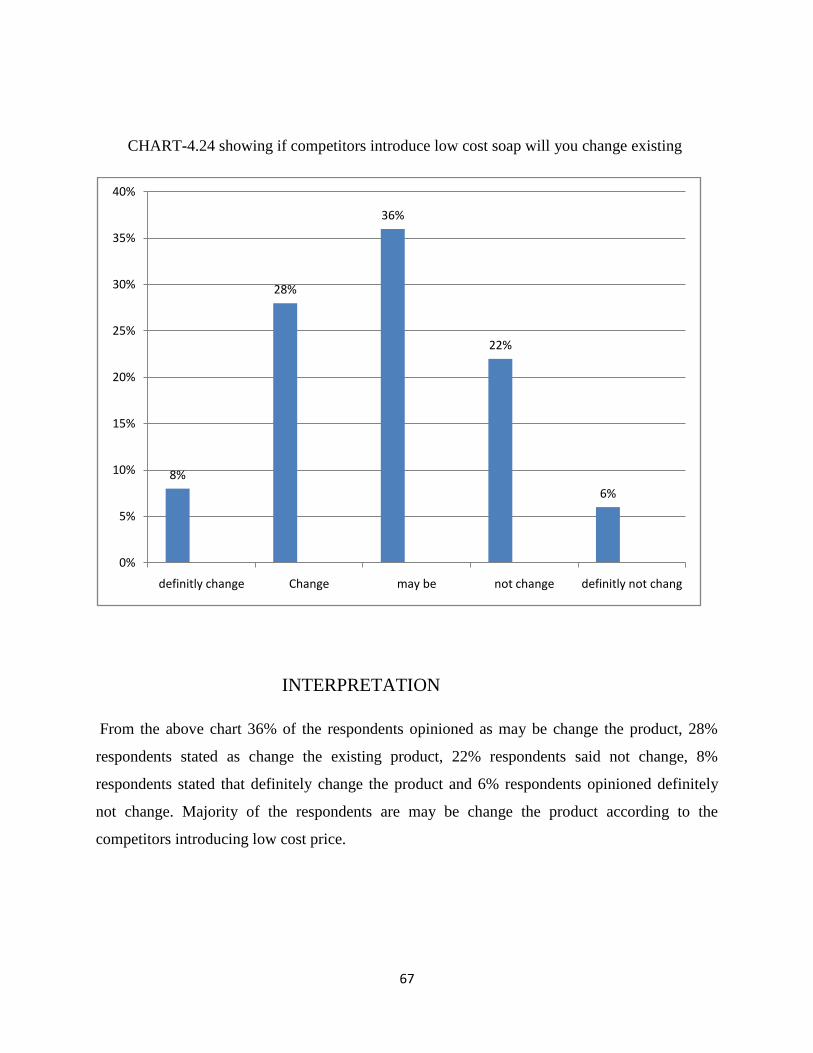
CHART-4.24 showing if competitors introduce low cost soap will you change existing
INTERPRETATION
From the above chart 36% of the respondents opinioned as may be change the product, 28%
respondents stated as change the existing product, 22% respondents said not change, 8%
respondents stated that definitely change the product and 6% respondents opinioned definitely
not change. Majority of the respondents are may be change the product according to the
competitors introducing low cost price.
8%
28%
36%
22%
6%
0%
5%
10%
15%
20%
25%
30%
35%
40%
definitly change Change may be not change definitly not chang
68
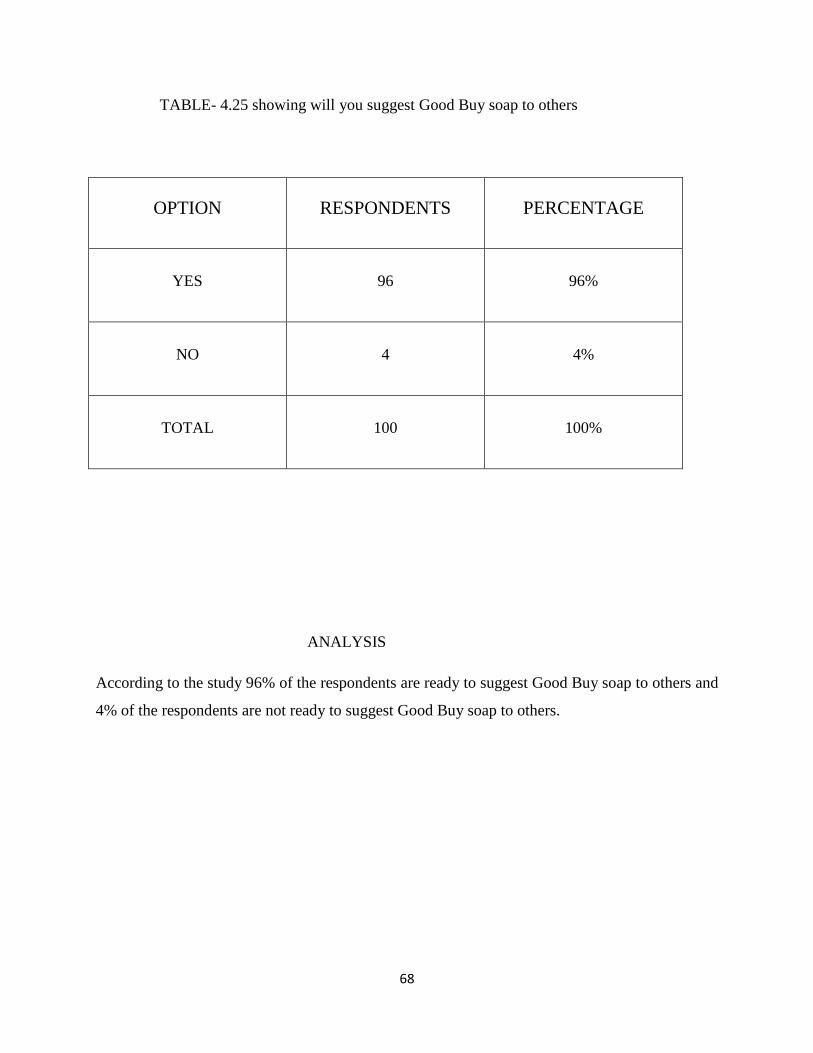
TABLE- 4.25 showing will you suggest Good Buy soap to others
OPTION RESPONDENTS PERCENTAGE
YES 96 96%
NO 4 4%
TOTAL 100 100%
ANALYSIS
According to the study 96% of the respondents are ready to suggest Good Buy soap to others and
4% of the respondents are not ready to suggest Good Buy soap to others.
69
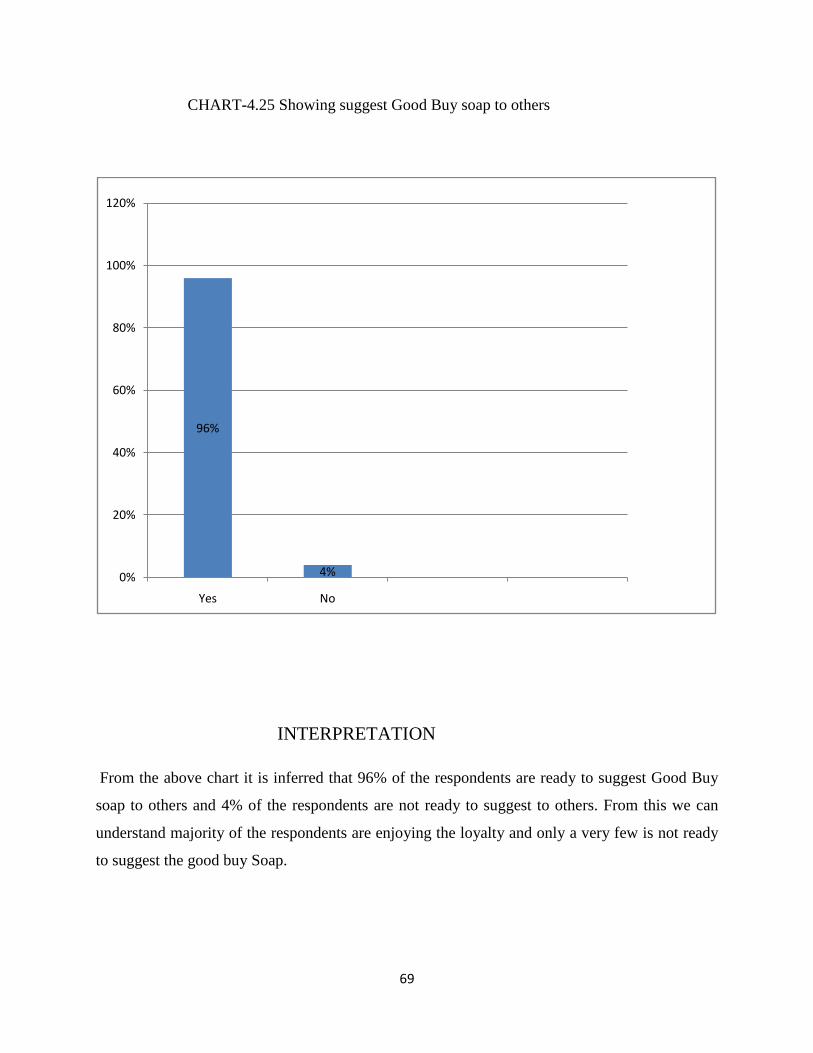
CHART-4.25 Showing suggest Good Buy soap to others
INTERPRETATION
From the above chart it is inferred that 96% of the respondents are ready to suggest Good Buy
soap to others and 4% of the respondents are not ready to suggest to others. From this we can
understand majority of the respondents are enjoying the loyalty and only a very few is not ready
to suggest the good buy Soap.
96%
4%0%
20%
40%
60%
80%
100%
120%
Yes No

70
TABLE- 4.26 Showing which Good buy products is mostly prefered
OPTION NO OF RESPONDENTS PERCENTAGE
MILSO 9 9%
CUTEE 13 13%
FEMINA JASMINE 26 26%
FEMINA LIME 15 15%
FEMINA ROSE 18 18%
FEMINA PASSION 11 11%
KATTAR 8 8%
TOTAL 100 100%
ANALYSIS
According to the study 26% of the respondents preferred Femina jasmine, 18% of the
respondents are preferred Femina rose, 15% of the respondents are opinioned they are preferring
Femina lime, 11% of the respondents preferred Femina passion, 8% respondents preferred
Kattar, 13% respondents preferred Cutee and 9% respondents preferred Milso.
71
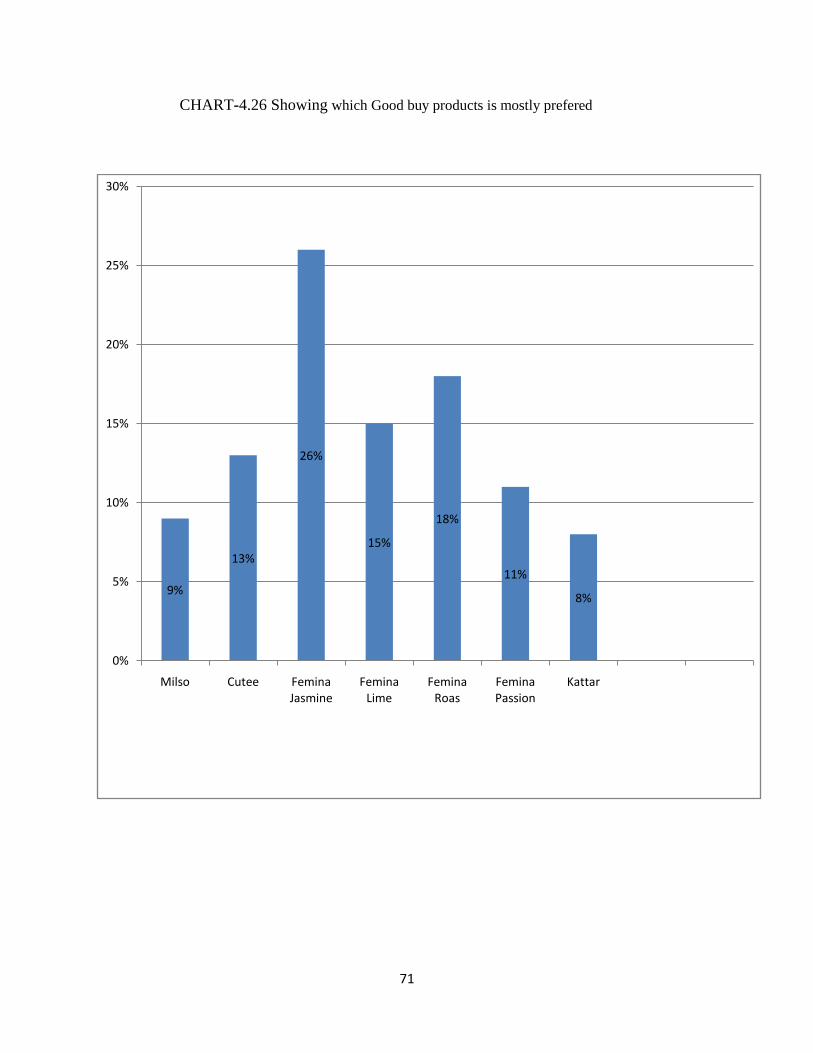
CHART-4.26 Showing which Good buy products is mostly prefered
9%
13%
26%
15%
18%
11%
8%
0%
5%
10%
15%
20%
25%
30%
Milso Cutee Femina Jasmine
Femina Lime
Femina Roas
Femina Passion
Kattar

72
INTERPRETATION
From the above chart it is inferred that 26% of the respondents preferred Femina jasmine, 18%
of the respondents are preferred Femina rose, 15% of the respondents are opinioned they are
preferring Femina lime, 11% of the respondents preferred Femina passion, 8% respondents
preferred Kattar, 13% respondents preferred Cutee and 9% respondents preferred Milso. From
this we can understand all the products preferred customers very much however majority of the
respondents preferred Femina Jasmine and only a minority preferred Milso and Kattar.
CHAPTER 5
FINDING SUGGESTION AND CONCLUSION
73
FINDINGS
60(percent) of respondents are male category and 40(percent) respondents are female
category. Major respondents are male category.
It is found from the study that most of the respondents (97 Percent) prefer brand items.
Rest of the (3 percent) does not prefer brand items. Brand items have more customer
value other than non-brand items
Many people (37 percent) would like to go for perfumed soaps, (35 percent) people
focusing beauty soap, rest of the (28 percent) prefer anti-bacterial soap. It is found that
the perfumed soap is major source of income than the other ones.
It was found that all the respondents (100 percent) are aware about Good buy soap. There
is no one without knowing Good buy soap. It shows Good buy soap has a very good
brand identity in the market.
It was found that 42(percent) respondents felt that it is good, 30(percent) of the
respondents said its average and 28(percent) of the respondents said it‟s very good. This
shows good will of the good buy soap is very high among the respondents. It shows Good
buy soap is full filling customer needs.
It was found that 34% of the respondents heard about Good Buy soap from Shopkeepers,
30(percent) of the respondents from advertisement and 26(percent) of the respondents are
heard about Good buy soap from friends. This shows that the major source of information
is from the shop keepers.
It was found that for most of the respondents (67 percent) people are used Good buy soap
more than 5 times and (33 percent) people are used Good buy soap two to five times.
This shows that majority of the respondents are regular customers for good buy soap.
It was found that for most of the respondents (63 percent) people spent 100-200 Rs in a
month and (18 percent) people are spent 200-400 Rs in a month. This shows that majority
of the respondents are price conscious while purchasing a soap.
It was found that 59(percent) of the respondents said that package of the Good buy soap
is highly attractive, 20(percent) of the respondents said that it is attractive, 15(percent) of
the respondents stated as moderate and 6(percent) of the respondents said as low
attractive. This shows customers are satisfied on package of good buy soap.

74
It was found that for most of the respondents (98percentage) do not prefer liquid soap
only (2 percent) of the respondents prefers liquid soap. This shows huge majority of the
respondents do not prefer liquid soap.
It was found that for most of the respondents (56percent) are consuming five to seven soaps
in a month and a minority is consuming above7 soaps.
It was found that for most of the respondents (70 percent) are consuming medium type
soap and (18 percent) only using small type soap. This shows medium type soap has
more market demand than the small sized ones.
It was found that 60(percent) of the respondents agree that perception of quality is
entirely based on the brand, 22(percent) of the respondents strongly agree on this
statement, 18(percent) of the respondents stated as neutral and no one stated it as
disagree. Majority of the respondents believe that perception of quality is entirely based
on the brand and only a minority does not believe it.
It was found that for most of the respondents (33percent) prefer HUL, (28 Percent) prefer
Good buy soap, and (20 percent) are going with Godrej. This shows Soap Company
having a huge competition and even though HUL is the most preferred brand a good
number of respondents prefer Good buy soaps also.
It was found that 46(percent) of the respondents said as good 42(percent) of the
respondents viewed that it is neutral, 12(percent) of the respondents opinioned as very
good and no one said it is bad. From this we can understand majority of them agree that
the Good Buy products are affordable.
It was found that for most of the respondents (58 percent) believing that the reasonable
price should be between 20 to 30 Rs and only a minority thinking reasonable is below 10
Rs. This shows price of the Good buy soap is affordable to customers
It was found that for most of the respondents (66 percent) people are Agree they are
satisfied with quality of Good buy soap.(26 percent) are neutral satisfied with Good buy
soap. This shows customers are satisfied with Good buy soap.
It was found that for most of the respondents (58 percent) choosing perfume category
while buying soaps and only a few (3 percent) is choosing the color while buying soaps.

75
It was found that for most of the respondents (79 percent) liked the Good Buy soap
flavors and only a minority (21percent) not like it. It shows that customers are accepted
the product flavors.
It was found that 41(percent) of the respondents are opinioned good buy soap is widely
available, 36(percent) of the respondents are opinioned it‟s available, 23(percent) of the
respondents are opinioned good buy soap availability is only in selected place and no one
said less available. From this we can understand the majority of the customers are
satisfied with the availability of the products.
It was found that 43(percent) of the respondents are highly aware about Good buy soap
product, 29(percent) of the respondents are very highly aware about good buy soap,
20(percent) of the respondents they are moderately aware and 8(percent) of the
respondents are opinioned they are aware very low. From this we can understand
majority of them are very much aware about the Good Buy soap and only a minority low
aware about it.
It was found that 35(percent) of the respondents are opinioned quality is consisting to buy
the soap, 25(percent) of the respondents are opinioned advertisement is consisting to the
buy soap and a minority (18 percent) stated that brand is consisting to buy the soap.
It was found that (34percent) of the respondents are strongly agreed appointing a
celebrity as brand ambassador will be a good business strategy, (34percent) of the
respondents are agreed to appointing a celebrity as brand ambassador will be a good
business strategy, (20percent) of the respondents are opinioned neutral and (4percent) of
the respondents are disagreed that appointing a celebrity as brand ambassador will be a
good business strategy.
It was found that (36percent) of the respondents opinioned as may be change the product,
(28percent) respondents stated as change the existing product, (22percent) respondents
said not change, (8percent) respondents stated that definitely change the product and
(6percent) respondents opinioned definitely not change. Majority of the respondents are
may be change the product according to the competitors introducing low cost price.
It was found that for most of the respondents (96 percent) are ready to suggest Good Buy
soap to others and (4percent) of the respondents are not ready to suggest to others.

76
It was found that for most of the respondents are opinioned (26 percent) favorite is
Femina jasmine, (18percent) of the respondents are preferred Femina rose is favorite e
and only a few preferred (9percent) Milso.
77
SUGGESTIONS
It may be better to introduce samples and discount offers to make the customers use the
product, so that they can feel the quality and other features of GOODBUY soaps
Till now the major mode of communication is through word of mouth from satisfied
customers, organization can start advertising using billboards, medias etc. to maximize the
reach
Salesman are the main source of contact between the GOODBUY soaps and the end
customers it may be needed to diversify the communication elements more through
personal selling and through dealers
Majority of respondents felt price is a major factor influencing while purchasing of
GOODBUY soaps. If the company can promote the quality of the product and different
factors available so that price won‟t be the only criteria for purchasing their product.
It is better to appoint a celebrity as brand ambassador of the firm so the firm will get
recognition in the society and increase the brand awareness.
Majority of the respondents didn‟t preferred liquid soap, so it is better to remove or
improve the product.

78
CONCLUSION
Brand awareness is the awareness of a consumer about a particular product or sometimes it may
be about the different products and services that the particular company provides. Brand
awareness is best spread in a variety of ways but the first and last important things underlined are
the quality and a strong belief can capture this company through their products and services. So
brand awareness is one of the valuable assets for any business.
Brand awareness protects a commodity or service from other competitors in the market. So the
business authority should keep a very good awareness about how can they protest and also
strengthen the existing good sides of their goods and services. The study leads to understand
knowledge about the level of awareness among consumers to good buy soaps. The factors that
influence the consumers in purchase of particular brand promote customer loyalty with good buy
soaps.
The findings showed that consumers are satisfied with good buy soaps price than its quality and
flavors. Almost all the people have a good awareness about GOOD BUY brands; from that 70 %
of them have been repurchasing brands. Even though the consumers are satisfied, it‟s better for
the company to provide the products and services according to the latest wants of consumers by
promoting and specializing the products in price, quality, size, and flavor etc. This will raise the
brand awareness consumers and keep the company in to better position.

BIBLIOGRAPHY
BOOKS
Fishbein-Ajzen Model", in NA - Advances in Consumer Research Volume 10, eds.
Richard P. Bagozzi and Alice M. Tybout, Ann Abor, MI: Association for Consumer
Research, Pages: 647-651.
Kotler P, Armstrong G (2002). Principal of Marketing. 10th Ed. New Delhi: Prentice
Hall of India Private Limited. P. 510.
Khalid I. Al-Sulaiti, Michael J. Baker, (1998) "Country of origin effects: a literature
review", Marketing Intelligence & Planning, Vol. 16 Iss: 3, pp.150 – 199.
JOURNEL
Yoram P. Wind, Robert J. Thomas, (1980) "Conceptual and Methodological Issues in
Organizational Buying Behaviour", European Journal of Marketing,
Vol. 14 Iss: 5/6, pp.239 – 263.
WEBSITES
https://www.google.co.in/?gfe_rd=cr&ei=2l9iU7nfBsjM8gewBQ#q=brand+awareness+l
iterature+review+pdf
WWW.GOODBUYSOAPS.COM
ANNEXURE
1) PERSONAL DETAILS:
Name:
Gender: Male Female
2) Do you prefer Branded items …?
Yes
No
3) Which type of soap do you buy regularly?
Anti-bacterial
Beauty
Perfumed
4) Have you heard about GOOD BUY products?
Yes
No
5) What is your opinion about Good buy soap?
Very Good
Good
Average
Bad
6) Where from you heard about GOOD BUY soap?
Friends
Advertisement
Family
Shopkeeper
7) How many times have you purchased Good Buy soap ?
One time
2-5 times
More than 5 times
8) What‟s the average amount spent on soap per month?
Below 100
100-200
200-400
400above
9) Does the package of Good Buy soap attract you?
Highly attractive
Attractive
Moderate
Low attractive
10) Do you like liquid soap?
Yes
No
11) What is the average consumption of soap in a month?
1-3
3-5
5-7
7 above
12) What size of soap do you buy?
Small
Medium
Big
13) Do you agree with „The perception of quality depends on the brand knowledge?
Strongly Agree
Agree
Neutral
Disagree
a
v
e
r
a
g
e
a
m
o
u
n
t
s
p
e
n
t
o
n
c
a
t
a
v
e
r
a
g
e
a
m
o
u
n
t
s
p
e
n
t
o
n
c
a
t
t
l
e
f
a
v
e
r
a
g
e
a
m
o
u
n
t
s
p
e
n
t
o
n
c
a
t
t
l
e
a
v
e
r
a
g
e
a
m
o
u
n
t
s
p
e
n
t
o
n
c
a
t
t
l
14) Which of these companies is giving best service to you?
HUL
Good Buy
Godrej
Wipro
15) The price of Good Buy is affordable
Very good
Good
Neutral
Bad
16) According to you what should be the reasonable price?
Below 10
10-20
20-30
30above
17) Do you think the quality of Good Buy soap is satisfactory?
Agree
Disagree
Neutral

18) Which factor makes you comfortable in this brand?
Perfume
Color
Lather
Skin protection
19) Does the flavor of Good Buy soap have an impact on your purchase?
Yes
No
20) According to you what is the availability of Good Buy?
Widely available
Available
In selected place only
Less available
21) State the awareness level of good buy soap in the market?
Very high
High
Moderate
Low
22) What factor you consist stimulates to buy the Good Buy soap?
Advertisement
Brand
Price
Quality
23) Which of the following factor inspire you to buy the product
Quality
Publicity
Free trails
Discounts
24) Do you feel appointing celebrities as brand ambassadors a good strategy?
Strongly Agree
Agree
Neutral
Disagree
25) If other company introduce the new brand with low cost comparing to the current one that
Will you change your soap?
Definitely change
Change
May be
Not change
Definitely not change
26) Will you suggest Good Buy soap to others?
Yes
No
27) Amoung the following which flavour of Good buy products is mostly prefered?
PRODUCTS YOUR CHOICE
Milso
Cutee
Femina Jasmine
Femina Lime
Femina Roas
Femina Passion
Kattar