A study on awareness of investment opportunities in mutual ...
10
Vol-1 Issue-3 2016 IJARIIE-ISSN(O)-2395-4396 International Conference on "Research avenues in Social Science ” Organize by SNGC, Coimbatore C-1228 www.ijariie.com 255 A study on awareness of investment opportunities in mutual funds - special Significance on SIP BYJU.K Ph.D Research Scholar, Department of Commerce SREE NARAYANA GURU COLLEGE Coimbatore - Palakkad National Highway (NH 47), K.G Chavadi Post Executive Summery The study is confined to the factors considered by investors by selecting mutual funds for their various investments. The level of awareness about SIP, Source of information, factors influencing decision making are studied. The above said factors are compared with demographic factors such as age, marital status, Occupation and gross annual income of the respondents to analyze “the awareness of investment opportunities in mutual funds - special Significance on SIP” Introduction These days you are hearing more and more about mutual funds as a means of investment. If you are like most people, you probably have most of your money in a bank savings account and your biggest investment may be your home. Apart from that, investing is probably something you simply do not have the time or knowledge to get involved in. You are not the only one. This is why investing through mutual funds has become such a popular way of investing. Mutual Fund A mutual fund is a pool of money from numerous investors who wish to save or make money just like you. Investing in a mutual fund can be a lot easier than buying and selling individual stocks and bonds on your own. Investors can sell their shares when they want. Professional Management. Each fund's investments are chosen and monitored by qualified professionals who use this money to create a portfolio. That portfolio could consist of stocks, bonds, money market instruments or a combination of those. Fund Ownership. As an investor, you own shares of the mutual fund, not the individual securities. Mutual funds permit you to invest small amounts of money, however much you would like, but even so, you can benefit from being involved in a large pool of cash invested by other people. All shareholders share in the fund' s gains and losses on an equal basis, proportionately to the amount they've invested.
-
Upload
khangminh22 -
Category
Documents
-
view
0 -
download
0
Transcript of A study on awareness of investment opportunities in mutual ...

Vol-1 Issue-3 2016 IJARIIE-ISSN(O)-2395-4396
International Conference on "Research avenues in Social Science” Organize by SNGC, Coimbatore
C-1228 www.ijariie.com 255
A study on awareness of investment opportunities in mutual funds - special
Significance on SIP
BYJU.K
Ph.D Research Scholar, Department of Commerce
SREE NARAYANA GURU COLLEGE Coimbatore - Palakkad National Highway (NH 47), K.G Chavadi Post
Executive Summery
The study is confined to the factors considered by investors by selecting mutual funds for their various investments. The level of awareness about SIP, Source o f information, factors influencing decision making are studied. The above
said factors are compared with demographic factors such as age, marital status, Occupation and gross annual income of the respondents to analyze “the awareness of investment opportunities in mutual funds - special Sign ificance on
SIP”
Introduction
These days you are hearing more and more about mutual funds as a means of investment. If you are like most people, you probably have most of your money in a bank savings account and your biggest investment may be your home.
Apart from that, investing is probably something you simply do not have the time or knowledge to get involved in. You are not the only one. This is why investing through mutual funds has become such a popular way of investing.
Mutual Fund
A mutual fund is a pool of money from numerous investors who wish to save or make money just like you. Investing in a mutual fund can be a lot easier than buying and selling individual stocks and bonds on your own. Investors can sell their shares when they want.
Professional Management. Each fund's investments are chosen and monitored by qualified professionals who use this money to create a portfolio. That portfolio could consist of stocks, bonds, money market instruments or a
combination of those.
Fund Ownership. As an investor, you own shares of the mutual fund, not the individual securities. Mutual funds permit you to invest small amounts of money, however much you would like, but even so, you can benefit from being
involved in a large pool of cash invested by other people. All shareholders share in the fund' s gains and losses on an
equal basis, proportionately to the amount they've invested.
Vol-1 Issue-3 2016 IJARIIE-ISSN(O)-2395-4396
International Conference on "Research avenues in Social Science” Organize by SNGC, Coimbatore
C-1228 www.ijariie.com 256
History of the Indian Mut ual Fund Industry
The mutual fund industry in India started in 1963 with the format ion of Unit Trust of India, at the init iative of the
Government of India and Reserve Bank. The history of mutual funds in India can be b roadly divided into four distinct
phases
• First Phase – 1964-87
• Second Phase – 1987-199 3 (Entry of Public Sector Funds)
• Third Phase – 1993-2003 (Entry of Private Sector Funds) • Fourth Phase – since February 2003 (Global Scenario)
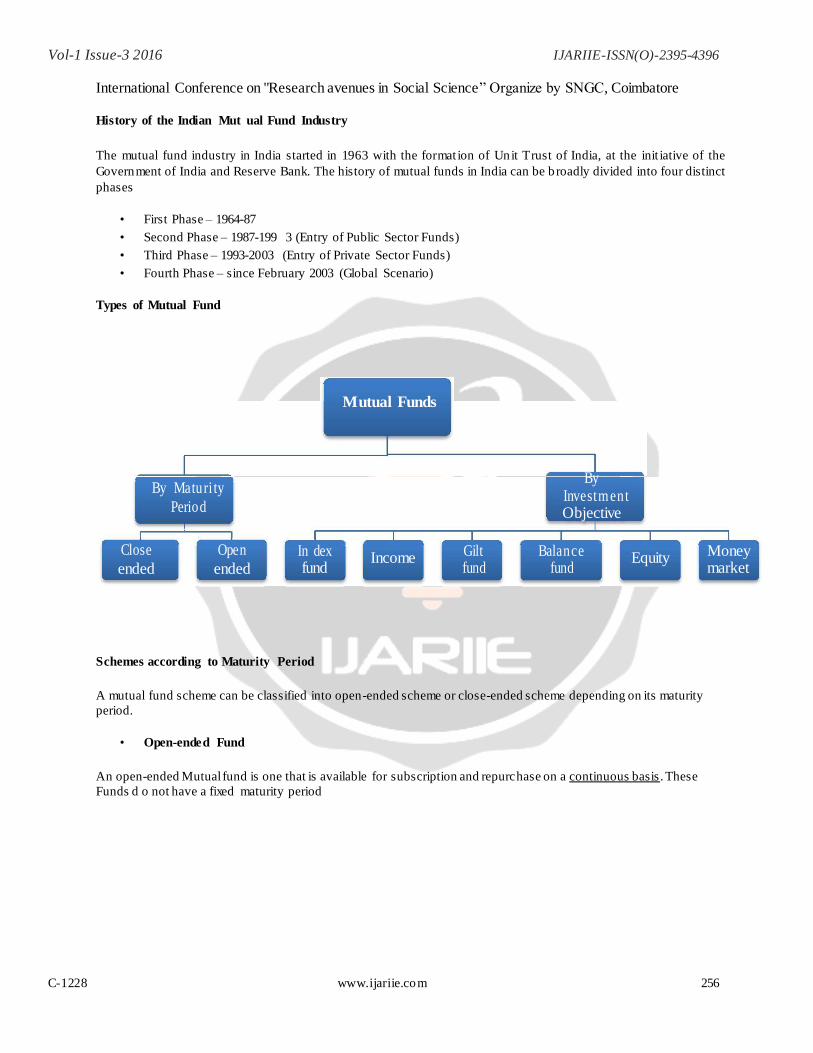
Types of Mutual Fund
Mutual Funds
By Maturi ty
By
Investment
Period
Objective
Close
Open
In dex Income
Gilt Balance Equity Money
ended
ended
fund
fund
fund
market
Schemes according to Maturity Period
A mutual fund scheme can be classified into open-ended scheme or close-ended scheme depending on its maturity
period.
• Open-ended Fund
An open-ended Mutual fund is one that is available for subscription and repurchase on a continuous basis . These
Funds d o not have a fixed maturity period
Vol-1 Issue-3 2016 IJARIIE-ISSN(O)-2395-4396
International Conference on "Research avenues in Social Science” Organize by SNGC, Coimbatore
C-1228 www.ijariie.com 257
• Close-ended Fund
A close-ended Mutual fund has a stipulated maturity period e.g. 5-7 years. The fund is open for subscription only during a specified period at the time of launch of the scheme
Fund according to Investment Objective
A scheme can also be classified as growth fund, income fund, or balanced fund considering its investment objective.
• Growth / Equity Oriented Scheme
The aim of growth funds is to provide capital appreciation over the medium to long - term.
Such funds have comparatively high risks. These schemes provide different options to the investors like dividend
option, capital appreciation, etc.
• Income / Debt Oriented Scheme
The aim of income funds is to provide regular and steady income to inves tors.
Such schemes generally invest in fixed income securities such as bonds, corporate debentures, Government securities
and money market instruments such funds are less risky compared to equity schemes
• Balanced Fund
The aim of balanced funds is to provide both growth and regular income as such schemes invest both in equities and fixed income securities in the proportion indicated in their offer documents.
These are appropriate for investors looking for moderate growth
• Money Market
These funds are also income funds and their aim is to provide easy liquidity, preservation of capital and moderate
income. These schemes invest exclusively in safer short-term instruments such as treasury bills, commercial paper
and government securities, etc. These funds are appropriate for corporate and individual investors as a means to park
their surplus funds for short periods
• Gilt Funds
These funds invest exclusively in government securities. Government securities have no default risk.
Vol-1 Issue-3 2016 IJARIIE-ISSN(O)-2395-4396
International Conference on "Research avenues in Social Science” Organize by SNGC, Coimbatore
C-1228 www.ijariie.com 258
• Index Funds
This scheme invests in the securities in the same weightage comprising of an index. This scheme would rise or fall in accordance with the rise or fall in the index
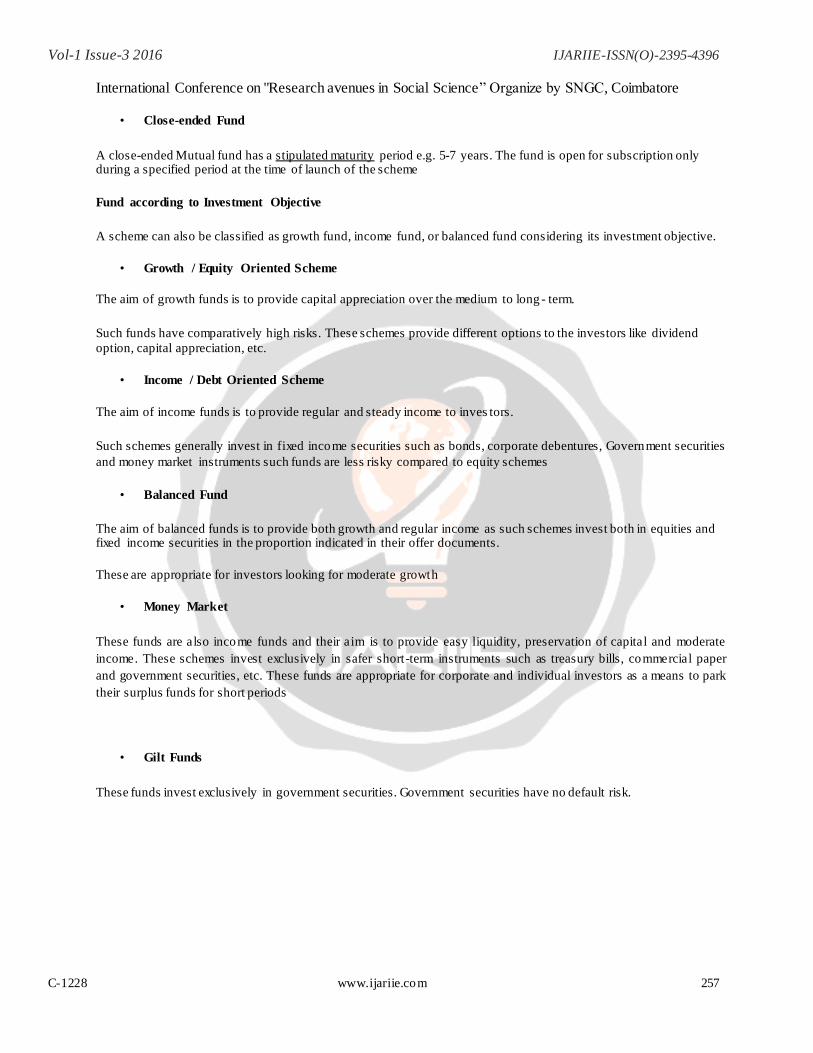
Systematic Investment Plan
A Systematic Investment Plan or SIP is a smart and hassle free mode for investing money in mutual funds. SIP
allows you to invest a certain pre-determined amount at a regular interval (weekly, monthly, quarterly, etc.). A
SIP is a planned approach towards investments and helps you inculcate the habit of saving and building wealth
for the future.
How does it work?
A SIP is a flexible and easy investment plan. Your money is
auto-debited from your bank account and invested into a specific
mutual fund scheme. You are allocated certain number of units
based on the ongoing market rate (called NAV or net asset value)
for the day.
Every time you invest money, additional units of the scheme are
purchased at the market rate and added to your account. Hence,
units are bought at different rates and investors benefit from Rupee-Cost Averaging and the Power of Compounding.
Rupee-Cost averaging
With volatile markets, most investors remain skeptical about the best time to invest and try to 'time' their entry
into the market. Rupee-cost averaging allows you to opt out of the guessing game. Since you are a regular
investor, your money fetches more units when the price is low and lesser when the price is high. During
volatile period, it may allow you to achieve a lower average cost per unit.
Power of Compounding
Albert Einstein once said, "Compound interest is the eighth wonder of the world. He, who understands it,
earns it... he who doesn't... pays it." The rule for compounding is simple - the sooner you start investing, the
more time your money has to grow.

Vol-1 Issue-3 2016 IJARIIE-ISSN(O)-2395-4396
International Conference on "Research avenues in Social Science” Organize by SNGC, Coimbatore
C-1228 www.ijariie.com 259
Scope of the study
The study is confined to the factors considered by investors by selecting mutual funds for their various investments. The
level of awareness about SIP, Source of information, factors influencing decision making are studied. The above said
factors are compared with demographic factors such as age, marital status, Occupation and gross annual income of the
respondents to analyze “the awareness of investment opportunities in mutual funds - special Significance on SIP”
Objectives of the study
• To study the attitude of the investors towards mutual funds
• To analyze the various sources that influences the respondents in selecting mutual funds and SIP.
• To measure the level of awareness of the respondents about mutual funds and SIP.
• To analyze the factors influencing investors awareness.
• To offer suggestion for the improvement on investment in mutual funds.
Methodology and Tools used
The study is main ly based on the primary data and the required primary data were collected through the structured
questionnaires from the 200 sample respondents who were selected through the convenience random sampling method. In
order to find out the association between the various independent variables and the dependent variables analyzed by using
statistical tools like Simple percentages, Chi - square test and ANOVA.
Findings
• 30% (Majority) of respondents belongs to the age group of 25 to 34 and 21% belongs to 18 to 24 (Ref: Table.1).
• The gender wise distribution of sample unit reveals that the number of male respondents exceeds female sample
respondents. (Ref: Table.2)
• On marital status wise distribution 62% of sample respondents are married.(Ref: Table.3)
The distribution of sample unit by education explains that majority of the respondents 32% Post Graduate qualification.
(Ref: Table.4)
• The occupation of sample unit is largely distributed between employment (28%) and Business (20%). (Ref:
Table.5)
• The study indicated that 44% of the respondents have the income between 25001 to 50000. (Ref: Table.6)
• The study indicates that 36% of the respondents get information through friends.(Ref: Table
• .7)
• It is observed that 69% of the respondents know SIP and its relevance. (Ref: Table.8)
• It is observed from the study majority of the respondents (38%) take investment decision their own. Only 5%
influence through dealers. (Ref: Tab le.9) The result of the chi-square test indicates that the attributes such as Age
group and Awareness of SIP, Occupation and Awareness of SIP, Education and Awareness of SIP, Marital status
and Factors influencing decision making – the hypothesis is rejected and we can conclude that this attributes are
dependent so directly affect awareness and decision making. But while testing the attributes Gender and
Awareness of SIP and Gender and Factors influencing decision making – the hypothesis is accepted. That is these
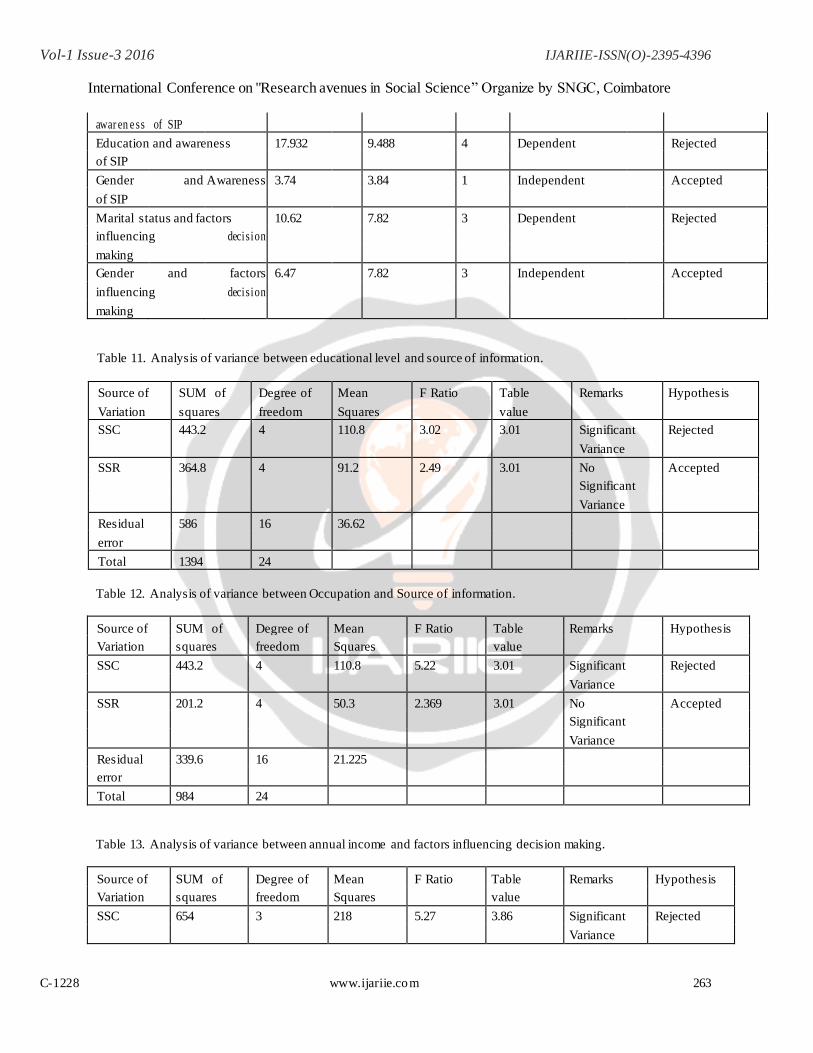
attributes are independent.(Ref: Table.10)

Vol-1 Issue-3 2016 IJARIIE-ISSN(O)-2395-4396
International Conference on "Research avenues in Social Science” Organize by SNGC, Coimbatore
C-1228 www.ijariie.com 260
• The ANOVA Table of analysis of variance between education level and source of information while carrying out
two way analysis exhibits that through educational level there is significant variance since calculated value (3.02)
greater than Table value (3.01). But through raw wise analysis that is source of information the hypothesis is
accepted so there is no significant variance here the calculated value (2.49) and Table value (3.01). (Ref: Table.11)
• The ANOVA Table of variance between occupation and source of information reveals that through column wise
analysis there is significant deference in occupation and source of in formation of the respondents. Calculated
value (5.22) Tab le Value (3.01). And on raw wise analysis that is through source of information results there is no
significant variance. Since Calculated value (2.369) and Table value (3.01) (Ref: Tbale.12)
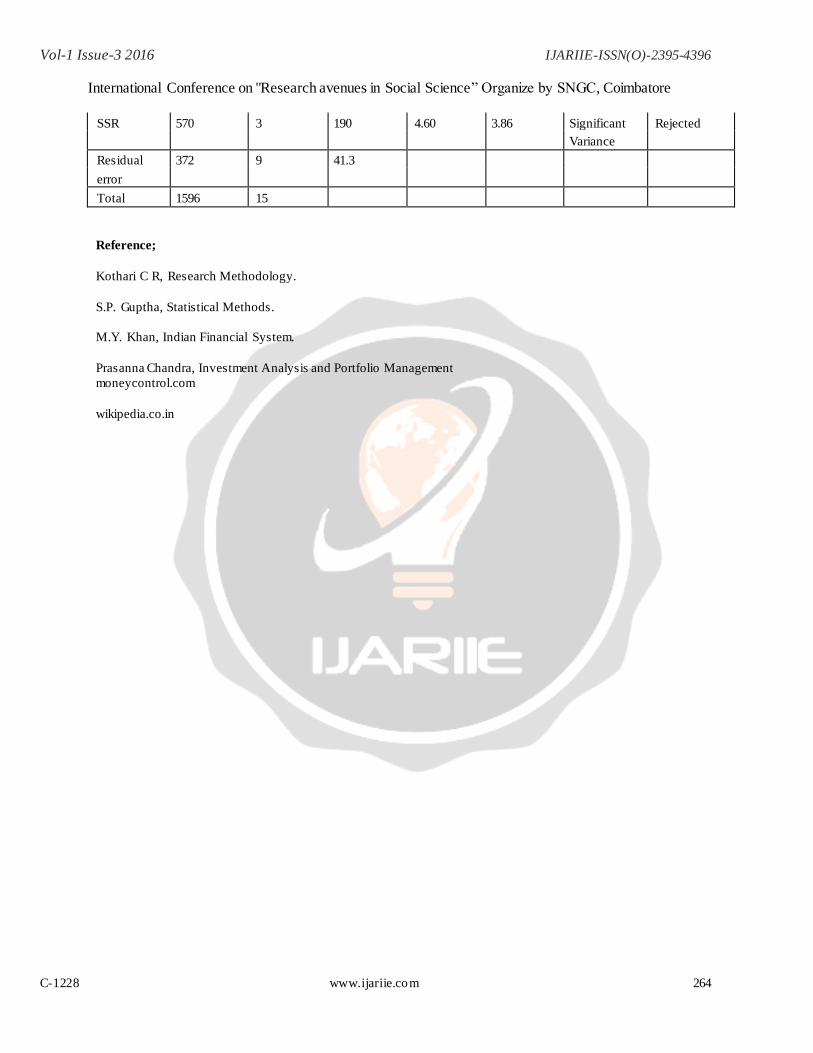
• The ANOVA table of analysis of variance between annual income and factors influencing decision making reveals
that through column wise analysis there is significant variance in annual income of respondent’s calculated value
(5.27) table value (3.86). and on raw wise analysis that is factors influencing decision making also have significant
variance the calculated value is (4.60) and Table value (3.86) (Ref: Table.13)
Suggestions
• More awareness about SIP can be made to the general public through advertisements promotional programmes
etc.
• Proper guidelines must be provided to Business, agricultural people for improving their awareness regarding
investments.
• Dealers can create more awareness regarding SIP to increase investor’s attitude towards SIP.
• Dealers can have a friendly approach with investors to promote investor’s decision making power on mutual
funds.
• More awareness programme to be given to low income groups (up to 10000) to promote investment in mutual
fund through SIP.
• More awareness programme to be given to lower education level people (That is Higher Secondary, SSLC and
Below SSLC)
• Investor education is very important factor for investors. Research and awareness programmers’ should be
conducted for investors. Seminars, conferences and training programs should be arranged for th is purpose.
Adequate publicity through newspapers, magazines, T.V., radio, pamphlets and brochures should be done.
Conclusion
The Mutual Fund Industry is a growth industry it cover a spectrum of Investment Options. Start Investing Early &
Systematically. We invest through a Professional Money Manager. The study was based on the awareness of investment
opportunities in mutual funds – with special significant on SIP. It becomes essential that the mutual fund industry should
stream line itself and become more compatible with global scenario in the fields of operation and services.
Appendix
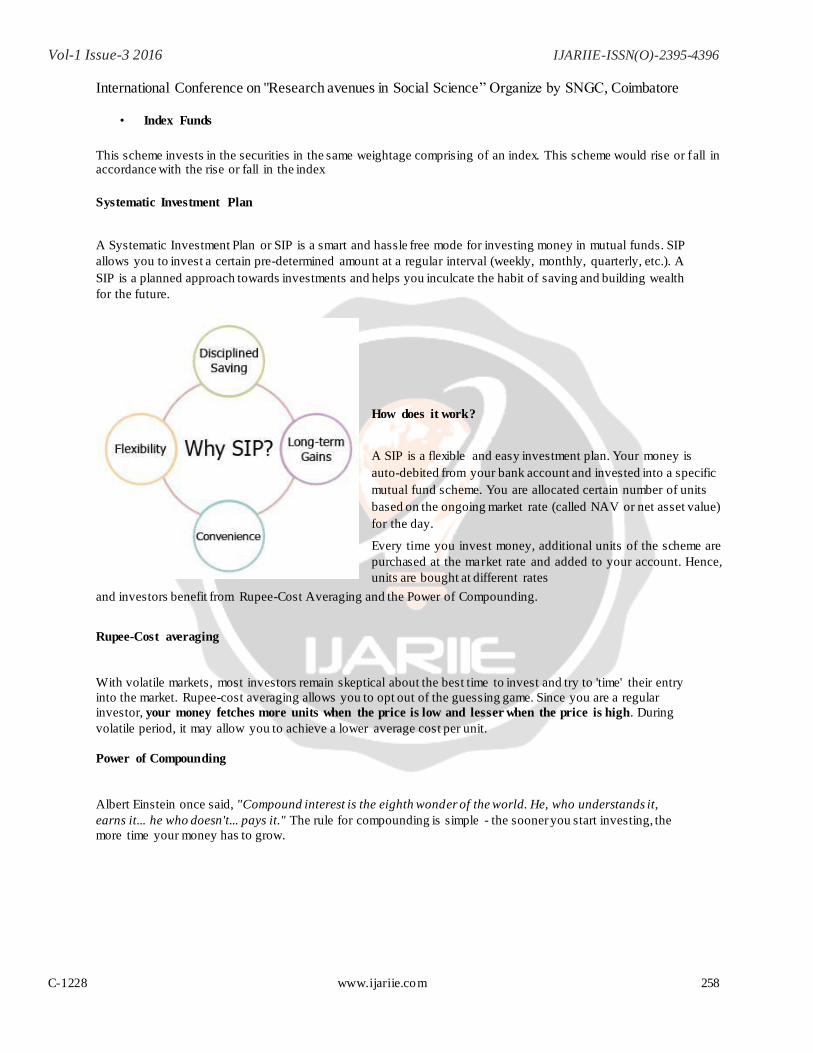
Table 1. Distribution of sample units by Age
Vol-1 Issue-3 2016 IJARIIE-ISSN(O)-2395-4396
International Conference on "Research avenues in Social Science” Organize by SNGC, Coimbatore
C-1228 www.ijariie.com 261
Age No. of respondents Percentage
18 - 24 42 21
25 - 34 60 30
35 – 44 52 26
45 and Above 46 23
Total 200 100
Table 2. Distribution of sample unit by Gender
Gender No. of respondents Percentage
Male 112 56
Fema le 88 44
Total 200 100
Table 3. Distribution of sample by marital status.
Status No. of respondents Percentage
Married 124 62
Unma r rie d 76 38
Total 200 100
Table 4. Distribution sample by Educational qualification.
Level of Education No. of respondents Percentage
Below SSLC 8 4
SSLC / Highe r Secon d ar y 44 22
Graduate 52 26
Post Grad ua te 64 32
Othe rs 32 16
Total 200 100
Table 5. Distribution of sample by Occupation.
Occupation No. of respondents Percentage
Business 40 20
Employ m e nt 56 28
Profession 38 19
Agric ul tu re 15 7.5
Othe rs 51 25.5
Total 200 100

Vol-1 Issue-3 2016 IJARIIE-ISSN(O)-2395-4396
International Conference on "Research avenues in Social Science” Organize by SNGC, Coimbatore
C-1228 www.ijariie.com 262
Table 6.Distribution of sample Units by Income
Income No. of respondents Percentage
Upto 10000 22 11
10001 – 25000 46 23
25001 – 50000 88 44
50001 and Above 44 22
Total 200 100
Table7. Distribution of sample unit by source of information.
Source No. of respondents Percentage
Friends 72 36
Relatives 32 16
Advisement 56 28
News paper 26 13
Others 14 7
Total 200 100
Table 8. Distribution of sample unit by knowing SIP and its relevance
No. of respondents Percentage
Know 138 69
Not Know 62 31
Total 200 100
Table 9. Distribution of sample units by Factors influencing decision making.
Factors No. of respondents Percentage
Self 76 38
Family 68 34
Friends 46 23
Dealers 10 5
Total 200 100
Table 10. Analysis of Chi-Square – Testing independency of two attributes.
Attributes Chi – Table value Df Remarks Hypothesis
square (Dependency or
values independency)
Age group and awareness 13.8 7.82 3 Dependent Rejected
of SIP
Occupation and 28.14 9.488 4 Dependent Rejected
Vol-1 Issue-3 2016 IJARIIE-ISSN(O)-2395-4396
International Conference on "Research avenues in Social Science” Organize by SNGC, Coimbatore
C-1228 www.ijariie.com 263
awar en e ss of SIP
Education and awareness 17.932 9.488 4 Dependent Rejected
of SIP
Gender and Awareness 3.74 3.84 1 Independent Accepted
of SIP
Marital status and factors 10.62 7.82 3 Dependent Rejected
influencing decision
making
Gender and factors 6.47 7.82 3 Independent Accepted
influencing decision
making
Table 11. Analysis of variance between educational level and source of information.
Source of SUM of Degree of Mean F Ratio Table Remarks Hypothesis
Variation squares freedom Squares value
SSC 443.2 4 110.8 3.02 3.01 Significant Rejected
Variance
SSR 364.8 4 91.2 2.49 3.01 No Accepted
Significant
Variance
Residual 586 16 36.62
error
Total 1394 24
Table 12. Analysis of variance between Occupation and Source of information.
Source of SUM of Degree of Mean F Ratio Table Remarks Hypothesis
Variation squares freedom Squares value
SSC 443.2 4 110.8 5.22 3.01 Significant Rejected
Variance
SSR 201.2 4 50.3 2.369 3.01 No Accepted
Significant
Variance
Residual 339.6 16 21.225
error
Total 984 24
Table 13. Analysis of variance between annual income and factors influencing decision making.
Source of SUM of Degree of Mean F Ratio Table Remarks Hypothesis
Variation squares freedom Squares value
SSC 654 3 218 5.27 3.86 Significant Rejected
Variance
Vol-1 Issue-3 2016 IJARIIE-ISSN(O)-2395-4396
International Conference on "Research avenues in Social Science” Organize by SNGC, Coimbatore
C-1228 www.ijariie.com 264
SSR 570 3 190 4.60 3.86 Significant Rejected
Variance
Residual 372 9 41.3
error
Total 1596 15
Reference;
Kothari C R, Research Methodology.
S.P. Guptha, Statistical Methods.
M.Y. Khan, Indian Financial System.
Prasanna Chandra, Investment Analysis and Portfolio Management
moneycontrol.com
wikipedia.co.in