A study of the routes of contamination by lead and cadmium in Santo Amaro, Brazil
16
PROOF COVER SHEET Author(s): Sandro Machado Article title: A study of the routes of contamination by lead and cadmium in Santo Amaro, Brazil Article no: TENT692717 Enclosures: 1) Query sheet 2) Article proofs Dear Author, 1. Please check these proofs carefully. It is the responsibility of the corresponding author to check these and approve or amend them.A second proof is not normally provided. Taylor & Francis cannot be held responsible for uncorrected errors, even if introduced during the production process. Once your corrections have been added to the article, it will be considered ready for publication. Please limit changes at this stage to the correction of errors. You should not make insignificant changes, improve prose style, add new material, or delete existing material at this stage. Making a large number of small, non-essential corrections can lead to errors being introduced. We therefore reserve the right not to make such corrections. For detailed guidance on how to check your proofs, please see http://journalauthors.tandf.co.uk/production/checkingproofs.asp. 2. Please review the table of contributors below and confirm that the first and last names are structured correctly and that the authors are listed in the correct order of contribution. This check is to ensure that your name will appear correctly online and when the article is indexed. Sequence Prefix Given name(s) Surname Suffix 1. Sandro Machado 2. Thaynara Santana Rabelo 3. Roberto Bagattini Portella 4. Miriam de Fátima Carvalho 5. Gustavo Alonso Muñoz Magna
-
Upload
independent -
Category
Documents
-
view
1 -
download
0
Transcript of A study of the routes of contamination by lead and cadmium in Santo Amaro, Brazil
PROOF COVER SHEET
Author(s): Sandro Machado
Article title: A study of the routes of contamination by lead and cadmium in Santo Amaro,Brazil
Article no: TENT692717
Enclosures: 1) Query sheet
2) Article proofs
Dear Author,
1. Please check these proofs carefully. It is the responsibility of the corresponding author to checkthese and approve or amend them.A second proof is not normally provided. Taylor & Francis cannotbe held responsible for uncorrected errors, even if introduced during the production process. Onceyour corrections have been added to the article, it will be considered ready for publication.
Please limit changes at this stage to the correction of errors. You should not make insignificantchanges, improve prose style, add new material, or delete existing material at this stage. Making alarge number of small, non-essential corrections can lead to errors being introduced. We thereforereserve the right not to make such corrections.
For detailed guidance on how to check your proofs, please seehttp://journalauthors.tandf.co.uk/production/checkingproofs.asp.
2. Please review the table of contributors below and confirm that the first and last names arestructured correctly and that the authors are listed in the correct order of contribution. Thischeck is to ensure that your name will appear correctly online and when the article is indexed.
Sequence Prefix Given name(s) Surname Suffix1. Sandro Machado2. Thaynara Santana Rabelo3. Roberto Bagattini Portella4. Miriam de Fátima Carvalho5. Gustavo Alonso Muñoz Magna
sandro
Sticky Note
Prof.
sandro
Sticky Note
Prof.
sandro
Sticky Note
Prof.
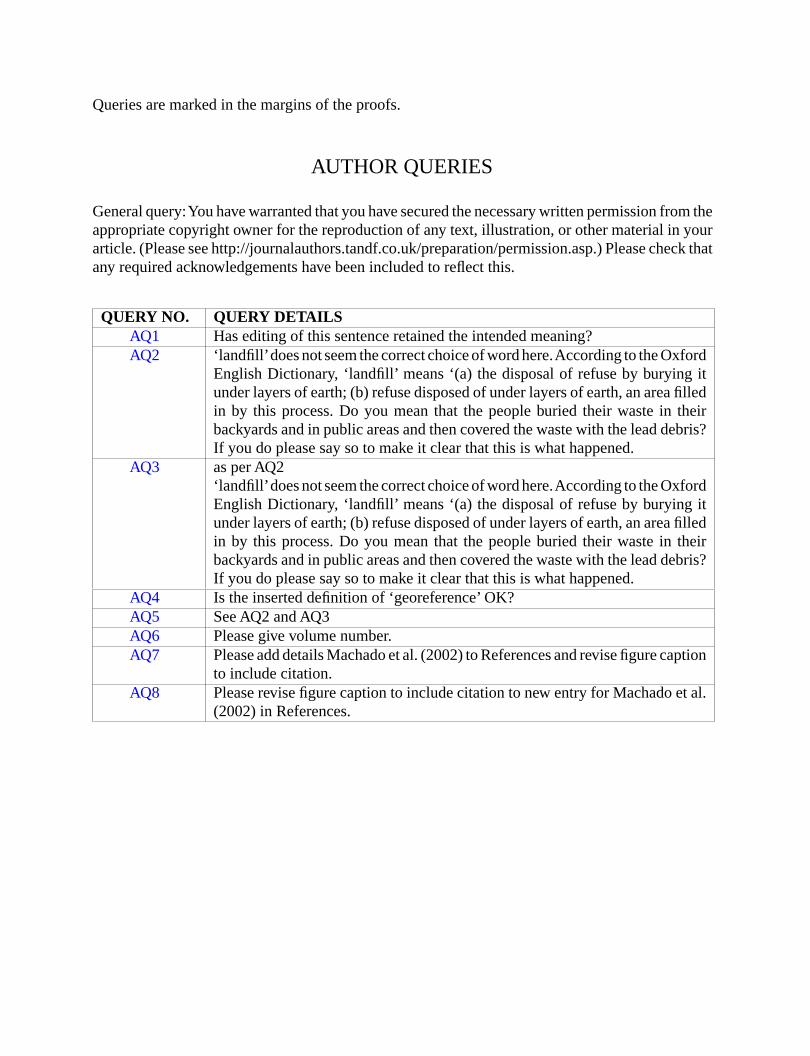
Queries are marked in the margins of the proofs.
AUTHOR QUERIES
General query:You have warranted that you have secured the necessary written permission from theappropriate copyright owner for the reproduction of any text, illustration, or other material in yourarticle. (Please see http://journalauthors.tandf.co.uk/preparation/permission.asp.) Please check thatany required acknowledgements have been included to reflect this.
QUERY NO. QUERY DETAILSAQ1 Has editing of this sentence retained the intended meaning?AQ2 ‘landfill’does not seem the correct choice of word here.According to the Oxford
English Dictionary, ‘landfill’ means ‘(a) the disposal of refuse by burying itunder layers of earth; (b) refuse disposed of under layers of earth, an area filledin by this process. Do you mean that the people buried their waste in theirbackyards and in public areas and then covered the waste with the lead debris?If you do please say so to make it clear that this is what happened.
AQ3 as per AQ2‘landfill’does not seem the correct choice of word here.According to the OxfordEnglish Dictionary, ‘landfill’ means ‘(a) the disposal of refuse by burying itunder layers of earth; (b) refuse disposed of under layers of earth, an area filledin by this process. Do you mean that the people buried their waste in theirbackyards and in public areas and then covered the waste with the lead debris?If you do please say so to make it clear that this is what happened.
AQ4 Is the inserted definition of ‘georeference’ OK?AQ5 See AQ2 and AQ3AQ6 Please give volume number.AQ7 Please add details Machado et al. (2002) to References and revise figure caption
to include citation.AQ8 Please revise figure caption to include citation to new entry for Machado et al.
(2002) in References.

How to make corrections to your proofs using Adobe Acrobat
Taylor & Francis now offer you a choice of options to help you make corrections to your proofs.Your PDF proof file has been enabled so that you can edit the proof directly using AdobeAcrobat. This is the simplest and best way for you to ensure that your corrections will beincorporated. If you wish to do this, please follow these instructions:
1. Save the file to your hard disk.
2. Check which version of Adobe Acrobat you have on your computer.You can do this byclicking on the “Help” tab, and then “About.”
If Adobe Reader is not installed, you can get the latest version free fromhttp://get.adobe.com/reader/.
• If you have Adobe Reader 8 (or a later version), go to “Tools”/“Comments & Markup”/“Show Comments & Markup.”
• If you have Acrobat Professional 7, go to “Tools”/ “Commenting”/“Show CommentingToolbar.”
3. Click “Text Edits.” You can then select any text and delete it, replace it, or insert new text asyou need to. If you need to include new sections of text, it is also possible to add a comment tothe proofs. To do this, use the Sticky Note tool in the task bar. Please also see our FAQs here:http://journalauthors.tandf.co.uk/production/index.asp.
4. Make sure that you save the file when you close the document before uploading it to CATSusing the “Upload File” button on the online correction form. A full list of the comments andedits you have made can be viewed by clicking on the “Comments” tab in the bottom left-handcorner of the PDF.
If you prefer, you can make your corrections using the CATS online correction form.
1234567891011121314151617181920212223242526272829303132333435363738394041424344454647484950515253545556
57585960616263646566676869707172737475767778798081828384858687888990919293949596979899100101102103104105106107108109110111112
Techset Composition Ltd, Salisbury TENT692717 Page#: 13 Printed: 8/6/2012
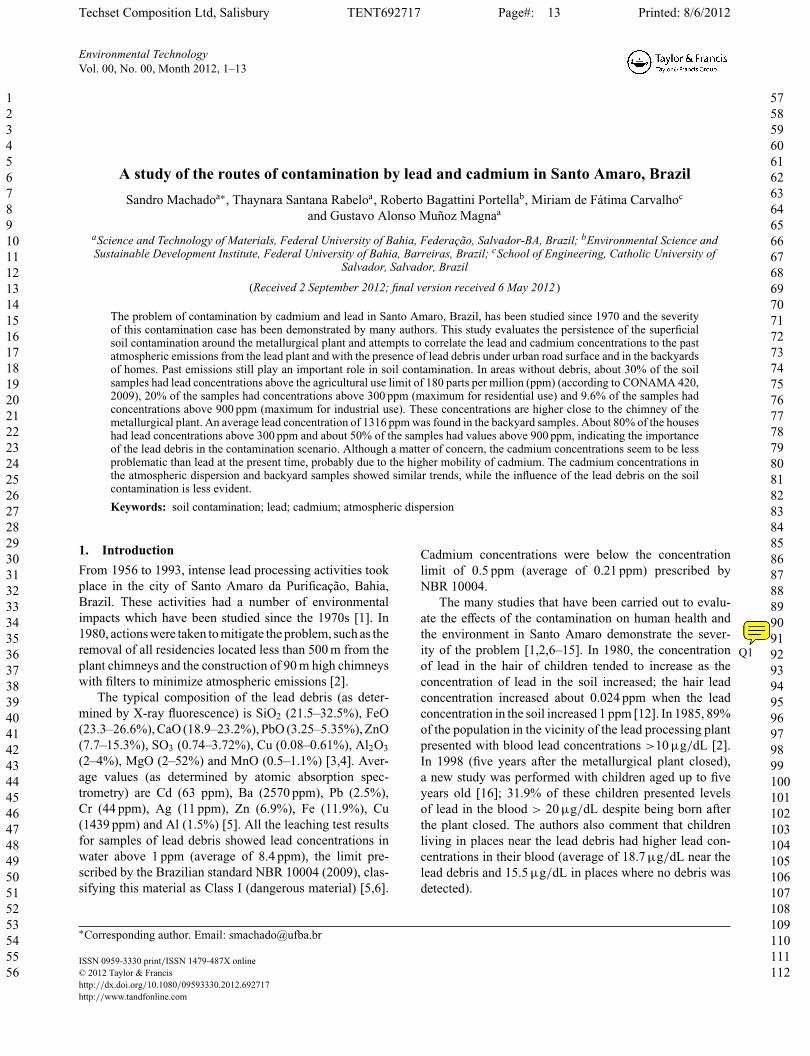
Environmental TechnologyVol. 00, No. 00, Month 2012, 1–13
A study of the routes of contamination by lead and cadmium in Santo Amaro, Brazil
Sandro Machadoa∗, Thaynara Santana Rabeloa, Roberto Bagattini Portellab, Miriam de Fátima Carvalhoc
and Gustavo Alonso Muñoz Magnaa
aScience and Technology of Materials, Federal University of Bahia, Federação, Salvador-BA, Brazil; bEnvironmental Science andSustainable Development Institute, Federal University of Bahia, Barreiras, Brazil; cSchool of Engineering, Catholic University of
Salvador, Salvador, Brazil
(Received 2 September 2012; final version received 6 May 2012 )
The problem of contamination by cadmium and lead in Santo Amaro, Brazil, has been studied since 1970 and the severityof this contamination case has been demonstrated by many authors. This study evaluates the persistence of the superficialsoil contamination around the metallurgical plant and attempts to correlate the lead and cadmium concentrations to the pastatmospheric emissions from the lead plant and with the presence of lead debris under urban road surface and in the backyardsof homes. Past emissions still play an important role in soil contamination. In areas without debris, about 30% of the soilsamples had lead concentrations above the agricultural use limit of 180 parts per million (ppm) (according to CONAMA 420,2009), 20% of the samples had concentrations above 300 ppm (maximum for residential use) and 9.6% of the samples hadconcentrations above 900 ppm (maximum for industrial use). These concentrations are higher close to the chimney of themetallurgical plant. An average lead concentration of 1316 ppm was found in the backyard samples. About 80% of the houseshad lead concentrations above 300 ppm and about 50% of the samples had values above 900 ppm, indicating the importanceof the lead debris in the contamination scenario. Although a matter of concern, the cadmium concentrations seem to be lessproblematic than lead at the present time, probably due to the higher mobility of cadmium. The cadmium concentrations inthe atmospheric dispersion and backyard samples showed similar trends, while the influence of the lead debris on the soilcontamination is less evident.
Keywords: soil contamination; lead; cadmium; atmospheric dispersion
1. IntroductionFrom 1956 to 1993, intense lead processing activities tookplace in the city of Santo Amaro da Purificação, Bahia,Brazil. These activities had a number of environmentalimpacts which have been studied since the 1970s [1]. In1980, actions were taken to mitigate the problem, such as theremoval of all residencies located less than 500 m from theplant chimneys and the construction of 90 m high chimneyswith filters to minimize atmospheric emissions [2].
The typical composition of the lead debris (as deter-mined by X-ray fluorescence) is SiO2 (21.5–32.5%), FeO(23.3–26.6%), CaO (18.9–23.2%), PbO (3.25–5.35%), ZnO(7.7–15.3%), SO3 (0.74–3.72%), Cu (0.08–0.61%), Al2O3(2–4%), MgO (2–52%) and MnO (0.5–1.1%) [3,4]. Aver-age values (as determined by atomic absorption spec-trometry) are Cd (63 ppm), Ba (2570 ppm), Pb (2.5%),Cr (44 ppm), Ag (11 ppm), Zn (6.9%), Fe (11.9%), Cu(1439 ppm) and Al (1.5%) [5]. All the leaching test resultsfor samples of lead debris showed lead concentrations inwater above 1 ppm (average of 8.4 ppm), the limit pre-scribed by the Brazilian standard NBR 10004 (2009), clas-sifying this material as Class I (dangerous material) [5,6].
∗Corresponding author. Email: [email protected]
Cadmium concentrations were below the concentrationlimit of 0.5 ppm (average of 0.21 ppm) prescribed byNBR 10004.
The many studies that have been carried out to evalu-ate the effects of the contamination on human health andthe environment in Santo Amaro demonstrate the sever-ity of the problem [1,2,6–15]. In 1980, the concentration Q1of lead in the hair of children tended to increase as theconcentration of lead in the soil increased; the hair leadconcentration increased about 0.024 ppm when the leadconcentration in the soil increased 1 ppm [12]. In 1985, 89%of the population in the vicinity of the lead processing plantpresented with blood lead concentrations >10 μg/dL [2].In 1998 (five years after the metallurgical plant closed),a new study was performed with children aged up to fiveyears old [16]; 31.9% of these children presented levelsof lead in the blood > 20 μg/dL despite being born afterthe plant closed. The authors also comment that childrenliving in places near the lead debris had higher lead con-centrations in their blood (average of 18.7 μg/dL near thelead debris and 15.5 μg/dL in places where no debris wasdetected).
ISSN 0959-3330 print/ISSN 1479-487X online© 2012 Taylor & Francishttp://dx.doi.org/10.1080/09593330.2012.692717http://www.tandfonline.com
sandro
Sticky Note
OK Q1
113114115116117118119120121122123124125126127128129130131132133134135136137138139140141142143144145146147148149150151152153154155156157158159160161162163164165166167168
169170171172173174175176177178179180181182183184185186187188189190191192193194195196197198199200201202203204205206207208209210211212213214215216217218219220221222223224
2 S. Machado et al.
Table 1. Metal mobility in different soil conditions [18].
Soil conditions Bioavailability
Redox pH High Moderated
Oxidation <3 Cd, Zn, Co, Cu, Ni Mg, Hg, VOxidation >5 Cd, Zn Mo, Se, Sr, Te, VOxidation Fe >5 – Cd, ZnReduction >5 Se, Mo Cd, Zn, Cu, Mn, Pb, SrReduction (H2S) >5 – Mn, Sr
Several factors affect the mobility of metals in the soil,such as pH, clay content and mineralogy, organic mattercontent, and the presence of iron and manganese oxides.The soil clay fraction plays a crucial role in the mobility oflead, while the mobility of cadmium is related to the pH andorganic matter content [17]. A summary of metal mobilityin different soil conditions is given in Table 1.
The average values of pH (6.59 ± 1.27) and organicmatter content (6.69 ± 3.62%) obtained for superficial soilsamples suggest that cadmium mobility is higher thanlead mobility in the environment around the city of SantoAmaro [19].
The local soil is classified as a CH (high plasticity clay)soil by the unified soil classification system (UCSC) andhas high values of plasticity index (PI = 51%) and liquidlimit (WL = 78.7%). The average permeability is aroundk = 1.4 × 10⁻⁸ cm/s. The results of the column tests per-formed by the authors indicated an average value of thesoil/water lead partitioning coefficient (Kd) of 19.51. If aporosity of 0.51 and a dry density of ρ = 1.35 g/cm3 areadopted for the soil, a retard coefficient (Rd) of 52.7 canbe calculated. During the column tests, the maximum leadconcentration obtained from the soil samples was about
13,000 ppm (or 1.3% dry mass of soil), demonstrating thehigh lead adsorption capacity of the local soil [5].
These characteristics tend to concentrate the contami-nation in the shallow layers of the soil, thus protecting thewater table. Considering the results of five boreholes in themetallurgical plant, the superficial soil samples (0–20 cm)had average lead and cadmium concentrations of 1550 and14.4 ppm, respectively [5]. The lead concentration obtainedat a depth of 1.5 m is about 40 ppm, considered by theauthors to be a natural concentration for such a clayeysoil. The decrease for cadmium is less dramatic; the cad-mium concentrations obtained at depths of 1.5 and 5 m areabout 4.5 ppm and 0.28 ppm, respectively. However, con-centrated lead and cadmium in the shallow layers increasesthe potential impact of routes such as dust inhalation andthe consumption of contaminated food cultivated in areasnear the plant.
The lead processing company operated without anyemissions control for 34 years, directly impacting the imme-diate surroundings. In 1980, a few contamination controlinitiatives were begun including the construction of a 90-mhigh chimney with air filters placed at the particle emis-sion sources, a ban on the use of the lead debris for landfillpurposes and the removal of all residences within a 500-mradius of the metallurgical plant [3].
Although many of the contamination sources resultedfrom lead processing activities, the uncontrolled air emis-sions, the liquid effluent discharged directly into the Subaériver, the uncontrolled debris disposal and the superficialdrainage water from the debris storage area were the maincauses of pollution. Moreover, the lead debris, consideredas ‘non-dangerous’ by the entrepreneur, was used by theSanto Amaro city authorities and by the population for sev-eral purposes including for road surfacing and as a landfill Q2material in residential courtyards and public areas [1].
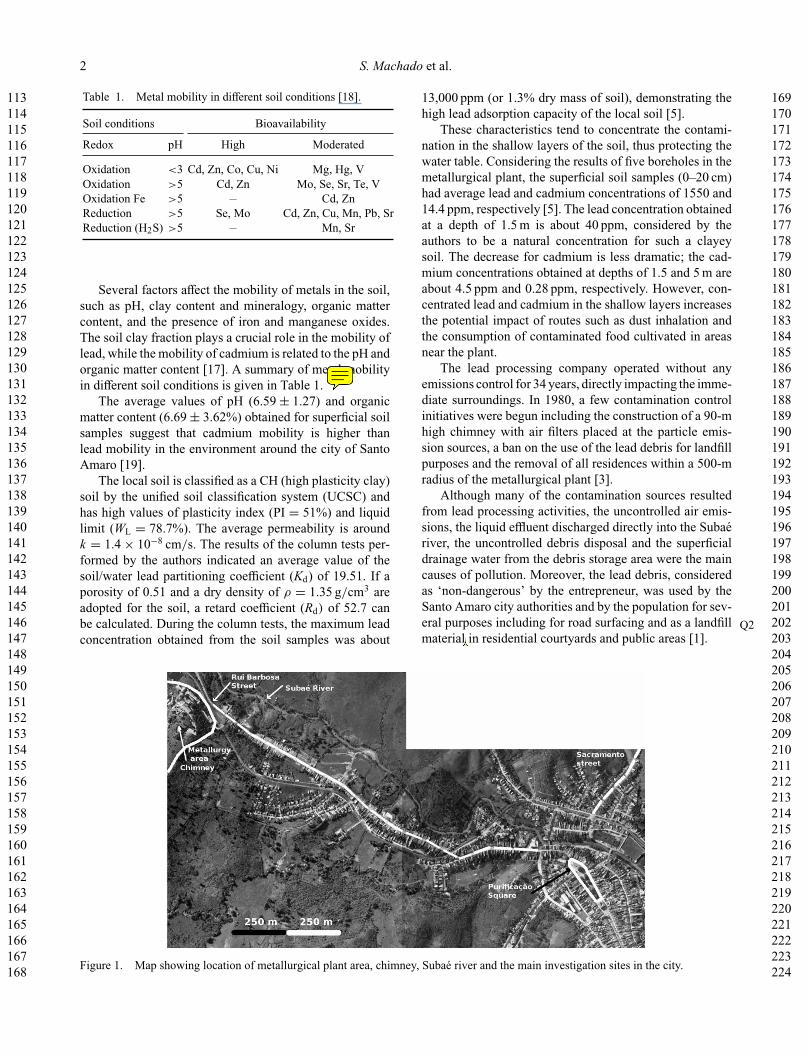
Figure 1. Map showing location of metallurgical plant area, chimney, Subaé river and the main investigation sites in the city.
sandro
Sticky Note
Please put table 1 after this paragraph
sandro
Cross-Out
sandro
Replacement Text
soil terrain regularization
225226227228229230231232233234235236237238239240241242243244245246247248249250251252253254255256257258259260261262263264265266267268269270271272273274275276277278279280
281282283284285286287288289290291292293294295296297298299300301302303304305306307308309310311312313314315316317318319320321322323324325326327328329330331332333334335336
Environmental Technology 3
Figure 1 shows the location of the plant and chimney,and the main areas of the town (Rui Barbosa Street, Sacra-mento Street and Purificação Square) where the majorityof the investigation points are located. As can be observed,the metallurgical plant site is located beside an urban area.Rui Barbosa Street and Sacramento Street are among themain contamination sites in the city. In these streets, leaddebris was used as a road surfacing base and the backyardsof the houses made intensive use of lead debris for landfillQ3purposes [5].
Sixteen years after the closure of the plant and withmany papers published on this subject, questions about themain routes of contamination still active in the city persist.This study evaluates the role played by the main potentialroutes in the contamination of superficial soil samples col-lected inside the urban zone and in the vicinity of the plant.It also attempts to separate the influences of past atmo-spheric emissions and the debris disposed of in the city’sstreets and backyards on the observed lead and cadmiumconcentrations.
2. Materials and methodsThe investigation was divided into three parts in order tofulfil the following research objectives:
(1) To collect and georeference (i.e. to define its phys-ical location) data published previously by otherQ4authors or by this group
(2) To observe the influence of past emissions on thelead and cadmium concentrations in the superficialsoil near the city
(3) To collect superficial soil samples in the urban zoneof the city to evaluate the effect of the lead debrison the soil contamination.
Results published by other authors were filtered in orderto analyse only those based on superficial soil samples (upto 20 cm depth) collected in the high plasticity clay layerfound in the area and those that used the same procedure todetermine the metal concentrations.
The analysis of the data published prior to this workrequired establishing a reference point for the soil samplesmainly using maps and house addresses. A GPS GarminMAP 76CS was used to georeference the data. Not allpublished data was able to be georeferenced because ofinsufficient information about its location. In this paper, 80points located in areas outside the city and 44 points locatedin the urban area from different sources were georeferencedfor analysis.
To study the influence of the past emissions on thesuperficial soil contamination, numerical simulations ofthe dispersion of atmospheric emissions during the oper-ating period of the metallurgical plant were performed thatconsidered the metallurgical processes used, the topograph-ical parameters of the region and the average local climate
conditions (the weather data were obtained from weatherstations located at Salvador airport). Hourly data were col-lected for wind direction and speed, temperature, stability,and mixing height for the rural and urban zones.
The topography was based on data acquired from theShuttle Radar Topography Mission (SRTM) performed byNASA. The company operation data were obtained fromreports by the Environmental Institute of Bahia (1992) andreferences 2 and 6. Numerical simulations were performedusing the AEROMOD 5.8 software adopted by the US Envi-ronmental Protection Agency (USEPA). For calculationpurposes, it was assumed that sulfur dioxide (SO2) emis-sions were released from the 80-m high chimney and that theparticles were emitted via the seven smaller chimneys dis-tributed throughout each stage of the metallurgical process.These calculations assumed no emissions control, which isconsistent with the operational characteristics during mostof the operational period of the plant.
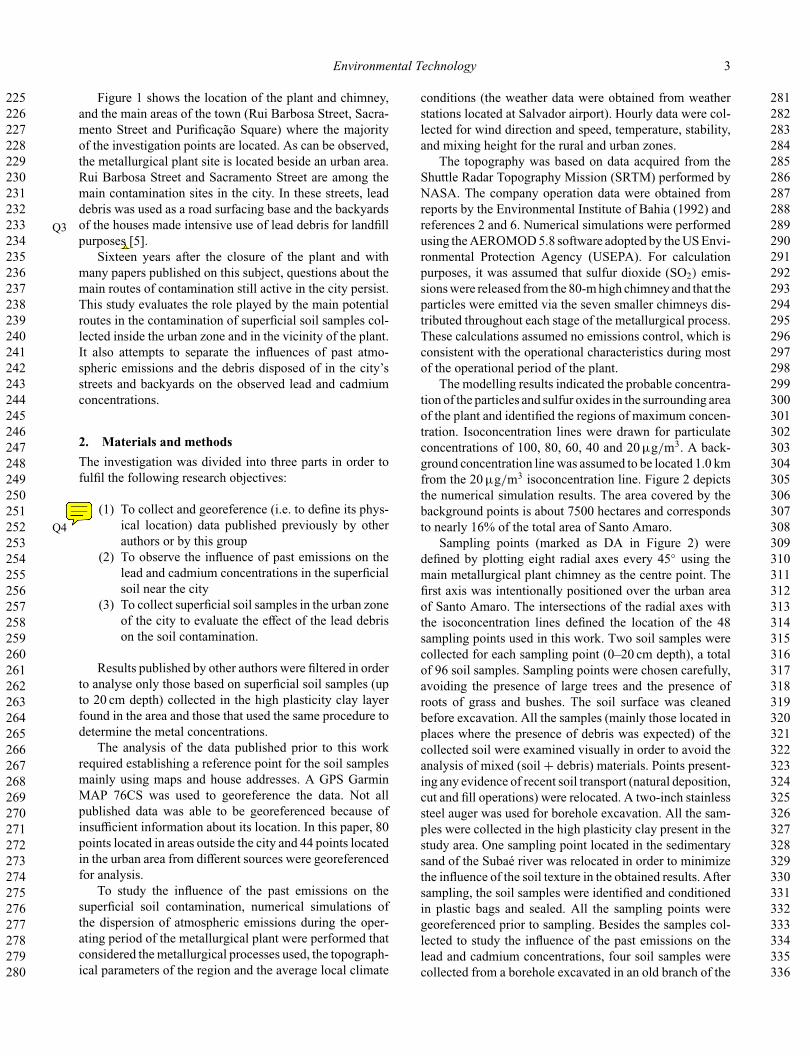
The modelling results indicated the probable concentra-tion of the particles and sulfur oxides in the surrounding areaof the plant and identified the regions of maximum concen-tration. Isoconcentration lines were drawn for particulateconcentrations of 100, 80, 60, 40 and 20 μg/m3. A back-ground concentration line was assumed to be located 1.0 kmfrom the 20 μg/m3 isoconcentration line. Figure 2 depictsthe numerical simulation results. The area covered by thebackground points is about 7500 hectares and correspondsto nearly 16% of the total area of Santo Amaro.
Sampling points (marked as DA in Figure 2) weredefined by plotting eight radial axes every 45◦ using themain metallurgical plant chimney as the centre point. Thefirst axis was intentionally positioned over the urban areaof Santo Amaro. The intersections of the radial axes withthe isoconcentration lines defined the location of the 48sampling points used in this work. Two soil samples werecollected for each sampling point (0–20 cm depth), a totalof 96 soil samples. Sampling points were chosen carefully,avoiding the presence of large trees and the presence ofroots of grass and bushes. The soil surface was cleanedbefore excavation. All the samples (mainly those located inplaces where the presence of debris was expected) of thecollected soil were examined visually in order to avoid theanalysis of mixed (soil + debris) materials. Points present-ing any evidence of recent soil transport (natural deposition,cut and fill operations) were relocated. A two-inch stainlesssteel auger was used for borehole excavation. All the sam-ples were collected in the high plasticity clay present in thestudy area. One sampling point located in the sedimentarysand of the Subaé river was relocated in order to minimizethe influence of the soil texture in the obtained results. Aftersampling, the soil samples were identified and conditionedin plastic bags and sealed. All the sampling points weregeoreferenced prior to sampling. Besides the samples col-lected to study the influence of the past emissions on thelead and cadmium concentrations, four soil samples werecollected from a borehole excavated in an old branch of the
sandro
Cross-Out
sandro
Replacement Text
for soil surface regularization
sandro
Sticky Note
Ok
337338339340341342343344345346347348349350351352353354355356357358359360361362363364365366367368369370371372373374375376377378379380381382383384385386387388389390391392
393394395396397398399400401402403404405406407408409410411412413414415416417418419420421422423424425426427428429430431432433434435436437438439440441442443444445446447448
4 S. Machado et al.
Figure 2. Map of the city of Santo Amaro showing the soil sampling points for emission dispersion analysis and the isoconcentrationlines of particle concentrations in the air.
Subaé river to examine the contaminants in question and thetendency of the contaminants to accumulate in the Subaériver sediments.
The soil samples were analysed using atomic absorptionspectrometry (AAS) partial digestion. Samples were firsthomogenized and quartered in the laboratory. An aliquot ofabout 200 g was separated for testing, placed in a plasticbag, sealed and identified by a code, and sent to the Bahiaresearch and development centre (CEPED) for analysis. Theremaining material was stored for other needs or to repeattests if necessary.
The quartered sample was dried at 40◦C to a constantmass, ground and sieved (#80 sieve). The passing materialwas used to calculate the lead and cadmium concentra-tions. Partial digestion was performed according to ASTM1971/95. Samples were digested in a microwave (121◦C)using nitric and hydrochloric acids, and then were filteredand added to deionized water to give a volume of 100 mL.Samples were left to cool to room temperature and the vol-ume of water was restored to 100 mL, when necessary. Theobtained solution was used in AAS to obtain Cd and Pbconcentrations in soil. The results are referenced to thedry mass (40◦C) of soil used in the digestion process. Themethod detection limits are 10 and 1 ppm for Pb and Cd,respectively. The instrument detection limits are 5 and 0.5for Pb and Cd, respectively. More details can be found inreference 20. Ten per cent of the samples were used to
calculate the recovery rates using standard solutions fromMERCK Chemicals (0.5 ppm for cadmium and 5 ppm forlead). Recovery rates of 82–120% were calculated for Pband 80–116% for Cd.
The soil samples from the backyards of the houseslocated on Rui Barbosa Street were used to study theinfluence of the lead debris on the lead and cadmiumconcentrations in the soil. Two to four soil samples werecollected in each backyard according to its size; these sam-ples were combined and quartered to form a single sampleof about 400 g that was assumed to be representative of theaverage conditions for the house studied. This study exam-ined 230 backyards. A careful analysis was performed toavoid sampling mixtures of soil and lead debris. The analyt-ical procedures adopted to determine metal concentrationswere similar to those described above.
Some boreholes were excavated in Rui Barbosa Streetand Sacramento Street and in parts of the backyards of thehouses to confirm the presence of debris under the road sur-face. Soil samples were collected at different depths aboveand under the lead debris layer when it was found.
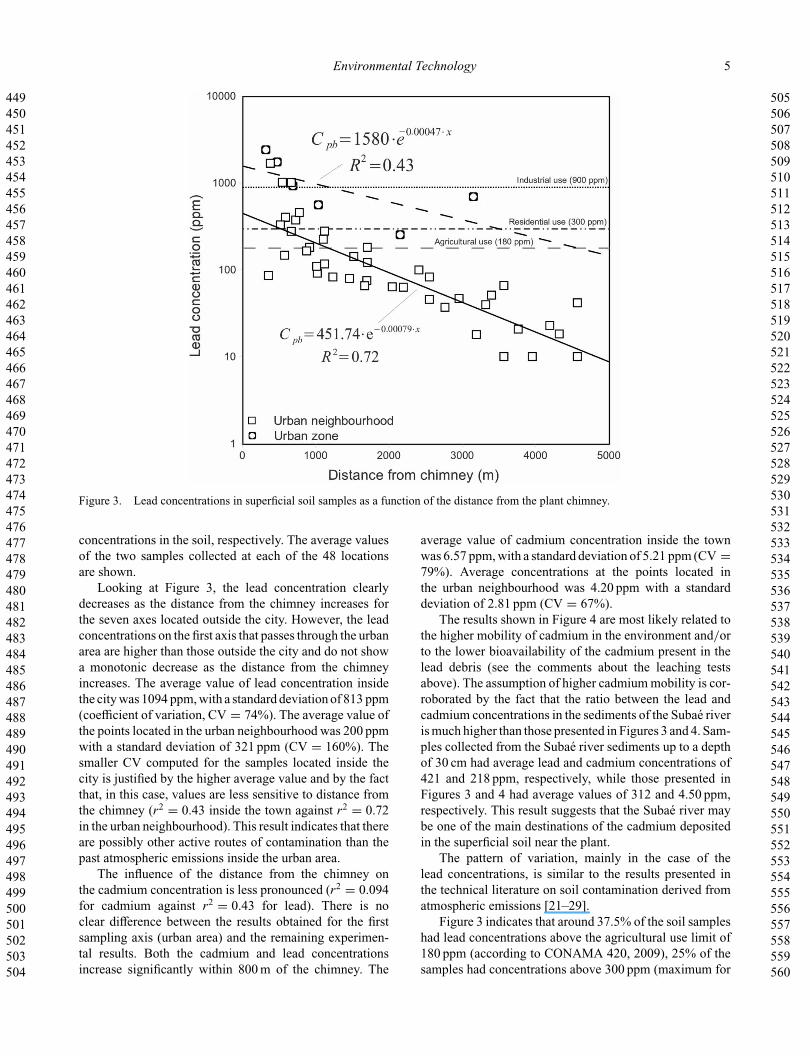
3. Results and analysis3.1. Study of the influence of the past emissionsFigures 3 and 4 show the results of sampling to evaluatethe influence of past emissions on the lead and cadmium
449450451452453454455456457458459460461462463464465466467468469470471472473474475476477478479480481482483484485486487488489490491492493494495496497498499500501502503504
505506507508509510511512513514515516517518519520521522523524525526527528529530531532533534535536537538539540541542543544545546547548549550551552553554555556557558559560
Environmental Technology 5
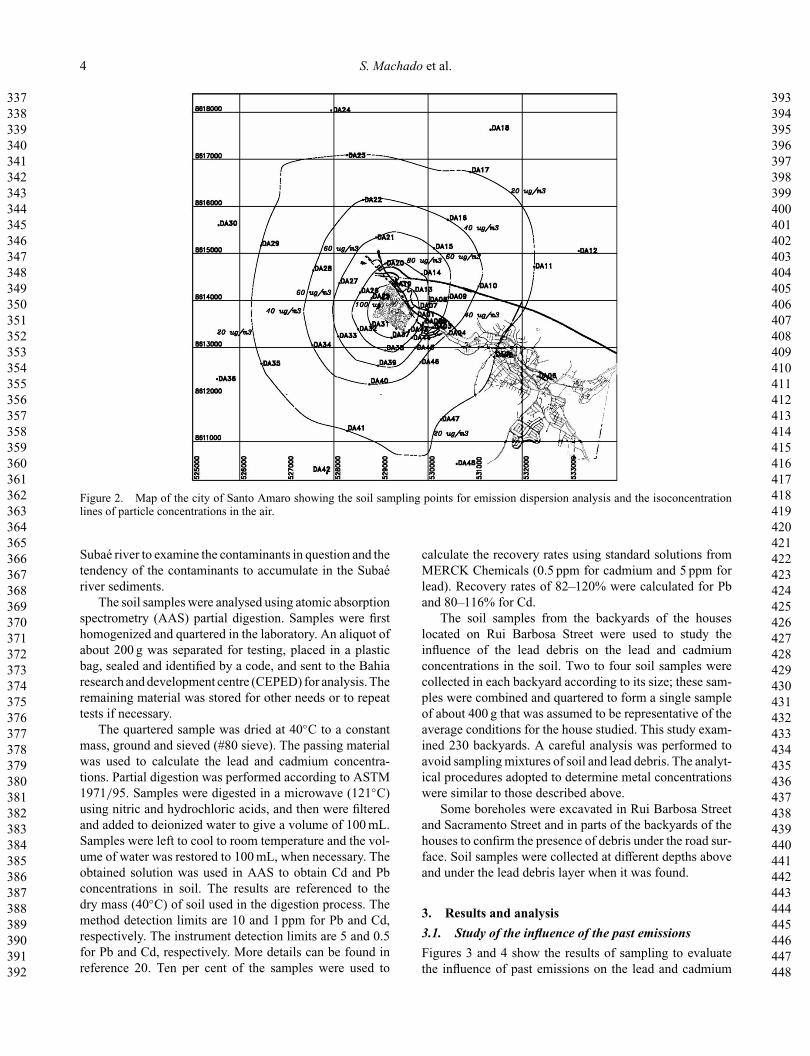
Figure 3. Lead concentrations in superficial soil samples as a function of the distance from the plant chimney.
concentrations in the soil, respectively. The average valuesof the two samples collected at each of the 48 locationsare shown.
Looking at Figure 3, the lead concentration clearlydecreases as the distance from the chimney increases forthe seven axes located outside the city. However, the leadconcentrations on the first axis that passes through the urbanarea are higher than those outside the city and do not showa monotonic decrease as the distance from the chimneyincreases. The average value of lead concentration insidethe city was 1094 ppm, with a standard deviation of 813 ppm(coefficient of variation, CV = 74%). The average value ofthe points located in the urban neighbourhood was 200 ppmwith a standard deviation of 321 ppm (CV = 160%). Thesmaller CV computed for the samples located inside thecity is justified by the higher average value and by the factthat, in this case, values are less sensitive to distance fromthe chimney (r2 = 0.43 inside the town against r2 = 0.72in the urban neighbourhood). This result indicates that thereare possibly other active routes of contamination than thepast atmospheric emissions inside the urban area.
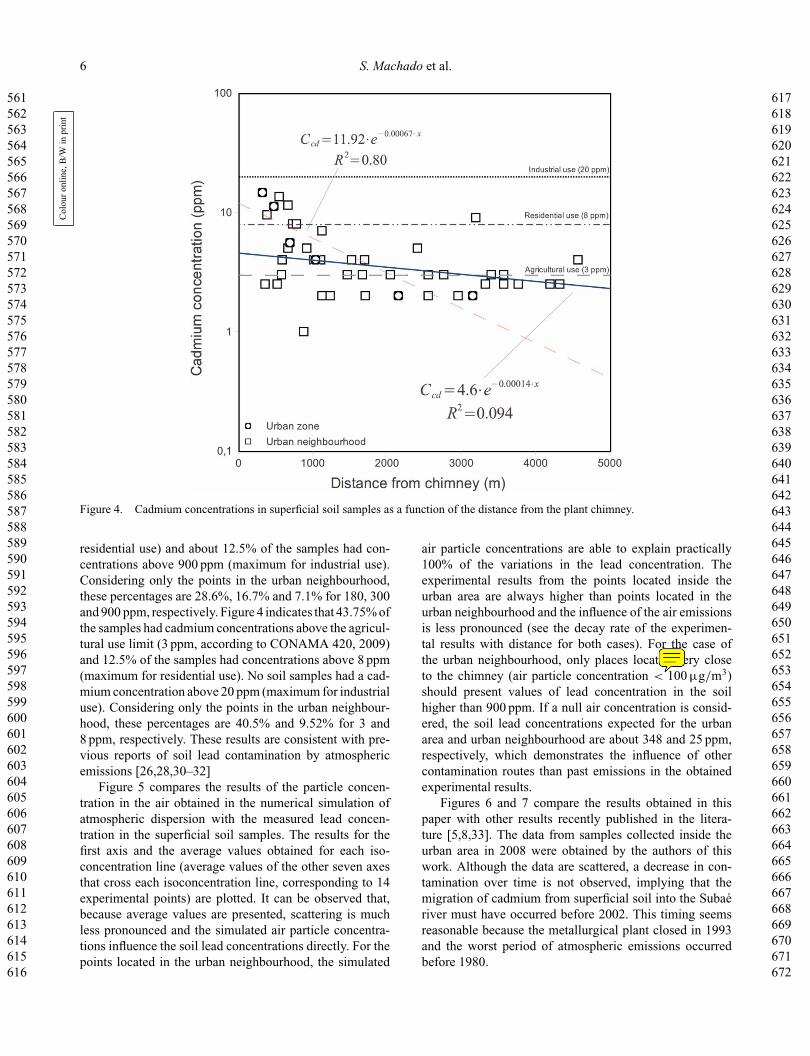
The influence of the distance from the chimney onthe cadmium concentration is less pronounced (r2 = 0.094for cadmium against r2 = 0.43 for lead). There is noclear difference between the results obtained for the firstsampling axis (urban area) and the remaining experimen-tal results. Both the cadmium and lead concentrationsincrease significantly within 800 m of the chimney. The
average value of cadmium concentration inside the townwas 6.57 ppm, with a standard deviation of 5.21 ppm (CV =79%). Average concentrations at the points located inthe urban neighbourhood was 4.20 ppm with a standarddeviation of 2.81 ppm (CV = 67%).
The results shown in Figure 4 are most likely related tothe higher mobility of cadmium in the environment and/orto the lower bioavailability of the cadmium present in thelead debris (see the comments about the leaching testsabove). The assumption of higher cadmium mobility is cor-roborated by the fact that the ratio between the lead andcadmium concentrations in the sediments of the Subaé riveris much higher than those presented in Figures 3 and 4. Sam-ples collected from the Subaé river sediments up to a depthof 30 cm had average lead and cadmium concentrations of421 and 218 ppm, respectively, while those presented inFigures 3 and 4 had average values of 312 and 4.50 ppm,respectively. This result suggests that the Subaé river maybe one of the main destinations of the cadmium depositedin the superficial soil near the plant.
The pattern of variation, mainly in the case of thelead concentrations, is similar to the results presented inthe technical literature on soil contamination derived fromatmospheric emissions [21–29].
Figure 3 indicates that around 37.5% of the soil sampleshad lead concentrations above the agricultural use limit of180 ppm (according to CONAMA 420, 2009), 25% of thesamples had concentrations above 300 ppm (maximum for
561562563564565566567568569570571572573574575576577578579580581582583584585586587588589590591592593594595596597598599600601602603604605606607608609610611612613614615616
617618619620621622623624625626627628629630631632633634635636637638639640641642643644645646647648649650651652653654655656657658659660661662663664665666667668669670671672
6 S. Machado et al.C
olou
ronl
ine,
B/W
inpr
int
Figure 4. Cadmium concentrations in superficial soil samples as a function of the distance from the plant chimney.
residential use) and about 12.5% of the samples had con-centrations above 900 ppm (maximum for industrial use).Considering only the points in the urban neighbourhood,these percentages are 28.6%, 16.7% and 7.1% for 180, 300and 900 ppm, respectively. Figure 4 indicates that 43.75% ofthe samples had cadmium concentrations above the agricul-tural use limit (3 ppm, according to CONAMA 420, 2009)and 12.5% of the samples had concentrations above 8 ppm(maximum for residential use). No soil samples had a cad-mium concentration above 20 ppm (maximum for industrialuse). Considering only the points in the urban neighbour-hood, these percentages are 40.5% and 9.52% for 3 and8 ppm, respectively. These results are consistent with pre-vious reports of soil lead contamination by atmosphericemissions [26,28,30–32]
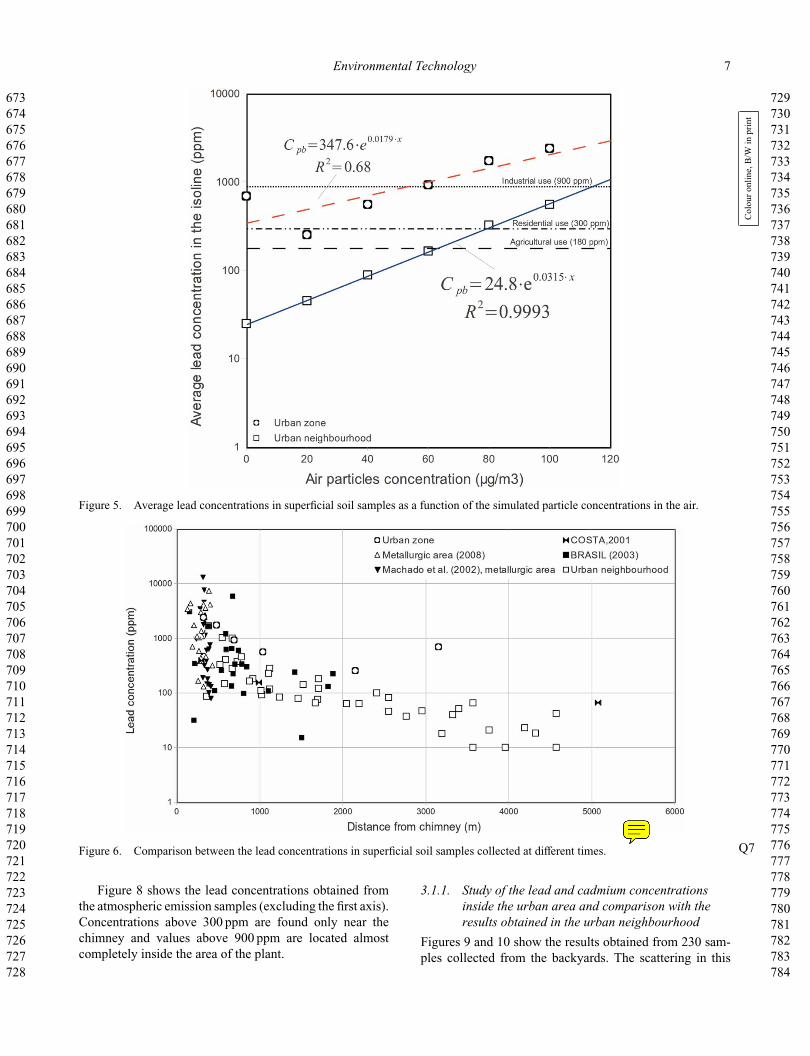
Figure 5 compares the results of the particle concen-tration in the air obtained in the numerical simulation ofatmospheric dispersion with the measured lead concen-tration in the superficial soil samples. The results for thefirst axis and the average values obtained for each iso-concentration line (average values of the other seven axesthat cross each isoconcentration line, corresponding to 14experimental points) are plotted. It can be observed that,because average values are presented, scattering is muchless pronounced and the simulated air particle concentra-tions influence the soil lead concentrations directly. For thepoints located in the urban neighbourhood, the simulated
air particle concentrations are able to explain practically100% of the variations in the lead concentration. Theexperimental results from the points located inside theurban area are always higher than points located in theurban neighbourhood and the influence of the air emissionsis less pronounced (see the decay rate of the experimen-tal results with distance for both cases). For the case ofthe urban neighbourhood, only places located very closeto the chimney (air particle concentration < 100 μg/m3)should present values of lead concentration in the soilhigher than 900 ppm. If a null air concentration is consid-ered, the soil lead concentrations expected for the urbanarea and urban neighbourhood are about 348 and 25 ppm,respectively, which demonstrates the influence of othercontamination routes than past emissions in the obtainedexperimental results.
Figures 6 and 7 compare the results obtained in thispaper with other results recently published in the litera-ture [5,8,33]. The data from samples collected inside theurban area in 2008 were obtained by the authors of thiswork. Although the data are scattered, a decrease in con-tamination over time is not observed, implying that themigration of cadmium from superficial soil into the Subaériver must have occurred before 2002. This timing seemsreasonable because the metallurgical plant closed in 1993and the worst period of atmospheric emissions occurredbefore 1980.
sandro
Sticky Note
> 100
673674675676677678679680681682683684685686687688689690691692693694695696697698699700701702703704705706707708709710711712713714715716717718719720721722723724725726727728
729730731732733734735736737738739740741742743744745746747748749750751752753754755756757758759760761762763764765766767768769770771772773774775776777778779780781782783784
Environmental Technology 7
Col
ouro
nlin
e,B
/Win
prin
t
Figure 5. Average lead concentrations in superficial soil samples as a function of the simulated particle concentrations in the air.
Q7Figure 6. Comparison between the lead concentrations in superficial soil samples collected at different times.
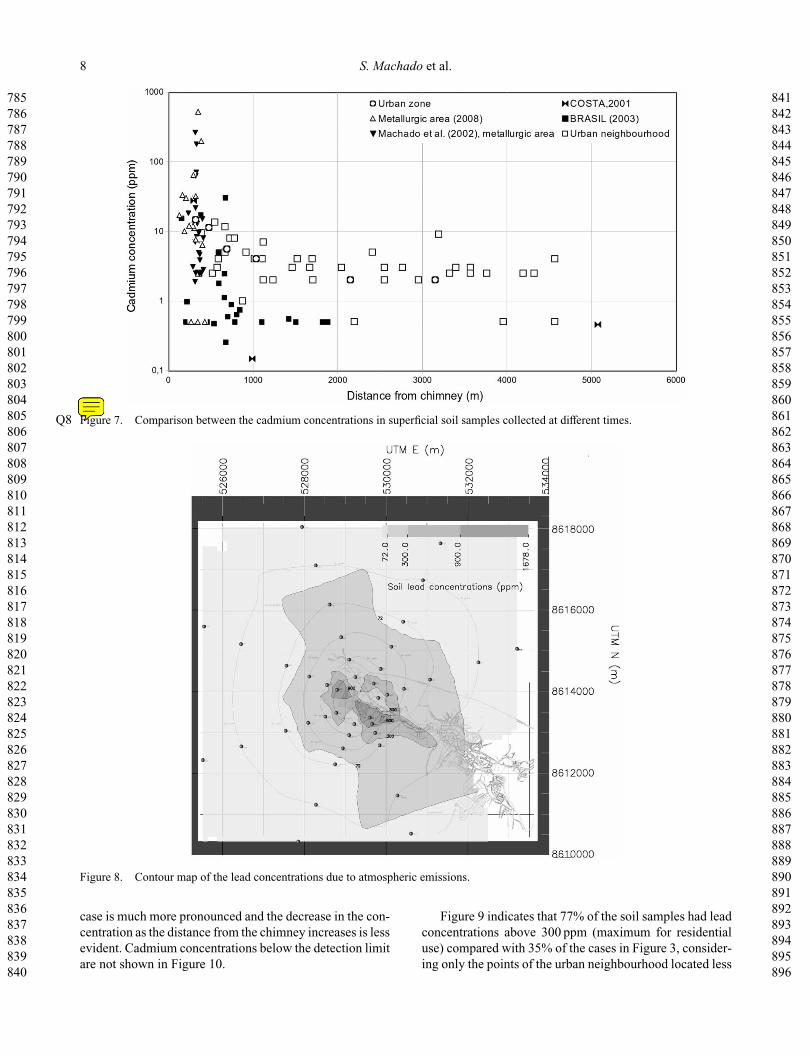
Figure 8 shows the lead concentrations obtained fromthe atmospheric emission samples (excluding the first axis).Concentrations above 300 ppm are found only near thechimney and values above 900 ppm are located almostcompletely inside the area of the plant.
3.1.1. Study of the lead and cadmium concentrationsinside the urban area and comparison with theresults obtained in the urban neighbourhood
Figures 9 and 10 show the results obtained from 230 sam-ples collected from the backyards. The scattering in this
sandro
Sticky Note
Please see new pictures 6 and 7 with correct citation attached. Please leave captions unchanged. Please also change reference [5] to S.L. Machado, Projeto PURIFICA. Proposta para remediação de áreas impactadas pela atividade extrativa de chumbo em Santo Amaro-BA, 2002. Available at http://www.geoamb.eng.ufba.br/site/sites/default/files/arquivos/relatorios/relatorio1.pdf
785786787788789790791792793794795796797798799800801802803804805806807808809810811812813814815816817818819820821822823824825826827828829830831832833834835836837838839840
841842843844845846847848849850851852853854855856857858859860861862863864865866867868869870871872873874875876877878879880881882883884885886887888889890891892893894895896
8 S. Machado et al.
Q8 Figure 7. Comparison between the cadmium concentrations in superficial soil samples collected at different times.
Figure 8. Contour map of the lead concentrations due to atmospheric emissions.
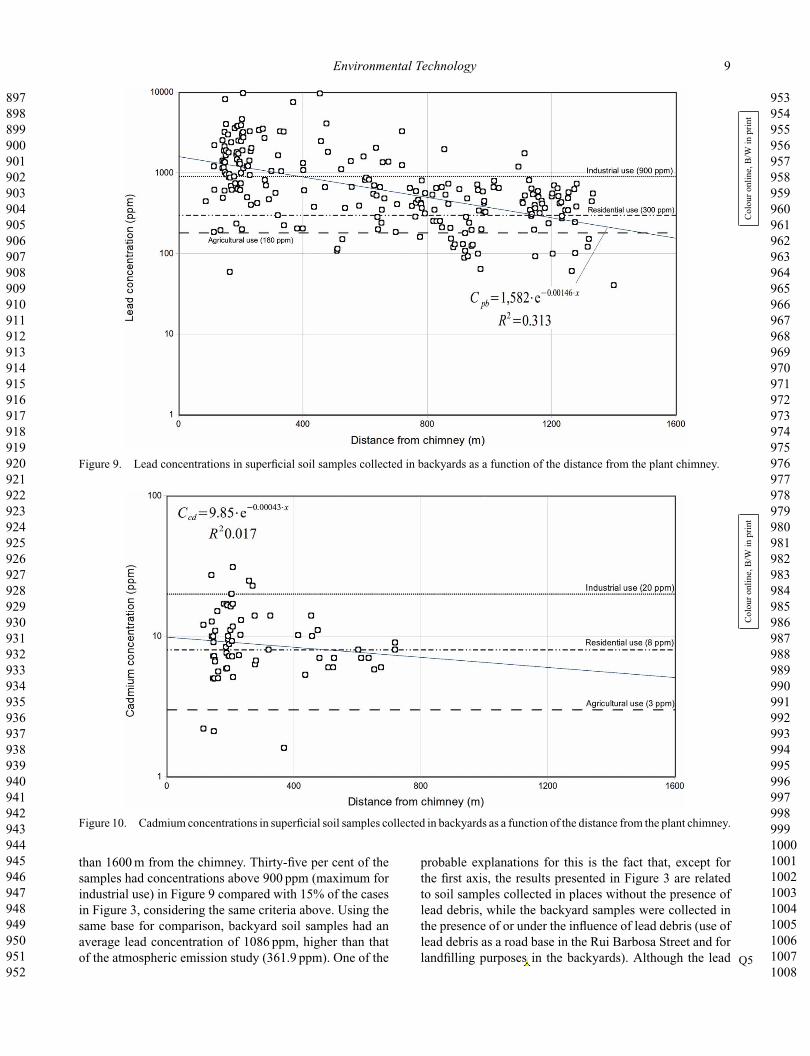
case is much more pronounced and the decrease in the con-centration as the distance from the chimney increases is lessevident. Cadmium concentrations below the detection limitare not shown in Figure 10.
Figure 9 indicates that 77% of the soil samples had leadconcentrations above 300 ppm (maximum for residentialuse) compared with 35% of the cases in Figure 3, consider-ing only the points of the urban neighbourhood located less
sandro
Sticky Note
See note Q7
897898899900901902903904905906907908909910911912913914915916917918919920921922923924925926927928929930931932933934935936937938939940941942943944945946947948949950951952
953954955956957958959960961962963964965966967968969970971972973974975976977978979980981982983984985986987988989990991992993994995996997998999100010011002100310041005100610071008
Environmental Technology 9
Col
ouro
nlin
e,B
/Win
prin
t
Figure 9. Lead concentrations in superficial soil samples collected in backyards as a function of the distance from the plant chimney.
Col
ouro
nlin
e,B
/Win
prin
t
Figure 10. Cadmium concentrations in superficial soil samples collected in backyards as a function of the distance from the plant chimney.
than 1600 m from the chimney. Thirty-five per cent of thesamples had concentrations above 900 ppm (maximum forindustrial use) in Figure 9 compared with 15% of the casesin Figure 3, considering the same criteria above. Using thesame base for comparison, backyard soil samples had anaverage lead concentration of 1086 ppm, higher than thatof the atmospheric emission study (361.9 ppm). One of the
probable explanations for this is the fact that, except forthe first axis, the results presented in Figure 3 are relatedto soil samples collected in places without the presence oflead debris, while the backyard samples were collected inthe presence of or under the influence of lead debris (use oflead debris as a road base in the Rui Barbosa Street and forlandfilling purposes in the backyards). Although the lead Q5
sandro
Cross-Out
sandro
Replacement Text
soil surface regularization

10091010101110121013101410151016101710181019102010211022102310241025102610271028102910301031103210331034103510361037103810391040104110421043104410451046104710481049105010511052105310541055105610571058105910601061106210631064
10651066106710681069107010711072107310741075107610771078107910801081108210831084108510861087108810891090109110921093109410951096109710981099110011011102110311041105110611071108110911101111111211131114111511161117111811191120
10 S. Machado et al.
Figure 11. Comparison between the lead concentrations obtained from atmospheric emissions and from backyard superficial soil samples.
Figure 12. Comparison between the cadmium concentrations obtained from atmospheric emissions and from backyard superficial soilsamples.
debris is located under the road surface, water and sewageservice repairs occur frequently and are performed withoutconsidering the classification of the lead debris. Part of thematerial excavated in these repairs is normally left on theroad surface and is reduced in size by traffic, transported bythe wind and deposited inside the neighbouring houses andbackyards.
Considering all the obtained cadmium results (includingpoints below method detection limit), 14% had cadmiumconcentrations above 8 ppm (maximum for residential use)
compared with 7.1% of the cases of Figure 4, consider-ing only the points in the urban neighbourhood locatedless than 1,600 m from chimney, while 1.7% of the sam-ples had cadmium concentrations above 20 ppm (maximumfor industrial use) against 0% in Figure 4. Using the samebase for comparison, but considering only points above themethod detection limit, backyard soil samples had an aver-age cadmium concentration of 10.14, higher than that ofthe atmospheric emission study (5.18 ppm). The differencesobserved in cadmium concentrations between backyard and
11211122112311241125112611271128112911301131113211331134113511361137113811391140114111421143114411451146114711481149115011511152115311541155115611571158115911601161116211631164116511661167116811691170117111721173117411751176
11771178117911801181118211831184118511861187118811891190119111921193119411951196119711981199120012011202120312041205120612071208120912101211121212131214121512161217121812191220122112221223122412251226122712281229123012311232
Environmental Technology 11
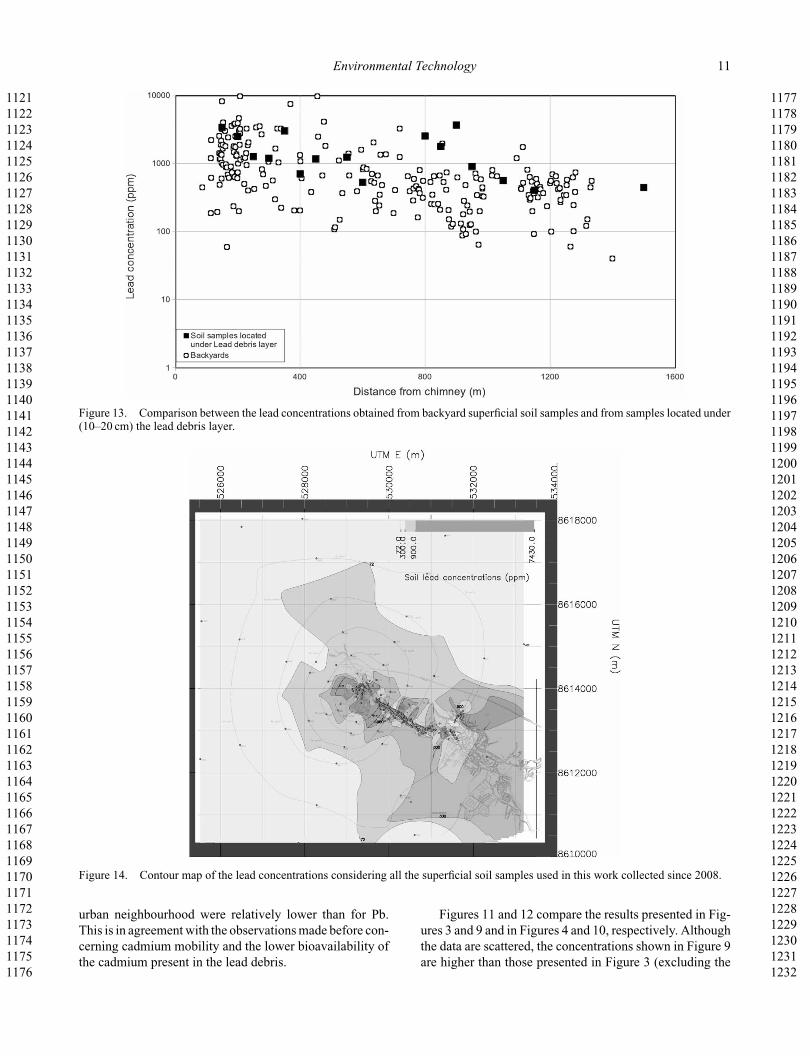
Figure 13. Comparison between the lead concentrations obtained from backyard superficial soil samples and from samples located under(10–20 cm) the lead debris layer.
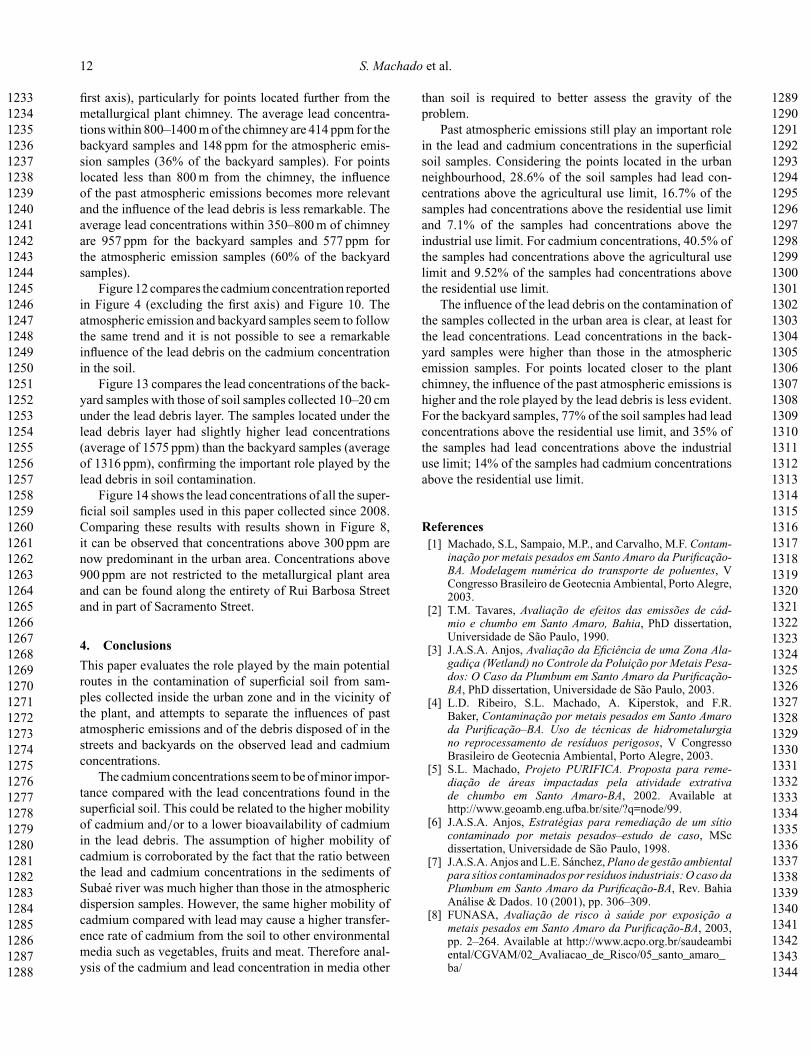
Figure 14. Contour map of the lead concentrations considering all the superficial soil samples used in this work collected since 2008.
urban neighbourhood were relatively lower than for Pb.This is in agreement with the observations made before con-cerning cadmium mobility and the lower bioavailability ofthe cadmium present in the lead debris.
Figures 11 and 12 compare the results presented in Fig-ures 3 and 9 and in Figures 4 and 10, respectively. Althoughthe data are scattered, the concentrations shown in Figure 9are higher than those presented in Figure 3 (excluding the
12331234123512361237123812391240124112421243124412451246124712481249125012511252125312541255125612571258125912601261126212631264126512661267126812691270127112721273127412751276127712781279128012811282128312841285128612871288
12891290129112921293129412951296129712981299130013011302130313041305130613071308130913101311131213131314131513161317131813191320132113221323132413251326132713281329133013311332133313341335133613371338133913401341134213431344
12 S. Machado et al.
first axis), particularly for points located further from themetallurgical plant chimney. The average lead concentra-tions within 800–1400 m of the chimney are 414 ppm for thebackyard samples and 148 ppm for the atmospheric emis-sion samples (36% of the backyard samples). For pointslocated less than 800 m from the chimney, the influenceof the past atmospheric emissions becomes more relevantand the influence of the lead debris is less remarkable. Theaverage lead concentrations within 350–800 m of chimneyare 957 ppm for the backyard samples and 577 ppm forthe atmospheric emission samples (60% of the backyardsamples).
Figure 12 compares the cadmium concentration reportedin Figure 4 (excluding the first axis) and Figure 10. Theatmospheric emission and backyard samples seem to followthe same trend and it is not possible to see a remarkableinfluence of the lead debris on the cadmium concentrationin the soil.
Figure 13 compares the lead concentrations of the back-yard samples with those of soil samples collected 10–20 cmunder the lead debris layer. The samples located under thelead debris layer had slightly higher lead concentrations(average of 1575 ppm) than the backyard samples (averageof 1316 ppm), confirming the important role played by thelead debris in soil contamination.
Figure 14 shows the lead concentrations of all the super-ficial soil samples used in this paper collected since 2008.Comparing these results with results shown in Figure 8,it can be observed that concentrations above 300 ppm arenow predominant in the urban area. Concentrations above900 ppm are not restricted to the metallurgical plant areaand can be found along the entirety of Rui Barbosa Streetand in part of Sacramento Street.
4. ConclusionsThis paper evaluates the role played by the main potentialroutes in the contamination of superficial soil from sam-ples collected inside the urban zone and in the vicinity ofthe plant, and attempts to separate the influences of pastatmospheric emissions and of the debris disposed of in thestreets and backyards on the observed lead and cadmiumconcentrations.
The cadmium concentrations seem to be of minor impor-tance compared with the lead concentrations found in thesuperficial soil. This could be related to the higher mobilityof cadmium and/or to a lower bioavailability of cadmiumin the lead debris. The assumption of higher mobility ofcadmium is corroborated by the fact that the ratio betweenthe lead and cadmium concentrations in the sediments ofSubaé river was much higher than those in the atmosphericdispersion samples. However, the same higher mobility ofcadmium compared with lead may cause a higher transfer-ence rate of cadmium from the soil to other environmentalmedia such as vegetables, fruits and meat. Therefore anal-ysis of the cadmium and lead concentration in media other
than soil is required to better assess the gravity of theproblem.
Past atmospheric emissions still play an important rolein the lead and cadmium concentrations in the superficialsoil samples. Considering the points located in the urbanneighbourhood, 28.6% of the soil samples had lead con-centrations above the agricultural use limit, 16.7% of thesamples had concentrations above the residential use limitand 7.1% of the samples had concentrations above theindustrial use limit. For cadmium concentrations, 40.5% ofthe samples had concentrations above the agricultural uselimit and 9.52% of the samples had concentrations abovethe residential use limit.
The influence of the lead debris on the contamination ofthe samples collected in the urban area is clear, at least forthe lead concentrations. Lead concentrations in the back-yard samples were higher than those in the atmosphericemission samples. For points located closer to the plantchimney, the influence of the past atmospheric emissions ishigher and the role played by the lead debris is less evident.For the backyard samples, 77% of the soil samples had leadconcentrations above the residential use limit, and 35% ofthe samples had lead concentrations above the industrialuse limit; 14% of the samples had cadmium concentrationsabove the residential use limit.
References[1] Machado, S.L, Sampaio, M.P., and Carvalho, M.F. Contam-
inação por metais pesados em Santo Amaro da Purificação-BA. Modelagem numérica do transporte de poluentes, VCongresso Brasileiro de Geotecnia Ambiental, Porto Alegre,2003.
[2] T.M. Tavares, Avaliação de efeitos das emissões de cád-mio e chumbo em Santo Amaro, Bahia, PhD dissertation,Universidade de São Paulo, 1990.
[3] J.A.S.A. Anjos, Avaliação da Eficiência de uma Zona Ala-gadiça (Wetland) no Controle da Poluição por Metais Pesa-dos: O Caso da Plumbum em Santo Amaro da Purificação-BA, PhD dissertation, Universidade de São Paulo, 2003.
[4] L.D. Ribeiro, S.L. Machado, A. Kiperstok, and F.R.Baker, Contaminação por metais pesados em Santo Amaroda Purificação–BA. Uso de técnicas de hidrometalurgiano reprocessamento de resíduos perigosos, V CongressoBrasileiro de Geotecnia Ambiental, Porto Alegre, 2003.
[5] S.L. Machado, Projeto PURIFICA. Proposta para reme-diação de áreas impactadas pela atividade extrativade chumbo em Santo Amaro-BA, 2002. Available athttp://www.geoamb.eng.ufba.br/site/?q=node/99.
[6] J.A.S.A. Anjos, Estratégias para remediação de um sítiocontaminado por metais pesados–estudo de caso, MScdissertation, Universidade de São Paulo, 1998.
[7] J.A.S.A. Anjos and L.E. Sánchez, Plano de gestão ambientalpara sítios contaminados por resíduos industriais: O caso daPlumbum em Santo Amaro da Purificação-BA, Rev. BahiaAnálise & Dados. 10 (2001), pp. 306–309.
[8] FUNASA, Avaliação de risco à saúde por exposição ametais pesados em Santo Amaro da Purificação-BA, 2003,pp. 2–264. Available at http://www.acpo.org.br/saudeambiental/CGVAM/02_Avaliacao_de_Risco/05_santo_amaro_ba/
13451346134713481349135013511352135313541355135613571358135913601361136213631364136513661367136813691370137113721373137413751376137713781379138013811382138313841385138613871388138913901391139213931394139513961397139813991400
14011402140314041405140614071408140914101411141214131414141514161417141814191420142114221423142414251426142714281429143014311432143314341435143614371438143914401441144214431444144514461447144814491450145114521453145414551456
Environmental Technology 13
[9] F.M. Carvalho, T.M. Tavares, S.P. Souza, and P. Linhares,Lead and cadmium concentrations in the hair of fishermenfrom the Subaé River basin, Brazil, Environ. Res. 33 (1984),pp. 300–306.
[10] F.M. Carvalho, A.M. Silvany-Neto, M.E.C. Lima, T.M.Tavares, and H.A. Waldron, Lead poisoning among childrenfrom Santo Amaro, Bahia, Brasil, PAHO Bull. 30 (1985),pp. 51–62.
[11] F.M. Carvalho, T.M. Tavares, A.M. Silvany-Neto, M.E.C.Lima, and F. Alt, Cadmium Concentrations in blood of chil-dren living near a lead smelter in Bahia, Brazil. Environ.Res. 40 (1986), pp. 437–449.
[12] F.M. Carvalho, A.M. Silvany Neto, M.E.C. Chaves, A.M.C.Melo, A.L. Galvao, and T.M. Tavares, Chumbo e cádmio emcabelo de crianças de Santo Amaro da Purificação, Bahia,Rev. Ciência Cultura 41 (1989), pp. 646–651.
[13] F.M. Carvalho, A.M. Silvany Neto, M.F.T. Pires, H.R.Gonçalves, G.C. Guimaraes, C.J.B. Amorim, J.A.S. Silva,and T.M. Tavares, Intoxicação pelo chumbo: zincoprotopor-firina no sangue de crianças de Santo Amaro da Purificaçãoe de Salvador, Bahia, J. Pediatria 72 (1996), pp. 295–298.
[14] S.L. Machado, L.D. Ribeiro, A. Kiperstok, M.A.B. Botelho,and M.F. Carvalho, Diagnóstico da contaminação por metaispesados em Santo Amaro-BA, Rev. Eng. Sanitaria Ambiental9 (2004), pp. 140–155.
[15] A.M. Silvany-Neto, F.M. Carvalho, M.E. Lima, and T.M.Tavares, Determinação social da intoxicação por chumboem crianças de Santo Amaro–Bahia, Rev. Ciência CulturaQ6(1987) pp. 1614–1626.
[16] F.M. Carvalho, A.M. Silvany-Neto, T.M. Tavares, A.C.A.Costa, C.D.R. Chaves, L.D. Nascimento, and M. Reis,Chumbo no sangue de crianças e passivo ambiental de umafundição de chumbo no Brasil, Rev. Pan. Salud Pública 13(2003), pp. 19–23.
[17] A. Kabata-Pendias and H. Pendias, Trace Elements in Soiland Plants, CRC Press, Boca Raton, FL, 1984.
[18] A. Kabata-Pendias and H. Pendias, Trace Elements in Soilsand Plants, 3rd ed., CRC Press, Boca Raton, FL, 2001.
[19] G.A.M. Muñoz, Análise da exposição por chumbo e cádmiopresentes em alimentos vegetais e gramíneas no município deSanto Amaro-BA, Caso do passivo ambiental da COBRAC.MSc dissertation, Universidade Federal da Bahia, 2011.
[20] T.S. Rabelo, Estudo das rotas remanescentes de contami-nação por chumbo e cádmio no município de Santo Amaro-BA. MSc dissertation, Universidade Federal da Bahia, 2010.
[21] F.G. Cunha, Contaminação humana e ambiental porchumbo no Vale do Ribeira, nos estados de São Paulo eParaná, Brasil, PhD disseration, Universidade Estadual deCampinas, 2003.
[22] M.J. Trepka, J. Heinrich, C. Krause, C. Schulz, U. Lippold,E. Meyer, and H.E. Wichamnn, The internal burden of leadamong children in a smelter town: a small area analysis,Environ. Res. 72 (1997), pp. 118–130.
[23] A.V. Sepúlveda, J.M. Vega, and I.B. Delgado, Exposi-ción severa a plomo ambiental en una poblacióninfantil de Antofagasta, Rev. Méd. Chile 128 (2000),pp. 221–232.
[24] M.M.B. Paolliello and A.A.M. Chasin, Cadernos de Ref-erencia Ambiental. Volume 3: Ecotoxicologia do chumbo eseus compostos, Centro de Recursos Ambientais, Salvador,2001.
[25] B.R. Ordóñez, L.R. Romero, and R. Mora, Investigación epi-demiológica sobre niveles de plomo en la población infantily en el medio ambiente domiciliario de Ciudad Juárez, Chi-huahua, en relación con una fundición de El Paso, Texas,Rev. Salud Pública México 45 (2003), pp. 281–295.
[26] G.C. Lalor, M.K. Vutchkov, S.T. Bryan, C.D.C Christie, D.Donaldson, J. Young, and S. Chambers, Acute lead poisoningassociated with backyard lead smelting in Jamaica, J. WestIndian Med. 55 (2006), pp. 394–398.
[27] E. Manzanares-Acuña, H.R.V. Carrillo, M.A.S. Luvéano,V.M.H. Dávila, C.L. León, and R.B. Valenzuela, Niveles deplomo en la población de alto riesgo y su entorno en SanIgnacio, Fresnillo, Zacatecas, Mexico, Rev. Salud PúblicaMéxico 48 (2006), pp. 212–219.
[28] N.A.M.R. Padula, M.H. Abreu, L.C.Y. De Miyzaki, andN.E. Tomita, Intoxicacão por chumbo e saúde infantil: açõesintersetoriais para o enfrentamento da questão, Cad. SaúdePública 22 (2006), pp. 163–171.
[29] C.U. De Freitas, E.M. De Capitani, N. Gouveia, M.H. Simon-etti, M.R. De Paula e Silva, C.S. Kira, A.M. Sakuma,M.F. Carvalho, M.C. Duran, P. Tiglea, and M.H. Abreu,Lead exposure in an urban community: Investigation of riskfactors and assessment of the impact of lead abatementmeasures, Environ. Res. 103 (2007), pp. 338–344.
[30] M.M.B. Paolliello, Exposição humana ao chumbo em áreasde mineração, Vale do Ribeira, Brasil. PhD dissertation,Universidade de Campinas, 2002.
[31] R.W. Lourenço and P.M.B. Landim, Mapeamento de áreasde risco à saúde pública por meio de métodos geoestatísticos,Cad. Saúde Pública. 21 (2005), pp. 150–160.
[32] W.S. Marçal, Intoxicação por chumbo em gado bovinoem zona rural próxima a indústria metalífera, VeterináriaNotícias 11 (2005), pp. 87–93.
[33] A.C.A. Costa, Avaliação da alguns aspectos do passivoambiental de uma metalúrgica de chumbo em Santo Amaroda purificação. MSc dissertation, Universidade Federal daBahia, 2001.
sandro
Sticky Note
Volume 37