College Student Binge Drinking and Academic Achievement: A Longitudinal Replication and Extension
Upload
independentCategory
view
0download
0
Vol 2 | Issue 3 (2014) | pp. 3–15
© 2014 Journal of Perspectives in Applied Academic Practice 3
A Study of the Impact of Technology-Enhanced Learning on Student Academic Performance
Sandeep Chowdhry, Edinburgh Napier University
Karolina Sieler, Edinburgh Napier University
Lourdes Alwis, Edinburgh Napier University
ABSTRACT
In university education a lot of emphasis is placed on the use of the virtual learning environment (VLE) in teaching to enhance the student learning experience. As a result, the academic staff is encouraged to use VLEs in different ways, including as a platform to provide online access to the study material but also as a source of additional online module activities aimed at enhancing student learning. This article reports on a study conducted on 257 students to investigate whether the utilisation of VLE has any impact on the final marks achieved by the students. As part of the study, the VLE logs were contrasted with the final marks of the students participating in a Law Module (LM), an Electrical Engineering Module (EEM) and a Mechanical Engineering Module (MEM) delivered at Edinburgh Napier University in the academic year 2013/14. The results showed that the number of VLE visits did not have a direct impact on the final marks obtained by the students. However, for one of the modules there was some correlation between the final marks obtained by the students and the way the modules were structured around the VLE. The results of the study emphasised the need for continued improvement of the technology-enhanced teaching and learning skills of the academic staff in order to enhance the student learning experience.
Keywords: VLE; technology-enhanced learning (TEL); academic performance; ELGG
Introduction
Widening access to Higher Education (HE) in the recent decade has enabled entrance to the university of students from diverse economic and social backgrounds, increasing the number of students who combine study with part-time work and therefore are not best served by conventional, face-to-face teaching methods. The changing landscape of HE in the UK, together with the fast-paced development of technology in recent years, contributes to the increased use of Technology-Enhanced Learning (TEL) in HE, whether in the form of formal VLEs, institutional intranets with learning and teaching components or internally developed systems comprising specific individual tools (Walker, Voce, & Ahmed, 2012). Traditional, face-to-face contact with students is no longer the exclusive method of teaching. Increasingly, technology is used to enhance the student learning experience in face-to-face environments, reduce face-to-face contact (as with blended learning courses) or even replace it entirely in favour of technology-enhanced independent study (as with distance learning courses). According to the Survey of Technology Enhanced Learning for HE in the UK (Walker, Voce, & Ahmed, 2012), the top three drivers for considering the use of TEL by UK universities are: enhancing the quality of learning and teaching, meeting student expectations and improving access to learning for students off campus.
The value of technology-enhanced learning is increasingly recognised by the HE sector in the UK (Kirkwood & Price, 2014), with universities placing technology at the centre of learning, teaching and assessment. Institutions such as the Higher Education Academy (HEA), the Association for Learning Technology (ALT) and the National Union of Students (NUS) partner up in initiatives such as ‘Changing the Learning Landscape’, renewed in 2013–2014 with “an increased focus on the impact of online learning on institutions’ learning and teaching strategies” (Leadership Foundation for Higher Education, 2014). The UK’s £12m Teaching and Learning Research Programme (TLRP) explored TEL in 2007–2012 in four themes: ‘flexibility’, ‘personalisation’, ‘productivity’ and ‘inclusion’. It was the ‘productivity’ theme which prompted this inter-disciplinary study on the role of TEL in “achieving higher quality and more effective learning” (Laurillard, 2011). For the purpose of the study the accepted definition for ‘productivity’ is the one provided by TLRP, whereby productivity is perceived as “an increase in the value of output per unit of resource input”, where the value of the output is “the level of achievement of the learner and the number oflearnersachievingatthatlevel” (Laurillard, 2011).

Journal of Perspectives in Applied Academic Practice | Vol 2 | Issue 3 (2014)
A Study of the Impact of Technology-Enhanced Learning on Student Academic Performance
© 2014 Journal of Perspectives in Applied Academic Practice 4
Our study aims to investigate the relationship between the frequency of the student VLE access, the VLE learning activities and the students’ academic performance. The study sample comprised students studying for three modules delivered at Edinburgh Napier University in the academic year 2013/14, which were: LM (83 students), EEM (83 students), MEM (91 students). The students’ final marks and their corresponding VLE logs were used for the data analysis presented in this paper.
Literature review
Since the introduction of VLEs, studies investigating them have focused on the institutions’ perceptions of VLEs and their implementation, especially in the context of blended learning. A recent study has proposed a framework for adoption of blended learning at institutions, specifically pointing out three stages in the adoption process: exploration, early implementation and growth (Graham, Woodfield, & Harrison, 2013). In particular, the study has identified the main relevant strategies, structures and support issues that institutions might be required to address at each stage. In the phase of implementation the key aspect to consider is not only the provision of the required infrastructure – including computers, other hardware and internet connection– but also the necessary virtual learning software (Garrison & Kanuka, 2004). Apart from the requirements for infrastructure, the three factors found to be particularly influential for student satisfaction with blended learning courses were course design, communication and motivation (King & Arnold, 2012). However, findings in a different study indicate that the primary determinants of learning satisfaction with blended e-learning systems include: computer self-efficacy, performance expectations, system functionality, content features, interaction and learning climate (Wu, Tennyson, & Hsia, 2010).
The use of VLEs, whether in blended learning courses or for supplementing traditional face-to-face teaching, can be complex and challenging because it requires institutions to provide the necessary infrastructure and lecturers to develop a variety of IT skills. But most importantly, it requires the HE sector in general to develop a completely new approach to the way courses are delivered. Ocak (2011) has identified the difficulties with the use of VLEs such as: complexity of the instruction, lack of planning and organisation, lack of effective communication, need for more time, lack of institutional support, changing roles, difficulty of adopting new technologies and lack of electronic means. The challenge with using VLEs is even greater due to the differences between how individual institutions, faculties and lecturers approach the task. VLEs can be used for anything from report lists, notes, handouts, handbooks, assessments, feedback, practice tests, student produced materials, commercial or other learning materials, PowerPoint presentations, links to external sites, staff resources, embedded video clips, to extension lessons and electronic portfolios (Ofsted, 2009). Therefore the use of VLEs in course delivery requires a comprehensive strategy which needs to be implemented with caution.
In recent years the focus in the discussions on VLEs appears to have shifted from stakeholders’ perception of VLEs and their implementation towards developing evaluation methods, including formal quality assurance systems, in order to ensure that equally high standards of implementation are maintained across faculties and institutions. An increasing number of studies investigate the benefits for both students and lecturers of using VLEs. According to a report issued by Ofsted (2009), the most frequently mentioned benefits to learners using VLEs are: improved motivation and interest, allowing learners to catch up on missed lessons, improved control of assignments and feedback, saving costs and effort in printing, better pacing of learning for individuals and help for excluded students. In an earlier study, Ho, Lu and Thurmaier (2006) established potential advantages of blended learning such as greater flexibility of time, meeting varying and individual needs and learning styles and increased time for reflection at one’s own pace. It was also found that the use of VLEs lowers the student dropout rates when compared with fully online courses. A direct link between students’ use of VLEs and their academic performance is also currently under investigation, although the research so far tends to focus on students’ performance in particular disciplines.
Lee (2013) has investigated the relationships between students' approaches to learning, their perceptions of online discussions, their contributions in asynchronous online discussions and their academic performance in an ecology course. In relation to students’ academic performance, the results of the study show that students who adopted deep approaches to studying (Biggs, 1994) and scored highest in their perception of online discussions scales outperformed the rest (Lee, 2013). Romero, López, Luna and Ventura (2013) have investigated the use of discussion forums as an indicator of student performance using real data from students participating in a first-year course in computer science. The data obtained during the study confirms the suitability of performing both a final prediction at the end of the course and an early prediction before the end of the course based on student participation in online discussion forums (Romero, López, Luna, & Ventura, 2013). However, Demian and Morrice (2012) have found that there is a weak correlation between students’ academic performance and the VLE’s usage logs based on the data obtained from students studying a civil engineering course, whereas the findings of Mijatovic, Cudanov, Jednak and Kadijevich (2013) indicate that students’ active participation in class has a stronger positive effect on students’ achievement than does students’ interactive usage of VLEs. However, an earlier study by Cheng, Pare, Collimore and Joordens (2011) indicates that voluntary participation of students in online group forums positively influences academic performance and that in particular reading posts on the forum slightly improves exam performance.
Such a diversity in results relating to the relationship between students’ performance and the use of VLEs might be due to the fact that in every similar study the results are influenced by several factors, some of which might include: whether the study investigates

Journal of Perspectives in Applied Academic Practice | Vol 2 | Issue 3 (2014)
A Study of the Impact of Technology-Enhanced Learning on Student Academic Performance
© 2014 Journal of Perspectives in Applied Academic Practice 5
students’ first contact with VLEs or whether using VLEs is a common practice at a particular institution; prior experience of students with online learning; lecturer’s background, creativity and IT skills; students’ background; and the types of learning activities and materials provided through the VLE. The last three factors are particularly worth emphasising, as potentially they have a greater influence on the speed with which both the students and the lecturers will adapt to using the VLE. For example, students of a computer science module, who are used to working with online environments, might be more flexible and eager to use VLEs than students of a history module who are used to dealing with more traditional learning environments. Equally, a well-designed VLE which provides a variety of comprehensive materials and engaging learning activities will be more appealing to students than a VLE which provides only a basic content.
It is evident from the discussion so far that good practices must be shared not only between the lecturers in similar subjects but especially across different disciplines in order to ensure that progress is made at a similar rate across all institutional departments and across various institutions in the UK. This study provides a comparative perspective on the topic by seeking to identify the relationship between students’ academic performance and their use of VLEs.
Research design
The research work presented in this paper has been driven by two research questions. The first research question (RQ) is:
RQ1: Is there a correlation between the number of VLE visits and the final marks obtained by the students?
The aim of this research question is to find whether the dependent variable (final marks obtained by the students) and the independent variable (VLE visits) are correlated to each other. To answer this research question, data of the VLE visits and the final marks have been analysed. Accordingly, the RQ has been specified for each module as follows:
The null hypothesis (H0) for the modules is that there is no significant correlation at the 0.05 alpha level between VLE visits and the final marks.
H0: There is no correlation between the VLE visits and the final marks for the LM.
H0: There is no correlation between the VLE visits and the final marks for the EEM.
H0: There is no correlation between the VLE visits and the final marks for the MEM.
The alternative hypothesis (H1) is that there is a correlation at the 0.05 alpha level between VLE visits and the final marks.
H1: There is a correlation between the VLE visits and the final marks for the LM.
H1: There is a correlation between the VLE visits and the final marks for the EEM.
H1: There is a correlation between the VLE visits and the final marks for the MEM.
The second research question is:
RQ2: Does the module structure around VLE affect the students’ academic performance?
The aim of this research question is to find whether the module structure around VLE has an impact on the aforementioned variables. To answer this RQ, the module structure, the VLE visits and the final marks of the modules have been contrasted.
The research model is presented in Figure 1:
RQ1 RQ2
Figure 1 Research Model
Research methodology
The students’ final marks and their VLE usage logs have been recorded for the LM (83 students), EEM (83 students) and MEM (91 students) modules. The logs have been made anonymous by the lecturers, who have replaced students’ names with numbers.
VLE Visits
Final marks
Correlation between variables
VLE module structure
Students’ academic performance
Journal of Perspectives in Applied Academic Practice | Vol 2 | Issue 3 (2014)
A Study of the Impact of Technology-Enhanced Learning on Student Academic Performance
© 2014 Journal of Perspectives in Applied Academic Practice 6
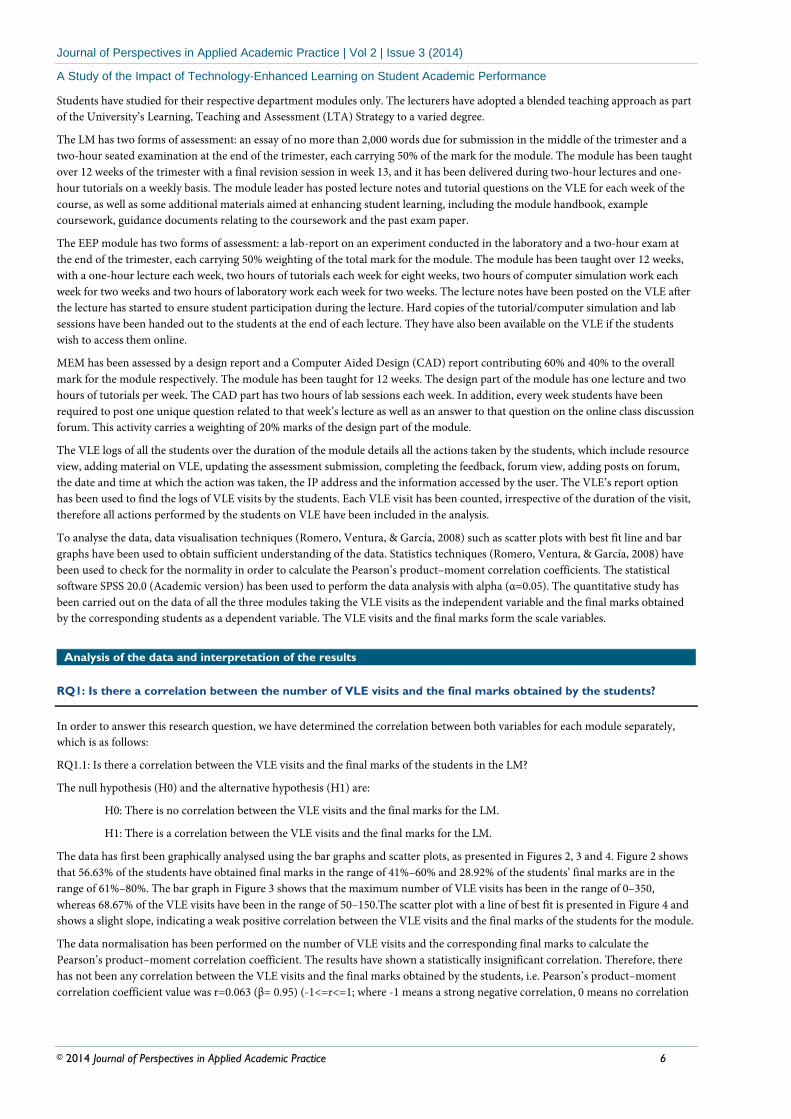
Students have studied for their respective department modules only. The lecturers have adopted a blended teaching approach as part of the University’s Learning, Teaching and Assessment (LTA) Strategy to a varied degree.
The LM has two forms of assessment: an essay of no more than 2,000 words due for submission in the middle of the trimester and a two-hour seated examination at the end of the trimester, each carrying 50% of the mark for the module. The module has been taught over 12 weeks of the trimester with a final revision session in week 13, and it has been delivered during two-hour lectures and one-hour tutorials on a weekly basis. The module leader has posted lecture notes and tutorial questions on the VLE for each week of the course, as well as some additional materials aimed at enhancing student learning, including the module handbook, example coursework, guidance documents relating to the coursework and the past exam paper.
The EEP module has two forms of assessment: a lab-report on an experiment conducted in the laboratory and a two-hour exam at the end of the trimester, each carrying 50% weighting of the total mark for the module. The module has been taught over 12 weeks, with a one-hour lecture each week, two hours of tutorials each week for eight weeks, two hours of computer simulation work each week for two weeks and two hours of laboratory work each week for two weeks. The lecture notes have been posted on the VLE after the lecture has started to ensure student participation during the lecture. Hard copies of the tutorial/computer simulation and lab sessions have been handed out to the students at the end of each lecture. They have also been available on the VLE if the students wish to access them online.
MEM has been assessed by a design report and a Computer Aided Design (CAD) report contributing 60% and 40% to the overall mark for the module respectively. The module has been taught for 12 weeks. The design part of the module has one lecture and two hours of tutorials per week. The CAD part has two hours of lab sessions each week. In addition, every week students have been required to post one unique question related to that week’s lecture as well as an answer to that question on the online class discussion forum. This activity carries a weighting of 20% marks of the design part of the module.
The VLE logs of all the students over the duration of the module details all the actions taken by the students, which include resource view, adding material on VLE, updating the assessment submission, completing the feedback, forum view, adding posts on forum, the date and time at which the action was taken, the IP address and the information accessed by the user. The VLE’s report option has been used to find the logs of VLE visits by the students. Each VLE visit has been counted, irrespective of the duration of the visit, therefore all actions performed by the students on VLE have been included in the analysis.
To analyse the data, data visualisation techniques (Romero, Ventura, & García, 2008) such as scatter plots with best fit line and bar graphs have been used to obtain sufficient understanding of the data. Statistics techniques (Romero, Ventura, & García, 2008) have been used to check for the normality in order to calculate the Pearson’s product–moment correlation coefficients. The statistical software SPSS 20.0 (Academic version) has been used to perform the data analysis with alpha (α=0.05). The quantitative study has been carried out on the data of all the three modules taking the VLE visits as the independent variable and the final marks obtained by the corresponding students as a dependent variable. The VLE visits and the final marks form the scale variables.
Analysis of the data and interpretation of the results
RQ1: Is there a correlation between the number of VLE visits and the final marks obtained by the students?
In order to answer this research question, we have determined the correlation between both variables for each module separately, which is as follows:
RQ1.1: Is there a correlation between the VLE visits and the final marks of the students in the LM?
The null hypothesis (H0) and the alternative hypothesis (H1) are:
H0: There is no correlation between the VLE visits and the final marks for the LM.
H1: There is a correlation between the VLE visits and the final marks for the LM.
The data has first been graphically analysed using the bar graphs and scatter plots, as presented in Figures 2, 3 and 4. Figure 2 shows that 56.63% of the students have obtained final marks in the range of 41%–60% and 28.92% of the students’ final marks are in the range of 61%–80%. The bar graph in Figure 3 shows that the maximum number of VLE visits has been in the range of 0–350, whereas 68.67% of the VLE visits have been in the range of 50–150.The scatter plot with a line of best fit is presented in Figure 4 and shows a slight slope, indicating a weak positive correlation between the VLE visits and the final marks of the students for the module.
The data normalisation has been performed on the number of VLE visits and the corresponding final marks to calculate the Pearson’s product–moment correlation coefficient. The results have shown a statistically insignificant correlation. Therefore, there has not been any correlation between the VLE visits and the final marks obtained by the students, i.e. Pearson’s product–moment correlation coefficient value was r=0.063 (β= 0.95) (-1<=r<=1; where -1 means a strong negative correlation, 0 means no correlation

Journal of Perspectives in Applied Academic Practice | Vol 2 | Issue 3 (2014)
A Study of the Impact of Technology-Enhanced Learning on Student Academic Performance
© 2014 Journal of Perspectives in Applied Academic Practice 7
and 1 means a strong positive correlation) respectively for the 83 cases. Overall, there has been no correlation between the VLE visits and the final marks obtained by the students.
Figure 2 Bar graph of the final marks of the LM
Figure 3 Bar graph of the VLE visits of the LM

Journal of Perspectives in Applied Academic Practice | Vol 2 | Issue 3 (2014)
A Study of the Impact of Technology-Enhanced Learning on Student Academic Performance
© 2014 Journal of Perspectives in Applied Academic Practice 8
Figure 4 Scatter plot for the LM
RQ1.2: Is there a correlation between the VLE visits and the final marks of the students in the EEM?
The null hypothesis (H0) and the alternative hypothesis (H1) are:
H0: There is no correlation between the VLE visits and the final marks for the EEM.
H1: There is a correlation between the VLE visits and the final marks for the EEM.
The data has first been graphically analysed using the bar graphs. The bar graph in Figure 5 shows that marks obtained by students are normally distributed, with the highest bar including 36.14% of students who have obtained marks in the range of 41%–60%, followed by the bars indicating 26.51% of the students have obtained marks in the range of 61%–80% and 25.30% of students have obtained marks in the range of 20%–40%. The bar graph in Figure 6 shows that the maximum numbers of VLE visits are in the range of 0–150, out of which 55.42% of students’ visits have been in the range of 0–25, followed by 26.5% of students’ visits which are in the range of 25–50.
The scatter plot with line of best fit is presented in Figure 7, which shows a slight slope, much like the LM, indicating a weak positive correlation between the VLE visits and the final marks of the students.
The data normalisation has been performed on the number of VLE visits to calculate the Pearson’s product–moment correlation coefficient. The results show a statistically insignificant correlation. Therefore, overall there has been no correlation between the VLE visits and the final marks obtained by the students, Pearson’s product–moment correlation coefficient value is r=0.155 (β=0.95) respectively for the 83 cases. Overall, there is no correlation between the VLE visits and the final marks obtained by the students of the EEM.

Journal of Perspectives in Applied Academic Practice | Vol 2 | Issue 3 (2014)
A Study of the Impact of Technology-Enhanced Learning on Student Academic Performance
© 2014 Journal of Perspectives in Applied Academic Practice 9
Figure 5 Bar graph of the final marks of the EEM
Figure 6 Bar graph of the VLE visits of the EEM

Journal of Perspectives in Applied Academic Practice | Vol 2 | Issue 3 (2014)
A Study of the Impact of Technology-Enhanced Learning on Student Academic Performance
© 2014 Journal of Perspectives in Applied Academic Practice 10
Figure 7 Scatter plot for the EEM
RQ1.3: Is there a correlation between the VLE visits and the final marks of the students in the MEM module?
The null hypothesis (H0) and the alternative hypothesis (H1) are:
H0: There is no correlation between the VLE visits and the final marks for the MEM.
H1: There is a correlation between the VLE visits and the final marks for the MEM.
The bar graph in Figure 8 shows that 50.55% of the students have obtained marks in the range of 60%–80%, followed by 24.18% of students who have obtained marks in the range of 41%–60%. The bar graph in Figure 9 shows the VLE visits in the range of 0–800. The highest bar shows that 38.46% of students’ VLE visits are in the range of 101–200, followed by 27.47% of the students’ VLE visits in the range of 201–300.
The scatter plot with line of best fit is presented in Figure 10, showing a significant slope, which indicates a positive correlation between the VLE visits and the final marks of the students.
The data normalisation has been performed on the VLE visits and the final marks to calculate the Pearson’s product–moment correlation coefficient. The results show that there is a statistically significant positive correlation between the VLE visits and the final marks obtained by the students; Pearson’s product–moment correlation coefficient value is r=0.567 (p<0.05) respectively for the 91 cases. Therefore, overall, there is a moderate positive correlation between the VLE visits and the final marks obtained by the students.

Journal of Perspectives in Applied Academic Practice | Vol 2 | Issue 3 (2014)
A Study of the Impact of Technology-Enhanced Learning on Student Academic Performance
© 2014 Journal of Perspectives in Applied Academic Practice 11
Figure 8 Bar graph of the final marks of the MEM
Figure 9 Bar graph of the VLE visits of the MEM

Journal of Perspectives in Applied Academic Practice | Vol 2 | Issue 3 (2014)
A Study of the Impact of Technology-Enhanced Learning on Student Academic Performance
© 2014 Journal of Perspectives in Applied Academic Practice 12
Figure 10 Scatter plot for the MEM
Table 1 summarises the Pearson’s product–moment correlation coefficients for the three modules. It has been found that in both the LM and EEM the numbers of VLE visits are not correlated with the corresponding final marks of the students, whereas in the MEM there is a moderate positive correlation between both variables. These results suggest that the students’ academic performance may not necessarily be directly affected by the use of the VLE.
Table 1 Pearson’s product–moment correlations coefficients
Pearson's Product–Moment Correlation Coefficient
MEM Final Marks LM Final Marks EEM Final
Marks MEM VLE Visits
0.567 (p<0.05)
LM VLE Visits
0.063 (β=0.95)
EEM VLE Visits
0.155 (β=0.95)
RQ2: Does the module structure around VLE affect the students’ academic performance?
In order to answer this research question, the VLE visits and students’ final marks have been contrasted against the availability of interactive online activities, handouts and other study materials on the VLE.
The results of the analysis are presented in Table 2. For the LM and the EEM, the study material has been provided to the students in the form of handouts and has been made available on the VLE; however, for the MEM the study material has been provided on the VLE and students have been required to attempt an additional online activity each week by referring to the lecture slides, reading books and using the internet. The maximum number of VLE visits in the LM and EEM has been 350 (Fig. 3) and 150 (Fig. 6) respectively, compared to 800 in the MEM. In both LM and EEM, the total number of students’ final marks in the range of 61% to 100 % is 24% (Fig. 2) and 26% (Fig. 5) compared to 53% (Fig. 8) in the MEM. These results suggest that providing the study material on VLE in addition to an interactive online activity has improved the students’ academic achievement.

Journal of Perspectives in Applied Academic Practice | Vol 2 | Issue 3 (2014)
A Study of the Impact of Technology-Enhanced Learning on Student Academic Performance
© 2014 Journal of Perspectives in Applied Academic Practice 13
Table 2 Comparison of results of the LM, EEM and MEM modules
Module VLE visits range Percentage of students in the marks range of 61%–100%
Interactive online activity
Study material on VLE
Handouts
LM 0–350 24 No Yes Yes EEM 0–150 26 No Yes Yes MEM 0–800 53 Yes Yes No
Discussion and implications for the practice
Wu, Tennyson and Hsia (2010) have suggested that, according to the social cognitive theory, encouraging students’ interaction and the use of interaction tools leads to an increase in the students’ satisfaction in blended learning. Constructive dialogues and interactive activities have been shown to encourage a deep approach to learning (Kember, McNaught, Chong, Lam, & Cheng, 2010). Moreover, Ginns and Ellis (2007) have suggested that a deep approach to learning is directly related to the students’ interaction in learning. The students’ interactive usage of the learning management systems has an effect on the students’ achievement (Mijatovic, Cudanov, Jednak, & Kadijevich, 2013).
The results of this study show that the numbers of VLE visits are not directly related to the final marks obtained by the students but that other factors must be taken into consideration, in particular the structure of the module, as well as online components used to promote engagement and interaction. In the MEM, in addition to providing the study materials on the VLE each week, the compulsory participation of an additional online discussion forum activity has provided learner–content interaction (Dawson, 2006), which encourages students to adopt a deep learning approach (Lee, 2013). The online activity provided students with an opportunity to be active learners (Walker, 2003; Mijatovic, Cudanov, Jednak, & Kodijevich, 2013) and take responsibility for their studies. Since the LM and EEM do not have any similar interactive activities on the VLE, the VLE visits by students for these two modules are related directly to students downloading lecture/tutorial material rather than interactively engaging in an online discussion on the topic. As a result of incorporating the interactive activity (Kember et al., 2010), the MEM has a maximum number of VLE visits in the range of 0–800 (Fig. 9) compared to VLE visits in the ranges of 0–350 and 0–150 for the LM (Fig. 3) and EEM (Fig. 6) respectively. In addition, in the MEM module 53% of the students have scored marks in the range of 61%–100% compared to 24% and 26% in the LM and EEM respectively. It shows that the final marks obtained by the students can be greatly enhanced by adopting a creative teaching approach, which makes effective use of VLE in promoting student engagement in discussion and interaction with module content. The study emphasises the critical role of tutors in promoting student engagement and therefore improving student performance by incorporating innovative technology-enhanced learning activities.
The study implies that in order to effectively use VLE to enhance the students’ learning experience, attention should be paid by the tutors to the quality of instructional process (Ocak, 2011) as well as to the selection and provision of good e-resources (Ginns & Ellis, 2007) which are aligned to the learning objectives of the module and which encourage active participation (Mijatovic, Cudanov, Jednak & Kodijevich, 2013) and the adoption of a deep learning approach by the students (Kember, McNaught, Chong, Lam & Cheng, 2010) in the VLE activities. In order to breach the gap between student expectations of the quality of VLE provided at university and the academic staff’s concerns about the use of VLE (as mentioned earlier), the university should provide additional IT training as well as promote the use of tools such as ELGG-based social networking site (Gray & Smyth, 2012) in order to encourage the staff to improve their TEL skills and improve the learning skills of the students (Porter, Graham, Spring, & Welch, 2014).
Conclusions
The main objective of this study has been to investigate the relationship between the amount of student VLE access, the VLE teaching styles and the students’ academic performance. The study has found that there is a positive correlation (r=0.567) between the VLE visits and the final marks obtained by the students in the MEM. It has established that there is no correlation (r=0) between the VLE visits and the final marks obtained by the students in the LM and EEM. It has found that the final marks obtained by the students can be greatly improved by the adoption of innovative online learning activities that encourage students to adopt a deep learning approach in their studies.
The main findings therefore indicate that using VLE as an additional platform for providing an access to the study material does not have an effect on the students’ academic performance per se, especially if the VLE is used only for the purpose of passing lecture/tutorial material. However, the use of VLE as a tool to provide students with an opportunity to actively participate in the learning process by promoting online discussion, providing additional educational material etc. does encourage students to adopt a deep learning approach that improves their academic achievement. The results of the study imply the necessity to focus on improving the TEL skills of the academic staff.

Journal of Perspectives in Applied Academic Practice | Vol 2 | Issue 3 (2014)
A Study of the Impact of Technology-Enhanced Learning on Student Academic Performance
© 2014 Journal of Perspectives in Applied Academic Practice 14
A limitation of this research is that it takes into account all of the VLE visits made by the students, irrespective of their particular reason for access. A suggested direction for further research is to compare and contrast the modules which are using different types of VLE activities and analyse the effect the VLE access to specific activities has on student performance so as to identify the best practice for using VLE to enhance student learning.
Biographies
Sandeep Chowdhry was educated in India and the UK. In the past, he has worked as a lecture in Mechanical Engineering in India. At present, he is working as a lecturer in Product Design and is a Teaching Fellow at Edinburgh Napier University. He is interested in research in education and in Mechanical Engineering.
Karolina Sieler is currently pursuing a PhD in socio-legal studies at Edinburgh Napier University, where she is also working as Lecturer in Law. Karolina is Chief Editor of the UK Law Student Review. Her research interests include international law, human rights, legal theory, socio-legal research methods and education.
Lourdes Alwis received a BEng degree from the Department of Electrical Engineering, City University, London in 2005. She then continued to a PhD degree in Optical Fibre Sensors at the same establishment, which she completed in 2013. She is currently lecturing and researching within the School of Engineering & the Built Environment at Edinburgh Napier University, Scotland. Her research interests include the use of blended teaching in higher education.
References
Biggs, J. (1994). Approaches to learning: Nature and measurement. The International Encyclopedia of Education (1), 318–322.
Cheng, C. K., Paré, D. E., Collimore, L.M., & Joordens, S. (2011). Assessing the effectiveness of a voluntary online discussion forum on improving students’ course performance. Computers & Education, 56(1), 253–261.
doi: http://dx.doi.org/10.1016/j.compedu.2010.07.024
Dawson, S. (2006). Online forum discussion interactions as an indicator of student community. Australasian Journal of Educational Technology, 22, 495–510. Retrieved from http://www.ascilite.org.au/ajet/ajet22/dawson.html
Demian, P., & Morrice, J. (2012). The use of virtual learning environments and their impact on academic performance. Engineering Education, 7(1), 11–19.
doi: http://dx.doi.org/10.11120/ened.2012.07010011
Garrison, D. R., & Kanuka, H. (2004). Blended learning: Uncovering its transformative potential in higher education. The Internet and Higher Education, 7(2), 95–105.
doi: http://dx.doi.org/10.1016/j.iheduc.2004.02.001
Ginns, P., & Ellis, R. (2007). Quality in blended learning: Exploring the relationships between on-line and face-to-face teaching and learning. The Internet and Higher Education, 10(1), 53–64.
doi: http://dx.doi.org/10.1016/j.iheduc.2006.10.003
Graham, C. R., Woodfield, W., & Harrison, J. B. (2013). A framework for institutional adoption and implementation of blended learning in higher education. The Internet and Higher Education, 18, 4–14.
doi: http://dx.doi.org/10.1016/j.iheduc.2012.09.003
Gray, C., & Smyth, K. (2012). Collaboration creation: Lessons learned from establishing an online professional learning community. Electronic Journal of E-Learning, 10(1), 60–75. Retrieved from http://eric.ed.gov/?id=EJ969436
Ho, A., Lu, L., & Thurmaier, K. (2006). Testing the reluctant professor’s hypothesis: Evaluating a blended-learning approach to distance education. Journal of Public Affairs Education, 12(1), 81–102.
Kember, D., McNaught, C., Chong, F. C. Y., Lam, P., & Cheng, K. F. (2010). Understanding the ways in which design features of educational websites impact upon student learning outcomes in blended learning environments. Computers & Education, 55(3), 1183–1192.
doi: http://dx.doi.org/10.1016/j.compedu.2010.05.015
King, C. R., & Arnold, K. C. (2012). Blended learning environments in Higher Education: A case study of how professors make it happen. Mid-Western Educational Researcher, 25(1-2), 44–59.
Kirkwood, A., & Price, L. (2014). Technology-enhanced learning and teaching in higher education: what is “enhanced” and how do we know? A critical literature review. Learning, Media and Technology, 39(1), 6–36.
doi: http://dx.doi.org/10.1080/17439884.2013.770404

Journal of Perspectives in Applied Academic Practice | Vol 2 | Issue 3 (2014)
A Study of the Impact of Technology-Enhanced Learning on Student Academic Performance
© 2014 Journal of Perspectives in Applied Academic Practice 15
Laurillard, D. (2011). A draft research briefing document from the technology-enhanced learning research programme. London Knowledge Lab. Retrieved from http://www.tlrp.org/docs/ProdBeta.pdf
Leadership Foundation for Higher Education (2014). Changing the Learning Landscape. Retrieved 05 May, 2014 from http://www.lfhe.ac.uk/en/programmes-events/your-university/cll/
Lee, S. W. Y. (2013). Investigating students’ learning approaches, perceptions of online discussions, and students' online and academic performance. Computers & Education, 68, 345–352.
doi: http://dx.doi.org/10.1016/j.compedu.2013.05.019
Mijatovic, I., Cudanov, M., Jednak, S., & Kadijevich, D. M. (2013). How the usage of learning management systems influences student achievement. Teaching in Higher Education, 18(5), 506–517.
doi: http://dx.doi.org/10.1080/13562517.2012.753049
Ocak, M. A. (2011). Why are faculty members not teaching blended courses? Insights from faculty members. Computers & Education, 56(3), 689–699.
doi: http://dx.doi.org/10.1016/j.compedu.2010.10.011
Ofsted. (2009). Virtual learning environments: An evaluation of their development in a sample of educational settings. Available from http://www.ofsted.gov.uk/resources/virtual-learning-environments-evaluation-of-their-development-sample-of-educational-settings
Porter, W. W., Graham, C. R., Spring, K. A., & Welch, K. R. (2014). Blended learning in higher education: Institutional adoption and implementation. Computers & Education, 75, 185–195.
doi: http://dx.doi.org/10.1016/j.compedu.2014.02.011
Romero, C., López, M. I., Luna, J. M., & Ventura, S. (2013). Predicting students’ final performance from participation in on-line discussion forums. Computers & Education, 68, 458–472.
doi: http://dx.doi.org/10.1016/j.compedu.2013.06.009
Romero, C., Ventura, S., & García, E. (2008). Data mining in course management systems: Moodle case study and tutorial. Computers & Education, 51(1), 368–384.
doi: http://dx.doi.org/10.1016/j.compedu.2007.05.016
Walker, S. E. (2003). Active learning strategies to promote critical thinking. Journal of Athletic Training, 38(3), 263–267.
Walker, R., Voce, J., & Ahmed, J. (2012). Survey of technology enhanced learning for higher education in the UK. Retrieved from http://www.ucisa.ac.uk/groups/ssg/surveys.aspx
Wu, J. H., Tennyson, R. D., & Hsia, T. L. (2010). A study of student satisfaction in a blended e-learning system environment. Computers & Education, 55(1), 155–164.
doi: http://dx.doi.org/10.1016/j.compedu.2009.12.012
Copyright © 2022 FDOKUMEN