
A study of gearing levels and company size of firms quoted at ...
99
' a study of gearing levels and company size of firms quoted AT NAIROBI STOCK EXCHANGE uNU'fcRsirr or- Bv ALT DAVID PASCALjPSIVVA A management Research Project Submitted in Partial Fulfillment of the Requirements of the Degree of Masters of Business Administration, University of Nairobi. OCTOBER 2005.
-
Upload
khangminh22 -
Category
Documents
-
view
0 -
download
0
Transcript of A study of gearing levels and company size of firms quoted at ...

' a s t u d y o f g e a r in g l e v e l s a n d c o m p a n y s iz e o f f ir m s q u o t e d
AT NAIROBI STOCK EXCHANGE
uNU'fcRsirr or-
Bv
ALTDAVID PASCALjPSIVVA
A management Research Project Submitted in Partial Fulfillment of the Requirements of the Degree o f Masters of Business Administration, University of Nairobi.
OCTOBER 2005.

DECLARATION
I declare that this project is my original work and has not been presented for a degree in any other University.
Date
This project has been submitted for examination with my approval as University Supervisor.
Angela Kithinji
Lecturer, Department of Accounting,
University of Nairobi.
1

DEDICATION
To my wife Pamella and my son Ryan.
u

LIST OF ABBREVIATIONS
MM - Modigiliani and Miller.
GDP- Gross domestic product.
NSE- Nairobi Stock Exchange.
G7 Countries - United States, Japan, Germany, France, Italy, United Kingdom and
Canada.
EAC- East Africa Community.
WACC- Weighted average cost of capital.
AIMS- Alternative investment markets.
GSK- Glaxosmithklinebeecham.
Ml

Declaration......... ........................................................................................................... I
Dedication----------------------------------------------------------------------------------------- ii
List of Abbreviations.................................................................................................... iii
Table of contents........................................................................................................... iv
Acknowledgement....................................................................................................... viii
Abstract------------------------------------------------------------------------------------------- ix
CHAPTER ONE
INTRODUCTION
1.1 Background.......................................................................................................... 1
1.2 Statement o f the problem.................................................................................... 3
1.3 Objectives o f the Study....................................................................................... 4
1.4 Importance of the Study......................................................................................4
CHAPTER TWO
LITERATURE REVIEW
2.1 The Nature of Corporate Financing................................................................... 7
2.2 Alternative Sources of Financing....................................................................... 8
2.3 Debt as a Form of Financing.............................................................................. 9
2.3.1 Why use Debt?.................................................................................................. 9
2.3.2 Benefits of Financing a Firm Using Debt........................................................10
2.3.3 Problems Associated With High-levei Gearing.............................................. ’9
2.4 Theories of Capital Structure............................................................................. *4
TABLE OF CONTENTS Page
iv

t. J
2.4.1 Traditional View of Gearing/ Optimal Debt level------------------------------- 15
2.4.2 The Theories of Modigiliani and Miller------------------------------------------- 16
2.4.3 Pecking Order Theory o f Capital Structure--------------------------------------- 17
2.4.4 Behavioral Theory of Capital Structure-------------------------------------------- 19
2.5 Indicators o f Company Size............................................................................ 20
2.6 Relationship Between Debt and Company Sizes........................................... 21
CHAPTER THREE
RESEARCH METHODOLOGY
3.1 Research Design...................................................................................................24
3.2 Population------------------------------------------------------------ 24
3.3 Data Collection--------------------------------------------------------------------------- 24
3.4 Data Analysis------------------------------------------------------------------------------24
CHAPTER FOUR
DATA ANALYSIS, FINDINGS AND DISCUSSIONS
4.1 Company Ranking............................................................................................ 26
4.2 Market Analysis................................................................................................ 27
4.2.1 Gearing Levels Based on Market Capitalization............................................ 27
4.2.2 Gearing Levels Based on Net assets...............................................................28
4.2.3 Gearing Levels Based on Turnover................................................................29
4.3 Industry Analysis..............................................................................................30
4.3.1 Commercial and Services Sector.................................................................... 30
4.3.1.1 Gearing Levels Based on Market Capitalization.............................................30i o r ' i ~ ~ ................................................... ........... .................. . .( . i . V I V / U I I 1 1 L , * V/l t ) U U . I V d U l i I > V I U J J V I J
v

4.3.1.3 Gearing Levels Based on Turnover---------------------------------------------- 33
4.3.2 Industrial and Allied Sector----------------------------------------------------------34
4.3.2.1 Gearing Levels Based on Market Capitalization........................................... 34
4.3.2.2 Gearing Levels Based on Net assets...............................................................35
4.3.2.3 Gearing Levels Based on Turnover................................................................ 36
4.3.3 Agricultural Sector-------------------------------------------------------------------- 38
4.3.3.1 Gearing Levels Based on Market Capitalization............................................38
4.3.3.2 Gearing Levels Based on Net assets...............................................................39
4.3.3.3 Gearing Levels Based on Turnover................................................................40
4.3.4 Alternative Investment Markets (AIMS)........................................................ 41
4.3.4.1 Gearing Levels Based on Market Capitalization............................................41
4.3.4.2 Gearing Levels Based on Net assets...............................................................42
4.3.4.3 Gearing Levels Based on Turnover................................................................43
4.4 Regression Analysis........................................................................................44
4.4.1 Regression Analysis for the Market...............................................................45
4.4.2 Regression Results for Industry Classification............................................. 46
4.4.2.1 Regression Analysis for Industrial and Allied.............................................. 46
4.4.2.2 Regression Analysis for Commercial and Services...................................... 47
vi
CHAPTER FIVE
SUMMARY OF FINDINGS & CONCLUSIONS, RECOMMENDATIONS, LIMITATIONS OF THE STUDY AND SUGGESTIONS FOR FURTHER RESEARCH.
5.1 Summary of Findings and Conclusion---------------------------------------48
5.1.1 Summary of Findings---------------------------------------------------------- 48
5.1.1.1 Graphical Analysis---------------------------------------------------------------48
5.1.1.2 Regression Analysis-----------------------------------------------------------50
5.1.2 Conclusions----------------------------------------------------------------------50
5.2 Limitations of Study----------------------------------------------------------- 51
5.3 Recommendations to Policy Makers--------------------------------------- 52
5.4 Suggestions for Further Study------------------------------------------------53
References------------------------------------------------------------------------54
Appendices------------------------------------------------------------------------59
vii

ACKNOWLEDGEMENT
I am indebted to a great number of people whom have played a crucial role to enable me •
complete my studies.
First and foremost, I am grateful to Mrs. A. Kithinji, my supervisor for her immense
contributions towards transforming the idea into a project. I would also like to
acknowledge and salute my lectures and colleagues in the department of accounting.
Last, but not least, I wish to thank my parents for their support throughout my education.
viii

ABSTRACT
The gearing level of firms is influenced by diverse factors. However the factors vary
amongst firms and industries. Different researchers, for example Kamere (1987) and
Omondi (1996) obtained differing conclusions on the important determinants of gearing
level of firms.
This study had the objective of determining the gearing level of companies quoted at the
Nairobi Stock Exchange as well as establishing whether there is a correlation between
gearing levels and company size of firms quoted at the Nairobi Stock Exchange. The
factors used to measure size of firms for the study period were market capitalization, net
assets and turnover.
Firms were ranked in pecking order based on their market capitalization and classified
into three groups of large firms, medium firms and small firms and their respective
aggregate gearing computed. The results of company size and gearing were plotted on
graph and also regressed for the entire period. This was also done at industry level. A
similar process was applied to all the firms using net assets and turnover as measures of
size.
The study found out that size, as measured by net assets is positively correlated to gearing
at both market and industry classification of firms into large, medium and small with co
efficient of determination being at 30%, 40% and 30%; and 22%, 55% and 11 %
respectively. The second finding was that size, as measured by turnover is positively
correlated with gearing at market classification of assets into large, medium and small,u
wntwivm s j a. vi vivi i 1111 luu \ j i A* * IMII/ n m i '
U V 1 i l £ t i t j v y / V , j w / u U I I Urnn/ . i , .jV y / u i v ) | ; v v u * v*i f •
IX

However, at industrial classification, the correlation is insignificant. Lastly, size, as
measured by market capitalization is positively, but insignificantly correlated to gearing
levels both at market and industry classification.
The graphical analysis produced mixed results and is tabulated elsewhere in this text. It is
also important to consider that the period under study had two interest rate regimes. The
period up to 2002 had high interest rates while the period after 2002 had low interest
rates. The graphical analysis depict that after stabilization of the interest rates in the year
2003, large companies recorded higher gearing at market classification irrespective of the
determinant of size.
All in all, the results from the various tests indicate that there are disparities in the
correlation between gearing level and size of firms. Possible explanations for this
includes the different interest rates regimes and small number of firms under study, which
is dictated by the number of companies listed at the Nairobi Stock Exchange.
x

CHAPTER ONE
INTRODUCTION
1.1 Background.
Corporate Financing problems, described by Balzac nearly 160 years ago, are just as
topical now as they were then. Companies therefore need to adopt a capital structure that
enables them to derive optimum value to its owners. In this regard, the gearing of a
company requires to be done skillfully, so as to enhance returns to the shareholders.
Capital structure is the relationship of long-term capital, that is, out of the total capital,
what ratio is debt and what ratio is equity. Debt can be in form of bank overdrafts, bank
loans, debentures or loan stock. Equity includes paid up share capital, share premium,
reserves and retained earnings (Scott, 1972).
Gearing is an expression of the relationship between the amount of finance provided by
equity shareholders and the amount provided by lenders. Since preference shareholders
receive a fixed return, they will be treated in the same way as lenders (although, in
theory, preference shareholders are only entitled to their dividends out of profits, in
practice, companies which do not pay preference dividends are in difficult
circumstances). In this regard, gearing is computed as a ratio of long-term finance and
preference shares to ordinarily shares and reserves (Delbreil et al, 1993).
Moreover, given the risk that a company may become insolvent, credit
institutions will grant additional external funds only if it can offer guarantees, or it can
maintain its net equity at a level sufficient to provide a safety margin (Delbreil et al,
1993).
1

The need to conduct the research by company size derives from the consideration that a
company s access to money and capital markets depends a great deal on its size.
It is also often asserted that, in view of institutional factors, small and medium sized
enterprises are disadvantaged by the financing system and must consequently bear higher
financial costs.
There are many theories that define what motivates companies to adapt a given capital
structure. They include the Traditional view (net income view), Modigiliani and Miller
(1958) theory, pecking order theory, and behavioral theory of capital structure. However,
there is no conventional theory that claims to address the subject conclusively (Lumby,
1991) . Capital structure of companies tends to be influenced by size, attitude of lenders
towards the company, management strategy and company growth (Weston and Copeland,
1992) .
Commercial banks and other financial institutions on the other hand grant credit facilities
to companies based on; collateral offered to secure credit, the companies past present and
future cash flows, size of the company, profitability of the company, quality of the
management and the nature and duration of the bank relationship (Delbreil, 1993).
Companies with large number o f fixed assets are in a position to grant creditors part of
the assets as collateral and hence are likely to support more loans than companies with a
small number of assets. A company with a large number of assets is likely to be a big
company and hence we can deduce that big companies are likely to benefit all the more
from higher gearing as their asset portfolio allows them to cover their commitments.
It is also argued that bigger companies are likely to diversify than smaller companies,
thereby reducing the likelihood of falling into trouble (the probability of bankruptcy
being smaller, it can take on more debt) (Delbreil, 1993).
Similarly, big companies with superior brands like coca-cola are likely to be granted
credit facilities on favorable terms than small companies with interior brands.
2

This in the affirmative with the preceding paragraph, and hence big companies can
support more credit facilities than small companies, and therefore big companies are
likely to be more geared than small companies (Delbreil et al, 1993).
1.2 Statement of the Problem.
As companies expand, they find themselves in need of more funds to finance increased
operations and to benefit from interest on tax being deductible (MM, 1958). The appetite
for more funds in addition to big companies being able to negotiate for concessionary
interest rates will lead to more use of debt, and hence higher gearing (Pandey, 2000). This
therefore implies that big companies are likely to be more geared than small companies.
Studies undertaken elsewhere are not conclusive on the relationship between debt and
company size. On the basis of sample of listed companies in the G7 countries, Rajan and
Zingales (1995) found that debt o f companies increases with size, except in Germany.
They explained their result by the fact that the bigger the company, the more it can
diversify, thereby reducing the likelihood of its finding itself in difficulty. Germany’s
negative relationship between size and debt is not explained by Rajan and Zingales
(1995).
Studies undertaken in Kenya in different periods and using different variables to
represent company size have had mixed results. Kamere (1987), who used average book
value to represent company size, and covering the period 1981-1985 found that the
correlation between debt and company size, was rather low. Omondi (1996), in his study
covering the period 1987-1994, using turnover to represent size, found that size, is not
correlated with capital structure at all, whether sectoral or combined.
It is important to note that the two studies used different variables to represent size and
hence the findings may not be consistent. Use of asset book values to determine size will
lead to different results, as firms procure debt based on their current state- market value,
as perceived by creditors.
3

Similarly, some firms have high turnover but register low profitability due to operating
inefficiencies. Use of turnover will therefore lead to equally different findings.
Market capitalization makes use of prices allocated to stocks at the stock exchange as
perceived by investors. Where the stocks are wrongly priced, the stock market corrects
itself as has been occassionally witnessed at Nairobi Stock Exchange. This phenomenon
is best depicted in an efficient market. The best estimate of a fi rm' s size in an efficient
market can therefore be determined by use of market capitalization.
This study will therefore determine the gearing levels o f companies quoted at the Nairobi
Stock Exchange as well as establishing the relationship between gearing levels and the
size of the quoted companies.
1.3 Objectives of the Study.
1. To determine Gearing levels o f companies quoted at the Nairobi Stock Exchange.
2. To determine the relationship between Gearing levels and size of companies quoted at
the Nairobi Stock Exchange for the period 1998-2004.
1.4 Importance of the Study.
This study will be useful to the following:
Investors: The findings will disclose the average leverage levels of companies of
similar size, probably in the same industry. This will be of interest to investors, as
they will know whether or not their investments are safe. The findings of this study
will provide that information as well as enable investors to know which companies to
invest their funds.
4

Managers: Managers are bestowed with a fiduciary role by the shareholders. The
findings will enable the managers know leverage levels of other companies of similar
size and especially the market leaders and hence the best mix of debt and equity to
finance the company’s assets so as to obtain the optimum return to shareholders at
acceptable risk level.
Auditors: Auditors are expected to examine the financial transactions and financial
statements of companies and express their opinion on whether or not they reflect the
true position of affairs of a company at a given date. The results of this study
therefore provide Auditors with further information regarding leverage levels of other
companies of similar size in the same industry and hence advise the management on
the company ' s current and recommended leverage level.
Commercial banks: Commercial banks give companies several credit facilities such
as term loans, asset financing, overdrafts, letters of credit, guarantees, and discount
facilities. The banks are also interested in having an indication of leverage levels of a
company especially in relation to leverage levels o f other companies of similar size in
the same industry.
Creditors: Creditors provide companies with goods and services on credit. They are
always interested to know the leverage level of a company before providing their
credit. Where a company is almost insolvent, they will withhold their credit, while
where a company is highly liquid, will continue providing credit.
Academicians: The findings may motivate other researchers to do further research in
other countries, undertake the same research in subsequent period or explore the topic
further.
5

Financial Analysts: By studying the findings of this research, analysts will be able to
obtain accurate information on comparability of leverage levels of companies of
similar size and in the same industry and hence will be in a better position to advise
investors on which companies to invest in, without the risk of recommending
companies with uncertain future.
6

CHAPTER TWO
LITERATURE REVIEW
2.1 The Nature of Corporate Financing.
Finance managers are always faced with a situation where they have to decide how to
raise capital for the firm to finance its activities. The options available are always
whether to finance firms using debt or equity. The choice might also entail a mixture of
debt and equity. Debt finance is cheaper because interest expense is tax deductible.
However, use of too much debt might expose a firm to too much fixed charges in form of
interest, which might lead to bankruptcy. On the other hand, reliance on equity finance
will lead to loss of opportunity to increase the value of the firm which debt would have
provided. The ultimate decision will be that mix of debt and equity that will lead to
maximization of shareholders wealth (Pandey, 2000).
Financial structure is the relationship of all sources of financing in a firm, that is short,
medium and long term. The following are the factors that influence financial structure ot
a firm (Pandey, 2000).
Growth and stability of sales- where growth rates are high, equity is likely to be cheap
because of the attractiveness of the company. On the other hand, the cost o f debt finance
can easily be sustained and the gearing effect will maximize the gain for equity. If growth
is stable; the ability to sustain high gearing levels increases.
Competitive structures of the industry- sales are only one factor in determining profits.
Another is the degree of competition and the profit margins in the industry. High
competition compels firms to reduce profit margins and loose some market share, which
leads to lower profitability. The reverse works in their favor.
7

Asset structure- where the firm’s asset structure largely consists of fixed assets, then
there will be a tendency to use long-term finance. If there is an emphasis on short-term
assets for example in retailing, then short-term financing will be used.
Management attitude - towards control and risk. For quoted companies, sale of shares is
attractive, with access to capital markets, less risk, and control being irrelevant. For
unquoted smaller companies, the issue of shares is often so as to preserve control and
avoid dilution of equity. Risk averse decision makers will encourage more of equity
while risk seekers will encourage more of debt.
Lender attitudes - the attitudes o f lenders to the company and its financial structure
dictate how much and at what cost the company can borrow. Where the lenders have
good attitude towards a firm, they are likely to offer favorable interest rates to the
borrowing firm, leading to the firm having access to long term funds in form of debt.
Company size- in general terms, large companies have easy access to both short term and
long term credit facilities at a lower cost than small companies. This is due to the fact that
lenders consider large firms to be more stable and less risky.
It is therefore imperative that financing decisions should be approached carefully with
skill, as it determines the value o f the company, its growth and its profitability among
others.
2.2 Alternative Sources of Financing.
There are basically two sources o f financing namely debt capital and equity capital
(Butt, 1979). Debt capital includes bank loans, debentures, and loan stock. Debentures
are the more common form of long term debt financing. A debenture is issued to show
that a lender has advanced money to a company.
8

The debenture deed will show the interest rate and maturity date. They may be secured or
unsecured, redeemable or perpetual and convertible or nonconvertible debentures.
Loan stock is borrowed money consolidated into one mass for the sake of convenience.
An advantage of loan stock over debenture is that the former can be sold in small units
while the later cannot be sold in units; one has to sell the whole amount of the debenture
because it is for a specific amount (Ross, 1978).
The other source of financing is equity capital, which comprises of ordinary shares,
preference shares, reserves, share premium, and retained earnings. Ordinary shares are
the most common and comprise that part of capital contributed by the owners. Preference
shares are more like debentures in that they entitle the owners to fixed interest payments
and they have to be paid before ordinary shares are paid. Share premium arises where
either ordinary shares or preference shares are sold at a price in excess of their par value.
Reserves are of various forms and are created at the discretion of the management, and
can be revenue, capital, redemption, capital reserves etc. They are included in the
owner ' s equity (Ross, 1978).
2.3 Debt as a Form of Financing.
2.3.1 Why Use Debt?
The tax shield on interest makes debt a cheaper option as compared to equity finance. It
therefore follows that if firms are attempting to minimize their cost of financing, it would
seem on first sight that they should go for as high gearing as possible. This approach,
however, ignores the effect of gearing on equity holders. As gearing increases, earnings
available to equity holders become increasingly variable (risky). To compensate
themselves for this risk, equity holders will ask for higher returns (Merret and Sykes,
1973). This increase in the cost o f equity could well cancel the benefit of cheaper debt.
This balance between the cost of debt, equity and the weighted average cost of capital
has been the subject of much academic investigations ( Merret and Sykes, 1973).
9

When investing into a business an investor faces two types of risk. Business or operating
risk, which is the variability of earnings before interest and tax associated with the
industrial sector in which a business operates. For example, an oil-prospecting venture
would carry more business risk than a property company. Financial risk on the other hand
is the additional risk introduced by the use of gearing.
2.3.2 Benefits o f Financing a Firm Using Debt.
Merret and Sykes (1973) observe that there are benefits associated with debt financing. If
a firm maintains its gross income in real terms under inflationary conditions, the real
income available to equity shareholders will adjust itself upwards as the burden of
servicing debt capital necessarily declines (Merret and Sykes, 1973). Therefore, the
company as a holder of debt will benefit at the expense of creditors. This will be true
especially if inflation continues for a long time and then, either the interest rates will rise
if additional debt is issued or the availability of debt capital.
Debt finance enables a company to invest into a project and realize returns, while debt
servicing takes a longer period, and in fact the repayment arrangements may be such that
there is a grace period while the principal repayments may be quarterly or semi- annually.
The firm therefore enjoys the benefit of time value of money.
2.3.3 Problems Associated With High-level Gearing.
The M&M (1963) position implies that companies should take gearing to a maximum to
obtain the largest tax shield on debt possible and therefore maximize the wealth of their
investors. A brief examination of company balance sheets would reveal that this does not
happen in reality. Other problems discourage companies from taking on high levels of
gearing. These problems are associated with bankruptcy and agency costs. For
bankruptcy costs, as firms take on high levels of gearing, the chances ot default on
repayment, and hence bankruptcy, increase.
10
UNBTER5ITY OP NAIfft*' ) f l« J U B E J E U W U tt
Investors will be concerned over this possibility that this concern will result in a fall in
the value ot a company’s securities, with a corresponding increase in the firm’s cost of
funds.
To optimize capital structure, financial managers must therefore not increase gearing
beyond the point where the cost o f investor fears over bankruptcy; outweigh the benefits
gained from the increased tax shield on debt. It is not bankruptcy in itself that is the
problem, but the costs that accompany it. These costs may be categorized as either direct
costs of bankruptcy or indirect costs of bankruptcy. In the case of direct costs of
bankruptcy, where a firm is liquidated, it is well known that its assets are usually sold at
less than their going concern value. Liquidation costs, redundancy costs and distress
prices for assets due to thin markets can all lead to assets realizing less than their
economic value. These costs mean that at any point, the company’s going concern value
will be greater than its wind-up value. This loss in value will often be borne by the debt
holders in the event of bankruptcy. To compensate for this, investors will ask for high
rates of return from highly geared companies and thus drive down the prices of their
securities (Pandey, 2001).
As for the indirect costs of bankruptcy, the costs can be suffered by companies that
eventually go bankrupt or by those that hover close to bankruptcy for many years. They
relate to the problems of operating a company under severe financial distress. In highly
geared firms, managers might find that the bulk of their time and attention is spent on
keeping creditors happy rather than on seeking the best course ot action for the future
prosperity o f the firm.
Additionally, the firm may find that key employees leave rather than stay and risk being
tainted by association with the bankrupt firm. Suppliers may refuse to supply trading
stock and customers may refuse to buy if they perceive a risk that the after sales service
will not be there. These operating problems will reduce the future cash flows of the
business and hence its value (Dobbins and Pike, 1982).
11

In the case of agency costs, shareholder and creditor interests are often at odds regarding
the acceptability of investment projects. Shareholders may be tempted to gamble on high-
risk projects, and if things work out well they take all the winnings whereas if things turn
out badly, the debenture holders will stand part of the losses, the shareholders only being
liable up to their equity stake. Managers can act in the best interest of the shareholders
rather than the debt holders in the following ways (Smith, 1986).
Dividends: Shareholders may be reluctant to put money into an ailing company. On the
other hand, they are usually happy to take money out. Large cash dividends will secure
part of the company s value for the shareholders at the expense of the creditors.
Playing for time: Generally, because of the increasing effect of the indirect costs of
bankruptcy, if a firm is going to fail, it is better that this happens sooner than later from
the creditor’s point of view. However, managers may try to hide the extent of the
problem by cutting back on research, maintenance, staff development and thus make this
years results better at the expense of next year 's.
Changing risks: The company may change the risk of the business without informing the
lender. For example, management may negotiate a loan for a relatively safe investment
project offering good security and therefore carrying only modest interest charges and
then use the funds to finance a far riskier investment. Alternatively, management may
arrange further loans, which increase the risks of the initial creditors by undercutting their
asset backing. These actions will once again be to the advantage ot the shareholders and
to the cost of the creditors. It is because of the risk that managers might act in this way
that most loan agreements contain restrictive covenants for protection of the lender, the
costs of these covenants to the firm in terms of constraints upon managers treedom ot
action often being referred to as agency costs.
12

Covenants used by suppliers of debt finance may place restrictions on issuing new debt
with a superior claim on assets, growth of dividends to be linked to earnings, ensure post
merger asset backing of loans is maintained at a minimum prescribed level, and
restriction on investment policy. Contravention of these agreements will usually result in
the loan immediately being callable, thus allowing the debenture holders to restrict the
size of any losses (Smith, 1986).
Tax Exhaustion: A further disincentive to high gearing is that the firm must be in a tax
paying position to obtain the tax shield on debt. At certain level of gearing, companies
will discover that they have no taxable income left against which to offset interest
charges. After this point, firms will experience all the problems of gearing, but none of
the advantages. The level of investment can also affect the point at which tax exhaustion
occurs. This is because capital allowances granted on capital investments will reduce
taxable profits (Foulks, 2004).
Impact of personal taxes: M&M (1963) position includes the effect of corporation taxes
on the capital structure decision, but not the impact o f personal taxes. In 1977, Miller
corrected this omission in his now famous article Debt and Taxes, which was prompted
by the fact that companies do not, in practice, follow a policy of high or even moderate
gearing as proposed by their 1963 theory.
To explain this, Miller (1963) explains that personal taxes must also be considered.
According to Miller (1963), in a world with no taxes and with no market imperfections,
firms would be indifferent between issuing debt or equity. If taxes were to be introduced
to this world, and if personal taxes on equity income are at a zero rate, this would not be
outrageous if all equity income is in the form ol capital gains and these gains are never
realized.
13

On the other hand, if income received on debt investments (mainly the interest
payments) is subject to income tax at normal rates, and corporation tax is assumed to
operate in the normal way (Foulks, 2004), firms would begin to replace equity finance
with debt finance to take advantage of the tax shield. To do this, they would need to
persuade some equity holders to become debt holders so as to purchase the new debt
issues that were replacing equity. Some investors will have no qualms about such a
switch providing the interest rates on debt were commensurate with the risks they were
taking. These would be the investors who were not subject to income taxes (the best
example being pension funds), as they would simply be switching from a tax-free equity
income to a tax-free debt income.
Consider, however, the position o f tax paying investors. They would have to switch from
a tax-free equity income to a taxable debt income. To persuade these people to switch,
firms would have to increase the interest rates on debt to make it worthwhile. Firms could
afford to do this by using some o f the gains they were making from the tax shield on
debt. As more and more debt were issued investors in higher and higher income tax
brackets would have to be persuaded to switch from equity to debt and the costs of
persuading them to switch would rise correspondingly.
Firms could only afford to continue upping the interest rates to persuade these investors
to switch until the gain made on the tax shield exactly equaled the personal tax loss
suffered by investors (Foulks, 2004). After this point, the attraction of issuing further debt
would disappear as the tax shield would be eaten up by the enlarged interest payments
required on debt and firms would therefore issue no more debt. In the context of overall
financial system, an equilibrium ratio of debt to equity would have been reached.
2.4 Theories of Capital Structure.
Several views are taken on the effect of gearing on the weighted average cost of capital.
The two main positions are the traditional view and Modigiliani and Miller theories of
capital structure (Pandey, 2001).
14

2.4.1 Traditional View o f Gearing/ Optimum Debt Level
As an organization introduces debt to its capital structure, the weighted average cost of
capital will fall, because, initially, the benefit of cheap debt finance outweighs any
increases in the cost of equity required to compensate equity holders for higher financial
risk (Andrew and Kim, 1979). As gearing continues to increase, the equity holders will
ask for increasingly higher returns and eventually this increase will start to outweigh the
benefit of cheap debt finance, and the weighted average cost of capital will rise.
At extreme levels of gearing, the cost of debt will also start to rise (as debt holders start to
get worried about the security of their loans) and this will also contribute to an increasing
weighted average cost of capital. The traditional view therefore claims that there is an
optimal capital structure, where weighted average cost of capital is at a minimum
(Barges, 1963).
The use of weighted average cost of capital to appraise the cash flows of investment
projects has been justified in situations where the gearing ratio is not expected to change
in the long run. A difficult situation is encountered if a large investment project is
financed by a major issue of funds, which moves the company to a new level of gearing.
Can the project then be appraised simply by discounting at a WACC and if so which
WACC should be used? (Foulks, 2004). If financial risk were ignored by investors, there
would be no problem because the WACC would be the same at all levels of gearing.
However, this is not probably the case and shareholders are likely to make a gain or loss
made up of two elements that is a gain or loss caused by accepting the project and a gain
or loss caused by the changed gearing.
Following the traditional view, if the company moves towards the optimal level of
gearing, the shareholders will make a gain under the second element, whereas if it moves
away from the optimal level, they will make a loss (Barges 1963).
15

As the traditional view does not follow any prescribed model, it will be difficult to assess
the overall impact of a project and its finance on the shareholders.
2.4.2 The Theories o f Modigiliani and Miller
Modigiliani and Miller (1958) challenged the traditional view of capital structure that
companies which operate in the same type of business and which have similar operating
risks must have the same total value, irrespective of their capital structure. Their view is
based on the belief that the value of a company depends upon the future operating income
generated by its assets. The way in which this income is split between returns to debt
holders and returns to equity should make no difference to the total value of the firm
(equity plus debt). Thus, the total value of the firm will not change with gearing, and
therefore neither will its WACC. The essential point made by M&M (1958) is that a firm
should be indifferent between all capital structures. This is at odds with the beliefs of the
traditionalists.
M&M (1958) support their case by demonstrating that market pressure (arbitrage) will
ensure that two companies identical in every aspect apart from their gearing level will
have the same overall market value. The assumptions o f M&M (1958) model do not go
without critisms. First, market inefficiencies hamper the arbitrage process: Though the
security markets are expected to be efficient in a technical economist sense, they are not
perfect. Dealing costs do exist and will hamper the arbitrage process. However, if the
arbitrage process is viewed as a long-term trend, rather than an immediate response, the
market imperfections become less important. Secondly, personal borrowing is not a
perfect substitute for corporate borrowing. This really breaks down to three distinct
aspects. Companies can often borrow on better terms than individual investors, corporate
borrowing does not expose the investor to personal liability in the way that personal
borrowing does and lastly some institutional investors are prohibited from indulging in
homemade gearing.
16

All ot these issues have some validity. What is not apparent is whether they arc
significant enough to invalidate the M&M view, especially since some investors are
themselves limited liability companies which can, therefore, borrow on equivalent terms
to the investee.
Thirdly, the model assumes that the cost of equity capital actually declines at extreme
leverage. This assumption is necessary to maintain a constant overall cost if it is accepted
that the cost o f debt rises at extreme leverage. The concept of this decline in the cost of
equity is extremely improbable and no evidence has been produced to support such a
view.
Fourthly, the model ignores taxation: This is the case and the effects are sufficiently
important to warrant incorporation separately. In their original model, M&M (1958)
ignored taxation. M&M (1963) amended their model to include corporation tax. This
alteration changes the implication o f their analysis significantly.
Previously, they argued that companies that differ only in their capital structure should
have the same total value of debt plus equity. This was because it was the size of a firm’s
operating earning stream that determines its value, not the way in which it was split
between returns to debt and equity holders. However the corporation tax system carries a
distortion under which returns to debt holders (interest) are tax deductible to the firm,
whereas returns to equity holders are not. M&M (1963) therefore, concluded that geared
companies have an advantage over ungeared companies that is they pay less tax and will,
therefore, have a greater market value and lower WACC.
2.4.3 Pecking Order Theory o f Capital Structure
Modigiliani and Miller (1958) theory is an attempt to explain how companies choose
their capital structure. The standard approach to analyzing capital structure is to start with
the proposition of irrelevance o f capital structure and then to build in the ettects ot
taxation and the risks of bankruptcy from excessive gearing and so on,
17

so that a proposition emerges that a capital structure combination of debt and equity
exists that minimizes the WACC, and so optimizes shareholder wealth ( Pandey, 2001)
According to Foulks (2004), theories of capital structure based on this approach are
known as static trade-off models of capital structure, referring to the idea that the
optimal mix o f debt and equity finance provides a trade- off between the benefits of the
tax shield provided by debt capital and the increasing costs of financial distress to
shareholders from higher gearing. Although the static trade-off theory provides an
excellent theoretical basis for looking at capital structuring decisions by firms, a problem
is that the theory is by no means always applied in practice.
In some industries, the most profitable firms appear to be those with the lowest gearing,
which is the opposite of what the static trade-off model would predict. Moreover, many
firms rarely raise new finance by issuing new equity, suggesting that the choice of new
financing method, equity or debt, is not driven by considerations of optimal capital
structure.
Pecking order theory has been developed to suggest a reason for this observed
inconsistency in practice between the static trade-off model and what companies actually
appear to do. Pecking order theory states that firms have a preferred hierarchy tor
financing decisions. Their main preference is to obtain finance from retained profits
before raising funds externally. Internal funds are cheaper to obtain than external funds,
and there is no requirement for public disclosures of financial information about the firm.
If a firm has to raise funds externally, its preference for financing method in descending
order (i.e. pecking order) is debt followed by convertible securities, followed by
preference shares and lastly equity shares. This motivation might stem from an
inclination o f management to act in the best interest of existing shareholders.
18

Whereas static trade-off model theory suggests that financing decisions will be based on
a target optimal capital structure, pecking order theory suggest that financing decisions
will vary according to the circumstances of the firm at the time. For example, in an
industry with slow growth, profitable firms are likely to build up retained profits and
have no incentive to raise new finance with debt issues. As a result, they are likely to
build financial slack and have low financial gearing. In contrast, a less profitable firm in
the same industry might need to raise funds externally and will do so by borrowing. As a
result, their gearing ratio will be higher. Pecking order theory has its limitations. It does
not explain the influence on capital structuring of taxation, security issue costs, financial
distress and so on. Nor does it properly consider whether there is an ideal capital structure
that a firm should target. As a result, pecking order theory is often presented as
complement to static trade-off model rather than an alternative stand-alone theory.
2.4.4 Behavioural Theory o f Capital Structure.
This is yet another theory of how firms make their capital structure decisions. As the
name suggests, this theory is based on the proposition that capital structure decisions are
made for psychological reasons, not necessarily connected to logical decision-making
(Patel etal, 1991).
Patel, Zeckhauser and Hendricks, (1991) in their Herd Migration theory found that in 7
out of 10 industries studied, more than 15% of firms changed their capital structure “with
the herd” (they followed what other firms in the industry were doing). Patel et al (1991)
suggested, “financial players also may migrate in herds, as when firms increase their
debt-equity and banks increase their Third World debt holdings.” Firms must balance the
benefits of seeking an optimal capital structure against the cost or risk of getting too far
out of line with other firms in the industry. One example of the danger of getting out of
line with the herd is the occasional tendency of banks to refuse to lend to firms whose
debt/equity ratio is higher than the industry average.
19

Another behavioral theory of capital structure is ‘follow my leader’, ( Foulks, 2004). This
theory suggests that instead of spending a lot of time trying to work out an optimal capital
structure using a static trade-off model, some firms might simply look at how the leading
firm or firms in the market are structured and try to copy their capital structure. The
assumption is that what is good for the market leader is presumably just as good for the
other firms in the industry. However, this assumption is invalid. What is best for the
market leader is not necessarily best for every other firm. A firm acting rationally should
therefore not adopt a follow-my-leader approach to capital structuring decisions.
2.5 Indicators of Company Size
Among the variables that are used to determine the size of companies (Delbreil, 1993)
include;
Market capitalization (a product of market price per share and number of issued
outstanding shares). Big firms have many issued shares and are likely to enjoy favorable
pricing at the stock exchange. Small firms generally have fewer shares and hence their
capitalization is less than large firms.
Share capital: Companies with large number of issued shares derive huge amount ot
share capital from the issued shares and are therefore able to acquire many assets and
finance big projects. Asset base is yet another factor, since firms with huge assets are able
to support big businesses and are therefore big firms.
Number of employees: A large number of employees are an indicator of a firm having
many branches or large operations in a central place, and hence a large firm. Most firms
with huge asset base tend to have many employees. Where technology performs some ot
the tasks traditionally carried out by employees, a large firm may however have relatively
few employees.
20

Turnover: This is the total sales of a firm in a given year. Bigger firms tend to sell more
than small firms. In this regard, it can generally be deduced that firms with high turnover
are big firms while firms with small turnover are small firms.
2.6 Relationship Between Debt and Company Size
On the basis o f a sample of listed companies in the G7 countries, Rajan and Zingales
(1995) studied capital structure of companies in 1991 using accounting and market
indicators. Overall, the aggregate level of debt was found to be similar between countries,
with the excemption of Germany and the United Kingdom, where it would appear to be
lower. This conclusion tallies in part with that of the Bundesbank (1994), which shows
that once the main differences in method have been resolved, the net equity of Germany,
Italian, French and Spanish companies, on the basis o f aggregate data, is similar. The
author places considerable emphasis on the existence of bias attributable to differences in
accounting practices, data collection, and statistical methods used to process the data and
choice of indicators. These various difficulties may explain why Remonola (1990),
working in the period 1982-1987, or Borio (1987), using aggregate accounting data and
with the help of figures for liability-to-asset gearing, find a higher level of debt in France
than that observed in Germany, but Kneeshaw (1995), comparing 1982 and 1992, finds
the reverse on the basis of creditors-to-asset ratios, equity gearing and financial creditors-
to -GDP ratios. The choice of data and indicators is also decisive for the assessment ot
the impact of corporate size on the level of debt. Rajan and Zingales (1995) find that debt
increases with size, except in Germany. They explain their result by the tact that the
bigger the company, the more it can diversify, thereby reducing the likelihood of its
finding itself in difficulty (the probability of bankruptcy being smaller, it can take on
more debt).
The explanation seems a pertinent one for listed companies whose investment choices are
directed at maximization of the value ot the firm. They can benefit all the more from
higher gearing as their assets portfolio allows them to cover their commitments.
21

On the other hand, it both listed and unlisted companies are considered, the inverse
relationship found between size and gearing in other studies (Bundesbank, 1992;
Paranque, 1994a - 1994b; Cieply and Paranque, 1996) tends to indicate different
financing parameters. Germany's negative relationship between size and debt is not
explained by Rajan and Zingales (1995).
They are however consistent with the analyses of the Bundesbank (1992), which show
that a negative correlation does exist between size and the level of debt. The main results
obtained by Rajan and Zingales (1995) based on the ratio between liabilities and net
equity/assets, found out that Germany is the country with the highest debt, followed by
France and Italy (with medians of 0.73 and 0.71 respectively in 1991). For the ratio
between creditors and assets, Germany and the United Kingdom have the lowest level of
debt, with pension provisions not being included under Creditors.
As for the ratio between creditors and net assets, Japan, Canada, Italy and France
have the highest level of debt (where net assets = assets - advances and payments on
account - other creditors).
Finally, taking the ratio between creditors and creditors and net equity, the United
Kingdom has the least debt, closely followed by Germany and the United States, whilst
France, Italy and Japan have the highest levels of debt. (Delbreil et al 1993).
Studies on capital structure undertaken in Kenya have had mixed results. Mbogo (1983)
did a research for the period 1972-1981 and found that public companies in Kenya were
highly geared during that period. Kamere (1987) covered the period 1981-1985 to
identify the factors that the management of quoted companies in Kenya consider in
making their capital structure decisions. His study found that many factors might
influence the capital structure of a firm. Among the most important were the stability of
future cash flows, the level of interest rates in the economy, the asset structure of a firm,
the need for outside capital, lenders attitude towards a firm and the attitude of
management towards risk.
22

Analysis of the capital structure revealed that a firm *s use of debt and its age, size
(measured by use of average book value), and amount of fixed assets were positively
correlated, but the correlation co-efficient was rather low. Omondi (1996), covered the
period 1987-1994 and came with findings that interest rates, growth in turnover, size
(measured using turnover) and age are not significantly correlated with capital structure
at all, whether sectoral or combined. Onsumu (2003) found out that there is no significant
relationship between debt and value of firms in Kenya for the period 1993-2001.
23

CHAPTER THREE
RESEARCH METHODOLOGY
3.1 Research Design
The research design was a survey.
3.2 Population
The population of the study constituted all companies quoted at the Nairobi Stock
Exchange as at 31s1 December 2004 excluding those in finance and investment sector. A
census was undertaken, thus no sampling was required.
3.3 Data Collection
Data necessary to conduct the research was collected from annual accounts of public
companies from Nairobi Stock Exchange, Capital Markets Authority and Registrar of
Companies. The data collected included market capitalization, total long term debt
including preference shares, total equity, total shareholder funds and total turnover of all
companies listed at the stock exchange for the entire period under research. The
companies of interest were those quoted at the Nairobi Stock Exchange during the period
1998-2004.
3.4 Data Analysis
The data collected was coded on computer sheets and applied to excel to aid in analysis.
The analysis comprised ratios, percentages, averages, and plotting of trends.
24

For each of the firms in the sample, the following ratios were computed; debt/equity
ratio, debt /asset ratio, percentage of long-term debt to total capital. Company size was
measured based on market capitalization of listed firms and classified into small, medium
and large companies as classified by Oluoch (2004). Further analysis was done on
gearing and company size, whereupon size was measured based on company net assets
and turnover. An analysis for each firm was undertaken, then aggregated to obtain the
industry variables. A comparative analysis was then undertaken to identify differences
between gearing levels and company size across industries. The statistics for each firm
were used to compute industry averages of ratios and percentages for the entire period.
A trend analysis for each of the industries for the entire period was then performed and
subsequently a trend analysis for all the companies for the entire period. The results were
also subjected to regression analysis using the equation
y = a + bx
Where
a and b are constants,
y is the gearing level
x is the company size
Each measure of debt was regressed against company size after which the aggregate debt
measures was regressed against size in terms of small, medium and large giving rise to
three equations.
Correlation co-efficient (r) and co-efficient of determination (r2) were obtained, which
determined the strength of the relationship.
25

CHAPTER FOUR
DATA ANALYSIS, FINDINGS AND DISCUSSIONS
4.1 Company Ranking
Discussions and conclusions were based on data for 35 companies representing 64% of
quoted companies. Companies in the financial sector were all omitted since their capital
structure have a huge amount of debt as a result of huge deposit liabilities of financial
institutions.
The size of firms in the study was determined using market capitalization, net assets and
turnover. Firms were ranked according to their size determined by the above factors.
Three different rankings were therefore obtained for the entire period. The rankings were
thereafter divided into three sizes of large, medium and small size firms for the entire
period. Gearing of each of the firms was determined and aggregated with the rest in the
similar size and their average computed. Average gearing levels for each size ot the firms
for the entire period was plotted in graphs.
A similar analysis was applied to the sectorial data. The sectors covered were Alternative
Investment Markets (AIMS), Agriculture, Commercial and Services and Industrial and
Allied.
26

4.2 Market Analysis
4.2.1 Gearing Levels Based on Market Capitalization
Table 1: Gearing (in %) Based on Market Capitalization
L A R G E M E D IU M S M A L L
G E A R IN G 2 0 0 4 2 3 .8 1 6 3 6 7 1 2 16.23821768 2 1 .5 9 1 3 7 1 6 5
G E A R IN G 2 0 0 3 2 1 .2 2 2 9 7 1 5 8 2 1 .10337469 3 0 .4 1 6 2 2 5 9 6
G E A R IN G 2 0 0 2 2 2 .5 4 9 6 1 7 9 5 21 .27531532 2 4 .7 2 8 4 1 3 2
G E A R IN G 2001 2 4 .6 1 1 5 4 1 6 6 18.40933992 4 5 .9 6 0 1 7 1 7
G E A R IN G 2 0 0 0 20 .17097751 19.17231142 5 4 .4 8 3 1 5 5 7 6
G E A R IN G 1999 16 .26100002 11.88630299 3 3 .3 7 5 1 5 9 7 7
G E A R IN G 1998 8 .3 4 1 1 2 5 4 0 9 9 .917006147 12 .5 9 6 2 9 9 0 2
Source: Research data
Chart 1: Gearing Based on Market Capitalization
Source: Research data
Small companies registered higher gearing levels, followed by large companies and lastly
medium size companies.
27

Large companies were the most geared in the year 2004. The possible explanation to the
above scenario is that small companies quoted at the Nairobi Stock Exchange do not
make as much profits as large companies. They thus, do not have the advantage of
financing their operations from retained earnings, but rely extensively on debt.
4.2.2 Gearing Levels Based on Net Assets
Table 2: Gearing (in %) Based on Net Assets
Y E A R L A R G E M E D IU M S M A L L
G E A R IN G 2004 2 5 .1 9 6 3 6 7 4 3 1 7 .17408609 2 0 .56203793
G E A R IN G 2003 3 0 .4 4 5 9 6 3 9 5 1 7 .41544939 2 5 .4 7 4 2 1 9 7 8
G E A R IN G 2002 2 9 .1 3 0 3 2 1 5 7 14 .68369393 2 4 .6 9 3 4 1 8 1 6
G E A R IN G 2001 3 1 .3 7 5 0 7 1 9 1 1 0 .30153236 4 4 .1 3 0 1 1 1 6 2
G E A R IN G 20 0 0 2 7 .5 2 6 3 9 9 0 9 11 .46762238 50 .77967608
G E A R IN G 1999 2 3 .1 6 9 2 8 6 6 2 17 .246055 20 .5029652
G E A R IN G 1998 12 .6 2 7 8 2 8 0 4 5 .7 1 3 1 3 6 3 3 4 11 .35511063
Source: Research data
Chart 2: Gearing Based on Net Assets
Source: Research data
28

Small companies registered higher gearing levels upto the year 2002, followed by large
companies and lastly medium size companies. Large companies recorded the highest
gearing level as from the year 2003. Most small companies have their assets financed by
creditors and report relatively lower profits than large companies, explaining the
relatively high gearing levels because they are not able to retain earnings to finance their
activities.
4.2.3 Gearing Levels Based on Turnover
Table 3: Gearing (in %) Based on Turnover
V A R IA B L E Y E A R L A R G E M E D IU M S M A L L
G E A R IN G 1998 18.42358301 18.4605503 20 .2871393
G E A R IN G 1999 2 4 .9 0 3 3 5 2 2 6 24 .11265931 20 .990 5 8 6 3 8
G E A R IN G 2000 2 2 .7 9 2 7 9 9 1 4 2 4 .3 3 0 2 0 4 4 7 16 .23926279
G E A R IN G 2001 2 4 .9 3 5 2 7 9 9 5 18 .00220587 19 .60704107
G E A R IN G 2002 2 0 .7 8 0 2 1 2 9 5 2 1 .2 8 9 4 4 6 2 7 16 .91996477
G E A R IN G 2003 13 .96876943 15 .28163834 14.82858498
G E A R IN G 2004 6 .5 5 5 1 0 6 9 3 5 6 .3 5 5 7 6 3 1 9 4 .7 6 3 6 7 9 8 6 6
Source: Research data
Chart 3: Gearing Based on Turnover
------LARGE------MEDIUM
SMALL
Source: Research data
29

Large and medium companies registered higher gearing followed by small companies.
Large companies emerged the most geared in the year 2004. This scenario could be
explained by relatively high turnover for large companies financed using borrowed funds.
Notwithstanding the above findings, and as mentioned elsewhere, it is imperative to note
that large firms registered the highest gearing levels in 2004 irrespective of determinant
of size. It is also worthwhile to consider that lending interest rates in the Kenyan
economy have been erratic and comparatively high for a long period, and have only
stabilized at a lower level after the new government took over the management of public
resources in the year 2002.
4.3 Industry Analysis
4.3.1. Commercial and Services Sector.
4.3.1.1 Gearing Levels Based on Market Capitalization
Table 4: Gearing (in %) Based on Market Capitalization
V A R IA B L E /E A R L A R G E M E D IU M S M A L L
G E A R IN G . 1998 23 .1229 5.88913 9 .7 3 0 8 5 2
G E A R IN G . 1999 26.1493 4 .41587 6 .3 2 1 6 3 7
G E A R IN G . 20 0 0 52 .4203 14.5015 1 4 .30355
G E A R IN G . 2001 28 .7056 11.1474 10 .9324
G E A R IN G . 2002 26.254 0 6 .1 9 7 9 0 5
G E A R IN G . 2003 29.068 14.1252 3 .2 9 9 3 4 8
G E A R IN G . 2 0 0 4 30.9551 14.0811 3 .5 5 4 9 0 7
Source: Research data
30

Chart 4: Gearing Based on Market Capitalization
Source: Research data
Large firms registered the highest gearing, followed by medium firms and lastly small
firms. The gearing levels of the large firms were as high as 52%. The implication is that
large companies in this sector mainly finance their activities using debt. The gearing
levels followed the same pattern over the study period, being lowest in 2002, period when
there was a negative economic growth, and hence most companies had minimal activities,
forcing them to reduce the appetite for debt. The gearing increased from 2002 to 2004
possibly explained by lower interest rates during this period, which may have encouraged
firms to borrow.
31

4.3.1.2 Gearing Levels Based on Net Assets
Table 5: Gearing (in %) Based on Net Assets
V A R IA B L E Y E A R L A R G E M E D IU M S M A L L
G E A R IN G . 1998 2 3 .1 2 2 9 4 .0 4 8 5 5 .7513
G E A R IN G . 1999 2 4 .2 2 1 5 4 .1 3 5 7 4 .2 1 4 4
G E A R IN G . 2000 3 6 .2 6 3 9 7 .2507 7.6011
G E A R IN G . 2001 3 2 .9 1 2 5 2 .5919 6 .4 7 1 5
G E A R IN G . 2002 3 0 .3 9 8 8 1.2605 2 .7 6 9 9
G E A R IN G . 2003 2 9 .0 6 8 7 .0626 3 .2993
G E A R IN G . 2004 3 7 .8 1 0 8 0 .1848 28 .7 3 8 3
Source: Research data
Chart 5: Gearing Based on Net Assets
Source: Research data
Large firms registered higher gearing followed by medium and small firms. Small firms
become more geared than the medium firms in the year 2004. This implies that large
firms in this sector use credit facilities to finance their activities.
32

Gearing was highest in the year 2004 indicating that their activities were highest in that
year possibly as the economy was gaining momentum and hence there was the highest
demand for goods and services.
4.3.1.3 Gearing Levels Based on Turnover
Table 6: Gearing (in %) Based on Turnover
V A R IA B L E Y E A R L A R G E M E D IU M S M A L L
G E A R IN G 1998 16 .2114 9 .8 5 5 9 7 9 .7 3 0 8 5 2
G E A R IN G 1999 44 .0 2 7 1 6 .34 3 6 8 6 .3 2 1 6 3 7
G E A R IN G 2000 5 2 .4 2 0 3 17.3045 11.4016
G E A R IN G 2001 5 2 .2 2 7 4 9 .39 0 7 6 9 .7 0 7 2 9 6
G E A R IN G 2002 2 5 .2 5 6 8 6 .66585 3 .8 9 1 5 0 8
G E A R IN G 2003 2 8 .4 6 8 7 .66257 3 .2 9 9 3 4 8
G E A R IN G 2004 7 0 .3 2 2 8 7 .22537 3 .5 5 4 9 0 7
Source: Research data
Chart 6: Gearing Based on Turnover
Source: Research data
33

Large firms had higher gearing, followed by medium firms and lastly small firms. This
implies that large firms require more credit facilities to finance their comparatively higher
sales. Gearing was highest in the year 2004 indicating that their activities were highest in
that year possibly as the economy was gaining momentum and hence there was the
highest demand for goods and services.
4.3. 2 Industrial and Allied Sector
4.3.2.1 Gearing Levels Based on Market Capitalization
Table 7: Gearing Based on Market Capitalization
V A R IA B L E Y E A R L A R G E M E D IU M SM A L L
G E A R IN G . 1998 3 .5 8 2 8 5 13.864 5.86859
G E A R IN G . 1999 11 .7 3 0 8 24.447 23 .3348
G E A R IN G . 2000 2 1 .4 5 3 8 18.592 5.54451
G E A R IN G . 2001 3 1 .1 1 5 3 18.481 7 .15864
G E A R IN G . 2002 9 .8 4 2 9 39.433 1 1.5966
G E A R IN G . 2003 2 1 .1 5 9 6 27.623 11.9769
G E A R IN G . 2004 13 .6 1 6 2 23.013 9 .11836
Source: Research data
34

Chart 7: Gearing Based on Market Capitalization
{*W h& 5ijy nrNAim*-mkJC^ U 3 ^ l
Source: Research data
All the firms had comparatively mixed gearing levels. However, in the year 2004,
medium firms were the most geared followed by large firms and lastly small firms. This
implies that medium size firms had higher activities from the year 2002 and had to
increase their borrowing so as to attain optimum operating level.
43.2.2 Gearing Levels Based on Net assets
Table 8: Gearing (in %) Based on Net Assets
V A R IA B L E Y E A R L A R G E M E D IU M s m a l l !
G E A R IN G . 1998 17 .1008 1.7066 5.6813
G E A R IN G . 1999 2 9 .1 1 0 8 6.32 28 .7493
G E A R IN G . 2 0 0 0 3 5 .7 8 6 5 4 .259 4.7681
G E A R IN G . 2001 4 2 .9 4 6 6 .6724 7.14
G E A R IN G . 20 0 2 4 2 .1 4 7 7 7 .0634 11.6508
G E A R IN G . 2003 4 3 .0 4 6 7 7.084 10.8536
G E A R IN G . 200 4 30 .4 4 2 1 6 .7096 6 .6833
Source: Research data
35

Chart 8: Gearing Based on Net Assets
Source: Research data
Generally, large firms had higher gearing followed by small firms and lastly medium
firms. However, medium firms had higher gearing than small firms in the year 2004.
Large firms may possibly have been financing their assets using credit facilities
throughout the entire period of study.
4.3.23 Gearing Levels Based on Turnover
Table 9: Gearing (in %) Based on Turnover
V A R IA B L E Y E A R L A R G E M E D IU M SM A LLjl
G E A R IN G 1998 3 .2 7 3 7 2 0 .5 61
G E A R IN G 1999 11 .9184 4 8 .5 7 4 1 .30395
G E A R IN G 2000 17.8201 22 .8 1 2 2 .5 0 3 1 A
G E A R IN G 2001 2 2 .9 6 8 7 2 4 .3 2 7 6 .2 9 6 4 9
G E A R IN G 2002 2 2 .6 4 3 7 2 5 .4 3 9 10 .5802
G E A R IN G 2003 23 .7471 2 6 .4 9 7 8 .1 6 1 5 3
G E A R IN G 2004 12 .6542 26.811 5 .5 7 5 9 5
Source: Research data
36

Chart 9: Gearing Based on Turnover
Source: Research data
Medium firms had higher gearing, followed by large companies and lastly small
companies during the entire period. This phenomenon may be attributable to the fact that
the medium size firms comprised companies that had the highest sales, which had to be
financed using debt.
37

4.3.3 Agricultural Sector
4.3.3.1 Gearing Levels Based on Market Capitalization
Table 10: Gearing (in %) Based on Market Capitalization
V A R IA B L E Y E A R L A R G E M E D IU M S M A L L
G E A R IN G 1998 3 .6 1 4 4 2 6 .01 1 2 2 0 .4 2 8 8 5 6
G E A R IN G 1999 15.5741 10.2546 5 .4 0 2 7 7 3
G E A R IN G 2000 13 .4725 21 .8526 15 .54689
G E A R IN G 2001 23 .3871 11.4223 2 5 .1 0 3 1 7
G E A R IN G 2002 15 .437 32.3381 2 7 .0 4 9 6
G E A R IN G 2003 18 .4719 26.2721 3 2 .5 0 7 0 4
G E A R IN G 2004 3 2 .3 1 5 6 19.1951 2 6 .0 9 0 0 8
Source: Research data
Chart 10: Gearing Based on Capitalization
Source: Research data
38

All the firms had erratic gearing structure. Large firms emerged the most geared in the
year 2004 as the economy was picking up and interest rates were low and stable,
hence conducive for the large firms to operate at a higher optimum level, which called for
increased use of debt.
4.3.3.2 Gearing Levels Based on Net Assets
Tablel 1: Gearing (in %) Based on Net Assets
V A R IA B L E Y E A R L A R G E M E D IU M S M A L L
G E A R IN G . 1998 6 .40713 3.21851 0 .4 2 8 8 5 6
G E A R IN G . 1999 22 .9 9 9 3 2.82943 5 .4 0 2 7 7 3
G E A R IN G . 2000 2 1 .3 3 5 7 13.9894 1 5 .54689
G E A R IN G . 2001 23 .0 6 4 3 11.7452 2 5 .1 0 3 1 7
G E A R IN G . 2002 2 4 .0 3 9 7 23 .2279 2 7 .5 5 7 1 7
G E A R IN G . 2003 2 4 .4 6 1 9 25 .5987 2 7 .1 9 0 3 9
G E A R IN G . 2004 2 0 .8 2 9 7 30.681 1 2 6 .0 9 0 0 8
Source: Research data
Chart 11: Gearing Based on Net Assets
Source research data
39

All the firms had erratic gearing structure. However, large firms were the most geared in
1998 while medium firms were the most geared in the year 2004. The medium firms
increased their assets possibly through increased use of debt in the year 2004.
4.3.3.3 Gearing Levels Based on Turnover
Table 12: Gearing (in %) Based on Turnover
V A R IA B L E Y E A R L A R G E M E D IU M S M A L L
G E A R IN G . 1998 6 .40 7 1 3 3.21851 0 .4 2 8 8 5 6
G E A R IN G . 1999 22 .9 9 9 3 2 .82943 5 .4 0 2 7 7 3
G E A R IN G . 2000 2 1 .3 3 5 7 13.9894 15.54689
G E A R IN G . 2001 23 .3871 11.4223 2 5 .1 0 3 1 7
G E A R IN G . 2002 3 2 .7 4 8 5 14.519 2 7 .5 5 7 1 7
G E A R IN G . 2003 3 2 .8 4 2 2 17.2185 27 .1 9 0 3 9
G E A R IN G . 2004 3 2 .3 1 5 6 20 .7686 24 .5 1 6 5 9
Source: Research data
Chart 12: Gearing Based on Turnover
Source: Research data
40

Large firms had higher gearing, followed by medium firms and lastly small firms. The
large firms in this sector may have used more borrowed funds to finance their higher
turnover as compared to the other small and medium size firms.
4.3.4 Alternative Investment Markets (AIMS)
4.3.4.1 Gearing Levels Based on Market Capitalization
Table 13: Gearing (in %) Based on Capitalization
V A R IA B L E Y E A R L A R G E M E D IU M SM A LL]
G E A R IN G . 1998 0 15.502 49 .2505
G E A R IN G . 1999 0 67 .8484 52.7218
G E A R IN G . 2000 2 1 .1 8 2 2 176.027 109.493
G E A R IN G . 2001 2 1 .5 1 5 176.168 42 .6426
G E A R IN G . 2002 2 2 .7 7 5 9 4 59 .5487 22 .4114
G E A R IN G . 2003 2 8 .6 0 7 4 9 43 .9334 52 .0956
G E A R IN G . 2004 2 9 .3 1 3 7 4 12.9843 53.0563
Source: Research data
Chart 13: Gearing Based on Capitalization
Source: Research data
41

Generally, medium size firms had higher gearing, followed by small firms and lastly
large firms. Small firms emerged with the highest gearing in the year 2004. The small
firms appear to have started increasing their gearing as from the year 2003 to take
advantage of low and stable interest rates.
4.3.4.2 Gearing Levels Based on Met Assets
Table 14: Gearing (in %) Based on Net Assets
V A R IA B L E Y E A R L A R G E M E D IU M S M A L L
G E A R IN G . 1998 1.008471 15.502 4 8 .2 4 2
G E A R IN G . 1999 0 .23 6 0 1 4 6.88345 113.451
G E A R IN G . 2 0 0 0 11.94677 16.0513 2 7 8 .7 0 4
G E A R IN G . 2001 12.3098 22 .6388 2 0 5 .3 7 7
G E A R IN G . 200 2 13.54405 27 .9686 6 3 .2 2 3 3
G E A R IN G . 2003 20 .1807 22 .397 8 2 .0 5 8 8
G E A R IN G . 20 0 4 2 9 .3 1 3 7 4 10.2091 5 5 .8 3 1 5
Source: Research data
Chart 14: Gearing Based on Net Assets
Source: Research data
42

Small firms had higher gearing followed by medium and small size firms for most of the
period under study. However, Large size firms were more geared than medium size firms
in the year 2004. The small size firms possibly continued making less profits, which
could not be sufficient to finance their assets and hence had to resort to consistently
operating at a higher debt level.
4.3.4.3 Gearing Levels Based on Turnover
Table 15: Gearing (in %) Based on Turnover
V A R IA B L E Y E A R L A R G E M E D IU M S M A L L
G E A R IN G 1998 15.50195 1.00847 4 8 .2 4 2
G E A R IN G 1999 6 7 .8 4 8 4 0.23601 5 2 .4 8 5 8
G E A R IN G 200 0 176.0271 11.9468 118.728
G E A R IN G 2001 176 .1684 12.3098 5 1 .8 4 7 8
G E A R IN G 2002 4 1 .1 4 8 0 9 13.544 5 0 .0 4 3 9
G E A R IN G 2003 60.52241 20 .1807 4 3 .9 3 3 4
G E A R IN G 200 4 2 0 .1 1 5 1 5 19.4077 5 5 .8 3 15||
Source: Research data
43

Chart 15: Gearing Based on Turnover
Source: Research data
Large size firms had higher gearing, followed by small firms and lastly medium firms for
most of the period under study. Small size firms emerged the most geared in the year
2004. The large firms operated at higher sales level for most of the period under study
and were therefore compelled to acquire more credit facilities to support their operating
level.
4.4 Regression Analysis.
The average gearing levels and average size were regressed for the entire period of study.
The first regression was between gearing of all firms as classified into large size firms,
medium size firms and lastly small size firms and their respective gearing. The next set ot
regression was at industrial level. The following tables indicate the co-efficient ot
determination (r2) obtained from the regression analysis, which are changes in size, that
determine changes in gearing levels of firms in their respective sizes. The error term (the
change in gearing that is not attributable to the change in size) for each regression
analysis are attached at the appendix.
44
4.4.1.Regression Analysis for the iMarket
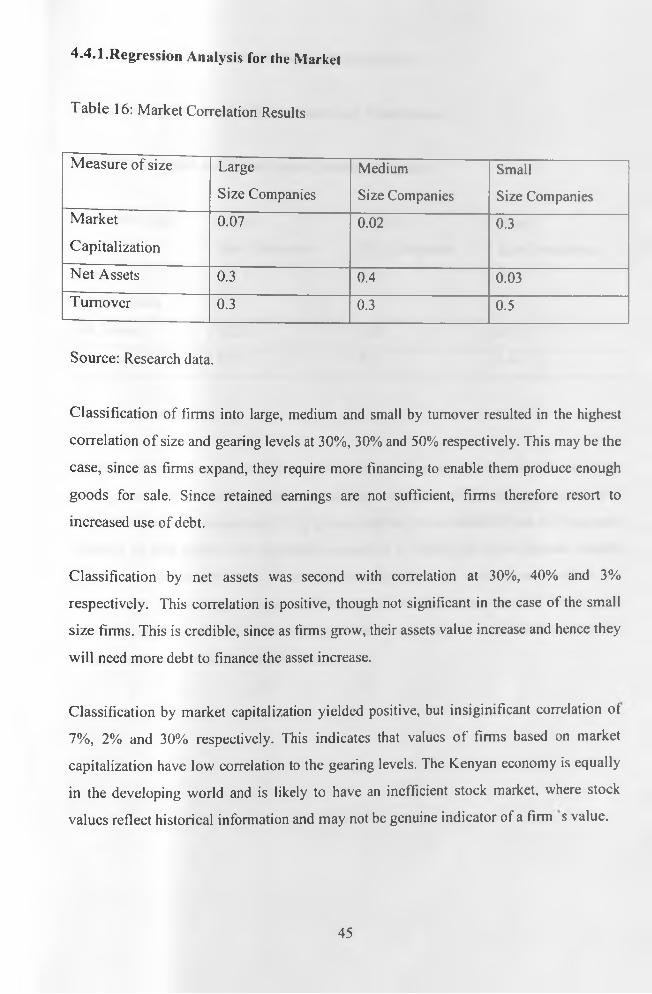
Table 16: Market Correlation Results
Measure of size Large Medium Small
Size Companies Size Companies Size CompaniesMarket 0.07 0.02 0.3Capitalization
Net Assets 0.3 0.4 0.03
Turnover 0.3 0.3 0.5
Source: Research data.
Classification of firms into large, medium and small by turnover resulted in the highest
correlation o f size and gearing levels at 30%, 30% and 50% respectively. This may be the
case, since as firms expand, they require more financing to enable them produce enough
goods for sale. Since retained earnings are not sufficient, firms therefore resort to
increased use of debt.
Classification by net assets was second with correlation at 30%, 40% and 3%
respectively. This correlation is positive, though not significant in the case of the small
size firms. This is credible, since as firms grow, their assets value increase and hence they
will need more debt to finance the asset increase.
Classification by market capitalization yielded positive, but insiginificant correlation ot
7%, 2% and 30% respectively. This indicates that values o f firms based on market
capitalization have low correlation to the gearing levels. The Kenyan economy is equally
in the developing world and is likely to have an inefficient stock market, where stock
values reflect historical information and may not be genuine indicator of a firm s value.
45

4.4.2.1 Regression Analysis for Industrial and Allied Sector.
Table 17: Industrial and Allied Sector Correlation Results
4.4.2 Regression Results for Industry Classification
Measure of size Large Medium Small
Size Companies Size Companies Size Companies
Market 0.0 0.03 0.03
Capitalization
Net Assets 0.22 0.55 0.11Turnover 0.05 0.1 0.64
Source: Research data.
Classification of firms into large, medium and small size in the industrial and allied
sector, based on net assets resulted in the highest correlation of size and gearing levels of
22%, 55% and 11% respectively. This gives credence to the reasoning that as firms asset
increase, its debt-equity ratio increases to enable it to finance the asset increase. Results
from the classification based on market capitalization and turnover are positive but
insignificant. The findings may equally be inconclusive since there were 15 firms in this
sector. A larger number of firms in the same sector operating in an efficient market will
give more accurate and credible findings.
46

4.4.2.2 Regression Analysis for Commercial and Services Sector.
Table 18: Commercial and Services Sector Regression Results
M easure of size Large Medium Small
Size Companies Size Companies Size Companies
M arket 0.06 0.09 0.01
Capitalization
N et Assets 0.64 0.05 0.42
T umover 0.13 0.13 0.05
Source: Research data.
Classification of firms into large, medium and small based on net assets and turnover
resulted in positive and slightly significant results of 64%, 5% and 42% and 13 o, 13 <>
and 5% respectively. This findings are slightly similar to those ot Industrial and allied
sector. However, this sector had even fewer firms. There were only 7 firms and hence the
findings may not be representative of the industry had there been a larger number of
firms.
47

CHAPTER FIVE
SUMMARY OF THE FINDINGS AND CONCLUSIONS,
RECOMMENDATIONS, LIMITATION OF STUDY AND SUGGESTION FOR
FURTHER RESEARCH.
5.1 Summary of Findings and Conclusions
5.1.1 Summary o f Findings
5.1.1.1 Graphical Analysis
At market analysis, and using market capitalization to represent size, small firms were the
m ost geared followed by large companies and lastly medium size companies. Large
companies emerged the most geared in the year 2004. This could be attributed to the fact
that small size companies quoted at the stock exchange did not make as much profits as
large companies and hence did not have retained earnings to finance their operations and
therefore had to opt for use of more debt. When analyzed using net assets as a measure of
size, small firms registered the highest gearing, followed by large firms and lastly
medium size firms. This can be attributed to the fact that small companies have their
assets financed by creditors and report relatively lower profits than large firms and have
to resort to use of more debt to finance their activities. Lastly, when analyzed using
turnover as a measure of size, large and medium size firms registered higher gearing
followed by small companies. This phenomenon is the case as large and medium
companies generally have higher turnover than small companies. The relatively higher
turnover calls for more financing using debt.
At industry analysis, commercial and services sector had large firms as the most geared
followed by medium firms and lastly small firms irrespective of the factor of measure of
size. This implies that large firms in this sector finance their activities using debt.
48

T h e gearing levels increased from 2002 to 2004 possibly due to lower interest rates
during this period. Industrial and allied sector had large firms and medium firms being
the m ost geared when size was determined by net assets and turnover respectively. This
im plies that the large and medium size firms required external financing to support their
net assets and sales respectively. Gearing based on market capitalization for this industry
had mixed gearing levels for the entire period of study.
Agricultural sector had large firms as the most geared when turnover is used to measure
size. This implies that the large firms in this sector required more debt so as to finance
their comparatively higher sales than the medium and small size firms. Gearing
consistently increased for all the sizes from the year 2002 and was highest in the year
2004 possibly due to the lower and stable interest rates during this period. Gearing based
on market capitalization and net assets as a measure of size was erratic during the entire
period of study.
Alternative Investment Markets (AIMS) had mixed results during the entire period. I he
firms are relatively small in size compared to the other sectors and its gearing was
distorted by Kenya Orchards which had gearing as high as 219% in the year 2000 and
The standard Group with a gearing as high as 338% in the year 2000.The standard Group
posted losses of 120 million and 126 million in 1999 and 2000 respectively, which led to
the firm having negative shareholders funds and reserves from 1999 through 2002.
As mentioned elsewhere, large firms emerged the most geared in the year 2004. This can
be attributed to the fact that the performance of the economy during the period under
study was mostly dismal coupled with high interest rates. However, after the political
change in the year 2002, the economy started recording positive growth while the interest
rates reduced and stabilized. This therefore created demand for goods and services, which
compelled large firms to acquire more financing in form of debt to enable them operate at
a higher capacity so as to meet the new demand.
49

T he findings of this study indicate that there is a positive correlation between company
size and gearing levels. However, the correlation is variable and erratic depending on the
nature o f classification. When all firms are classified broadly into large, medium and
sm all, using net assets and turnover as a measure of size, the correlation is slightly
significant. When classified based on market capitalization, the correlation is positive, but
insignificant.
W hen the firms are classified into their respective industries, there is no significant
correlation between gearing and company size irrespective of the parameters of company
size.
5.1.2. Conclusions
The foregoing analysis depicts that there is no clear and authoritative trend(s) between
gearing levels and company size. This is attributable to the fact that the period under
study had two different economic and political environments, with the former having
high interest rates and almost stagnant economy while the later had low interest rates and
a growing economy. Assuming the current economic environment of stable interest rates
is sustained, a subsequent similar study in the future may lead to authoritative trend (s).
The findings of regression analysis indicate that capitalization is positively but
insignificantly correlated to gearing. This can be attributed to the fact that the Nairobi
Stock Exchange operates in the developing economies were the stock market is
inefficient, and as such, values assigned to stocks reflect historical information which
may be completely different from the current state of affairs.
Net assets are positively correlated to gearing, whether based on broad classification or
industry classification.
5.1.1.2 Regression Analysis
50

"This is logical since firms tend to incur long-term financial obligations using assets as
security . This is in the affirmative with the findings of Omondi (1996) and Kamere (1987).
T urnover is positively correlated with gearing at broad classification of assets into large,
m edium and small, with co-efficient of determination being at 30%, 30% and 50%
respectively. However, at industrial classification, the correlation is insignificant.
5.2 Limitation of the Study.
T he first limitation relates to the level of interest rate regimes. The period under study
covers two periods of interest rate levels. The period up to 2002 had high interest rates,
w here commercial banks base rates were at over 20% while the period after the year 2002
had as low base rates as 8%. This therefore implies that the capital structure as well as the
term o f long-term debt for firms for the two periods is different.
The industry classification had uneven number of firms. For instance, agricultural sector
had 6 companies whereas industrial and allied had 12 companies and hence the sectoral
analysis was not balanced.
The period under study may not have been fully representative. A longer period may
have given more fair findings. Unfortunately, Kenya being a third world country, there
has been several political and economic restructuring over the last 15 years. Moreover,
the stock exchange has just been automated and hence only information relating to recent
years is available.
Lastly, there is a lot o f difficulty in getting accurate classification of debt in the Kenyan
firms. This led to classification of all non-current liabilities into long-term financial
obligations.
51

T h e importance o f accurate and timely financial information will continue to be of
param ount importance as far as research, planning and trading at both the money market
and capital market is concerned.
Efficient operations at the said markets will ensure that firms will access adequate and
affordable capital to finance their daily operations as well as expansion. The government
should therefore create an enabling environment as well as support the automation of
C apital Markets Authority, Registrar of Companies and the Nairobi Stock Exchange.
T his will enable all the stakeholders including investors and researchers get accurate
information for a reasonable period to enable them make objective, reliable and accurate
decisions.
T he incumbent political class, who took over the political dispensation in the year 2002,
and whose term expires in the year 2007, has done a commendable job to maintain low
and stable interest rates. Financial institutions have made a shift from lending to the
government in form of treasury bills and bonds to providing credit to the private sector
including households in form of consumer loans (unsecured personal loans). This has
seen a growth in most sectors of the economy to the benefit of all stakeholders. It is
therefore imperative that the government should strife to maintain the prevailing interest
rates and the future governments and policy makers ought to emulate and sustain the
current relatively low interest rates.
The Nairobi Stock Exchange has few firms listed despite the country having many
potential firms. The Co-operative Bank of Kenya has aspired for a long time to be listed
at the stock exchange, but has not succeeded to date due to various hindrances. Other
successful family and private businesses like Nakumatt Super Markets and Mabati
Rolling, multinational oil companies like Kenya Shell, Caltex and Mobil and
multinational companies like Magadi Soda, Safaricom, Unilever and
Glaxosmithklinebeecham (gsk) are not listed.
5.3 Recommendation to Policy Makers.
52

T h e policymakers should provide conducive environment to facilitate the listing of this
firm s as well as encourage the multinational corporations to get listed at the Nairobi
S to ck Exchange. In the spirit of East Africa Co-operation, the three governments of East
A frica should encourage and facilitate cross border listing so as to widen and deepen
financial markets.
5 .4 . Suggestion for Further Research
T h is study focused on all firms listed at the Nairobi Stock Exchange. There are many
o th e r huge and profitable private firms e.g. Unilever, Sameer Group, Safaricom, Kenya
S hell, Magadi Soda, Mabati Rollings and Kencell. A similar study could be done on these
com panies so as to establish their trends.
A sim ilar study can also be done to determine the relationship between financial structure
(short term debt and long term debt) and company size for listed firms and/or private
firm s (unlisted firms). Differences in financial structure composition by firm size should
also be evaluated.
A nother area that could be studied is the extent of relevance of Pecking Order I heory and
H erd Migration Theory in firms quoted at Nairobi Stock Exchange.
Research can also be done to determine whether there is any correlation between industry
gearing average and profitability. Do firms that conform to industry gearing average or
operate close to industry gearing average post higher profitability?
Last, but not least, research is also necessary to establish the factors that influence lenders
attitude towards firms. Do lenders attitude towards firms in a certain industry also change
(migrate) in herds?
53

REFERENCES
A ndrew , C. and Kim, E.H. (1979), Theories of Corporate Debt Policy. Journal of
Finance, Pages 371-385.
Barges A. (1963), The Effect of Capital Structure on the Cost of Capital. Prentice
H all, Englewood Cliffs NJ.
Brenam, M.J. (1984), Optimal Financial Policy and Firm Valuation. Journal of
Finance, Page 107.
Chonde, P. (2003), A Study of Determinants of Capital Structures of Public Sector
.Enterprises in Kenya. Unpublished M.B.A Thesis, 2003.
Daily Nation Newspaper of 08.04.05 Page 27.
Delbreil, M 1 (1993), A Comparative Analysis of German. Austrian. Spanish, French
and Italian Companies, with Share Capital during the Period 1991-1993.
Fama, E.and Kenneth, F. (1998), Taxes. Financing Decision and Firm' s Value,
Journal of Finance. Pages 819-841.
Fama E.J. (1965), The Behaviour of Stock Market Prices, Journal of Business, Pages
34- 120.
Fama E.J. (1978), The Effects of a Firm' s Investment and Financing Decisions on
the Welfare of Its Security Holders, American Economic Review, 200-302.
Ferri M.G. and Jones W.H. (1979), Determinants of Financial Structure: A New
Methodological Approach, Journal of Finance Page 350
54

Foulks L. (2004), Strategic Financial Management. Foulks Lynch Publications, U.K.
Jeffrey K. Jackie-Mason, (1990), Do Taxes Affect Corporate Financing Decisions?
Journal o f Finance Page 1471.
Jensen M.C. (1986), Agency Costs of Free Cash Flow, Corporate Finance, and
T akeovers. American Economic Review, 323-284.
Kamere N.I. (1987), Some Factors that Influence Capital Structures of Public
Companies in Kenya. Unpublished M.B.A. Thesis, 1987.
Kneeshaw J.T. (1995), A Survey of Non-financial Sector Balance Sheets in
Industrialized Countries. Bank for International Settlements Working Paper Number
25.
Kraus, A. and Litzenberge, R. (1972), A State Preference Model of Financial
Leverage. Journal of Finance Page 337-348.
Lumby, S. (1991), Investment Appraisal and Financing Decisions: A First Course in
Financial Management, 4 111 Edition Chapman and Hall.
Margaret, W. (1992), Taxation, The Macmillan Press Ltd, Page 120.
Mbogo, P.A. (1983), The Extent of Indebtedness of Public Companies in
Kenva.Unpublished M.B.A Thesis, 1983.
Merret A.J. and Allen Sykes, The Finance and Analysis of Capital Projects,
Longman Group Ltd, London, Second Edition 1973).
Miller, M. (1979), Debt and Taxes, Journal of Finance, 32, 261-275.
55

M and Rock, K.. (19851 Dividend Policy Under Asymmetric Information. Jo u rn a l o f Finance Page 27.
lle r M.H. (1999b), The History of Finance: An Eve Witness Account. Journal of
P ortfo lio Management 25, 95-101.
M iller M.H. (1977), Debt and Taxes. Journal of Finance, Page 263.
M ille r M.H. (1998e), The M and M Propositions 40 Years Later. European Financial
M anagement, 113-130.
M yers (1977), Determinants of Corporate Borrowing. Journal of Financial
Economics, 5,147-167
M yers S.C. (1984), The Capital Structure Puzzle, Journal of Finance Page 577.
M yers, S (1984), The Search for Optimal Capital Structure. Midlow Corporate
Finance Journal, 1,6-16.
Omondi, W.A. (1996), A Study of Capital Structures in Kenya. Unpublished M.B.A.
Thesis, 1996.
Onsumu, Z.N. (2003), The Relationship Between Debt Financing and the Value of
the Firm Quoted at the Nairobi Stock Exchange. Unpublished M.B.A. Thesis, 2003.
Pandey, I.M. (2001), Financial Management and Policy, New Delhi, India.
Pandey, I. M. (1999), Financial Management, Vikas Publishing House PVT Ltd,
eighth edition Page 695,702.
Pandey I.M. (2000), Financial Management, Eighth edition, Tata- McGraw Hill Inc.
56

a u l, M . (1982), The Choice Between Equity and Debt. Journal of Finance Page 121- 144
R oss, S.A. (1978), The Determination of Financial Structure: The Incentive Signaling
Approach, Bell Journal of Economics, 8,23-40.
Scott D. (1972), Evidence on the Importance of Financial Structure. Financial
Management, 45-50.
S tig litz , J.E. (1969), A Re- examination of the Modigiliani-Miller Theorem.
A m erican Economic Review, Vol. 59 Page 784
Sm ith , J. (1986), An Analysis of Bond Covenants, Journal of Financial Economics,
117-163.
Solom on, E. (1963), Leverage and the Cost of Capital, Journal of Finance, 273-279.
Taggart, R. (19770), A Model of Corporate Financing Decisions, Journal of Finance,
32, 1467-1484.
Titm an, S. and Wessels R. (1988), The Determinants of Capital Structure Choice,
Journal of Finance, Page 10-19.
Tum bull M. S. (1979), Debt Capacity, Journal of Finance, Page 931 -939.
Warner, J.B. (1977), Bankruptcy Costs, Journal of Finance, Page 340.
Weston, J.F. and Copeland, T.E. (19861. Management Finance, New York: Dryden
Press.
57

ton , J.F. and Copeland, T.E. (1992), Managerial Finance. Dryden Press, New V ° r k , Page 593.
58
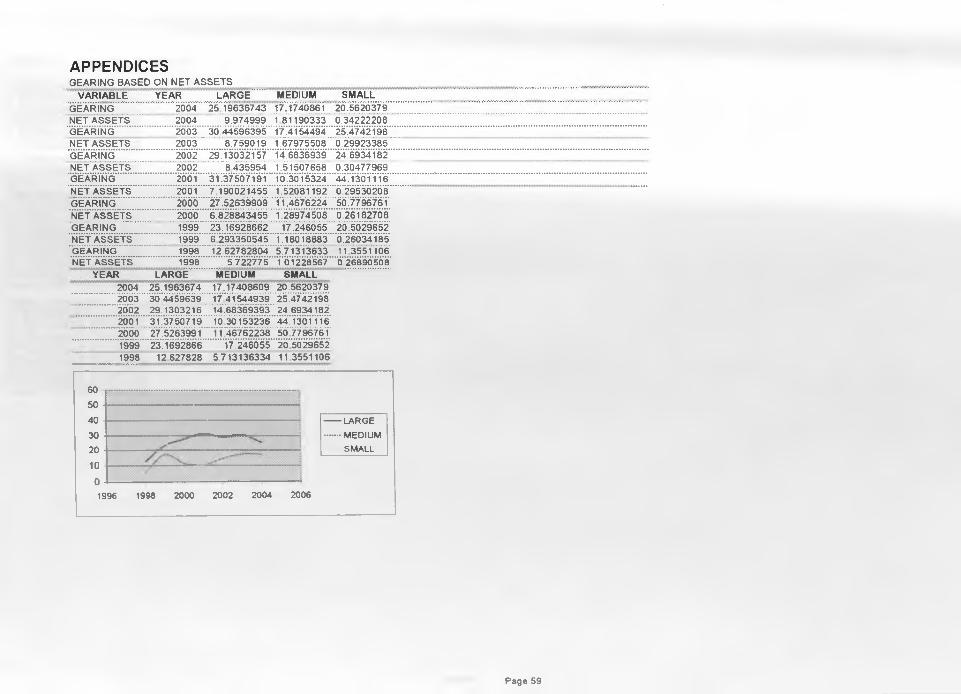
APPENDICESGEARING BASED ON NET ASSETS
VARIABLE YEAR LARGE..... MEDIUM SMALLGEARING 2004 25.19636743 17.1740861 20.5620379NET ASSETS 2004 9.974999 1 81190333 0.34222208GEARING 2003 30.44596395 17.4154494 25.4742198NET ASSETS 2003 8.759019 1.67975508 0.29923385GEARING 2002 29.13032157 14.6836939 24.6934182NET ASSETS 2002 8 435954 1.51507658 0.30477969GEARING 2001 31.37507191 10.3015324 44.1301116NET ASSETS 2001 7.190021455 1.52081192 0.29530208GEARING 2000 27.52639909 11.4676224 50.7796761NET ASSETS 2000 6.828843455 1.28974508 0.26182708GEARING 1999 23.16928662 17.246055 20.5029652NET ASSETS 1999 6 293350545 1.18018883 0.26034185GEARING 1998 12.62782804 5.71313633 11 3551 106NET ASSETS 1998 5.722775 1.01228567 0.26890508
YEAR LARGE MEDIUM SMALL2004 25.1963674 17.17408609 20.56203792003 30 4459639 17 41544939 25.47421982002 29 1303216 14.68369393 24.69341822001 31.3750719 10 30153236 44.13011162000 27.5263991 11.46762238 50 77967611999 23.1692866 17.246055 20 50296521998 12 627828 5 713136334 11.3551106
60 50 40 30 20 10 01996 1998 2000 2002 2004 2006
------LARGE....... m e d iu m
SMALL
Page 59

GEARING % NET ASSETS (BILLIONS)
LARGE COMPANIES25.19636743 9.97499930.44596395 8.75901929.13032157 8.43595431.37507191 7.1900214527.52639909 6.8288434523.16928662 6.2933505512.62782804 5.722775
MEDIUM COMPANIES17.17408609 1.8119033317.41544939 1.6797550814.68369393 1.5150765810.30153236 1.5208119211.46762238 1.28974508
17.246055 1.180188835.713136334 1.01228567
SMALL COMPANIES20.56203793 0.3422220825.47421978 0.2992338524 69341816 0.3047796944.13011162 0.2953020850.77967608 0.26182708
20.5029652 0 2603418511.35511063 0 26890508

SUMMARY OUTPUT SMALL COMPANIES BY NET ASSETSRegression Statistics
Multiple R 0.17927901R Square 0.03214096Adjusted R Squ -0.16143084Standard Error 15.1432599Observations 7
ANOVAdf SS MS F Significance F
Regression 1 38.0763717 38.0763717 0.16604156 0.700513929Residual 5 1146.591599 229.31832Total 6| 1184.66797
Coefficients Standard Error tS tat P-value Lower 95% Upper 95% Lower 95 0% Upper 95 0%Intercept 53.1182361 61.38497559 0.8653296 0.42641846 -104.6766093 210.9130814 -104.67661 210.9130814X Variable 1 -85.7665602 210.4793961 -0.407482 0.70051393 -626.8201885 455.287068 -626.82019 455.287068
SUMMARY OUTPUT MEDIUM COMPANIES BY NET ASSETSRegression Statistics
Multiple R 0.63343057R Square 0.40123428Adjusted R Sqt 0.28148114Standard Error 3.77855467Observations 7
ANOVAdf SS MS F Significance F
Regression 1 47 83684507 47 8368451 3 35051147 0.126695894Residual 5 71 38737703 14.2774754Total 6] 119 2242221
Coefficients Standard Error tS ta t P-value Lower 95% Upper 95% Lower 95 0% Upper 95 0%Intercept -0 84246042 7.926348936 X Variable 1 9.98013274 5.4523128
-0.1062861 091948802 -21.21775572 19 53283489 -21.217756 19 532834891 83044024 012669589 -4.035460601 23 99572609 -4.0354606 23 99572609
Page 61

SUMMARY OUTPUT
Regression StatisticsMultiple R 0.53785992R Square 0.28929329Adjusted R Squ 0.14715195Standard Error 5.9294383Observations 7
LARGE COMPANIES BY NET ASSETSANOVA
df SS MS F Significance FRegression 1 71.55583531 71.5558353 2.03525086 0.213029719Residual 5 175.7911929 35.1582386Total 6 247.3470282
Coefficients Standard Error tStat P-value Lower 95% Upper 95% Lower 95 0% Upper 95 0%Intercept 8.25338109 12.39074599 0.66609235 0.53484703 -23.59799342 40.10475561 -23.597993 40.10475561X Variable 1 2.28733497 1.603322161 1.42662219 0.21302972 -1.834129123 6.408799053 -1.8341291 6.408799053
Page 62

GEARING BASED ON CAPITALISATION
VARIABLE YEAR LARGE MEDIUM SMALLGEARING 2004 23.81636712 16.2382177 21.5913716CAPITALISATl' 2004 14.42134155 1.72962493 0.32801228GEARING 2003 21.22297158 21.1033747 30.416226CAPITALISATl' 2003 12.13395103 1.47357982 0.23364036GEARING 2002 22.54961795 21.2753153 24.7284132CAPITALISATl' 2002 4.581310786 0.48696286 0.1168566GEARING 2001 24.61154166 18.4093399 45.9601717CAPITALISATl' 2001 3.71015579 0.60145686 0.13187251GEARING 2000 20.17097751 19.1723114 54.4831558CAPITALISATli 2000 4.504928281 0.6786607 0.12419568GEARING 1999 16.26100002 11.886303 33.3751598CAPITALISATl 1999 4.723728168 0.69017116 0.10849436GEARING 1998 8.341125409 9.91700615 12.596299CAPITALISATl 1998 5.571085066 1.16985846 0.17970939
CAPITALISATION AND GEARING CHARTLARGE MEDIUM SMALL
2004 23.8163671 16.23821768 21.59137162003 21.2229716 21.10337469 30.4162262002 22.5496179 21.27531532 24.72841322001 24 6115417 18.40933992 45.96017172000' 20.1709775 19.17231142 54 48315581999 16 261 11.88630299 33.37515981998 8.34112541 9917006147 12 596299

REGRESSION BASED ON CAPITALISATION LARGE COMPANIES
GEARING% CAPITALISATION (BILLIONS)23.81636712 14.421341521.22297158 12.13395122 54961795 4.5813107924.61154166 3.7101557920.17097751 4.5049282816 26100002 4.723728178.341125409 5.57108507
MEDIUM COMPANIES GEARING % CAPITALISATION(BILLIONS)
16.23821768 1.7296249321.10337469 1.47357982 21.27531532 0.48696286 18.40933992 0.60145686 19.17231142 0.678660711.88630299 0.690171169.917006147 1.16985846
SMALL COMPANIESGEARING % CAPITALISATION (BILLIONS)
21 59137165 032801228 30.41622596 0.23364036
24 7284132 0 116856645 9601717 0.13187251
54 48315576 0.84623011 33.37515977 0.1084943612 59629902 0.17970939

SUMMARY OUTPUT SMALL COMPANIES BY CAPITALISATION
Regression StatisticsMultiple R 0.57964162R Square 0.33598441Adjusted R Squ 0.20318129Standard Error 12.8449922Observations 7
ANOVAdf SS MS F Significance F
Regression 1 417.4250807 417.425081 2.52994367 0.172576716Residual 5 824.9691206 164.993824Total 6 1242.394201
Coefficients Standard Error t Stat P-value Lower 95% Upper 95% Lower 95 0% Upper 95 0%Intercept X Variable 1
23.046687931.7891227
7.37583377719.98587268
3.124621371.59057966
0.026115530.17257672
4.086534521-19.58611467
42.0068412283.16435999
4.08653452-19.586115
42.0068412283.16435999
Page 65

SUMMARY OUTPUT MEDIUM COMPANIES BY CAPITALISATION
Regression StatisticsMultiple R 0.13248329R Square 0.01755182Adjusted R Squ -0.17893781Standard Error 4.82693714Observations 7
ANOVAdf SS MS F Significance F
Regression 1 2.081257596 2.0812576 0.08932696 0.777057973Residual 5 116.4966106 23.2993221Total 6 118.5778682
Coefficients Standard Error tS tat P-value Lower 95% Upper 95% Lower 95 0% Upper 95 0%Intercept X Variable 1
18.04599-1.21810815
4.3753477544.075628337
4.12446988-0.2988762
0.009134040.77705797
6.798818958-11.6948272
29.293161129.258610904
6.79881896-11.694827
29.293161129.258610904
Page 66

SUMMARY OUTPUT LARGE COMPANIES BY CAPITALISATION
Regression StatisticsMultiple R 0.26136724R Square 0.06831283Adjusted R Squ -0.1180246Standard Error 5.98849132Observations 7
ANOVAdf SS MS F Significance F
Regression 1 13.14731378 13.1473138 0.3666082 0.571288184Residual 5 179.3101415 35.8620283Total 6 192.4574552
Coefficients Standard Error t Stat P-value Lower 95% Upper 95% Lower 95 0% Upper 95 0%Intercept 17.1322035 4.615448879 3.71192574 0.01382728 5.267833836 28.99657316 5.26783384 28.99657316X Variable 1 0.34339131 0.567137294 0.60548179 0.57128818 -1.114479138 1.801261752 -1.1144791 1.801261752
Page 67

GEARING BASED ON TURNOVER
VARIABLE YEAR LARGE MEDIUM SMALLGEARING 1998 18 42358301 18.4605503 20.2871393TURNOVER 1998 18.65140836 15.673053 12.9618965GEARING 1999 24.90335226 24.1126593 20.9905864TURNOVER 1999 14.65443891 12.4317979 10.2967866GEARING 2000 22.79279914 24.3302045 16.2392628TURNOVER 2000 14.10855709 11.9737031 9.86009918GEARING 2001 24.93527995 18.0022059 19.6070411TURNOVER 2001 13.79982973 11.6212564 9.51049436GEARING 2002 20.78021295 21.2894463 16.9199648TURNOVER 2002 12.46438427 10.4392867 8.57184436GEARING 2003 13.96876943 15.2816383 14.828585TURNOVER 2003 10.34650355 8.33508336 6.91876118GEARING 2004 6.555106935 6.35576319 4.76367987TURNOVER 2004 10.32781018 8.28513845 6.89909109
VARIABLE YEAR LARGE MEDIUM SMALLGEARING 1998 18.42358301 18.4605503 20.2871393GEARING 1999 24.90335226 24.1126593 20.9905864GEARING 2000 22.79279914 24 3302045 16.2392628GEARING 2001 24 93527995 18.0022059 19.6070411GEARING 2002 20.78021295 21.2894463 16.9199648GEARING 2003 13.96876943 15.2816383 14.828585GEARING 2004 6.555106935 6.35576319 4.76367987
-------LARGE-------MEDIUM
SMALL
Page 68

Page 69

REGRESSION ANALYSIS BASED ON TURNOVERLARGE COMPANIESGEARING % TURNOVER (BILLIONS)
18.42358301 18.651408424.90335226 14.654438922.79279914 14.108557124.93527995 13.799829720.78021295 12.464384313 96876943 10.34650356.555106935 10.3278102
MEDIUM COMPANIES18.4605503 15.673053
24.11265931 12.431797924.33020447 11.973703118.00220587 11.621256421.28944627 10.439286715.28163834 8.335083366.35576319 8 28513845
SMALL COMPANIES20.2871393 12.9618965
20 99058638 10 296786616 23926279 9.8600991819.60704107 9.5104943616.91996477 8.5718443614 82858498 6.918761184 763679866 6 89909109
SUMMARY OUTPUT SMALL COMPANIES BY TURNOVER
Regression StatisticsMultiple R 0.7219R Square 0.5211Adjusted R Sqt 04253Standard Error 4 2030Observations 7
ANOVAdf SS MS F Significance F
Regression 1 96 1174 96 1174 5.4410 00670Residual 5 88 3270 17 6654Total 6] 184 4445
Coefficients Standard Error tS tat P-value Lower 05% Upper 05% Lower 05 0% Upper 05 0%
Intercept -1 3813 7.7170 -0.1790 0 8650 -21.2184 18 4558 -21.2184 18 4558X Variable 1 1 8965 0.8130 2.3326 0 0670 -0.1935 3.9864 -0.1935 3 9864
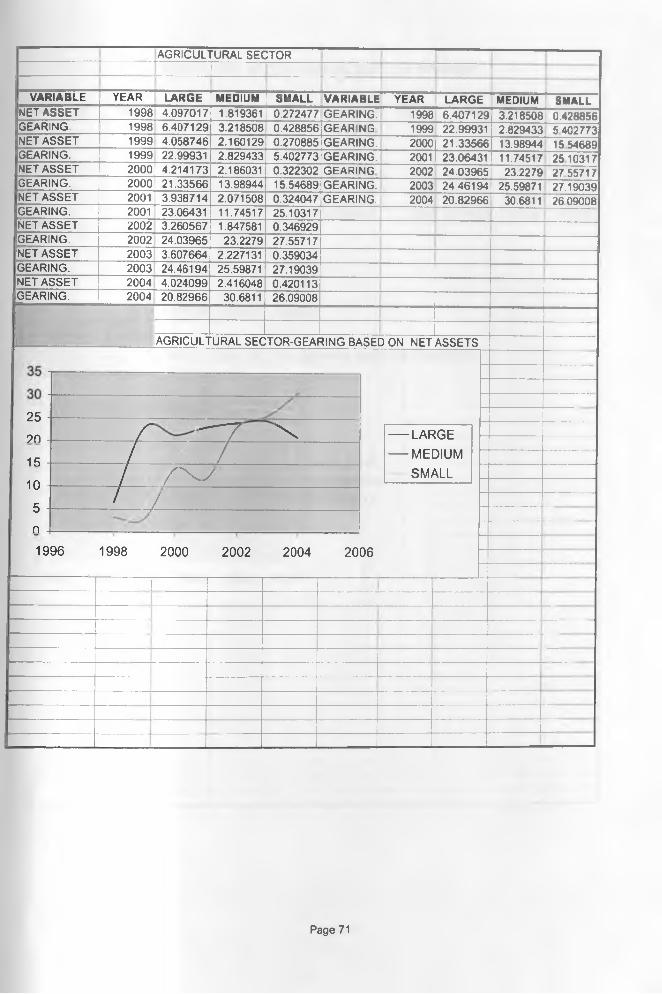
AGRICULTURAL SECTOR------------- -------------
VARIABLE YEAR LARGE MEDIUM SMALL VARIABLE YEAR LARGE MEDIUM SMALLNET ASSET 1998 4.097017 1.819361 0.272477 GEARING. 1998 6.407129 3.218508 0.428856GEARING. 1998 6.407129 3.218508 0.428856 GEARING 1999 22.99931 2.829433 5402773NET ASSET 1999 4.058746 2.160129 0.270885 GEARING. 2000 21.33566 13.98944 15 54689GEARING. 1999 22.99931 2.829433 5.402773 GEARING. 2001 23.06431 11.74517 2510317NET ASSET 2000 4.214173 2.186031 0.322302 GEARING 2002 24.03965 23.2279 27 55717GEARING. 2000 21.33566 13.98944 15.54689 GEARING. 2003 24.46194 25.59871 27.19039NET ASSET 2001 3.938714 2.071508 0.324047 GEARING. 2004 20.82966 30.6811 26 09008GEARING. 2001 23.06431 11.74517 25.10317NET ASSET 2002 3.260567 1.847581 0.346929GEARING. 2002 24.03965 23.2279 27.55717NET ASSET 2003 3.607664 2.227131 0.359034 I-------------GEARING. 2003 24.46194 25.59871 27.19039NET ASSET 2004 4.024099 2.416048 0.420113
—GEARING. 2004 20.82966 30.6811 26.09008
AGRICULTURAL SECTOR-GEARING BASED ON NET ASSETS—
2520 r — ~ 7 \ -----LARGE
15 / / -----MEDIUM —
m / / \ / SMALLI u c / yOn -------------1-------------i
1996 1998 2000 2002 2004 2006——— —
I
r~ ~ j
________ t
Page 71

AGRICULTURAL SECTOR- GEARING BASED ON TURNOVER
VARIABLE YEAR LARGE MEDIUM SMALL VARIABLE YEAR LARGE MEDIUM SMALLGEARING. 1998 6.407129 3.218508 0.428856 GEARING. 1998 6.407129 3.218508 0428856TURNOVER 1998 2.739638 1.026285 0.291929 GEARING 1999 22 99931 2 829433 5402773GEARING. 1999 22.99931 2.829433 5.402773 GEARING 2000 21.33566 13.98944 15 54689TURNOVER 1999 2.106974 0.850166 0.292251 GEARING. 2001 23.38713 11.42234 25.10317GEARING. 2000 21.33566 13.98944 15.54689 GEARING 2002 32.74852 14.51903 27 55717TURNOVER 2000 2.66497 1.031331 0.325985 GEARING. 2003 32.84216 17.21849 27 19039GEARING. 2001 23.38713 11.42234 25.10317 GEARING. 2004 32 31563 20.76863 24.51659TURNOVER 2001 2.813732 1.062773 0.321953GEARING. 2002 32.74852 14.51903 27.55717TURNOVER 2002 2.666738 0.929341 0.356742GEARING. 2003 32.84216 17.21849 27.19039TURNOVER 2003 2.705632 0.848065 0.388851GEARING. 2004 32.31563 20.76863 24.51659TURNOVER 2004 3.040306 0.956524 0.455944
AGRICULTURAL SECTOR -GEARING BASED ON TURNOVER
LARGEMEDIUMSMALL
1996 1998 2000 2002 2004 2006
H— __L
Page 72

VARIABLE YEAR LARGE MEDIUM SMALL VARIABLE YEAR LARGE MEDIUM SMALLCAPITALISATIC 1998 4.928048 1.977229 0.26 GEARING 1998 3.614418 6.011218 0 428856GEARING 1998 3.614418 6.011218 0 428856 GEARING 1999 15.57415 10.25459 5402773CAPITALISATIC 1999 3.596257 1.465542 0.203 GEARING 2000 13.47247 21.85263 15 54689GEARING 1999 15.57415 10.25459 5.402773 GEARING 2001 23.38713 11.42234 25 10317CAPITALISATIC 2000 3.030848 0.9199 0.176 GEARING 2002 15.43703 32 3381 27 0496GEARING 2000 13.47247 21.85263 15.54689 GEARING 2003 18.47191 26.2721 32 50704CAPITALISATIC 2001 2.197316 0.729092 0.2052 GEARING 2004 32.31563 19.19513 26 09008GEARING 2001 23.38713 11.42234 25.10317CAPITALISATIC 2002 1.570486 0.26177 0.099786GEARING 2002 15.43703 32.3381 27.0496 —CAPITALISATIC 2003 1.941655 0.460971 0.26177GEARING 2003 18.47191 26.2721 32.50704CAPITALISATIC 2004 2.603594 0.739848 0 4032GEARING 2004 32.31563 19.19513 26.09008 —
5AGRICULTURAL SECTOR- GEARING BASED ON CAPITALISTS_______I I I
LARGEMEDIUMSMALL
Page 73
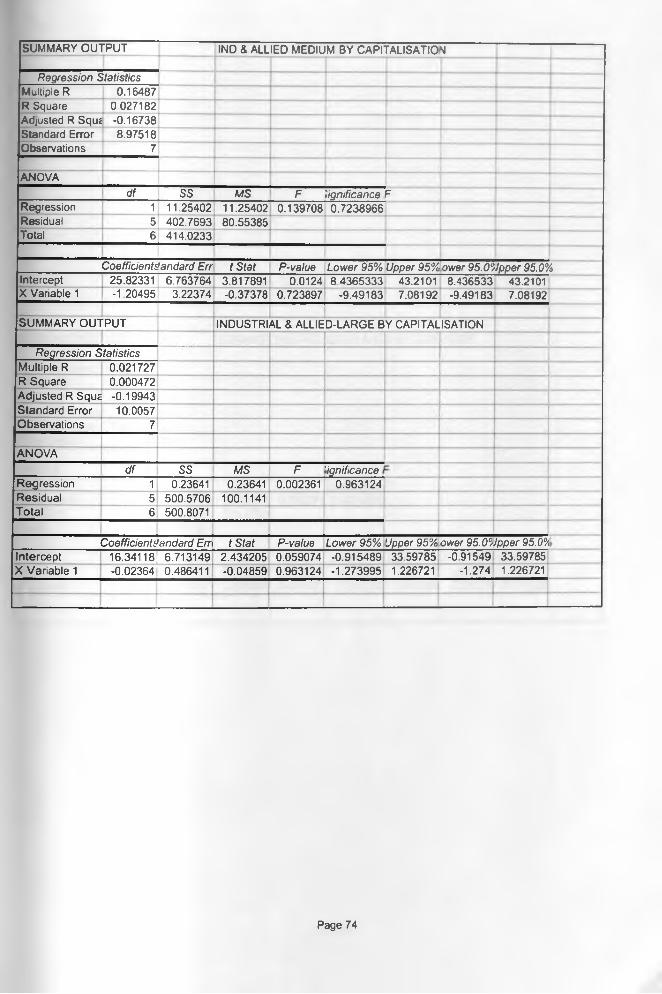
SUMMARY OUTPUT IND & ALLIED MEDIUM BY CAPITALISATION
Regression StatisticsMultiple R 0.16487R Square 0.027182Adjusted R Squj -0.16738Standard Error 8.97518Observations 7
ANOVAdf ss MS F Significance F
Regression 1 11.25402 11.25402 0.139708 0.7238966Residual 5 402.7693 80.55385Total 6 414.0233
iCoefficientdandard Err tS ta t P-value Lower 95% Upper 95% ower 95.0Vpper 95.09Intercept 25.82331 6.763764 3.817891 0.0124 84365333 43.2101 8.436533 43.2101X Variable 1 -1.20495 3.22374 -0.37378 0.723897 -9.49183 7.08192 -9.49183 7.08192
SUMMARY OUTPUT INDUSTRIAL & ALLIED-LARGE BY CAPITALISATION
Regression StatisticsMultiple R 0.021727R Square 0.000472Adjusted R Squa -0.19943Standard Error 10.0057Observations 7
ANOVAdf SS MS F 'ignificance
Regression 1 0.23641 0.23641 0.002361 0.963124Residual 5 500.5706 100.1141Total 6| 500.8071
Coefficientdandard Em tS ta t P-value Lower 95% Upper 95% ower 95.0°/Jpper 95.0°/Intercept 16.341181 6.713149 2.434205 0.059074 -0.915489 33.59785 -0.91549 33.59785X Variable 1 -0.02364] 0.486411 -0.04859 0.963124 -1.273995 1.226721 -1.274 1.226721
Page 74

SUMMARY OUTPUT IND & ALLIED SMALL BY CAPITALISATION
Regression StatisticsMultiple R 0.176855R Square 0.031278Adjusted R Squ< -0.16247Standard Error 6.632097Observations 7
_______ANOVA
df SS MS F ignificanceRegression 1 7.10081 7.10081 0.161438 0.7044346Residual 5 219.9235 43.98471Total 6 227.0243
Coefficientdandard Err tS ta t P-value Lower 95% Upper 95% ower 95.0Vpper 95.0%Intercept 12.00069 4.179592 2.871259 0.034943 1.2567269 22.74466 1.256727 22.74466X Variable 1 -3.3581 8.357761 -0.40179 0.704435 -24.84237 18.12618 -24.8424 18.12618
SUMMARY OUTPUT COMMERCIAL AND SERV LARGE BY TURNOVER
Regression StatisticsMultiple R 0.364531R Square 0.132883Adjusted R Squ£ -0.04054Standard Error 19.28399Observations 7
ANOVAd f SS MS F '•ignificance C
Regression ~ 1 \ 284.9411 284.9411 0.766234 0.4214368Residual 5 1859.361 371.8721Total 6 2144.302
Coefficientdandard Ern tS ta t P-value Lower 95% Upper 95% ower 95.0Vpper 95.0%Intercept 17.30109 28.3425 0.610429 0.568256 -55.55551 90.1577 -55.5555 90.1577X Variable 1 1.67957 1.918746 0.875348 0.421437 -3.252715 6.611856 -3.25272 6.611856
Page 75

[SUMMARY OUTPUT IND SALLIED LARGE BY NET ASSETSj ------------
Regression Statistics[Multiple R 0.473242R Square 0.223958Adjusted R Squ E 0.06875[Standard Error 9.261486[Observations 7J
[ANOVAdf SS MS F Significance F
[Regression 1 123.7692 123.7692 1.44295 0.2834549Residual 51328.8756f 85.77513Total 6 552.6448
Coefficientdandard Err tS ta t P-value Lower 95% Upper 95%.ower 95.0°/Jpper 95.0?6Intercept 14.39184 16.99474 0.84684 0.435731 -29.29448 58.07815 -29.2945 58.07815X Variable 1 1.969457 1.639536 1.201228 0.283455 -2.245097 6.184011 -2.2451 6.184011
--------------SUMMARY OUTPUT IND & ALLIED MEDIUM BY NET ASSETS
Regression StatisticsMultiple R 0.742243R Square 0.550925Adjusted R Squs 0.46111Standard Error 1.47265Observations 7
| ANOVAdf SS MS F 'ignificance
Regression 1 13.30278 13.30278 6.133995 0.0560681Residual 5 10.84348 2.168697
| Total 6 24.14626
Coefficient Standard Et Stat P-value Lower 95% Upper 95% Lower 95.C Upper 95.0%Intercept 0.906315 2.009253 0.45107 0.670828 -4.258627 6.071256 -4.25863 6.071256X Variable 1 1.953039 0.788568 2.47669 0.056068 -0.074036 3.980115 -0.07404 3.980115--------
[SUMMARY OUTPUT IND & ALLIED SMALL BY NET ASSETS
Regression Statistics[Multiple R 0.331537R Square 0.109917Adjusted R Sque -0 0681Standard Error 8.603769 -------------r
[Observations 7 ________ L
[ANOVAd f SS MS F fignificance F
Regression ~~TT 45.70689 45.70689 0.617453 0.4675805Residual 5 370.1242 74.02483 I
I Total 6| 415.8311
Coefficientdandard Err tS ta t P-value ower 95% Upper 95%.ower 95.0°/)pper 95.0%[intercept 25.50609 19.00883 1.341802 0.237371 -23.35759 74.36978 -23.3576 74.36978X Variable 1 -24.5119 31.1943 -0.78578 0.46758 -104.6993 55.67544 -104.699 55.67544
Page 76

Page
77

SUMMARY OUTPUT
Regression Statistics[Multiple R |R Square [Adjusted R Squc [Standard Error [Observations
0.2274140.051717-0.137948.08352
7
ANOVA
IND. & ALLIED LARGE BY TURNOVER
df SS MSjression
ResidualTotal
1 17.81845 326.71656 344.5349
17.818465.3433
Significance F0.272689 0.6238349
Coefficientdandard Em t Stat P-value Lower 95% Upper 95%ower 95. OVpper 95.0%Intercept 7.765695 16.87526 0.460182 0.664705 -35.61347 51.14486 -35.6135 51.14486
[X Variable 1 0.502964 0.96317 0.522196 0.623835 -1.97294 2.978868 -1.97294 2.978868
SUMMARY OUTPUT-L
IND SALLIED MEDIUM BY TURNOVER
Regression StatisticsMultiple R
IR SquareAdjusted R SqusStandard ErrorObservations
ANOVA
0.3136470.098375-0.081959.76815
7
df SS MSRegression
Significance F
ResidualTotal
1 52.05368 52.05368 0.54554 0.49333525 477.0838 95.41676 6' 529 1375
Intercept X Variable 1
37.1937-2.6392
13.165133.573217
Coefficientdandard Em t Stat P-value Lower 95% Upper 95%.ower 95.OVpper 95.0%2.825167 0.036884 3.3516979 71.0357 3.351698 71.0357-0.73861 0.493335 -11.82444 6.54603 -11.8244 6.54603
----------- —
SUMMARY OUTPUT IND SALLIED SMALL BY TURNOVER
Regression Statistics[Multiple R 0.799195| r Square 0.638713| Adjusted R Squc 0.566455[Standard Error 2.521553| Observations 7
| AN OVAd f SS MS F 'ignificance
Regression 1 56.20294 56.20294 8.839401 0.0310454Residual 5 31.79115 6.35823Tota l 6 87.99409
Coefficientdandard Em t Stat P-value Lower 95% Upper 95%.ower 95. OVpper 95.0%Intercept -1.52956 2.368602 -0.64577 0.546894 -7.618236 4.559112 -7.61824 4.559112
Page 78

X Variable 1 15.88251 5.342048 2.973113 0.031045 2.1503633 29.61466 2.150363 29.61466___________________________
1 _______ _______ _______GEARING LEVELS AND CAPITALISATION FOR IDUSTRIAL AND ALLIED SECTOR
| |------------
VARIABLE YEAR LARGE MEDIUM SN1ALL82471
VARIABLE YEAR LARGE MEDIUM SMALLCAPITALISATIC 1998 7.529608 1.897367 0.2 GEARING. 1998 3 582854 13.86354 5.86859GEARING. 1998 3.582854 13.86354 5.86859 GEARING. 1999 11.73079 24.44746 2333482CAPITALISATIC 1999 6.585022 0.859208 0.097688 GEARING. 2000 21.45385 18.5916 5.544512GEARING. 1999 11.73079 24.44746 23.33482 GEARING. 2001 31.11533 18.48067 7.158642CAPITALISATIC 2000 6.385073 1.314734 0.201325 GEARING. 2002 98429 39.43332 11.59657GEARING. 2000 21.45385 18.5916 5.544512 GEARING. 2003 21.1596 27.62311 11.97686CAPITALISATIC 2001 4.984052 1.222102 0.248831 GEARING. 2004 13.61623 23.01331 9.118359GEARING. 2001 31.11533 18.48067 7.158642
---------------p — .. .. ...
CAPITALISATIC 2002 7.248651 0.88464 0.241072 —GEARING. 2002 9.8429 39.43332 11.59657CAPITALISATIC 2003 21.74719 2.501003 0.816533GEARING. 2003 21.1596 27.62311 11.97686
—
CAPITALISATIC 2004 25.34159 4.026982 0.913221GEARING. 2004 13.61623 23.01331 9.118359
IND. & ALLIED GEARING BASED ON CAPITALISATION
40
30 ARGEL
9n ------MEDIUM
SMALL10
■
________0 -I----- ,----- 1---------- r— — —i----------1996 1998 2000 2002 2004 2006
—
——
-------------1
________
________— -------------1—
----------- 1 —I
Page 79

IND. & ALLIED- GEARING BASED ON NET ASSETSI-------------
VARIABLE YEAR rLARGE MEDIUM SMALL VARIABLE YEAR LARGE MEDIUM SMALLNET ASSETS 1998 7.5699 1.6006 0.4758 GEARING. 1998 17.1008 1.7066 5.6813GEARING. 1998 17.1008 1.7066 5.6813 GEARING. 1999 29.1108 6 32 28 7493NET ASSETS 1999 8.0068 1.7122 0.48 GEARING. 2000 35.7865 4.259 4.7681GEARING. 1999 29.1108 6.32 28.7493 GEARING. 2001 42.946 6.6724 ” 7.14NET ASSETS 2000 8.8588 1.6976 0.5291 GEARING. 2002 42.1477 7.0634 11.6508GEARING. 2000 35.7865 4.259 4.7681 GEARING. 2003 43.0467 7.084 108536NET ASSETS 2001 9.0767 2.6317 0.6168 GEARING. 2004 30.4421 6.7096 6 6833GEARING. 2001 42.946 6.6724 7.14NET ASSETS 2002 12.001 2.9485 0.6441 ------------- !------------- — " ■ —GEARING. 2002 42.1477 7.0634 11.6508 ■ 1 ■ 1 ■ 1NET ASSETS 2003 12.0572 3.1801 0.6737GEARING. 2003 43.0467 7.084 10.8536NET ASSETS 2004 13.4328 3.3671 0.7832GEARING. 2004 30.4421 6.7096 6.6833
cn
40 >______ __
30 / / \ ARGE-----L
90 - . . . / ' -----MEDIUMSMALL
10 -/ .................." ^ .............
..........................U H " t—3------- r ......... r 1""1----1 wlMBttt1996 1998 2000 2002 2004 2006
________ _________________ _________
________ _________________ ________
————
-------------1—
Page 80

IND. &ALLIED- GEARING BASED ON TURNOVER
VARIABLE YEAR LARGE MEDIUM SMALL VARIABLE YEAR LARGE MEDIUM SMALLGEARING 1998 3.273703 20.56025 0 GEARING 1998 3.273703 20.56025 0TURNOVER 1998 14.0027 2.185568 0.157586 GEARING 1999 11.91845 4857395 1.303949GEARING 1999 11.91845 48.57395 1.303949 GEARING 2000 17.82011 22.81156 2.503171TURNOVER 1999 13.84922 2.231236 0.248248 GEARING 2001 22.96865 24 32749 6 29649GEARING 2000 17.82011 22.81156 2.503171 GEARING 2002 22.64369 25.43944 10.58024TURNOVER 2000 16.2674 2.818063 0.249692 GEARING 2003 23.74706 26.49694 8 161533GEARING 2001 22.96865 24.32749 6.29649 GEARING 2004 12.65415 26.81064 5.57595TURNOVER 2001 17.1909 4.212174 0.424204 — ■
GEARING 2002 22.64369 25.43944 10.58024TURNOVER 2002 17.36541 4.083505 0.522761 —GEARING 2003 23.74706 26.49694 8.161533TURNOVER 2003 17.83539 4.190478 0.561592GEARING 2004 12.65415 26.81064 5.57595TURNOVER 2004 24.1059 5.034788 0.677298
50A-
------------------ / \
i a o n e
MEDIUMo u ■
20 -— ^
SMALL
10U
1996 1998 2000 2002 2004 2006
—
— — — H
—
—
____________— ------------------- -
--------------------|
Page 81

--------- 1_______ 1 I I[REGRESSION ANALYSIS OF IND. & ALLIED SECTOR- GEARING AND CAPITALISATION
J_______ I--------- 1----------LARGE
i--------- 1r VARIABLE YEAR LARGE MEDIUM SMALL CAPITALISAT GEARING[CAPITALISATIC: 1998 7.529608 1.89736'r 0.28247'j r 7.529606r 3.582854[GEARING. 1998 3.582854 13.8635' 5.86855 6.585022 11.730791CAPITALISATIC3 1999 6.585022 0.859206 0.097686 6.385072 21 45385[gearing. 1999 11.73079 24.44746 23.33482 4.984052 31.11533[CAPITALISATIC3 2000 6.385073 1.31473^ 0.2013261----------- 7.248651 9.8429[gearing. 2000 21.45385 18.5916 5.544512 21.74719 | 21.1596[CAPITALISATIC3 2001 4.984052 1.222102 0.248831 25.34159 13 61623[gearing . 2001 31.11533 18.48067 7.158642[CAPITALISATIC 2002 7.248651 0.88464 0.241072 MEDIUM[gearing . 2002 9.8429 39.43332 11.59657 1.897367 13.86354[CAPITALISATIC 2003 21.74719 2.501003 0.816533 0.859208 24.44746[gearing . 2003 21.1596 27.62311 11.97686 1.314734 18.5916[CAPITALISATIC 2004 25.34159 4.026982 0.913221 1.222102 18.48067[gearing . 2004 13.61623 23.01331 9.118359 0.88464 39.43332
2.501003 27.623114.026982 23.01331
I---------- SMALL0.282471 5.868590.097688 23.334820.201325 5.5445120.248831 7 1586420.241072 11.596570.816533 11.976860.913221 9.118359
Isum m ary OUTPUT COMMERCIAL &SERV LARGE BY NET ASSETS
|| Regression Statistics —[Multiple R 0.79947R Square 0.639152 [ ________ [Adjusted R Squc 0.566982)
[Standard Error 3.687182 ________L[Observations 7|
AN OVA ________ Lf z _______ df SS MS F Iqnificance P| Regression 1 120.4033 120.4033 8.856236 0.0309443Residual 5 67.97654 13.59531
[Total 6[ 188.3798 ------------ L
Coefficientdandard Em tS ta t P-value i.ow er 95% LIpper 95% m er 95. OVpper 95.0%[Intercept 10.91464! 6.741179 1.6191 0.166351 -6.414079 28.24337 -6.41408 28.24337X Variable 1 2.16512! 0.727541 2.975943 0.030944 0.2949197 4.03532 0.29492 4.03532
Page 82
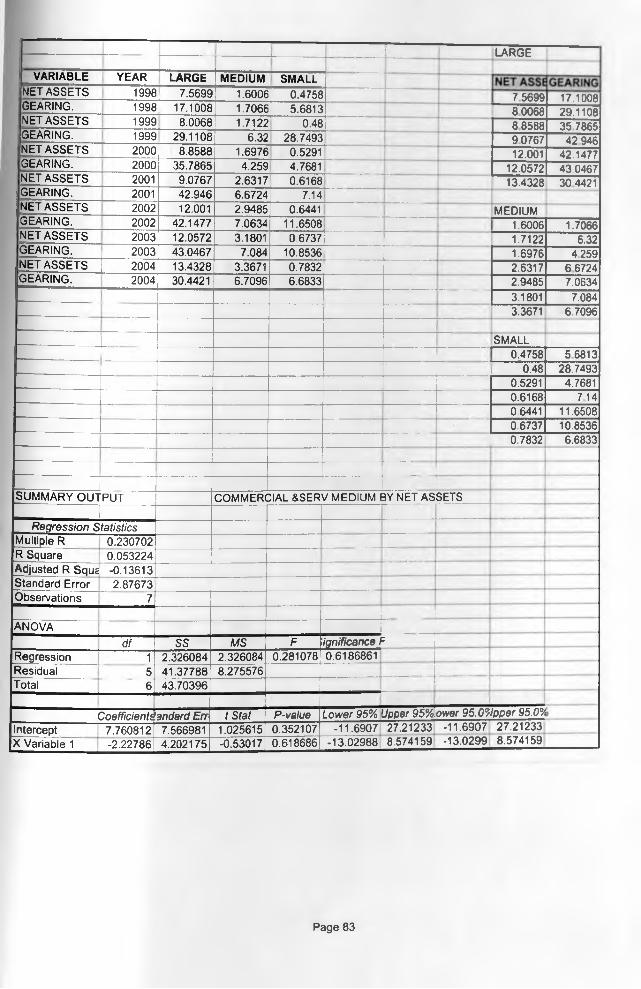
—1 | LARGE
VARIABLE YEAR LARGE MEDIUM SMALLNET ASSETS 1998 7.5699 1.6006[ 0.4758 7 5699 17.1008GEARING. 1998 17.1008 1.7066 5.6813 80068 29.1108NET ASSETS 1999 8.0068 1.7122 0.48 88588 35 7865GEARING. 1999 29.1108 6.32 28.7493 90767 42 946NET ASSETS 2000 8.8588 1.6976 0.5291 12.001 42.1477GEARING. 2000 35.7865 4.259 4.7681 12.0572 43.0467NET ASSETS 2001 9.0767 2.6317 0.6168 13.4328 30 4421GEARING. 2001 42.946 6.6724 7.14NET ASSETS 2002 12.001 2.9485 0.6441 MEDIUMGEARING. 2002 42.1477 7.0634 11.6508 1.6006 1.7066NET ASSETS 2003 12.0572 3.1801 0.6737 1.7122 6.32GEARING. 2003 43.0467 7.084 10.8536 1.6976 4259NET ASSETS 2004 13.4328 3.3671 0.7832 2.6317 66724GEARING. 2004 30.4421 6.7096 6.6833 2.9485 7.0634
3.1801 7.0843.3671 6.7096
SMALL0.4758 5 6813
0.48 28.74930.5291 4.76810.6168 7 140.6441 11.65080.6737 10.85360.7832 6.6833
I IISUMMARY OUTPUT COMMERCIAL &SERV MEDIUM BY NET ASSETS_ n -—| Regression StatisticsMultiple R 0.230702R Square 0.053224Adjusted R Squa -0.13613Standard Error 2.87673Observations 7
|ANOVA
df SS MS F 1ignificance FRegression 1 2.326084 2.326084 0.281078 0.6186861Residual 5 41.37788 8.275576Total 6t 43.70396
___ ___Coefficientdandard Err tS ta t P-value Lower 95% Upper 95%.ower 95.0Vpper 95.0°/
Intercept 7.760812 7.566981 1.025615 0.352107 -11.6907 27.212338.574159
-11.6907-13.0299
27.212338.574159X Variable 1 -2.22786 4.202175 -0.53017 0.618686 -13.02988
Page 83

LARGE
VARIABLE YEAR LARGE MEDIUM SMALL TURNOVE GEARINGgearing 1998 3.273703 20.56025 0 14.0027 3273703TURNOVER 1996! 14.0027 2.185568 0157586 13.84922 11.91845GEARING 1999 1191845 4857395 1.303949 16 2674 17.82011TURNOVER 1999 13.84922 2.231236 0.248248 17.1909 22.96865GEARING 2000 17 82011 22.81156 2.503171 17.36541 22.64369TURNOVER 2000 16 2674 2818063 0.249692 17.83539 23.74706GEARING 2001 j 22 96865 24 32749 629649 24.1059 12.65415TURNOVER 2001, 17.1909 4 2 1 2 1 7 4 0.424204GEARING 2002 22 64369 2543944 10 58024 MEDIUMTURNOVER 2002 17 36541 4 083505 0.522761 2.185568 20.56025gearing 2003 23.74706 26 49694 8.161533 2.231236 4857395TURNOVER 2003 17 83539 4190478 0 561592 2.818063 22.81156GEARING 2004 12.65415 2681064 5.57595 4.212174 24.32749TURNOVER 2004 24.1059 5.034788 0.677298 4.083505 25.43944
4.190478 26.496945.034788 26.81064
0.157586 00.248248 1.3039490.249692 2.5031710.424204 6.29649
___________ 0.522761 10.580240.561592 8.161533
— 0.677298 5.57595
SUMMARY OUTPUT COMMERCIAL &SERV SMALL BY NET ASSETS------- i r —
Regression StatisticsMultiple R 0.646813R Square 0.418368 -------------- 'Adjusted R Squc 0.302041 —Standard Error 7.628416Observations 7
“■ -- ------ANOVA
df SS MS F ignificanceRegression 1 209.2898 209.2898 3.596494 0.1163935Residual 5 290.9637 58.19274Total 6 500.2535
Coefficients andard Err tS tat P-value Lower 95% Upper 95% ower 95.0°/}pper 95.0%Intercept 50.06653 22.15585 2.259743 0.073375 -6.886804 107.0199 -6.8868 107.0199X Variable 1 -80.9516 42.68601 -1.89644 0.116393 -190.6793 28.77614 -190.679 28.77614
Page 84

SUMMARY OUTPUT1------------- COMMERCIAL &SERV LARGE BY CAPITALISATION
Regression Statistics " — —Multiple K 0.2477191
R Square 0.061365Adjusted R Squ< -0.12636Standard Error 10.39782Observations 7
AN OVAdf SS MS F Significance
Regression 1 35.3408 35.3408 0.326882 0.5922428Residual 5I 540.5735 108.1147Total 6f 575.9143
Coefficientstandard Err tS tat P-value Lower 95% Upper 95%.ower 95.0Vpper 95.6%Intercept 37.80918 12.61843 2.996345 0.030226 5.3725206 70.24585 5.372521 70.24585X Variable 1 -1.55191 2.71438 -0.57174 0.592243 -8.529434 5.425615 -8.52943 5 425615
SUMMARY OUTPUT COMMERCIAL &SERV MEDIUM BY CAPITALISATION
Regression StatisticsMultiple R 0.304269R Square 0.092579Adjusted R Squc -0.0889Standard Error 6.00147Observations 7
ANOVAd f SS MS F Significance c
Regression 1 18.37347 18.37347 0.510124 0.5070322Residual 5 180.0882 36.01765Total 6 198.4617
Coefficientdandard Em tS tat P-value Lower 95% Upper 95%.ower 95.OVpper 95.0%Intercept 4.93694 6.340419 0.778646 0.471412 -11.3616 21.23548 -11.3616 21.23548X Variable 1 2.81654 3.943464 0.71423 0.507032 -7.320441 12.95352 -7.32044 12.95352
SUMMARY OUTPUT COMMERCIAL &SERV SMALL BY CAPITALISATION
Regression StatisticsMultiple R 0.073599R Square 0.005417' —
Adjusted R Squc -0.1935Standard Error 4.434415'Observations f
ANOVA —
df SS MS F Significance P
Regression T ] 0.535479 0.535479 0.027231 0.875393Residual 5' 98.3202 19.66404Total 6 98.85567
Coefficientdandard Em tS ta t P-value Lower 95% Upper 95%.ower 95.OVpper 95.0%Intercept 8.37563 4.073591 2.05608 0.094905 -2.095852 18.84711 -2.09585 18.847111________X Variable 1 -1.057311 6.407169 -0.16502 0.875393 -17.52743 15.41282 -17.5274 15.41282
Page 85
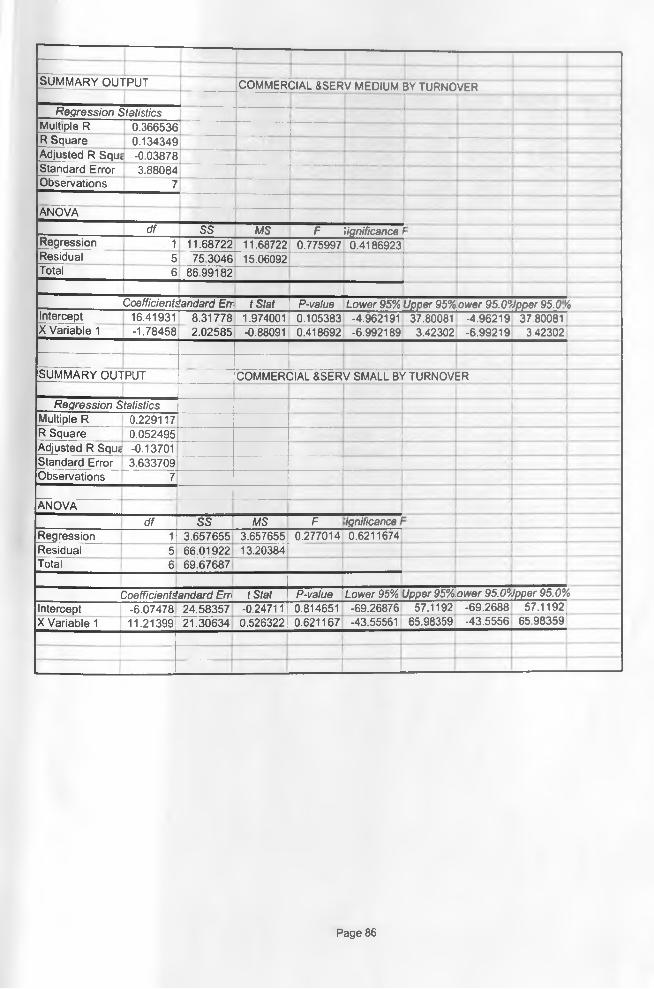
SUMMARY 0U1fPUT COMMERCIAL &SERV MEDIUM BY TURNOVER
Regression StatisticsMultiple R 0.366536R Square 0.134349Adjusted R Squ< -0.03878Standard Error 3.88084 ............ _ _ _ _ _Observations 7_ ___ANOVA
df SS MS F SignificanceRegression 1 11.68722 11.68722 0.775997 0.4186923Residual 5 75.3046 15.06092Total 6 86.99182
Coefficienteandard Err tS tat P-value Lower 95% Upper 95%.ower 95.0°/Jpper 95.0 tIntercept 16.41931 8.31778 1.974001 0.105383 -4.962191 37.80081 -4.96219 37.80081X Variable 1 -1.78458 2.02585 -0.88091 0.418692 -6.992189 3.42302 -6.99219 3.42302
SUMMARY OUTPUT COMMERCIAL &SERV SMALL BY TURNOVER
Regression StatisticsMultiple R 0.229117R Square 0.052495Adjusted R Squc -0.13701Standard Error 3.633709Observations 7
ANOVAd f SS MS F ignificance
Regression V 3.657655 3.657655 0.277014 0.6211674Residual 5 66.01922 13.20384Total 6 69.67687
Coefficientdandard Err> tS tat P-value Lower 95% Upper 95%.ower 95.0°/lpper 95.0%Intercept -6.07478 24.58357 -0.24711 0.814651 -69.26876 57.1192 -69.2688 57.1192X Variable 1 11.21399 21.30634 0.526322 0.621167 -43.55561 65.98359 -43.5556 65.98359
Page 86

COMMERCIAL AND SERVICES SECTOR
VARIABLE YEAR LARGE MEDIUM SMALL VARIABLE YEAR LARGE MEDIUM SMALLNET ASSETS 1998 5.708 1.3471 0.5737 GEARING. 1998 23.1229 4 0485 5 7513GEARING. 1998 23.1229 4.0485 5.7513 GEARING. 1999 24.2215 4.1357 42144NET ASSETS 1999 7.9952 1.518 0.5417 G E A R IN G 2000 36.2639 72507 7.6011GEARING. 1999 24.2215 4.1357 4.2144 GEARING 2001 32 9125 25919 64715NET ASSETS 2000 8.8614 1.76 0.5655 GEARING 2002 30.3988 1.2605 2 7699GEARING. 2000 36.2639 7.2507 7.6011 G E A R IN G 2003 29 068 7 0626 32993NET ASSETS 2001 9.4797 1.7688 0.5581 GEARING? 2004 37.8108 0.1848 287383GEARING. 2001 32.9125 2.5919 6.4715NET ASSETS 2002 8.8934 1.9018 0.5431GEARING. 2002 30.3988 1.2605 2.7699NET ASSETS 2003 9.9592 2.0348 0.4274GEARING. 2003 29.068 7.0626 3.2993NET ASSETS 2004 12.5619 2.1438 0.3929GEARING. 2004 37.8108 0.1848 28.7383
COMM & SERV SECTOR- 3EARING BASED ON NET ASSETS
____________4U /00 - on
___ i A R f i P25--------- ' -20 - -------- IV IC U IU IV I
15 - S m a l l10 - _^ ------------------------5 -0 -I 1 11996 1998 2000 2002 2004 2006
Page 87

i
ALTERNATIVE INVESTMENT MARKETS------------------
----------- -------------/
....
VARIABLE YEAR LARGE MEDIUM SMALL VARIABLE YEAR LARGE MEDIUM SMALLNET ASSET 1998 0.426535 0.274862 0.103413 GEARING. 1998 1.008471 15.50195 4824202GEARING. 1998 1.008471 15.50195 48.24202 GEARING. 1999 0.236014 6.883449 113.4507NET ASSET 1999 0.482888 0.251111 0.077389 GEARING? 2000 11 94677 16.05127 278 7043GEARING. 1999 0.236014 6.883449 113.4507 GEARING 2001 12 3098 22 63885 205 3774
63 22334NET ASSET 2000 0.500385 0.249257 0.047547 GEARING? 2002 13.54405 27 96863GEARING. 2000 11.94677 16.05127 278.7043 GEARING 2003 20.1807 22.39701 82 05877NET ASSET 2001 0.501331 0.189373 0.051509 GEARING. 2004 29.31374 10 20909 55 83149GEARING. 2001 12.3098 22 63885 205 3774NET ASSET 2002 0.4584 0.21651 0.096618GEARING. 2002 13.54405 27.96863 63.22334NET ASSET 2003 0.605455 0.211889 0.106577 —GEARING. 2003 20.1807 22.39701 82.05877NET ASSET 2004 0.672908 0.259623 0.132279GEARING. 2004 29.31374 10.20909 55.83149
GEARING BASED ON NET ASSETS
I —
300 250 200
150 100
50 0
-5(J 9̂ 96 1998 2000 2002- 2004
■LARGEMEDIUMSMALL
2006
---r
Page 88