EMPLOYMENT GENERATION BY SMALL FIRMS IN SPAIN
39
EMPLOYMENT GENERATION BY SMALL FIRMS IN SPAIN Documentos Ocasionales N.º 0903 Paloma López-García, Sergio Puente and Ángel Luis Gómez 2009
-
Upload
khangminh22 -
Category
Documents
-
view
1 -
download
0
Transcript of EMPLOYMENT GENERATION BY SMALL FIRMS IN SPAIN

EMPLOYMENT GENERATIONBY SMALL FIRMS IN SPAIN
Documentos OcasionalesN.º 0903
Paloma López-García, Sergio Puenteand Ángel Luis Gómez
2009

EMPLOYMENT GENERATION BY SMALL FIRMS IN SPAIN

EMPLOYMENT GENERATION BY SMALL FIRMS IN SPAIN (*)
Paloma López-García, Sergio Puente and Ángel Luis Gómez (**)
BANCO DE ESPAÑA
(*) The opinion and analyses herein are the responsibility of the authors and, therefore, do not necessarily coincide withthose of the Banco de España.
(**) Please address any comments or correspondence to the authors at Banco de España, Alcalá 48, 28014 Madrid, or electronically to [email protected], or [email protected].
Documentos Ocasionales. N.º 0903 2009

The Occasional Paper Series seeks to disseminate work conducted at the Banco de España, in the performance of its functions, that may be of general interest. The opinions and analyses in the Occasional Paper Series are the responsibility of the authors and, therefore, do not necessarily coincide with those of the Banco de España or the Eurosystem. The Banco de España disseminates its main reports and most of its publications via the INTERNET atthe following website: http://www.bde.es. Reproduction for educational and non-commercial purposes is permitted provided that the source is acknowledged. © BANCO DE ESPAÑA, Madrid, 2009 ISSN: 1696-2222 (print) ISSN: 1696-2230 (on line) Depósito legal: Unidad de Publicaciones, Banco de España

Abstract
Despite the relevance in terms of policy, we still know little in Spain about where and by
whom jobs are created, and how that is affecting the size distribution of firms. The main
innovation of this paper is to use a rich database that overcomes the problems encountered
by other firm-level studies to shed some light on the employment generation of small firms
in Spain. We find that small firms contribute to employment disproportionately across all
sectors of the economy although the difference between their employment and job creation
share is largest in the manufacturing sector. The job creators in that sector are both new and
established firms whereas only new small firms outperform their larger counterparts in the
service sector. The large annual job creation of the small firm size class is shifting the firm
size distribution towards the very small production units, although not uniformly across
industries of different technology intensity.
JEL Classification: L11; L53; J21.
Keywords: Firm-level data, employment creation and destruction, and firm size distribution .
BANCO DE ESPAÑA 9 DOCUMENTO OCASIONAL N.º 0903
1 Introduction
During the 1970s two lines of research, complementary but independent at the time, resulted
in an increasing attention to the employment creation potential of small firms. The first line of
research used cross-sectional data to compute the employment share of small producers
to find overwhelming evidence of a change in the size distribution of production units. Large
firms were reducing their share of total employment whereas small firms were increasing their
importance. The most impressive and cited piece of evidence of the shift of activity towards
the small firm segment is the drop in the share of the 500 largest American firms
(Fortune 500) in employment: from 20% in 1970 to 8.5% in 1996. What was so remarkable
about this finding was not that it meant the reversal of a long-time trend towards the
concentration of production in large production units, but rather that the increasing
importance of small firms was so robust over a wide sample of countries, sectors, size
distributions and institutional frameworks.1
The second line of research was started by David Birch, who used the Dun &
Bradstreet database to classify establishments according to their size and location in the base
year, 1969, and in each succeeding wave of data (four in total) until 1976. This longitudinal
database contained around 80% of all establishments, although the very small and/or young
firms were under-represented due to the firms’ registration criteria. Even so, Birch found and
reported in 1979 that around 80% of net new jobs were created by firms with 100 employees
or less [Birch (1979): The job creation process. The main results are also in Birch (1981)].
Up to that moment, labour economists had analysed published labour statistics for
many years and consistently found that most new jobs were created by firms in the largest
size classes. The analysis was done by counting the number of jobs in the same size class
in two periods. The assumption behind this methodology was that interclass movement of
firms was negligible. However, Birch’s findings implied that the growth of small firms until they
are classified as large firms were a major factor in determining aggregate net employment
growth. Although Birch’s methodology has been contested [see Davis, Haltiwanger and
Schuh (1996)], it is by now a stylised fact that gross job creation and destruction in small
production units is disproportionably large; more importantly, rates of net job change
(job creation minus job destruction) are largest in small firms and smallest in large producers.
Both types of studies, the ones using macro or aggregate data and those using
micro or firm-level information, are fully complementary. The increasing share of small firms
in total employment could be the result of very different underlying phenomena such as, for
example, a net employment decline of large firms or a surge of new small firms. Hence,
the analysis of job creation and destruction at the firm level helps understanding what is
causing the observed aggregate phenomenon. In turn, rates of net job creation fail by
themselves to capture the importance of a size class. Small producers can create jobs at a
larger rate than large producers but still make a rather small contribution to aggregate
employment. In order to evaluate the real impact of small firms on employment, a study of the
development of the size distribution of production units along time is required. Furthermore,
such an analysis can help understanding what type of structural change might be causing
the job creation differential between small and large firms.
1. See for example Acs and Audretsch (1993), Loverman and Sengenberger (1991), Storey and Johnson (1987) and OECD (1985).
BANCO DE ESPAÑA 10 DOCUMENTO OCASIONAL N.º 0903
The statistical observation that small firms create the majority of new jobs has had an
enormous impact on public policy which has actively supported and promoted the creation,
survival and expansion of small and medium enterprises (SMEs). The rationale behind these
policies has been the belief that, above all during times of economic slowdown, small
firms are the employment locomotive of developed economies. The resulting observed shift
of firm size distribution is also of great interest from a policy point of view for reasons other
than the concern with job creation. Without getting into the debate of whether the increasing
concentration of employment and production in small production units is desirable or not,2
the fact that it is occurring in most developed countries means that the production and
working conditions in SMEs must be a primary target and concern for policy-makers.3
Despite the relevance in terms of policy of these issues, we still know little in Spain
about where and by whom jobs are created, and how that is affecting the size distribution of
firms due to a lack of appropriate data. Dolado and Gómez (1995) and Dolado, García and
Gómez (1997), for example, study gross job flows of large manufacturing existing firms
collaborating with the “Central de Balances” of the Bank of Spain to find that the reallocation
rate (gross job creation plus gross job destruction) is acyclical in Spain. The exclusion of very
small firms and new entries might, however, have significantly affected their measurement
of gross job flows. Analyses elsewhere have confirmed the importance for the job generation
process of new entries in the market vis-à-vis established firms. Boeri and Cramer (1992),
for example, find that the entry of establishments is the driving force of trend employment
growth whereas employment fluctuations are mainly associated with continuing plants.
Furthermore, most of what we know about employment dynamics in Spain
results from the analysis of the manufacturing sector to the exclusion of the much larger
and dynamic service sector. Given that the manufacturing and the service sector differ
substantially in terms of labour intensity, entry and exit rates, demand shocks or ability to
compete externally or to hold inventories, it is not straightforward that what we know from
the manufacturing sector could be extrapolated to the whole economy. Indeed, the few
existing analyses including the service sector elsewhere confirm that both net and gross
job flows are much larger in the service sector, with respect to the manufacturing, as it is the
importance of net entry (entry and exit of firms) versus established firms in the job generation
process.4 The neglect of the service sector could be behind the low contribution of entry and
exit to aggregate creation and destruction of jobs found by Ruano (2000).5
Using a constructed database that overcomes the problems encountered by other
studies in Spain, this paper analyses both the contribution to aggregate employment growth
of small firms and whether that contribution is affecting the size distribution of firms. The aim
2. There is contradicting evidence in this respect. Carre and ThuriK (1998) for example find that, on average, the employment share of large firms in the 1990 (in 13 European countries) has a negative effect on output growth in subsequent years. The reason is that small firms play an important role as agents of change being the source of entrepreneurial and innovative activity, stimulating industry evolution and creating an important share of new jobs. Hence, countries lagging behind in the industrial restructuring process that has resulted in most developed countries in a shift of employment and production to small firms have suffered a cost in terms of economic growth. On the other hand, Pagano and Schivardi (2001) find that countries with a higher share of small firms lag behind in terms of productivity growth. The reason is that large firms might be able to exploit better the possibilities of a given innovation. Hence, according to them, large firms are important for dynamic efficiency and therefore for growth. 3. Several institutional and policy factors can affect very differently the performance of small and large firms. For example, any fixed cost has a higher importance for smaller firms, meaning that the reduction in red tape is even more important in an economy with diminishing firm size. Likewise, the design of the collective bargaining procedure or the financial system should react to the reported size reduction. 4. See Boeri and Cramer (1992), Armington and Acs (1999), Audretsch, Klomp and Thurik (1998). 5. Ruano (2000) uses the “Encuesta de Estrategias Empresariales”, a panel of manufacturing firms sponsored by the Spanish Ministry of Industry.

BANCO DE ESPAÑA 11 DOCUMENTO OCASIONAL N.º 0903
is to shed some light on the real impact of small firms on aggregate employment in Spain.
One novelty of the paper is to go beyond the traditional manufacturing-service sector division
and explore these issues in industries differing in their technology intensity within each of the
main sectors. We find that the analysis at this level of disaggregation uncovers some
sector-wide interesting differences.
The database used in this paper, with firm-level information from the provincial firm
registries and the National Institute of Statistics (INE), offers at least four advantages
with respect to other databases. First, there is little undersampling of small and young firms.
Second, it includes all entries and exits. Third, the dataset covers the whole market economy
(but the financial sector). Moreover, we have detailed sector information (4-digit) which allows
us to go beyond the traditional manufacturing versus service distinction. Fourth and last
characteristic of our dataset is the high-frequency of the data which allows us to compute
year-to-year employment changes. This is important to be able to compute accurately
the contribution of new firms to employment.6
The next section describes the dataset and explains some measurement issues.
Section 3 shows employment creation rates by firm size and sector and presents some
regularities of the Spanish job creation process. Section 4 looks at the employment growth
of different cohorts of firms. Section 5 studies the development of the firm size distribution
along time and across sectors, and, finally, section 6 concludes.
6. Other studies are only able to compute employment changes from wave to wave of data, like the very influential Dunne, Roberts and Samuelson (1989). In that paper, new firms could be up to five years old when their employment contribution is computed. That information is interesting but different, in our opinion, from the contribution of entries to aggregate employment.
BANCO DE ESPAÑA 12 DOCUMENTO OCASIONAL N.º 0903
2 Data and measurement
2.1 Data
The Bank of Spain Firm Demography Database (BSFDD) contains information on sector of
activity (at 4 digits), legal form and employment at firm-level for about 90,000-200,000
Spanish Limited Liability Societies and Corporations operating in all sectors of the market
economy (but the financial one) each year between 1996 and 2003. Data come from two
sources: the “Directorio Central de Empresas” (DIRCE)7, with information stemming from tax
and social security records, and the “Central de Balances del Banco de España” (CB), which
processes data from the provincial firm registries.
For a detailed account of the construction of the dataset, please refer to
López-García and Puente (2007b). However, three important points of the construction
process are worth stressing and repeating here. First of all although all companies
(not self-employed) are obliged by law to deposit every year their financial accounts in the
provincial firm registries, they often choose not to. Moreover, reporting employment data is
not compulsory but voluntary. The result is that amongst the firms that present coherent
financial statements and employment figures at least one year, many disappear from the
registry to appear year/s later. That means that we are unable to deduct the date of entry and
exit of the firms solely from the presence or absence of data in the registry, as it is done in
other countries. For that reason we had to resort to a second information source, DIRCE,
to get information on all entries and exits within the period of analysis.8 Information for all the
rest of active firms every year comes from the firm registries.
Secondly, the unit of production considered is the firm. We only have data on
Limited Liability Companies and Corporations, not on self-employed workers.9 There are no
employment thresholds, that is, we also have firms with no employees (only when they are
constituted as Limited Liabilities Companies or Corporations). As it was mentioned before,
the number of firms, as well as their employment and sector of activity, that enter or exit the
market every year is provided by DIRCE. DIRCE records an entry whenever a new fiscal
identification number is given to a firm. An exit is recorded when a fiscal identification number
disappears. That means that any restructuring of firms (merges and acquisitions) resulting in a
new identification number will be recorded as an entry by DIRCE. Using information from
large firms collaborating with the Bank of Spain we have estimated that around 5% of entries
of firms with less than 20 employees and most of the entries recorded by DIRCE of firms with
more than 100 employees could be the result of some kind of restructuring process or “false”
entries. Please bear in mind all these caveats when interpreting the results presented in the
paper.
Finally, after cleaning the data we cannot assume that the remaining sample of firms
is representative of the population. For that reason we computed annual sampling weights for
each firm in the data set according to its 2-digit sector of activity, employment segment and
status (continuing firm, entry or exit), using as the population benchmark the aggregate data
from DIRCE. The resulting comparison of our database vis-à-vis DIRCE is shown in Figure 1.
7. Managed by the National Institute of Statistics (INE). 8. DIRCE has provided as well the employment and the sector of activity at entry or exit. 9. Which are about 60% of all Spanish firms.
BANCO DE ESPAÑA 13 DOCUMENTO OCASIONAL N.º 0903
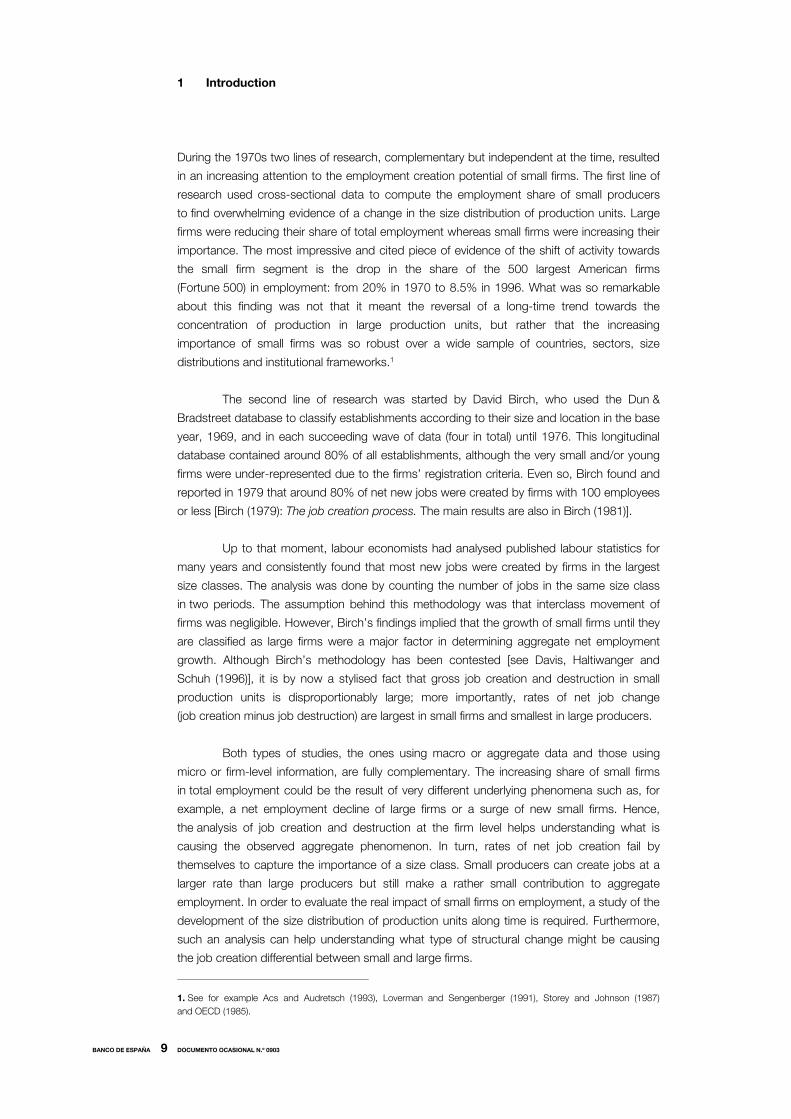
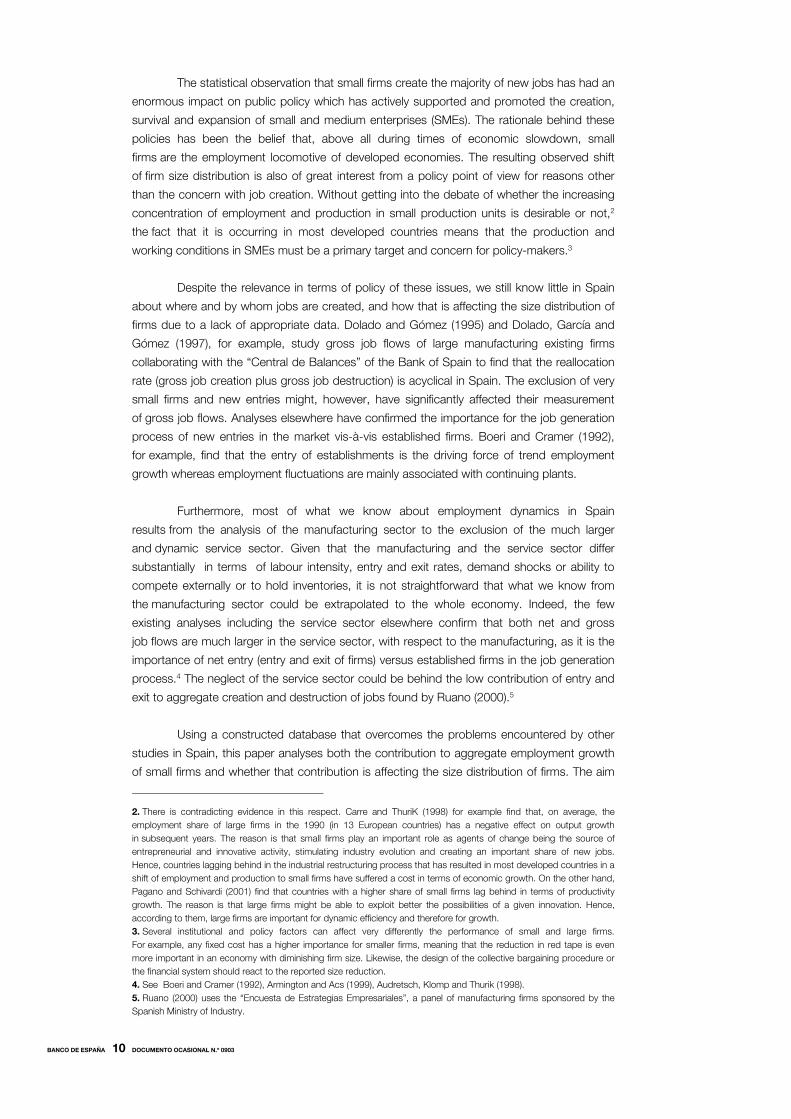
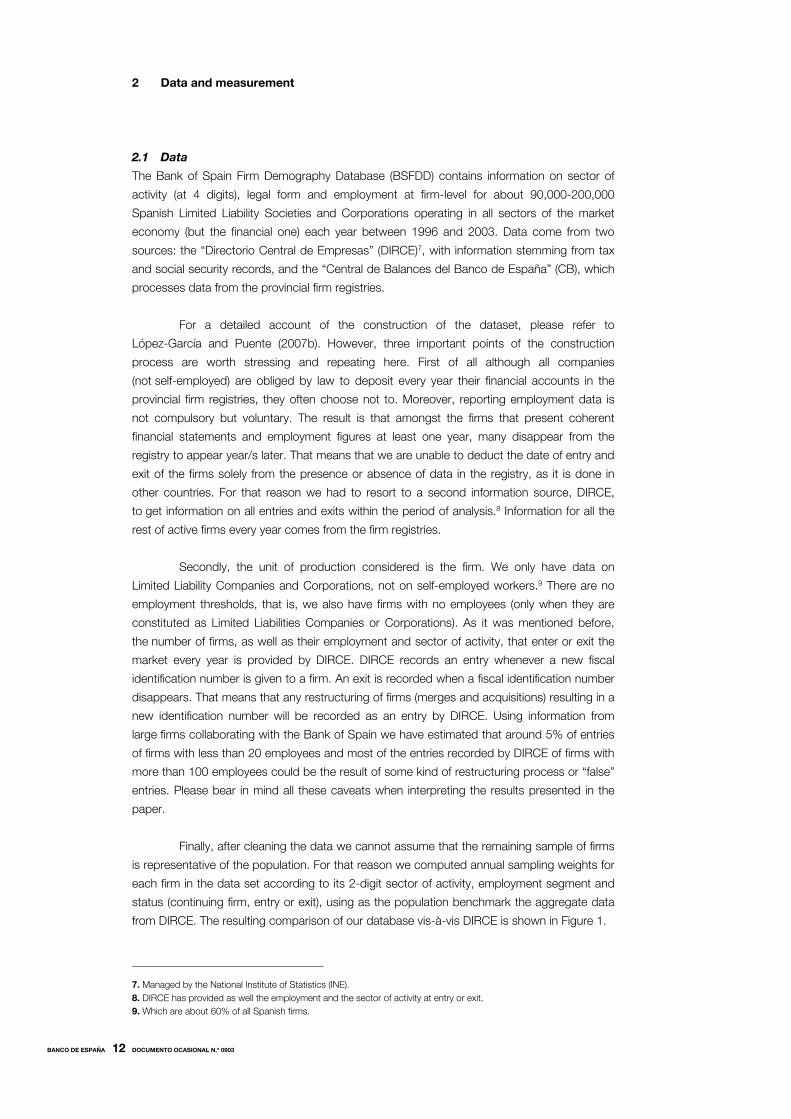
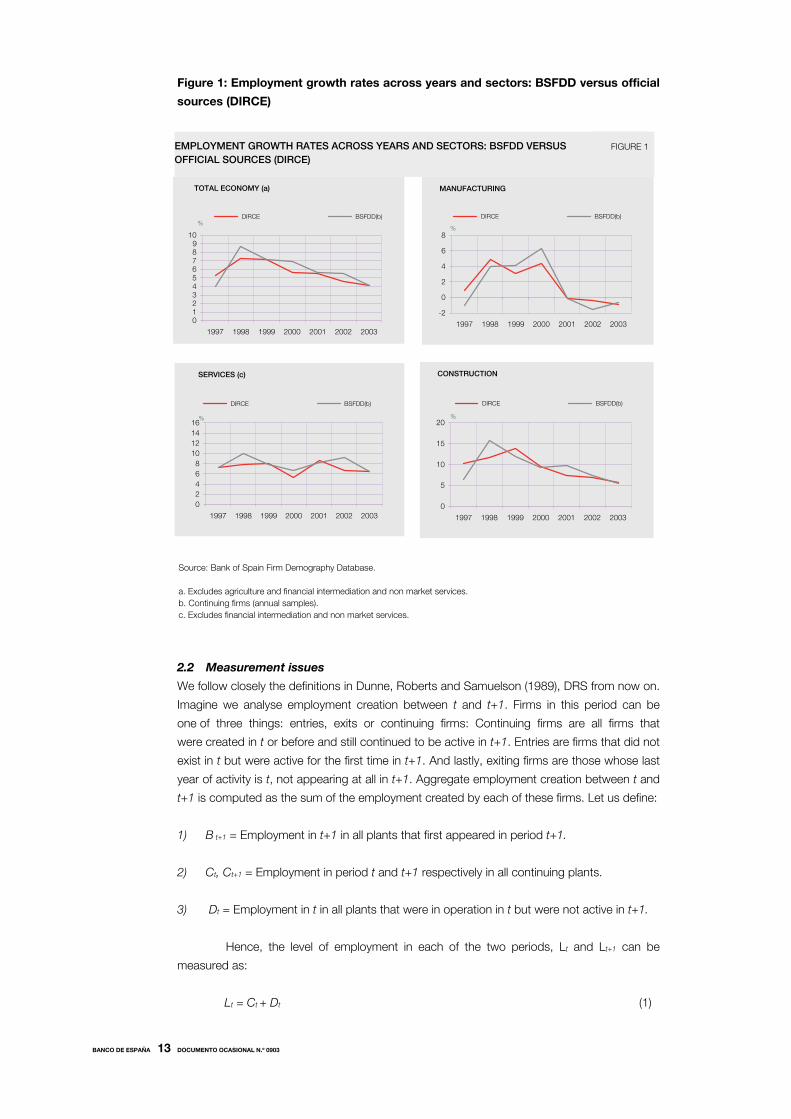
Figure 1: Employment growth rates across years and sectors: BSFDD versus official
sources (DIRCE)
2.2 Measurement issues
We follow closely the definitions in Dunne, Roberts and Samuelson (1989), DRS from now on.
Imagine we analyse employment creation between t and t+1. Firms in this period can be
one of three things: entries, exits or continuing firms: Continuing firms are all firms that
were created in t or before and still continued to be active in t+1. Entries are firms that did not
exist in t but were active for the first time in t+1. And lastly, exiting firms are those whose last
year of activity is t, not appearing at all in t+1. Aggregate employment creation between t and
t+1 is computed as the sum of the employment created by each of these firms. Let us define:
1) B t+1 = Employment in t+1 in all plants that first appeared in period t+1.
2) Ct, Ct+1 = Employment in period t and t+1 respectively in all continuing plants.
3) Dt = Employment in t in all plants that were in operation in t but were not active in t+1.
Hence, the level of employment in each of the two periods, Lt and Lt+1 can be
measured as:
Lt = Ct + Dt (1)
-2
0
2
4
6
8
1997 1998 1999 2000 2001 2002 2003
DIRCE BSFDD(b)
MANUFACTURING
%
EMPLOYMENT GROWTH RATES ACROSS YEARS AND SECTORS: BSFDD VERSUSOFFICIAL SOURCES (DIRCE)
FIGURE 1
Source: Bank of Spain Firm Demography Database.
a. Excludes agriculture and financial intermediation and non market services.
b. Continuing firms (annual samples).
c. Excludes financial intermediation and non market services.
0
5
10
15
20
1997 1998 1999 2000 2001 2002 2003
DIRCE BSFDD(b)
CONSTRUCTION
%
0
2
4
6
8
10
12
14
16
1997 1998 1999 2000 2001 2002 2003
DIRCE BSFDD(b)
%
SERVICES (c)
0123456789
10
1997 1998 1999 2000 2001 2002 2003
DIRCE BSFDD(b)%
TOTAL ECONOMY (a)

BANCO DE ESPAÑA 14 DOCUMENTO OCASIONAL N.º 0903
Lt+1 = Ct+1 + Bt+1 (2)
The net change in employment between the two periods is given by
ΔLt+1 = (Ct+1 – Ct )+ Bt+1 - Dt (3)
According to (3), the net change in employment equals the net employment created
by continuing firms plus the employment created by entries in the period minus employment
lost due to the exit of firms. Recall that we have an unbalanced panel of firms and annual
sample weights. These two facts together imply that, for continuing firms, we must first
calculate their aggregate employment each year and then calculate the year-to-year variation.
The reverse order, that is, to calculate each firms’ employment growth and then aggregate
over all continuing firm in the period is not feasible given the characteristics of our dataset.10
The implication is that the net contribution of continuing firms cannot be disentangled into the
gross contribution of expanding and contracting firms.
10. This reverse order would require sample weights for firms operating two consecutive periods in order to recover the population equivalent of firm level employment growth rates. This in turn requires knowing the number of firms active two consecutive years in the population. Unfortunately, this piece of information is not published by DIRCE; we have only annual population figures.
BANCO DE ESPAÑA 15 DOCUMENTO OCASIONAL N.º 0903
3 The contribution to job creation of small firms
In the mid-70s David Birch used for the first time a longitudinal dataset to track
establishments along time. He concluded that very small establishments, defined as having
less than 20 employees, created 6 out of every 10 new jobs [Birch (1979): The job creation
process. The main results are also in Birch (1981)]. Birch´s claim was challenging at the time:
It implied that interclass movements (small firms growing until they are classified as
large firms) were a major factor in determining aggregate employment growth. Although
Birch´s methodology has been contested [Davis, Haltiwanger and Schuh (1996), DHS from
now on],11 it is by now a stylised fact that gross job creation and destruction of small firms is
disproportionably large, although their impact on aggregate employment is still in debate
[see Segenberger, Loveman and Piore (1990) and Storey and Johnson (1987) for a summary
of OECD studies]. This section investigates whether small producers in Spain are as
important for aggregate job creation as it has been reported elsewhere.
How to assign a size class to a given firm has been the subject of a long debate in
the literature. In its seminal work Birch (1979) used the size of the initial year of observation as
defining variable. However DHS uncovered years later that such classification biased results in
favour of small firms due to the so-called regression-to-the-mean problem (see footnote 11).
In their paper they proposed instead to use the average size of the firm over the period of
analysis. This choice avoided the regression-to-the-mean bias indeed but introduced a bias
towards large firms given that small firms that grew fast over the period would be classify
as medium or large firms and their growth would be assign to that size class. Although both
size classifications are imperfect, most empirical studies opt to use average size (or both initial
and average size to contrast the results) to classify firms as large or small because
it is expected to give a better indication of the intended scale of operations of the firm.
Given this argument and the specific characteristics of our dataset we also choose to classify
firms according to their period average size, although always keeping in mind that this choice
might bias the results somehow in favour of medium or large firms.
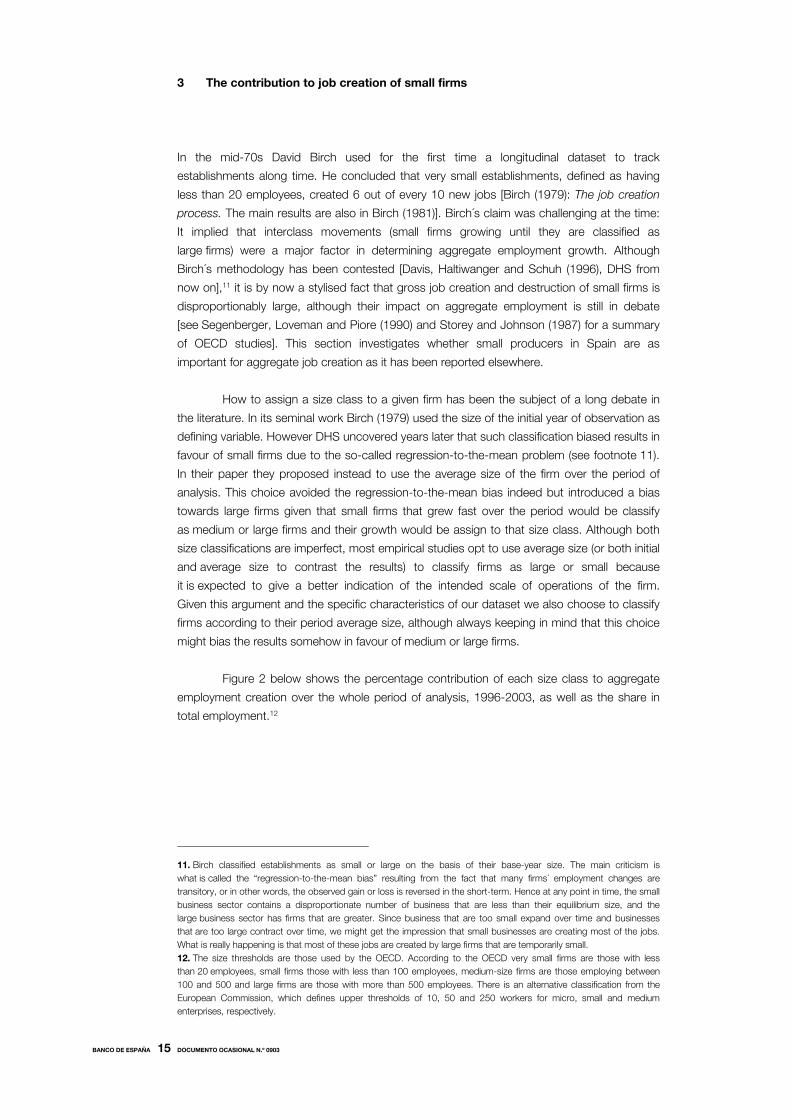
Figure 2 below shows the percentage contribution of each size class to aggregate
employment creation over the whole period of analysis, 1996-2003, as well as the share in
total employment.12
11. Birch classified establishments as small or large on the basis of their base-year size. The main criticism is what is called the “regression-to-the-mean bias” resulting from the fact that many firms´ employment changes are transitory, or in other words, the observed gain or loss is reversed in the short-term. Hence at any point in time, the small business sector contains a disproportionate number of business that are less than their equilibrium size, and the large business sector has firms that are greater. Since business that are too small expand over time and businesses that are too large contract over time, we might get the impression that small businesses are creating most of the jobs. What is really happening is that most of these jobs are created by large firms that are temporarily small. 12. The size thresholds are those used by the OECD. According to the OECD very small firms are those with less than 20 employees, small firms those with less than 100 employees, medium-size firms are those employing between 100 and 500 and large firms are those with more than 500 employees. There is an alternative classification from the European Commission, which defines upper thresholds of 10, 50 and 250 workers for micro, small and medium enterprises, respectively.
BANCO DE ESPAÑA 16 DOCUMENTO OCASIONAL N.º 0903
Figure 2: The contribution to job creation and employment by size class, 1996-2003
The smallest size class, firms with less than 20 employees, was responsible for
about 50% of all net job creation of the period but employed only a third of all workers. That
is, the employment creation of small firms in Spain is much larger than their corresponding
share in employment. Larger firms belonging to all the rest of size classes contributed
proportionally less than their employment share to job creation.
The large contribution to net employment creation of small firms should not be taken
to imply that all small firms create jobs at a uniform rate. On the contrary, there is piling
evidence that relatively few firms are responsible for the majority of jobs created in the small
firm sector. Storey and Johnson (1987), for example, show for the UK that 88% of firms that
had less than 20 employees in 1982 still had less than 20 employees in 1984 and only 2%
grew past that threshold. However, that 2% of firms managed to create over half a million
jobs. Gallagher and Stewart (1986) do the same kind of exercise for the UK over a 10-year
period to reach a similar conclusion: 2.3% of firms with less than 20 employees in 1971 that
survived to 1981 had in 1981 more than 100 employees. The vast majority of survivors
remained in the “very small category”. Teitz et al. (1981) show similar results for a sample of
Californian firms whereas the Fifth Report of Enterprises of Europe (European Commission)
and OECD (1985) confirm the fact that only a small percentage of small firms are truly
contributing to overall job creation in other OECD countries. The analysis of the job creation
winners, or high growth firms, in Spain is beyond the scope of this paper. However, we have
deepened into the topic in a companion paper where the proportion, job creation potential
and characteristics of the Spanish high growth firms are analysed. We find among other
things that only about 8% of small firms (less than 20 employees) can be classified
as high-growth. However, those few firms create between 70 and 100% of all jobs created by
the small size class over the period.13
The evidence is contradictory, however, as to whether the few small winners
come from the pool of young firms, who happen to start-up small and grow fast during
their first years of operations, or from the pool of mature small firms, or from both.
Birch himself concluded in his seminal paper that “not all small businesses are job creators.
13. See López-García and Puente (2009), forthcoming.
THE CONTRIBUTION TO JOB CREATION AND EMPLOYMENT BY SIZE CLASSAnnual averages
FIGURE 2
Sources: Bank of Spain Firm Demography Database.
0
10
20
30
40
50
60
<20 20-49 50-99 100-249 250-499 >500
SHARE IN JOB CREATION SHARE IN TOTAL EMPLOYMENT
%
BANCO DE ESPAÑA 17 DOCUMENTO OCASIONAL N.º 0903
The job creators are the relatively few younger ones that start-up and expand rapidly in their
youth, outgrowing the “small” designation in the process” [Birch (1981), page 8]. That is,
Birch observed that it was not so much the “smallness” of firms what mattered in job
creation but their age. This has been confirmed by other empirical studies. In the USA, for
example, Brown, Hamilton and Medoff (1990) observed that “existing small firms do not grow
faster than large ones but by an accident of birth new firms happen to be born small.
Since new businesses account for more than 100% of the net increase in employment, and
new businesses rarely start out with 100 or more employees, it is almost inevitable that
small firms will account for a disproportionate share of new employment” [Brown, Hamilton
and Medoff (1990), page 24].14 In Canada, Picot et al. (1994) found that employment growth
between 1981 and 1984 of Canadian firms already existing in 1981 (at least 3 years-old)
was of -14% in the group of very small firms, with 20 or less employees, and of -11% in the
group of large firms. If the birth of new firms and their contribution to employment growth
is added, the employment change among the very small firms is 12% and that among large
ones -9%. These results are robust along time. Their conclusion is the same as in Brown
et al. (1990): “The results for existing small and large firms are not that dissimilar. It is the fact
that new firms tend to be small that makes the difference” [Picot, Baldwin and Dupuy (1994),
page 18)]. In this same line, Hull (1986) analysed a sample of about 500 small German
manufacturers to conclude that “it is more the youth of small firms than their size which
makes them grow” [Hull (1986), page 24].
Other studies, however, have found that the superior job generation performance
of small firms vis-à-vis their larger counterparts is due both to age and size. Evans (1987)
uses USA manufacturing data to estimate the relationship between employment growth,
firm size and age. He finds that employment growth decreases with size given age, and with
age given size, and this is robust to alternative assumptions and functional forms of the
growth relationship. More recently, Gómez et al. (2004) compute gross job flows for 13
European countries in the 1990s using a sample of continuing firms. They find that job
reallocation (the sum of job creation and destruction) and also net job creation decreases
with the size of existing firms.
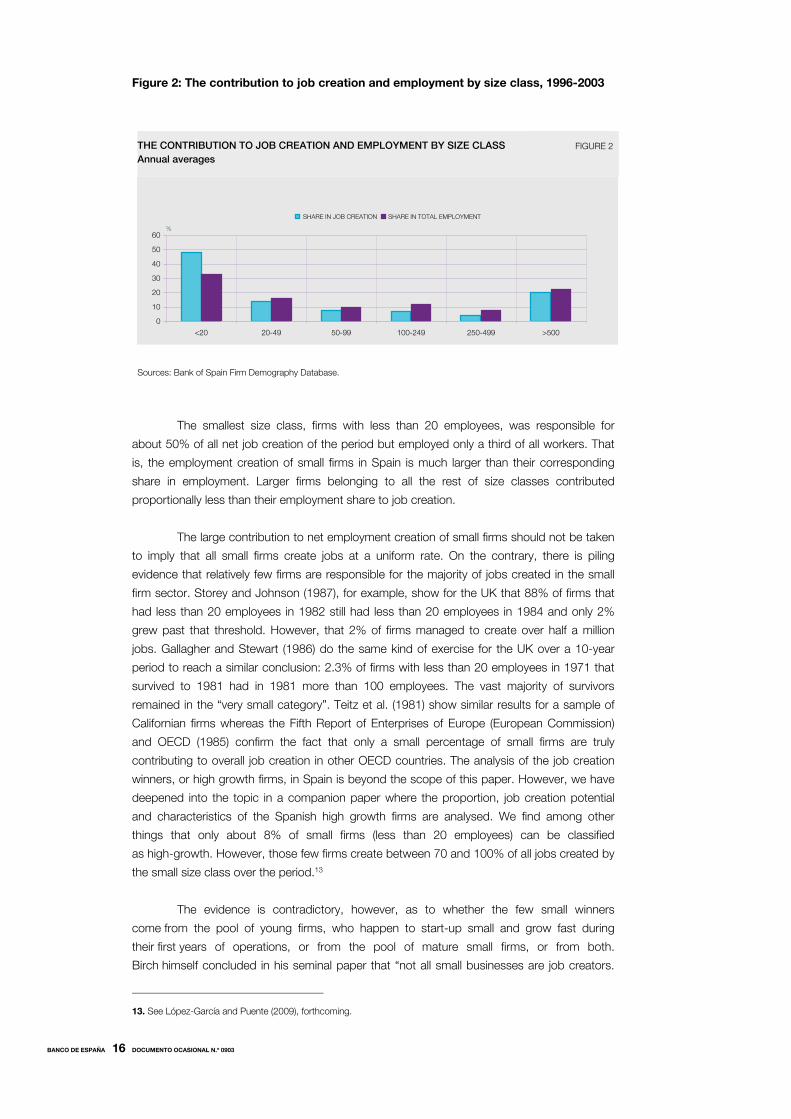
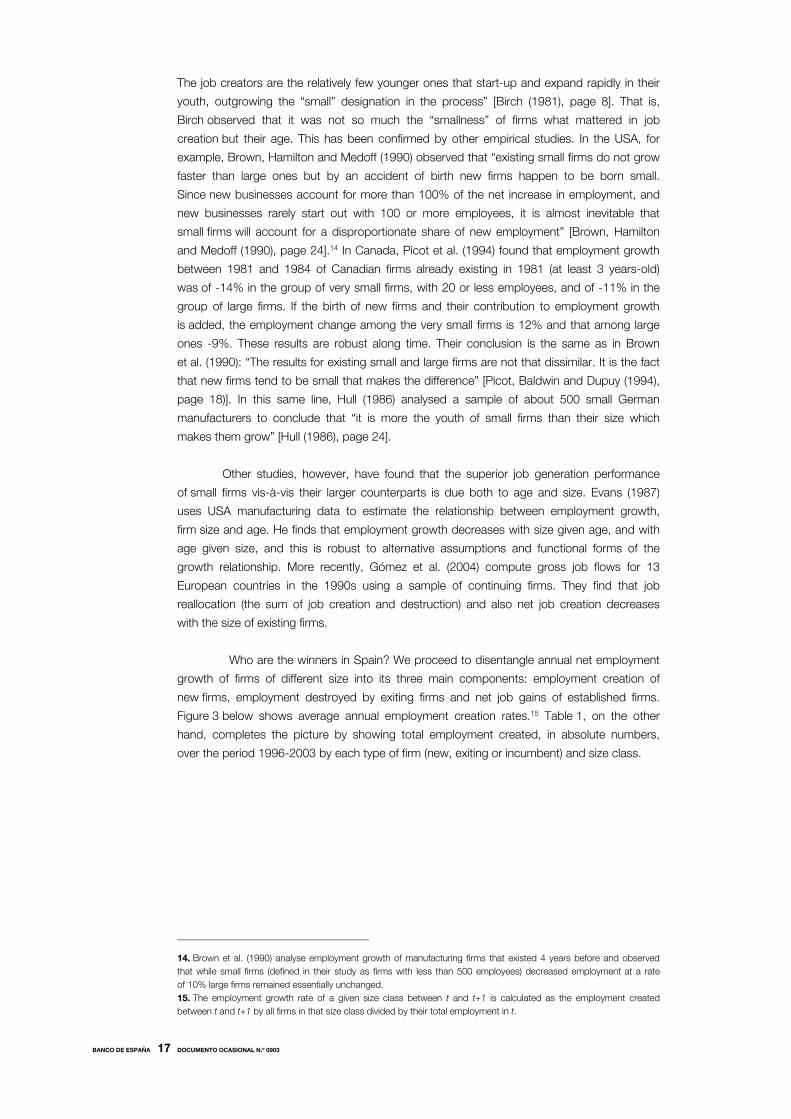
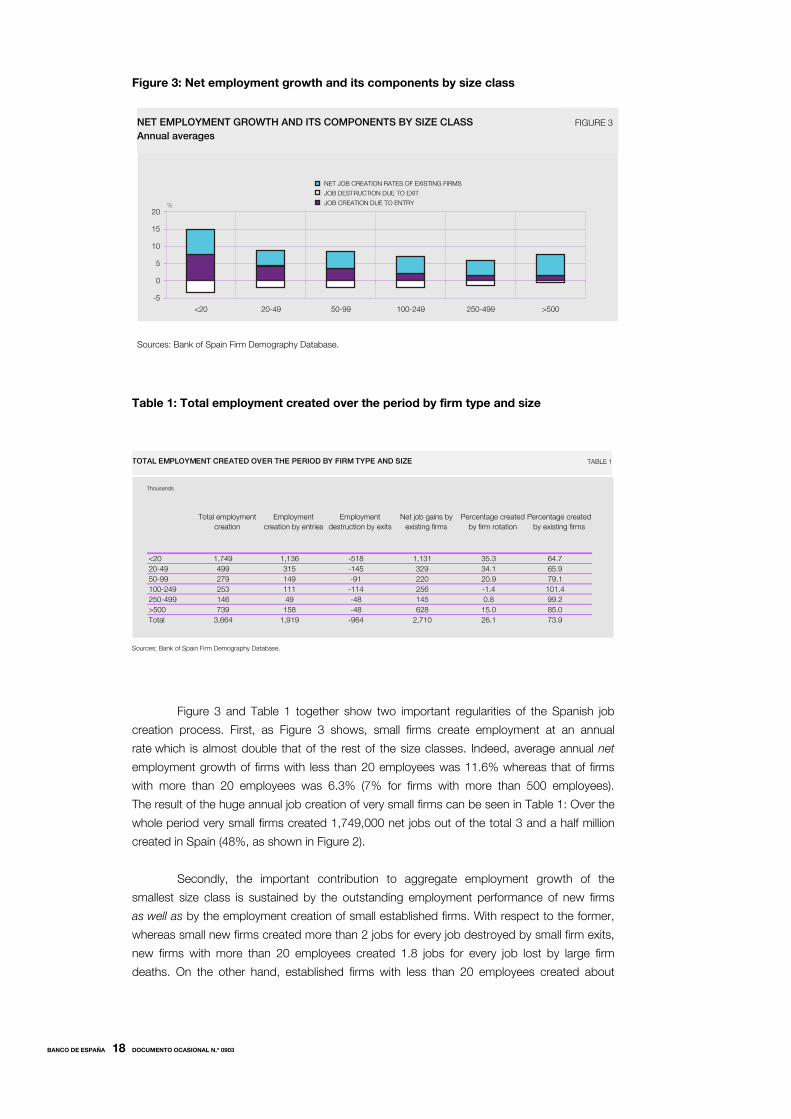
Who are the winners in Spain? We proceed to disentangle annual net employment
growth of firms of different size into its three main components: employment creation of
new firms, employment destroyed by exiting firms and net job gains of established firms.
Figure 3 below shows average annual employment creation rates.15 Table 1, on the other
hand, completes the picture by showing total employment created, in absolute numbers,
over the period 1996-2003 by each type of firm (new, exiting or incumbent) and size class.
14. Brown et al. (1990) analyse employment growth of manufacturing firms that existed 4 years before and observed that while small firms (defined in their study as firms with less than 500 employees) decreased employment at a rate of 10% large firms remained essentially unchanged. 15. The employment growth rate of a given size class between t and t+1 is calculated as the employment created between t and t+1 by all firms in that size class divided by their total employment in t.
BANCO DE ESPAÑA 18 DOCUMENTO OCASIONAL N.º 0903
Figure 3: Net employment growth and its components by size class
Table 1: Total employment created over the period by firm type and size
Total employment creation
Employment creation by entries
Employment destruction by exits
Net job gains by existing firms
Percentage created by firm rotation
Percentage created by existing firms
<20 1,749 1,136 -518 1,131 35.3 64.720-49 499 315 -145 329 34.1 65.950-99 279 149 -91 220 20.9 79.1100-249 253 111 -114 256 -1.4 101.4250-499 146 49 -48 145 0.8 99.2>500 739 158 -48 628 15.0 85.0Total 3,664 1,919 -964 2,710 26.1 73.9
Sources: Bank of Spain Firm Demography Database.
TOTAL EMPLOYMENT CREATED OVER THE PERIOD BY FIRM TYPE AND SIZE TABLE 1
Thousands
Figure 3 and Table 1 together show two important regularities of the Spanish job
creation process. First, as Figure 3 shows, small firms create employment at an annual
rate which is almost double that of the rest of the size classes. Indeed, average annual net
employment growth of firms with less than 20 employees was 11.6% whereas that of firms
with more than 20 employees was 6.3% (7% for firms with more than 500 employees).
The result of the huge annual job creation of very small firms can be seen in Table 1: Over the
whole period very small firms created 1,749,000 net jobs out of the total 3 and a half million
created in Spain (48%, as shown in Figure 2).
Secondly, the important contribution to aggregate employment growth of the
smallest size class is sustained by the outstanding employment performance of new firms
as well as by the employment creation of small established firms. With respect to the former,
whereas small new firms created more than 2 jobs for every job destroyed by small firm exits,
new firms with more than 20 employees created 1.8 jobs for every job lost by large firm
deaths. On the other hand, established firms with less than 20 employees created about
NET EMPLOYMENT GROWTH AND ITS COMPONENTS BY SIZE CLASSAnnual averages
FIGURE 3
Sources: Bank of Spain Firm Demography Database.
-5
0
5
10
15
20
<20 20-49 50-99 100-249 250-499 >500
NET JOB CREATION RATES OF EXISTING FIRMS
JOB DESTRUCTION DUE TO EXIT
JOB CREATION DUE TO ENTRY%
BANCO DE ESPAÑA 19 DOCUMENTO OCASIONAL N.º 0903
twice as many jobs as established firms with more than 500 employees.16 The last column of
Table 1 shows that the relative contribution of existing firms to the job creation record of each
size class increases with firm size. However, even within the small firm sector two-thirds of all
jobs were created by established firms.
Both regularities above have been established for the aggregate economy.
However, OECD (1985) and Picot et al. (1994) among others have proven that part of
the disproportionate employment creation of small firms is reflecting an activity shift
towards sectors with an above-average share of small firms, like services and construction.
Furthermore, it has been reported elsewhere that the employment contribution of firm
rotation (established firms) is much more (less) important in the service sector than in the
manufacturing one [see Boeri and Cramer (1992), Armington and Acs (1999) and Audretsch
et al. (1998)]. To check whether what we observe in the aggregate is robust across sectors,
we proceed to compute the contribution to employment creation and share in total
employment of small firms within each of the main economic sectors, manufacturing,
construction and services. Table 2 presents as well the average contribution to annual
employment growth of firm rotation and established firms within each of the sectors and size
class. Not to overcrowd this table and the followings, we show results only for the small and
large firm size class to stress size differences in job creation patterns. The OECD defines very
small firms as those with less than 20 employees and large firms as those with more than 500
employees. Given that the average firm size in Spain is smaller than in other OECD countries17
we have opted to show instead results for firms with less than 10 employees and for
firms with more than 250 employees although results are quite robust to the particular size
threshold used to define small firms.18
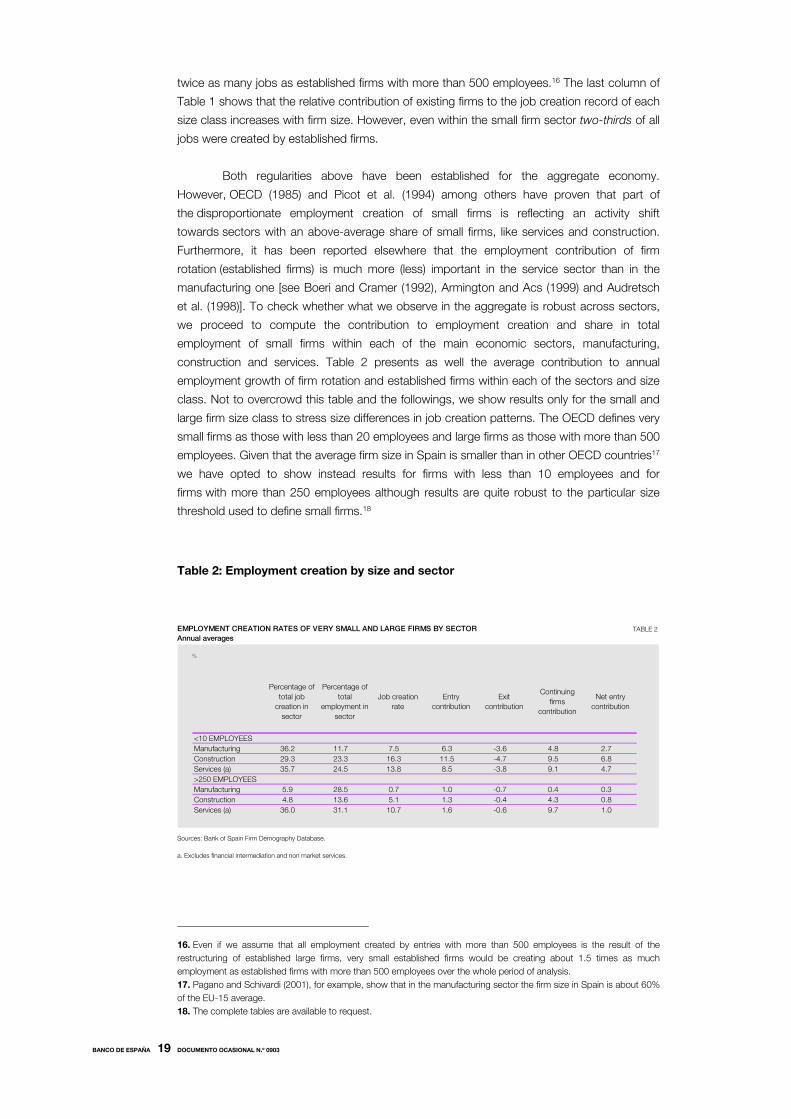
Table 2: Employment creation by size and sector
Percentage of total job
creation in sector
Percentage of total
employment in sector
Job creation rate
Entry contribution
Exit contribution
Continuing firms
contribution
Net entry contribution
<10 EMPLOYEESManufacturing 36.2 11.7 7.5 6.3 -3.6 4.8 2.7Construction 29.3 23.3 16.3 11.5 -4.7 9.5 6.8Services (a) 35.7 24.5 13.8 8.5 -3.8 9.1 4.7>250 EMPLOYEESManufacturing 5.9 28.5 0.7 1.0 -0.7 0.4 0.3Construction 4.8 13.6 5.1 1.3 -0.4 4.3 0.8Services (a) 36.0 31.1 10.7 1.6 -0.6 9.7 1.0
Sources: Bank of Spain Firm Demography Database.
a. Excludes financial intermediation and non market services.
EMPLOYMENT CREATION RATES OF VERY SMALL AND LARGE FIRMS BY SECTOR
Annual averagesTABLE 2
%
16. Even if we assume that all employment created by entries with more than 500 employees is the result of the restructuring of established large firms, very small established firms would be creating about 1.5 times as much employment as established firms with more than 500 employees over the whole period of analysis. 17. Pagano and Schivardi (2001), for example, show that in the manufacturing sector the firm size in Spain is about 60% of the EU-15 average. 18. The complete tables are available to request.
BANCO DE ESPAÑA 20 DOCUMENTO OCASIONAL N.º 0903
Table 2 shows that very small firms (less than 10 employees) create more net new
jobs than their corresponding employment share across all sectors of the economy.
The disproportion is largest in the manufacturing sector: Whereas firms with less than 10
employees employ barely 12% of all workers in the manufacturing sector, they create
more than one-third of annual manufacturing employment. Very small firms in construction
and services employ a larger share of the sector workers and create proportionally more jobs
every year but differences are not as striking as in the manufacturing sector.
Very small firms in the service and construction sectors increase employment
at an annual rate exceeding 13% over this period of economic boom, about twice the
annual job creation rate of small manufacturing firms. Even so, small manufacturing firms
create jobs at a rate ten times that of large manufacturing firms. The ratio is not even 1.5
in services. Table 2 shows that more than 2/3 of that large employment creation
differential between small and large manufacturing firms is due to the performance of small
industrial incumbents. The rest is explained by firm rotation. On the other hand, there are no
differences in the employment creation rates of existing small and large firms in the service
sector; the whole job creation difference between both firm size classes in services comes
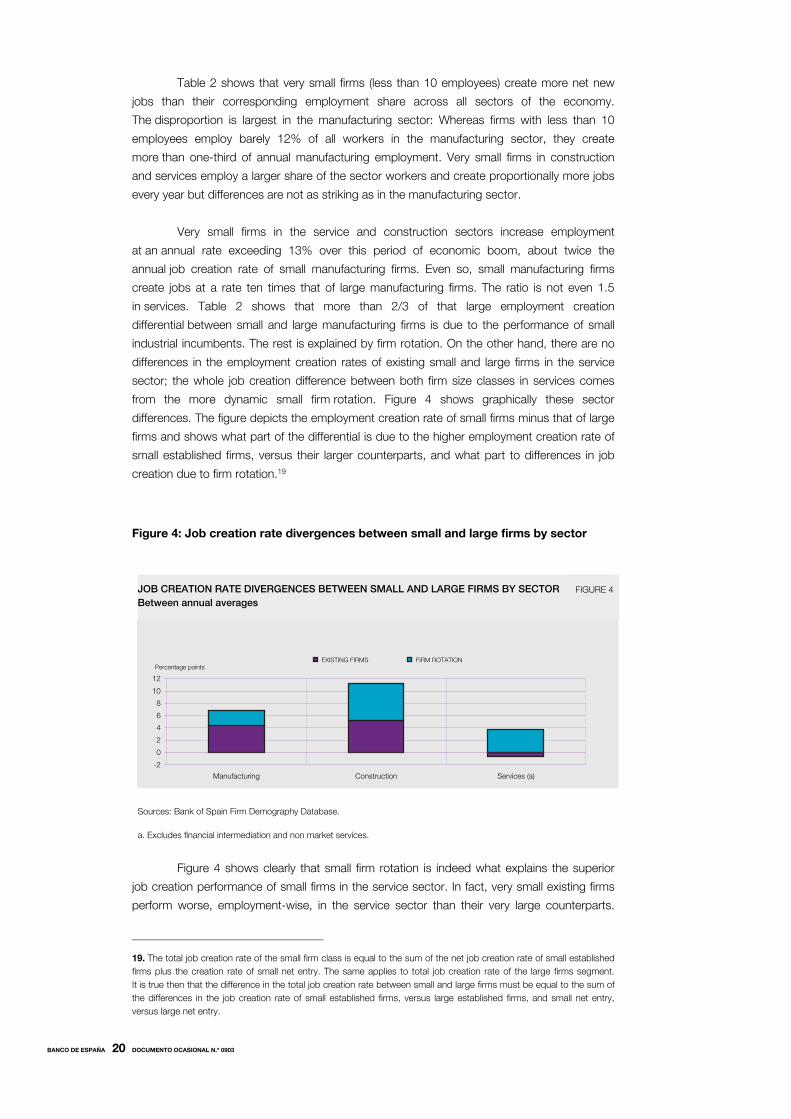
from the more dynamic small firm rotation. Figure 4 shows graphically these sector
differences. The figure depicts the employment creation rate of small firms minus that of large
firms and shows what part of the differential is due to the higher employment creation rate of
small established firms, versus their larger counterparts, and what part to differences in job
creation due to firm rotation.19
Figure 4: Job creation rate divergences between small and large firms by sector
Figure 4 shows clearly that small firm rotation is indeed what explains the superior
job creation performance of small firms in the service sector. In fact, very small existing firms
perform worse, employment-wise, in the service sector than their very large counterparts.
19. The total job creation rate of the small firm class is equal to the sum of the net job creation rate of small established firms plus the creation rate of small net entry. The same applies to total job creation rate of the large firms segment. It is true then that the difference in the total job creation rate between small and large firms must be equal to the sum of the differences in the job creation rate of small established firms, versus large established firms, and small net entry, versus large net entry.
JOB CREATION RATE DIVERGENCES BETWEEN SMALL AND LARGE FIRMS BY SECTORBetween annual averages
FIGURE 4
Sources: Bank of Spain Firm Demography Database.
a. Excludes financial intermediation and non market services.
-2
0
2
4
6
8
10
12
)a( secivreSnoitcurtsnoCgnirutcafunaM
EXISTING FIRMS FIRM ROTATIONPercentage points
BANCO DE ESPAÑA 21 DOCUMENTO OCASIONAL N.º 0903
On the other hand, in the manufacturing sector firm rotation is, in average, less important than
established firms to explain the job creation differential of small firms.
Table 2 and Figure 4 show that the very large employment creation record of small
firms in Spain is not responding solely to a sector shift towards more small-firm intensive
service sectors because it is a phenomenon taking place within each of the main economic
sectors. On the other hand, not all small firms create employment. The winners differ across
economic sectors. Whereas small firm rotation is what makes the difference in the service
sector, the employment contribution of both new firms and small incumbents are important
in the manufacturing one.
These regularities are robust across a number of dimensions. For example, in our
dataset established firms are those with one year or more, that is, they can be very young
firms. Age could be then the relevant factor to explain the relatively larger employment
creation of small manufacturing existing firms. In order to correct for the fact that our
established firms are younger than in other studies, we have recalculated employment
creation rates and their components using only established firms that already existed 3 years
before, that is, that are three years-old or more.20 Existing manufacturing firms will be then
similarly defined as those in Brown et al. (1990) and Picot at al. (1994), two of the studies that
found that small established firms did not perform differently than their larger counterparts
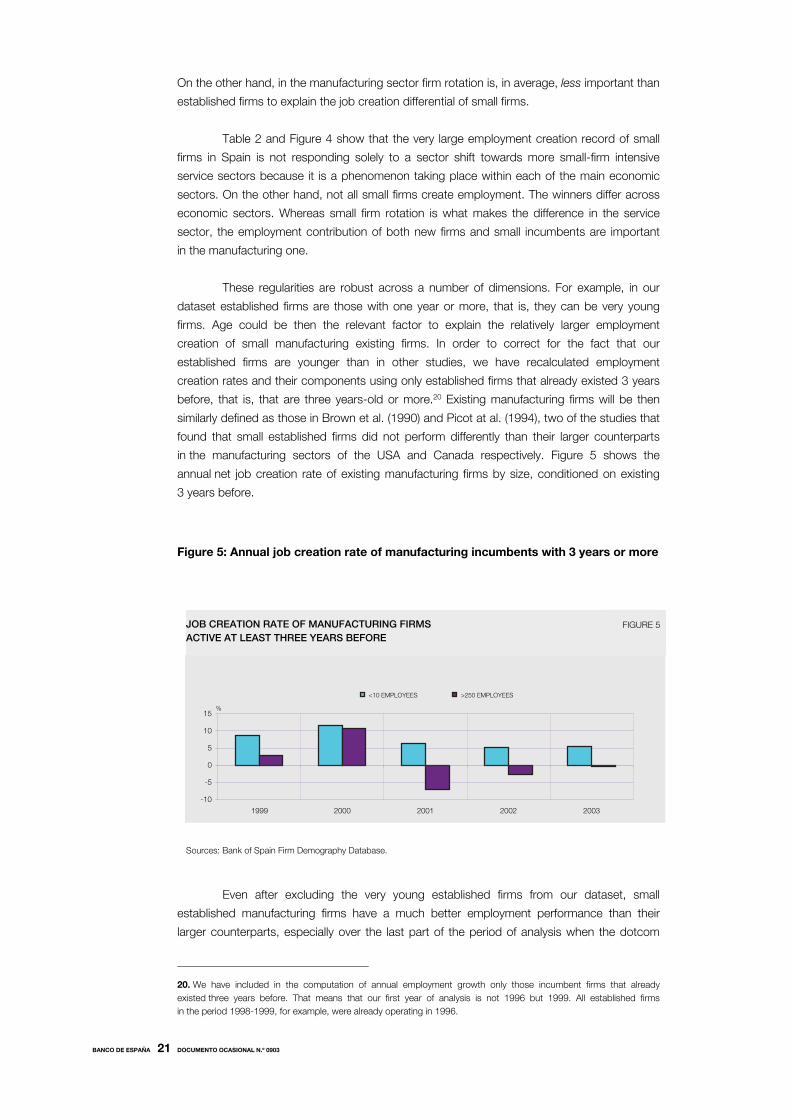
in the manufacturing sectors of the USA and Canada respectively. Figure 5 shows the
annual net job creation rate of existing manufacturing firms by size, conditioned on existing
3 years before.
Figure 5: Annual job creation rate of manufacturing incumbents with 3 years or more
Even after excluding the very young established firms from our dataset, small
established manufacturing firms have a much better employment performance than their
larger counterparts, especially over the last part of the period of analysis when the dotcom
20. We have included in the computation of annual employment growth only those incumbent firms that already existed three years before. That means that our first year of analysis is not 1996 but 1999. All established firms in the period 1998-1999, for example, were already operating in 1996.
JOB CREATION RATE OF MANUFACTURING FIRMSACTIVE AT LEAST THREE YEARS BEFORE
FIGURE 5
Sources: Bank of Spain Firm Demography Database.
-10
-5
0
5
10
15
1999 2000 2001 2002 2003
<10 EMPLOYEES >250 EMPLOYEES
%
BANCO DE ESPAÑA 22 DOCUMENTO OCASIONAL N.º 0903
bubble burst in the USA. Large existing firms had actually net job losses over that period
whereas small existing firms in the manufacturing sector continued creating employment.
The distinction between the manufacturing and service sector is useful in many
ways: To be able to compare with other similar studies, because they have traditionally
corresponded to the traded and non-traded sectors of the economy, and because their
technologies of production (capital intensity, minimum efficient scale of operations and so on)
used to divert significantly. However, last decades have brought about important
technological changes that have rendered the traditional manufacturing-service distinction
less useful. First of all, the information and communications technologies (ICT) have made
it possible to delocalise services such as calling centres or IT support. That means that, at
least some part, of the service sector can now be traded and is subject to international
competition. In Spain, the liberalisation of the telecommunication industries has contributed
as well to that process. Secondly, the adoption of ICT in traditional service industries such as
retail and wholesale trade during the 90s is dramatically changing the minimum efficient scale
of operations and productivity growth patterns of a traditionally labour intensive sector21.
The result of these tendencies is the coexistence within the manufacturing and service sector
of industries of very different technology nature. For this reason it might be of interest to
explore whether the regularities observed for each economic sector hold across industries
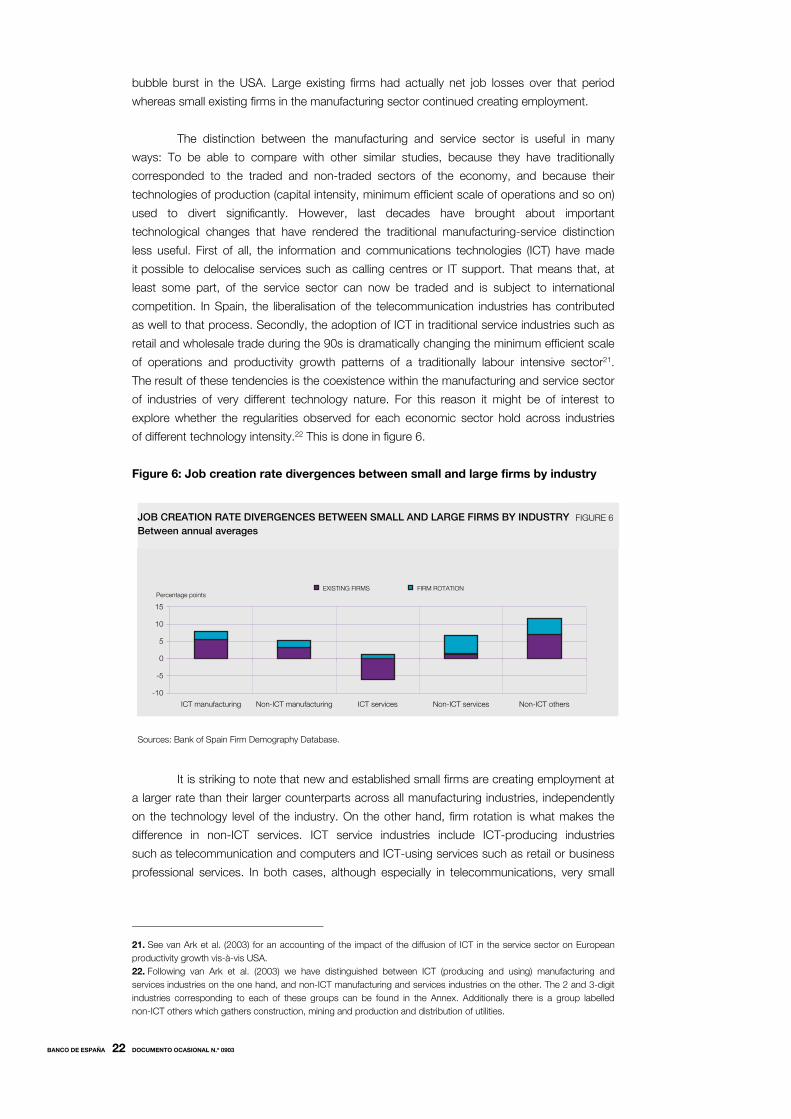
of different technology intensity.22 This is done in figure 6.
Figure 6: Job creation rate divergences between small and large firms by industry
It is striking to note that new and established small firms are creating employment at
a larger rate than their larger counterparts across all manufacturing industries, independently
on the technology level of the industry. On the other hand, firm rotation is what makes the
difference in non-ICT services. ICT service industries include ICT-producing industries
such as telecommunication and computers and ICT-using services such as retail or business
professional services. In both cases, although especially in telecommunications, very small
21. See van Ark et al. (2003) for an accounting of the impact of the diffusion of ICT in the service sector on European productivity growth vis-à-vis USA. 22. Following van Ark et al. (2003) we have distinguished between ICT (producing and using) manufacturing and services industries on the one hand, and non-ICT manufacturing and services industries on the other. The 2 and 3-digit industries corresponding to each of these groups can be found in the Annex. Additionally there is a group labelled non-ICT others which gathers construction, mining and production and distribution of utilities.
JOB CREATION RATE DIVERGENCES BETWEEN SMALL AND LARGE FIRMS BY INDUSTRYBetween annual averages
FIGURE 6
Sources: Bank of Spain Firm Demography Database.
-10
-5
0
5
10
15
ICT manufacturing Non-ICT manufacturing ICT services Non-ICT services Non-ICT others
EXISTING FIRMS FIRM ROTATIONPercentage points

BANCO DE ESPAÑA 23 DOCUMENTO OCASIONAL N.º 0903
established firm perform worse than very large established firms to the extent that total annual
job creation rate of very small firms is lower than that of large firms.23
Why do small firms have a better employment performance than their larger
counterparts? There are two possible answers. The first one is that the greater contribution of
small firms is due to some sort of life cycle, whereby fast-growing firms enter small and
expand over some years to converge to the average sector size. The second possibility is that
the better performance of small firms reflects greater entrepreneurship and hence growth
amongst the “small business sector” that typically does not make the transition to the “large
business sector”, which is coherent with a reduction in the optimal firm size. The next section
explores this question by analysing the growth pattern of different cohorts of firms entering
in different sectors of the economy. Our findings suggest that at least part of the latter
possibility, a particular small firm dynamism, is present in Spain.
23. This is the only case in which size thresholds to define small and large firms do make a difference in computed job creation rates. For example, if instead of depicting annual job creation rates of very small firms versus that of very large firms one computes differences between very small firms and the rest (grouping all firms with more than 10 employees), the results concerning ICT services change to a picture very similar to non-ICT service industries: Although small existing firms perform as their larger counterparts employment-wise, the huge employment creation due to small firm rotation brings the annual job creation rate of firms with less than 10 employees above that of larger firms. Hence it seems that very large established firms in the ICT service industries do indeed create employment at very large annual rates but that is not the case for medium-size established firms (very broadly defined), outperformed by very small ones.
BANCO DE ESPAÑA 24 DOCUMENTO OCASIONAL N.º 0903
4 Employment growth of new firms in Spain
There is mixed evidence on how total employment of new cohorts of firms evolves as their
age. The reason is that there are two forces at work: on the one hand, new firms enter
small and then grow faster than incumbents in their same sector of activity to converge to the
minimum efficient scale of the sector. On the other hand, failure rates of new or young firms
are higher than those of established firms [see for example Bartelsman et al. (2003)]. DRS for
the USA and Mata, Portugal and Guimaraes (1995) for Portugal find a net fall of employment
of different cohort of firms in years subsequent to entry. That is, the destruction of
employment due to the exit of young firms outweighed their higher employment
growth. On the contrary, Baldwin (1995) found for Canada a net increase of cohorts’ total
employment along time whereas Boeri and Cramer (1992) found that German new firms
increased their employment during the first or second years of operations to decrease it
afterwards.
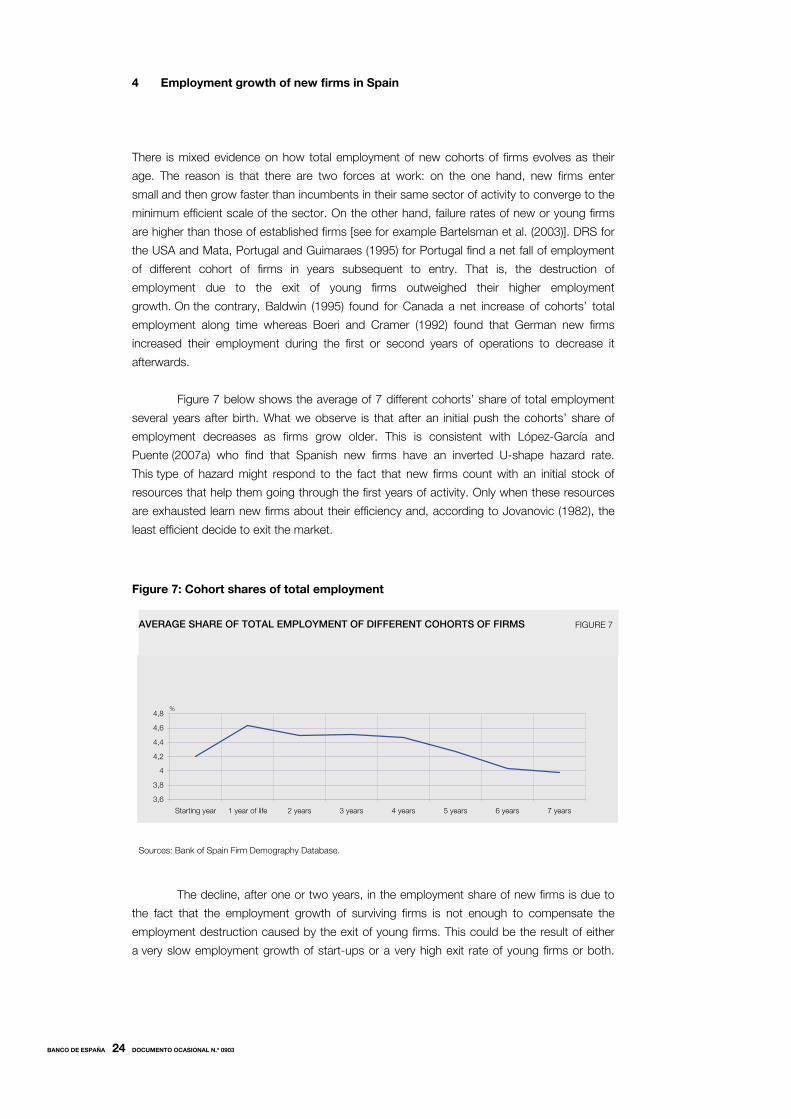
Figure 7 below shows the average of 7 different cohorts’ share of total employment
several years after birth. What we observe is that after an initial push the cohorts’ share of
employment decreases as firms grow older. This is consistent with López-García and
Puente (2007a) who find that Spanish new firms have an inverted U-shape hazard rate.
This type of hazard might respond to the fact that new firms count with an initial stock of
resources that help them going through the first years of activity. Only when these resources
are exhausted learn new firms about their efficiency and, according to Jovanovic (1982), the
least efficient decide to exit the market.
Figure 7: Cohort shares of total employment
The decline, after one or two years, in the employment share of new firms is due to
the fact that the employment growth of surviving firms is not enough to compensate the
employment destruction caused by the exit of young firms. This could be the result of either
a very slow employment growth of start-ups or a very high exit rate of young firms or both.
AVERAGE SHARE OF TOTAL EMPLOYMENT OF DIFFERENT COHORTS OF FIRMS FIGURE 7
Sources: Bank of Spain Firm Demography Database.
3,6
3,8
4
4,2
4,4
4,6
4,8
Starting year 1 year of life 2 years 3 years 4 years 5 years 6 years 7 years
%

BANCO DE ESPAÑA 25 DOCUMENTO OCASIONAL N.º 0903
Table 324 below shows that firms’ exit is not the “problem” in Spain: After 7 years of
operation, only about 20% of firms of a given cohort have exited the market.25 This is
something happening with each of the cohorts under study. The relatively low exit rates
of Spanish firms (please keep in mind that the BSFDD dataset comprises only Limited Liability
Societies and Corporations, not self-employed workers) is something already observed in
other studies like López-García and Puente (2007a), Núñez (2004) and Ruano (2000).
Table 3: Firms belonging to different cohorts active every year after entry
1996 1997 1998 1999 2000 2001 2002 2003
cohort 1996 100 98 96 93 89 86 82 80cohort 1997 100.0 97.8 95.3 91.5 87.5 84.0 81.2cohort 1998 100.0 98.0 94.9 91.4 87.9 85.3cohort 1999 100.0 97.6 94.4 90.9 87.9cohort 2000 100.0 97.4 94.0 90.9cohort 2001 100.0 97.4 94.7cohort 2002 100.0 97.6
Sources: Bank of Spain Firm Demography Database.
FIRMS ACTIVE EVERY YEAR AFTER ENTRY TABLE 3
%
If it is not the exit of young firms what explains the decline in new cohorts’ share of
employment, it must be that new firms grow quite slowly. Figure 8 below shows that this is
the case, above all in the manufacturing sector. Given that employment growth of new firms
depends crucially on their market of reference, Figure 8 shows the ratio of employment of
each firm to its 2-digit sector of activity average size along time. We show those ratios for all
firms belonging to each of the main economic sectors.
24. The table shows the number of firms, as percentage of the initial stock of firms, belonging to each cohort that remain active every subsequent year after entering the market. 25. This exit rate of firms is quite low. Bartelsman et al. (2003), for example, calculated that after 7 years about 60% of firms have exited the market in Finland, Germany and Canada. The percentage was about 50% in Portugal, Italy and the USA.

BANCO DE ESPAÑA 26 DOCUMENTO OCASIONAL N.º 0903
Figure 8: Employment convergence of new firms to the sector average size
First of all, entrants are about a third of the average size of the incumbents in their
reference sector within the manufacturing and the service sector. Second, first year
employment growth of firms is larger than that of subsequent years, which is consistent
with the growth path of new cohorts’ employment share shown in Figure 7. Third, after 7
years of activity Spanish firms have not reached yet the average size of established firms
in their market of reference. Growth of new cohorts of firms is relatively slower in the
manufacturing sector vis-à-vis the service sector.
To get a feeling of whether Spanish new cohorts of firms grow slower than
in other countries, Figure 9 shows the employment gains of surviving firms belonging to
different cohorts at 2, 4 and 7 years after entry relative to its initial employment for the three
main sectors of the market economy.
Figure 9: Employment gains of a new cohort of firm relative to initial employment
EMPLOYMENT CONVERGENCE OF NEW FIRMS TO SECTOR AVERAGE SIZEAverage employment of new firms/average 2 digits sector employment
FIGURE 8
Sources: Bank of Spain Firm Demography Database.
a. Excludes financial intermediation and non market services.
0
0,2
0,4
0,6
0,8
1
After 1 year After 2 years After 3 years After 4 years After 5 years After 6 years After 7 years
MANUFACTURING CONSTRUCTION
SERVICES (a)
EMPLOYMENT GAINS RELATIVE TO INITIAL EMPLOYMENT, AVERAGE DIFFERENT COHORTS
FIGURE 9
Sources: Bank of Spain Firm Demography Database.
-0,2
-0,1
0
0,1
0,2
0,3
0,4
0,5
0,6
secivreSnoitcurtsnoCgnirutcafunaM
EMPLOYMENT GAINS 2 YEARS AFTER ENTRY
AFTER 4 YEARS
AFTER 7 YEARS
BANCO DE ESPAÑA 27 DOCUMENTO OCASIONAL N.º 0903
In average, new manufacturing firms increase by 20% their initial employment seven
years after entry whereas new service firms manage to increase their employment by 50%
in the same time period. According to Bartelsman et al. (2003) these computed employment
gains of new cohorts are in line with other European countries and clearly below those in
the USA, where new firms double their initial employment in 7 years. However, the analysis
of Bartelsman et al. (2003) refers to firms entering the market in the late 1980s or early 1990s,
a period of economic slowdown due to the dotcom crisis of early 1990s. On the other
hand, the oldest cohort of firms in our analysis entered the market in 1996, when a long
period of economic growth had just started. Given the different moments of the business
cycle in which new firms entered the market in both analyses we would have expected higher
relative employment gains in the Spanish case. The fact that it is not the case suggests that
Spanish new firms grow slower than in other European countries.
What could explain the slow post-entry growth of Spanish firms? Bartelsman
et al. (2003) give some hints. As it was mentioned before, in their paper they find that
surviving European new firms enter larger but grow much slower than their American
counterparts. They conclude that the observed differences in post-entry behaviour seem to
indicate a greater degree of experimentation amongst entering firms in the United States
and obey to a given number of factors that could apply to the specific case of Spain. Among
those the fact that certain administrative costs at entry are fixed and very large in Spain could
be a disincentive for firm experimentation. Likewise, post entry adjustments in employment
may be hindered by rigidities arising from labour regulations, like hiring and firing restrictions.
Finally, higher risk aversion in project financing might result in lower financing possibilities for
entrepreneurs with small or innovative projects, often characterised by limited cash flows and
lack of collateral. Gómez, Messina and Vallanti (2004) also find that labour market institutions
such as employment protection and unemployment benefits reduce job reallocation rates in
a panel of European countries.
We do not explore further in this paper which or what group of these possible
reasons can explain the slow growth of Spanish new firms, leaving it for further research.26
What we do now is to focus on the fact that it is not so much “age”, or a life-cycle story, what
explains the huge share of jobs created by small firms in Spain. Our results suggest rather
that the “smallness” of the firms matters for their employment creation record. This small
firms’ dynamism is coherent with the increasing importance that small firms are having
in terms of aggregate employment and activity in other developed countries. The next section
explores this issue by analysing the evolution of the firm size distribution over time and across
sectors in Spain.
26. López-García and Puente will explore in a companion paper which are the factors that increase the probability that a firm grows fast.
BANCO DE ESPAÑA 28 DOCUMENTO OCASIONAL N.º 0903
5 Is the size distribution of firms in Spain changing?
As Baldwin and Picot (1995) suggest, the net employment creation rates for different size
classes are only partial measures that describe the dynamic path of adjustment of producers
in an industry. Imagine, for example, that a technology shock or a shift in demand prompts
the entry of a wave of small new firms. In the short-run we will observe high small firms’ job
creation rates. Whether this shock has an impact in the short-run on the firm size distribution
depends on whether the new entries displace other existing small firms, in which case the
total share in employment of small plants might not change, or whether they displace other
large firms or no firms at all. In the latter two cases we might observe a temporary surge in
small firms’ employment share. In the long-run the new firms might move along the learning
curve and grow to produce at a larger scale. In this case after the initial surge, small firms’
employment share might decline and that of medium or large firms start increasing. If, on the
other hand, the learning process was not so important and new technologies were exploited
better at a smaller scale the explosive employment growth of small firms would be maintained
along time. The consequence would be a shift in the size distribution towards the small size
class along time. Hence, the analysis of the firm size distribution over time, and across
sectors, is the second piece of information required to understand what might be causing the
job creation differentials across firm size classes and whether those differentials are having
any impact at all on aggregate employment.
There is piling evidence in other developed countries that there has been indeed a
shift in the firm size distribution towards small production units since the 1970s after decades
of dominance of the economies of scale in production. The most impressive and cited proof is
the drop in the share of the 500 largest American firms (Fortune 500) in employment:
from 20% in 1970 to 8.5% in 1996. Loveman and Sengenberger (1991), on the other hand,
review the existent data for the six largest OECD countries27. They write: “The most important
empirical result to emerge from the country reports is that there has been a recent increase
in the share of total employment in small enterprises and establishments. While the
magnitude of the increase varies considerably from country to country and across sectors,
its significance rests primarily on the fact that it signifies the reversal of a substantial
downward trend in the employment shares of small units that has prevail for many decades
(…). What is remarkable about this finding is that (…) the pattern of decline and then growth is
so robust over such a wide sample of countries, sectors, size distributions and institutions”
(pages 6 and 7).
Moreover, this increasing importance of small production units in employment is
robust independently on whether one uses firms or establishments as production units and it
remains after controlling for the effect of the business cycle. Moreover, no more than 50% of
the economy-wide employment shift to small production units can be explained by a sectoral
recomposition of employment from goods to services production given that average
enterprise and establishment size is smaller in the service sector [OECD (1985), Davis and
Haltiwanger (1989), and Picot et al. (1994)]. Therefore, while composition effects are clearly
important, there remains a significant within-sector shift to smaller units.
27. United States, Japan, France, Germany, United Kingdom and Italy.
BANCO DE ESPAÑA 29 DOCUMENTO OCASIONAL N.º 0903
What is not so clear is why this shift has taken place. The most probable answer
is that a complex set of factors, with different weight depending on the country or sector of
reference, is to be blamed. Early works like Carlsson (1992) or Acs (1992) explain it as
the result of three major changes in the world economy since the early 1970s. The first one
is the intensified global competition, mainly from low-cost Eastern Europe and Asian
countries, resulting from the development in transportation, information and communication
technologies. Some firms have responded to this increase in competition shifting
production out of high-cost locations to low-cost ones, which can explain the wave of
corporate downsizing of the last two decades. Moreover, technological changes, such
as those that have decreased computer costs, have reduced optimal firm size and the
minimum scale of entry.
The second major change has been the increase in the degree of uncertainty,
reflected in a significant growth slowdown in all industrial countries triggered by the oil
price shocks of the 1970s and exacerbated by the volatility of exchange rates. Piore and
Sable (1984) and Brock and Evans (1990) claim that the instability of markets has resulted
in the demise of mass production and has promoted flexible production, a comparative
advantage of small firms over their large counterparts. Other recent episodes of instability
could have triggered similar effects. Flexible production has also been a crucial advantage
of small firms given the third major economic change, namely, the intensified market
fragmentation due to growing consumer demand for differentiated products.
More recently, Audretsch (1995), Audretsch and Thurik (2001) and Acs and
Audretsch (2001) have suggested that increased globalization and the technological
revolution have shifted the comparative advantage towards a knowledge-based economic
activity. In such economy, the focus is on the individual as possessor of knowledge
rather than on the firm. It is argued that asymmetric information and uncertainty about the
future value of the knowledge result in its different valuation by firm and individual.
This situation can lead to the departure of the individual from the incumbent firm in order to
launch a new firm where his knowledge can be commercialized. That is, entrepreneurship
is taking a new importance because it serves as a key mechanism by which knowledge
created in one organization (such as a university or an incumbent firm) becomes
commercialized in a new firm.
From a theoretical viewpoint, there is not a single theory of the firm that can embrace
all these factors to explain the change in optimal firm size. Instead, diverse theories of firm
size and firm size distribution, not necessarily exclusive, incorporate one or several of the
explanations put forward to account for the observed shift in size distribution [You (1995)].
The traditional firm theory [Viner (1932)], for example, is a technological theory where scale
economies determine firm size. According to this theory, the expansion of the service sector,
generally characterised by lower scale economies, and the drop of the costs of computers,
which have reduced the minimum efficient scale of operations, might be behind the increasing
importance of small firms. Traditional industrial organization models [Williamson (1985), for
example], on the other hand, focus on product and cost differentiation to explain firms’
market shares. According to these theories, a change in the market environment favouring
flexible production or increased demand for specialised and customised products or a
reduction in the cost of factors of production for small firms ⎯due to better access to finance
or to the introduction of new financing possibilities for small firms like venture capital funds or
business angel networks⎯, could all result in an increasing share of small firms.
BANCO DE ESPAÑA 30 DOCUMENTO OCASIONAL N.º 0903
Transaction cost theories [Piore and Sabel (1984)], which explain cross-industry
differences in the extent of vertical integration, are usually invoked to explain the success of
Northern-Italy clusters or industrial districts of small firms to face increasing competition from
emerging economies. Lastly, according to evolutionary models based on innovation and
Schumpeterian competition [Acs and Audretsch (1987)] small firms have a comparative
advantage in young industries where the main source of innovation is information outside the
industry whereas large firms are dominant in routinised technological regimes. In this context
small firms would be the main actors in the new knowledge economy.
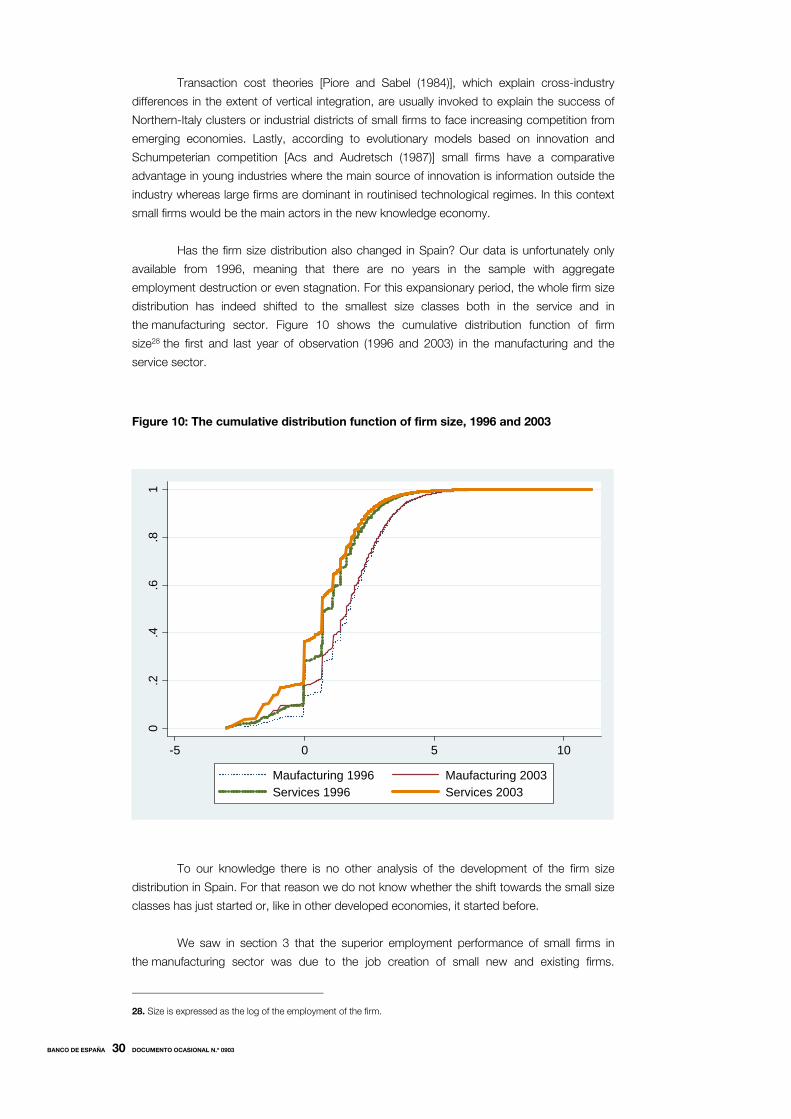
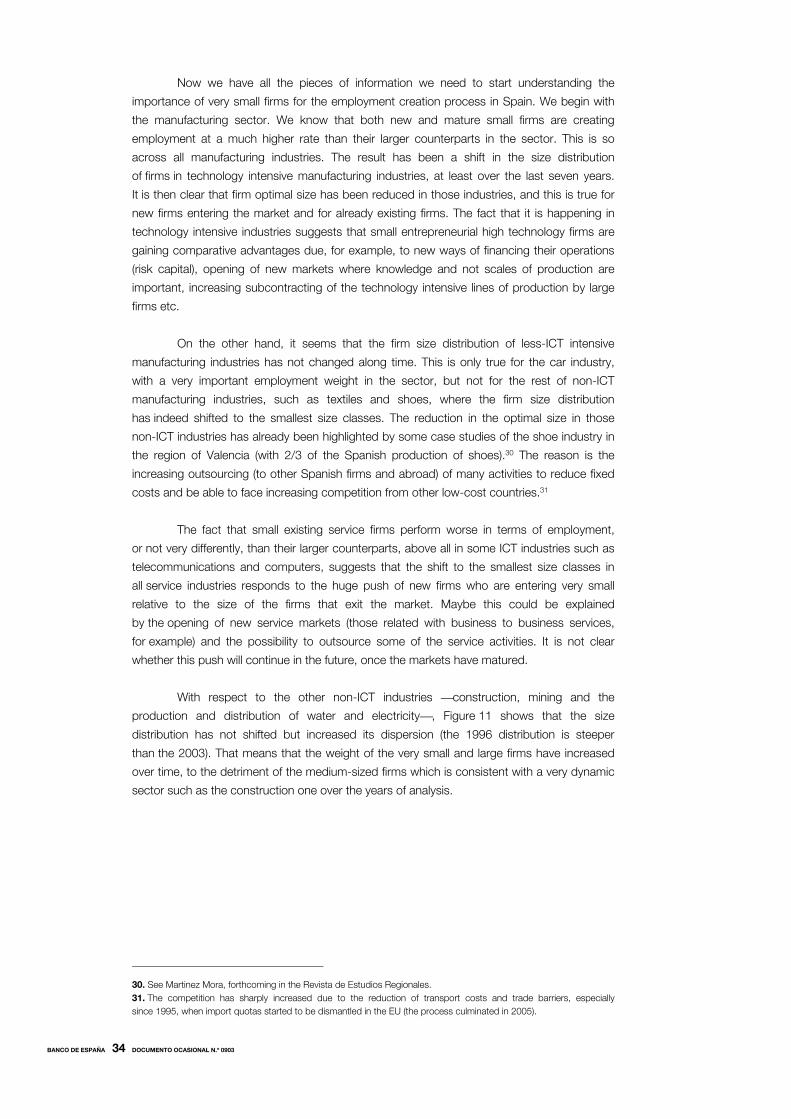
Has the firm size distribution also changed in Spain? Our data is unfortunately only
available from 1996, meaning that there are no years in the sample with aggregate
employment destruction or even stagnation. For this expansionary period, the whole firm size
distribution has indeed shifted to the smallest size classes both in the service and in
the manufacturing sector. Figure 10 shows the cumulative distribution function of firm
size28 the first and last year of observation (1996 and 2003) in the manufacturing and the
service sector.
Figure 10: The cumulative distribution function of firm size, 1996 and 2003
To our knowledge there is no other analysis of the development of the firm size
distribution in Spain. For that reason we do not know whether the shift towards the small size
classes has just started or, like in other developed economies, it started before.
We saw in section 3 that the superior employment performance of small firms in
the manufacturing sector was due to the job creation of small new and existing firms.
28. Size is expressed as the log of the employment of the firm.
0.2
.4.6
.81
-5 0 5 10
Maufacturing 1996 Maufacturing 2003Services 1996 Services 2003
BANCO DE ESPAÑA 31 DOCUMENTO OCASIONAL N.º 0903
In the service sector it was the employment created by small net entry what made the
difference between small and large firms. In both sectors the large employment creation of
very small firms has had an impact on the size distribution of firms. Although we only show
the size distribution in the first and last year of analysis, the shift towards the smallest size
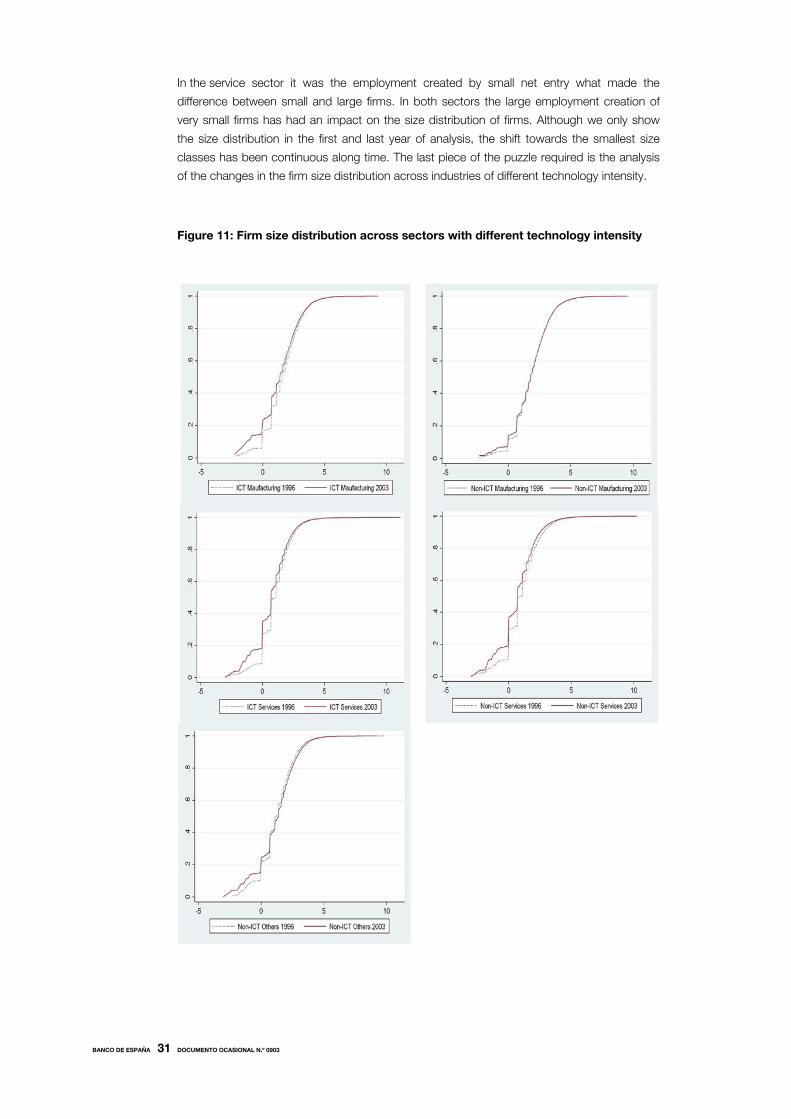
classes has been continuous along time. The last piece of the puzzle required is the analysis
of the changes in the firm size distribution across industries of different technology intensity.
Figure 11: Firm size distribution across sectors with different technology intensity

BANCO DE ESPAÑA 32 DOCUMENTO OCASIONAL N.º 0903
Figure 11 shows that the firm size distribution has changed uniformly across all
service industries, independently on whether they are technology intensive or not. On the
other hand, only in technology intensive manufacturing industries has the activity and
employment shifted towards smaller production units over time. The optimal firm size seems
not to have changed in non-ICT manufacturing industries like textiles, food and beverages or
the production of cars neither in other non-ICT industries like construction or the production
and distribution of gas, electricity and water.
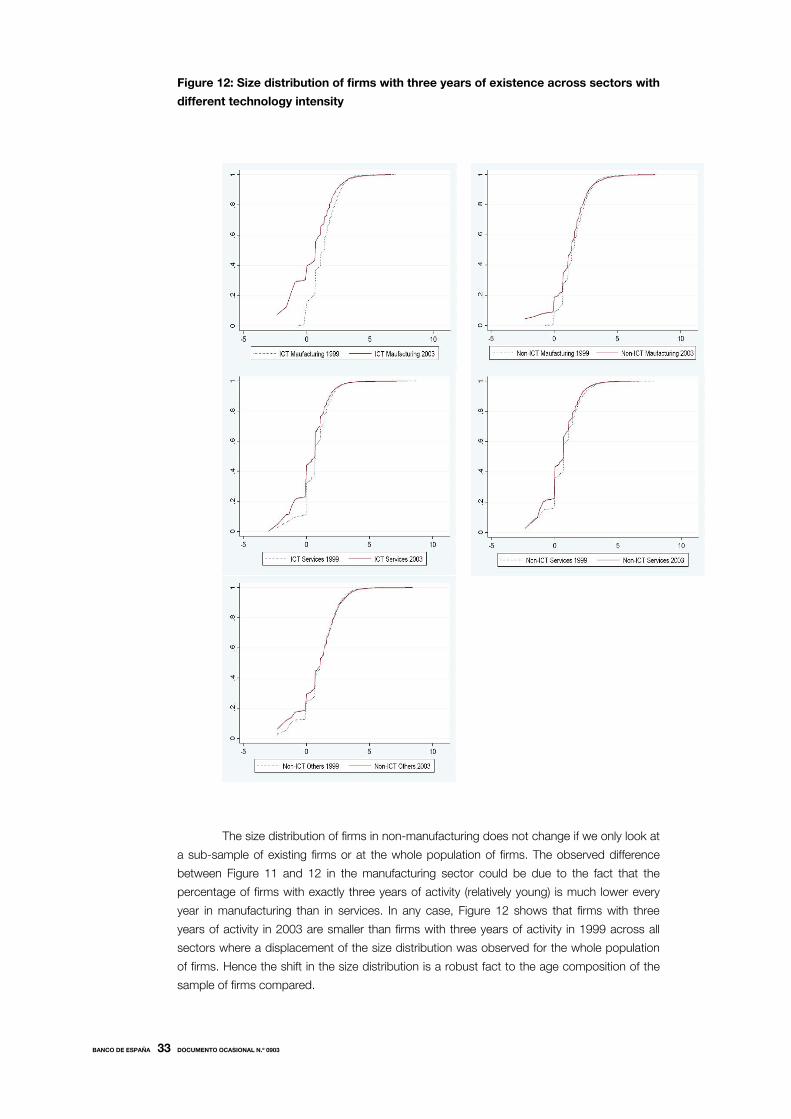
During this period of economic boom in Spain an enormous amount of small new
firms entered the markets. This, possibly temporal, phenomenon could explain the observed
displacement of the firm size distribution. For that reason we present below the cumulative
distribution function of the size of firms with exactly three years of existence, the first and
the last year of observation.29 Comparing only this sub-sample of firms we have relative
confidence that any displacement observed in the distribution function is reflecting an actual
decrease in optimal firm size and not a circumstantial wave of new small firms.
29. The first year of observation for this exercise is 1999. The reason is that we only know the age of firms that entered between 1996 and 2003. Hence all firms that entered the market in 1996 have 3 years of activity in 1999.
BANCO DE ESPAÑA 33 DOCUMENTO OCASIONAL N.º 0903
Figure 12: Size distribution of firms with three years of existence across sectors with
different technology intensity
The size distribution of firms in non-manufacturing does not change if we only look at
a sub-sample of existing firms or at the whole population of firms. The observed difference
between Figure 11 and 12 in the manufacturing sector could be due to the fact that the
percentage of firms with exactly three years of activity (relatively young) is much lower every
year in manufacturing than in services. In any case, Figure 12 shows that firms with three
years of activity in 2003 are smaller than firms with three years of activity in 1999 across all
sectors where a displacement of the size distribution was observed for the whole population
of firms. Hence the shift in the size distribution is a robust fact to the age composition of the
sample of firms compared.
BANCO DE ESPAÑA 34 DOCUMENTO OCASIONAL N.º 0903
Now we have all the pieces of information we need to start understanding the
importance of very small firms for the employment creation process in Spain. We begin with
the manufacturing sector. We know that both new and mature small firms are creating
employment at a much higher rate than their larger counterparts in the sector. This is so
across all manufacturing industries. The result has been a shift in the size distribution
of firms in technology intensive manufacturing industries, at least over the last seven years.
It is then clear that firm optimal size has been reduced in those industries, and this is true for
new firms entering the market and for already existing firms. The fact that it is happening in
technology intensive industries suggests that small entrepreneurial high technology firms are
gaining comparative advantages due, for example, to new ways of financing their operations
(risk capital), opening of new markets where knowledge and not scales of production are
important, increasing subcontracting of the technology intensive lines of production by large
firms etc.
On the other hand, it seems that the firm size distribution of less-ICT intensive
manufacturing industries has not changed along time. This is only true for the car industry,
with a very important employment weight in the sector, but not for the rest of non-ICT
manufacturing industries, such as textiles and shoes, where the firm size distribution
has indeed shifted to the smallest size classes. The reduction in the optimal size in those
non-ICT industries has already been highlighted by some case studies of the shoe industry in
the region of Valencia (with 2/3 of the Spanish production of shoes).30 The reason is the
increasing outsourcing (to other Spanish firms and abroad) of many activities to reduce fixed
costs and be able to face increasing competition from other low-cost countries.31
The fact that small existing service firms perform worse in terms of employment,
or not very differently, than their larger counterparts, above all in some ICT industries such as
telecommunications and computers, suggests that the shift to the smallest size classes in
all service industries responds to the huge push of new firms who are entering very small
relative to the size of the firms that exit the market. Maybe this could be explained
by the opening of new service markets (those related with business to business services,
for example) and the possibility to outsource some of the service activities. It is not clear
whether this push will continue in the future, once the markets have matured.
With respect to the other non-ICT industries ⎯construction, mining and the
production and distribution of water and electricity⎯, Figure 11 shows that the size
distribution has not shifted but increased its dispersion (the 1996 distribution is steeper
than the 2003). That means that the weight of the very small and large firms have increased
over time, to the detriment of the medium-sized firms which is consistent with a very dynamic
sector such as the construction one over the years of analysis.
30. See Martinez Mora, forthcoming in the Revista de Estudios Regionales. 31. The competition has sharply increased due to the reduction of transport costs and trade barriers, especially since 1995, when import quotas started to be dismantled in the EU (the process culminated in 2005).
BANCO DE ESPAÑA 35 DOCUMENTO OCASIONAL N.º 0903
6 Conclusion and some policy implications
Much has been written about the Spanish productive structure, dominated by very small
firms. But we have not a clear idea as to whether that firm size distribution has changed along
time and why. This paper uses a database that overcomes the problems encountered by
other firm-level studies in Spain, to try to shed some light on the employment contribution of
small firms in Spain.
We first study the contribution to annual employment growth of new firms, exits and
continuing firms of different sizes over the period 1996 to 2003. We find that, as it has been
reported elsewhere, Spanish small firms create a disproportionate share of new jobs. This is
so across all economic sectors but the disproportion between the contribution to total
job creation and actual share in employment is largest within the manufacturing sector,
where firms with less than 20 employees are responsible for more than 60% of annual
manufacturing net employment creation but employ solely about 20% of all workers in the
sector. Moreover, new small firms are responsible for most of the job creation differential
between small and large production units in the service sector while both new and existing
small firms create jobs at a much higher rate than their larger counterparts in the
manufacturing sector. These regularities are also true across industries of different technology
intensity within each of the main economic sectors.
We proceed then to study whether the observed better performance of small firms
is just reflecting the fact that new firms are normally small and, as reported elsewhere, create
jobs at a higher rate than incumbent firms. Age and not size could also be behind the job
creation record of the small existing manufacturing firms given that, in this study, continuing
firms can be quite young. However, the analysis of the convergence patterns to the
average sector size of different cohorts of firms across sectors show that new firms grow as
slowly as in other European countries, if not more, compared with the USA, especially in the
manufacturing sector. Why is this so? Bartelsman et al. (2003) offer some tentative
explanations like the existence of higher entry and adjustment costs in Europe as well as
the higher risk-aversion of the bank-based European financial system. In any case, our results
suggest that not only the age but also the “smallness” of firms matter for their employment
creation record. The small firms’ dynamism is coherent with the increasing importance
that small firms are having in terms of aggregate employment and activity in other developed
countries.
To explore further this issue as well as to understand whether the large job creation
record of small firms is a transitory phenomenon or a permanent one and to evaluate its real
impact on the employment generation process in Spain we proceed to study whether the firm
size distribution has changed over the period of analysis. We find that it has indeed been the
case although not uniformly across all sectors of the economy. The optimal firm size in ICT
manufacturing industries seems to be decreasing, and this is true for new and mature firms,
which suggests that small technology manufacturing firms are gaining comparative
advantages over larger ones and that it is a development which is here to stay. Non-ICT
manufacturing industries such as textile and shoes are also reducing their optimal size due
to increasing outsourcing of lines of production to face competition from low-cost countries.
In all service sectors, independently on their technology level, the firm size distribution is also
shifting to the smallest sizes. However that is due to the employment impact of new firms,

BANCO DE ESPAÑA 36 DOCUMENTO OCASIONAL N.º 0903
entering very small in comparison to the size of the firms that exit. The firm size distribution
of the construction sector has not shifted but become more disperse, with very small and
large firms gaining employment share to the detriment of medium-size firm classes.
The fact that employment and activity is concentrating more and more in
the very small firm sector might have important policy implications, given the particular
problems small firms face. It has been proven, for example, that administrative burdens
inflict a higher relative cost to small firms than to their larger counterparts32. In this regard, the
fact that average firm size is getting yet smaller should be a call for a careful revision of
the administrative regulation imposed on the small firm sector. As there would be the need
to improve the policy instruments aimed at facilitating the access to finance for small firms,
given the fact that they face higher difficulties to finance their operations, above all if
they are new ⎯with no track record or collateral⎯ and/or innovative.33 Other institutions
or regulations, including those of the labour market, with a disproportionate effect on small
firms would accordingly need to be revised.
32. See for example Nijsen and Vellinga (2002). 33. Klapper et al. (2004) show using an international database that countries that introduce regulation aimed at enlarging the financial instruments available to firms enjoy higher firm entry rates, especially in R&D intensive industries.

BANCO DE ESPAÑA 37 DOCUMENTO OCASIONAL N.º 0903
REFERENCES
ACS, Z. J. (1992). “Small Business Economics: A Global Perspective”, Challenge, 35, pp. 38-44. ACS, Z. J., and D. B. AUDRETSCH (1987). “Innovation in Large and Small Firms: An Empirical Analysis”, American
Economic Review, 78, pp. 678-690. ⎯ (1993). Small firms and Entrepreneurship: An East-West Perspective, Cambridge: Cambridge University Press. ⎯ (2001). “The Emergence of the Entrepreneurial Society”, 2001 International Award for Entrepreneurship and Small
Business Research, Stockholm. ARMINGTON, C., and Z. ACS (1999). Job Flow Dynamics in the Service Sector, Working Paper 99-14, Center for
Economic Studies, U.S. Census Bureau. AUDRESTCH, D. B. (1995). Innovation and Industry Evolution, Cambridge: MIT Press. AUDRETSCH, D. B, L. KLOMP and A. C. THURIK (1998). Do Services Differ from Manufacturing? The Post-Entry
Performance of Firms in Dutch Services”, Tinbergen Institute Discussion Papers 98-012/3. AUDRESTCH, D. B., and R. THURIK (2001). “What’s New about the New Economy? Sources of Growth in the Managed
and Entrepreneurial Economies”, Industrial and Corporate Change, 10 (1), pp. 267-315. BALDWIN, J. R. (1995). The Dynamics of Industrial Competition: A North American Perspective, Cambridge University
Press. BALDWIN, J. R., and G. PICOT (1995). “Employment Generation by Small Producers in the Canadian Manufacturing
Sector”, Small Business Economics, 7, pp. 317-331. BARTELSMAN, E., S. SCARPETTA and F. SCHIVARDI (2003). Comparative Analysis of Firm Demographics and
Survival: Micro-level Evidence for the OECD Countries, Economics Department Working Papers 348, Organisation for Economic Co-Operation and Development, Paris.
BIRCH, D. L. (1979). The job creation process, MIT Program on Neighborhood and Regional Change, Cambridge, MA. ⎯ (1981). “Who Creates the Jobs?”, The Public Interest, 65, pp. 3-14. BOERI, T., and U. CRAMER (1992). “Employment Growth, Incumbents and Entrants”, International Journal of Industrial
Organization, 10, pp. 545-565. BROCK, W. A., and D. S. EVANS (1989). “Small Business Economics”, Small Business Economics, 1, pp. 7-20. BROWN, C., J. HAMILTON and J. MEDOFF (1990). Employers Large and Small, Cambridge Mass.: Harvard University
Press. CARLSSON, B. (1992). “The Rise of Small Business: Causes and Consequences”, in Adams (Ed.), Singular Europe,
Economic and Policy of the European Community after 1992: University of Michigan Press. CARREE, M. A., and A. R. THURIK (1998). “Small Firms and Economic Growth in Europe”, Atlantic Economic Journal,
26 (2),1 pp. 37-146. DAVIS, S. J., and J. HALTIWANGER (1989). Gross Job Creation, Gross Job Destruction, and Employment Reallocation,
University of Maryland Working Paper No. 89-31. DAVIS, S. J., J. C. HALTINWANGER and S. SCHUH (1996). “Small Business and Job Creation: Dissecting the Myth and
reassessing the facts”, Small Business Economics, 8 (4), pp. 297-315. DOLADO, J., C. GARCÍA SERRANO and R. GÓMEZ (1997). “Creación y Destrucción de Empleo: Una Panorámica con
Nuevos Resultados para España”, Papeles de Economía Española, 72, pp. 138-153. DOLADO, J., and R. GÓMEZ (1995). “Creación y Destrucción de Empleo en el Sector Privado Manufacturero Español:
Un análisis Descriptivo”, Investigaciones Económicas, Vol. XIX, pp. 371-393. DUNNE, T., M. ROBERTS and L. SAMUELSON (1989). “Plant Turnover and Gross Employment Flows in the U.S.
Manufacturing Sector”, Journal of Labor Economics, 7 (1), pp. 48-71. EUROPEAN COMMISSION (1998). Enterprises in Europe, Fifth Report, Brussels. EVANS, D. S. (1987). “Tests of Alternative Theories of Firm Growth”, Journal of Political Economy, 95 (4), pp. 657-673. GALLAGHER C. C., and H. STEWART (1986). “Jobs and the Business life Cycle in the UK”, Applied Economics, 18,
pp. 875-900. GÓMEZ, R., J. MESSINA and G. VALLANTI (2004). Gross Job Flows and Institutions in Europe, Working Paper
Series 318, European Central Bank. HULL, C. J. (1986). Job Generation in the Federal Republic of Germany: A Review, Discussion Paper, Berlin:
Wissenschaftszentrum. JOVANOVIC, B. (1982). “Selection and the Evolution of the Industry”, Econometrica, 50 (3), pp. 649-670. KLAPPER, L., L. LAEVEN and R. RAJAN (2004). Business Environment and Firm Entry: Evidence from International
Data, CEPR Discussion Paper 4366. LÓPEZ-GARCÍA, P., and S. PUENTE (2007a). “A Comparison of the Determinants of Survival of Spanish Firms across
Economic Sectors”, in J. M. Arauzo-Carod and M. C. Manjon-Antolin (Eds.), Entrepreneurship, Industrial Location
and Economic Growth. ⎯ (2007b). Firm Productivity Dynamics in Spain, Documentos de Trabajo, No. 0739, Banco de España. LOVEMAN, G., and W. SENGENBERGER (1991). “The Re-Emergence of Small-Scale Production: An International
Comparison”, Small Business Economics, 3, pp. 1-37. LOVEMAN, G., W. SENGENBERGER and M. J. PIORE (1990). The re-emergence of small enterprises: industrial
restructuring in industrialised countries, International Institute for Labour Studies. MARTÍNEZ MORA, C. (Forthcoming). “Estrategias de Competitividad de las PYMES Alicantinas”, Revista de Estudios
Regionales. MATA, J., P. PORTUGAL and P. GUIMARAES (1995). “The survival of new plants: Start-up conditions and post-entry
evolution”, International Journal of Industrial Organization, 13 (4), pp. 459-481.

BANCO DE ESPAÑA 38 DOCUMENTO OCASIONAL N.º 0903
NIJSEN, A., and N. VELLINGA (2002). A Model to Measure the Administrative Burden of Businesses, Scientific Analysis of Enterprises and SMEs Research Report 0110.
NÚÑEZ, S. (2004). “Salida, Entrada y Tamaño de las Empresas Españolas”, Boletín Económico, March, Banco de España.
OECD (1985). Employment Outlook, Organisation for Economic Co-Operation and Development, Paris. PAGANO, P., and F. SCHIVARDI (2001). Firm Size Distribution and Growth, Working Paper 394, Banca D’Italia. PICOT, G., J. BALDWIN and R. DUPUY (1994). Have Small Firms Created a Disproportionate Share of New Jobs in
Canada? A Reassessment of the Facts, Statistics Canada WP 71. PIORE, M., and C. SABEL (1984). The Second Industrial Divide: Possibilities for Prosperity, New York: Basic books. RUANO, S. (2000). “Creación y Destrucción Bruta de Empleo en las Empresas Industriales Españolas”, Investigaciones
Económicas, XXIV, pp. 563-584. STOREY, D. J., and S. JOHNSON (1987). Job Generation and Labour Market Change, McMillan Press. TEITZ, M. B. et al. (1981). Small Business and Employment Growth in California, Working Paper 348, Institute of Urban
and Regional Development, University of California. VAN ARK, B., R. INKLAAR and R. H. MCGUCKIN (2003). "The Contribution of ICT-Producing and ICT-Using Industries
to Productivity Growth: A Comparison of Canada, Europe and the United States", International Productivity Monitor, Centre for the Study of Living Standards, Vol. 6, pp. 56-63.
VINER, J. (1932). “Cost Curves and Supply Curves”, Zeitschrift fur National-Eokonomie, 3, pp. 23-46. WILLIAMSON, O. (1985). The Economic Institutions of Capitalism: Firms, markets, relational Contracting, New York,
The Free Press. YOU, J. (1995). “Small Firms in Economic Theory”, Cambridge Journal of Economics, 19, pp. 441-462.

BANCO DE ESPAÑA 39 DOCUMENTO OCASIONAL N.º 0903
Annex: Industries by technology intensity (van Ark et al 2003)
ICT-Producing Manufacturing
30 Office, accounting and computing machinery
313 Insulated wire and cable
321 Semiconductors and other electronic components
322 Communication and broadcasting equipment
323 Radio and TV receivers
331 Medical and measuring equipment and industrial process control
ICT-Producing Services
64 Post and Telecommunications
72 Computer and related services
ICT-Using Manufacturing
18 Wearing apparel, dressing and dying fur
22 Printing and Publishing
29 Machinery and equipment
31 (not 313) Electrical machinery and apparatus
33 (not 331) Precision and optical instruments
351 Building and repairing of ships and boats
353 Aircraft and spacecraft
352+359 Railroad equipment and transport equipment
36-37 Miscellaneous
ICT-Using Services
51 Wholesale trade
52 Retail trade
71 Renting of machinery and equipment
73 Research and Development
741-743 Professional business services
Less-intensive ICT Manufacturing
15-16 Food products, beverages and tobacco
17 Textiles
19 Leather and footwear
20 Wood and cork
21 Pulp and paper
23 Coke, refined petroleum and nuclear fuel
24 Chemicals
25 Plastic and rubber products
26 Non-metallic mineral products
27 Basic metals
28 Fabricated metal products
34 Motor vehicles, trailers and semi-trailers

BANCO DE ESPAÑA 40 DOCUMENTO OCASIONAL N.º 0903
Less-intensive ICT Services
50 Repairs
55 Hotels and restaurants
60-63 Transport and storage
70 Real state activities
745-749 Other business services
Less-intensive ICT Other
10-14 Mining and quarrying
40-41 Electricity, gas and water supply
45 Construction
BANCO DE ESPAÑA PUBLICATIONS
OCCASIONAL PAPERS
0501 JOSÉ RAMÓN MARTÍNEZ-RESANO: Size and heterogeneity matter. A microstructure-based analysis of
regulation of secondary markets for government bonds.
0502 ALICIA GARCÍA-HERRERO, SERGIO GAVILÁ AND DANIEL SANTABÁRBARA: China’s banking reform: an
assessment of its evolution and possible impact.
0503 ANA BUISÁN, DAVID LEARMONTH AND MARÍA SEBASTIÁ BARRIEL: An industry approach to understanding
export performance: stylised facts and empirical estimation.
0504 ANA BUISÁN AND FERNANDO RESTOY: Cross-country macroeconometric heterogeneity in EMU.
0505 JOSÉ LUIS MALO DE MOLINA: Una larga fase de expansión de la economía española.
0506 VÍCTOR GARCÍA-VAQUERO AND JORGE MARTÍNEZ: Fiscalidad de la vivienda en España.
0507 JAIME CARUANA: Monetary policy, financial stability and asset prices.
0601 JUAN F. JIMENO, JUAN A. ROJAS AND SERGIO PUENTE: Modelling the impact of aging on Social Security
expenditures.
0602 PABLO MARTÍN-ACEÑA: La Banque de France, la BRI et la création du Service des Études de la Banque
d’Espagne au début des années 1930. (There is a Spanish version of this edition with the same number.)
0603 CRISTINA BARCELÓ: Imputation of the 2002 wave of the Spanish Survey of Household Finances (EFF).
0604 RAFAEL GÓMEZ AND PABLO HERNÁNDEZ DE COS: The importance of being mature: The effect of
demographic maturation on global per-capita income.
0605 JUAN RUIZ AND JOSEP VILARRUBIA: International recycling of petrodollars. (The original Spanish version has
the same number.)
0606 ALICIA GARCÍA-HERRERO AND SERGIO GAVILÁ: Posible impacto de Basilea II en los países emergentes.
0607 ESTHER GORDO, JAVIER JAREÑO AND ALBERTO URTASUN: Radiografía del sector de servicios en España.
0608 JUAN AYUSO, ROBERTO BLANCO AND FERNANDO RESTOY: House prices and real interest rates in Spain.
0701 JOSÉ LUIS MALO DE MOLINA: Los principales rasgos y experiencias de la integración de la economía española
en la UEM.
0702 ISABEL ARGIMÓN, FRANCISCO DE CASTRO AND ÁNGEL LUIS GÓMEZ: Una simulación de los efectos de la
reforma del IRPF sobre la carga impositiva.
0703 YENER ALTUNBAŞ, ALPER KARA AND ADRIAN VAN RIXTEL: Corporate governance and corporate ownership:
The investment behaviour of Japanese institutional investors.
0704 ARTURO MACÍAS AND ÁLVARO NASH: Efectos de valoración en la posición de inversión internacional de
España.
0705 JUAN ÁNGEL GARCÍA AND ADRIAN VAN RIXTEL: Inflation-linked bonds from a central bank perspective.
0706 JAVIER JAREÑO: Las encuestas de opinión en el análisis coyuntural de la economía española.
0801 MARÍA J. NIETO AND GARRY J. SCHINASI: EU framework for safeguarding financial stability: Towards an
analytical benchmark for assessing its effectiveness.
0802 SILVIA IRANZO: Delving into country risk. (There is a Spanish version of this edition with the same number.)
0803 OLYMPIA BOVER: The Spanish survey of household finances (EFF): Description and methods of the 2005 wave.
0804 JAVIER DÍAZ-CASSOU, AITOR ERCE-DOMÍNGUEZ AND JUAN J. VÁZQUEZ-ZAMORA: Recent episodes of
sovereign debt restructurings. A case-study approach.
0805 JAVIER DÍAZ-CASSOU, AITOR ERCE-DOMÍNGUEZ AND JUAN J. VÁZQUEZ-ZAMORA: The role of the IMF in
recent sovereign debt restructurings: Implications for the policy of lending into arrears.
0806 MIGUEL DE LAS CASAS AND XAVIER SERRA: Simplification of IMF lending. Why not just one flexible credit
facility?
0807 MIGUEL GARCÍA-POSADA AND JOSEP M.ª VILARRUBIA: Mapa de exposición internacional de la economía
española.
0808 SARAI CRIADO AND ADRIAN VAN RIXTEL: Structured finance and the financial turmoil of 2007-2008: An
introductory overview. (There is a Spanish version of this edition with the same number.)
0809 FRANCISCO DE CASTRO Y JOSÉ M. GONZÁLEZ-MÍNGUEZ: La composición de las finanzas públicas y el
crecimiento a largo plazo: Un enfoque macroeconómico.
0810 OLYMPIA BOVER: The dynamics of household income and wealth: results from the panel of the Spanish survey
of household finances (EFF) 2002-2005. (The original Spanish version has the same number.)
0901 ÁNGEL ESTRADA, JUAN F. JIMENO AND JOSÉ LUIS MALO DE MOLINA: The Spanish economy in EMU:
The first ten years. (The original Spanish version has the same number.)

0902 ÁNGEL ESTRADA AND PABLO HERNÁNDEZ DE COS: El precio del petróleo y su efecto sobre el producto
potencial.
0903 PALOMA LÓPEZ-GARCÍA, SERGIO PUENTE AND ÁNGEL LUIS GÓMEZ: Employment generation by small firms
in Spain.
Unidad de PublicacionesAlcalá, 522; 28027 Madrid
Telephone +34 91 338 6363. Fax +34 91 338 6488e-mail: [email protected]
www.bde.es