Self-employment among the Swedish science and technology labor force: the evolution of the firms...
101
A2005:001 Self-employment among the Swedish Science and Technology Labor Force The evolution of the firms between 1990 and 2000 Frédéric Delmar, Karl Wennberg Johan Wiklund and Karin Sjöberg
Transcript of Self-employment among the Swedish science and technology labor force: the evolution of the firms...

A2005:001
Self-employment among the Swedish Scienceand Technology Labor Force
The evolution of the firms between 1990 and 2000
Frédéric Delmar, Karl WennbergJohan Wiklund and Karin Sjöberg


Self-employment among the Swedish Science and Technology
Labor Force
The evolution of the firms between 1990 and 2000
Frédéric Delmar Karl Wennberg
Center for Entrepreneurship and Business Creation Stockholm School of Economics
Johan Wiklund Karin Sjöberg
Jönköping International Business School

ITPS, Swedish Institute For Growth Policy Studies Studentplan 3, SE-831 40 Östersund, Sweden Telephone: +46 (0)63 16 66 00 Fax: +46 (0)63 16 66 01 E-mail [email protected] www.itps.se ISSN 1652-0483 Elanders, Stockholm 2005
For further information, please contact Björn Falkenhall Telephone 08 456 6716 E-mail [email protected]

SELF-EMPLOYMENT AMONG THE SWEDISH SCIENCE AND TECHNOLOGY LABOR FORCE
3
Förord
Ett område som tilldrar sig stort intresse är akademiskt entreprenörskap, vilket innebär entreprenöriella aktiviteter bland de individer som har forskningsnära kunskap. Det finns förväntningar om att akademiskt entreprenörskap bidrar till kommersialisering av ny kunskap och därför är en viktig drivkraft för ekonomisk tillväxt. Kunskapen om det akademiska entreprenörskapet och i vilken omfattning det påverkar den ekonomiska tillväxten är emellertid begränsad.
I en tidigare studie publicerad av ITPS (A2003:017) undersöktes hur samtliga individer med akademisk utbildning inom naturvetenskap, teknik och medicin är involverade i företagande. Dessa utbildningsgrupper valdes därför att de anses ha en hög sannolikhet för att överföra vetenskaplig kunskap till kommersiella aktiviteter. I föreliggande rapport, som utgör en fortsättning på den förstnämnda studien, analyseras dessa individers företag och hur dessa utvecklas över tiden.
Studien har skrivits av Frédéric Delmar och Karl Wennberg vid Handelshögskolan i Stockholm samt Johan Wiklund och Karin Sjöberg vid Internationella Handels-högskolan i Jönköping. Författarna ansvarar själva för rapportens innehåll liksom för de slutsatser som dras. Rapporten är författad på engelska, men den inleds med en sammanfattning på svenska.
Studien utgör en del av ett större forskningsprojekt som bedrivs vid Handels-högskolan i Stockholm. Projektet finansieras av Forum för Småföretagsforskning, Handelsbankens forskningsstiftelser, ITPS, Nutek och Vinnova.
Östersund i februari 2005
Sture Öberg Generaldirektör


SELF-EMPLOYMENT AMONG THE SWEDISH SCIENCE AND TECHNOLOGY LABOR FORCE
5
Table of Content
Sammanfattning .................................................................................................................. 7 Summary ............................................................................................................................ 11 1 Abstract ..................................................................................................................... 17 2 Introduction............................................................................................................... 19 3 Theory........................................................................................................................ 23
3.1 Endogenous Technical Change.......................................................................................23 3.2 The Entrepreneurial Process ...........................................................................................24
3.2.1 The Sources and Discovery of Opportunities .......................................................25 3.2.2 The Exploitation of Opportunities..........................................................................27 3.2.3 The Mode of Exploitation ......................................................................................29
3.3 Firm Entry, Growth, Exit and Industrial Differences .........................................................31 3.3.1 Firm entry and exit ................................................................................................31 3.3.2 Firm Growth..........................................................................................................33
3.4 Summary .........................................................................................................................36 4 Method ....................................................................................................................... 37
4.1 Design..............................................................................................................................37 4.2 Population........................................................................................................................37 4.3 Data sources....................................................................................................................41 4.4 Descriptor variables .........................................................................................................43 4.5 Understanding longitudinal data ......................................................................................44
5 Results....................................................................................................................... 47 5.1 The Population of Firms Owned by STLF Entrepreneurs ................................................47
5.1.1 Size Distribution and Job Creation .......................................................................47 5.1.2 Legal form and Industry Classification..................................................................49 5.1.3 Summary of Findings on the Population ...............................................................52
5.2 Entry and Exit from the STLF Firm Population.................................................................53 5.2.1 Industry of De Novo Entries..................................................................................54 5.2.2 Size Distribution of De Novo Entries.....................................................................57 5.2.3 Legal Form of De Novo Entries ............................................................................59 5.2.4 Summary de Novo Entries....................................................................................60
5.3 Survival of De Novo Entries .............................................................................................60 5.3.1 Industry Affiliation and Survival.............................................................................62 5.3.2 Initial Size and Survival.........................................................................................63 5.3.3 Legal Form and Survival.......................................................................................64 5.3.4 Summary Survival ................................................................................................66
5.4 Performance of De Novo Entries .....................................................................................66 5.4.1 Salary Distributions in De Novo Firms ..................................................................66 5.4.2 Salary Distribution across Industries ....................................................................69 5.4.3 Summary Salaries ................................................................................................70
5.5 Growth of De Novo Entries ..............................................................................................70 5.5.1 Firm Growth and Industry Affiliation......................................................................73 5.5.2 Firm Growth and Initial Size..................................................................................73 5.5.3 Firm Growth and Legal Form................................................................................73 5.5.4 Summary Firm Growth..........................................................................................74
6 Discussion................................................................................................................. 75 6.1 Major Findings .................................................................................................................75 6.2 Theoretical Implications ...................................................................................................77 6.3 Practical Implications .......................................................................................................79 6.4 Limitations and Future Research .....................................................................................82 6.5 Conclusions .....................................................................................................................83
7 References ................................................................................................................ 85 8 Appendix ................................................................................................................... 91


SELF-EMPLOYMENT AMONG THE SWEDISH SCIENCE AND TECHNOLOGY LABOR FORCE
7
Sammanfattning
Många välkända företag såsom Ericsson, ASEA (nu ABB), AGA och SKF grun-dades av personer med en bakgrund inom forskning eller teknik. Dessa företag har kommit att betyda mycket för den svenska ekonomins utveckling. Till dags dato har storföretagen stått för en betydande del av vårt lands investeringar i forskning och utveckling. Under senare år har dock dessa företag skurit ned på sina invester-ingar samtidigt som utlokalisering till utlandet blivit allt vanligare. Dessutom grundades dessa företag under 1800-talet. Trots att Sverige ligger väl framme gällande investeringar i forskning och utveckling så har vi en sämre förmåga att kommersialisera den kunskap som dessa investeringar utmynnat i. Kommersialiser-ing av ny kunskap är betydelsefull då den ses som en motor för ett lands ekonomi-ska utveckling. Kombinationen av Sveriges rådande brist på kommersialisering och storföretagens nedskärningar har lett till ett ökat intresse för nyföretagande. Detta intresse grundas i tron att nya företag ska ta över den roll som storföretagen inte längre kan axla på egen hand genom att i högre grad kunna identifiera och exploat-era nya möjligheter. Kärnan i vårt intresse ligger nära detta fenomen; kommersial-isering av ny kunskap.
Det är rimligt att anta att vissa grupper av individer är bättre lämpade för att skapa ny kunskap och se nya möjligheter. Därför har vi valt att studera alla personer som har lägst en treårig högskoleexamen inom naturvetenskap, teknik eller medicin (NTM) och följa deras företag. Vi anser att dessa individer är högintressanta då de med större sannolikhet befinner sig inom forskning och utvecklingssektorn. Des-sutom kan de ses som bärare av kunskap som de för med sig när de byter jobb eller startar eget. Med tanke på deras bakgrund är det även troligt att de har bättre tillgång till ny information, som kan vara en utlösande faktor när det gäller att identifiera nya möjligheter. I en tidigare rapport har vi följt dessa individers inträde i och utträde från egenföretagande (ITPS, A2003:017). Då fokuserade vi enbart på individerna. I föreliggande rapport har vi utgått från dessa individer för att istället studera deras företag och hur de utvecklas över tiden. I rapporten fokuserar vi på följande:
• En beskrivning av omfattningen av de företag som ägs och drivs av personer med en naturvetenskaplig, teknisk eller medicinsk högskoleutbildning (om minst tre år).
• Inträden och utträden av företag som ägs och drivs av personer med en natur-vetenskaplig, teknisk eller medicinsk högskoleutbildning.
• Tillväxt och överlevnad bland dessa företag. • Dessa företags spridning över olika branscher. • Dessa företags spridning över olika bolagsformer. • Strukturen på denna arbetskraft relaterat till utbildning och kön.

SELF-EMPLOYMENT AMONG THE SWEDISH SCIENCE AND TECHNOLOGY LABOR FORCE
8
För att skapa en bättre förståelse för dessa företag och deras uppkomst och utveck-ling har vi kombinerat tre teoretiska spår; ny tillväxtteori (new growth theory), entreprenörskapsteori och industriell organisationsteori. Ny tillväxtteori belyser vikten av ny kunskap och hur ny kommersialiserad kunskap är en stark bidragande faktor till ekonomisk tillväxt. Kritiken mot denna teori har dock varit att kunskaps-överföring antagits ske såväl automatiskt som utan kostnad. Det finns emellertid en mängd orsaker till att så inte är fallet, såsom branschtillhörighet, patentregimer och geografi. Om man anser att kunskap inte automatiskt leder till tillväxt krävs att någon ansvarar för kommersialiseringen. De agenter som ansvarar för denna upp-gift är entreprenörer och således har vi inkluderat entreprenörskapsteori. Med hjälp av entreprenörskapsteori som beskriver den entreprenöriella processen kan vi bättre förstå hur kommersialiseringen av ny kunskap, i form av nya företag, sker och om den de facto sker. Man kan tänka sig att individer med en högskoleexamen inom naturvetenskap, teknik eller medicin är väl lämpade för att agera som entreprenöri-ella agenter i det ekonomiska systemet. Detta argument grundas i tanken att dessa individer besitter kunskap som gör att de bättre kan se värdet av möjligheter som baseras på ny kunskap. Därmed har de förmågan att identifiera möjligheter med stor potential. Då de dessutom har höga alternativkostnader kan de tänkas kräva en hög avkastning och således enbart exploatera möjligheter som de anser har stor potential. Dessutom representerar denna arbetskraft en mekanism för överföring av företagsspecifika kunskaper som ingår i en individs humankapital. Denna kunskap kommer enbart att överföras till andra företag om individen i fråga lämnar sin nuvarande anställning. Eftersom vi är intresserade av de entreprenöriella aktivite-terna som dessa individer företar sig kommer vi fokusera på deras företag. Genom att dessutom inkludera industriell organisationsteori tillåts vi förstå i vilka former kommersialiseringen äger rum.
I denna studie har vi följt alla fristående företag som ägs eller drivs av individer med en NTM-bakgrund. Således är det inte enbart nya företag som ingår i popula-tionen utan även företag som tas över av någon med en NTM-utbildning. Vi har enbart studerat de företag som även utgjort den huvudsakliga inkomstkällan för NTM-entreprenörer. Dessa företag har vi följt över en elvaårsperiod från 1990 fram till och med 2000. Med andra ord har vi studerat hela populationen och elva olika kohorter som består av paneldata. För att kunna göra detta har vi med hjälp av SCB samkört olika register för att skapa en databas som kan beskriva dessa företags uppkomst och utveckling över tiden. Populationen består totalt av 22 312 företag. 11 077 (49,6 %) av dessa trädde in i populationen under observationsperioden.
Vår analys av hela populationen visar tydligt att antalet inträden och utträden har ett starkt samband, dvs. när det sker många inträden så tenderar även antalet utträ-den att ligga på en hög nivå. Detta resulterar i att antalet inträden inte radikalt förändrar den totala stocken av företag. Höga in- och utträdesnivåer tyder snarare på en hög dynamik. Antalet inträden är som lägst 19,1 % år 1993 och som högst 24,7 % år 1990. I genomsnitt låg nivån på 21,1 % under hela perioden. Knappt 50 % av alla inträden (i populationen) är helt nya företag och årsvis representerade de nya företagen 45 % procent av alla inträden.

SELF-EMPLOYMENT AMONG THE SWEDISH SCIENCE AND TECHNOLOGY LABOR FORCE
9
För utträden fann vi liknande resultat och cirka 45 % av antalet utträden är nedläggningar medan resten är fall då företaget överlever, men NTM-individen lämnar företaget. Generellt sett kan vi se att denna grupp av företag är en dynamisk sådan där omsättningen på företagen är hög.
Populationen har ökat stadigt från 1993, då den var som minst, fram till 2000, då den var som störst. Från 1990 till 1993 var det en stadig nedgång, vilket inte är förvånande med tanke på den då rådande lågkonjunkturen. Att populationen har vuxit är dock inte ett tecken på att gruppen blivit mer entreprenöriell, eftersom även antalet individer med en NTM-utbildning har ökat kraftigt under samma period. En stor del av företagen är även små företag och cirka 85 % har igenomsnitt mellan en och fyra anställda. Få företag blir större än medelstora företag. Vi kan även se att dessa företags förmåga att skapa nya jobb snabbt avtar under perioden.
De branscher som dessa företag främst återfinns inom är sjukvård, teknologitjänster och övriga branscher. Dessa tre branscher representerar cirka 58 % av företagen. Vi kan även se att tillverkningssektorn i sin helhet minskar i betydelse när det gäller antalet nya företag även om den står för en stor del av sysselsättningen. Andra kunskapsintensiva branscher och utbildningssektorn har ökat i betydelse. Vidare kan vi konstatera att den allra vanligaste bolagsformen är enskild firma.
Våra resultat är tydliga när det gäller att förklara inträden och utträden ur populationen. Genom att analysera bransch, bolagsform och initial storlek är det uppenbart att majoriteten av dessa företag inte drivs med höga ambitioner och stort engagemang, vilket man eventuellt kan förvänta sig från denna grupp av individer. Det är snarare så att de företag som ägs och drivs av individer med en NTM-utbildning är jämförbara med företag i allmänhet. Denna grupps unika kompetens avspeglas dock till viss del i branschtillhörighet, där tendensen är att företagen drivs inom kunskapsintensiva branscher.
Gällande företagens överlevnad så tenderar den att växa sig starkare över tiden. Med detta menas att de flesta företagen sållas bort under de första levnadsåren. När detta undersöktes studerade vi enbart de företag som hade startats av NTM-individer. 53 % lades ned inom fem år efter starten och 65 % inom tio år. Intressant att tillägga är att det fanns stora skillnader i överlevnadsgrad beroende på företagets status vid start. Dessutom fanns vissa skillnader mellan kohorterna även om de utjämnades över tiden. Bransch och initial storlek visade sig ha betydelse för företag som startades inom branscher med höga inträdesbarriärer. Företag som var större vid start visade även upp en högre överlevnadsgrad. Överlevnadsgraden var högst hos företag som drevs som aktiebolag, som även till viss del reflekterar initiala investeringar. Dessa resultat är i linje med tidigare forskningsresultat.
De nya företag vi studerat är enligt vår definition även den huvudsakliga inkomstkällan för entreprenörerna. Trots detta är det enbart cirka 57 % som faktiskt betalar ut lön. Denna siffra sjunker till 40 % de följande åren. Medellönen bland de företag som betalade ut lön var mycket låg det första året, men steg därefter under de nästkommande åren.

SELF-EMPLOYMENT AMONG THE SWEDISH SCIENCE AND TECHNOLOGY LABOR FORCE
10
Efter fem år hade medellönen stigit med cirka 290 %. Intressant att nämna är att lönerna låg högst inom vissa branscher, närmare bestämt inom branscher med höga barriärer eller inom branscher där en NTM-utbildning kan ses som en tillgång.
Tillväxten i de nystartade företagen analyserades på en aggregerad nivå. Vi kan då konstatera att totalt skapades 11 879 jobb årligen, varav 6 604 (55,6 %) fortfarande återstår år 2000. Cirka 80 % av jobben skapades redan under det första levnadsåret medan resterande cirka 20 % var tillväxt under de följande åren. Med andra ord framstår det som svårt för dessa företag att uppnå tillväxt.
För att sammanfatta våra resultat är det mest framstående att denna grupp inte representerar en Schumpeteriansk population av entreprenörer. Tvärtom är denna grupps bidrag till ekonomin liten och förmodligen avtagande. Gruppens förmåga att skapa sysselsättning har blivit sämre under den studerade perioden. Likväl har de inte uppvisat någon tillväxt i löneutbetalningar och antal anställda. Det visade sig dock finnas vissa skillnader mellan branscher, bolagsform och initial storlek.
Det framstår som att nyföretagande inte är ett attraktivt alternativ för de som har en NTM-utbildning. Givet de låga lönerna och brist på tillväxt synes det till stor del vara de som inte lyckas få annan sysselsättning som startar företag. Det finns dock de som är framgångsrika och lyckas visa upp en god utveckling, men på en aggre-gerad nivå är det inga imponerande resultat. Då många förefaller tvingas in i entreprenörskap är det troligt att det inte är de mest potentiella idéerna som exploateras. Ytterligare efterforskningar och kunskap kan ge oss bättre underlag till rekommendationer i detta avseende.
En viktig komponent i kommersialisering av ny kunskap kan vara entreprenörskap. I denna rapport har vi undersökt en del av detta fenomen och våra resultat kan till viss del förklara varför Sverige inte lyckas väl inom detta område. Våra resultat pekar på att de entreprenöriella aktiviteterna i form av nyföretagande är för låga och att det förefaller vara obalans mellan ny kunskap som skapas och entreprenörs-kap. Detta föranleder oss att peka på vissa områden där insatser bör göras. Områden som kan vara av vikt att fokusera på är Science Parks och utbildning. Science Parks antas stimulera entreprenörskap och därför kan mer arbete läggas på detta område, antingen på att vidareutveckla eller möjligtvis expandera deras ar-bete. Gällande utbildning är det viktigt att entreprenörskap belyses i utbildningen så att studerande ser nyföretagande som ett fullgott alternativ till anställning. Slutli-gen är det viktigt att se över de generella spelreglerna för företag, så att man förenklar för individer som önskar exploatera en idé i egen regi. Exempel på sådana spelregler är det aktiekapital som krävs för att starta ett aktiebolag, skatter och förmågan att bygga upp en egen förmögenhet som kan investeras i nya företag.
SELF-EMPLOYMENT AMONG THE SWEDISH SCIENCE AND TECHNOLOGY LABOR FORCE
11
Summary
Many well-known firms such as Ericsson, ASEA (now ABB), AGA and SKF were founded by people with a background in research or technology. These firms have come to play an important role in the development of the Swedish economy. Until now large firms have accounted for an important part of investments in research and development in Sweden. However, in recent years these firms have reduced their investments at the same time as outsourcing abroad has become increasingly common. In addition, these firms were started during the 19th century. Although Sweden lies at the forefront in terms of investments in research and development, our capacity to commercialise this knowledge has been weaker. Commercialisation of new knowledge is important as this is regarded as a driving force in a country's economic development. The combination of shortcomings in Sweden in terms of commercialising knowledge and the cutbacks made by large companies have led to greater interest in new entrepreneurship. This interest is based on the belief that new firms by identifying and exploiting new opportunities should to a greater extent take over the role which large firms can no longer sustain on their own. The core of our interest is closely related to this phenomenon; commercialisation of new knowledge.
It is reasonable to assume that certain groups of individuals are better suited to create new knowledge and see new opportunities. This is the reason we have chosen to study all persons who have at least a three year qualification in higher education in science, technology or medicine (STLF - science and technology labour force) and follow the development of their firms. We consider these individuals to be particularly interesting since they are highly likely to be in the research and development sector. In addition, they may be regarded as carriers of knowledge which accompanies them when they change jobs or start their own firms. Given their background, it is also probable that they have better access to new information, which can be a decisive factor in identifying new opportunities. In an earlier report, we have followed the entry and exit paths of these individuals when running their own firms (ITPS, A2003:017). In that report, we focused only on the individuals. In the current report, we have chosen to study the firms started by these individuals and how they have developed over time. In this report, we focus on the following:
• A description of the range of firms owned and run by people with scientific, technological or medical qualifications from higher education (at least three years).
• Entry and exit of firms owned and run by people with a higher education qualification in science, technology or medicine.
• Growth and survival among these firms.
• Distribution of these firms by different industries.

SELF-EMPLOYMENT AMONG THE SWEDISH SCIENCE AND TECHNOLOGY LABOR FORCE
12
• Distribution of these firms by different company forms.
• Structure of the labour force in relation to education and gender.
In order to create a better understanding of these firms, and their origins and development, we have combined three theoretical approaches; new growth theory, entrepreneurship theory and industrial organisation theory. New growth theory focuses on the importance of new knowledge and how its commercialisation is a strong contributory factor to economic growth. However, one of the criticisms of this theory has been that the transfer of knowledge is assumed to take place automatically and without cost. There are also a complex of factors working against this, such as the nature of the industry, patent regimes and geography. If we consider that knowledge does not automatically lead to growth, there must be someone responsible for its commercialisation. The agents of this process are entrepreneurs and this is the reason we have included entrepreneurship theory. The descriptions of the entrepreneurial process in entrepreneurship theory help us to better understand the process whereby new knowledge is commercialised, in the form of new firms, and whether in fact this process takes place. Individuals with a higher education background in science, technology or medicine may be regarded as well-suited to act as entrepreneurial agents in the economic system. This argument is based on the idea that these individuals "possess" knowledge which makes them better able to see the value of opportunities that can be exploited by this new knowledge. They have the capacity to identify opportunities with great potential. As they also have high opportunity costs, they can be thought to require a high rate of return and thus only exploit opportunities which they consider have great potential. In addition, this entrepreneurial "labour force" provide a mechanism for the transfer of company specific knowledge which is a part of the individual's human capital. This knowledge will only be transferred to other firms if the individuals in question leave their current employment position. Since we are interested in the entrepreneurial activities of these individuals, we chose to focus on their firms. By including perspectives from industrial organisation theory, we are able to understand the different forms in which commercialisation takes place.
In this study we have monitored all independent firms which are owned or run by individuals with a background in science, technology and medicine. Thus it is not only new firms which are included in the population, but also firms that have been taken over by someone with such a background. We have only studied firms which have been the main source of income for entrepreneurs in these areas. We have monitored these firms over an 11 year period from 1990 up to 2000. In other words, we have studied the whole population and 11 different cohorts consisting of panel data. In order to do this, with the help of Statistics Sweden we have linked different registers to create a database which can describe the establishment of these firms and their development over time. Today the population consists of a total of 22,312 firms. 11,077 (49.6 %) of these entered the population during the observation period.

SELF-EMPLOYMENT AMONG THE SWEDISH SCIENCE AND TECHNOLOGY LABOR FORCE
13
Our analysis of the whole population clearly shows that the number of entries and exists is closely related i.e. when there are many entries, the number of exits also tends to be at a high level. This means that the number of entries does not radically change the total stock of firms. High entry and exit levels are indicative of high dynamics. The number of entries was lowest 19.1 % in 1993 and reached a peak of 24.7 % in 1990. During the whole period, the average was 21.1 %. Slightly less than 50 % of all new entries (in the population) are completely new firms and on an annual basis the new firms accounted for 45 % of all entries. We found similar results for exits, and about 45 % of the number of exits are closures, while the remainder are cases where the firm survives, but the founder leaves the firm. In general terms, we can see that this group of firms is dynamic since their turnover is high.
The population has increased steadily from 1993, when it was at its lowest level, up to 2000 when it reached its peak. From 1990 to 1993 there was a steady decline, which is not surprising given the prevailing economic conditions of recession. The fact that the population has grown in size, however, is not an indication that the group has become more entrepreneurial, since the number of individuals with a science, technology and medical background increased substantially over the same period. A large proportion of the firms are also small and about 85 % have on average between 1 and 4 employees. Few firms become larger than the average size. We can also see that the capacity of these firms to create new jobs rapidly declined during the period.
These firms are mainly found in medical care, technology services and unclassified industries. These three categories represent about 58 % of the firms. We can also see that the manufacturing sector as a whole decreases in importance in terms of the number of new firms even though it accounts for a large proportion of employment. Other knowledge intensive industries and the educational sector have increased in importance. We can also state that the most common company form is that of the sole proprietorship.
Our results are clear in terms of explaining the entry and exit of the population. By analysing industry, company form and initial size, it is evident that the majority of these firms are not run with high ambitions and great involvement, contrary to what might have been expected from this group of individuals. In fact it is the case that firms owned and run by individuals with an STLF background are comparable with firms in general. The unique competence of this group, however, is reflected to a certain extent by the industrial affiliation of the firms they run, where the tendency is to choose knowledge intensive industries.
The survival capacity of these firms tends to become stronger over time. The majority of these firms ceased to exist during their early infancy. When we examined this, we only studied firms which had been started by member of STLF. 53 % were closed down within five years of starting, and 65 % within 10 years. It is interesting to note that there are major differences in the survival capacity of these firms related to their status at start-up. There are also differences between the cohorts even though these tend to become more equal over time. Industry and

SELF-EMPLOYMENT AMONG THE SWEDISH SCIENCE AND TECHNOLOGY LABOR FORCE
14
initial size proved to be of importance for firms which started in industries with high barriers to entry. Firms which were larger when they started also had a higher capacity to survive. Capacity to survive was highest among limited liability companies, which to some extent reflects their initial investments. These results are in line with findings from earlier research.
The new firms we studied were as per our definition the main source of income for their owners. Despite this, only about 57 % actually paid out salaries. This figure sinks to 40 % in subsequent years. Average salaries among the firms paying salaries was very low in the first year, but thereafter increased in the following years. After five years, average salaries had increased by about 290 %. It is worth mentioning that salaries were highest in certain industries, more specifically in industries with high barriers to entry or in industries where an STLF background could be regarded as an asset.
Growth in newly started firms was analysed at an aggregate level. We can state that a total of 11,879 jobs were created annually, of which 6,604 (55.6 %) still remained in 2000. About 80 % of the jobs were created during the first year of existence, while the remaining 20 % were due to growth during the following years. In other words, it was difficult for these companies to achieve growth.
To summarise our results. The most prominent is that this group does not represent a Schumpeterian population of entrepreneurs. The converse is true, as the group's contribution to the economy is small and probably decreasing. The capacity of the group to create employment has weakened during the period studied. Neither has it demonstrated any growth in salaries or number of employees. However, there were certain differences between industries, type of company and initial size.
It is evident that being a start-up entrepreneur is not an attractive alternative for those with a background in science, technology or medicine (STLF). Given the low salaries and lack of growth, it largely appears to be the case that it is mainly those who don't succeed in getting other employment who start firms. There are, however, a number who are successful and succeed in achieving good development, but at the aggregate level the results are less than impressive. Since many appear to be forced into entrepreneurship, it is probable that the ideas which have the greatest potential are not being exploited. Further research and knowledge can provide us with a better basis for examining these issues, and making recommendations.
One important component in commercialising new knowledge may be entrepreneurship. In this report we have studied a part of this phenomenon and our results can to a certain extent explain why Sweden has not been particularly successful in this area. Our results indicate that entrepreneurial activities in terms of starting new firms is too low and there remains an imbalance between the creation of new knowledge and entrepreneurship. This leads us into highlighting some of those areas where initiatives should be taken. Areas which may be fruitful to focus on are Science Parks and education. Science Parks are thought to stimulate entrepreneurship and for this reason more work can be put into this area, either to further develop or possibly expand on existing work in this area. As regards

SELF-EMPLOYMENT AMONG THE SWEDISH SCIENCE AND TECHNOLOGY LABOR FORCE
15
education, it is important that entrepreneurship is focused on in education so that students can see that entrepreneurship is an attractive alternative to employment. In conclusion, it is important to review the general playing rules for firms, and make it easier for individuals wishing to exploit an idea through entrepreneurship. Examples of such playing rules are the share capital required to start a limited liability company, taxes and the ability to build up personal wealth which can then be invested in new firms.

SELF-EMPLOYMENT AMONG THE SWEDISH SCIENCE AND TECHNOLOGY LABOR FORCE
16

SELF-EMPLOYMENT AMONG THE SWEDISH SCIENCE AND TECHNOLOGY LABOR FORCE
17
1 Abstract
In this study we investigate the firms started and owned by the science and technol-ogy labor force (STLF) in Sweden between 1990 and 2000. The population consists of 22,312 firms of which 7,716 are new firms established by entrepreneurs from the STLF. We have specifically investigated the entry, survival, salary devel-opment and employment growth of these new firms. We examined the effect of cohort and industry affiliation, initial size class and legal form. We find strong evidence that this group of entrepreneurs and their firms play only a minor role in economic development in Sweden. We also find strong evidence that initial conditions during establishment have long lasting effects on our performance measures. The results are discussed from the perspective of endogenous growth theory, entrepreneurship theory, and industrial organization theory.

SELF-EMPLOYMENT AMONG THE SWEDISH SCIENCE AND TECHNOLOGY LABOR FORCE
18

SELF-EMPLOYMENT AMONG THE SWEDISH SCIENCE AND TECHNOLOGY LABOR FORCE
19
2 Introduction
The purpose of this report is to explore the entrepreneurial activities of the science and technology labor force in Sweden. We are interested in understanding the magnitude of their entrepreneurial efforts and how it is related to economic growth. By entrepreneurial activities here, we mean the establishment, growth and exit of independent firms. In other words, we are interested in seeing how many firms are created, expanded and terminated by entrepreneurs coming from the science and technology labor force. The reason that we are interested in this is, as we will see later, that the entrepreneurial activities of this group is recognized to be of poten-tially great economic value because it is the link between the production of new technological knowledge and its commercialization. By studying the entrepreneu-rial activities of this group we can better understand how new technological knowledge is converted into economic growth.
If the entrepreneurial activities of this labor group are of importance, then we can conclude that Sweden has a framework that encourages entrepreneurial initiatives based on the commercial exploitation of new knowledge. This is of particular importance to Sweden as it has built much of its economic wealth on entrepreneu-rial activities initiated by Swedish engineers and researchers. Well-known firms such as Eriksson, ASEA (now ABB), AGA, SKF and Electrolux, have all been created by entrepreneurs with an engineering or research background. Much of their competitive advantage can be attributed to investments in research and development. However, while these firms still contribute to economic growth in important ways, they were created more than a century ago. Moreover, we have witnessed substantial downsizing on their part during the last fifteen years. As in the rest of the world, entrepreneurship in terms of new firms has become an important substitute for these large and old firms, since they are able to create new jobs and more effectively use new technological knowledge for commercial purposes (Aldrich, 1999; Audretsch, 1991b; Audretsch & Mahmood, 1995a).
From the perspective of endogenous growth theory, the commercial use of new knowledge coming from research and development drives economic growth (Lucas, 1988; Romer, 1990, 1994). Endogenous growth theory adds new knowl-edge to the inputs affecting economic growth, but does not specify where new technology comes from, and how it is converted into economic growth (Carlsson & Eliasson, 2003). We suggest that an important mechanism for explaining how new technological knowledge is converted into economic growth is the economic behavior of the science and technology labor force, and especially the entrepreneu-rial activities of that group.
The science and technology labor force is important for a number of reasons. First, it is the labor force that has the highest probability of being part of the research and development sector producing new knowledge. For this reason the relative size of that group is important because they represent the accumulated technological knowledge in the economy. Second, even if they are not producers of new knowledge, they will be carriers of this knowledge from one firm to another as they

SELF-EMPLOYMENT AMONG THE SWEDISH SCIENCE AND TECHNOLOGY LABOR FORCE
20
move from one employment to another. They thus play an important role in the process of technology dissemination and knowledge spillovers. Third, as they have access to new information, they have the greatest probability of discovering poten-tially valuable opportunities to exploit commercially. Hence, an analysis of the economic behavior and entrepreneurial activities of the science and technology labor force is important in providing an understanding how new technological knowledge is converted into economic growth.
In a related work (Delmar, Sjöberg, & Wiklund, 2003b), we have described this group’s participation in self-employment between 1990 and 2000. We studied the complete population and found that about 13% of this group were full time self-employed for at least one year. In the present work, we will take as our point of departure results at the individual level of analysis and specifically examine how this self-employment translates into different activities at the firm level. Specifically, we want to know if this participation in self-employment leads to any substantial activity at the firm level. Knowledge about these activities is still scarce. For example, we do not know how many firms this group creates, and whether or not these firms create any substantial economic growth. We want to know how science is used to establish, and to expand firms, and whether or not such firms exit from the market. To achieve our purpose, we have constructed the specific population of firms that are managed and owned by those that are self-employed with a background in the natural sciences, medicine, or technology. We follow this population of firms between 1990 and 2000. Such analyses have previously been impossible to conduct at the firm level due to data limitations. With the help of experts1 from Statistics Sweden, we have been able to mitigate this problem and match individual level data with firm level data. This enables us to follow the evolution of this specific population.
From the perspectives of both entrepreneurship theory and endogenous growth models, this population is ideal for gaining an understanding of the use of new knowledge for commercial use. However, it must be acknowledged that while entrepreneurship is probably the most important force behind the commercializa-tion of new knowledge, other forces represented by the industrial and market power of already established large firms also play a non-trivial role. While we also ac-knowledge their importance, such an analysis is beyond the scope of our empirical ambitions. This report covers:
• A description of the extent to which independent firms are owned and managed by entrepreneurs from the science and technology labor force.
• Entries and exits of firms owned and managed by entrepreneurs from the science and technology labor force.
• The growth and survival of these firms. • The distribution of these firms across industries. • The distribution of these firms across legal forms. • The labor structure of these firms in terms of education and sex.
1 We would especially acknowledge the valuable support and work provided by Jan Andersson, Statistics Sweden.

SELF-EMPLOYMENT AMONG THE SWEDISH SCIENCE AND TECHNOLOGY LABOR FORCE
21
The approach taken in this report is eclectic. The analysis draws on a framework based on endogenous or new growth theory, industrial organization, and entrepre-neurship. However, since we are interested in the entrepreneurial activities of this particular labor force group, we focus on their firm activities from an entrepreneur-ship theory perspective arguing that the quantity and quality of such entrepreneur-ship is dependent on the available opportunities based on new knowledge, as well as the industrial context in which these opportunities were exploited at a particular time (Aldrich, 1979, 1999; Baumol, 1993; Nelson & Winter, 1982; Schumpeter, 2000 (1934); Shane & Eckhardt, 2003). Based on the present framework, we argue that entrepreneurship is the critical link between the technological system and the exploitation of entrepreneurial opportunities within the market economy (Carlsson et al., 2003; Grebel, Pyka, & Hanusch, 2003). The framework developed in this study focuses on the entry, growth, and exit of firms, driven by a labor force with high potential access to new, emerging technologies.
The report is structured as follows. In the next section, we develop a theoretical framework. In this framework we expand our discussion on why technological changes are central to entrepreneurship and economic growth. Using entrepreneur-ship theory, we explain how new knowledge is transformed into commercial activities. Insights from industrial organization help us to understand how these firms develop. Thereafter, we describe the method. We discuss the strengths and limitations of the present design, as well as the measures employed to analyze the data. In the fourth section, we present the results from the analyses. We discuss in detail how these firms come into existence, whether they grow, and in which industries and legal form. Finally, we conclude by putting forward our conclusions and we discuss the implications of this study for research and for policy purposes.

SELF-EMPLOYMENT AMONG THE SWEDISH SCIENCE AND TECHNOLOGY LABOR FORCE
22

SELF-EMPLOYMENT AMONG THE SWEDISH SCIENCE AND TECHNOLOGY LABOR FORCE
23
3 Theory
3.1 Endogenous Technical Change Endogenous growth theory distinguishes itself from neoclassical growth theory by emphasizing that economic growth is an endogenous outcome of an economic system, and not the result of forces that impinge from the outside. At the heart of endogenous growth theory is the assumption that technological changes arise from intentional investment decisions made by profit-maximizing agents (Romer, 1990, 1994).
Technological change leads to a change in the output per hour worked, and thus leads to increased growth. The reason that technological change plays such a central role is due to the basic characteristics of technology or technological discoveries. Technological discoveries differ from other inputs in the sense that many people can use them at the same time. That is, knowledge related to technological discoveries can be used by many users and for different products or services. In economic terms knowledge is a non-rival good. This implies that the use of the good (knowledge) by an individual or a firm in no way limits its use by others. For example, land is a rival good as its use by one agent precludes its use by another. The use of knowledge about software programming by a firm does not preclude the use of that knowledge by another firm. Furthermore, these technologi-cal discoveries come from things people do. If they act in the market, many of those individuals and the firms in which they are active have the possibility to earn monopoly rents on these discoveries. This is possible as long as they retain control over the information produced by most discoveries. Hence, technological knowl-edge is a partially excludable good. That is, it is possible for the owner of the information to prevent others from using it by preventing access or by preventing understanding of how the information can be used. The observation that knowledge from technological change can be seen as a non-rival and partially excludable good enables us to explain how economic growth is achieved (Romer, 1990, 1994).
In endogenous growth theory, technological knowledge is no longer an entirely public good, as in the neoclassical view. This leads to technological spillovers: firms can acquire information created by others without paying for that information on the market, and the owners of such information have often no effective resources to hinder this to happen under prevailing laws, if other firms choose to use the information. There are many ways in which spillovers can take place. One example is the mobility of highly skilled employees between firms. Spillovers also occur when new knowledge enters production. A second way is when new technological knowledge is used in production by the firm that has developed this new knowledge. Here, it is possible for the firm to protect the new technological knowledge. However, the new set of knowledge increases the general level of publicly available knowledge because it is spilled over to other researchers who study its patent documentation. As such there is an increase in productivity because this set of new knowledge leads to the creation of further inventions in the research sector. A third way for new knowledge to enter production and create spillovers is

SELF-EMPLOYMENT AMONG THE SWEDISH SCIENCE AND TECHNOLOGY LABOR FORCE
24
related to the relationship between the total stock of knowledge and the human capital used in research and development at a certain time. This relationship affects the creation of new knowledge. Human capital creates new knowledge, but the ability to do so is dependent on the productivity of that human capital. That produc-tivity is dependent on the total stock of already available knowledge. The larger the size of the stock of knowledge, the higher the productivity of the human capital and the less expensive it is for firms to invest in the creation of new knowledge (Acs, 2002). Hence, as the stock of knowledge increases, the cost of producing new knowledge decreases.
Consequently, the creation and commercial use of new knowledge plays an impor-tant role in economic growth. This new knowledge comes from things that people do. They create new knowledge because they think they may be able to achieve market power and earn monopoly rents. The question then becomes who are the agents most likely to create the new knowledge and introduce it to the market for commercial ends, and why do they do this? Research suggests that certain agents in the economy are more likely to use new knowledge commercially than others.
3.2 The Entrepreneurial Process We have argued that new knowledge is non-rival and under some circumstance even free for use. However, knowledge about the existence of this knowledge is not necessarily free or equally distributed across all individuals in an economy. On the contrary, as Hayek (1945) pointed out, a central feature of a market economy is the division of knowledge among individuals, as no two individuals share the same knowledge or information about the economy. What is important is that this new knowledge is diffused in the economy and is not available to everyone. Only a few will know about a new way of organizing, a new way of producing new products or services or new raw materials that are not being put to best use. Such knowledge is personal because it is acquired through each individual’s own situation, including present and previous occupations, education, social position, and daily life. It is this particular knowledge, obtained in a unique knowledge base that leads to people developing a belief that they have discovered a valuable opportunity to exploit commercially (Acs, 2002; Shane et al., 2003; Shane & Venkataraman, 2000). The unequal distribution of information among individuals who as a result do not have access to the same interpretations, experiences or observations has two important implications for entrepreneurship (Acs, 2002).
First, entrepreneurship is possible because people do not have the same access to information, and thus they differ in what they believe to be a valuable opportunity for its exploitation. It is this unequal distribution of information that creates oppor-tunities in the first place. Second, the same unequal distribution of information creates obstacles to exploiting the opportunity profitably, since there is no current market for these future goods and services. Hence, the entrepreneurial process is a function of the uncertainty of the real value of the opportunity, and the information asymmetry. Despite not knowing its actual value, some people will still choose to invest their time, talent and resources to exploit what they believe is a valuable opportunity. It is thus necessary to understand (1) the sources of new opportunities,

SELF-EMPLOYMENT AMONG THE SWEDISH SCIENCE AND TECHNOLOGY LABOR FORCE
25
(2) the identification of new opportunities, (3) the exploitation of new opportuni-ties, and (4) the consequences for the economy2. The field of research into entre-preneurship consequently seeks to explain the economic process whereby oppor-tunities in the market economy arise, how individuals identify opportunities and overcome the obstacles to their exploitation, and what the consequences of entrepreneurship are for the economy. This process is labeled the entrepreneurial process.
The theoretical framework of this report is inspired by an Austrian economic model of entrepreneurship (Kirzner, 1997; Schumpeter, 2000 (1934))which identifies the historically and culturally determined framework conditions affecting entrepreneur-ship and the idiosyncratic prior experiences of enterprising -and potentially enterprising - individuals (Shane, 2000b; Shane et al., 2000; Venkataraman, 1997). By framework conditions, we refer to general conditions defining the context in which entrepreneurship occurs. Examples of such conditions are the stock of know-ledge, of financial and of human capital in the economy, its institutions, the history, and the culture of the economy. Such conditions determine what opportunities are identified, and how entrepreneurs will exploit them (Baumol, 1993). The present model assumes that changes in technology create opportunities that are not equally obvious to everyone, but are discovered and exploited because some individuals have an advantage in discovering specific opportunities. This advantage is provided by these individuals’ access to idiosyncratic information and resources that are gen-erated by their prior experiences and their position in social networks. Entrepreneu-rial opportunities are not equally obvious to everyone, but the model assumes that they are equally available to anyone with the experiences and the knowledge to discover them.
3.2.1 The Sources and Discovery of Opportunities In order for opportunities to be identified, they first have to arise in the economy. The literature offers two different perspectives to this question. The first perspec-tive is attributed to Kirzner (1997), and the second to Schumpeter (2000 (1934)). Venkataraman (1997) termed these opportunities ‘weak’ and ‘strong’ respectively, because the former does not assume that opportunities need to be based on revolutionizing innovations, whereas the latter assumes that their introduction is the basis for the opportunities on which the entrepreneurial process is based.
Kirzner assumes the presence of differential access to information. These differ-ences in access to information lead to the existence of entrepreneurial opportuni-ties. This is, because people have different access to information since markets are not perfectly efficient3. Market inefficiencies are a major source of opportunities,
2 Exploitation of entrepreneurial opportunities here refers to the establishment of an independent business. However, entrepreneurial opportunities can also be exploited in existing organizations or on the market through licensing for example. 3 Markets are efficient when all economic agents have access to the same information and have similar financial strength (no agent is sufficiently strong to start dominating the other agents). In such a case, markets are in equilibrium, and the price conveys all information necessary to define demand and supply. In this model, there is no room for an entrepreneurial individual.

SELF-EMPLOYMENT AMONG THE SWEDISH SCIENCE AND TECHNOLOGY LABOR FORCE
26
where entrepreneurs can enhance their wealth by exploiting these inefficiencies. Hence, Kirzner argues that markets are in disequilibrium until an entrepreneur enters the market to exploit the inefficiency, and thereby restores the market equilibrium. In contrast, Schumpeter assumes that new knowledge has to be intro-duced for entrepreneurial opportunities to arise. He suggests that even if markets are in equilibrium, the introduction of new knowledge in the forms of innovations, and the existence of individuals willing to use these innovations to enhance their wealth, leads to the destruction of the equilibrium. This is known as the process of creative destruction. Both perspectives assume that the market should be perceived as an ever-changing process. This process results in a continuous supply of oppor-tunities that may enhance personal wealth, and a continuous supply of individuals seeking to exploit such opportunities.
Kirzner identifies market inefficiencies as a major source of opportunities. A mar-ket becomes inefficient because changes are introduced in the market that existing economic agents are not ready to or cannot assimilate, because their operations are based on old routines that are difficult to change. Kirzner assumes that there is already a market in existence, but that a change in the market leads to new opportunities. Changes in existing markets can arise because there are (a) political or regulatory changes, (b) social or demographic changes or (c) technological changes. What is important is that the demand side, the supply side or both change. For example, this means that a market can expand in size, as did the market for financial instruments when the financial market was deregulated in the 1980s. Another example are changes in the customer base, such as when new production processes lowered the price of mobile phones thereby making them available to a larger consumer market, rather than just a wealthy few.
For Schumpeter it is the creation of a new market that is central. It is the introduc-tion of new knowledge in an economy that leads to such kinds of revolutionizing entrepreneurial opportunities. When this knowledge is commercialized, new mar-kets are created, which changes the way the economy functions. One example is the introduction of the personal computer which has changed the way people work and live. Another example is the introduction of the car which has changed the way we define transportation. This new knowledge often comes from technological innovations. The introduction of the personal computer resulted in a market for microchips, flat screens, and software. Such products did not previously exist, and these technological changes have created a demand for new resources such as computer engineers, or changed the price of existing raw materials needed to manufacture computers, such as silicon. Change in Kirzner’s perspective is incre-mental, whereas change in Schumpeter’s perspective is discontinuous. For Schum-peter, the entrepreneur assumes the role of economic leadership, and revolutionizes the economy. Kirzner grants the entrepreneur a somewhat more humble role. However, differential access to information is the major source of opportunities in both perspectives.
It can be assumed that because of the differences in nature between Kirzner’s and Schumpeter’s opportunities they can co-exist in the same economy (Shane, 2003; Shane et al., 2000). Entrepreneurs tend to exploit both types. The two types of

SELF-EMPLOYMENT AMONG THE SWEDISH SCIENCE AND TECHNOLOGY LABOR FORCE
27
opportunities also have different consequences for the economy. Schumpeter’s types of opportunity lead to important technological shifts in the economy and disequilibrating consequences because of their revolutionizing nature. Kirzner’s types of opportunities bring the economy to equilibrium and more efficient use of resources because of their incremental aspect. A development of that argument suggest that most entrepreneurial opportunities are Kirznerian because most opportunities are minor variations or imitations of established ways of doing things (Aldrich, 1999). Most entrepreneurs just try to copy an opportunity they have perceived as profitable and try to exploit it. That is, they try to copy the modus operandi of what they see as market winners. Thereby they reduce the uncertainty and risk coupled with exploiting an opportunity.
3.2.2 The Exploitation of Opportunities Opportunities in themselves are unstructured. The advantages and disadvantages of opportunities are largely dependent on the interpretation or construction of the available information about the opportunity made by the individual. These differ-ences in interpretation are linked to differences in personal experience and education (Casson, 1982a). This means that while opportunities are fuzzy (i.e., based on the same opportunity, multiple combinations of products and services can be created, but only an unknown number are valuable), and the entrepreneur has to discover the opportunity and package it, so that others can understand its value. This process of transforming a fuzzy opportunity into a valuable and distinct busi-ness opportunity for exploitation is known as the construction of a new means-ends framework. A new means-ends framework is the way entrepreneurs think about how they generate a better alternative to existing products and services, and how that alternative is going to generate a profit (Shane, 2003). It is the combination of the nexus of opportunity and enterprising individuals that is critical for entrepre-neurship. The exploitation of the opportunity is defined by three characteristics: (a) the ability to discover versus the ability to exploit (b), the entrepreneur’s opportu-nity cost and (c) the uncertainty of the outcome and information asymmetry.
There is an important difference between having an insight about what may consti-tute a valuable opportunity, and having the knowledge about how to exploit this opportunity. The incentives, capabilities, and the specific behavior needed to profit from useful insights all vary among individuals. These differences are relevant for explaining the development and performance of the entrepreneurial endeavor. There is no automatic logic suggesting that the differences in access to information and talents that lead to the discovery of an opportunity are the same sort of information and talents that lead to the successful exploitation of the opportunity. On the contrary, anecdotal evidence suggests that those that are the most successful in identifying potentially valuable opportunities are far removed from those most capable of exploiting them. For example, an important role of the venture capital industry is to identify entrepreneurs with valuable opportunities and to match them with human and financial resources needed to organize the exploitation of that opportunity.
SELF-EMPLOYMENT AMONG THE SWEDISH SCIENCE AND TECHNOLOGY LABOR FORCE
28
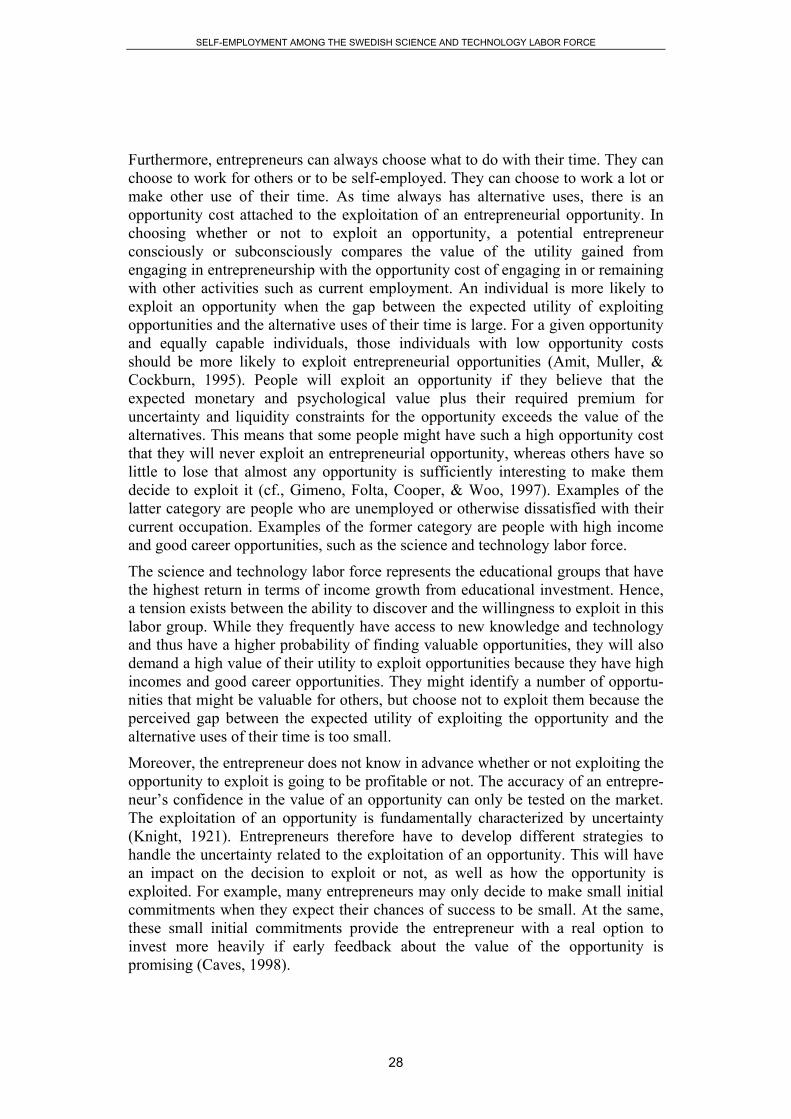
Furthermore, entrepreneurs can always choose what to do with their time. They can choose to work for others or to be self-employed. They can choose to work a lot or make other use of their time. As time always has alternative uses, there is an opportunity cost attached to the exploitation of an entrepreneurial opportunity. In choosing whether or not to exploit an opportunity, a potential entrepreneur consciously or subconsciously compares the value of the utility gained from engaging in entrepreneurship with the opportunity cost of engaging in or remaining with other activities such as current employment. An individual is more likely to exploit an opportunity when the gap between the expected utility of exploiting opportunities and the alternative uses of their time is large. For a given opportunity and equally capable individuals, those individuals with low opportunity costs should be more likely to exploit entrepreneurial opportunities (Amit, Muller, & Cockburn, 1995). People will exploit an opportunity if they believe that the expected monetary and psychological value plus their required premium for uncertainty and liquidity constraints for the opportunity exceeds the value of the alternatives. This means that some people might have such a high opportunity cost that they will never exploit an entrepreneurial opportunity, whereas others have so little to lose that almost any opportunity is sufficiently interesting to make them decide to exploit it (cf., Gimeno, Folta, Cooper, & Woo, 1997). Examples of the latter category are people who are unemployed or otherwise dissatisfied with their current occupation. Examples of the former category are people with high income and good career opportunities, such as the science and technology labor force.
The science and technology labor force represents the educational groups that have the highest return in terms of income growth from educational investment. Hence, a tension exists between the ability to discover and the willingness to exploit in this labor group. While they frequently have access to new knowledge and technology and thus have a higher probability of finding valuable opportunities, they will also demand a high value of their utility to exploit opportunities because they have high incomes and good career opportunities. They might identify a number of opportu-nities that might be valuable for others, but choose not to exploit them because the perceived gap between the expected utility of exploiting the opportunity and the alternative uses of their time is too small.
Moreover, the entrepreneur does not know in advance whether or not exploiting the opportunity to exploit is going to be profitable or not. The accuracy of an entrepre-neur’s confidence in the value of an opportunity can only be tested on the market. The exploitation of an opportunity is fundamentally characterized by uncertainty (Knight, 1921). Entrepreneurs therefore have to develop different strategies to handle the uncertainty related to the exploitation of an opportunity. This will have an impact on the decision to exploit or not, as well as how the opportunity is exploited. For example, many entrepreneurs may only decide to make small initial commitments when they expect their chances of success to be small. At the same, these small initial commitments provide the entrepreneur with a real option to invest more heavily if early feedback about the value of the opportunity is promising (Caves, 1998).

SELF-EMPLOYMENT AMONG THE SWEDISH SCIENCE AND TECHNOLOGY LABOR FORCE
29
Finally, the distribution of information and knowledge in the economy is what enables the entrepreneur to discover a fuzzy opportunity and to transform it into a valuable business opportunity. However, this quality also presents the entrepreneur with problems. The process of creating a valuable means-ends framework implies that much of the information needed by potential stakeholders to evaluate the value of the opportunity is not readily available. Examples of such information are infor-mation about how to apply technology, how to serve markets, how to set prices, in-formation about customers’ preferences, competitors and suppliers (Shane, 2000b). Such information cannot be accessed by potential entrepreneurs unless a function-ing market has been created. Potential stakeholders thus have to rely on the entrepreneur for information, but without the benefit of the entrepreneurs’ special insight. In almost every venture entrepreneurs have more information about the true qualities of the opportunity and their ability to exploit it than any other parties. Because of this information asymmetry, stakeholders may not be willing to make the necessary investments to develop the new venture. This situation leads to problems of moral hazard and adverse selection. Despite the existence of these problems, a number of entrepreneurs are able to secure resources needed on favorable terms and to share the risks with stakeholders.
In sum, the decision to exploit an opportunity is dependent on the entrepreneur’s ability to transform a fuzzy opportunity into a valuable venture, the expected utility cost, the ability to handle uncertainty, and the ability to overcome problems related to information asymmetry. Some individuals believe that they have secured enough resources and that they have the ability needed to exploit an opportunity. Some of those will also be able to achieve financial success (Venkataraman, 1997).
3.2.3 The Mode of Exploitation A critical aspect of the entrepreneurial process is the mode of exploitation chosen by the entrepreneur. Two questions have to be answered to determine the mode of exploitation (Shane, 2003). First, does the individual who identified the opportunity want to exploit it on behalf of someone else, or exploit it on his or her own? Second, does the individual want to use a market mechanism, such as licensing or franchising, or use a hierarchical mechanism such as a firm to exploit the opportu-nity? Considering the number of modes of exploitation and that the dominant choice seems to be the start of an independent firm, it is interesting to ask why this is so?
Acs and Audretsch offer an economic explanation to this question based on an agency cost perspective (Acs, 2002; Acs & Audretsch, 1989; Audretsch, 1991b, 1995b; Audretsch et al., 1995a; Wiggins, 1995). They argue that in the absence of perfect markets with perfect information, markets are characterized by uncertainty and substantial information asymmetries which makes the creation of new inde-pendent firms the best way to process the information needed to determine the value of new opportunities. Due to the uncertain nature of economic knowledge, and the existence of substantial information asymmetries across agents, the assess-ment of the expected value of a new means-ends framework is likely to be anything but unanimous between the entrepreneur and the decision makers of the incumbent

SELF-EMPLOYMENT AMONG THE SWEDISH SCIENCE AND TECHNOLOGY LABOR FORCE
30
firm when confronted with the proposed new means-ends framework. Combined with the bureaucratic organization of the incumbent firms in decision-making, the information asymmetry leads to different agency problems, for example, problems related to the construction of incentive structures, monitoring and transaction costs (Wiggins, 1995). These agency problems in combination with information asym-metries provide the incentives for an entrepreneur to pursue their opportunity by starting a new independent firm.
The degree to which incumbent firms are confronted with such agency problems with respect to new knowledge and potentially valuable opportunities varies across industries and regions, the reason being that the underlying knowledge conditions differ. In some industries new knowledge-generating and innovative activities are relatively more frequent and can be processed within the context and structure of incumbent firms. In other industries, innovations and new opportunities often origi-nate from knowledge that is not of a routine nature and thus is more often discarded by the context and structure of the incumbent firms. Nelson and Winter (1982) call these industry differences the technological regime of the industry. They argue that the choice of exploitation mode in an industry is based on (1) the nature of benefits and costs that are weighted by the incumbent firms that will decide to exploit or not exploit a new opportunity; (2) the manner in which consumers or regulatory preferences and rules influence what is profitable; (3) the relationship between profit and how incumbent firms learn what is and what is not a valuable opportu-nity. Given the flow of new opportunities, the technological regime will strongly dictate the preferred mode of exploitation of new entrepreneurial opportunities. Hence, some industries are more favorable to innovative new firms and unfavorable to innovative activity by established firms. Other industries work the other way around. They are more favorable to innovative activity by established firms and unfavorable to innovative new firms. The first type of technological regime is labeled an entrepreneurial regime, the second type of regime is labeled routinized technological regime.
If the underlying knowledge conditions more closely resemble those of a routinized technological regime, there is likely to be relatively little divergence between the evaluation of the expected value of the entrepreneurial opportunity between the entrepreneur and the incumbent firm. Under a routinized technological regime, incentives will not exist for entrepreneurs to start their own independent firms. If the underlying knowledge conditions resemble more those of an entrepreneurial regime, there will be a greater divergence between the evaluation of the expected value of the entrepreneurial opportunity between the entrepreneur and the incumbent firm. Thus, it is under the entrepreneurial regime where the start-ups of new independent firms are more likely to play a major role. Under an entrepreneu-rial regime, incentives will exist for entrepreneurs to start their own independent firms. We have argued that the result of the motivation is to appropriate the value of economic knowledge. Due to agency problems, this value cannot easily and without cost be transferred to the incumbent firms. This shifts the emphasis from firms and institutions to individual agents endowed with new economic knowledge.

SELF-EMPLOYMENT AMONG THE SWEDISH SCIENCE AND TECHNOLOGY LABOR FORCE
31
This model allows us to understand how entrepreneurship both affects and is affected by surrounding conditions such as information asymmetry and uncertainty, and how the entrepreneurial process evolves over time (from individuals recogniz-ing opportunities to exploiting them more or less successfully in independent firms). This is the reason why only certain kind of opportunities are discovered and by certain kinds of individuals; who decides to exploit these opportunities and what leads to the ability to recognize an entrepreneurial opportunity also leads to prob-lems of resource acquisition. This model also explains why the exploitation of many entrepreneurial opportunities are organized as independent start-ups. In the next section we will elaborate on what happens when new firms enter an industry and a market.
3.3 Firm Entry, Growth, Exit and Industrial Differences Our framework suggests that entrepreneurship - here defined as the establishment of new firms and their development - represents an important mechanism in trans-forming new technological knowledge into economic activities. We have described in detail the function of this mechanism. In this section we review earlier empirical research on new firm formation and their development (growth and exit). As we will see, empirical research supports the theoretical framework, but research also points heavily towards the fact that far from all new firms have a substantial impact on the market. Quite the contrary, only a few of the firms started can be expected to have any effect on the market. However, their aggregate volume has a substantial impact on how industries and economies develop. We will more specifically focus on research dealing with industrial organization (Caves, 1998; Geroski, 2001), but also to some extent organizational ecology (Carroll & Hannan, 2000; Freeman, 1982; Hannan & Freeman, 1984).
We have organized this section in two main parts. The first part is dedicated to empirical evidence on firm entry and exit. We do not deal with entry and exit sepa-rately, because, as we will see, the two are closely related to each other. The second part is dedicated to empirical evidence on firm growth. Industrial differences are addressed in the respective parts. We will focus on a number of stylized facts, that is, empirical results that tend to come in a variety of studies that have been carried out in various economies and with different approaches. Hence, the reported facts have a solid basis of support in the empirical literature.
3.3.1 Firm entry and exit To start with, entry and exit (or the birth and death of firms) are intimately related. This intimacy seems to be related to two mechanisms. First, the survival rate among most entrants is low, especially during the first few years. Even successful entrants may take more than a decade before they reach a size comparable to the average firm size in the industry (Dunne, Roberts, & Samuelson, 1988; Geroski, 1995b). Most of the failures of new entrants occur during the first year and then survival rates increase steadily. The survival rates for entrants reported from various countries are quite similar. Second, the correlation between rates of entry and exit is high. For example, in Sweden the correlation between entry and exit

SELF-EMPLOYMENT AMONG THE SWEDISH SCIENCE AND TECHNOLOGY LABOR FORCE
32
varies depending on industries from 0.6 to 0 .7. In Canada, it ranged between 0.5 and 0.7 according to a study by Picot and Dupuy (1998). In other words, in most industries the number of firms that enter the industry corresponds roughly to the number of firms exiting. This indicates that entry and exit seem to be part of a process of change where a large number of new firms (when they survive their first year) displace large numbers of older firms without changing the total number of firms in operation at any given time very much. This process is often referred to as churning.
New firm entry is common. Large numbers of firms enters most industries in most years, but the rates of entry are higher than the actual impact of the industries’ sales. The difference between entry rates and actual impact on the sales of the industry is due to the fact that new firms are much smaller than the incumbent firms. This is consistent with the notion that small-scale entry is easy, but that large-scale entry is not (Geroski, 1995b). Entry size is discussed in greater detail below.
Entry rates vary more within the life cycle of an industry than between industries. Rates of entry are seldom persistently high in some industries or persistently low in other industries over time. Rather entry seems to come in bursts that are not related to specific industries. What seems to be determining the entry rates is the life cycle of the industry, instead of cross-sectional differences between industries. The path of an industry’s life cycle is often as follows: First the industry grows rapidly because of a large number of entries, and incumbent firms are also able to grow rapidly. Second, the industry declines sharply and we can observe a shakeout with high rates of exit. During the first and second phase, we can observe that on a firm basis, output rises and product prices fall at a decreasing percentage. In the third phase, entry and exit rates stabilize and the changes in output and prices level off (Klepper & Graddy, 1990). Evidence suggests that new firms have the most impact on the industry when the industry is young, i.e., during the first phase of the industry life cycle (Klepper, 1996).
New firms are small when they enter an industry even if there is substantial variation within and between industries. In other words, firms enter industries at different initial sizes, and the entrant’s size distribution varies from industry to industry. This pattern is aligned with the structure of the industry entered, which is often called barriers to entry (Mata & Portugal, 1994; Mata, 1996) and also affects the probability of survival of the firms. Greater entry barriers in an industry mean a large initial size on average for entrants, but most entrants remain very small. That is, most entry firms have similar size across industries. Audrescht and Mahmood (1995a) studying a US population, and Wagner (1994) studying a German population, both found that the survival rate of firms increased with their initial size. Similar results have been found by Dunne, Roberts and Samuelsson (1988; 1989). The interpretation is not necessarily that small firms fail because they lack resources. On the contrary, firm founders seem to be quite rational and to use a real option approach. The meaning of this approach is that because firm founders cannot a priori know the value of their opportunity, less confident firm founders start out small, incurring a unit-cost penalty but limiting sunk cost investment while

SELF-EMPLOYMENT AMONG THE SWEDISH SCIENCE AND TECHNOLOGY LABOR FORCE
33
they gather evidence of the value of the opportunity. If the feedback is positive, firm founders can increase their investments; if the feedback is negative they can exit at a minimum loss. Initially, smaller entrants would thus be expected to show higher exit rates. Hence, they may start small because they expect to have a high probability of failure, and consequently want to limit their investment. More confident firm founders would then start larger in order to achieve an optimal size more rapidly (Caves, 1998; Jovanovic, 1982).
The start of an independent firm is the most common way of entering an industry. It is also a less successful way of surviving as a new entrant. A firm can enter a market in three different ways. First, it can be a newly created independent firm (de novo entry), which can be subdivided into spin-offs and genuine new entries. A spin-off is a new firm where the founders have previously worked in the same industry as they now are starting in. A genuine new entry is a firm where the founders have no previous experience of the industry in which they have chosen to establish the firm. Second, a new entry can be a firm that is already present in other industries and has chosen to diversify into a new industry. This firm has then a number of plants present in several industries. Thirdly, a new entry can be a firm that moves or migrates completely from one industry to another (de alio entry). Basically, access to previously acquired financial assets, being part of a company group or both can represent an important advantage for such kinds of new firms. De novo firms are in general much smaller than the other two types of entries, and they are more likely to fail. Spin-offs are somewhat less likely to fail than genuine new entries. Not only does the type of entry determine survival, it also determines growth, where diversified firms - especially from closely connected industries - grow more rapidly than de novo entrants or specialized firms moving from one industry to another (Geroski, 1995b).
3.3.2 Firm Growth While young firms have a higher probability of failure, we can also observe that younger firms grow more and faster than older firms. We know today that young firms in young industries are particularly likely to grow. The larger and older firms get, the lower the probability of them growing (Bottazzi, Cefis, & Dosi, 2002; Bottazzi, Dosi, Lippi, Pammolli, & Riccaboni, 2001; Dunne et al., 1989). This is especially the case if we require that they grow organically (i.e., if growth through acquisition, which does not reflect new activity and new jobs, is excluded). Empirical results for Sweden suggest that among high-growth firms (here defined as the 10 percent of all firms that grow the fastest in numbers of employees), as many as 62 percent were younger than ten years (Davidsson & Delmar, 2000). This figure, which is for the 1987-1996 period, does not change substantially if we instead look at sales growth. Young firms thus grow more than older firms. This result seems to be stable regardless of whether we measure growth in absolute or relative terms. This is an important consideration since measuring growth as a relative change will favor smaller firms, whereas absolute change will favor larger firms.

SELF-EMPLOYMENT AMONG THE SWEDISH SCIENCE AND TECHNOLOGY LABOR FORCE
34
Firms in industries with high entry rates for new firms grow more than firms in more stable industries. This is another relationship between age and growth. Here, however, we are dealing with differences between industries. Where entry of new firms is high, the proportion of growth firms is also higher. Firm growth, thus to some extent, reflects the general dynamism of a specific industry. It is correct – as has been suggested in other studies – that growth firms can be found in any industry. However, growth firms are substantially over-represented in industries where start-up rates are also high. The same pattern is found on the regional level of analysis (Carroll et al., 2000; Jovanovic, 1982). The reason that dynamism is important is that firms often compete with each other under conditions where relative position matters. If other firms enter the market and grow, then the relative position of a specific firm is weakened if this firm chooses not to grow. Hence, in order to at least keep its relative competitive position a firm has to expand. This is also known as the Red Queen effect in evolutionary theory (Barnett & Sorensen, 2002). We can thus conclude that a dynamic environment is favorable to the occurrence of growth firms.
Younger and smaller firms grow organically whereas older and larger firms grow through acquisitions. As we have seen, firms can choose different growth strate-gies. Peng and Heath (1996) suggest that three basic strategic choices exist: organic or generic expansion, acquisition, and hybrid or network strategies. The age and the size of a firm play an important role in how the firm expands. Firms that are younger and smaller have a strong tendency to grow organically. This means that they expand the volume of the operations they are already running, or they develop and expand new lines of business from scratch, in-house. Older and larger firms seem to prefer growing through the acquisition of businesses already in existence. Davidsson and Delmar (2003) tested for different growth strategies while control-ling for age and size. They found that the differences were dramatic. For high growth firms (defined as the ten percent of the population of active firms that grow the fastest) that are younger than ten years, some 60 percent or more of total growth is organic; among those younger than five years, this figure is around 90 percent. For high growth firms that are older than ten years, the corresponding share is just short of 16 percent. When different size classes are contrasted, the differences are even more dramatic. High growth firms with less than 50 employ-ees grow almost exclusively through organic growth, whereas high growth firms larger than 2,500 employees actually shrunk in organic terms. This, of course, has important implications for the relationship between firm level growth and job creation at the societal level. Growth through acquisition represents re-organiza-tion, not job creation.
Furthermore, analyses have shown that the concepts ”firm growth” and ”growth firms” may represent very heterogeneous phenomena. For example, Delmar, Davidsson and Gartner (2003a) when analyzing Swedish growth firms, identified the existence of seven relatively distinct types of high growth firms. Some grow in sales, but not in employment. Some have impressive growth in relative (percent-age) terms, but not in absolute numbers, and vice versa. While some show steady growth over a number of years, others display a roller coaster ride, and yet others

SELF-EMPLOYMENT AMONG THE SWEDISH SCIENCE AND TECHNOLOGY LABOR FORCE
35
have their entire growth concentrated in one giant step. These different patterns of growth also show meaningful relationships with firm characteristics such as age and size, geographic location, ownership, and industry. The differences in how growth is achieved suggest that the growth strategies adopted by young and small firms differ significantly from the strategies employed by larger and more estab-lished firms. Hence, entrepreneurs choose strategies when expanding their firms that are based on the internal weaknesses and strengths of the firm, as well as the opportunities available. As we have seen previously, constraints presented by the environment are also important (Chandler, 1962).
Independent of the economy investigated, only a small proportion of all firms do in fact grow. Somewhat paradoxically, it is also the case that even if small and young firms grow more and create most new employment, most small and young firms do not grow at all, and many of them do not want to grow. Of all firms that start and actively establish a business, only a minority try to grow larger, and even fewer succeed. Put in other terms, the absolute majority does not grow at all (Aldrich, 1979; Reynolds & White, 1997; Storey, 1994). This does not mean that a small elite creates large employment effects. Even if only a minority grow, and most firms in this group show only modest growth, their sheer number is so large that collectively they create large employment effects (Davidsson et al., 2000; Davidsson, Lindmark, & Olofsson, 1994, 1996).
Growing firms have a higher probability of survival than have non-growing firms. The notion that organic growth of individual firms is important for the economy is fairly self-evident. Growth through acquisitions may mirror structural rationaliza-tion that is also good for the economy-at-large. It is far from being crystal clear that growth is necessarily good for the individual firm. Examples of successful firms that have grown to die or at least through their expansion experience serious financial trouble are not hard to find. Empirical research suggests, however, that by and large young firms that grow have a likelihood of survival that is twice as high as for similar firms that do not grow (Caves, 1998; Phillips & Kirchoff, 1989). It is interesting to note that a majority of small firm owner-managers hold the opposite belief, that growth is a threat to the survival ability of the firm (Davidsson, 1989b).
There are important differences between industries, however. In innovative indus-tries, growth should preferably come as early as possible in order to enhance the firm’s chances of survival. In more mature and less innovative industries, waiting a few years before setting off on a growth track may be a wiser strategy. Audretsch and his collaborators (Audretsch, 1991b, 1995b; Audretsch et al., 1995a; Audretsch & Mata, 1995b) explain this in terms of uncertainty being so high in innovative industries that firms have to invest hard in product development and launch in order to survive. If the firms are able to survive the initial first years, they have a much higher probability of generating high demand than firms in more mature industries. There is thus a clear interdependence between the degree of uncertainty in the industry, and the need for and prospect of growth. We thus find relatively many high growth firms in uncertain and turbulent environments, where entry is also high, but also an over-representation of firms that fail. The old adage ”Grow or die!” seems to carry some truth for this category of firm (Davidsson et al., 2000).

SELF-EMPLOYMENT AMONG THE SWEDISH SCIENCE AND TECHNOLOGY LABOR FORCE
36
3.4 Summary In summary, we can conclude that we have today compiled a substantial body of knowledge about firm dynamics and industrial differences. After this overview of the research findings, we hope it has become evident to the reader that this is a complex phenomenon. We know that entry is common across industries and that only a minority of all firms is actually able to expand (regardless of what economy is studied). A large number of entrants fail during their first years, but for those firms that do grow in their early years, this leads to increased probability of survival. Entry and exits are highly correlated to each other, but a closer examina-tion show that entrants to a high degree replace older and less efficient firms. Most entrants are very small, but this is probably rational behavior from firm founders as it is difficult to estimate beforehand the value of the entrepreneurial opportunity that is exploited. We have also shown that those entrants that start larger also have a higher probability of survival and achieving growth. Finally, we have pointed out that the nature of an industry in terms of its innovativeness and life cycle stage will have an impact on how many firms that will enter the industry and if they are able to achieve growth.
These empirical findings on industry dynamics have been linked to a more abstract discussion linking economic growth, the production of new technological know-ledge and entrepreneurship (defined as the establishment and evolution of new independent firms). We have argued that the production and commercialization of new technological knowledge is a key to economic growth. Entrepreneurial activities by individuals represent the mechanism by which new knowledge is transformed into economic activities. Entrepreneurial activities by the science and technology labor force may be particularly important to economic growth. First, this labor force is likely to understand the true value of opportunities that are based on new knowledge. This makes it highly probable they will discover high potential opportunities. Second, because they have substantial opportunity costs, they are likely to attempt to exploit opportunities only when they believe that the opportuni-ties do in fact have high potential. Third, entrepreneurial activities of this labor force represent a mechanism for knowledge spillover of firm-specific tacit knowledge. Tacit knowledge resides within the human capital of employees. This knowledge will only spill over to other firms should the employees choose to leave their current employment.

SELF-EMPLOYMENT AMONG THE SWEDISH SCIENCE AND TECHNOLOGY LABOR FORCE
37
4 Method
4.1 Design The design of this study is unique as it is based on a longitudinal database of all firms owned by individuals from the science and technology labor force in Sweden. This enables us to study the dynamics and development over time of this important population. We can follow firms that are already in the population, (i.e. firms owned and managed by the STLF prior to 1990), firms that enter the population during the period studied, as well as firms exiting the population. We can therefore examine both changes in the population (all active members) and the progression of cohorts (firms which become owned and managed by the STLF after 1990) when entering the population. By doing so we are able to control for age and cohort effects. That is, we are able to separate effects that are due to the fact that a case is aging, from other effects related to when the case was “born” (i.e., the establish-ment of firm). For example, a firm created in 1993 under a severe economic recession when financial resources were scarce will probably develop differently from a firm created in 1998 under an economic boom when financial resource were abundant. Hence these data give us a unique opportunity to understand how firms owned and managed by the STLF develop over time and the role of this group of highly educated individuals in the process.
From a method perspective, we decided to focus on firms owned and managed by the STLF because it enables us to control for unobserved heterogeneity. We are able to do so since both the level and the direction of education constitute criteria for inclusion in the population and thus control for other factors. We thereby restrict the kind of information and experience an individual has access too. We also restrict the variation in income and social position. This means that our analyses are less prone to erroneous interpretation as we do not subsequently have to control for relevant variables, such as access to certain information, access to capital, and access to education, all factors that we know have an important effect on both the probability of becoming self-employed, and on the established firm performing successfully. Previous studies of transition to self-employment have used more heterogeneous samples or populations in this respect (Bates, 1995; Carroll & Mosakowski, 1987; de Wit & van Winden, 1989; Delmar & Davidsson, 2000; Dunn & Holtz-Eakin, 1995; Dunn & Holtz-Eakin, 2000; Taylor, 2001) and to our knowledge no study has focused exclusively on the firms operated and owned by individuals from this educational group.
4.2 Population The primary unit of analysis in this study is the firm, i.e. STLF firms. The data set comprises all independent firms that are owned and managed full-time by the STLF between 1990 and 2000. With respect to these categories of firms, it is therefore a census study. There are 22,312 such firms in the population. 11,077 (49.6%) of these entered the population during the period studied between 1991 and 2000.

SELF-EMPLOYMENT AMONG THE SWEDISH SCIENCE AND TECHNOLOGY LABOR FORCE
38
We start by describing self-employment among the science and technology labor force at the individual level before we proceed to describe our population at the firm level.
In Table 1 the development of the STLF from 1990 to 2000 is presented. For each year, the number of people that are included in the population are reported, i.e. the total stock of individuals that have at least a three year degree within engineering, medicine or science. The total number of individuals included during a specific year represents the previous year’s value plus (or minus) the net change, which is the number of entries in the STLF (graduation plus people moving to Sweden) minus the number of exits (people dying or moving out of Sweden). From Table 1 we can conclude that the STLF is a growing work force. From comprising 140,769 in 1990, it has grown to 186,496 in 2000, which represents an increase of 45,727 individuals. Looking closer at the three different educational categories, we can see that the increase in the size of STLF between 1990 and 2000 consists of approximately 39 % of engineering, 17 % of medicine and 44 % of science gradu-ates, which adds up to a total increase of 33 %. Furthermore, the relative share of the three types of education is almost constant over the period studied. On average during the period of study, the STLF comprises approximately 50 % with an engineering degree, 30 % with a degree in medicine, and 20 % with a degree in the natural sciences. Table 1 Development of the STLF 1990-2000
1990 1991 1992 1993 1994 1995 1996 1997 1998 1999 2000 Change
1990-2000
Engineers total: 68783 70638 71136 72947 74945 77380 80405 84114 88140 92917 95456 26673
Percent of total 48.9% 49.3% 49.5% 50.0% 47.9% 48.3% 49.1% 49.6% 50.3% 50.1% 51.2% 38.8%
Medicine total: 47532 48081 47930 48272 49829 50165 50651 51360 52029 52952 55752 8220
Percent of total 33.8% 33.5% 33.4% 33.1% 31.8% 31.3% 30.9% 30.3% 29.7% 28.5% 29.9% 17.3%
Science total: 24454 24637 24643 24780 31737 32643 32760 33962 34899 39693 35288 10834
Percent of total 17.4% 17.2% 17.1% 17.0% 20.3% 20.4% 20.0% 20.0% 19.9% 21.4% 18.9% 44.3%
Total: 140769 143356 143709 145999 156511 160188 163816 169436 175068 185562 186496 45727 32,5%
In total 221,708 individuals are part of the relevant educational groups during the observation period. 49,122 (22 %) of those have been self-employed one year or more. If we look at the group of individuals that graduated during the period of study, it amounts to 44,182 (20 %) individuals. 4,790 (11 %) of these are self-em-ployed one year or more. Each case of self-employment does not necessarily equal a new firm since some firms are owned and managed by more than one individual and also because individuals may take over firms already in existence.
Table 2 below depicts how many firms are included in the population for each year during the period studied, i.e. the total stock of STLF firms each year. As can be seen in the table, the number of firms is rather stable during the observation period.

SELF-EMPLOYMENT AMONG THE SWEDISH SCIENCE AND TECHNOLOGY LABOR FORCE
39
There is a slight drop in the number of firms during 1991, 1992 and 1993. In 1994 the number starts to increase and it does so during the remainder of the period. In 1999 it is back to the same level as in 1990 and the highest observed number can be found in 2000, when there are 9,348 firms that are owned and managed by the STLF. The number of full time self-employed (FTSE) follows the same trend as the total number of firms. The reason for the figures being higher for FTSE than number of firms is that some firms are owned and managed by more than one individual from the STLF. Table 2 Number of firms operated by STLF self-employed 1990-2000
1990 1991 1992 1993 1994 1995 1996 1997 1998 1999 2000 Change
1990-2000
Number of firms 8610 7191 7069 7073 7422 7670 7602 8124 8240 8687 9348 738 (8.6%)
FTSE 9244 7815 7673 7637 7969 8181 8041 8553 8650 9079 9743 499 (5.4%)
Stlf/firm 1.07 1.09 1.09 1.08 1.07 1.07 1.06 1.05 1.05 1.05 1.04 -0.03 (-2.8%)
However, we can note that a majority of the firms are run and managed by one individual from the STLF, i.e. in most of the firms that we follow, only one indi-vidual from the STLF is involved in the ownership and management of the firm. Furthermore, this ratio has slightly decreased over the years, but for the whole period there is an indication that most firms are managed and owned by only one person from the STLF. This explains why the development of full-time self-em-ployed follows the number of firms. It is important to note that this does not imply that all firms are owned and managed by only one individual since people with different education (e.g. a person with a degree in business administration) may also be involved in the process. Table 3 displays the stock of firms owned by STLF entrepreneurs and the stock of firms that are included in this group during at least one year. As we match ownership and firm status, we have to remember that a firm’s status is independent of ownership, that is, a firm can have many different owners over its life span. This means that a firm might have a previous life as well as after it has left our population of study. A firm can enter our population in two ways: (1) created by an STLF entrepreneur or (2) an STLF entrepreneur becomes owner or part owner of an already active firm. Thus, for every year we can also observe a number of firms that are active and present in our data set, but not included in our population until they fulfill the selection criteria. The number of these firms varies between 2,523 in 1990 to 4,780 in 1996. The exact technique for how a firm’s identity was constructed is described below in the section on data sources.

SELF-EMPLOYMENT AMONG THE SWEDISH SCIENCE AND TECHNOLOGY LABOR FORCE
40
Table 3 The stock of firms owned by individuals from the STLF 1990-2000 1990 1991 1992 1993 1994 1995 1996 1997 1998 1999 2000
FTSE with firm level data
8596 7186 7063 6944 7396 7609 7519 8041 8179 8538 9123
Diff 14 5 6 129 26 61 83 83 61 149 225
FTSE identified 8610 7191 7069 7073 7422 7670 7602 8124 8240 8687 9348
Active firms but not part of population this year
2523 3656 4004 4215 4408 4499 4780 4489 4374 3892 2740
Total firms 11119 10842 11067 11159 11804 12108 12299 12530 12553 12430 11863
Note: Because we are matching individual level data and firm level data, and since they are not totally compatible, we get a number of cases at the individual level that are indicated as individuals with firms, but there is no data on the firm level. These cases are indicated in the row “diff”. The cases are kept in the analyses for reasons of clarity. The absolute majority of these cases are single individual firms.
To be included in our analyses a firm has to have at least one owner with a 3-year or longer university degree in engineering, natural sciences, or medicine (nursing school excluded) (Delmar et al., 2003). As indicated previously, there are two ways in which a firm can enter the population. Table 4 displays the dynamics of this specific population when it comes to entry and exit. In the first case, a person with the relevant education starts a firm. These cases are labeled “De novo STLF” in Table 4. In the second case, persons not having any of the relevant education forms have established a firm and this firm becomes owned or partly owned by a person from the STLF at a later time. These cases are labeled “acquired firms” in Table 4.4 In this case the firm becomes part of the population when the change of ownership takes place, and it becomes fully or partly owned by a person from the STLF. Similar to entry, firms can exit the population in two ways. In the first case, a firm exits the population because it is terminated. These cases are labeled “Exiting firms STLF” in Table 4. In the second case, a firm exits the population because the owner sells all ownership of the firm to persons with other educational back-grounds that are not part of the STLF. In this case, the firm can continue to be active, but is no longer part of our population. These cases are labeled “sold firms” in Table 4.
A detailed analysis of new firm entry is presented in the result section, but we can conclude with the following brief findings: First, as expected entries and exits are highly correlated. Entry, defined as de novo firms and acquired firms, represents between 19.1 % in 1993 and 24.7 % in 1990 of all the active firms. On average, 21.8 % of the firms were new in any given year. Exit, defined as exiting firms and sold firms, represents between 17.2 % in 1999 and 37.0 % in 1990 of all the active firms. On average, 21.1% of the firms exited in any given year. Second, somewhat less than half of the firms that enter our population are genuinely new start-ups initiated by a least one member of the STLF. On average, 45.4 % of new entrants were new de novo entrants. We find similar figures for exiting firms. On average, somewhat less than half of the firms (45.3 %) that exit the population are firms that are terminated by STLF entrepreneurs. Hence the majority of the firms that exit
4 It is worth noting that the terms “acquired firms” and “sold firms” do not specifically mean that ownership has been transferred. It could also mean that the STLF entrepreneur no longer has ownership and receives their primary income from that firm.

SELF-EMPLOYMENT AMONG THE SWEDISH SCIENCE AND TECHNOLOGY LABOR FORCE
41
remain active, but do not provide the primary income of the STLF entrepreneurs and are owned or partly owned by the very same persons.
An important technical detail is that over our period of observation, we have 7,716 de novo entries and 9,201 “acquired firms” accumulated over the years. This repre-sents in total 16,917 firms entering. This figure is higher than the 11,077 firms mentioned previously. The difference is that the latter represent unique entries, whereas the former figure counts the same firm each time it makes a transition back into the population. Firms exit from our population when an STLF entrepreneur does not receive their primary income from that firm or is no longer the owner. A firm enters our population when an STLF entrepreneur receives their primary income from that firm and is an owner. Hence, the same firm can enter and exit from the population as the status of the entrepreneur changes. Table 4 Entry and exit from the population of firms owned by STLF entrepreneurs
1990 1991 1992 1993 1994 1995 1996 1997 1998 1999 2000
FTSE Firm level 8596 7186 7063 6944 7396 7609 7519 8041 8179 8538 9123Diff 14 5 6 129 26 61 83 83 61 149 225FTSE Individual level 8610 7191 7069 7073 7422 7670 7602 8124 8240 8687 9348 De novo STLF 838 525 559 760 676 732 950 859 904 913Acquired firms 934 890 769 862 1048 874 1011 762 859 1192 Exiting firms STLF 1671 538 644 471 564 617 628 678 733 1000 Sold firms 1513 1000 803 699 947 1079 811 805 671 521
To summarize the description of the population of firms owned by STLF entrepre-neurs, we can conclude that the number of firms has increased steadily since 1993, when the lowest observation during the period occurs. Before this year, the number of firms decreased between 1990 and 1992. However, for the whole period we can see that the highest number of observations occurs in year 2000. In that sense the population has grown during the period observed. We have also seen that this is a highly dynamic population with a large share of both entries and exits. Because we match ownership with firm status, a firm included in our population can have an active life both before and after our analysis. We found that among entries, less than half of the entries were de novo entrants, the rest were acquired firms. Similarly, we found that half of the firms exiting the population were comprised of firms that were terminated, the rest were firms that were sold to other people with a different educational background.
4.3 Data sources This study relies on register data from Statistics Sweden. We have cooperated closely with register experts from Statistics Sweden in order to create a solid data set. By combining data from various registers, we have developed a unique data set that allows us to analyze the development of the firms owned and managed by individuals educated in engineering, natural sciences and medicine over time.

SELF-EMPLOYMENT AMONG THE SWEDISH SCIENCE AND TECHNOLOGY LABOR FORCE
42
Statistics Sweden has developed a number of longitudinal databases that enable us to follow both the individual and the firm between the period of 1990 and 2000. In this study we follow the firms owned and managed by a specific group of people, i.e. the STLF. Tracking is based on the individual person’s identification number (the Swedish equivalent to the social security number), which remains unchanged during the life of an individual. The database LOUISE is an example of an individual register with a focus on education, income and labor. The procedure we have gone through when creating our population of firms is that we first identified the relevant individuals on the basis of their education. For everyone with the specified education, we tracked their work place and singled out individuals that are self-employed during any of the years observed. For those individuals we gathered information on the firms they operate during all years that the firm represents the primary employment for the individual.
Information on the firm level is mainly gathered from two databases at SCB, RAMS and FDB. RAMS is the main data source for this study and it contains information about individuals, firms and workplaces. All firms that have employees registered in Sweden and/or have an income based on information given to the tax office are included in RAMS. FDB is a register that covers all firms and their establishments when they have more than one work place. Both establish-ments and firms are monitored through yearly surveys. The data we are dealing with is at times unstable since some changes tend not to be captured, e.g. a change in firm registration number is viewed as a new firm. In order to deal with this problem, we have adopted a procedure in order to obtain more stable entities.
Studies such as this face two definitional problems. First to identify and define what is meant by self-employment, and second to define the founding, survival and possible termination of the firms they own. We are able to identify individuals that are either part-time or full-time self-employed. In this report, however, we focus solely on full-time self-employed. A person is defined as full-time self-employed when receiving the majority of their income from a firm in which they are an owner or part owner.
While the identity of a person is stable over time, identities of firms tend to be considerably less stable. A common problem is the change in the numerical code when a firm changes ownership, industry classification or regional affiliation. This makes on-going firms appear as terminations and later as new firms, while in reality it is the same firm. This leads to a risk of over-estimating the number of terminations and start-ups. Also, firms are only tracked when they have employees or show a profit. Therefore a firm with no employees that is reporting a loss does not appear in standard business registers that are annually linked. Not taking this bias into consideration, means that we would over-sample successful firms and that we would start to track firms only when they start to show a profit. Both problems are especially important if we are interested in understanding the processes of firm formation and firm closure, and if not mitigated might lead to severe biases in our estimates. We have overcome these problems by not accepting a single identifier as the tracking criterion. We have tracked firms by combining data from the tax authorities with identity codes from Statistics Sweden. We have defined a firm as

SELF-EMPLOYMENT AMONG THE SWEDISH SCIENCE AND TECHNOLOGY LABOR FORCE
43
started as soon as it has been registered with the tax authorities and there has been some economic activity. A firm is considered to be active as long as there is any economic activity. This is independent of whether the firm is reporting a loss or a profit. This tracking of firms in combination with other sources on firm dynamics, such as employment size, industry affiliation and mergers and acquisitions enables us to better estimate the status of the firms included in our population.
4.4 Descriptor variables Six different variables were used to break down the analysis into sub-categories: survival, firm size (with different size classes), industry (18 industries), firm growth and performance (salaries), and legal form.
Industry. The theoretical frame of reference of this report has substantiated the importance of industry differences. Following and expanding on previous work in this area (Davidsson et al., 2003; Davidsson et al., 1994, 1996), we use an industry classification where firms are grouped into 18 categories based on their Swedish industry standard code (SNI92). All firms with the same SNI code are included in the same group. The 18 categories adopted here are: High-tech manufacturing, Wood, Manufacturing, Mining, Other manufacturing, Technology services, Other knowledge industries-intensive services, Finance, Trade, Hotel and restaurants, Communications (including logistics), Education, Other services, Land, forestry and fishery, Public sector etc., Research and development, and finally, Health-care. Several firms also appear as Unclassified. This classification enables us to better study the industries STLF in which entrepreneurship takes place and how it develops over time.
It is important to note that this variable is a self-reported variable. This is a weakness since some firms tend to fill out many industry codes while some do not provide any codes at all. The fact that we have a large number of “Unclassified” is an indication that either the managers of the firms have neglected to fill in this information or they perceive that their area of business is not captured by any of the existing codes. The category “Unclassified” is thus over-represented among new firms.
Legal form. We have chosen legal form, because legal form is associated with the development of the firm. For example, we know that sole proprietorships are more likely to be terminated than incorporations. There are two possible reasons for this. The first is that incorporated firms frequently start at a larger size, and based on this initial endowment will survive longer. The second reason is that firm founders that are more certain about the value of their opportunities will invest more money than other founders who are less certain. For this reason, the former group will on average be more successful. The initial investment requirement can also be seen as a sign of higher ambition and commitment levels. We have three different legal forms: sole proprietorship, partnership and incorporations.
Size class. Firm size was chosen based on its supposed importance in growth and employment creation (Dunne & Hughes, 1996; Storey, 1994; Wagner, 1992). Size classes also give us a clear way to describe the size or growth development of the

SELF-EMPLOYMENT AMONG THE SWEDISH SCIENCE AND TECHNOLOGY LABOR FORCE
44
different cohorts of new firms that we investigate. We describe the total population of firms and their size distribution using a standardized class distribution: no employees, 1-4 employees, 5-9 employees, 10-19 employees, 20-49 employees, 50-199 employees, 200-499 employees, 500-999 employees, and, 1000 or more employees. However, since the vast majority of all firms in the population are very small firms with only one employee, we have used somewhat altered size classes to take this into account in our analyses.
Firm growth and performance. An important indicator of a well functioning economy is that newly established firms are able to grow, and sometimes to grow substantially. This is especially important for this group of firms, as some of them have probably acted on opportunities with substantial value. To capture the growth of the firms, we measure the absolute growth in employment for each cohort of newly started firms. We measure growth on a yearly basis. Measuring growth only for the cohorts has important advantages as we control for the effect of age and size. As we have seen earlier, growth is closely associated with the age and size of the firm. We measure performance by measuring the total and average salary paid by the firm. While it is not a perfect indicator of performance, it is still a very good indicator of value creation. Firms that have been able to create substantial value will on average be able to pay a much higher salary than less successful firms. Hence, our two measures allow us not only to estimate how many jobs are created, but also the value of these jobs. These analyses are supplemented by analyses of what categories of people they hire (share of women, share of people from the STLF).
Survival. Firm survival is central to our topic since it varies substantially between firms (Audretsch & Mahmood, 1995; Carroll & Hannan, 2000). Survival is meas-ured as the number of years a firm is active between when it was started and when it exited the market or was terminated. Because we need to know when a firm is started, we only calculate the survival of firms established 1991 or later. Since we do not have any data on firm status prior to 1990, we can only establish firm entry and exit after 1990.
4.5 Understanding longitudinal data Working with longitudinal data as well as a number of different cohorts requires some insight into the structure of the data. Therefore, we will here spend some time describing the most important characteristics of these data. This will enable the reader to be more able to understand the choices we have made regarding what variables to focus on, as well as what is not covered by the data.
In this study we are covering the time period of 1990-2000. We do not have any information about what happens to the firms prior to 1990 or after 2000. We not only work with longitudinal design, but we also work with different cohorts, since new firms enter the population each year. In total we have ten different cohorts plus those entering the population 1990 or earlier. Since we start observing the firms in 1990, we cannot separate firms in existence from new firms in 1990. The ten cohorts are all those firms that are established by the STLF between 1991 and 2000. In other words data cover two main categories of firms: those that entered the

SELF-EMPLOYMENT AMONG THE SWEDISH SCIENCE AND TECHNOLOGY LABOR FORCE
45
population prior to 1991 and those that enter after 1990. We can study all these firms, however, we will be able to say more about the firms started or acquired during 1991 or later. For the firms that entered the population prior to 1991, all we know is what part of the population they belong to and their status after 1991. For the latter group, we follow them from the time they enter the population and forward. However, in this group we can only follow them from a minimum of one year (those entering in 2000) to a maximum of ten years (those entering in 1991). Thus we measure the first years they are in business. For some firms this time period might be too short for them to actually start growing or become discontinued.
Figure 1 illustrates how the data is structured. It presents a number of different scenarios that can be used in order to describe what types of cases are included in the data. As previously mentioned, we are dealing with a limited observation period resulting in some cases being censored. For example, firm (A) is not captured by our data since we have no information regarding events occurring prior to 1990. This could concern a firm that has been started and discontinued prior to the measurement period. Regarding firm (B), we do not have information about the firm before 1990, but from 1990 and onwards we have complete information. This is the case where a firm is owned and managed by an individual from the STLF when we start the period of observation. However, we do not know how long this person has owned and managed the firm. For case (C) we only have access to information during the period observed and we have no information about what happens before or after. This is the same case as example (B) with the difference that the firm is part of the population during the whole period of observation. All the examples mentioned so far are left-censored in some sense and are all present in our data.
Example (D) is fully covered by our data. As for (E) we have a similar scenario as for (B) except here we cover the whole period in which the firm is an STLF firm. Examples of right-censored data are covered by the following cases (F) and (G). In the case of (F), we do not have any information after 2000 and we have no information whatsoever about (G). This is the case where the firm qualifies for inclusion in our population after the period of observation ends. The lack of information covering the period before 1990 is referred to as left censoring and the lack of information after the period studied is called right censoring.
As depicted in Figure 1 below, we are dealing with both left and right censoring. Left censoring is more problematic to deal with, especially in cases when the information is fully censored, as is the case for (A). Since we have no access to their past track record, it is difficult for us to deal with firms that are included in the population prior to 1990. We only have information from 1990 and onwards, regardless of when they were actually started or became STLF firms. Left-censoring is especially problematic when trying to explain how and why processes develop as they do. The only way to deal with left-censoring is to either gather more data or to eliminate such cases. However, our prime purpose is not to explain what is happening, but to describe the development of this population over time.

SELF-EMPLOYMENT AMONG THE SWEDISH SCIENCE AND TECHNOLOGY LABOR FORCE
46
Therefore, it is important to include them when we, for example, describe the stock of these types of firms. On the other hand, in some analyses we will focus solely on the firms that enter the population after 1990. Figure 1 Possible spells of STLF entrepreneurship in the data
Furthermore, understanding the structure of the data is important for understanding how to present the results. For example, we will have a number of cases that do not have an entry into the population, but only one exit (STLF firms that are started prior to 1990). We also have a number of cases that do not have an exit from the population, because they continue to be active after 2000. Obviously, the structure of data leads us to adopt a number of different measures to be able to describe what is happening in this particular population.
20001990 Period of observation
G
E
D
BA
C
F

SELF-EMPLOYMENT AMONG THE SWEDISH SCIENCE AND TECHNOLOGY LABOR FORCE
47
5 Results
The result section is organized as follows. We start by describing the whole population of the firms which are the primary income of and are owned by STLF entrepreneurs. We then proceed to the analyses of the firms that enter this population during the period of observation. We examine the industry affiliation of these firms, their legal form, size distribution, survival and growth and perform-ance. Hence, the main part of the analyses is focused on the dynamics of firms that enter the population during the period of 1990-2000. We do this because, as argued in the method section, it allows us to control for age and cohort effects.
5.1 The Population of Firms Owned by STLF Entrepreneurs
5.1.1 Size Distribution and Job Creation Table 5 displays the size distribution among the firms which are owned by and constitute the primary income for STLF entrepreneurs, as well as what kinds of people these firms tend to employ. This is the stock of firms per year in our popula-tion. The number of firms varies between a minimum of 7,069 firms in 1992 and a maximum of 9,348 firms in 2000. Hence, in terms of the number of firms included in the population, we are dealing with a growing population.
With respect to the size of the firms and their ability to generate employment, the conclusions is the opposite. The ability of these firms to generate employment has diminished dramatically over the observation period. From this, we can conclude that the absolute majority of firms are in the size bracket 1 to 4 employees.5 On average, we find 84.9 % of all firms in this size class. Even if there is some yearly variation, there is no dramatic change at all to be observed. Almost all firms have less than 50 employees, with a few exceptions. This indicates that we are dealing with a population of very small firms in general, with almost no medium sized firms. Two additional analyses confirm this. First the average size varies between 4.0 employees and 2.9 employees. Actually, over time we can observe that the average firm size for this category of firms decreases. Furthermore, Table 5 also display the size of the largest firm found in the population per year. This maximum size varies quite dramatically over time. The maximum size peaks in 1991 with a firm having 820 employees, reaching the lowest level in 1996 with a firm having 498 employees. Thereafter, the maximum size peaks once more quite dramatically in 1998 and 1999 with firms having 984 and 1,103 employees respectively. Beside the years 1998 and 1999 which represent an important economic boom in Sweden especially in the ICT sector, we can conclude that even the maximum firm size has gone down.
5 Due to how we define the population of firms that provide their STLF owner with their primary income, we should not have any firms with no employees. However, as mentioned in the method section we have a number of cases where the individual file indicates a person as full-time self-employed, but all data except the firm’s organisation number in the firm file are missing. These are the firms indicated as having no employees.

SELF-EMPLOYMENT AMONG THE SWEDISH SCIENCE AND TECHNOLOGY LABOR FORCE
48
If we take a closer look at the kind of jobs created by this group, we found a slight increase in the share of STLF employed relative to other categories. The share of STLF in these firms has increased from 34.4 % in 1990 and the following years to 42.0 % in 1999 to drop back to 34.8 % in 2000. Changes in the educational codes in 2000 might explain the sudden decrease. The share of women (independent of education) is stable over time, with an average of 35.2 % women employed.
However, we note dramatic and negative changes when analyzing the total number of jobs created. In 1990 there were 34,432 individuals working in these firms, whilst in 2000 the figure was only 26,237. This represents a net decrease of 23.8 % over eleven years. If we believe that the entrepreneurial activities of this labor group play a crucial role in economic development, then there are grounds to be seriously concerned. It is obvious that the ability of this population to generate jobs diminishes over time. Table 5 Size distributions of firms owned by STLF entrepreneurs
1990 1991 1992 1993 1994 1995 1996 1997 1998 1999 2000
No employees 1.1% 1.0% 1.5% 7.1% 2.1% 3.0% 3.5% 3.3% 2.2% 4.3% 5.1%
1-4 employees 85.8% 83.4% 83.9% 79.9% 84.3% 84.1% 85.3% 87.0% 87.9% 86.6% 86.3%
5-9 employees 6.6% 8.4% 8.4% 7.1% 7.5% 7.4% 6.5% 5.7% 5.7% 5.2% 4.8%
10-19 employees 3.8% 4.4% 3.9% 3.7% 3.7% 3.4% 2.8% 2.5% 2.6% 2.3% 2.2%
20-49 employees 1.8% 2.0% 1.7% 1.5% 1.7% 1.5% 1.4% 1.2% 1.2% 1.2% 1.2%
50-199 employees 0.7% 0.7% 0.5% 0.5% 0.6% 0.5% 0.4% 0.3% 0.4% 0.3% 0.3%
200-499 employees 0.1% 0.1% 0.1% 0.1% 0.1% 0.1% 0.1% 0.0% 0.0% 0.1% 0.1%
500-999 employees 0.0% 0.1% 0.0% 0.0% 0.0% 0.0% 0.0% 0.0% 0.0% 0.0% 0.0%
1000 or more employees 0.0% 0.0% 0.0% 0.0% 0.0% 0.0% 0.0% 0.0% 0.0% 0.0% 0.0% Total 100.0% 100.0% 100.0% 100.0% 100.0% 100.0% 100.0% 100.0% 100.0% 100.0% 100.0% Average size 4 4.5 4 3.9 3.8 3.6 3.2 2.9 3 2.9 3.2
Maximum size 710 820 506 507 514 514 498 517 984 1103 498
Number ST no research degree 10934 9679 9125 8439 9217 9233 8375 8751 8953 9404 8375
Number ST with research degree 924 685 686 669 766 750 759 781 860 884 759
Total ST 11858 10364 9811 9108 9983 9983 9134 9532 9813 10288 9134 Number of women 12159 11516 9752 9149 9673 9370 8440 7822 8632 8930 8440Total number of employees 34432 31868 27812 25948 27681 27046 23680 22455 23829 24499 26237
Total number of firms 8610 7191 7069 7073 7422 7670 7602 8124 8240 8687 9348
The loss in job creation ability becomes even more accentuated when we investi-gate the ability of this group to hire people from the STLF compared to other organizations. Table 6 shows the share of employment held by STLF entrepreneurs compared to other employers of the STLF. As indicated previously, the STLF has grown substantially over the period. For example, in 1990, 134,230 individuals with a degree in science, technology or medicine held a job. In 1999, the corre-

SELF-EMPLOYMENT AMONG THE SWEDISH SCIENCE AND TECHNOLOGY LABOR FORCE
49
sponding figure is 191,920, which corresponds to an increase of 43,0 %.6 During the same period, we can conclude that the share of STLF employed by our population of firms diminished from 9.3 % in 1990 to 5.6 % in 1999. That corresponds to an actual loss of 39.8 % in our population’s ability to generate employment for their own labor group. It is worth noting that the share diminishes almost on a yearly basis.
The critical reader would probably argue that these are not necessarily true changes, because the way we have constructed our population creates a “non-growth” bias. The reason is that all firms that grow substantially and make an IPO or are acquired by other firms become excluded from our population as they are publicly traded. If this was true, we would see the same development, but that development would be the result of increased ability to generate growth and jobs rather then the opposite. In the later analyses when we follow the cohorts of newly established firms we are able to control for this possibility. We do that by following the firm through its whole life independent of any changes in ownership. The results shown here do not change in any substantial way. The main reason is that only a very few number of firms make an IPO. Many firms are indeed acquired, but they do not show any substantial growth before they are bought up. Hence the result is still valid. This population has lost dramatically in its power to generate jobs both for their own labor group and in general. This is a population of firms where the number of firms that grow and their ability to generate jobs diminishes on average and in total. Table 6 The share of science and technology (ST) employment held by STLF entrepreneurs compared to other employers
1990 1991 1992 1993 1994 1995 1996 1997 1998 1999 2000
Percentage employed in STLF Firms no research 9.3% 8.0% 7.6% 7.0% 7.3% 7.0% 6.1% 6.0% 5.7% 5.6% 3.3%
Number of ST no research degree 117571 120506 120177 119996 126283 131996 137599 145057 155732 167041 253251
Percentage employed in STLF Firms with research 5.5% 3.9% 3.9% 3.7% 3.9% 3.7% 3.5% 3.5% 3.7% 3.6% 2.9%
Number of ST with research degree 16659 17445 17658 18039 19410 20502 21386 22311 23515 24879 26399
Percentage employed in STLF Firms 8.8% 7.5% 7.1% 6.6% 6.9% 6.5% 5.7% 5.7% 5.5% 5.4% 3.3%
Total number ST 134230 137951 137835 138035 145693 152498 158985 167368 179247 191920 279650
Note: In 2000 the education codes were changed and the number of educations that are defined as part of the STLF increase, and hence the number of people who are part of that population.
5.1.2 Legal form and Industry Classification Figure 2 shows the distribution of legal forms across our population. The dominant forms by far are sole proprietorship and incorporations. Partnership represents on average only 3.2 %, and its share has been fairly stable over time. Sole proprietor-
6 We exclude 2000 from this analysis as the educational codes were changed that year resulting in an artificial increase in our estimates.

SELF-EMPLOYMENT AMONG THE SWEDISH SCIENCE AND TECHNOLOGY LABOR FORCE
50
ship represents a growing share with 28.9% having that legal form in 1992 to 51.2 % in 2000. The share of incorporations has diminished steadily over time, with 59.6 % of the firms incorporated in 1991, compared to only 37.1 % in 2000. It is also worth noting that on average 8.6 % of all firms do not have any legal form indicated. Our own analyses combined with consultation with data experts from Statistics Sweden indicate that new firms and firms that later on are categorized as sole proprietorship are heavily over represented here. Most of these firms only have survival expectancy of one year. Figure 2 The distribution of legal forms among firms owned by STLF entrepreneurs
Table 7 gives the distribution of firms across industries. We can see that three industries totally dominate. Health care, technological services and unclassified industries account for 72.4 % of all firms. Health care and technological services account for 50.3 % of all firms. With the exception of the industry class “Other” that diminishes, the results are stable over time, and we cannot observe any important shifts in the industry structure among the three largest groups. However, we note some important changes in the smaller industries. The share of firms in “Other knowledge intensive” industries has increased by 77.1 % from 4.8 % in 1990 to 8.5 % in 2000. Other industries that have increased their share are “Research and development”, “Education”, and “Communication”. All are industries in the service sector. The industries that have experienced dramatic declines are “High-tech manufacturing”, “Manufacturing” and “Trade”. The two former industries are part of the manufacturing sector.
0%
10%
20%
30% 40%
50% 60%
70%
80% 90%
100%
1990
1991
1992
1993
1994
19
95
1996
1997
1998
1999
2000
No information
Incorporations
Partnership
Sole proprietorship

SELF-EMPLOYMENT AMONG THE SWEDISH SCIENCE AND TECHNOLOGY LABOR FORCE
51
Table 7 Industry classification of firms owned by STLF entrepreneurs
1990 1991 1992 1993 1994 1995 1996 1997 1998 1999 2000Unclassified 30.3% 20.6% 22.0% 26.4% 22.4% 20.4% 20.3% 20.0% 19.4% 21.1% 19.8%High-tech Manufacturing 2.0% 2.1% 1.9% 1.7% 1.8% 1.6% 1.6% 1.4% 1.4% 1.3% 1.2%Wood, paper and pulp 0.4% 0.3% 0.3% 0.3% 0.4% 0.3% 0.4% 0.3% 0.3% 0.3% 0.3%Manufacturing 1.3% 1.3% 1.3% 1.2% 1.2% 1.1% 1.1% 1.0% 1.0% 0.9% 0.8%Mining 0.2% 0.2% 0.1% 0.1% 0.1% 0.2% 0.1% 0.2% 0.2% 0.2% 0.1%Other manufacturing 1.3% 1.5% 1.3% 1.4% 1.3% 1.4% 1.2% 1.1% 1.1% 1.0% 1.1%Technology 24.0% 27.6% 27.4% 25.7% 26.1% 26.0% 24.9% 25.3% 25.8% 25.0% 25.0%Other knowledge intensive firms 4.8% 6.3% 6.5% 6.5% 6.6% 7.0% 7.3% 7.7% 8.0% 7.9% 8.5%Finance 1.5% 1.7% 1.4% 1.5% 1.6% 1.6% 1.5% 1.5% 1.7% 1.6% 1.5%Trade 7.4% 8.1% 7.6% 6.6% 6.8% 6.7% 6.6% 6.4% 6.1% 5.9% 5.6%Hospitality 0.5% 0.7% 0.8% 0.7% 0.9% 1.0% 1.1% 1.2% 1.2% 1.1% 1.1%Communications 0.2% 0.4% 0.4% 0.5% 0.7% 0.7% 0.8% 1.1% 1.3% 1.3% 1.6%Education 0.6% 0.7% 0.8% 1.0% 1.0% 1.2% 1.2% 1.4% 1.6% 1.9% 2.1%Other services 1.1% 1.2% 1.0% 0.9% 1.1% 1.3% 1.4% 1.5% 1.7% 1.8% 1.9%Land, forestry and fishery 3.3% 2.7% 2.1% 1.9% 2.5% 2.6% 3.0% 2.9% 2.7% 2.7% 2.6%Public sector 0.1% 0.1% 0.1% 0.1% 0.1% 0.1% 0.1% 0.1% 0.0% 0.0% 0.0%Research and development 0.4% 0.5% 0.6% 0.6% 0.8% 0.8% 1.0% 1.0% 1.0% 1.0% 1.1%
Health-care 20.4% 23.9% 24.5% 23.0% 24.8% 26.0% 26.5% 25.8% 25.4% 25.1% 25.7%
Total 100.0% 100.0% 100.0% 100.0% 100.0% 100.0% 100.0% 100.0% 100.0% 100.0% 100.0%
If instead of considering the distribution of firms, we consider the distribution of employment, the picture is somewhat but not substantially altered. Table 8 gives the employment distribution across industries for firms included in our population. We can see that health care and technology services account on average for 47.1 % of all employees. The third largest industry is the “Unclassified” category with a mean value of 11.3 %. The most important differences between the industry classi-fication by firms and the industry classification by employment, is that we find a larger part of the total number of employees in the manufacturing sector. We find 21 % on average of the employees in the manufacturing sector, but only 4.5 % of the firms. We define the manufacturing sector as “High technology manufacturing”, “Wood, paper and pulp”, “Manufacturing”, “Mining” and “Other manufacturing”. As expected, firms in the manufacturing sector are on average larger than in the service sector, but the increase in number of firms is to be found in the service sector. In this respect, this population of firms follows the general trend in industry dynamics: the average size of firms goes down, and the number of firms in the service sector increases in relation to the manufacturing sector. Another observation is that the changes in number of employees are less accentuated than the changes in number of firms. This is also in line with previous research suggesting that the dynamics of entry and exit have relatively little effect in terms of employment in an industry. However, as we will see in the following section they play an important role in restructuring the population as a whole.

SELF-EMPLOYMENT AMONG THE SWEDISH SCIENCE AND TECHNOLOGY LABOR FORCE
52
Table 8 Employment distribution across industries
1990 1991 1992 1993 1994 1995 1996 1997 1998 1999 2000 Average 1990-2000
Unclassified 13.9% 12.1% 13.1% 12.9% 11.7% 10.5% 11.9% 11.5% 8.6% 9.2% 8.8% 11.3%High-tech Manufac-turing 3.6% 4.9% 3.6% 4.9% 4.2% 4.3% 4.9% 4.6% 5.0% 4.8% 5.3% 4.5%
Wood, paper and pulp 2.3% 0.7% 0.9% 1.0% 1.0% 1.3% 1.4% 1.4% 1.2% 1.1% 0.9% 1.2%Manufacturing 9.8% 7.7% 8.6% 8.5% 7.7% 7.5% 7.6% 6.8% 7.0% 6.3% 5.9% 7.6%Mining 1.6% 2.2% 2.0% 2.0% 1.9% 2.1% 1.7% 1.6% 1.4% 1.6% 1.4% 1.8%Other manufacturing 6.3% 8.7% 6.3% 5.9% 5.3% 4.8% 4.4% 2.5% 6.9% 6.7% 6.9% 5.9%Technology 28.3% 28.6% 29.5% 28.1% 29.6% 29.8% 25.4% 27.0% 26.1% 27.5% 28.8% 28.1%Other knowledge intensive firms 2.9% 3.4% 3.6% 3.6% 3.5% 3.5% 4.0% 4.6% 4.8% 5.5% 5.3% 4.1%
Finance 2.0% 2.0% 1.8% 1.8% 2.0% 2.1% 1.9% 1.9% 2.0% 1.4% 1.3% 1.8%Trade 9.5% 9.1% 8.6% 9.0% 9.5% 9.5% 9.3% 8.7% 8.4% 7.1% 7.2% 8.7%Hospitality 0.9% 0.9% 0.9% 0.7% 1.0% 1.0% 1.2% 1.2% 1.2% 1.0% 0.9% 1.0%Communications 0.4% 0.6% 0.5% 0.5% 0.7% 0.5% 0.6% 0.9% 1.0% 1.0% 1.1% 0.7%Education 0.5% 0.5% 0.6% 0.7% 0.6% 0.9% 0.9% 1.2% 1.3% 1.5% 1.4% 0.9%Other services 1.5% 1.2% 0.4% 0.4% 0.4% 0.7% 1.0% 1.0% 1.2% 1.3% 1.2% 0.9%Land, forestry and fishery 1.6% 1.3% 1.2% 1.2% 1.4% 1.5% 1.8% 2.0% 1.8% 1.8% 1.6% 1.6%
Public sector 0.2% 0.1% 0.1% 0.2% 0.2% 0.1% 0.1% 0.1% 0.0% 0.0% 0.0% 0.1%Research and development 0.5% 0.6% 0.7% 0.9% 1.1% 0.9% 1.1% 0.9% 0.9% 1.0% 0.9% 0.8%
Health-care 14.3% 15.3% 17.4% 17.6% 18.1% 19.0% 21.0% 22.2% 21.2% 21.4% 21.0% 19.0% Total 100.0% 100.0% 100.0% 100.0% 100.0% 100.0% 100.0% 100.0% 100.0% 100.0% 100.0% 100.0%
5.1.3 Summary of Findings on the Population We have found that very small firms largely dominate this population. On average 84.9% of all the firms have between one and four employees. Very few firms ever exceed medium size. Furthermore, we have concluded that the job generation ability of this group has diminished dramatically over the period. The change is documented both on the general employment level, as well as the level of creating jobs for the other members of the STLF. The total number of employees in this category has diminished, and the relative share of non-STLF people hired has also dropped. The drops are 23.8 % and 39.8 % respectively. We point out that there might be a number of inconsistent explanations for this development. It could be that the overall and specific capacity to generate employment has decreased due to unfavorable institutional effects, but it might also be due to an increase in the proportion of firms acquired or making an IPO. In this case, they are removed from our population. However, taking into account the average size of our firms, the most plausible conclusion is that the institutional effects have been negative for these firms.
The most popular industries for these firms are health care and technology services, and unclassified. These three industries account for 58.4 % of all firms in the popu-lation. However, we have seen that the manufacturing sector as a whole is diminishing in importance when it comes to the number of firms, but they still account for much employment.

SELF-EMPLOYMENT AMONG THE SWEDISH SCIENCE AND TECHNOLOGY LABOR FORCE
53
Industries such as “Other knowledge intensive industries” and “Education” have become increasingly more important. Finally, the dominant legal form is sole proprietorship.
5.2 Entry and Exit from the STLF Firm Population We address three principal issues in order to examine to what extent the Swedish science and technology labor force contributes to economic development by their involvement in entrepreneurial activities. These issues are the entry of new firms, the survival of these firms, and finally, the performance of the firms in terms of job growth and salary levels.
The numbers of entries and exits are presented in Table 9. De novo entries repre-sent new firms from which an individual belonging to the STLF receives their main salary and also holds an ownership stake in the firm. For exits, the firm is terminated and no longer exists as an independent entity. Termination is possible because the firm is closed down or because the firm is merged with an equally larger or larger firm or because it has been acquired by another firm.
We first examine the development of de novo entries over time. The column per-centage de novo entries illustrates the proportion of the current year’s number of firms created in the same year. There does not seem to be any upward or downward trend in this proportion, the percentages are roughly the same at the beginning and the end of the period. The column percentage STLF exits illustrates what propor-tion of firms in one year exit during the following year. Similar to entries, with the exception of 1991, there does not seem to be any upward or downward trend for exits, it varies around 8.5 % annually. If we compare this figure to the average annual entry rate of 10.0 %, we can conclude that there is slow but consistent in-crease in the number of firms started and operated by individuals from the science and technology labor force. However, this should not be attributed to a general increase in entrepreneurship frequency among this labor force. Rather, it is due to the increase in the number of individuals with degrees in engineering, medicine, or the natural sciences. In a prior report (Delmar et al., 2003b) we have described this labor force and it’s characteristics during the period 1990-2000.
It is apparent that entry and exit rates are related to each other. When the entry rate is high, so tend the exit rate to be. Two exceptions exist. If we back to the exit rate in the year 1991, almost 20 % of the population of firms active in 1990 exited, this led to a sharp decrease in the total number of firms. This is a consequence of the severe recession that Sweden experienced in the early 1990s. The second exception is the development during the years 1993-94, where the number of entries in 1994 is relatively high, but the number of exits in 1993 is the lowest in all years during the period. The low number of exits is probably attributable to an upturn in the economy since the recession in the early 1990s.
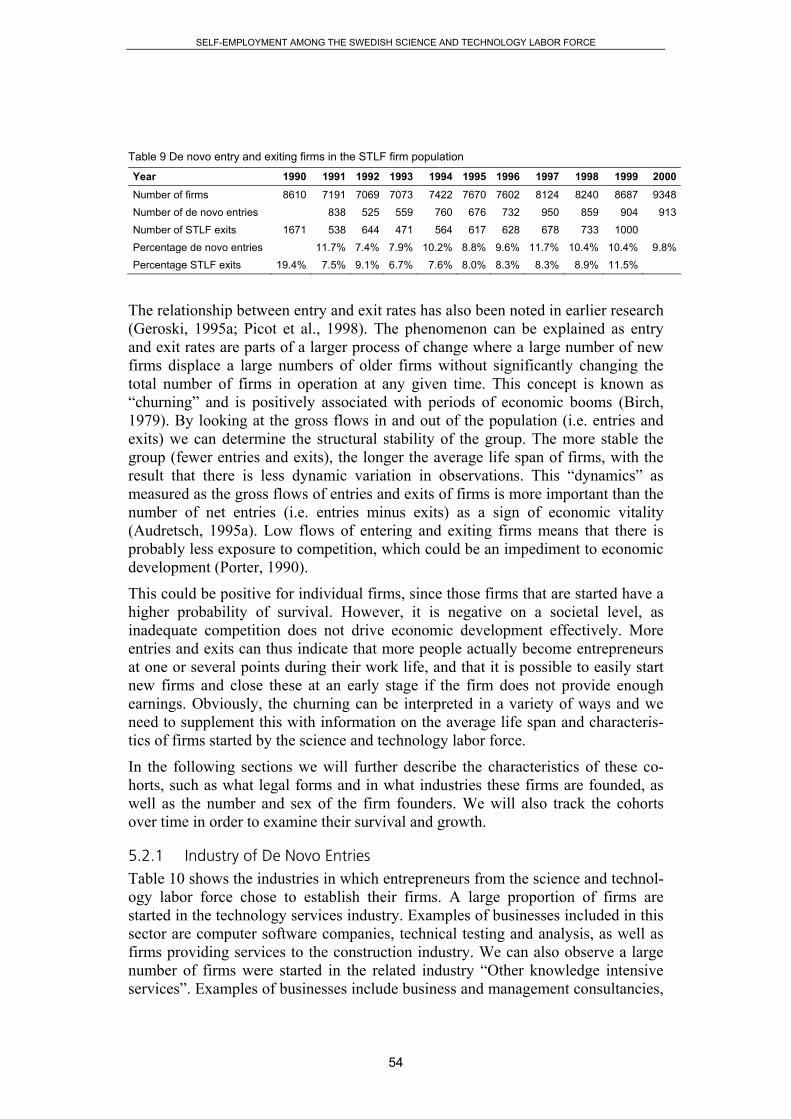
SELF-EMPLOYMENT AMONG THE SWEDISH SCIENCE AND TECHNOLOGY LABOR FORCE
54
Table 9 De novo entry and exiting firms in the STLF firm population
Year 1990 1991 1992 1993 1994 1995 1996 1997 1998 1999 2000Number of firms 8610 7191 7069 7073 7422 7670 7602 8124 8240 8687 9348Number of de novo entries 838 525 559 760 676 732 950 859 904 913Number of STLF exits 1671 538 644 471 564 617 628 678 733 1000 Percentage de novo entries 11.7% 7.4% 7.9% 10.2% 8.8% 9.6% 11.7% 10.4% 10.4% 9.8%Percentage STLF exits 19.4% 7.5% 9.1% 6.7% 7.6% 8.0% 8.3% 8.3% 8.9% 11.5%
The relationship between entry and exit rates has also been noted in earlier research (Geroski, 1995a; Picot et al., 1998). The phenomenon can be explained as entry and exit rates are parts of a larger process of change where a large number of new firms displace a large numbers of older firms without significantly changing the total number of firms in operation at any given time. This concept is known as “churning” and is positively associated with periods of economic booms (Birch, 1979). By looking at the gross flows in and out of the population (i.e. entries and exits) we can determine the structural stability of the group. The more stable the group (fewer entries and exits), the longer the average life span of firms, with the result that there is less dynamic variation in observations. This “dynamics” as measured as the gross flows of entries and exits of firms is more important than the number of net entries (i.e. entries minus exits) as a sign of economic vitality (Audretsch, 1995a). Low flows of entering and exiting firms means that there is probably less exposure to competition, which could be an impediment to economic development (Porter, 1990).
This could be positive for individual firms, since those firms that are started have a higher probability of survival. However, it is negative on a societal level, as inadequate competition does not drive economic development effectively. More entries and exits can thus indicate that more people actually become entrepreneurs at one or several points during their work life, and that it is possible to easily start new firms and close these at an early stage if the firm does not provide enough earnings. Obviously, the churning can be interpreted in a variety of ways and we need to supplement this with information on the average life span and characteris-tics of firms started by the science and technology labor force.
In the following sections we will further describe the characteristics of these co-horts, such as what legal forms and in what industries these firms are founded, as well as the number and sex of the firm founders. We will also track the cohorts over time in order to examine their survival and growth.
5.2.1 Industry of De Novo Entries Table 10 shows the industries in which entrepreneurs from the science and technol-ogy labor force chose to establish their firms. A large proportion of firms are started in the technology services industry. Examples of businesses included in this sector are computer software companies, technical testing and analysis, as well as firms providing services to the construction industry. We can also observe a large number of firms were started in the related industry “Other knowledge intensive services”. Examples of businesses include business and management consultancies,

SELF-EMPLOYMENT AMONG THE SWEDISH SCIENCE AND TECHNOLOGY LABOR FORCE
55
as well as firms providing services related to patents and intellectual property rights. Relatively many firms are also founded in the health-care sector. This can be explained by the entrepreneurial activities of a certain group within the science and technology labor force, namely those with an education in medicine. As could be seen in Table 1, this sub-group is the one most frequently starting new firms, often as a way of establishing their own medical practices.
There are three probable explanations for these findings. First, people are likely to discover and exploit opportunities that are related to their prior knowledge (Shane, 2000a), which is based on prior experience and education (Casson, 1982b). The STFL has substantial knowledge relevant to the health care and technological services sectors, which would explain a large number of start-ups in these sectors. Second, conditions for business survival differ across industries. For example, few entries are noted in sectors such as mining or wood, paper and pulp where initial capital investments are substantial, and create barriers to new entries. Third, technological regimes are likely to be different across industries (Audretsch, 1991a). Some sectors are characterized by a routinized regime whereas other sectors are structured according to an entrepreneurial regime, the latter represents more favorable environments for new and innovative firms. We can expect that industries with high rates of innovation and dominated by large firms have a smaller share of new start-ups, whereas in industries with low levels of innova-tions, a smaller average firm size or both we can expect relatively more start-ups.
Consequently few firms are started within high-tech manufacturing – only about 0.4 % of all firms, and the majority of firms start in technology services and health care. These are industries where there exists a tradition for STLF entrepreneurs to start and manage firms. Going back to high technology manufacturing industry, this industry typically requires substantial financial investments so a low frequency is not entirely surprising. However, Swedish studies using the same industry classi-fication as we do here have found that approximately one percent of all new firms started belong to this sector (Dahlqvist, Davidsson & Wiklund, 2000). As our population consists of the individuals most likely to discover opportunities relevant to high-tech companies, we would expect a proportion higher than one percent rather than the opposite. Given the large financial investments needed, we suspect that few individuals within the STLF choose to start firms in this sector because they consider the opportunity costs to be too large. During the period studied, access to venture capital for Swedish firms increased dramatically. As a result, we would expect to see an upward trend for these types of firms. However, the data show no support for this argument. An alternative explanation may be that more entrepreneurial individuals with different educational backgrounds start these firms and subsequently employ individuals with the proper background, such as the STLF.

SELF-EMPLOYMENT AMONG THE SWEDISH SCIENCE AND TECHNOLOGY LABOR FORCE
56
Table 10 Industry distribution for de novo entries
Year 1991 1992 1993 1994 1995 1996 1997 1998 1999 2000 Total %Unclassified 461 352 342 394 355 311 343 274 351 259 3442 44.6High-tech Manufacturing 6 3 2 4 4 1 0 6 3 2 31 0.4Wood, paper and pulp 3 1 2 3 1 3 0 1 1 0 15 0.2Manufacturing 2 3 1 5 4 5 6 7 2 3 38 0.5Mining 0 0 0 1 0 1 1 1 1 0 5 0.1Other manufacturing 6 3 2 4 2 2 6 6 6 7 44 0.6Technology services 140 73 83 118 130 136 232 239 196 261 1608 20.8Other knowledge intensive firms 40 24 36 54 37 56 88 72 75 102 584 7.6Finance 10 3 7 7 9 6 11 16 12 9 90 1.2Trade 49 20 22 38 32 45 63 45 50 35 399 5.2Hospitality 8 4 7 11 13 16 19 9 19 11 117 1.5Communications 6 4 5 7 8 11 14 12 20 32 119 1.5Education 7 2 5 11 11 12 20 21 22 33 144 1.9Other services 11 2 4 10 10 11 20 28 19 27 142 1.8Land, forestry and fishery 22 4 6 4 4 21 12 13 14 17 117 1.5Public sector 1 1 0 0 0 1 0 1 0 0 4 0.1Research and development 2 0 2 6 3 6 5 10 7 8 49 0.6Health-care 64 26 31 83 53 88 110 98 106 107 766 9.9
It should be noted that a high proportion of all firms are categorized as belonging to “Unclassified” industries, i.e. these are difficult to classify or information on their line of business is missing. Three things are important to mention in connection with this. First, the problem with missing information is worst among firms estab-lished at the beginning of the period of observation and subsequently decreases: Of the de novo entries for year 1991, 55 % were categorized as “Unclassified” whereas in 2000 this figured had dropped to 28 %. Second, the problem with missing information decreases after the first few years of a firm’s life. If we take the average for all years in the period, companies categorized as “Unclassified” de-crease from 44 % in first year to 35 % in the second and 29 % in the third year of life. Third, there seems to be a tendency for poorly performing firms to be categorized as “Unclassified”, while better performing firms are categorized in one of the other industries.
However, we can conclude that the distribution of de novo start-ups in general mirrors the distribution of the population they enter. Technological services and health care represent the most important industries with 30.7 % of all firms started. They both represent growing industries, but other industries also grow in terms of a yearly increase of new start-ups. The following industries are most important in descending order: Knowledge intensive firms, Communication, Education and Other services. Hence, while traditional industries still dominate heavily, we can see that other industries such as the one just mentioned have increased their relative importance. Similarly, we can see that the manufacturing sector becomes less and less interesting for this category of start-ups.

SELF-EMPLOYMENT AMONG THE SWEDISH SCIENCE AND TECHNOLOGY LABOR FORCE
57
5.2.2 Size Distribution of De Novo Entries Table 11 displays the initial mean size and the size distribution of the de novo entries by number of employees. We find the average size of firms started by the STLF to be generally small. The average size is 1.2 employees without substantial variation over time. That is, in most cases only the founder is employed in the newly established firm. The vast majority are to be found among single firms with the owner-manager as the sole employee. This result is not surprising given the large proportion of sole proprietorships in Table 10. These firms tend to be single individual organizations. Actually, on average during the period, 89.0 % of the new firms had only one employee, and 8.4 % of the firms started with two to four employees. We can see a slight decrease in the 2 to 4 employee size bracket. In 1990, 10,6 % of the de novo entries were found in that size class, while in 2000, this figure was 8.4 %. Only 1 % of the firms had five or more employees the year they were founded. Hence, the average size of new firms is substantially lower than that of the incumbents (1.2 and 3.5 employees respectively). This difference is mainly due to the fact that incumbents have relatively more large firms than de novo entries, a substantial number are in the 1 to 4 employee size class (84.9 % compared to 89.0 % for the de novo entries). Table 11 Initial firm size distribution and mean size for de novo entries
Firm size 1991 1992 1993 1994 1995 1996 1997 1998 1999 2000No employees 5 0 8 9 7 17 15 11 20 231 employee 733 472 491 668 613 664 847 759 801 8142 to 4 employees 89 49 50 75 52 42 76 75 71 635 to 9 employees 9 4 5 2 3 7 7 10 11 510 to 19 employees 1 0 5 3 1 2 4 1 0 320-49 employees 1 0 0 3 0 0 1 2 1 550 or more employees 0 0 0 0 0 0 0 1 0 0 Average size 1,22 1,14 1,28 1,3 1,17 1,16 1,22 1,35 1,19 1,3Percentage women: 30% 27% 29% 28% 26% 27% 26% 28% 29% 23% Total number of firms 838 525 559 760 676 732 950 859 904 913
Note. As mentioned in the method section, the matching between the individual level and the firm level produces a number of cases with no information at the firm level. Those cases are indicated here as having no employees.
Given that most firms employ one single individual, the share of women working in firms started by the STLF closely resembles the share of women in the STLF who become self-employed (see Delmar et al., 2003), but the share of women in the novo entries is significantly lower than for incumbent firms (27.3 % and 35.2 % respectively).
Table 12 exhibits the mean start size of firms across industries, as well as the proportion of STLF women who become self-employed in that industry. As the number of firms is very small in some industries on a yearly base, we do not report mean size and share of women for individual years. We only report aggregate figures for the whole period. As could be expected, firms in industry sectors where initial investments on average are high start at a larger size than firms in the trade

SELF-EMPLOYMENT AMONG THE SWEDISH SCIENCE AND TECHNOLOGY LABOR FORCE
58
and service sectors. The largest de novo entries on average are found in the following four industries: “Wood, paper and pulp”, “High technology manufactur-ing”, “Manufacturing”, and “Other manufacturing”. All are industries in the manu-facturing sector. The smallest de novo entries on average are found in the following industries: “Mining”, “Public sector”, “Other services”, “Land, forestry and fishery”. The explanation is here not as straightforward, as we have both industries from the manufacturing and service sector represented. However, the differences with the other industries are quite small. The results indicate that these industries attract individuals that intend to work alone where the basis of the opportunity is constituted by their idiosyncratic knowledge that is not easily transferable to other potential employees. A typical example is a management consultant whose busi-ness idea is based on his or her specific experiences and personal network. Table 12 Mean size at founding and share of women employees across industries for de novo entries
Industry Mean size Share of Women Unclassified 1.06 25% High-tech Manufacturing 3.05 17% Wood. paper and pulp 3.10 19% Manufacturing 2.09 7% Mining 1.00 40% Other manufacturing 2.00 20% Technology 1.32 14%
Other knowledge intensive firms 1.19 22% Finance 1.77 14% Trade 1.32 21% Hospitality 1.51 19% Communications 1.31 5% Education 1.38 32% Other services 1.13 26% Land. forestry and fishery 1.12 20% Public sector 1.00 0% Research and development 1.28 21% Health-care 1.62 49%
The proportion of women is highest in the health-care sector, a sector where STLF entrepreneurship is increasing relative to other sectors. The fact that there seems to be a large proportion of women in the mining sector should be viewed with skepti-cism, considering the very small number of de novo entries by the STLF (five in total during 1991-2000). Another sector with a relatively high proportion of women is education, a sector that similar to the health-care sector is increasing in STLF entrepreneurship relative to other sectors. An explanation for this development is that these two sectors have been de-regulated during the 1990s in Sweden. Since women are strongly represented in the labor structure in health-care as well as education, it is not unsurprising that these two sectors have a comparatively large proportion of women entrepreneurs coming from the STLF. Medicine, for example, has the most equal distribution of men and women among our three educational

SELF-EMPLOYMENT AMONG THE SWEDISH SCIENCE AND TECHNOLOGY LABOR FORCE
59
groups. This fact indicates that a possible way of increasing the frequency of entre-preneurship by women could be to focus on certain sectors where women dominate the labor market. The two industries that stand out as having minimal representa-tion by women STLF entrepreneurs are the manufacturing and the communication sectors. Similarly, these are two industries that tend to attract individuals with a background in the natural sciences, and especially in engineering. These educa-tional groups have relatively few women.
5.2.3 Legal Form of De Novo Entries Start-up costs vary considerably depending on what legal form is chosen. The financial and legal requirements are substantial for incorporated companies where a share capital of SEK 100,000 is needed in addition to formal registration costs with the Swedish patent office. On the other hand, this legal form provides the owners with limited liability. Incorporation is thus likely to be associated with riskier adventures and greater initial commitment. Sole proprietorships, on the other hand, require virtually no initial investment. It is sufficient to fill out a form at the local tax office to start this type of firm.
As can be observed in Figure 3, the vast majority of firms are founded as sole proprietorships. In fact 82 % of all firms started during the period of observation started as sole proprietorships compared to 14 % for incorporations and 4 % for limited partnerships. It should be kept in mind that those surveyed in this study do not operate their firms as sidelines to regular employment, so they should be considered as “real firms”. This indicates that most firms started by the STLF are in fact marginal operations at least when they start. This result is in line with the real-option logic suggested in the theoretical framework; where entrepreneurs in order to manage the uncertainty related to the value of their opportunities, make low initial investments until they have received feedback from the market. Figure 3 New firms by legal form
0% 10% 20%
30% 40% 50% 60% 70%
80% 90%
100%
1991 1992 1993 1994 1995 1996 1997 1998 1999 2000 Year
Limited Company Partners hip Sole Proprietor
Per
cent
age

SELF-EMPLOYMENT AMONG THE SWEDISH SCIENCE AND TECHNOLOGY LABOR FORCE
60
There are some interesting developments over time. The number of sole proprietor-ships drops substantially during 1992 to start increasing again in 1994. This is a reflection of the business cycle with a recession at the beginning of the decade and a subsequent recovery in 1994. The increase in 1994 could also be associated with the new rules making it possible to write off business deficits against other income, hence starting a firm became an interesting alternative for tax purposes. We can also see that the number of sole proprietorships started fluctuates considerably and is more than twice as high in 1998 compared to 1992. Partnerships show a constant downward trend, representing less than 2.0 % of all new firms towards the end of the period. The number of incorporated companies drops during the recession and yet again in 1996, never to fully recover. During 1996, a law was passed increasing the minimum share capital from SEK 50,000 to SEK 100,000. This meant that for new incorporations, SEK 100,000 was needed upon registration and existing incorporated firms needed to increase their share capital. The idea was initially to enforce the new law from January 1 1998, but this was later postponed to Janu-ary 1, 1999. As we can see, the effect of the new law became evident already in 1996 and appears to have created a barrier to entry for incorporated companies with long lasting effects.
The distribution of legal forms among de novo entries differs from the distribution in the population where incorporations are more frequent. As we will see later, this does not reflect an on-going change towards other legal forms. Rather, it is associated with the survival and performance structure that relates to different legal forms.
5.2.4 Summary de Novo Entries The pattern for the entry of firms operated by the STLF is relatively clear. Analyses of entries by industry, legal form, and initial size all indicate that the vast majority of firms are not started in “bold” ways with high initial commitment and ambitions which could possibly be expected by such a labor force. Instead, the firms started by the STLF seem to resemble firms in general. The industry distribution, however, seems to reflect the unique knowledge among this labor force with a relatively high prevalence of firms within various knowledge intensive professional service sectors.
5.3 Survival of De Novo Entries The specific conditions under which a firm is founded can have long term effects upon its future development (Brüderl & Schussler, 1990; Fichman & Levinthal, 1991). Such conditions refer to macro level effects such as economic development and industry affiliation to micro level effects of initial size and legal form. Given that Sweden underwent a dramatic recession during the first years of the 1990s followed by an upturn, it is possible that these changes affect firms’ chances of survival, because some firms have been established in periods where financial capital was abundant as during the 1997-1999 period. Other firms were started in periods when resources were scarce as in the 1991-1993 period. 1994 also repre-sents a unique year where there were some important legal changes, as well as

SELF-EMPLOYMENT AMONG THE SWEDISH SCIENCE AND TECHNOLOGY LABOR FORCE
61
changes in the regulation of the labor market. We would thus expect a cohort effect based on when the firm was established.
Here we track the survival of the firms for subsequent years independent of whether they are owned or not by entrepreneurs and if they provide the primary income from the STLF. We do not take into account ownership, merely firm status here. This allows us to track the actual life span of firms started by this group. The advantage is that it enables us to overcome problems related to the fact that both the less and the most successful are likely to be terminated since we use a defini-tion covering both ownership and firm status. The less successful will be terminated rapidly because the entrepreneurs have exploited a non-profitable opportunity. The more successful firms will disappear and count as terminated because they have a higher probability of being sold (acquisition or IPO), but the firm is still active. With the present definition we can track firms as long as they are not merged or acquired by another firm, as they then stop existing as a unique entity. Changes in ownership do not count as terminations. To give the reader a sense of the difference between the two definitions, we have provided the survival rates for the definition combining ownership and firm status in the appendix. As shown, there is an important difference. This definition based solely on firm status is used throughout the rest of the analyses. It is especially important when we examine the growth and performance of these firms.
Table 13 shows the survival rate of the different cohorts started between 1991 and 2000. The table clearly shows that the liability of newness is very high during the first year and gradually diminishes. On average 21 % of the firms started exit during the following year. Survival during the first year was lowest for firms started in 1992 and 1999. The cohort started in 1992 appears to be strongly affected by the recession that Sweden experienced at the time, but the effect wears off in subsequent years. The cohort of 1999 also suffers from the strong recession Sweden experienced in 2000. Survival during the first year was highest in 1991, 1994, and 1997. For the cohorts of 1994 and of 1997, it is clear that they were able to take advantage of the changes in the legal structure and the economic boom respectively. These survival rates are in line with results from other countries. Geroski (1991) investigated the survival rates among entries on the US market. He found that 60 % of all entrant firms exited within five years of entry, and 80% exited within ten years of entry. The estimates for these firms are 53 % exited within five years of entry and 65 % exited within ten years of entry. This would indicate that this group on average consists of firms with a somewhat higher probability of survival.
It is important to note that while there are differences in survival between the different cohorts, they are not large, but somewhat persistent over time. This can be seen in Figure 4 and in Table 13. Figure 4 shows the percentage of firm that sur-vives each year for the first four cohorts 1991 to 1994. They were chosen because they have the longest period of observation. If we examine survival after three years, we can see that the cohorts with the highest survival rates during the first year are also among the highest rate of survival after three years. However, the effect fades out over time and there seems to be a regression towards the mean.

SELF-EMPLOYMENT AMONG THE SWEDISH SCIENCE AND TECHNOLOGY LABOR FORCE
62
Such an effect is to be anticipated because so many other factors are introduced that determine survival, such as the cohort’s age. Table 13 Percentage survival by cohorts of de novo entries
No. of years 1991 1992 1993 1994 1995 1996 1997 1998 1999 2000 Mean survival between cohorts
for no. of year, respectively 1 100% 100% 100% 100% 100% 100% 100% 100% 100% 100% 100% 2 81% 75% 79% 81% 79% 79% 82% 79% 72% 79% 3 68% 65% 68% 69% 66% 69% 71% 63% 67% 4 64% 57% 61% 59% 57% 59% 58% 59% 5 58% 50% 55% 53% 48% 50% 53% 6 53% 46% 51% 45% 42% 47% 7 47% 42% 45% 38% 43% 8 43% 38% 39% 40% 9 39% 33% 36%
10 35% 35%
Figure 4 Survival rates for cohorts of de novo entries established 1991-1994
5.3.1 Industry Affiliation and Survival As indicated in the theoretical framework, we can expect significant differences between industries in terms of survival. Industry differences are associated with entry barriers. In industries with high entry barriers, we would expect the firms to survive longer than in industries with low entry barriers. The reason is that high entry barriers are overcome by a larger initial investment and a larger size.
Figure 5 shows the accumulated survival rates for all ten cohorts for the four major industries. The four major industries are the ones where STLF entrepreneurs are most likely to start a firm and are the most important in terms of generated employ-ment. We have chosen to collapse “High technology manufacturing”, “Manufactur-ing” and “other manufacturing” into one because there are so few new firms
0,2
0,4
0,6
0,8
1
1 2 3 4 5 6 7 8 9 10
Years in survival
Per
cent
age
of o
rigin
al c
ohor
t
1991 Cohort1992 Cohort1993 Cohort1994 Cohort

SELF-EMPLOYMENT AMONG THE SWEDISH SCIENCE AND TECHNOLOGY LABOR FORCE
63
started. However, in terms of employment this collapsed industry is very important. Technology services and health care represent the two most important industries both in terms of employment and STLF entrepreneurship. Finally, we have included “Other knowledge intensive services” as this has grown in importance over the observation period. Figure 5 Survival rates per industry
We find some important industry differences. Firms started in the manufacturing industry have a significantly higher survival rate than other industries. At least by the end of the period where 57.1 % are still active compared to the average of 35.1 % for all firms. This is in line with research on the effect of entry barriers. However, manufacturing only differs from other categories after the second year. It is possible that the effects of different technological regimes as suggested by Audrescht and colleagues only have an effect once firms have been able to establish themselves. Otherwise, health care stands out, as it is an industry with high survival rates. After 10 years almost half of the firms are still active (46.9 %). In fact, the four industries displayed in the figure have above average survival rates. The industry with the lowest survival rate is “other”. Hence, there are important industry differences, but they might be associated with the initial size of the firm as well. Therefore we will now examine the effect of initial size on survival.
5.3.2 Initial Size and Survival Figure 6 exhibits survival rates across size classes. Initial size is measured as size by number of employees during the first year. The results are straightforward to year seven: the larger the initial size, the higher the probability of the firm surviving. After year seven, the main conclusion still stands, but it is not so clear-cut. One reason is the construction of our Figure where we collapse the ten cohorts.
-
0,20
0,40
0,60
0,80
1,00
1 2 3 4 5 6 7 8 9 10
Years in survival
Manufacturing
Technology services
Other knowledge intensive services
Health-care
Per
cent
age
of c
ohor
t stil
l in
busi
ness

SELF-EMPLOYMENT AMONG THE SWEDISH SCIENCE AND TECHNOLOGY LABOR FORCE
64
In the first and second year, we have most observations because all cohorts are represented, and in the tenth year we have only one cohort represented (the firm started in 1991 and survived to 2000). This effect in combination with the fact that fewer and fewer firms survive with age and that there are few firms in the larger size classes, leads to a situation where we have few cases during the final years. This increases the random variation. Hence, if we were to increase the number of cases, we would also get the same result. Size has a significant impact on survival and the impact is long lasting. In year seven, only 41.5 % of the firms that started with only one employee remained. This can be compared to firms that started with four to five employees: in year seven, 72.9 % of the firms remained. The average survival rate for all firms was in that year 43.1 %. Figure 6 Survival rates by initial size
5.3.3 Legal Form and Survival It is also interesting to conduct a survival analysis on the basis of legal form. As we mentioned in the previous section, incorporating a company requires a substantial investment and a much larger commitment than starting a sole proprietorship. The capital requirement of an incorporated company should provide some insulation from external shocks. Coupled with greater commitment, we would expect that incorporated companies survive to a greater extent than sole proprietorships and partnerships.
Table 14 and summarize the survival of firms by different legal forms. It should be noted that all the different cohorts have been collapsed so that two year survival contains firms from cohorts 1991 to 1999, while three year survival contains cohorts from 1991 to 1998 and so on. In the table and figure, we see some marked differences in term of survival among the three legal forms. Partnerships survive to a lesser extent than the other legal forms. More than 80 % disappear during the period of study compared to 64 % for sole proprietorships and 53 % for
0
0,2
0,4
0,6
0,8
1
1 2 3 4 5 6 7 8 9 10
Year
Per
cent
of s
urvi
ving
firm
s
1 Employee
2-3 Employees
4-5 Employees
6+ Employees

SELF-EMPLOYMENT AMONG THE SWEDISH SCIENCE AND TECHNOLOGY LABOR FORCE
65
incorporations. One explanation of this is that since partnership is an organizational form with mutual liability, it may be difficult to maintain a good relationship in such organizations for many years. An alternative explanation is that two or more individuals with limited financial supply may be forced to start out as a partnership, but will later choose either to incorporate or discontinue their business depending on its profitability. However, almost none of the firms investigated changed legal form during the period of observation. If we look at incorporated companies, these clearly have higher survival rates than the other legal forms during any year of existence. This is in accordance with the theoretical arguments of higher capital re-serves and thus indirectly a higher commitment to the firm’s business idea.
As we will see in later analyses, incorporations perform better than other legal forms in terms of employment growth and salary levels. Therefore survival is higher and the idea that more substantial financial resources and greater commit-ment has positive implications appears relevant to other performance measures such as growth. Dahlqvist et al (2000) examined three Swedish groups of newly founded firms with separate developments (closure, marginal survival, and high performance). They found that incorporation did not discriminate between closure and marginal survival, but was a strong discriminator between marginal survival and high performance. Table 14 Average survival of firms by legal form
No. of years All Sole Proprietorship Partnership Incorporations 1 100% 100% 100% 100% 2 79% 83% 78% 93% 3 67% 70% 63% 85% 4 59% 63% 54% 77% 5 53% 55% 46% 71% 6 47% 50% 40% 64% 7 43% 46% 35% 59% 8 40% 43% 28% 51% 9 36% 39% 22% 46% 10 35% 36% 19% 47%

SELF-EMPLOYMENT AMONG THE SWEDISH SCIENCE AND TECHNOLOGY LABOR FORCE
66
Figure 7 Survival rates by legal form
5.3.4 Summary Survival Here we have investigated the survival pattern of the ten cohorts of de novo entries. In general we found that the probability of survival increases with time. At least it leveled off after the first couple of years when most firms were terminated. We found that 53 % exited within five years of entry and 65 % exited within ten years of entry. However, a closer analysis revealed important differences in survival due to the status at initial founding. Cohort effects were noticed, but their effect was rather small and tended to diminish over time. We found important effects of industry structure. Industries with high entry barriers tended to have substantially higher rates of survival. We also found important effects of initial size: the larger the initial size, the higher the probability of survival. Additionally, we pointed out that industry effects and initial size effects tend to be associated with each other, since one way to overcome barriers to entry is to start larger firms. Finally, we also observed that legal form had an important effect. Incorporation was the legal form with the highest survival rate. The choice of legal form is also related to initial investment so it is also associated with industry and initial size. All results are in line with previous research on survival of newly started firms.
5.4 Performance of De Novo Entries
5.4.1 Salary Distributions in De Novo Firms In Table 15 the number of firms that pay no salary is reported. An examination of the proportion of firms paying salaries reveals an interesting pattern. During the first year, on average 56.9 % of the firms pay a salary. In the subsequent year the
0%
10%
20%
30%
40%
50%
60%
70%
80%
90%
100%
1 2 3 4 5 6 7 8 9 10
Year
Per
cent
age
Sole Propriatorship
Partnership
Limited Company

SELF-EMPLOYMENT AMONG THE SWEDISH SCIENCE AND TECHNOLOGY LABOR FORCE
67
proportion of firms that pay a salary actually drops to somewhat below 40 %. There is little variation in the years after the first year. This suggests that the population of firms is most active during the first year of existence. In general, the firms we follow exhibit very little economic activity. As we are following firm status only, and not ownership, we can assume that many entrepreneurs revert to other options such as employment, but the firm remains active. At least they are not paying any salaries to their owners and possibly employees. We have concluded that somewhat more than half of the firms (56.9 % on average) pay salaries during the first year. The reader should remember that the individuals operating these firms do not earn more money from employment or from another firm. This is their primary source of income. Thus, this represents their largest source of earned income. Stated differently, during the first year of company operations, many of those in the STLF earn no money.
For those that do earn money, how much do they earn? Table 16 shows average salaries with standard deviations for de novo entries that pay salaries. Here firms that do not pay salaries are excluded from the calculation of the average. The results from the Table reveal three things. First, there is substantial variance in average income in the start year among cohorts. The variance seems also to have long lasting effects. This suggest that cohorts that were able to rapidly start earning money will also continue doing so later in their life assuming they survive. Second, average salary increase as the cohort ages. This suggests that in most cases, foun-ders start with low salaries and increase salaries in their firms as the firm gets older. Actually, after five years the average salary has increased 2.89 times compared with the first year. Third, the standard deviation also increases with age. This implies that some firms are able to increase their salaries substantially faster than other firms. As the cohort ages, the difference between the lowest and the highest paying firm increases. Thus with age some firms become increasingly successful. The conclusion is that for those that make it, they can expect to have some important pay-offs. However it is worth mentioning that most firms are one person firms and if we compare the average salaries from these firms with the average salary from STLF employment, entrepreneurs score significantly lower. Hence, the strong income development is probably more a regression towards a salary mean than “rent earnings”.
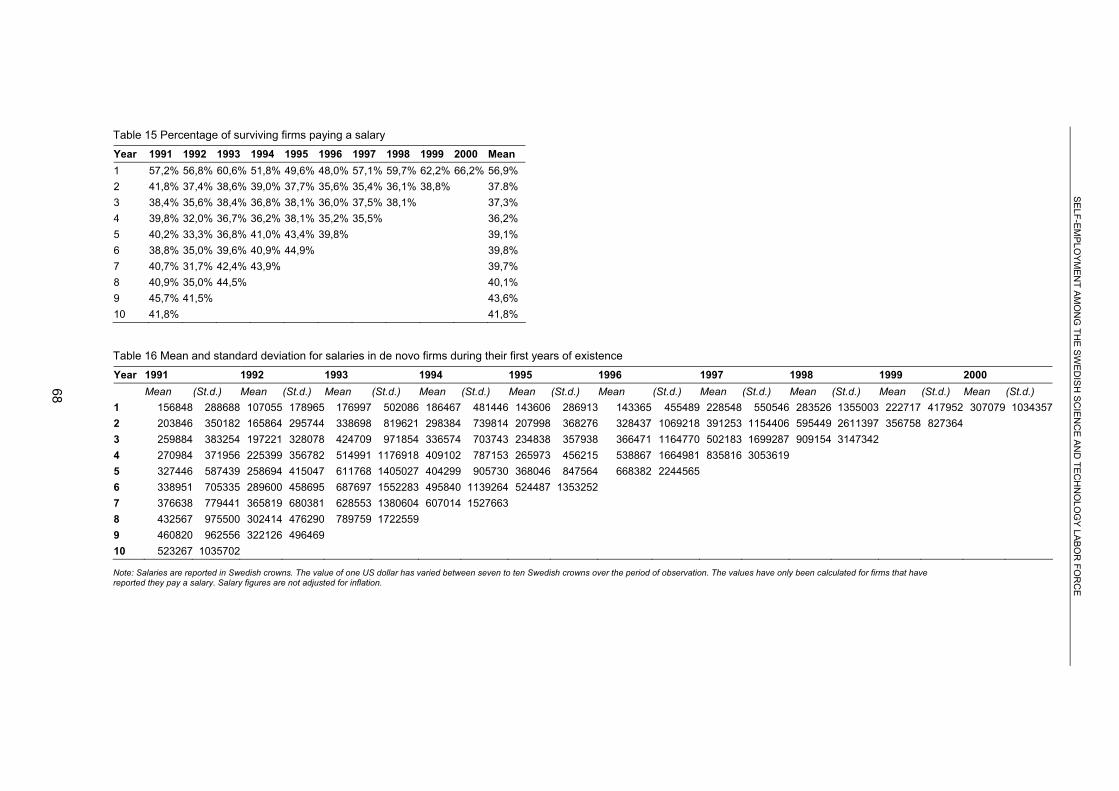
68
SE
LF-EM
PLO
YM
ENT A
MO
NG
THE
SWE
DIS
H SC
IEN
CE AN
D TEC
HN
OLO
GY
LABO
R FO
RC
E
Table 15 Percentage of surviving firms paying a salary
Year 1991 1992 1993 1994 1995 1996 1997 1998 1999 2000 Mean 1 57,2% 56,8% 60,6% 51,8% 49,6% 48,0% 57,1% 59,7% 62,2% 66,2% 56,9% 2 41,8% 37,4% 38,6% 39,0% 37,7% 35,6% 35,4% 36,1% 38,8% 37.8% 3 38,4% 35,6% 38,4% 36,8% 38,1% 36,0% 37,5% 38,1% 37,3% 4 39,8% 32,0% 36,7% 36,2% 38,1% 35,2% 35,5% 36,2% 5 40,2% 33,3% 36,8% 41,0% 43,4% 39,8% 39,1% 6 38,8% 35,0% 39,6% 40,9% 44,9% 39,8% 7 40,7% 31,7% 42,4% 43,9% 39,7% 8 40,9% 35,0% 44,5% 40,1% 9 45,7% 41,5% 43,6% 10 41,8% 41,8%
Table 16 Mean and standard deviation for salaries in de novo firms during their first years of existence
Year 1991 1992 1993 1994 1995 1996 1997 1998 1999 2000 Mean (St.d.) Mean (St.d.) Mean (St.d.) Mean (St.d.) Mean (St.d.) Mean (St.d.) Mean (St.d.) Mean (St.d.) Mean (St.d.) Mean (St.d.) 1 156848 288688 107055 178965 176997 502086 186467 481446 143606 286913 143365 455489 228548 550546 283526 1355003 222717 417952 307079 10343572 203846 350182 165864 295744 338698 819621 298384 739814 207998 368276 328437 1069218 391253 1154406 595449 2611397 356758 8273643 259884 383254 197221 328078 424709 971854 336574 703743 234838 357938 366471 1164770 502183 1699287 909154 31473424 270984 371956 225399 356782 514991 1176918 409102 787153 265973 456215 538867 1664981 835816 30536195 327446 587439 258694 415047 611768 1405027 404299 905730 368046 847564 668382 22445656 338951 705335 289600 458695 687697 1552283 495840 1139264 524487 1353252 7 376638 779441 365819 680381 628553 1380604 607014 15276638 432567 975500 302414 476290 789759 1722559 9 460820 962556 322126 496469 10 523267 1035702
Note: Salaries are reported in Swedish crowns. The value of one US dollar has varied between seven to ten Swedish crowns over the period of observation. The values have only been calculated for firms that have reported they pay a salary. Salary figures are not adjusted for inflation.

SELF-EMPLOYMENT AMONG THE SWEDISH SCIENCE AND TECHNOLOGY LABOR FORCE
69
The fact that the financial returns to entrepreneurship on average are so small in all probability creates disincentives for members of the STLF to pursue entrepreneur-ship. Most individuals in this labor force are unlikely to have educational peers that are successful entrepreneurs who could serve as role models and sources of inspiration. There is no question that a select few are actually able to generate important wealth, but these seem to be quite a few.
5.4.2 Salary Distribution across Industries Table 17 examines mean salaries across industries collapsed over the whole period studied. Salary differences are notably high. Mean salaries are more than four times as high in research and development-- which is the sector paying the highest salaries-- compared to firms in the lowest paying unclassified and hotel and restaurant sectors. There is a relatively clear pattern where low salaries appear in industries that have low barriers to entry and exit, i.e., where competition is fierce for small new ventures and their survival uncertain. These industries are also characterized by fierce competition for small new ventures and their survival uncertain. There is substantial price competition and generally low knowledge content. The opposite applies to industries paying the highest salaries. These results are not surprising for new firms in general, and the pattern has been established numerous times by economists. However, it is interesting that the same results apply despite the fact that representatives of the STLF who possess specific skills and knowledge start these firms. We do not know to what extent they operate businesses that are typical of the industries in which they operate, but given that the salary differences are so large and constantly show that firms in less productive sectors pay lower salaries than firms in more productive sectors would suggest that the firms operated by the STLF are not markedly different from other firms in the same sectors. One should also remember that many people start firms for reasons other than to maximize financial benefits. An important share of the firms that we follow has been started with the goal of offering the founders an alternative life style to the one found in employment and pursuing a career.
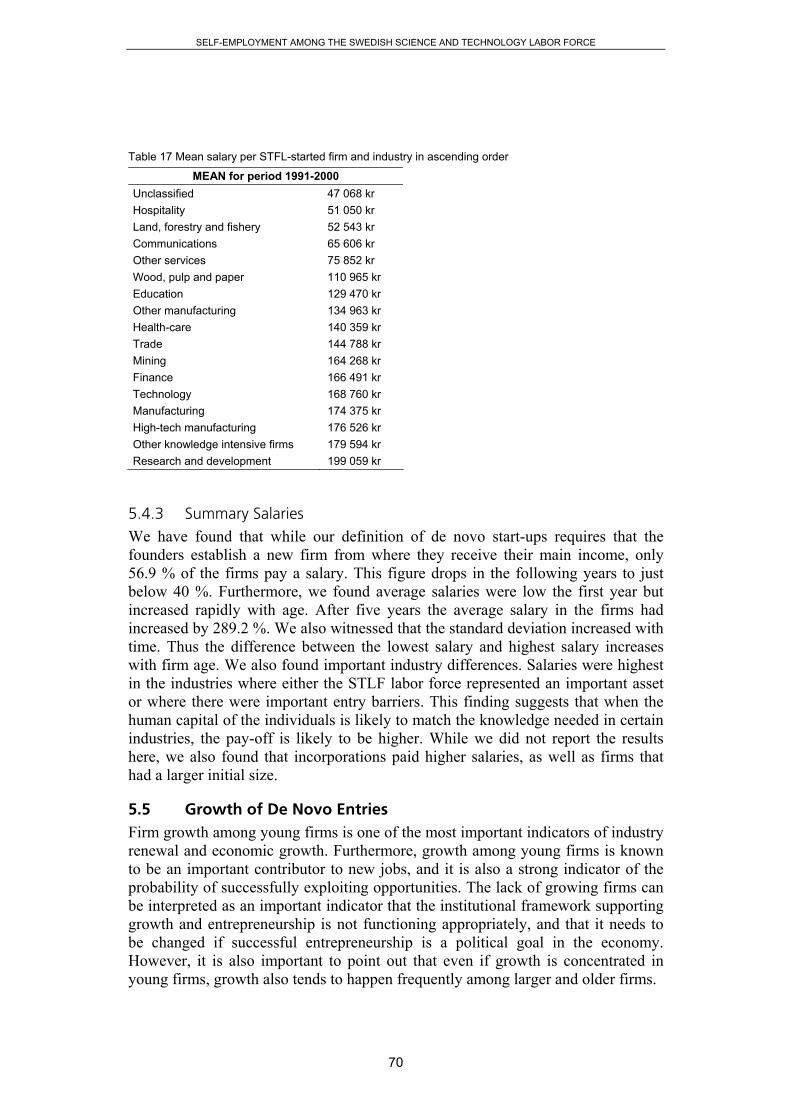
SELF-EMPLOYMENT AMONG THE SWEDISH SCIENCE AND TECHNOLOGY LABOR FORCE
70
Table 17 Mean salary per STFL-started firm and industry in ascending order
MEAN for period 1991-2000 Unclassified 47 068 kr Hospitality 51 050 kr Land, forestry and fishery 52 543 kr Communications 65 606 kr Other services 75 852 kr Wood, pulp and paper 110 965 kr Education 129 470 kr Other manufacturing 134 963 kr Health-care 140 359 kr Trade 144 788 kr Mining 164 268 kr Finance 166 491 kr Technology 168 760 kr Manufacturing 174 375 kr High-tech manufacturing 176 526 kr Other knowledge intensive firms 179 594 kr Research and development 199 059 kr
5.4.3 Summary Salaries We have found that while our definition of de novo start-ups requires that the founders establish a new firm from where they receive their main income, only 56.9 % of the firms pay a salary. This figure drops in the following years to just below 40 %. Furthermore, we found average salaries were low the first year but increased rapidly with age. After five years the average salary in the firms had increased by 289.2 %. We also witnessed that the standard deviation increased with time. Thus the difference between the lowest salary and highest salary increases with firm age. We also found important industry differences. Salaries were highest in the industries where either the STLF labor force represented an important asset or where there were important entry barriers. This finding suggests that when the human capital of the individuals is likely to match the knowledge needed in certain industries, the pay-off is likely to be higher. While we did not report the results here, we also found that incorporations paid higher salaries, as well as firms that had a larger initial size.
5.5 Growth of De Novo Entries Firm growth among young firms is one of the most important indicators of industry renewal and economic growth. Furthermore, growth among young firms is known to be an important contributor to new jobs, and it is also a strong indicator of the probability of successfully exploiting opportunities. The lack of growing firms can be interpreted as an important indicator that the institutional framework supporting growth and entrepreneurship is not functioning appropriately, and that it needs to be changed if successful entrepreneurship is a political goal in the economy. However, it is also important to point out that even if growth is concentrated in young firms, growth also tends to happen frequently among larger and older firms.

SELF-EMPLOYMENT AMONG THE SWEDISH SCIENCE AND TECHNOLOGY LABOR FORCE
71
The 7,716 de novo entry firms established over a ten-year period created in total 11,879 yearly jobs of which 6,604 jobs still remained in 2000 (55.6 %). Of the 11,879 jobs created, 79.2% were created the year the firms were established. The remaining 20.8 % of the jobs created came from subsequent growth. The jobs still remaining in 2000 represent 25.2 % of all jobs held by the population of STLF firms. Tables over gross jobs created and net jobs created are found in the appendix (and Table A5 respectively). Hence, jobs created by new firms represent an important addition to the population’s ability to create employment.
Table 18 shows the mean and standard deviation for the ten cohorts across every year. Firm size is measured as absolute size by number of employees. We have chosen to display mean and standard deviation rather than total employment creation, because the latter does take into consideration the fact that the number of firms able to generate growth diminishes over time as firms are terminated. Three results are worth mentioning. First, as expected firms have grown on average and the rate of growth is not really modest. After four years, the average size of the firms in the seven cohorts that we follow for at least four years has increased by a factor of 1.34. This might be impressive but one has to remember that they have also started very small. Moreover, there is substantial variation across the cohorts. The cohorts of 1996 and 1997 are especially impressive since they achieve an average growth by a factor of 1.47 and 1.65 respectively. The cohorts of 1991 and 1992 are less impressive, and achieve only an average growth of a factor of 1.20 and 1.19 respectively. It is clear that the economic situation when firms are started and their first years has an important impact on the growth of the cohort. Firms established during an economic boom enjoy a much higher growth than firms created during a recession. Second, the standard deviation increases over time. This indicates that a subset of firms achieve the lion’s share of growth. Third, it is important to note that none of the cohorts are close to reaching the average size of incumbent firms (mean in 2000 is 3.2 employees). Previous studies mention the time for new firms to reach the average size of incumbents varies between five to ten years (Caves, 1998; Geroski, 1995b). In this study none of the cohorts had achieved the average size of the incumbent firms of the population. This is a serious indication that growth is difficult to achieve for this group of firms in Sweden.
As growth tends to be concentrated to a small proportion of firms (Davidsson et al., 2003; Storey, 1995), we tend to get a firm size distribution where most firms cluster around the smallest size classes and only a few firms cluster in the larger size classes. In the respective cohorts, it is therefore of interest to examine the maximum size achieved by any firm. Table 19 displays the maximum size in number of employees per cohort and year. Not one single firm achieves a size above 100 employees. The largest firm that was created in 1998 had 94 employees. Otherwise the maximum size is concentrated in a bracket between 30 and 40 employees. Once more we are not dealing with cohorts of de novo entrants that are characterized by substantial achievements in terms of employment growth, salary growth or survival. In the following sections we investigate the relationships between growth, industry affiliation, legal form and initial size. Because of the size of the tables, they are presented in the appendix.

72
SE
LF-EM
PLO
YM
ENT A
MO
NG
THE
SWE
DIS
H SC
IEN
CE AN
D TEC
HN
OLO
GY
LABO
R FO
RC
E
Table 18 Mean and standard deviation for size in number of employees
Year 1991 1992 1993 1994 1995 1996 1997 1998 1999 2000 Mean (St.d.) Mean (St.d.) Mean (St.d.) Mean (St.d.) Mean (St.d.) Mean (St.d.) Mean (St.d.) Mean (St.d.) Mean (St.d.) Mean (St.d.)
1 1.22 1.02 1.14 0.55 1.28 1.38 1.30 1.88 1.17 1.22 1.16 0.96 1.22 1.29 1.35 3.31 1.19 1.12 1.30 2.14 2 1.32 1.11 1.28 0.96 1.58 2.40 1.56 2.71 1.27 1.51 1.41 2.21 1.48 2.31 1.70 5.10 1.46 1.96 3 1.48 1.42 1.27 0.82 1.80 3.07 1.59 2.29 1.31 0.92 1.49 2.45 1.67 3.07 2.07 5.92 4 1.46 1.23 1.36 1.05 1.88 3.34 1.66 2.43 1.33 1.15 1.72 3.34 2.02 5.14 5 1.60 2.11 1.39 1.15 2.07 3.98 1.72 2.86 1.59 2.93 1.86 4.28 6 1.65 2.66 1.49 1.32 2.15 4.04 1.84 3.07 1.80 3.86 7 1.61 2.80 1.49 1.60 2.04 3.47 2.08 3.87 8 1.81 3.50 1.46 1.35 2.26 4.14 9 1.84 3.28 1.48 1.44
10 1.78 2.55
Table 19 Maximum size in number of employees per cohort and year
Year 1991 1992 1993 1994 1995 1996 1997 1998 1999 2000 1 22 6 19 38 29 16 25 86 28 35 2 15 10 26 36 29 32 27 94 30 3 14 8 30 27 11 30 30 91 4 11 8 32 24 14 34 68 5 31 9 41 35 41 50 6 44 11 38 30 48 7 46 14 28 36 8 53 10 29 9 45 12
10 27

SELF-EMPLOYMENT AMONG THE SWEDISH SCIENCE AND TECHNOLOGY LABOR FORCE
73
5.5.1 Firm Growth and Industry Affiliation Table A 6 in the appendix displays the mean size and standard deviation across the four industry sectors that are most important in the STLF population, both in terms of entrepreneurship and employment. Contrary to what would have been expected, we did not find any large industry effects relating to growth. There are size differences among the industries, but these can be attributed to initial size rather than to subsequent growth. In general, firms from the manufacturing sector and from the technology service industry have grown the most. Four years after entry, firms in the manufacturing sector have grown 1.84 times, whereas firms in the technology service industry have grown 1.55 times. This can be compared to the average four year growth for other technology services (1.15) and health care (1.13). It is important to note that for the manufacturing sector, the cohort of 1994 had exceptional development in size, and that development influences the average for the industry.
5.5.2 Firm Growth and Initial Size Table A7 in the appendix shows the mean size and standard deviation for four different size classes. In all size classes and across all cohorts, both the average size of firms and their standard deviation increase with firm age. However, we do not observe a linear relationship between initial size and growth. Rather the relation-ship seems to be curvilinear. The relationship between growth and initial size is linear and positive up to six employees in the initial year. That is, the probability of achieving growth increases the initial size of the firm. Four years after entry, firms in the size class four to five employees have on average grown 1.65 times, firms in the size class two to three employees have on average grown 1.19 times, and firms in the size class one employee have on average grown 1.16 times. In the size class of six or more employees, we see that growth is less pronounced that in the previous size class (four to five employees). Four year after entry, firms in the size class six or more employees have on average grown 1.21 times. The curvilinear relationship is more pronounced in the larger size class than in the smaller ones.
5.5.3 Firm Growth and Legal Form Table A8 in the appendix shows the mean size and standard deviation for sole proprietorship, Partnerships, and incorporations. Once more, we can see that choice of legal form is closely associated with the value of the opportunity. Legal form has been associated with both survival and salary development. Incorporated firms have on average a much higher growth than the other two forms. Four years after entry, incorporated firms have grown 1.65 times, whereas sole proprietorships and partnerships have grown 1.10 and 1.15 times respectively. We have also witnessed an important shift over time where the growth for incorporations increases rapidly for the 1996, 1997, and 1998 cohorts. Probably, the valuable opportunities started during that period were started as incorporations where the financial arrangements relative to venture capital are most easily made.

SELF-EMPLOYMENT AMONG THE SWEDISH SCIENCE AND TECHNOLOGY LABOR FORCE
74
5.5.4 Summary Firm Growth The de novo firms created in total 11, 879 yearly jobs of which 6,604 jobs still remained in 2000 (55.6 %). Of the 11,879 jobs created, 79.2 % were created the year the firms were established. The remaining 20.8 % of the jobs created came from subsequent growth. Overall, growth seems to be hard to achieve for these firms. This is an observation that has also been made by other researchers studying the development of technology intensive firms (Jacobsson & Lindholm Dahlstrand, 2001). No firms during the period of investigation grow beyond 100 employees. We find some important difference related to when a firm was created, initial size, industry affiliation and legal form. Firms in the manufacturing sector, with larger initial size and which were incorporated had the highest probability of growing. We could also note evidence of a cohort effect where firms created in a recession period had a lower probability of growth than firms created during an economic boom.

SELF-EMPLOYMENT AMONG THE SWEDISH SCIENCE AND TECHNOLOGY LABOR FORCE
75
6 Discussion
The purpose of this report is to explore the entrepreneurial activities of the science and technology labor force in Sweden. We are interested in understanding the magnitude of their entrepreneurial efforts and how this is related to economic growth. By entrepreneurial activities we mean the establishment, survival and performance of independent firms. From the perspective of endogenous growth theory, the commercial use of new knowledge coming from research and development is one of the drivers of economic growth (Lucas, 1988; Romer, 1990, 1994). Endogenous growth theory adds new knowledge to the inputs affecting economic growth, but does not specify where new technology comes from and how it is converted into economic growth (Carlsson et al., 2003). We posit that an important mechanism for explaining how new technological knowledge is con-verted to economic growth is the economic behavior of the science and technology labor force, and especially the entrepreneurial activities of that group. The most famous example of how such a process functions is Silicon Valley where members of the STLF gained relevant knowledge at universities such as Stanford, and relevant experience from companies such as Fairchild and then move on to start their own firms in technology intensive sectors (Christensen, 1993). These firms then expand and create substantial value for their owners, as well as for society.
The theoretical approach taken in this report is eclectic. The analysis draws on a framework based on endogenous or new growth theory, industrial organization, and entrepreneurship. We empirically investigate all firms that have been partly or fully owned by a member of the STLF between 1990 and 2000. The design of this study, where we match the education of the entrepreneurs with the firm they own and from which they received their primary income, offers us a unique opportunity to investigate how knowledge and experience acquired by this group is actually used to generate economic growth. We find 22,312 firms that fulfill our matching criteria. 11,077 firms entered the population between 1991 and 2000. More than half of these were de novo entries, i.e., firms that were established by at least one person from the STLF. The remaining entries are firms that were already in existence and subsequently taken over by a member of the STLF that also received their primary income from this firm. After having analyzed this population of firms, we have analyzed the entry, survival and growth of the de novo firms.
6.1 Major Findings We can conclude that this group does not represent a population of entrepreneurs in the Schumpeterian sense. It is quite the contrary; the contribution of this group to the economy is minimal and probably diminishing. We have observed a group of firms that as a whole has become less able to generate employment, and where new firms are unlikely to generate substantial salaries or employment growth.
For the complete population, we have seen that the number of firms has increased from 7,073 in 1993 to 9,348 in 2000, but that the average size of the incumbent firms has diminished. In 2000 the average was 3.2 employees, so we are dealing

SELF-EMPLOYMENT AMONG THE SWEDISH SCIENCE AND TECHNOLOGY LABOR FORCE
76
with a population of rather small firms. Furthermore, the number of people em-ployed by this group has diminished by 23.8 % from 34,432 in 1990 to 26,237 in 2000. The effect is even stronger for this group’s ability to generate work for the STLF. During the same period, we can conclude that the share of STLF employed by our population of firms decreased from 9.3 % in 1990 to 5.6 % in 1999. This corresponds to an actual loss of 39.8 % in our population’s ability to generate employment for their own labor group. It is worth noting that 83.7 % of the jobs created by STLF entrepreneurs were jobs created for themselves.
When we focus on de novo entries that are supposed to represent a strong stimulus to rejuvenate a population of firms, we find that about ten percent of the population in any given year are newly established firms. A somewhat lower share of firms is terminated on a yearly basis. In total, 7,716 firms were established in ten different yearly cohorts. The entrants were distributed across industry in a similar way to the population. Most entries are found in technology services, health care and in other knowledge intensive industries. They are in general very small (89.0 % have only one employee –i.e. the founder).
We have also examined the survival, salary distribution and growth in number of employees in these firms. The average estimates for these firms are that 53 % exited within five years of entry and 65 % exited within ten years of entry. This would indicate that this group on average consists of firms with a somewhat higher probability of survival than other groups. While average salaries in these firms are low in the beginning, we can see that on average they can achieve a rapid increase. After five years, average salaries for employees have risen by 289.2 %. However, only 40 % of the surviving firms pay any salary after the first year. In terms of employment growth, not even the oldest cohort is able to achieve the average size for incumbent firms. The 7,716 de novo entry firms established over a ten-year period created in total 11, 879 yearly jobs, of which 6,604 jobs still remained in 2000 (55.6 %). Of the 11,879 created jobs, 79.2 % were created the year the firms were established. The remaining 20.8 % of the jobs created came from subsequent growth. Very few firms actually grow, which is to be expected, but the ones that do grow do not grow substantially. Not one single firm had more than 100 employees. This is a serious indication that growth is difficult to achieve for this group of firms in Sweden.
Cohort effect, industry affiliation, legal form and initial size all have important effects on survival, salary development and absolute employment growth. We did not find any strong cohort effects on survival, but some strong and long lasting effects on growth and salary development. Firms started in an economic recession had a lower probability of achieving growth and a strong salary development than firms started during an economic boom. We found that most firms were started in traditional industries for the STLF, both in terms of employment and already established entrepreneurial firms. However, some industries such as other know-ledge intensive industries and education represented growing industries for these entrepreneurs. Firms in the manufacturing sector had the largest initial size, highest survival and growth. Average salaries were highest in the sectors where STLF entrepreneurs could best exploit their education, but the results were not clear-cut

SELF-EMPLOYMENT AMONG THE SWEDISH SCIENCE AND TECHNOLOGY LABOR FORCE
77
(the knowledge intensive service sector) because we aggregate all employees independent of their position in the firm when analyzing salaries. We also found a strong positive relationship between initial firm size and salary development and growth. In general, the larger the firm at establishment, the higher is the probability of survival and growth. Salaries were also positively affected by initial size. Finally, incorporated firms performed better on all three measures (survival, salary and employment growth).
6.2 Theoretical Implications This study elaborates on three strands of theory; endogenous growth theory, entre-preneurship theory and industrial organization theory. It deals with endogenous growth theory, because it is a unique attempt to test the impact of one of the important mechanisms in converting new knowledge into commercial activities. Here we have closely examined the entrepreneurial activities of the science and technology labor force. We have suggested that this labor force is the labor force having the highest access to new and emerging technologies. Therefore, they represent the individuals that have the highest probability of discovering and pursuing entrepreneurial opportunities based on new technological knowledge. We did not find any support for this relationship.
There are several possible interpretations beside the fact that entrepreneurship, as a mechanism for commercializing new knowledge, does not seem to work. One reason is the lack of an environment that supports entrepreneurship (i.e., high entry barriers, administrative burden, limited access to venture capital). It is possible that other mechanisms of knowledge spillovers are more effective for economic growth than entrepreneurship. An example of such a mechanism is the mobility of highly educated employees that move between firms. Some people argue that the lack of an environment that supports entrepreneurs is not a serious problem. An important explanation is probably that there is a strong Swedish tradition where large indus-trial companies produce most of the research, development, and innovation (cf. Granstrand & Alänge, 1995). In other words, there is a strong routinized techno-logical regime in most, if not all, industries in Sweden. Most likely, the Swedish STLF has the ability to discover entrepreneurial opportunities, but for the most part, these opportunities are exploited within the framework of the organizations where they work. Hence, innovations inside large corporation can compensate for the lack of entrepreneurs. Therefore, endogenous growth theory would still be valid, but mechanisms other than entrepreneurship –measured as the establishment and development of new firms– are in all probability more important. While endogenous theory offers an interesting explanation as to how growth is achieved, there is little empirical support for it. More research is needed to operationalize the different factors of the model and to test them.
For example, more research is needed on how innovations are discovered and exploited both within and outside existing firms. Entrepreneurship theory would suggest that new firms discover other types of innovations than established firms do. Established firms are mainly involved in routinized upgrading of technology that already exists, while start-up firms are the ones credited for path-breaking non-

SELF-EMPLOYMENT AMONG THE SWEDISH SCIENCE AND TECHNOLOGY LABOR FORCE
78
routine innovations (Baumol, 2002). It is in the latter category that new industries are spawned and substantial economic growth is achieved. Furthermore, over the last few years, there have been many examples of large Swedish firms downsizing their research and development in Sweden, which further emphasizes the relevance of start-ups. Research on how new knowledge is created and exploited in the economy as a whole is important in terms of understanding the balance in an economy between an entrepreneurial driven economy and one driven by large corporations.
This study informs entrepreneurship research because it is able to mitigate a number of problems such survival bias, heterogonous samples, reliance on small samples and the examination of cross sectional data. By examining a large popula-tion of firms and following the establishment of the firms from the very beginning, we have been able to gather evidence supporting a model on the behavior of entrepreneurs. This behavioral theory lends support to the work in industrial organization theory (Caves, 1998; Jovanovic, 1982). The results clearly support a real option strategy from the perspective of entrepreneurs. Entrepreneurs differ in how certain they are about the value of their opportunities, and they seem to act quite rationally. Since firm founders cannot a priori know the value of their oppor-tunity, less confident firm founders start out small, incurring a unit-cost penalty but limiting their sunk cost investment while they gather evidence of the value of the opportunity. If the feedback is positive, firm founders can increase their invest-ment, and if the feedback is negative they can exit at a minimum loss. Initially smaller entrants would therefore be expected to show higher exit rates. Hence, they may start small because they expect to have a high probability of failure, and consequently want to limit their investment. More confident firm founders would then start larger in order to more rapidly achieve an optimal size (Caves, 1998; Jovanovic, 1982). This argument is based on fact that the smallest initial invest-ments on the market are the first to disappear. We have seen that initial conditions such as initial size and choice of legal form have a long-term effect on firm sur-vival, salary development and growth. Multivariate analyses where we can better control for the influence of other variables might reveal stronger support for this behavioral model.
We have also seen that while new entrepreneurs from the STLF start in industries where the labor force is most present in terms of number of employees and owned firms, they also start in a number of other industries. This suggests that the Austrian economic perspective of opportunity recognition as optimizing behavior based on information processing might understate other factors such as motivation and changes in careers. If all entrepreneurs acted according to the Austrian eco-nomic model, most if not all would be in industries where their education and experience is most valued. There is strong indication that a number of entrepre-neurs start in industries where their background is relatively less valuable. Future research is needed to better determine the relationship between experience and the choice of where to establish a firm and whether that experience has an effect on subsequent firm performance.

SELF-EMPLOYMENT AMONG THE SWEDISH SCIENCE AND TECHNOLOGY LABOR FORCE
79
The results from this would add to the accumulation of knowledge we have about industry dynamics. To a large degree, the population examined follows the patterns found in other studies. However, this study represents an important departure from previous studies that have focused on new firms. We have here focused on the nature of founders and owners and thereby added an extra dimension in explaining firm behavior. Firms are composed of people that act for different reasons. One of the major determinants of their behavior is their education and experience. We have seen that taking this into account gives somewhat different results, but perhaps most importantly offers new avenues for gaining a better understanding of how firms evolve by applying multilevel analyses. Also, our use of longitudinal data has underlined the long lasting effects of initial conditions on firm salary development and employment growth.
6.3 Practical Implications It appears that starting an independent firm is a less attractive option for most members of the STLF. Given the low salaries paid, the lack of growth achieved, and the industries they choose to enter, we are bound to suspect that several of these starting businesses in fact do start because they are unable to find suitable employment opportunities. However, we need to point out that there are some important variations in our population of firms since a limited few become very successful. In other words, we are led to believe that a number of those starting businesses are pushed into doing so because they have few other options. While this is a common situation for the labor force at large, it is surprising that it also applies to the STLF. Consequently, the opportunities exploited by members of the STLF in starting their own businesses are probably not the most promising ones. A first implication is that more research is needed to understand how the STLF functions both as employed and as entrepreneurs. With better knowledge about the uniqueness of this group, specific policy implications or measures can be devel-oped. Such research is needed particularly as several policy measures (cf. Henrek-son & Rosenberg, 2001) have been initiated during the period of investigation to support entrepreneurship among members of this labor group. Our results show no evidence that these measures have so far had any positive impact.
Acs et al. (2003) suggest that in a society where little knowledge is produced, this can be compensated for by a large degree of entrepreneurial activity. In Sweden there is substantial knowledge creation in terms of large expenditure on R&D. However, it is well known that this knowledge creation is only marginally trans-formed into economic growth. In this report, we tap into one of the important reasons why this is the case. Our empirical results suggest that there is too little entrepreneurial activity in the economy for new knowledge to be transformed into new viable economic activity, and that it might even be in a downward spiral. Therefore, Sweden appears to be in a situation where there is an imbalance between knowledge creation and entrepreneurial activity with the latter being insufficient.
Thus, the policy implications of this study are primarily that initiatives should be taken that aim at increasing the number of firms started with special emphasis on increasing the number of start-ups by the STLF, and also encourage their growth.

SELF-EMPLOYMENT AMONG THE SWEDISH SCIENCE AND TECHNOLOGY LABOR FORCE
80
The problem is both the lack of start-ups and the lack of growth in both new and established firms. This problem should not be underestimated considering the substantial restructuring that many large established firms, for example, Ericsson, have recently undergone. It is clear that initiatives need to be taken at several levels, both national and regional, to support this kind of entrepreneurship (cf. Henrekson et al., 2001).
Examples of more regional or local initiatives are science parks and entrepreneur-ship education. It is also well established that science parks can stimulate entre-preneurship among the STLF. Over the last few decades, science parks have been established in several locations is Sweden. Others have addressed the functioning of these and it is beyond the scope of this study to address how the effectiveness of science parks can be improved (Jacobsson et al., 2001).
The role of education in entrepreneurship should not be underestimated. Our results lead us to believe that many of those who have the highest chances of discovering and exploiting opportunities through independent entrepreneurial activities do not choose to do so. A major reason for this is probably that they never consider entrepreneurship as a viable career option. In order to change this, it is necessary that members of STLF are exposed to entrepreneurship as a career option during their education. We emphasized this point in the previous report when analyzing the self-employment among the STLF (Delmar et al., 2003). Now when we exam-ine survival, growth, job creation and other aspects of performance, this point becomes even clearer. We believe that entrepreneurship should be part of the education of all students in engineering, science and medicine. Young people with this education have made unique investments in their human capital and it is possible for them and society to reap the benefits of these investments through entrepreneurial activities. This would enhance the ability of Sweden to become a country where new knowledge is more often transformed into economic activity and eventually growth.
On a national level we would like to point out three important factors that we believe might support entrepreneurial activities. These proposals involve increasing the incentives to becoming an entrepreneur. The first issue is the equity capital needed to incorporate a company. Throughout our analyses we have found that incorporated companies are the best performers. The fundamental difference between incorporated companies and other legal forms is that the former provides the owner(s) with limited liability. New start-ups are credited for being able to con-duct path-breaking non-routine innovations (e.g., Baumol, 2002). Such activities are associated with considerable risk. Limited liability becomes important for these types of innovations, because the owners can limit their own personal financial risk. Our analyses showed that the number of incorporated companies started by the STLF dropped when the minimum share capital was increased from 50,000 to 100,000 SEK. This sum is far above what is needed in most comparable countries. For example, in the UK only £1,000 is required (approximately 14,000 SEK). Given that the private wealth of the Swedish STLF is likely to be low compared to counterparts in other countries, raising the funds to incorporate a company provides a much greater hurdle in Sweden than in other countries. We therefore suggest that

SELF-EMPLOYMENT AMONG THE SWEDISH SCIENCE AND TECHNOLOGY LABOR FORCE
81
the share capital needed for incorporating a company be reduced. This would be likely to have positive effects on high potential entrepreneurship among the STLF. There are, of course, tradeoffs in reducing the capital requirements for incorporated companies, such as the risk of people starting such companies in order to “exploit” opportunistic behavior vis-à-vis suppliers, customers, and other stakeholders. How-ever, other countries apparently make other assessments of the balance between the pros and cons of share capital requirements.
Another important but related factor would be to allow individuals better opportu-nities to accumulate personal savings. Studies in Sweden and in other countries such as the US and the UK (Delmar et al., 2000; Dunn et al., 2000; Taylor, 2001) clearly suggest that access to personal capital increase the willingness to engage in entrepreneurial activities. The reason is that entrepreneurs would rather spend their own money than other people’s money when pursuing an opportunity. Further-more, knowing that they can regain lost investment by earned income increases the risk willingness of potential entrepreneurs. Allowing people to save more of their money can only be done by lowering taxes and putting more pressure on the individual to take financial responsibility for their own well-being. A liberalization of income taxation would also open up other opportunities for entrepreneurs to compensate employees to share the risk of working in a new firm. We have seen that these new firms pay a substantially lower salary on average than more mature firms. This leads to a problem for new firms in attracting competent and skilled employees, since potential employees would rather choose a large firm that can offer a higher and more secure salary. New firms must be able to attract these skilled workers with different options programs that allow employees to be compensated if the new ventures become successful. This would diminish the gap between new and old firms when it come to their ability to attract skilled employees.
A final important factor is the creation of a functioning exit market for entrepreneu-rial activities. At present, it is difficult for entrepreneurs to successfully harvest their entrepreneurial endeavors. A complicated tax system makes it difficult and expensive to shift capital from the firm to the entrepreneur, in the event that the entrepreneur would like to do something else. For example, we know that a sub-stantial proportion of successful entrepreneurs that have made a successful exit, invest their money in new firms, either as individual business angels or as venture capitalists. Thereby they give back to the entrepreneurial economy both financial capital and substantial and valuable experience. Smart entrepreneurs know how to construct systems of firms to manage the tax system. However, such systems often need to be put in place at the establishment of the firm, when the value of the opportunity is still uncertain. This requires an extra investment in the firm, and tends to attract criminal elements that might defraud honest entrepreneurs. This is not optimal for the individual entrepreneur or for the economy. Clearer legal structures need to be created, because they would allow entrepreneurs alike to work harder to create value in their firms. It would also make entrepreneurship more attractive, since participating in entrepreneurial activities could lead to higher financial returns than at present. It would also increase the availability of venture

SELF-EMPLOYMENT AMONG THE SWEDISH SCIENCE AND TECHNOLOGY LABOR FORCE
82
capital that can be directed towards ventures in their earliest phases of develop-ment; as former entrepreneurs prefer to invest in the early stages. In sum, we believe that a combination of policy measures that raises the knowledge level about entrepreneurship and increases the incentives to being an entrepreneur might reverse the negative trend that we have described here. We believe that the pros of changing the incentive systems in Sweden far outweigh the cons.
6.4 Limitations and Future Research Such a study is not without limitations. Four important limitations are worth men-tioning. The first is that we have not carried out any analyses at the regional level. Modern cluster theory and developments in endogenous growth theory suggest that this is an important level of analysis. We will conduct such analyses in the future. However, we have carried out regional analysis at the individual level, and since most firms that we have tracked are one-person firms we do not expect the results to differ at the firm level.
Second, our performance and outcome measures need to be refined. We have focused on survival, salary and employment growth, but we believe there is still much to learn from analysis of more financially oriented data such as sales and profits. Moreover, when examining survival, we have not taken into account competing risks. This means that a firm can be terminated for a number of reason, either because it is not financially viable or because its success leads to it being acquired. These competing outcomes are probably the results of totally different causal patterns.
Third, we have argued that most of the firms we have followed do not exploit valuable opportunities. However, we have not been able to provide any controls for the nature of the opportunity despite the fact that it is central to our understanding of both endogenous growth theory and entrepreneurship. Future research must thus try to take into account the role of opportunities. One way to do that would be to use patent data as one indicator of the nature and value of the opportunity.
Fourth, we do not have any control group so it is difficult to assess precisely the exact levels of performance of this particular labor group relative to other labor groups. Future work directed to establishing more detailed comparison in order to develop policy implications should also develop a design allowing group compari-sons. We believe that even if we have taken precautions to minimize heterogeneity in our sample, there remains much work to do. Future analysis should look at more detailed levels of education.
Finally, we have already mentioned a number of areas in which we need to conduct further research. We have mentioned the need to analyze more carefully the total economic behavior and contribution of the STLF, not only in terms of entrepre-neurship, but also to better assess the applicability of endogenous growth theory. We have also suggested more research in order to develop a behavioral theory of entrepreneurship, and that multilevel models should be developed. In addition, further research needs to be done on understanding the organizational origin of new firms, and how these origins affect future development. The study of spin-offs and

SELF-EMPLOYMENT AMONG THE SWEDISH SCIENCE AND TECHNOLOGY LABOR FORCE
83
their development is crucial to understanding how knowledge spills over from one organization to another. Such studies are also important in order to gain an understanding of what kind of spawning organizations are most successful in creating spin-offs.
6.5 Conclusions The purpose of this report is to explore the entrepreneurial activities of the science and technology labor force in Sweden from the perspective of endogenous growth theory. We argued that an important mechanism for explaining how new techno-logical knowledge is converted to economic growth is the economic behavior of the science and technology labor force, and especially the entrepreneurial activities of that group. However, we have found little evidence supporting this statement. Entrepreneurship plays a marginal role, and the firms started seldom manage to achieve any substantial growth. Furthermore, the population of firms owned by the STLF has over time become less and less able to generate employment growth.

SELF-EMPLOYMENT AMONG THE SWEDISH SCIENCE AND TECHNOLOGY LABOR FORCE
84

SELF-EMPLOYMENT AMONG THE SWEDISH SCIENCE AND TECHNOLOGY LABOR FORCE
85
7 References
Acs, Z. J. 2002. Innovations and the Growth of Cities: Edward Elgar.
Acs, Z. J., & Audretsch, D. B. 1989. Births and firm size. Southern Economic Journal, 56(2): 467-476.
Aldrich, H. 1979. Organizations and Environments. Englewoods Cliffs, NJ: Prentice -Hall Inc.
Aldrich, H. 1999. Organizations Evolving. London: Sage Publications.
Amit, R., Muller, E., & Cockburn, I. 1995. Opportunity costs and entrepreneurial activity. Journal of Business Venturing, 10: 95-106.
Audretsch, D. B. 1991. New-Firm Survival and the Technological Regime. The Review of Economics and Statistics, 73(3): 441-450.
Audretsch, D. B. 1995a. Innovation and industry evolution. Cambridge, Mass. ; London: MIT Press.
Audretsch, D. B. 1995b. Innovation, growth and survival. International Journal of Industrial Organization, 13: 441-457.
Audretsch, D. B., & Mahmood, T. 1995a. New firm survival: New results using a hazard function. The Review of Economics and Statistics, 77(1): 97-103.
Audretsch, D. B., & Mata, J. 1995b. The post-entry performance of firms: Introduction. International Journal of Industrial Organization, 13: 413-419.
Barnett, W. P., & Sorensen, O. 2002. The Red Queen in organizational creation and development. Industrial and Corporate Change, 11(2): 289-325.
Bates, T. 1995. Self-employment entry across industry groups. Journal of Business Venturing, 10: 143-156.
Baumol, W. J. 1993. Entrepreneurship, Management, and the Structure of Payoffs. Cambridge, Massachusetts: The MIT Press.
Baumol, W. J. 2002. The Free-market Innovation Machine: Analyzing the Growth Miracle of Capitalism. Princeton: Princeton University press.
Birch, D. L. 1979. The job generation process. Cambridge, Mass.: M.I.T. Program on Neighborhood and Regional Change.
Bottazzi, G., Cefis, E., & Dosi, G. 2002. Corporate growth and industrial structures: Some evidence from the Italian manufacturing industry. Industrial and Corporate Change, 11(4): 705-723.
Bottazzi, G., Dosi, G., Lippi, M., Pammolli, F., & Riccaboni, M. 2001. Innovation and corporate growth in the evolution of the drug industry. International Journal of Industrial Organization, 19(7): 1161.
Brüderl, J., & Schussler, R. 1990. Organizational Mortality: The liabilities of newness and adolescence. Administrative Science Quarterly, 35(3): 530-548.

SELF-EMPLOYMENT AMONG THE SWEDISH SCIENCE AND TECHNOLOGY LABOR FORCE
86
Carlsson, B., & Eliasson, G. 2003. Industrial dynamics and endogenous growth. Industry and Innovation, 10(4): 435-455.
Carroll, G. R., & Hannan, M. T. 2000. The Demography of Corporations and Industries. Princeton, New Jersey: Princeton University Press.
Carroll, G. R., & Mosakowski, E. 1987. The career dynamics of self-employment. Administrative Science Quarterly, 32: 570-589.
Casson, M. 1982a. The Entrepreneur. Totowa, NJ: Barnes and Nobles Books.
Casson, M. 1982b. The entrepreneur : an economic theory. Oxford: Martin Robertson.
Caves, R. E. 1998. Industrial organization and new findings on the turnover and mobility of firms. Journal of Economic Literature, XXXVI: 1947-1982.
Chandler, A. D. 1962. Strategy and Structures: Chapters in the History of the American Industrial Enterprises. Cambridge, MA: MIT Press.
Christensen, C. M. 1993. The rigid disk drive industry: A history of commercial and technological turbulence. Business History Review, 67(4): 531-588.
Davidsson, P., & Delmar, F. 2000. Tillväxtföretagen i Sverige. Var de finns, hur de växer och vilka jobb de skapar. Stockholm: Nya Jobb och Företag.
Davidsson, P., & Delmar, F. 2003. Hunting for new employment: The role of high growth firms. In D. A. Kirby, & A. Watson (Eds.), Small Firms and Economic Development in Developed and Transition Economies: A Reader: 7-19. Aldershot, England: Ashgate.
Davidsson, P., Lindmark, L., & Olofsson, C. 1994. Dynamiken i svenkt näringsliv (The dynamics of the Swedish business sector). Lund, Sweden: Studentlitteratur.
Davidsson, P., Lindmark, L., & Olofsson, C. 1996. Näringslivsdynamik under 90-talet. Stockholm: Nutek.
de Wit, G., & van Winden, F. A. A. M. 1989. An empirical analysis of self-employment in the Netherlands. Small Business Economics, 1: 263-272.
Delmar, F., & Davidsson, P. 2000. Where do they come from? Prevalence and characteristics of nascent entrepreneurs. Entrepreneurship & Regional Development, 12: 1-23.
Delmar, F., Davidsson, P., & Gartner, W. B. 2003a. Arriving at the high growth firm. Journal of Business Venturing, 18(2): 189-216.
Delmar, F., Sjöberg, K., & Wiklund, J. 2003b. The Involvement in Self-employment among the Swedish Science and Technology Labor Force Between 1990 and 2000. Stockholm: ITPS.
Dunn, T., & Holtz-Eakin, D. 1995. Capital Market Constraints, Parental Wealth and the Transition to Self-Employment among Men and Women: US Department of Labor Bureau of Statistics.

SELF-EMPLOYMENT AMONG THE SWEDISH SCIENCE AND TECHNOLOGY LABOR FORCE
87
Dunn, T., & Holtz-Eakin, D. 2000. Financial capital, human capital, and the transition to self-employment: Evidence from intergenerational links. Journal of Labor Economics, 18(2): 285-305.
Dunne, P., & Hughes, A. 1996. Age, size, growth and survival: UK companies in the 1980s. Journal of Industrial Economics, XLII(2): 115-140.
Dunne, T., Roberts, M. J., & Samuelson, L. 1988. Patterns of firm entry and exit in U.S. manufacturing firms. RAND Economic Journal, 19(4): 495- 515.
Dunne, T., Roberts, M. J., & Samuelson, L. 1989. The growth and failure of U.S. manufacturing plants. The Quarterly Journal of Economics, November: 671-698.
Fichman, M., & Levinthal, D. A. 1991. Honeymoons and the liability of adolescence: A new perspective on duration dependence in social and organizational relationships. Academy of Management Review, 18(2): 442-468.
Freeman, J. 1982. Organizational life cycles and natural selection processes. Research in Organizational Behavior, 4(1-32).
Geroski, P. A. 1995. What do we know about entry? International Journal of Industrial Organization, 13: 421-440.
Geroski, P. A. 2001. Exploring the niche overlaps between organizational ecology and industrial economics. Industrial and Corporate Change, 10(2): 507-540.
Gimeno, J., Folta, T. B., Cooper, A. C., & Woo, C. Y. 1997. Survival of the fittest? Entrepreneurial human capital and the persistence of underperforming firms. Administrative Science Quarterly, 42: 750-783.
Granstrand, O., & Alänge, S. 1995. The evolution of corporate entrepreneurship in Swedish industry- was Schumpeter wrong? Journal of Evolutionary Economics, 5: 133-156.
Grebel, T., Pyka, A., & Hanusch, H. 2003. An evolutionary approach to the theory of entrepreneurship. Industry and Innovation, 10(4): 493-514.
Hannan, M. T., & Freeman, M. T. 1984. Structural inertia and organizational change. American Sociological Review, 49: 149-164.
Hayek, F. A. 1945. The use of knowledge in society. American Economic review, 35(4): 519-530.
Henrekson, M., & Rosenberg, N. 2001. Designing Efficient Institutions for Science-Based Entrepreneurship: Lesson from the US and Sweden. Journal of Technology Transfer, 26(3): 207-231.
Jacobsson, S., & Lindholm Dahlstrand, Å. 2001. Nya teknikbaserade företag och industriell tillväxt. In P. Davidsson, F. Delmar, & J. Wiklund (Eds.), Tillväxtföretagen i Sverige: 116-143. Stockholm: SNS.
Jovanovic, B. 1982. Selection and the evolution of industry. Econometrica, 50(3): 649-670.

SELF-EMPLOYMENT AMONG THE SWEDISH SCIENCE AND TECHNOLOGY LABOR FORCE
88
Kirzner, I. M. 1997. Entrepreneurial discovery and the competitive market process: An Austrian approach. Journal of Economic Literature, 35(1): 60-85.
Klepper, S. 1996. Entry, exit, growth and innovation over the product life cycle. The American Economic Review, 86(3): 562-583.
Klepper, S., & Graddy, E. 1990. The evolution of new industries and the determinants of market structure. RAND Journal of Economics, 21(1): 27-44.
Knight, F. H. 1921. Risk, Uncertainty and Profit. Boston: Houghton Mifflin Company.
Lucas, R. E., Jr. 1988. On the Mechanics of Economic Development. Journal of Monetary Economics, 22(1): 3-42.
Mata, J., & Portugal, P. 1994. Life duration of new firms. The Journal of Industrial Economics, 42(3): 227.
Mata, J. M., Jose A F. 1996. Firm start-up size: A conditional quantile approach. European Economic Review, 40(6): 1305.
Nelson, R., & Winter, S. 1982. An Evolutionary Theory of Economic Change. Cambridge, MA: Belknap Press.
Peng, M. W., & Heath, P. S. 1996. The growth of the firm in planned economies in transition: institutions, organizations, and strategic choice. Academy of Management Review, 21(2): 492-528.
Phillips, B. D., & Kirchoff, B. A. 1989. Formation, growth and survival; small firm dynamics in the U.S. economy. Small Business Economics, 1: 65-74.
Picot, G., & Dupuy, R. 1998. Job creation by company size class: The magnitude, concentration and persistence of job gains and losses in Canada. Small Business Economics, 10: 117- 139.
Porter, M. E. 1990. The competitive advantage of nations. New York: Free Press.
Reynolds, P. D., & White, S. B. 1997. The Entrepreneurial Process: Economic Growth, Men, Women, and Minorities. Westport, Connecticut: Quorum Books.
Romer, P. M. 1990. Endogenous technological change. The Journal of Political Economy, 98(5): S71-S102.
Romer, P. M. 1994. The origins of endogenous growth. The Journal of Economic Perspectives, 8(1): 3-22.
Schumpeter, J. A. 2000 (1934). Entrepreneurship as innovation. In R. Swedberg (Ed.), Entrepreneurship: The social science view. Oxford, England: Oxford University Press.
Shane, S. 2000. Prior knowledge and the discovery of entrepreneurial opportunities. Organization Science, 11(4): 448-469.
Shane, S. 2003. A General Theory of Entrepreneurship. The Individual-Opportunity Nexus. Northampton, MA: Edward Elgar.

SELF-EMPLOYMENT AMONG THE SWEDISH SCIENCE AND TECHNOLOGY LABOR FORCE
89
Shane, S., & Eckhardt, J. 2003. The Individual-Opportunity Nexus. In Z. J. Acs, & D. B. Audretsch (Eds.), Handbook of Entrepreneurship Research: An Interdisciplinary Survey and Introduction: 161-191. Norwell, MA: Kluwer Academic Publishers.
Shane, S., & Venkataraman, S. 2000. The promise of entrepreneurship as a field of research. Academy of Management Review, 25(1): 217-266.
Storey, D. J. 1994. Understanding the Small Business Sector. London: Routledge.
Storey, D. J. 1995. Symposium on Harrison's "Lean and mean": a job generation perspective. Small Business Economics, 7(5): 5-8.
Taylor, M. P. 2001. Self-employment and windfall gains in Britain: Evidence from panel data. Economica, 68: 539-565.
Wagner, J. 1992. Firm size, firm growth and persistence of chance. Testing GIBRAT's law with establishment data form lower Saxony, 1978-1989. Small Business Economics, 4: 125-131.
Wagner, J. 1994. The post-entry performance of new small firms in German manufacturing industries. Journal of Industrial Economics, XLII(2): 141-154.
Venkataraman, S. 1997. The distinctive domain of entrepreneurship research: An editor's perspective. In J. Katz, & R. H. S. Brockhaus (Eds.), Advances in entrepreneurship, firm emergence, and growth, Vol. 3: 119-138. Greenwich, CT: JAI Press.
Wiggins, S. N. 1995. Entrepreneurial enterprises, endogenous ownership, and the limits to firm size. Economic Inquiry, 33(1): 54-69.

SELF-EMPLOYMENT AMONG THE SWEDISH SCIENCE AND TECHNOLOGY LABOR FORCE
90

SELF-EMPLOYMENT AMONG THE SWEDISH SCIENCE AND TECHNOLOGY LABOR FORCE
91
8 Appendix
Table A 1 Entry and exit from the population of firms that at some point in time are owned or part owned by at least one person in the STLF 1990-2000 1990 1991 1992 1993 1994 1995 1996 1997 1998 1999 2000 New firms STLF 838 525 559 760 676 732 950 859 904 913 New firms other 557 415 411 515 433 393 282 217 137 1 New total 1395 940 970 1275 1109 1125 1232 1076 1041 914 Exiting firms STLF 1671 538 644 471 564 617 628 678 733 1000 Exiting firms other 1 177 234 159 241 317 373 375 431 481 Exit Total 1672 715 878 630 805 934 1001 1053 1164 1481 Total firms 11119 10842 11067 11159 11804 12108 12299 12530 12553 12430 11863 Table A 2 Survival of firms founded by STLF entrepreneurs, ownership and status definition
No. of years 1991 1992 1993 1994 1995 1996 1997 1998 1999 2000
Mean survival between cohorts for no. of year,
respectively 1 100% 100% 100% 100% 100% 100% 100% 100% 100% 100% 100% 2 60% 59% 63% 67% 67% 68% 68% 69% 65% 65% 3 49% 48% 52% 54% 52% 55% 59% 56% 53% 4 46% 39% 46% 46% 44% 48% 51% 46% 5 41% 33% 40% 40% 39% 45% 40% 6 34% 30% 39% 36% 38% 35% 7 33% 27% 36% 34% 33% 8 29% 26% 33% 29% 9 28% 26% 27%
10 28% 28%
Table A 3 Survival by legal form, ownership and status definition
No of years All Sole Proprietorship Partnership Limited Company
1 100% 100% 100% 100% 2 65% 64% 61% 76% 3 53% 52% 44% 63% 4 46% 44% 35% 55% 5 40% 39% 31% 46% 6 35% 36% 24% 39% 7 33% 33% 22% 35% 8 29% 31% 14% 29% 9 27% 29% 13% 26% 10 28% 29% 12% 28%

SELF-EMPLOYMENT AMONG THE SWEDISH SCIENCE AND TECHNOLOGY LABOR FORCE
92
Table A 4 Gross number of jobs created by cohort
Year 1991 1992 1993 1994 1995 1996 1997 1998 1999 2000 SUM (per year) 1991 1013 1013 1992 51 601 652 1993 49 36 704 789 1994 46 17 77 974 1114 1995 69 25 54 101 780 1029 1996 43 14 29 44 32 832 994 1997 19 25 43 42 33 98 1145 1405 1998 52 12 33 50 23 27 149 1148 1494 1999 37 8 18 35 67 68 113 155 1055 1556 2000 55 8 63 57 34 50 159 120 119 1161 1826 11872 Total number of jobs created per cohort 1434 746 1021 1303 969 1075 1566 1423 1174 1161 Growth past first year 421 145 317 329 189 243 421 275 119 n/a % of growth past year 1 29.4% 19.4% 31.0% 25.2% 19.5% 22.6% 26.9% 19.3% 10.1% n/a
Table A 5 Net of jobs created by cohort
Year 1991 1992 1993 1994 1995 1996 1997 1998 1999 2000 Jobs remaining 1991 1013 1013 1992 698 601 1299 1993 562 363 704 1629 1994 586 332 568 974 2460 1995 601 292 528 785 780 2986 1996 540 255 497 657 566 832 3347 1997 507 257 483 595 465 700 1145 4152 1998 508 239 490 553 406 606 974 1148 4924 1999 513 209 421 514 417 593 933 988 1055 5643 2000 453 204 431 505 456 604 962 982 846 1161 6604

93
SE
LF-EM
PLO
YM
ENT A
MO
NG
THE
SWE
DIS
H SC
IEN
CE AN
D TEC
HN
OLO
GY
LABO
R FO
RC
E
Table A 6 Average firm size and standard deviations across industries
1991 1992 1993 1994 1995 1996 1997 1998 1999 2000 Manufacturing Year Mean (St.d.) Mean (St.d.) Mean (St.d.) Mean (St.d.) Mean (St.d.) Mean (St.d.) Mean (St.d.) Mean (St.d.) Mean (St.d.) Mean (St.d.)
1 1.2 0.4 1.8 1.6 7.5 7.5 3.2 5.7 1.1 0.3 2.5 1.9 1.8 2.3 3.2 8.2 1.1 0.3 1.7 1.6 2 1.6 1.3 2.8 3.5 9.8 12.2 3.5 6.5 1.3 0.6 2.9 2.3 1.4 0.7 3.7 9.9 1.1 0.4 3 2.0 1.7 2.8 3.0 12.0 14.7 4.0 7.2 1.2 0.4 3.0 2.3 1.8 1.6 4.4 11.5 4 1.8 1.5 2.8 3.0 10.5 14.5 4.2 7.1 1.5 0.6 2.8 2.1 8.2 12.9 5 1.8 1.1 2.8 3.1 13.6 18.0 2.2 1.7 1.4 0.5 3.0 2.3 6 2.1 1.7 2.9 3.7 12.8 16.4 2.9 2.2 1.6 0.5 7 2.3 1.7 3.0 3.9 8.0 12.7 3.5 3.2 8 2.1 1.8 3.5 4.4 8.3 13.8 9 2.2 1.7 3.2 4.9
10 2.2 1.8 Technology services Year Mean (St.d.) Mean (St.d.) Mean (St.d.) Mean (St.d.) Mean (St.d.) Mean (St.d.) Mean (St.d.) Mean (St.d.) Mean (St.d.) Mean (St.d.)
1 1.4 2.1 1.3 0.9 1.2 0.6 1.4 1.6 1.2 0.8 1.4 1.9 1.4 1.7 1.3 1.6 1.2 0.6 1.5 3.1 2 1.6 2.0 1.3 1.0 1.4 1.0 1.9 3.9 1.2 1.0 2.2 4.6 2.0 3.9 1.5 2.2 1.4 1.5 3 1.8 2.3 1.4 1.0 1.7 1.6 1.6 1.8 1.3 1.2 2.7 5.3 2.5 5.6 2.3 5.3 4 1.7 1.8 1.4 1.0 1.6 1.5 1.7 1.8 1.3 1.6 3.6 7.3 3.2 9.0 5 1.8 2.3 1.5 1.1 2.0 2.4 1.6 1.8 1.4 1.9 4.0 8.9 6 1.8 1.8 1.7 1.7 2.1 3.1 1.7 1.9 1.8 3.6 7 1.7 2.0 1.6 1.8 1.8 1.9 2.8 4.5 8 2.1 2.9 1.6 1.9 2.4 4.8 9 2.3 3.7 1.5 1.5
10 2.7 5.3

94
SE
LF-EM
PLO
YM
ENT A
MO
NG
THE
SWE
DIS
H SC
IEN
CE AN
D TEC
HN
OLO
GY
LABO
R FO
RC
E
Other knowledge-intensive services Year Mean (St.d.) Mean (St.d.) Mean (St.d.) Mean (St.d.) Mean (St.d.) Mean (St.d.) Mean (St.d.) Mean (St.d.) Mean (St.d.) Mean (St.d.)
1 1.1 0.3 1.3 1.0 1.3 0.5 1.2 0.4 1.1 0.4 1.1 0.7 1.2 1.2 1.2 0.6 1.2 0.9 1.1 0.4 2 1.1 0.3 1.7 2.1 1.4 0.6 1.3 0.7 1.3 0.6 1.2 1.0 1.2 0.6 2.7 8.5 1.9 3.5 3 1.1 0.4 1.5 1.6 1.2 0.5 1.4 0.9 1.3 0.6 1.3 0.8 1.2 1.0 2.6 6.7 4 1.2 0.5 1.5 1.6 1.3 0.5 1.7 2.3 1.4 1.3 1.3 0.4 1.2 0.9 5 1.2 0.5 1.4 1.5 1.4 0.7 2.1 4.4 2.1 3.3 1.3 0.6 6 1.2 0.6 1.5 1.5 1.4 0.7 2.8 6.1 2.9 5.2 7 1.1 0.4 2.4 3.9 1.5 0.7 2.9 7.6 8 1.2 0.4 1.1 0.3 1.3 0.7 9 1.2 0.4 1.1 0.4
10 1.7 1.1 Health-care Year Mean (St.d.) Mean (St.d.) Mean (St.d.) Mean (St.d.) Mean (St.d.) Mean (St.d.) Mean (St.d.) Mean (St.d.) Mean (St.d.) Mean (St.d.)
1 1.7 1.3 1.4 0.6 2.9 3.9 1.7 2.3 1.4 1.2 1.3 0.9 1.4 0.8 1.4 1.0 1.8 2.9 1.4 1.2 2 1.9 1.4 1.9 1.2 2.6 3.9 2.0 2.4 1.7 1.3 1.5 1.1 1.5 0.9 1.6 1.0 2.1 3.3 3 2.1 2.1 1.4 0.7 2.5 3.7 2.0 2.6 1.9 1.3 1.4 1.1 1.6 1.0 1.6 1.1 4 1.9 1.6 1.4 1.0 2.8 4.6 2.0 2.4 1.9 1.4 1.4 1.3 1.7 1.3 5 2.2 3.6 1.4 1.0 3.0 4.8 2.1 2.8 2.0 1.5 1.4 1.7 6 2.3 4.9 1.6 1.1 3.2 5.1 2.0 2.4 1.8 1.5 7 2.3 5.4 1.6 1.2 3.0 4.7 2.0 2.3 8 2.7 6.6 1.6 1.2 2.9 3.2 9 2.5 5.5 1.7 1.3
10 1.8 1.5

95
SE
LF-EM
PLO
YM
ENT A
MO
NG
THE
SWE
DIS
H SC
IEN
CE AN
D TEC
HN
OLO
GY
LABO
R FO
RC
E
Table A 7 Average firm size and standard deviations by initial size
1 Employee 1991 1992 1993 1994 1995 1996 1997 1998 1999 2000 Year Mean (St.d.) Mean (St.d.) Mean (St.d.) Mean (St.d.) Mean (St.d.) Mean (St.d.) Mean (St.d.) Mean (St.d.) Mean (St.d.) Mean (St.d.)
1 1.0 0.0 1.0 0.0 1.0 0.0 1.0 0.0 1.0 0.0 1.0 0.0 1.0 0.0 1.0 0.0 1.0 0.0 1.0 0.0 2 1.1 0.3 1.1 0.4 1.1 0.3 1.1 0.4 1.1 0.3 1.1 0.3 1.1 0.4 1.2 2.8 1.0 0.0 3 1.1 0.5 1.1 0.3 1.1 0.6 1.2 0.8 1.1 0.4 1.1 0.3 1.2 0.7 1.2 2.1 4 1.2 0.7 1.1 0.4 1.2 0.6 1.2 0.7 1.1 0.3 1.1 0.4 1.2 1.0 5 1.3 1.8 1.1 0.6 1.2 0.9 1.2 0.7 1.1 0.4 1.2 0.6 6 1.4 2.7 1.3 0.7 1.3 1.0 1.2 0.6 1.3 1.7 7 1.4 2.9 1.2 0.6 1.3 1.0 1.4 1.8 8 1.6 3.5 1.2 0.7 1.4 2.1 9 1.6 3.1 1.2 0.6 10 1.4 1.2
2-3 Employees 1991 1992 1993 1994 1995 1996 1997 1998 1999 2000 Year Mean (St.d.) Mean (St.d.) Mean (St.d.) Mean (St.d.) Mean (St.d.) Mean (St.d.) Mean (St.d.) Mean (St.d.) Mean (St.d.) Mean (St.d.)
1 2.1 0.3 2.0 0.2 2.2 0.4 2.2 0.4 2.1 0.4 2.1 0.3 2.1 0.3 2.1 0.3 2.2 0.4 2.2 0.4 2 2.1 1.4 1.6 0.7 2.4 1.4 2.1 1.1 1.8 0.6 2.4 1.3 2.0 0.8 2.3 1.1 2.2 0.4 3 2.3 1.9 1.8 0.8 2.4 2.0 2.2 1.3 2.1 1.0 2.4 1.8 2.2 1.3 2.7 2.2 4 2.3 1.7 2.0 1.3 2.6 1.9 2.6 2.1 2.4 1.8 3.4 3.1 2.5 2.0 5 2.4 2.3 2.3 1.2 3.0 2.6 3.0 3.7 2.8 3.1 3.4 3.2 6 2.1 1.2 2.1 1.2 3.4 3.8 3.4 4.7 3.0 4.3 7 2.0 1.3 2.1 1.4 2.7 2.4 3.7 6.1 8 2.2 1.6 2.1 1.5 4.0 5.4 9 2.1 1.5 2.3 1.9 10 2.3 1.7
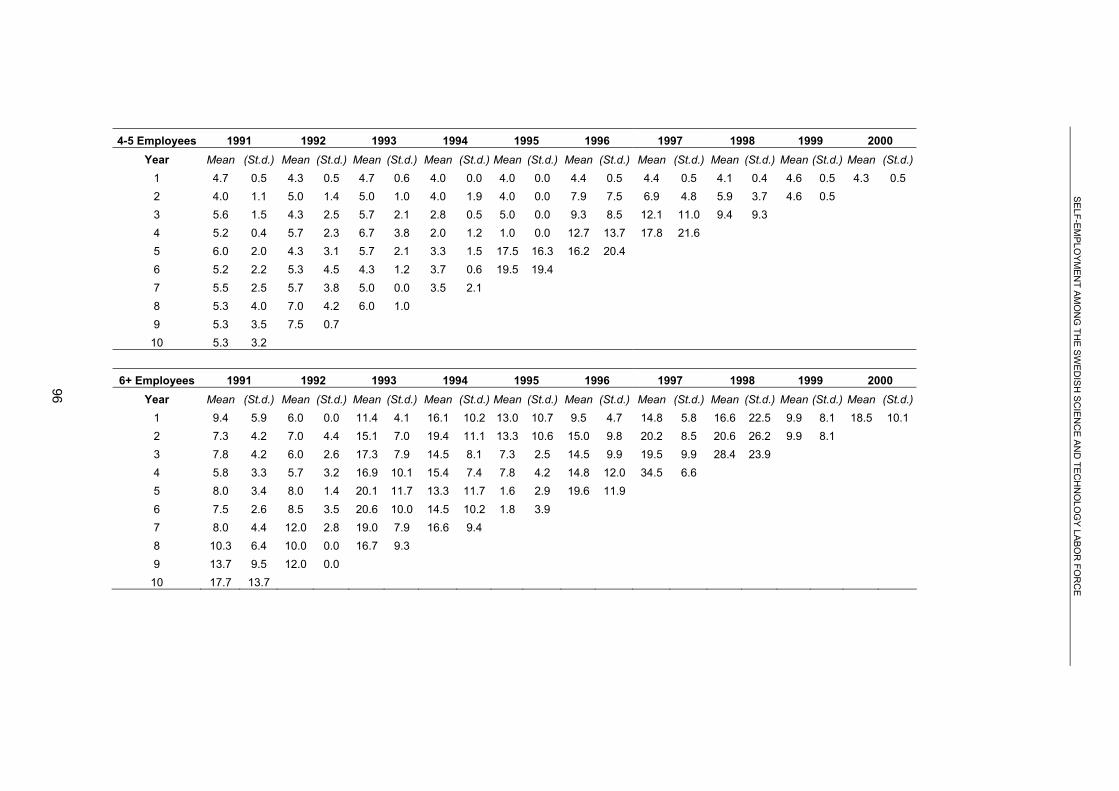
96
SE
LF-EM
PLO
YM
ENT A
MO
NG
THE
SWE
DIS
H SC
IEN
CE AN
D TEC
HN
OLO
GY
LABO
R FO
RC
E
4-5 Employees 1991 1992 1993 1994 1995 1996 1997 1998 1999 2000 Year Mean (St.d.) Mean (St.d.) Mean (St.d.) Mean (St.d.) Mean (St.d.) Mean (St.d.) Mean (St.d.) Mean (St.d.) Mean (St.d.) Mean (St.d.)
1 4.7 0.5 4.3 0.5 4.7 0.6 4.0 0.0 4.0 0.0 4.4 0.5 4.4 0.5 4.1 0.4 4.6 0.5 4.3 0.5 2 4.0 1.1 5.0 1.4 5.0 1.0 4.0 1.9 4.0 0.0 7.9 7.5 6.9 4.8 5.9 3.7 4.6 0.5 3 5.6 1.5 4.3 2.5 5.7 2.1 2.8 0.5 5.0 0.0 9.3 8.5 12.1 11.0 9.4 9.3 4 5.2 0.4 5.7 2.3 6.7 3.8 2.0 1.2 1.0 0.0 12.7 13.7 17.8 21.6 5 6.0 2.0 4.3 3.1 5.7 2.1 3.3 1.5 17.5 16.3 16.2 20.4 6 5.2 2.2 5.3 4.5 4.3 1.2 3.7 0.6 19.5 19.4 7 5.5 2.5 5.7 3.8 5.0 0.0 3.5 2.1 8 5.3 4.0 7.0 4.2 6.0 1.0 9 5.3 3.5 7.5 0.7 10 5.3 3.2
6+ Employees 1991 1992 1993 1994 1995 1996 1997 1998 1999 2000 Year Mean (St.d.) Mean (St.d.) Mean (St.d.) Mean (St.d.) Mean (St.d.) Mean (St.d.) Mean (St.d.) Mean (St.d.) Mean (St.d.) Mean (St.d.)
1 9.4 5.9 6.0 0.0 11.4 4.1 16.1 10.2 13.0 10.7 9.5 4.7 14.8 5.8 16.6 22.5 9.9 8.1 18.5 10.1 2 7.3 4.2 7.0 4.4 15.1 7.0 19.4 11.1 13.3 10.6 15.0 9.8 20.2 8.5 20.6 26.2 9.9 8.1 3 7.8 4.2 6.0 2.6 17.3 7.9 14.5 8.1 7.3 2.5 14.5 9.9 19.5 9.9 28.4 23.9 4 5.8 3.3 5.7 3.2 16.9 10.1 15.4 7.4 7.8 4.2 14.8 12.0 34.5 6.6 5 8.0 3.4 8.0 1.4 20.1 11.7 13.3 11.7 1.6 2.9 19.6 11.9 6 7.5 2.6 8.5 3.5 20.6 10.0 14.5 10.2 1.8 3.9 7 8.0 4.4 12.0 2.8 19.0 7.9 16.6 9.4 8 10.3 6.4 10.0 0.0 16.7 9.3 9 13.7 9.5 12.0 0.0 10 17.7 13.7
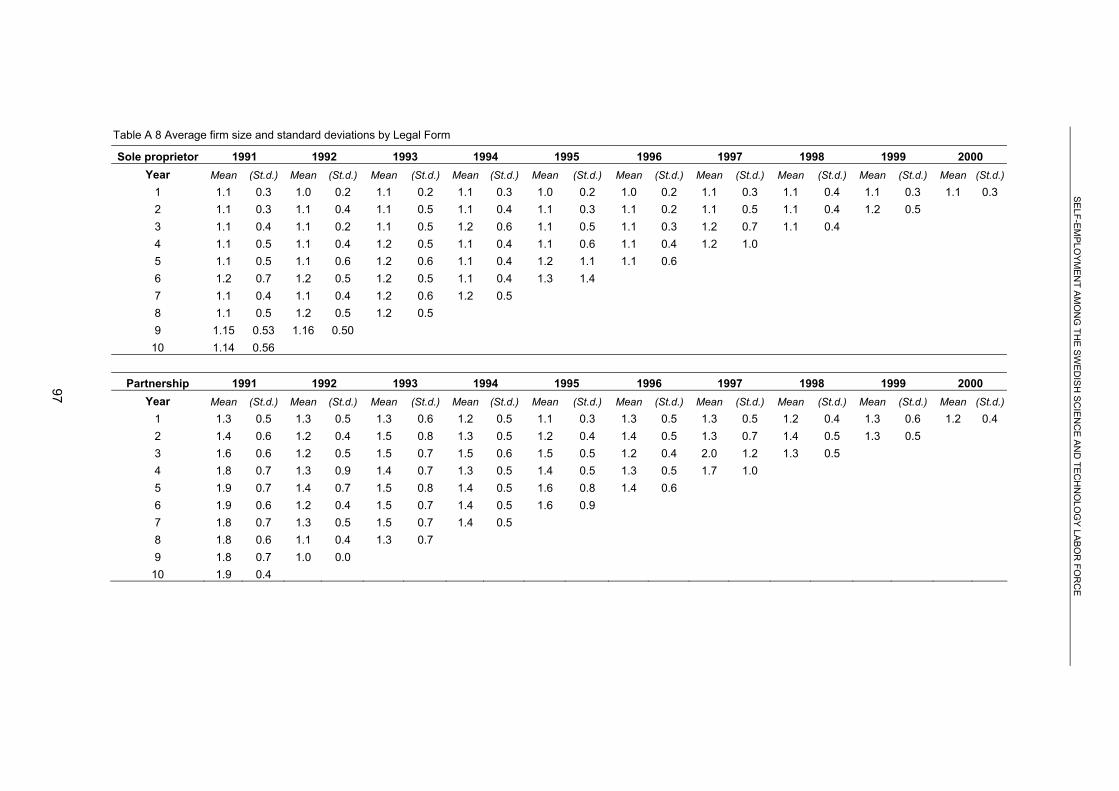
97
SE
LF-EM
PLO
YM
ENT A
MO
NG
THE
SWE
DIS
H SC
IEN
CE AN
D TEC
HN
OLO
GY
LABO
R FO
RC
E
Table A 8 Average firm size and standard deviations by Legal Form
Sole proprietor 1991 1992 1993 1994 1995 1996 1997 1998 1999 2000 Year Mean (St.d.) Mean (St.d.) Mean (St.d.) Mean (St.d.) Mean (St.d.) Mean (St.d.) Mean (St.d.) Mean (St.d.) Mean (St.d.) Mean (St.d.)
1 1.1 0.3 1.0 0.2 1.1 0.2 1.1 0.3 1.0 0.2 1.0 0.2 1.1 0.3 1.1 0.4 1.1 0.3 1.1 0.3 2 1.1 0.3 1.1 0.4 1.1 0.5 1.1 0.4 1.1 0.3 1.1 0.2 1.1 0.5 1.1 0.4 1.2 0.5 3 1.1 0.4 1.1 0.2 1.1 0.5 1.2 0.6 1.1 0.5 1.1 0.3 1.2 0.7 1.1 0.4 4 1.1 0.5 1.1 0.4 1.2 0.5 1.1 0.4 1.1 0.6 1.1 0.4 1.2 1.0 5 1.1 0.5 1.1 0.6 1.2 0.6 1.1 0.4 1.2 1.1 1.1 0.6 6 1.2 0.7 1.2 0.5 1.2 0.5 1.1 0.4 1.3 1.4 7 1.1 0.4 1.1 0.4 1.2 0.6 1.2 0.5 8 1.1 0.5 1.2 0.5 1.2 0.5 9 1.15 0.53 1.16 0.50
10 1.14 0.56
Partnership 1991 1992 1993 1994 1995 1996 1997 1998 1999 2000 Year Mean (St.d.) Mean (St.d.) Mean (St.d.) Mean (St.d.) Mean (St.d.) Mean (St.d.) Mean (St.d.) Mean (St.d.) Mean (St.d.) Mean (St.d.)
1 1.3 0.5 1.3 0.5 1.3 0.6 1.2 0.5 1.1 0.3 1.3 0.5 1.3 0.5 1.2 0.4 1.3 0.6 1.2 0.4 2 1.4 0.6 1.2 0.4 1.5 0.8 1.3 0.5 1.2 0.4 1.4 0.5 1.3 0.7 1.4 0.5 1.3 0.5 3 1.6 0.6 1.2 0.5 1.5 0.7 1.5 0.6 1.5 0.5 1.2 0.4 2.0 1.2 1.3 0.5 4 1.8 0.7 1.3 0.9 1.4 0.7 1.3 0.5 1.4 0.5 1.3 0.5 1.7 1.0 5 1.9 0.7 1.4 0.7 1.5 0.8 1.4 0.5 1.6 0.8 1.4 0.6 6 1.9 0.6 1.2 0.4 1.5 0.7 1.4 0.5 1.6 0.9 7 1.8 0.7 1.3 0.5 1.5 0.7 1.4 0.5 8 1.8 0.6 1.1 0.4 1.3 0.7 9 1.8 0.7 1.0 0.0
10 1.9 0.4

98
SE
LF-EM
PLO
YM
ENT A
MO
NG
THE
SWE
DIS
H SC
IEN
CE AN
D TEC
HN
OLO
GY
LABO
R FO
RC
E
Incorporation 1991 1992 1993 1994 1995 1996 1997 1998 1999 2000 Year Mean (St.d.) Mean (St.d.) Mean (St.d.) Mean (St.d.) Mean (St.d.) Mean (St.d.) Mean (St.d.) Mean (St.d.) Mean (St.d.) Mean (St.d.)
1 1.8 2.1 1.6 1.2 2.3 3.2 2.6 4.7 1.8 2.9 2.3 2.8 2.7 3.6 3.5 9.5 2.4 3.3 3.6 6.3 2 2.0 2.1 1.9 1.8 3.6 5.2 3.3 5.9 2.0 3.2 3.6 5.5 3.9 5.8 5.3 13.0 3.5 4.7 3 2.2 2.3 2.0 1.5 4.3 6.2 3.3 4.6 1.8 1.6 3.9 5.9 4.8 7.6 7.4 14.0 4 2.3 2.0 2.3 1.9 4.3 6.4 3.5 4.7 1.9 2.0 5.0 7.7 6.7 12.6 5 2.8 3.7 2.3 2.0 5.2 7.7 3.7 5.5 2.7 5.5 6.2 10.4 6 2.7 4.6 2.8 2.4 5.5 7.7 4.0 5.7 3.3 7.0 7 2.8 5.1 3.1 3.1 5.1 6.7 4.7 7.0 8 3.4 6.3 2.6 2.5 6.1 7.8 9 3.6 5.8 2.8 2.7
10 3.3 4.3

ITPS, Swedish Institute for Growth Policy StudiesStudentplan 3, 831 40 Östersund, SwedenTelephone: +46 (0)63 16 66 00Fax: +46 (0)63 16 66 [email protected] 1652-0483