A STUDY OF FATIGUE IN HIGH SPEED GEARS
11
ISSN 1590-8844 International Journal of Mechanics and Control, Vol. 14, No. 02, 2013 9 A STUDY OF FATIGUE IN HIGH SPEED GEARS Francesca Curà* Fabio Gallo* Carlo Rosso* *Department of Mechanical and Aerospace Engineering, Politecnico di Torino, Corso Duca degli Abruzzi 24, 10129, Torino ABSTRACT This paper presents a study about a multiaxial fatigue approach in high speed gears. Once identified the main effects determining a variable stress state at the tooth root fillet, it has been developed a methodology for the superposition of mesh load, centrifugal field and dynamic behaviour of the gear. To this aim, a numerical model has been accomplished to simulate each loading condition independently. FEM analyses, in specific, have provided meaningful results about the time history of the stress tensors at the tooth root fillet. A comparative study has been included, which shows the rim thickness effect on the dynamic load variation. In addition, this paper warns the reader about the usage of standards for gears with low backup ratio. Keywords: multiaxial fatigue, rim thickness, dynamic overloads, gears 1 INTRODUCTION Nowadays, planetary gearings are massively exploited in the aerospace field thanks to their robustness and to a very good weight/power ratio. However, this field of application is characterized by two antithetical needs: on one hand high velocities and torques, on the other the lightening of the components. These features affect both design and manufacturing process of the aerospace gearings by leading to a very low rim thickness factor. Due to this “non- traditional geometry”, it is straightforward the importance of a deep and accurate study about the fatigue behaviour of the components. One of the main concerns of gear transmission designer is the reduction of the dynamic overloads. The research on gear noise and vibrations has revealed that even if the input torque and speed are constant, significant vibration of the gear masses can exist. Beside the thermal deformations due to friction, indeed, the velocity influences the magnitude of the dynamic loads through the unavoidable errors characterizing the mounting and the manufacturing processes [1]. Therefore, harsh dynamic tooth forces result from the relative vibration of gears as they vibrate in response to an excitation known as “transmission error” [2,3]. Ideally, a gear set would have a uniform velocity ratio between input and output rotation. Contact author: Francesca Curà 1 1 Corso Duca degli Abruzzi, 24 – 10129 Torino (Italy) E-mail: [email protected] Hence, the transmission error can be defined as the departure from the uniform relative angular motion of the pair of actual meshing gears. A further source of vibration is represented by the meshing stiffness variation [4]. Therefore, this present study is aimed to develop a methodology able to account for all the main effects enforcing a multiaxial fatigue state on the gears: in the first section of the paper it has been provided the reader a general overview about the principal fatigue failure criteria. In specific, since it has been talking about aerospace gearings, the research has been limited to the stress-based models, suitable for large class of components that must operate near or below the fatigue threshold [5]. Thus, having chosen the proper tools for the fatigue life assessment, the authors resorted to the FEM analysis in order to investigate the stress state characterizing the tooth root fillets of a reference gear model. By superimposing the mesh load and the centrifugal field it has been possible to rebuild the “static” time evolution of all the stress tensor components over a single revolution period of the gear. Then, the report goes through the core of the research by investigating the extent of the dynamic overloads. After being questioned about the applicability of the standards (AGMA, ISO) [6,7], for the computation of the dynamic factors K v, a FEA approach has been adopted for the dynamic characterization of two gear models with different backup ratio (m b , rim thickness/tooth height). The final section of the present research work clarifies the theory underlying the methodology for the effect superposition and provides a practical example on a thin
Transcript of A STUDY OF FATIGUE IN HIGH SPEED GEARS

ISSN 1590-8844 International Journal of Mechanics and Control, Vol. 14, No. 02, 2013
9
A STUDY OF FATIGUE IN HIGH SPEED GEARS
Francesca Curà* Fabio Gallo* Carlo Rosso*
*Department of Mechanical and Aerospace Engineering, Politecnico di Torino,
Corso Duca degli Abruzzi 24, 10129, Torino
ABSTRACT
This paper presents a study about a multiaxial fatigue approach in high speed gears. Once identified the main effects determining a variable stress state at the tooth root fillet, it has been developed a methodology for the superposition of mesh load, centrifugal field and dynamic behaviour of the gear. To this aim, a numerical model has been accomplished to simulate each loading condition independently. FEM analyses, in specific, have provided meaningful results about the time history of the stress tensors at the tooth root fillet. A comparative study has been included, which shows the rim thickness effect on the dynamic load variation. In addition, this paper warns the reader about the usage of standards for gears with low backup ratio.
Keywords: multiaxial fatigue, rim thickness, dynamic overloads, gears
1 INTRODUCTION
Nowadays, planetary gearings are massively exploited in the aerospace field thanks to their robustness and to a very good weight/power ratio. However, this field of application is characterized by two antithetical needs: on one hand high velocities and torques, on the other the lightening of the components. These features affect both design and manufacturing process of the aerospace gearings by leading to a very low rim thickness factor. Due to this “non-traditional geometry”, it is straightforward the importance of a deep and accurate study about the fatigue behaviour of the components. One of the main concerns of gear transmission designer is the reduction of the dynamic overloads. The research on gear noise and vibrations has revealed that even if the input torque and speed are constant, significant vibration of the gear masses can exist. Beside the thermal deformations due to friction, indeed, the velocity influences the magnitude of the dynamic loads through the unavoidable errors characterizing the mounting and the manufacturing processes [1]. Therefore, harsh dynamic tooth forces result from the relative vibration of gears as they vibrate in response to an excitation known as “transmission error” [2,3]. Ideally, a gear set would have a uniform velocity ratio between input and output rotation.
Contact author: Francesca Curà1 1Corso Duca degli Abruzzi, 24 – 10129 Torino (Italy) E-mail: [email protected]
Hence, the transmission error can be defined as the departure from the uniform relative angular motion of the pair of actual meshing gears. A further source of vibration is represented by the meshing stiffness variation [4]. Therefore, this present study is aimed to develop a methodology able to account for all the main effects enforcing a multiaxial fatigue state on the gears: in the first section of the paper it has been provided the reader a general overview about the principal fatigue failure criteria. In specific, since it has been talking about aerospace gearings, the research has been limited to the stress-based models, suitable for large class of components that must operate near or below the fatigue threshold [5]. Thus, having chosen the proper tools for the fatigue life assessment, the authors resorted to the FEM analysis in order to investigate the stress state characterizing the tooth root fillets of a reference gear model. By superimposing the mesh load and the centrifugal field it has been possible to rebuild the “static” time evolution of all the stress tensor components over a single revolution period of the gear. Then, the report goes through the core of the research by investigating the extent of the dynamic overloads. After being questioned about the applicability of the standards (AGMA, ISO) [6,7], for the computation of the dynamic factors Kv, a FEA approach has been adopted for the dynamic characterization of two gear models with different backup ratio (mb, rim thickness/tooth height). The final section of the present research work clarifies the theory underlying the methodology for the effect superposition and provides a practical example on a thin

ISSN 1590-8844 International Journal of Mechanics and Control, Vol. 14, No. 02, 2013
10
rim gear. This way the reader is allowed to recognize the importance of the dynamics in terms of critical stress magnitude and its localization.
2 FATIGUE FAILURE CRITERIONS
2.1 OVERVIEW In many applications, the mechanical components undergo multiaxial fatigue. This stress state occurs when at least two principal stresses are different from zero. One of the main problems concerning multiaxial fatigue is that each of the principal stresses is characterized by its own time history. Hence, generally speaking, we can distinguish between three different cases: • Simple multiaxial stress states: all the principal stresses
achieve their maximum and minimum values at the same time; In addition, principal directions do not change over time;
• Complex multiaxial stress states: the stress sources operate out of phase with each other, so the principal directions change over time;
• Intermediate case: the stress sources are in phase with each other but the principal directions are not fixed, due to the presence of mean stresses whose principal directions do not coincide with the ones belonging to the alternate components.
The gearboxes are designed so to operate near or below the fatigue threshold. Therefore, what the reader is going to see next is an overview on the main multiaxial fatigue failure criteria developed on the so-called stress-base models [5]. All of them are characterized by the following general form: �⌧ + k� (1) Where �⌧ is the shear stress, � is the normal stress, k is a constant parameter. Hence, the models under investigation will differ in the interpretation of shear and tensile stress terms.
2.2 MANSON-MCKNIGHT The Manson-McKnight criterion [8] is based on Von Mises hypothesis and is aimed to reduce the multiaxial stress state to an equivalent monoaxial stress. Thus, by assuming the following characteristic parameters
(2) ��
i
= �i,max
,+�i,min (3)
�⌧i
= ⌧i,max
,�⌧i,min (4)
�⌧i
= ⌧i,max
,+⌧i,min (5)
it is possible to define the corresponding equations, as representative of the monoaxial mean component �m and the monoaxial alternate �a:
�a
=1
2p2
q(��
x
���y
)2 + (��y
���z
)2 + (��z
���x
)2 + 6(�⌧2xy
+�⌧2xz
+�⌧2yz
) (6) �m
=1
2p2Bq(��
x
� ��y
)2 + (��y
� ��z
)2 + (��z
� ��x
)2 + 6(�⌧2xy
+ �⌧2xz
+ �⌧2yz
) (7)
with B =
P�1 +
P�3P
�1 �P
�3 , where �3 < �2 < �1. As we can notice from the equation (7), the sign and the magnitude of the mean stress are dependent on the factor B, itself related to the principal stresses, �1 and �3, through the following expressions: X
�1 = �1,max
+ �1,min (8) X�3 = �3,max
+ �3,min (9)
2.3 SINES After studying several failure criteria, Sines defined the octahedral shear stress as the critical parameter for the assessment of the fatigue damage and he concluded that the mean hydrostatic stress during a cycle has an effect on fatigue life [9]. In the same way as the octahedral stress represents an “average” shear value for a state of stress, the hydrostatic stress, �h can be considered as representing the average tensile stress in the material. Physically, it is the normal stress on the octahedral shear plane and it is related to the mean bending stress, �b through the following formula: �h =
�b
3 (10)
On the basis of these considerations, the author developed the analytical expression of the model:
1p2
q(�a,1 � �a,2)2 + (�a,3 � �a,2)2 + (�a,1 � �a,3)2 +m(�m,1 + �m,2 + �m,3) �D�1 (11)
Where �a,i is the principal stress amplitude, �m,i is the principal mean stresses, �D�1 is the monoaxial endurance limit, m is a coefficient accounting for the properties of the materials and it can be computed as far as the equation (11) still holds for the particular case of monoaxial loading. Thus, by setting the principal stress amplitudes �a,2, �a,3 and the principal mean stresses �m,2, �m,3 equal to zero , we get: �a,1 +m�m,1 = �D�1 (12) The equation (12) is just the Goodman condition: m =
�D�1
�UTS (13)
where �UTS represents the ultimate tensile strength.
However, octahedral stresses can be obtained from direct computation using the six stress components for any coordinate system. In particular, for a generic non-principal reference frame, the equivalent stress amplitude becomes: �a,eq
=1p2
q(�
a,x
� �a,y
)2 + (�a,z
� �a,y
)2 + (�a,x
� �a,z
)2 + 6(⌧2a,xy
+ ⌧2a,xz
+ ⌧2a,yz
) (14)
ISSN 1590-8844 International Journal of Mechanics and Control, Vol. 14, No. 02, 2013
11
The equivalent mean stress, proportional to the 1st invariant of the mean stress tensor instead, simply turns into:
�m,eq
= �m,x
+ �m,y
+ �m,z (15)
Sines’ formulation has the advantage that is easily solved for complex stress states and only relatively simple tests must be done to determine the constant m. However, the application of Sines’ criterion is limited to proportional loading.
2.4 FINDLEY Findley reviewed much of the same experimental data as Sines, but came to a slightly different model [10]. He suggested that the normal stress, �n, on a shear plane might have a linear influence on the allowable alternating shear
stress, �⌧
2 . Thus, the infinite life condition is represented by the equation (16)
(�⌧
2+ k�n) f
(16)
Where k is a characteristic constant, f is the fatigue limit in fully reversed axial loading. This model differs from Sines’ or Manson-McKnight’s in that it identifies the stress acting on specific planes within the material. These are termed critical planes and they can be defined as one or more planes subject to a maximum value of a characteristic damage parameter. Findley identifies a critical plane for fatigue crack initiation and growth that is dependent on both alternating shear stress and maximum normal stress. The combined action of these stresses is responsible for fatigue damage and failure is expected to occur on the plane where the maximum value of the quantity in parenthesis in equation (16) is detected. Moreover, the constant k is determined experimentally by performing fatigue tests involving two or more stress state. Several examples are shown in Table I. Anyway, for ductile materials, k typically varies between 0.2 and 0.3.
2.5 MCDIARMID McDiarmid proposed a criterion very similar to Findley criterion [11]. What is different is the definition of critical planes. McDiarmid, indeed, defined the critical plane as the plane characterized by the maximum shear amplitude and not the by the maximum damage quantity. Thus, once this plane has been identified, by adding the shear stress
amplitude, �⌧
max
2 , to the normal stress, �max, on the same plane, we end up with the infinite life condition according to McDiarmid:
(�⌧
max
2tA,B
+�n,max
2�UTS
) 1
(17)
where tA,B represents the shear fatigue strength for two type cracking modes. Case A propagates cracks that grow along the free surface, whereas the Case B results in cracks that penetrate into the material and �UTS is the ultimate tensile strength. By comparing this criterion with the one developed by Findley, we notice that the constant k is replaced by the
quantity
�n,max
2�UTS . Thus, only one set of fatigue tests and one
static test are necessary, as compared to the two set of fatigue tests needed to define k. The difference in definition of the critical plane between McDiarmid and Findley is clearly illustrated by the case of
high stress ratio R(=
�min
�max
), in presence of uniaxial
tension. The former criterion always predicts critical planes at ± 45°, whereas the latter foresees critical planes approaching to 0° as R increases toward 1. Table I - Examples of solutions for k based on the ratio of
fatigue strength for two stress states
2.6 DANG VAN
The application of Dang Van’s criterion [12] requires a deep knowledge level about the stress state of the component and this reflects the complexity of the model. For this reason, the present paragraph is limited to the description of the underlying approach. In particular, the author proposed an endurance limit criterion on the concept of microstress within a critical volume of material. This model arises from the observation that fatigue crack nucleation is a local process and begins in grains that have undergone plastic deformations and form characteristic slip bands. In addition, since cracks usually nucleate in intragranular slip bands, it has been hypothesized that the microscopic shear stress on a grain must be an important parameter. In the same way, it has been reasoned that the microscopic hydrostatic stress will influence the opening of these cracks or slip bands. Finally, the simplest failure criterion involving these two variables is the linear combination, as shown in equation (18), where ⌧(t) and �h(t) are respectively the instantaneous microscopic shear stress and the hydrostatic stress, and a and b are constants.
Ratio of Fatigue Strength k
�a,R=�1
⌧a,R=�1 2
1 + kp1+k2
�a,R=0
⌧a,R=�1 1 +
p1 + k2
2k +p1 + (2k)2
�a,R=0.5
⌧a,R=�1 1 +
p1 + k2
4k +p1 + (4k)2

ISSN 1590-8844 International Journal of Mechanics and Control, Vol. 14, No. 02, 2013
12
⌧(t) + a�h(t) = b (18) The microscopic stresses and strains within critical grains are different from the macroscopic stresses and strains commonly computed for fatigue analysis. Therefore, it was necessary to distinguish these two size scales as follows: • Macroscopic scale, characterized by an elementary
volume V(M) surrounding a point where the fatigue analysis is to be performed. This size scale is of the order of a strain gage or FEM element. Macroscopic stresses are denoted
X(M, t) and strains E(M,t). Both
are functions of position within the structure, M, and time, t.
• Microscopic scale, of the order of a grain or other suitable microstructural unit corresponding to a subdivision of V(M). The microscopic stresses �m,t and strains "m,t are related but not equal to macroscopic (at a microscopic scale a material is neither isotropic nor homogeneous).
3 STATIC ANALYSIS
3.1 INTRODUCTION In the present paper, the term static is going to be used for any loading condition not inducing a dynamic response of the component under investigation. Thus, this section has been devoted to the analysis of the stress state induced by mesh and inertial load only. In order to achieve the goal, several FEM analyses have been carried on the gear model presented in the technical report on crack propagation studies by NASA [13].
3.2 BENDING EFFECT
3.2.1 Bending stresses Since the mesh load induces a “local” stress state, it has been thought to extract a 4-teeth sector out of the reference model (Figure 1) to reduce the computational time at the solution stage.
Figure 1 Mesh of the 2D model of the 4-teeth sector.
For our simulations, since the teeth 2 and 3 are the only ones undergoing the bending load (having assumed a clockwise rotation, it has been carried out the teeth numeration as shown in Figure 1), it has been made a mesh refinement in the neighbourhood of their common fillet. By following a tooth during a complete revolution, we can define the segment AB as the portion of the line of contact along which the engagement with the mating tooth takes place. The Figure 2 specifically shows the ideal bending load history for a certain rotation angle.
Figure 2 Ideal bending load history on a tooth, over the
segment of contact AB. Hence, since the tooth experiences the engagement over an arc of revolution, it has been thought to develop a time history of the stresses. To this aim, the engagement has been discretized into meaningful instants corresponding to the transitions of the teeth 2 and 3 on the points A, A’, B’, B of the contact line, and the stresses of some elements at the tooth root fillet have been detected. The Figure 3 shows the qualitative distribution of the stresses, for some characteristic loading conditions.
Figure 3 Engagement of the tooth 3 along the segment of
contact: a) A, b) A’, c) B’, d) B. Beside the graphical representation, it has been possible to quantitatively know the extent of all the components of the stress tensor evaluated in the centroid of the element under investigation. In specific each simulation, representing a
a) b)
c) d)

ISSN 1590-8844 International Journal of Mechanics and Control, Vol. 14, No. 02, 2013
13
precise loading condition, allowed the rebuilding of the stress-time history over the arc of engagement. In particular, the next figure (Figure 4) is going to show the most relevant normal stresses σx for an element belonging to the tooth root fillet.
Figure 4 Bending stress time history of an element: σx.
The stress-time history shown in Figure 4 is qualitatively representative of all the other elements under investigation. This first result, then, seems to confirm what some gearing manuals have reported about the bare static analysis [4]. What the reader can easily observe is that the single contact condition with maximum flexural arm (situation corresponding to the point A’ on the contact line) is the most critical for the element belonging to the tooth root fillet. Also all the other components of the stress tensor, indeed, assume their own maximum values as soon as the tooth 3 takes over the whole bending load. However, the static failure is something really rear to be detected in a gearing system. Another feature clearly visible in Figure 4 is that the element experiences a compression stress state (negative stress values) before the tooth 3 starts to be involved in the engagement. The clockwise rotation, indeed, leads the tooth 2 to carry the load in advance, by inducing pure compression of the fillet of interest for a time instant t<0,2 ms. However, when the tooth 3 enters the first single contact segment (point A of the contact line), the stress state turns into a tensile state. Thus, at the time instant t=0,2 ms, all the time histories of the tensor components are characterized by a sharp jump, up to relevant positive values.
3.3 CENTRIFUGAL EFFECT
3.3.1 Centrifugal stresses As we already said, another feature affecting the stress state at the tooth root fillet is the centrifugal field. The literature about gears extensively talks about the velocity effect on gears as the main source of vibrations. However, the centrifugal forces themselves are proportional to the square
of the spinning speed. Thus, this paragraph will investigate the influence of the centrifugal field on the stress state induced by the mesh load only. Since the centrifugal field involves all the inertias of the gear, it has been decided to develop a 3D mesh for the complete CAD model. Thus, by keeping the reference mesh of the 4-teeth sector unchanged, the centrifugal analysis has been carried out on the whole gear model, with a coarser mesh away from the fillet. Furthermore, since it has been thought of a shrink fit coupling between the gear and the mating shaft, we decided to fix all the translations along X, Y, Z, directions (Cartesian coordinates) of all the nodes belonging to the hub interface. The processing of the above described boundary conditions leads to the following results shown by the Figure 5.
Figure 5 Stress field due to the centrifugal field.
The stresses seem to decrease along the radial direction. This first result agrees with the theory of the rotating disks [14]. In particular, it is possible to detect the most stressed area around the hub interface, since the restraints previously enforced prevent the deformation of the gear in that region. The chromatic distribution highlights a stress concentration in the neighbourhood of the tooth root fillets. This effect can be explained by assuming the teeth as lumped masses, applied on the root circle, that somehow pull the whole structure along the radial direction, in presence of the centrifugal field. Thus, this effect leads to a relevant stress enhancement around the fillets. Then, what is possible to notice is a symmetrical stress distribution with respect to the centreline of the compartment between the teeth. In particular, it is easy to recognize two yellowish areas characterized by the maximum stress concentration factor. The compartment, indeed, is not characterized by a full round fillet rather by two variable radius fillets, where it is possible to detect an important notch effect. However, this detail seems to disappear in the outer fillets of the sector of interest but we have to specify that this is only due to the mesh size in those areas. Anyway, the numerical superposition has been limited to the central fillet of the 4-teeth sector, where the good accuracy of results is assured. Finally, despite what we may have thought, the centrifugal
ISSN 1590-8844 International Journal of Mechanics and Control, Vol. 14, No. 02, 2013
14
stresses have a relevant importance and we cannot ignore them. The high spinning speed of 10000 rpm, indeed, is able to induce equivalent stresses up to the order of 100 MPa. Almost one order of magnitude more than the extent of the most critical stresses induced by the mesh load.
4 MULTIAXIAL FATIGUE
Two different fatigue failure criterions have been selected for the evaluation of the extent and the location of the critical stress state in the mechanical fatigue process. However, before applying a suitable fatigue failure criterion, it has been necessary to work out the numerical values of stresses of each elements of interest. In particular, since the mechanical fatigue is a process over time we had to rebuilt the time histories of the tensor components. The spinning speed of 10000 rpm enables the gear to complete a single revolution in 0,006 s. Each tooth experiences the mesh load only once per revolution. Therefore, setting the instant 0 s as the moment at which the tooth 2 (benchmark) comes into engagement, after 0,006 s the loading history on the elements gets repeated. Therefore, the stress histories that are going to be shown next can be seen as periodical signals with a period equal to the time needed by the gear to carry out one single revolution. The centrifugal field, indeed, induces mean stresses that can be algebraically summed to the step load trend, arisen from the teeth engagement, instant by instant. Thus, these components don’t change the “shape” of the stress history, but they can either shift it downwards (compressive stresses) or upwards (tensile stresses).
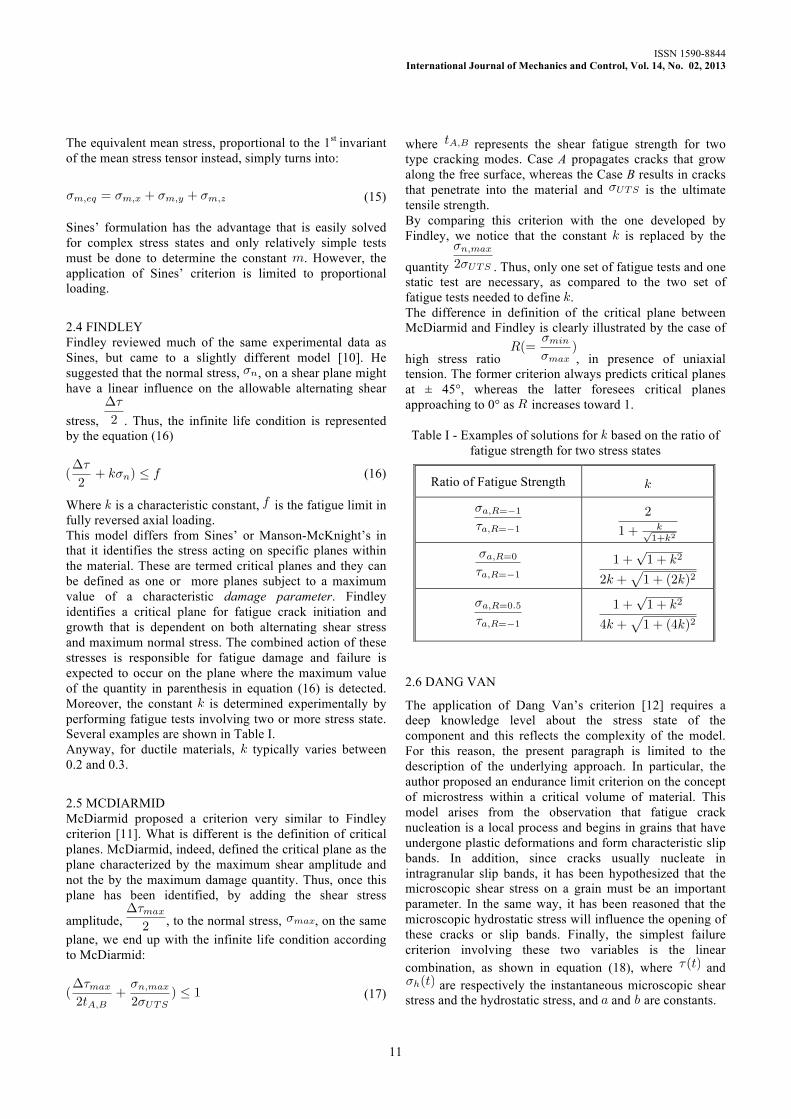
Figure 6 Superposition of bending and centrifugal effect: time history of the tensor component σx, for an analyzed
element, time scale is logarithmic for highlighting the stress values.
In Figure 6 the reader is allowed to appreciate the time history of the stress tensor component σx of an element, over a complete revolution.
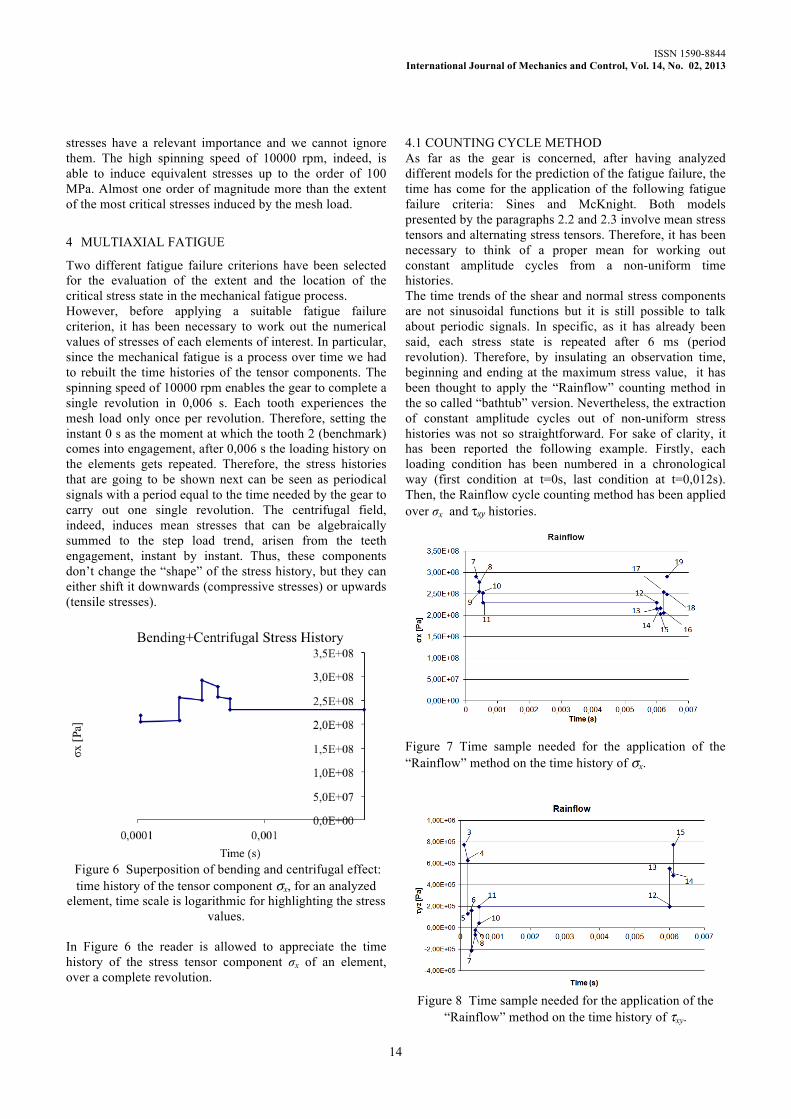
4.1 COUNTING CYCLE METHOD As far as the gear is concerned, after having analyzed different models for the prediction of the fatigue failure, the time has come for the application of the following fatigue failure criteria: Sines and McKnight. Both models presented by the paragraphs 2.2 and 2.3 involve mean stress tensors and alternating stress tensors. Therefore, it has been necessary to think of a proper mean for working out constant amplitude cycles from a non-uniform time histories. The time trends of the shear and normal stress components are not sinusoidal functions but it is still possible to talk about periodic signals. In specific, as it has already been said, each stress state is repeated after 6 ms (period revolution). Therefore, by insulating an observation time, beginning and ending at the maximum stress value, it has been thought to apply the “Rainflow” counting method in the so called “bathtub” version. Nevertheless, the extraction of constant amplitude cycles out of non-uniform stress histories was not so straightforward. For sake of clarity, it has been reported the following example. Firstly, each loading condition has been numbered in a chronological way (first condition at t=0s, last condition at t=0,012s). Then, the Rainflow cycle counting method has been applied over σx and τxy histories.
Figure 7 Time sample needed for the application of the “Rainflow” method on the time history of σx.
Figure 8 Time sample needed for the application of the
“Rainflow” method on the time history of τxy.

ISSN 1590-8844 International Journal of Mechanics and Control, Vol. 14, No. 02, 2013
15
What comes out from the Figures 7 and 8 is the different shape of the two “bathtubs”. Thus, by proceeding with the application of the Rainflow it is possible to extract the following cycles out of the two stress histories (Table II). Table II - Constant amplitude cycles extracted from σx and
τxy history, by means of Rainflow method. Cycle Peak-Valley σx Peak-Valley τxy
1 7-15 3-7
2 17-18 13-14 3 14-13 6-5
The alternating and mean stresses in Sines and Manson-McKnight formulas are to be computed across a couple of stress tensors, identifying two specific loading conditions. However, by comparing the second and the third column of the table II it is possible to notice a mismatch in the number couplings representing the peak and the valley of the characteristic cycles. As a consequence, none of the selected fatigue criteria can be properly applied. Whence, what has been done in order to solve this ambiguity was to reduce the three-dimensional stress state to an equivalent mono-dimensional one. In specific, we developed a different counting methodology through the application of Von Mises criterion [15]. By applying the corresponding formula to any “sampling instant”, the revolution period T is made of, indeed, we were able to rebuild the characteristic time trend of an equivalent stress σeq (Figure 9). Thus, having obtained a unique time history representative of the three dimensional stress state of the element under investigation (over a single revolution of the gear) it has been possible to apply the Rainflow method so by-passing the problem of the non proportional load histories. Finally, each peak valley association (column 1, Table III) were, then, picked to identify the tensor couples needed for the fatigue life prediction. By applying Sines and Manson-McKnight criteria, indeed, it has been possible to compute the mean and the alternating equivalent stresses associated to each of the characteristic cycles (Table III).
Table III - Fatigue criteria application (most stressed element): Sines VS/ Manson-McKnight.
Peak-Valley
�m,eq Sines [Pa]
�a,eq Sines [Pa]
�m,eq Mans.-
Mck [Pa]
�a,eq Mans.-
Mck. [Pa]
7-15 2,93E+08 4,68E+07 2,97E+08 4,68E+07
17-18 2,98E+08 3,10E+06 3,04E+08 3,10E+06
14-13 2,55E+08 4,83E+08 2,58E+08 4,83E+05
4.2 HAIGH DIAGRAM For the safe life approach in gearbox design the manufacturer has to make sure that every component will never be involved in any crack nucleation phenomenon. In order to fulfil this requirement, the equivalent stress
amplitude of the critical cycle has to be lower than the endurance limit. The Haigh Diagram has been used for the fatigue strength assessment of the component. In specific, having assumed AISI9310 as constituting material of the gear, it has been verified that all the points (�m,eq,�a,eq), univocally representing the loading cycles, are included within the triangular region defined by the Goodman’s limit curve. By looking at the Figure 10, it is possible to notice how Manson-Mcknight slightly overestimates the mean equivalent stresses with respect to Sines whereas, as far as the equivalent stress amplitudes are concerned, they basically predict the same values. In addition, none of the constant amplitude cycles is able to induce a fatigue failure. Nevertheless, the Figure 10 refers to a specific element. Thus, in order to verify the infinite life of the component it would be necessary to reiterate the whole procedure for any element at the tooth root fillet. However since the stress history of the element under investigation is qualitatively representative of all the elements of the fillet, it has been enough to identify a critical cycle for all the centroid involved in the analysis. To this aim, the safety factors have been computed, by assuming a proportional increment between the mean stress, �m,eq, and the equivalent stress amplitude �a,eq .
Figure 9 Time history of the equivalent mono-axial stress
state (σeq).
What comes out is that the couple 7-15 is the cycle characterized by the minimum safety factor. So finally, for each element, it has been enough to apply Sines and Manson-McKnight criteria across the tensors 7-15. This way it has been possible to compute the critical values of mean equivalent stress and equivalent stress amplitude to be put in the Haigh Diagram. In specific, for the case being analyzed, the combined effect of the mesh load and the centrifugal field is unable to induce a fatigue failure of the component at the tooth root fillet. In fact, all the critical stresses, experienced by each element, are anyway contained within the triangular safety region of the Haigh Diagram, with a certain safety factor.

ISSN 1590-8844 International Journal of Mechanics and Control, Vol. 14, No. 02, 2013
16
5 DYNAMIC EFFECT
5.1 INTRODUCTION Having analysed the combined effect of the inertial and the mesh load, it is now time to shift our focus on the dynamics of the gear. As it has already been pointed out many times, gear transmissions, throughout their working life, undergo relevant vibrations that cannot be neglected in case of accurate design process. Thus, this paragraph is dedicated to better understand the influence of the dynamic behaviour as a further feature affecting the stress field at the tooth root.
Figure 10 Haigh Diagram: cycle representation through
monoaxial equivalent stresses.
5.2 FREQUENCY RESPONSE FUNCTION The modal analysis in structural mechanics can be described as an useful medium for the dynamic characterization of components. In specific, it allows the analyst to determine the mode shapes and the corresponding frequencies during free vibration. The characteristic parameters affecting the free response of the component are essentially three: • The masses and the moment of the inertias of the
structure • The stiffness of the structure • The boundary conditions in terms of restraints, applied
to the structure. However, the normal modes so computed do not represent the actual response of a system undergoing an external excitation. The FRF solution, instead, allows to map the amplitude of the dynamic response as a function of the exciting frequency. In order to successfully complete this study, it has been necessary to feed a further physical parameter of the gear to the FEM solver: the damping. By the way, it has to be said that the estimation of this additional parameter would require an accurate study of the material behaviour, the lubrication conditions and the friction effect. However, since the research study couldn’t afford experimental tests on physical components, a reasonable damping ratio has been picked from the
literature about gears: ζ equal to 0,01. As the name of the paragraph 5.2 suggests, the output of this analysis will be a function linking a dynamic parameter (i.e. stress displacement, velocity, etc.) on the ordinate axis to the frequency (independent variable measured in Hertz). Thus, during the boundary condition definition it has been necessary to specify an exciting force to be associated to a frequency field. Through a careful bibliographic research [3] it is highlighted how the internal sources of vibration (transmission errors) explicate the system excitement in relation to the meshing frequency of the teeth. Thus, being z1 the number of teeth of the gear and n1 its working spinning speed it is easy to compute the exciting frequency as:
fz =
n1
60z1 (19)
In other words, the gear experiences z1 “shocks” per revolutions and dynamically responds with a frequency equal to the meshing frequency. The reasons underlying the vibration phenomena of gearings have been deeply investigated. However, due to the complexity of the problem, it has been picked an harmonic forcing function with amplitude equal to ½ the force exchanged between the teeth (R=0). In addition, having identified the upper point of the single contact region as critical for the bending load, this exciting force has been distributed over the nodes along the face width. The FRF analysis involves the frequency domain. For the specific case, the exciting frequency has been swept over the range 100 Hz-5000Hz and the Von Mises equivalent stress function has been computed as an indirect measure of the dynamic response of the gear.
Figure 11 Frequency Response Function: Von Mises
stresses for the elements representative of the tooth root fillet.
Therefore, in the Figure 11 the reader can appreciate the frequency response functions concerning some of elements belonging to the fillet. What is pretty clear is that all the stresses, steadily increase as the exciting frequency grows. Nevertheless, no relevant peak resembling somehow a
ISSN 1590-8844 International Journal of Mechanics and Control, Vol. 14, No. 02, 2013
17
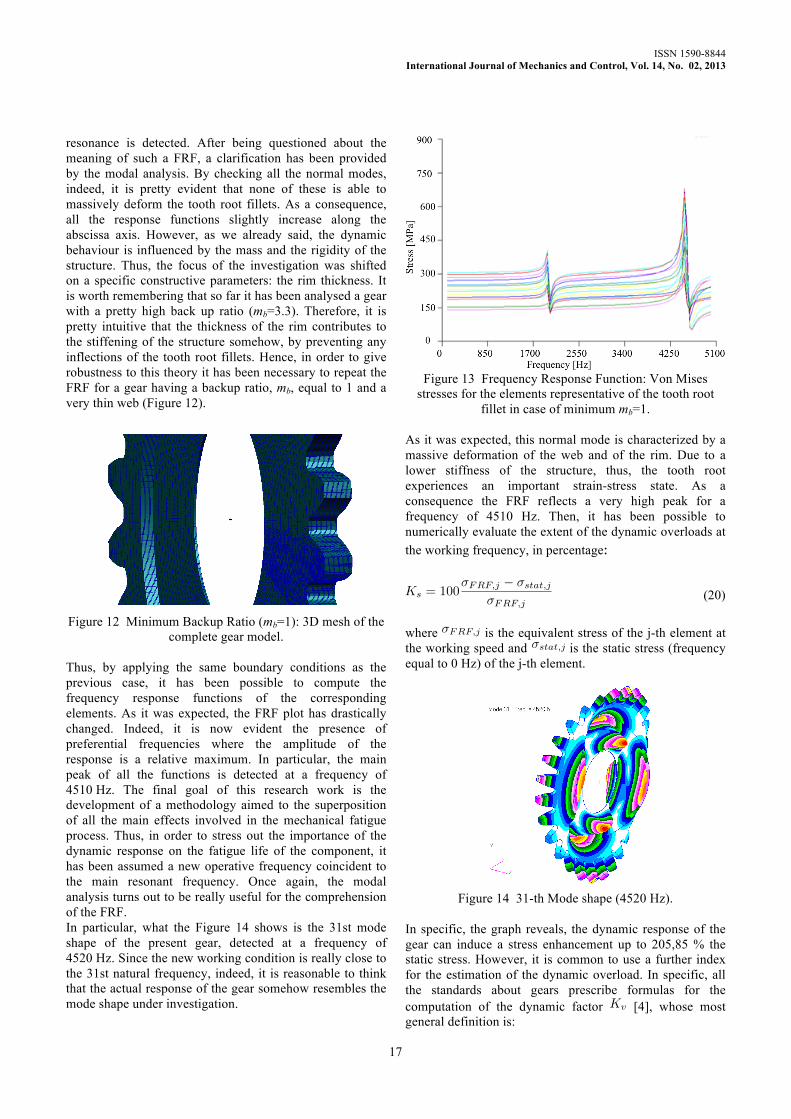
resonance is detected. After being questioned about the meaning of such a FRF, a clarification has been provided by the modal analysis. By checking all the normal modes, indeed, it is pretty evident that none of these is able to massively deform the tooth root fillets. As a consequence, all the response functions slightly increase along the abscissa axis. However, as we already said, the dynamic behaviour is influenced by the mass and the rigidity of the structure. Thus, the focus of the investigation was shifted on a specific constructive parameters: the rim thickness. It is worth remembering that so far it has been analysed a gear with a pretty high back up ratio (mb=3.3). Therefore, it is pretty intuitive that the thickness of the rim contributes to the stiffening of the structure somehow, by preventing any inflections of the tooth root fillets. Hence, in order to give robustness to this theory it has been necessary to repeat the FRF for a gear having a backup ratio, mb, equal to 1 and a very thin web (Figure 12).
Figure 12 Minimum Backup Ratio (mb=1): 3D mesh of the
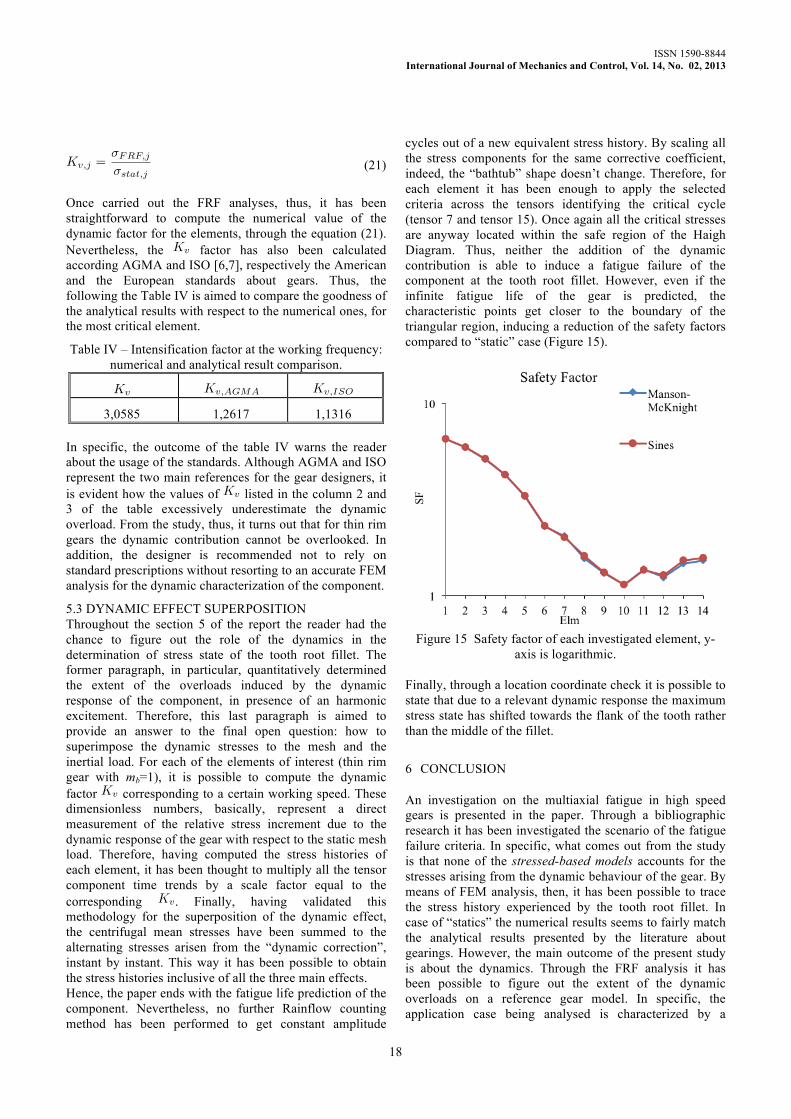
complete gear model. Thus, by applying the same boundary conditions as the previous case, it has been possible to compute the frequency response functions of the corresponding elements. As it was expected, the FRF plot has drastically changed. Indeed, it is now evident the presence of preferential frequencies where the amplitude of the response is a relative maximum. In particular, the main peak of all the functions is detected at a frequency of 4510 Hz. The final goal of this research work is the development of a methodology aimed to the superposition of all the main effects involved in the mechanical fatigue process. Thus, in order to stress out the importance of the dynamic response on the fatigue life of the component, it has been assumed a new operative frequency coincident to the main resonant frequency. Once again, the modal analysis turns out to be really useful for the comprehension of the FRF. In particular, what the Figure 14 shows is the 31st mode shape of the present gear, detected at a frequency of 4520 Hz. Since the new working condition is really close to the 31st natural frequency, indeed, it is reasonable to think that the actual response of the gear somehow resembles the mode shape under investigation.
Figure 13 Frequency Response Function: Von Mises
stresses for the elements representative of the tooth root fillet in case of minimum mb=1.
As it was expected, this normal mode is characterized by a massive deformation of the web and of the rim. Due to a lower stiffness of the structure, thus, the tooth root experiences an important strain-stress state. As a consequence the FRF reflects a very high peak for a frequency of 4510 Hz. Then, it has been possible to numerically evaluate the extent of the dynamic overloads at the working frequency, in percentage: Ks = 100
�FRF,j � �stat,j
�FRF,j (20)
where �FRF,j is the equivalent stress of the j-th element at the working speed and �stat,j is the static stress (frequency equal to 0 Hz) of the j-th element.
Figure 14 31-th Mode shape (4520 Hz).
In specific, the graph reveals, the dynamic response of the gear can induce a stress enhancement up to 205,85 % the static stress. However, it is common to use a further index for the estimation of the dynamic overload. In specific, all the standards about gears prescribe formulas for the computation of the dynamic factor Kv [4], whose most general definition is:
ISSN 1590-8844 International Journal of Mechanics and Control, Vol. 14, No. 02, 2013
18
Kv,j =
�FRF,j
�stat,j (21)
Once carried out the FRF analyses, thus, it has been straightforward to compute the numerical value of the dynamic factor for the elements, through the equation (21). Nevertheless, the Kv factor has also been calculated according AGMA and ISO [6,7], respectively the American and the European standards about gears. Thus, the following the Table IV is aimed to compare the goodness of the analytical results with respect to the numerical ones, for the most critical element.
Table IV – Intensification factor at the working frequency: numerical and analytical result comparison.
Kv
Kv,AGMA
Kv,ISO 3,0585 1,2617 1,1316
In specific, the outcome of the table IV warns the reader about the usage of the standards. Although AGMA and ISO represent the two main references for the gear designers, it is evident how the values of Kv listed in the column 2 and 3 of the table excessively underestimate the dynamic overload. From the study, thus, it turns out that for thin rim gears the dynamic contribution cannot be overlooked. In addition, the designer is recommended not to rely on standard prescriptions without resorting to an accurate FEM analysis for the dynamic characterization of the component.
5.3 DYNAMIC EFFECT SUPERPOSITION Throughout the section 5 of the report the reader had the chance to figure out the role of the dynamics in the determination of stress state of the tooth root fillet. The former paragraph, in particular, quantitatively determined the extent of the overloads induced by the dynamic response of the component, in presence of an harmonic excitement. Therefore, this last paragraph is aimed to provide an answer to the final open question: how to superimpose the dynamic stresses to the mesh and the inertial load. For each of the elements of interest (thin rim gear with mb=1), it is possible to compute the dynamic factor Kv corresponding to a certain working speed. These dimensionless numbers, basically, represent a direct measurement of the relative stress increment due to the dynamic response of the gear with respect to the static mesh load. Therefore, having computed the stress histories of each element, it has been thought to multiply all the tensor component time trends by a scale factor equal to the corresponding Kv. Finally, having validated this methodology for the superposition of the dynamic effect, the centrifugal mean stresses have been summed to the alternating stresses arisen from the “dynamic correction”, instant by instant. This way it has been possible to obtain the stress histories inclusive of all the three main effects. Hence, the paper ends with the fatigue life prediction of the component. Nevertheless, no further Rainflow counting method has been performed to get constant amplitude
cycles out of a new equivalent stress history. By scaling all the stress components for the same corrective coefficient, indeed, the “bathtub” shape doesn’t change. Therefore, for each element it has been enough to apply the selected criteria across the tensors identifying the critical cycle (tensor 7 and tensor 15). Once again all the critical stresses are anyway located within the safe region of the Haigh Diagram. Thus, neither the addition of the dynamic contribution is able to induce a fatigue failure of the component at the tooth root fillet. However, even if the infinite fatigue life of the gear is predicted, the characteristic points get closer to the boundary of the triangular region, inducing a reduction of the safety factors compared to “static” case (Figure 15).
Figure 15 Safety factor of each investigated element, y-
axis is logarithmic. Finally, through a location coordinate check it is possible to state that due to a relevant dynamic response the maximum stress state has shifted towards the flank of the tooth rather than the middle of the fillet.
6 CONCLUSION
An investigation on the multiaxial fatigue in high speed gears is presented in the paper. Through a bibliographic research it has been investigated the scenario of the fatigue failure criteria. In specific, what comes out from the study is that none of the stressed-based models accounts for the stresses arising from the dynamic behaviour of the gear. By means of FEM analysis, then, it has been possible to trace the stress history experienced by the tooth root fillet. In case of “statics” the numerical results seems to fairly match the analytical results presented by the literature about gearings. However, the main outcome of the present study is about the dynamics. Through the FRF analysis it has been possible to figure out the extent of the dynamic overloads on a reference gear model. In specific, the application case being analysed is characterized by a

ISSN 1590-8844 International Journal of Mechanics and Control, Vol. 14, No. 02, 2013
19
maximum Kv factor of 3,0585. However, the paper warns the reader about the usage of the international standards of gears. In presence of thin rim (low backup ratio), indeed, AGMA and ISO excessively underestimate the dynamic overloads. Therefore, by exploiting the results of the FEM, the numerical values of Kv factors have been exploited as multiplying coefficients of the static stress histories. This way, it has been possible to apply two selected fatigue criteria on a stress scenario (in the time domain) already inclusive of all the three main effects: bending, centrifugal and dynamic.
NOMENCLATURE
Symbol Description
mb Backup ratio
�⌧ Shear stress amplitude
� Normal stress
k Material constant
R Stress ratio
�i,max Maximum normal stress
�i,min Minimum normal stress
⌧i,max Maximum shear stress
⌧i,min Minimum shear stress
�a Alternating normal stress
�m Mean normal stress
�1,�2,�3 Principal stresses
�m,eq Mean equivalent stress
�a,eq Alternating equivalent stress
f Fatigue limit in axial loading (R=-1)
�D�1 Fatigue limit in bending loading (R=-1)
�UTS Ultimate tensile stress
V(M) Elementary volume X
(M, t) Macroscopic stress
E(M,t) Macroscopic strain
�m,t Microscopic stress
"m,t Microscopic stress
t Time
T Revolution period
�eq Equivalent stress
ζ Damping ratio
fz Meshing frequency
n1 Spinning speed
z1 Number of teeth
Ks Percentage of load increment
�FRF,j FRF stress output
�stat,j Static stress
Kv Maximum dynamic factor
Kv,AGMA Dynamic factor according AGMA
Kv,ISO Dynamic factor according ISO
REFERENCES
[1] Buckingham E., Dynamic loads on Gear Teeth, Machinery, pp. 117-121, 1958.
[2] Timoshenko S. and Baud R. V., Strength of Gear Teeth, Mechanical Engineering, Vol. 48, p. 1105, 1926
[3] Baud V. and Peterson R. E., Load and Stress Cycles in Gear Teeth, Mechanical Engineering, Vol. 51, No. 9, p. 653.
[4] Niemann G., Winter H., Elementi di Macchine. vol. 2, Studio M&B, 1986.
[5] Socie D. F., Marquis G. B., Multiaxial Fatigue. Society of Automotive Engineers Inc, 1999.
[6] International Standard ANSI/AGMA 2001-C95. [7] International Standard ISO 6336-3. [8] Filippini M., Folletti S., Criteri Multiassiali e
Nucleazione di Fratture per Fatica in Materiali per l’Impiego ad Elevata Temperatura, Congress IGF19, Milano, July 2-4, 2007.
[9] Sines G., Failure of materials under combined repeated stresses with superimposed static stress, National Advisory Committee for Aeronautics (N.A.C.A), Technical Note 3495, Washington, 1955.
[10] Findley W. N., A theory for the effect of mean stress on fatigue of metals under combined torsion and axial load or bending. J Eng Ind, Trans ASME, Vol. 81, pp. 301-6, 1959.
[11] McDiarmid D. L., Fatigue under out-of-phase bending and torsion. Fatigue Eng Mater Struct, Vol. 9, No. 6, pp. 457-75, 1987.
[12] Dang Van K., Griveau B., Griveau O., On a multiaxial fatigue criterion. Theory and application, Rapport SKF, R.E. 1123.
[13] Lewicki D., Crack Propagation Studies to Determine Benign or Catastrophic Failure Modes for Aerospace Thin-Rim Gears, NASA Technical Memorandum 107170, U.S. Army Research Laboratory Technical Report ARL-TR 971, pp. 1-182, 1996.
[14] Roccati G., Elementi Costruttivi delle Macchine. CeTeM, Politecnico di Torino, 2004.
[15] Meggiolaro M.A., Pinho de Castro J.T., An improve multiaxial rainflow algorithm for non-proportional stress or strain histories-Part II: The modified Wang-Brown method, International Journal of Fatigue, pp. 194-206, 2012