A Study of Aerosol Properties over Lahore (Pakistan) by Using AERONET Data
10
Asia-Pac. J. Atmos. Sci., 50(2), 153-162, 2014 DOI:10.1007/s13143-014-0004-y A Study of Aerosol Properties over Lahore (Pakistan) by Using AERONET Data Muhammad Ali, Salman Tariq, Khalid Mahmood, Asim Daud, Adila Batool, and Zia-ul-Haq Department of Space Science, University of the Punjab, New Campus, Lahore, Pakistan (Manuscript received 1 March 2013; accepted 24 July 2013) © The Korean Meteorological Society and Springer 2014 Abstract: It is well established that aerosols affect the climate in a variety of ways. In order to understand these effects, we require an insight into the properties of aerosols. In this paper we present a study of aerosol properties such as aerosol optical depth (AOD), single scattering albedo (SSA) and aerosol radiative forcing (ARF) over mega city of Lahore (Pakistan). The data from Aerosol Robotic Net- work (AERONET) have been used for the period December 2009 to October 2011. The seasonal average values of AOD, asymmetry parameter (ASY) and volume size distribution in coarse mode were observed to be highest in summer. On the other hand, the average values of Angstrom exponent (AE) and imaginary part of refractive index (RI) were found to be maximum in winter. The average value of real part of RI was found to be higher in spring than in all other seasons. The SSA exhibited an increasing trend with wavelength in the range 440 nm - 1020 nm in spring, summer and fall indicating the dominance of coarse particles (usually dust). However, a decreasing trend was found in winter in the range 675 nm - 1020 nm pointing towards the dominance of biomass and urban/industrial aerosols. As far as aerosol radiative forcing (ARF) is concerned, we have found that during the spring season ARF was lowest at the surface of Earth and highest at top of the atmosphere (TOA). This indicates that the atmosphere was warmer in spring than in all the remaining seasons. Key words: AERONET, aerosol properties, Lahore 1. Introduction Considerable uncertainties exist in the prediction of global climate change due to highly variable spatio-temporal distribu- tion and poor understanding of optical properties of atmospheric aerosols (IPCC, 2001). Therefore, effects of aerosols on climate can be better understood if the spatial as well as temporal distribution and optical properties of aerosols are accurately known. Aerosols interact directly by scattering and absorbing solar radiation whereas indirect effects refer to the influence of aerosols on cloud processes. Atmospheric aerosols influence the radiation budget and affect the hydrological cycle (Twomey, 1977; Coakley et al., 1983; Charlson et al., 1992; Rosenfeld and Lensky, 1998; Ramanathan et al., 2001a; Lohmann and Feichter, 2005). Satellite remote sensing (SRS) has the cap- ability to measure extremely variable aerosol fields on global scales for longer periods (IPCC, 1995). However, the surface reflectance of Earth causes the measurement of aerosol con- tribution to have low accuracy (Kaufman et al., 1997; King et al., 1999). Even though the results obtained from satellite observation of aerosols have been improved by the use of more sophisticated instruments, the discrepancies between various satellite products indicate that inaccuracies still exist in SRS techniques (Zhao et al., 2005). Therefore, a precise and com- prehensive study of the optical properties and other charac- teristics of aerosols is not possible only with the available satellite data. In contrast, the ground based aerosol remote sen- sing, though does not provide global coverage, yields authentic, detailed and continuous information about aerosol properties (Dubovik et al., 2002a). The Aerosol Robotic Network (AERONET), which is a ground based sun and sky scanning automated radiometer, measures various properties of atmos- pheric aerosols (Holben et al., 1998). Rapid increase in population and urban sprawl has led to appreciable increase in aerosol loading over Pakistan. Owing to large anthropogenic emissions, the densely populated areas of Pakistan experience pollution with high amounts of particu- late matter. Very few analyses have been conducted over Pakistan to investigate optical properties of aerosols using remote sensing techniques (e.g., Alam et al., 2010, 2011a, b, 2012). At present, there exists only one study on Lahore using AERONET data conducted by Alam et al. (2012) in which aerosol optical and radiative properties have been discussed during only summer and winter seasons of 2010-11. These authors have studied the aerosol optical and radiative pro- perties by analyzing the measurements (level 1.5) for only six months (April-June, 2010 and December 2010 to February 2011). However, in terms of climatic studies, we need an im- proved understanding of aerosol properties and radiative forcing based on long-term observations that should include variations in all the four seasons (Yu et al., 2011). The main objective of the present work is to study the aerosol properties by analyzing the AERONET measurements over mega city of Lahore for a relatively longer period (~2 years) by considering variations in all the four seasons. In this study we have used all the available AERONET data (level 2.0) for the period December 2009 to October 2011 to analyze the aerosol optical depth (AOD), Angstrom exponent (440/870) (AE), volume size distribution, single scattering albedo (SSA), real and imaginary parts of refractive index (RI), asymmetry parameter (ASY) and aerosol radiative forcing (ARF). We have also compared the AERONET data with satellite based Corresponding Author: Salman Tariq, Department of Space Science, University of the Punjab, New Campus, 54590 Lahore, Pakistan. E-mail: [email protected]
Transcript of A Study of Aerosol Properties over Lahore (Pakistan) by Using AERONET Data
Asia-Pac. J. Atmos. Sci., 50(2), 153-162, 2014
DOI:10.1007/s13143-014-0004-y
A Study of Aerosol Properties over Lahore (Pakistan) by Using AERONET Data
Muhammad Ali, Salman Tariq, Khalid Mahmood, Asim Daud, Adila Batool, and Zia-ul-Haq
Department of Space Science, University of the Punjab, New Campus, Lahore, Pakistan
(Manuscript received 1 March 2013; accepted 24 July 2013)© The Korean Meteorological Society and Springer 2014
Abstract: It is well established that aerosols affect the climate in a
variety of ways. In order to understand these effects, we require an
insight into the properties of aerosols. In this paper we present a study
of aerosol properties such as aerosol optical depth (AOD), single
scattering albedo (SSA) and aerosol radiative forcing (ARF) over
mega city of Lahore (Pakistan). The data from Aerosol Robotic Net-
work (AERONET) have been used for the period December 2009 to
October 2011. The seasonal average values of AOD, asymmetry
parameter (ASY) and volume size distribution in coarse mode were
observed to be highest in summer. On the other hand, the average
values of Angstrom exponent (AE) and imaginary part of refractive
index (RI) were found to be maximum in winter. The average value
of real part of RI was found to be higher in spring than in all other
seasons. The SSA exhibited an increasing trend with wavelength in
the range 440 nm - 1020 nm in spring, summer and fall indicating the
dominance of coarse particles (usually dust). However, a decreasing
trend was found in winter in the range 675 nm - 1020 nm pointing
towards the dominance of biomass and urban/industrial aerosols. As
far as aerosol radiative forcing (ARF) is concerned, we have found
that during the spring season ARF was lowest at the surface of Earth
and highest at top of the atmosphere (TOA). This indicates that the
atmosphere was warmer in spring than in all the remaining seasons.
Key words: AERONET, aerosol properties, Lahore
1. Introduction
Considerable uncertainties exist in the prediction of global
climate change due to highly variable spatio-temporal distribu-
tion and poor understanding of optical properties of atmospheric
aerosols (IPCC, 2001). Therefore, effects of aerosols on climate
can be better understood if the spatial as well as temporal
distribution and optical properties of aerosols are accurately
known. Aerosols interact directly by scattering and absorbing
solar radiation whereas indirect effects refer to the influence of
aerosols on cloud processes. Atmospheric aerosols influence
the radiation budget and affect the hydrological cycle (Twomey,
1977; Coakley et al., 1983; Charlson et al., 1992; Rosenfeld
and Lensky, 1998; Ramanathan et al., 2001a; Lohmann and
Feichter, 2005). Satellite remote sensing (SRS) has the cap-
ability to measure extremely variable aerosol fields on global
scales for longer periods (IPCC, 1995). However, the surface
reflectance of Earth causes the measurement of aerosol con-
tribution to have low accuracy (Kaufman et al., 1997; King et
al., 1999). Even though the results obtained from satellite
observation of aerosols have been improved by the use of more
sophisticated instruments, the discrepancies between various
satellite products indicate that inaccuracies still exist in SRS
techniques (Zhao et al., 2005). Therefore, a precise and com-
prehensive study of the optical properties and other charac-
teristics of aerosols is not possible only with the available
satellite data. In contrast, the ground based aerosol remote sen-
sing, though does not provide global coverage, yields authentic,
detailed and continuous information about aerosol properties
(Dubovik et al., 2002a). The Aerosol Robotic Network
(AERONET), which is a ground based sun and sky scanning
automated radiometer, measures various properties of atmos-
pheric aerosols (Holben et al., 1998).
Rapid increase in population and urban sprawl has led to
appreciable increase in aerosol loading over Pakistan. Owing
to large anthropogenic emissions, the densely populated areas
of Pakistan experience pollution with high amounts of particu-
late matter. Very few analyses have been conducted over
Pakistan to investigate optical properties of aerosols using
remote sensing techniques (e.g., Alam et al., 2010, 2011a, b,
2012). At present, there exists only one study on Lahore using
AERONET data conducted by Alam et al. (2012) in which
aerosol optical and radiative properties have been discussed
during only summer and winter seasons of 2010-11. These
authors have studied the aerosol optical and radiative pro-
perties by analyzing the measurements (level 1.5) for only six
months (April-June, 2010 and December 2010 to February
2011). However, in terms of climatic studies, we need an im-
proved understanding of aerosol properties and radiative forcing
based on long-term observations that should include variations
in all the four seasons (Yu et al., 2011).
The main objective of the present work is to study the aerosol
properties by analyzing the AERONET measurements over
mega city of Lahore for a relatively longer period (~2 years)
by considering variations in all the four seasons. In this study
we have used all the available AERONET data (level 2.0) for
the period December 2009 to October 2011 to analyze the
aerosol optical depth (AOD), Angstrom exponent (440/870)
(AE), volume size distribution, single scattering albedo (SSA),
real and imaginary parts of refractive index (RI), asymmetry
parameter (ASY) and aerosol radiative forcing (ARF). We
have also compared the AERONET data with satellite based
Corresponding Author: Salman Tariq, Department of Space Science,University of the Punjab, New Campus, 54590 Lahore, Pakistan.E-mail: [email protected]
154 ASIA-PACIFIC JOURNAL OF ATMOSPHERIC SCIENCES
measurements over Lahore, a location in the central region of
Pakistan.
2. Site and instrumentation
a. Site description
Pakistan is situated in South Asia having an area of about
796,100 sq. km. It shares its borders with India to the east,
Afghanistan and Iran to the west and People’s Republic of
China to the far northeast. The southern part of the country is
bounded by a coastline of about 1046 km along the Arabian
Sea and gulf of Oman. Geographically, Pakistan is divided into
three main areas: the northern highlands, the Indus river plain
and the Baluchistan plateau. Pakistan is a sub-tropical and
semi-arid country with a mid-summer monsoon from July to
September. This region has a unique weather on account of
monsoon and associated winds that reverse direction seasonally
(Satheesh and Moorthy, 2005).
Lahore (31o 32'N; 74o 22'E) is the capital of province of
Punjab and the second largest city of Pakistan with a popu-
lation of almost 10 million. It lies in the central region of the
Punjab province, which is the most thickly populated area in
Pakistan. It is situated along the river Ravi and covers an area
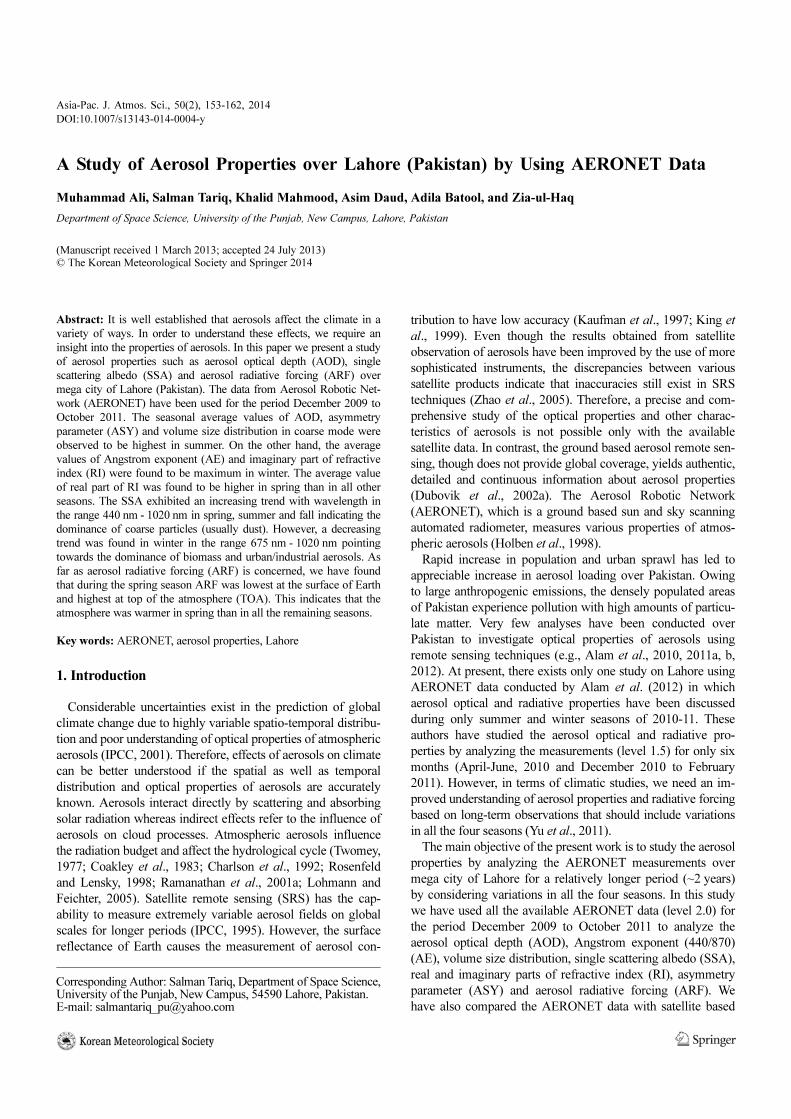
of about 2000 square kilometers (see Fig. 1). The major in-
dustries in and around Lahore include iron, chemicals, textile,
thermal power plants and automobiles. The main sources of air
pollution include automobile emissions, road dust and biomass
burning (Biswas et al., 2008; Alam et al., 2012). Out of the
four provinces, Punjab has about 26 percent of total area, yet
contains more than 50% of the total population and produces
more than 65% of the country’s food grain. The neighboring
Indian state of Punjab also produces two thirds of the India’s
total food grain and is often referred to as the country’s “bread
basket” (Sharma et al., 2010). In short, Lahore is surrounded
by a fertile land, both in Pakistan and across the border in
India, famous for producing wheat and rice.
b. Weather characteristics of the study area
The climate of Lahore can be classified as a semi arid
climate with rainy, long and very hot summers and usually dry
and cool winters. During the months of May, June and July the
weather of Lahore is extremely hot and it receives dust storms
followed by rainfall events. The monsoon starts with heavy
rainfall from late June to early September. The highest maxi-
mum temperature recorded so far is 48oC (in June) while the
lowest temperature recorded is −2oC (in January). The weather
of Lahore is very hot during the months of May, June and July,
when the average highest temperature is 41oC, while during
the months of December and January the average lowest tem-
perature is 5oC. The average seasonal temperature is minimum
during winter (13.8oC), while it is maximum in summer
(31.3oC). For spring and fall, we have moderate temperatures.
It has an annual rainfall of 489 mm with heavy rainfall occurring
during the monsoon season i.e., from late June to September.
Mean annual relative humidity is 37.9% and on monthly basis,
it ranges from 20% in May to 58% in August. Keeping in view
the existing meteorological conditions at Lahore, four dominant
seasons have been defined according to the following months:
Fig. 1. Map of Lahore showing the AERONET site, major roads and its location in Pakistan.
28 February 2014 Muhammad Ali et al. 155
winter (December to February), spring (March to May), sum-
mer (June to August), fall (September to November). The
seasonal characteristics of Lahore weather for the study period
have been summarized in Table 1, except for the dust storm
frequency that has been deduced from available data of 60
years (1951-2010). The atmospheric pressure is minimum in
summer (1000.3 hPa) with maximum rainfall (176.3 mm) occur-
ring during this season. The dust storm frequency is highest in
summer (48.3%), while during winters it is negligibly small
(1.5%).
c. Instrumentation
AERONET instrument provides the spectral data of direct
sun and sky radiances within spectral ranges of 340 nm -
1020 nm and 440 nm - 1020 nm respectively (Holben et al.,
1998). The particle size distribution, SSA, and RI have been
acquired from sky radiance measurements (Dubovik and King,
2000). The details of AERONET instrument and data regis-
tration have been given by Holben et al. (1998), while a brief
description can be found in Eck et al. (2003). The AERONET
data are available at three levels i.e., level 1.0 which is un-
screened, level 1.5 which is cloud screened and level 2.0
which is quality assured (Holben et al., 1998; Smirnov et al.,
2000). In the present study quality assured data (level 2.0)
have been used from both direct sun (AOD and AE) and
inversion products (SSA, ASY, RI), for the period December
2009 - October 2011.
3. Results
a. Aerosol optical depth, Angstrom exponent and water vapor
content
The aerosol optical depth (AOD) is the most important
variable to remotely estimate the atmospheric aerosol loading
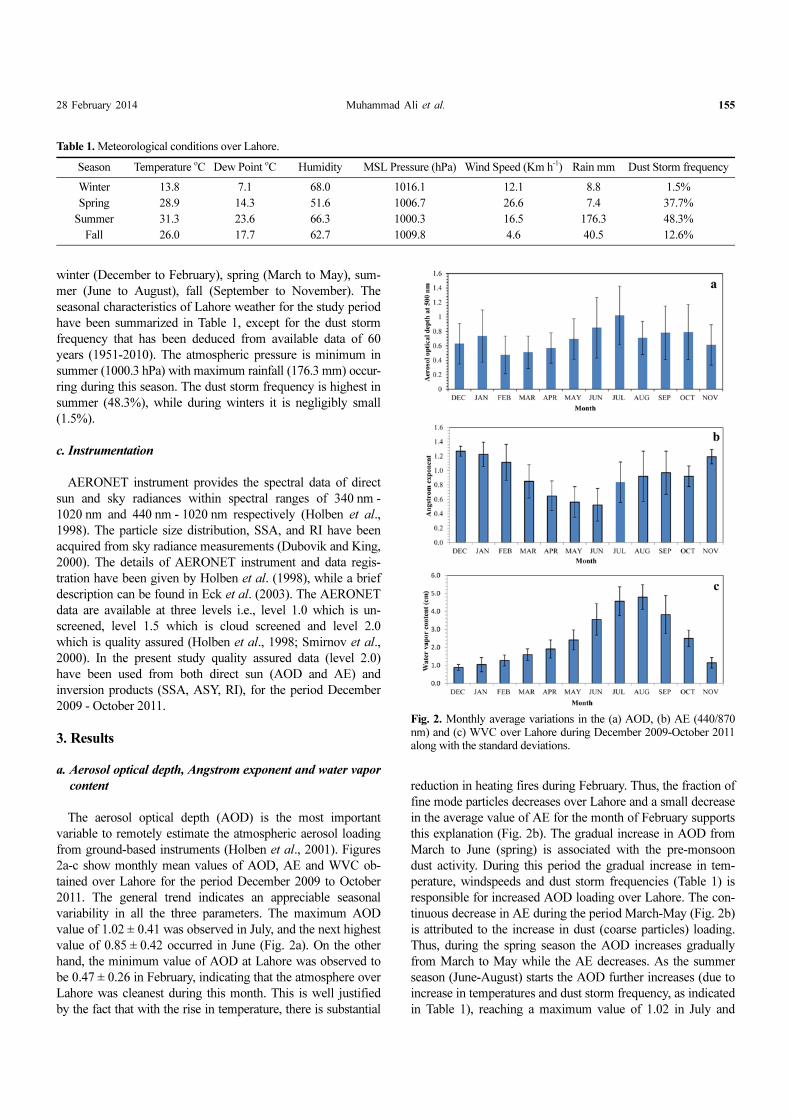
from ground-based instruments (Holben et al., 2001). Figures
2a-c show monthly mean values of AOD, AE and WVC ob-
tained over Lahore for the period December 2009 to October
2011. The general trend indicates an appreciable seasonal
variability in all the three parameters. The maximum AOD
value of 1.02 ± 0.41 was observed in July, and the next highest
value of 0.85 ± 0.42 occurred in June (Fig. 2a). On the other
hand, the minimum value of AOD at Lahore was observed to
be 0.47 ± 0.26 in February, indicating that the atmosphere over
Lahore was cleanest during this month. This is well justified
by the fact that with the rise in temperature, there is substantial
reduction in heating fires during February. Thus, the fraction of
fine mode particles decreases over Lahore and a small decrease
in the average value of AE for the month of February supports
this explanation (Fig. 2b). The gradual increase in AOD from
March to June (spring) is associated with the pre-monsoon
dust activity. During this period the gradual increase in tem-
perature, windspeeds and dust storm frequencies (Table 1) is
responsible for increased AOD loading over Lahore. The con-
tinuous decrease in AE during the period March-May (Fig. 2b)
is attributed to the increase in dust (coarse particles) loading.
Thus, during the spring season the AOD increases gradually
from March to May while the AE decreases. As the summer
season (June-August) starts the AOD further increases (due to
increase in temperatures and dust storm frequency, as indicated
in Table 1), reaching a maximum value of 1.02 in July and
Table 1. Meteorological conditions over Lahore.
Season Temperature oC Dew Point
oC Humidity MSL Pressure (hPa) Wind Speed (Km h
-1) Rain mm Dust Storm frequency
Winter 13.8 7.1 68.0 1016.1 12.1 8.8 1.5%
Spring 28.9 14.3 51.6 1006.7 26.6 7.4 37.7%
Summer 31.3 23.6 66.3 1000.3 16.5 176.3 48.3%
Fall 26.0 17.7 62.7 1009.8 4.6 40.5 12.6%
Fig. 2. Monthly average variations in the (a) AOD, (b) AE (440/870nm) and (c) WVC over Lahore during December 2009-October 2011along with the standard deviations.
156 ASIA-PACIFIC JOURNAL OF ATMOSPHERIC SCIENCES
then decrease to 0.71 in August. This abrupt decrease in the
mean AOD values in August is due to washout process by
rainfall events in the monsoon. A similar trend was observed by
Alam et al. (2010, 2011a) using MODIS data, while studying
seasonal variations in AOD for many selected cities of Pakistan
including Lahore. However, our results do not agree with those
of Alam et al. (2012) who obtained highest AOD over Lahore
in December (0.76 ± 0.35). This discrepancy has occurred
probably because, in their analysis, Alam et al. (2012) have
used the level 1.5 data for only six months and the data of July
2010, in which we obtained the maximum values of AOD, was
not included in their study period. In their previous analyses
over Pakistan using MODIS data for the periods 2001 - 2006
(Alam et al., 2010) and 2002 - 2008 (Alam et al., 2011b), it
was found that among all the cities studied, including Lahore,
the highest mean values of AOD were obtained during the
season of summer. Prasad et al. (2007), while investigating the
variations in aerosol loadings over Indo-gangatic plain, also
reported higher AOD values in summer than in all other
seasons. In recent studies of Eck et al. (2010) and Wang et al.
(2011) over another Asian site (Beijing, China) AERONET
AOD measurements were found to be maximum during sum-
mer and minimum during winter.
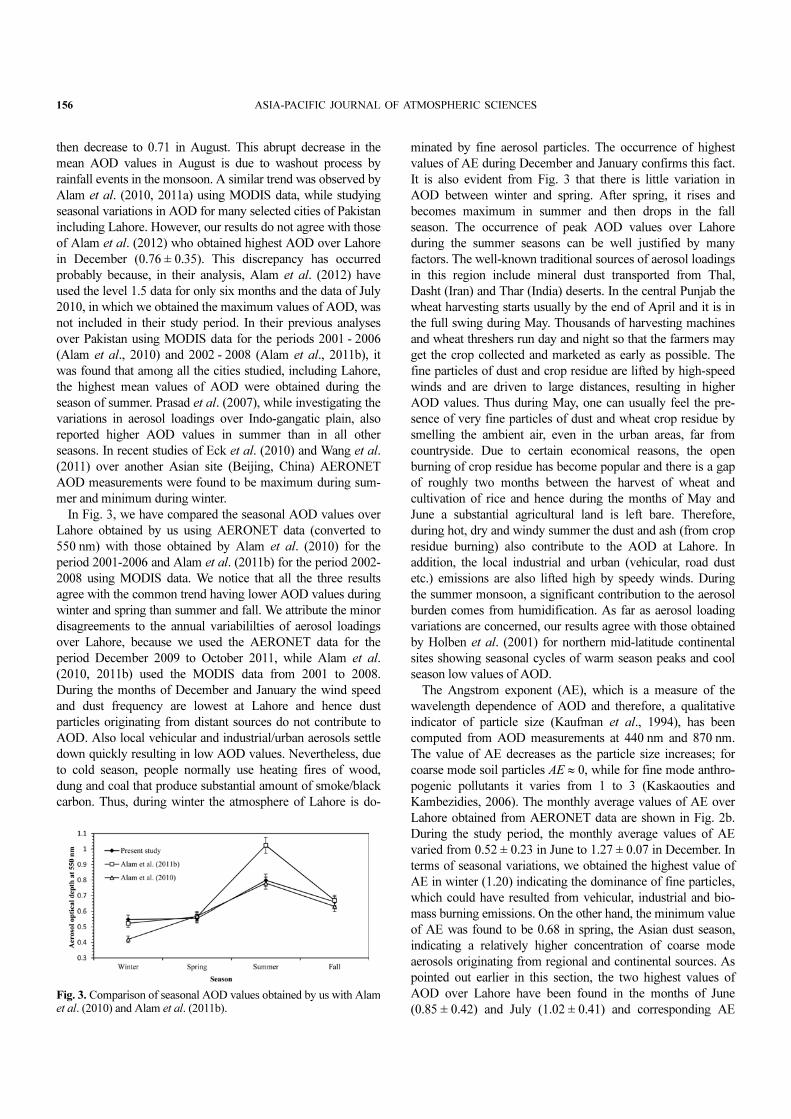
In Fig. 3, we have compared the seasonal AOD values over
Lahore obtained by us using AERONET data (converted to
550 nm) with those obtained by Alam et al. (2010) for the
period 2001-2006 and Alam et al. (2011b) for the period 2002-
2008 using MODIS data. We notice that all the three results
agree with the common trend having lower AOD values during
winter and spring than summer and fall. We attribute the minor
disagreements to the annual variabililties of aerosol loadings
over Lahore, because we used the AERONET data for the
period December 2009 to October 2011, while Alam et al.
(2010, 2011b) used the MODIS data from 2001 to 2008.
During the months of December and January the wind speed
and dust frequency are lowest at Lahore and hence dust
particles originating from distant sources do not contribute to
AOD. Also local vehicular and industrial/urban aerosols settle
down quickly resulting in low AOD values. Nevertheless, due
to cold season, people normally use heating fires of wood,
dung and coal that produce substantial amount of smoke/black
carbon. Thus, during winter the atmosphere of Lahore is do-
minated by fine aerosol particles. The occurrence of highest
values of AE during December and January confirms this fact.
It is also evident from Fig. 3 that there is little variation in
AOD between winter and spring. After spring, it rises and
becomes maximum in summer and then drops in the fall
season. The occurrence of peak AOD values over Lahore
during the summer seasons can be well justified by many
factors. The well-known traditional sources of aerosol loadings
in this region include mineral dust transported from Thal,
Dasht (Iran) and Thar (India) deserts. In the central Punjab the
wheat harvesting starts usually by the end of April and it is in
the full swing during May. Thousands of harvesting machines
and wheat threshers run day and night so that the farmers may
get the crop collected and marketed as early as possible. The
fine particles of dust and crop residue are lifted by high-speed
winds and are driven to large distances, resulting in higher
AOD values. Thus during May, one can usually feel the pre-
sence of very fine particles of dust and wheat crop residue by
smelling the ambient air, even in the urban areas, far from
countryside. Due to certain economical reasons, the open
burning of crop residue has become popular and there is a gap
of roughly two months between the harvest of wheat and
cultivation of rice and hence during the months of May and
June a substantial agricultural land is left bare. Therefore,
during hot, dry and windy summer the dust and ash (from crop
residue burning) also contribute to the AOD at Lahore. In
addition, the local industrial and urban (vehicular, road dust
etc.) emissions are also lifted high by speedy winds. During
the summer monsoon, a significant contribution to the aerosol
burden comes from humidification. As far as aerosol loading
variations are concerned, our results agree with those obtained
by Holben et al. (2001) for northern mid-latitude continental
sites showing seasonal cycles of warm season peaks and cool
season low values of AOD.
The Angstrom exponent (AE), which is a measure of the
wavelength dependence of AOD and therefore, a qualitative
indicator of particle size (Kaufman et al., 1994), has been
computed from AOD measurements at 440 nm and 870 nm.
The value of AE decreases as the particle size increases; for
coarse mode soil particles AE ≈ 0, while for fine mode anthro-
pogenic pollutants it varies from 1 to 3 (Kaskaouties and
Kambezidies, 2006). The monthly average values of AE over
Lahore obtained from AERONET data are shown in Fig. 2b.
During the study period, the monthly average values of AE
varied from 0.52 ± 0.23 in June to 1.27 ± 0.07 in December. In
terms of seasonal variations, we obtained the highest value of
AE in winter (1.20) indicating the dominance of fine particles,
which could have resulted from vehicular, industrial and bio-
mass burning emissions. On the other hand, the minimum value
of AE was found to be 0.68 in spring, the Asian dust season,
indicating a relatively higher concentration of coarse mode
aerosols originating from regional and continental sources. As
pointed out earlier in this section, the two highest values of
AOD over Lahore have been found in the months of June
(0.85 ± 0.42) and July (1.02 ± 0.41) and corresponding AEFig. 3. Comparison of seasonal AOD values obtained by us with Alamet al. (2010) and Alam et al. (2011b).
28 February 2014 Muhammad Ali et al. 157
values of 0.52 ± 0.23 and 0.84 ± 0.28 respectively. This in-
dicates that relatively large sized aerosol particles (such as
dust) dominated the atmosphere of Lahore in the month of
June. Alam et al. (2011b, 2012), also found similar results over
Karachi. We find minimum value of AOD to be 0.47 ± 0.26 in
February with corresponding AE value of 1.11 ± 0.25, indi-
cating dominance of fine mode anthropogenic aerosols over
Lahore. As far as seasonal values of AE are concerned, we
obtained its maximum value in winter (1.20) attributed to the
dominance of fine aerosol particles and minimum value in
spring (0.68) indicating that coarse aerosol particles dominated
the atmosphere over Lahore. In summer and fall, average
values of AE were observed to be 0.76 and 1.03 respectively.
Thus, the atmosphere over Lahore was dominated by coarse
particles (mineral/desert dust) during spring and summer. It is
well justified by the meteorological conditions prevailing at
Lahore (Table 1), where an accumulated frequency of desert
dust events during these two seasons is almost 86%.
We have also plotted the monthly average values of water
vapor content (WVC) over Lahore by using the AERONET
data as shown in Fig. 2c. The AERONET measures simul-
taneous columnar water vapor along with aerosol properties at
three wavelengths of 675 nm, 870 nm and 940 nm. The total
transmission for 675 nm and 870 nm is computed using Rayleigh
and AODs and extrapolated to obtain the total transmission at
the nominal 940 nm wavelength, which is then subtracted from
the measured transmission at 940 nm. This resultant would give
us the transmission due to water vapor. The columnar water
vapor (in centimeters) are thus retrieved by using AERONET
version 2.0 algorithm and data quality criteria (Smirnov et al.,
2000; Dubovik et al., 2006; Holben et al., 2006). The accuracy
of AERONET cimel for WVC retrievals is estimated to be
within 10% (Schmid et al., 2001; Smirnov et al., 2004). Prasad
and Singh. (2009) have shown that high correlation (~0.95)
exits between WVC retrieved from AERONET and Global
Positioning System (GPS) over Kanpur (India). We observe a
strong seasonality in the WVC variabililties over Lahore i.e.,
high values in summer (4.305) and low in winter (1.068) with
moderate values in spring (1.977) and fall (2.823) in agree-
ment with the usual synoptic pattern of the region (see for
example Singh et al., 2004; Alam et al., 2012). Its highest value
was observed in August (4.80). Obviously, this result can be
explained by the fact that greater rainfall in August increases
the amount of water vapors in the atmosphere. Due to
relatively dry weather, the lowest value of WVC was observed
in December (0.88).
b. Size distribution
The volume size distribution of aerosols is influenced by the
mixture of different aerosol types present at a certain location
which depends upon factors influencing the strength of aerosol
sources, upon the trajectories of the air masses arriving at that
location and upon meteorological dispersion and scavenging
mechanisms (Eck et al., 2001). The volume size distribution of
aerosol particles dV/d ln r (µm3 µm-2) for each mode is given
by:
,
where Cv is the columnar volume of particles per unit cross
section of atmospheric column, r is the particle radius, rv is the
volume geometric mean radius and σ is the standard deviation.
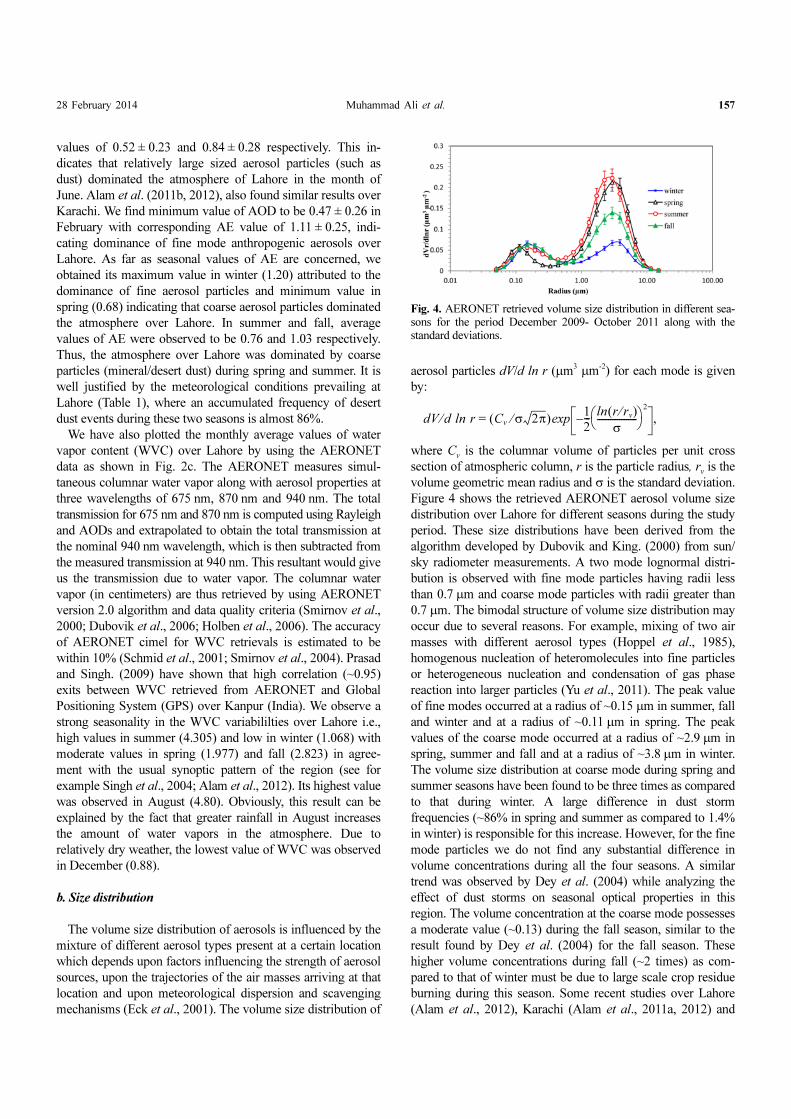
Figure 4 shows the retrieved AERONET aerosol volume size
distribution over Lahore for different seasons during the study
period. These size distributions have been derived from the
algorithm developed by Dubovik and King. (2000) from sun/
sky radiometer measurements. A two mode lognormal distri-
bution is observed with fine mode particles having radii less
than 0.7 µm and coarse mode particles with radii greater than
0.7 µm. The bimodal structure of volume size distribution may
occur due to several reasons. For example, mixing of two air
masses with different aerosol types (Hoppel et al., 1985),
homogenous nucleation of heteromolecules into fine particles
or heterogeneous nucleation and condensation of gas phase
reaction into larger particles (Yu et al., 2011). The peak value
of fine modes occurred at a radius of ~0.15 µm in summer, fall
and winter and at a radius of ~0.11 µm in spring. The peak
values of the coarse mode occurred at a radius of ~2.9 µm in
spring, summer and fall and at a radius of ~3.8 µm in winter.
The volume size distribution at coarse mode during spring and
summer seasons have been found to be three times as compared
to that during winter. A large difference in dust storm
frequencies (~86% in spring and summer as compared to 1.4%
in winter) is responsible for this increase. However, for the fine
mode particles we do not find any substantial difference in
volume concentrations during all the four seasons. A similar
trend was observed by Dey et al. (2004) while analyzing the
effect of dust storms on seasonal optical properties in this
region. The volume concentration at the coarse mode possesses
a moderate value (~0.13) during the fall season, similar to the
result found by Dey et al. (2004) for the fall season. These
higher volume concentrations during fall (~2 times) as com-
pared to that of winter must be due to large scale crop residue
burning during this season. Some recent studies over Lahore
(Alam et al., 2012), Karachi (Alam et al., 2011a, 2012) and
dV d rln⁄ Cv σ 2π⁄( ) 1
2---–
r rv
⁄( )ln
σ------------------⎝ ⎠⎛ ⎞
2
exp=
Fig. 4. AERONET retrieved volume size distribution in different sea-sons for the period December 2009- October 2011 along with thestandard deviations.
158 ASIA-PACIFIC JOURNAL OF ATMOSPHERIC SCIENCES
Kanpur (India) (Wang et al., 2011) show similar trends regard-
ing the particle size distributions in coarse and fine modes.
c. Single scattering albedo
Single scattering albedo (SSA) is defined as the ratio of the
scattering coefficient to the extinction coefficient and is an
important parameter that describes the effect of aerosols on
radiative forcing. It depends upon the refractive index and size
of aerosols and there are many ways in which SSA can be
estimated for column as well as surface and layered aerosols
(Soni et al., 2010). In the present work, SSA has been obtained
using sun/sky radiance measurements for column aerosols in
the atmosphere (Nakajima et al., 1996; Dubovik et al., 2000)
and is derived from almucantar retrieved aerosol properties
such as complex index of refraction and aerosol size distri-
bution (Dubovik and King, 2000; Dubovik et al., 2002 ). The
SSA exhibits different spectral behavior for different types of
aerosols: increasing with wavelength for desert dust aerosols
and decreasing for biomass and urban/industrial aerosols
(Dubovik et al., 2002).
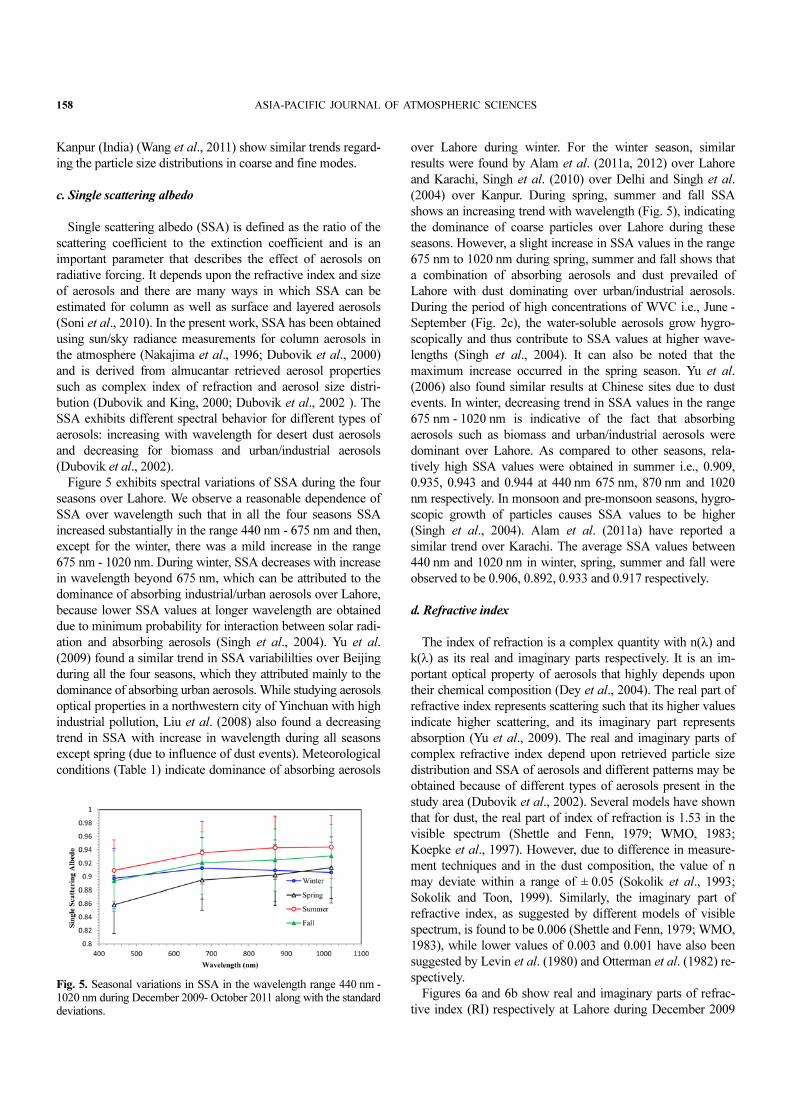
Figure 5 exhibits spectral variations of SSA during the four
seasons over Lahore. We observe a reasonable dependence of
SSA over wavelength such that in all the four seasons SSA
increased substantially in the range 440 nm - 675 nm and then,
except for the winter, there was a mild increase in the range
675 nm - 1020 nm. During winter, SSA decreases with increase
in wavelength beyond 675 nm, which can be attributed to the
dominance of absorbing industrial/urban aerosols over Lahore,
because lower SSA values at longer wavelength are obtained
due to minimum probability for interaction between solar radi-
ation and absorbing aerosols (Singh et al., 2004). Yu et al.
(2009) found a similar trend in SSA variabililties over Beijing
during all the four seasons, which they attributed mainly to the
dominance of absorbing urban aerosols. While studying aerosols
optical properties in a northwestern city of Yinchuan with high
industrial pollution, Liu et al. (2008) also found a decreasing
trend in SSA with increase in wavelength during all seasons
except spring (due to influence of dust events). Meteorological
conditions (Table 1) indicate dominance of absorbing aerosols
over Lahore during winter. For the winter season, similar
results were found by Alam et al. (2011a, 2012) over Lahore
and Karachi, Singh et al. (2010) over Delhi and Singh et al.
(2004) over Kanpur. During spring, summer and fall SSA
shows an increasing trend with wavelength (Fig. 5), indicating
the dominance of coarse particles over Lahore during these
seasons. However, a slight increase in SSA values in the range
675 nm to 1020 nm during spring, summer and fall shows that
a combination of absorbing aerosols and dust prevailed of
Lahore with dust dominating over urban/industrial aerosols.
During the period of high concentrations of WVC i.e., June -
September (Fig. 2c), the water-soluble aerosols grow hygro-
scopically and thus contribute to SSA values at higher wave-
lengths (Singh et al., 2004). It can also be noted that the
maximum increase occurred in the spring season. Yu et al.
(2006) also found similar results at Chinese sites due to dust
events. In winter, decreasing trend in SSA values in the range
675 nm - 1020 nm is indicative of the fact that absorbing
aerosols such as biomass and urban/industrial aerosols were
dominant over Lahore. As compared to other seasons, rela-
tively high SSA values were obtained in summer i.e., 0.909,
0.935, 0.943 and 0.944 at 440 nm 675 nm, 870 nm and 1020
nm respectively. In monsoon and pre-monsoon seasons, hygro-
scopic growth of particles causes SSA values to be higher
(Singh et al., 2004). Alam et al. (2011a) have reported a
similar trend over Karachi. The average SSA values between
440 nm and 1020 nm in winter, spring, summer and fall were
observed to be 0.906, 0.892, 0.933 and 0.917 respectively.
d. Refractive index
The index of refraction is a complex quantity with n(λ) and
k(λ) as its real and imaginary parts respectively. It is an im-
portant optical property of aerosols that highly depends upon
their chemical composition (Dey et al., 2004). The real part of
refractive index represents scattering such that its higher values
indicate higher scattering, and its imaginary part represents
absorption (Yu et al., 2009). The real and imaginary parts of
complex refractive index depend upon retrieved particle size
distribution and SSA of aerosols and different patterns may be
obtained because of different types of aerosols present in the
study area (Dubovik et al., 2002). Several models have shown
that for dust, the real part of index of refraction is 1.53 in the
visible spectrum (Shettle and Fenn, 1979; WMO, 1983;
Koepke et al., 1997). However, due to difference in measure-
ment techniques and in the dust composition, the value of n
may deviate within a range of ± 0.05 (Sokolik et al., 1993;
Sokolik and Toon, 1999). Similarly, the imaginary part of
refractive index, as suggested by different models of visible
spectrum, is found to be 0.006 (Shettle and Fenn, 1979; WMO,
1983), while lower values of 0.003 and 0.001 have also been
suggested by Levin et al. (1980) and Otterman et al. (1982) re-
spectively.
Figures 6a and 6b show real and imaginary parts of refrac-
tive index (RI) respectively at Lahore during December 2009
Fig. 5. Seasonal variations in SSA in the wavelength range 440 nm -1020 nm during December 2009- October 2011 along with the standarddeviations.
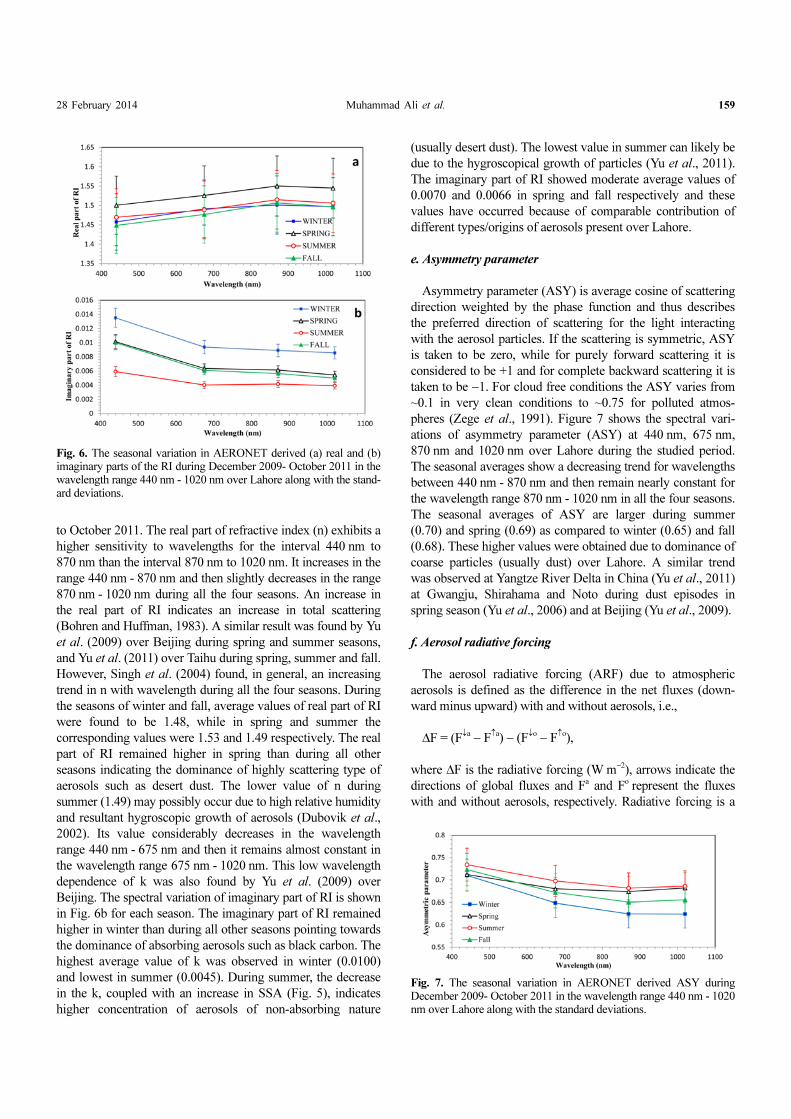
28 February 2014 Muhammad Ali et al. 159
to October 2011. The real part of refractive index (n) exhibits a
higher sensitivity to wavelengths for the interval 440 nm to
870 nm than the interval 870 nm to 1020 nm. It increases in the
range 440 nm - 870 nm and then slightly decreases in the range
870 nm - 1020 nm during all the four seasons. An increase in
the real part of RI indicates an increase in total scattering
(Bohren and Huffman, 1983). A similar result was found by Yu
et al. (2009) over Beijing during spring and summer seasons,
and Yu et al. (2011) over Taihu during spring, summer and fall.
However, Singh et al. (2004) found, in general, an increasing
trend in n with wavelength during all the four seasons. During
the seasons of winter and fall, average values of real part of RI
were found to be 1.48, while in spring and summer the
corresponding values were 1.53 and 1.49 respectively. The real
part of RI remained higher in spring than during all other
seasons indicating the dominance of highly scattering type of
aerosols such as desert dust. The lower value of n during
summer (1.49) may possibly occur due to high relative humidity
and resultant hygroscopic growth of aerosols (Dubovik et al.,
2002). Its value considerably decreases in the wavelength
range 440 nm - 675 nm and then it remains almost constant in
the wavelength range 675 nm - 1020 nm. This low wavelength
dependence of k was also found by Yu et al. (2009) over
Beijing. The spectral variation of imaginary part of RI is shown
in Fig. 6b for each season. The imaginary part of RI remained
higher in winter than during all other seasons pointing towards
the dominance of absorbing aerosols such as black carbon. The
highest average value of k was observed in winter (0.0100)
and lowest in summer (0.0045). During summer, the decrease
in the k, coupled with an increase in SSA (Fig. 5), indicates
higher concentration of aerosols of non-absorbing nature
(usually desert dust). The lowest value in summer can likely be
due to the hygroscopical growth of particles (Yu et al., 2011).
The imaginary part of RI showed moderate average values of
0.0070 and 0.0066 in spring and fall respectively and these
values have occurred because of comparable contribution of
different types/origins of aerosols present over Lahore.
e. Asymmetry parameter
Asymmetry parameter (ASY) is average cosine of scattering
direction weighted by the phase function and thus describes
the preferred direction of scattering for the light interacting
with the aerosol particles. If the scattering is symmetric, ASY
is taken to be zero, while for purely forward scattering it is
considered to be +1 and for complete backward scattering it is
taken to be −1. For cloud free conditions the ASY varies from
~0.1 in very clean conditions to ~0.75 for polluted atmos-
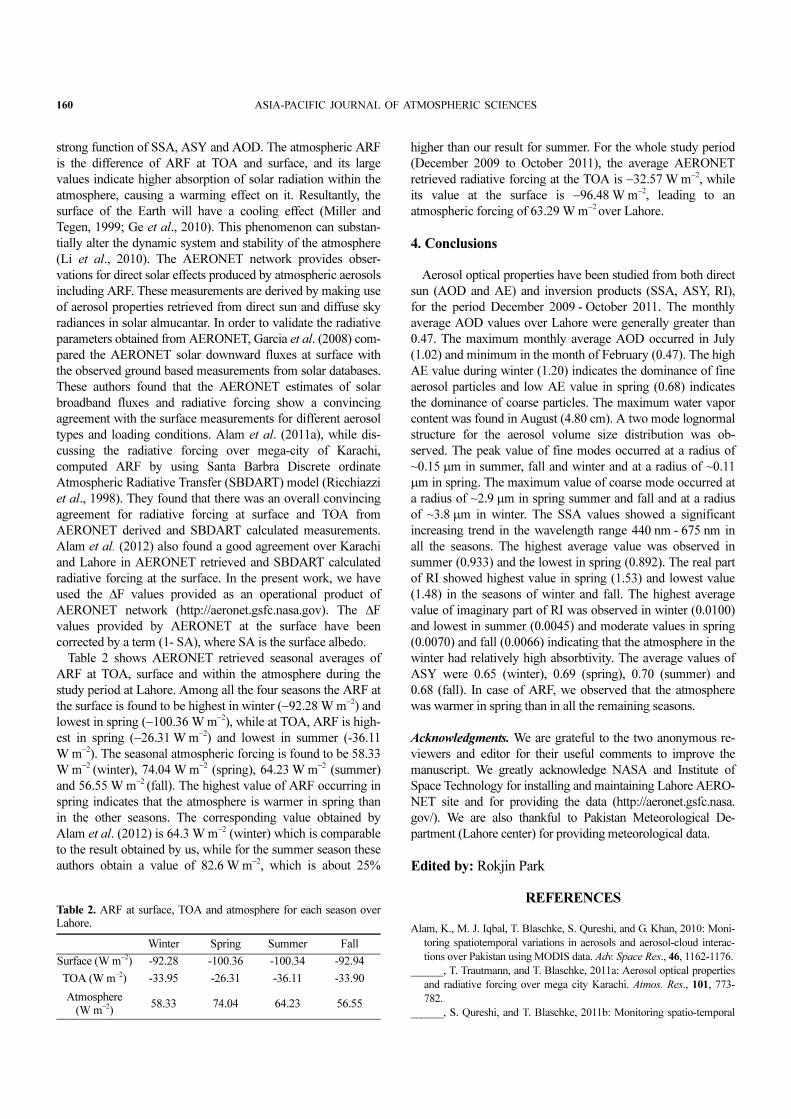
pheres (Zege et al., 1991). Figure 7 shows the spectral vari-
ations of asymmetry parameter (ASY) at 440 nm, 675 nm,
870 nm and 1020 nm over Lahore during the studied period.
The seasonal averages show a decreasing trend for wavelengths
between 440 nm - 870 nm and then remain nearly constant for
the wavelength range 870 nm - 1020 nm in all the four seasons.
The seasonal averages of ASY are larger during summer
(0.70) and spring (0.69) as compared to winter (0.65) and fall
(0.68). These higher values were obtained due to dominance of
coarse particles (usually dust) over Lahore. A similar trend
was observed at Yangtze River Delta in China (Yu et al., 2011)
at Gwangju, Shirahama and Noto during dust episodes in
spring season (Yu et al., 2006) and at Beijing (Yu et al., 2009).
f. Aerosol radiative forcing
The aerosol radiative forcing (ARF) due to atmospheric
aerosols is defined as the difference in the net fluxes (down-
ward minus upward) with and without aerosols, i.e.,
∆F = (F↓a − F↑a) − (F↓o − F↑o),
where ∆F is the radiative forcing (W m−2), arrows indicate the
directions of global fluxes and Fa and Fo represent the fluxes
with and without aerosols, respectively. Radiative forcing is a
Fig. 6. The seasonal variation in AERONET derived (a) real and (b)imaginary parts of the RI during December 2009- October 2011 in thewavelength range 440 nm - 1020 nm over Lahore along with the stand-ard deviations.
Fig. 7. The seasonal variation in AERONET derived ASY duringDecember 2009- October 2011 in the wavelength range 440 nm - 1020nm over Lahore along with the standard deviations.
160 ASIA-PACIFIC JOURNAL OF ATMOSPHERIC SCIENCES
strong function of SSA, ASY and AOD. The atmospheric ARF
is the difference of ARF at TOA and surface, and its large
values indicate higher absorption of solar radiation within the
atmosphere, causing a warming effect on it. Resultantly, the
surface of the Earth will have a cooling effect (Miller and
Tegen, 1999; Ge et al., 2010). This phenomenon can substan-
tially alter the dynamic system and stability of the atmosphere
(Li et al., 2010). The AERONET network provides obser-
vations for direct solar effects produced by atmospheric aerosols
including ARF. These measurements are derived by making use
of aerosol properties retrieved from direct sun and diffuse sky
radiances in solar almucantar. In order to validate the radiative
parameters obtained from AERONET, Garcia et al. (2008) com-
pared the AERONET solar downward fluxes at surface with
the observed ground based measurements from solar databases.
These authors found that the AERONET estimates of solar
broadband fluxes and radiative forcing show a convincing
agreement with the surface measurements for different aerosol
types and loading conditions. Alam et al. (2011a), while dis-
cussing the radiative forcing over mega-city of Karachi,
computed ARF by using Santa Barbra Discrete ordinate
Atmospheric Radiative Transfer (SBDART) model (Ricchiazzi
et al., 1998). They found that there was an overall convincing
agreement for radiative forcing at surface and TOA from
AERONET derived and SBDART calculated measurements.
Alam et al. (2012) also found a good agreement over Karachi
and Lahore in AERONET retrieved and SBDART calculated
radiative forcing at the surface. In the present work, we have
used the ∆F values provided as an operational product of
AERONET network (http://aeronet.gsfc.nasa.gov). The ∆F
values provided by AERONET at the surface have been
corrected by a term (1- SA), where SA is the surface albedo.
Table 2 shows AERONET retrieved seasonal averages of
ARF at TOA, surface and within the atmosphere during the
study period at Lahore. Among all the four seasons the ARF at
the surface is found to be highest in winter (−92.28 W m−2) and
lowest in spring (−100.36 W m−2), while at TOA, ARF is high-
est in spring (−26.31 W m−2) and lowest in summer (-36.11
W m−2). The seasonal atmospheric forcing is found to be 58.33
W m−2 (winter), 74.04 W m−2 (spring), 64.23 W m−2 (summer)
and 56.55 W m−2 (fall). The highest value of ARF occurring in
spring indicates that the atmosphere is warmer in spring than
in the other seasons. The corresponding value obtained by
Alam et al. (2012) is 64.3 W m−2 (winter) which is comparable
to the result obtained by us, while for the summer season these
authors obtain a value of 82.6 W m−2, which is about 25%
higher than our result for summer. For the whole study period
(December 2009 to October 2011), the average AERONET
retrieved radiative forcing at the TOA is −32.57 W m−2, while
its value at the surface is −96.48 W m−2, leading to an
atmospheric forcing of 63.29 W m−2 over Lahore.
4. Conclusions
Aerosol optical properties have been studied from both direct
sun (AOD and AE) and inversion products (SSA, ASY, RI),
for the period December 2009 - October 2011. The monthly
average AOD values over Lahore were generally greater than
0.47. The maximum monthly average AOD occurred in July
(1.02) and minimum in the month of February (0.47). The high
AE value during winter (1.20) indicates the dominance of fine
aerosol particles and low AE value in spring (0.68) indicates
the dominance of coarse particles. The maximum water vapor
content was found in August (4.80 cm). A two mode lognormal
structure for the aerosol volume size distribution was ob-
served. The peak value of fine modes occurred at a radius of
~0.15 µm in summer, fall and winter and at a radius of ~0.11
µm in spring. The maximum value of coarse mode occurred at
a radius of ~2.9 µm in spring summer and fall and at a radius
of ~3.8 µm in winter. The SSA values showed a significant
increasing trend in the wavelength range 440 nm - 675 nm in
all the seasons. The highest average value was observed in
summer (0.933) and the lowest in spring (0.892). The real part
of RI showed highest value in spring (1.53) and lowest value
(1.48) in the seasons of winter and fall. The highest average
value of imaginary part of RI was observed in winter (0.0100)
and lowest in summer (0.0045) and moderate values in spring
(0.0070) and fall (0.0066) indicating that the atmosphere in the
winter had relatively high absorbtivity. The average values of
ASY were 0.65 (winter), 0.69 (spring), 0.70 (summer) and
0.68 (fall). In case of ARF, we observed that the atmosphere
was warmer in spring than in all the remaining seasons.
Acknowledgments. We are grateful to the two anonymous re-
viewers and editor for their useful comments to improve the
manuscript. We greatly acknowledge NASA and Institute of
Space Technology for installing and maintaining Lahore AERO-
NET site and for providing the data (http://aeronet.gsfc.nasa.
gov/). We are also thankful to Pakistan Meteorological De-
partment (Lahore center) for providing meteorological data.
Edited by: Rokjin Park
REFERENCES
Alam, K., M. J. Iqbal, T. Blaschke, S. Qureshi, and G. Khan, 2010: Moni-
toring spatiotemporal variations in aerosols and aerosol-cloud interac-
tions over Pakistan using MODIS data. Adv. Space Res., 46, 1162-1176.
______, T. Trautmann, and T. Blaschke, 2011a: Aerosol optical properties
and radiative forcing over mega city Karachi. Atmos. Res., 101, 773-
782.
______, S. Qureshi, and T. Blaschke, 2011b: Monitoring spatio-temporal
Table 2. ARF at surface, TOA and atmosphere for each season overLahore.
Winter Spring Summer Fall
Surface (W m−2) -92.28 -100.36 -100.34 -92.94
TOA (W m−2) -33.95 -26.31 -36.11 -33.90
Atmosphere(W m−2)
58.33 74.04 64.23 56.55
28 February 2014 Muhammad Ali et al. 161
aerosol patterns over Pakistan based on MODIS, TOMS and MISR
satellite data and a HYSPLIT model. Atmos. Environ., 45, 4641-4651.
______, T. Trautmann, T. Blaschke, and M. Hussain, 2012: Aerosol optical
and radiative properties during summer and winter seasons over Lahore
and Karachi. Atmos. Environ., 50, 234-245.
Biswas, K. F., B. M. Ghauri, and L. Husain, 2008: Gaseous and aerosol
pollutants during fog and clear episodes in south Asian urban
atmosphere. Atmos. Environ., 42, 7775-7785.
Bohren, C. F., and D. R. Huffman, 1983: Absorption and scattering of light
by small particles. John Wiley, 550 pp.
Charlson, R. J., S. E. Schwartz, J. M., Hales, R. D. Cess, J. A. Coakley Jr.,
J. E. Hansen, and D. J. Hofmann, 1992: Climate forcing by
anthropogenic aerosols. Science, 255, 423-430.
Coakley Jr., J. A., R. D. Cess, and F. B. Yurevich, 1983: The effect of
tropospheric aerosols on the Earth’s radiation budget: a parameteri-
zation for climate model. J. Atmos. Sci., 40, 116-138.
Dey, S., S. N. Tripathi, R. P. Singh, and B. N. Holben, 2004: Influence of
dust storms on the aerosol optical properties over the Indo-Gangetic
basin. J. Geophys. Res., 109, D20211, doi:10.1029/2004JD004924.
Dubovik, O., and M. D. King, 2000: A flexible inversion algorithm for
retrieval of aerosol optical properties from sun and sky radiance
measurements. J. Geophys. Res., 105, 20,673-20,696.
______, B. N. Holben, T. F. Eck, A. Smirnov, Y. J. Kaufman, M. D. King,
D. Tanre, and I. Slutsker, 2002: Climatology of atmospheric aerosol
absorption and optical properties in key locations. J. Atmos. Sci., 59,
590-608.
______, ______, T. F. Eck, A. Smirnov, Y. J. Kaufman, M. D. King, D.
Tanre, and I. Slutsker, 2002a: Variability of absorption and optical
properties of key aerosol types observed in worldwide locations. J.
Atmos. Sci., 59, 590-608.
______, and Coauthors, 2006: Application of spheroid models to account
for aerosol particle nonsphericity in remote sensing of desert dust. J.
Geophys. Res., 111, D11208, doi:10.1029/2005JD006619.
Eck, T. F., and Coauthors, 2001: Characterization of the optical properties
of biomass burning aerosols in Zambia during the 1997 ZIBBEE field
campaign. J. Geophys. Res. 106, (D4), 3425-3448.
______, and Coauthors, 2010: Climatological aspects of the optical
properties of fine/coarse mode aerosol mixtures. J. Geophys. Res., 115,
D19205, doi:10.1029/2010JD014002.
García, O. E., and Coauthors, 2008: Validation of AERONET estimates of
atmospheric solar fluxes and aerosol radiative forcing by ground-based
broadband measurements. J. Geophys. Res., 113, D21207, doi:10.1029/
2008JD010211.
Ge, J. M., J. Su, T. P. Ackerman, Q. Fu, J. P. Huang, and J. S. Shi, 2010:
Dust aerosol optical properties retrieval and radiative forcing over
northwestern China during the 2008 China-U.S. joint field experiment.
J. Geophys. Res., 115, D00k12, doi:10.1029/2009JD013263.
Holben, B. N., and Coauthors, 1998: AERONET-A federated instrument
network and data archive for aerosol characterization. Remote Sens.
Environ., 66, 1-16.
______, and Coauthors, 2001: An emerging ground-based aerosol cli-
matology: Aerosol Optical Depth from AERONET. J. Geophys. Res.,
106, 12067-12097.
______, T. F. Eck, I. Slutsker, A. Smirnov, A. Sinyuk, J. Schafer, D. Giles,
and O. Dubovik, 2006: AERONET’s Version 2.0 quality assurance
criteria. Remote Sensing of the Atmosphere and Clouds, Proc. SPIE Int.
Soc. Opt. Eng., 6408, 64080Q, doi:10.1117/12.706524.
Hoppel, W. A., J. W. Fitzgerald, and R. E. Larson, 1985: Aerosol size
distributions in air masses advecting off the east coast of the United
States. J. Geophys. Res., 90, (D1), 2365-2379.
Intergovernmental Panel on Climate Change (IPCC), 1995: Climate
change 1994: Radiative forcing of climate. Cambridge University Press,
Cambridge, 1-231 pp.
______, 2001: Climate Change 2001: The Scientific Basis. Cambridge
University Press, Cambridge, United Kingdom, New York, NY, USA,
881 pp.
Kaskaoutis D. G., and H. D. Kambezidis, 2006: Investigation on the
wavelength dependence of the aerosol optical depth in the Athens area.
Quart. J. Roy. Meteor. Soc., 132, 2217-2234.
Kaufman, Y. J., A. Gitelson, A. Karnieli, E. Ganor, R. S. Fraser, T.
Nakajima, S. Matoo, and B. N. Holben, 1994: Size distribution and
scattering phase function of aerosol particles retrieved from sky bright-
ness measurements. Geophys. Res. Lett., 99, 10 341-10 356.
______, C. Tanre, L. A. Remer, E. F. Vermote, A. Chu, and B. N. Holben,
1997: Operational remote sensing of tropospheric aerosol over land
from EOS moderate resolution imaging spectroradiometer. J. Geophys.
Res., 102, 17051-17067.
Koepke, P., M. Hess, I. Schult, and E. P. Shettle, 1997: Global aerosol data
set. MPI Meteorologie Humburg Rep., 243, 44 pp.
King, M. D., Y. J. Kaufman, D. Tanre, and T. Nakijima, 1999: Remote
sensing of tropospheric aerosols from space: Past, present, and future.
Bull. Amer. Meteor. Soc., 80, 2229-2259.
Levin, Z., J. H. Joseph, and Y. Mekler, 1980: Properties of Sharav
(Khamsin) dust-comparison of optical and direct sampling data. J.
Atmos. Sci., 37, 182- 191.
Li, Z., K. H. O. Lee, Y. Wang, J. Xin, and W. M. Hao, 2010: First obser-
vation-based estimates of cloud-free aeroso radiative forcing across
China. J. Geophys. Res., 115, D00K18, doi:10.1029/2009JD013306.
Liu, J., Y. Zheng, Z. Li, and R. Wu, 2008: Ground-based remote sensing of
aerosol optical properties in one city in Northwest China. Atmos. Res.,
89, 194-205.
Lohmann, U., and J. Feichter, 2005: Global indirect aerosol effects: a
review. Atmos. Chem. Phys., 5, 715-737.
Miller, R. L., and I. Tegen, 1999: Radiative forcing of a tropical direct
circulation by soil dust aerosols. J. Atmos. Sci., 56, 2403-2433.
Nakajima, T., G. Tonna, R. Rao, P. Boi, Y. Kaufman, and B. Holben, 1996:
Use of sky brightness measurements from ground for remote sensing of
particulate polydispersions. Appl. Opt., 35, 2672-2686.
Otterman, J., R. S. Fraser, and O. P. Bahethi, 1982: Characterization of
tropospheric desert aerosols at solar wavelengths by multispectral
radiometry from Landsat. J. Geophys. Res., 87, 1270- 1278.
Prasad, A. K., and R. P. Singh, 2009: Validation of MODIS Terra, AIRS,
NCEP/DOE AMIP-II Reanalysis-2, and AERONET Sun photometer
derived integrated precipitable water vapor using ground-based GPS
receivers over India. J. Geophys. Res., 114, D05107, doi:10.1029/
2008JD011230.
Ramanathan, V., P. J. Crutzen, J. T. Kiehl, and D. Rosenfeld, 2001a:
Aerosol, climate, and hydrological cycle. Science, 294, 2119-2124.
Rosenfeld, D., and I. M. Lensky, 1998: Satellite-based insights into pre-
cipitation formation processes in continental and maritime convective
clouds. Bull. Amer. Meteor. Soc., 79, 2457-2476.
Satheesh, S. K., and K. K. Moorthy, 2005: Radiative effects of natural
aerosols: A review. Atmos. Environ., 39, 2089-2110, doi:10.1016/
j.atmosenv.2004.12.029.
Schmid B., and Coauthors, 2001: Comparison of columnar water-vapor
measurements from solar transmittance methods. Appl. Opt., 40, doi:
10.1364/AO.40.001886.
Sharma, A. R., S. K. Kharol, K. V. S. Badarinath, and D. Singh, 2010:
Impact of agriculture crop residue burning on atmospheric aerosol
loading - a study over Punjab State, India. Ann. Geophys., 28, 367-379,
doi:10.5194/angeo-28-367-2010.
Shettle, E. P., and R. W. Fenn, 1979: Models of aerosols lower troposphere
and the effect of humidity variations on their optical properties.
AFCxRL Tech. Rep. 79 0214. Air Force Cambridge Research Labora-
tory, Hanscom Air Force Base, MA, 100 pp.
Singh, S., K. Soni, T. Bano, R. S. Tanwar, S. Nath, and B. C. Arya, 2010:
162 ASIA-PACIFIC JOURNAL OF ATMOSPHERIC SCIENCES
Clear-sky direct aerosol radiative forcing variations over mega-city
Delhi. Ann. Geophys., 28, 1157-1166, doi:10.5194/angeo-28-1157-2010.
Singh, R. P., S. Dey, S. N. Tripathi, V. Tare, and B. N. Holben, 2004:
Variability of aerosol parameters over Kanpur city, northern India. J.
Geophys. Res., 109, D23206, doi:10.1029/2004JD004966.
Smirnov, A., B. N. Holben, T. F. Eck, O. Dubovik, and I. Slutsker, 2000:
Cloud screening and quality control algorithms for the AERONET data
base. Remote Sens. Environ., 73, 337-349.
______, ______, A. Lyapustin, I. Slutsker, and T. F. Eck, 2004: AERO-
NET processing algorithms refinement, paper presented at AERONET
Workshop, El Arenosillo, Spain, 10-14 May.
Sokolik, I. N., and O. B. Toon, 1999: Incorporation of mineralogical
composition into models of the radiative properties of mineral aerosol
from UV to IR wavelengths. J. Geophys. Res., 104, 9423-9444.
______, A. Andronove, and T. C. Johnson, 1993: Complex refractive
index of atmospheric dust aerosols. Atmos. Environ, 27A, 2495-2502.
Soni, K., S. Singh, T. Bano, R. Tanwar, S. Nath, and B. Arya, 2010:
Variations in single scattering albedo and Angstrom absorption ex-
ponent during different seasons at Delhi, India. Atmos. Environ., 44,
4355-4363.
Twomey, S., 1977: The influence of pollution on the shortwave albedo of
clouds. J. Atmos. Sci., 34, 1149-1152.
Wang, S., L. Fang, X. Gu, T. Yu, and J. Gao, 2011: Comparison of aerosol
optical properties from Beijing and Kanpur. Atmos. Environ., 39, 7406-
7414.
WMO, 1983: Radiation commission of IAMAP meeting of experts on
aerosols and their climatic effects, World Meteorological Organization
Rep, WCP55, 28 pp.
Yu, X., B. Zhu, Y. Yin, S. Fan, and A. Chen, 2011: Seasonal variation of
columnar aerosol optical properties in Yangtze River Delta in China.
Adv. Atmos. Sci., 28, 1326-1335.
______, ______, and M. Zhang, 2009: Seasonal variability of aerosol
optical properties over Beijing. Atmos. Environ., 43, 4095-4101.
______, T. Cheng, J. Chen, and Y. Liu, 2006: A comparison of dust pro-
perties between China continent and Korea, Japan in east Asia. Atmos.
Environ, 40, 5787-5797.
Zege, E. P., A. P. Ivanov, and I. L. Katzev, 1991: Image transfer through a
scattering medium, Springer, Berlin, New York, 349 pp.
Zhao, T. X. P., I. Laszlo, P. Minnis, and L. Remer, 2005: Comparison and
analysis of two aerosol retrievals over the ocean in the Terra/Clouds and
the Earth’s Radiant Energy System-Moderate Resolution Imaging
Spectroradiometer single scanner footprint data: 1. Global evaluation. J.
Geophys. Res., 110, D21208, doi:10.1029/2005JD005851.


![2012 P L C (C.S.) 1437 [Lahore High Court] Before Malik ...](https://static.fdokumen.com/doc/165x107/63207386b71aaa142a03cf42/2012-p-l-c-cs-1437-lahore-high-court-before-malik-.jpg)