A structured approach to instrumentation system development and evaluation
27
0 A Structured Approach to Instrumentation System Development and Evaluation Abdul Waheed † and Diane T. Rover Department of Electrical Engineering 260 Engineering Building Michigan State University East Lansing, MI 48824 E-mail: {waheed, rover}@egr.msu.edu Phone: 517-353-7735 FAX: 517-353-1980 Abstract Software instrumentation is a widely used technique for parallel program performance evaluation, debugging, steering, and visualization. With increasing sophistication of parallel tool development technologies and broadening of application areas where these tools are being used, runtime data collection and management activities are growing in importance; we use the term instrumentation system (IS) to refer to components that support these activities in state-of-the-art parallel tool environments. An IS consists of Local Instrumentation Servers, an Instrumentation System Manager, and a Transfer Protocol. The overheads and perturbation effects attributed to an IS must be accounted for to ensure correct and efficient representation of program behavior, especially for on-line and real-time environments. Moreover, an IS is a key facilitator of integration of tools in an environment. In this paper, we define the primary components of an IS and their roles in an integrated environment, and classify ISs according to selected features. We introduce a structured approach to plan, design, model, evaluate, implement, and validate an IS. The approach provides a means to formally address domain-specific requirements. The modeling and evaluation processes are illustrated in the context of three distinctive IS case studies for PICL, Paradyn, and Vista. Valuable feedback on performance effects of IS parameters and policies can assist developers in making design decisions early in the software development cycle. Additionally, use of structured software engineering methods can support the mapping of an abstract IS model to an implementation of the IS. † Student and presenting author
Transcript of A structured approach to instrumentation system development and evaluation

0
A Structured Approach to Instrumentation System Developmentand Evaluation
Abdul Waheed† and Diane T. RoverDepartment of Electrical Engineering
260 Engineering BuildingMichigan State UniversityEast Lansing, MI 48824
E-mail: {waheed, rover}@egr.msu.eduPhone: 517-353-7735FAX: 517-353-1980
Abstract
Software instrumentation is a widely used technique for parallel program performance evaluation,
debugging, steering, and visualization. With increasing sophistication of parallel tool development
technologies and broadening of application areas where these tools are being used, runtime data
collection and management activities are growing in importance; we use the term instrumentation system
(IS) to refer to components that support these activities in state-of-the-art parallel tool environments. An IS
consists of Local Instrumentation Servers, an Instrumentation System Manager, and a Transfer Protocol.
The overheads and perturbation effects attributed to an IS must be accounted for to ensure correct and
efficient representation of program behavior, especially for on-line and real-time environments. Moreover,
an IS is a key facilitator of integration of tools in an environment. In this paper, we define the primary
components of an IS and their roles in an integrated environment, and classify ISs according to selected
features. We introduce a structured approach to plan, design, model, evaluate, implement, and validate an
IS. The approach provides a means to formally address domain-specific requirements. The modeling and
evaluation processes are illustrated in the context of three distinctive IS case studies for PICL, Paradyn,
and Vista. Valuable feedback on performance effects of IS parameters and policies can assist developers in
making design decisions early in the software development cycle. Additionally, use of structured software
engineering methods can support the mapping of an abstract IS model to an implementation of the IS.
† Student and presenting author

1
A Structured Approach to Instrumentation System Developmentand Evaluation
1 Introduction and Motivation
Software instrumentation is a widely used technique for parallel program performance evaluation,
debugging, and visualization. Parallel tools rely on execution information regarding the states and behavior
of application programs to provide useful feedback to the user. With increasing sophistication of parallel
tool development technologies, runtime data collection and management activities are receiving more
attention from tool developers [21]. Parallel tool developers are focusing on integrated parallel tool
environments [30] and frameworks [26], performance evaluation of real-time systems [1], and program
steering [6]. The overheads and perturbation effects associated with data collection and management are of
critical importance in these emerging technologies, and, therefore, deserve special attention. We use the
term instrumentation system (henceforth,IS) to specifically consider the data collection and management
components in state-of-the-art parallel tool environments [29]. This paper presents a structured approach to
plan, design, model, evaluate, and implement anIS to address specific requirements imposed by the
parallel tool environment that it supports. It represents one of very few documented efforts to formally
evaluateIS design early in the development cycle, thus treating theIS as any other complex software
system. Moreover, it provides the basis for an automated path towardIS implementation via a mapping of
the abstract system model using software engineering techniques. Finally, we cannot overemphasize the
role of theIS to support integration in next-generation parallel tool environments.
In order to put ourIS development and evaluation approach in the proper perspective, we have examined a
number of parallel tool development efforts, some of which are reviewed in Section 4. A majority of the
ISs in current tool environments have been developed in a manner that can best be described as ad hoc,
with insufficient or no evaluation of their overheads. Typical activities of an instrumentation system—such
as the rate of data arrivals (collection), competition and contention between application andIS processes
for shared system resources, message passing among variousIS modules, etc.—are nondeterministic. Any
system supporting such activities can not be evaluated reliably unless its modules and activities are
appropriately specified. We have specified and modeled some of the well-known and popularly usedISs,
including those of PICL [4] and Paradyn [19], to evaluate their overheads to the application programs and
systems with respect to the specific requirements of their environments. These case studies demonstrate the
promise of this methodology and lead to a structured development approach forISs for the next generation
of parallel tool environments.

2
This paper classifies anIS in terms of (1) the time constraints imposed by analysis tools in the environment,
and (2) IS development, management, and evaluation approaches (including any cost models used for
evaluation). Such classification is a prerequisite to a structuredIS development and evaluation
methodology. AnIS may supportoff-line or on-line (or even real-time) performance analysis, visualization,
and steering in an environment. TheIS may be developed as a software module that ishard-coded into the
rest of the environment or as a customizableapplication-specific module. It can manage the information
collected from the executing concurrent processes in astatic, adaptive, or application-specific manner.
Evaluating anIS involves metrics and a cost model, which accounts forIS overheads. We classify anIS
along these dimensions in Section 2.
In order to develop anIS in a structured manner, we propose a rapid prototyping, two-level approach, as
depicted in Figure 1. On a higher-level, requirements of theIS are either determined by the developer or
specified by the tool users. These requirements are transformed to detailed lower-level system
specifications, which are subsequently mapped to a model representing the structure and dynamics of the
IS. This model is parameterized and evaluated with respect to chosen performance metrics that reflect the
critical IS overheads to the application program as well as the target system. The evaluation results are then
translated back to the higher-level, so that conclusions can be drawn by tool developers and users regarding
IS performance. Feedback from theIS prototyping process is used to modify either the requirements or the
system specifications to obtain desired performance. Finally, the model becomes the blueprint for actual
synthesis of theIS. More specifically, we are applying object modeling techniques in this process with the
intent of using object-oriented software engineering methods to translate the abstract system model into the
software modules for the actual system.
Realization of a tool in general, and anIS in particular, is a non-trivial process requiring many person-
ISRequirements
ISEvaluation
Feedback from the evaluation process
SystemSpecifications
ISModel
Parameter-ization
ModelCalculations
ISSynthesis
Higher-level qualitative considerations
Lower-level quantitative considerations
Figure 1. Two levels of a structuredIS development approach.

3
hours of programming effort. Moreover, evaluation of a tool by users upon its release typically leads to
requests for corrections, changes, or enhancements in its function. In contrast, rapid prototyping and
preliminary evaluation of anIS using the approach presented in this paper can be applied to ensure that
specific requirements of a tool environment are met prior to the investment in programming effort. This
process is likely to deliver better performance, be less costly, and yield greater user satisfaction.
We present three case studies in Section 3 that follow theIS development approach depicted in Figure 1.
Section 4 discusses the related work that provides an appropriate context to appreciate the relevance of this
work. We conclude with a discussion of the significance of this research.
2 Terms and Classifications
This section defines the terminology that we use throughout this paper. Several terms are identical to those
used by others in the literature on monitoring systems, which serves to establish some consistency and
clarity of discussion in this area.
2.1 Monitoring
A monitor is a tool used to observe the activities of a system. In general, monitors observe the performance
of systems, collect performance statistics, analyze the data, and display results. Monitors are used by
performance analysts, programmers, system designers, and system managers [11]. Monitors are usually
classified with respect to implementation level (software, hardware, or hybrid), trigger mechanism (event-
driven or time-driven, i.e., sampling), and data presentation and analysis mode (on-line or off-line). For a
parallel or distributed system, a monitor is responsible for the collection and analysis of distributed
program information [21, 27].
2.2 Instrumentation System
An instrumentation system (IS) is the part of a monitor that is concerned with the collection and
management of performance information. The scope of anIS spans three modules or functions that are
components of any software monitor for a parallel or distributed system. These components are defined in
the following subsections. We use the terminstrumentation data to account for bothexecution information
(messages, memory references, I/O calls, etc.) andprogram information (variables, arrays, objects, etc.).
We have developed a generic instrumentation system model that represents a majority of components
found in extantISs and omits unnecessary implementation details. This generic model is depicted in Figure

4
2. The model defines three components of anIS that supports tool integration: (1) local instrumentation
server (LIS), (2) instrumentation system manager (ISM), and (3) transfer protocol (TP). In Section 3, we
study theISs of selected tools with respect to this model.
2.2.1 Local Instrumentation Server
The Local Instrumentation Server (LIS)captures instrumentation data of interest from the concurrent
application processes and forwards the data to otherIS modules for consumption by appropriate tools.
Typically, theLIS uses local buffers and a management policy to accomplish data capturing and forwarding
functions.
Instrumentation code is inserted in the application program statically at compile-time (for instance, using
PICL [4]) or dynamically at runtime (for instance, using Paradyn [19]) to capture instrumentation data for
profiling or tracing program execution. Ogle et al. [21] describe theLIS part of the monitor in their Issos
environment in terms ofsensors, probes, andtracing buffers. As in PICL, anLIS can simply comprise
instrumentation library calls responsible for storing data in local buffers or forwarding data to analysis
tools. Or, as in Paradyn, it may consist of a separate process for each node of the concurrent system, which
handles instrumentation data management independent of the application processes. Existing monitoring
systems use varying terminology for anLIS; for example, Paradyn calls it aParadyn daemon, and Issos, a
resident monitor. However, we use the termLIS as an abstraction for specific implementations of data
capturing and forwarding functionality.
Local
Inputbuffers
Outputbuffers
Toolswith front-ends for
control anddata integration
User interactions
Instrumentation System Manager (ISM)
Storagehierarchy
Local interconnection network
Figure 2. Components of a typical instrumentation system supporting an integrated tool environment.
ControlRawinstrumentationdata
Processedinstrumentationdata
Instrumentationdata processor
InstrumentationServer(LIS)
Concurrent system nodes Set of supported tools
Transfer Protocol (TP)
TP
Integrated parallel tool environmentTarget parallel/distributedsystem on the host system

5
2.2.2 Instrumentation System Manager
TheLIS forwards instrumentation data from the concurrent system nodes to a logically centralized location
called theInstrumentation System Manager (ISM), which manages the data in real-time. The functions of
the ISM include temporary buffering of data, storing of data on a mass-storage device, and pre-processing
of data for analysis and/or visualization tools (e.g., causal ordering). Functional requirements of anISM
that supports on-line tool usage are different in nature than for one that supports off-line tool usage.
Similarly, different requirements are associated with an integrated tool environment versus a stand-alone
tool. For instance, on-line tool usage may require theISM to order data on-the-fly before submission to a
tool; whereas anISM for off-line tool usage may only need to merge data from various application
processes, performing event-ordering off-line. We reflect this programmability by defining an
instrumentation data processor module within theISM in Figure 2. Tools receive instrumentation data
from ISM output buffers or a mass storage device, depending on on-line or off-line usage, respectively.
The ISM components in Paradyn [19] and Issos [21] monitoring systems are known as themain Paradyn
process and thecentral monitor, respectively. Some tool developers, such as Ogle, Schwan, and Snodgrass
[21], favor a different partitioning of pre-processing functions, implementing data reduction/analysis in the
LIS rather than in theISM. The definitions of theLIS and theISM do not preclude this.
2.2.3 Transfer Protocol
Instrumentation data are transferred from theLIS to the ISM and further to various analysis and
visualization tools in an integrated tool environment. Data transfer to the tools is typically accompanied by
an exchange of control signals between theISM and a tool (for instance, as in the Vista toolkit [28]).
Additionally, control messages may need to be passed between theISM and concurrent application
processes (directly or via theLIS) to control program execution as dictated by debugging and steering tools
in the environment [7]. Usually, a consistent instrumentation data and controltransfer protocol (TP) is
used for IS-related communications. A majority of existing monitors use operating system-supported
interprocess communication abstractions (such assockets in Pablo [22] and Issos [21],pipes in Paradyn
[19], and remote procedure calls in TAM [24]) to accomplish this purpose. Some monitors (such as
Hewlett-Packard’s VIZIR [7]) implement customized high-level protocols, developed on top of operating
system functions, to enhance the flexibility and portability of the instrumentation data transfer and control
messaging mechanisms.

6
2.3 Integrated Parallel Tool Environment
A proliferation of parallel program performance analysis, debugging, steering, and visualization tools has
led to the development of several integrated parallel tool environments to enhance the usability of
individual tools [30]. An integrated parallel tool environment supports the use of multiple, possibly
heterogeneous, tools that cooperate for carrying out one or more analyses of the same parallel program.
Tools built by different developers are referred to asheterogeneous tools by Hao et al. [7]. An integrated
environment may support off-line tool usage, such as TAU [2] and ParaVision [20]; homogeneous on-line
tool usage, such as Paradyn [19]; or a combination of the two, such as SPI [1], VIZIR [7], and ParAide
[24]. Malony [18] presents a classification of measurement-based tools comprising four classes: profile-
based (sampling), trace-based, prediction-based, and automated (dynamic, adaptive, or knowledge-based
management). These types of tools, among others, are typically found in integrated environments.
Integrated parallel tool environments rely on particular mechanisms invoked by theIS to capture, process,
and consume instrumentation data. Figure 3 shows the basic technologies in use for tool integration. Tools
are integrated with the support of debuggers, operating systems, languages and compilers, or runtime
libraries to capture execution and program information from the application processes. Operating system
interprocess communication abstractions, such as remote procedure call (RPC), socket, and pipe, are
commonly used for transferring instrumentation data. Graphics libraries and graphical user interfaces, such
as OpenGL, Tcl/Tk, and X/Motif, provide the user with a consistent view and control of the environment.
An IS provides a subset of the functionality of an integrated environment, as can be seen by correlating
Figure 2 with Figure 3. Clearly, theIS plays a central role in integration; it can cause undesirable and
unexpected overhead and perturbation to an application program if its design is not properly evaluated.
2.4 IS Classification
To address the issues related to its design and evaluation, we classify anIS in terms of (1) off-line versus
on-line tool usage, i.e., the time constraints imposed by analysis tools in the environment, and (2)IS
development, management, and evaluation approaches (including any cost models used for evaluation).
These dimensions ofIS classification are defined in this subsection.
Off-line IS: An IS that supports analysis, debugging, and/or visualization of a parallel application program
as a batch process after program execution is called an off-line IS. TheLIS andISM still collect and manage
instrumentation data in real-time for suchISs. TheISM simply stores the data for post-processing.

7
On-line IS: An IS that supports analysis, debugging, steering, and/or visualization of a parallel application
program in real-time, concurrent with application program execution, is called anon-line IS. In this case,
the ISM interacts with the tools and dispatches instrumentation data as soon as on-the-fly preprocessing is
finished. When an on-lineIS supports an integrated tool environment, it maintains a steady flow of runtime
data to the tools.
IS Development: The process of planning, designing, and synthesizing anIS for a particular hardware
platform is collectively referred to asIS development. The multi-step process is mandated in light of the
complexity stemming from system integration issues that need to be addressed.
IS Management: An IS is a combination of theIS components (as defined above) and a set of policies that
dictate component behavior.IS management refers to the policies that are used to schedule various
activities of theLIS andISM parts of the system. These policies may bestatic, adaptive, or application-
specific. Decisions regarding instrumentation data storage in local buffers, communication of data to the
ISM or tools, and usage of shared system resources can greatly impact the performance of user programs.
Therefore, these decisions are instituted via anIS management policy.
IS Evaluation: An IS perturbs the performance of an application program at theLIS level due to data
capturing and forwarding functions. Additionally, the functions at theISM level can introduce excessive
Integration technology sup-ported by a centralized location
ToolsConcurrentprocesses Control
Instrumentation
Control
dataInstrumentationdata
Presentation mechanisms
User interactions
Types of toolsControl mechanisms
Figure 3. Basic components and technologies for a typical integrated parallel tool environment.
• Debugger based• OS based• Compiler based• Library based
• RPC• Sockets• Pipes
• X/Motif• Tcl/Tk• OpenGL
• Performanceevaluation
• Debugging• Steering• Visualization

8
delay between the time that instrumentation data are received by theISM and dispatched to tools. These
overheads are the subject ofIS evaluation.
3 IS Modeling and Evaluation
Now that the concept of an instrumentation system has been elaborated upon, we proceed with the details
of the structured development approach outlined in Section 1. The specification, modeling, and evaluation
of three ISs, PICL, Paradyn, and Vista, are considered in the following subsections as case studies to
illustrate the approach. The PICLIS is modeled to demonstrate proof-of-concept [4]. The Paradyn and
Vista ISs are modeled and evaluated as part of on-going tool development efforts with specific goals and
requirements. The primary objective of the techniques presented here is to answer “what-if” questions to
provide feedback for making design decisions. Investigating such questions with measurement,
experimentation, and analysis of prototype and production systems is often non-trivial.
3.1 PICL IS
Portable Instrumented Communication Library (PICL), designed at Oak Ridge National Laboratory,
provides efficient communication functions that are easily portable to various multicomputer and
distributed computing platforms [4]. Instrumentation is an additional feature, and when combined with a
tool such as ParaGraph, it supports program performance analysis and animation [8]. In order to instrument
an application program, PICL library functions are inserted in the program by the user before compilation.
During program execution, calls to these functions generate instrumentation data in a particular event
record format and log the data in a local buffer of each node. The user specifies the size of the buffer. These
buffers are typically flushed at the end of program execution and merged into a single trace file at the host
system.
Management of PICL’sIS is essential for a long-running program because local buffers will overflow with
the immense amount of instrumentation data generated during program execution. By default, data
collection stops after a buffer becomes full. Local buffers need to be flushed to allow continued data
collection. The objectives ofIS management are: (1) to optimize the use of limited resources, such as local
memory; and (2) to minimize the adverse effects of excessive perturbation due to instrumentation data
buffer flushes. We have identified two management policies for the PICLIS: Flush One buffer when it Fills
(FOF) andFlush All the buffers when One Fills (FAOF). Neither of these is the default policy; and only
FOF is actually supported as a PICL option, however, otherIS developers have favored FAOF. The
objective of modeling and evaluating thisIS is to analyze the overhead of each policy and guide in the

9
selection of an appropriate policy.
3.1.1 System Specifications
Specifications necessary for creating a model of the PICLIS based on the components of Figure 1 are
summarized in Table 1. System requirements place theIS in the class of off-line systems. The platform to
be considered is a distributed-memory parallel system consisting ofP processors. TheLIS is implemented
with an instrumentation library, and theISM andTP provide a means to merge the data as a trace file. The
management policies are static.
3.1.2 TheIS Model
The IS model is diagrammed in Figure 4. The concurrentLIS is modeled as a set of single-server (M/G/1)
queues, one at each processor, as shown in Figure 4. The instrumentation data arrive at local buffers in
response to the occurrence of anevent of interest at a local processor. The capacity of each localM/G/1
buffer is l records; and the inter-arrival times at each of these buffers are assumed independent and
exponentially distributed with rateα. The data in local buffers are transferred dynamically to the host
system when the buffers become full. A larger buffer in the main memory of the host, called themain
instrumentation data buffer, is the next level of the trace data storage hierarchy. At the end of the program,
all trace records are transferred to the main buffer. The main buffer, in turn, may be flushed to the next level
of the storage hierarchy, for example, a disk. The storage capacity is assumed to increase with each level in
the storage hierarchy. The scope of theIS model considered in this paper is restricted only to the local
buffers, but it extends naturally to higher levels of the storage hierarchy.
With this model, we can perform a wide range of experiments using different parameters and calculate
various metrics in order to evaluateIS performance under alternative management policies. Two of the
metrics selected for comparing the FOF and FAOF policies are: (1) length of the time interval after which a
local buffer becomes full and needs to be flushed (trace stopping time); and (2) ratio of the number of
Table 1. Specifications characterizing the PICL instrumentation system.
AnalysisRequirements Platform LIS ISM TP
ManagementPolicy
Off-line Multicomputersystem (e.g.,nCUBE)
Instrumentationlibrary withtrace data buff-ers at each node
Instrumentationlibrary withmerging distrib-uted buffers asa trace file
Parallel I/O Static manage-ment policyimplementedby the program-mer

10
flushes to the number of arrivals for a local buffer during a program’s execution (frequency of buffer
flushes). These metrics represent the lower level quantitative considerations of Figure 1. Each metric, its
method of calculation, and its interpretation are summarized in Table 2. Further evaluation using these
metrics yields higher level feedback to aid in design decisions (see the next section).
A summary of the analytical results for the PICLIS model is presented in Table 3 (See [29] for
derivations). These results compare the FOF and FAOF policies using expected trace stopping time and
flushing frequency for a given arrival rate. The analytical results for the FAOF policy are obtained under
the assumption that the arrival rates at all nodes are identical; and the results for the FAOF policy provide a
theoretical lower bound on trace stopping time and hence an upper bound on flushing frequency.
3.1.3 IS Evaluation
Analytical results for the PICLIS for off-line visualization are based on the observation that the process of
filling and flushing a buffer is a regenerative process. That is, after one cycle of buffer filling and then
flushing at the end of that cycle, the same cycle repeats again, independent of the first cycle. This process
Programs Program Results
p0 p1 p2 pP–1
Localbuffers of
Main instrumentationdata buffer
lengths Qi(t),
Figure 4. Model for a concurrentLIS and ISM developed from PICLIS.
each ofcapacity l
Trace records
Processors
Instrumentation data Instrumentationdata segments
Disk-basedbuffer
Concurrent Computer System
Front-End Host System
Host service facility
Distributed service facility
LIS
ISM (off-line)
pages
Table 2. Metrics for evaluating the PICLIS management policies.
Metric Calculation Interpretation
Trace stoppingtime
Stochastic analysis of arrivals tolocal buffers
A higher value is desirable
Flushing fre-quency
Regenerative nature of buffer fillingstochastic process
A higher value indicates greateroverhead to the user program

11
continues till the end of instrumented program execution. Therefore, the proportion of time spent by the
instrumentation system in the “flushing state” throughout program execution is the same as the proportion
of time spent in this state during one cycle (Smith’s theorem [5, 23]). This result is used to determine the
flushing frequency under either of the two policies [29]. Flushing frequencies for three different arrival
rates are plotted in Figure 5 for variable buffer capacities; these show that the flushing frequency is lower
under the FAOF policy for a given arrival rate. This behavior is more obvious as the arrival rate increases.
These results were compared and validated with simulation and measurement results [29].
The analytical results depicted by Figure 5 indicate that the FAOF policy is preferable with respect to the
frequency of buffer flushes, consequently minimizing the time delays due to flushing operations.
Intuitively, if the arrival rate of instrumentation data at all local buffers is nearly identical, the likelihood of
filling other buffers soon after one buffer fills is very high. Therefore, in the long run, the overall frequency
of flushing will be smaller compared with the FOF policy. On the other hand, the FAOF policy is not easily
τl(i) andτl represent the trace stopping times ati-th buffer under the FOF policy and on all buffers under FAOF policy,
respectively. Capacity of each local buffer isl records. There are totalP processors allocated for the instrumented programunder consideration. Message passing time is a linear function ofl and is represented by the functionf(l).
Table 3. Summary of management policies.
Performance Metric FOF Policy FAOF Policy
Distribution
Expected trace
stopping time
Long-term flushing
frequency
P τli( ) t≤[ ] e αt– αt( ) l
Γ l 1+( )---------------------= P τl t>[ ] 1-e αt– αt( ) l
l!--------------
P=
E τli( )[ ] l
1α---⋅= E τl[ ] minE τl[ ]≥ l
Pα-------=
ωo1
l αf l( )+----------------------= ωa
1l Pαf l( )+--------------------------≤
+o FAOF policy
FOF policy
Figure 5. Comparison of buffer flushing frequencies of the FOF and FAOF policies for three arrivalrates, (a)α=0.0008, (b)α=0.007, and (c)α=2.
(a) (b) (c)
Buffer capacity l Buffer capacity l Buffer capacity l
Flu
shin
g fr
eque
ncy
Flu
shin
g fr
eque
ncy
Flu
shin
g fr
eque
ncy
10 20 30 40 50 60 70 80 90 1000
0.01
0.02
0.03
0.04
0.05
0.06
0.07
0.08
0.09
0.1
10 20 30 40 50 60 70 80 90 1000
0.01
0.02
0.03
0.04
0.05
0.06
0.07
0.08
0.09
10 20 30 40 50 60 70 80 90 1000
0.5
1
1.5
2
2.5x 10
−3
12
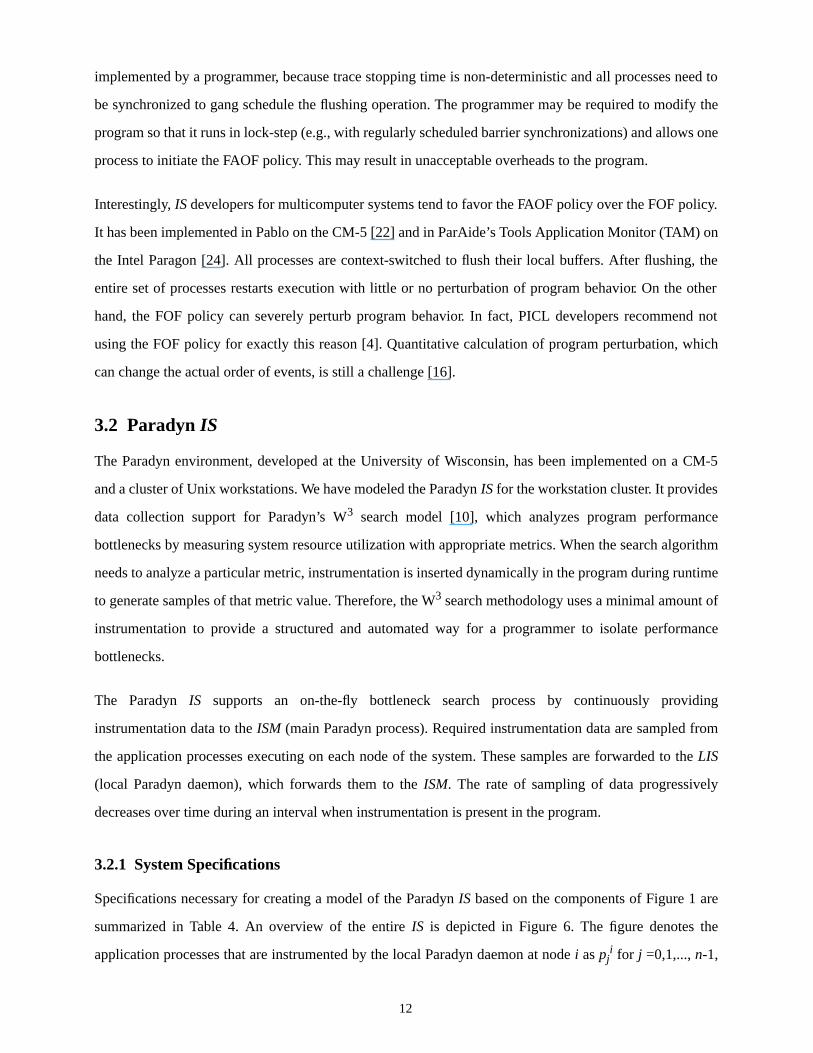
implemented by a programmer, because trace stopping time is non-deterministic and all processes need to
be synchronized to gang schedule the flushing operation. The programmer may be required to modify the
program so that it runs in lock-step (e.g., with regularly scheduled barrier synchronizations) and allows one
process to initiate the FAOF policy. This may result in unacceptable overheads to the program.
Interestingly,IS developers for multicomputer systems tend to favor the FAOF policy over the FOF policy.
It has been implemented in Pablo on the CM-5 [22] and in ParAide’s Tools Application Monitor (TAM) on
the Intel Paragon [24]. All processes are context-switched to flush their local buffers. After flushing, the
entire set of processes restarts execution with little or no perturbation of program behavior. On the other
hand, the FOF policy can severely perturb program behavior. In fact, PICL developers recommend not
using the FOF policy for exactly this reason [4]. Quantitative calculation of program perturbation, which
can change the actual order of events, is still a challenge [16].
3.2 ParadynIS
The Paradyn environment, developed at the University of Wisconsin, has been implemented on a CM-5
and a cluster of Unix workstations. We have modeled the ParadynIS for the workstation cluster. It provides
data collection support for Paradyn’s W3 search model [10], which analyzes program performance
bottlenecks by measuring system resource utilization with appropriate metrics. When the search algorithm
needs to analyze a particular metric, instrumentation is inserted dynamically in the program during runtime
to generate samples of that metric value. Therefore, the W3 search methodology uses a minimal amount of
instrumentation to provide a structured and automated way for a programmer to isolate performance
bottlenecks.
The Paradyn IS supports an on-the-fly bottleneck search process by continuously providing
instrumentation data to theISM (main Paradyn process). Required instrumentation data are sampled from
the application processes executing on each node of the system. These samples are forwarded to theLIS
(local Paradyn daemon), which forwards them to theISM. The rate of sampling of data progressively
decreases over time during an interval when instrumentation is present in the program.
3.2.1 System Specifications
Specifications necessary for creating a model of the ParadynIS based on the components of Figure 1 are
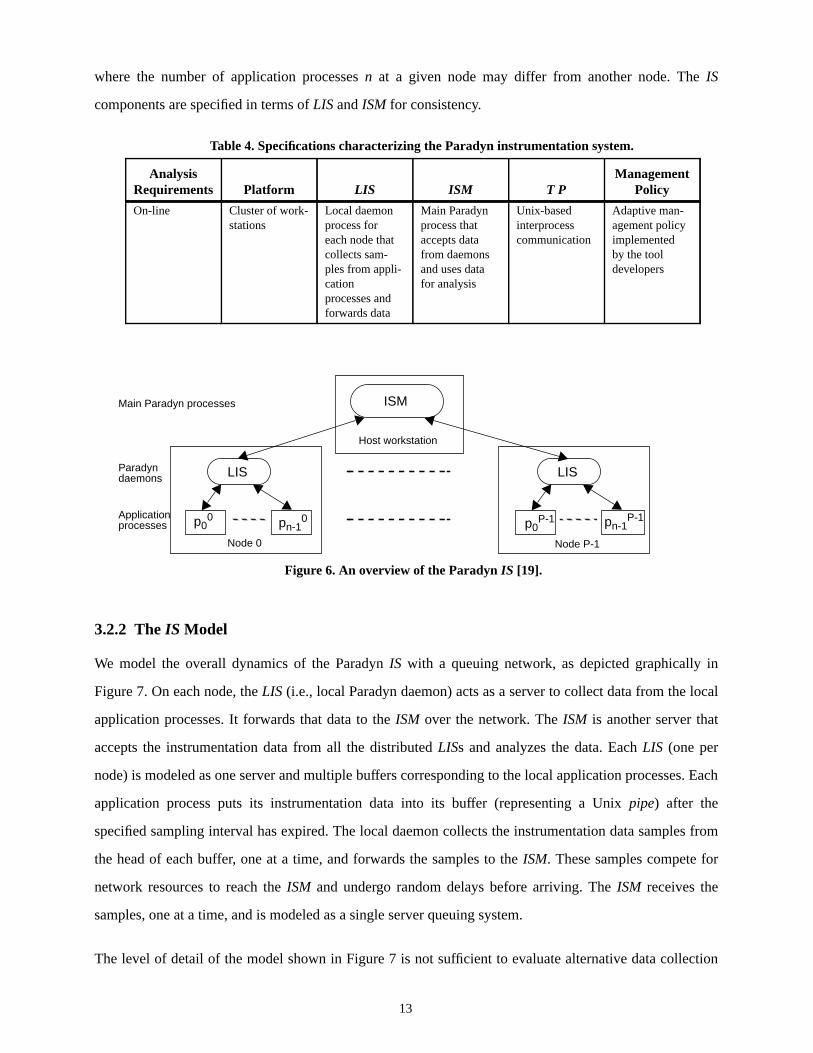
summarized in Table 4. An overview of the entireIS is depicted in Figure 6. The figure denotes the
application processes that are instrumented by the local Paradyn daemon at nodei aspji for j =0,1,...,n-1,
13
where the number of application processesn at a given node may differ from another node. TheIS
components are specified in terms ofLIS andISM for consistency.
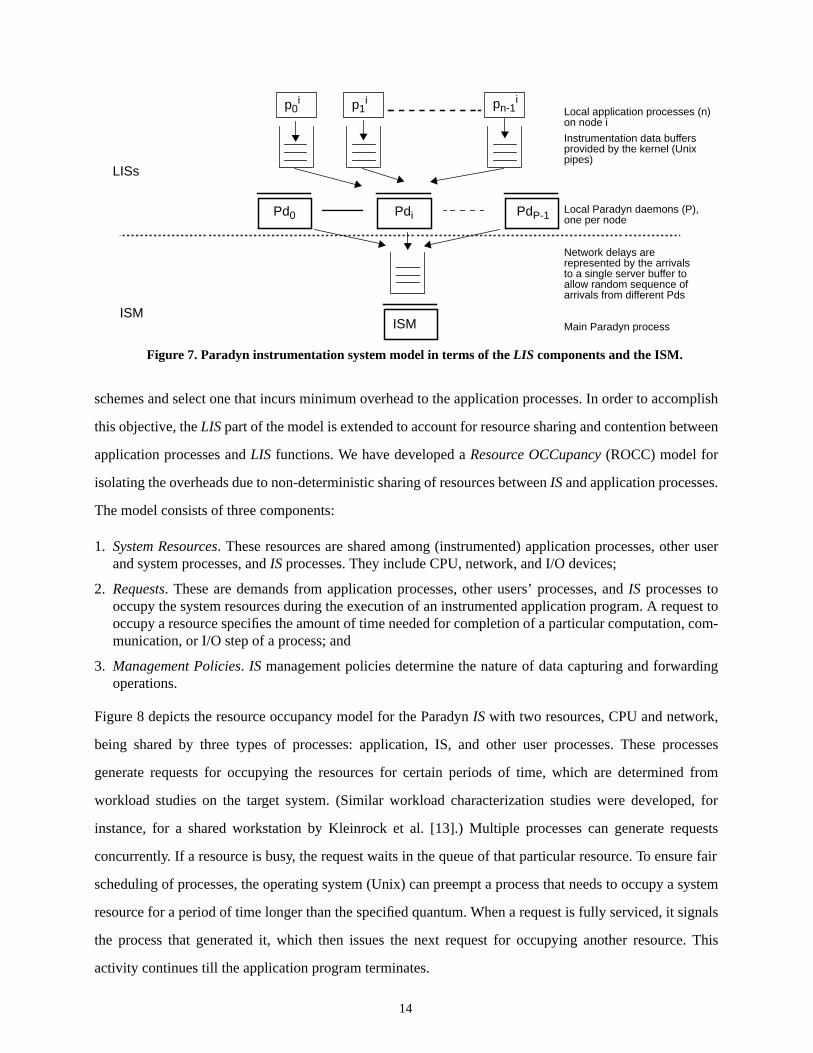
3.2.2 TheIS Model
We model the overall dynamics of the ParadynIS with a queuing network, as depicted graphically in
Figure 7. On each node, theLIS (i.e., local Paradyn daemon) acts as a server to collect data from the local
application processes. It forwards that data to theISM over the network. TheISM is another server that
accepts the instrumentation data from all the distributedLISs and analyzes the data. EachLIS (one per
node) is modeled as one server and multiple buffers corresponding to the local application processes. Each
application process puts its instrumentation data into its buffer (representing a Unixpipe) after the
specified sampling interval has expired. The local daemon collects the instrumentation data samples from
the head of each buffer, one at a time, and forwards the samples to theISM. These samples compete for
network resources to reach theISM and undergo random delays before arriving. TheISM receives the
samples, one at a time, and is modeled as a single server queuing system.
The level of detail of the model shown in Figure 7 is not sufficient to evaluate alternative data collection
Table 4. Specifications characterizing the Paradyn instrumentation system.
AnalysisRequirements Platform LIS ISM T P
ManagementPolicy
On-line Cluster of work-stations
Local daemonprocess foreach node thatcollects sam-ples from appli-cationprocesses andforwards data
Main Paradynprocess thataccepts datafrom daemonsand uses datafor analysis
Unix-basedinterprocesscommunication
Adaptive man-agement policyimplementedby the tooldevelopers
LIS
p00 pn-1
0
LIS
p0P-1 pn-1
P-1
ISM
Figure 6. An overview of the ParadynIS [19].
Applicationprocesses
Paradyndaemons
Main Paradyn processes
Node 0 Node P-1
Host workstation
14
schemes and select one that incurs minimum overhead to the application processes. In order to accomplish
this objective, theLIS part of the model is extended to account for resource sharing and contention between
application processes andLIS functions. We have developed aResource OCCupancy (ROCC) model for
isolating the overheads due to non-deterministic sharing of resources betweenIS and application processes.
The model consists of three components:
1. System Resources. These resources are shared among (instrumented) application processes, other userand system processes, andIS processes. They include CPU, network, and I/O devices;
2. Requests. These are demands from application processes, other users’ processes, andIS processes tooccupy the system resources during the execution of an instrumented application program. A request tooccupy a resource specifies the amount of time needed for completion of a particular computation, com-munication, or I/O step of a process; and
3. Management Policies. IS management policies determine the nature of data capturing and forwardingoperations.
Figure 8 depicts the resource occupancy model for the ParadynIS with two resources, CPU and network,
being shared by three types of processes: application, IS, and other user processes. These processes
generate requests for occupying the resources for certain periods of time, which are determined from
workload studies on the target system. (Similar workload characterization studies were developed, for
instance, for a shared workstation by Kleinrock et al. [13].) Multiple processes can generate requests
concurrently. If a resource is busy, the request waits in the queue of that particular resource. To ensure fair
scheduling of processes, the operating system (Unix) can preempt a process that needs to occupy a system
resource for a period of time longer than the specified quantum. When a request is fully serviced, it signals
the process that generated it, which then issues the next request for occupying another resource. This
activity continues till the application program terminates.
p1i pn-1
ip0i
Pdi
ISM
Pd0 PdP-1
Instrumentation data buffersprovided by the kernel (Unix
Local application processes (n)
Local Paradyn daemons (P),
Network delays arerepresented by the arrivalsto a single server buffer toallow random sequence ofarrivals from different Pds
Main Paradyn process
LISs
ISM
Figure 7. Paradyn instrumentation system model in terms of theLIS components and the ISM.
pipes)
on node i
one per node

15
This model is simulated to determine the overhead due to resource sharing and contention between
application processes and theIS. Of particular interest is a comparison of alternative parameters and
policies forLIS management. Two applicable metrics, their calculation method, and their interpretations
are summarized in Table 5. Here, we consider the metrics with respect to the CPU.Pd (monitoring)
interference, the absolute amount of CPU time required for daemon execution, represents direct overhead
to the application processes. Lower is better. The relative amount of total CPU time used by the daemon
(relative to the application processes),utilizationPd, has a more complicated interpretation in which a
nominal value is best under high application process loads. That is, both high and low values are
undesirable if there is contention from application processes. Relatively high utilization by the daemon
then reflects low availability and thus low throughput (compared to capacity) for application processes.
Conversely, relatively low utilization correlates with high latency in servicingIS requests (monitoring
latency [6]) if the system is saturated. Once again, low throughput for application processes may be the
result in this case due to blocking, as described in Section 3.2.3.
Simulation experiments were set up to analyze the effects of two parameters (factors) associated with the
presentLIS management policy,sampling rate and number of local application processes, on the two
Instrumentedapplicationprocesses
Instrumentationsystemprocess
Otheruserprocesses
CPU
Network
Processes running at aparticular system node thatgenerate requests for occupyingthe system resources
Triggering of subsequent request from the corresponding process
Figure 8. The resource occupancy model for the Paradyn IS to evaluate the overhead to theapplication program due to resource sharing and contention among processes.
time out
CPU requests
Network requests(daemon)
Table 5. Metrics for evaluating the ParadynIS management policies.
Metric Calculation Interpretation
Pd Interference Resource occupancy model Corresponds to direct perturbationof the program; lower is better
UtilizationPd Resource occupancy model Nominal is best

16
performance metrics of interest. We used a 2kr factorial design technique for these experiments, wherek is
the number of factors of interest andr is the number of repetitions of each experiment [11]. For these
experiments,k=2 factors andr=50 repetitions, and the mean values of the two metrics are derived within
90% confidence intervals. Results are plotted in Figure 9. As expected, direct perturbation (i.e., Pd
interference) to local application processes decreases as the sampling rate decreases, that is, as the period
increases. The dependence is superlinear initially, but levels off. CPU utilization by the daemon (i.e.,
utilizationPd) decreases as the number of application processes becomes large.
3.2.3 IS Evaluation
The reduction in CPU utilization by the daemon is mainly due to the round-robin CPU scheduling used by
the Unix operating system. If there are more processes waiting for CPU time in the queue, then within a
given period of time, the daemon process will receive relatively less CPU time. This means that the
daemon becomes a bottleneck as the number of application processes grows. If it can not collect and
forward the instrumentation data samples at a sufficiently high rate, the pipes become full and application
processes, blocked. A similar result is reported by Gu et al. using measurements from their FalconIS to
show that multiple monitoring processes reduce themonitoring latency when the number of application
processes is above a threshold [6]. This is particularly true when local nodes have more computation than
communication capacity as in the case of high performance workstations.
Evaluation of the ParadynIS continues in collaboration with the Paradyn developers, including modeling
of new LIS management policies. We expect that feedback to the developers early in the development
process will lead to better design decisions.
Sampling period (msec) Number of application processes
Inte
rfer
ence
(m
sec)
CP
U u
tiliz
atio
n by
the
daem
on
Figure 9. Interference and utilization metrics calculated with the ROCC model.
50 100 150 200 250 300 350 400 450 5001700
1800
1900
2000
2100
2200
2300
2400
2500
2600
2700
0 5 10 15 20 25 30 350
1
2
3
4
5
6
7

17
3.3 VistaIS
Vista is an experimental, integrated parallel tool environment used for testing novel concurrent system
instrumentation and visualization technologies [25]. We have previously used this environment to integrate
specialized performance analysis tools with generic data analysis and visualization tools to perform off-
line performance analysis [28]. Presently, we are using Vista for on-line performance analysis and
visualization of programs running on a cluster of workstations. Vista includes a testbedIS, which is being
used for studyingIS management policies that control data collection, forwarding, processing, and
dispatching. TheIS is configurable, so different management policies can be instituted dynamically. The
overall goal of the VistaIS testbed (called P´RISM, PaRallel Instrumentation System Management, and
consisting ofLIS, ISM, andTP components) is to enable the user to rapidly prototypeIS designs and select
a policy that meets functional and performance requirements.
The VistaLIS captures instrumentation data from an application process by invoking its instrumentation
library functions. Instrumentation is event-driven, and data related to an event of interest are forwarded to
the ISM without local buffering. The size of this data structure is kept very small to avoid excessive
communication delays. This event record forwarding differs from the context switching and sampling of
the ParadynLIS (which uses a local daemon process).Event forwarding involves only one system call per
event. The data are received and ordered by theISM. To avoid problems due to the lack of a global clock,
we use the technique of assigning logical time-stamps, as implemented by VIZIR [7]. If an arriving event
is in correct causal order, it is assigned a logical time-stamp and stored in an output buffer. When a tool
selected by the user is ready, the processed event information is dispatched to the tool from the output
buffer. If the arriving event is not in causal order, it is added in one (or multiple) input buffer(s) to
reconstruct the causal order of the data before dispatch to a tool. For this type ofISM, it is desirable that
input buffer management and event ordering are efficient, so that the (monitoring) latency between the
arrival of data to the input buffer and the dispatch of data to the output buffer is minimized. Otherwise, the
logical time-stamp will become less accurate and may even perturb the visualizations presented by the
tools.
The evaluation of the VistaIS presented in this subsection focuses on itsISM. We have found remarkably
similar issues addressed by Vista’sISM and Falcon’sISM, where Vista’s is designed for tool integration
and Falcon’s, for program steering.

18
3.3.1 System Specifications
The requirements of the VistaIS for efficient support of an integrated environment impose the constraints
that theIS should haveminimum overheads to the program and the system and should allow the analysis
and visualization tools to presentaccurate program behavior to the users. The tool needs to operate on-
line, with optional storing of data to a disk file for off-line analysis. Presently, theLIS does not support a
local daemon for data forwarding, which avoids the potential bottleneck suggested by the ParadynIS
evaluation in Section 3.2.3. Customized message passing functions support data transfer between theISM
and application processes and theISM and tools. Currently, theIS implements static instrumentation data
management policies; in the future, it will be capable of implementing adaptive policies as well.
Specifications necessary for creating a model of the VistaIS based on the components of Figure 1 are
summarized in Table 6.
3.3.2 TheIS Model
The ISM is modeled first because its performance is deemed critical to obtaining correct and efficient
presentation of program behavior from tools in an integrated environment. The specific objective of this
modeling effort is to guide the developers in selecting one of two possible configurations of theISM that
will guarantee regular receipt of instrumentation data with minimum delays. The two possible
configurations are:Single Input buffer, Single Output buffer (SISO) and Multiple Input buffers, Single
Output buffer (MISO). As the names suggest, theSISO configuration uses one input buffer to store out-of-
order instrumentation data from all the processes, whereas theMISO configuration has one buffer per each
application process. These configurations are commonly used in on-lineISs, for example, Falcon uses the
MISO approach.
The ISM is modeled as a network of two single-server queues. Queuing models for theSISO andMISO
systems are shown in Figure 10. Instrumentation data are assumed to arrive at the input buffer(s) with
exponentially distributed inter-arrival times. The data processor of theISM processes and dispatches this
data according to a normal distribution. The processed instrumentation data are consumed by a tool in a
Table 6. Specifications characterizing the Vista instrumentation system.
AnalysisRequirements Platform LIS ISM TP
ManagementPolicy
On-line/ Off-line
Cluster of work-stations
Instrumentationlibrary withevent forward-ing and no localbuffers
Instrumentationdata processing,forwarding totools, and stor-ing to disk
Unix-basedlibrary func-tions for inter-processcommunication
Static manage-ment policyimplementedby the develop-ers

19
first come, first served fashion.
We have selected two metrics to compare the performance of theISM configurations: data processing
latency and average length of buffer(s).Data processing latency is defined as the amount of time between
the arrival of instrumentation data at theISM and its arrival (after processing) at the output buffer. Lower is
better, since a high latency may result in inaccurate presentation of program behavior by tools.Average
buffer length is defined as the ratio of the total number of instrumentation data records that arrive out of
order (and hence need to be buffered) to the total observation time. A larger value of average buffer length
indicates that many arrivals are out of order due to the management policies implemented by theLIS. A
similar metric, calledhold back ratio has been used by Gu et al. to evaluate the performance of the Falcon
ISM [6]. This metric is defined as the ratio of the number of out-of-order arrivals to the total number of
arrivals (rather than to total time). However, the two metrics provide the same qualitative measure ofISM
performance. Each metric, its calculation, and its interpretation are summarized in Table 7.
The simulation experiments were set up to analyze the effects of theSISO or MISO configuration on the
two performance metrics. Two factors were varied for these experiments: theISM configuration (SISO or
MISO) and the mean inter-arrival time between successive instrumentation data arrivals to theISM. We use
Dataprocessor
Tool
From applicationprocesses
Data transfer to tool
Input (priority)
Output
M/G/1queue
G/M/1queue
Figure 10. Models for theSISO and MISO configurations of the VistaISM.
Exit from the system
Output side
queue
Dataprocessor
Tool
From applicationprocess 0
MP/G/1queues
G/M/1queue
process P-1 Exit from the system
Input side
Output side
Input (priority)queues
Input side
Data transfer to tool
Output(FIFO)queue
(FIFO)queue
The SISO Model The MISO Model
Table 7. Metrics for evaluating the VistaIS management policies.
Metric Calculation Interpretation
Data processinglatency
Queuing model evaluation and sim-ulation
Longer latency may be undesirablefor the tools
Average bufferlength (hold backratio)
Queuing model evaluation and sim-ulation
Higher value indicates a potentialbottleneck in theIS

20
a 2kr factorial design technique for these experiments (as in Section 3.2.2) [11]. For these experiments,k=2
factors andr=50 repetitions, and the mean values of the two metrics are derived within 90% confidence
intervals. This technique was used to evaluate the relative significance of each of the two factors with
respect to a metric.
Data processing latency and average buffer length statistics for the two configurations and various arrival
rates are shown in Figure 11. The data processing latency exhibits higher variance at longer inter-arrival
times (lower arrival rates) for bothSISO andMISO configurations, making them less distinguishable. For
shorter inter-arrival times (higher arrival rates), theSISO ISM has relatively lower latency. Intuitively,
maintenance of multiple buffers should incur more overhead, especially in accessing memory (including
virtual memory), under high arrival rate conditions. The average buffer length follows a similar pattern. At
lower arrival rates, the average buffer lengths are almost the same, but at higher rates,SISO is better than
MISO. This behavior agrees with that observed by Gu et al. for the FalconISM, where the hold back ratio
increases if anLIS has a large local buffer [6]. A large local buffer equates to a high rate of arrival at the
ISM buffer, since, when sent, the result is a burst of arrivals at theISM. We analyzed these results using
principal component analysis techniques [11] and found that the inter-arrival rate is the dominant factor
that affects data processing latency and average buffer length.
3.3.3 IS Evaluation
The results presented in the previous section do not indicate that one configuration is clearly superior to
another. Some researchers favor theMISO configuration (for instance [15]), and tools such as Falcon have
implemented it. However, the models and evaluation presented here suggest that theSISO configuration
10 20 30 40 50 60 70 80 90 100160
170
180
190
200
210
220
10 20 30 40 50 60 70 80 90 1004
6
8
10
12
14
16
18
20
22
Mean inter-arrival times (milliseconds)
Ave
rage
dat
a pr
oces
sing
late
ncy
Mean inter-arrival times (milliseconds)
Ave
rage
inpu
t buf
fer
leng
th
Figure 11. Comparison between theSISO and MISO ISMs in terms of average data processinglatencies and input buffer lengths.
+o MISO system
SISO system +o MISO system
SISO system

21
performs equally well at moderate arrival rates and marginally better at higher arrival rates. In event-driven
monitoring, it is not uncommon for the rate of arrivals to surge during certain intervals, yielding unstable
ISM behavior. Since the VistaIS uses an event-driven approach, a design decision was made to incorporate
the SISO configuration based on this modeling and evaluation feedback. In general, assessing and
validating design decisions with measurements of the operatingIS (i.e., with benchmarking) is an essential
step of the development process and one that we are currently addressing.
The results of the PICL, Paradyn, and Vista case studies demonstrate the utility of the structured
development approach for practicalISs. The major contribution of theIS models is their ability to support
“what-if” analyses to investigate various parameters and policies. Considerable research effort remains to
develop meaningful benchmarks for validating prototype or productionISs.
4 Related Work
Many parallel programming tools use anIS. Cheng [3] has surveyed most of the well-known parallel
program performance analysis and debugging tools. In this section, we introduce theIS development
approaches of various representative parallel tools. These are summarized in Table 8 according to the
following features:off-line or on-line performance analysis and visualization; nature of theLIS andISM
components;hard-coded or application-specific development of instrumentation software;static, adaptive,
or application-specific management of instrumentation data; and any integral evaluation techniques. These
features establish the relevant context for the structuredIS development approach presented in this paper.
PICL and ParaGraph [8] have been used with several environments. PICL [4] is a portable library of
efficient communication functions that also supports instrumentation. Refer to Section 3.1 for discussion of
the PICLIS.
AIMS (Automated Instrumentation and Monitoring System [32]) is a toolkit consisting of an
instrumentation library and a set of off-line performance analysis and visualization tools. ItsIS support is
almost identical to that of PICL. A user can specify different sizes of buffers or usage of flushing functions
in a configuration file as part of a static management policy.
Pablo [22] is an integrated tool environment that offers three types of performance data capturing
functions: (1) event tracing; (2) event counting; and (3) code profiling. If a local buffer is full, all buffers
can be flushed synchronously to a file or to an Internet domain socket. Unlike PICL and AIMSISs, Pablo’s
IS supports adaptive levels of tracing to dynamically alter the volume, frequency, and types of event data

22
recorded. Adaptive management policies ensure that theIS overheads remain low, particularly for the long-
running instrumented programs.
Paradyn [19] is an on-line performance evaluation environment that is based on dynamically updating the
cumulative-time statistics of various performance variables. In addition to implementing a dynamic
management policy, itsIS is equipped with the capability to estimate its cost to the application program
[10]. This cost model is continuously updated in response to actual measurements as an instrumented
program starts executing, and the model attempts to regulate the amount ofIS overhead to the application
program.
Falcon [6] is an application-specific, on-line monitoring and steering system for parallel programs. The
Falcon IS supports dynamic control of monitoring overhead to reduce the latency between the time an
event is generated and the time it is acted upon for the purpose of steering. Various modules and functions
of the IS are specified by a low-level sensor specification language and a higher level view specification
language. Falcon is perhaps the only tool that provides a thorough evaluation of bothLIS andISM parts of
its instrumentation system.
ParAide [24] is the integrated performance monitoring environment for the Intel Paragon. Commands are
Table 8. Summary ofIS features of some representative parallel tools.
Tool
Analysis/Visualization
Support LIS ISMSynthesisApproach
ManagementApproach
EvaluationApproach
PICL Off-line Local buffersusing runtimelibrary
Trace file Hard-coded Static —
AIMS Off-line Library Trace file Hard-coded Static —
Pablo Off-line Library Trace file Hard-coded Adaptive —
Paradyn On-line Local daemon Main Para-dyn process
Application-specific byusing PCL
Adaptive Adaptive costmodel
Falcon/Issos/Cha-osMON
On-/Off-line Resident monitor Centralmonitor
Application-specific
Application-specific
Evaluationof the factorsthat affectperturbation
ParAide(TAM)
On-/Off-line Library Event traceserver
Hard-coded Static Accountableinvasiveness
SPI On-/Off-line Library Event-Actionmachines
Application-specific
Application-specific
Accountableinvasiveness
VIZIR On-/Off-line Library VIZIRfront-end
Hard-coded Static —

23
sent to the distributed monitoring system, called Tools Application Monitor (TAM). TAM consists of a
network of TAM processes arranged as a broadcast spanning tree with one TAM process at each node. This
configuration allows broadcasting monitoring requests to all nodes. Instrumentation library calls generate
data that are sent to the event trace servers, which perform post-processing tasks and write the data to a file
or send them directly to an analysis tool. To minimize perturbation, trace records are stored locally in a
trace buffer that is periodically flushed to the local trace server.
Scalable Parallel Instrumentation (SPI [1]) is Honeywell’s real-time instrumentation system for
heterogeneous computer systems. SPI supports an application-specific instrumentation development
environment, which is based on an event-action model and an event specification language.
Hewlett-Packard’s VIZIR [7] is another integrated tool environment used for debugging and visualizing
of a workstation cluster. This environment utilizes commercially available debuggers and visualization
tools. This environment is an example in whichIS support has been used to integrate heterogeneous tools.
Work has been done on compensating for the effects of program perturbation due to instrumentation [31].
The goal of perturbation compensation is to reconstruct the actual program behavior from the perturbed
behavior as it may be recorded by theIS. Malony et al. [16] describe a model for removing the effects of
perturbation from the traces of parallel program executions.
Presently, it is not standard practice to formally evaluate the performance and functionality of a tool early
in its development. Usability and efficiency studies of prototypical tools are emerging to alleviate this
situation. However, the underlyingIS is removed from the end-user and is part of system infrastructure,
thus necessitating more rigorous evaluation. Moreover, contemporary approaches to evaluateIS overheads
and perturbation do not adequately consider the nondeterministic nature of these effects. The approach
introduced in this paper has addressed these issues.
5 Discussion and Conclusions
This paper has presented a structured approach to evaluate the configuration and the management policies
of an instrumentation system to provide valuable feedback to developers regarding the performance of
their designs. Due to the diversity and complexity of computer systems in general and concurrent computer
systems in particular, many performance analysts agree that there is no such thing as a “theory of computer
system performance evaluation” yet. Performance evaluation of a given computer system is justifiably
referred to as an art [11]. The evaluation process is carried out with respect to specific goals and the subtle

24
behavioral aspects of the system under study by applying appropriate results from multiple, related
disciplines such as statistics, probability theory, queuing theory, operations research, simulation, and so on.
In this paper, we have presented modeling and evaluation approaches for threeISs that serve fundamentally
different requirements. For PICL, we used analytical modeling to calculateIS overheads. Actual
measurements also were possible because theIS already exists. On the other hand, we had to use
simulation models for evaluating the overheads of the Paradyn and VistaISs in their specific contexts
because the actualISs are still at various stages of development and prototyping. While a “universal”
model or evaluation technique that applies to allISs is not practical, one can appreciate the following
commonalities among the three case studies:
• Queuing models are intuitively appropriate to model the dynamics of anIS, just as they are for severalother computer system components and policies, including processor architectures, networks, I/O sub-systems, memory hierarchies, memory management schemes, caching policies, processor schedulingpolicies, communication protocols, and so on.
• A model is established according to high-level requirements of anIS, which aids in specifying the fac-tors and metrics that are important for evaluating performance.
• The primary goal of a model is to support “what-if” analyses regarding the selection of various parame-ters and policies of anIS. If the IS is in production, modeling results can be used to analyze the systemand measurements can be obtained to test their validity. If anIS is being designed or prototyped, simula-tion experiments can be used to investigate various design choices. This is a standard practice in systemdesign [14].
These commonalities point toward the need and the opportunity for applying a structured approach inIS
development. Although specifics will differ for differentISs, the overall approach is represented by Figure
1. This approach provides a basis for developers to institute design decisions that better serve the
requirements.
Most of the extantISs that represent state-of-the-artIS development (listed in Table 8) try to address a
subset of the issues raised in this paper in order to meet their domain-specific requirements. As concurrent
computing is becoming more popular in a growing number of application areas,IS developers are faced
with new challenges. One such challenge is the development ofISs for distributed or embedded real-time
systems [1]. Such systems have to meet stringent timing and performability constraints to be operational,
and theirISs need to incorporate adaptive management and usage of system resources, customizability, and
flexibility. The demands on next-generationISs reinforce the need for a structured approach.
The operation of anIS in a real system is non-deterministic; hence it is not sufficient to collect
measurements to evaluate it. The non-deterministic nature of arrivals, resource usage and contentions, and
computational load on the system may render measurements of limited use. All three case studies

25
presented in this paper used models that do not overlook the random nature of variousIS activities.
Several important areas are being addressed by our on-going efforts inIS development: (1) benchmarking
of ISs to validate that requirements are met; (2) applying structured software engineering methods to map
abstract instrumentation system models to implementations; (3) appropriately characterizingIS workload
to enhance the power and accuracy of the models; and (4) modeling otherISs that are at various stages of
development to augment our suite of case studies using the structured approach.
References
[1] Bhatt, Devesh, Rakesh Jha, Todd Steeves, Rashmi Bhatt, and David Wills, “SPI: An InstrumentationDevelopment Environment for Parallel/Distributed Systems,”to Appear in the Proc. of Int. ParallelProcessing Symposium, April 1995.
[2] Brown D., S. Hackstadt, A. Malony, B. Mohr, “Program Analysis Environments for Parallel Lan-guage Systems: The TAU Environment,”Proc. of the Second Workshop on Environments and ToolsFor Parallel Scientific Computing, Townsend, Tennessee, May 1994, pp. 162–171.
[3] Cheng, Doreen Y., “A Survey of Parallel Programming Languages and Tools,” Report RND-93-005,NASA Ames Research Center, March 1993.
[4] Geist, G., M. Heath, B. Peyton, and P. Worley, “A User’s Guide to PICL”, Technical Report ORNL/TM-11616, Oak Ridge National Laboratory, March 1991.
[5] Gelenbe, E., G. Pujolle, and J. C. C. Nelson,Introduction to Queuing Networks, John Wiley, 1987.
[6] Gu, Weiming, Greg Eisenhauer, Eileen Kramer, Karsten Schwan, John Stasko, and Jeffrey Vetter,“Falcon: On-line Monitoring and Steering of Large-Scale Parallel Programs,” Technical ReportGIT–CC–94–21, 1994.
[7] Hao, Ming C., Alan H. Karp, Abdul Waheed, and Mehdi Jazayeri, “VIZIR: An Integrated Environ-ment for Distributed Program Visualization,”Proc. of Int. Workshop on Modeling, Analysis and Sim-ulation of Computer and Telecommunication Systems (MASCOTS ‘95) Tools Fair, Durham, NorthCarolina, Jan. 1995.
[8] Heath, Michael T. and Jennifer A. Etheridge, “Visualizing the Performance of Parallel Programs,”IEEE Software, 8(5), September 1991, pp. 29–39.
[9] Hollingsworth, J. K. and B. P. Miller, “Dynamic Control of Performance Monitoring on Large ScaleParallel Systems,”Proc. of Int. Con. on Supercomputing, Tokyo, Japan, July 19–23, 1993.
[10] Hollingsworth, J. K. and B. P. Miller, “An Adaptive Cost Model for Parallel Program Instrumenta-tion,” Technical Report, Oct. 1994.
[11] Jain, Raj,The Art of Computer Systems Performance Analysis—Techniques for ExperimentalDesign, Measurement, Simulation, and Modeling, John Wiley & Sons, Inc., 1991.
[12] Kilpatrick, Carol and Karsten Schwan, “ChaosMON—Application-Specific Monitoring and Displayof Performance Information for Parallel and Distributed Systems,”Proceedings of the ACM/ONRWorkshop on Parallel and Distributed Debugging, Santa Cruz, California, May 20–21, 1991.
[13] Kleinrock, Leonard and Willard Korfhage, “Collecting Unused Processing Capacity: An Analysis ofTransient Distributed Systems,”IEEE Transactions on Parallel and Distributed Systems, 4(4), May1993, pp. 535–546.
[14] Law, Averill M. and W. D. Kelton,Simulation Modeling and Analysis, McGraw-Hill, Inc., 1991.

26
[15] Lieu, Eric, personal communications, Hewlett-Packard Labs, Palo Alto, California, June 1994.
[16] Malony, A. D., D. A. Reed, and H. A. G. Wijshoff, “Performance Measurement Intrusion and Pertur-bation Analysis,”IEEE Transactions on Parallel and Distributed Systems, 3(4), July 1992.
[17] Malony, A., B. Mohr, P. Beckman, D. Gannon, S. Yang, F. Bodin, and S. Kesavan, “Implementing aParallel C++ Runtime System for Scalable Parallel Systems,”Proceedings of Supercomputing ‘93,Portland, Oregon, November 15–19, 1993.
[18] Malony, A. D., “Measurement and Monitoring of Parallel Programs,”Tutorial, Sigmetrics ‘1994,Nashville, Tennessee, May 16–20, 1994.
[19] Miller, Barton P., Jonathan M. Cargille, R. Bruce Irvin, Krishna Kunchithapadam, Mark D. Cal-laghan, Jeffrey K. Hollingsworth, Karen L. Karavanic, and Tia Newhall, “The Paradyn Parallel Per-formance Measurement Tools,” Technical Report, 1994.
[20] Nutt, Gary J. and Adam J. Griff, “Extensible Parallel Program Performance Visualization,”Proc. ofInt. Workshop on Modeling, Analysis and Simulation of Computer and Telecommunication Systems(MASCOTS ‘95), Durham, North Carolina, Jan. 1995.
[21] Ogle, David M., Karsten Schwan, and Richard Snodgrass, “Application-Dependent Dynamic Moni-toring of Distributed and Parallel Systems,”IEEE Transactions on Parallel and Distributed Systems,4(7), July 1993, pp. 762–778.
[22] Reed, Daniel A., Ruth A. Aydt, Tara M. Madhyastha, Roger J. Noe, Keith A. Shields, Bradley W.Schwartz, “The Pablo Performance Analysis Environment,” Dept. of Comp. Sci., Univ. of Ill., 1992.
[23] Resnick, Sidney I.,Adventures in Stochastic Processes, Birkhauser, 1992.
[24] Ries, Bernhard, R. Anderson, D. Breazeal, K. Callaghan, E. Richards, and W. Smith, “The ParagonPerformance Monitoring Environment,”Proceedings of Supercomputing ‘93, Portland, Oregon,Nov. 15–19, 1993.
[25] Rover, Diane T., “Vista: Visualization and Instrumentation of Scalable Multicomputer Applica-tions,” Project Summary,IEEE Parallel and Distributed Technology, 1(3), August 1993, pp. 83.
[26] Rover, Diane T., “Performance Evaluation: Integrating Techniques and Tools into Environments andFrameworks,”Roundtable, Supercomputing ‘94, Washington DC, November 14–18, 1994.
[27] Simmons, M., and R. Koskela, editors,Performance Instrumentation and Visualization, ACM &Addison-Wesley, 1990.
[28] Waheed, A., B. Kronmuller, Roomi Sinha, and D. T. Rover, “A Toolkit for Advanced PerformanceAnalysis,”Proc. of Int. Workshop on Modeling, Analysis and Simulation of Computer and Telecom-munication Systems (MASCOTS ‘94) Tools Fair, Durham, North Carolina, Jan. 31– Feb. 2, 1994.
[29] Waheed, A., Vincent Melfi, and Diane T. Rover, “A Model for Instrumentation System Managementin Concurrent Systems,”Proceedings of the Twenty Eights Hawaii International Conference on Sys-tem Sciences, Maui, Hawaii, Jan. 3-6, 1995.
[30] Workshop on Debugging and Performance Tuning of Parallel Computing Systems, Chatham, Mass.,Oct. 3-5, 1994.
[31] Yan, Jerry C. and S. Listgarten, “Intrusion Compensation for Performance Evaluation of ParallelPrograms on a Multicomputer,”Proceedings of the Sixth International Conference on Parallel andDistributed systems, Louisville, KY, Oct. 14–16, 1993.
[32] Yan, Jerry, “Performance Tuning with AIMS—An Automated Instrumentation and Monitoring Sys-tem for Multicomputers,”Proc. of the Twenty-Seventh Hawaii Int. Conf. on System Sciences,Hawaii, January 1994.