Writing scientific English: overcoming intercultural problems
A Strategy for Overcoming Barriers to the Successful
Implementation of Lean Construction in the UK
A dissertation submitted by
Saad Sarhan
Supervised by
Mr. Andrew Fox
This dissertation is submitted to the University of Plymouth in partial fulfilment
of the course requirements for the degree of
MASTER OF SCIENCE IN CIVIL ENGINEERING
School of Engineering
Faculty of Science and Technology
October 2011
Copyright Statement
This copy of the report has been supplied on condition that anyone who consults
it is understood to recognise that its copyright rests with its author and that no
quotations from the thesis and no information derived from it may be published
without the author’s prior consent.

Dedicated to:
Almighty Allah (God) who always blessed me for what I asked and even for what I did not
ask. All the thanks and praises to Allah.
My beloved parents, as without their unconditional love and prayers I was unable to achieve
the goals of my life. Whatever the time it was, their love and warmth protected me like
warmth of the sun in winters and shelter in rain.
Monika: my lovely wife, for her love, support and patience with me all through my
postgraduate study. Without her support and sacrifice, this work was impossible. No words
could describe how much I love you and appreciate you.
Laila: my gorgeous baby girl, whose love enlightened upon me a deeper and newer
understanding of the meanings of Life. She was just 2 months old when I started my
postgraduate study and now she started walking! Thank you very much for giving me the
hope, motivation and inspiration.
My wife’s parents: for supporting me and looking after my daughter. Thank you very much.
Page | I
ABSTRACT
Lean construction efforts could prove to be highly rewarding for the construction industry.
Although various countries gained large benefits by adopting the lean concepts, there seems
to be a scarce implementation of lean in the UK construction industry over the last two
decades even after the publication of the Egan report. Building upon the methodologies and
conceptual frameworks used in earlier work in the UK (Common et al., 2000), the
Netherlands (Johansen et al., 2002), and Germany (Johansen & Walter, 2007), this study
carried out a similar survey to evaluate lean construction as practiced in the UK, and identify
the barriers to its successful implementation.
A theoretical framework was adopted and modified by the author to keep up with the vast
developments made among the lean construction community since previous studies were
carried out; and it formed the basis for a questionnaire survey. The data obtained was then
subject to secondary analysis on top of quantitative and qualitative systematic evaluation. Six
different classifications were established and analysed during secondary stage. This allowed
trends and contrasting views to be determined, and thus more comprehensive findings to be
concluded. After completing the results they were informed further by undertaking interviews
with a number of professionals from the UK construction industry.
It was found that the majority of the construction organisations do not yet have a holistic
view of the full potentials of lean; and that there is still a significant lack of understanding of
how to successfully apply lean principles to construction processes and activities. The study
concluded the significant barriers to the successful implementation of lean construction in the
UK; and proposed a strategy for overcoming the barriers identified.

Page | II
ACKNOWLEDGEMENTS
My sincere thanks to all who helped me achieve the completion of this work. The words
simply could not express them deeply and are never enough.
I take this opportunity to express my sincere gratitude to my Project Supervisor, Mr. Andrew
Fox, for giving me the advice, guidance and confidence that I needed to get this dissertation
into shape. His invaluable advice and support was a source of learning and inspiration for me
throughout this journey.
My sincere thanks to the following people for their valuable assistance and contributions
toward the completion of this project:
o Eric Johansen – Director of Construction at Northumbria University
o Alan Mossman – Lean Consultant / Researcher / Director at: The Change Business Ltd
o Ted Garrison – Certified Professional Speaker / Author / Consultant at Garrison Associates
o Ed Anderson - President at LEAN Implementation Services of Florida
o Richard Dawe - Associate Professor and Programme Manager at Plymouth University
o Abdul-Salam Jafar – Productivity Manager at SKANSKA Balfour Beatty Joint Venture, UK
o Waseem Sattar – Agent at SKANSKA Balfour Beatty Joint Venture, UK
o Andy Marsh - Quality/Continuous Improvement Manager at Eurovia Infrastructure Services

Page | III
AUTHOR’S ACKNOWLEDGEMENT
At no time during the registration for the degree of Master of Science in Civil
Engineering has the author been registered for any other University award without the
prior consent of the Graduate Committee.
The study is the work of the author only.
Signed: ____________________________________________________
Date: _________________
Page | IV
TABLE OF CONTENTS
Abstract I
Acknowledgements II
List of Figures VIII
List of Tables XI
List of Abbreviations
XVII
1.0 Introduction 1
1.1 Aim 1
1.2 Objectives 2
1.3 Structure of the Thesis 3
2.0 Literature Review 4
2.1 Transforming Construction Using Lean Thinking: Lean Construction 4
2.2 The Dissemination of Lean within the UK Construction Industry 7
2.3 Lean Construction Practices in the UK 9
2.4 Barriers to the Successful Implementation of Lean Construction 13
2.4.1 Lack of commitment to change and continuous improvement 14
2.4.2 Fragmentation and subcontracting 14
2.4.3 Procurement and contracts 15
2.4.4 Culture and human attitudinal issues 16
2.4.5 Adherence to traditional management concepts due to time and
commercial pressure
17
2.4.6 Financial issues 17
2.4.7 Predominance of final-based solutions in the thinking of
managers and professionals in construction
18
2.4.8 Lack of top management commitment and support 19
2.4.9 Design/construction dichotomy 20
2.4.10 Lack of adequate lean awareness & understanding 21
Page | V
2.4.11 Educational issues 23
2.4.12 Lack of customer-focused and process-based performance
measurement
24
2.5 How to Evaluate the Effect of Barriers on the Successful-implementation of
Lean Construction?
24
2.5.1 Project performance measurement and benchmarking 25
2.5.2 Project performance measures 26
2.5.3 Key performance indicators (KPIs) in the UK 29
2.5.4 Lean process measurement 30
2.5.5 Other approaches and methods 31
2.6 A Framework for Evaluating LC, as Practiced in the UK 33
3.0 Research Methodology 35
3.1 Introduction 35
3.2 Research Ethics 36
3.3 Research Methodology Adopted 37
3.3.1 Secondary data collection 38
3.3.2 Pilot studies 39
3.3.3 Questionnaire (electronic survey) 39
3.3.4 Interviews 42
3.3.5 Data analysis 43
4.0 Results and Analysis 44
4.1 Introduction 44
4.2 Pilot Studies 44
4.3 Questionnaire (Electronic Survey) 45
4.3.1 Background details: Questions 1-9 45
4.3.2 Secondary analysis 47
4.3.3 Soft aspects of lean: Questions 10-17 49
4.3.4 Hard aspects of lean: Questions 18-28 60
4.3.5 Outcomes of the successful implementation of LC: Questions 29-33 74
4.3.6 Barriers to the successful implementation of LC: Questions 34-35 77
4.4 Semi Structured Interviews 85
Page | VI
4.4.1 Understanding the nature of the significant barriers identified 86
4.4.2 Proposed ideas and strategies for overcoming the barriers identified 89
5.0 Discussion 90
5.1 Introduction 90
5.2 Evaluating LC as Practiced within the Construction Industry 90
5.2.1 Soft aspects of lean 91
5.2.2 Hard aspects of lean 97
5.2.3 Benefits and holistic view of lean construction 104
5.3 Barriers to the Successful Implementation of LC 106
5.3.1 Checking the participant’s agreement to the key barriers identified 107
5.3.2 Identifying the most significant barriers to the successful
implementation of LC 108
5.3.3 Prioritising the barriers identified with the aim of evaluating their
effect on the successful implementation of LC 110
5.4 A Strategy for Overcoming the Significant Barriers Identified 111
6.0 Conclusions and Reflections 113
6.1 Lean Construction, as Practiced in the UK 113
6.2 Barriers to the Successful Implementation of LC in the UK 115
6.3 A Proposed Strategy for Overcoming Barriers to the Successful
Implementation of LC in the UK 117
6.4 Recommendations 118
6.5 Limitations of the Study 119
List of References 120
Appendix 1: Development of the Modified Conceptual Framework 130
Appendix 2: Approaches Used for Conduction Research 135
Appendix 3: Information Sheet for Participants 143
Appendix 4: Feedback Received from Pilot Studies 145
Appendix 5: Background details: Questions 1-9 146
Appendix 6: Organisations’ AAT Classification Results & Analysis 157
Page | VII
Appendix 7: Organisations’ Size Classification Results & Analysis 170
Appendix 8: Organisations’ Major Client Classification Results & Analysis 180
Appendix 9: Years of Experience Classification Results and Analysis 189
Appendix 10: Level of Education Classification Results and Analysis 199
Appendix 11: Current Role Classification Results and Analysis 213
Appendix 12: Survey Report 228
Appendix 13: SPSS Statistical Analysis 270
Appendix 14: Full Transcripts of the Interviews 279
Page | VIII
LIST OF FIGURES
Figure 1.1: The Egan Challenge (Egan, 1998) 1
Figure 2.1: How performance indicators support management actions (Grillo, 1997),
adopted from Alarcón et al. (2001)
27
Figure 2.2: Performance indicators (Grillo, 1997), adopted from Alarcón et al. (2001) 28
Figure 2.3 Factors that effect project success, adopted from Liu & Walker (1998) 28
Figure 2.4: Conceptual Framework (Johansen & Walter, 2007) 34
Figure 2.5: Modified Conceptual Framework (Author) 34
Figure 3.1: Data Collection process adopted for the research study (Author) 37
Figure 3.2: Survey dashboard summary (Author) 40
Figure 4.1: Modal responses of question 16, regarding some lean concepts (Author) 56
Figure 4.2: Comparison between planning and control tools/techniques used by
construction organisations according to their frequency of use (Author)
62
Figure 4.3: Areas of application of LPS within construction organisations (Author) 69
Figure 4.4: Techniques used by construction organisations for performance
measurement (Author)
72
Figure 4.13: Ranking of non-financial measures according to their importance to
construction organisations (Author)
74
Figure 4.14: The frequency output of the barriers to the successful implementation of
Lean Construction, based on the respondents’ viewpoint (Author)
81
Figure 4.15: The ranking of the barriers identified according to their influence on the
successful implementation of Lean Construction, from the respondents’ perspective
(Author)
83
Page | IX
Figure 5.1: Framework for the successful implementation of LC (Author) 91
Figure 5.2: Top 5 benefits of LC according to the respondents’ perspectives (Author) 105
Figure 5.3: The Prioritisation of the barriers identified according to their effect on the
successful implementation of LC (Author)
110
Figure 6.1: The Prioritisation of barriers according to their effect on the successful
implementation of LC in the UK (Author)
116
Figure A1.1: Conceptual Framework (Common et al., 2000; Johansen et al., 2002) 130
Figure A1.2: Updated Conceptual Framework (Johansen & Walter, 2007) 131
Figure A1.3: Modified Conceptual Framework (Author) 132
Figure A2.1: The meaning of Sampling Error (Kothari, 2009) 141
Figure A2.2: Basic Sampling Designs (Kothari, 2009) 142
Figure A5.1: Profession of the participants (Author) 147
Figure A6.1: The evaluation of leaders’ motivation abilities within construction
organisations, based on the organisation turnover sub-classification analysis (Author)
162
Figure A6.2: The evaluation of lean commitment within construction organisations,
based on the organisation turnover sub-classification analysis (Author)
163
Figure A6.3: The amount of ‘successful’ experience with principles of TQM, SCM and
CE, based on the organisation turnover sub-classification analysis (Author)
165
Figure A6.4: Attention to environmental considerations based on the organisations’
turnover sub-classification analysis (Author)
168
Figure A6.5: The relation between the turnover of organisations in Million sterling and
cultural, fragmentation & subcontracting, and educational barriers (Author)
169
Figure A9.1: Level of awareness of the LCI-UK based on the years of experience sub-
classification analysis (Author)
194
Page | X
Figure A9.2: The relation between the awareness of practitioners to the function of the
PPC value and the frequency of using LPS for performance measurement, based on the
experience sub-classification analysis (Author)
198
Figure A9.3: The evaluation of the effect of time & pressure and procurement &
subcontracting barriers on LC, based on the years of experience sub-classification
analysis (Author)
200
Figure A10.1: The evaluation of lean commitment within construction organisations,
based on the education sub-classification analysis (Author)
205
Figure A10.2: The awareness of the importance of adopting LC and supply-chain
assistance to help organisations achieve their environmental considerations, based on
the qualification sub-classification analysis (Author)
210
Figure A10.3: The responses to how social considerations are achieved in construction
organisations, based on the education sub-classification analysis (Author)
211
Figure A10.4: The evaluation of the effect of time & pressure and procurement &
subcontracting barriers on LC, based on the years of experience sub-classification
analysis (Author)
212
Figure A11.1: Level of awareness of the LCI-UK based on the managerial position
sub-classification analysis (Author)
220
Figure A11.2: The responses to how economic success is achieved in construction
organisations, based on the managerial position sub-classification analysis (Author)
225
Figure A11.3: The evaluation of the effect of lack of top management commitment and
cultural barriers on LC, based on the managerial position sub-classification (Author)
226
Figure A11.4: The ranking of the barriers according to their influence on the successful
implementation of LC, based on the academics/researchers point of view (Author)
227
Page | XI
LIST OF TABLES
Table 2.1: KPIs groups and levels (The KPI Working Group, 2000) 30
Table 3.1: Mixed methods approach adopted for the study (Author) 38
Table 3.2: Questionnaire Structure (Author) 41
Table 3.3: Data analysis approach (Author) 43
Table 4.1: Overall Secondary Analysis (Author) 48
Table 4.2: Measurement scale for questions 11-14, based on median values adopted
from Terry & Smith (2011)
49
Table 4.3: Awareness of the LCI-UK (Author) 49
Table 4.4: The level of lean capability building within construction organisations
(Author)
50
Table 4.5: Classifying the organisations’ level of lean capability building (Author) 51
Table 4.6: Evaluating the performance of leaders within construction organisations, in
terms of their ability to motivate people (Author).
51
Table 4.7: Classifying the performance of leaders within construction organisations, in
terms of their ability to motivate others (Author)
51
Table 4.8: The level of lean commitment within construction organisations (Author) 52
Table 4.9: Level of lean awareness and understanding of leadership teams within
construction organisations, obtained through formal training/induction (Author)
53
Table 4.10: Techniques used by construction organisations for developing
collaborative relationships and partnerships (Author)
53
Table 4.11: The level of awareness/understanding of the participants to some
lean concepts and practices (Author)
55
Page | XII
Table 4.12: Results of the statements that the participants should agree with (Author) 57
Table 4.13: Results of the statements that respondents should disagree with (Author) 58
Table 4.14: Tasks set in place to help construction organisations achieve the lean
approach (Author)
59
Table 4.15: Planning and control techniques used by construction organisations
(Author)
61
Table 4.16: Techniques used by construction organisations for minimising uncertainty
in production processes (Author)
63
Table 4.17: Techniques used by construction organisations for planning and organising
the movement of crews and materials, as well as the production processes itself
(Author)
63
Table 4.18: The proportion of construction organisations that have ‘successful’
experience with the management concepts of: TQM, SCM and CE (Author)
64
Table 4.19: Techniques used by suppliers for the provision of materials to construction
sites (Author)
65
Table 4.20: Tools/techniques used by construction organisations to simulate flow by
enhancing coordination and information procedures (Author)
66
Table 4.21: Tools/techniques used by construction organisations to prevent value loss
by reducing inconsistent decision making (Author)
67
Table 4.22: Areas of application of LPS within construction organisations (Author) 68
Table 4.23: Testing the understanding/awareness to the function of the PPC value
within the LPS (Author)
69
Table 4.24: Techniques used by construction organisations for performance
measurement (Author)
70
Page | XIII
Table: 4.25: Prioritising non-financial performance measures according to their
importance to construction organisations (Author)
72
Table 4.26: Mean values of non-financial performance measures for construction
organisations (Author)
73
Table 4.27: Identifying the top five benefits that could be achieved from applying lean
principles to construction (Author)
75
Table 4.28: Practices executed by organisations to help it contribute to the triple
bottom line of economical, environmental, and social sustainability (Author)
76
Table 4.29: The top reasons that ‘pulled’ or would ‘pull’ construction organisations to
the Lean journey (Author)
78
Table 4.30: Barriers to the successful implementation of Lean Construction (Author) 80
Table 4.31: Frequency analysis of the barriers to the successful implementation of
Lean Construction (Author)
82
Table 4.32: Other barriers to the implementation of Lean Construction from the
respondents’ point of view (Author)
83
Table 4.33: Percentage of respondents willing to take part in follow up interview
(Author)
85
Table 4.34: Generic strategy for overcoming the significant barriers identified (Author) 89
Table 5.1: Evaluation of the readiness of construction organisations for progressing
along the lean journey (Author)
92
Table 5.2: Techniques/tasks practiced and set in place to help construction
organisations improve their collaborative relationships and achieve the lean approach
(Author)
94
Table 5.3: Level of awareness of the LCI-UK based on the experience and managerial
position sub-classifications analysis (Author)
95
Page | XIV
Table 5.4: Amount of successful experience that construction organisations have/had
with the concepts of TQM and SCM (Author)
99
Table 5.5: Influence of the barriers identified on the successful implementation of Lean
Construction (Author)
107
Table 5.6: The significant barriers to the successful implementation of LC (Author) 109
Table 5.7: A proposed strategy for overcoming barriers to the successful
implementation of LC (Author)
112
Table 6.1: The significant barriers to the successful implementation of LC in the UK
(Author)
116
Table 6.2: A proposed strategy for overcoming barriers to the successful
implementation of LC in the UK (Author)
117
Table A1.1: Fundamental attributes of a lean approach, adopted and modified by
author from Johansen & Walter (2007)
132
Table A2.1: Contrasting characteristics of qualitative and quantitative research
(Kanbur, 2003; Thomas et al., 2005)
135
Table A2.2: Comparison between Primary and Secondary Research (Dunsmuir &
Williams, 1992)
138
Table A2.3:- Strengths and Weaknesses of Interviews (structured, semi-structured, or
open ended) (Thomas et al., 2005; Bimingham City University, 2006)
139
Table A2.4: Strengths and Weaknesses of Electronic Questionnaire Surveys (Barribeau
et al., 2005)
140
Table A5.1: Profession of the participants (Author) 146
Table A5.2: Location of the participants (Author) 148
Table A5.3: Current role of the participants (Author) 149
Table A5.4: Qualification of the participants (Author) 150

Page | XV
Table A5.5: Years of experience of the participants (Author) 151
Table A5.6: Number of employees within the participants’ organisations (Author) 152
Table A5.7: Areas of operations of organisations (Author) 154
Table A5.8: Average Annual turnover of organisations in £ Millions (Author) 155
Table A5.9: Major clients/customers of the organisations (Author) 156
Table A6.1: Organisation Turn-Over Sub-Classification Results & Analysis (Author) 157
Table A6.2: Level of lean capability learning, based on the organisation turnover sub-
classification analysis (Author)
162
Table A6.3: Level of lean awareness/understanding within organisations, based on the
turnover sub-classification analysis (Author)
163
Table A6.4: The relation between Turnover of Organisations and the frequency of
using LPS for Production Control (Author)
166
Table A7.1: Organisation Size Sub-Classification Results and Analysis (Author) 170
Table A8.1: Major Client Sub-Classification Results and Analysis (Author) 180
Table A8.2: The mean values of barriers identified based on the major client sub-
classification analysis (Author)
188
Table A9.1: Years of Experience Sub-Classification Results and Analysis (Author) 189
Table A10.1: Qualification Sub-Classification Results and Analysis (Author) 199
Table A10.2: The level of awareness of JIT as a supply technique, based on the
qualification sub-classification analysis (Author)
207
Table A10.3: The level of awareness of BIM, based on the education sub-classification
analysis (Author)
207
Table A10.4: The relation between Level of Education / Managerial Position of the
practitioner and the frequency of using LPS for Management Control (Author)
208

Page | XVI
Table A11.1: Current Role within Organisation Sub-classification Results and
Analysis (Author)
213
Table A11.2: The level of awareness of using LPS for production processes, based on
the managerial position sub-classification analysis (Author)
222
Table A11.3: The relation between Managerial Position / Level of Education of the
practitioner and the frequency of using LPS for Management Control (Author)
223
Page | XVII
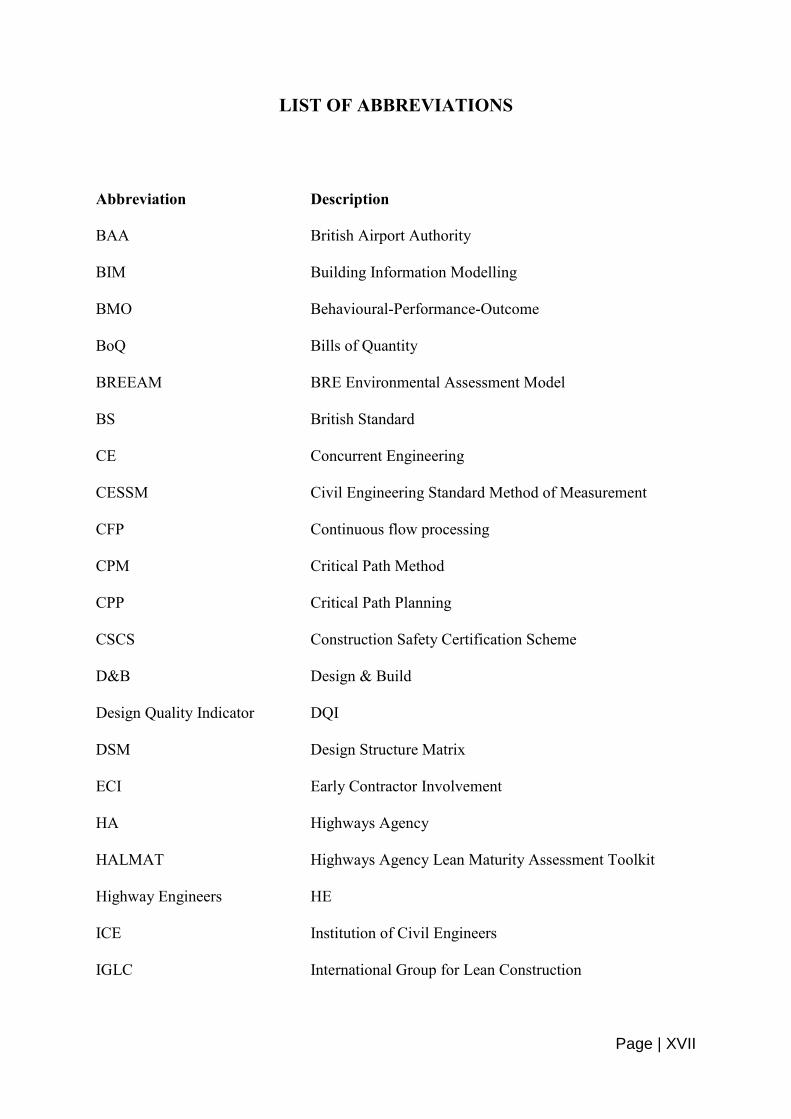
LIST OF ABBREVIATIONS
Abbreviation Description
BAA British Airport Authority
BIM Building Information Modelling
BMO Behavioural-Performance-Outcome
BoQ Bills of Quantity
BREEAM BRE Environmental Assessment Model
BS British Standard
CE Concurrent Engineering
CESSM Civil Engineering Standard Method of Measurement
CFP Continuous flow processing
CPM Critical Path Method
CPP Critical Path Planning
CSCS Construction Safety Certification Scheme
D&B Design & Build
Design Quality Indicator DQI
DSM Design Structure Matrix
ECI Early Contractor Involvement
HA Highways Agency
HALMAT Highways Agency Lean Maturity Assessment Toolkit
Highway Engineers HE
ICE Institution of Civil Engineers
IGLC International Group for Lean Construction
Page | XVIII
IPD Integrated Project delivery
JIT Just in Time
KPI Key Performance Indicator
LC Lean Construction
LCI Lean Construction Institute
LCI-UK Lean Construction Institute in the United Kingdom
LoB Line of Balance
LPDS Lean Project Delivery System
LPS Last Planner System
MIT Massachusetts Institute of Technology
PDCA Plan-Do-Check-Act
PMS Performance Measurement System
PPC Percent Planned Complete
QMPMS Quantitative models for performance measurement systems
RPS Reverse Phase Scheduling
SCM Supply Chain Management
TFV Transformation-Flow-Value generation
TQM Total Quality Management
UK United Kingdom
VDS Virtual Design Studios
VM Visual Management
VR tools Virtual Reality tools
1 | P a g e
CHAPTER ONE - INTRODUCTION
1.0 Introduction
The Construction industry, according to researchers, is seen as a slow progressing industry
with frequent problems, for example low productivity, unsatisfactory quality, time overruns
and poor safety records; such problems obstruct client delivered value (for example, see
Latham, 1994; Egan, 1998). Over the past 60 years, the UK construction industry has been
subjected to various reports with the aim of reviewing its performance and suggesting means
of improvement (Simon, 1944; Emmerson, 1962; Banwell, 1964; British Property Federation,
1983; Latham, 1994). The latest of these was the Egan report „Rethinking Construction‟
which was produced in 1998, due to the increased issues concerning the value that UK
construction clients perceived. It was noted that although various tools and techniques were
seen to be used, the end result from the client‟s perspective was still not satisfactory (Garnett
et al., 1998). At the heart of the Egan report was a desire to develop a change in culture, style
and process of the industry (Blockley & Godfrey, 2000; Forbes & Ahmed, 2011). Based on
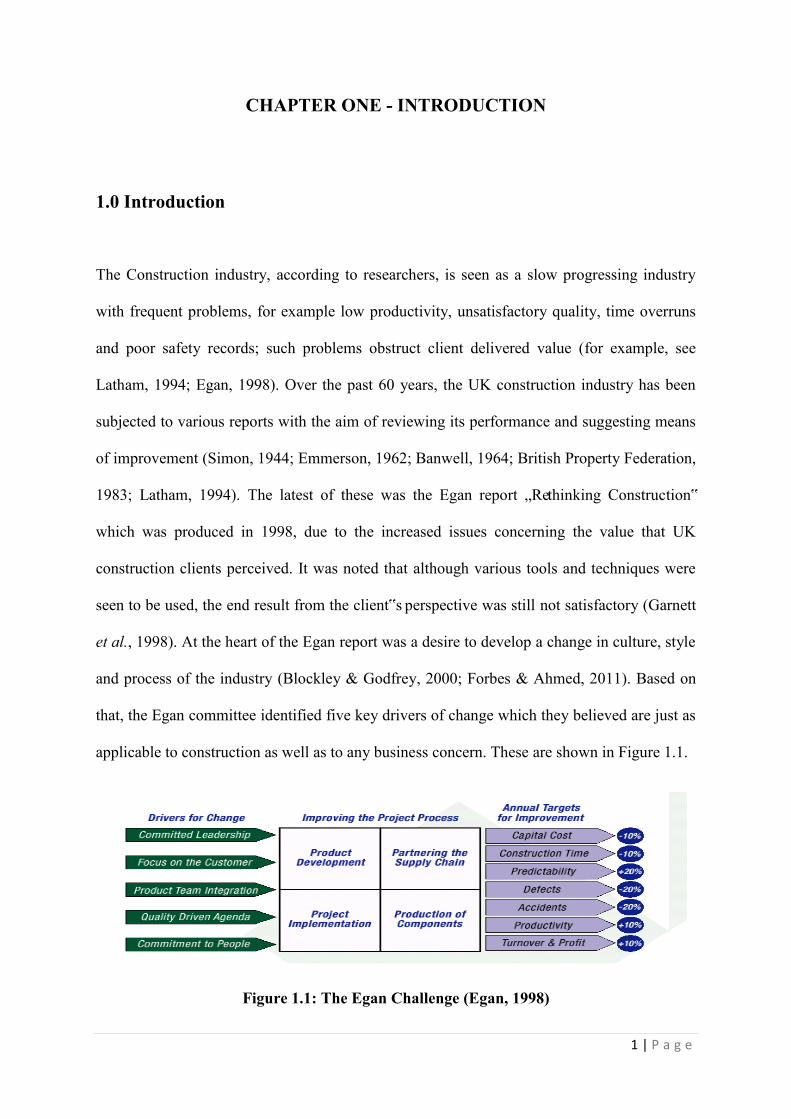
that, the Egan committee identified five key drivers of change which they believed are just as
applicable to construction as well as to any business concern. These are shown in Figure 1.1.
Figure 1.1: The Egan Challenge (Egan, 1998)
2 | P a g e
In addition, the report pointed out some case studies from around the world where
construction was attaining improvement. Amongst these were examples of lean thinking
being applied by other leading companies. Egan (1998) says of Lean:
“Lean thinking presents a powerful and coherent synthesis of the most effective
techniques for eliminating waste and delivering significant sustained improvements in
efficiency and quality.” Furthermore, “we recommend that the UK construction
industry should also adopt lean thinking as a means of sustaining performance
improvement’’
Although engaging in lean construction efforts could prove to be highly rewarding for the UK
construction industry, there has been a scarce implementation of lean over the last two
decades even after the publication of the Egan report (Mossman, 2009; Bashir et al., 2010).
There seems to be some structural and cultural barriers that prevent its successful
implementation.
1.1 Aim
The aim of this research is to evaluate lean construction, as practiced in the UK, to identify
barriers that may prevent its successful implementation and to propose a strategy for
overcoming the barriers identified.
1.2 Objectives The main objectives of this thesis are to:
Review literature relating to lean construction as practiced in the UK;
Identify barriers to the successful implementation of lean construction in the UK;

3 | P a g e
Evaluate the effect of the barriers on the successful implementation of lean construction
in the UK;
Propose a strategy to overcome the barriers identified.
1.3 Structure of the Thesis
The structure of the thesis reflects a conscious choice of organising the work so that it is easy
for the reader to follow. Therefore, to aid the comprehension of this thesis a synopsis of each
chapter is provided below:
Chapter 2 Literature Review
This chapter reviews literature relating to lean construction as practiced in the UK, barriers to
the successful implementation of lean construction, and different performance measurement
methods. Also, a modified conceptual framework will be illustrated by the end of the chapter.
Chapter 3 Research Methodology
This chapter describes the research methodology used in the thesis. Chapter 4 Results and Analysis
In this chapter, the results of the data obtained through the pilot studies, electronic survey and
interviews are summarised and analysed. Also, secondary analysis will be conducted.
Chapter 5 Discussion
In this chapter, the results and findings of the collected data are discussed and examined to
determine both their validity and their impact upon the aims and objectives for this study.
Chapter 6 Conclusions and Reflections
In this chapter the conclusions and the main findings of the study are summarised. Also, some
reflections on the outcomes of the study and recommendations for future research are
provided; followed by a list of references and appendices to support the findings of the study.

4 | P a g e
CHAPTER TWO: LITERATURE REVIEW
2.1 Transforming Construction Using Lean Thinking: Lean Construction
Lean thinking is a philosophy based on the concepts of lean production (Koskela, 1992;
Koskela, 2000). According to Smook et al. (1996), Common et al. (2000), and Mossman
(2009) lean principles date back at least as far as the early 1900‟s, when Henry Ford
introduced the principle of the assembly line that revolutionised car production. In the early
1950‟s, lean production management principles were developed by Toyota led by engineer
Ohno (Womack et al., 1990). Taiichi Ohno, the father of the Toyota Production System,
focused his efforts into finding ways to convert waste „muda‟ into value, and to alter
attentions and thoughts from the narrow focus of craft production on worker productivity and
mass production on machine to the entire production system (Womack & Jones, 1996;
Howell, 1999). According to Womack et al. (1990) the term “lean” was invented by the
research team working on the International Motor Vehicle Programme (IMVP) at
Massachusetts Institute of Technology (MIT) to reflect both the waste reduction nature of the
Toyota production system and to contrast it with craft and mass forms of production.
Alternatively, the first consideration of the ideas of lean production for use within
construction is attributed to Koskela (1992) (Garnett et al., 1998; Mossman, 2009). This
seminal technical-report carefully considered the ideas expressed in the Machine that
changed the World within a construction context (Garnett et al., 1998). Koskela (1992)
formulated the transformation-flow-value generation model of production, known as the TFV
theory of production, which could lead to improved performance when applied to
construction. He proposed the need to review construction production as a combination of
5 | P a g e
conversion and flow processes to remove waste, when traditional thinking of construction
was only focusing on conversion activities and ignoring flow and value considerations
(Garnett et al., 1998; Senaratne & Wijesiri, 2008). Here, 8 types of waste are commonly
agreed up on: Transportation, Inventory, Motion, Waiting, Over-Production, Over-
Processing, Defects, Skills Misuse (Terry & Smith, 2011).
Since then, researchers started working closely with practitioners investigating the TFV
theory and lean techniques (Alves & Tsao, 2007). Also, its publication initiated the formation
of the International Group for Lean Construction (IGLC) in 1993, followed by other
initiatives such as the Lean Construction Institute (LCI) in 1997; to promote lean principles
in construction (Common et al., 2000).
Consequently, Womack and Jones (1996) described the thought process of lean and
established the five principles of lean production. This theoretical foundation is called „Lean
Thinking‟ by them to differentiate from pure production activities (Terry & Smith, 2011).
The five principles of lean are (Womack & Jones, 1996):
1. Specify value from the customer‟s perspective;
2. Identify and integrate the processes that deliver value (value stream). This is the
sequence of processes from raw materials to product (the supply chain). To achieve
this, you need to (i) map the value chain and (ii) eliminate waste;
3. Make value flow by eliminating bottlenecks and disruption. Never stop a value adding
step by a non value adding step;
4. Let the customer pull the product through the manufacturing process. Produce only
what is wanted when it is wanted;
6 | P a g e
5. Pursue perfection through continuous improvement. This is not just restricted to
quality; it is extended to include producing exactly what the customer wants when it is
wanted at a fair price with zero waste
According to Garnett et al. (1998), the work done by Womack and Jones (1996) was seen as
a strategic approach to achieving the lean production system described in the 1990
publication. „‟In a sense it was the general management philosophy alluded to by Koskela‟‟
(Garnett et al., 1998).
Founded in 1997 by Howell and Glenn Ballard, the LCI developed the Lean Project Delivery
System (LPDS) and the Last Planner System (LPS) of Production Control, applying
principles pioneered in manufacturing to construction (Ballard, 2000). The LPDS is divided
into four interconnected phases: project definition, lean design, lean supply, and lean
assembly. The Last Planner system is a tool which concentrates on the planning function of
construction, using functions such as: „Look-Ahead Plan‟ to plan what can be done when
constraints are removed, and the „Percent Planned Complete‟ (PPC) which monitors the
Look-ahead Plan and requires reasons for delays, which are analysed in terms of root causes
(Ansell et al., 2007).
Lean Construction (LC) is a different project management approach because it: has a clear set
of objectives for the delivery process, is aimed at maximizing performance for the customer
at the project level, designs concurrently product and process, and applies production control
throughout the life of the product from design to delivery (Howell, 1999). Abdel-Razek et al.
(2007) believe that the core idea of LC is to reduce or eliminate waste, represented in non-
value adding activities, and increase the efficiency of value adding activities. However,
7 | P a g e
according to Koskela (1992) and Thomas et al. (2002) LC includes: practice of just in time
(JIT), use of pull-driven scheduling, reduction of variability in labour productivity,
improvement of flow reliability, elimination of waste, simplification of the operation, and
implementation of benchmarking.
Evidence of the use of lean thinking has shown that there are benefits to be made from
applying lean principles to construction. These benefits claimed include: improved
productivity, increased reliability, improved quality, more client satisfaction, increased
predictability, shortened schedules, less waste, reduced cost, enhanced build-ability
improvements to design, and improved safety (Lehman & Reiser, 2004; Mossman, 2009).
2.2 The Dissemination of Lean within the UK Construction Industry
According to Johansen et al. (2002), since 1998 the UK construction industry has
seen Government setting up bodies to support it in its drive, inspired by the Egan
report, to improve its financial performance, provide a better product and service to
its customers, and cope with a skills shortage. Also, there have been efforts towards
encouraging the use of lean concepts in construction in most geographical areas of
the UK, such as the seminars staged by CIRIA and CPN (Johansen et al., 2002).
These efforts were extended to include the Construction Lean Improvement
Programme (CLIP) created by BRE in 2003, case studies by Construction
Excellence, the establishment of the LCI-UK, and some LC consultancy and
promotional companies. More recently some organizations and universities offer LC
education, attempting to make lean a part of mainstream education.
8 | P a g e
Despite these continuous efforts, a study by Common et al. (2000) has shown that
there appears to be significantly less lean culture in UK construction companies
than is professed. An even larger gap is evident from the level of development
recognized in the LC literature review in other countries, in comparison to those in
UK (Common et al., 2000). Also, Green & May (2005) state that there is a
noteworthy lack in any empirical research which tests the way leanness is diffused
or enacted in practice. This is emphasised by Bashir et al. (2010) who mentioned
that although various countries gained large benefits by adopting LC concepts, it
does not seem to be generally applied amongst UK construction organizations.
Therefore, the first objective of this study is to evaluate LC as practiced in the UK,
and measure the transferability of lean principles to construction.
Moreover, there is still no agreed definition for LC even within the IGLC and LCI
communities (Mossman, 2009). This is supported by Green & May (2005) who
stated that there continues to be much debate regarding the definition of LC and the
meaning of lean. „‟Any such discussions must start with the ideas of Lean
Production‟‟ (Green & May, 2005). Although Mossman (2009) acknowledged that
the lack of a common understanding and agreed definition of LC may slow down its
take up, he also believed that this may not be a problem; this is as the competing
definitions give an indication of the margin between what could be generally
accepted as lean and what is not. At least, at the moment it is easy to recognise its
absence. Mossman (2009) also suggested that the transformation in thinking is more
important than the definition and is therefore a prerequisite for lean.
9 | P a g e
2.3 Lean Construction Practices in the UK
Implementing lean concepts means applying tools and techniques throughout the processes of
a project; where a theoretical basis is provided through the TFV theory and further aspects of
management theory and complexity theory (Johansen & Walter, 2007).
In UK the British Airport Authority (BAA), has led the way, encouraging its integrated
supply chain to adopt lean practices on airport projects (Mossman, 2009). These practices
included the use of Last Planner System (LPS) for planning and control, creating a single 3D
computer model, and benchmarking to measure performance (Potts, 2008). Potts (2008b)
considers the Terminal 5 (T5) project to be the turning point in embracing the principles of
LC in the UK; this has required a complete change in the mindset and culture of the
participants. However, it is important to stress that a client pull approach (intrinsic
motivation) is considered more effective for the successful implementation of LC than a
client push approach (Henrich et al., 2006).
Additionally, in April 2009, the Highways Agency (HA) Lean Improvement Division was
created, with a focus on delivering the benefits of lean by applying the principles to HA
processes (HA, 2009b). From that time, the HA engaged their supply chain in lean processes
with varying levels of success. Some of the lean improvement techniques they use comprise:
Six Sigma tools such as the DMAICT process improvement method, lean visual
management, collaborative planning using LPS, and the HA lean maturity assessment toolkit
(HALMAT) for assessing supply chain adoption of a continuous improvement culture (HA,
2009a).
10 | P a g e
In 2005, a LC trial was carried out on a highways maintenance project undertaken by a
partnering framework, where a lean programme was produced. Introducing the lean process
to a highways scheme was a challenge because although LC was applied to building projects,
it was seen that a building site is different to the highways construction environment (Ansell
et al., 2007). However, the lean programme comprised three main activities: constraints
analysis, delay analysis and buffer analysis. Also, a weekly plan attainment chart showing the
percentage of activities completed each week against the weekly plan was produced as a bar
chart (Ansell et al., 2007). Ansell et al. (2007) found that both problems and benefits were
encountered in applying lean to the project. Many areas were seen as successful during the
lean pilot scheme and could be carried on as tools to be used on future projects. These
included: the use of a Construction Management Framework (CMF), working in a
collaborative environment, Early Contractor Involvement (ECI) during the design stage, the
appreciation of the value of the constraints analysis, weekly planning, and to some extent the
delay analysis (Ansell et al., 2007). On the other hand, the main problems identified were the
lack of commitment and a good understanding by the team members of lean, and some
misunderstanding of what was trying to be achieved. This addresses the need for developing
system thinking and culture change if lean is to be continued successfully onto other schemes
(Ballard & Howell, 1998; Seymour, 1998; Johansen et al., 2004).
In case of applying LC to construction buildings, Common et al. (2000) carried out a survey
to test the take-up of lean concepts among UK construction companies. In their work they
identified four areas as being fundamental in developing a lean culture: Procurement,
Planning, Control and Management. Within each area they identified a number of techniques
that were seen as being suitable for the successful implementation of LC; namely, Design &
Build (D&B) , Last Planner System, Look-ahead Planning, Supply Chain Management
11 | P a g e
(SCM) and Partnering. The survey showed that there has been some adoption of lean
techniques; nevertheless the problem is that these existed alongside traditional approaches
(Common et al., 2000). Also, the companies implemented a mixture of techniques that were
thought to be lean but which in fact added waste to the process. Examples of these are: using
traditional contracts as a primary route of procurement for most contractors, and critical path
planning (Common et al., 2000). The first contradicts the assumptions that there is a need to
change from a process exchange model to a system that supports the use of concurrent
engineering (CE) principles (Common et al., 2000). The second has been identified by many
researchers as a traditional „push-system approach‟ that creates waste (Howell & Ballard,
1994; Tommelein, 1998; Yang & Ioannou, 2001). That is because the critical path method
(CPM) possesses various deficiencies in scheduling repetitive projects and neglects the
important of production information, such as production rate and work location (Yang &
Ioannou, 2001; Rooke et al., 2007b).
However, the framework mentioned above is considered to be no longer adequate due to the
vast progress made among the lean construction community since the study was carried out
(Johansen & Walter, 2007). Consequently, Johansen & Walter (2007) developed a new
conceptual framework to comprise eight areas: Management, Planning/Control, Behaviour,
Supply, Installation, Design, Collaboration, and Procurement. This framework was only used
to test the range and dissemination of lean concepts among construction companies in
Germany. Therefore, it will be adopted and modified by the author for evaluating LC, as
practiced in the UK (Section 2.6).
In another study, Johansen & Porter (2003) considered how the Last Planner methodology
could be applied to the UK building construction. This included the use of LPS, look-ahead
12 | P a g e
schedules, analysis of percentage Plan completion (PPC) on the weekly targets as the main
metric and involving clients, designers and subcontractors in initial planning. The
methodology had some success in terms of improving structure and control in planning, but
there were structural and cultural barriers identified which need to be addressed before it can
be fully successful in the UK. According to Johansen & Porter (2003), there seemed to be a
cultural issue in getting the subcontractors to adopt the methodology in a comprehensive way.
For instance, some subcontractors actively avoided carrying definite aspects of responsibility
themselves; this was due to commercial pressure and because of their over-confidence in
their relationship with the main contractor (Johansen & Porter, 2003b). These cultural and
structural barriers will be discussed in more depth in the next section.
An important point to stress is that there seems to be an issue on how to interpret the „no
blame‟ culture of the LPS that occurs on the weekly representations of the PPC charts. It was
noticed that some subcontractors would only agree to unchallenging weekly targets, in order
to give themselves an easy time and avoid being blamed (Johansen & Porter, 2003b). The
author suggests that the LPS may need to be updated, so that the PPC chart represented
weekly would show the total integrated results of the whole team instead of showing
individual results. In a discussion with Mr. Alan Mossman on the LCI-UK network on
LinkedIn, he accepted this suggestion:
“That is the recommended approach. A construction site is a system. The system
elements are interdependent - they affect each other so measuring the commitment
reliability (that is what PPC does) of one part of the system without considering the
effects of the commitment reliability of other system elements is unfair, unreasonable
& unjust. PPC is information; it is an indicator and an output of the total system. I
believe it is dangerous to use it as a target - PPC is too easy to manipulate‟‟ 1.
13 | P a g e
Alternatively, there are some other case studies with varying levels of success across the UK
(BRE, 2011). Also, there seems to be good prospects ahead for applying LC concepts to the
UK roofing and cladding industry (Swain & Mossman, 2003).
It is obvious that lean is happening in construction in the UK. There are just a number of
barriers militating against successful lean implementation (Mossman, 2009). Therefore, this
study will focus on identifying the barriers that may prevent the successful implementation of
LC in UK; the author will proceed to propose a strategy for overcoming the barriers
identified.
2.4 Barriers to the Successful Implementation of Lean Construction
Several studies have been carried out in different countries worldwide to identify the barriers
in implementing the LC approach. Some of these studies focused on investigating barriers
that prevent the diffusion and implementation of LC (Johansen & Walter, 2007; Olatunji,
2008; Senaratne & Wijesiri, 2008; Abdullah et al., 2009; Mossman, 2009). Others focused on
identifying barriers that exist during the execution of LC practices (Seymour, 1998; Garnett,
1999; Alarcon et al., 2002; Johansen & Porter, 2003b; Jørgensen et al., 2004; Alarcón et al.,
2005; Ansell et al., 2007).
_______________________________
1 A reply from Mr. Alan Mossman on the author‟s suggestion posted in a topic named: „Needing help for a
better understanding of LC implementation‟ created by the author on the LCI-UK Network on LinkedIn.
Find more discussions at http://www.linkedin.com/groups?about=&gid=1179447&trk=anet_ug_grppro.
14 | P a g e
In a research by Bashir et al. (2010) these barriers were classified into six different
categories: Management issues, Technical issues, Educational issues, Financial issues,
Governmental issues, and Human attitudinal issues. Based on a careful and comprehensive
literature review relating to the barriers in implementing the LC approach, this study
classifies barriers to the successful implementation of LC into twelve different categories, as
will be shown below.
2.4.1 Lack of commitment to change and continuous improvement
The construction industry has rejected before many ideas from manufacturing because of the
belief that construction is different; that is as projects in construction are one-off project
based, more complex and take place under lots of uncertainties and constraints (Salem et al.,
2006). There is a repeated claim that the construction industry is very different than
manufacturing because every product is unique. Egan (1998) does not agree with that claim
because he believes that the construction industry includes lots of repeated processes. The
task force suggests that the construction industry has two options: “to ignore all this in the
belief that construction is so unique that there are no lessons to be learned; or seek
improvement through re-engineering construction, learning as much as possible from those
who have done it elsewhere” (Egan, 1998). Koskela (2000) also, believes that all of these
barriers are just temporary; they may slow down the diffusion but will not impede it.
2.4.2 Fragmentation and subcontracting
Many similar factors in the construction industry of both developed and developing nations,
act as an obstacle to the adoption of LC concepts (Forbes et al., 2002). In both arenas,
fragmentation and subcontracting in construction hinder the incentive for project participants
15 | P a g e
to cooperate and learn together (Mossman, 2009). These participants have different
circumstances and priorities but with one shared objective of successfully completing the
related project (Abdullah et al., 2009). Therefore, it is essential to establish effective
communication between all parties by embarking on the partnering and integrated team-
working route (Thomas & Thomas, 2005). That is because, in the process of implementing
the LC concepts, poor communication will have a negative impact on the effectiveness of the
project delivery and coordination system (Abdullah et al., 2009).
Also, in construction projects, contractors traditionally hire subcontractors. These
subcontractors generally do not have contracts with the client; and may sometimes have to
work with insufficient budgets, even if the client pays a fair price to the main contractor
(Forbes et al., 2002). As a result, this often leads to compromised quality of work. Although,
some clients have tried to overcome these barriers by providing framework opportunities and
partnering contracts, these usually only involve the main participants (Mossman, 2009).
2.4.3 Procurement and contracts
Traditional Procurement methods and contracts undermine the application of lean principles;
because they seem to create adversarial relationships between parties involved (Mossman,
2009), and can add waste to the process (Cullen et al., 2005). According to Cullen et al
(2005), contract forms that allow one party to impose power over another create adversarial
relations. These adversarial relations create transaction costs which are considered waste, and
are thus opposing to the lean philosophy. Mossman (2009) suggests that recent contracts such
as PPC2000, Be, NEC3, and the new JCT-Constructing Excellence Contract are moving in
the lean direction.

16 | P a g e
In addition, Johansen and Walter (2007) stated that any procurement form that tends to
delegate design work to external designers, separates the design from the construction
process; and therefore misses the lean aim of collaboration and integration. Therefore,
selecting a collaborative procurement system with a significant emphasis on concurrent
design and construction, would be recommended for the successful implementation of LC
(Common et al., 2000).
2.4.4 Culture and human attitudinal issues
Applying Lean thinking principles into the construction industry requires a fresh approach in
thinking about the complete process; in order to remove „waste‟, create „continuous flow‟,
and radically enhance „value‟ to the customer. On contrast, the culture of the UK construction
industry is known to be opportunistic, prone to conflict and resistant to change (Rooke et al.,
2003; Rooke et al., 2004). Therefore, changing traditions and behaviour seems to be a
necessary prerequisite for implementing LC in the UK (Seymour, 1998; Garnett, 1999;
Common et al., 2000). Based on researches and case studies conducted by Common et al.
(2000), Alarcon et al. (2002), Johansen and Porter (2003), Johansen et al. (2004), Jorgensen
et al. (2004), Alarcon et al. (2005), Salem et al. (2006), Olatunji (2008), Abdullah et al
(2009), and Mossman (2009), these factors include: lack of commitment, lack of ability to
work in group, lack of self criticism, weak communication and transparency among teams of
the production process, cultural issues in getting the subcontractors and workers to adopt the
methodology in a comprehensive way, fear of taking risk, wrong attitude to change, not
viewing housekeeping as a continuous effort, lack of team spirit among professionals, over-
enthusiastic champions, dependency, lack of incentives and motivation, lack of trust, and fear
of blame and contractual disputes.
17 | P a g e
2.4.5 Adherence to traditional management concepts due to time and
commercial pressure
One of the main barriers to the successful implementation of LC is the tendency of
construction firms to apply traditional management concepts as opposed to productivity and
quality initiatives (Abdullah et al., 2009). According to Common et al. (2000), it seems that
commercial pressure to do the deal takes place over production issues. For that reason,
Mossman (2009) advises companies not to wait for a crisis to make efforts to change;
because it would be then too late to learn news skills and new ways of thinking.
Consequently, Abdullah et al. (2009) stresses that if construction firms keep stuck to their
current management concepts, as they are satisfied with achieving their intended objectives,
they will become reluctant to any changes even though these changes may be able to improve
their performance and increase their quality and productivity rates.
2.4.6 Financial issues
The successful implementation of LC requires adequate funding to provide relevant tools and
equipments, sufficient professional wages, incentives and reward systems; investment in
training and development programmes, and perhaps employing a lean specialist to provide
guidance to both employers and employees during the initial implementation (Bashir et al.,
2010).
Studies conducted by Dulaimi and Tanamas (2001), Olatunji (2008), and Mossman (2009)
have revealed some common financial barriers that need to be carefully addressed. These
include: inflation, inadequate funding of projects, unstable markets for construction, lack of
basic sociable amenities required for facilitating the lean implementation, lack of incentives
18 | P a g e
and motivation, low professional remuneration, unwillingness of some companies to invest
extra funds to provide training for their workers more than the essential legislation
requirement.
2.4.7 Predominance of final-based solutions in the thinking of managers
and professionals in construction Rooke et al. (2007) emphasised that the most successful production management solutions
are flow based ones; and that adherence to substance thinking poses a significant barrier to
achieving progress in the construction industry.
An example of this in the UK, is the use of bills of quantity (BoQ) based on the Civil
Engineering Standard Method of Measurement (CESSM). That is because there are two
problems that exist with CESSM based bills. First, aggregating the BoQ items into self-
contained construction operations is done by client representives and may not match the way
the contractor intends to do the works (Hoare & Broome, 2001). Second, lack of transparency
in the way that prices are made up as to the contractor‟s assumptions about profit and quality
of work (Rooke et al., 2007a).
Those two problems mentioned above could lead to price variations and delivery difficulties.
Therefore, the use of claims management could be recommended. Even though it is argued
that contractors tend to use more effort on gaining profit from claims than from improved
construction methods, tackling the claims culture could be an important step towards
increasing productivity, and providing conditions in which LC would be successfully
implemented (Rooke et al., 2003; Rooke et al., 2004).
19 | P a g e
Another alternative supported by Hoare & Broome (2001) could be replacing the BoQ with
the activity schedule included in the Engineering and Construction Contract (ICE, 1998).
According to Rooke et al. (2007) this method of mesurement involves pricing activities rather
than quantities, thus allows price to be more closely linked to the actual process of
costruction. They consider both: the activity schedule and claims planning as examples of
flow metaphysics, as opposed to the CESSM which is idenified as an object metaphysics by
them.
2.4.8 Lack of top management commitment and support
The successful implementation of LC or any new innovative strategy needs to be supported
by top management. Top managers have to provide sufficient time and resources to develop
an effective plan, and manage changes arising from the implementation process (Bashir et al.,
2010). Although studies carried out by Abdullah et al. (2009), and Alinaitwe (2009) have
identified lack of top management leadership and commitment as a main barrier to the
implementation of LC, Mossman (2009) believes that the problem exists with middle
management not top mangement. For middle managers the benefits are not very clear and
their training and experience is not sufficient to provide them with the ability to manage
change in thinking, responsibility and roles (Mossman, 2009). Alternatively, benefits for top
mangement from imlementing LC concepts are very clear: increased productivity, reduced
time and accidents (Mossman, 2009). However, several studies reported various management
related issues such as: poor planning, lack of delegation to enhance work flow, poor
understanding of customer needs, lack of a participative management style for the workforce,
logistics‟ problems, absence of look-ahead planning and poor coordination (Shammas-Toma
et al., 1998; Johansen & Porter, 2003b; Olatunji, 2008; Alinaitwe, 2009).
20 | P a g e
2.4.9 Design/construction dichotomy
Design and planning are identified as major attributes of the process of LC. Any ignorance to
the importance of these could lead to disastrous loss of time, cost and the overall process
(Common et al., 2000). Due to traditional contractual procedures, design and implementation
of design are treated as separate products (Rooke et al., 2007a). This causes a conflict border
between the two phases and creates lots of waste such as: incomplete and inaccurate designs,
rework in design and construction, lack of buildable designs, final products with significant
variation from values specified in the design, and disruption to contractors due to design
changes made by designers (Shammas-Toma et al., 1998; Rooke et al., 2007a).
According to Seymour and Rooke (2000) designers usually ignore the production conditions
in which their designs will be implemented. There is an argument on how to solve
uncertainties of work on site and on how quality could be achieved. Some view the
attainment of quality as a factor of relationships and good coordination, while others see it as
a matter of strict adherence to specifications and codes (Shammas-Toma et al., 1998).
A suggested solution to this design/construction dichotomy could be the use of the British
Standard (BS) 5606:1990 (Seymour & Rooke, 2000; Rooke et al., 2007a). The BS 5606
provides a formula for site personnel to calculate the consequences for the achievement of
specified tolerances. Also, designers can make adjustments in their specifications to code
recommendations if they anticipate circumstances on site that will make strict adherence to
the code difficult or impossible. However, this still requires good collaboration and
coordination between the two parties, and is subject to the multiple vagaries of inter-personal
relations on site (Seymour & Rooke, 2000; Rooke et al., 2007a).
21 | P a g e
Another suggestion by Shammas-Toma et al. (1998) is giving the contractor the
responsibility for the re-inforcement detailing. According to them, designers themself
acknowledged their limitation in producing buildable reinforced concrete designs; where poor
detailing can account for about 20% of reinforcement which in turn is about 25% ofthe
contract. This suggestion may lead to improved constructability, and gives the contractor
some control during the design phase; this involvement could also encourage the takeup of
D&B contracts (Shammas-Toma et al., 1998).
However, One Promising aspect is the tendency in the construction industry to adopt
integrated design to enhance performance and add value to the final products. There are two
opposing views regarding the way to adopt traditional design practices to the new trend of
work (Forgues & Koskela, 2009). Promoters of sustainable construction hypothesize that it is
a matter of developing from a sequential to an iterative design process; but the British
government argues that a change to the context in which the design is realized is essential and
requires a change in how projects are procured (Forgues & Koskela, 2009). Findings by
Forgues and Koskela (2009) demonstrated that: problems with integrated design team
efficiency are related to context and not process, traditional procurement processes strengthen
socio-cognitive barriers that hinder team efficiency, and new collaborative procurement
approaches help to mitigate socio-cognitive barriers and improve integrated design team
performance.
2.4.10 Lack of adequate lean awareness & understanding
Lean thinking principles have been adopted from manufacturing sectors to the construction
industry (Eriksson, 2009). Therefore, many LC principles and techniques are referred to those
contained within lean manufacturing. However, there is a debate on the extent to which
22 | P a g e
methods of lean production are applicable to LC (Green, 1999a; Green, 1999b; Howell &
Ballard, 1999; Green, 2000). Some lean production measures may not be equally applicable
in construction and may need to be amended (Eriksson, 2009). Abdullah et al. (2009)
suggests that it is essential to have a full comprehension about lean manufacturing concepts
in advance, in order to be able to clearly understand the concept of LC.
Also, many studies have reported the lack of exposure on the need to adopt LC, and
difficulties in understanding its concepts to be significant barriers to the successful
implementation of LC (Johansen et al., 2002; Johansen & Porter, 2003a; Ansell et al., 2007;
Abdullah et al., 2009). This could be due to the lack of a shared and agreed definition or
understanding of what is meant by lean (Green, 1999a; Jørgensen & Emmitt, 2008;
Mossman, 2009). Eriksson (2009) does not agree with that because he believes that the
definition and understanding of LC, as for other innovative management practices like
partnering, would be best developed by investigating its core elements.
In addition, LC has introduced to the construction industry the usage of new tools and
techniques, which have a distinct difference when compared to those used in traditional
practices. According to Abdullah et al. (2009) these differences have to be clearly understood
in order for them to be optimally utilised. However, several researchers believe that lean is
more than tools or techniques; instead it requires a transformation in thinking, collaboration,
flexibility, commitment, discipline, and a broad system-wide focus (Rooke et al., 2007a;
Mossman, 2009; Terry & Smith, 2011). Lean has to be implemented across the business and
value chain to deliver the promised results; any isolated efforts may even cause waste (HA,
2009b).

23 | P a g e
A study by Common et al. (2000) revealed that there is a considerable lack of understanding
to the fundamental concepts and application of lean within UK construction companies. For
instance, a minority of respondents considered that the lean concept is not suitable for the
construction industry because of the demands from clients for quicker and cheaper projects.
This is inconsistent with the principles of lean of eliminating waste to reduce time and cost,
and add value to the client.
Also, many companies that professed to be applying LC principles seemed to combine
traditional techniques with those that are considered lean. A typical combination was the use
of traditional contracting, critical path planning and SCM. Although SCM and partnering are
important attributes to the successful implementation of LC, the use of traditional contracting
and critical path planning (CPP) hinders their effects. That is because both traditional
contracting and critical path planning have been identified as contributors of waste in
construction (Common et al., 2000; Johansen & Walter, 2007). Furthermore, only a few
companies recognized the importance of design and planning to the process of LC.
2.4.11 Educational issues
Although there have been several efforts to provide awareness and guidance to LC by
researchers, academics, practitioners and professional bodies in the UK and some other
countries, it seems that educational barriers could pose a great threat to the sustainable
implementation of LC (Bashir et al., 2010).
Some of these barriers include: lack of technical skills, ignorance to human resource
management and development, inadequate training, poor understanding and awareness, poor
team-work skills, illiteracy and computer illiteracy (Green, 1999a; Alarcon et al., 2002;
24 | P a g e
Johansen & Porter, 2003b; Jørgensen et al., 2004; Olatunji, 2008; Abdullah et al., 2009;
Mossman, 2009).
2.4.12 Lack of customer-focused and process-based performance
measurement systems
There is an industry tendency to measure performance in terms of time, cost and meeting
code; but very limited consideration has been subjected to client satisfaction (Forbes et al.,
2002). These traditional performance prefrences measured in projects, specifically costs and
schedule, are not appropriate for continuous improvement because they are not effective in
identifying the root-causes of quality and productivity losses (Alarcon & Serpell, 1996). This
issue will be discussed comprehensively in the following section.
2.5 How to Evaluate the Effect of Barriers on the Successful
Implementation of Lean Construction?
The implementation of LC needs to be appropriately managed and controlled to increase the
chances of success (Alinaitwe, 2009). In some countries, the application of lean principles to
construction has not been successful due to the many barriers to its successful
implementation (Alinaitwe, 2009). These barriers could affect the application process of LC,
hinder the project performance, and lead to disastrous results if not properly managed
(Alinaitwe, 2009). By not understanding the factors that affect the successful implementation
of LC, organizations will not be able to know what improvement efforts need to be made,
where these efforts should be focused, or which efforts could obtain best results (Leong &
Tilley, 2008). For this reason, this study will conduct a thorough investigation of the
25 | P a g e
performance measurement systems that could be used to control and evaluate the effect of
barriers on the successful implementation of LC.
2.5.1 Project performance measurement and benchmarking
The use of simple and well-designed performance measurements and procedures is very
important to achieving proper managing, control, and evaluation of variations and
improvements (Alarcón & Serpell, 1996). That is because performance measurement
provides the information required for process control, and makes it feasible to set up
challenging goals (Lantelme & Formoso, 2000; Moon et al., 2007). It is also necessary to
support the successful implementation of business strategies (Lantelme & Formoso, 2000),
such as the application of LC. Correspondingly, benchmarking allows managers to constantly
improve processes and compare their existing performances against others that expertise in
such processes elsewhere. Neely et al. (1996) define performance measurement as „‟the
process of quantifying effectiveness and efficiency of action ‟‟. Effectiveness is the extent to
which a target is achieved (e.g. client satisfaction) with resources applied (Neely et al., 1996;
Cheng et al., 2009). Efficiency is the evaluation of how economically the resources are
utilised to meet client requirements (Neely et al., 1996).
Without the use of appropriate performance measurement systems (PMSs), it becomes very
difficult for organizations to understand why poor performance continues, or how
improvement could be achieved (Leong & Tilley, 2008). Also, without PMSs, managers
cannot know whether they will be able to achieve their objectives and goals or not (Neely et
al., 1996). According to Chrysostomou (2000) „‟to manage you must measure, if you don‟t
you are only practising‟‟; cited in Alarcón et al. (2001). This points out that the selection of
26 | P a g e
appropriate measures has a major influence on the implementation of strategies, and is
essential for the development of improvement programmes (Lantelme & Formoso, 2000).
2.5.2 Project performance measures
Traditional Performance measurement systems are based on financial measures (Lantelme &
Formoso, 2000; Suwignjo et al., 2000). The latter are result-oriented performance indicators,
and have been strongly criticised by many researchers (Alarcón et al., 2001; Mitropoulos &
Howell, 2001; Takim & Akintoye, 2002; Costa et al., 2004; Moon et al., 2007; Nudurupati et
al., 2007; Leong & Tilley, 2008). That is because these parameters are backward focused
(Lantelme & Formoso, 2000). They are not measured until project is complete; and thus the
information obtained arrives too to take any corrective actions (Alarcón & Serpell, 1996;
Moon et al., 2007). As a result, these outcome based indicators cannot be used to identify
barriers or problems that exist during the execution of processes. According to Alarcón et al.
(2001) traditional control systems focus their attention in conversion activities and ignore
flow activities; therefore nearly all non value-adding activities become invisible.
Instead, Costa et al (2004) recommends the use of leading measures aiming to give early
warnings, identify barriers and potential problems, and emphasize the need for future
investigation. This recommendation is supported by Neely et al. (1996) who asserted the
need to adopt formal process based approaches. Also, it is important to use measures for
tracking improvement not reporting (Terry & Smith, 2011). Measurement alone is not
enough; it is essential to analyse these indicators with the objective to detect the problems
and their root causes (Alarcón et al., 2001). This approach enables managers to identify
strong and weak areas, and thus make more effective decisions (Figure 2.1).

27 | P a g e
Figure 2.1: How performance indicators support management actions (Grillo, 1997),
adopted from Alarcón et al. (2001)
Grillo (1997), cited in Alarcón et al. (2001), proposed a model that shows how that different
processes, variables and decisions that interact during a project execution influence the result
of a project (Figure 2.2). Based on this figure below, performance indicators were classified
into three different types (Alarcón et al., 2001) :
Results: indicators to measure the level of success that a project has achieved, at the
end of a project (e.g. cost and schedule deviations).
Process: indicators that have the objective of measuring processes that occur
throughout the project such as: procurement, design, planning and construction.
Variables: these are decisions, strategies, and others that are not process indicators but
have an effect on the performance of the project (e.g. types of contract, subcontractor
ratio).
28 | P a g e
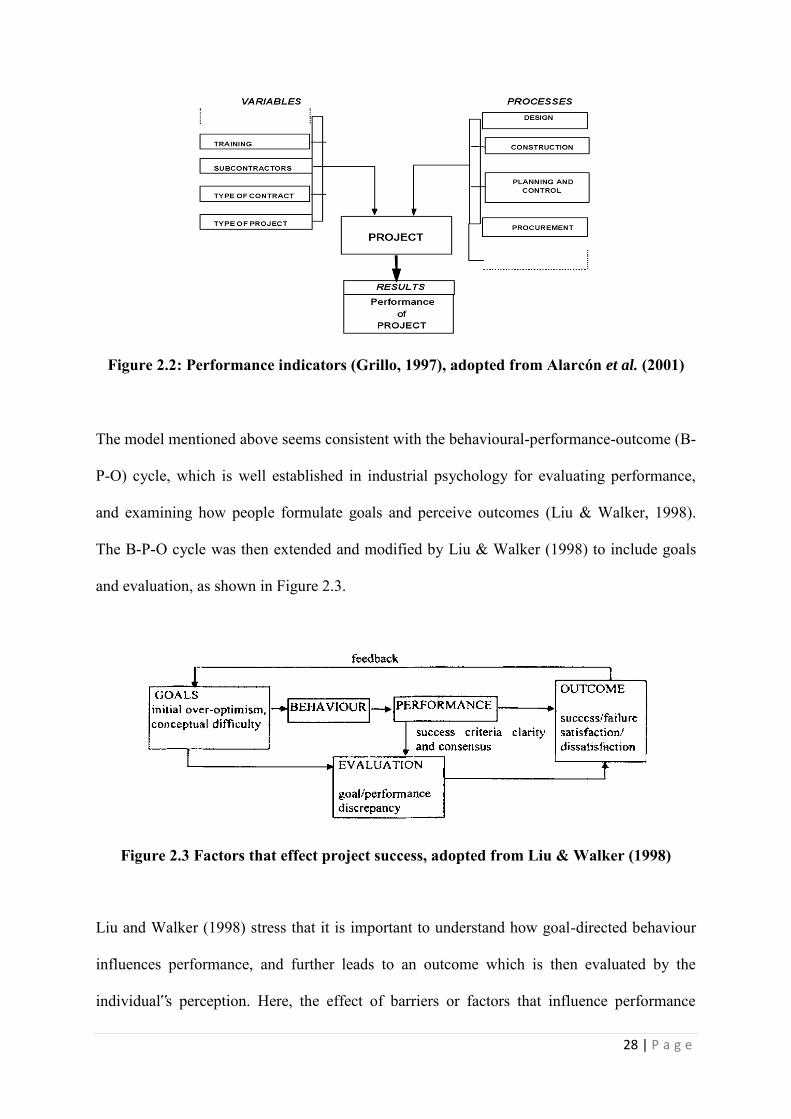
Figure 2.2: Performance indicators (Grillo, 1997), adopted from Alarcón et al. (2001)
The model mentioned above seems consistent with the behavioural-performance-outcome (B-
P-O) cycle, which is well established in industrial psychology for evaluating performance,
and examining how people formulate goals and perceive outcomes (Liu & Walker, 1998).
The B-P-O cycle was then extended and modified by Liu & Walker (1998) to include goals
and evaluation, as shown in Figure 2.3.
Figure 2.3 Factors that effect project success, adopted from Liu & Walker (1998)
Liu and Walker (1998) stress that it is important to understand how goal-directed behaviour
influences performance, and further leads to an outcome which is then evaluated by the
individual‟s perception. Here, the effect of barriers or factors that influence performance
29 | P a g e
could be evaluated by the relationship between the realised performance level and the
expected performance (goal) level; where clarity of success criteria and consensus are vital
for the evaluation process to take place at each level successfully (Liu & Walker, 1998).
2.5.3 Key performance indicators (KPIs) in the UK
In order to help organisations move towards best practice in response to the Egan‟s report
(1998), the UK working groups on KPIs identified a set of non-financial parameters for
benchmarking projects (Takim & Akintoye, 2002; Sikka et al., 2006). These KPIs are
classified into three levels, namely, headline, operational, and diagnostic (Costa et al., 2004;
Nudurupati et al., 2007). The KPI groups and their associated indicators are shown in the
Table 2.1 below. Headline indicators provide a measure of the overall health of a firm.
Operational Indicators bear on specific aspects of a firm‟s activities and should enable
management to identify and focus on specific areas for improvement. Diagnostic Indicators
provide information on why certain changes may have occurred in the headline or operational
indicators and are useful in analysing areas for improvement in more detail (The KPI
Working Group, 2000).
Despite the initiatives of the KPI programme, there are some problems identified in the KPIs.
For instance, none of the measures mentioned could identify the performance of suppliers in
a project environment (Takim & Akintoye, 2002; Costa et al., 2004). Also, there are no
suggestions for performance indicators in benchmarking projects at the project selection
phase, such as the analysis stage (Takim & Akintoye, 2002). For this reason, Takim &
Akintoye (2002) suggests that the successful construction project performance can be
devided along three orientations: procurement, process, and results oriented. A similar
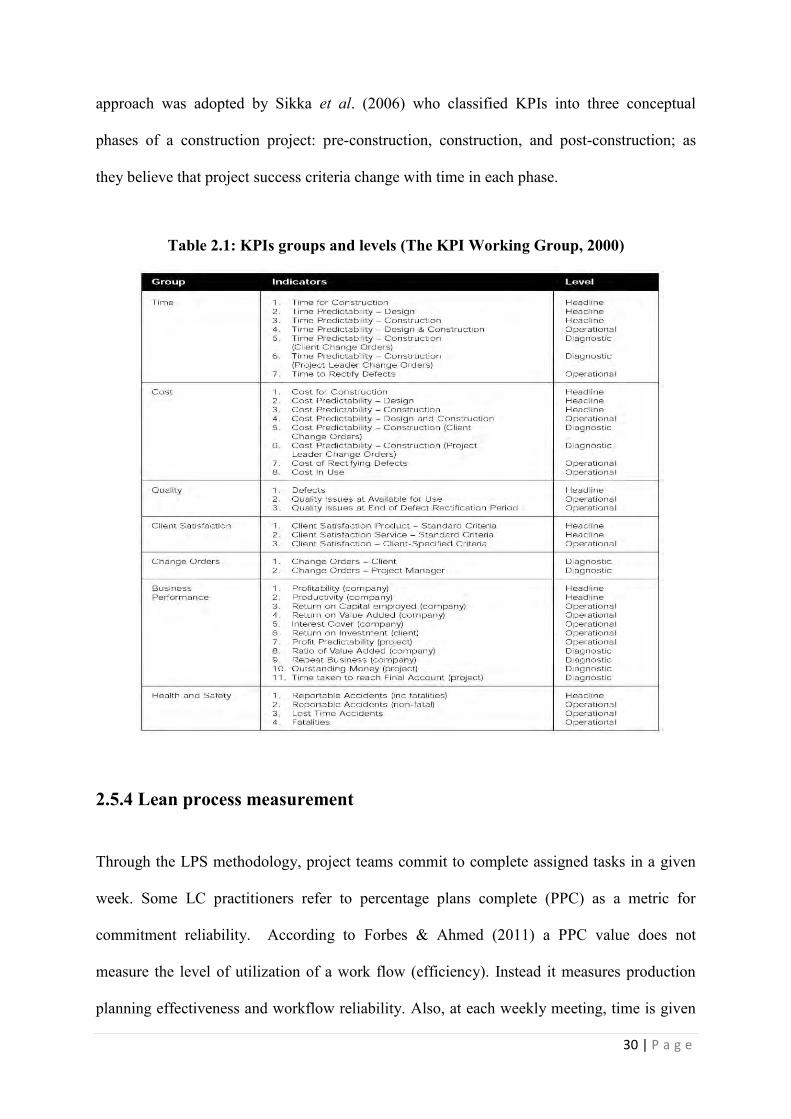
30 | P a g e
approach was adopted by Sikka et al. (2006) who classified KPIs into three conceptual
phases of a construction project: pre-construction, construction, and post-construction; as
they believe that project success criteria change with time in each phase.
Table 2.1: KPIs groups and levels (The KPI Working Group, 2000)
2.5.4 Lean process measurement
Through the LPS methodology, project teams commit to complete assigned tasks in a given
week. Some LC practitioners refer to percentage plans complete (PPC) as a metric for
commitment reliability. According to Forbes & Ahmed (2011) a PPC value does not
measure the level of utilization of a work flow (efficiency). Instead it measures production
planning effectiveness and workflow reliability. Also, at each weekly meeting, time is given
31 | P a g e
to learn and understand why certain tasks were not completed as planned in the previous
week, before creating a new weekly plan to be executed. The incompleted plans are studied
and analysed to determine the barriers and root causes that affected the implementation
process. The five-WHY analysis proceedure could be used for identifying the root-causes of
problems; and a Pareto chart could be used for ranking the barriers and reasons for non-
completion. Consequently, the information gained from the root-cause analysis would help
the project teams to avoid obstacles in future work cycles, and improve the effectiveness and
reliability of future work plans (Forbes & Ahmed, 2011).
Also, Moon et al. (2007) proposed a set of process-oriented performance indicators, which
are derived from the TFV theory: reliability, efficiency and effectiveness. Furthermore,
Alarcón et al. (2001) suggested a set of parameters that are „‟lean‟‟ based. The essence in
their approach is to create a „‟measurement culture‟‟ within organisations that will facilitate
future implementations. More lean performance measures are proposed by Forbes and
Ahmed (2011).
2.5.5 Other approaches and methods
There are also some other approaches that could be used to design a PMS (that incorporates
financial and non-financial measures), or to identify and evaluate the effect of factors/barriers
on performance. Some of these are discussed below.
The balanced scorecard is a widely accepted framework (Nudurupati et al., 2007). It was
constructed to complement measures of past performance with measures of the drivers of
future performance (Nudurupati et al., 2007). Consequently, it links an organisation‟s
strategy through a series of perspectives to KPIs (Fraser & Kelly, 2011).
32 | P a g e
Quantitative models for performance measurement systems (QMPMS) use cognitive maps,
cause and effect diagrams, tree diagrams, and the analytic hierarchy process, to quantify the
affect of factors on performance (Suwignjo et al., 2000; Nudurupati et al., 2007). There are
three main steps in QMPMS: (1) identifying the factors that affect performance and their
relationships; (2) structuring the factors hierarchically; (3) quantifying the effect of factors on
performance (Suwignjo et al., 2000; Nudurupati et al., 2007). The quantification process is
carried out based on the results of a pair-wise comparison questionnaire among the factors
(subjective technique).
This approach for quantifying the affects of factors on performance could be criticised
because it is subjective, and it may be difficult to be applied in practices. Suwignjo et al.
(2000) do not agree with that previous assumption, because they believe that subject
measurement is the only concept that is widely accepted in Multi-Criteria Decision Analysis
to deal with multi-criteria problems. To clarify their idea further, they questionned the
possibility of developing an objective measurement and scale to measure management
committment, or to quantify objectively value trade-off between management committment
and percent of reject. In order to overcome this argument, Suwignjo et al. (2000) propose the
use of group judgement rather than individual to reduce the subjectivity of the judgement.
However, one of the potential problems of this approach is that performance improvement
usually involves identification of a large number of factors affecting performance.
Consequently, the number of pairwise comparison questionnaire will be huge; and filling it in
will be exhausting and time consuming (Suwignjo et al., 2000).
Questionnaire model is possibly the most simple approach amongst all. It could be applied
quantatively or qualitatively to obtain statistical or descriptive results. In a study to prioritise
the LC barriers in Uganda‟s construction industry, Alinaitwe (2009) carried out structural
33 | P a g e
interviews with technical managers of building firms to assess their perception of the barriers
to LC based on their experience at their firms. Using a questionnaire model and a data
collection guide, the barriers were ranked twice. First according to the ease of overcoming
each, then according to their influence on the implementation of LC. In this study, the author
will carry out a similar approach which focuses on identifying and evaluating the effects of
barriers on the successful implementaion of LC in the UK. This will help organisations in the
construction industry to focus their attention and resources on the key issues.
2.6 A Framework for Evaluating LC, as Practiced in the UK
Building on the methodologies and conceptual frameworks used in earlier work in the UK
(Common et al., 2000), the Netherlands (Johansen et al., 2002), and Germany (Johansen &
Walter, 2007), this study will carry out a similar survey among UK construction
organisations to evaluate LC as practiced in the UK, discover the current awareness of lean
principles & trends in lean development, and establish how lean concepts have been
implemented and disseminated among construction organisations.
In their work Johansen & Walter (2007) identified eight areas as being fundamental attributes
of a lean approach, as shown in Figure 2.4 below. However, there have been vast
developments made among the lean construction community since the study by Johansen &
Walter (2007) was carried out. Several recent studies have emphasised the importance of
establishing a lean culture among the construction industry (Hines et al., 2011; Santorella,
2011; Terry & Smith, 2011). There has also been an improved understanding of the
importance of using appropriate performance measurement systems (PMSs) to support the
successful implementation of LC (section 2.5).
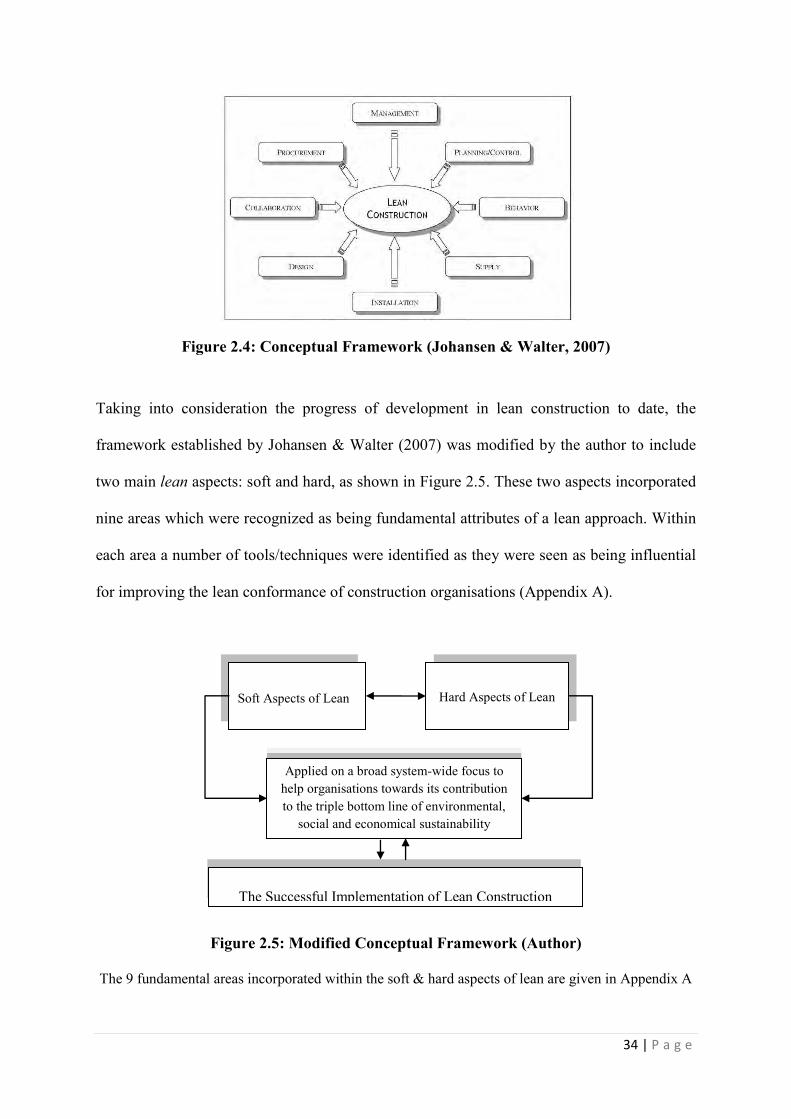
34 | P a g e
Figure 2.4: Conceptual Framework (Johansen & Walter, 2007)
Taking into consideration the progress of development in lean construction to date, the
framework established by Johansen & Walter (2007) was modified by the author to include
two main lean aspects: soft and hard, as shown in Figure 2.5. These two aspects incorporated
nine areas which were recognized as being fundamental attributes of a lean approach. Within
each area a number of tools/techniques were identified as they were seen as being influential
for improving the lean conformance of construction organisations (Appendix A).
Figure 2.5: Modified Conceptual Framework (Author)
The 9 fundamental areas incorporated within the soft & hard aspects of lean are given in Appendix A
Hard Aspects of Lean
Applied on a broad system-wide focus to help organisations towards its contribution to the triple bottom line of environmental,
social and economical sustainability
Soft Aspects of Lean
The Successful Implementation of Lean Construction
35 | P a g e
CHAPTER THREE: RESEARCH METHODOLOGY
3.1 Introduction
The literature review allowed the author to identify the gaps, glean ideas from others, and see
results of related studies. However, in order to enable this study to be well-founded by its
own findings and to allow comparisons to similar studies to be performed, independent
research was conducted.
Research refers to a search for knowledge; it could be defined as a scientific and systematic
search for significant information on a specific topic. In fact, research is an art of scientific
investigation. According to Kothari (2009) the term ‘reserach’ refers to:
‘’The systematic method consisting of enunciating the problem, formulating a
hypothesis, collecting the facts or data, analysing the facts and reaching certain
conclusions either in the form of solutions(s) towards the concerned problem or in
certain generalisations for some theoretical formulation’’.
The process of putting together a piece of good research is not something that could be done
by just strictly following a set of rules about what is right and wrong. (Denscombe, 2007). In
practice, the researcher faces a variety of options and alternatives and has to make his own
strategic decisions about which to choose. There is no ‘one right’ direction to take, as each
choice brings with it a set of advantages and disadvantages (Denscombe, 2007). There are,
though, some approaches that are more appropriate for specific types of investigation and
specific kinds of problems. According to Denscombe (2007), ‘’the crucial thing for good
36 | P a g e
research is that the choices are reasonable and that they are made explicit as part of any
research report’’. Furthermore, although all research is different, the following factors are
common to all good pieces of research (White, 2006):
The research is carried out in an unbiased fashion (bias - unfair preference or prejudice
for one side of an issue). That means that all sides or alternative views of controversial
issues should be presented;
The research should be ethical and not harmful in any way to the participants;
The research ensures data protection (confidentiality and anonymity).
This chapter describes the author’s adopted research methodology. To see a comprehensive
review on the different approaches used for conducting research, sources of data, data
collection methods, and data sampling, please refer to Appendix 2.
3.2 Research Ethics
The research within this study required human participation to allow the perspective of the
construction industry in the UK to be understood. An ethical review was undertaken in
accordance with the University of Plymouth’s guidelines to ensure that the research was not
harmful to the participants in any way. The University of Plymouth takes very seriously the
whole business of the ethics of research involving human participants. All staff and students
of the University undertaking such research have to conform to a set of 'ethical principles',
make these clear to those they are working with and ensure that they remain within them
throughout the research. This process allowed the research to be conducted in such a way that
would not affect the participant’s professional or personal perception. In addition, this

37 | P a g e
research study included an information sheet for the participants, which illustrated clearly
what the research was about, what it involved, and ensured data protection (Appendix 3).
3.3 Research Methodology Adopted
The choice of research methodology depends upon the set of research questions under
consideration and the state of knowledge development (Pettigrew, 1990). In line with good
research practice, the author has adopted a ‘mixed methods’ approach involving a
questionnaire and interviews. This approach is appropriate for the research aims of this
project, some of which are very broad (e.g. evaluating LC as practised in the UK). For
broader strategic issues, then a general quantitative survey method is needed to increase the
generality of the findings; and questionnaires are most effective (Bryman, 2001 ). When
investigating deeper then qualitative issues, particularly interviews are the most suitable
(Thomas et al., 2005). An outline of the research approaches adopted is illustrated below.
This is divided into two parts. The 1st provides a detailed explanation to the data collection
process (Figure 3.1 and Table 3.1). The second outlines the adopted data analysis methods, as
well as the nature of the scale of measurements utilised.
Figure 3.1: Data Collection process adopted for the research study (Author)
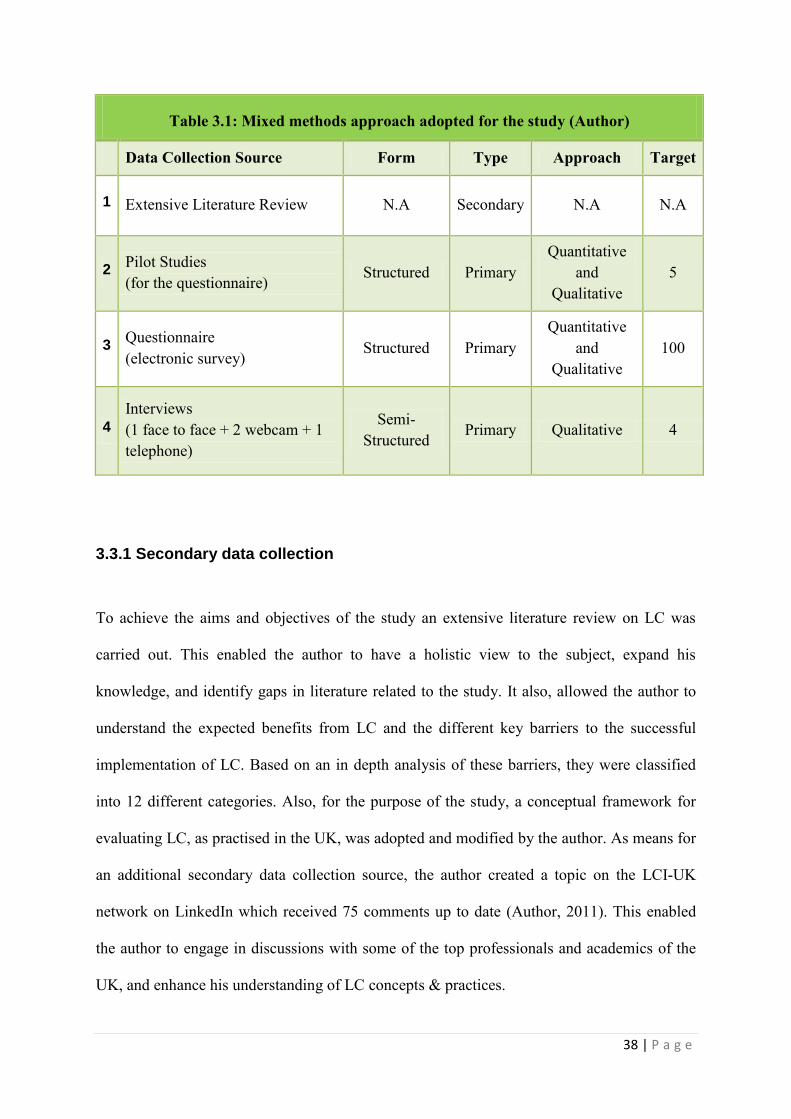
38 | P a g e
Table 3.1: Mixed methods approach adopted for the study (Author)
Data Collection Source Form Type Approach Target
1 Extensive Literature Review N.A Secondary N.A N.A
2 Pilot Studies (for the questionnaire)
Structured Primary Quantitative
and Qualitative
5
3 Questionnaire (electronic survey)
Structured Primary Quantitative
and Qualitative
100
4
Interviews (1 face to face + 2 webcam + 1 telephone)
Semi-Structured
Primary Qualitative 4
3.3.1 Secondary data collection
To achieve the aims and objectives of the study an extensive literature review on LC was
carried out. This enabled the author to have a holistic view to the subject, expand his
knowledge, and identify gaps in literature related to the study. It also, allowed the author to
understand the expected benefits from LC and the different key barriers to the successful
implementation of LC. Based on an in depth analysis of these barriers, they were classified
into 12 different categories. Also, for the purpose of the study, a conceptual framework for
evaluating LC, as practised in the UK, was adopted and modified by the author. As means for
an additional secondary data collection source, the author created a topic on the LCI-UK
network on LinkedIn which received 75 comments up to date (Author, 2011). This enabled
the author to engage in discussions with some of the top professionals and academics of the
UK, and enhance his understanding of LC concepts & practices.
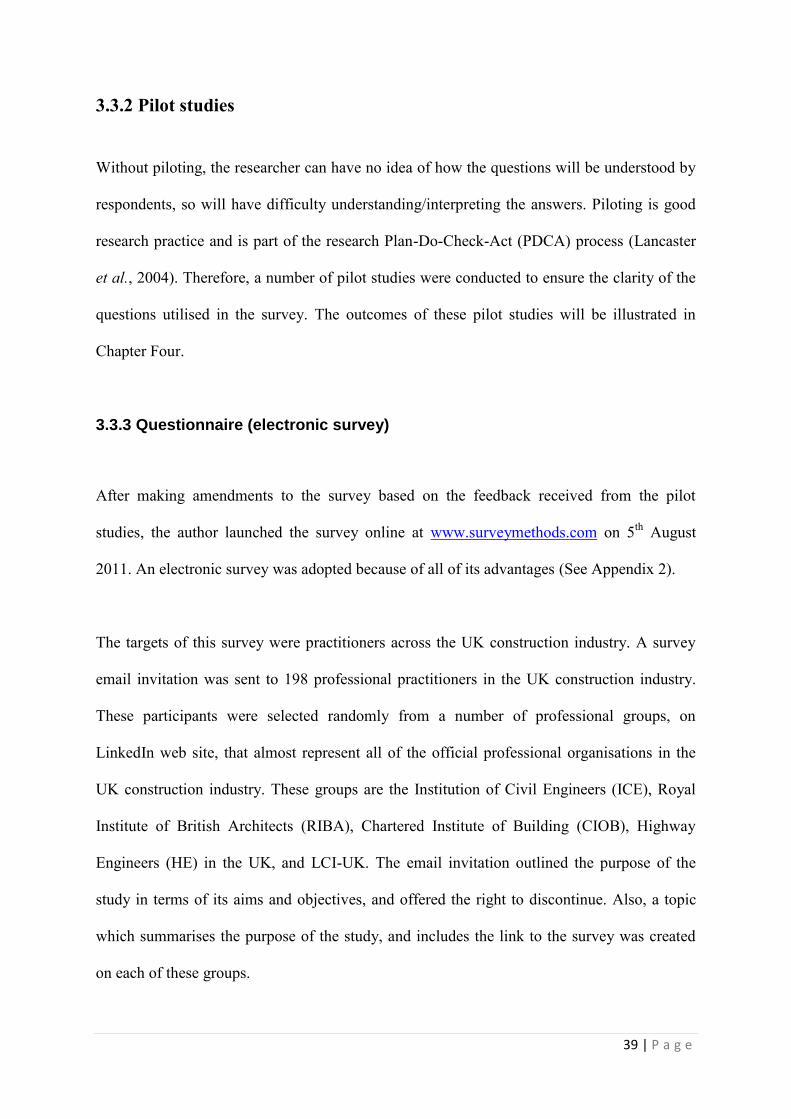
39 | P a g e
3.3.2 Pilot studies
Without piloting, the researcher can have no idea of how the questions will be understood by
respondents, so will have difficulty understanding/interpreting the answers. Piloting is good
research practice and is part of the research Plan-Do-Check-Act (PDCA) process (Lancaster
et al., 2004). Therefore, a number of pilot studies were conducted to ensure the clarity of the
questions utilised in the survey. The outcomes of these pilot studies will be illustrated in
Chapter Four.
3.3.3 Questionnaire (electronic survey)
After making amendments to the survey based on the feedback received from the pilot
studies, the author launched the survey online at www.surveymethods.com on 5th August
2011. An electronic survey was adopted because of all of its advantages (See Appendix 2).
The targets of this survey were practitioners across the UK construction industry. A survey
email invitation was sent to 198 professional practitioners in the UK construction industry.
These participants were selected randomly from a number of professional groups, on
LinkedIn web site, that almost represent all of the official professional organisations in the
UK construction industry. These groups are the Institution of Civil Engineers (ICE), Royal
Institute of British Architects (RIBA), Chartered Institute of Building (CIOB), Highway
Engineers (HE) in the UK, and LCI-UK. The email invitation outlined the purpose of the
study in terms of its aims and objectives, and offered the right to discontinue. Also, a topic
which summarises the purpose of the study, and includes the link to the survey was created
on each of these groups.
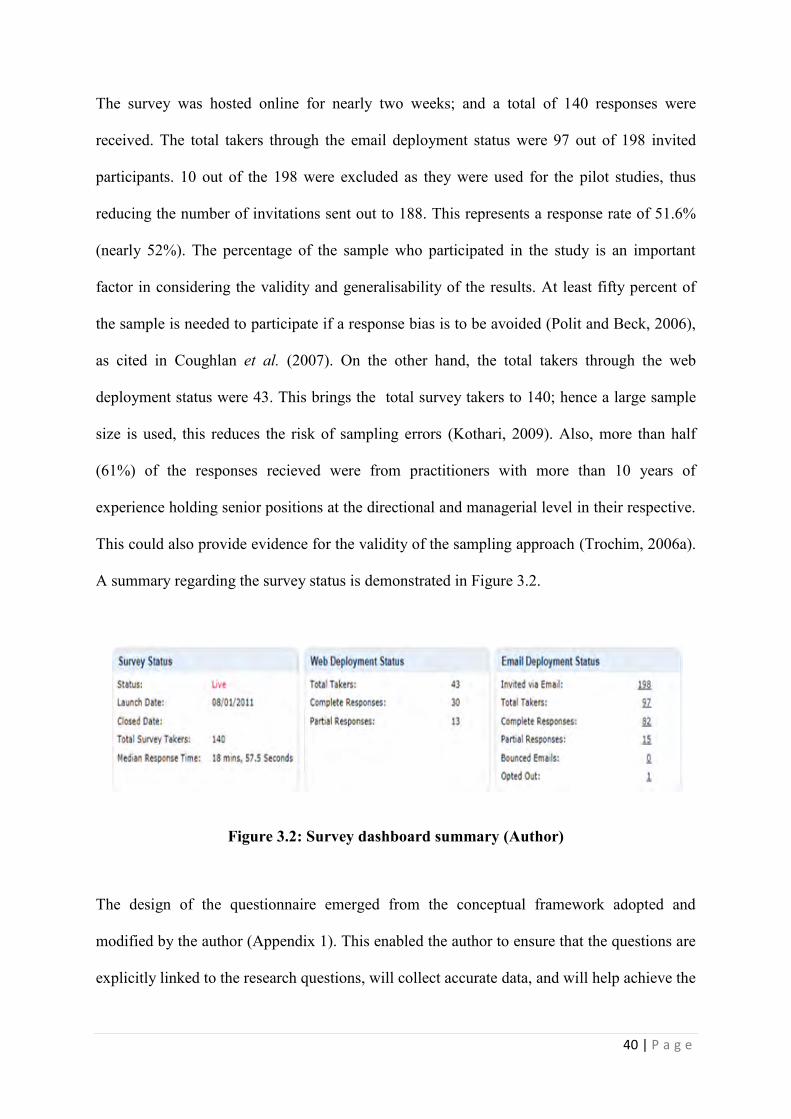
40 | P a g e
The survey was hosted online for nearly two weeks; and a total of 140 responses were
received. The total takers through the email deployment status were 97 out of 198 invited
participants. 10 out of the 198 were excluded as they were used for the pilot studies, thus
reducing the number of invitations sent out to 188. This represents a response rate of 51.6%
(nearly 52%). The percentage of the sample who participated in the study is an important
factor in considering the validity and generalisability of the results. At least fifty percent of
the sample is needed to participate if a response bias is to be avoided (Polit and Beck, 2006),
as cited in Coughlan et al. (2007). On the other hand, the total takers through the web
deployment status were 43. This brings the total survey takers to 140; hence a large sample
size is used, this reduces the risk of sampling errors (Kothari, 2009). Also, more than half
(61%) of the responses recieved were from practitioners with more than 10 years of
experience holding senior positions at the directional and managerial level in their respective.
This could also provide evidence for the validity of the sampling approach (Trochim, 2006a).
A summary regarding the survey status is demonstrated in Figure 3.2.
Figure 3.2: Survey dashboard summary (Author)
The design of the questionnaire emerged from the conceptual framework adopted and
modified by the author (Appendix 1). This enabled the author to ensure that the questions are
explicitly linked to the research questions, will collect accurate data, and will help achieve the
41 | P a g e
aims of the research. The questionnaire comprised a total of 36 questions. The break down
structure of the questionnaire is shown in Table 3.2.
Table 3.2: Questionnaire Structure (Author)
Contents and Focus areas Purpose Q. No.
Information
sheet
(Appendix 3)
To provide the participants with information regarding:
the purpose of the project;
The research ethics. This includes: informing consent,
confidentiality and anonymity, right to discontinue, storage &
publication of research material in accordance with University of
Plymouth policies and procedure;
Project supervisor contact details for further information.
-
Background
details
To gain information about the participants and their organisations, so
it can be used for secondary analysis.
1 - 9
Soft aspects of
Lean
To evaluate the participants’ understanding of LC concepts and
principles, and to evaluate the extent to which the Lean culture is
established within organisations in the UK. Also to identify the
techniques and tools used to facilitate the collaboration aspect of LC.
10 - 17
Hard aspects of
Lean
To identify and evaluate the techniques, tools and methods used for
the implementation of LC in the UK. These represent the 7 remaining
corner stones of the conceptual framework, namely: Procurement,
Management concepts, Planning and control, design, installation,
supply, and performance measurement & evaluation.
18 - 28
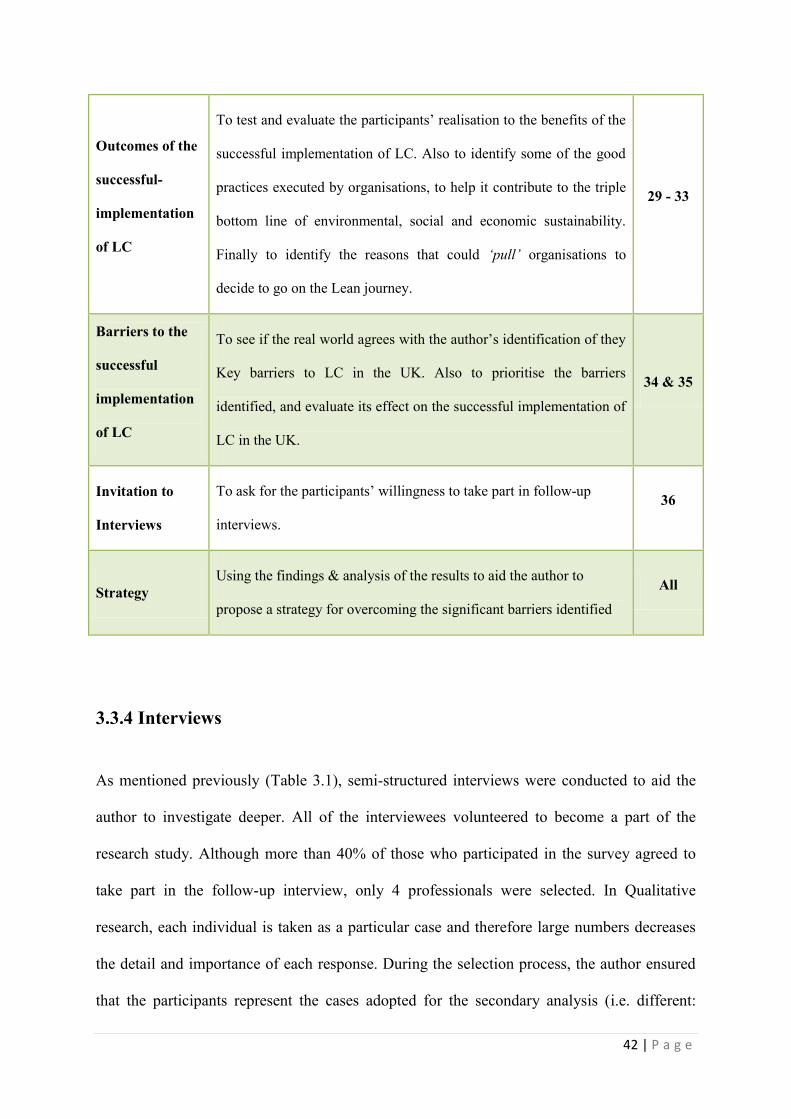
42 | P a g e
Outcomes of the
successful-
implementation
of LC
To test and evaluate the participants’ realisation to the benefits of the
successful implementation of LC. Also to identify some of the good
practices executed by organisations, to help it contribute to the triple
bottom line of environmental, social and economic sustainability.
Finally to identify the reasons that could ‘pull’ organisations to
decide to go on the Lean journey.
29 - 33
Barriers to the
successful
implementation
of LC
To see if the real world agrees with the author’s identification of they
Key barriers to LC in the UK. Also to prioritise the barriers
identified, and evaluate its effect on the successful implementation of
LC in the UK.
34 & 35
Invitation to
Interviews
To ask for the participants’ willingness to take part in follow-up
interviews.
36
Strategy Using the findings & analysis of the results to aid the author to
propose a strategy for overcoming the significant barriers identified
All
3.3.4 Interviews
As mentioned previously (Table 3.1), semi-structured interviews were conducted to aid the
author to investigate deeper. All of the interviewees volunteered to become a part of the
research study. Although more than 40% of those who participated in the survey agreed to
take part in the follow-up interview, only 4 professionals were selected. In Qualitative
research, each individual is taken as a particular case and therefore large numbers decreases
the detail and importance of each response. During the selection process, the author ensured
that the participants represent the cases adopted for the secondary analysis (i.e. different:
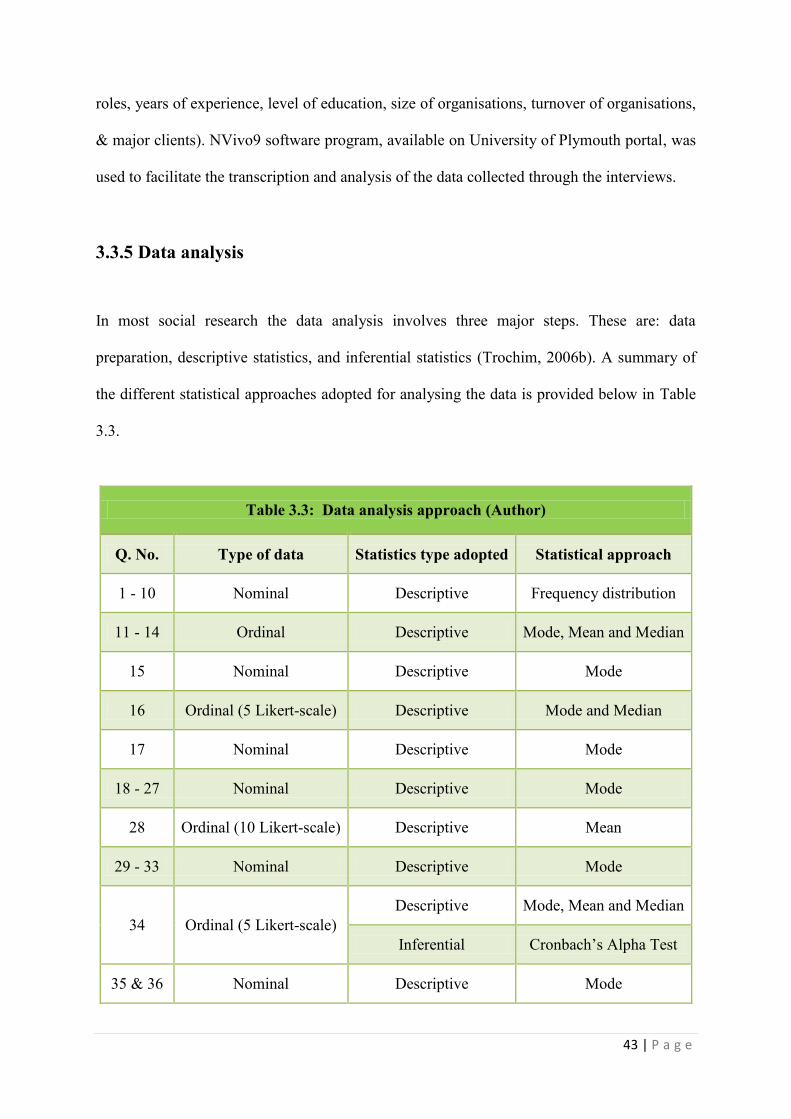
43 | P a g e
roles, years of experience, level of education, size of organisations, turnover of organisations,
& major clients). NVivo9 software program, available on University of Plymouth portal, was
used to facilitate the transcription and analysis of the data collected through the interviews.
3.3.5 Data analysis
In most social research the data analysis involves three major steps. These are: data
preparation, descriptive statistics, and inferential statistics (Trochim, 2006b). A summary of
the different statistical approaches adopted for analysing the data is provided below in Table
3.3.
Table 3.3: Data analysis approach (Author)
Q. No. Type of data Statistics type adopted Statistical approach
1 - 10 Nominal Descriptive Frequency distribution
11 - 14 Ordinal Descriptive Mode, Mean and Median
15 Nominal Descriptive Mode
16 Ordinal (5 Likert-scale) Descriptive Mode and Median
17 Nominal Descriptive Mode
18 - 27 Nominal Descriptive Mode
28 Ordinal (10 Likert-scale) Descriptive Mean
29 - 33 Nominal Descriptive Mode
34 Ordinal (5 Likert-scale) Descriptive Mode, Mean and Median
Inferential Cronbach’s Alpha Test
35 & 36 Nominal Descriptive Mode
44 | P a g e
CHAPTER FOUR – RESULTS AND ANALYSIS
4.1 Introduction
In this chapter, the results of the data obtained through the pilot studies, electronic survey and
the performed interviews are summarised, examined and analysed. Also, secondary analysis
will be conducted to scrutinise the data obtained in more detail. This will allow trends and
contrasting views to be determined; and thus more comprehensive findings to be concluded.
4.2 Pilot Studies
As mentioned previously in Chapter 3, piloting is good research practice and is part of the
research PDCA process (Lancaster et al., 2004). For this reason, a number of pilot studies
were conducted to ensure the clarity of the questions utilised in the survey. The survey was
sent to 10 professionals. Out of these ten, five professionals completed the survey
(supervisor, academic professor, senior project controls engineer, graduate civil & coastal
engineer, and an MSc postgraduate student). It is important to stress that none of these
participants took part in the agreed final survey. The intention was to use only a small sample
due to time constraints, and to leave more participants available for contribution in the main
survey. For the purpose of the pilot study, an additional question was placed by the end of
each page of the survey asking the participants for feedback on the clarity and relevance of
the questions, in addition to the overall structure of the questions on each page. To see a
summary of the feedback received, please refer to Appendix 4. These pilot studies helped to
validate and improve the survey in terms of its format and structure, wording of statements &
spelling mistakes, and the overall content. It also aided in choosing the most suitable and
reliable measurement methods.

45 | P a g e
4.3 Questionnaire (Electronic Survey)
This survey received a total of 140 responses by professional participants in the UK
construction industry. The average estimated time to complete the questionnaire was 15-20
minutes and it comprised of 36 questions. Only one question out of the 36 was mandatory, to
enable academics with an industrial or construction management background to skip
questions which may appear to be irrelevant to their current case. A total of 112 participants
fully completed the questionnaire and 28 participants partially completed it. The median
response time taken to complete the survey by all participants was 18 minutes and 57.5
seconds.
4.3.1 Background details: Questions 1-9
These set of questions were included to determine the nature and the background of the
participants and their organisations. This data obtained was then used by the author to
conduct the secondary analysis. A summary of the results obtained is provided below. To see
the detailed analysis, please refer to Appendix 5.
Questions 1 to 5 were introduced to ask the participants about their profession, location,
current role, qualification, and experience respectively. The responses obtained from these
questions illustrated that more than half (63%) of the participants were from practitioners
with more than 10 years of experience holding senior positions at the directional and
managerial level in their respective. This enhances the validity of the sampling approach
adopted (Trochim, 2006), and thus increases the reliability of the results achieved. Also,
question 3 was introduced to ensure that all the participants of the survey were currently
46 | P a g e
involved in the construction industry, and thus had up-to-date first hand knowledge. The
respondents represented a very wide range of professions. The largest proportion was for civil
engineers (33.57%); followed by those who selected the ‘other’ option, which included a text
box so they can enter their precise profession. This option was included within all questions
for flexibility, and to obtain accurate description of the participants within the research study
which is required so as to provide evidence to the generality of the findings. 77.14% of all
participants were currently based in the UK and the others were based in a variety of
international countries. Furthermore, most of the respondents were holding bachelors and
masters degrees; where each of these groups had an equal representation of 35.71% of all the
participants.
Alternatively, questions 6 to 9 were introduced to ask the participants about their
organisations’ size (number of employees), areas of operations, turnover, and major client
respectively. The results of these questions indicated that this study was able to capture a very
well distributed mixture of organisations, and included most of the largest construction
organisations in the UK. Almost 30% of the responses were for organisations which their
average annual turnover (AAT) exceeds 1000 Million UK sterling pounds, and 30.6% were
for organisations which their AAT was between £100-1000 Millions. Alternatively 30% of
the responses represented organisations which their AAT was from £1-10 Millions, and only
9.6% were for those which their AAT was from £10-100 Millions. Also, 53.62% of the
responses were for organisations which have more than 500 employees. Furthermore, the
results illustrated that the organisations involved in the study were engaged in very broad
areas of operations. This was important to ensure that the results are not biased towards
certain specific areas of operations. Finally, 60% of all respondents stated that their
organisations’ major clients/customers were ‘both’: public and private organisations
(indicates no bias).

47 | P a g e
4.3.2 Secondary Analysis
Based on the large data sets collected from questions 1-9, secondary analysis was conducted
on the rest of the questionnaire to help the author to investigate in more depth and provide a
more detailed & accurate evaluation. For the purpose of the secondary analysis, six different
classifications were established, as follows:
1. Organisations’ Average Annual Turnover (AAT) Classification which included: small
organisations (£1-100 Millions), medium organisations (£100-1000 Millions), and large
organisations (£1000+ Millions). See Appendix 6.
2. Organisations’ Size Classification which included: large organisations (more than 500
employees) and small organisations (less than 500 employees). See Appendix 7.
3. Organisations’ Major Client Classification which included organisations dealing mainly
with public clients, and those dealing mainly with private individuals & organisations.
See Appendix 8.
4. Years of experience Classification which comprised of respondents with less than 10
years of experience (1-10), (10-20), and (20+). See Appendix 9.
5. Level of Education Classification which included: respondents holding NVQ &
HNC/HND, Bachelors degree, and Masters degree (Appendix 10)
6. Current Role Classification which comprised of graduates/juniors, middle managers and
senior managers (Appendix 11).
To have a ‘holistic view’ of the analysis of these six classifications (Overall secondary
analysis), please refer to Table 4.1 in next page. To ‘zoom in’ and see the results and analysis
of each classification separately, and with additional in-depth analysis supported by graphs
and charts, see Appendices 6 – 11.

Table 4.1: Overall Secondary Analysis (Author)
10 · Yes= 68% · Yes= 58.8% · Yes= 60% · Yes= 70.97% · Yes= 71.43% · Yes= 65.38% · Yes= 66.13% · 47.22% Yes · 75.76 % Yes · 72.73 % Yes · 68.42% Yes · 64.1 % Yes · 68 % Yes · 25% Yes · 61.29 % Yes · 76.67 % Yes
· Mode= 1 · Mode= 1 · Mode= 1 · Mode= 1 · Mode= 1 · Mode= 1 · Mode= 1 · Mode= 1 · Mode= 1 · Mode= 1 · Mode= 1 · Mode= 1 · Mode= 1 · Mode= 1 · Mode= 1 · Mode= 1
· Median= 1 (Traditional) · Median= 2 (Learning) · Median= 1 (Traditional) · Median= 2 (Learning) · Median= 3 (Leading) · Median=1 (Traditional) · Median= 3 (Leading) · Median= 1 (Traditional) · Median= 1 (Traditional)· Median= 1
(Traditional)· Median= 3 (Leading) · Median= 1 (Traditional) · Median= 2 (Learning) · Median= 1 (Traditional) · Median= 1 (Traditional) · Median= 2 (Learning)
· Mean= 1.75 · Mean= 2.35 · Mean= 1.7 · Mean= 2.32 · Mean= 2.63 · Mean= 1.6 · Mean=2.58 · Mean= 2.138 · Mean= 2.09 · Mean= 2.209 · Mean= 2.368 · Mean= 2.128 · Mean= 2.04 · Mean= 1.83 · Mean= 2.06 · Mean= 2.4
· Mode= 3 · Mode= 2 · Mode= 3 · Mode= 3 · Mode= 2 and 3 · Mode= 3 · Mode= 3 · Mode= 3 · Mode= 3 · Mode= 3 · Mode= 1 · Mode= 3 · Mode= 2 · Mode= 2 · Mode= 3 · Mode= 3
· Median= 3 (Leading) · Median= 3 (Leading) · Median= 3 (Leading) · Median= 3 (Leading) · Median= 3 (Leading) · Median= 3 (Leading) · Median= 3 (Leading) · Median= 3 (Leading) · Median= 3 (Leading) · Median= 3 (Leading) · Median= 3 (Leading) · Median= 3 (Leading) · Median= 2 (Learning) · Median= 2 (Learning) · Median= 3 (Leading) · Median= 3 (Leading)
· Mean= 2.54 · Mean= 2.76 · Mean= 2.75 · Mean= 2.84 · Mean= 2.79 · Mean= 2.75 · Mean= 2.79 · Mean= 2.78 · Mean= 2.65 · Mean= 2.837 · Mean= 2.368 · Mean= 2.92 · Mean= 2.58 · Mean= 2.67 · Mean= 2.63 · Mean= 2.87
· Mode= 1 · Mode= 1 · Mode= 1 · Mode= 1 · Mode= 1 · Mode= 1 · Mode= 1 · Mode= 1 · Mode= 1 · Mode= 1 · Mode= 5 · Mode= 2 · Mode= 1 · Mode= 1 · Mode= 1 · Mode= 1
· Median= 2 (Learning) · Median= 2 (Learning) · Median= 2 (Learning) · Median= 2 (Learning) · Median= 2 (Learning) · Median= 2 (Learning) · Median= 2 (Learning) · Median= 2 (Learning) · Median= 2 (Learning) · Median= 2 (Learning) · Median= 3 (Leading) · Median= 2 (Learning) · Median= 1 (Traditional) · Median= 2 (Learning) · Median= 2 (Learning)· Median= 2 and
3(Leading)
· Mean= 2.43 · Mean= 2.64 · Mean= 2.32 · Mean= 2.38 · Mean= 2.70 · Mean= 2.12 · Mean= 2.56 · Mean= 2.39 · Mean= 2.35 · Mean= 2.634 · Mean= 3.167 · Mean= 2.763 · Mean= 1.92 · Mean= 2.4167 · Mean= 2.24 · Mean= 2.77
· Mode=1 · Mode= 2 · Mode= 1 · Mode= 1 · Mode= 1 · Mode= 1 · Mode= 1 · Mode= 1 · Mode= 1 · Mode= 1 · Mode= 3 · Mode= 1 · Mode= 1 · Mode= 1 · Mode= 1 · Mode= 1
· Median= 1 (Traditional) · Median= 2 (Learning) · Median= 1 (Traditional) · Median= 2 (Learning) · Median= 2 (Learning) · Median= 1 (Traditional) · Median= 2 (Learning) · Median= 1 (Traditional) · Median= 2 (Learning) · Median= 2 (Learning) · Median= 2 (Learning) · Median= 2 (Learning) · Median= 2 (Learning) · Median= 1 (Traditional) · Median= 2 (Learning) · Median= 2 (Learning)
· Mean= 2.04 · Mean= 2.47 · Mean= 2.02 · Mean= 2.22 · Mean= 2.38 · Mean= 1.94 · Mean= 2.4 · Mean= 2.05 · Mean= 2.096 · Mean= 2.357 · Mean= 2.33 · Mean= 1.71 · Mean= 2.12 · Mean= 1.75 · Mean= 2.275 · Mean= 2.33
1. Document Management
Systems= 66.67%
1. Long-Term Contractual
Agreements= 70.59%
1. Long-Term Contractual
Agreements= 59.09%
1. Long-Term Contractual
Agreements= 76.67%
1. Long-Term Contractual
Agreements= 73.53%
1. Long-Term Contractual
Agreements= 56.86%
1. Long-Term Contractual
Agreements= 76.27%
1. Long term Contractual
Arrangement= 62.86%
1. Long term Contractual
Arrangement= 81.25%
1. Document Management
Systems= 64.29%
1. Collaborative Planning=
72.22%
1. Long term Contractual
Arrangement= 66.67%
1. Long-Term Contractual
Agreements= 70%
1. Long term Contractual
Arrangement= 63.64%
1. Document Management
Systems= 75.86%
1. Document Management
Systems= 66.67%
2. Long-Term Contractual
Agreements= 50%
2. Cross-Functional
Teams= 47%
2. Document Management
Systems= 52.27%
2. Document Management
Systems= 73.33%
2. Document Management
Systems= 70.59%
2. Document Management
System= 54.9%
2. Document management
Systems= 69.49%
2. Document Management
systems= 57.14%
2. Document Management
Systems= 65.62%
2. Long-Term Contractual
Agreements= 61.9%
2. Long term Contractual
Arrangement= 61.11%
2. Document Management
Systems= 66.67%
2. Document Management
Systems= 57.5%
2. Document Management
systems= 45.45%
2. Long term Contractual
Arrangement= 68.97%
2. Long-Term Contractual
Agreements= 63.33%
3. Project Information
Systems= 41.67%
3. Document Management
Systems= 47%
3. Collaborative Planning
Schedules= 45.45%
3. Cross functional teams=
63.33%
3. Cross-Functional
Teams= 61.76%
3. Collaborative Planning=
41.18%
3. Cross functional teams=
61.02%
3. Cross-Functional
Teams= 37.14%
3. Project Information
Systems= 46.88%
3. Cross-Functional
Teams= 61.9%
3. Document Management
systems= 55.56%
3. Cross-Functional
Teams=48.72%
3. Cross-Functional
Teams= 40%
3. Cross-Functional
Teams= 27.27%
3. Cross-Functional
Teams= 41.38%
3. Collaborative planning=
60%
4. Collaborative planning
schedules= 41.67%
4. Project Information
Systems= 29.41%4. PIS= 29.55% 4. PIS= 46.67% 4. IPD= 47.06%
4. Cross-functional teams=
31.37%
4. Collaborative Planning=
44.76%
4. Collaborative Planning=
37.14%
4. Cross-Functional
Teams=40.62%
4. Collaborative planning=
52.38%
4. Cross-Functional
Teams= 50%
4. Project Information
Systems= 41.03%4. IPD= 32.5%
4. Project Information
Systems= 27.27%
4. Project Information
Systems= 34.48%
4. Cross-Functional
Teams= 56.67%
5. Cross functional teams=
33.33%
5. Collaborative Planning
Schedules= 29.41%
5. Cross functional teams=
27.27%
5. Collaborative planning=
43.33%
5. Collaborative planning=
44.12&
5. Project information
Systems= 29.41%5. IPD= 47.46%
5. Project Information
Systems= 25.71%
5. Collaborative Planning=
40.62%5. IPD= 40.48% 5. IPD= 38.89%
5. Collaborative Planning=
38.46%
5. Collaborative planning=
32.5%
5. Collaborative Planning=
27.27%
5. Collaborative Planning=
34.48%5. IPD= 46.67%
6. IPD= 20.83% 6. IPD= 23.53% 6. IPD= 18.18% 6. IPD= 40% 6. PIS= 41.18% 6. IPD= 15.69%6. Project Information
systems= 44.07%6. IPD= 25.71% 6. IPD= 28.12%
6. Project Information
Systems= 40.48%
6. Project Information
Systems= 33.33%6. IPD= 28.21%
6. Project Information
Systems= 27.5%6. IPD= 18.18% 6. IPD= 31.03%
6. Project Information
Systems= 43.33%
7. LPDS= 20.83% 7. LPDS= 23.53% 7. LPDS= 9.09% 7. LPDS= 23.33% 7. LPDS= 29.41% 7. LPDS= 11.76% 7. LPDS= 25.42% 7. LPDS= 20% 7. LPDS= 15.62% 7. LPDS= 21.43% 7. LPDS= 22.22% 7. LPDS= 20.51% 7. LPDS= 15% 7. LPDS= 18.18% 7. All= 20.69% 7. LPDS= 30%
8. All= 4.17% 8. All= 23.53% 8. All= 6.82% 8. All= 23.33% 8. All= 17.65% 8. All= 9.8% 8. All= 22.03% 8. All=11.43% 8. All= 15.62% 8. All= 21.43% 8. All=16.67% 8. All= 20.51% 8. All= 15% 8. All=18.18% 8. LPDS= 10.34% 8. All= 10%
9. Other= 0% 9. Other= 5% 9. Other= 6% 9. Other= 6% 9. Other= 8% 9. Other=3% 9. Other= 10% 9. Other= 5% 9. Other= 9% 9. Other= 7% 9. Other= 11% 9. Other= 5% 9. Other= 7% 9. Other= 0% 9. Other= 10% 9. Other= 6%
Statements they should
disagree/strongly disagree
with:
Statements they should
disagree/strongly disagree
with:
Statements they should
disagree/strongly disagree
with:
Statements they should
disagree/strongly disagree
with:
Statements they should
disagree/strongly disagree
with:
Statements they should
disagree/strongly disagree
with:
Statements they should
disagree/strongly disagree
with:
Statements they should
disagree/strongly disagree
with:
Statements they should
disagree/strongly disagree
with:
Statements they should
disagree/strongly disagree
with:
Statements they should
disagree/strongly disagree
with:
Statements they should
disagree/strongly disagree
with:
Statements they should
disagree/strongly disagree
with:
Statements they should
disagree/strongly disagree
with:
Statements they should
disagree/strongly disagree
with:
Statements they should
disagree/strongly disagree
with:
1) 76% 1) 70.59% 1) 62.23% 1) 86.67% 1) 76.47% 1) 67.3% 1) 76.27% 1) 71.43% 1) 78.12% 1) 67.44% 1) 72.22% 1) 64.1% 1) 77.5% 1) 45.45% 1) 62.07% 1) 76.67%
2) 84% 2) 88.24% 2) 75.55% 2) 90% 2) 82.36% 2) 76.92% 2) 86.44% 2) 82.86% 2) 78.13% 2) 83.72% 2) 77.78% 2) 82.05% 2) 82.5% 2) 63.63% 2) 79.31% 2) 83.33%
5) 40% 5) 29.41% 5) 33.33% 5) 30% 5) 41.17% 5) 32.69% 5) 33.89% 5) 45.72% 5) 37.5% 5) 32.56% 5) 38.89% 5) 30.77% 5) 37.5% 5) 9.09% 5) 48.28% 5) 36.67%
Statements they should
agree/strongly agree with:
Statements they should
agree/strongly agree with:
Statements they should
agree/strongly agree with:
Statements they should
agree/strongly agree with:
Statements they should
agree/strongly agree with:
Statements they should
agree/strongly agree with:
Statements they should
agree/strongly agree with:
Statements they should
agree/strongly agree with:
Statements they should
agree/strongly agree with:
Statements they should
agree/strongly agree with:
Statements they should
agree/strongly agree with:
Statements they should
agree/strongly agree with:
Statements they should
agree/strongly agree with:
Statements they should
agree/strongly agree with:
Statements they should
agree/strongly agree with:
Statements they should
agree/strongly agree with:
3) 80% 3) 82.35% 3) 64.45 % 3) 56.67% 3) 82.35% 3) 65.38% 3) 69.49% 3) 62.86% 3) 68.74% 3) 69.76% 3) 77.78% 3) 64.11% 3) 60% 3) 36.36% 3) 55.17% 3) 80%
4) 64% 4) 70.59% 4) 62.22% 4) 50% 4) 61.77% 4) 59.61% 4) 59.32% 4) 60% 4) 65.62% 4) 53.49% 4) 61.11% 4) 61.54% 4) 52.5% 4) 81.82% 4) 51.72% 4) 63.33%
6) 20% 6) 29.41% 6) 24.44% 6) 30% 6) 29.41% 6) 23.08% 6) 32.2% 6) 25.71% 6) 34.38% 6) 25.58% 6) 33.34% 6) 23.07% 6) 25% 6) 9.09% 6) 20.68% 6) 23.34%
7) 44% 7) 29.41% 7) 31.11% 7) 30% 7) 43.42% 7) 30.77% 7) 39.66% 7) 23.53% 7) 37.5% 7) 44.19% 7) 16.67% 7) 43.59% 7) 33.34% 7) 0% 7) 41.38% 7) 23.34%
8) 92% 8) 100% 8) 84.09% 8) 100% 8) 91.18% 8) 86.28% 8) 94.92% 8) 94.29% 8) 87.5% 8) 90.48% 8) 88.89% 8) 92.11% 8) 92.5% 8) 90.91% 8) 93.1% 8) 86.21%
9) 83.34% 9) 70.59% 9) 75% 9) 53.34% 9) 73.53% 9) 74.51% 9) 64.4% 9) 65.71% 9) 70.96% 9) 69.77% 9) 83.33% 9) 57.9% 9) 72.5% 9) 54.54% 9) 62.07% 9) 66.67%
10) 72% 10) 76.47% 10) 57.78% 10) 60% 10) 45.45% 10) 57.69% 10) 51.72% 10) 47.06% 10) 56.24% 10) 60.46% 10) 44.44% 10) 56.41% 10) 61.54% 10) 27.27% 10) 64.29% 10) 50%
11) 92% 11) 88.23% 11) 77.78% 11) 90% 11) 76.47% 11) 78.85% 11) 81.35% 11) 71.43% 11) 87.5% 11) 81.4% 11) 72.22% 11) 84.62% 11) 80% 11) 45.45% 11) 89.65% 11) 76.66%
8 correct out of 11 8 correct out of 11 8 correct out of 11 8 correct out of 11 7 correct out of 11 8 correct out of 11 8 correct out of 11 7 correct out of 11 8 correct out of 11 8 correct out of 11 7 correct out of 11 8 correct out of 11 8 correct out of 11 4 correct out of 11 8 correct out of 11 8 correct out of 11
Average score= 67.94% Average score= 66.84% Average score= 58.9% Average score= 61.51% Average score= 63.96% Average score= 59.37% Average score= 62.69% Average score= 59.145% Average score= 63.835% Average score= 61.71% Average score= 60.6% Average score= 60.02% Average score= 61.35% Average score= 42.146% Average score= 60.7% Average score= 60.565%
1. Workplace
organisation= 60.87%1. Data Analysis= 47.06%
1. Workplace
organisation= 58.14%
1. Collaborative Planning=
50%
1. Collaborative Planning=
61.76%
1. Workplace
organisation= 57.14%
1. Collaborative Planning=
54.24%
1. Standardised work=
55.88%
1. Collaborative Planning=
50%1. Data Analysis= 58.54%
1. Workplace
organisation= 66.67%
1. Problem solving=
58.97%
1. Workplace
organisation= 43.59%1. Data analysis= 54.55%
1. Workplace
organisation= 55.17%
1. Collaborative Planning=
65.52%
2. Collaborative Planning=
52.17%
2. Visual management=
41.18%
2. Standardised work=
58.14%2. Data analysis= 50% 2. Data Analysis= 58.82%
2. Standardised work=
57.14%2. Data Analysis= 52.54%
2. Workplace
organisation= 52.94%
2. Standardised work=
46.88%
2. Workplace
organisation= 58.54%
2. Standardised work=
66.67%
2. Collaborative Planning=
56.41%
2. Collaborative Planning=
38.46%
2. Standardised work=
54.55%
2. Collaborative Planning=
44.83%2. Data Analysis= 62.07%
3. Standardised work=
52.17%
3. Workplace
organisation= 41.18%
3. Problem solving=
51.16%
3. Workplace
organisation= 43.33%
3. Workplace
organisation= 55.88%
3. Problem solving=
46.94%
3. Workplace
organisation= 49.15%
3. Problem solving=
52.94%
3. Work sequence
analysis= 43.75%
3. Collaborative Planning=
51.22%
3. Problem solving=
66.67%3. Data Analysis= 53.85%
3. Standardised work=
38.46%
3. Collaborative planning=
36.36%
3. Visual management=
37.93%
3. Workplace
organisation= 62.07%
4. Problem solving=
52.17%
4. Process mapping=
35.29%
4. Collaborative planning=
41.86%4. Process mapping= 40%
4. Work sequence
analysis= 52.94%
4. Collaborative Planning=
44.9%
4. Problem solving=
47.46%
4. Collaborative planning=
47.06%
4. Workplace
organisation= 43.75%
4. Problem solving=
51.22%
4. Collaborative planning=
61.11%
4. Workplace
organisation= 53.85%
4. Work sequence
analysis= 35.9%
4. Problem solving=
36.36%
4. Standardised work=
37.93%
4. Standardised work=
58.62%
5. Data Analysis= 47.83%5. Problem solving=
35.29%5. Data analysis= 39.53%
5. Work sequence
analysis= 36.67%
5. Visual management=
52.94%5. Data Analysis= 42.86%
5. Work sequence
analysis= 45.76%5. Data analysis= 47.06%
5. Process mapping=
43.75%
5. Visual management=
48.78%5. Data analysis= 61.11%
5. Visual management=
51.28%5. Data Analysis= 33.33%
5. Work sequence
analysis= 27.2%
5. Problem solving=
34.48%
5. Problem solving=
58.62%
6. Visual management=
47.83%
6. Collaborative Planning=
29.41%6. VM= 39.53% 6. VM= 33.33%
6. Standardised work=
52.94%
6. Process mapping=
40.82%
6. Visual management=
45.76%
6. Visual management=
47.06%6. Data Analysis= 37.5%
6. Standardised work=
46.34%
6. Visual management=
61.11%
6. Standardised work=
51.28%
6. Problem solving=
33.33%
6. Visual management=
27.2%6. Data Analysis= 31.03%
6. Work sequence
analysis= 55.17%
7. Work sequence
analysis= 34.78%
7. Standardised work=
29.41%
7. Process mapping=
39.53%
7. Standardised work=
33.33%
7. Problem solving=
52.94%
7. Visual management=
38.78%
7. Standardised work=
44.07%
7. Process mapping=
38.24%7. Problem solving= 37.5%
7. Work sequence
analysis= 36.59%
7. Work sequence
analysis= 50%
7. Process mapping=
48.72%
7. Process mapping=
28.21%
7. Workplace
organisation= 27.2%
7. Process mapping=
27.59%
7. Visual management=
55.17%
8. Process mapping=
30.43%8. All= 29.41%
8. Work sequence
analysis= 27.91%
8. Problem solving=
33.33%
8. Process mapping=
35.29%
8. Work sequence
analysis= 30.61%
8. Process mapping=
37.29%
8. Work sequence
analysis= 35.29%
8. Visual management=
31.25%
8. Process mapping=
36.59%8. Process mapping= 50%
8. Work sequence
analysis= 33.33%
8. Visual management=
25.64%8. All= 27.27%
8. Work sequence
analysis= 24.14%
8. Process mapping=
48.28%
9. None= 17.39%9. Work sequence
analysis= 23.53%9. All= 11.63% 9. All= 26.67% 9. All= 17.65% 9. None= 12.24% 9. All= 23.73% 9. All= 20.59% 9. None= 15.62% 9. All= 21.95% 9. All= 22% 9. All= 17.95% 9. All= 17.95%
9. Process mapping=
18.18%9. All= 20.69% 9. All= 13.79%
10. All=8.7% 10. None= 17.69% 10. None= 11.63% 10. None= 13.33% 10. Other= 11% 10. All= 10.2% 10. None= 8.47% 10. None= 11.76% 10. All= 9.38% 10. Other= 7% 10. Other= 11% 10. None= 10.26% 10. None= 12.82% 10. None= 18.18% 10. None= 6.9% 10. None= 6.9%
11. Other= 0% 11. Other= 11% 11. Other= 6% 11. Other= 3% 11. None= 5.88% 11. Other= 6% 11. Other= 8% 11. Other= 5% 11. Other= 9% 11. None= 5% 11. None= 0% 11. Other= 7% 11. Other= 5% 11. Other= 0% 11. Other= 0% 11. Other= 6%
1. CPM= 52.17% 1. CPM= 58.82% 1. CPM= 48.84% 1. CPM= 76.67% 1. CPM= 69.7% 1. CPM= 48% 1. CPM= 75.86% 1. CPM= 58.82% 1. CPM= 64.52% 1. CPM= 66.67% 1. CPM= 72.22% 1. CPM= 60.53% 1. CPM= 64.1% 1. CPM= 30% 1. CPM= 75.86% 1. CPM= 63.33%
2. Look ahead planning=
34.78%2. Look ahead= 52.94% 2. Look ahead= 41.86% 2. Look ahead= 53.33% 2. PCP tools= 57.58%
2. Look ahead planning=
42%2. PCP tools= 55.17%
2. Look ahead planning=
47.06%
2. Look ahead planning=
41.94%
2. Look ahead Planning=
50%
2. Look ahead planning=
55.56%
2. Look ahead planning=
44.74%
2. Look ahead Planning=
53.85%
2. Look ahead planning=
30%2. PCP tools= 48.28%
2. Look ahead Planning=
56.67%
3. Workflow PM= 30.43% 3. PCP tools= 41.18% 3. PCP= 30.23% 3. PCP tools= 50% 3. Look ahead= 51.52% 3. PCP tools= 30%3. Look ahead planning=
51.72%3. PCP tools= 38.24% 3. PCP tools= 38.71% 3. PCP tools= 50% 3. PPC tools= 50% 3. PCP tools= 34.21% 3. PCP tools= 46.15% 3. PCP tools= 30%
3. Look ahead planning=
41.38%3. PCP tools= 53.33%
4. PCP tools= 30.43% 4. LPS= 17.65% 4. N/A= 25.58% 4. Workflow PM= 30%4. Constraint analysis=
33.33%4. N/A= 24%
4. Constraint analysis=
32.76%4. Workflow PM= 23.53% 4. Not applicable= 19.35%
4. Constraint analysis=
33.33%
4. Constraint analysis=
33.33%
4. Constraint analysis=
26.32%4. Workflow PM= 30.77% 4. N/A= 20%
4. Constraint analysis=
31.03%4. LPS=30%
5. N/A= 26.09% 5. N/A= 11.76% 5. Workflow PM= 25.58% 5. LPS= 30% 5. LPS= 18.18% 5. Workflow PM= 24%5. Workflow PM=
22.41%%
5. Constraint analysis=
23.53%5. Workflow PM= 19.35% 5. LPS=28.57% 5. Not Applicable= 22.22% 5. Not applicable= 18.42% 5. LPS=25.64% 5. Workflow PM= 20% 5. Workflow PM= 20.69%
5. Constraint analysis=
23.33%
6. LPS= 17.39% 6. Workflow PM= 11.76%6. Constraint analysis=
16.28%
6. Constraint analysis=
30%6. Other= 18.18%
6. Constraint analysis=
18%6. LPS= 22.41% 6. N/A= 17.65% 6. LPS= 19.35% 6. Workflow PM= 26.19% 6. Workflow PM= 16.67% 6. WF PM= 18.42%
6. Constraint analysis=
25.64%
6. Constraint analysis=
20%6. LPS= 20.69% 6. RSPS= 20%
7. Constraint analysis=
17.39%
7. Constraint analysis=
11.76%7. LPS= 14% 7. RPS= 16.67% 7. Workflow PM= 15.15% 7. LPS= 16% 7. RPS= 12.07% 7. RPS= 11.76%
7. Constraint analysis=
19.35%7. N/A= 16.67% 7. LPS= 16.67% 7. Other= 18% 7. N/A= 12.82% 7. RPS= 10% 7. Not applicable= 17.24% 7. Other= 13.33%
8. Other= 8% 8. Other= 11% 8. RPS= 7% 8. N/A= 13.33% 8. N/A= 12% 8. Other= 12% 8. N/A= 12.07% 8. Other= 11% 8. Other= 6% 8. RSPS= 14%% 8. RPS= 16.67% 8. LPS= 15.79% 8. RSPS= 10.26%8. Other= 10% (said: Don’t
Know)8. RPS= 6.9% 8. N/A= 13.33%
9. RPS= 8% 9. RPS= 5.88% 9. Other= 6% 9. Other= 6% 9. RPS= 9% 9. RPS= 8% 9. Other= 10% 9. LPS= 8.82% 9. RPS= 3.25% 9. Other= 14% 9. Other= 0% 9. RPS= 7.89% 9. Other= 7% 9. LPS= 0% 9. Other= 3% 9. Workflow PM= 10%
1. None= 50% 1. None= 41.18% 1. None= 56.82% 1. PDCA= 46.67% 1. PDCA= 45.45% 1. None= 54% 1. PDCA= 46.55% 1. None= 47.06% 1. None= 46.88% 1. PDCA= 41.46% 1. None= 50% 1. None= 50% 1. None= 43.95% 1. None= 50% 1. None= 48.28% 1. PDCA= 46.67%
2. PDCA= 33.33% 2. PDCA= 41.18% 2. PDCA= 29.55% 2. None= 33.33% 2. None= 33.33% 2. PDCA= 30% 2. None= 34.48% 2. PDCA= 41.18% 2. PDCA= 31.25% 2. None= 39.02% 2. PDCA= 33.33% 2. PDCA= 38.46% 2. PDCA= 41.03% 2. PDCA= 30% 2. PDCA= 41.38% 2. None= 43.33%
3. Prefabrication= 20.83% 3. Prefabrication= 11.76% 3. Other= 11% 3. Prefabrication= 26.67% 3. Prefabrication= 33.33% 3. Prefabrication= 16%3. Prefabrication
strategies= 25.86%3. Prefabrication= 20.59% 3. Other= 18% 3. Prefabrication= 26.83% 3. Prefabrication= 33.33% 3. Prefabrication= 12.82% 3. Prefabrication= 20.51% 3. Prefabrication= 20% 3. Prefabrication= 13.79% 3. Prefabrication= 30%
4. FRS= 12.5% 4. Other= 11.76% 4. FRS= 9.05% 4. Other= 13% 4. FRS= 18.18% 4. Other= 12%4. First Run studies=
13.79%
4. First Run Studies=
11.76%4. Prefabrication= 15.62% 4. FRS= 12.2%
4. First Run Studies=
11.11%
4. First Run Studies=
12.82%4. FRS= 10.26% 4. First Run Studies= 20%
4. First Run Studies=
10.34%4. FRS= 16.67%
5. Other= 8% 5. FRS= 5% 5. Prefabrication= 9.05% 5. FRS= 10% 5. Other= 9% 5. First Run studies= 10% 5. Other= 10% 5. Other= 8%5. First Run Studies=
12.5%5. Other= 7% 5. Other= 0% 5. Other= 10% 5. Other= 10%
5. Other= 10% (said: Don’t
know)5. Other= 3% 5. Other= 10%
1. N/A= 54.55% 1. N/A= 47% 1. N/A= 66.67% 1. VM= 37.93% 1. VM= 42.42% 1. N/A= 59.18%1. Visual Management=
40.35%1. Not Applicable= 47.06% 1. Not Applicable= 50% 1. N/A= 39.02% 1. Not Applicable= 58.82% 1. Not Applicable= 44.74% 1. N/A= 42.11% 1. Not Applicable= 60% 1. Not Applicable= 39.39% 1. N/A= 50%
2. VM= 31.82% 2. VM= 35.29% 2. VM= 19.05% 2. N/A= 34.48% 2. N/A= 30.3%2. Visual Management=
22.45%2. N/A= 33.33% 2. VM= 35.29% 2. VM= 23.33% 2. VM= 36.59% 2. VM= 23.33% 2. VM= 34.21% 2. VM= 34.21% 2. VM= 30% 2. VM= 43.14% 2. VM= 30%
3. CFP= 13.84% 3. CFP= 17.65% 3. LPS= 11.9% 3. LPS= 27.59% 3. LPS= 18.18% 3. LPS= 16.33% 3. CFP= 19.3% 3. CFP=23.53% 3. LPS= 16.67% 3. LPS= 24.39% 3. LPS= 17.65% 3. LPS= 13.16% 3. CFP= 26.32% 3. Crane= 20% 3. CFP= 21.43% 3. LPS= 26.67%
4. Other= 13% 4. LPS= 17.65% 4. CFP= 9.52% 4. CFP= 20.69% 4. CFP= 15.15% 4. CFP= 10.2% 4. LPS= 19.3% 4. LPS= 11.56% 4. Other= 13% 4. CFP= 12.2% 4. CFP=5.88% 4. CFP= 10.53% 4. LPS= 23.68% 4. CFP=10% 4. LPS= 14.29% 4. Other= 16%
5. LPS= 9.09% 5. Crane= 0% 5. Other= 7% 5. Crane= 13.79% 5. Other= 15.15% 5. Other= 8% 5. Crane= 10.53% 5. Crane= 11.56% 5. CFP= 10% 5. Other= 9% 5. Crane= 5.88% 5. Crane= 10.53% 5. Other= 7% 5. LPS= 10% 5. Crane= 3.57% 5. Crane= 10%
6. Crane= 4.55% 6. Other= 0% 6. Crane= 4.76% 6. Other= 6% 6. Crane= 9% 6. Crane= 6.12% 6. Other= 10% 6. Other= 5% 6. Crane= 6.67% 6. Crane= 7.32% 6. Other= 5% 6. Other= 10% 6. Crane= 2.63% 6. Other= 0% 6. Other= 3.57% 6. CFP= 6.67%
21 · Yes= 26% · Yes= 35.29% Yes= 18.6% Yes= 76.67% Yes= 56.25% Yes= 22.45% Yes= 66.67% · 39.39% Yes · 61.29% Yes · 41.46%% Yes · 50% Yes · 55.26% Yes · 52.63% Yes
· 20% Yes (because
one when asked to
identify which, said:
don’t know. Thus
· 42.86% Yes · 40% Yes
1. N/A= 39.13% 1. Don’t know= 53% 1. Don't know= 32.56% 1. Don’t know= 50% 1. JIT= 34.28% 1. Don't know= 34.69% 1. Don’t know= 33.33% 1. Don’t know= 42.42% 1. Don’t Know= 41.94% 1. JIT= 41.46% 1. JIT= 38.89% 1. Don’t Know= 42.11% 1. Don’t know= 34.21% 1. Don’t know= 40% 1. Don’t Know= 42.86% 1. JIT= 43.33%
2. JIT= 26.09% 2. JIT= 29.41% 2. N/A= 30.23% 2. JIT= 26.67% 2. N/A= 25% 2. Just-In-Time= 32.65% 2. JIT= 28.07% 2. JIT= 33.33% 2. N/A= 35.48% 2. N/A= 24.39% 2. Not Applicable= 33. 33% 2. JIT= 34.21% 2. N/A= 28.95% 2. JIT= 30% 2. JIT= 25% 2. Don’t know= 26.67%
3. Don’t know= 21.74% 3. VS analysis= 11.76% 3. JIT= 30.23% 3. N/A= 16.67% 3. Don’t know= 21.88% 3. N/A= 28.57% 3. N/A= 22.81% 3. N/A= 18.18% 3. JIT= 12.9% 3. Don’t know= 19.51% 3. Don’t know= 16.67% 3. N/A= 18.42% 3. JIT= 23.68% 3. N/A= 20% 3. N/A= 21.43% 3. N/A= 23.33%
4. VS analysis= 8.88% 4. N/A= 5.88% 4. VS analysis= 7% 4. VS analysis= 10% 4. Other= 15%4. Value stream analysis=
6.12%4. Other= 14%
4. Value stream analysis=
6%4. Other=12% 4. VS analysis= 17.07%
4. Kanban System=
11.11%
4. Value stream analysis=
10.53%4. Other= 13%
4. Value stream analysis=
10%4. Other=10% 4. Other= 10%
5. Kanban= 8.88% 5. Kanban= 5.88% 5. Other= 2% 5. Other= 10% 5. VS analysis= 12.5% 5. Kanban System= 2.04% 5. VS analysis= 12.28% 5. Other= 6%5. Value stream analysis=
3.23%5. Kanban= 9.76%
5. Value stream analysis=
5.56%5. Other= 5% 5. VS analysis= 10.53% 5. Other= 0%
5. Value stream analysis=
7.14%5. VS analysis= 6.67%
6. Other= 8.88% 6. Other= 5.88% 6. Kanban= 2% 6. Kanban= 3.33% 6. Kanban= 9.38% 6. Other= 2.04% 6. Kanban= 7.02% 6. Kanban System= 0% 6. Kanban= 3.23% 6. Other= 7% 6. Other= 5% 6. Kanban= 2.63% 6. Kanban= 5.26% 6. Kanban System= 0% 6. Kanban= 3.57% 6. Kanban= 6.67%
1. N/A= 34..78% 1. None= 58.82% 1. N/A= 37.21% 1. BIM= 40% 1. BIM= 43.75% 1. N/A= 34.69% 1. BIM= 41.07% 1. BIM= 32.35% 1. BIM= 43.33% 1. BIM= 30% 1. N/A= 47.06% 1. None= 34.21% 1. BIM= 55.26% 1. N/A= 40% 1. BIM= 37.93% 1. BIM= 34.48%
2. BIM= 26.09% 2. BIM= 17.65% 2. None= 30.27% 2. DSM= 30% 2. VR tools= 21.88% 2. None=30.61% 2. N/A= 19.64% 2. None= 29.41% 2. N/A= 30% 2. None= 30% 2. None= 23.53% 2. BIM= 26.32%% 2. N/A= 15.79% 2. BIM= 30% 2. None= 27.59 2. None= 34.48%
3. None= 21.74% 3. N/A= 11.76% 3. BIM= 25.58% 3. None= 30% 3. N/A= 21.88% 3. BIM= 28.57% 3. None= 19.64% 3. N/A= 26.47%3. Design structure matrix=
13.33%3. N/A= 25%
3. Virtual reality tools=
17.65%3. N/A= 28.89% 3. DSM= 15.79%
3. Design structure matrix=
10%
3. Virtual reality tools=
24.14%3. N/A= 27.59%
4. VR tools= 17.39% 4. Other= 11% 4. VR tools= 9.3% 4. N/A= 16.67% 4. Other= 15% 4. VR tools= 10.2% 4. DSM= 17.86%4. Design structure matrix=
14.71%
4. Virtual reality tools=
13.33%4. VR tools= 17.5% 4. BIM= 17.65%
4. Virtual reality tools=
15.79%4. VR tools= 15.79% 4. None= 10%
4. Design structure matrix=
17.24%4. Other= 17%
5. Other= 13% 5. DSM= 6% 5. Other= 6% 5. VDS= 13.33% 5. None= 12.5% 5. DSM= 8.16% 5. VR tools= 17.86% 5. Other= 11% 5. None= 13.33% 5. DSM= 12.5% 5. Other= 17.65%5. Design structure matrix=
13.16%5. None= 15.79% 5. Other= 10%
5. Virtual design studios=
10.34%5. VR tools= 13.79%
6. VDS= 8.7% 6. VR tools= 6% 6. DSM= 4.65% 6. VR tools= 13.33% 6. DSM= 9.38% 6. Other= 6% 6. Other= 14%6. Virtual reality tools=
8.826. Other= 13% 6. VDS= 10%
6. Design structure matrix=
5.88%
6. Virtual design studios=
7.89%6. Other= 13% 6. Virtual reality tools= 0% 6. N/A= 10.34% 6. DSM= 6.9%
7. DSM= 4.35% 7. VDS= 0% 7. VDS= 2.33% 7. Other= 10% 7. VDS= 9.38% 7. VDS= 4.08% 7. VDS= 10.71%7. Virtual design studio=
5.88%
7. Virtual design studios=
6.67%7. Other= 7%
7. Virtual design studio=
5.88%7. Other= 2% 7. VDS= 7.89%
7. Virtual design studio=
0%7. Other= 3% 7. VDS= 6.9%
1. N/A= 47.83% 1. None= 41.18% 1. N/A= 44.19% 1. N/A= 31% 1. N/A= 33.33% 1. N/A= 42.86% 1. N/A= 33.33% 1. N/A= 47.06% 1. N.A= 40% 1. None= 34.15% 1. N/A= 50% 1. N.A= 39.47% 1. N/A= 31.58% 1. N/A= 60% 1. None= 42.86% 1. None= 43.33%
2. None= 21.74% 2. N/A= 29.41% 2. None= 30.23% 2. None= 31% 2. N/A= 30.3% 2. None= 28.57% 2. None= 31.58%2. Set-based design=
20.59%2. None= 33.33% 2. N/A= 29.27%
2. Concurrent design=
16.67%2. None= 39.47% 2. None= 28.95% 2. Concurrent design= 30% 2. N.A= 28.57% 2. N/A= 30%
3. Concurrent design= 13%3. Concurrent design=
23.53%
3. Set based design=
16.28%
3. Concurrent design=
24.14%
3. Concurrent design=
24.24%
3. Concurrent design=
20.41%
3. Concurrent design=
19.3%3. None= 20.59%
3. Concurrent design=
16.67%
3. Concurrent design=
26.83%%
3. Set-based design=
16.67%
3. Concurrent design=
13.16%
3. Concurrent design=
26.32%3. Set-based design= 20%
3. Set-based design=
21.43%
3. Concurrent design=
20%%
4. Set based design= 13% 4. Other= 5% 4. Concurrent design= 14%4. Set based design=
20.69%
4. Set based design=
9.09%
4. Set based design=
16.33%
4. Set based design=
14.04%
4. Concurrent design=
14.71%
4. Set-based design=
13.33%
4. Set-based design=
12.2%4. None= 11.11%
4. Set-based design=
10.53%
4. Set-based design=
21.05%
4. Other= 10% (said: Don’t
know)
4. Concurrent design=
14.29%4. Other= 10%
5. Other= 8% 5. Set based design= 0% 5. Other= 11% 5. Other= 3% 5. Other= 9% 5. Other= 10% 5. Other= 7% 5. Other= 8% 5. Other= 13% 5. Other= 4% 5. Other= 5% 5. Other= 10% 5. Other= 7% 5. None= 0% 5. Other= 7%5. Set-based design=
6.67%
1. N/A= 73.91% 1. N/A= 58.82% 1. N/A= 74.42% 1. N/A= 51.72% 1. N/A= 50% 1. N/A= 67.35% 1. N/A= 55.36% 1. N/A= 57.58% 1. N/A= 70% 1. N/A= 56.1% 1. N/A= 55.56% 1. N/A= 67.57% 1. N/A= 55.26% 1. N/A= 50% 1. N/A= 60.71% 1. N/A= 60%
2. Planning= 21.74%2. Performance
measurement= 23.53%
2. Performance
measurement= 18.6%2. Planning= 38% 2. Planning= 28.12% 2. Planning= 20.41% 2. Planning= 28.57%
2. Planning as an activity
schedule= 21.21%
2. Planning as an activity
schedule= 16.67%2. Planning= 34.15%
2. Planning as an activity
scheduling tool= 33.33%
2. Planning as an activity
schedule= 24.32%
2. Management Control=
26..32%
2. Management control=
30%
2. Planning as an activity
schedule= 25%2. Planning= 30%
3. Logistics= 13% 3. Planning= 17.65% 3. Planning= 14%3. Management control=
31%
3. Production control=
28.12%
3. Performance
measurement= 20.41%
3. Production control=
21.43%
3. Management control=
21.21%
3. Production control=
16.67%
3. Performance
measurement= 29.27%
3. Performance
measurement= 16.67%
3. Production control=
16.22%3. Planning= 23.68%
3. Planning as an activity
schedule= 20%
3. Management Control=
21.43%
3. Performance
measurement= 23.33%
4. Performance
measurement= 13%
4. Management control=
17.65%4. Logistics= 9.3%
4. Production control=
20.69%
4. Performance
measurement= 18.75%
4. Management Control=
14.29%
4. Management control=
21.43%
4. Performance
measurement= 15.15%4. Logistics= 16.67%
4. Production control=
19.51%
4. Production control=
5.56%
4. Performance
measurement= 16.22%
4. Production control=
23.68%
4. Production control=
20%
4. Production control=
17.86%4. Logistics= 20%
5. Production control=
8.7%
5. Production control=
11.76%
5. Management control=
9.3%5. Logistics= 20.69%
5. Management control=
18.75%
5. Production control=
10.2%5. Logistics= 17.86%
5. Production control=
12.12%
5. Management Control=
13.33%
5. Management Control=
19.51%5. Logistics= 5.56%
5. Management Control=
16.22%
5. Performance
measurement= 23.68%
5. Performance
measurement= 20%
5. Performance
measurement= 17.86%
5. Production control=
13.33%
Q.
23
25
16
17
18
19
20
22
Team leader, site
manager, and project
manager
Regional manager,
department manager,
and managerial
director
Academic/Researcher
11
Graduates and Juniors
Organisations with
more than 500
employees
NVQ and HND/HNC
24
MastersTurn Over [0-100]0-10 Years of
Experience
10-20 Years of
Experience
20+ Years of
ExperienceDegree
Private Individuals and
OrganisationsPublic Organisations Turn Over [100-1000] Turn Over [1000+]
Organisations with
less than 500
employees
12
13
14
15
48]

Q.
Team leader, site
manager, and project
manager
Regional manager,
department manager,
and managerial
director
Academic/ResearcherGraduates and Juniors
Organisations with
more than 500
employees
NVQ and HND/HNC MastersTurn Over [0-100]0-10 Years of
Experience
10-20 Years of
Experience
20+ Years of
ExperienceDegree
Private Individuals and
OrganisationsPublic Organisations Turn Over [100-1000] Turn Over [1000+]
Organisations with
less than 500
employees
6. Management control=
8.7%6. Other= 11.76%
6. Production control=
4.65%
6. Performance
measurement= 20.69%6. Other= 12% 6. Logistics= 10.2%
6. Performance
measurement= 17.86%6. Logistics= 9.09%
6. Performance
measurement= 10%6. Logistics= 17.07%
6. Management control=
5.56%6. Logistics= 10.81% 6. Logistics= 21.05% 6. Logistics= 10% 6. Logistics= 10.71%
6. Management Control=
13.33%
7. Other= 0% 7. Logistics= 6% 7. Other= 2% 7. Other= 0% 7. Other= 2% 7. Other= 7% 7. Other= 6% 7. Other= 3% 7. Other= 4% 7. Other= 5% 7. Other= 2% 7. Other= 5%7. Other= 10% (said: Don’t
Know)7. Other= 0% 7. Other= 10%
26
· measures production
planning effectiveness and
workflow reliability= 18.18%
· measures production
planning effectiveness and
workflow reliability= 25%
· Measures production
planning effectiveness and
workflow reliability=14%
· measures production
planning effectiveness and
workflow reliability= 14.81%
· measures production
planning effectiveness and
workflow reliability= 18.18%
· Production planning
effectiveness and workflow
reliability= 16.67%%
· Production planning
effectiveness and workflow
reliability= 14.29%
· 15.15% (measures
production planning
effectiveness and workflow
reliability)
· 3.33% (measures
production planning
effectiveness and workflow
reliability)
· 25% (measures
production planning
effectiveness and workflow
Reliability)
· 5.56% (measures
production planning
effectiveness and workflow
reliability)
· 21.62% (effectiveness&
reliability)
· 16.22 %
(effectiveness&
reliability)
· ZERO % (measures
production planning
effectiveness and workflow
reliability)
· 22.22% (measures
production planning
effectiveness and workflow
reliability)
· 23.33% (measures
production planning
effectiveness and workflow
Reliability)
1. Experience of
managers= 69.57%1. KPI= 94.12%
1. Experience of
managers= 59.52%1. KPI= 90% 1. KPI= 90.91% 1. KPI= 57.14% 1. KPI= 89.66% 1. KPI= 64.71% 1. KPI= 77.42% 1. KPI= 80.49% 1. KPI= 88.24% 1. KPI= 71.05% 1. KPI= 71.79%
1. Experience of
managers= 70%1. KPI= 82.76% 1. KPI= 75.86%
2. KPI= 65.22% 2. own metrics= 58.82% 2. KPI= 52.38%2. Experience of
managers= 53.33%
2. Experience of
managers= 63.64%
2. Experience of
managers= 57.14%
2. Experience of
managers= 58.62%
2. Experience of
managers= 61.76%
2. Experience of
managers= 51.61%
2. Experience of
managers= 58.54%
2. Experience of
managers= 47.06%
2. Experience of
managers= 71.05%
2. Experience of
managers= 51.28%2. KPI= 30%
2. Experience of
managers= 51.61%
2. Experience of
managers= 68.96%
3. Own metrics= 21.74%3. Experience of
managers= 58.82%3. Process PM= 21.43% 3. Own metrics= 36.67% 3. Own metrics= 54.55% 3. Process PM= 24.49% 3. Own metrics= 44.83%
3. Process performance
measures= 29.41%3. Own metrics= 25.81% 3. Own metrics= 48. 78% 3. Own metrics= 29.41% 3. Own metrics= 50% 3. Process PM= 30.77%
3. International
benchmark= 20%3. Process PM= 34.48% 3. Own metrics= 55.17%
4. Process PM= 17.39% 4. Process PM= 29.41% 4. Own metrics= 19.05% 4. LPS= 30% 4. Process PM= 33.33%4. Our own metrics=
22.45%4. Process PM= 29.31% 4. Own metrics= 26.47%
4. Process Performance
measures= 19.35%4. Process PM= 31.71%%
4. International
benchmarking= 23.53%
4. Process Performance
measures= 28.95%
4. Balanced Scorecards=
23.08%4. None= 20% 4. Own metrics= 31.03% 4. Process PM= 31.03%%
5. International
benchmarking= 13%
5. International
benchmarking= 23.53%5. None= 11.9% 5. Process PM= 30%
5. Balanced Scorecards=
21.21%5. LPS= 14.29%
5. Balanced Scorecards=
24.14%
5. International
benchmarking= 17.65%
5. Balanced score cards=
16.13%5. LPS= 24.39%
5. Process performance
measures= 23.53%5. LPS= 18.42% 5. Own metrics= 20.51% 5. DQI= 10%
5. Balanced score cards=
24.14%5. LPS= 24.14%
6. LPS= 13%6. Balanced Scorecards=
23.53%
6. International
benchmarking= 9.52%
6. Balanced scorecards=
26.67%
6. International
benchmarking= 15.15%
6. Balanced scorecards=
10.2%
6. International
benchmarking= 20.69%
6. Balanced Score cards=
11.76%6. LPS= 12.9%
6. Balanced Scorecards=
24.39%6. LPS= 11.76%
6. Balanced score cards=
13.16%6. LPS= 17.95% 6. QMPMS= 10% 6. LPS= 20.69%
6. Balanced Scorecards=
20.69%
7. Balanced Scorecards=
8.7%7. LPS= 17.65%
7. Balanced scorecards=
9.52%
7. International
benchmarking= 20%7. LPS= 15.15% 7. None= 10.2% 7. LPS= 17.24% 7. LPS= 8.82%
7. International
benchmarking= 9.68%
7. International
benchmarking= 17.07%
7. Balanced Score cards=
11.76%7. QMPMS= 10.53%
7. International
benchmarking= 15.38%7. Own metrics= 10%
7. International
benchmarking= 10.34%
7. International
benchmarking= 13.79%
8. QMPMS= 8.7% 8. QMPMS= 6% 8. LPS= 7.14% 8. DQI= 16.67% 8. QMPMS= 12.12%8. International
benchmarking= 8.16%8. QMPMS= 13.79% 8. DQI= 8.82% 8. None= 9.68% 8. QMPMS= 14.63% 8. DQI= 5.88%
8. International
benchmarking= 7.89%8. QMPMS= 10.26% 8. Process PM= 10% 8. None= 6.9% 8. DQI= 10.34%
9. None= 8.7% 9. None= 0% 9. DQI= 2.38% 9. QMPMS= 13.33% 9. DQI= 6.06% 9. DQI= 8.16% 9. DQI= 6.9% 9. QMPMS= 5.88% 9. QMPMS= 6.45% 9. DQI= 9.76% 9. QMPMS= 5.88% 9. DQI= 7.89% 9. DQI= 5.1359. Other= 10% (said:
Customer feedback)9. QMPMS= 6.9% 9. QMPMS= 6.9%
10. Other= 0% 10. Other= 0% 10. QMPMS= 2.38% 10. Other= 6% 10. Other= 3% 10. QMPMS= 4% 10. Other= 5% 10. None= 5.88% 10. DQI= 3% 10. Other= 4% 10. Other= 5.88% 10. None= 7.89% 10. None= 5.13%10. Balanced Score cards=
0%10. DQI= 0% 10. Other= 0%
11. Other= 2% 11. None= 0% 11. None= 3% 11. Other= 4% 11. None= 1.72% 11. Other= 5% 11. Other= 3% 11. None= 2.44% 11. None= 0% 11. Other= 2% 11. Other= 2% 11. LPS= 0% 11. Other= 3% 11. None= 0%
Mean score for ‘non-
financial’ performance
indicators (Only those
achieving a score of 8 and
above will be considered)
Mean score for ‘non-
financial’ performance
indicators (Only those
achieving a score of 8 and
above will be considered)
Mean score for ‘non-
financial’ performance
indicators (Only those
achieving a score of 8 and
above will be considered)
Mean score for ‘non-
financial’ performance
indicators (Only those
achieving a score of 8 and
above will be considered)
Mean score for ‘non-
financial’ performance
indicators (Only those
achieving a score of 8 and
above will be considered)
Mean score for ‘non-
financial’ performance
indicators (Only those
achieving a score of 8 and
above will be considered)
Mean score for ‘non-
financial’ performance
indicators (Only those
achieving a score of 8 and
above will be considered)
Mean score for ‘non-
financial’ performance
indicators (Only those
achieving a score of 8 and
above will be considered)
Mean score for ‘non-
financial’ performance
indicators (Only those
achieving a score of 8 and
above will be considered)
Mean score for ‘non-
financial’ performance
indicators (Only those
achieving a score of 8 and
above will be considered)
Mean score for ‘non-
financial’ performance
indicators (Only those
achieving a score of 8 and
above will be considered)
Mean score for ‘non-
financial’ performance
indicators (Only those
achieving a score of 8 and
above will be considered )
Mean score for ‘non-
financial’ performance
indicators (Only those
achieving a score of 8 and
above will be considered)
Mean score for ‘non-
financial’ performance
indicators (Only those
achieving a score of 8 and
above will be considered)
Mean score for ‘non-
financial’ performance
indicators (Only those
achieving a score of 8 and
above will be considered)
Mean score for ‘non-
financial’ performance
indicators (Only those
achieving a score of 8 and
above will be considered)
1. Safety= 9.521 1. Safety= 9.625 1. Safety= 9.325 1. Safety= 9.714 1. Safety= 9.545 1. Safety= 9.346 1. Safety= 9.637 1. Safety= 9.47 1. Safety= 9.129 1. Safety= 9.804 1. Safety= 9.89 1. Safety= 9.756 1. Safety= 9.589 1. Safety= 9.0 1. Safety= 9.75 1. Safety= 9.8
2. Customer Satisfaction=
9.174
2. Customer Satisfaction=
9.25
2. Customer Satisfaction=
9.14
2. Customer Satisfaction=
8.93
2. Customer Satisfaction=
9.454
2. Customer Satisfaction=
8.918
2. Customer Satisfaction=
9.344
2. Customer Satisfaction=
9.11
2. Customer Satisfaction=
9.193
2. Customer Satisfaction=
9.195
2. Customer
Satisfaction= 9.556
2. Customer Satisfaction=
9.189
2. Customer Satisfaction=
8.972. Quality= 8.7
2. Customer Satisfaction=
9.142
2. Customer Satisfaction=
9.4
3. Quality= 8.869 3. Quality= 8.875 3. Quality= 8.813 3. Quality= 8.75 3. Quality= 8.67 3. Quality= 8.734 3. Quality= 8.793 3. Quality= 8.941 3. Quality= 8.451 3. Quality= 8.902 3. Quality= 9.278 3. Quality= 8.837 3. Quality= 8.7173. Customer Satisfaction=
8.43. Quality= 8.857 3. Quality= 8.67
4. Functionality= 7.608 4. Functionality= 8.0 4.Functionality= 7.928 4. Functionality= 7.965 4. Planning Efficiency= 7.757 4. Functionality= 7.6875 4. Team performance= 7.965 4. Functionality= 8.242 4. Productivity= 8.0644. Team performance=
7.6094. Planning Efficiency= 8.556 4. Functionality= 7.81 4.Planning Efficiency= 7.897 4. Functionality= 7.8 4. Functionality= 7.75 4. Team performance= 7.7
5. Planning Efficiency=
7.5625. Productivity= 8.0 5. Productivity= 7.907 5. Productivity= 7.931 5. Team performance= 7.727 5. Team performance= 7.612 5. Productivity= 7.965 5. Productivity= 8.117 5. Functionality= 8.032 5. Productivity= 7.365 5. Team performance= 8.44 5. Productivity= 7.783 5. Functionality= 7.842 5. Productivity= 7.5
5. Team performance=
7.6425. Productivity= 7.6
6. Productivity= 7.521 6.Team performance= 7.93756. Team performance=
7.6746. Team performance= 7.931
6. Productivity=
7.5156. Productivity= 7.591
6. Planning
Efficiency= 7.775
6. Team performance=
7.882
6. Team performance=
8.032
6. Planning Efficiency=
7.3176. Productivity= 8.05 6. Team performance= 7.54 6. Productivity= 7.794 6. Planning Efficiency= 7.5 6. Productivity= 7.642
6. Planning Efficiency=
7.43
7. Team performance=
7.434
7. Planning Efficiency=
7.5625
7. Planning Efficiency=
7.6047. Planning Efficiency= 7.482 7. Functionality= 7.272 7. Planning Efficiency= 7.408 7. Functionality= 7.741
7. Planning Efficiency=
7.823
7. Planning Efficiency=
7.8067. Functionality= 7.048 7. Functionality= 7.778 7. Planning Efficiency= 7.081 7. Team performance= 7.717 7. Team performance= 7.1
7. Planning Efficiency=
7.3577. Functionality= 7.413
1. less waste= 81.82% 1. Less waste= 88.24% 1. Less waste= 75%1. improved productivity=
86.67%1. Less waste= 69.7% 1. less waste= 76.6% 1. less waste= 74.14% 1. less waste= 83.87% 1. Less waste= 74.19%
1. Improved productivity=
71.43%
1. Improved
productivity=70.59%1. Less waste= 73.68% 1. Less waste= 81.08% 1. less waste= 88.89% 1. Less waste= 72.41%
1. Fewer defects and
improved quality= 82.76%
2. improved productivity=
72.73%
2. Improved productivity=
76.47%
2. improved productivity=
67.5%2. Less waste= 83.33%
2. fewer defects and
improved quality= 69.7%
2. improved productivity=
74.47%
2. fewer defects and
improved quality= 68.97%
2. Improved
productivity=74.19%
2. Improved productivity=
64.52%
2. Fewer defects and
improved quality= 71.43%
2. fewer defects and
improved quality = 70.59%
2. Improved productivity=
68.42%
2. Improved productivity=
70.27%
2. Improved
productivity=66.67%
2. Improved productivity=
65.52%
2. Improved productivity=
72.41
3. fewer defects and
improved quality= 72.73%
3. fewer defects and
improved quality= 70.59%
3. fewer defects and
improved quality= 62.5%3. Reduced cost= 76.67%
3. improved safety and
health
3. fewer defects and
improved quality= 65.96%
3. improved productivity=
67.24%3. Reduced cost= 74.19%
3. Fewer defects and
improved quality= 64.52%3. Less waste= 69.05% 3. less waste= 64.71%
3. Fewer defects and
improved quality= 65.79%
3. Fewer defects and
improved quality= 70.27%,3. Reduced cost= 66.67%
3. Fewer defects and
improved quality= 62.07%
3. More client satisfaction=
72.41%
4. more client satisfaction
68.18%4. reduced cost= 70.59% 4. Reduced cost= 60%
4. fewer defects and
improved quality= 73.33%4. conditions= 57.58% 4. reduced cost= 59.57% 4. reduced cost= 63.79%
4. fewer defects and
improved quality= 64.52%
4. More client satisfaction=
54.84%4. Reduced cost= 64.29%
4. increased profit=
64.71%4. Reduced cost= 55.26% 4. Reduced cost= 70.27%
4. fewer defects and
improved quality= 55.56%4. Reduced cost= 55.17%
4. Increased Predictability=
72.41%
5. reduced cost= 68.18%5. more client satisfaction=
58.82%
5. more client satisfaction=
57.5%
5. more client satisfaction=
63.33%
5. improved productivity=
57.58%
5. more client satisfaction=
57.45%
5. more client satisfaction
and improved safety and
health conditions= 55.17%
5. increased
profit/turnover AND more
client satisfaction 51.61%
5. improved safety and
health conditions= 51.61%
5. More client satisfaction=
59.52%
5. improved safety and
health conditions= 64.71%
5. More client satisfaction=
47.37%
5. More client satisfaction=
64.86%
5. increased
profit/turnover= 44.44%
5. More client satisfaction=
51.72%
5. Less waste, Reduced
cost, and increased profit=
65.52%
6. reduced cost=
51.52%
1. Risk management and
mitigation= 60.87%
1. Risk management=
62.5%
1. Cost and Value
Management= 61%1. Risk management= 62%
1. Risk management=
48.48%
1. Cost and Value
Management= 59.57%
1. Cost and Value
Management= 51.72%
1. Cost and Value
Management= 66.67%
1. Cost and Value
Management= 48.39%1. Risk Management= 60%
1. Risk Management=
62.5%
1. Risk Management=
64.86%%
1. Cost and Value
Management= 66.67%1. Risk Management= 50%
1. Cost and Value
Management= 60.71%
1. Risk Management=
65.52%
2. Cost and Value
Management= 60.87%
2. Cost and Value
Management= 43.75%
2. Risk management=
53.66%
2. Cost and Value
management= 58.62%
2. Cost and Value
management= 48.48%
2. Risk management=
57.45%
2. Risk management=
51.72%
2. Risk Management=
54.55%
2. Risk Management=
45.16%
2. Cost and Value
Management= 52.5%
2. Cost and Value
Management= 43.75%
2. Cost and Value
Management= 45.95%%
2. Risk Management=
46.15%
2. Cost and Value
Management= 50%
2. Risk Management=
39.29%
2. Cost and Value
Management= 51.72%
3. LC= 26% 3. All= 25% 3. LC= 22% 3. SC assistance= 38% 3. All= 27.27% 3. All= 21.28% 3. All= 29.31% 3. LC= 21.21% 3. All= 32.26% 3. All= 27.5% 3. All= 37.5% 3. All= 27.03% 3. SC assistance= 23.08% 3. All= 20% 3. All= 28.57% 3. SC assistance= 34.48%
4. SC assistance= 26% 4. LC= 18.75% 4. SC assistance= 22% 4. All= 31% 4. LC= 15.15% 4. LC= 19.15% 4. SC assistance= 27.59% 4. All= 18.18% 4. SC assistance= 32.26% 4. SC assistance= 25% 4. SC assistance= 31.25% 4. SC assistance= 27.03% 4. All= 20.51% 4. LC= 10% 4. SC assistance= 17.86% 4. All= 31.03%
5. All= 26% 5. SC assistance= 12.5% 5. All= 22% 5. LC= 13.79% 5. SC assistance= 15.15% 5. SC assistance= 19.15% 5. LC= 15.52% 5. SC assistance= 15.15% 5. LC= 12.9% 5. LC= 17.5% 5. LC= 18.75% 5. LC= 18.92% 5. LC= 15.38%5. Other= 10% (said: Don’t
know)5. LC= 3.57% 5. LC= 31.03
6. Other= 0% 6. Other= 12% 6. Other= 9% 6. Other= 3% 6. Other= 3% 6. Other= 10% 6. Other= 3% 6. Other= 9% 6. Other= 6% 6. Other= 5% 6. Other= 6% 6. Other= 8% 6. Other= 5% 6. SC assistance= 0% 6. Other= 0% 6. Other= 5%
1. N/A= 31.82%1. International
standards= 58.82%1. BREEAM= 31.71%
1. International
standards= 70%
1. International
standards= 56.25%1. BREEAM= 37.5%
1. International
standards= 64.91%
1. International
standards= 45.16%
1. International
standards= 61.29%
1. International
standards= 45.24%
1. International
standards= 62.5%
1. International
standards= 47.37%
1. International
standards= 46.15%1. BREEAM= 33.33%
1. International
standards= 65.52%
1. International
standards= 48.28%
2. International
standards= 31.82%2. BREEAM= 47%
2. International
standards= 29.27%2. BREEAM= 46.67% 2. BREEAM= 40.62%
2. International
standards= 31.25%2. BREEAM= 40.35% 2. BREEAM= 35.48% 2. BREEAM= 48.39% 2. BREEAM= 35.71% 2. SC assistance= 43.75% 2. BREEAM= 39.47% 2. BREEAM= 35.9% 2. All= 22.22% 2. BREEAM= 44.83% 2. BREEAM= 27.59%
3. BREEAM= 18.18% 3. SC assistance= 17.65% 3. N/A= 26.83% 3. SC assistance= 36.67% 3. SC assistance= 25% 3. N/A= 25%3. Supply Chain
Assistance= 35.09%3. All= 12.9% 3. SC assistance= 25.81% 3. SC assistance= 26.19% 3. BREEAM= 37.5% 3. SC assistance= 23.68% 3. N/A= 15.38% 3. N/A= 22.22% 3. SC assistance= 24.14% 3. LC= 20.69%
4. SC assistance= 13.64% 4. LC= 11.76% 4. LC= 14.63% 4. LC= 16.67% 4. All= 15.62% 4. LC= 18.75% 4. All=15.79% 4. N/A= 12.9% 4. N/A= 16.13% 4. LC= 19.05% 4. LC= 18.75% 4. N/A= 13.16% 4. LC= 12.82% 4. SC assistance= 11.11% 4. N/A= 10.34% 4. N/A= 17.24%
5. LC= 13.64% 5. Other= 11% 5. Other= 12% 5. N/A= 10% 5. Other= 6% 5. Other= 10% 5. LC= 8.77% 5. SC assistance= 9.68% 5. LC= 9.68% 5. N/A= 14.29% 5. N/A= 12.5% 5. LC= 13.16% 5. All= 10.26% 5. LC= 11.11% 5. All= 6.9% 5. SC assistance= 17.24%
6. Other= 13% 6. All= 5.88% 6. All= 7.32% 6. All= 10% 6. N/A= 6% 6. SC assistance= 4.17% 6. N/A= 7% 6. LC= 9.68% 6. All= 9.68% 6. All= 9.52% 6. All=6.25% 6. All= 10.53% 6. SC assistance= 10.26%6. Other= 11 % (said: Don’t
Know)6. LC= 3.45% 6. Other= 13%
7. All= 4.55% 7. N/A= 0% 7. SC assistance= 7.32% 7. Other= 3% 7. LC= 6.25% 7. All= 4.17% 7. Other= 5% 7. Other= 6% 7. Other= 3% 7. Other= 11% 7. Other= 0% 7. Other= 7% 7. Other= 10%7. International
standards= 0%7. Other= 3% 7. All= 6.7%
1. Community
engagement= 47.83%
1. In-house training=
41.18%
1. In-house training=
35.71%1. In-house training= 60%
1. In-house training=
54.55%
1. In-house training=
36.73%
1. In-house training=
58.62%
1. In-house training=
51.52%
1. In-house training=
51.61%
1. In-house training=
45.24%
1. In-house training=
64.71%
1. In-house training=
47.37%
1. Community
engagement= 48.72%1. In-house training= 30%
1. In-house training=
58.62%
1. In-house training=
46.67%
2. In-house training=
34.78%
2. Safety programmes=
41.18%
2. Job knowledge and Skills
scheme= 33.33%
2. Community engagement
56.67%
2. Community
engagement= 45.45%
2. Job knowledge and Skills
scheme= 28.57%
2. Community
engagement= 51.72%
2. Job knowledge and skills
scheme= 39.39%
2. Community
engagement= 48.39%
2. Community
engagement= 40.48%
2. Job knowledge and skills
scheme= 58.82%
2. Community
engagement= 39.47%
2. In-house training=
41.03%2. N/A= 20%
2. Safety programmes=
44.83
2. Community
engagement= 43.33%
3. Job knowledge and Skills
scheme= 34.78%
3. Community
engagement= 41.18%
3. Team development=
28.57%
3. Safety programmes=
50%
3. Safety programmes=
33.33%
3. Team development
Programme= 28.57%
3. Safety programmes=
41.38%
3. Community
engagement= 33.33%
3. Safety programmes=
35.48%
3. Safety programmes=
33.33%
3. Team development=
35.29%
3. Team development= 34.
2%
3. Safety programmes=
33.33%
3. Creating a Lean culture=
20%
3. Community
engagement= 41.38%
3. Job knowledge and Skills
scheme= 26.67%
4. Safety programmes=
30.43%
4. Job knowledge and skills
scheme= 35.29%
4. Community
engagement= 26.19%
4. Job knowledge and Skills
scheme= 43.33%
4. Job knowledge and Skills
scheme= 24.24%
4. Community
engagement= 28.57%
4. Job knowledge and skills
scheme= 37.93%
4. Team development=
24.24%
4. Team development=
29.03%
4. Job knowledge and Skills
scheme= 33.33%
4. Community
engagement= 35.29%
4. Job knowledge and Skills
scheme= 31.58%
4. Job knowledge and Skills
scheme= 25.64%4. All= 20%
4. Job knowledge and Skills
scheme= 37.93%
4. Team development=
26.67%
5. N/A= 21.74%5. Team development=
29.41%5. N/A= 16.67%
5. Team development=
33.33%5. All=21.21% 5. N/A= 18.37%
5. Team development=
25.86%
5. Safety programmes=
24.24%
5. Job knowledge and Skills
scheme= 29.03%
5. Team development=
28.57%
5. Creating a Lean culture=
29.41%
5. Safety programmes=
28.95%
5. Team development=
23.08%
5. Job knowledge and skills
scheme= 10%
5. Team development=
31.03%
5. Safety programmes=
26.67%
6. Lean culture= 21.74% 6. Other= 17% 6. Lean culture= 14.29% 6. Lean culture= 20%6. Team development=
18.18%
6. Safety programmes=
18.37%6. Lean culture= 20.69%
6. Creating a Lean culture=
18.18%6. All= 12.9% 6. Lean culture= 21.43%
6. Safety programmes=
29.41%
6. Creating a Lean culture=
15.79%6. Lean culture= 12.82%
6. Community
engagement= 10%6. All= 10.34% 6. Lean culture= 20%
7. Team development=
21.74%7. Lean culture= 11.76%
7. Safety programmes=
14.29%7. All= 10% 7. Lean culture= 15.15% 7. Lean culture= 12.24% 7. All= 17.24% 7. All=12.12%
7. Creating a Lean culture=
9.68%7. Other=16% 7. All=11.76% 7. All= 15.79% 7. All= 10.26%
7. Team development=
10%
7. Creating a Lean culture=
10.34%7. Other=13%
8. All= 4.35% 8. Other= 17% 8. Other= 11% 8. N/A= 6.67% 8. Other= 12% 8. Other= 12.24% 8. Other= 8% 8. Other= 6% 8. Other= 6% 8. All= 11.9% 8. Other= 5% 8. Other= 15% 8. Other= 5%8. Safety programmes=
10%8. Other= 0% 8. All= 10%
9. Other= 4% 9. All= 11.76% 9. All= 4.76% 9. Other= 3% 9. N/A= 3% 9. All= 6% 9. N/A= 1.72%9. Other= 10% (said: Not
sure what you mean)
1. To improve the quality
of our outputs= 59%
1. To improve our rate of
client satisfaction= 52.94%
1. To improve our rate of
client satisfaction= 53.85%
1. To improve the quality
of our Outputs= 63.33%
1. To improve our rate of
client satisfaction= 51.52%
1. To improve our rate of
client Satisfaction= 48.89%
1. To improve our rate of
client Satisfaction= 58.62%
1. To increase our profit
and /or turnover= 56.25%
1. To improve our rate of
client satisfaction= 58.06%
1. To improve the quality
of our Outputs= 53.86%
1. To improve our rate of
client satisfaction= 62.5%
1. To improve the quality
of our outputs= 55.26%
1. To increase our profit
and /or turnover= 54.05%
1. To increase our profit
and /or turnover= 55.56%
1. To improve the quality
of our outputs= 48.28%
1. To improve our rate of
client satisfaction= 65.52%
2. To improve our rate of
client Satisfaction= 59%
2. To improve the quality
of our outputs= 47%
2. To increase our profit=
54%
2. To increase our profit=
60%
2. To increase our profit=
45.5%
2. To increase our profit
and /or Turnover= 48.89%
2. To increase our profit
and /or Turnover= 55.17%
2. To improve the quality
of our outputs= 52.12%
2. To increase our profit
and /or turnover= 45.16%
2. To increase our profit
and /or turnover= 53.86%
2. To keep up-to-date with
any new emerging
management concepts= 50%
2. To improve our rate of
client satisfaction= 55.26%
2. To improve our rate of
client satisfaction= 48.65%
2. To improve our rate of
client satisfaction= 44.44%
2. To improve our rate of
client satisfaction= 48.28%
2. To improve the quality
of our Outputs= 62.07%
3. To increase our profit=
54.55%
3. To increase our profit=
17%
3. To improve the quality
of our outputs= 46.15%
3. To improve our rate of
client satisfaction= 56.67%
3. To improve the quality
of our outputs= 42.42%
3. To improve the quality of
our Outputs= 46.67%
3. To improve the quality
of our Outputs= 51.72%
3. To improve our rate of
client satisfaction= 53.12%
3. To improve the quality
of our outputs= 38.71%
3. To improve our rate of
client satisfaction= 51.28%
3. To increase our profit
and /or turnover= 50%
3. To increase our profit
and /or turnover= 52.63%
3. To improve the quality
of our outputs= 48.65%
3. To improve the quality
of our outputs= 33.33%
3. To increase our profit
and /or turnover= 48.28%
3. To increase our profit
and /or turnover= 51.72%
4. To keep up-to-date=
31.82%
4. To keep up-to-date=
29.41%
4. To keep up-to-date=
28.21%
4. To keep up-to-date=
36.67%
4. To keep up-to-date=
39.39%
4. To keep up-to-date=
26.67%
4. To keep up to date=
41.38%
4. To keep up-to-date =
37.5%
4. To keep up to date=
29.03%
4. To keep up-to-date=
38.46%
4. To improve the quality
of our outputs= 37.5%
4. To keep up to date=
28.95%
4. To keep up-to-date=
32.43%
4. To keep up-to-date =
37.5%
4. To keep up to date=
44.83%
4. To keep up-to-date=
37.93%
5. As a respond to the
Egan's report= 27.27%5. Other= 17%
5. As a respond to the
Egan's report= 15.38%
5. As a respond to the
Egan's report= 23.33%5. Other= 27%
5. As a respond to the
Egan's report= 15.56%
5. As a respond to the
Egan's report= 17.24%5. Other= 18%
5. As a respond to Egan’s
report= 16.13%
5. As a respond to Egan’s
report= 20.51%
5. As a respond to the
Egan's report= 25%
5. We are satisfied=
13.16%
5. As a respond to Egan’s
report= 21.62%
5. When a major problem
occurs= 22.22%
5. As a respond to Egan’s
report= 24.14%
5. As a respond to Egan’s
report= 20.69%
6. When a major problem
Occurs= 13.64%
6. As a respond to the
Egan's report= 5.88%
6. We are satisfied, no
need to change= 12.82%
6. When a major problem
occurs= 10%
6. As a respond to the
Egan's report= 12.12%6. Other= 13% 6. Other= 15%
6. When a major problem
occurs= 15.62%6. Other= 16.13%
6. When a major problem
occurs= 10.26%
6. When a major problem
occurs/occurred=12.5%6. Other= 13% 6. Other= 13%
6. Other= 22% ( they said:
Don’t know and N/A)
6. We are satisfied=
10.34%6. Other= 10%
7. Other= 4%7. We are satisfied, no
need to change= 5.88%7. Other= 12%
7. We are satisfied, no
need to change= 3.33%
7. We are satisfied, no
need to change= 9%
7. We are satisfied, no
need to change= 11.11%
7. When a major problem
Occurs= 8.62%
7. We are satisfied, no
need to change= 5.38%7. We are satisfied= 9.68% 7. Other= 10% 7. Other= 12%
7. As a respond to Egan’s
report= 10.53%
7. When a major problem
occurs= 10.81%
7. We are satisfied, no
need to change= 11.11%
7. When a major problem
occurs= 6.9%
7. When a major problem
occurs= 3.45%
8. We are satisfied, no
need to change= 4%
8. When a major problem
Occurs= 0%
8. When a major problem
occurs= 10.26%8. Other= 3.33%
8. When a major problem
occurs= 9%
8. When a major problem
Occurs= 11.11%
8. We are satisfied; No
need to change= 6.9%
8. As a respond to the
Egan's report= 5.38%
8. When a major problem
occurs= 3.23%
8. We are satisfied, No
need to change= 7.69%
8. We are satisfied, no
need to change= 0%
8. When a major problem
occurs= 5.26%
8. We are satisfied, No
need to change= 8.11%
8. As a respond to the
Egan's report= 0%8. Other= 0%
8. We are satisfied, No
need to change= 3.45%
Only barriers with a mean
score of 4.0 and above will be
classified as significant
barriers :
Only barriers with a mean
score of 4.0 and above will be
classified as significant
barriers:
Only barriers with a mean
score of 4.0 and above will be
classified as significant
barriers :
Only barriers with a mean
score of 4.0 and above will be
classified as significant
barriers :
Only barriers with a mean
score of 4.0 and above will be
classified as significant
barriers :
Only barriers with a mean
score of 4.0 and above will be
classified as significant
barriers:
Only barriers with a mean
score of 4.0 and above will be
classified as significant
barriers:
Only barriers with a mean
score of 4.0 and above will be
classified as significant
barriers :
Only barriers with a mean
score of 4.0 and above will be
classified as significant
barriers :
Only barriers with a mean
score of 4.0 and above will be
classified as significant
barriers :
Only barriers with a mean
score of 4.0 and above will be
classified as significant
barriers :
Only barriers with a mean
score of 4.0 and above will be
classified as significant
barriers :
Only barriers with a mean
score of 4.0 and above will be
classified as significant
barriers :
Only barriers with a mean
score of 4.0 and above will be
classified as significant
barriers :
Only barriers with a mean
score of 4.0 and above will be
classified as significant
barriers :
Only barriers with a mean
score of 4.0 and above will be
classified as significant
barriers :
Only barriers with a mean score
of 4.0 and above will be
classified as significant barriers :
Lack of adequate Lean
awareness = 4.6
Lack of adequate Lean
awareness= 4.294
Lack of adequate Lean
awareness = 4.256
Lack of adequate Lean
awareness= 4.469
Lack of adequate Lean
awareness = 4.212
Lack of adequate Lean
awareness = 4.275
Lack of adequate Lean
awareness = 4.333
Lack of adequate Lean
awareness = 4.229
Lack of adequate Lean
awareness = 4.469
Lack of adequate Lean
awareness = 4.256
Lack of adequate Lean
awareness= 4.235
Lack of adequate Lean
awareness = 4.231
Lack of adequate Lean
awareness = 4.282
Lack of adequate Lean
awareness = 3.9
Lack of adequate Lean
awareness = 4.464
Lack of adequate Lean
awareness = 4.25
Lack of adequate Lean
awareness = 4.714
Lack of top management
commitment= 4.44Cultural issues= 4.235
Lack of top management
commitment= 4.163Cultural issues= 4.031 Cultural issues= 4.152
Lack of top management
commitment= 4.137 Cultural issues= 4.117
Time & commercial pressure=
4.0
Lack of top management
commitment= 4.281
Lack of top management
commitment= 4.14Cultural issues= 4.235
Fragmentation &
subcontracting= 3.947 Cultural issues= 4.154
Time & commercial pressure=
3.8
Lack of top management
commitment= 4.107
Lack of top management
commitment= 4.214
Fragmentation &
subcontracting= 4.428
Cultural issues= 4.08Fragmentation &
subcontracting= 4.235
Fragmentation &
subcontracting= 3.977
Lack of top management
commitment= 3.938
Lack of top management
commitment= 4.030Cultural issues= 3.9619
Lack of top management
commitment= 4.0Cultural issues= 3.943 Cultural issues= 4.188 Cultural issues= 4.023
Lack of top management
commitment= 4.118
Time & commercial pressure=
3.895
Lack of top management
commitment= 4.128 Educational issues= 3.7
Time & commercial pressure=
4.07 Cultural issues= 4.035
Time & commercial pressure=
4.428
Fragmentation &
subcontracting= 3.96
Lack of top management
commitment= 3.824Cultural issues= 3.953
Time & commercial pressure=
3.806
Time & commercial pressure=
3.879
Fragmentation &
subcontracting= 3.961
Time & commercial pressure=
3.864
Fragmentation &
subcontracting= 3.829 Educational issues= 4.065
Procurement & contracts=
3.857
Time & commercial pressure=
3.824Cultural issues= 3.846
Fragmentation &
subcontracting= 3.868
Fragmentation &
subcontracting= 3.6
Fragmentation &
subcontracting= 4.03
Procurement & contracts=
3.821
Lack of top management
commitment= 4.428
Procurement & contracts=
3.96
Procurement & contracts=
3.588
Time & commercial pressure=
3.907
Fragmentation &
subcontracting= 3.719
Procurement & contracts=
3.844
Time & commercial pressure=
3.882
Fragmentation &
subcontracting= 3.69Financial issues=3.743
Time & commercial pressure=
3.969
Fragmentation &
subcontracting= 3.833
Procurement & contracts=
3.588
Lack of top management
commitment= 3.846
Time & commercial pressure=
3.846
Design/Construction
Dichotomy= 3.5Cultural issues= 3.964
Fragmentation &
subcontracting= 3.64 Procurement & contracts= 4.28
Time & commercial pressure=
3.96
Lack of process based PMS=
3.588Educational issues= 3.767
Procurement & contracts=
3.594
Fragmentation &
subcontracting= 3.688
Procurement & contracts=
3.824
Procurement & contracts=
3.672
Lack of top management
commitment= 3.743
Fragmentation &
subcontracting= 3.806
Time & commercial pressure=
3.667 Financial issues= 3.588
Procurement & contracts=
3.684 Educational issues= 3.816
Procurement & contracts=
3.4
Lack of process based PMS=
3.67 Educational issues= 3.607 Cultural issues= 4.142
Educational issues=3.88Time & commercial pressure=
3.529
Procurement & contracts=
3.744Educational issues= 3.594 Financial issues= 3.576 Educational issues= 3.784 Educational issues= 3.5
Lack of process based PMS=
3.686
Procurement & contracts=
3.774 Educational issues= 3.429
Lack of process based PMS=
3.588
Lack of process based PMS=
3.526
Procurement & contracts=
3.763Cultural issues= 3.4 Financial issues= 3.6
Lack of process based PMS=
3.607Educational issues= 4.142
Lack of process based PMS=
3.8Educational issues= 3.294
Lack of process based PMS=
3.721
Design/Construction
Dichotomy= 3.484
Lack of process based PMS=
3.469
Lack of process based PMS=
3.745
Lack of process based PMS=
3.424
Procurement & contracts=
3.543
Lack of process based PMS=
3.719
Lack of process based PMS=
3.333 Educational issues= 3.412 Educational issues= 3.474
Lack of process based PMS=
3.744 Financial issues=3.4 Educational issues= 3.55
Time & commercial pressure=
3.48 Financial issues= 4.0
Financial issues= 3.56 Financial issues= 3.118 Financial issues= 3.581Lack of process based PMS=
3.469Educational issues= 3.438 Financial issues= 3.549 Financial issues= 3.417 Educational issues= 3.457
Design/Construction
Dichotomy= 3.645 Financial issues= 3.326
Fragmentation &
subcontracting= 3.353
Design/Construction
Dichotomy= 3.324Financial issues= 3.487
Lack of top management
commitment= 3.4
Procurement & contracts=
3.44 Financial issues= 3.428 Lack of process PMS= 3.857
Design/Construction
Dichotomy= 3.5
Design/Construction
Dichotomy= 2.941
Design/Construction
Dichotomy= 3.476Financial issues= 3.188
Design/Construction
Dichotomy= 3.313
Design/Construction
Dichotomy= 3.4
Design/Construction
Dichotomy= 3.379
Design/Construction
Dichotomy= 3.429Financial issues= 3.625
Design/Construction
Dichotomy= 3.30
Design/Construction
Dichotomy= 3.313Financial issues= 3.308
Design/Construction
Dichotomy= 3.395
Lack of process based PMS=
3.3
Design/Construction
Dichotomy= 3.23
Design/Construction
Dichotomy= 3.428
Design/Construction Dichotomy=
3.3
35 · Yes= 19.23% · Yes= 17.65% · Yes= 13.95% · Yes= 12.9% · Yes= 36.36% · Yes= 11.76% · Yes= 28.81% · Yes= 13.89% · Yes= 19.35% · Yes= 28.57% · Yes= 23.53% · Yes= 21.62% · Yes= 15% · Yes= 0% · Yes= 18.52% · Yes= 20.69% · Yes= 42.86%
36 · Yes= 46.15% · Yes= 35.29% · Yes= 31.82% · Yes= 53.12% · Yes= 45.16% · Yes= 38.46% · Yes= 48.28% · Yes= 29.41% · Yes= 53.12% · Yes= 48.54% · Yes= 35.29% · Yes= 41.03% · Yes= 46.15% · Yes= 11.11% · Yes= 44.44% · Yes= 44.83% · Yes= 71.43%
33
34
30
29
31
32
25
27
28
48]

49 | P a g e
4.3.3 Soft aspects of lean: Questions 10-17
Lean is a philosophy. Without the philosophy tools are not nearly as effective. This requires
creating a lean culture & developing collaborative relationships within organisations. In this
set of questions, there are twelve areas that have been identified by the author as the „soft
aspects of lean‟, or fundamental tools that could enable organisations to consider their
readiness for and progress along the lean journey. These twelve areas are namely: lean
awareness and understanding, the ability to motivate others, lean commitment, lean capability
building, work sequence analysis, data analysis, visual management, workplace-organisation,
standardising work, process mapping, and problem solving, and developing collaborative
relationships and partnerships. Questions 10, 15, 16, and 17 have been created by the author,
while questions 11-14 have been adopted and modified from Terry and Smith (2011). In each
of these questions (11-14), participants had to choose only one statement out of five. The
results will be analysed as shown in Table 4.2.
Table 4.2: Measurement scale for questions 11-14, based on median values adopted from Terry & Smith (2011)
Statement 1 Statement 2 Statement 3 Statement 4 Statement 5
Traditional Learning Leading World class Currently invincible
Question 10
Table 4.3: Awareness of the LCI-UK (Author)
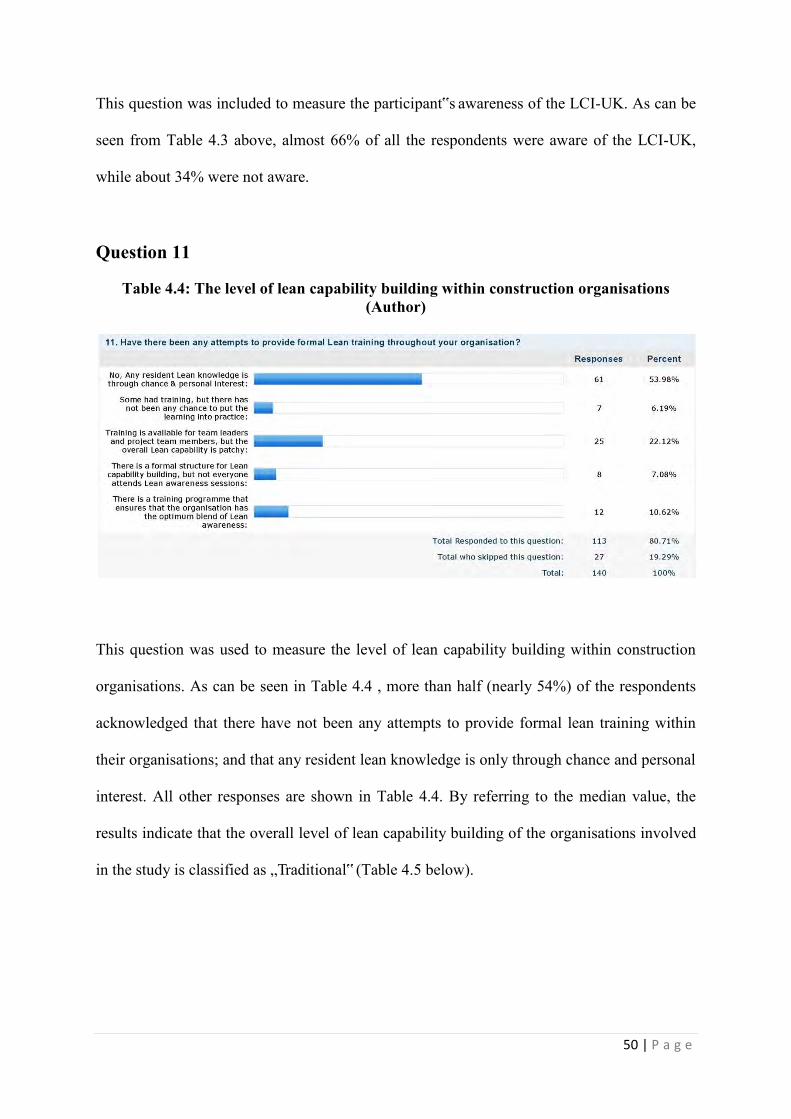
50 | P a g e
This question was included to measure the participant‟s awareness of the LCI-UK. As can be
seen from Table 4.3 above, almost 66% of all the respondents were aware of the LCI-UK,
while about 34% were not aware.
Question 11
Table 4.4: The level of lean capability building within construction organisations (Author)
This question was used to measure the level of lean capability building within construction
organisations. As can be seen in Table 4.4 , more than half (nearly 54%) of the respondents
acknowledged that there have not been any attempts to provide formal lean training within
their organisations; and that any resident lean knowledge is only through chance and personal
interest. All other responses are shown in Table 4.4. By referring to the median value, the
results indicate that the overall level of lean capability building of the organisations involved
in the study is classified as „Traditional‟ (Table 4.5 below).

51 | P a g e
Table 4.5: Classifying the organisations’ level of lean capability building (Author)
Statistical Approach Value (Statement number) Classification
Mode Analysis 1 Traditional
Median Analysis 1 Traditional
Question 12
Table 4.6: Evaluating the performance of leaders within construction organisations, in terms of their ability to motivate people (Author)
This question was used to evaluate the performance of leaders within organisations, in terms
of their ability to motivate others. As can be seen from Table 4.6, the highest proportion of
responses was for statement 3. Also, the median values indicated the same result (Table 4.7).
This illustrates that the leaders within the organisations involved in this study, generally
create an environment that people want to do their best in.
Table 4.7: Classifying the performance of leaders within construction organisations, in terms of their ability to motivate others (Author)
Statistical Approach Score (Statement number) Classification
Mode Analysis 3 Leaders
Median Analysis 3 Leaders
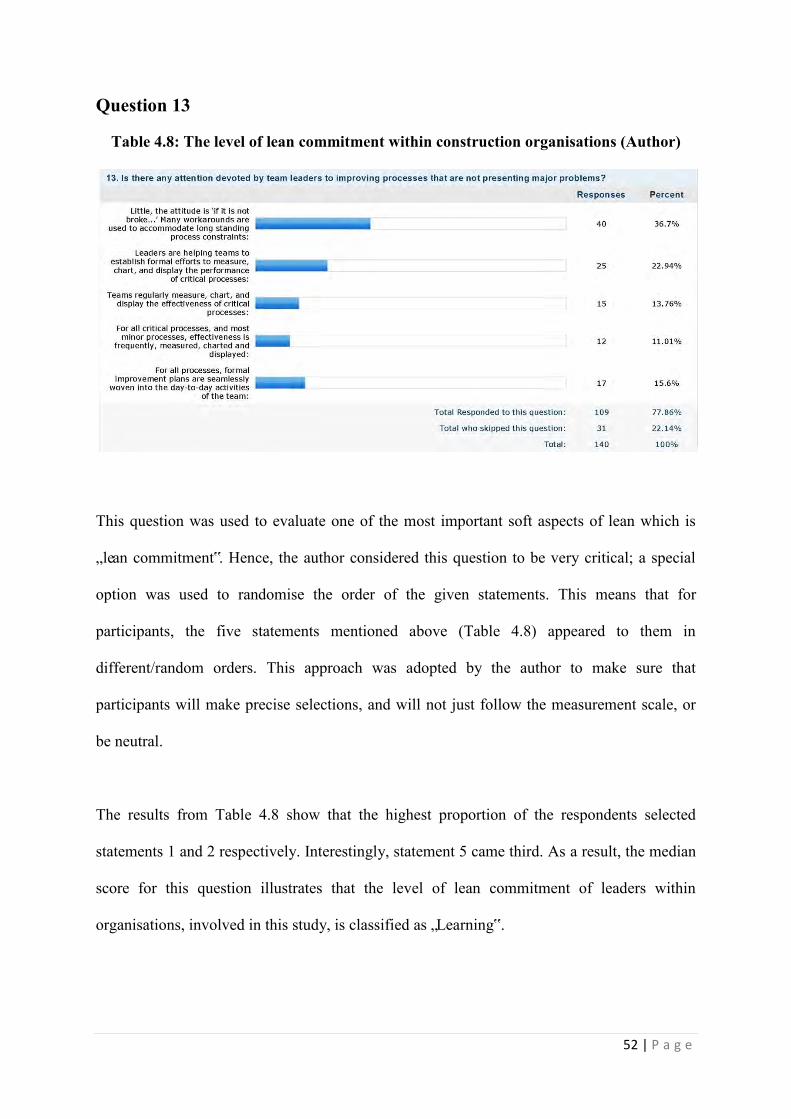
52 | P a g e
Question 13
Table 4.8: The level of lean commitment within construction organisations (Author)
This question was used to evaluate one of the most important soft aspects of lean which is
„lean commitment‟. Hence, the author considered this question to be very critical; a special
option was used to randomise the order of the given statements. This means that for
participants, the five statements mentioned above (Table 4.8) appeared to them in
different/random orders. This approach was adopted by the author to make sure that
participants will make precise selections, and will not just follow the measurement scale, or
be neutral.
The results from Table 4.8 show that the highest proportion of the respondents selected
statements 1 and 2 respectively. Interestingly, statement 5 came third. As a result, the median
score for this question illustrates that the level of lean commitment of leaders within
organisations, involved in this study, is classified as „Learning‟.

53 | P a g e
Question 14
Table 4.9: Level of lean awareness and understanding of leadership teams within construction organisations, obtained through formal training/induction (Author)
Table 4.9, shows that almost 44% of all respondents acknowledged that teams within their
organisations are satisfied and do not need to know anything further on the subject (statement
1). The median score for this question illustrates that the level of lean awareness and
understanding within construction organisations is classified as „Learning‟.
Question 15
Table 4.10: Techniques used by construction organisations for developing collaborative relationships and partnerships (Author)
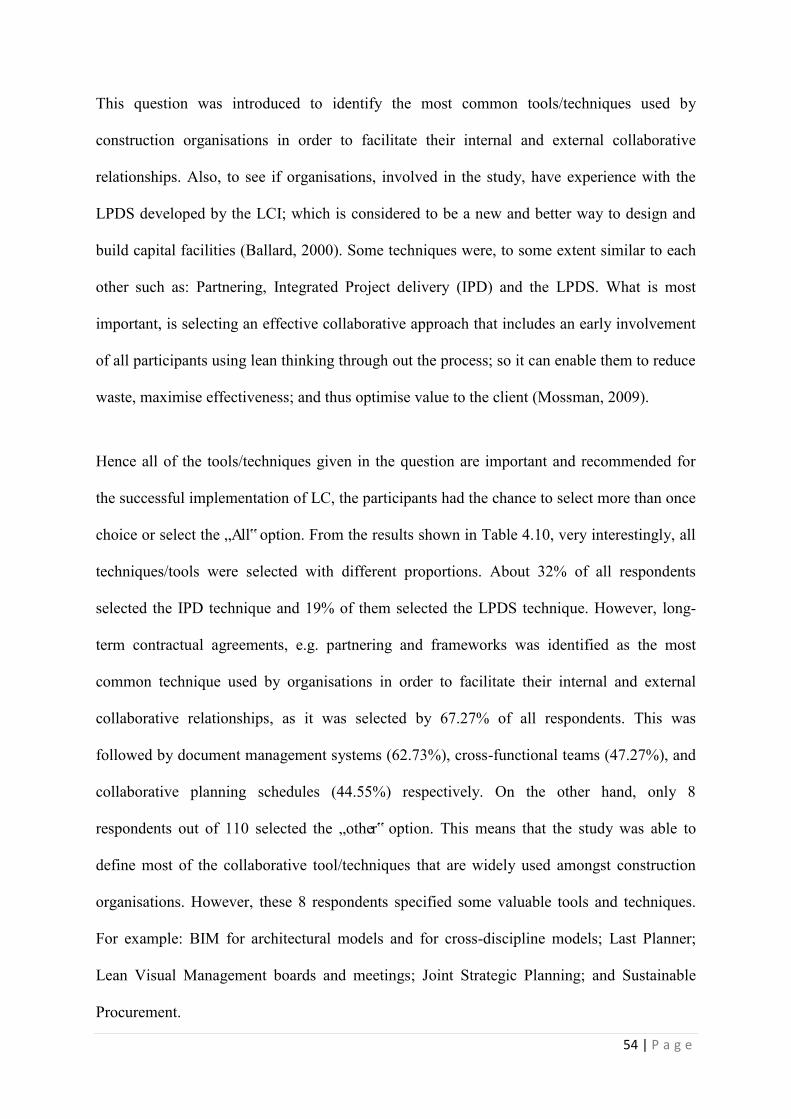
54 | P a g e
This question was introduced to identify the most common tools/techniques used by
construction organisations in order to facilitate their internal and external collaborative
relationships. Also, to see if organisations, involved in the study, have experience with the
LPDS developed by the LCI; which is considered to be a new and better way to design and
build capital facilities (Ballard, 2000). Some techniques were, to some extent similar to each
other such as: Partnering, Integrated Project delivery (IPD) and the LPDS. What is most
important, is selecting an effective collaborative approach that includes an early involvement
of all participants using lean thinking through out the process; so it can enable them to reduce
waste, maximise effectiveness; and thus optimise value to the client (Mossman, 2009).
Hence all of the tools/techniques given in the question are important and recommended for
the successful implementation of LC, the participants had the chance to select more than once
choice or select the „All‟ option. From the results shown in Table 4.10, very interestingly, all
techniques/tools were selected with different proportions. About 32% of all respondents
selected the IPD technique and 19% of them selected the LPDS technique. However, long-
term contractual agreements, e.g. partnering and frameworks was identified as the most
common technique used by organisations in order to facilitate their internal and external
collaborative relationships, as it was selected by 67.27% of all respondents. This was
followed by document management systems (62.73%), cross-functional teams (47.27%), and
collaborative planning schedules (44.55%) respectively. On the other hand, only 8
respondents out of 110 selected the „other‟ option. This means that the study was able to
define most of the collaborative tool/techniques that are widely used amongst construction
organisations. However, these 8 respondents specified some valuable tools and techniques.
For example: BIM for architectural models and for cross-discipline models; Last Planner;
Lean Visual Management boards and meetings; Joint Strategic Planning; and Sustainable
Procurement.
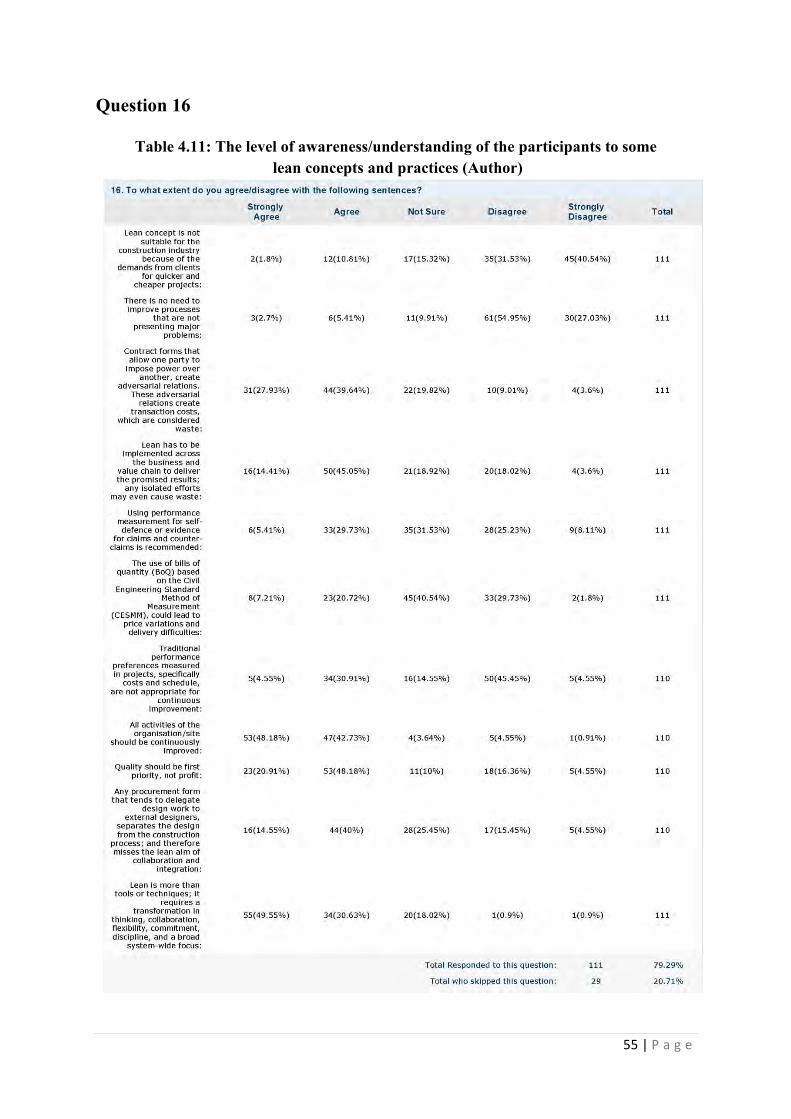
55 | P a g e
Question 16
Table 4.11: The level of awareness/understanding of the participants to some lean concepts and practices (Author)

56 | P a g e
This question was introduced to assess the participants‟ level of awareness and understanding
of some lean concepts and practices. Eleven statements were provided; and the respondents
were asked to indicate their level of agreement/disagreement to each statement on a five-
point Likert scale, ranging from „Strongly Agree‟ to „Strongly Disagree‟. Most statements
were included in a positive form, which means that the respondents should have shown their
agreement to them in order to provide answers that illustrates their awareness; while only
three statements, particularly number 1, 2 and 5, were included in a negative form where
respondents should have shown their disagreement to them to demonstrate their awareness.
The modal responses of the participants are illustrated in Figure 4.1, and summarised in
Tables 4.12 and 4.13 below.
Figure 4.1: Modal responses of question 16, regarding some lean concepts (Author)

57 | P a g e
Table 4.12: Results of the statements that the participants should agree with (Author)
ID The Aim of the statement
Answer Scale
(5= Strongly Agree and 1= Strongly
Disagree)
Freq. Score
Aware
(4 + 5)
5 4 3 2 1
S3 To measure their awareness of the disadvantages of
traditional contracts. 31 44 22 10 4 67.57%
S4 To measure their awareness of the importance of applying
Lean on a broad system-wide focus. 16 50 21 20 4 59.46%
S6
To assess their awareness of the problems that exist with
CESSM based bills, such as lack of transparency in the way
that prices are made up as to the contractor‟s assumptions
about profit and quality of work (See section 2.4.7).
8 23 45 33 2 27.93%
S7
To measure their understanding of the fact that traditional
performance measures are backward focussed as they are
not measured until project is complete; and thus
information obtained arrives too to take any corrective
actions (Alarcón & Serpell, 1996; Moon et al., 2007). See
section 2.5.2.
5 34 16 50 5 35.46%
S8 To evaluate their mentality of continuous improvement
(Kaizen mentality). 53 47 4 5 1 90.91%
S9 To emphasise their acceptance/refusal for continuous
improvement. 23 53 11 18 5 69.09%
S10 To measure their awareness of the disadvantages of
traditional procurement methods 16 44 28 17 5 54.55%
S11 To evaluate their understanding of the importance of
establishing a lean culture within organisations. 55 34 20 1 1 80.18%
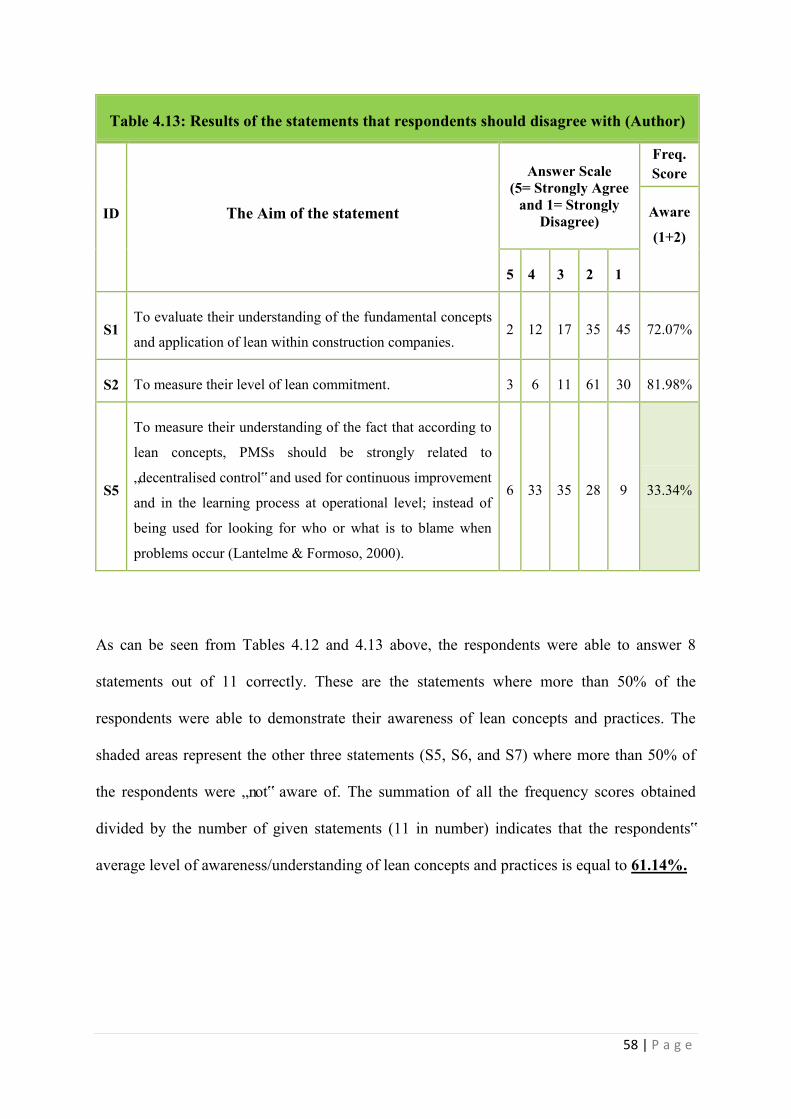
58 | P a g e
Table 4.13: Results of the statements that respondents should disagree with (Author)
ID The Aim of the statement
Answer Scale (5= Strongly Agree
and 1= Strongly Disagree)
Freq. Score
Aware
(1+2)
5 4 3 2 1
S1 To evaluate their understanding of the fundamental concepts
and application of lean within construction companies. 2 12 17 35 45 72.07%
S2 To measure their level of lean commitment. 3 6 11 61 30 81.98%
S5
To measure their understanding of the fact that according to
lean concepts, PMSs should be strongly related to
„decentralised control‟ and used for continuous improvement
and in the learning process at operational level; instead of
being used for looking for who or what is to blame when
problems occur (Lantelme & Formoso, 2000).
6 33 35 28 9 33.34%
As can be seen from Tables 4.12 and 4.13 above, the respondents were able to answer 8
statements out of 11 correctly. These are the statements where more than 50% of the
respondents were able to demonstrate their awareness of lean concepts and practices. The
shaded areas represent the other three statements (S5, S6, and S7) where more than 50% of
the respondents were „not‟ aware of. The summation of all the frequency scores obtained
divided by the number of given statements (11 in number) indicates that the respondents‟
average level of awareness/understanding of lean concepts and practices is equal to 61.14%.
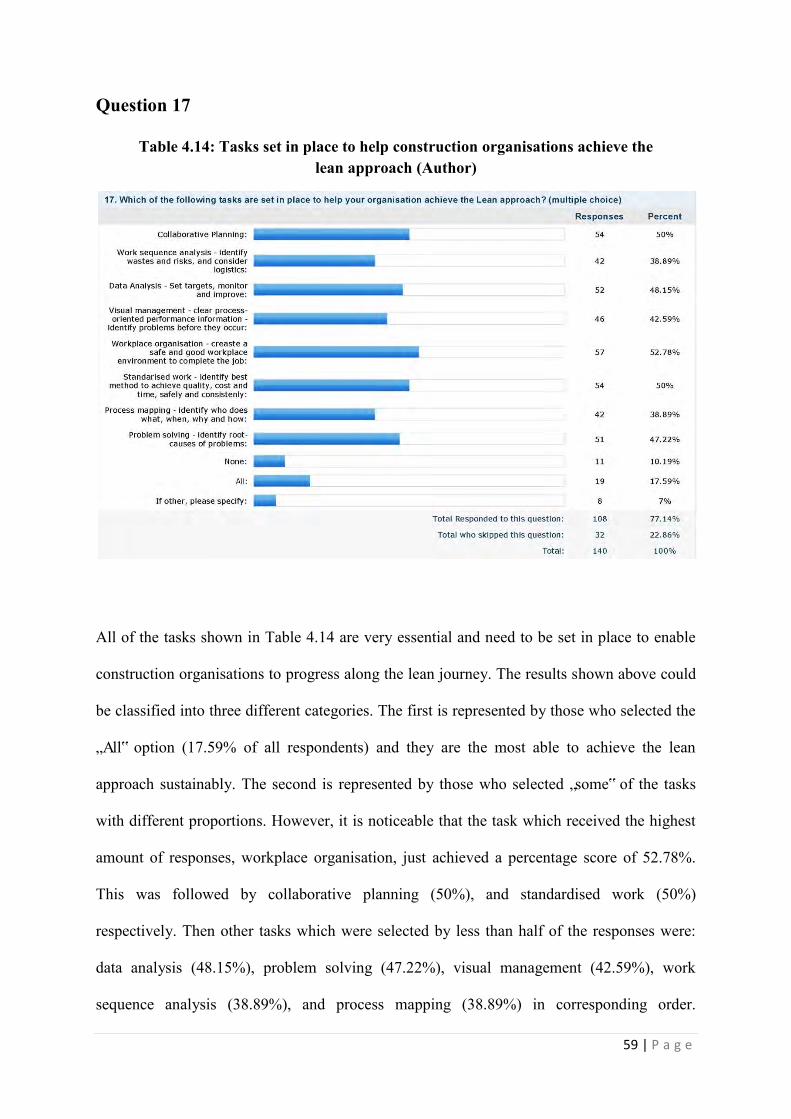
59 | P a g e
Question 17
Table 4.14: Tasks set in place to help construction organisations achieve the lean approach (Author)
All of the tasks shown in Table 4.14 are very essential and need to be set in place to enable
construction organisations to progress along the lean journey. The results shown above could
be classified into three different categories. The first is represented by those who selected the
„All‟ option (17.59% of all respondents) and they are the most able to achieve the lean
approach sustainably. The second is represented by those who selected „some‟ of the tasks
with different proportions. However, it is noticeable that the task which received the highest
amount of responses, workplace organisation, just achieved a percentage score of 52.78%.
This was followed by collaborative planning (50%), and standardised work (50%)
respectively. Then other tasks which were selected by less than half of the responses were:
data analysis (48.15%), problem solving (47.22%), visual management (42.59%), work
sequence analysis (38.89%), and process mapping (38.89%) in corresponding order.
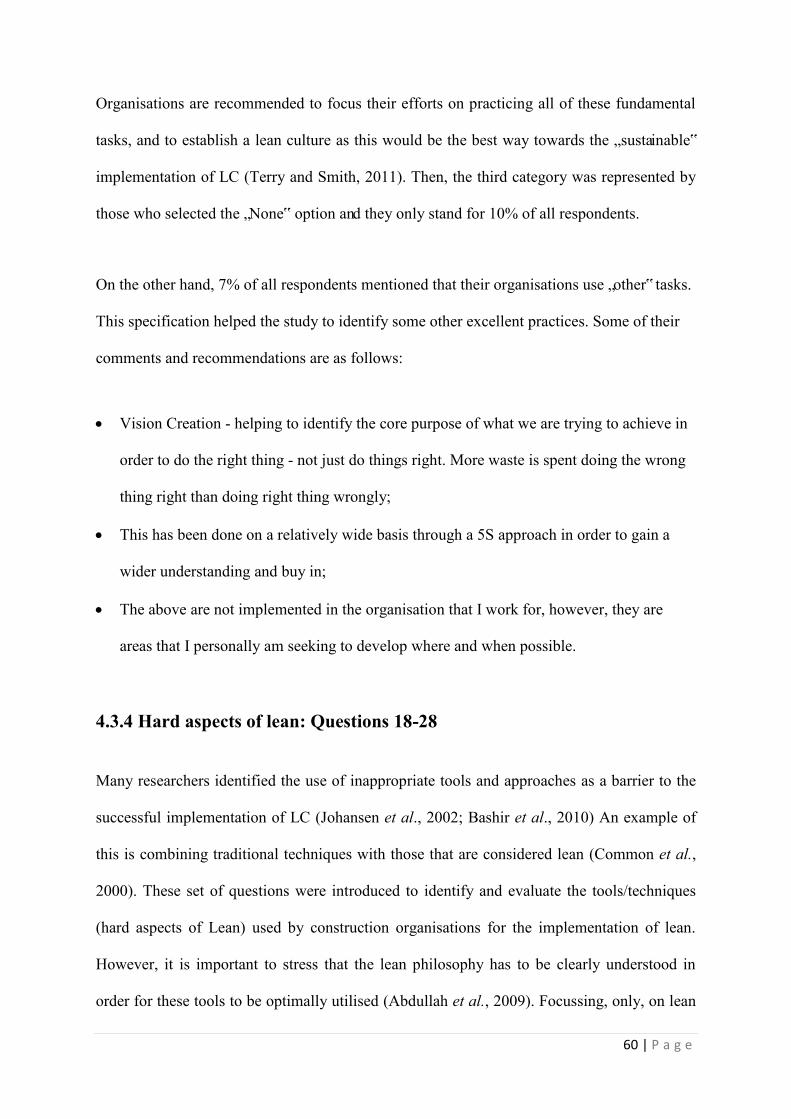
60 | P a g e
Organisations are recommended to focus their efforts on practicing all of these fundamental
tasks, and to establish a lean culture as this would be the best way towards the „sustainable‟
implementation of LC (Terry and Smith, 2011). Then, the third category was represented by
those who selected the „None‟ option and they only stand for 10% of all respondents.
On the other hand, 7% of all respondents mentioned that their organisations use „other‟ tasks.
This specification helped the study to identify some other excellent practices. Some of their
comments and recommendations are as follows:
Vision Creation - helping to identify the core purpose of what we are trying to achieve in
order to do the right thing - not just do things right. More waste is spent doing the wrong
thing right than doing right thing wrongly;
This has been done on a relatively wide basis through a 5S approach in order to gain a
wider understanding and buy in;
The above are not implemented in the organisation that I work for, however, they are
areas that I personally am seeking to develop where and when possible.
4.3.4 Hard aspects of lean: Questions 18-28
Many researchers identified the use of inappropriate tools and approaches as a barrier to the
successful implementation of LC (Johansen et al., 2002; Bashir et al., 2010) An example of
this is combining traditional techniques with those that are considered lean (Common et al.,
2000). These set of questions were introduced to identify and evaluate the tools/techniques
(hard aspects of Lean) used by construction organisations for the implementation of lean.
However, it is important to stress that the lean philosophy has to be clearly understood in
order for these tools to be optimally utilised (Abdullah et al., 2009). Focussing, only, on lean
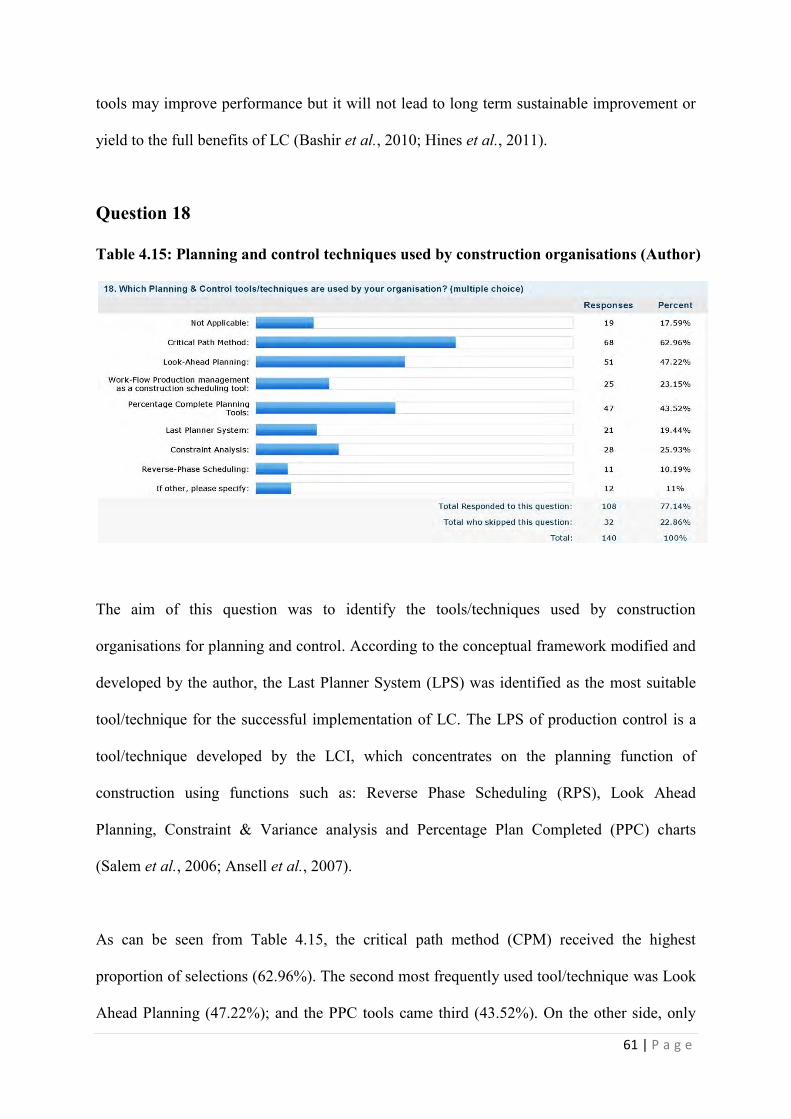
61 | P a g e
tools may improve performance but it will not lead to long term sustainable improvement or
yield to the full benefits of LC (Bashir et al., 2010; Hines et al., 2011).
Question 18
Table 4.15: Planning and control techniques used by construction organisations (Author)
The aim of this question was to identify the tools/techniques used by construction
organisations for planning and control. According to the conceptual framework modified and
developed by the author, the Last Planner System (LPS) was identified as the most suitable
tool/technique for the successful implementation of LC. The LPS of production control is a
tool/technique developed by the LCI, which concentrates on the planning function of
construction using functions such as: Reverse Phase Scheduling (RPS), Look Ahead
Planning, Constraint & Variance analysis and Percentage Plan Completed (PPC) charts
(Salem et al., 2006; Ansell et al., 2007).
As can be seen from Table 4.15, the critical path method (CPM) received the highest
proportion of selections (62.96%). The second most frequently used tool/technique was Look
Ahead Planning (47.22%); and the PPC tools came third (43.52%). On the other side, only
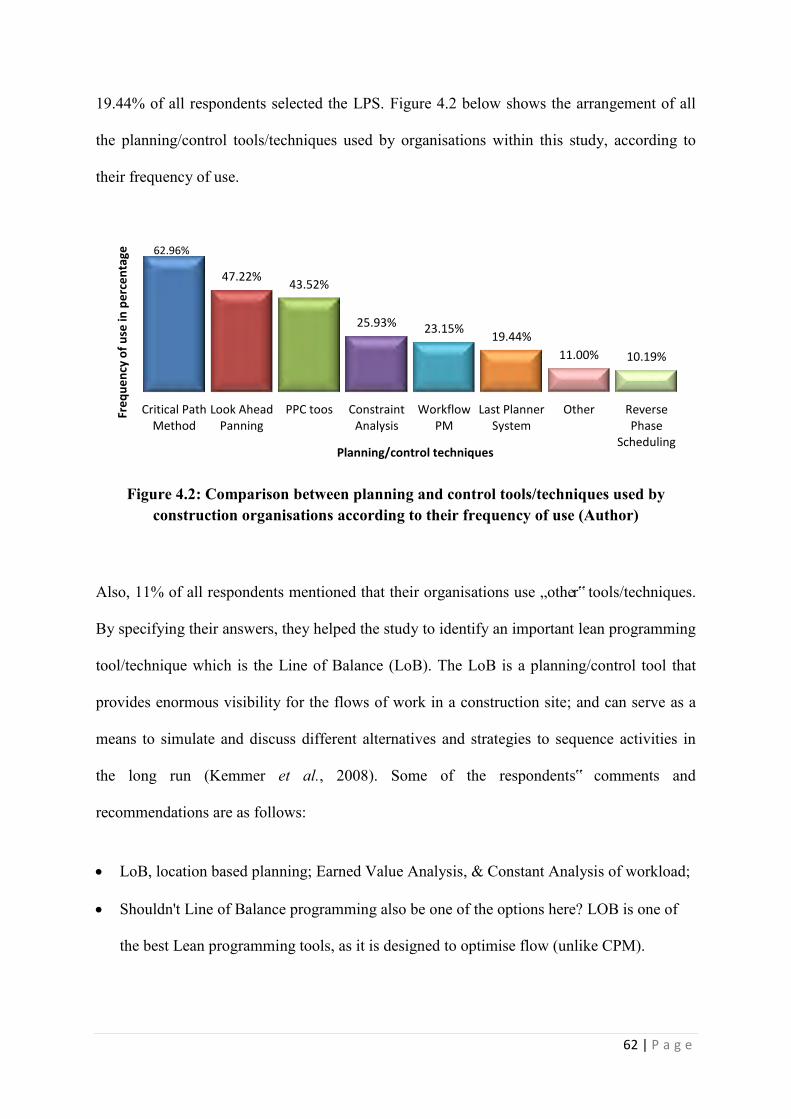
62 | P a g e
19.44% of all respondents selected the LPS. Figure 4.2 below shows the arrangement of all
the planning/control tools/techniques used by organisations within this study, according to
their frequency of use.
Figure 4.2: Comparison between planning and control tools/techniques used by construction organisations according to their frequency of use (Author)
Also, 11% of all respondents mentioned that their organisations use „other‟ tools/techniques.
By specifying their answers, they helped the study to identify an important lean programming
tool/technique which is the Line of Balance (LoB). The LoB is a planning/control tool that
provides enormous visibility for the flows of work in a construction site; and can serve as a
means to simulate and discuss different alternatives and strategies to sequence activities in
the long run (Kemmer et al., 2008). Some of the respondents‟ comments and
recommendations are as follows:
LoB, location based planning; Earned Value Analysis, & Constant Analysis of workload;
Shouldn't Line of Balance programming also be one of the options here? LOB is one of
the best Lean programming tools, as it is designed to optimise flow (unlike CPM).
62.96%
47.22% 43.52%
25.93% 23.15% 19.44%
11.00% 10.19%
Critical Path Method
Look Ahead Panning
PPC toos Constraint Analysis
Workflow PM
Last Planner System
Other Reverse Phase
Scheduling
Fre
qu
en
cy o
f u
se in
pe
rce
nta
ge
Planning/control techniques
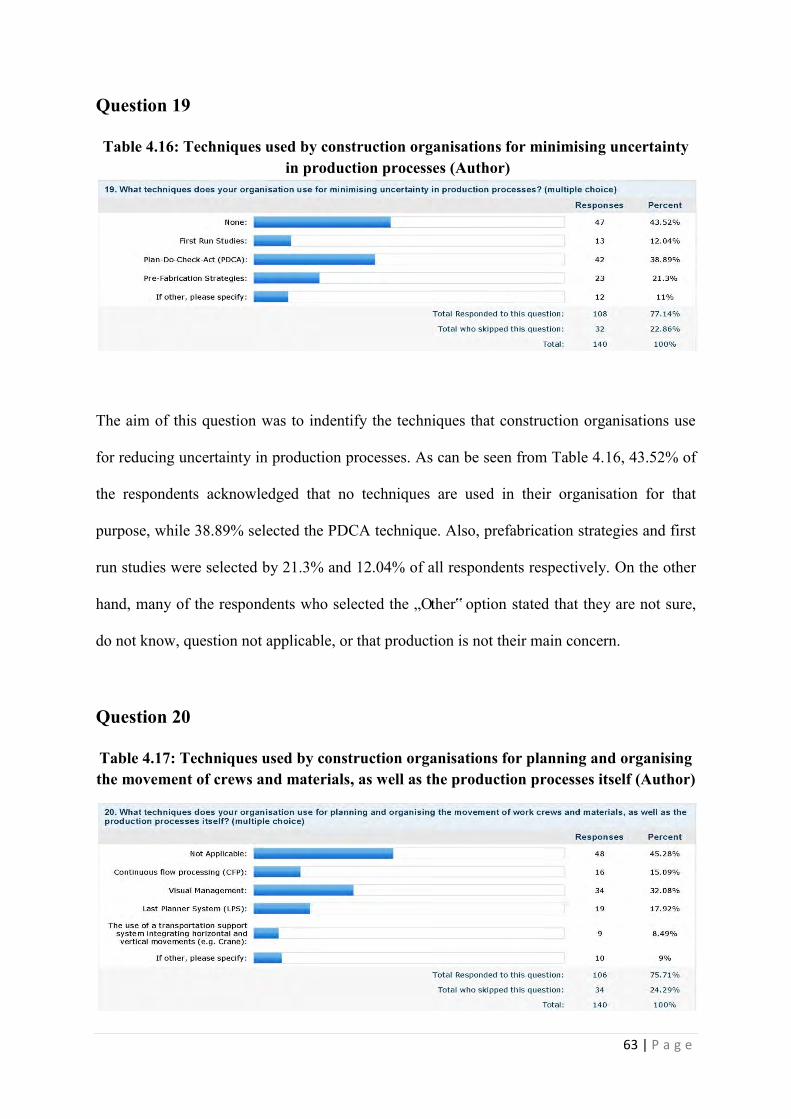
63 | P a g e
Question 19
Table 4.16: Techniques used by construction organisations for minimising uncertainty in production processes (Author)
The aim of this question was to indentify the techniques that construction organisations use
for reducing uncertainty in production processes. As can be seen from Table 4.16, 43.52% of
the respondents acknowledged that no techniques are used in their organisation for that
purpose, while 38.89% selected the PDCA technique. Also, prefabrication strategies and first
run studies were selected by 21.3% and 12.04% of all respondents respectively. On the other
hand, many of the respondents who selected the „Other‟ option stated that they are not sure,
do not know, question not applicable, or that production is not their main concern.
Question 20
Table 4.17: Techniques used by construction organisations for planning and organising the movement of crews and materials, as well as the production processes itself (Author)
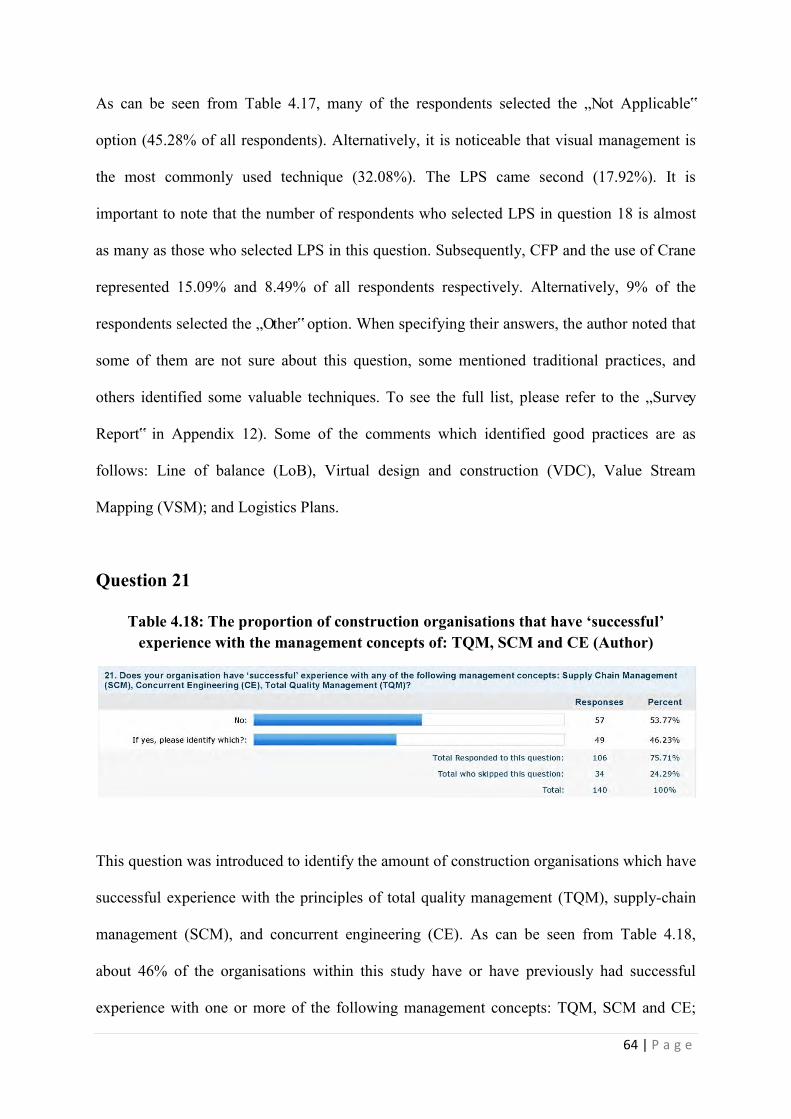
64 | P a g e
As can be seen from Table 4.17, many of the respondents selected the „Not Applicable‟
option (45.28% of all respondents). Alternatively, it is noticeable that visual management is
the most commonly used technique (32.08%). The LPS came second (17.92%). It is
important to note that the number of respondents who selected LPS in question 18 is almost
as many as those who selected LPS in this question. Subsequently, CFP and the use of Crane
represented 15.09% and 8.49% of all respondents respectively. Alternatively, 9% of the
respondents selected the „Other‟ option. When specifying their answers, the author noted that
some of them are not sure about this question, some mentioned traditional practices, and
others identified some valuable techniques. To see the full list, please refer to the „Survey
Report‟ in Appendix 12). Some of the comments which identified good practices are as
follows: Line of balance (LoB), Virtual design and construction (VDC), Value Stream
Mapping (VSM); and Logistics Plans.
Question 21
Table 4.18: The proportion of construction organisations that have ‘successful’ experience with the management concepts of: TQM, SCM and CE (Author)
This question was introduced to identify the amount of construction organisations which have
successful experience with the principles of total quality management (TQM), supply-chain
management (SCM), and concurrent engineering (CE). As can be seen from Table 4.18,
about 46% of the organisations within this study have or have previously had successful
experience with one or more of the following management concepts: TQM, SCM and CE;
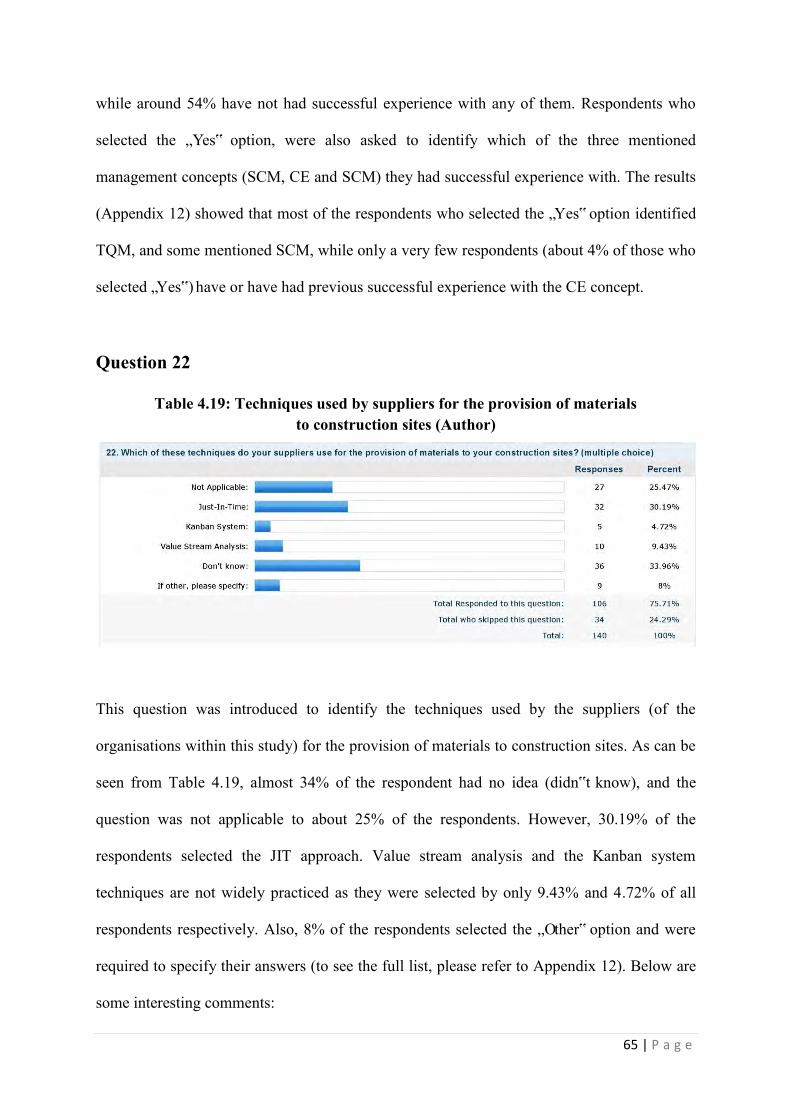
65 | P a g e
while around 54% have not had successful experience with any of them. Respondents who
selected the „Yes‟ option, were also asked to identify which of the three mentioned
management concepts (SCM, CE and SCM) they had successful experience with. The results
(Appendix 12) showed that most of the respondents who selected the „Yes‟ option identified
TQM, and some mentioned SCM, while only a very few respondents (about 4% of those who
selected „Yes‟) have or have had previous successful experience with the CE concept.
Question 22
Table 4.19: Techniques used by suppliers for the provision of materials to construction sites (Author)
This question was introduced to identify the techniques used by the suppliers (of the
organisations within this study) for the provision of materials to construction sites. As can be
seen from Table 4.19, almost 34% of the respondent had no idea (didn‟t know), and the
question was not applicable to about 25% of the respondents. However, 30.19% of the
respondents selected the JIT approach. Value stream analysis and the Kanban system
techniques are not widely practiced as they were selected by only 9.43% and 4.72% of all
respondents respectively. Also, 8% of the respondents selected the „Other‟ option and were
required to specify their answers (to see the full list, please refer to Appendix 12). Below are
some interesting comments:
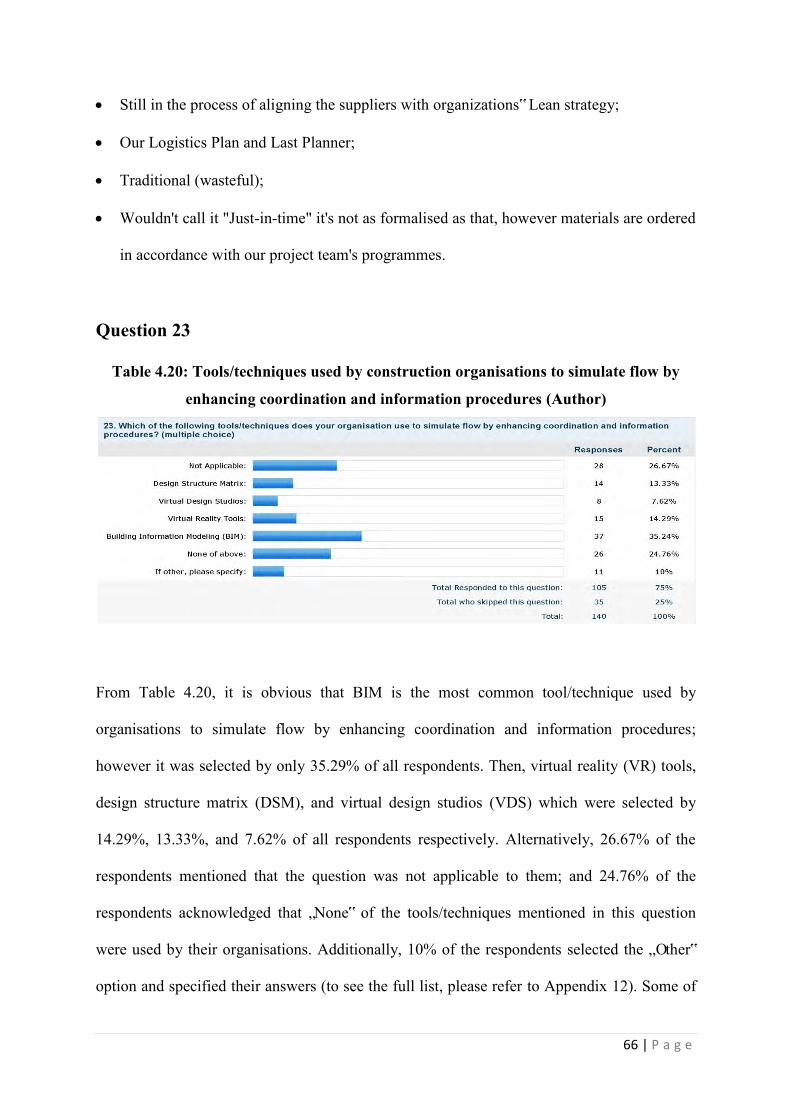
66 | P a g e
Still in the process of aligning the suppliers with organizations‟ Lean strategy;
Our Logistics Plan and Last Planner;
Traditional (wasteful);
Wouldn't call it "Just-in-time" it's not as formalised as that, however materials are ordered
in accordance with our project team's programmes.
Question 23
Table 4.20: Tools/techniques used by construction organisations to simulate flow by
enhancing coordination and information procedures (Author)
From Table 4.20, it is obvious that BIM is the most common tool/technique used by
organisations to simulate flow by enhancing coordination and information procedures;
however it was selected by only 35.29% of all respondents. Then, virtual reality (VR) tools,
design structure matrix (DSM), and virtual design studios (VDS) which were selected by
14.29%, 13.33%, and 7.62% of all respondents respectively. Alternatively, 26.67% of the
respondents mentioned that the question was not applicable to them; and 24.76% of the
respondents acknowledged that „None‟ of the tools/techniques mentioned in this question
were used by their organisations. Additionally, 10% of the respondents selected the „Other‟
option and specified their answers (to see the full list, please refer to Appendix 12). Some of
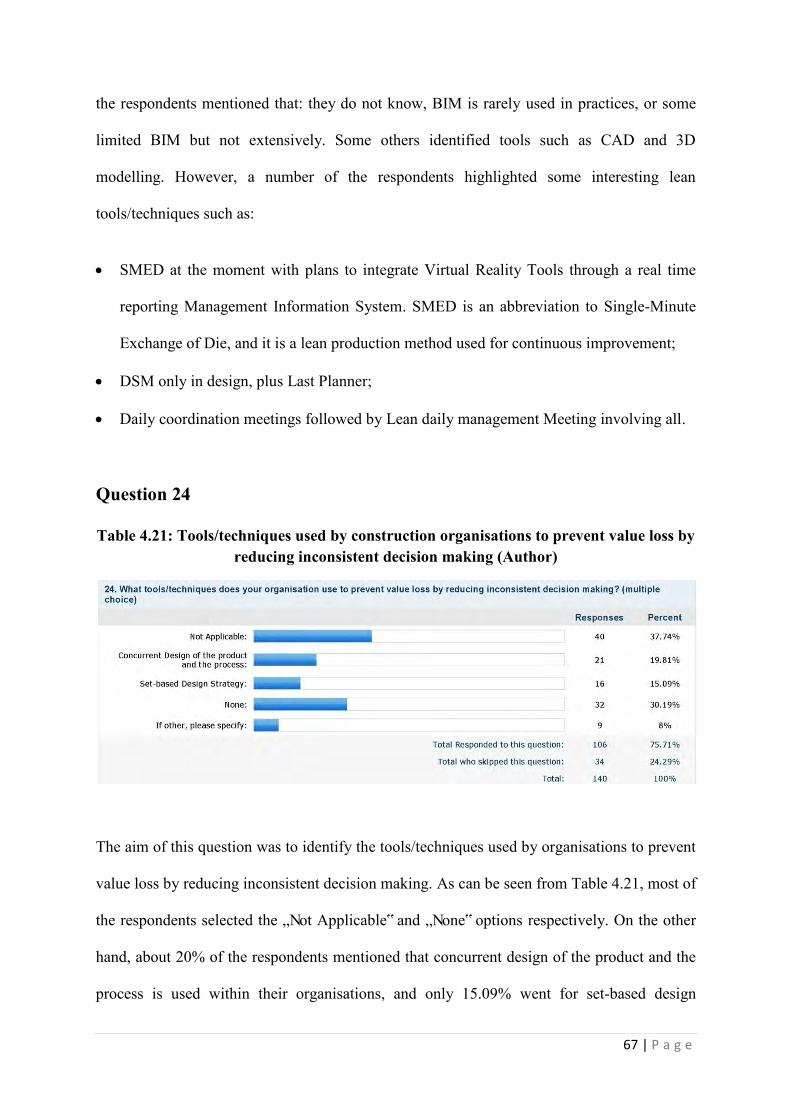
67 | P a g e
the respondents mentioned that: they do not know, BIM is rarely used in practices, or some
limited BIM but not extensively. Some others identified tools such as CAD and 3D
modelling. However, a number of the respondents highlighted some interesting lean
tools/techniques such as:
SMED at the moment with plans to integrate Virtual Reality Tools through a real time
reporting Management Information System. SMED is an abbreviation to Single-Minute
Exchange of Die, and it is a lean production method used for continuous improvement;
DSM only in design, plus Last Planner;
Daily coordination meetings followed by Lean daily management Meeting involving all.
Question 24
Table 4.21: Tools/techniques used by construction organisations to prevent value loss by reducing inconsistent decision making (Author)
The aim of this question was to identify the tools/techniques used by organisations to prevent
value loss by reducing inconsistent decision making. As can be seen from Table 4.21, most of
the respondents selected the „Not Applicable‟ and „None‟ options respectively. On the other
hand, about 20% of the respondents mentioned that concurrent design of the product and the
process is used within their organisations, and only 15.09% went for set-based design
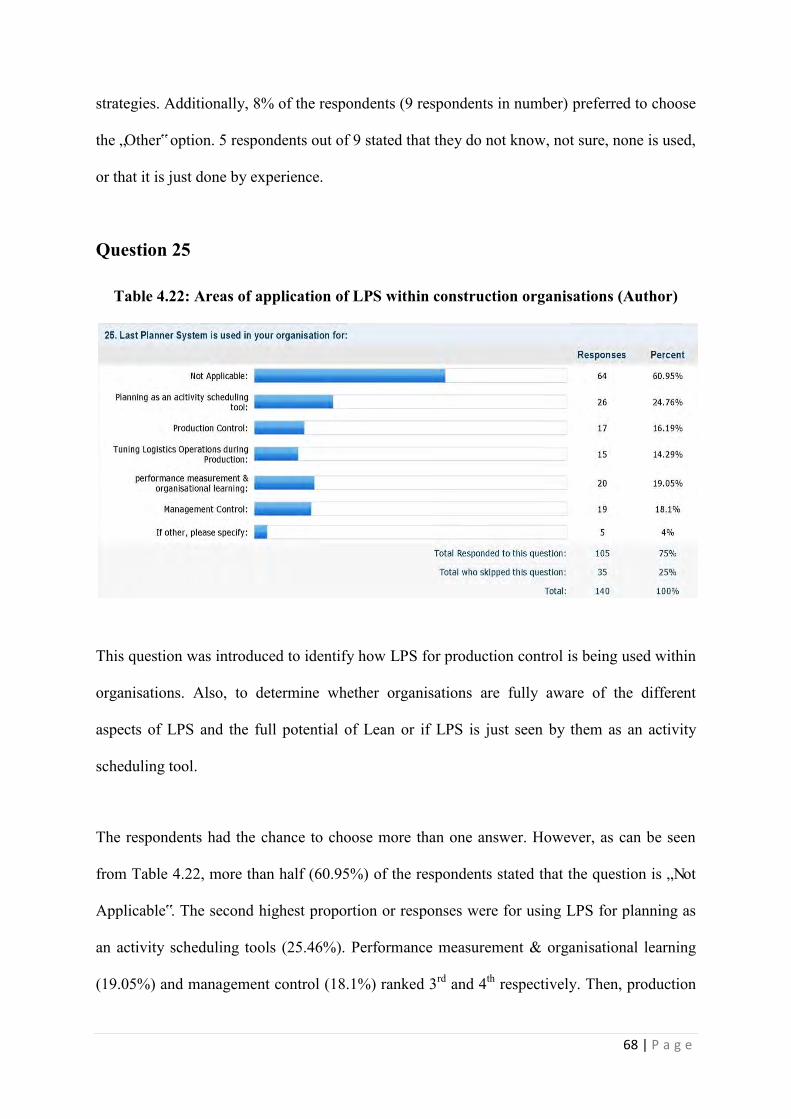
68 | P a g e
strategies. Additionally, 8% of the respondents (9 respondents in number) preferred to choose
the „Other‟ option. 5 respondents out of 9 stated that they do not know, not sure, none is used,
or that it is just done by experience.
Question 25
Table 4.22: Areas of application of LPS within construction organisations (Author)
This question was introduced to identify how LPS for production control is being used within
organisations. Also, to determine whether organisations are fully aware of the different
aspects of LPS and the full potential of Lean or if LPS is just seen by them as an activity
scheduling tool.
The respondents had the chance to choose more than one answer. However, as can be seen
from Table 4.22, more than half (60.95%) of the respondents stated that the question is „Not
Applicable‟. The second highest proportion or responses were for using LPS for planning as
an activity scheduling tools (25.46%). Performance measurement & organisational learning
(19.05%) and management control (18.1%) ranked 3rd and 4th respectively. Then, production

69 | P a g e
control (16.19%) and tuning logistics operation during production control (14.29%) ranked
5th and 6th correspondingly. The „Other‟ option figured at the bottom of the list and received
only 5 responses out of 105. Figure 4.3 below shows the arrangement of the different areas of
application of LPS, according to their frequency of use within construction organisations
involved in this study.
Figure 4.3: Areas of application of LPS within construction organisations (Author)
Question 26
Table 4.23: Testing the understanding/awareness to the function of the PPC value within the LPS (Author)
25.46%
19.05% 18.10% 16.19%
14.29%
4.00%
0.00%
5.00%
10.00%
15.00%
20.00%
25.00%
30.00%
Planning Performance measurement
Management Control
Production Control
Logistics Other
Fre
qu
en
cy o
f u
se in
pe
rce
nta
ge
Aspects of LPS
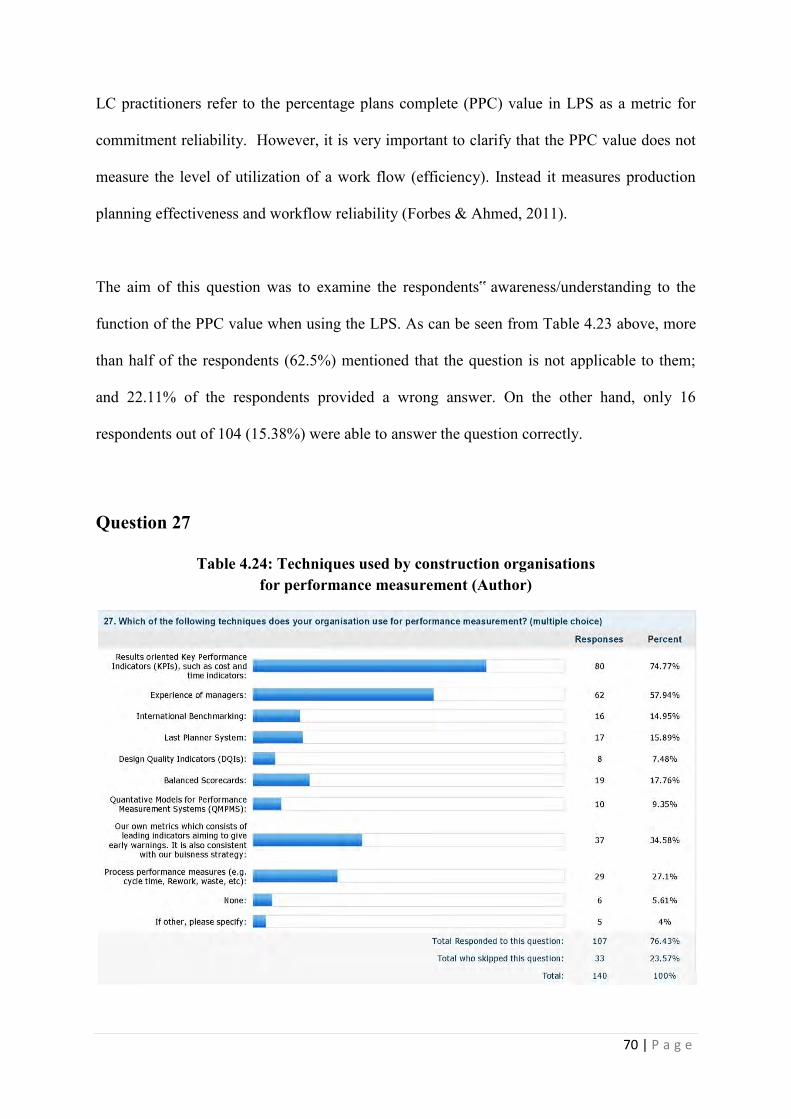
70 | P a g e
LC practitioners refer to the percentage plans complete (PPC) value in LPS as a metric for
commitment reliability. However, it is very important to clarify that the PPC value does not
measure the level of utilization of a work flow (efficiency). Instead it measures production
planning effectiveness and workflow reliability (Forbes & Ahmed, 2011).
The aim of this question was to examine the respondents‟ awareness/understanding to the
function of the PPC value when using the LPS. As can be seen from Table 4.23 above, more
than half of the respondents (62.5%) mentioned that the question is not applicable to them;
and 22.11% of the respondents provided a wrong answer. On the other hand, only 16
respondents out of 104 (15.38%) were able to answer the question correctly.
Question 27
Table 4.24: Techniques used by construction organisations for performance measurement (Author)
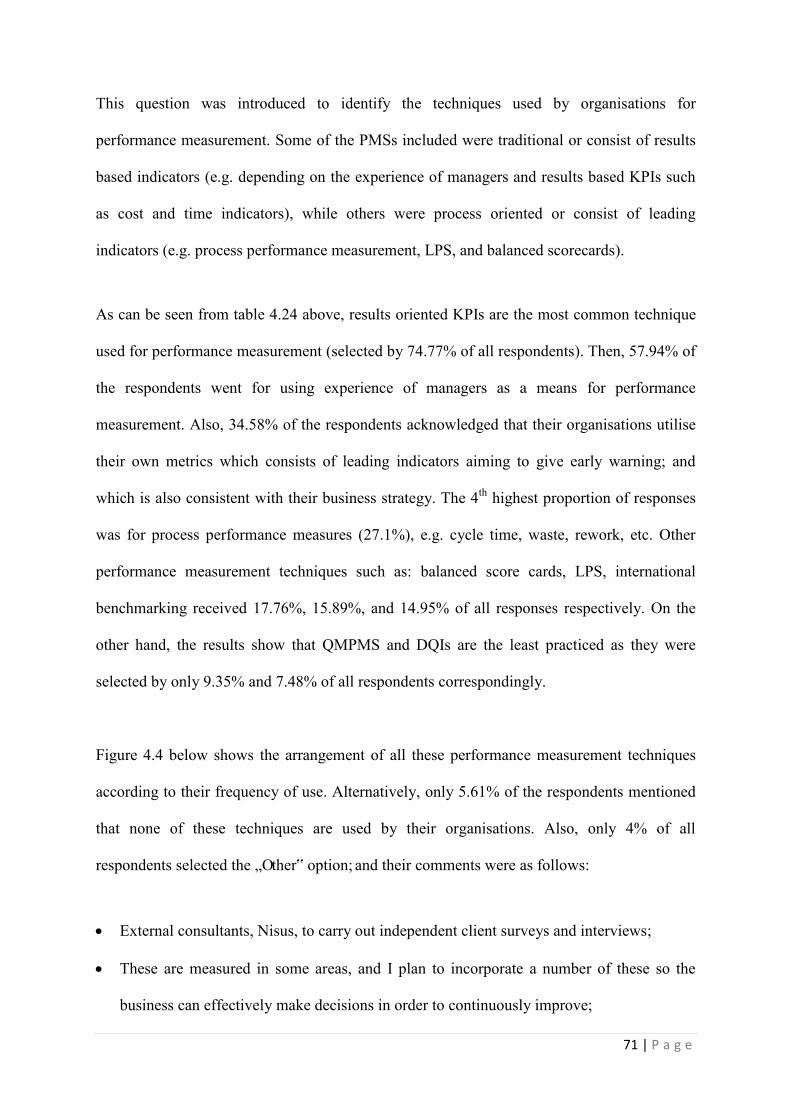
71 | P a g e
This question was introduced to identify the techniques used by organisations for
performance measurement. Some of the PMSs included were traditional or consist of results
based indicators (e.g. depending on the experience of managers and results based KPIs such
as cost and time indicators), while others were process oriented or consist of leading
indicators (e.g. process performance measurement, LPS, and balanced scorecards).
As can be seen from table 4.24 above, results oriented KPIs are the most common technique
used for performance measurement (selected by 74.77% of all respondents). Then, 57.94% of
the respondents went for using experience of managers as a means for performance
measurement. Also, 34.58% of the respondents acknowledged that their organisations utilise
their own metrics which consists of leading indicators aiming to give early warning; and
which is also consistent with their business strategy. The 4th highest proportion of responses
was for process performance measures (27.1%), e.g. cycle time, waste, rework, etc. Other
performance measurement techniques such as: balanced score cards, LPS, international
benchmarking received 17.76%, 15.89%, and 14.95% of all responses respectively. On the
other hand, the results show that QMPMS and DQIs are the least practiced as they were
selected by only 9.35% and 7.48% of all respondents correspondingly.
Figure 4.4 below shows the arrangement of all these performance measurement techniques
according to their frequency of use. Alternatively, only 5.61% of the respondents mentioned
that none of these techniques are used by their organisations. Also, only 4% of all
respondents selected the „Other‟ option; and their comments were as follows:
External consultants, Nisus, to carry out independent client surveys and interviews;
These are measured in some areas, and I plan to incorporate a number of these so the
business can effectively make decisions in order to continuously improve;

72 | P a g e
Customer Feedback; Client satisfaction and repeat bookings.
Figure 4.4: Techniques used by construction organisations for
performance measurement (Author)
Question 28
Table: 4.25: Prioritising non-financial performance measures according to their importance to construction organisations (Author)
Quality:
Safety:
Client/customer satisfaction:
Functionality:
Planning Efficiency:
Team Performance:
Productivity:
74.77%
57.94%
34.58%
27.10%
17.76% 15.89% 14.95% 9.35% 7.48%
4.00%
0.00%
10.00%
20.00%
30.00%
40.00%
50.00%
60.00%
70.00%
80.00%
Fre
qu
en
cy o
f u
se in
pe
rce
nta
ge
Performance measurement techniques
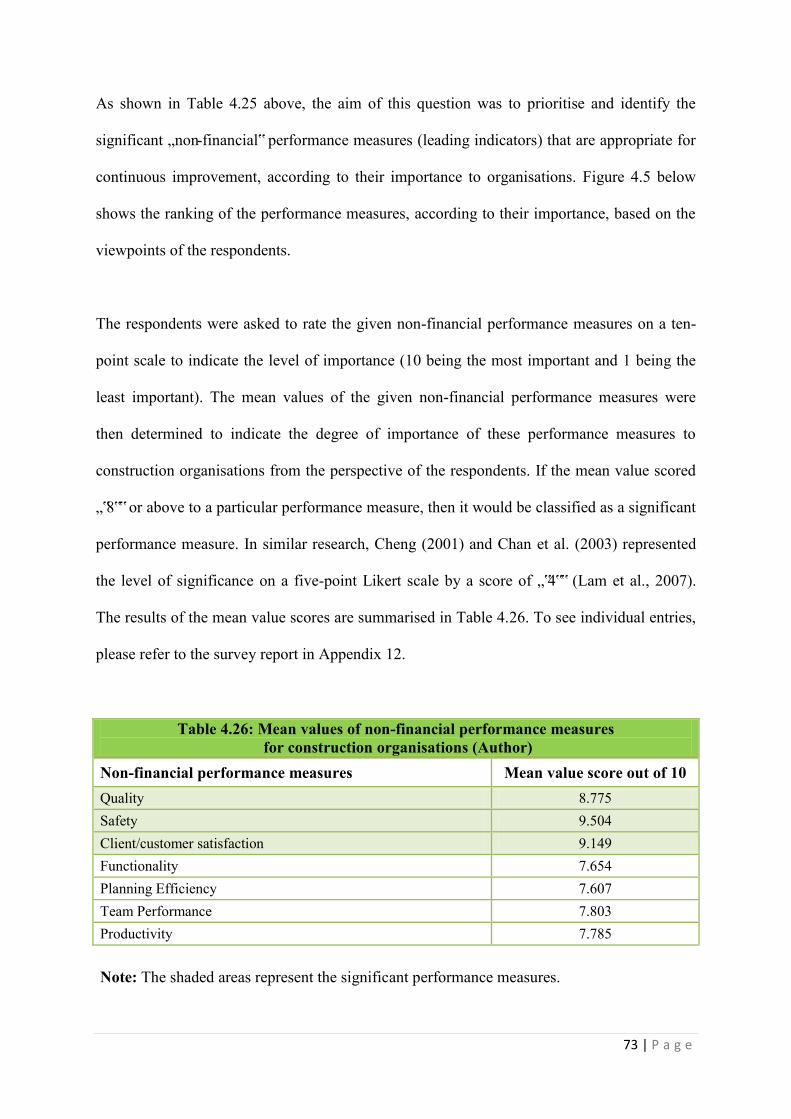
73 | P a g e
As shown in Table 4.25 above, the aim of this question was to prioritise and identify the
significant „non-financial‟ performance measures (leading indicators) that are appropriate for
continuous improvement, according to their importance to organisations. Figure 4.5 below
shows the ranking of the performance measures, according to their importance, based on the
viewpoints of the respondents.
The respondents were asked to rate the given non-financial performance measures on a ten-
point scale to indicate the level of importance (10 being the most important and 1 being the
least important). The mean values of the given non-financial performance measures were
then determined to indicate the degree of importance of these performance measures to
construction organisations from the perspective of the respondents. If the mean value scored
„‟8‟‟ or above to a particular performance measure, then it would be classified as a significant
performance measure. In similar research, Cheng (2001) and Chan et al. (2003) represented
the level of significance on a five-point Likert scale by a score of „‟4‟‟ (Lam et al., 2007).
The results of the mean value scores are summarised in Table 4.26. To see individual entries,
please refer to the survey report in Appendix 12.
Table 4.26: Mean values of non-financial performance measures for construction organisations (Author)
Non-financial performance measures Mean value score out of 10 Quality 8.775 Safety 9.504 Client/customer satisfaction 9.149 Functionality 7.654 Planning Efficiency 7.607 Team Performance 7.803 Productivity 7.785
Note: The shaded areas represent the significant performance measures.
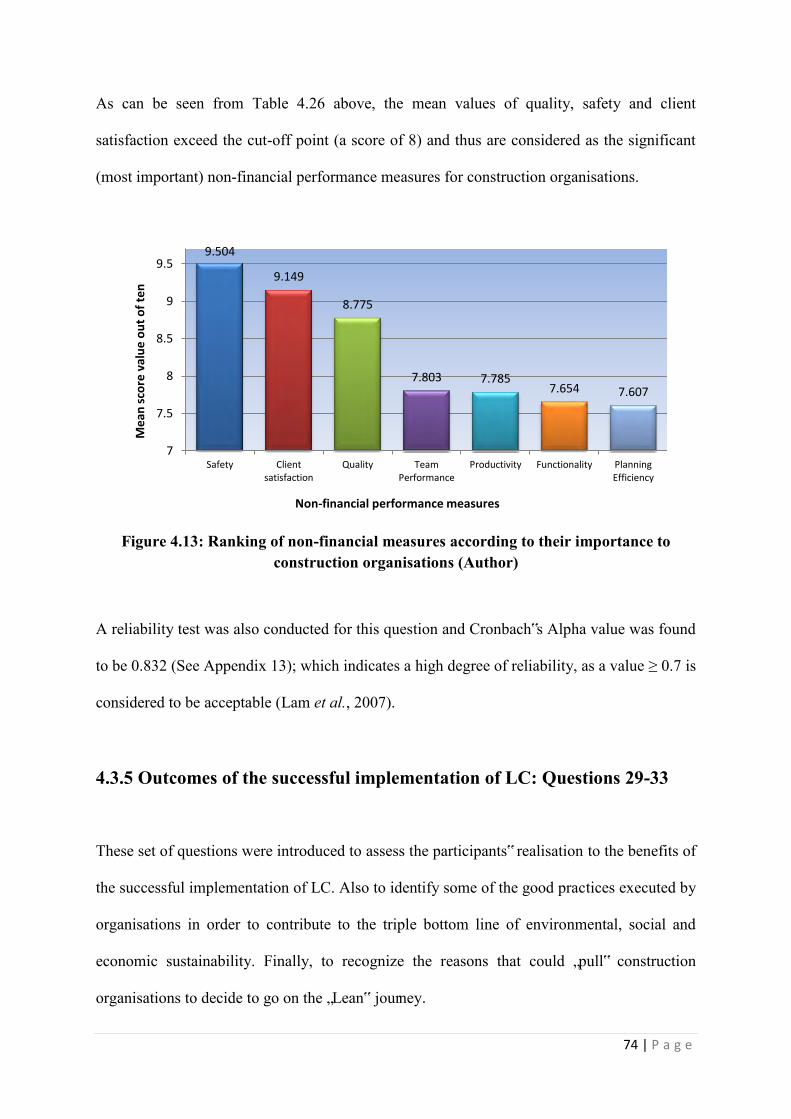
74 | P a g e
As can be seen from Table 4.26 above, the mean values of quality, safety and client
satisfaction exceed the cut-off point (a score of 8) and thus are considered as the significant
(most important) non-financial performance measures for construction organisations.
Figure 4.13: Ranking of non-financial measures according to their importance to construction organisations (Author)
A reliability test was also conducted for this question and Cronbach‟s Alpha value was found
to be 0.832 (See Appendix 13); which indicates a high degree of reliability, as a value ≥ 0.7 is
considered to be acceptable (Lam et al., 2007).
4.3.5 Outcomes of the successful implementation of LC: Questions 29-33
These set of questions were introduced to assess the participants‟ realisation to the benefits of
the successful implementation of LC. Also to identify some of the good practices executed by
organisations in order to contribute to the triple bottom line of environmental, social and
economic sustainability. Finally, to recognize the reasons that could „pull‟ construction
organisations to decide to go on the „Lean‟ journey.
9.504
9.149
8.775
7.803 7.785 7.654 7.607
7
7.5
8
8.5
9
9.5
Safety Client satisfaction
Quality Team Performance
Productivity Functionality Planning Efficiency
Me
an s
core
val
ue
ou
t o
f te
n
Non-financial performance measures

75 | P a g e
Question 29
Table 4.27: Identifying the top five benefits that could be achieved from applying
lean principles to construction (Author)
An extensive literature review was conducted to understand the expected benefits from LC.
Based on that, this question was designed to assess the participants‟ realisation to the benefits
of applying lean principles to construction. The „Other‟ option was added to help the study to
define any other possible benefits. The respondents were requested to express their opinions
to the best of their knowledge about the benefits that could be achieved from applying lean
principles to construction. However, to make the question more challenging, the respondents
were asked to choose up to five benefits only.
As can be seen from Table 4.27 above, the top five benefits that could be achieved from
applying lean principles to construction, according to the respondents‟ perspectives are as
follows:

76 | P a g e
1. Less waste (75.24%);
2. Improved productivity (70.48%);
3. Fewer defects and improved quality (67.72%);
4. Reduced cost (61.9%); and
5. More client satisfaction (56.19%).
Additionally, 4% of the respondents (5 out of 105) selected the „Other‟ option. This helped
the study to identify more expected benefits, such as: collaboration between SC members;
Positive recognition, increased innovation, more workplace satisfaction and pride; and Long-
term financial benefits, not necessarily short-term profit.
Questions 30, 31, &32
Table 4.28: Practices executed by organisations to help it contribute to the triple bottom line of economical, environmental, and social sustainability (Author)

77 | P a g e
These three questions were introduced to see if the respondents are aware of the full potential
of Lean & the importance of supply chain management, and whether there is a holistic view
of lean within construction organisations or not. A summary of the analysis is provided
below.
As can be seen from Table 4.28 above, cost & value management and risk management &
mitigation are the most common approaches used by construction organisations for achieving
economical success. Only 17.14% of all of the respondents stated that their organisations are
achieving economical benefits through using LC, and just 25% selected the „All option‟.
International standards and BREEAM are the top two approaches used for economical
considerations. Only 13.33% of all respondents considered using LC as a primary tool for
reducing physical waste, and just 10.33% selected the „All‟ option. As for social
considerations, in-house training & community engagement are the most common
approaches used by construction organisations for obtaining social benefits to their
employees. Only 16.82% of all respondents mentioned the establishment of a Lean culture. It
also appears from the responses that supply-chain assistance is overlooked or ignored by
most organisations, as it was selected by no more than 24% of all respondents.
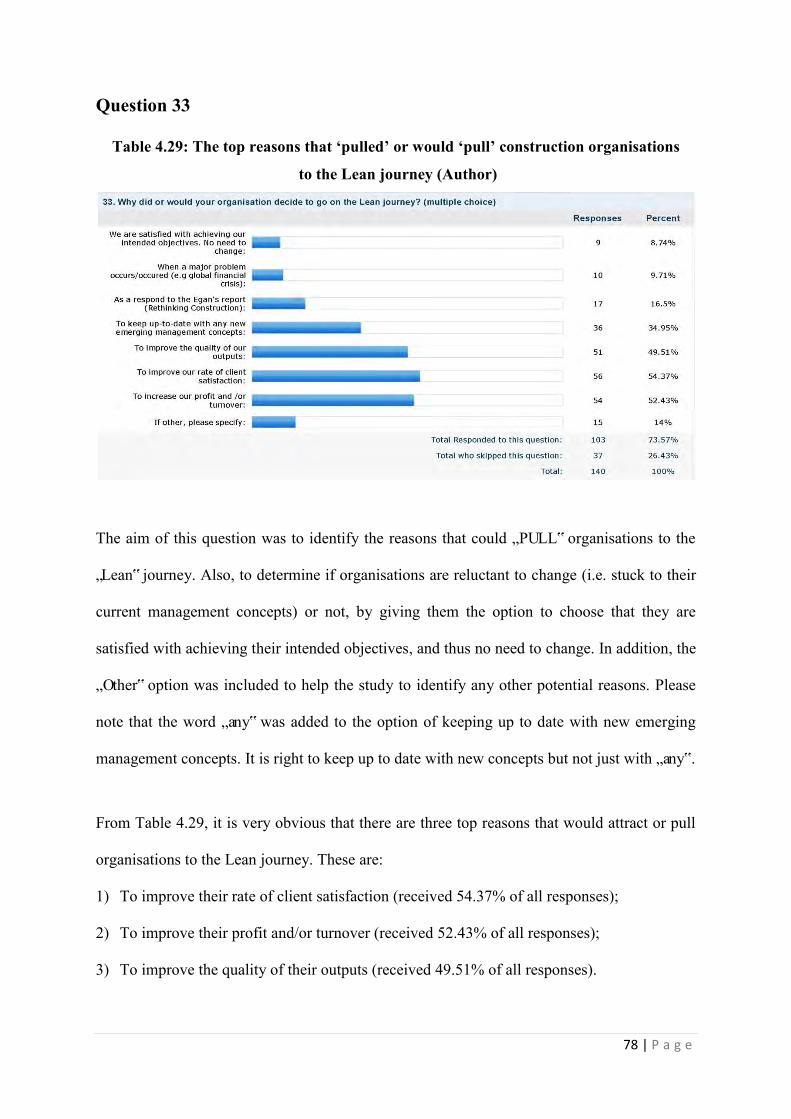
78 | P a g e
Question 33
Table 4.29: The top reasons that ‘pulled’ or would ‘pull’ construction organisations
to the Lean journey (Author)
The aim of this question was to identify the reasons that could „PULL‟ organisations to the
„Lean‟ journey. Also, to determine if organisations are reluctant to change (i.e. stuck to their
current management concepts) or not, by giving them the option to choose that they are
satisfied with achieving their intended objectives, and thus no need to change. In addition, the
„Other‟ option was included to help the study to identify any other potential reasons. Please
note that the word „any‟ was added to the option of keeping up to date with new emerging
management concepts. It is right to keep up to date with new concepts but not just with „any‟.
From Table 4.29, it is very obvious that there are three top reasons that would attract or pull
organisations to the Lean journey. These are:
1) To improve their rate of client satisfaction (received 54.37% of all responses);
2) To improve their profit and/or turnover (received 52.43% of all responses);
3) To improve the quality of their outputs (received 49.51% of all responses).
79 | P a g e
Also, about 35% of the respondents stated that their organisation would possibly go on the
Lean journey to keep up to date with any new management concepts, and 16.5% mentioned
that this happened/would happen as a response to the Egan‟s report. Additionally 9.71%
acknowledged that their organisations will not take this step unless a major crisis occurs.
Furthermore, only 8.74% of the respondents admitted that there is no need o change as they
believe that they are already satisfied with achieving their intended objectives. On the other
hand, 14% of the respondents selected the „Other‟ option. This helped the study to identify
some other possible reasons. Some of the comments received were as follows:
To reduce waste and therefore improve the social and environmental integrity of the
organisation;
Improve predictability of delivery and to support internal continuous improvement focus;
To improve the certainty of outcome;
To create safer operations to reduce stress on project managers;
Just to expand the client satisfaction - all stakeholders. Also, to gain a competitive edge;
They are not clued up enough to even think about lean procedures;
The organisation talks the talk when required but is not actively engaging with lean
processes.
4.3.6 Barriers to the successful implementation of LC: Questions 34-35
Question 34 was introduced to see if the real world agrees with the author‟s identification of
they Key barriers to LC; also, to prioritise the barriers identified, and evaluate its effect on the
successful implementation of LC. In addition, question 35 was added to help the study
identify and consider any other possible barriers from the respondents‟ view.
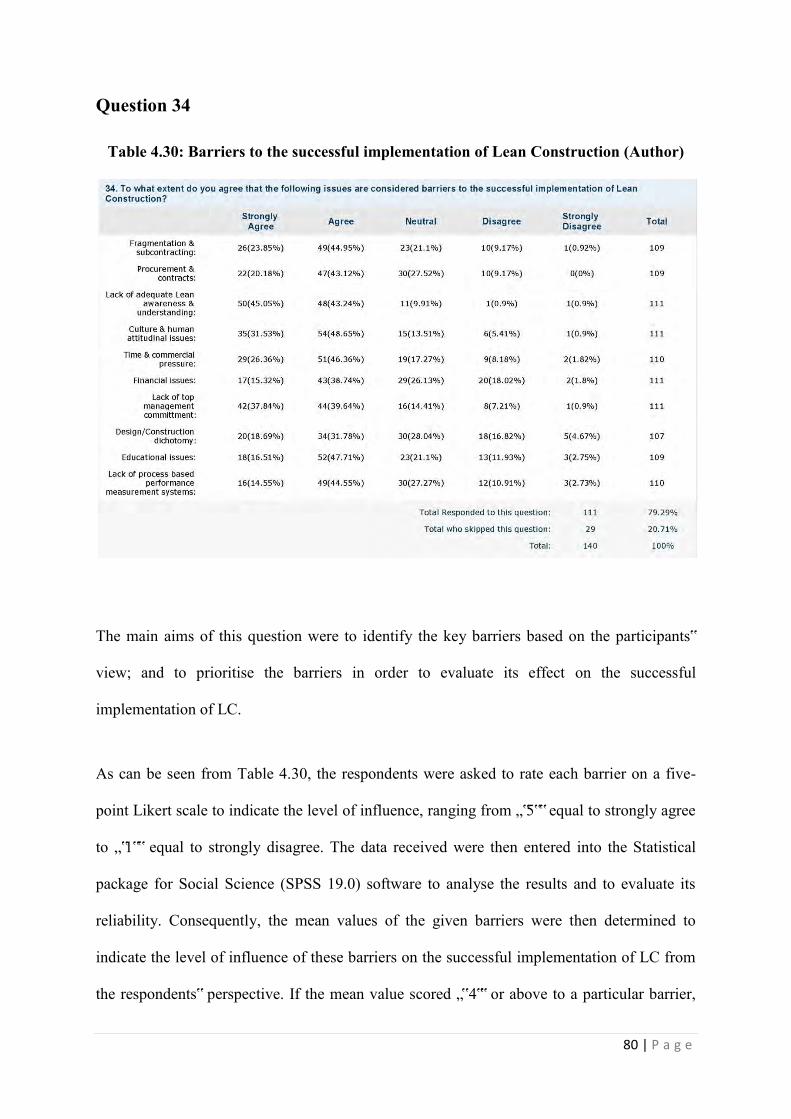
80 | P a g e
Question 34
Table 4.30: Barriers to the successful implementation of Lean Construction (Author)
The main aims of this question were to identify the key barriers based on the participants‟
view; and to prioritise the barriers in order to evaluate its effect on the successful
implementation of LC.
As can be seen from Table 4.30, the respondents were asked to rate each barrier on a five-
point Likert scale to indicate the level of influence, ranging from „‟5‟‟ equal to strongly agree
to „‟1‟‟ equal to strongly disagree. The data received were then entered into the Statistical
package for Social Science (SPSS 19.0) software to analyse the results and to evaluate its
reliability. Consequently, the mean values of the given barriers were then determined to
indicate the level of influence of these barriers on the successful implementation of LC from
the respondents‟ perspective. If the mean value scored „‟4‟‟ or above to a particular barrier,
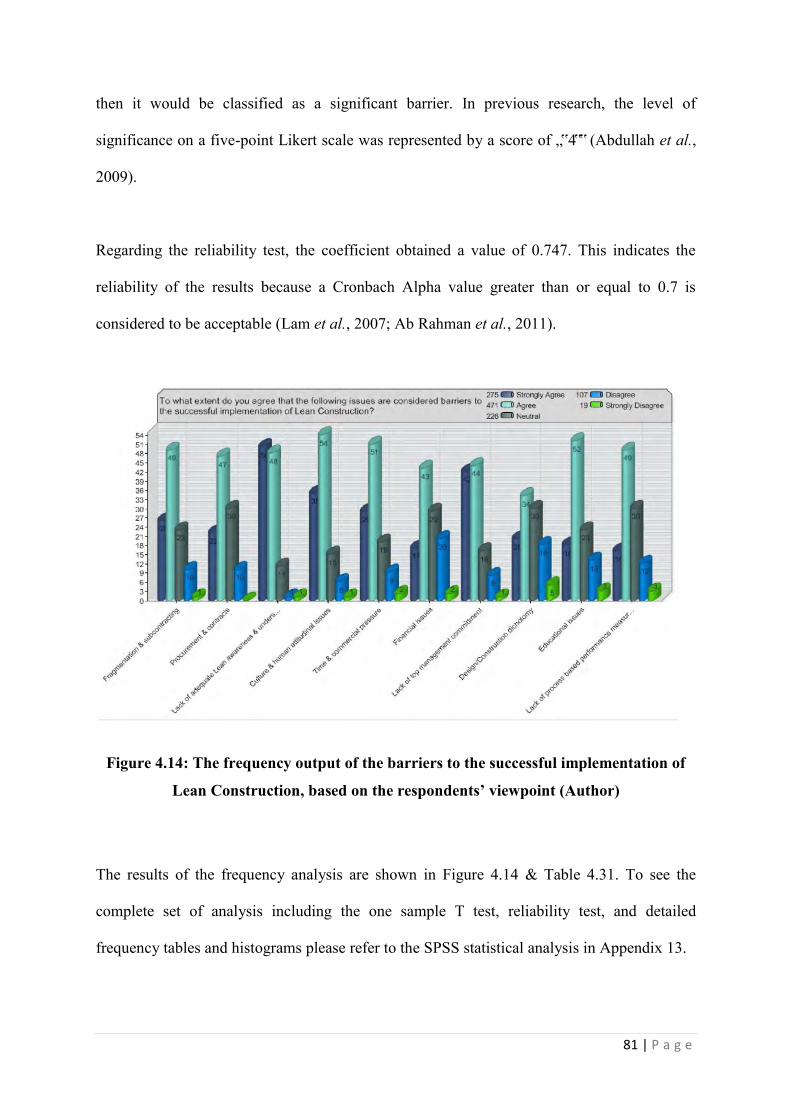
81 | P a g e
then it would be classified as a significant barrier. In previous research, the level of
significance on a five-point Likert scale was represented by a score of „‟4‟‟ (Abdullah et al.,
2009).
Regarding the reliability test, the coefficient obtained a value of 0.747. This indicates the
reliability of the results because a Cronbach Alpha value greater than or equal to 0.7 is
considered to be acceptable (Lam et al., 2007; Ab Rahman et al., 2011).
Figure 4.14: The frequency output of the barriers to the successful implementation of
Lean Construction, based on the respondents’ viewpoint (Author)
The results of the frequency analysis are shown in Figure 4.14 & Table 4.31. To see the
complete set of analysis including the one sample T test, reliability test, and detailed
frequency tables and histograms please refer to the SPSS statistical analysis in Appendix 13.
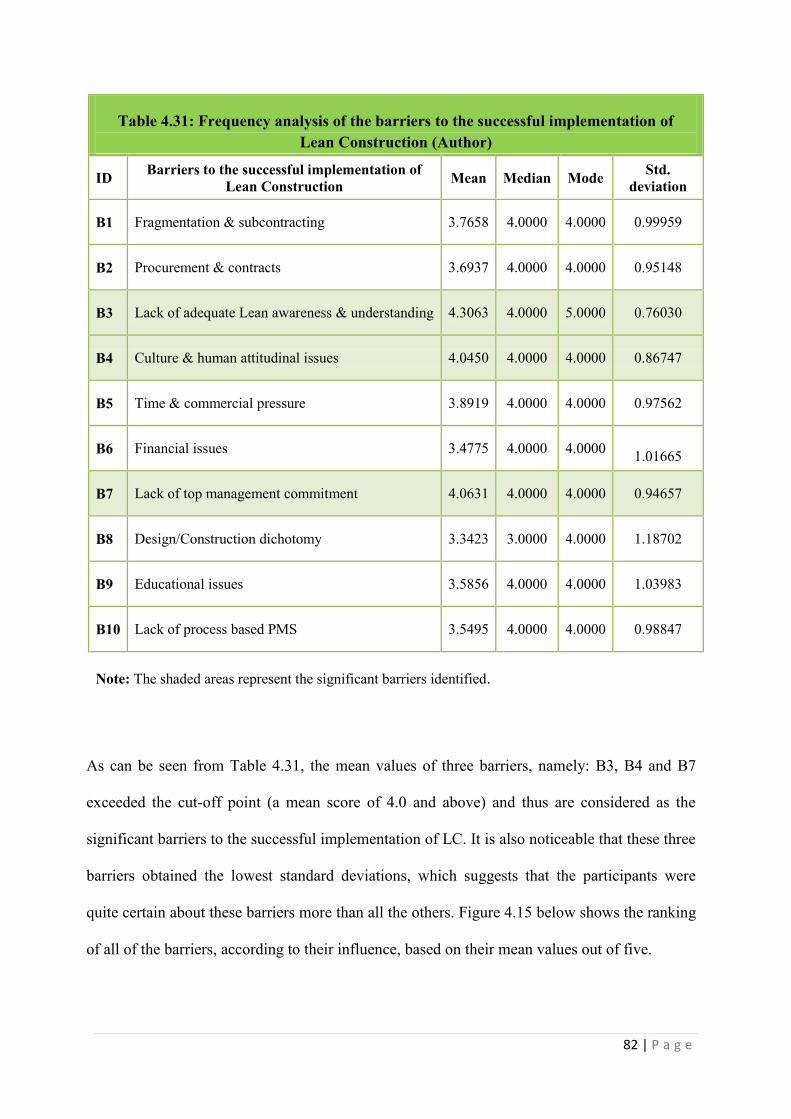
82 | P a g e
Table 4.31: Frequency analysis of the barriers to the successful implementation of Lean Construction (Author)
ID Barriers to the successful implementation of Lean Construction Mean Median Mode Std.
deviation
B1 Fragmentation & subcontracting 3.7658 4.0000 4.0000 0.99959
B2 Procurement & contracts 3.6937 4.0000 4.0000 0.95148
B3 Lack of adequate Lean awareness & understanding 4.3063 4.0000 5.0000 0.76030
B4 Culture & human attitudinal issues 4.0450 4.0000 4.0000 0.86747
B5 Time & commercial pressure 3.8919 4.0000 4.0000 0.97562
B6 Financial issues 3.4775 4.0000 4.0000 1.01665
B7 Lack of top management commitment 4.0631 4.0000 4.0000 0.94657
B8 Design/Construction dichotomy 3.3423 3.0000 4.0000 1.18702
B9 Educational issues 3.5856 4.0000 4.0000 1.03983
B10 Lack of process based PMS 3.5495 4.0000 4.0000 0.98847
Note: The shaded areas represent the significant barriers identified.
As can be seen from Table 4.31, the mean values of three barriers, namely: B3, B4 and B7
exceeded the cut-off point (a mean score of 4.0 and above) and thus are considered as the
significant barriers to the successful implementation of LC. It is also noticeable that these three
barriers obtained the lowest standard deviations, which suggests that the participants were
quite certain about these barriers more than all the others. Figure 4.15 below shows the ranking
of all of the barriers, according to their influence, based on their mean values out of five.
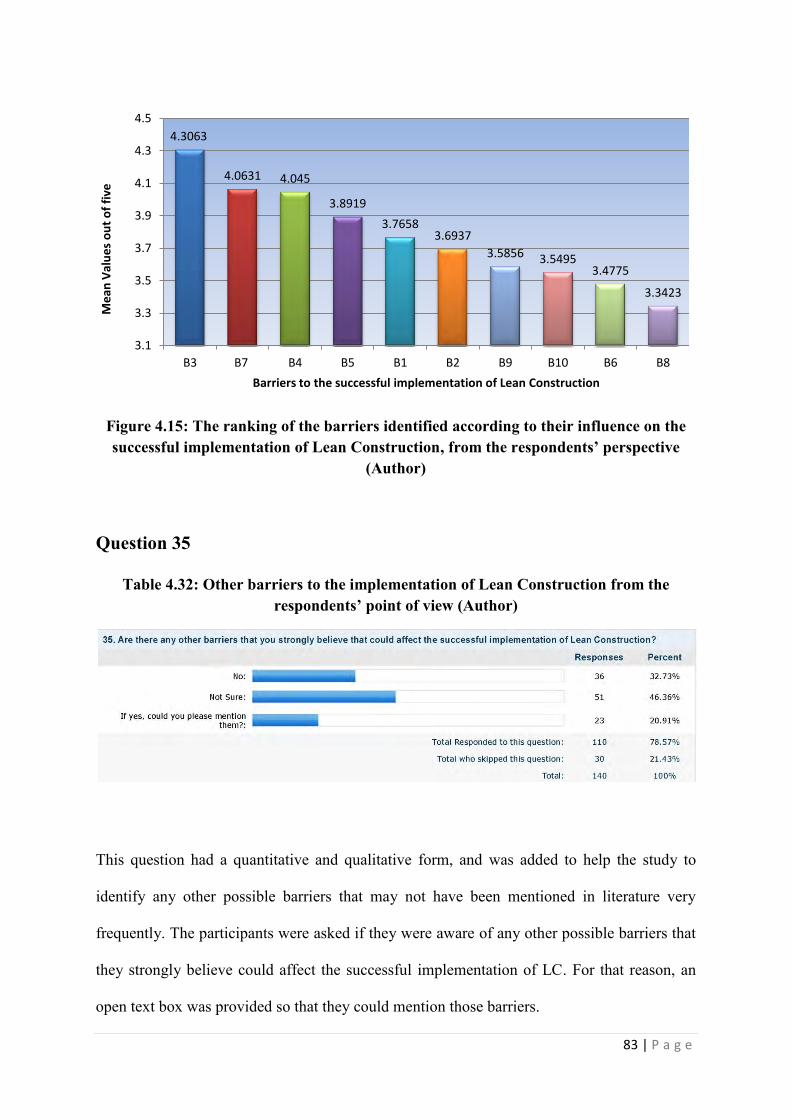
83 | P a g e
Figure 4.15: The ranking of the barriers identified according to their influence on the successful implementation of Lean Construction, from the respondents’ perspective
(Author)
Question 35
Table 4.32: Other barriers to the implementation of Lean Construction from the respondents’ point of view (Author)
This question had a quantitative and qualitative form, and was added to help the study to
identify any other possible barriers that may not have been mentioned in literature very
frequently. The participants were asked if they were aware of any other possible barriers that
they strongly believe could affect the successful implementation of LC. For that reason, an
open text box was provided so that they could mention those barriers.
4.3063
4.0631 4.045
3.8919
3.7658 3.6937
3.5856 3.5495 3.4775
3.3423
3.1
3.3
3.5
3.7
3.9
4.1
4.3
4.5
B3 B7 B4 B5 B1 B2 B9 B10 B6 B8
Me
an V
alu
es
ou
t o
f fi
ve
Barriers to the successful implementation of Lean Construction
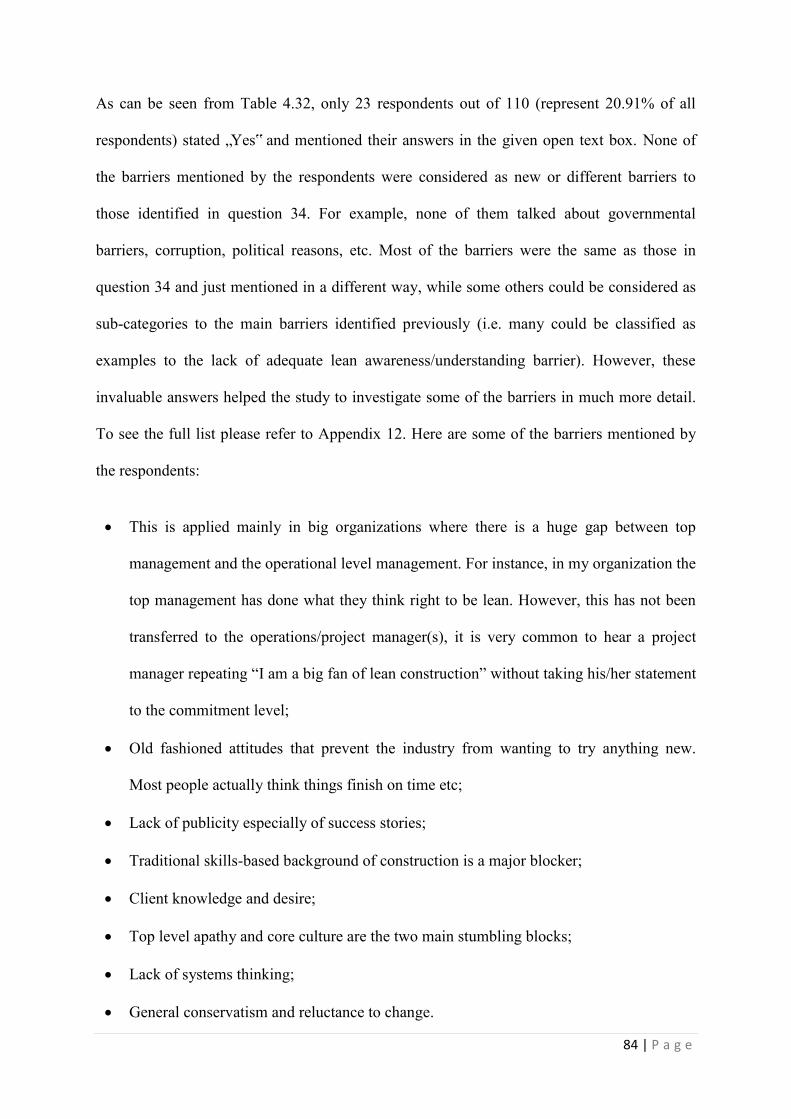
84 | P a g e
As can be seen from Table 4.32, only 23 respondents out of 110 (represent 20.91% of all
respondents) stated „Yes‟ and mentioned their answers in the given open text box. None of
the barriers mentioned by the respondents were considered as new or different barriers to
those identified in question 34. For example, none of them talked about governmental
barriers, corruption, political reasons, etc. Most of the barriers were the same as those in
question 34 and just mentioned in a different way, while some others could be considered as
sub-categories to the main barriers identified previously (i.e. many could be classified as
examples to the lack of adequate lean awareness/understanding barrier). However, these
invaluable answers helped the study to investigate some of the barriers in much more detail.
To see the full list please refer to Appendix 12. Here are some of the barriers mentioned by
the respondents:
This is applied mainly in big organizations where there is a huge gap between top
management and the operational level management. For instance, in my organization the
top management has done what they think right to be lean. However, this has not been
transferred to the operations/project manager(s), it is very common to hear a project
manager repeating “I am a big fan of lean construction” without taking his/her statement
to the commitment level;
Old fashioned attitudes that prevent the industry from wanting to try anything new.
Most people actually think things finish on time etc;
Lack of publicity especially of success stories;
Traditional skills-based background of construction is a major blocker;
Client knowledge and desire;
Top level apathy and core culture are the two main stumbling blocks;
Lack of systems thinking;
General conservatism and reluctance to change.
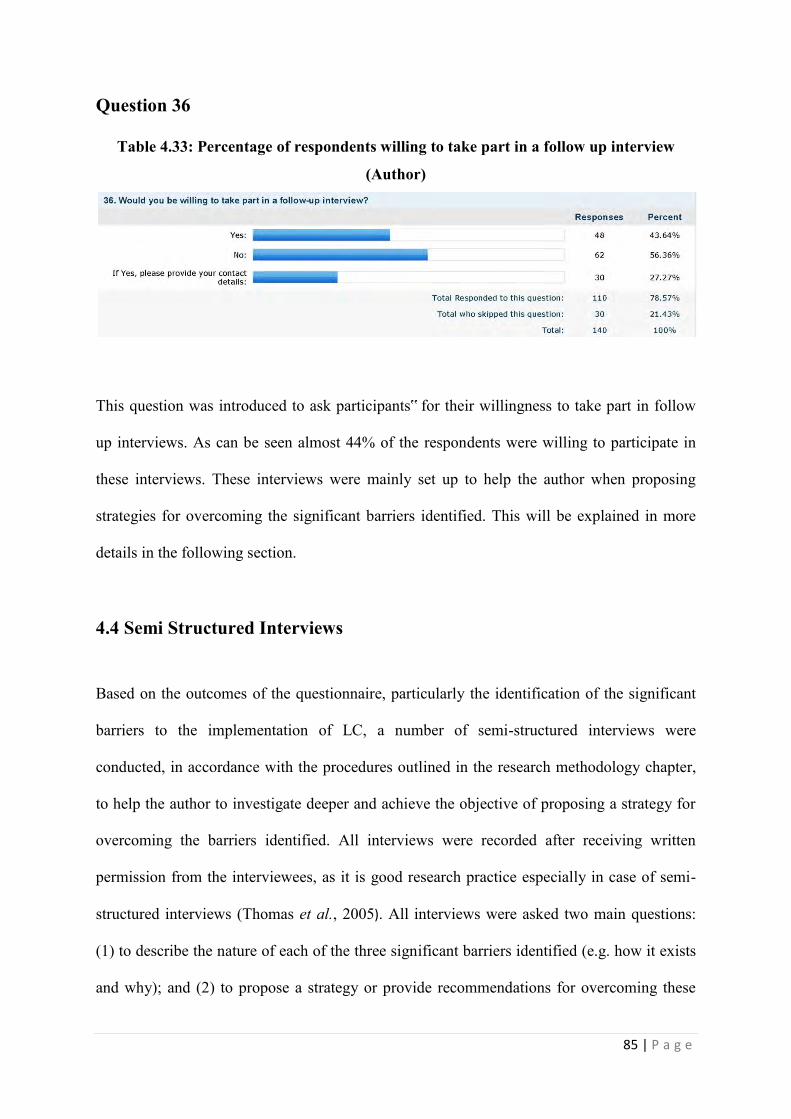
85 | P a g e
Question 36
Table 4.33: Percentage of respondents willing to take part in a follow up interview
(Author)
This question was introduced to ask participants‟ for their willingness to take part in follow
up interviews. As can be seen almost 44% of the respondents were willing to participate in
these interviews. These interviews were mainly set up to help the author when proposing
strategies for overcoming the significant barriers identified. This will be explained in more
details in the following section.
4.4 Semi Structured Interviews
Based on the outcomes of the questionnaire, particularly the identification of the significant
barriers to the implementation of LC, a number of semi-structured interviews were
conducted, in accordance with the procedures outlined in the research methodology chapter,
to help the author to investigate deeper and achieve the objective of proposing a strategy for
overcoming the barriers identified. All interviews were recorded after receiving written
permission from the interviewees, as it is good research practice especially in case of semi-
structured interviews (Thomas et al., 2005). All interviews were asked two main questions:
(1) to describe the nature of each of the three significant barriers identified (e.g. how it exists
and why); and (2) to propose a strategy or provide recommendations for overcoming these
86 | P a g e
barriers. A brief summary of the main outcomes of the interviews will be illustrated below.
To see „full transcripts‟, please refer to Appendix 14.
4.4.1 Understanding the nature of the significant barriers identified
In this sub-section, a brief introduction about the background of each interviewee will be
provided, and the key points of the responses to question one will be highlighted.
Interviewee number 1
This interview was conducted through internet webcam on Skype program. The interviewee
is a Consultant/Author/Certified Professional Speaker in the construction industry, with more
than 30 years of experience, and holding a bachelors degree in civil engineering. The
following points were highlighted during the interview, as a response to question (1):
Education (e.g. there is not enough courses within universities or colleagues teaching how
lean principles could be applied in design & construction);
Long term benefits does not interest people; as well as lack of incentives;
Predominance of the „Make Do‟ type of waste in the construction industry;
Students and recent graduates/juniors do not have adequate field experience
Lack of sufficient project management skills;
Mutual respect is very necessary between all the different team players in projects;
The construction industry is still focussed on the „low-bid mentality‟ competition;
Interviewee number 2
This interview was also conducted through internet webcam on Skype program. The
interviewee is a Productivity Manager/Lean facilitator in one of the leading contracting

87 | P a g e
companies in the UK (AAT is almost equal to £1000 Millions); with (10-20) years of
practical experience and holding a masters degree. The following points were highlighted:
The problem is that people see lean as tools rather than understanding its whole
philosophy. Organisations which have taken up the complete philosophy are
implementing lean more successfully than those who just focussed on the lean tools;
Some companies say they are applying lean but they are not. This is because they do not
have a lean culture/attitude within their organisation and it is not applied on a broad
system-wide focus;
People think that lean will increase the amount of labour work which is not the case. By
implementing lean they will improve the efficiency and effectiveness of the production.
Culture implementation takes a lot of time because it is a change of mind-sets, behaviours
and acts that you have adopted for a long time;
Top managers usually ask: how much money could I save? The people don‟t understand
that lean is not for cost cutting. Lean will not cut your cost but yes it will save you
money. There are 2 different ways of looking at things. If people say cost cuttings they
will focus totally on cost cutting & ignore the main benefits. The benefits are that they
will improve the workflow, productivity, the main productive hours, & eliminate waste;
Within the UK construction industry or environment in general, there is an issue of
human rights (e.g. you cannot discriminate, you do not need to restraint culture), and
some people think to certain extent that lean may have a negative effect on their culture,
which is not the case. Within an organisation, it will strengthen the relation between
employees; and between organisations and their supply chain. However if your supply
chain is not performing to your required standards you can change them. This is the
message from the client now, if we as a contractor and our supply chain do not show to
the clients that we are adopting a lean culture, we will not have work from them.
88 | P a g e
Interviewee number 3
This interview was conducted by telephone. The interviewee is a Quality/Business
Improvements Manager in a medium construction organisation (£100-1000 Millions); has 5-
10 years of experience and holding an NVQ degree. The following points were highlighted:
Lack of basic understanding of lean concepts as well as the use of wrong methodologies;
People just go and do tasks without planning;
Senior managers do not explain what, why and how.
Some people are settled of what they are doing and think that any change means adding
more work;
Lean training is considered expensive but it obtains lots of benefits. Small organisations
should not worry so much about financial problems as they will need an external
consultant for less time than large organisations because they have fewer employees.
Interviewee number 4
This was a face to face interview. The interviewee is an Architectural Designer (recent
junior) in a small organisation (£1-10 Millions); holding a masters degree and starting
recently a doctorate study. The following points were highlighted:
Some organisations are already practicing lean and using programs that may be
considered lean but they are not aware of that (e.g. BIM & 3D visual tools);
People are comfortable with the way they used to do things (i.e. resistance to change);
Top managers are not interested in investments which obtains benefits in the long run;
Fear of time & commercial pressure;
Successful lean stories are not frequently published as much as they should be.
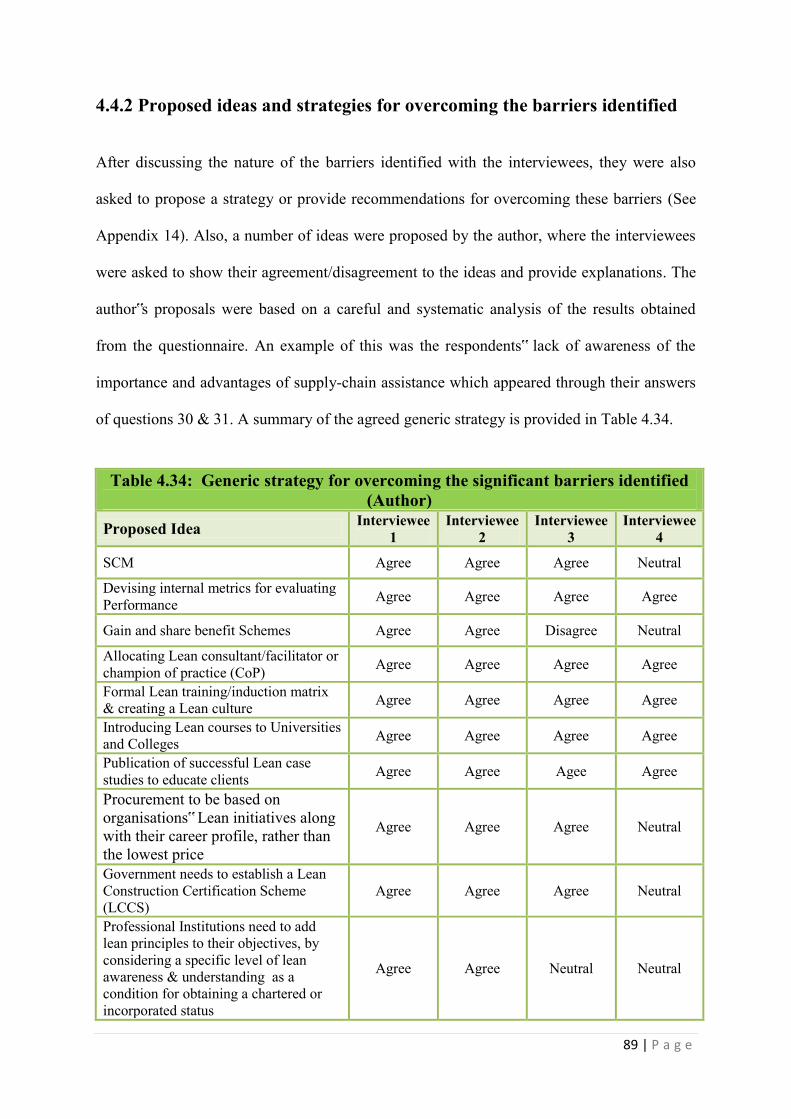
89 | P a g e
4.4.2 Proposed ideas and strategies for overcoming the barriers identified
After discussing the nature of the barriers identified with the interviewees, they were also
asked to propose a strategy or provide recommendations for overcoming these barriers (See
Appendix 14). Also, a number of ideas were proposed by the author, where the interviewees
were asked to show their agreement/disagreement to the ideas and provide explanations. The
author‟s proposals were based on a careful and systematic analysis of the results obtained
from the questionnaire. An example of this was the respondents‟ lack of awareness of the
importance and advantages of supply-chain assistance which appeared through their answers
of questions 30 & 31. A summary of the agreed generic strategy is provided in Table 4.34.
Table 4.34: Generic strategy for overcoming the significant barriers identified
(Author) Proposed Idea Interviewee
1 Interviewee
2 Interviewee
3 Interviewee
4
SCM Agree Agree Agree Neutral
Devising internal metrics for evaluating Performance Agree Agree Agree Agree
Gain and share benefit Schemes Agree Agree Disagree Neutral
Allocating Lean consultant/facilitator or champion of practice (CoP) Agree Agree Agree Agree
Formal Lean training/induction matrix & creating a Lean culture Agree Agree Agree Agree
Introducing Lean courses to Universities and Colleges Agree Agree Agree Agree
Publication of successful Lean case studies to educate clients Agree Agree Agee Agree
Procurement to be based on organisations‟ Lean initiatives along with their career profile, rather than the lowest price
Agree Agree Agree Neutral
Government needs to establish a Lean Construction Certification Scheme (LCCS)
Agree Agree Agree Neutral
Professional Institutions need to add lean principles to their objectives, by considering a specific level of lean awareness & understanding as a condition for obtaining a chartered or incorporated status
Agree Agree Neutral Neutral
90 | P a g e
CHAPTER FIVE: DISCUSSION
5.1 Introduction
In this chapter, the results and findings of the collected data are discussed and examined to
determine both their validity and their impact upon the aims and objectives for this study. The
results of the data were illustrated in chapter 4. The questionnaire and the interviews have
provided this study with data of a quantitative and qualitative nature. Therefore, the most
practical way in which to dissect the data is to evaluate the results within the boundaries of
the aims and objectives that this study began with.
5.2 Evaluating LC as Practiced within the Construction Industry
LC is perceived as a work approach that could improve processes and add value in the
construction industry. This was also acknowledged by the Egan Committee who stated that
the concepts of lean thinking would lead the UK construction industry‟s quest to improve
quality and efficiency. However, there seems to be a scarce implementation of lean in the UK
construction industry over the last two decades even after the publication of the Egan report
(Mossman, 2009; Bashir et al., 2010). For this reason, the first objective of this study was to
review LC as practiced in the UK.
By conducting an extensive literature review and referring to many case studies, a conceptual
frame work for evaluating LC as practiced in the UK was adopted and modified by the author
from Johansen & Walter (2007). The framework comprised of two main lean aspects: soft
and hard, as shown in Figure 5.1. These two aspects incorporated nine areas which were
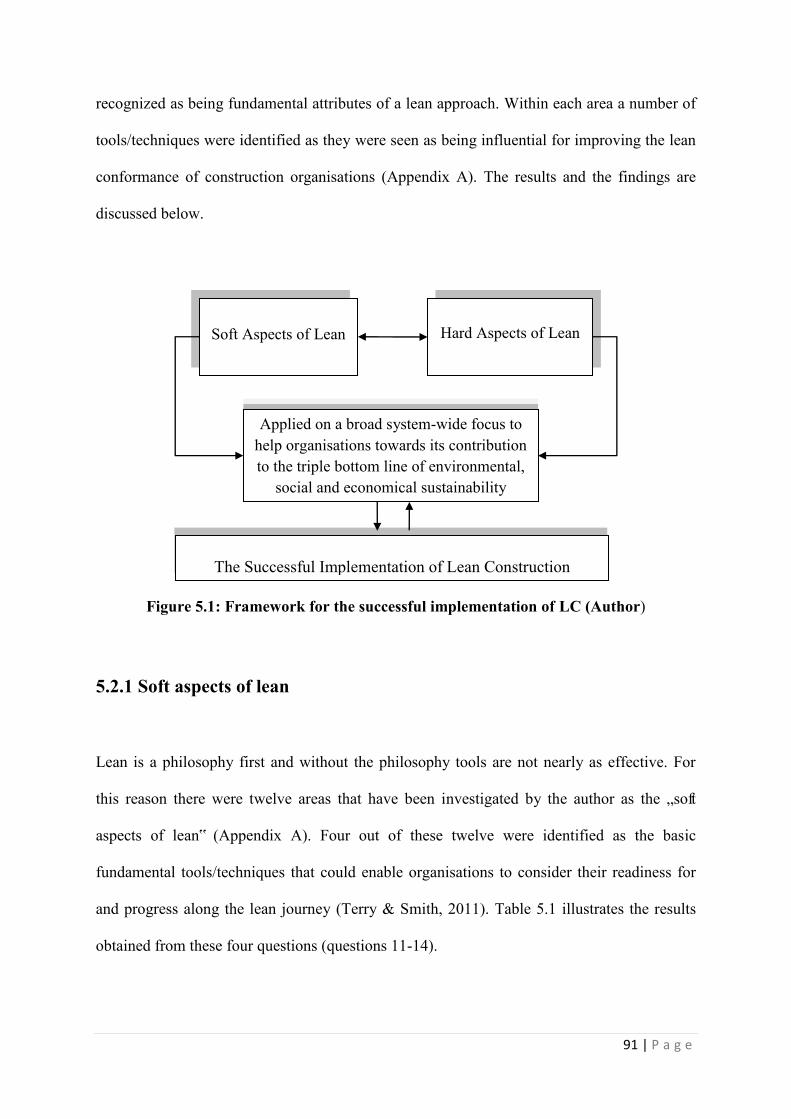
91 | P a g e
recognized as being fundamental attributes of a lean approach. Within each area a number of
tools/techniques were identified as they were seen as being influential for improving the lean
conformance of construction organisations (Appendix A). The results and the findings are
discussed below.
Figure 5.1: Framework for the successful implementation of LC (Author)
5.2.1 Soft aspects of lean
Lean is a philosophy first and without the philosophy tools are not nearly as effective. For
this reason there were twelve areas that have been investigated by the author as the „soft
aspects of lean‟ (Appendix A). Four out of these twelve were identified as the basic
fundamental tools/techniques that could enable organisations to consider their readiness for
and progress along the lean journey (Terry & Smith, 2011). Table 5.1 illustrates the results
obtained from these four questions (questions 11-14).
Hard Aspects of Lean
Applied on a broad system-wide focus to help organisations towards its contribution to the triple bottom line of environmental,
social and economical sustainability
Soft Aspects of Lean
The Successful Implementation of Lean Construction
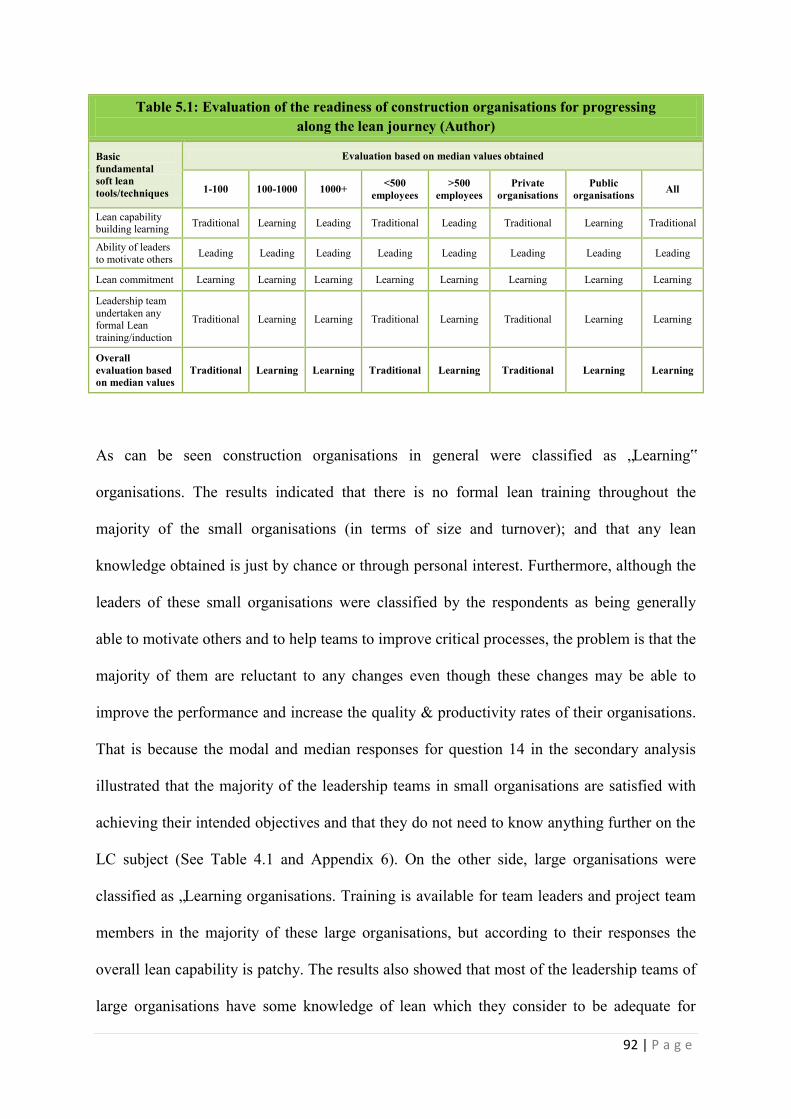
92 | P a g e
Table 5.1: Evaluation of the readiness of construction organisations for progressing along the lean journey (Author)
Basic fundamental soft lean tools/techniques
Evaluation based on median values obtained
1-100 100-1000 1000+ <500 employees
>500 employees
Private organisations
Public organisations All
Lean capability building learning Traditional Learning Leading Traditional Leading Traditional Learning Traditional
Ability of leaders to motivate others Leading Leading Leading Leading Leading Leading Leading Leading
Lean commitment Learning Learning Learning Learning Learning Learning Learning Learning
Leadership team undertaken any formal Lean training/induction
Traditional Learning Learning Traditional Learning Traditional Learning Learning
Overall evaluation based on median values
Traditional Learning Learning Traditional Learning Traditional Learning Learning
As can be seen construction organisations in general were classified as „Learning‟
organisations. The results indicated that there is no formal lean training throughout the
majority of the small organisations (in terms of size and turnover); and that any lean
knowledge obtained is just by chance or through personal interest. Furthermore, although the
leaders of these small organisations were classified by the respondents as being generally
able to motivate others and to help teams to improve critical processes, the problem is that the
majority of them are reluctant to any changes even though these changes may be able to
improve the performance and increase the quality & productivity rates of their organisations.
That is because the modal and median responses for question 14 in the secondary analysis
illustrated that the majority of the leadership teams in small organisations are satisfied with
achieving their intended objectives and that they do not need to know anything further on the
LC subject (See Table 4.1 and Appendix 6). On the other side, large organisations were
classified as „Learning organisations. Training is available for team leaders and project team
members in the majority of these large organisations, but according to their responses the
overall lean capability is patchy. The results also showed that most of the leadership teams of
large organisations have some knowledge of lean which they consider to be adequate for

93 | P a g e
involvement of lean. It was also found that organisations undertaking work for public
organisations were classified as „Learning‟ organisations; while those providing delivery
services to private individuals & organisations were classified as „Traditional‟ organisations.
Furthermore, questions 15 and 17 were introduced to identify the extent of the application of
some fundamental techniques required for a lean culture to exist within construction
organisations. The results obtained from question 15 (provided in Table 5.2 below) showed
that the LPDS developed by the LCI is not widely practiced amongst construction
organisations. Only 19% of the respondents acknowledged that LPDS is used by their
organisations to facilitate their internal and external collaborative relationships. Similarly,
about 33% of the respondents went for the IPD technique. However, one area of remarkable
growth is the increased amount of construction organisations that professed their engagement
in long-term contractual agreements (67.27%). This will be covered under the hard aspects of
lean (section 5.2.2), particularly procurement methods & contracts. On the other hand, the
results suggest that large organisations are showing some promising success; as the IPD is
almost used by half of these organisations and the LPDS is adopted by about 25%-29% of
them. Also, around 22% of these organisations admitted that „all‟ the techniques provided in
question 15 are used by them to facilitate internal/external relationships.
The results of question 17 (Table 5.2) showed that only a limited amount of construction
organisations (17.59%) have put into practice „all‟ of the fundamental tasks identified to help
organisations achieve the lean approach. These tasks include collaborative planning, work
sequence analysis, visual management; workplace organisation, process mapping, etc. (please
refer to Q17). However, it was found that medium organisations (100-1000) and large

94 | P a g e
organisations in size (more than 500 employees) are taking the lead as about 24-27% of these
organisations could be considered completely ready to proceed along the lean journey
Table 5.2: Techniques/tasks practiced and set in place to help construction organisations to improve their collaborative relationships and achieve the lean approach (Author)
Fundamental soft lean
techniques/tasks
Evaluation based on the frequency of use
1-100 100-1000 1000+ <500 employees
>500 employees
Private organisations
Public organisations All
Long term contractual agreements 59.09% 76.67% 73.53% 56.86% 76.27% 50% 70.59% 67.27%
LPDS 9.09% 23.33% 29.41% 11.76% 25.42% 20.83% 23.53% 19.09%
IPD 18.18% 40% 47.06% 15.69% 47.46% 20.83% 23.53% 32.73%
All techniques mentioned in Q15 6.82% 23.33% 17.65% 9.8% 22.03% 4.17% 23.53% 16.36%
All tasks mentioned in Q17 11.63% 26.67% 17.65% 10.2% 23.73% 8.7% 29.41% 17.59%
Furthermore, and very interestingly, the results from Table 5.2 also illustrated that about 24%
of organisations which their major client is public organisations have practical experience
with „all‟ of the techniques given in questions 15; which suggests the establishment of
excellent collaborative relations. This was emphasised by the consistency in their modal
responses (LPDS, IPD, and All were selected equally). Moreover, almost 30% of these
organisations have admitted that they have implemented „all‟ the essential lean tasks
mentioned in question 17; which indicates that they are the most ready to proceed along the
lean journey. On contrast, only 4% and 8.7% of the organisations which their major client is
private individuals & organisations admitted that „all‟ of the techniques mentioned in
questions 15 and 17 respectively are practiced within their organisations. It is obvious that the
remarkable progress being achieved through organisations dealing with public organisations
(clients) could be linked to the UK Highways Agency‟s promising efforts of engaging its
supply-chain in lean processes and assessing their adoption of a continuous improvement lean
culture (HA, 2009a).
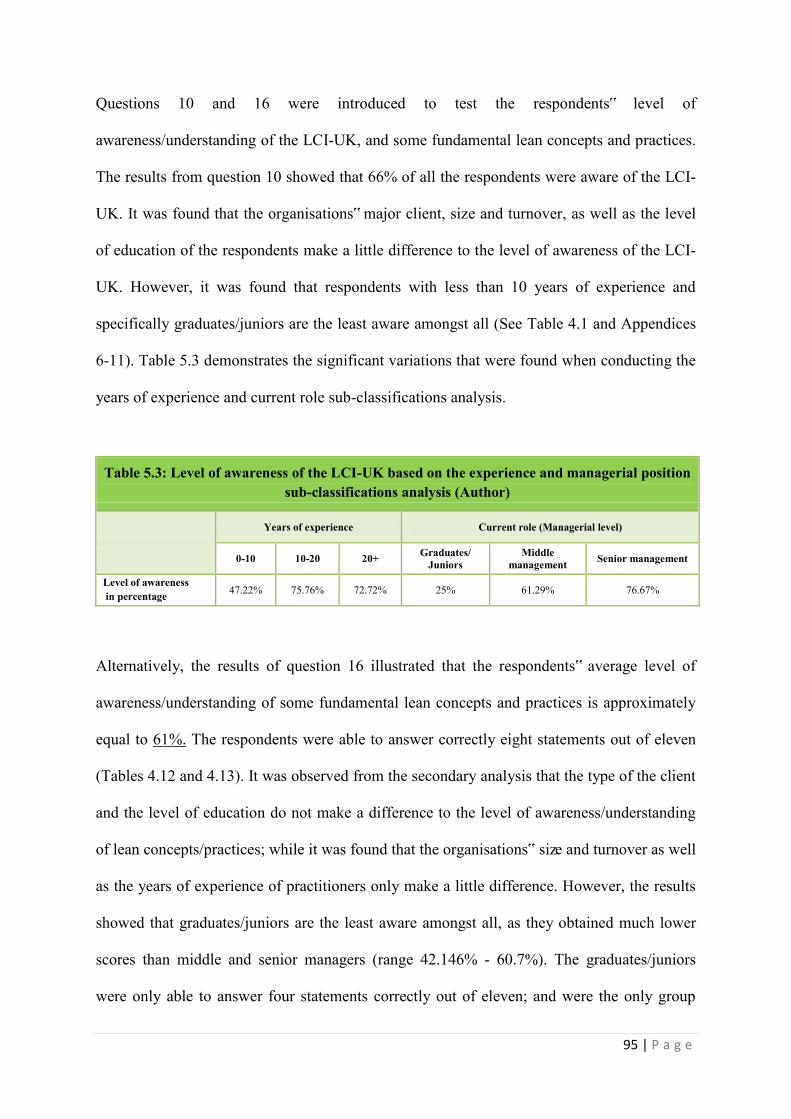
95 | P a g e
Questions 10 and 16 were introduced to test the respondents‟ level of
awareness/understanding of the LCI-UK, and some fundamental lean concepts and practices.
The results from question 10 showed that 66% of all the respondents were aware of the LCI-
UK. It was found that the organisations‟ major client, size and turnover, as well as the level
of education of the respondents make a little difference to the level of awareness of the LCI-
UK. However, it was found that respondents with less than 10 years of experience and
specifically graduates/juniors are the least aware amongst all (See Table 4.1 and Appendices
6-11). Table 5.3 demonstrates the significant variations that were found when conducting the
years of experience and current role sub-classifications analysis.
Table 5.3: Level of awareness of the LCI-UK based on the experience and managerial position
sub-classifications analysis (Author)
Years of experience Current role (Managerial level)
0-10 10-20 20+ Graduates/ Juniors
Middle management Senior management
Level of awareness in percentage 47.22% 75.76% 72.72% 25% 61.29% 76.67%
Alternatively, the results of question 16 illustrated that the respondents‟ average level of
awareness/understanding of some fundamental lean concepts and practices is approximately
equal to 61%. The respondents were able to answer correctly eight statements out of eleven
(Tables 4.12 and 4.13). It was observed from the secondary analysis that the type of the client
and the level of education do not make a difference to the level of awareness/understanding
of lean concepts/practices; while it was found that the organisations‟ size and turnover as well
as the years of experience of practitioners only make a little difference. However, the results
showed that graduates/juniors are the least aware amongst all, as they obtained much lower
scores than middle and senior managers (range 42.146% - 60.7%). The graduates/juniors
were only able to answer four statements correctly out of eleven; and were the only group
96 | P a g e
whose average level of awareness/understanding of lean concepts/practices was less than
50% (exactly 42.146%). Furthermore they were the only group which was not sure if the lean
concept is suitable for the construction industry or not.
Several recent studies have emphasised the importance of establishing a lean culture within
the construction industry (Hines et al., 2011; Santorella, 2011; Terry & Smith, 2011). In
earlier research by common et al. (2000) it was found that there was a distinct lack of
understanding of the fundamental techniques for a lean culture to exist within UK
construction companies; and that it appeared to be a significantly less lean culture in UK than
was professed. The findings of this study are slightly different to the findings of common et
al. (2000), but similar to the conclusions of Mossman (2009). The latter concluded that lean
is happening in construction in the UK; however it is haphazard and growing slowly.
The findings of this study have shown that with the exception of graduates/juniors, the level
of awareness/understanding of lean concepts and implementation techniques within
construction organisations is growing gradually. It appears that construction organisations in
general are currently classified as „Learning‟ organisations, and that medium and large
organisations are not very far behind from becoming „Leading‟ organisations (as shown in
Tables 5.1 and 5.2). About 16-18% of all the construction organisations have already set in
place the basic fundamental tools/techniques that could enable them to progress successfully
along the lean journey. In addition, the LPDS and IPD techniques are being used by around
19% and 33% of all the construction organisations respectively for improving their
internal/external collaborative relationships. The results also suggest that the major public
organisations (clients) such as the HA could play an important role in increasing the
97 | P a g e
dissemination of LC in the UK, if a lean culture is to be implemented successfully across
their business and value chain.
5.2.2 Hard aspects of lean
Many researchers identified the use of inappropriate tools and approaches as a barrier to the
successful implementation of LC (Johansen et al., 2002; Bashir et al., 2010) An example of
this is combining traditional techniques with those that are considered lean (Common et al.,
2000). For this reason, questions 18 to 28 were introduced to evaluate the level of
understanding and application of LC tools/techniques within construction organisations. The
evaluation of the tools/techniques mentioned or selected by the participants in the
questionnaire was based on the tools/techniques identified by the conceptual framework
(Appendix A), and what researchers say in literature; also by referring to the concepts of the
transformation-flow-value generation (TFV) model of production which was formulated by
Koskela (1992).
Procurement methods and contracts
The results obtained from question 16 (Table 5.2) illustrated that long-term contractual
agreements, e.g. frameworks and partnering was selected by 67% of the respondents; and
used by about 75% of the medium and large organisations. However, when referring to the
answers of questions no. 31 and 32 in chapter 4, it appears that only around 20-24% of all of
the respondents mentioned that economical success or environmental considerations are
achieved in their organisations through supply-chain assistance. Furthermore, the results of
the secondary analysis showed that only 45% of the respondents who belong to large
organisations (1000+) agreed with statement no. 10 in question 16 (Table 4.1 & Appendix 6);
98 | P a g e
which states that any procurement form that tends to delegate design work to external
designers, separates the design from the construction process, and thus misses the lean aim of
collaboration and integration (Johansen & Walter, 2007). Based on these results, it is obvious
that the advantages of the SCM are overlooked or ignored by construction organisations and
that the design element of the construction process is generally delegated or contracted out;
and thus the use of partnering becomes ineffective (Johansen et al., 2002). According to
Johansen et al. (2002) separating the design from the construction process fits with traditional
tendering where relationships with designers tend to be filled with complexity. These results
are similar to the findings of common et al. (2000), Johansen et al. (2002) and Johansen &
Walter (2007).
Management concepts
According to Johansen & Walter (2007), the principles of SCM, TQM and CE are
successfully applicable to the construction industry and could help organisations to achieve
the LC approach. The results from question 21 in chapter 4, illustrated that 46% of the
respondents acknowledged that their organisations have/had successful experience with one
or more of the management concepts of TQM, SCM and CE. Most of these respondents (46%
of all respondents) specified SCM and TQM, but Only 5% out of the 46% specified CE. In an
earlier work in Germany by Johansen & Walter (2007), when TQM was selected by 35% of
the companies and 76% of the responding companies were employing either none or just one
of the listed lean management concepts, their LC management situation was considered poor.
Based on that, and hence in this study 46% (nearly 50%) of the construction organisations
selected both TQM and SCM, the overall situation of the construction organisations involved
in this study in terms of LC management could be assessed as acceptable. However,
unexpectedly, when referring to the secondary analysis (Table 4.1 and Appendices 6&7) it

99 | P a g e
was found that about 77% of the medium organisations (100-1000) and 67% of the large
organisations (with more than 500 employees) have admitted that they have/had successful
experience with both TQM and SCM; and thus as an exception to others, their LC
management situation could be considered very good. The findings of question 21 from the
secondary analysis are summarised in Table 5.4.
Table 5.4: Amount of successful experience that construction organisations have/had with the concepts of TQM and SCM (Author)
Evaluation based on the proportion in %
1-100 100-1000 1000+ <500 employees
>500 employees
Private organisations
Public organisations All
Amount of successful experience with TQM & SCM in %
18.6% 76.67% 56.25% 22.45% 66.67% 26% 35.29% 46.23%
Planning and control
The LPS of production control has been identified by researchers as the leading concept for
combining planning and control in projects, which also introduces the next customer into the
equation through continuous and collaborative planning (Johansen & Walter, 2007). The
results from question 18 illustrated that the CPM which has been identified by many
researches as a traditional „push-system approach‟ that creates waste (Howell & Ballard,
1994; Yang & Ioannou, 2001), is the most common planning technique used by construction
organisations. It was also found that several organisations employ some of the LPS
techniques separately such as look ahead planning, PPC tools and Constrain analysis;
however these techniques are never as effective as when applied together (Johansen &
Walter, 2007). On the other hand, only 19.44% of the respondents mentioned that the LPS is
used by their organisations for planning and control, and in most cases it is used alongside the
100 | P a g e
CPM. These results are similar to the findings of Common et al. (2000) who criticized
construction organisations for mixing lean tools such as the LPS with traditional planning
tools such as the CPM.
However it was observed through data collection, particularly from interviewee number two
who is a senior manager in one of the leading contracting companies in the UK, that the CPM
is only used for the high level master plan and for testing the feasibility of bids/offers at the
tender stage. They began to see software programmes such as Primavera and MS project as a
tool, but LPS as a philosophy and a planning technique. Therefore, this could be considered
as a good starting point. The author suggests that by the time as construction organisations
develop their learning and understanding to lean concepts and implementation techniques,
they will have no need to have two planning systems on the go anymore.
Design
The participants were asked in question 23 about the tools/techniques used by their
construction organisations to simulate flow by enhancing coordination and information
procedures. A number of lean tools were introduced such as BIM, VDS, VR tools and DSM.
Very interestingly, only 24.76% of all respondents mentioned that none of these techniques
are used at all. Around 14% mentioned that DSM and VR tools are used by their
organisations, and about 8% went for VDS. However, surprisingly, BIM came first as it was
selected by 35% of the respondents. This increased awareness of the use of BIM could
possibly be linked to the UK Government‟s decision to push forward with BIM, where the
use of BIM will be mandatory within 5 years with all government projects. These results are
better than those obtained from an earlier study in Germany by Johansen & Walter (2007);
and it indicates that there is a high potential for improving the design process in the UK
101 | P a g e
construction industry. However, some argue that although BIM could help to improve
information flow and reduce design error; but without lean and without cultural reform in the
industry it could fail to deliver the benefits anticipated, and may be just treated as a 3D tool
rather than a collaborative modelling technique (Love et al., 2011).
On the other hand, question 24 was introduced to identify the tools/techniques used by
organisations to prevent value loss by reducing inconsistent decision making. Only about
20% of the respondents mentioned that the concept of concurrent design of the product and
the process is used within their organisations, and 15% for set based design. These results are
similar to the findings of Johansen & Walter (2007), and indicate that there is a general lack
of understanding of the principles of integrating design and construction within construction
organisations.
Installation of design (Lean assembly process on site)
The results of question 19 showed that the majority of the respondents were not familiar with
the techniques used for minimising uncertainty in production processes. The highest
proportion of the respondents (43.5%) mentioned that none is used; while about 39%
mentioned PDCA techniques, 20% stated pre-fabrication strategies, and only 12% went for
first-run studies. The participants were then asked in question 20 about the techniques used
by their organisations for planning and organising the movement of crews and materials as
well as the production processes itself. The results indicated that important techniques such as
visual management and CFP are not widely used. Also, only about 18% of the respondents
selected the LPS for production control. In addition, when the respondents were asked once
again in question 25 about the areas of application of LPS within construction organisations,
planning as an activity scheduling tool came first; which means that the respondents are not
102 | P a g e
aware of the full benefits of LPS. However, when referring to the secondary analysis (Table
4.1 and Appendix 6), it was found that almost 28% of the large organisations use LPS as a
productivity control technique but this amount decreases significantly as the turnover of
organisation decreases. Furthermore, when respondents were asked in question 26 about their
understanding of the function of the PPC value within the LPS, only 15.38% of all
respondents were able to answer the question correctly and realise that the PPC value does
not measure the level of utilization of a work flow (efficiency); as it measures production
planning effectiveness and workflow reliability instead (Forbes & Ahmed, 2011). These
inconsistencies in the answers of the respondents regarding the use of the LPS for production
control could be an indication of the lack of adequate awareness/understanding of the
application of lean tools/techniques within construction organisations. These results are
consistent with the findings of common et al. (2000).
Supply
The participants were asked in question 22 to identify the techniques used by their suppliers
for the provision of materials to construction sites. A number of typical lean supply
techniques were provided such as JIT, value stream analysis and Kanban were provided. The
results showed that that there is a lack of awareness of the supply principles, as the highest
proportion of the respondents mentioned that they do not know (34% of the respondents). JIT
which has been well known to several production industries for decades was selected by just
30% of the respondents, and the value stream analysis and Kanban techniques were hardly
selected. Also some of the respondents who went for the „other‟ option mentioned that
materials are ordered to their sites in accordance with their project team's programmes but
without an existence of a formal policy. By linking these results to the results of question 31
and 32 where it was shown that SCM advantages are not well considered by construction
103 | P a g e
organisations, it could be concluded that most of the construction organisations lack a
comprehensive lean approach to supply. These findings are very similar to the findings of
Johansen & Walter (2007).
Performance measurement
The selection of appropriate measures has a major influence on the implementation of
strategies, and is essential for the continuous development of improvement programmes
(Lantelme & Formoso, 2000). That is because without the use of appropriate PMSs, it
becomes very difficult for organizations to understand why poor performance continues.
Based on a comprehensive literature review (section 2.5), a number of process-oriented
(leading) measures were selected and provided alongside other traditional (lagging) measures
through question 27; to determine the techniques used by construction organisations for
performance measurement. The results revealed that results oriented KPIs are the most
common technique used amongst construction organisations for performance measurement
(selected by almost 75% of the respondents). It was also found that many organisations still
rely on the experience of their managers as a means for performance measurement. These
two approaches are no longer appropriate for continuous improvement, and have been
criticised by many researchers (Alarcón et al., 2001; Mitropoulos & Howell, 2001; Takim &
Akintoye, 2002; Costa et al., 2004; Moon et al., 2007).
Despite the fact that continuous improvement requires analysis of processes and devising an
internal metrics for evaluating performance, only about 35% of the respondents mentioned
that their organisations use their own metrics that is consistent with their business strategy.
Also, process performance measures which are the type of measurement recommended for
the successful implementation of LC was selected by just 27% of all respondents. However,
104 | P a g e
in question 28, when the respondents were asked to give a score out of ten (10 being the most
important and 1 being the least important) to some non-financial performance measures, the
mean values of three measures namely: safety, client satisfaction and quality obtained a score
above 8 (most significant); and the lowest score obtained amongst all other performance
measures was 7.6. These results indicated that although the respondents recognise the
importance of performance measures, it has not been properly and widely implemented in the
construction industry. Most managers still make decisions just based on their experience &
common sense, and on a few traditional financial measures which are no longer suitable in
the existing competitive environment.
Furthermore, when the respondents were asked in question 16 to indicate their level of
agreement to statement 5, most of the respondents agreed that using performance
measurement for self defence or evidence of claims and counter claims is recommended. This
contradicts the LC theoretical framework, where PMSs should be strongly related to
„decentralised control‟ and used for continuous improvement and in the learning process at
operational level; instead of being used for looking for who or what is to blame when
problems occur (Lantelme & Formoso, 2000). These results suggest that there is a
considerable lack of awareness of the application of performance measurement and its role, in
terms of providing process transparency and creating conditions for decentralised control to
be implemented. Although the data obtained from this question were evaluated and indicated
a high degree of reliability, further research would be recommended to confirm its validity.
5.2.3 Benefits and holistic view of lean construction Evidence of the use of lean thinking has shown that there are benefits to be gained from
applying lean principles to construction (Ansell et al., 2007). Based on a comprehensive
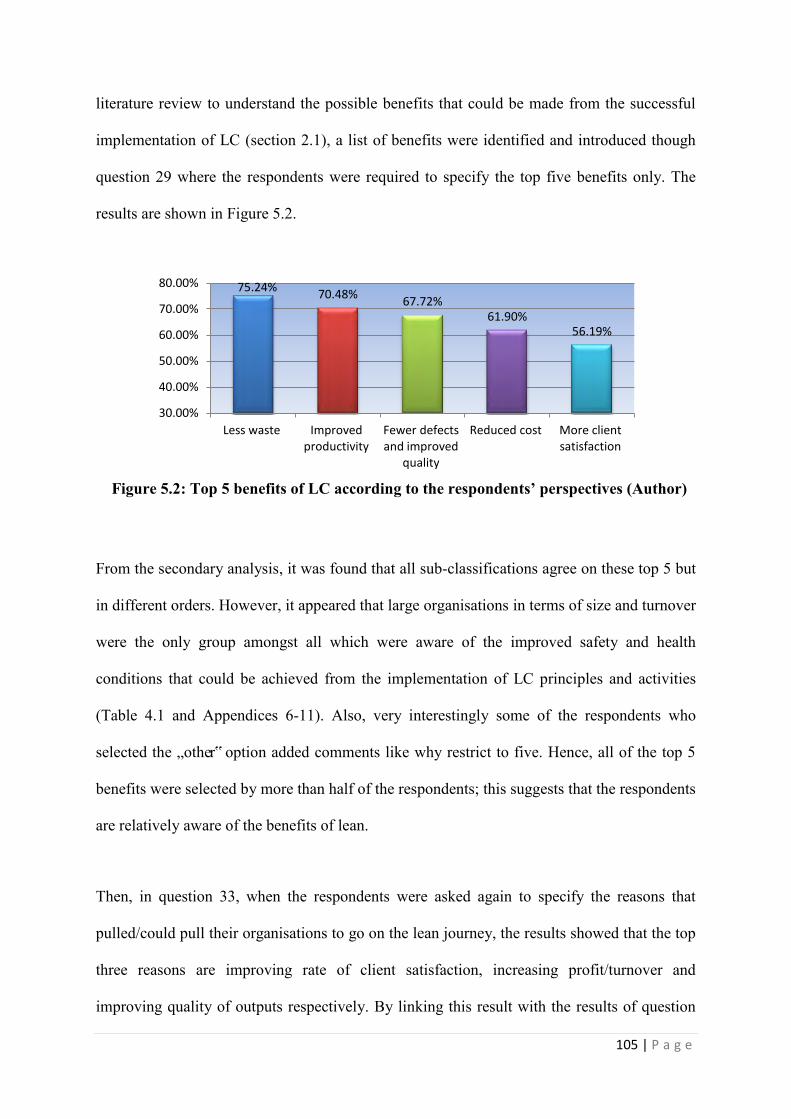
105 | P a g e
literature review to understand the possible benefits that could be made from the successful
implementation of LC (section 2.1), a list of benefits were identified and introduced though
question 29 where the respondents were required to specify the top five benefits only. The
results are shown in Figure 5.2.
Figure 5.2: Top 5 benefits of LC according to the respondents’ perspectives (Author)
From the secondary analysis, it was found that all sub-classifications agree on these top 5 but
in different orders. However, it appeared that large organisations in terms of size and turnover
were the only group amongst all which were aware of the improved safety and health
conditions that could be achieved from the implementation of LC principles and activities
(Table 4.1 and Appendices 6-11). Also, very interestingly some of the respondents who
selected the „other‟ option added comments like why restrict to five. Hence, all of the top 5
benefits were selected by more than half of the respondents; this suggests that the respondents
are relatively aware of the benefits of lean.
Then, in question 33, when the respondents were asked again to specify the reasons that
pulled/could pull their organisations to go on the lean journey, the results showed that the top
three reasons are improving rate of client satisfaction, increasing profit/turnover and
improving quality of outputs respectively. By linking this result with the results of question
75.24% 70.48%
67.72% 61.90%
56.19%
30.00%
40.00%
50.00%
60.00%
70.00%
80.00%
Less waste Improved productivity
Fewer defects and improved
quality
Reduced cost More client satisfaction
106 | P a g e
28 where client satisfaction was identified as one of the significant non-financial measures
according to the respondents‟ viewpoint, it is very clear that the respondents are customer
focussed. This is a promising improvement; however construction organisations still need to
draw their attentions on how customer value could best be achieved, especially when the
results of questions 22, 31 and 32 have shown a lack of awareness of the importance of
fundamental approaches like SCM and value stream mapping and analysis.
On the other hand, the results of questions 31-33 revealed that the majority of the
construction organisations do not yet have a holistic view of the full potentials of lean; and
that LC is hardly implemented on a broad system-wide focus to help organisations towards its
contribution to the triple bottom line of environmental, social and economical sustainability.
5.3 Barriers to the Successful Implementation of LC
An extensive literature review was conducted to understand the possible barriers to the
successful implementation of LC in the UK (section 2.4). Based on a thorough analysis of
these barriers, they were merged and classified by the author into 10 different categories.
Consequently, questions number 34 and 35 were introduced:
1) To see if the real world agrees with the author‟s identification of the key barriers to the
successful implementation of LC;
2) To identify the most significant barriers according to its influence on the implementation
of LC, based on the mean values obtained;
3) To prioritise the barriers identified and evaluate its effect on the successful
implementation of LC.
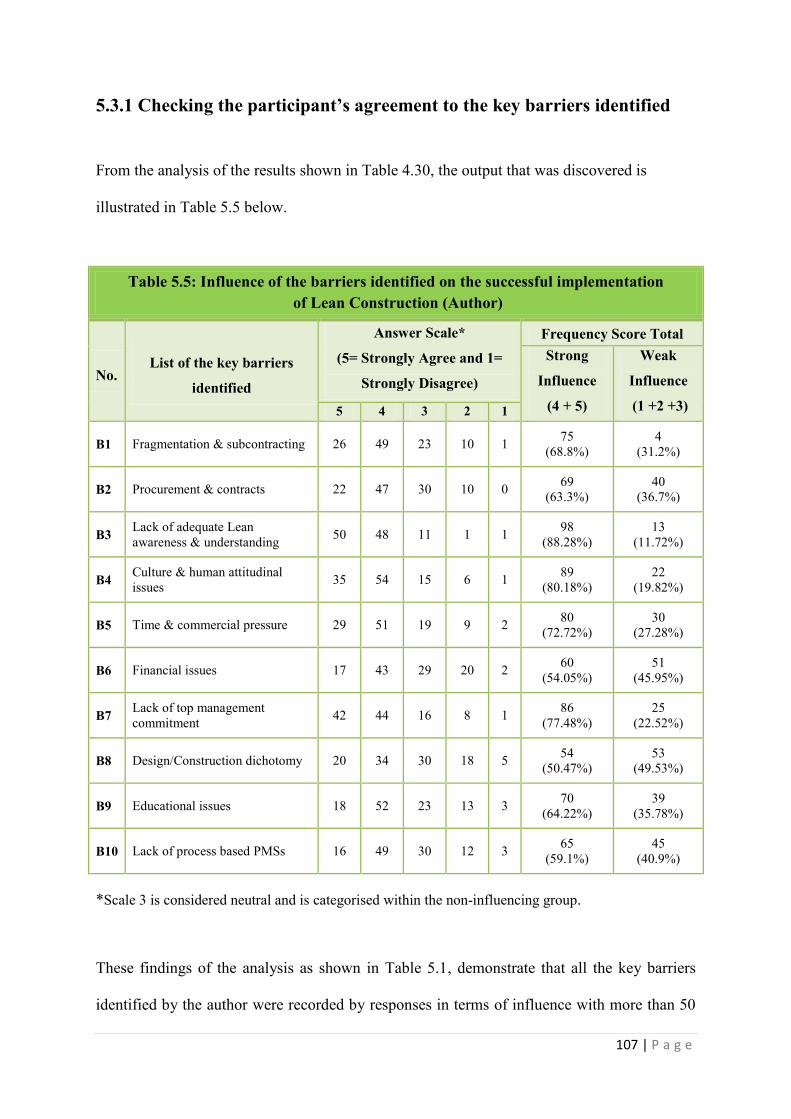
107 | P a g e
5.3.1 Checking the participant’s agreement to the key barriers identified
From the analysis of the results shown in Table 4.30, the output that was discovered is
illustrated in Table 5.5 below.
Table 5.5: Influence of the barriers identified on the successful implementation
of Lean Construction (Author)
No. List of the key barriers
identified
Answer Scale*
(5= Strongly Agree and 1=
Strongly Disagree)
Frequency Score Total Strong
Influence
(4 + 5)
Weak
Influence
(1 +2 +3) 5 4 3 2 1
B1 Fragmentation & subcontracting 26 49 23 10 1 75 (68.8%)
4 (31.2%)
B2 Procurement & contracts 22 47 30 10 0 69 (63.3%)
40 (36.7%)
B3 Lack of adequate Lean awareness & understanding 50 48 11 1 1 98
(88.28%) 13
(11.72%)
B4 Culture & human attitudinal issues 35 54 15 6 1 89
(80.18%) 22
(19.82%)
B5 Time & commercial pressure 29 51 19 9 2 80 (72.72%)
30 (27.28%)
B6 Financial issues 17 43 29 20 2 60 (54.05%)
51 (45.95%)
B7 Lack of top management commitment 42 44 16 8 1 86
(77.48%) 25
(22.52%)
B8 Design/Construction dichotomy 20 34 30 18 5 54 (50.47%)
53 (49.53%)
B9 Educational issues 18 52 23 13 3 70 (64.22%)
39 (35.78%)
B10 Lack of process based PMSs 16 49 30 12 3 65 (59.1%)
45 (40.9%)
*Scale 3 is considered neutral and is categorised within the non-influencing group.
These findings of the analysis as shown in Table 5.1, demonstrate that all the key barriers
identified by the author were recorded by responses in terms of influence with more than 50

108 | P a g e
percent frequency. This clearly proves that the majority of the respondents agreed with the
author‟s identification of the key barriers to the successful implementation of LC. Hence the
measurement of reliability is essential to the validity of the results (Lam et al., 2007); the data
received for this question were entered into SPSS 19.0 software to evaluate its reliability
using Cronbach‟s Alpha coefficients. The coefficient obtained a value of 0.747 which
indicates the „‟reliability‟‟ of the results as it greater than the acceptable threshold (0.7) (Lam
et al., 2007; Ab Rahman et al., 2011).
The validity of the results obtained from this question can be assessed against other studies.
In similar research, the same approach used by the author for reaching these findings was
conducted by Abdullah et al (2009). Furthermore, in earlier studies, Mossman (2009) and
Bashir et al. (2010) investigated all of the barriers identified by the author except B8 & B10.
5.3.2 Identifying the most significant barriers to the successful
implementation of LC
With the same data obtained in Table 5.5, further analysis was conducted using the mean
values of each barrier (as shown in Table 5.6 below). It was found that only three barriers
obtained a mean score above four, namely, lack of adequate lean awareness/understanding,
lack of top management commitment, and culture & human attitudinal issues. In several
studies, the level of significance was represented by a score of „‟4‟‟ on a five-point Likert
scale (Chan, 2003; Abdullah et al., 2009). This seems to be a common threshold in most
construction research (Lam et al., 2007). Within this context, these three barriers (B3, B4 and
B7) were classified as the significant barriers to the successful implementation of LC.
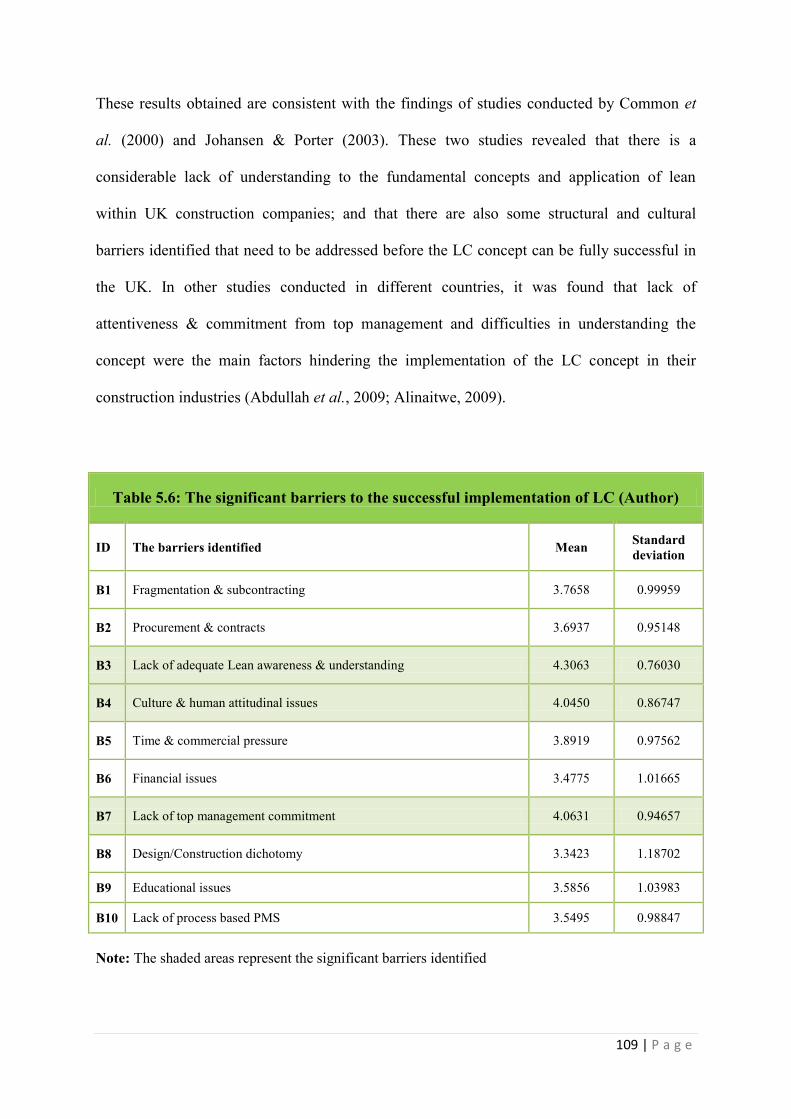
109 | P a g e
These results obtained are consistent with the findings of studies conducted by Common et
al. (2000) and Johansen & Porter (2003). These two studies revealed that there is a
considerable lack of understanding to the fundamental concepts and application of lean
within UK construction companies; and that there are also some structural and cultural
barriers identified that need to be addressed before the LC concept can be fully successful in
the UK. In other studies conducted in different countries, it was found that lack of
attentiveness & commitment from top management and difficulties in understanding the
concept were the main factors hindering the implementation of the LC concept in their
construction industries (Abdullah et al., 2009; Alinaitwe, 2009).
Table 5.6: The significant barriers to the successful implementation of LC (Author)
ID The barriers identified Mean Standard deviation
B1 Fragmentation & subcontracting 3.7658 0.99959
B2 Procurement & contracts 3.6937 0.95148
B3 Lack of adequate Lean awareness & understanding 4.3063 0.76030
B4 Culture & human attitudinal issues 4.0450 0.86747
B5 Time & commercial pressure 3.8919 0.97562
B6 Financial issues 3.4775 1.01665
B7 Lack of top management commitment 4.0631 0.94657
B8 Design/Construction dichotomy 3.3423 1.18702
B9 Educational issues 3.5856 1.03983
B10 Lack of process based PMS 3.5495 0.98847
Note: The shaded areas represent the significant barriers identified
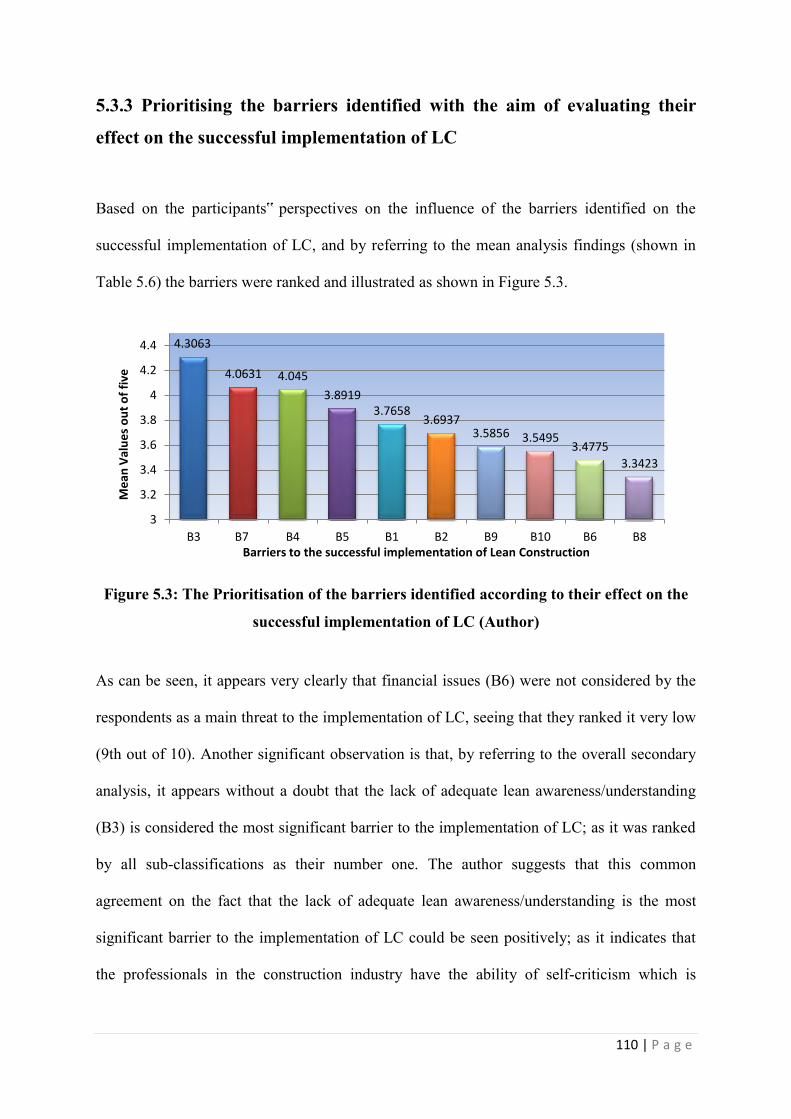
110 | P a g e
5.3.3 Prioritising the barriers identified with the aim of evaluating their
effect on the successful implementation of LC
Based on the participants‟ perspectives on the influence of the barriers identified on the
successful implementation of LC, and by referring to the mean analysis findings (shown in
Table 5.6) the barriers were ranked and illustrated as shown in Figure 5.3.
Figure 5.3: The Prioritisation of the barriers identified according to their effect on the
successful implementation of LC (Author)
As can be seen, it appears very clearly that financial issues (B6) were not considered by the
respondents as a main threat to the implementation of LC, seeing that they ranked it very low
(9th out of 10). Another significant observation is that, by referring to the overall secondary
analysis, it appears without a doubt that the lack of adequate lean awareness/understanding
(B3) is considered the most significant barrier to the implementation of LC; as it was ranked
by all sub-classifications as their number one. The author suggests that this common
agreement on the fact that the lack of adequate lean awareness/understanding is the most
significant barrier to the implementation of LC could be seen positively; as it indicates that
the professionals in the construction industry have the ability of self-criticism which is
4.3063
4.0631 4.045
3.8919 3.7658
3.6937 3.5856 3.5495
3.4775
3.3423
3
3.2
3.4
3.6
3.8
4
4.2
4.4
B3 B7 B4 B5 B1 B2 B9 B10 B6 B8
Me
an V
alu
es
ou
t o
f fi
ve
Barriers to the successful implementation of Lean Construction

111 | P a g e
identified by Johansen & Walter (2007) as one of the fundamental behavioural aspects of lean
construction.
The methodology adopted for prioritising the barriers and carrying out this evaluation is
comparable to the approaches conducted by similar studies (Abdul-Hadi et al., 2005;
Alinaitwe, 2009). Therefore, this evaluation (based on the priority list) could be used to help
the construction industry to focus its attention and resources on the key issues.
5.4 A Strategy for Overcoming the Significant Barriers Identified
Having identified the significant barriers to the successful implementation of LC based on the
respondents‟ perspectives, a number of semi-structured interviews were conducted (section
4.4 and Appendix 14). These interviews were essential in order to help the author to
investigate deeper, have a better understanding of the nature of each of the barriers identified,
and discuss solutions & proposals to overcome these barriers. Although about 40% of the
respondents of the survey agreed to take part in the follow-up interview (Q36), only 4
professionals were selected. During the selection process, the author focussed on ensuring the
diversity of the participants, so that they can represent all the 6 different classifications
adopted for the secondary analysis.
Through these informative discussions with the interviewees, a number of proposals & ideas
were determined. Only those proposals which were agreed up on by the majority of the
interviewees were taken forward to form the structure of a generic strategy for overcoming
the significant barriers identified (Table 4.34). Then, by referring to the overall results of the
survey, four distinct categories of response were distinguished. From a strategy perspective
there were those involved in the private sector, those involved in the public sector, and the

112 | P a g e
survey seems to have identified different needs associated with each sector. It appeared to the
author, from the findings of the secondary analysis, that there were two clear levels of need.
A basic level for those confronted by barriers (i.e. recent graduates/junior staff), and an
advanced level for those capable of removing barriers (i.e. senior and experienced managers).
Finally, by analysing the generic strategy within the context of the four categories described
above, a final strategy was adopted (Table 5.7).
Table 5.7: A proposed strategy for overcoming barriers to the successful implementation of LC (Author)
PUBLIC ORGANISATIONS (Governmental)
Implementing a Lean culture across the whole business and value chain
Procurement to be based on organisations‟ Lean initiatives along with their career profile, rather than the lowest price
Establishing a Lean Construction
Certification Scheme (LCCS)
Supply-Chain Management
Allocating champions of practice to provide learning opportunities to all of its members and prepare project teams for challenges they may face
PRIVATE ORGANISATIONS
Providing a formal Lean training/induction matrix
Hiring external Lean consultants
Devising internal metrics of leading
parameters for evaluating performance and organisational learning
Increasing the Lean awareness/knowledge
of clients through the publishing of successful Lean case studies
Creating a „Gain and Share‟ benefit
Scheme, where bonuses & incentives are based on the profitability of the production rather than the productivity rates
GRADUATES
Lean principles to be added to the curriculum at Universities and Colleges
Companies and organisations to provide Lean induction sessions to all recent graduates & juniors
SENIOR MANAGERS
Professional institutions should only award chartered/ incorporated status to professionals and managers who could demonstrate at least a basic level of awareness and understanding of Lean
113 | P a g e
CHAPTER SIX - CONCLUSIONS AND REFLECTIONS
6.1 Lean Construction, as Practiced in the UK
The first aim of this study was to evaluate LC, as practiced in the UK. Based on a
comprehensive literature review, a theoretical framework was adopted and modified by the
author; and it formed the basis for the questionnaire survey. The responses of the questionnaire
were then subject to a secondary analysis, as well as a quantitative and qualitative analysis in
pursuit of the objectives of the study.
The study revealed that although the level of awareness of the lean principles amongst
construction organisations is growing gradually, there is still a significant lack of
understanding of how to successfully apply these lean principles to construction processes
and activities.
Hence this study received 140 responses where more than half (63%) of the respondents were
from practitioners with more than 10 years of experience holding senior positions at the
directional and managerial level in their respective, and due to the diversity of the
respondents as well as the very well distributed mixture of organisations involved in the
study, the author considers the sample to be representative of the UK construction industry as
a whole; and also believes that the findings of this study have validity throughout the whole
UK construction industry. The main findings of this study are illustrated, as follows:
Recent graduates/juniors have a significant lack of awareness/understanding of Lean
principles, practices, and even the LCI-UK;
Lean concepts are hardly implemented among construction organisation on a broad
system-wide focus;
114 | P a g e
Large and medium organisations in terms of size & turnover, particularly those dealing
with public organisations, are the most ready to proceed along the lean journey.
Any Lean knowledge throughout most of the construction organisations is just obtained
by chance and through personal interest;
Long term contractual agreements & document management systems are the most
common techniques used by construction organisations for facilitating external and
internal collaborative relationships;
The critical path method is the most common technique used by construction
organisations for planning & control;
A large amount of construction organisations do not practice any lean techniques for
minimising uncertainty in production processes;
The LPS and visual management techniques are not practiced by most of the construction
organisations;
Most of the construction organisations lack a comprehensive lean approach to supply;
The level of awareness of the use of BIM amongst professionals is increasing; but the
state of the construction organisations in terms of facilitating the integration of design and
construction by means of contracts and design procedures appears to be at a rather early
stage of lean construction development.
Most of the construction organisations do not practice any lean techniques to prevent
value loss by reducing inconsistent decision making. Concurrent engineering and set-
based design strategies are hardly practiced;
LPS is mostly used as an activity scheduling tool within construction organisations;
Results oriented KPIs and the experience of managers are the most common techniques
used by construction organisations for performance measurement;

115 | P a g e
The top three non-financial parameters according to their importance to construction
organisations are: 1- Safety, 2- Customer/client satisfaction, and 3- Quality;
The top 5 benefits perceived benefits of applying Lean thinking to construction according
to the respondents‟ perspectives are: 1- less waste, 2- improved productivity, 3- fewer
defects and improved quality, 4- reduced cost, and 5- increased client satisfaction;
Cost & value management and risk management & mitigation are the most common
techniques adopted by construction organisations to achieve economic success;
International standards & accreditation (e.g. ISO 14001) are the most common techniques
used by large organisation, but BREAM is the most frequently used by small ones;
In-house training and community engagement are the most two common approaches used
by construction organisations for achieving social benefits to their employees;
The top three reasons that could pull construction organisations to go on the lean journey
are: 1- improving rate of client satisfaction, 2- increasing profit/turnover and 3-
improving quality of outputs.
6.2. Barriers to the Successful Implementation of LC in the UK
An extensive literature review was conducted to understand the possible barriers to the
successful implementation of LC in the UK. Based on a thorough analysis of these barriers,
they were merged and classified by the author into 10 different categories. The findings of
this study has shown that only three out of these ten were considered as significant barriers to
the successful implementation of LC in the UK (Table 6.1), namely, lack of adequate lean
awareness & understanding, lack of top management commitment, and Cultural & human
attitudinal issues. The barriers were then prioritised with the aim of evaluating their effect on
the successful implementation of LC, as shown in Figure 6.1 below.
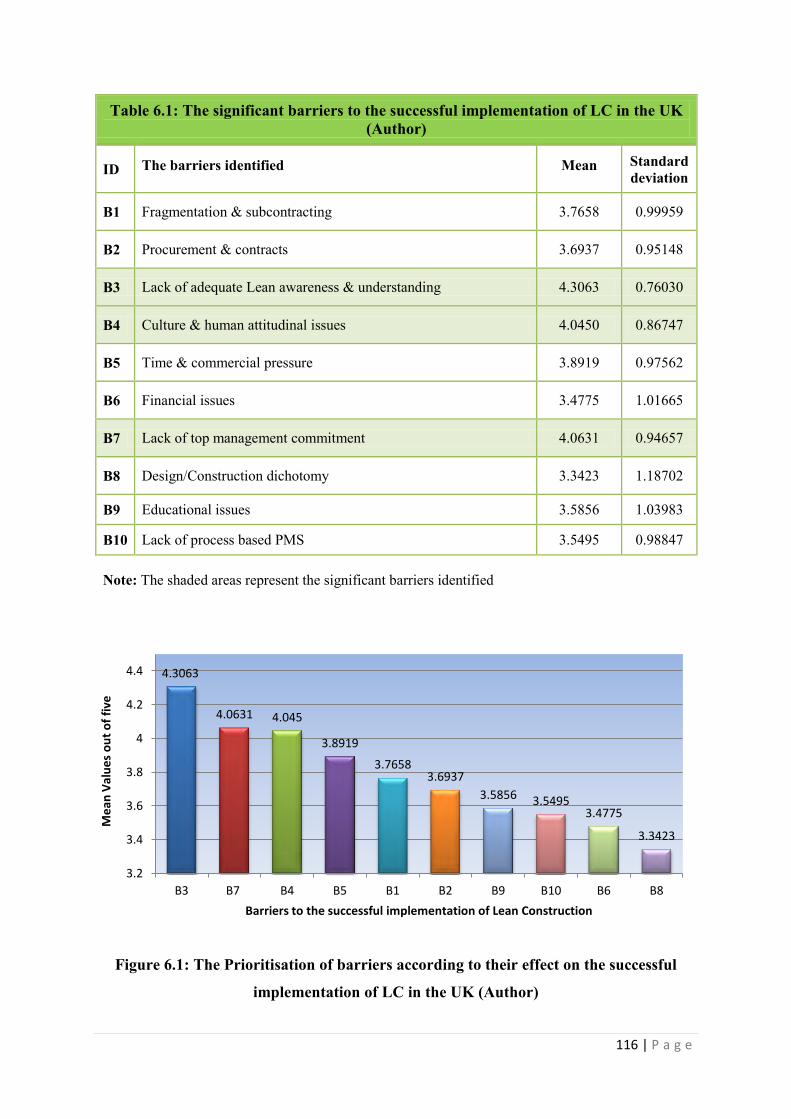
116 | P a g e
Table 6.1: The significant barriers to the successful implementation of LC in the UK (Author)
ID The barriers identified Mean Standard deviation
B1 Fragmentation & subcontracting 3.7658 0.99959
B2 Procurement & contracts 3.6937 0.95148
B3 Lack of adequate Lean awareness & understanding 4.3063 0.76030
B4 Culture & human attitudinal issues 4.0450 0.86747
B5 Time & commercial pressure 3.8919 0.97562
B6 Financial issues 3.4775 1.01665
B7 Lack of top management commitment 4.0631 0.94657
B8 Design/Construction dichotomy 3.3423 1.18702
B9 Educational issues 3.5856 1.03983
B10 Lack of process based PMS 3.5495 0.98847
Note: The shaded areas represent the significant barriers identified
Figure 6.1: The Prioritisation of barriers according to their effect on the successful
implementation of LC in the UK (Author)
4.3063
4.0631 4.045
3.8919
3.7658 3.6937
3.5856 3.5495 3.4775
3.3423
3.2
3.4
3.6
3.8
4
4.2
4.4
B3 B7 B4 B5 B1 B2 B9 B10 B6 B8
Me
an V
alu
es
ou
t o
f fi
ve
Barriers to the successful implementation of Lean Construction
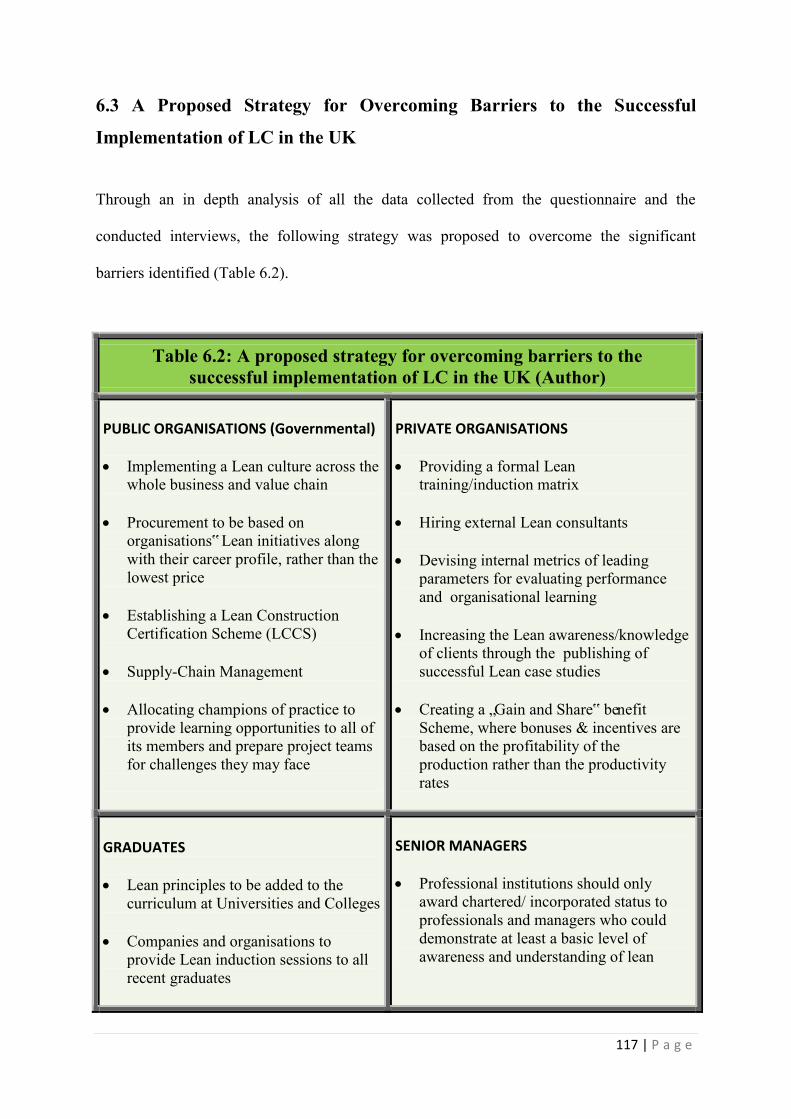
117 | P a g e
6.3 A Proposed Strategy for Overcoming Barriers to the Successful
Implementation of LC in the UK
Through an in depth analysis of all the data collected from the questionnaire and the
conducted interviews, the following strategy was proposed to overcome the significant
barriers identified (Table 6.2).
Table 6.2: A proposed strategy for overcoming barriers to the successful implementation of LC in the UK (Author)
PUBLIC ORGANISATIONS (Governmental)
Implementing a Lean culture across the whole business and value chain
Procurement to be based on organisations‟ Lean initiatives along with their career profile, rather than the lowest price
Establishing a Lean Construction
Certification Scheme (LCCS)
Supply-Chain Management
Allocating champions of practice to provide learning opportunities to all of its members and prepare project teams for challenges they may face
PRIVATE ORGANISATIONS
Providing a formal Lean training/induction matrix
Hiring external Lean consultants
Devising internal metrics of leading
parameters for evaluating performance and organisational learning
Increasing the Lean awareness/knowledge
of clients through the publishing of successful Lean case studies
Creating a „Gain and Share‟ benefit
Scheme, where bonuses & incentives are based on the profitability of the production rather than the productivity rates
GRADUATES
Lean principles to be added to the curriculum at Universities and Colleges
Companies and organisations to provide Lean induction sessions to all recent graduates
SENIOR MANAGERS
Professional institutions should only award chartered/ incorporated status to professionals and managers who could demonstrate at least a basic level of awareness and understanding of lean
118 | P a g e
6.4 Recommendations
Below are the author‟s recommendations for further studies:
Implementing the proposed strategy and evaluating its effectiveness;
Using the modified conceptual framework for future research, as it has a balance between
the soft and hard aspects of lean;
Using the same questionnaire for conducting similar studies in different countries. By
comparing the results obtained from different countries, it could be a good practice of
international benchmarking; as it would help to identify the strengths and weaknesses of
different construction organisations;
Referring to the secondary analysis, which consisted of six different classifications, and
carrying out further investigation is strongly recommended. Each classification could be
treated as a specific case study;
It appeared from the qualification sub-classification analysis, that respondents holding
NVQ and HND qualifications provided the most optimistic and consistent answers which
sometimes declined significantly as the level of education increased. Further investigation
is highly recommended;
Adding one question to the questionnaire to differentiate between respondents working on
and off site could be useful; because it would help to categorise respondents who selected
a non-applicable answer;
Carrying out more interviews, particularly face to face ones;
From the analysis of the data collected, the author suggests that the adherence of
professionals to substance thinking acts a hidden barrier to achieving progress in the
construction industry. An example of this from the findings of the survey was the over
119 | P a g e
reliance of the respondents on using results based KPIs (object metaphysics) for
performance measurement, as opposed to process performance measures (flow
metaphysics). However, further investigation is required to confirm the validity of this
suggestion.
Referring to the full transcripts of the interviews is extremely important. One of the
interviewees had a concern about the HALMAT; as it is mainly based on a qualitative
analysis rather than a quantitative one. When it comes to measuring a culture, it is
difficult to bring it into numbers (quantify it). Thus, this issue needs to be carefully
addressed. One proposed solution is that companies may have to show, from their
previous projects, what sort of cost benefits they have saved and how they achieved that.
6.5 Limitations of the Study
There are some other areas related to the soft aspects of lean, present in Terry & Smith
(2011), which the author could not cover in his study due to time constraints and the size
of the questionnaire. These areas include: understanding key processes, benefits tracking
& management, role of champions, etc.
Time limitations- the author did not have a chance to discuss and demonstrate many other
findings from the secondary analysis due to time constraints; however investigating the
secondary analysis is highly recommended for future studies, as mentioned previously.
Also, only a limited amount of interviews were conducted, when compared to the size of
the sample, due to time limitations;
Cost limitations- the author was not able to carry out many face to face interviews, due to
the expenses of travelling.

120 | P a g e
LIST OF REFERENCES
Author (2011) 'Needing help for a better understanding of Lean Construction implementation'. [Online]. Available at: http://www.linkedin.com/groups?about=&gid=1179447&trk=anet_ug_grppro. (Accessed: 1 May 2011). Abdullah, S., Abdul-Razak, A., Abubakar, A. & Mohammad, I. S. (2009) 'Towards Producing Best Practice in the Malaysian Construction Industry: The Barriers in Implementing the Lean Construction Approach'. Faulty of Engineering and Geoinformation science, Universiti Teknologi Malaysia. Abdul-Hadi, N., Al-Sudairi, A. & Al Qahtani, S. (2005) 'Prioritizing barriers to successful business process re-engineering (BPR) efforts in Saudi Arabian construction industry'. Construction Management and Economics, 23 pp 305-315.
Ab Rahman, M. N., Shokshok, M. A. & Abd Wahab, D. (2011) 'Barriers and Benefits of Total Quality management Implementation in Libyan Manufacturing Companies'. Middle-East Journal of Scientific Research, 7 (4). pp 619-624.
Alarcón, L., Diethelm, S., Rojo, O. & Calderon, R. (2005) 'Assessing the impacts of implementing lean construction', Proceedings of the 13th Annual Conference of the IGLC. Sydney, pp. 387-393.
Alarcón, L., Grillo, A., Freire, J. & Diethelm, S. (2001) 'Learning From Collaborative Benchmarking in the Construction Industry', Proceedings of 9th International Conference of the International Group for Lean Construction. Singapore.
Alarcón, L. & Serpell, A. (1996) 'Performance Measuring, Benchmarking and Modeling of Project Performance', Proceedings of 5th International Conference of the International Group for Lean Construction. The University of Birmingham, UK.
Alarcon, L. F., Diethelm, S. & Rojo, O. (2002) 'Collaborative Implementation of Lean Planning Systems in Chilean Construction Companies', Proceedings of the 10th Annual Conference of the International Group for Lean Construction. Gramado, Brazil, 6 - 8 August 2002.
Alarcon, L. F. & Serpell, A. (1996) 'Performance measuring benchmarking, and modelling of project performance', Proceedings IGLC-5. The University of Birmingham, UK.
Alinaitwe, H. M. (2009) 'Prioritizing Lean Construction Barriers in Uganda’s Construction Industry'. Journal of Construction in Developing Countries, 14 (1). pp 15-30.
Alves, T. & Tsao, C. (2007) 'Lean Construction – 2000 to 2006'. Lean Construction Journal, 3 (1). pp 46-70.
121 | P a g e
Ansell, M., Holmes, M., Evans, R., Pasquire, C. & Price, A. (2007) 'Lean Construction Trial on a Highways Maintenance Project', Proceedings IGLC-15. Michigan, USA July 2007.
Ballard, G. (2000) The Last Planner System of Production Control. Degree of Doctor of Philosophy. The University of Birmingham.
Ballard, G. & Howell, G. (1998) 'Implementing Lean Construction: Understanding and Action'. Proceedings of the 6th Annual Meeting of the International Group for Lean Construction. Guarujá, Brazil.
Banwell, H. (1964) Report of the Committee on the Placing and Management of Contracts for Building and Civil Engineering Work. HMSO.
Barribeau, P., Butler, B., Corney, J., Doney, M., Gault, J., Gordon, J., Fetzer, R., Klein, A., Rogers, C. A., Stein, I. F., Steiner, C., Urschel, H., Waggoner, T. & Palmquist, M. (2005) 'Survey Research. Writing@CSU'. Colorado State University Department of English. [Online]. Available at: http://writing.colostate.edu/guides/research/survey/ (Accessed: 15 August 2011). Bashir, M. A., Suresh, S., Proverbs, D. G. & Gameson, R. (2010) Barriers towards the sustainable implementation of lean construction in the United Kingdom. Part of an ongoing doctoral study. University of Wolverhampton.
Berry, J. (2005) 'Quantitative Methods in Education Research'. Centre for Teaching Mathematics, University of Plymouth. [Online]. Available at: http://www.edu.plymouth.ac.uk/resined/Quantitative/quanthme.htm (Accessed: 15 August 2011). Birmingham City University (2006) 'An evaluation toolkit for e-library developments'. [Online]. Available at: http://www.evalued.bcu.ac.uk/tutorial/4c.htm (Accessed: 16 August 2011). Blockley, D. & Godfrey, P. (2000) Doing it differently: systems for rethinking construction. London: Thomas Telford Publishing.
BRE (2011) 'Construction Lean Improvement Programme (CLIP) - Lean Construction'. [Online]. Available at: http://www.bre.co.uk/page.jsp?id=355 (Accessed: 10 June 2011).
British Property Federation (1983) Manual of the BPF system for building design and construction. . British Property Federation, London.
Bryman, A. (2001 ) Social Research Methods. Oxford: Oxford University Press.
122 | P a g e
Bryman, A. (2004) 'Integrating Quantitative and Qualitative Research: Prospects and Limits'. [Online]. Available at: www.ccsr.ac.uk/methods/ (Accessed: 15 August 2011). Bryman, A. (2006) 'Integrating quantitative and qualitative research: How is it done?'. Qualitative Research, 6 (1). pp 97-113. Castillo, J. J. (2009) 'Non-probability Sampling'. Experiment Resources. [Online]. Available at: http://www.experiment-resources.com/non-probability-sampling.html (Accessed: 18 August 2011).
Chan, A. P. C., Chan, D.W.M., Chiang, Y.H., Tang, B.S., Chan, E.H.W. and Ho, K.S.K. (2003) 'Exploring critical success factors for partnering in construction projects'. JOURNAL OF CONSTRUCTION ENGINEERING AND MANAGEMENT, 130 (2). pp 188-198.
Cheng, M., Tsai, H. & Lai, Y. (2009) 'Construction Management Process Reengineering Performance Measurements'. Automation in Construction, 18 pp 183-193.
Common, G., Johansen, E. & Greenwood, D. (2000) 'A survey of the take up of Lean concepts among UK construction companies', Proceedings of the 8th International Group for Lean Construction Annual Conference. Brighton, United Kingdom, 2000.
Costa, D., Formoso, C., Kagioglou, M. & Alarcón, L. (2004) 'Performance Measurement Systems for Benchmarking in the Construction Industry', Proceedings of 12th International Conference of the International Group for Lean Construction. Copenhagen, Denmark.
Coughlan, M., Cronin, P. & Ryan, F. (2007) 'Step by-step guide to critiquing research. Part 1: quantitative research'. British Journal of Nursing, 16 (2). pp 658-663. Creswell, J. W. (2003) Research Design: Quantitative, Qualitative, and Mixed Methods Approaches. Thousand Oaks, USA: SAGE.
Cullen, P., Butcher, B., Hickman, R., Keast, J. & Valadez, M. (2005) 'The application of lean principles to in-service support: a comparison between construction and the aerospace and defence sections'. Lean Construction Journal, 2 (1). pp 87-104.
Denscombe, M. (2007) The good research guide for small-scale social research projects. Third edn. Berkshire, England: Open University Press, McGraw-Hill. Dulaimi, M. & Tanamas, C. (2001) 'The Principles and Applications of Lean Construction in Singapore', Proceedings of the 9th Annual Conference of the International Group for Lean Construction. Kent Ridge Crescent, Singapore.
Dunsmuir, A. & Williams, L. (1992) How To Do Social Research (Sociology in action series). London: Collins Educational.
123 | P a g e
Egan, J. (1998) Rethinking Construction: Report of the Construction Task Force. London: HMSO.
Emmerson, H. (1962) Survey of Problems Before the Construction Industries. HMSO.
Eriksson, P. E. (2009) 'A Case Study of Partnering in Lean Construction'. The 5th Nordic Conference on Construction Economics and Organisation. Reykjavík University, Iceland. Fellows, R. & Liu, A. (2008) Research Methods for Construction. Third edn. Oxford: WILEY-BLACKWELL. Forbes, L. H. & Ahmed, S. M. (2011) Modern Construction: Lean Project Delivery and Integrated Practices. London: CRC Press.
Forbes, L. H., Ahmed, S. M. & Barcala, M. (2002) 'Adapting Lean Construction Theory for Practical Application in Developing Countries', Proceedings of the first CIB W107 International Conference: Creating a Sustainable Construction Industry in Developing Countries. Stellenbosch, South Africa 11-13 November.
Forgues, D. & Koskela, L. (2009) 'The influence of a collaborative procurement approach using integrated design in construction on project team performance'. International Journal of Managing Projects in Business, 2 (3). pp 370-385.
Fraser, N. & Kelly, R. (2011) 'Applying a balanced score card approach to waste reduction KPIs in Lean construction'. [Online]. Available at: www.ciria.org (Accessed: July 2011). Garnett, N., Jones, D. T. & Murray, S. (1998) 'Strategic Application of Lean Thinking', Proceedings IGLC 98. Guaruja, Brazil.
Garnett, N. A. (1999) 'Developing lean thinking in construction: a naturalistic enquiry', Proceedings IGLC-7. University of California , Berkeley, CA, USA.
Green, S. & May, S. (2005) 'Lean construction: arenas of enactment, models of diffusion and the meaning of ‘leanness’'. Building Research & Information, 33 (6). pp 498-511.
Green, S. D. (1999a) 'The Dark Side of Lean Construction: Exploitation and Ideology', Tommelein, I.D. (ed. Proceedings of the 7th Conference of the International Group for Lean Construction (IGLC-7). University of California, Berkeley, USA.
Green, S. D. (1999b) 'The missing arguments of Lean Construction'. Construction Management & Economics, 17 pp 133-137.
124 | P a g e
Green, S. D. (2000) 'The Future of Lean Construction: A Brave New World', Proceedings for the 8th Annual Conference on Lean Construction. Brighton, UK.
Greene, J. C., Caracelli, V. J. & Graham, W. F. (1989) 'Toward a Conceptual Framework for Mixed-method Evaluation Designs'. Educational Evaluation and Policy Analysis, 11 (3). pp 255-274. HA (2009a) 'What is Lean?'. [Online]. Available at: http://www.highways.gov.uk/business/31319.aspx (Accessed: 15 June 2011).
HA (2009b) 'Lean in the Highway Agency'. [Online]. Available at: http://www.highways.gov.uk/business/31320.aspx (Accessed: 15 June 2011).
Henrich, G., Abbott, C. & Koskela, L. (2006) 'Drivers for Innovation in Production Management', Proceedings of the 14th Conference of the IGLC. Santiago, Chilie.
Hines, P., Found, P., Griffiths, G. & Harrison, R. (2011) Staying Lean: Thriving, Not Just Surviving. Lean Enterprise Research Centre, Cardiff University. [Online]. Available at: www.leanenterprise.org.uk (Accessed: 27 August 2011).
Hoare, D. J. & Broome, J. C. (2001) 'Bills of Quantities Versus Activity Schedules for Civil Engineering Projects'. Journal of Construction Procurement, 7 (1). pp 11-26.
Howell, G. & Ballard, G. (1994) 'Lean production theory: Moving beyond “Can-Do”'. Proceedings of the 2nd Annual Conference of the International Group for Lean Construction. Santiago, Chile, pp 17-24.
Howell, G. A. (1999) 'WHAT IS LEAN CONSTRUCTION?'. Seventh Annual Conference of the International Group for Lean Construction (IGLC-7). Berkeley, California.
Howell, G. A. & Ballard, G. (1999) 'Bringing light to the dark side of lean construction: A response to Stuart Green', Proceedings IGLC-7.
ICE (1998) The Engineering and Construction Contract: An NEC Document. 2nd edn. London: Thomas Telford.
Institute of Lifelong Learning (2009) Module 9: Research & Managing Information. University of Lecister. [Online]. Available at: http://www2.le.ac.uk/projects/oer/oers/lill/module-9-research-managing-information (Accessed: 16 August 2011). Johansen, E., Glimmerveen, H. & Vrijhoef, R. (2002) 'Understanding Lean Construction and how it penetrates the industry: A comparison of the dissemination of lean within the UK and the
125 | P a g e
Netherlands', Proceedings of 10th Annual Conference of the International Group for Lean Construction. Brazil 6-8 August.
Johansen, E. & Porter, G. (2003a) 'An experience of introducing last planner into a UK construction project', Proceedings of the 10th annual conference of the international group for lean construction Virginia, USA, pp. 22-24 July.
Johansen, E. & Porter, G. (2003b) 'An experience of introducing last planner into a UK construction project'. The 11th annual conference of the International Group for Lean Construction. Blacksburg, Virginia, USA 22-24 July. Johansen, E., Porter, G. & Greenwood, D. (2004) 'Implementing lean: UK culture and systems change'. The 12th Annual Conference of the International Group for Lean Construction. Helsingor, Denmark: 3-6 August.
Johansen, E. & Walter, L. (2007) 'Lean construction: Prospects for the German construction industry'. Lean Construction Journal, 3 (1). pp 19-32.
Jørgensen, B. & Emmitt, S. (2008) 'Lost in transition: the transfer of lean manufacturing to construction'. Engineering, Construction and Architectural Management, 15 (4). pp 383 - 398.
Jørgensen, B., Emmitt, S. & Bonke, S. (2004) 'Revealing Cultures and Sub-Cultures During The Implementation of Lean Construction', Proceedings of 12th Annual Conference on Lean Construction. Helsingør, Denmark.
Kanbur, R. (ed.) (2003) Q-Squared: Qualitative and quantitative methods of poverty appraisal. Delhi: Permanent Black. Kemmer, S. L., Heineck, L. F. M. & Alves, T. C. L. (2008) 'Using the Line of Balance for Production System Design', Proceedings of the 16th Annual Conference of the International Group for Lean Construction. Manchester, UK.
Koskela, L. (1992) 'Application of the new production philosophy to construction'. [Technical Report No. 72] CIFE, Stanford University.
Koskela, L. (2000) An Exploration towards a Production Theory and its Application to Construction. Degree of Doctor of Technology. Helsinki University of Technology
Kothari, C. R. (2009) Research methodology: methods and techniques. 2nd revised edn. New Delhi: New Age International Publishers.
126 | P a g e
Lam, E., Chan, A. & Chan, D. (2007) 'Benchmarking the performance of design-build projects: Development of project success index'. Benchmarking: An Internation Journal, 14 (5). pp 624-635.
Lancaster, G., Dodd, S. & Williamson, P. (2004) 'Design and analysis of pilot studies: recommendations for good practice'. Journal of Evaluation in Clinical Practice, 10 (2). pp 307-312.
Lantelme, E. M. V. & Formoso, C. T. (2000) 'Improving Performance through Measurement: The Application of Lean Production and Organisational Learning Principles', Proceedings of 8th International Conference of the International Group for Lean Construction. University of Sussex, Brighton.
Latham, M. (1994) Constructing the team. London: HMSO. Lehman, T. & Reiser, P. (2004) 'Maximising Value and Minimising Waste: Value Engineering & Lean Construction'. [Online]. Available at: http://www.value-eng.org/knowledge_bank/attachments/200432.pdf (Accessed: 30th May 2011).
Leong, M. S. & Tilley, P. (2008) 'A Lean Strategy to Performance Measurement - Reducing Waste by Measuring 'Next' Customer Needs', Proceedings of 16th International Conference of the International Group for Lean Construction. Manchester, UK.
Liu, A. M. M. & Walker, A. (1998) 'Evaluation of project outcomes'. Construction Management & Economics, 16 pp 209-219.
Love, P. E. D., Edawards, D. J., Han, S. & Goh, Y. M. (2011) 'Design error reduction: toward the effective utilization of building information modeling'. Research in Engineering Design, 22 (3). pp 173-187.
Mitropoulos, P. & Howell, G. (2001) 'Performance Improvement Programs and Lean Construction', 9th International Group for Lean Construction Conference. Singapore.
Moon, H., Yu, J. & Kim, C. (2007) 'Performance Indicators Based on TFV Theory', Proceedings of 15th International Conference of the International Group for Lean Construction. Michigan, USA.
Mossman, A. (2009) 'Creating value: a sufficient way to eliminate waste in lean design and lean production'. Lean Construction Journal, 2009 pp 13-23.
Mossman, A. (2009) 'What is integrated project delivery?'. [Online]. Available at: http://www.thechangebusiness.co.uk (Accessed: 20 June 2011).
Mossman, A. (2009) 'Why Isn't The UK Construction Industry Going Lean With Gusto?'. Lean Construction Journal, 5 (1). pp 24-36.

127 | P a g e
Muijs, D. (2004) Doing Quantitative Research in Education with SPSS. London: SAGE Publications Ltd.
Neely, A., Mills, J., Platts, K., Gregory, M. & Richards, H. (1996) 'Performance measurement system design: Should process based approaches be adopted?'. Int. J. Production Economics, 46-47 pp 423-431.
Nudurupati, S., Arshad, T. & Turner, T. (2007) 'Performance measurement in the construction industry: An action case investigating manufacturing methodologies'. Computers in Industry, 58 pp 667-676.
Olatunji, J. (2008) 'Lean-in-Nigerian Construction: State, Barriers, Strategies and “Goto-gemba” Approach', Proceedings 16th Annual Conference of the International Group for Lean Construction. Manchester, UK.
Pettigrew, A. (1990) 'Longitudinal Field Research on Change: Theory and Practice'. Organization Science, 1 (3). pp 267-292. Potts, K. (2008) 'Case study: Heathrow Terminal 5'. Construction Cost Management: Learning from case studies. New York: Taylor & Francis.
Pratt, N. (2011) 'Beginning Research: Ethical Implications'. [Online]. Available at: http://www.edu.plymouth.ac.uk/resined/beginning/begresed.htm (Accessed: 01 May 2011).
Rooke, J., Seymour, D. & Fellows, R. (2003) 'The Claims Culture; A Taxonomy of Attitudes in the Industry'. Construction Management and Economics, 21 (2). pp 167-174.
Rooke, J., Seymour, D. & Fellows, R. (2004) 'Planning for Claims; An Ethnography of Industry Culture'. Construction Management and Economics, 22 (6). pp 655-662.
Rooke, J. A., Koskela, L. & Seymour, D. (2007a) 'Producing things or production Flows? Ontological assumptions in the thinking of managers and professionals in construction'. Construction Management & Economics, 25, pp 1077-1085. Rooke, J. A., Koskela, L. & Seymour, D. (2007b) 'Producing things or production flows? Ontological assumptions in the thinking of managers and professionals in construction'. Construction Management and Economics, 25 (10). pp 1077-1085.
Salem, M., Solomon, J., Genaidy, A. & Minkarah, I. (2006) 'Lean Construction: From Theory to Implementation'. Journal of Management in Engineering, 22 (4). pp 168-175.
Santorella, G. (2011) Lean Culture for the Construction Industry. New York: Taylor & Francis Group.
128 | P a g e
Senaratne, S. & Wijesiri, D. (2008) 'Lean Construction as a Strategic Option: Testing its Suitability and Acceptability in Sri Lanka'. Lean Construction Journal, pp 34-48.
Seymour, D. (1998) 'Getting UK Construction People to Think Lean - Where to start? A Case Study'. International Group for Lean Construction. Guaraja, Brazil.
Seymour, D. & Rooke, J. (2000) 'Commitment Planning and Reasons Analysis', Proceedings of the 8th Annual Conference of the International Group for Lean Construction. University of Sussex, Brighton.
Shammas-Toma, M., Seymour, D. & Clark, L. (1998) 'Obstacles to implementing total quality management in the UK construction industry'. Construction Management & Economics, 16 pp 177-192.
Sikka, S., Dawood, N., Marasini, R. & Dean, J. (2006) 'Identification and development of key performance indicators to establish the value of 4D planning'. ARCOM Doctoral Workshop on Emerging Technologies in Construction. School of the Built Environment, University of Salford: 10 November, 2006.
Simon, E. (1944) Report of the Council for Works and Buildings: The Placing and Management of Building Contracts. HMSO.
Suwignjo, P., Bititci, U. S. & Carrie, A. S. (2000) 'Qunatitive models for performance measurement system'. Int. J. Production Economics, 64 pp 231-241.
Swain, B. & Mossman, A. (2003) 'Smooth and Lean - Hathaway Roofing Case'. Quality World, 29 (3). pp 27-30.
Takim, R. & Akintoye, A. (2002) 'performance indicators for successful construction project performance'. 18th Annual ARCOM Conference. University of Northumbria: 2-4 September 2002, pp 545-555.
Terry, A. & Smith, S. (2011) Build Lean. Transforming construction using Lean Thinking. London: CIRIA.
The KPI Working Group (2000) 'KPI Report for the Minister for Construction'. [Online]. Available at: www.bis.gov.uk/files/file16441.pdf (Accessed: 15 July 2011).
Thomas, J. R., Nelson, J. & Silverman, S. (2005) Research Methods in Physical Activity. 5th edn. London: Human Kinetics Europe.
129 | P a g e
Thomas, G. & Thomas, M. (2005) 'Communication'. Construction Partnering & Integrated Team Working. Oxford: Blackwell Publishing.
Tommelein, I. D. (1998) 'Pull-Driven Scheduling For Pipe-Spool Installation: Simulation of a Lean Construction Technque'. ASCE Journal of Construction Engineering and Management, 124 (4). pp 279-288.
Trochim, W. M. K. (2006a) 'Sampling'. Research Methods Knowledge Base. [Online]. Available at: http://www.socialresearchmethods.net/kb/sampling.php (Accessed: 17 August 2011). Trochim, W. M. K. (2006b) 'Analysis'. Research Methods Knowledge Base. [Online]. Available at: http://www.socialresearchmethods.net/kb/analysis.php (Accessed: 20 August 2011). White, T. (2006) 'Principles of Good Research & Research Proposal Guide'. [Online]. Available at: http://www.richmond.gov.uk/research_proposal_guide.pdf (Accessed: 16 August 2011). Womack, J. P. & Jones, D. T. (1996) Lean Thinking: banish waste and create wealth in your corporation. New York: Simon & Schuster.
Womack, J. P., Jones, D. T. & Roos, D. (1990) The Machine That Changed The World: The Story Of Lean Production. New York: 1st Harper Perennial Ed.
Yang, I. T. & Ioannou, P. G. (2001) 'Resource-Driven Scheduling For Repetitive Projects: A Pull-System Approach', Proceedings of the 9th Annual Conference of the International Group for Lean Construction. National Singapore University, Singapore. Aug 4-6.
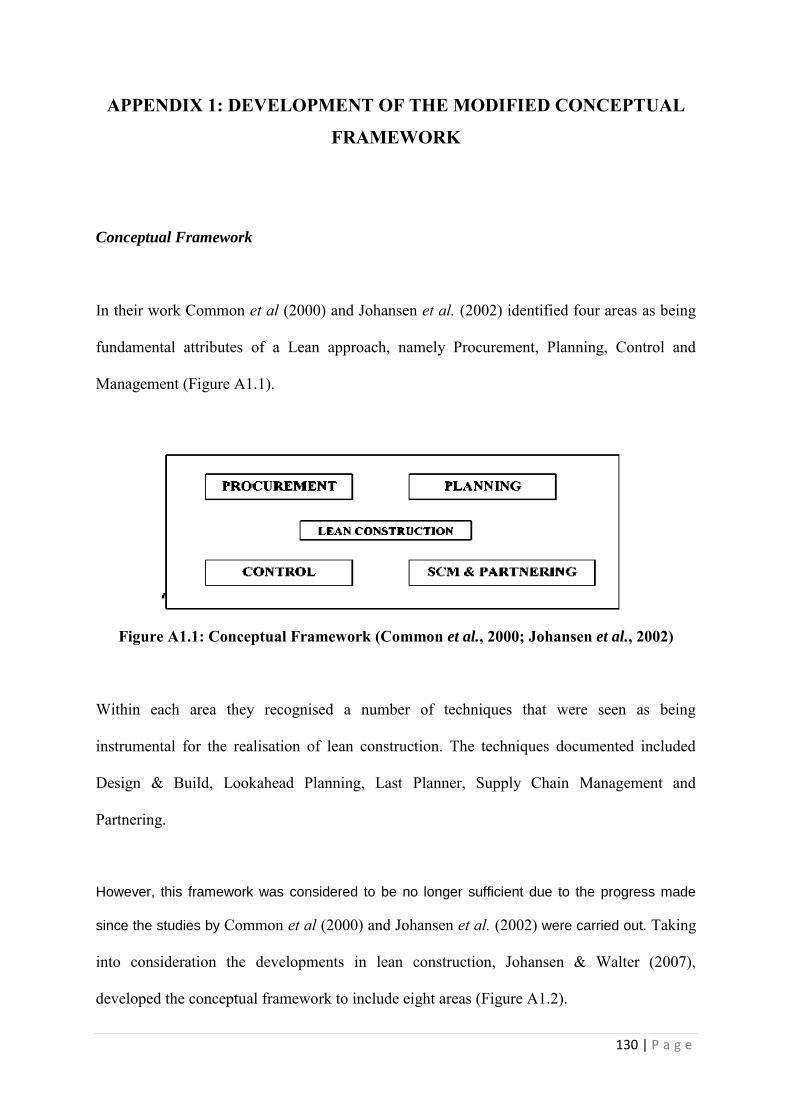
130 | P a g e
APPENDIX 1: DEVELOPMENT OF THE MODIFIED CONCEPTUAL
FRAMEWORK
Conceptual Framework
In their work Common et al (2000) and Johansen et al. (2002) identified four areas as being
fundamental attributes of a Lean approach, namely Procurement, Planning, Control and
Management (Figure A1.1).
Figure A1.1: Conceptual Framework (Common et al., 2000; Johansen et al., 2002)
Within each area they recognised a number of techniques that were seen as being
instrumental for the realisation of lean construction. The techniques documented included
Design & Build, Lookahead Planning, Last Planner, Supply Chain Management and
Partnering.
However, this framework was considered to be no longer sufficient due to the progress made
since the studies by Common et al (2000) and Johansen et al. (2002) were carried out. Taking
into consideration the developments in lean construction, Johansen & Walter (2007),
developed the conceptual framework to include eight areas (Figure A1.2).
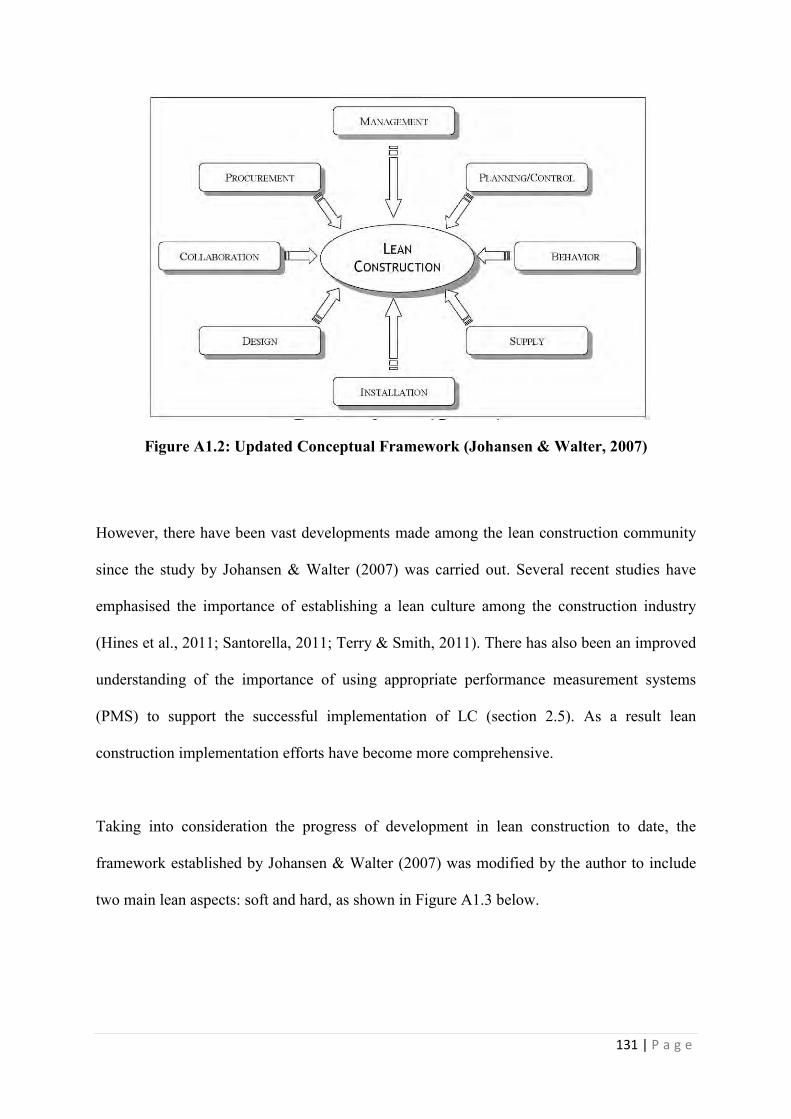
131 | P a g e
Figure A1.2: Updated Conceptual Framework (Johansen & Walter, 2007)
However, there have been vast developments made among the lean construction community
since the study by Johansen & Walter (2007) was carried out. Several recent studies have
emphasised the importance of establishing a lean culture among the construction industry
(Hines et al., 2011; Santorella, 2011; Terry & Smith, 2011). There has also been an improved
understanding of the importance of using appropriate performance measurement systems
(PMS) to support the successful implementation of LC (section 2.5). As a result lean
construction implementation efforts have become more comprehensive.
Taking into consideration the progress of development in lean construction to date, the
framework established by Johansen & Walter (2007) was modified by the author to include
two main lean aspects: soft and hard, as shown in Figure A1.3 below.
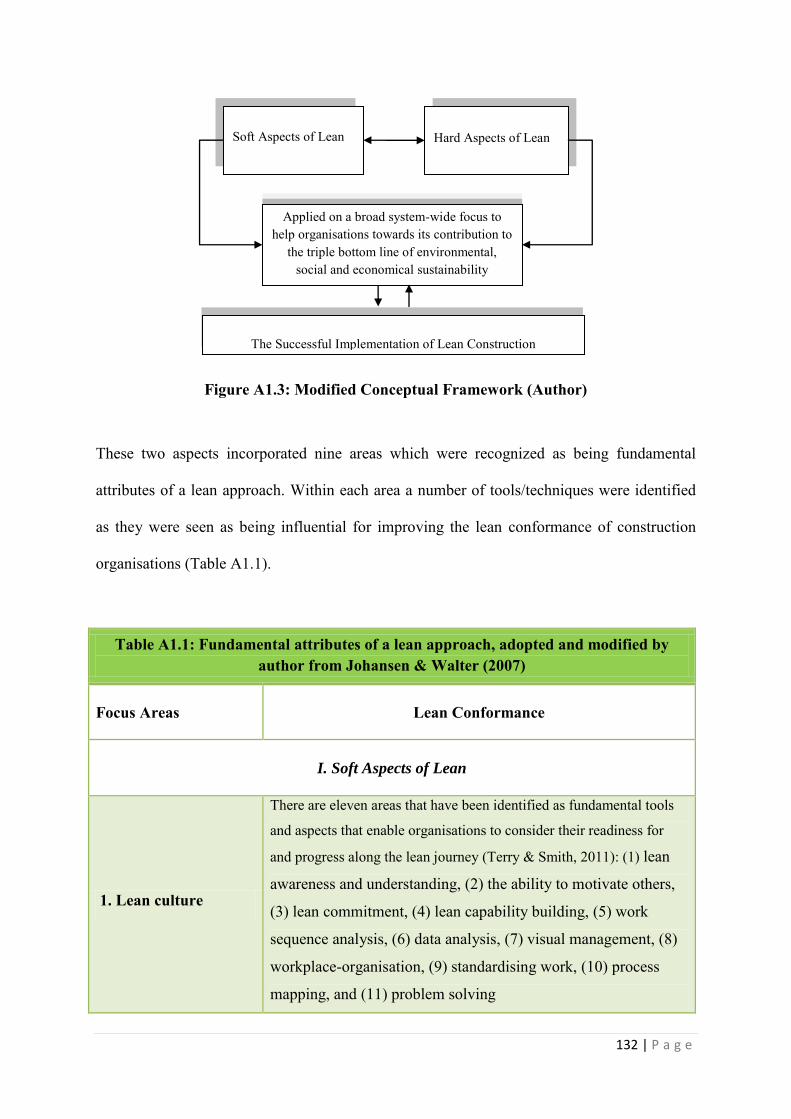
132 | P a g e
Figure A1.3: Modified Conceptual Framework (Author)
These two aspects incorporated nine areas which were recognized as being fundamental
attributes of a lean approach. Within each area a number of tools/techniques were identified
as they were seen as being influential for improving the lean conformance of construction
organisations (Table A1.1).
Table A1.1: Fundamental attributes of a lean approach, adopted and modified by author from Johansen & Walter (2007)
Focus Areas Lean Conformance
I. Soft Aspects of Lean
1. Lean culture
There are eleven areas that have been identified as fundamental tools
and aspects that enable organisations to consider their readiness for
and progress along the lean journey (Terry & Smith, 2011): (1) lean
awareness and understanding, (2) the ability to motivate others,
(3) lean commitment, (4) lean capability building, (5) work
sequence analysis, (6) data analysis, (7) visual management, (8)
workplace-organisation, (9) standardising work, (10) process
mapping, and (11) problem solving
Hard Aspects of Lean
Applied on a broad system-wide focus to help organisations towards its contribution to
the triple bottom line of environmental, social and economical sustainability
Soft Aspects of Lean
The Successful Implementation of Lean Construction
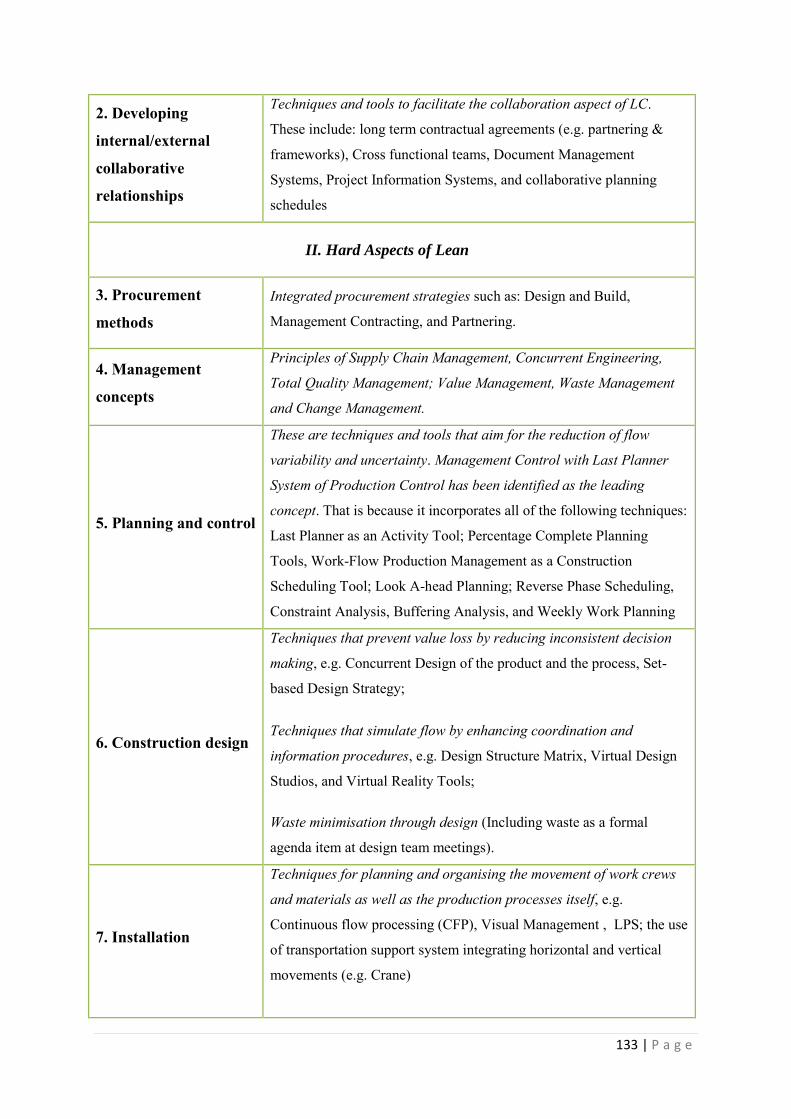
133 | P a g e
2. Developing
internal/external
collaborative
relationships
Techniques and tools to facilitate the collaboration aspect of LC.
These include: long term contractual agreements (e.g. partnering &
frameworks), Cross functional teams, Document Management
Systems, Project Information Systems, and collaborative planning
schedules
II. Hard Aspects of Lean
3. Procurement
methods
Integrated procurement strategies such as: Design and Build,
Management Contracting, and Partnering.
4. Management
concepts
Principles of Supply Chain Management, Concurrent Engineering,
Total Quality Management; Value Management, Waste Management
and Change Management.
5. Planning and control
These are techniques and tools that aim for the reduction of flow
variability and uncertainty. Management Control with Last Planner
System of Production Control has been identified as the leading
concept. That is because it incorporates all of the following techniques:
Last Planner as an Activity Tool; Percentage Complete Planning
Tools, Work-Flow Production Management as a Construction
Scheduling Tool; Look A-head Planning; Reverse Phase Scheduling,
Constraint Analysis, Buffering Analysis, and Weekly Work Planning
6. Construction design
Techniques that prevent value loss by reducing inconsistent decision
making, e.g. Concurrent Design of the product and the process, Set-
based Design Strategy;
Techniques that simulate flow by enhancing coordination and
information procedures, e.g. Design Structure Matrix, Virtual Design
Studios, and Virtual Reality Tools;
Waste minimisation through design (Including waste as a formal
agenda item at design team meetings).
7. Installation
Techniques for planning and organising the movement of work crews
and materials as well as the production processes itself, e.g.
Continuous flow processing (CFP), Visual Management , LPS; the use
of transportation support system integrating horizontal and vertical
movements (e.g. Crane)
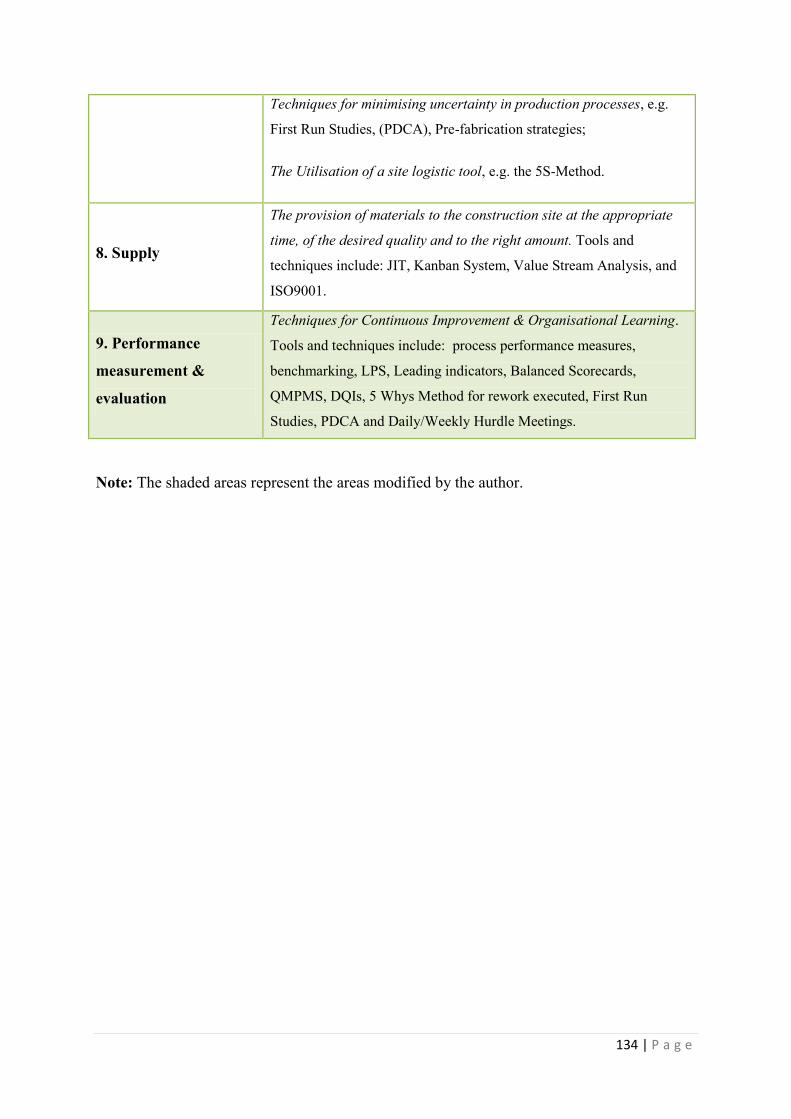
134 | P a g e
Techniques for minimising uncertainty in production processes, e.g.
First Run Studies, (PDCA), Pre-fabrication strategies;
The Utilisation of a site logistic tool, e.g. the 5S-Method.
8. Supply
The provision of materials to the construction site at the appropriate
time, of the desired quality and to the right amount. Tools and
techniques include: JIT, Kanban System, Value Stream Analysis, and
ISO9001.
9. Performance
measurement &
evaluation
Techniques for Continuous Improvement & Organisational Learning.
Tools and techniques include: process performance measures,
benchmarking, LPS, Leading indicators, Balanced Scorecards,
QMPMS, DQIs, 5 Whys Method for rework executed, First Run
Studies, PDCA and Daily/Weekly Hurdle Meetings.
Note: The shaded areas represent the areas modified by the author.
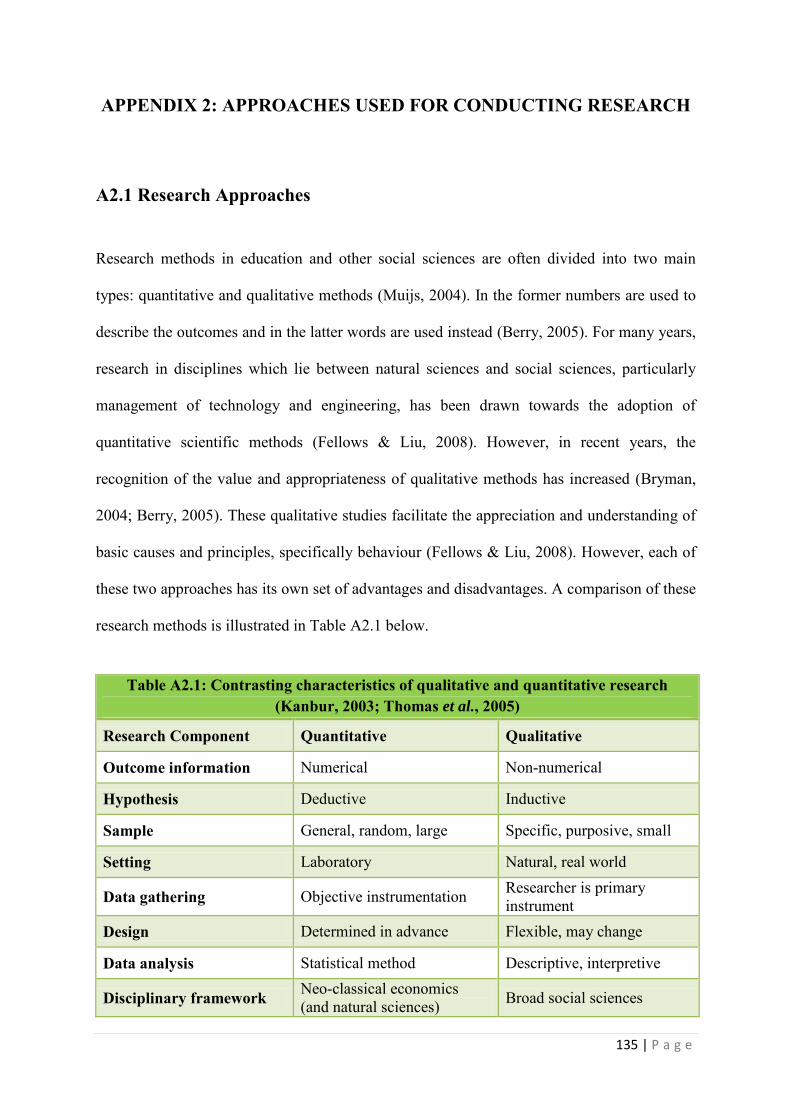
135 | P a g e
APPENDIX 2: APPROACHES USED FOR CONDUCTING RESEARCH
A2.1 Research Approaches
Research methods in education and other social sciences are often divided into two main
types: quantitative and qualitative methods (Muijs, 2004). In the former numbers are used to
describe the outcomes and in the latter words are used instead (Berry, 2005). For many years,
research in disciplines which lie between natural sciences and social sciences, particularly
management of technology and engineering, has been drawn towards the adoption of
quantitative scientific methods (Fellows & Liu, 2008). However, in recent years, the
recognition of the value and appropriateness of qualitative methods has increased (Bryman,
2004; Berry, 2005). These qualitative studies facilitate the appreciation and understanding of
basic causes and principles, specifically behaviour (Fellows & Liu, 2008). However, each of
these two approaches has its own set of advantages and disadvantages. A comparison of these
research methods is illustrated in Table A2.1 below.
Table A2.1: Contrasting characteristics of qualitative and quantitative research
(Kanbur, 2003; Thomas et al., 2005)
Research Component Quantitative Qualitative
Outcome information Numerical Non-numerical
Hypothesis Deductive Inductive
Sample General, random, large Specific, purposive, small
Setting Laboratory Natural, real world
Data gathering Objective instrumentation Researcher is primary instrument
Design Determined in advance Flexible, may change
Data analysis Statistical method Descriptive, interpretive
Disciplinary framework Neo-classical economics (and natural sciences) Broad social sciences
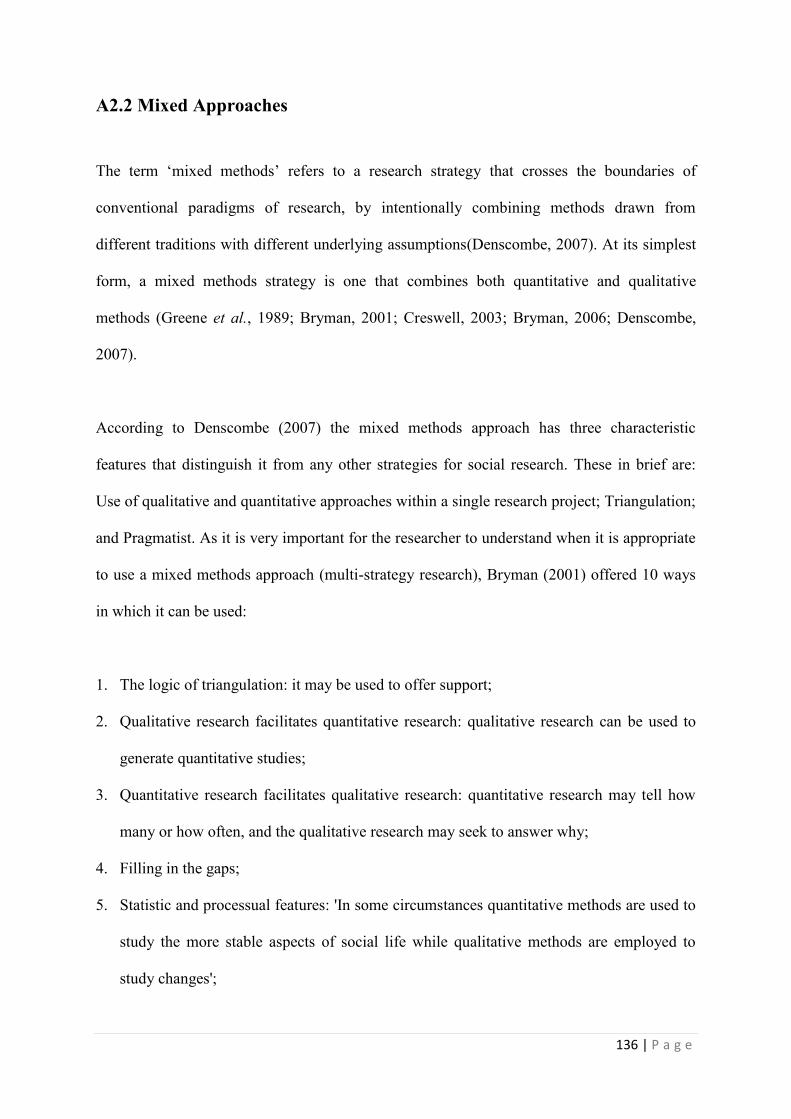
136 | P a g e
A2.2 Mixed Approaches
The term ‘mixed methods’ refers to a research strategy that crosses the boundaries of
conventional paradigms of research, by intentionally combining methods drawn from
different traditions with different underlying assumptions(Denscombe, 2007). At its simplest
form, a mixed methods strategy is one that combines both quantitative and qualitative
methods (Greene et al., 1989; Bryman, 2001; Creswell, 2003; Bryman, 2006; Denscombe,
2007).
According to Denscombe (2007) the mixed methods approach has three characteristic
features that distinguish it from any other strategies for social research. These in brief are:
Use of qualitative and quantitative approaches within a single research project; Triangulation;
and Pragmatist. As it is very important for the researcher to understand when it is appropriate
to use a mixed methods approach (multi-strategy research), Bryman (2001) offered 10 ways
in which it can be used:
1. The logic of triangulation: it may be used to offer support;
2. Qualitative research facilitates quantitative research: qualitative research can be used to
generate quantitative studies;
3. Quantitative research facilitates qualitative research: quantitative research may tell how
many or how often, and the qualitative research may seek to answer why;
4. Filling in the gaps;
5. Statistic and processual features: 'In some circumstances quantitative methods are used to
study the more stable aspects of social life while qualitative methods are employed to
study changes';
137 | P a g e
6. Researchers' and participants' perspectives: qualitative data may give a view to the
perspectives of the people, while the quantitative information may tell researcher what
they are trying to find;
7. The problem of generality: a small sample may be used for the qualitative element, while
the quantitative element may be used to include a wider sample, therefore increasing the
generality of the findings;
8. Qualitative research facilitating the interpretations of the relationship between the
variables: i.e. quantitative research may identify patterns, while qualitative research can
offer to explain the patterns;
9. Solving a puzzle: i.e. if the results of a research do not make sense and there is a need to
clarify what has been found.
10. Studying different aspects of a phenomenon: i.e. quantitative methods might help one
research what people thought of religion and qualitative research might research how
religious beliefs and rituals affected behaviour;
Alternatively, there are some limitations and disadvantages associated with the use of mixed
methods. For instance, if the rationale for combining quantitative and qualitative research is
not made explicit, it becomes difficult for the reader to judge what has been gained by
employing both approaches (Bryman, 2004). Also, observation or results gained from
different approaches could be time consuming or misfit and difficult to integrate
(Denscombe, 2007).

138 | P a g e
A2.3 Data Sources for Research
Researchers need to consider the sources of information on which to conduct, support and
confirm their research and findings. There are two main categories of sources: primary
sources and secondary sources. Researchers should always consider secondary research
options first with careful consideration to its reliability and validity. Similarly, when choosing
and developing primary sources, researchers must consider the most appropriate method to
include its reliability, validity and practicality (Institute of Lifelong Learning, 2009). A
comparison of these two data sources is shown in Table A2.2.
Table A2.2: Comparison between Primary and Secondary Research (Dunsmuir & Williams, 1992)
Category Primary Sources Secondary sources
Definition Data collected by the researcher
themselves (considered first hand
information)
Data that already exists (considered
second hand sources of data)
Examples Questionnaires, interviews, case
studies, action research, and
observations
Previous research, official statistics,
government reports, historical data,
and web information
Benefits
Original data;
Addresses specific research issues
as the researcher controls the
search design to fit their needs.
i.e. the researcher can decide on
such requirements as size of
project, funds, time frame,
location of research and the way
data is collected
Cheap and accessible - especially
a University Library;
May be useful for putting the
research into context;
Often the only resource, for
example historical documents;
Can be used to set the scene of the
research and its findings.
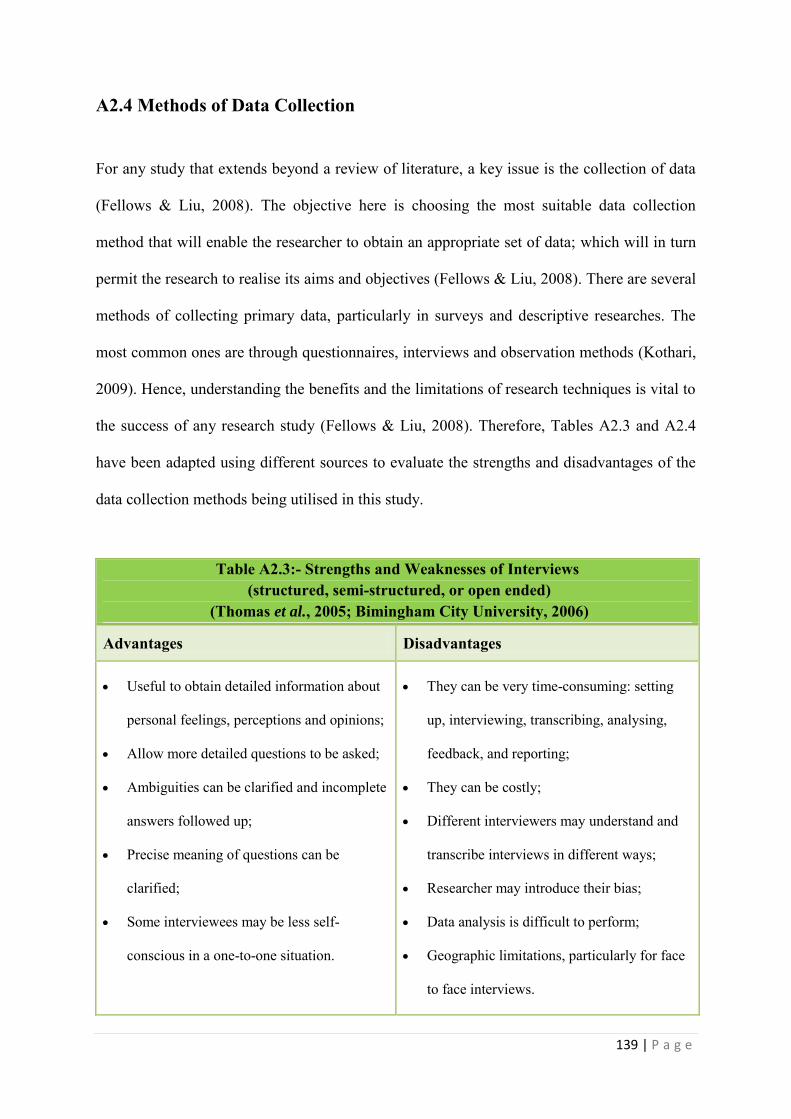
139 | P a g e
A2.4 Methods of Data Collection
For any study that extends beyond a review of literature, a key issue is the collection of data
(Fellows & Liu, 2008). The objective here is choosing the most suitable data collection
method that will enable the researcher to obtain an appropriate set of data; which will in turn
permit the research to realise its aims and objectives (Fellows & Liu, 2008). There are several
methods of collecting primary data, particularly in surveys and descriptive researches. The
most common ones are through questionnaires, interviews and observation methods (Kothari,
2009). Hence, understanding the benefits and the limitations of research techniques is vital to
the success of any research study (Fellows & Liu, 2008). Therefore, Tables A2.3 and A2.4
have been adapted using different sources to evaluate the strengths and disadvantages of the
data collection methods being utilised in this study.
Table A2.3:- Strengths and Weaknesses of Interviews
(structured, semi-structured, or open ended) (Thomas et al., 2005; Bimingham City University, 2006)
Advantages Disadvantages
Useful to obtain detailed information about
personal feelings, perceptions and opinions;
Allow more detailed questions to be asked;
Ambiguities can be clarified and incomplete
answers followed up;
Precise meaning of questions can be
clarified;
Some interviewees may be less self-
conscious in a one-to-one situation.
They can be very time-consuming: setting
up, interviewing, transcribing, analysing,
feedback, and reporting;
They can be costly;
Different interviewers may understand and
transcribe interviews in different ways;
Researcher may introduce their bias;
Data analysis is difficult to perform;
Geographic limitations, particularly for face
to face interviews.
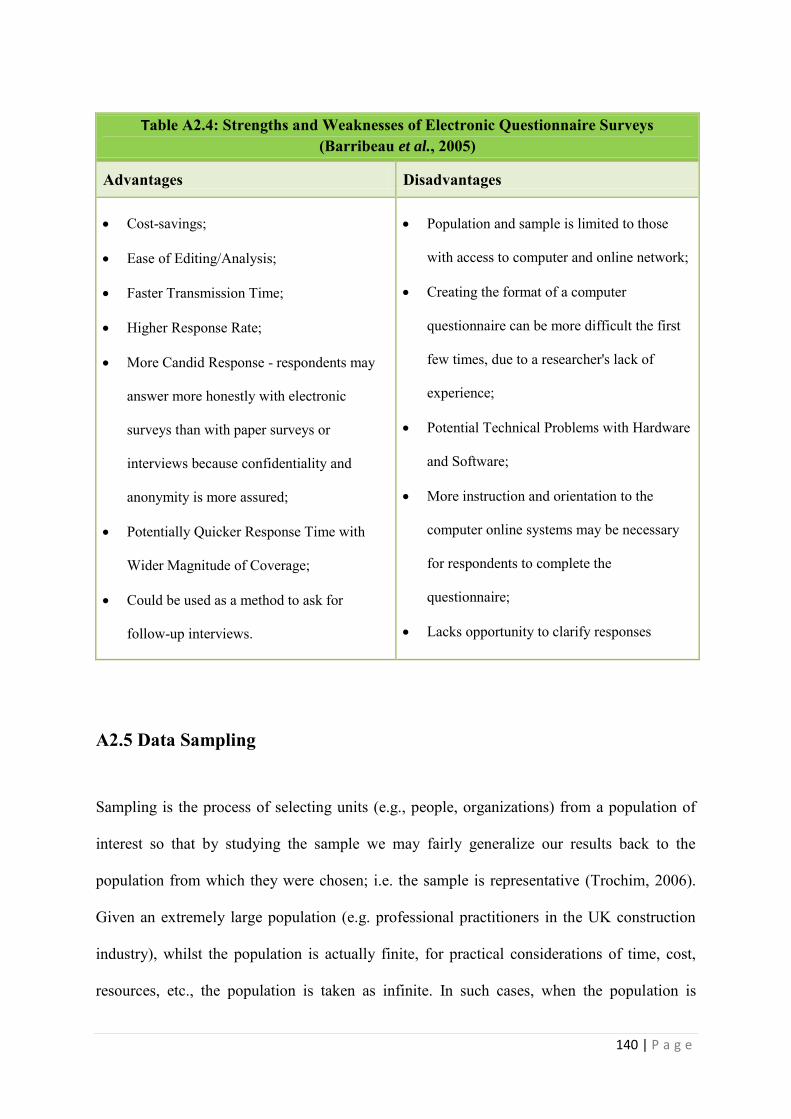
140 | P a g e
Table A2.4: Strengths and Weaknesses of Electronic Questionnaire Surveys
(Barribeau et al., 2005)
Advantages Disadvantages
Cost-savings;
Ease of Editing/Analysis;
Faster Transmission Time;
Higher Response Rate;
More Candid Response - respondents may
answer more honestly with electronic
surveys than with paper surveys or
interviews because confidentiality and
anonymity is more assured;
Potentially Quicker Response Time with
Wider Magnitude of Coverage;
Could be used as a method to ask for
follow-up interviews.
Population and sample is limited to those
with access to computer and online network;
Creating the format of a computer
questionnaire can be more difficult the first
few times, due to a researcher's lack of
experience;
Potential Technical Problems with Hardware
and Software;
More instruction and orientation to the
computer online systems may be necessary
for respondents to complete the
questionnaire;
Lacks opportunity to clarify responses
A2.5 Data Sampling
Sampling is the process of selecting units (e.g., people, organizations) from a population of
interest so that by studying the sample we may fairly generalize our results back to the
population from which they were chosen; i.e. the sample is representative (Trochim, 2006).
Given an extremely large population (e.g. professional practitioners in the UK construction
industry), whilst the population is actually finite, for practical considerations of time, cost,
resources, etc., the population is taken as infinite. In such cases, when the population is
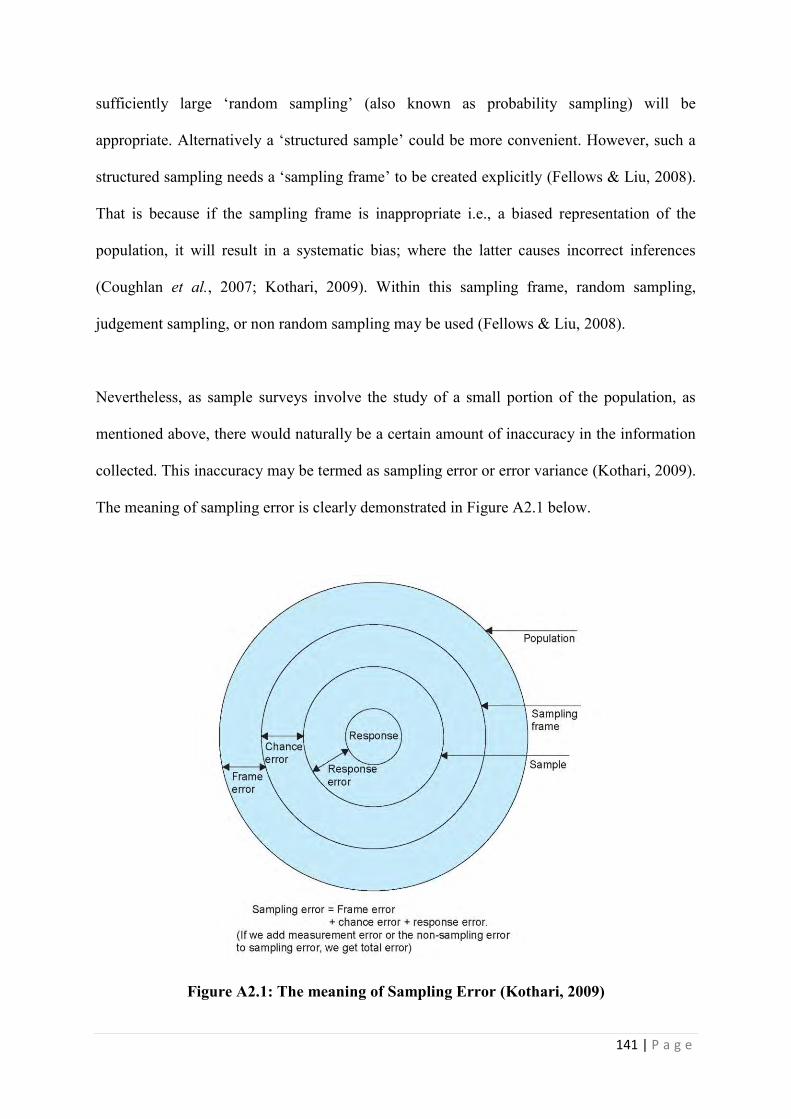
141 | P a g e
sufficiently large ‘random sampling’ (also known as probability sampling) will be
appropriate. Alternatively a ‘structured sample’ could be more convenient. However, such a
structured sampling needs a ‘sampling frame’ to be created explicitly (Fellows & Liu, 2008).
That is because if the sampling frame is inappropriate i.e., a biased representation of the
population, it will result in a systematic bias; where the latter causes incorrect inferences
(Coughlan et al., 2007; Kothari, 2009). Within this sampling frame, random sampling,
judgement sampling, or non random sampling may be used (Fellows & Liu, 2008).
Nevertheless, as sample surveys involve the study of a small portion of the population, as
mentioned above, there would naturally be a certain amount of inaccuracy in the information
collected. This inaccuracy may be termed as sampling error or error variance (Kothari, 2009).
The meaning of sampling error is clearly demonstrated in Figure A2.1 below.
Figure A2.1: The meaning of Sampling Error (Kothari, 2009)
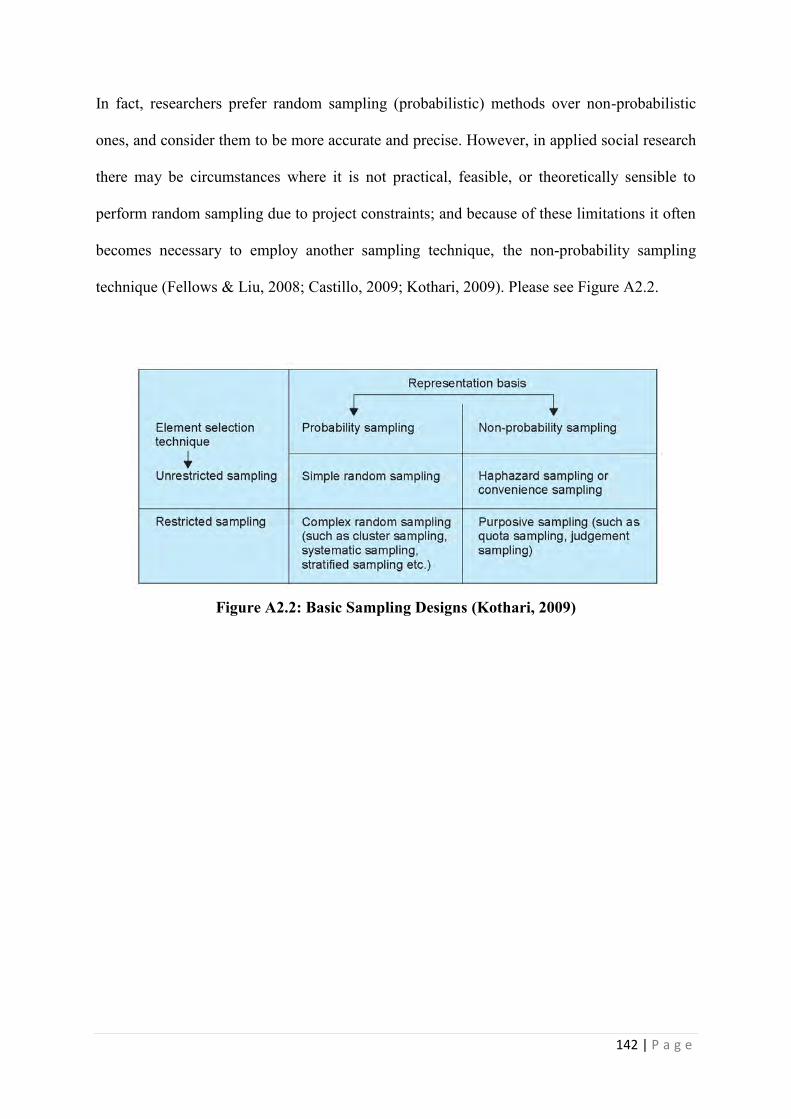
142 | P a g e
In fact, researchers prefer random sampling (probabilistic) methods over non-probabilistic
ones, and consider them to be more accurate and precise. However, in applied social research
there may be circumstances where it is not practical, feasible, or theoretically sensible to
perform random sampling due to project constraints; and because of these limitations it often
becomes necessary to employ another sampling technique, the non-probability sampling
technique (Fellows & Liu, 2008; Castillo, 2009; Kothari, 2009). Please see Figure A2.2.
Figure A2.2: Basic Sampling Designs (Kothari, 2009)
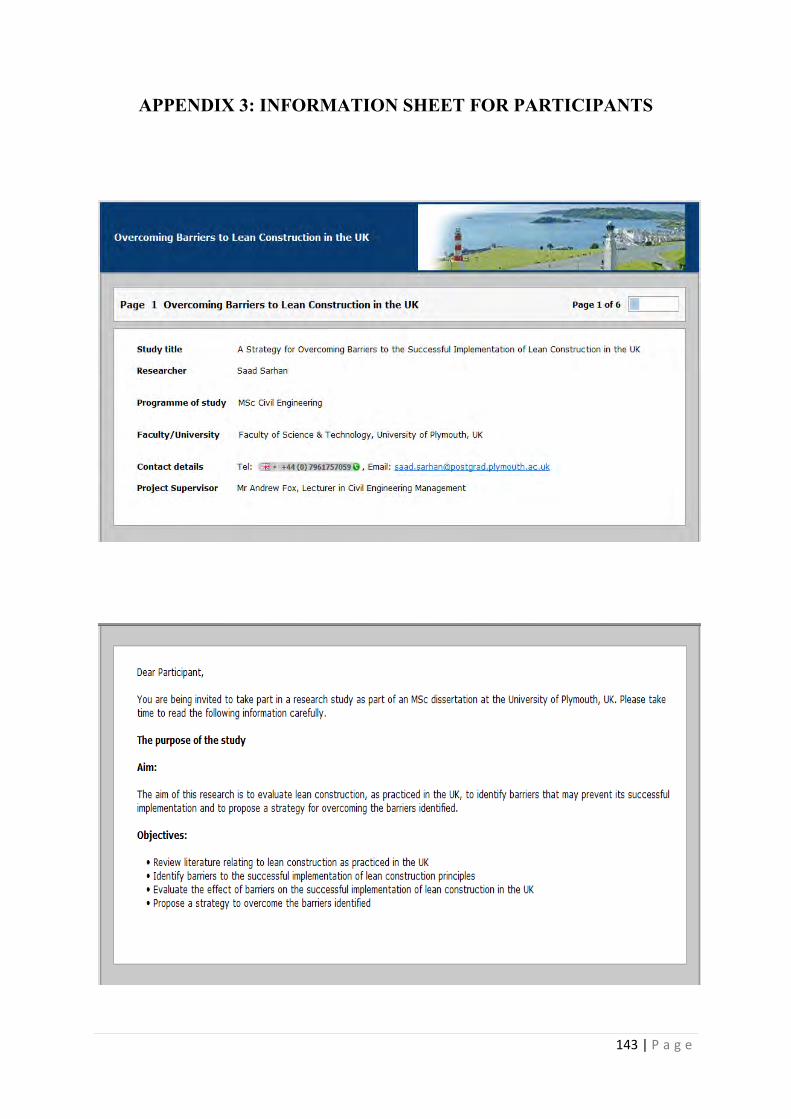
143 | P a g e
APPENDIX 3: INFORMATION SHEET FOR PARTICIPANTS

144 | P a g e
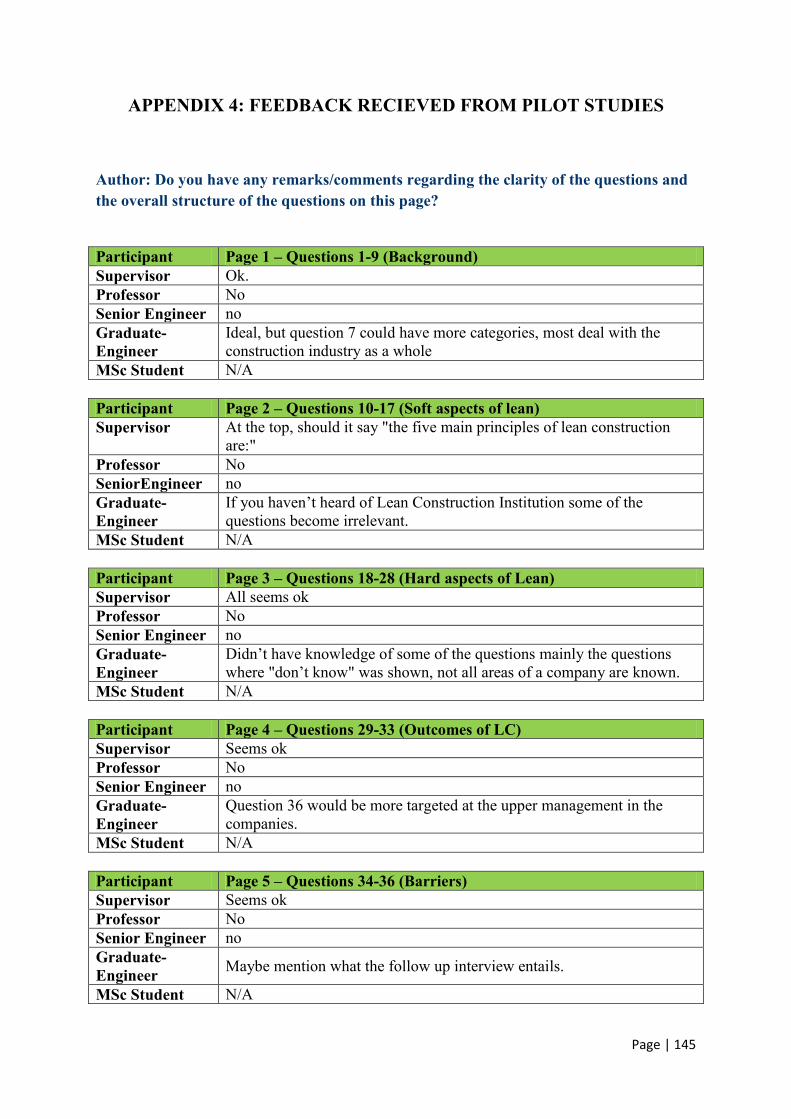
Page | 145
APPENDIX 4: FEEDBACK RECIEVED FROM PILOT STUDIES
Author: Do you have any remarks/comments regarding the clarity of the questions and the overall structure of the questions on this page?
Participant Page 1 – Questions 1-9 (Background) Supervisor Ok. Professor No Senior Engineer no Graduate- Engineer
Ideal, but question 7 could have more categories, most deal with the construction industry as a whole
MSc Student N/A Participant Page 2 – Questions 10-17 (Soft aspects of lean) Supervisor At the top, should it say "the five main principles of lean construction
are:" Professor No SeniorEngineer no Graduate- Engineer
If you haven’t heard of Lean Construction Institution some of the questions become irrelevant.
MSc Student N/A Participant Page 3 – Questions 18-28 (Hard aspects of Lean) Supervisor All seems ok Professor No Senior Engineer no Graduate- Engineer
Didn’t have knowledge of some of the questions mainly the questions where "don’t know" was shown, not all areas of a company are known.
MSc Student N/A Participant Page 4 – Questions 29-33 (Outcomes of LC) Supervisor Seems ok Professor No Senior Engineer no Graduate- Engineer
Question 36 would be more targeted at the upper management in the companies.
MSc Student N/A Participant Page 5 – Questions 34-36 (Barriers) Supervisor Seems ok Professor No Senior Engineer no Graduate- Engineer Maybe mention what the follow up interview entails.
MSc Student N/A
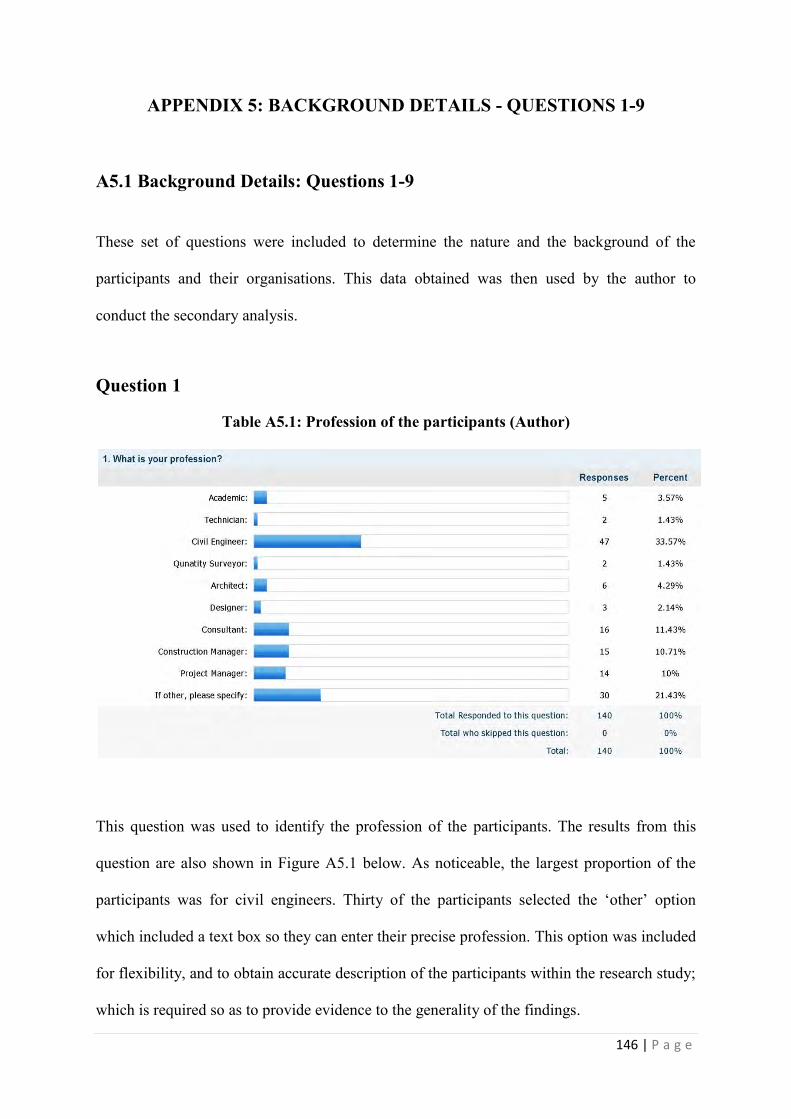
146 | P a g e
APPENDIX 5: BACKGROUND DETAILS - QUESTIONS 1-9
A5.1 Background Details: Questions 1-9
These set of questions were included to determine the nature and the background of the
participants and their organisations. This data obtained was then used by the author to
conduct the secondary analysis.
Question 1
Table A5.1: Profession of the participants (Author)
This question was used to identify the profession of the participants. The results from this
question are also shown in Figure A5.1 below. As noticeable, the largest proportion of the
participants was for civil engineers. Thirty of the participants selected the ‘other’ option
which included a text box so they can enter their precise profession. This option was included
for flexibility, and to obtain accurate description of the participants within the research study;
which is required so as to provide evidence to the generality of the findings.

147 | P a g e
Figure A5.1: Profession of the participants (Author)
As mentioned previously, the largest two groups were civil engineers and those who selected
the ‘other’ option, representing 33.57% and 21.43% of all participants respectively. The next
largest group of participants were the consultants, construction managers, and project
managers which represented 11.43%, 10.71%, and 10% of all participants in respective order.
Architects represented 4.29% of the participants, 3.57% were academics, 2.14% were
designers, and finally each of the technicians and quantity surveyors represented 1.43% of all
participants. Some of the professions (e.g. designers and quantity surveyors) had a small
percentage of participation because some of them preferred to select the ‘other’ option. The
latter included a wide range of professions (the full list can be found in Appendix 12) such as:
design manager, structural engineer, construction director, planning claims manager, head of
procurement, planning director, quality/business improvements manager, geo-engineer,

148 | P a g e
dimensional control engineer, general manager, contract sales manager, project engineer,
researcher, supplier to construction market, etc.
Question 2
Table A5.2: Location of the participants (Author)
This question was included to determine where the participants are based; and to be used for
secondary analysis, by comparing between LC practices in the UK, USA and other
international countries.
As can be seen from Table A5.2 above, 77.14% of all participants were based in the UK,
17.86% in other international countries, and only 5% in the USA. The participants who
selected the ‘other’ option were based in different international countries such as: Republic of
Ireland, Netherlands, Italy, Australia, Canada, Peru, China, Pakistan, India, Singapore, State
of Qatar, Egypt, Nigeria, Kenya, and Sri Lanka.
Hence, very few responses were obtained from respondents who are based in the USA (only
seven responses) and many of those based in international countries have not completed the
survey, this comparison was excluded from the secondary analysis.

149 | P a g e
Question 3
Table A5.3: Current role of the participants (Author)
This question was included to determine the current role of the participants. This was
essential to ensure that all participants of the survey are currently involved in the construction
industry, and thus have up-to-date first hand knowledge. It was also included to be used for
secondary analysis by comparing between the participants according to their managerial
position; where the respondents were divided into three groups. The first included graduate
and junior engineers; the second included team leaders, site managers and project managers;
while the third included regional managers, department managers, and managing directors.
Respondents who selected the ‘Other’ option were excluded from the secondary analysis.
As can be seen in Table A5.3, the majority of the participants were holding senior positions at
their respective organisations. Also, around 6% of the participants were
academics/researchers. Forty five respondents selected the ‘other’ option and entered their
specific roles into the comment box. The full list can be found in Appendix 12. However this
list included the following roles: technical director, marketing director, divisional director, ,
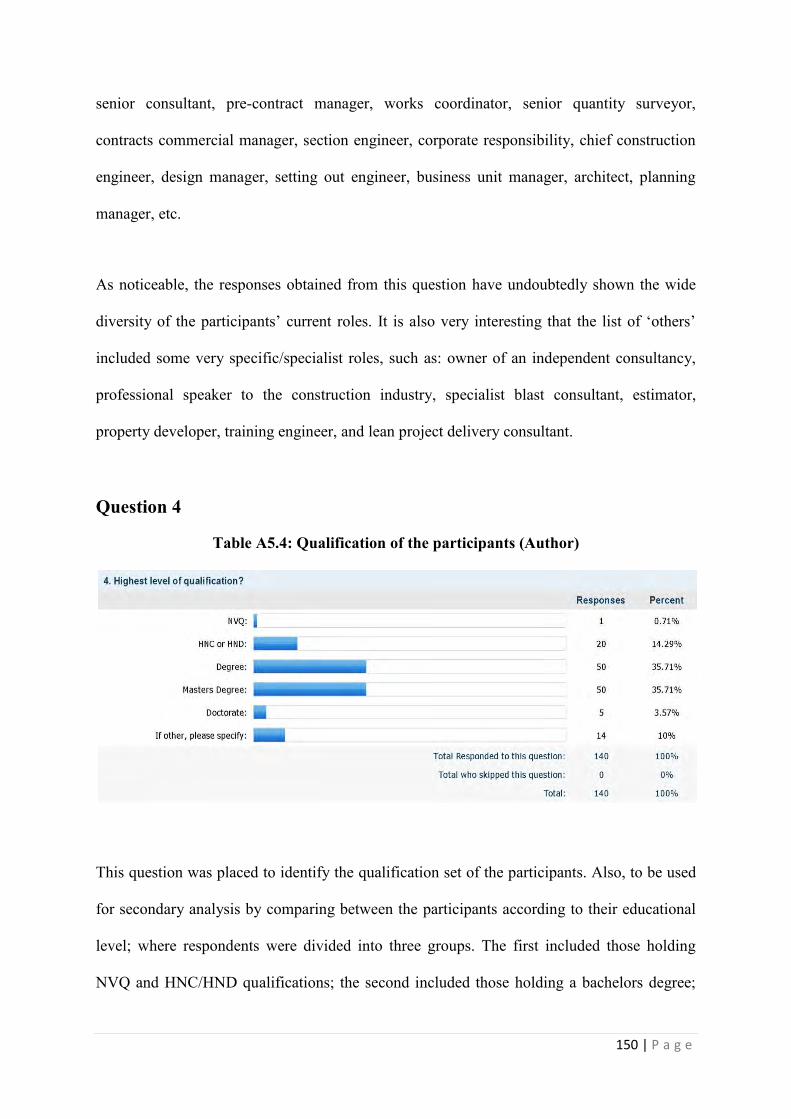
150 | P a g e
senior consultant, pre-contract manager, works coordinator, senior quantity surveyor,
contracts commercial manager, section engineer, corporate responsibility, chief construction
engineer, design manager, setting out engineer, business unit manager, architect, planning
manager, etc.
As noticeable, the responses obtained from this question have undoubtedly shown the wide
diversity of the participants’ current roles. It is also very interesting that the list of ‘others’
included some very specific/specialist roles, such as: owner of an independent consultancy,
professional speaker to the construction industry, specialist blast consultant, estimator,
property developer, training engineer, and lean project delivery consultant.
Question 4
Table A5.4: Qualification of the participants (Author)
This question was placed to identify the qualification set of the participants. Also, to be used
for secondary analysis by comparing between the participants according to their educational
level; where respondents were divided into three groups. The first included those holding
NVQ and HNC/HND qualifications; the second included those holding a bachelors degree;
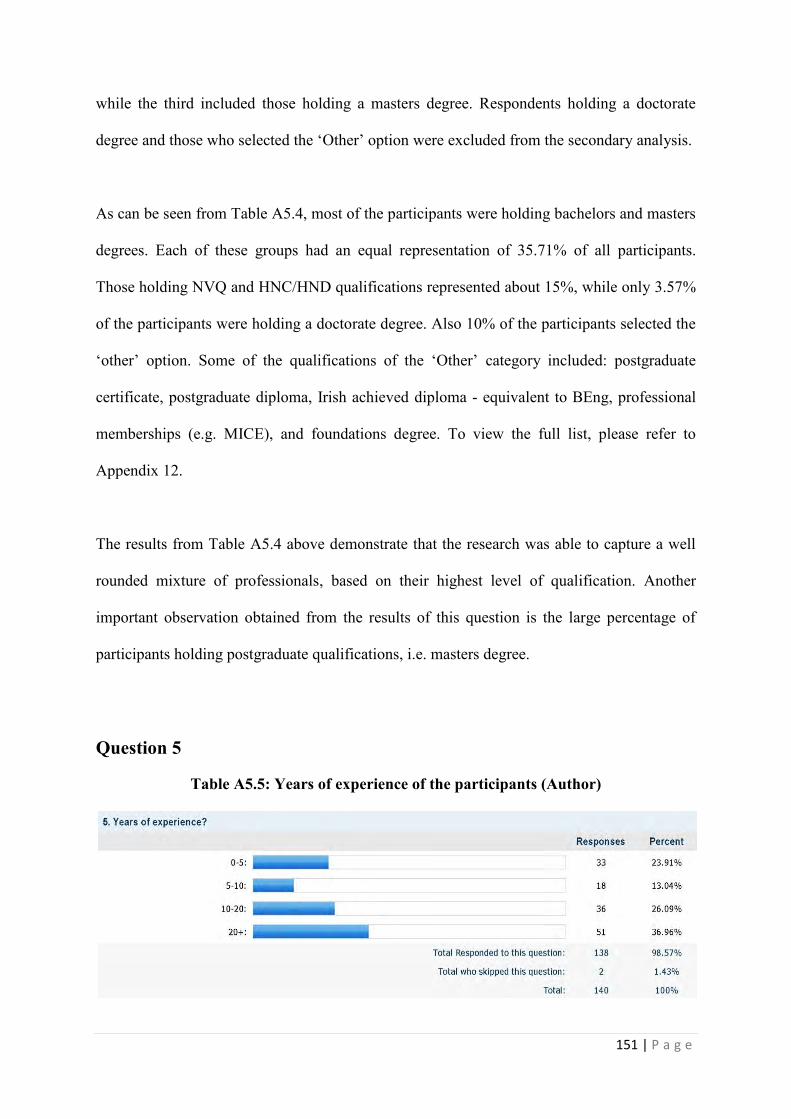
151 | P a g e
while the third included those holding a masters degree. Respondents holding a doctorate
degree and those who selected the ‘Other’ option were excluded from the secondary analysis.
As can be seen from Table A5.4, most of the participants were holding bachelors and masters
degrees. Each of these groups had an equal representation of 35.71% of all participants.
Those holding NVQ and HNC/HND qualifications represented about 15%, while only 3.57%
of the participants were holding a doctorate degree. Also 10% of the participants selected the
‘other’ option. Some of the qualifications of the ‘Other’ category included: postgraduate
certificate, postgraduate diploma, Irish achieved diploma - equivalent to BEng, professional
memberships (e.g. MICE), and foundations degree. To view the full list, please refer to
Appendix 12.
The results from Table A5.4 above demonstrate that the research was able to capture a well
rounded mixture of professionals, based on their highest level of qualification. Another
important observation obtained from the results of this question is the large percentage of
participants holding postgraduate qualifications, i.e. masters degree.
Question 5
Table A5.5: Years of experience of the participants (Author)
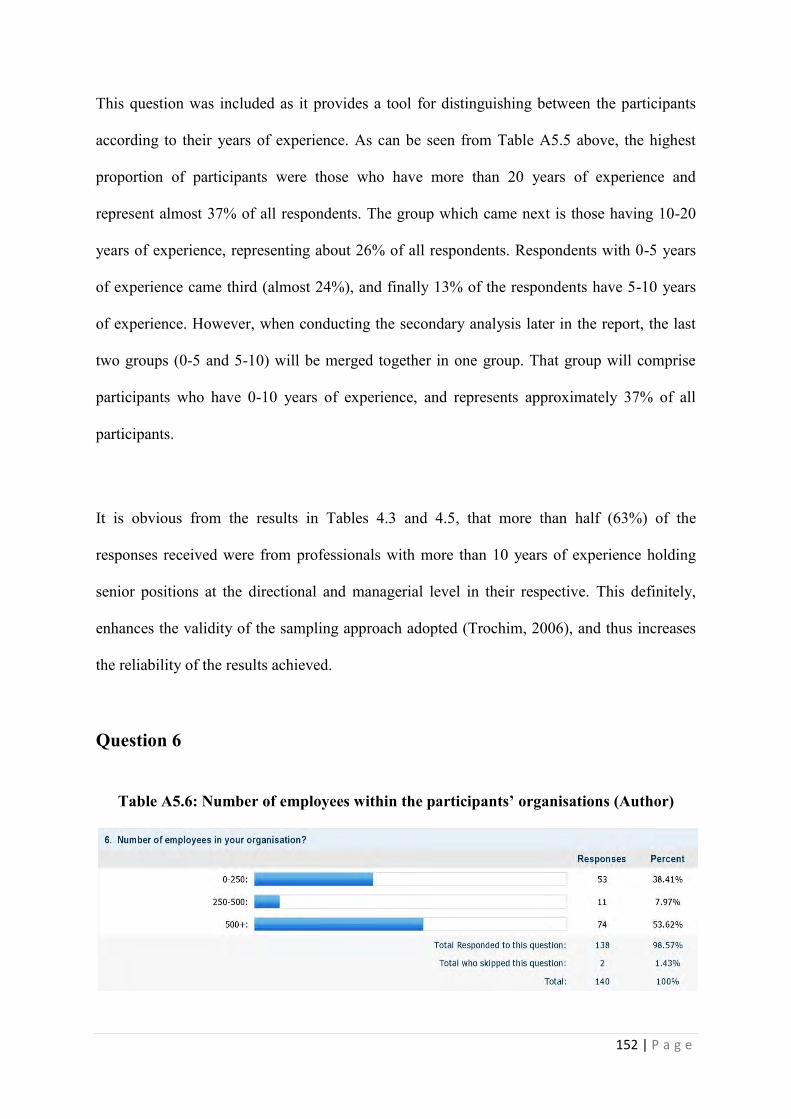
152 | P a g e
This question was included as it provides a tool for distinguishing between the participants
according to their years of experience. As can be seen from Table A5.5 above, the highest
proportion of participants were those who have more than 20 years of experience and
represent almost 37% of all respondents. The group which came next is those having 10-20
years of experience, representing about 26% of all respondents. Respondents with 0-5 years
of experience came third (almost 24%), and finally 13% of the respondents have 5-10 years
of experience. However, when conducting the secondary analysis later in the report, the last
two groups (0-5 and 5-10) will be merged together in one group. That group will comprise
participants who have 0-10 years of experience, and represents approximately 37% of all
participants.
It is obvious from the results in Tables 4.3 and 4.5, that more than half (63%) of the
responses received were from professionals with more than 10 years of experience holding
senior positions at the directional and managerial level in their respective. This definitely,
enhances the validity of the sampling approach adopted (Trochim, 2006), and thus increases
the reliability of the results achieved.
Question 6
Table A5.6: Number of employees within the participants’ organisations (Author)
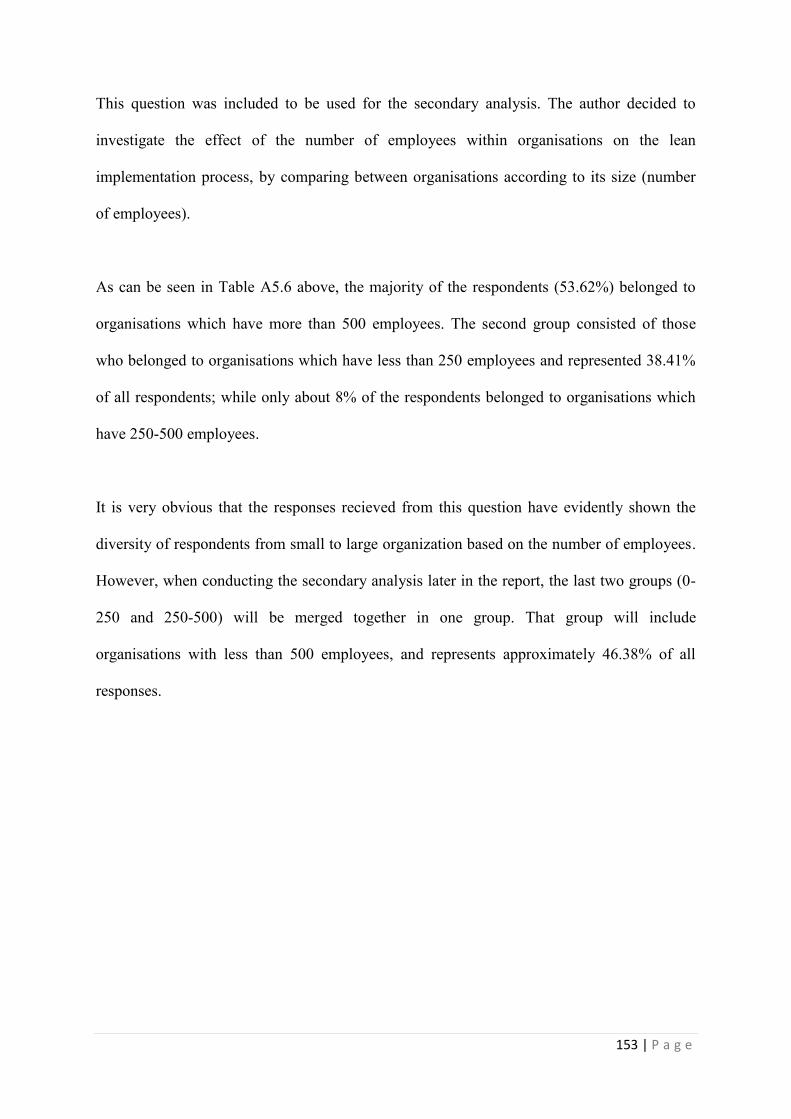
153 | P a g e
This question was included to be used for the secondary analysis. The author decided to
investigate the effect of the number of employees within organisations on the lean
implementation process, by comparing between organisations according to its size (number
of employees).
As can be seen in Table A5.6 above, the majority of the respondents (53.62%) belonged to
organisations which have more than 500 employees. The second group consisted of those
who belonged to organisations which have less than 250 employees and represented 38.41%
of all respondents; while only about 8% of the respondents belonged to organisations which
have 250-500 employees.
It is very obvious that the responses recieved from this question have evidently shown the
diversity of respondents from small to large organization based on the number of employees.
However, when conducting the secondary analysis later in the report, the last two groups (0-
250 and 250-500) will be merged together in one group. That group will include
organisations with less than 500 employees, and represents approximately 46.38% of all
responses.
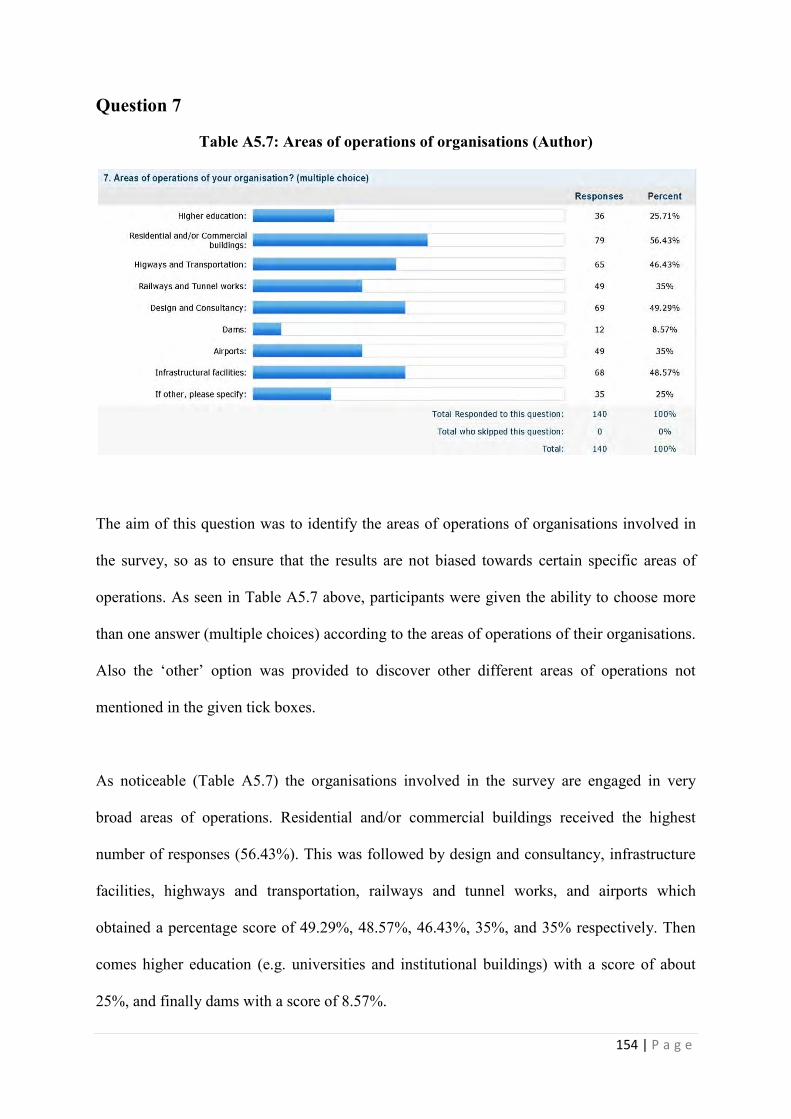
154 | P a g e
Question 7
Table A5.7: Areas of operations of organisations (Author)
The aim of this question was to identify the areas of operations of organisations involved in
the survey, so as to ensure that the results are not biased towards certain specific areas of
operations. As seen in Table A5.7 above, participants were given the ability to choose more
than one answer (multiple choices) according to the areas of operations of their organisations.
Also the ‘other’ option was provided to discover other different areas of operations not
mentioned in the given tick boxes.
As noticeable (Table A5.7) the organisations involved in the survey are engaged in very
broad areas of operations. Residential and/or commercial buildings received the highest
number of responses (56.43%). This was followed by design and consultancy, infrastructure
facilities, highways and transportation, railways and tunnel works, and airports which
obtained a percentage score of 49.29%, 48.57%, 46.43%, 35%, and 35% respectively. Then
comes higher education (e.g. universities and institutional buildings) with a score of about
25%, and finally dams with a score of 8.57%.
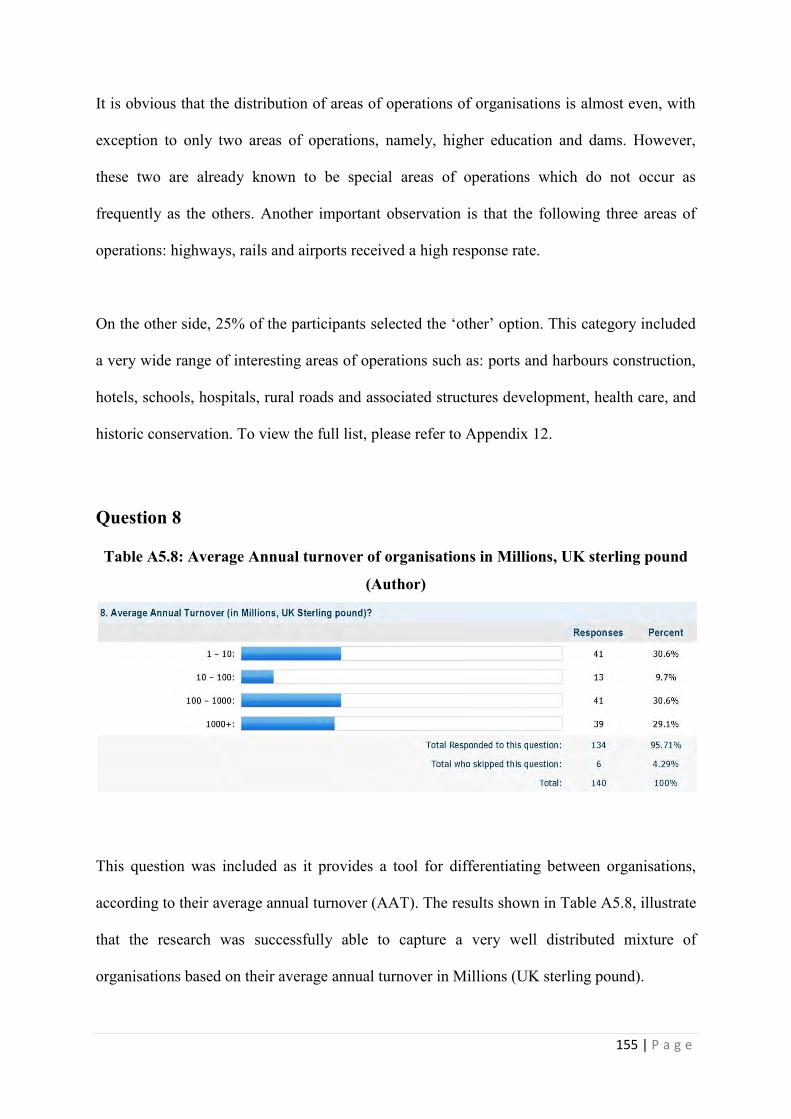
155 | P a g e
It is obvious that the distribution of areas of operations of organisations is almost even, with
exception to only two areas of operations, namely, higher education and dams. However,
these two are already known to be special areas of operations which do not occur as
frequently as the others. Another important observation is that the following three areas of
operations: highways, rails and airports received a high response rate.
On the other side, 25% of the participants selected the ‘other’ option. This category included
a very wide range of interesting areas of operations such as: ports and harbours construction,
hotels, schools, hospitals, rural roads and associated structures development, health care, and
historic conservation. To view the full list, please refer to Appendix 12.
Question 8
Table A5.8: Average Annual turnover of organisations in Millions, UK sterling pound
(Author)
This question was included as it provides a tool for differentiating between organisations,
according to their average annual turnover (AAT). The results shown in Table A5.8, illustrate
that the research was successfully able to capture a very well distributed mixture of
organisations based on their average annual turnover in Millions (UK sterling pound).

156 | P a g e
This study included most of the largest construction organisations in the UK. Almost 60%
(59.7% exactly) of the responses received represent organisations which their average annual
turnover (AAT) exceeds 100 Million UK sterling pounds. Alternatively about 40% of the
responses represent organisations which its AAT is less than 100 Million UK sterling pounds.
During the secondary analysis, organisations will be divided into three categories (1-100,
100-1000, and 1000+). That means that organisations which their AAT are £1-10 Million and
£10-100 Million, will be merged together.
Question 9
Table A5.9: Major clients/customers of the organisations (Author)
This question is linked to question number 7, and it aims to identify the nature of
clients/customers that deal with the organisations involved in this survey, in order to ensure
that the results obtained are not biased towards certain types of clients. As can be seen from
Table A5.9, the major clients/customers selected were ‘both’: public and private individual
organisations with a percentage score of nearly 60% of all respondents. However, this
category (those who selected the ‘both’ answer) will be excluded from the secondary
analysis. The secondary analysis will be focussed on comparing between the other two
specific categories (those who mentioned that they only deal with public organisations and
those who only deal with private individuals & organisations).
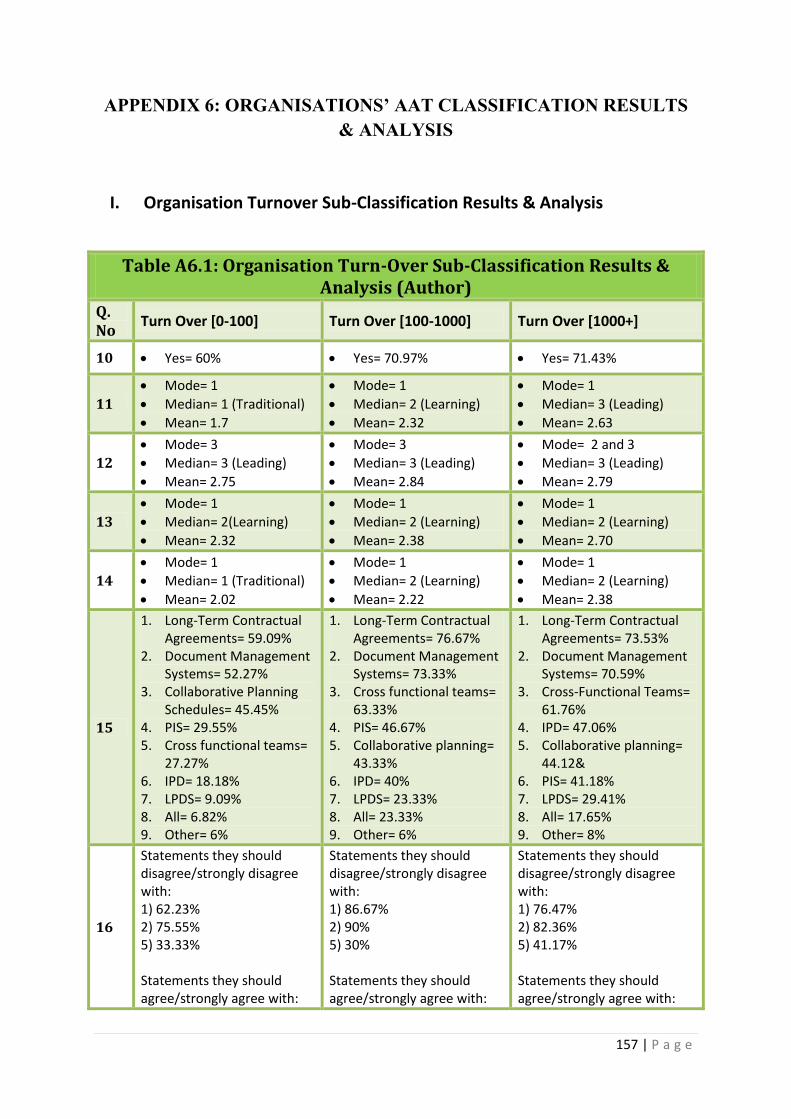
157 | P a g e
APPENDIX 6: ORGANISATIONS’ AAT CLASSIFICATION RESULTS & ANALYSIS
I. Organisation Turnover Sub-Classification Results & Analysis
Table A6.1: Organisation Turn-Over Sub-Classification Results & Analysis (Author)
Q. No
Turn Over [0-100] Turn Over [100-1000] Turn Over [1000+]
10 Yes= 60% Yes= 70.97% Yes= 71.43%
11
Mode= 1
Median= 1 (Traditional)
Mean= 1.7
Mode= 1
Median= 2 (Learning)
Mean= 2.32
Mode= 1
Median= 3 (Leading)
Mean= 2.63
12
Mode= 3
Median= 3 (Leading)
Mean= 2.75
Mode= 3
Median= 3 (Leading)
Mean= 2.84
Mode= 2 and 3
Median= 3 (Leading)
Mean= 2.79
13
Mode= 1
Median= 2(Learning)
Mean= 2.32
Mode= 1
Median= 2 (Learning)
Mean= 2.38
Mode= 1
Median= 2 (Learning)
Mean= 2.70
14
Mode= 1
Median= 1 (Traditional)
Mean= 2.02
Mode= 1
Median= 2 (Learning)
Mean= 2.22
Mode= 1
Median= 2 (Learning)
Mean= 2.38
15
1. Long-Term Contractual Agreements= 59.09%
2. Document Management Systems= 52.27%
3. Collaborative Planning Schedules= 45.45%
4. PIS= 29.55% 5. Cross functional teams=
27.27% 6. IPD= 18.18% 7. LPDS= 9.09% 8. All= 6.82% 9. Other= 6%
1. Long-Term Contractual Agreements= 76.67%
2. Document Management Systems= 73.33%
3. Cross functional teams= 63.33%
4. PIS= 46.67% 5. Collaborative planning=
43.33% 6. IPD= 40% 7. LPDS= 23.33% 8. All= 23.33% 9. Other= 6%
1. Long-Term Contractual Agreements= 73.53%
2. Document Management Systems= 70.59%
3. Cross-Functional Teams= 61.76%
4. IPD= 47.06% 5. Collaborative planning=
44.12& 6. PIS= 41.18% 7. LPDS= 29.41% 8. All= 17.65% 9. Other= 8%
16
Statements they should disagree/strongly disagree with: 1) 62.23% 2) 75.55% 5) 33.33% Statements they should agree/strongly agree with:
Statements they should disagree/strongly disagree with: 1) 86.67% 2) 90% 5) 30% Statements they should agree/strongly agree with:
Statements they should disagree/strongly disagree with: 1) 76.47% 2) 82.36% 5) 41.17% Statements they should agree/strongly agree with:

158 | P a g e
3) 64.45 % 4) 62.22% 6) 24.44% 7) 31.11% 8) 84.09% 9) 75% 10) 57.78% 11) 77.78% 8 correct out of 11 Average score= 58.9%
3) 56.67% 4) 50% 6) 30% 7) 30% 8) 100% 9) 53.34% 10) 60% 11) 90% 8 correct out of 11 Average score= 61.51%
3) 82.35% 4) 61.77% 6) 29.41% 7) 43.42% 8) 91.18% 9) 73.53% 10) 45.45% 11) 76.47% 7 correct out of 11 Average score= 63.96%
17
1. Workplace organisation= 58.14%
2. Standardised work= 58.14%
3. Problem solving= 51.16% 4. Collaborative planning=
41.86% 5. Data analysis= 39.53% 6. VM= 39.53% 7. Process mapping=
39.53% 8. Work sequence analysis=
27.91% 9. All= 11.63% 10. None= 11.63% 11. Other= 6%
1. Collaborative Planning= 50%
2. Data analysis= 50% 3. Workplace organisation=
43.33% 4. Process mapping= 40% 5. Work sequence analysis=
36.67% 6. VM= 33.33% 7. Standardised work=
33.33% 8. Problem solving= 33.33% 9. All= 26.67% 10. None= 13.33% 11. Other= 3%
1. Collaborative Planning= 61.76%
2. Data Analysis= 58.82% 3. Workplace organisation=
55.88% 4. Work sequence analysis=
52.94% 5. Visual management=
52.94% 6. Standardised work=
52.94% 7. Problem solving= 52.94% 8. Process mapping=
35.29% 9. All= 17.65% 10. Other= 11% 11. None= 5.88%
18
1. CPM= 48.84% 2. Look ahead= 41.86% 3. PCP= 30.23% 4. N/A= 25.58% 5. Workflow PM= 25.58% 6. Constraint analysis=
16.28% 7. LPS= 14% 8. RPS= 7% 9. Other= 6%
1. CPM= 76.67% 2. Look ahead= 53.33% 3. PCP tools= 50% 4. Workflow PM= 30% 5. LPS= 30% 6. Constraint analysis= 30% 7. RPS= 16.67% 8. N/A= 13.33% 9. Other= 6%
1. CPM= 69.7% 2. PCP tools= 57.58% 3. Look ahead= 51.52% 4. Constraint analysis=
33.33% 5. LPS= 18.18% 6. Other= 18.18% 7. Workflow PM= 15.15% 8. N/A= 12% 9. RPS= 9%
19
1. None= 56.82% 2. PDCA= 29.55% 3. Other= 11% 4. FRS= 9.05% 5. Prefabrication= 9.05%
1. PDCA= 46.67% 2. None= 33.33% 3. Prefabrication= 26.67% 4. Other= 13% 5. FRS= 10%
1. PDCA= 45.45% 2. None= 33.33% 3. Prefabrication= 33.33% 4. FRS= 18.18% 5. Other= 9%
20
1. N/A= 66.67% 2. VM= 19.05% 3. LPS= 11.9% 4. CFP= 9.52% 5. Other= 7%
1. VM= 37.93% 2. N/A= 34.48% 3. LPS= 27.59% 4. CFP= 20.69% 5. Crane= 13.79%
1. VM= 42.42% 2. N/A= 30.3% 3. LPS= 18.18% 4. CFP= 15.15% 5. Other= 15.15%
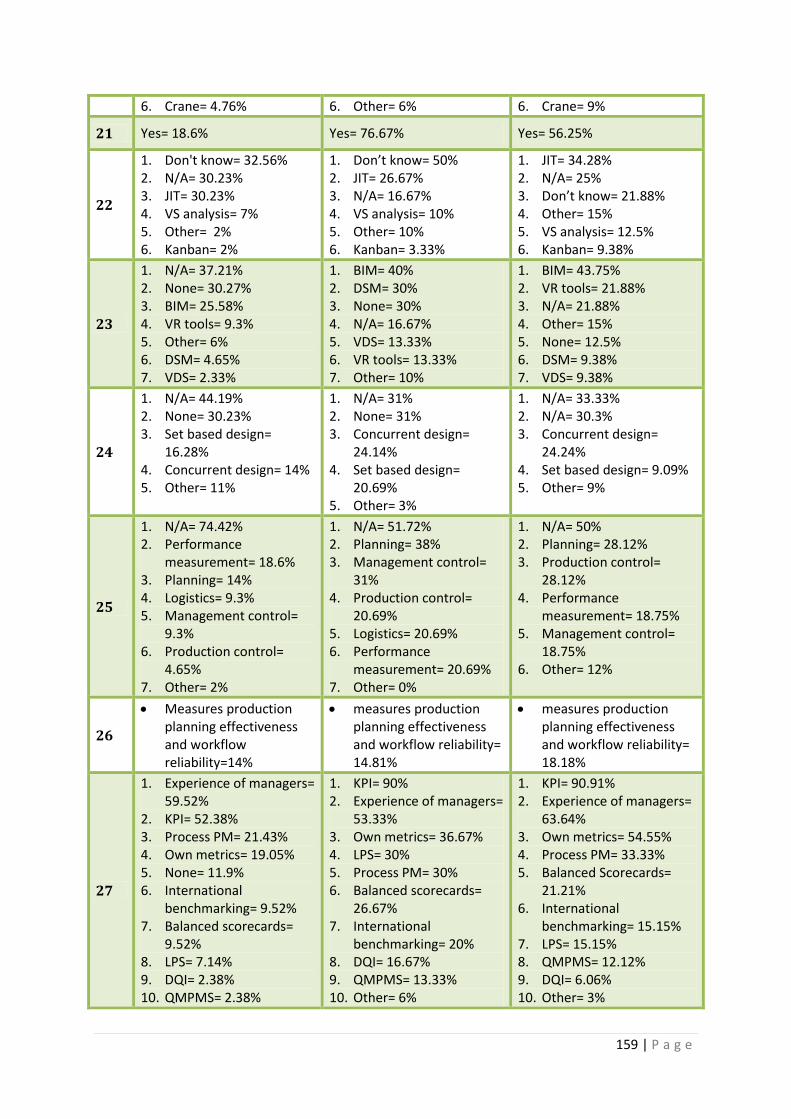
159 | P a g e
6. Crane= 4.76% 6. Other= 6% 6. Crane= 9%
21 Yes= 18.6% Yes= 76.67% Yes= 56.25%
22
1. Don't know= 32.56% 2. N/A= 30.23% 3. JIT= 30.23% 4. VS analysis= 7% 5. Other= 2% 6. Kanban= 2%
1. Don’t know= 50% 2. JIT= 26.67% 3. N/A= 16.67% 4. VS analysis= 10% 5. Other= 10% 6. Kanban= 3.33%
1. JIT= 34.28% 2. N/A= 25% 3. Don’t know= 21.88% 4. Other= 15% 5. VS analysis= 12.5% 6. Kanban= 9.38%
23
1. N/A= 37.21% 2. None= 30.27% 3. BIM= 25.58% 4. VR tools= 9.3% 5. Other= 6% 6. DSM= 4.65% 7. VDS= 2.33%
1. BIM= 40% 2. DSM= 30% 3. None= 30% 4. N/A= 16.67% 5. VDS= 13.33% 6. VR tools= 13.33% 7. Other= 10%
1. BIM= 43.75% 2. VR tools= 21.88% 3. N/A= 21.88% 4. Other= 15% 5. None= 12.5% 6. DSM= 9.38% 7. VDS= 9.38%
24
1. N/A= 44.19% 2. None= 30.23% 3. Set based design=
16.28% 4. Concurrent design= 14% 5. Other= 11%
1. N/A= 31% 2. None= 31% 3. Concurrent design=
24.14% 4. Set based design=
20.69% 5. Other= 3%
1. N/A= 33.33% 2. N/A= 30.3% 3. Concurrent design=
24.24% 4. Set based design= 9.09% 5. Other= 9%
25
1. N/A= 74.42% 2. Performance
measurement= 18.6% 3. Planning= 14% 4. Logistics= 9.3% 5. Management control=
9.3% 6. Production control=
4.65% 7. Other= 2%
1. N/A= 51.72% 2. Planning= 38% 3. Management control=
31% 4. Production control=
20.69% 5. Logistics= 20.69% 6. Performance
measurement= 20.69% 7. Other= 0%
1. N/A= 50% 2. Planning= 28.12% 3. Production control=
28.12% 4. Performance
measurement= 18.75% 5. Management control=
18.75% 6. Other= 12%
26
Measures production planning effectiveness and workflow reliability=14%
measures production planning effectiveness and workflow reliability= 14.81%
measures production planning effectiveness and workflow reliability= 18.18%
27
1. Experience of managers= 59.52%
2. KPI= 52.38% 3. Process PM= 21.43% 4. Own metrics= 19.05% 5. None= 11.9% 6. International
benchmarking= 9.52% 7. Balanced scorecards=
9.52% 8. LPS= 7.14% 9. DQI= 2.38% 10. QMPMS= 2.38%
1. KPI= 90% 2. Experience of managers=
53.33% 3. Own metrics= 36.67% 4. LPS= 30% 5. Process PM= 30% 6. Balanced scorecards=
26.67% 7. International
benchmarking= 20% 8. DQI= 16.67% 9. QMPMS= 13.33% 10. Other= 6%
1. KPI= 90.91% 2. Experience of managers=
63.64% 3. Own metrics= 54.55% 4. Process PM= 33.33% 5. Balanced Scorecards=
21.21% 6. International
benchmarking= 15.15% 7. LPS= 15.15% 8. QMPMS= 12.12% 9. DQI= 6.06% 10. Other= 3%
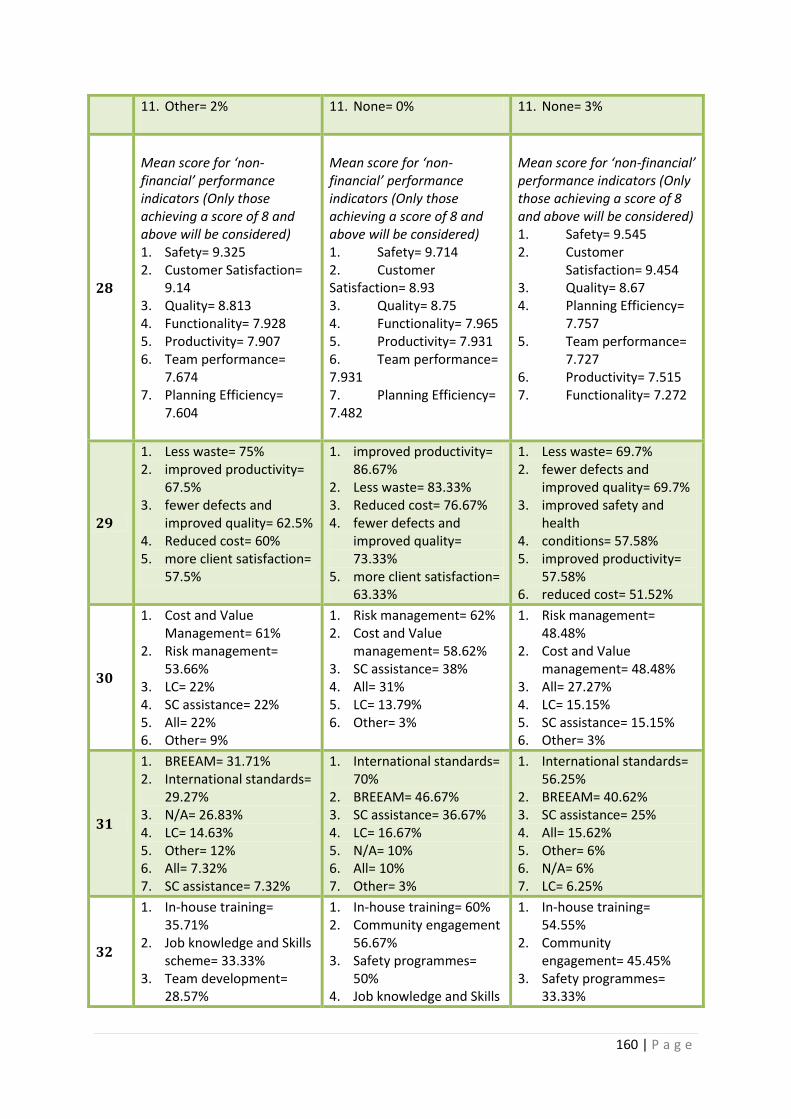
160 | P a g e
11. Other= 2%
11. None= 0% 11. None= 3%
28
Mean score for ‘non-financial’ performance indicators (Only those achieving a score of 8 and above will be considered) 1. Safety= 9.325 2. Customer Satisfaction=
9.14 3. Quality= 8.813 4. Functionality= 7.928 5. Productivity= 7.907 6. Team performance=
7.674 7. Planning Efficiency=
7.604
Mean score for ‘non-financial’ performance indicators (Only those achieving a score of 8 and above will be considered) 1. Safety= 9.714 2. Customer Satisfaction= 8.93 3. Quality= 8.75 4. Functionality= 7.965 5. Productivity= 7.931 6. Team performance= 7.931 7. Planning Efficiency= 7.482
Mean score for ‘non-financial’ performance indicators (Only those achieving a score of 8 and above will be considered) 1. Safety= 9.545 2. Customer
Satisfaction= 9.454 3. Quality= 8.67 4. Planning Efficiency=
7.757 5. Team performance=
7.727 6. Productivity= 7.515 7. Functionality= 7.272
29
1. Less waste= 75% 2. improved productivity=
67.5% 3. fewer defects and
improved quality= 62.5% 4. Reduced cost= 60% 5. more client satisfaction=
57.5%
1. improved productivity= 86.67%
2. Less waste= 83.33% 3. Reduced cost= 76.67% 4. fewer defects and
improved quality= 73.33%
5. more client satisfaction= 63.33%
1. Less waste= 69.7% 2. fewer defects and
improved quality= 69.7% 3. improved safety and
health 4. conditions= 57.58% 5. improved productivity=
57.58% 6. reduced cost= 51.52%
30
1. Cost and Value Management= 61%
2. Risk management= 53.66%
3. LC= 22% 4. SC assistance= 22% 5. All= 22% 6. Other= 9%
1. Risk management= 62% 2. Cost and Value
management= 58.62% 3. SC assistance= 38% 4. All= 31% 5. LC= 13.79% 6. Other= 3%
1. Risk management= 48.48%
2. Cost and Value management= 48.48%
3. All= 27.27% 4. LC= 15.15% 5. SC assistance= 15.15% 6. Other= 3%
31
1. BREEAM= 31.71% 2. International standards=
29.27% 3. N/A= 26.83% 4. LC= 14.63% 5. Other= 12% 6. All= 7.32% 7. SC assistance= 7.32%
1. International standards= 70%
2. BREEAM= 46.67% 3. SC assistance= 36.67% 4. LC= 16.67% 5. N/A= 10% 6. All= 10% 7. Other= 3%
1. International standards= 56.25%
2. BREEAM= 40.62% 3. SC assistance= 25% 4. All= 15.62% 5. Other= 6% 6. N/A= 6% 7. LC= 6.25%
32
1. In-house training= 35.71%
2. Job knowledge and Skills scheme= 33.33%
3. Team development= 28.57%
1. In-house training= 60% 2. Community engagement
56.67% 3. Safety programmes=
50% 4. Job knowledge and Skills
1. In-house training= 54.55%
2. Community engagement= 45.45%
3. Safety programmes= 33.33%
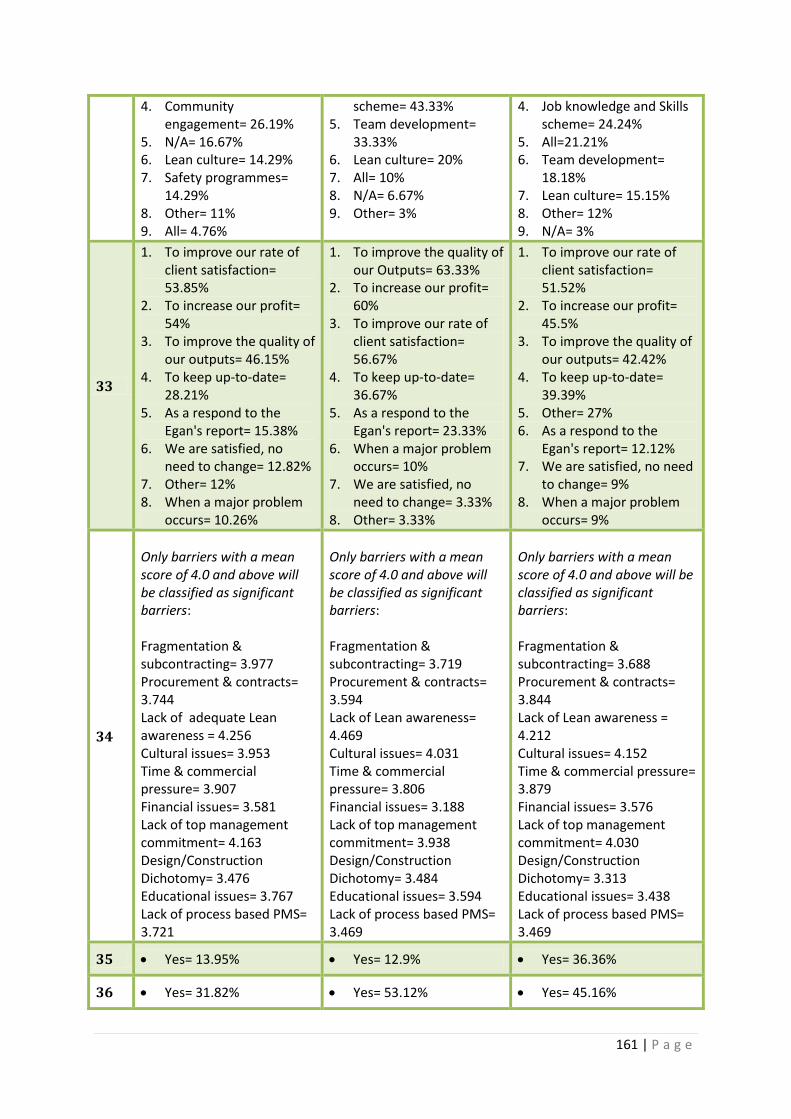
161 | P a g e
4. Community engagement= 26.19%
5. N/A= 16.67% 6. Lean culture= 14.29% 7. Safety programmes=
14.29% 8. Other= 11% 9. All= 4.76%
scheme= 43.33% 5. Team development=
33.33% 6. Lean culture= 20% 7. All= 10% 8. N/A= 6.67% 9. Other= 3%
4. Job knowledge and Skills scheme= 24.24%
5. All=21.21% 6. Team development=
18.18% 7. Lean culture= 15.15% 8. Other= 12% 9. N/A= 3%
33
1. To improve our rate of client satisfaction= 53.85%
2. To increase our profit= 54%
3. To improve the quality of our outputs= 46.15%
4. To keep up-to-date= 28.21%
5. As a respond to the Egan's report= 15.38%
6. We are satisfied, no need to change= 12.82%
7. Other= 12% 8. When a major problem
occurs= 10.26%
1. To improve the quality of our Outputs= 63.33%
2. To increase our profit= 60%
3. To improve our rate of client satisfaction= 56.67%
4. To keep up-to-date= 36.67%
5. As a respond to the Egan's report= 23.33%
6. When a major problem occurs= 10%
7. We are satisfied, no need to change= 3.33%
8. Other= 3.33%
1. To improve our rate of client satisfaction= 51.52%
2. To increase our profit= 45.5%
3. To improve the quality of our outputs= 42.42%
4. To keep up-to-date= 39.39%
5. Other= 27% 6. As a respond to the
Egan's report= 12.12% 7. We are satisfied, no need
to change= 9% 8. When a major problem
occurs= 9%
34
Only barriers with a mean score of 4.0 and above will be classified as significant barriers: Fragmentation & subcontracting= 3.977 Procurement & contracts= 3.744 Lack of adequate Lean awareness = 4.256 Cultural issues= 3.953 Time & commercial pressure= 3.907 Financial issues= 3.581 Lack of top management commitment= 4.163 Design/Construction Dichotomy= 3.476 Educational issues= 3.767 Lack of process based PMS= 3.721
Only barriers with a mean score of 4.0 and above will be classified as significant barriers: Fragmentation & subcontracting= 3.719 Procurement & contracts= 3.594 Lack of Lean awareness= 4.469 Cultural issues= 4.031 Time & commercial pressure= 3.806 Financial issues= 3.188 Lack of top management commitment= 3.938 Design/Construction Dichotomy= 3.484 Educational issues= 3.594 Lack of process based PMS= 3.469
Only barriers with a mean score of 4.0 and above will be classified as significant barriers: Fragmentation & subcontracting= 3.688 Procurement & contracts= 3.844 Lack of Lean awareness = 4.212 Cultural issues= 4.152 Time & commercial pressure= 3.879 Financial issues= 3.576 Lack of top management commitment= 4.030 Design/Construction Dichotomy= 3.313 Educational issues= 3.438 Lack of process based PMS= 3.469
35 Yes= 13.95% Yes= 12.9% Yes= 36.36%
36 Yes= 31.82% Yes= 53.12% Yes= 45.16%
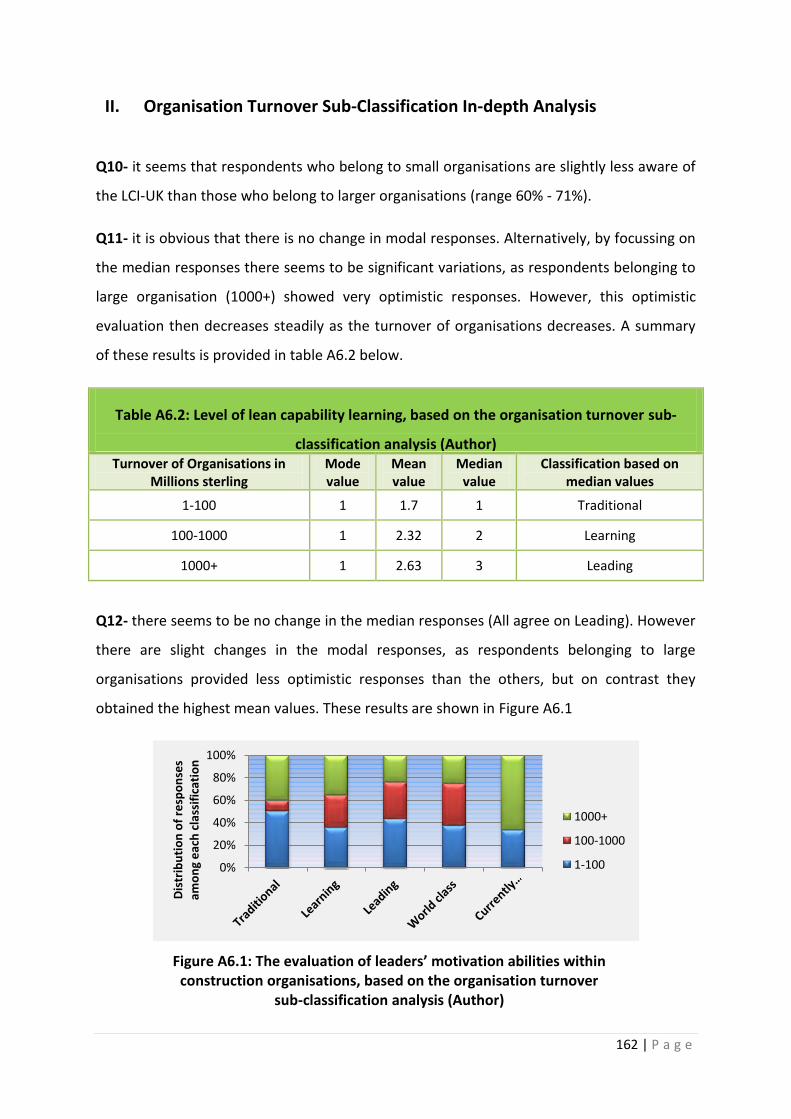
162 | P a g e
II. Organisation Turnover Sub-Classification In-depth Analysis
Q10- it seems that respondents who belong to small organisations are slightly less aware of
the LCI-UK than those who belong to larger organisations (range 60% - 71%).
Q11- it is obvious that there is no change in modal responses. Alternatively, by focussing on
the median responses there seems to be significant variations, as respondents belonging to
large organisation (1000+) showed very optimistic responses. However, this optimistic
evaluation then decreases steadily as the turnover of organisations decreases. A summary
of these results is provided in table A6.2 below.
Table A6.2: Level of lean capability learning, based on the organisation turnover sub-
classification analysis (Author) Turnover of Organisations in
Millions sterling Mode value
Mean value
Median value
Classification based on median values
1-100 1 1.7 1 Traditional
100-1000 1 2.32 2 Learning
1000+ 1 2.63 3 Leading
Q12- there seems to be no change in the median responses (All agree on Leading). However
there are slight changes in the modal responses, as respondents belonging to large
organisations provided less optimistic responses than the others, but on contrast they
obtained the highest mean values. These results are shown in Figure A6.1
Figure A6.1: The evaluation of leaders’ motivation abilities within construction organisations, based on the organisation turnover
sub-classification analysis (Author)
0%
20%
40%
60%
80%
100%
Dis
trib
uti
on
of
resp
on
ses
amo
ng
eac
h c
lass
ific
atio
n
1000+
100-1000
1-100
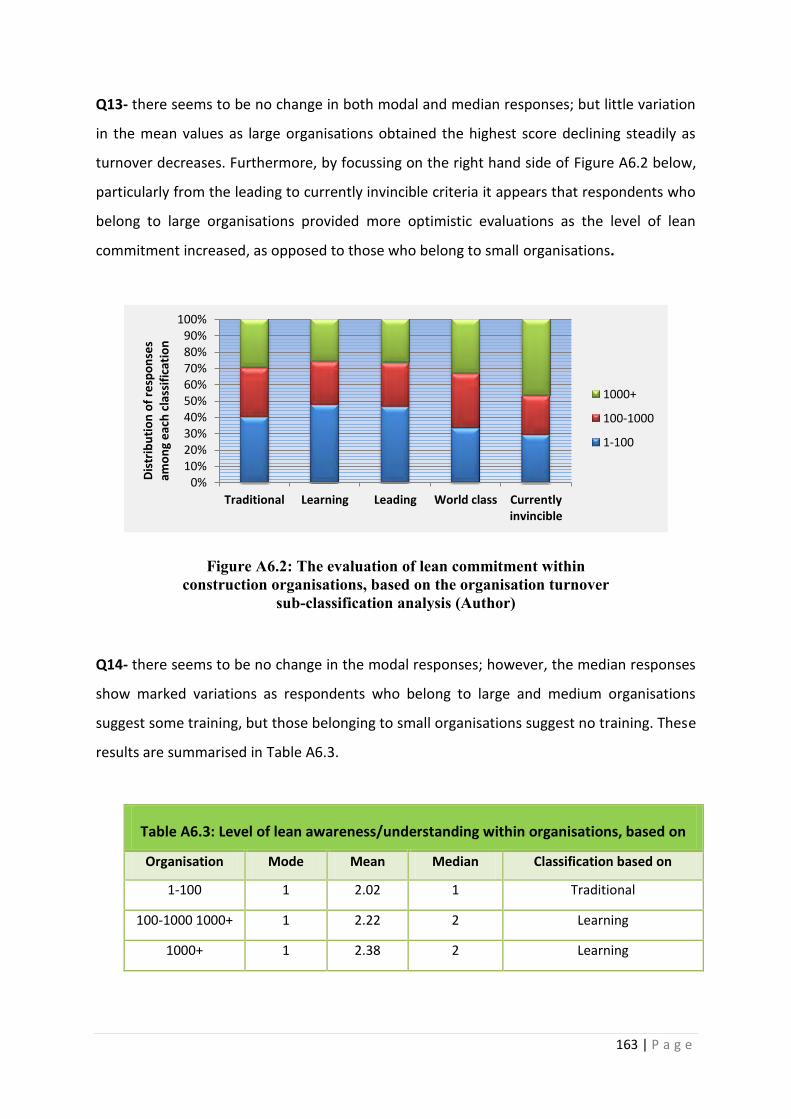
163 | P a g e
Q13- there seems to be no change in both modal and median responses; but little variation
in the mean values as large organisations obtained the highest score declining steadily as
turnover decreases. Furthermore, by focussing on the right hand side of Figure A6.2 below,
particularly from the leading to currently invincible criteria it appears that respondents who
belong to large organisations provided more optimistic evaluations as the level of lean
commitment increased, as opposed to those who belong to small organisations.
Figure A6.2: The evaluation of lean commitment within construction organisations, based on the organisation turnover
sub-classification analysis (Author)
Q14- there seems to be no change in the modal responses; however, the median responses
show marked variations as respondents who belong to large and medium organisations
suggest some training, but those belonging to small organisations suggest no training. These
results are summarised in Table A6.3.
Table A6.3: Level of lean awareness/understanding within organisations, based on
the turnover sub-classification analysis (Author) Organisation Mode
value
Mean
value
Median
value
Classification based on
median value 1-100 1 2.02 1 Traditional
100-1000 1000+ 1 2.22 2 Learning
1000+ 1 2.38 2 Learning
0% 10% 20% 30% 40% 50% 60% 70% 80% 90%
100%
Traditional Learning Leading World class Currently invincible
Dis
trib
uti
on
of
resp
on
ses
amo
ng
eac
h c
lass
ific
atio
n
1000+
100-1000
1-100

164 | P a g e
Q15- it is obvious that all agree on top two: long term contractual agreements and
document management systems. Also, all agree on bottom three: LPDS, All, and Other.
However, LPDS was selected by 29.41% of the respondents who belong to large
organisations declining significantly as turnover decreases; but respondents who belong to
medium organisations showed more consistent responses as both: All and LPDS were
selected equally (23.33%). Another important observation is that large organisations put IPD
as 4th (47.06%) decreasing significantly as turnover decreases (range 18.18% - 47.06%).
Q16- by referring to the organisation turnover sub-classification analysis, it appears that
turnover makes a little difference to the level of understanding of lean concepts and
practices, as large organisations obtained the highest score (63.96%) declining slightly as
turnover decreases (range 58.9% - 63.96%). However, small and medium organisations were
able to answer 8 statements correctly; while large organisations were able to illustrate their
awareness of lean concepts to 7 statements only as they were the only group amongst all
which did not agree with S10 (they achieved a frequency score= 45.45%). This statement
(S10) mentions that any procurement form that tends to delegate design work to external
designers, separates the design from the construction process; and therefore misses the
lean aim of collaboration and integration (Johansen & Walter, 2007).
Q17- by referring to the organisation turnover sub-classification, it appears that both
medium and large organisations agree on top three: collaborative planning, data analysis,
and then workplace organisations; but small organisations prioritise tasks differently. For
instance, the latter put work lace organisation, standardised work and problem solving as
1st, 2nd and 3rd respectively; but the others ranked them significantly lower.
Q18- it is obvious that LPS is used more frequently in larger organisation (in terms of
turnover and number of employees) than in smaller organisations.
Q19- it appears that those who belong to larger organisations are the most aware of the
techniques used for minimising uncertainty in production processes, as they put PDCA as
number 1 according to their modal responses.

165 | P a g e
Q20- Within larger organisations (100-1000 and 1000+) the visual management technique
was selected by 46.67% and 45.45% of the respondents respectively, and it came 1st in the
modal ranking. While in case of smaller organisations (1-100) only 29.66% of the
respondents selected the visual management technique, and it came 2nd in their modal
ranking (after the option ‘None’). When it comes to the frequency of using LPS for
organising the movement of materials, crews and production processes, medium
organisations come 1st (27.59%), followed by large organisations (18.18%) and then small
ones (11.9%).
Q21- there seems to be very significant variations as medium organisations came first
(76.67%), then large organisations (56.25%), and finally smaller organisations (only 18.6%),
as shown in Figure A6.3 below.
Figure A6.3: The amount of ‘successful’ experience with principles of TQM, SCM and CE, based on the
organisation turnover sub-classification analysis (Author)
Q22- it is noticeable that there is a change in the modal responses based on turnover. JIT
technique ranked 1st in case of large organisations (1000+), 2nd in case of medium
organisations (100-1000); and 3rd in case of small organisations (1-100).
Q23- it appears that the turnover of organisations makes a significant difference to the
frequency of using BIM; as larger organisations (100-1000 and 1000+) ranked BIM as 1st
while small organisations put it considerably lower (range 25.58% - 43.75%). Also, large
18.60%
76.77%
56.25%
0.00%
20.00%
40.00%
60.00%
80.00%
100.00%
1-100 100-1000 1000+ Pe
rce
nta
ge o
f su
cce
ssfu
l exp
eri
en
ce
wit
h T
QM
, SC
M, a
nd
CE
Sub-classification of Organisations according to their AAT in Milion Sterling Pounds

166 | P a g e
organisations ranked DSM as second while medium and small organisations put it
significantly lower (range 4.65% - 30%).
Q24- it appears that in all cases, the ‘None’ and ‘Not Applicable’ options always figured in
the top two modal responses. No other consensus otherwise.
Q25- One significant observation is that LPS is used for production control in larger
organisations much more frequently than in smaller ones (Table A6.4).
Table A6.4: The relation between Turnover of Organisations and the
frequency of using LPS for Production Control (Author)
Modal Order
Turnover (0-100) Turnover (100-1000) Turnover (1000+)
2 Performance measurement=18.6%
Planning= 38% Planning= 28.12%
3 Planning= 14% Management control= 31%
Production control= 28.12%
4 Logistics= 9.3% Production control= 20.69%
Performance measurement= 18.75%
5 Management control= 9.3%
Logistics= 20.69% Management control= 18.75%
6 Production control= 4.65%
Performance measurement= 20.69%
Other= 12%
Q26- it seems that turnover makes very little difference to the awareness/understanding of
the function of the PPC value in LPS (range 14% - 18.18%).
Q27- it appears that small organisations (1-100) rely mostly on experience of managers,
while in case of larger organisations (100-1000 & 1000+) 90% of the respondents who
belong to these organisations agree that results based KPI is the most commonly used.
Another clear observation is that the larger organisations (based on turnover and size) have
a higher tendency to establish their own metrics which is consistent with their business
strategy and includes leading indicators aiming to provide them with early warnings.
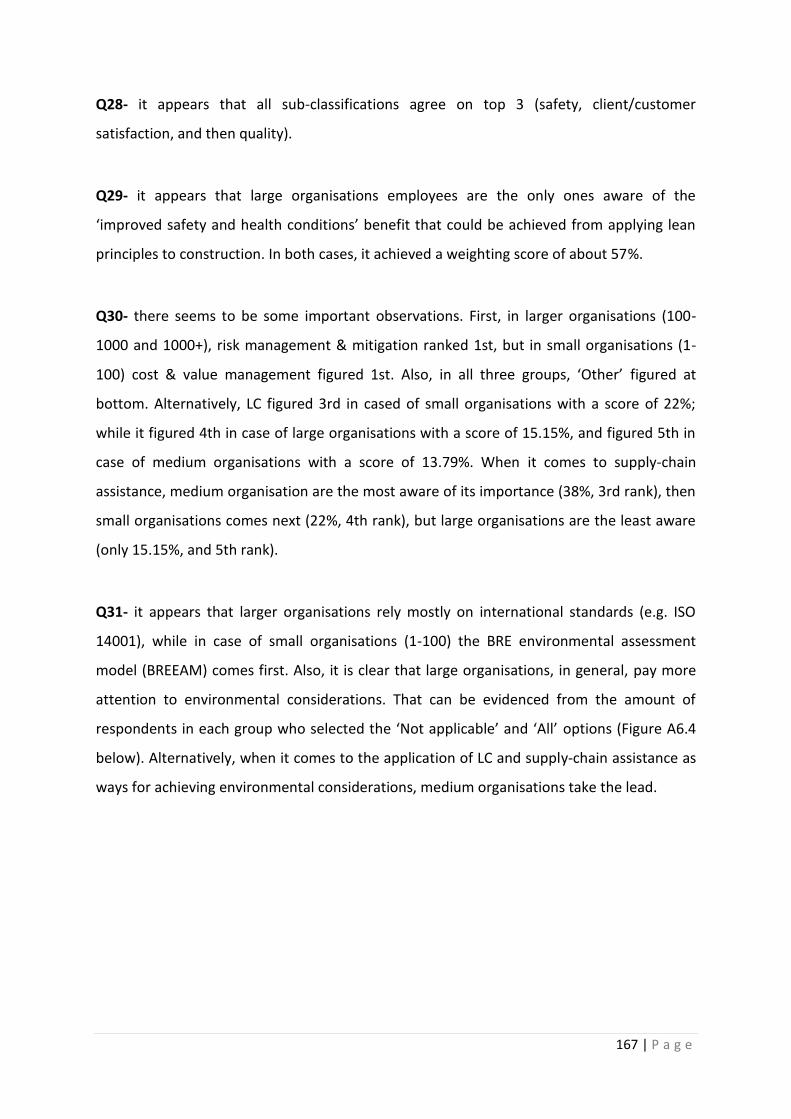
167 | P a g e
Q28- it appears that all sub-classifications agree on top 3 (safety, client/customer
satisfaction, and then quality).
Q29- it appears that large organisations employees are the only ones aware of the
‘improved safety and health conditions’ benefit that could be achieved from applying lean
principles to construction. In both cases, it achieved a weighting score of about 57%.
Q30- there seems to be some important observations. First, in larger organisations (100-
1000 and 1000+), risk management & mitigation ranked 1st, but in small organisations (1-
100) cost & value management figured 1st. Also, in all three groups, ‘Other’ figured at
bottom. Alternatively, LC figured 3rd in cased of small organisations with a score of 22%;
while it figured 4th in case of large organisations with a score of 15.15%, and figured 5th in
case of medium organisations with a score of 13.79%. When it comes to supply-chain
assistance, medium organisation are the most aware of its importance (38%, 3rd rank), then
small organisations comes next (22%, 4th rank), but large organisations are the least aware
(only 15.15%, and 5th rank).
Q31- it appears that larger organisations rely mostly on international standards (e.g. ISO
14001), while in case of small organisations (1-100) the BRE environmental assessment
model (BREEAM) comes first. Also, it is clear that large organisations, in general, pay more
attention to environmental considerations. That can be evidenced from the amount of
respondents in each group who selected the ‘Not applicable’ and ‘All’ options (Figure A6.4
below). Alternatively, when it comes to the application of LC and supply-chain assistance as
ways for achieving environmental considerations, medium organisations take the lead.
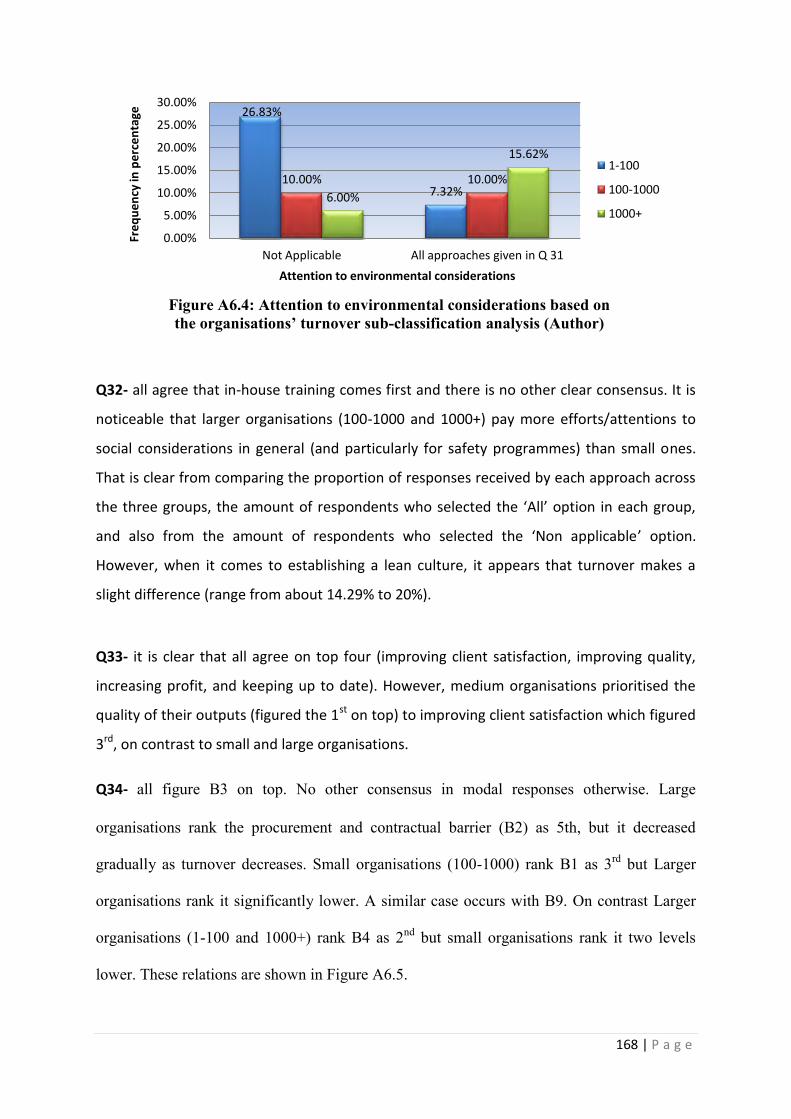
168 | P a g e
Figure A6.4: Attention to environmental considerations based on the organisations’ turnover sub-classification analysis (Author)
Q32- all agree that in-house training comes first and there is no other clear consensus. It is
noticeable that larger organisations (100-1000 and 1000+) pay more efforts/attentions to
social considerations in general (and particularly for safety programmes) than small ones.
That is clear from comparing the proportion of responses received by each approach across
the three groups, the amount of respondents who selected the ‘All’ option in each group,
and also from the amount of respondents who selected the ‘Non applicable’ option.
However, when it comes to establishing a lean culture, it appears that turnover makes a
slight difference (range from about 14.29% to 20%).
Q33- it is clear that all agree on top four (improving client satisfaction, improving quality,
increasing profit, and keeping up to date). However, medium organisations prioritised the
quality of their outputs (figured the 1st on top) to improving client satisfaction which figured
3rd, on contrast to small and large organisations.
Q34- all figure B3 on top. No other consensus in modal responses otherwise. Large
organisations rank the procurement and contractual barrier (B2) as 5th, but it decreased
gradually as turnover decreases. Small organisations (100-1000) rank B1 as 3rd but Larger
organisations rank it significantly lower. A similar case occurs with B9. On contrast Larger
organisations (1-100 and 1000+) rank B4 as 2nd but small organisations rank it two levels
lower. These relations are shown in Figure A6.5.
26.83%
7.32% 10.00% 10.00%
6.00%
15.62%
0.00%
5.00%
10.00%
15.00%
20.00%
25.00%
30.00%
Not Applicable All approaches given in Q 31
Fre
qu
en
cy in
pe
rce
nta
ge
Attention to environmental considerations
1-100
100-1000
1000+
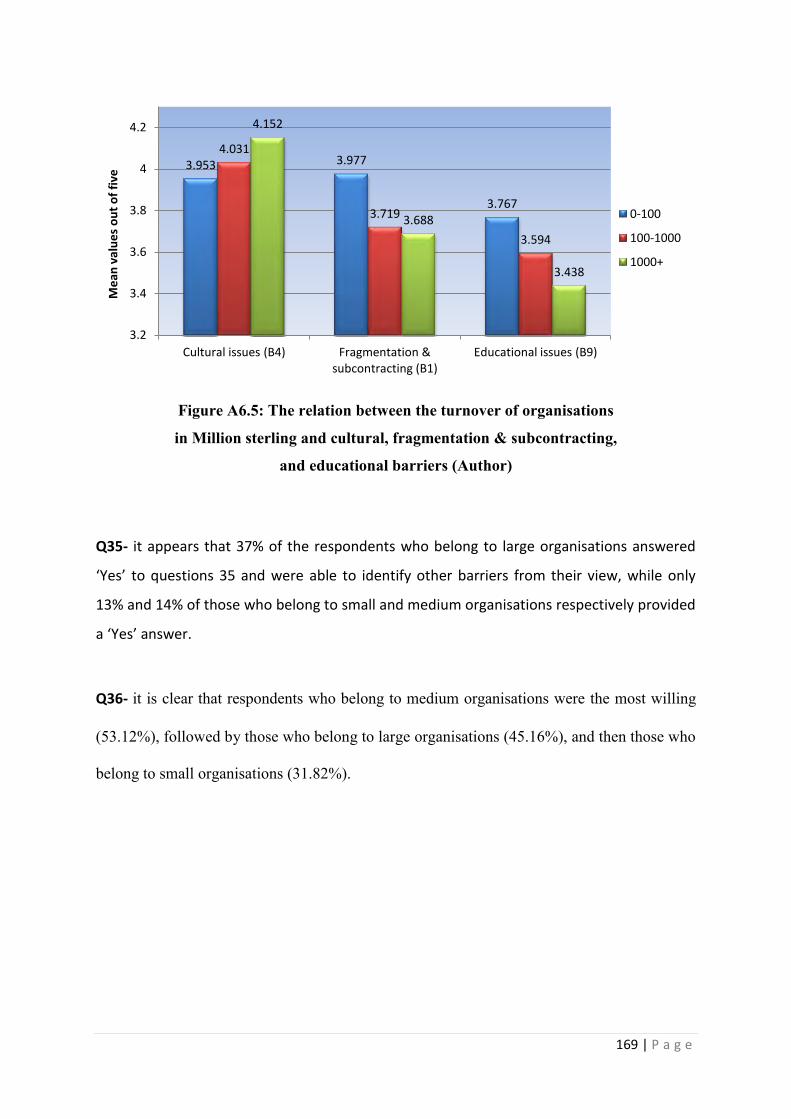
169 | P a g e
Figure A6.5: The relation between the turnover of organisations
in Million sterling and cultural, fragmentation & subcontracting,
and educational barriers (Author)
Q35- it appears that 37% of the respondents who belong to large organisations answered
‘Yes’ to questions 35 and were able to identify other barriers from their view, while only
13% and 14% of those who belong to small and medium organisations respectively provided
a ‘Yes’ answer.
Q36- it is clear that respondents who belong to medium organisations were the most willing
(53.12%), followed by those who belong to large organisations (45.16%), and then those who
belong to small organisations (31.82%).
3.953 3.977
3.767
4.031
3.719
3.594
4.152
3.688
3.438
3.2
3.4
3.6
3.8
4
4.2
Cultural issues (B4) Fragmentation & subcontracting (B1)
Educational issues (B9)
Me
an v
alu
es
ou
t o
f fi
ve
0-100
100-1000
1000+
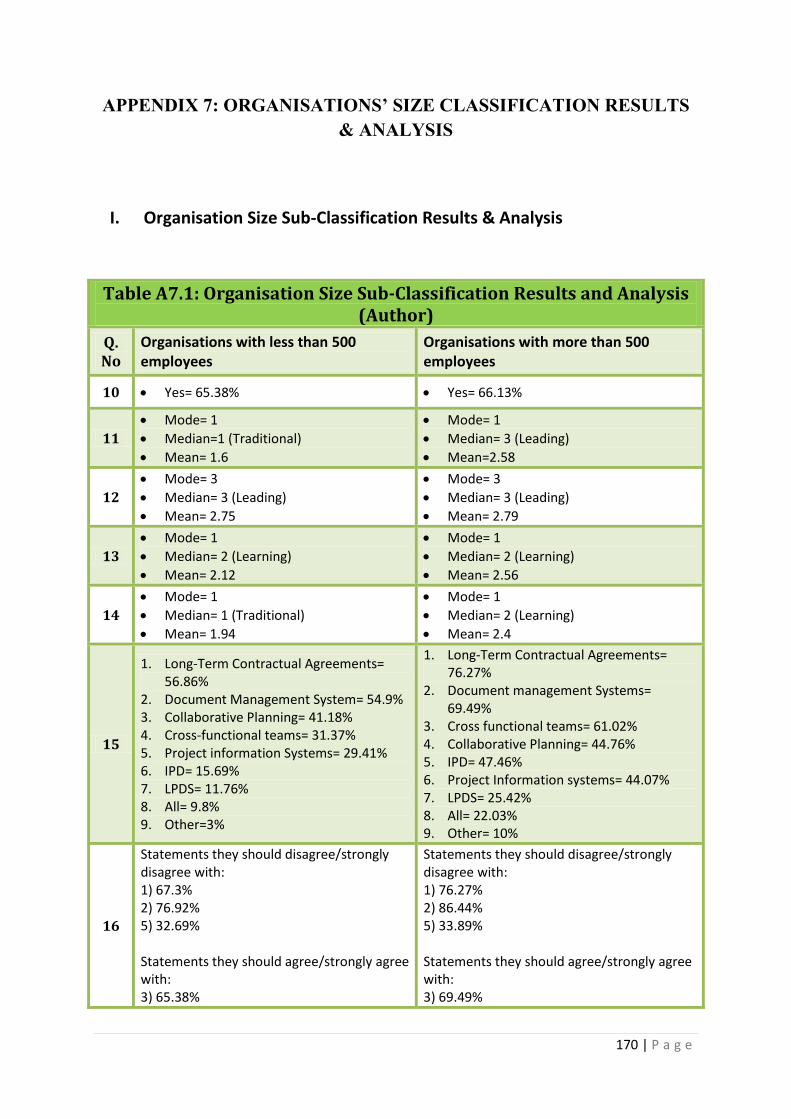
170 | P a g e
APPENDIX 7: ORGANISATIONS’ SIZE CLASSIFICATION RESULTS & ANALYSIS
I. Organisation Size Sub-Classification Results & Analysis
Table A7.1: Organisation Size Sub-Classification Results and Analysis (Author)
Q. No
Organisations with less than 500 employees
Organisations with more than 500 employees
10 Yes= 65.38% Yes= 66.13%
11
Mode= 1
Median=1 (Traditional)
Mean= 1.6
Mode= 1
Median= 3 (Leading)
Mean=2.58
12
Mode= 3
Median= 3 (Leading)
Mean= 2.75
Mode= 3
Median= 3 (Leading)
Mean= 2.79
13
Mode= 1
Median= 2 (Learning)
Mean= 2.12
Mode= 1
Median= 2 (Learning)
Mean= 2.56
14
Mode= 1
Median= 1 (Traditional)
Mean= 1.94
Mode= 1
Median= 2 (Learning)
Mean= 2.4
15
1. Long-Term Contractual Agreements= 56.86%
2. Document Management System= 54.9% 3. Collaborative Planning= 41.18% 4. Cross-functional teams= 31.37% 5. Project information Systems= 29.41% 6. IPD= 15.69% 7. LPDS= 11.76% 8. All= 9.8% 9. Other=3%
1. Long-Term Contractual Agreements= 76.27%
2. Document management Systems= 69.49%
3. Cross functional teams= 61.02% 4. Collaborative Planning= 44.76% 5. IPD= 47.46% 6. Project Information systems= 44.07% 7. LPDS= 25.42% 8. All= 22.03% 9. Other= 10%
16
Statements they should disagree/strongly disagree with: 1) 67.3% 2) 76.92% 5) 32.69% Statements they should agree/strongly agree with: 3) 65.38%
Statements they should disagree/strongly disagree with: 1) 76.27% 2) 86.44% 5) 33.89% Statements they should agree/strongly agree with: 3) 69.49%

171 | P a g e
4) 59.61% 6) 23.08% 7) 30.77% 8) 86.28% 9) 74.51% 10) 57.69% 11) 78.85% 8 correct out of 11 Average score= 59.37%
4) 59.32% 6) 32.2% 7) 39.66% 8) 94.92% 9) 64.4% 10) 51.72% 11) 81.35% 8 correct out of 11 Average score= 62.69%
17
1. Workplace organisation= 57.14% 2. Standardised work= 57.14% 3. Problem solving= 46.94% 4. Collaborative Planning= 44.9% 5. Data Analysis= 42.86% 6. Process mapping= 40.82% 7. Visual management= 38.78% 8. Work sequence analysis= 30.61% 9. None= 12.24% 10. All= 10.2% 11. Other= 6%
1. Collaborative Planning= 54.24% 2. Data Analysis= 52.54% 3. Workplace organisation= 49.15% 4. Problem solving= 47.46% 5. Work sequence analysis= 45.76% 6. Visual management= 45.76% 7. Standardised work= 44.07% 8. Process mapping= 37.29% 9. All= 23.73% 10. None= 8.47% 11. Other= 8%
18
1. CPM= 48% 2. Look ahead planning= 42% 3. PCP tools= 30% 4. N/A= 24% 5. Workflow PM= 24% 6. Constraint analysis= 18% 7. LPS= 16% 8. Other= 12% 9. RPS= 8%
1. CPM= 75.86% 2. PCP tools= 55.17% 3. Look ahead planning= 51.72% 4. Constraint analysis= 32.76% 5. Workflow PM= 22.41%% 6. LPS= 22.41% 7. RPS= 12.07% 8. N/A= 12.07% 9. Other= 10%
19
1. None= 54% 2. PDCA= 30% 3. Prefabrication= 16% 4. Other= 12% 5. First Run studies= 10%
1. PDCA= 46.55% 2. None= 34.48% 3. Prefabrication strategies= 25.86% 4. First Run studies= 13.79% 5. Other= 10%
20
1. N/A= 59.18% 2. Visual Management= 22.45% 3. LPS= 16.33% 4. CFP= 10.2% 5. Other= 8% 6. Crane= 6.12%
1. Visual Management= 40.35% 2. N/A= 33.33% 3. CFP= 19.3% 4. LPS= 19.3% 5. Crane= 10.53% 6. Other= 10%
21 Yes= 22.45% Yes= 66.67%
22
1. Don't know= 34.69% 2. Just-In-Time= 32.65% 3. N/A= 28.57% 4. Value stream analysis= 6.12% 5. Kanban System= 2.04%
1. Don’t know= 33.33% 2. JIT= 28.07% 3. N/A= 22.81% 4. Other= 14% 5. VS analysis= 12.28%
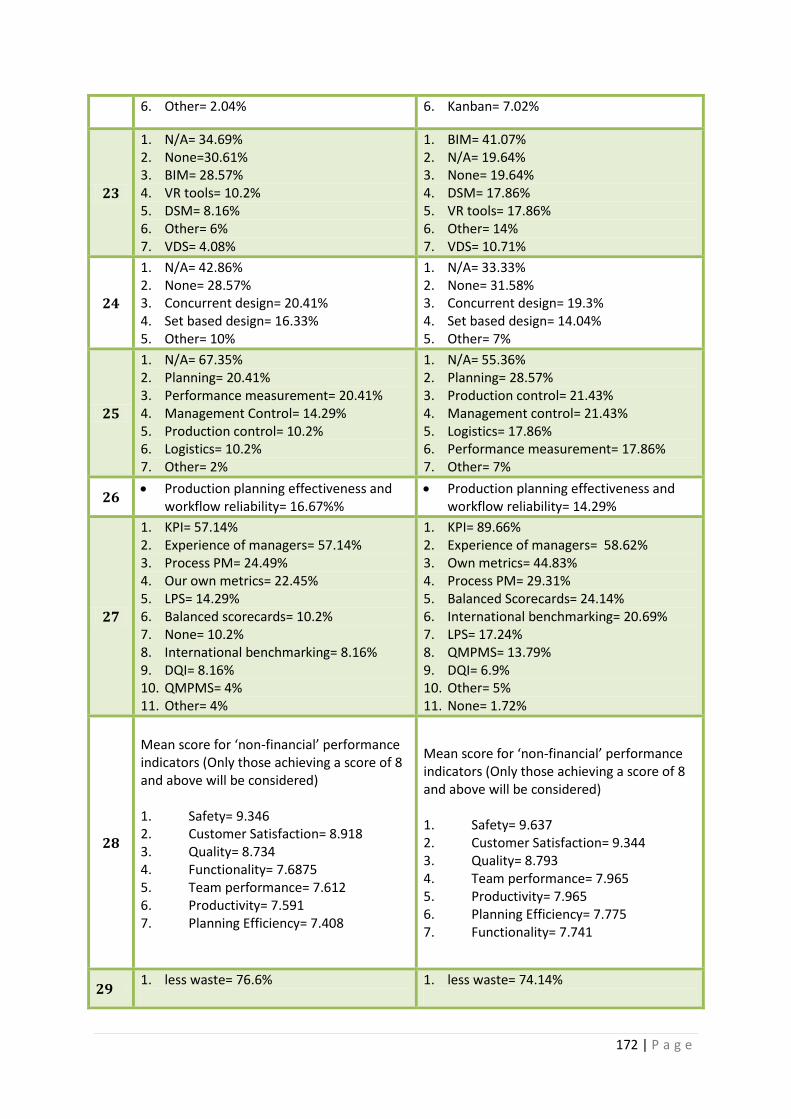
172 | P a g e
6. Other= 2.04% 6. Kanban= 7.02%
23
1. N/A= 34.69% 2. None=30.61% 3. BIM= 28.57% 4. VR tools= 10.2% 5. DSM= 8.16% 6. Other= 6% 7. VDS= 4.08%
1. BIM= 41.07% 2. N/A= 19.64% 3. None= 19.64% 4. DSM= 17.86% 5. VR tools= 17.86% 6. Other= 14% 7. VDS= 10.71%
24
1. N/A= 42.86% 2. None= 28.57% 3. Concurrent design= 20.41% 4. Set based design= 16.33% 5. Other= 10%
1. N/A= 33.33% 2. None= 31.58% 3. Concurrent design= 19.3% 4. Set based design= 14.04% 5. Other= 7%
25
1. N/A= 67.35% 2. Planning= 20.41% 3. Performance measurement= 20.41% 4. Management Control= 14.29% 5. Production control= 10.2% 6. Logistics= 10.2% 7. Other= 2%
1. N/A= 55.36% 2. Planning= 28.57% 3. Production control= 21.43% 4. Management control= 21.43% 5. Logistics= 17.86% 6. Performance measurement= 17.86% 7. Other= 7%
26 Production planning effectiveness and
workflow reliability= 16.67%% Production planning effectiveness and
workflow reliability= 14.29%
27
1. KPI= 57.14% 2. Experience of managers= 57.14% 3. Process PM= 24.49% 4. Our own metrics= 22.45% 5. LPS= 14.29% 6. Balanced scorecards= 10.2% 7. None= 10.2% 8. International benchmarking= 8.16% 9. DQI= 8.16% 10. QMPMS= 4% 11. Other= 4%
1. KPI= 89.66% 2. Experience of managers= 58.62% 3. Own metrics= 44.83% 4. Process PM= 29.31% 5. Balanced Scorecards= 24.14% 6. International benchmarking= 20.69% 7. LPS= 17.24% 8. QMPMS= 13.79% 9. DQI= 6.9% 10. Other= 5% 11. None= 1.72%
28
Mean score for ‘non-financial’ performance indicators (Only those achieving a score of 8 and above will be considered) 1. Safety= 9.346 2. Customer Satisfaction= 8.918 3. Quality= 8.734 4. Functionality= 7.6875 5. Team performance= 7.612 6. Productivity= 7.591 7. Planning Efficiency= 7.408
Mean score for ‘non-financial’ performance indicators (Only those achieving a score of 8 and above will be considered) 1. Safety= 9.637 2. Customer Satisfaction= 9.344 3. Quality= 8.793 4. Team performance= 7.965 5. Productivity= 7.965 6. Planning Efficiency= 7.775 7. Functionality= 7.741
29 1. less waste= 76.6%
1. less waste= 74.14%
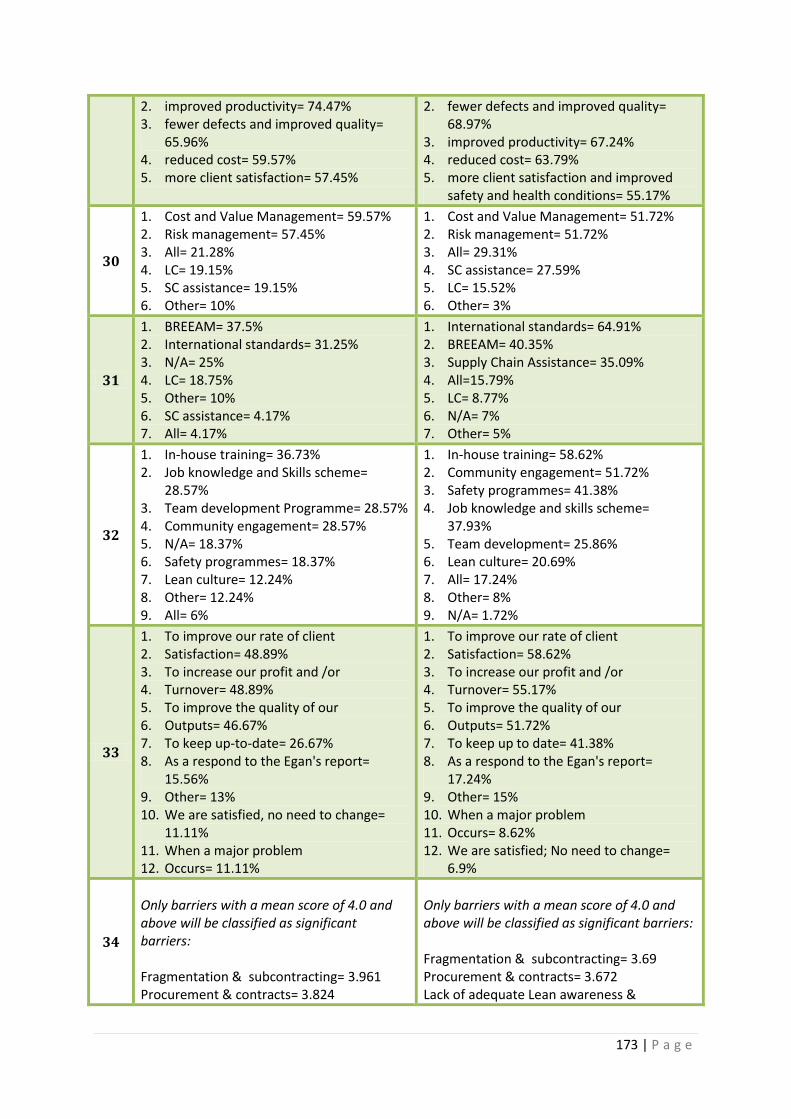
173 | P a g e
2. improved productivity= 74.47% 3. fewer defects and improved quality=
65.96% 4. reduced cost= 59.57% 5. more client satisfaction= 57.45%
2. fewer defects and improved quality= 68.97%
3. improved productivity= 67.24% 4. reduced cost= 63.79% 5. more client satisfaction and improved
safety and health conditions= 55.17%
30
1. Cost and Value Management= 59.57% 2. Risk management= 57.45% 3. All= 21.28% 4. LC= 19.15% 5. SC assistance= 19.15% 6. Other= 10%
1. Cost and Value Management= 51.72% 2. Risk management= 51.72% 3. All= 29.31% 4. SC assistance= 27.59% 5. LC= 15.52% 6. Other= 3%
31
1. BREEAM= 37.5% 2. International standards= 31.25% 3. N/A= 25% 4. LC= 18.75% 5. Other= 10% 6. SC assistance= 4.17% 7. All= 4.17%
1. International standards= 64.91% 2. BREEAM= 40.35% 3. Supply Chain Assistance= 35.09% 4. All=15.79% 5. LC= 8.77% 6. N/A= 7% 7. Other= 5%
32
1. In-house training= 36.73% 2. Job knowledge and Skills scheme=
28.57% 3. Team development Programme= 28.57% 4. Community engagement= 28.57% 5. N/A= 18.37% 6. Safety programmes= 18.37% 7. Lean culture= 12.24% 8. Other= 12.24% 9. All= 6%
1. In-house training= 58.62% 2. Community engagement= 51.72% 3. Safety programmes= 41.38% 4. Job knowledge and skills scheme=
37.93% 5. Team development= 25.86% 6. Lean culture= 20.69% 7. All= 17.24% 8. Other= 8% 9. N/A= 1.72%
33
1. To improve our rate of client 2. Satisfaction= 48.89% 3. To increase our profit and /or 4. Turnover= 48.89% 5. To improve the quality of our 6. Outputs= 46.67% 7. To keep up-to-date= 26.67% 8. As a respond to the Egan's report=
15.56% 9. Other= 13% 10. We are satisfied, no need to change=
11.11% 11. When a major problem 12. Occurs= 11.11%
1. To improve our rate of client 2. Satisfaction= 58.62% 3. To increase our profit and /or 4. Turnover= 55.17% 5. To improve the quality of our 6. Outputs= 51.72% 7. To keep up to date= 41.38% 8. As a respond to the Egan's report=
17.24% 9. Other= 15% 10. When a major problem 11. Occurs= 8.62% 12. We are satisfied; No need to change=
6.9%
34
Only barriers with a mean score of 4.0 and above will be classified as significant barriers: Fragmentation & subcontracting= 3.961 Procurement & contracts= 3.824
Only barriers with a mean score of 4.0 and above will be classified as significant barriers: Fragmentation & subcontracting= 3.69 Procurement & contracts= 3.672 Lack of adequate Lean awareness &
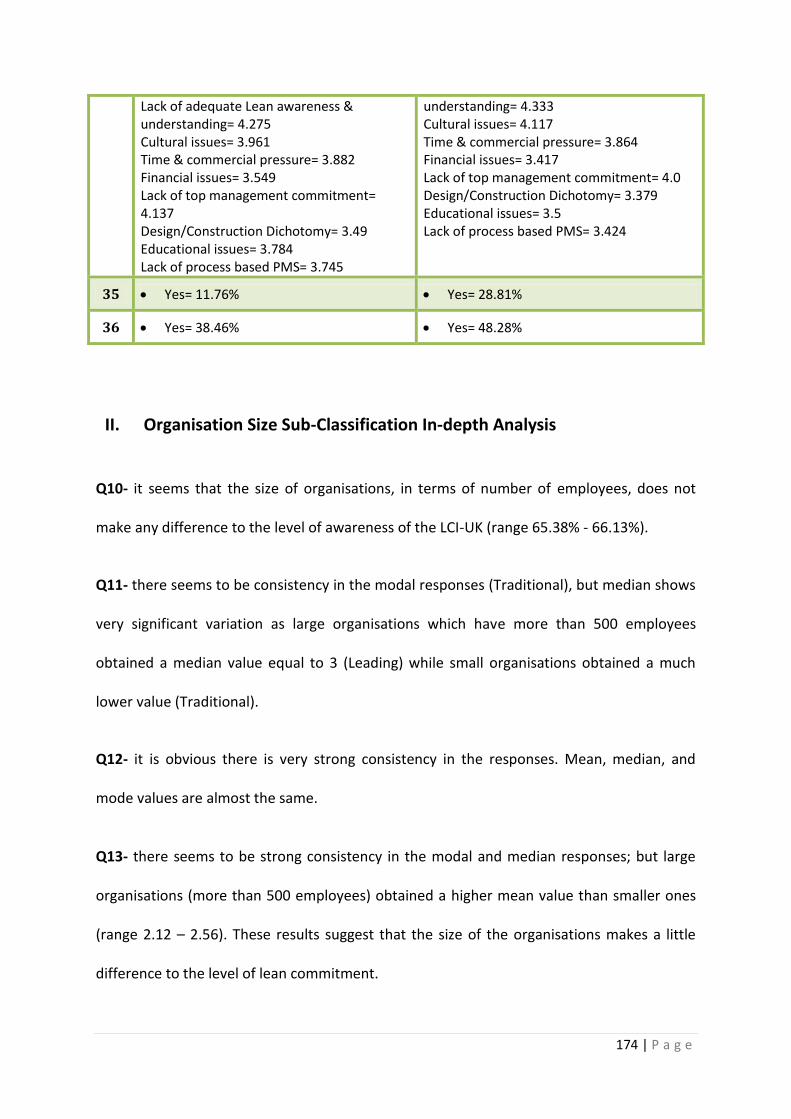
174 | P a g e
Lack of adequate Lean awareness & understanding= 4.275 Cultural issues= 3.961 Time & commercial pressure= 3.882 Financial issues= 3.549 Lack of top management commitment= 4.137 Design/Construction Dichotomy= 3.49 Educational issues= 3.784 Lack of process based PMS= 3.745
understanding= 4.333 Cultural issues= 4.117 Time & commercial pressure= 3.864 Financial issues= 3.417 Lack of top management commitment= 4.0 Design/Construction Dichotomy= 3.379 Educational issues= 3.5 Lack of process based PMS= 3.424
35 Yes= 11.76% Yes= 28.81%
36 Yes= 38.46% Yes= 48.28%
II. Organisation Size Sub-Classification In-depth Analysis
Q10- it seems that the size of organisations, in terms of number of employees, does not
make any difference to the level of awareness of the LCI-UK (range 65.38% - 66.13%).
Q11- there seems to be consistency in the modal responses (Traditional), but median shows
very significant variation as large organisations which have more than 500 employees
obtained a median value equal to 3 (Leading) while small organisations obtained a much
lower value (Traditional).
Q12- it is obvious there is very strong consistency in the responses. Mean, median, and
mode values are almost the same.
Q13- there seems to be strong consistency in the modal and median responses; but large
organisations (more than 500 employees) obtained a higher mean value than smaller ones
(range 2.12 – 2.56). These results suggest that the size of the organisations makes a little
difference to the level of lean commitment.

175 | P a g e
Q14- there is no change in modal responses, but there seems to be some variations in
median responses as respondents who belong to large organisations (more than 500
employees) suggest some training, but those belonging to small organisations suggest no
training. There is also noticeable difference in the mean values, as small organisations
obtained a mean value equal to 1.9, but large organisations obtained a mean value equal to
2.4.
Q15- it appears that both agree on top two: long term contractual agreements and
document management systems. Also both agree on bottom three: LPDS, All, and Other.
However LPDS was selected by 25.42% of the respondents who belong to large
organisations (more than 500 employees), while it was selected by only 11.76% of those
who belong to smaller organisations. Similarly, the former put IPD as 5th (selected by
47.46% of the respondents), but the latter ranked it as 6th (only 15.69% of the
respondents).
Q16- it seems that size of organisations (in terms of number of employees) makes a limited
difference to the level of understanding of lean concepts and practices. Large organisations
obtained a score= 62.69%, while small organisations obtained a score= 59.37%. Also, both
answered 8 statements correctly.
Q17- it appears very clearly that the same relations analysed before (organisation turnover
sub-classification analysis) exists exactly. The only difference is that when comparing
according to size, it appears more clearly that large organisations selected the ‘All’ option
more frequently than smaller organisations (range 10% - 23.73%).
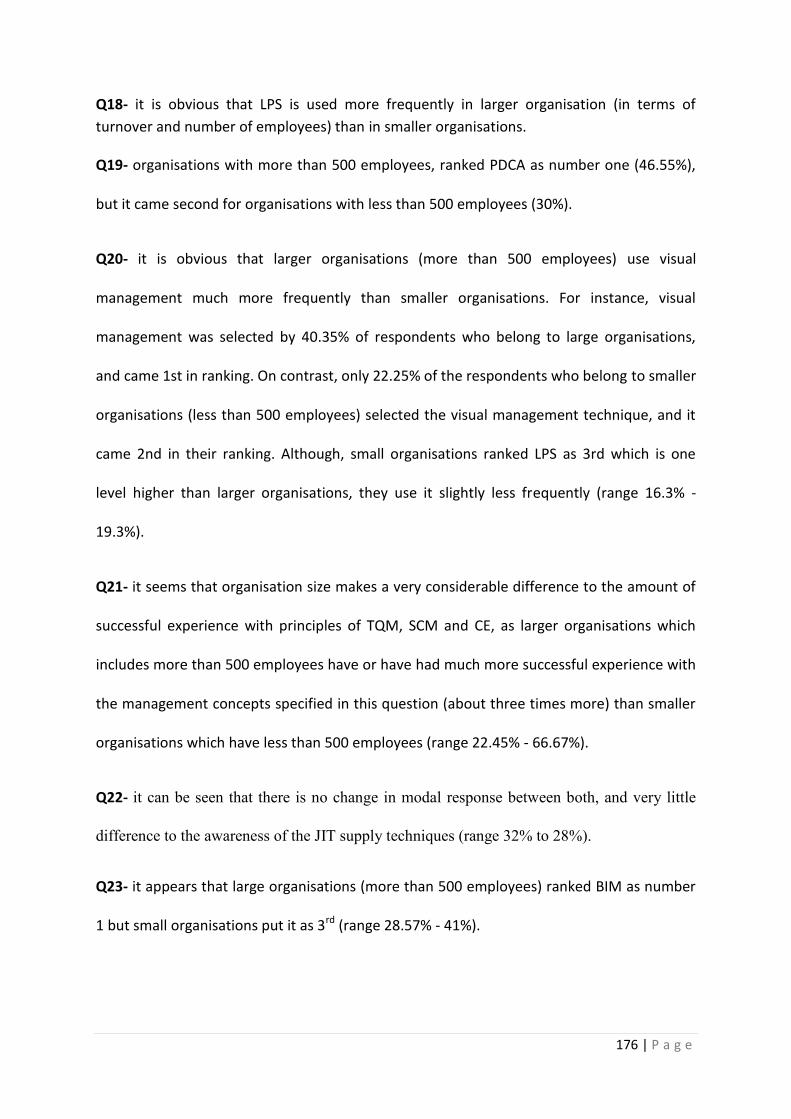
176 | P a g e
Q18- it is obvious that LPS is used more frequently in larger organisation (in terms of
turnover and number of employees) than in smaller organisations.
Q19- organisations with more than 500 employees, ranked PDCA as number one (46.55%),
but it came second for organisations with less than 500 employees (30%).
Q20- it is obvious that larger organisations (more than 500 employees) use visual
management much more frequently than smaller organisations. For instance, visual
management was selected by 40.35% of respondents who belong to large organisations,
and came 1st in ranking. On contrast, only 22.25% of the respondents who belong to smaller
organisations (less than 500 employees) selected the visual management technique, and it
came 2nd in their ranking. Although, small organisations ranked LPS as 3rd which is one
level higher than larger organisations, they use it slightly less frequently (range 16.3% -
19.3%).
Q21- it seems that organisation size makes a very considerable difference to the amount of
successful experience with principles of TQM, SCM and CE, as larger organisations which
includes more than 500 employees have or have had much more successful experience with
the management concepts specified in this question (about three times more) than smaller
organisations which have less than 500 employees (range 22.45% - 66.67%).
Q22- it can be seen that there is no change in modal response between both, and very little
difference to the awareness of the JIT supply techniques (range 32% to 28%).
Q23- it appears that large organisations (more than 500 employees) ranked BIM as number
1 but small organisations put it as 3rd (range 28.57% - 41%).
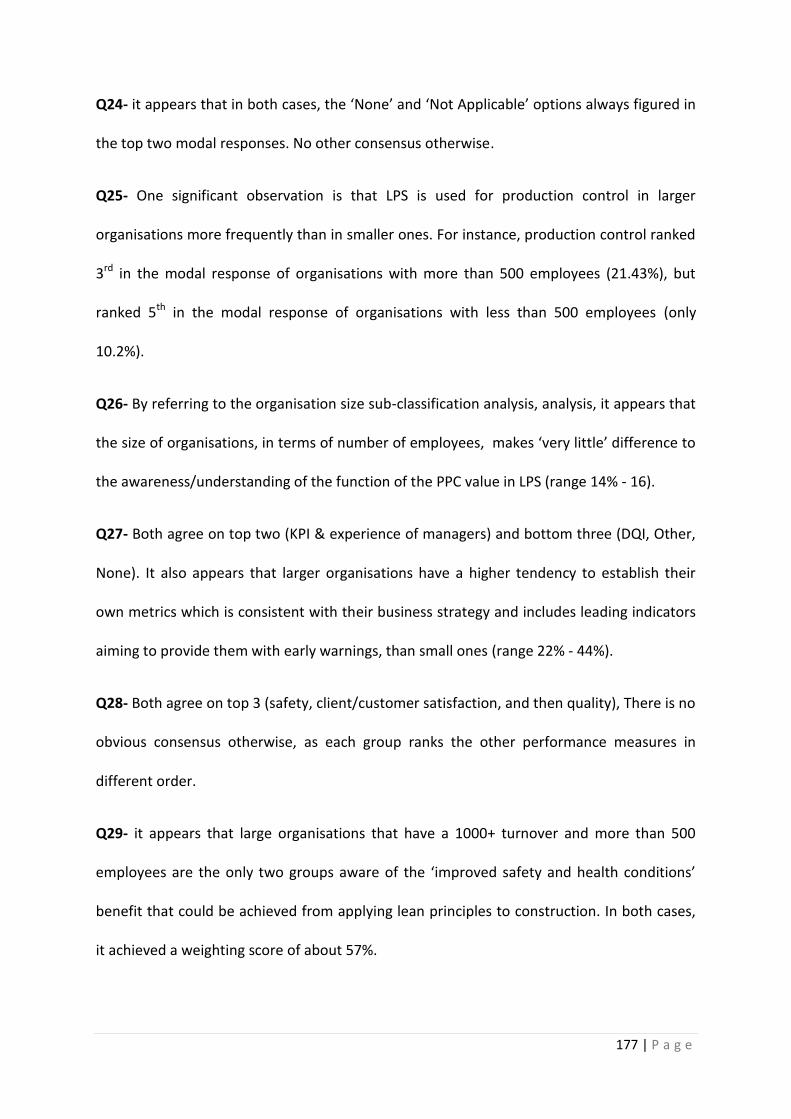
177 | P a g e
Q24- it appears that in both cases, the ‘None’ and ‘Not Applicable’ options always figured in
the top two modal responses. No other consensus otherwise.
Q25- One significant observation is that LPS is used for production control in larger
organisations more frequently than in smaller ones. For instance, production control ranked
3rd in the modal response of organisations with more than 500 employees (21.43%), but
ranked 5th in the modal response of organisations with less than 500 employees (only
10.2%).
Q26- By referring to the organisation size sub-classification analysis, analysis, it appears that
the size of organisations, in terms of number of employees, makes ‘very little’ difference to
the awareness/understanding of the function of the PPC value in LPS (range 14% - 16).
Q27- Both agree on top two (KPI & experience of managers) and bottom three (DQI, Other,
None). It also appears that larger organisations have a higher tendency to establish their
own metrics which is consistent with their business strategy and includes leading indicators
aiming to provide them with early warnings, than small ones (range 22% - 44%).
Q28- Both agree on top 3 (safety, client/customer satisfaction, and then quality), There is no
obvious consensus otherwise, as each group ranks the other performance measures in
different order.
Q29- it appears that large organisations that have a 1000+ turnover and more than 500
employees are the only two groups aware of the ‘improved safety and health conditions’
benefit that could be achieved from applying lean principles to construction. In both cases,
it achieved a weighting score of about 57%.
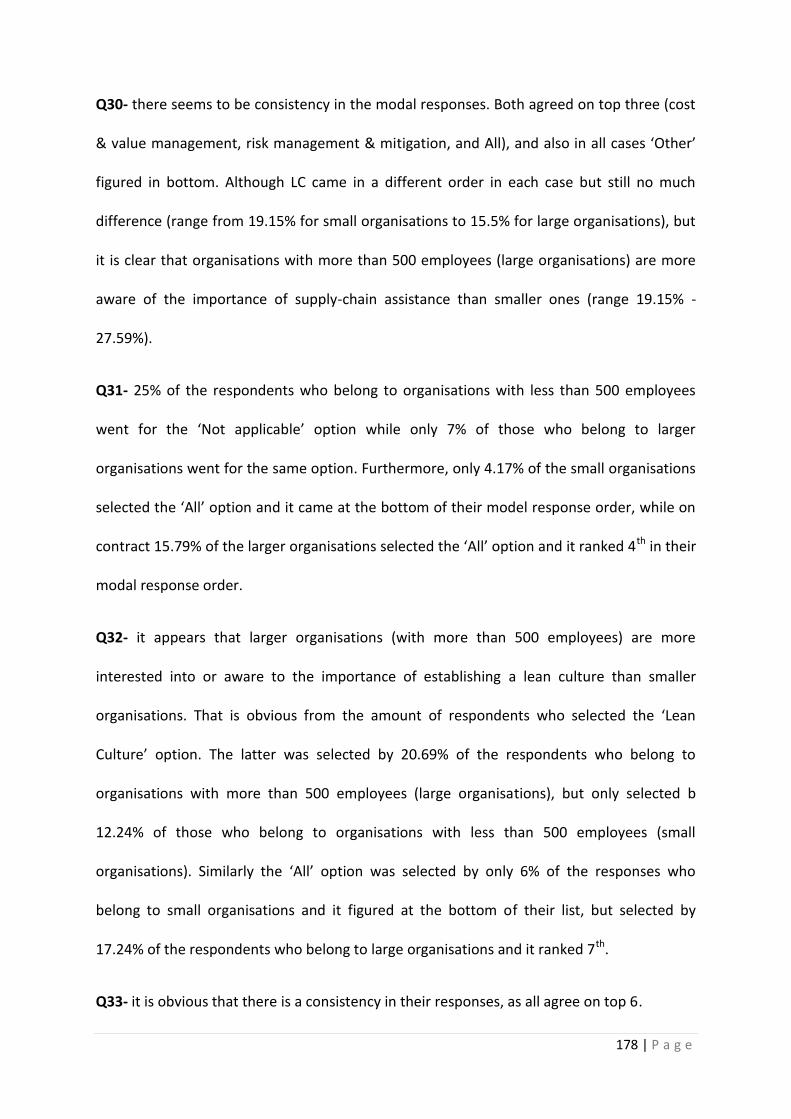
178 | P a g e
Q30- there seems to be consistency in the modal responses. Both agreed on top three (cost
& value management, risk management & mitigation, and All), and also in all cases ‘Other’
figured in bottom. Although LC came in a different order in each case but still no much
difference (range from 19.15% for small organisations to 15.5% for large organisations), but
it is clear that organisations with more than 500 employees (large organisations) are more
aware of the importance of supply-chain assistance than smaller ones (range 19.15% -
27.59%).
Q31- 25% of the respondents who belong to organisations with less than 500 employees
went for the ‘Not applicable’ option while only 7% of those who belong to larger
organisations went for the same option. Furthermore, only 4.17% of the small organisations
selected the ‘All’ option and it came at the bottom of their model response order, while on
contract 15.79% of the larger organisations selected the ‘All’ option and it ranked 4th in their
modal response order.
Q32- it appears that larger organisations (with more than 500 employees) are more
interested into or aware to the importance of establishing a lean culture than smaller
organisations. That is obvious from the amount of respondents who selected the ‘Lean
Culture’ option. The latter was selected by 20.69% of the respondents who belong to
organisations with more than 500 employees (large organisations), but only selected b
12.24% of those who belong to organisations with less than 500 employees (small
organisations). Similarly the ‘All’ option was selected by only 6% of the responses who
belong to small organisations and it figured at the bottom of their list, but selected by
17.24% of the respondents who belong to large organisations and it ranked 7th.
Q33- it is obvious that there is a consistency in their responses, as all agree on top 6.
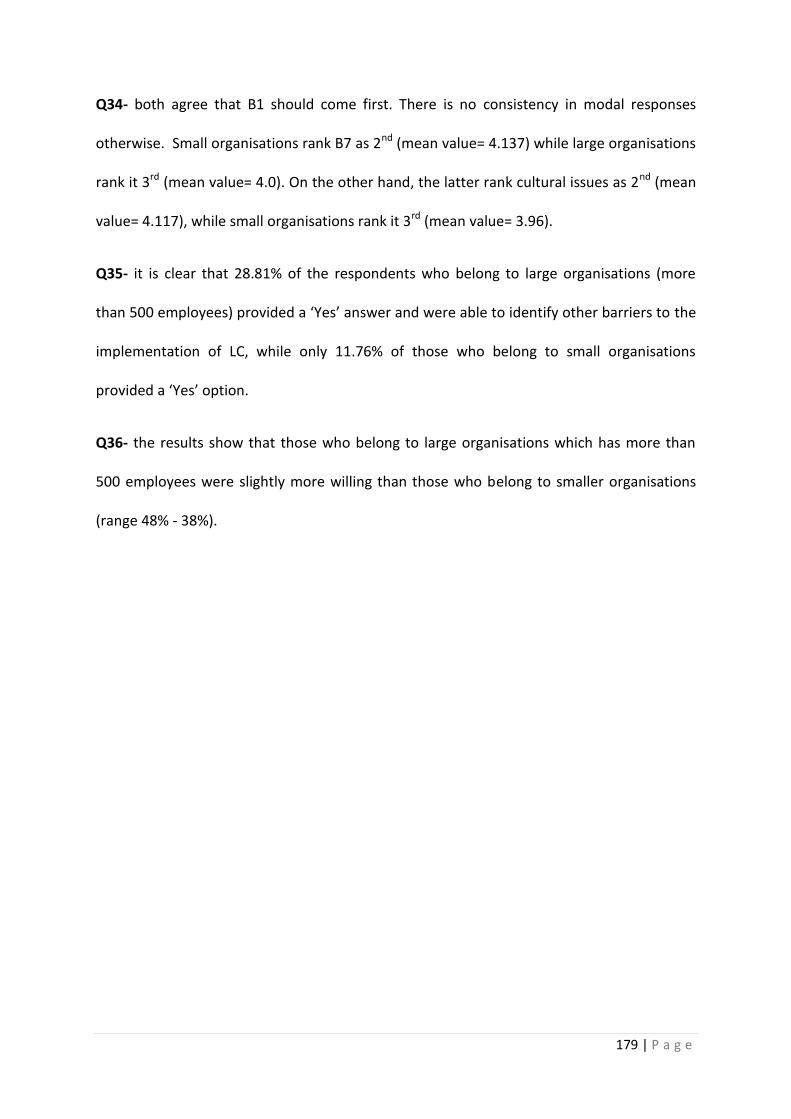
179 | P a g e
Q34- both agree that B1 should come first. There is no consistency in modal responses
otherwise. Small organisations rank B7 as 2nd (mean value= 4.137) while large organisations
rank it 3rd (mean value= 4.0). On the other hand, the latter rank cultural issues as 2nd (mean
value= 4.117), while small organisations rank it 3rd (mean value= 3.96).
Q35- it is clear that 28.81% of the respondents who belong to large organisations (more
than 500 employees) provided a ‘Yes’ answer and were able to identify other barriers to the
implementation of LC, while only 11.76% of those who belong to small organisations
provided a ‘Yes’ option.
Q36- the results show that those who belong to large organisations which has more than
500 employees were slightly more willing than those who belong to smaller organisations
(range 48% - 38%).
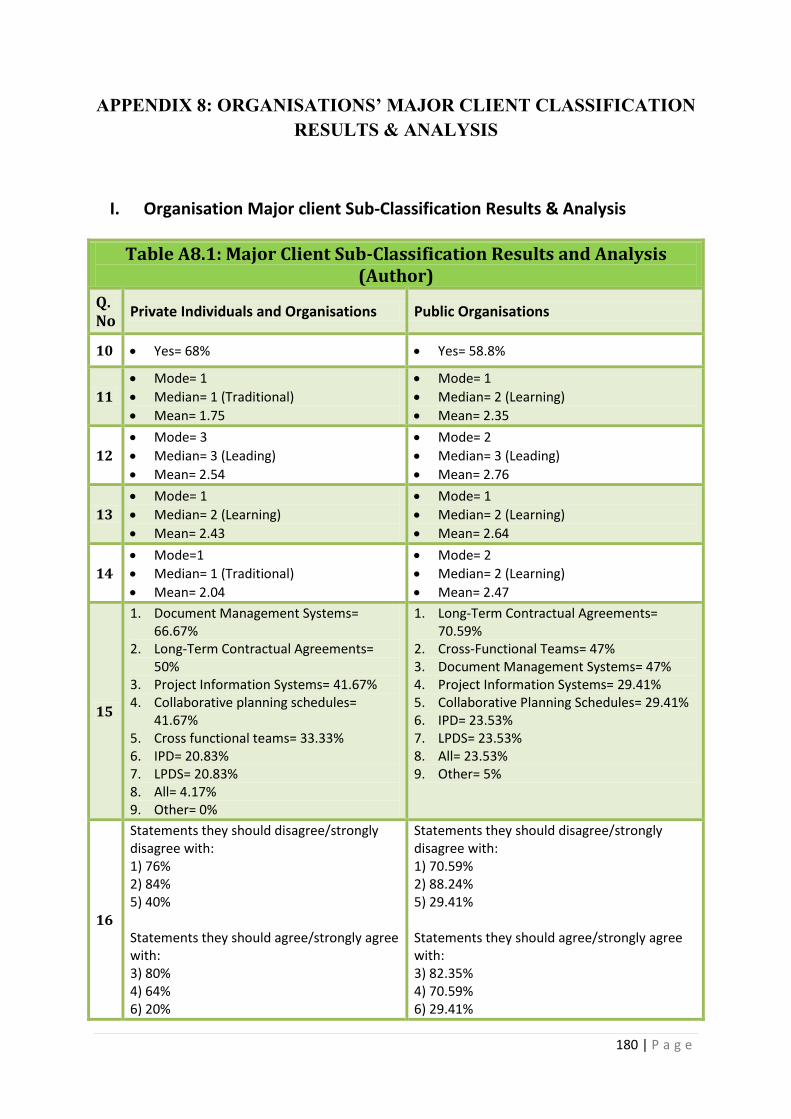
180 | P a g e
APPENDIX 8: ORGANISATIONS’ MAJOR CLIENT CLASSIFICATION RESULTS & ANALYSIS
I. Organisation Major client Sub-Classification Results & Analysis
Table A8.1: Major Client Sub-Classification Results and Analysis (Author)
Q. No
Private Individuals and Organisations Public Organisations
10 Yes= 68% Yes= 58.8%
11
Mode= 1
Median= 1 (Traditional)
Mean= 1.75
Mode= 1
Median= 2 (Learning)
Mean= 2.35
12
Mode= 3
Median= 3 (Leading)
Mean= 2.54
Mode= 2
Median= 3 (Leading)
Mean= 2.76
13
Mode= 1
Median= 2 (Learning)
Mean= 2.43
Mode= 1
Median= 2 (Learning)
Mean= 2.64
14
Mode=1
Median= 1 (Traditional)
Mean= 2.04
Mode= 2
Median= 2 (Learning)
Mean= 2.47
15
1. Document Management Systems= 66.67%
2. Long-Term Contractual Agreements= 50%
3. Project Information Systems= 41.67% 4. Collaborative planning schedules=
41.67% 5. Cross functional teams= 33.33% 6. IPD= 20.83% 7. LPDS= 20.83% 8. All= 4.17% 9. Other= 0%
1. Long-Term Contractual Agreements= 70.59%
2. Cross-Functional Teams= 47% 3. Document Management Systems= 47% 4. Project Information Systems= 29.41% 5. Collaborative Planning Schedules= 29.41% 6. IPD= 23.53% 7. LPDS= 23.53% 8. All= 23.53% 9. Other= 5%
16
Statements they should disagree/strongly disagree with: 1) 76% 2) 84% 5) 40% Statements they should agree/strongly agree with: 3) 80% 4) 64% 6) 20%
Statements they should disagree/strongly disagree with: 1) 70.59% 2) 88.24% 5) 29.41% Statements they should agree/strongly agree with: 3) 82.35% 4) 70.59% 6) 29.41%
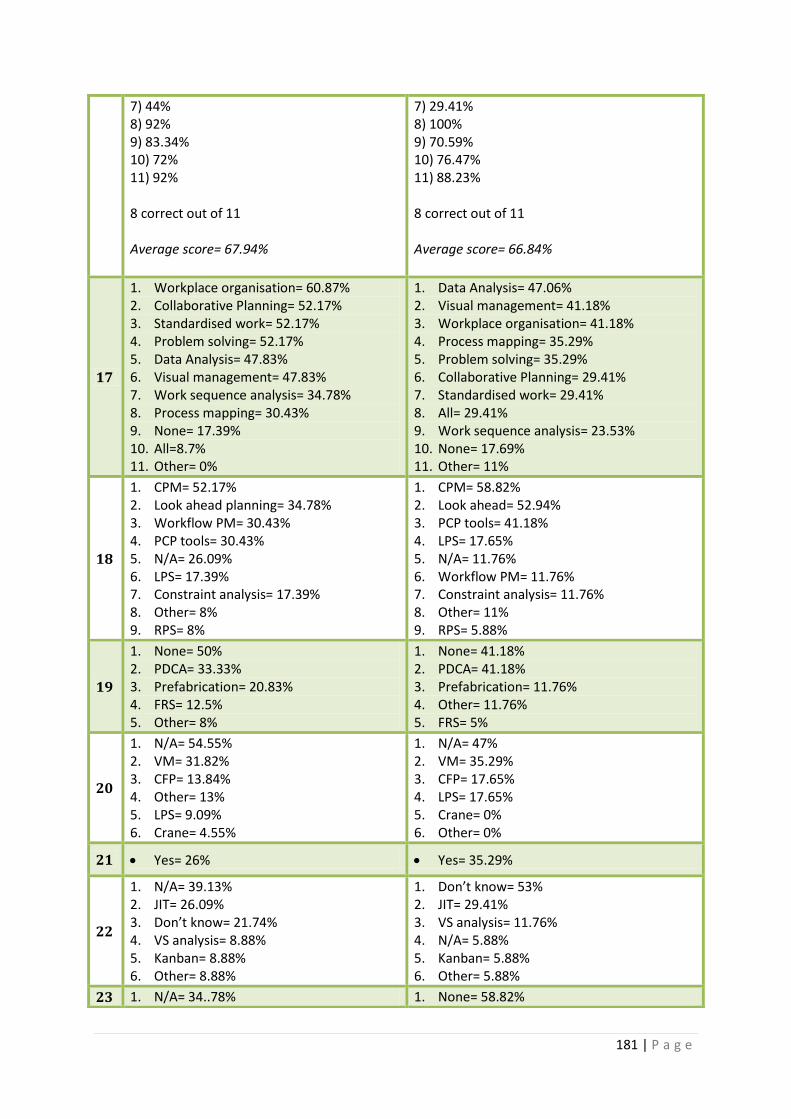
181 | P a g e
7) 44% 8) 92% 9) 83.34% 10) 72% 11) 92% 8 correct out of 11 Average score= 67.94%
7) 29.41% 8) 100% 9) 70.59% 10) 76.47% 11) 88.23% 8 correct out of 11 Average score= 66.84%
17
1. Workplace organisation= 60.87% 2. Collaborative Planning= 52.17% 3. Standardised work= 52.17% 4. Problem solving= 52.17% 5. Data Analysis= 47.83% 6. Visual management= 47.83% 7. Work sequence analysis= 34.78% 8. Process mapping= 30.43% 9. None= 17.39% 10. All=8.7% 11. Other= 0%
1. Data Analysis= 47.06% 2. Visual management= 41.18% 3. Workplace organisation= 41.18% 4. Process mapping= 35.29% 5. Problem solving= 35.29% 6. Collaborative Planning= 29.41% 7. Standardised work= 29.41% 8. All= 29.41% 9. Work sequence analysis= 23.53% 10. None= 17.69% 11. Other= 11%
18
1. CPM= 52.17% 2. Look ahead planning= 34.78% 3. Workflow PM= 30.43% 4. PCP tools= 30.43% 5. N/A= 26.09% 6. LPS= 17.39% 7. Constraint analysis= 17.39% 8. Other= 8% 9. RPS= 8%
1. CPM= 58.82% 2. Look ahead= 52.94% 3. PCP tools= 41.18% 4. LPS= 17.65% 5. N/A= 11.76% 6. Workflow PM= 11.76% 7. Constraint analysis= 11.76% 8. Other= 11% 9. RPS= 5.88%
19
1. None= 50% 2. PDCA= 33.33% 3. Prefabrication= 20.83% 4. FRS= 12.5% 5. Other= 8%
1. None= 41.18% 2. PDCA= 41.18% 3. Prefabrication= 11.76% 4. Other= 11.76% 5. FRS= 5%
20
1. N/A= 54.55% 2. VM= 31.82% 3. CFP= 13.84% 4. Other= 13% 5. LPS= 9.09% 6. Crane= 4.55%
1. N/A= 47% 2. VM= 35.29% 3. CFP= 17.65% 4. LPS= 17.65% 5. Crane= 0% 6. Other= 0%
21 Yes= 26% Yes= 35.29%
22
1. N/A= 39.13% 2. JIT= 26.09% 3. Don’t know= 21.74% 4. VS analysis= 8.88% 5. Kanban= 8.88% 6. Other= 8.88%
1. Don’t know= 53% 2. JIT= 29.41% 3. VS analysis= 11.76% 4. N/A= 5.88% 5. Kanban= 5.88% 6. Other= 5.88%
23 1. N/A= 34..78% 1. None= 58.82%
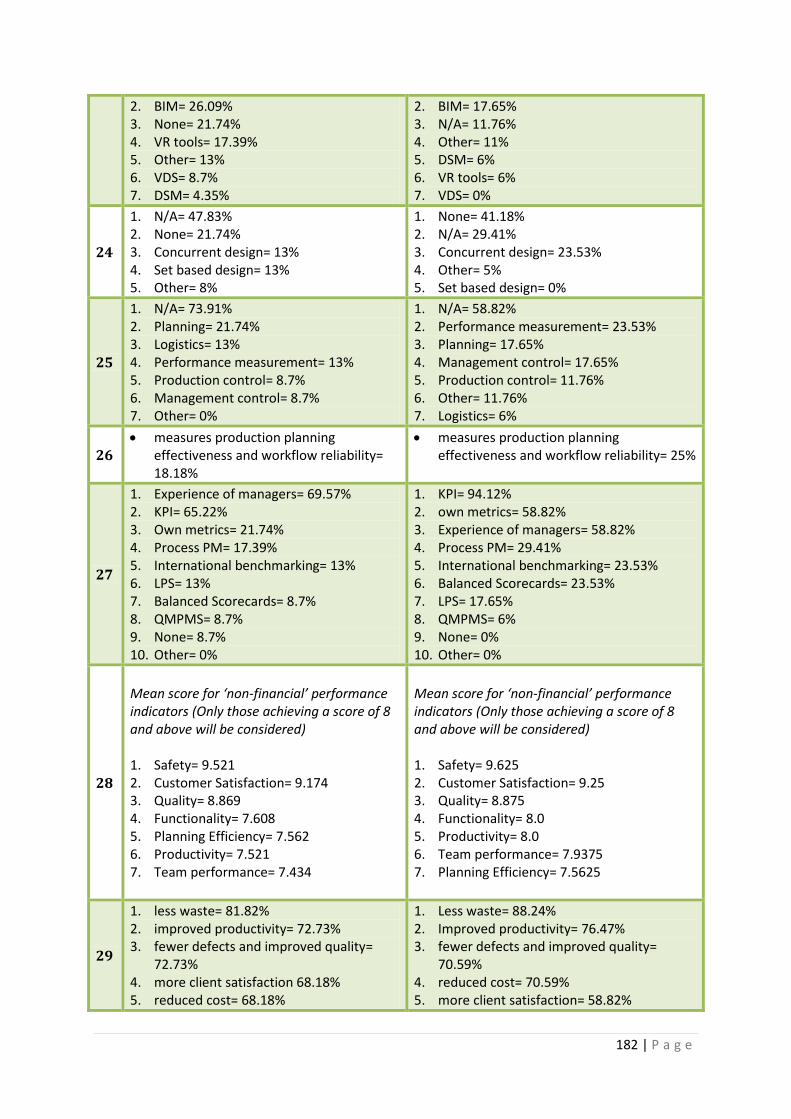
182 | P a g e
2. BIM= 26.09% 3. None= 21.74% 4. VR tools= 17.39% 5. Other= 13% 6. VDS= 8.7% 7. DSM= 4.35%
2. BIM= 17.65% 3. N/A= 11.76% 4. Other= 11% 5. DSM= 6% 6. VR tools= 6% 7. VDS= 0%
24
1. N/A= 47.83% 2. None= 21.74% 3. Concurrent design= 13% 4. Set based design= 13% 5. Other= 8%
1. None= 41.18% 2. N/A= 29.41% 3. Concurrent design= 23.53% 4. Other= 5% 5. Set based design= 0%
25
1. N/A= 73.91% 2. Planning= 21.74% 3. Logistics= 13% 4. Performance measurement= 13% 5. Production control= 8.7% 6. Management control= 8.7% 7. Other= 0%
1. N/A= 58.82% 2. Performance measurement= 23.53% 3. Planning= 17.65% 4. Management control= 17.65% 5. Production control= 11.76% 6. Other= 11.76% 7. Logistics= 6%
26 measures production planning
effectiveness and workflow reliability= 18.18%
measures production planning effectiveness and workflow reliability= 25%
27
1. Experience of managers= 69.57% 2. KPI= 65.22% 3. Own metrics= 21.74% 4. Process PM= 17.39% 5. International benchmarking= 13% 6. LPS= 13% 7. Balanced Scorecards= 8.7% 8. QMPMS= 8.7% 9. None= 8.7% 10. Other= 0%
1. KPI= 94.12% 2. own metrics= 58.82% 3. Experience of managers= 58.82% 4. Process PM= 29.41% 5. International benchmarking= 23.53% 6. Balanced Scorecards= 23.53% 7. LPS= 17.65% 8. QMPMS= 6% 9. None= 0% 10. Other= 0%
28
Mean score for ‘non-financial’ performance indicators (Only those achieving a score of 8 and above will be considered) 1. Safety= 9.521 2. Customer Satisfaction= 9.174 3. Quality= 8.869 4. Functionality= 7.608 5. Planning Efficiency= 7.562 6. Productivity= 7.521 7. Team performance= 7.434
Mean score for ‘non-financial’ performance indicators (Only those achieving a score of 8 and above will be considered) 1. Safety= 9.625 2. Customer Satisfaction= 9.25 3. Quality= 8.875 4. Functionality= 8.0 5. Productivity= 8.0 6. Team performance= 7.9375 7. Planning Efficiency= 7.5625
29
1. less waste= 81.82% 2. improved productivity= 72.73% 3. fewer defects and improved quality=
72.73% 4. more client satisfaction 68.18% 5. reduced cost= 68.18%
1. Less waste= 88.24% 2. Improved productivity= 76.47% 3. fewer defects and improved quality=
70.59% 4. reduced cost= 70.59% 5. more client satisfaction= 58.82%

183 | P a g e
30
1. Risk management and mitigation= 60.87%
2. Cost and Value Management= 60.87% 3. LC= 26% 4. SC assistance= 26% 5. All= 26% 6. Other= 0%
1. Risk management= 62.5% 2. Cost and Value Management= 43.75% 3. All= 25% 4. LC= 18.75% 5. SC assistance= 12.5% 6. Other= 12%
31
1. N/A= 31.82% 2. International standards= 31.82% 3. BREEAM= 18.18% 4. SC assistance= 13.64% 5. LC= 13.64% 6. Other= 13% 7. All= 4.55%
1. International standards= 58.82% 2. BREEAM= 47% 3. SC assistance= 17.65% 4. LC= 11.76% 5. Other= 11% 6. All= 5.88% 7. N/A= 0%
32
1. Community engagement= 47.83% 2. In-house training= 34.78% 3. Job knowledge and Skills scheme=
34.78% 4. Safety programmes= 30.43% 5. N/A= 21.74% 6. Lean culture= 21.74% 7. Team development= 21.74% 8. All= 4.35% 9. Other= 4%
1. In-house training= 41.18% 2. Safety programmes= 41.18% 3. Community engagement= 41.18% 4. Job knowledge and skills scheme= 35.29% 5. Team development= 29.41% 6. Other= 17% 7. Lean culture= 11.76% 8. Other= 17% 9. All= 11.76%
33
1. To improve the quality of our outputs= 59%
2. To improve our rate of client Satisfaction= 59%
3. To increase our profit= 54.55% 4. To keep up-to-date= 31.82% 5. As a respond to the Egan's report=
27.27% 6. When a major problem Occurs= 13.64% 7. Other= 4% 8. We are satisfied, no need to change= 4%
1. To improve our rate of client satisfaction= 52.94%
2. To improve the quality of our outputs= 47%
3. To increase our profit= 17% 4. To keep up-to-date= 29.41% 5. Other= 17% 6. As a respond to the Egan's report= 5.88% 7. We are satisfied, no need to change=
5.88% 8. When a major problem Occurs= 0%
34
Only barriers with a mean score of 4.0 and above will be classified as significant barriers: Fragmentation & subcontracting= 3.96 Procurement & contracts= 3.96 Lack of adequate Lean awareness & understanding= 4.6 Cultural issues= 4.08 Time & commercial pressure= 3.96 Financial issues= 3.56 Lack of top management commitment= 4.44 Design/Construction Dichotomy= 3.5 Educational issues=3.88 Lack of process based PMS= 3.8
Only barriers with a mean score of 4.0 and above will be classified as significant barriers: Fragmentation & subcontracting= 4.235 Procurement & contracts= 3.588 Lack of adequate Lean awareness & understanding= 4.294 Cultural issues= 4.235 Time & commercial pressure= 3.529 Financial issues= 3.118 Lack of top management commitment= 3.824 Design/Construction Dichotomy= 2.941 Educational issues= 3.294 Lack of process based PMS= 3.588
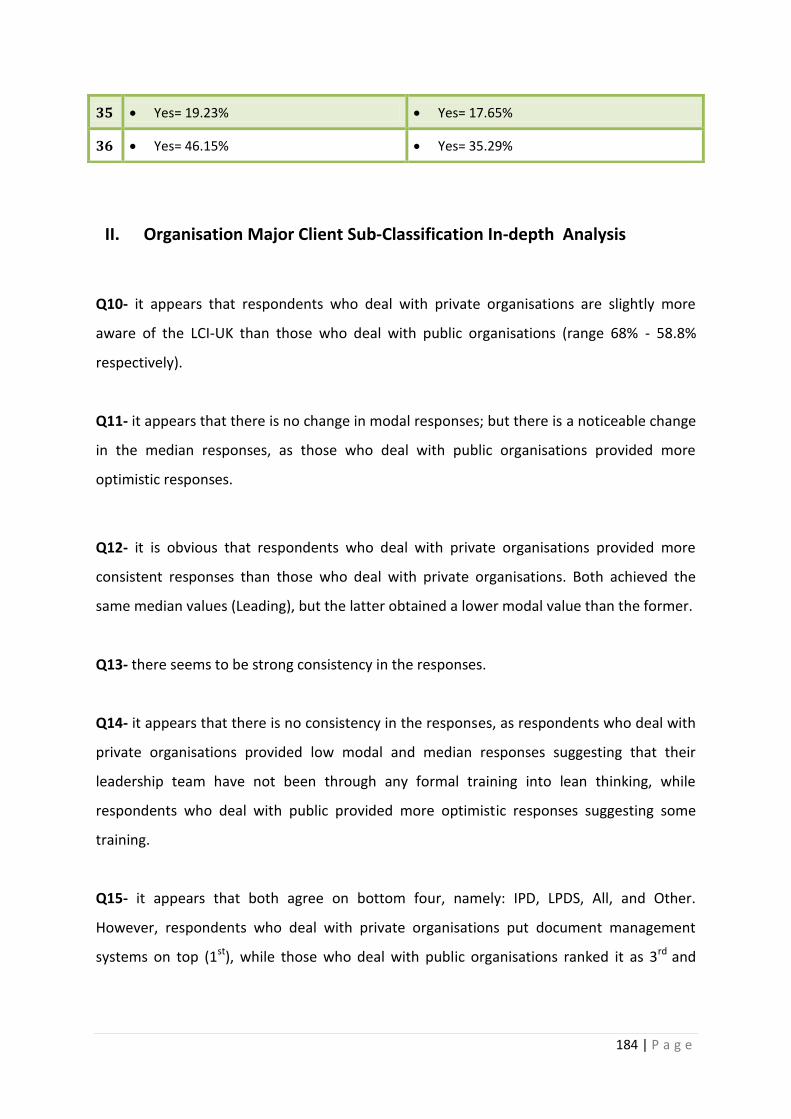
184 | P a g e
II. Organisation Major Client Sub-Classification In-depth Analysis
Q10- it appears that respondents who deal with private organisations are slightly more
aware of the LCI-UK than those who deal with public organisations (range 68% - 58.8%
respectively).
Q11- it appears that there is no change in modal responses; but there is a noticeable change
in the median responses, as those who deal with public organisations provided more
optimistic responses.
Q12- it is obvious that respondents who deal with private organisations provided more
consistent responses than those who deal with private organisations. Both achieved the
same median values (Leading), but the latter obtained a lower modal value than the former.
Q13- there seems to be strong consistency in the responses.
Q14- it appears that there is no consistency in the responses, as respondents who deal with
private organisations provided low modal and median responses suggesting that their
leadership team have not been through any formal training into lean thinking, while
respondents who deal with public provided more optimistic responses suggesting some
training.
Q15- it appears that both agree on bottom four, namely: IPD, LPDS, All, and Other.
However, respondents who deal with private organisations put document management
systems on top (1st), while those who deal with public organisations ranked it as 3rd and
35 Yes= 19.23% Yes= 17.65%
36 Yes= 46.15% Yes= 35.29%
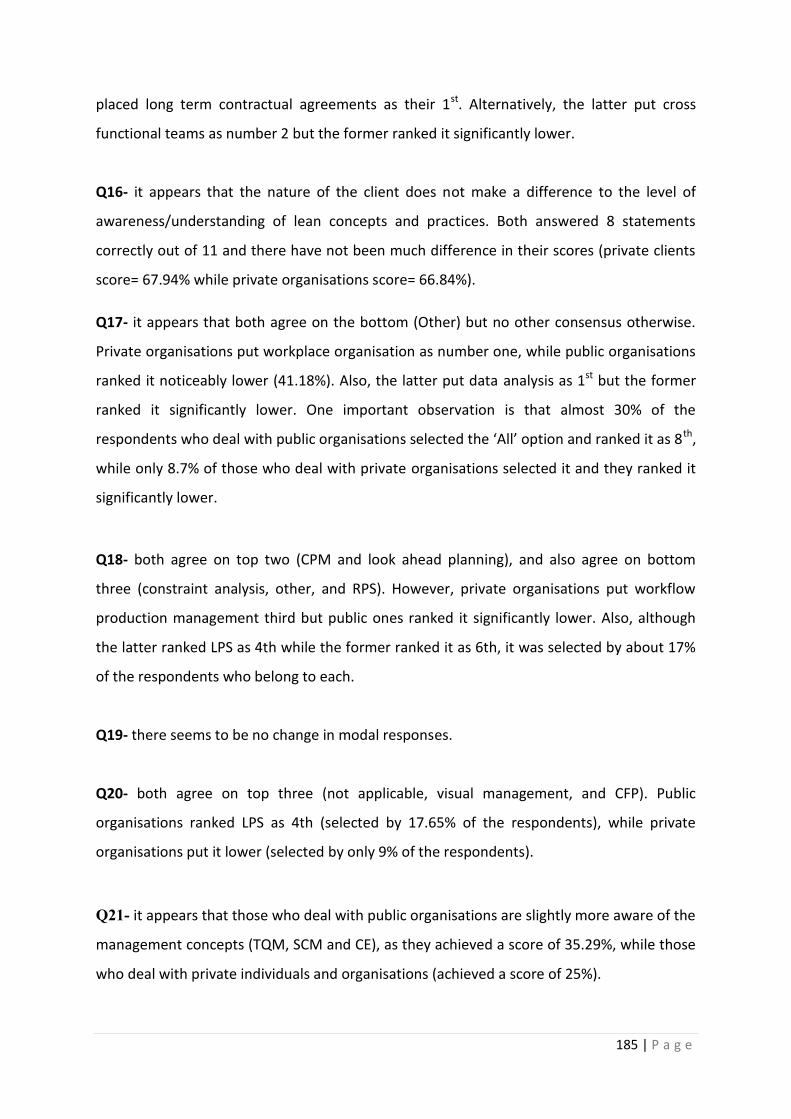
185 | P a g e
placed long term contractual agreements as their 1st. Alternatively, the latter put cross
functional teams as number 2 but the former ranked it significantly lower.
Q16- it appears that the nature of the client does not make a difference to the level of
awareness/understanding of lean concepts and practices. Both answered 8 statements
correctly out of 11 and there have not been much difference in their scores (private clients
score= 67.94% while private organisations score= 66.84%).
Q17- it appears that both agree on the bottom (Other) but no other consensus otherwise.
Private organisations put workplace organisation as number one, while public organisations
ranked it noticeably lower (41.18%). Also, the latter put data analysis as 1st but the former
ranked it significantly lower. One important observation is that almost 30% of the
respondents who deal with public organisations selected the ‘All’ option and ranked it as 8th,
while only 8.7% of those who deal with private organisations selected it and they ranked it
significantly lower.
Q18- both agree on top two (CPM and look ahead planning), and also agree on bottom
three (constraint analysis, other, and RPS). However, private organisations put workflow
production management third but public ones ranked it significantly lower. Also, although
the latter ranked LPS as 4th while the former ranked it as 6th, it was selected by about 17%
of the respondents who belong to each.
Q19- there seems to be no change in modal responses.
Q20- both agree on top three (not applicable, visual management, and CFP). Public
organisations ranked LPS as 4th (selected by 17.65% of the respondents), while private
organisations put it lower (selected by only 9% of the respondents).
Q21- it appears that those who deal with public organisations are slightly more aware of the
management concepts (TQM, SCM and CE), as they achieved a score of 35.29%, while those
who deal with private individuals and organisations (achieved a score of 25%).
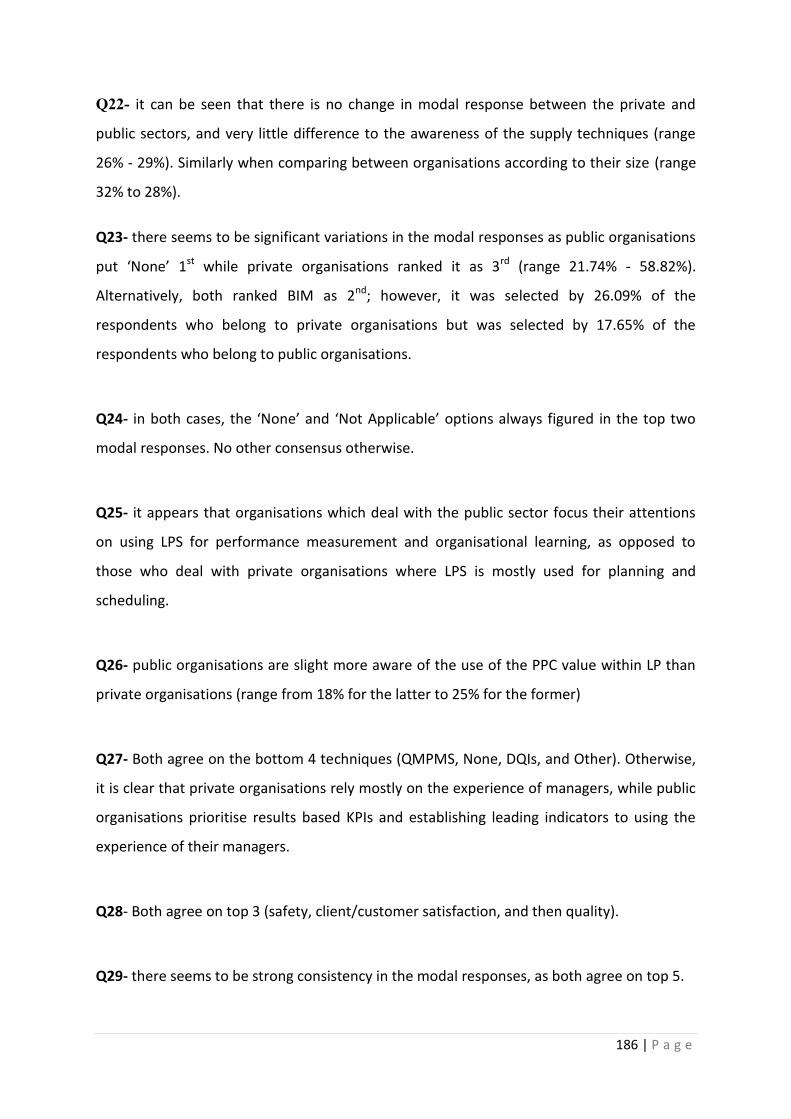
186 | P a g e
Q22- it can be seen that there is no change in modal response between the private and
public sectors, and very little difference to the awareness of the supply techniques (range
26% - 29%). Similarly when comparing between organisations according to their size (range
32% to 28%).
Q23- there seems to be significant variations in the modal responses as public organisations
put ‘None’ 1st while private organisations ranked it as 3rd (range 21.74% - 58.82%).
Alternatively, both ranked BIM as 2nd; however, it was selected by 26.09% of the
respondents who belong to private organisations but was selected by 17.65% of the
respondents who belong to public organisations.
Q24- in both cases, the ‘None’ and ‘Not Applicable’ options always figured in the top two
modal responses. No other consensus otherwise.
Q25- it appears that organisations which deal with the public sector focus their attentions
on using LPS for performance measurement and organisational learning, as opposed to
those who deal with private organisations where LPS is mostly used for planning and
scheduling.
Q26- public organisations are slight more aware of the use of the PPC value within LP than
private organisations (range from 18% for the latter to 25% for the former)
Q27- Both agree on the bottom 4 techniques (QMPMS, None, DQIs, and Other). Otherwise,
it is clear that private organisations rely mostly on the experience of managers, while public
organisations prioritise results based KPIs and establishing leading indicators to using the
experience of their managers.
Q28- Both agree on top 3 (safety, client/customer satisfaction, and then quality).
Q29- there seems to be strong consistency in the modal responses, as both agree on top 5.
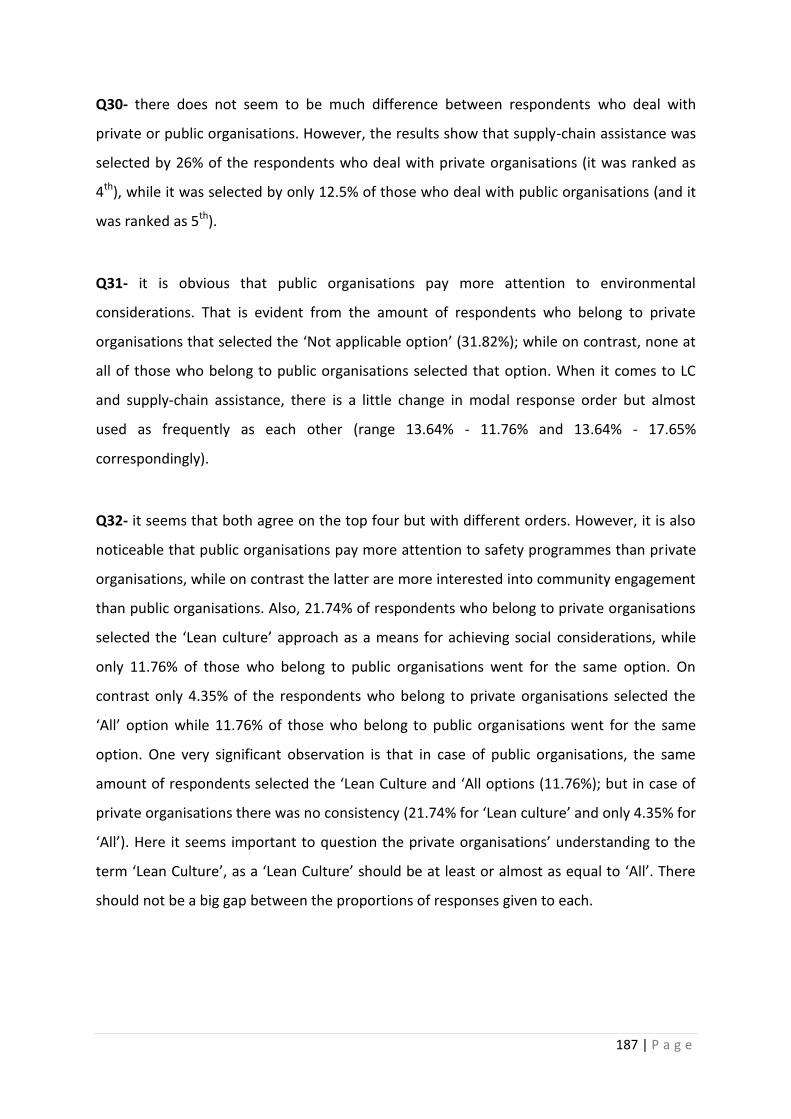
187 | P a g e
Q30- there does not seem to be much difference between respondents who deal with
private or public organisations. However, the results show that supply-chain assistance was
selected by 26% of the respondents who deal with private organisations (it was ranked as
4th), while it was selected by only 12.5% of those who deal with public organisations (and it
was ranked as 5th).
Q31- it is obvious that public organisations pay more attention to environmental
considerations. That is evident from the amount of respondents who belong to private
organisations that selected the ‘Not applicable option’ (31.82%); while on contrast, none at
all of those who belong to public organisations selected that option. When it comes to LC
and supply-chain assistance, there is a little change in modal response order but almost
used as frequently as each other (range 13.64% - 11.76% and 13.64% - 17.65%
correspondingly).
Q32- it seems that both agree on the top four but with different orders. However, it is also
noticeable that public organisations pay more attention to safety programmes than private
organisations, while on contrast the latter are more interested into community engagement
than public organisations. Also, 21.74% of respondents who belong to private organisations
selected the ‘Lean culture’ approach as a means for achieving social considerations, while
only 11.76% of those who belong to public organisations went for the same option. On
contrast only 4.35% of the respondents who belong to private organisations selected the
‘All’ option while 11.76% of those who belong to public organisations went for the same
option. One very significant observation is that in case of public organisations, the same
amount of respondents selected the ‘Lean Culture and ‘All options (11.76%); but in case of
private organisations there was no consistency (21.74% for ‘Lean culture’ and only 4.35% for
‘All’). Here it seems important to question the private organisations’ understanding to the
term ‘Lean Culture’, as a ‘Lean Culture’ should be at least or almost as equal to ‘All’. There
should not be a big gap between the proportions of responses given to each.
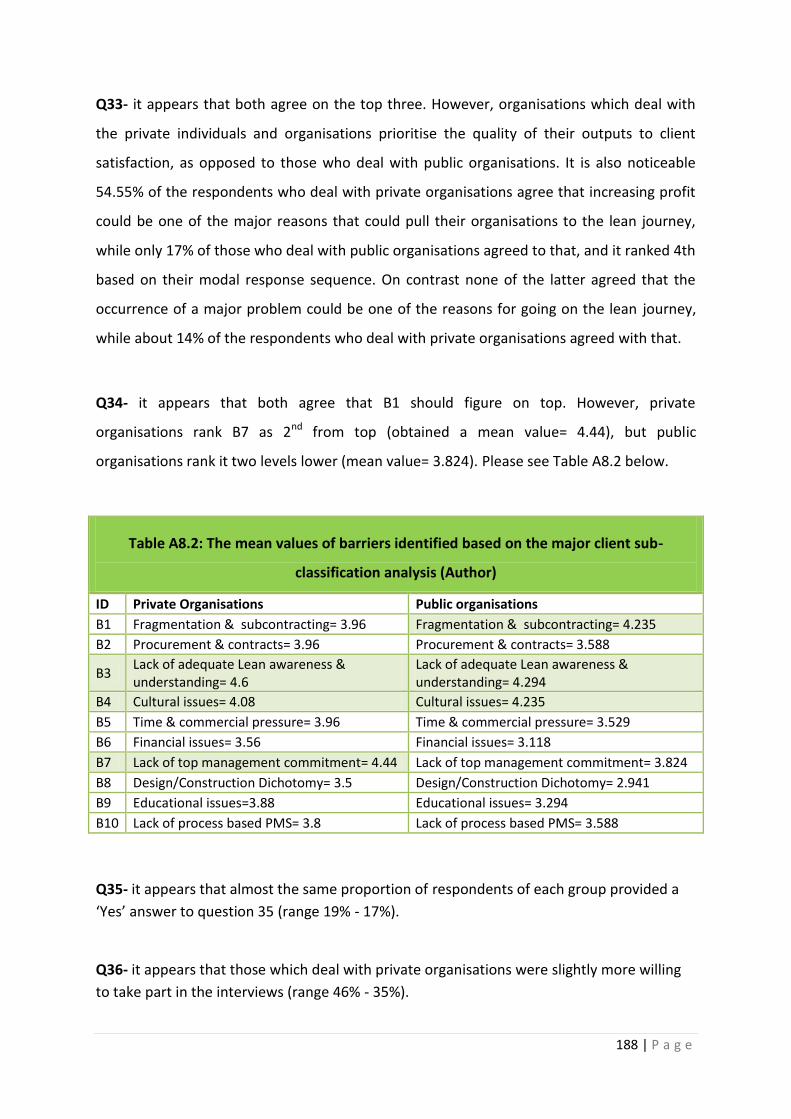
188 | P a g e
Q33- it appears that both agree on the top three. However, organisations which deal with
the private individuals and organisations prioritise the quality of their outputs to client
satisfaction, as opposed to those who deal with public organisations. It is also noticeable
54.55% of the respondents who deal with private organisations agree that increasing profit
could be one of the major reasons that could pull their organisations to the lean journey,
while only 17% of those who deal with public organisations agreed to that, and it ranked 4th
based on their modal response sequence. On contrast none of the latter agreed that the
occurrence of a major problem could be one of the reasons for going on the lean journey,
while about 14% of the respondents who deal with private organisations agreed with that.
Q34- it appears that both agree that B1 should figure on top. However, private
organisations rank B7 as 2nd from top (obtained a mean value= 4.44), but public
organisations rank it two levels lower (mean value= 3.824). Please see Table A8.2 below.
Table A8.2: The mean values of barriers identified based on the major client sub-
classification analysis (Author)
ID Private Organisations Public organisations
B1 Fragmentation & subcontracting= 3.96 Fragmentation & subcontracting= 4.235
B2 Procurement & contracts= 3.96 Procurement & contracts= 3.588
B3 Lack of adequate Lean awareness & understanding= 4.6
Lack of adequate Lean awareness & understanding= 4.294
B4 Cultural issues= 4.08 Cultural issues= 4.235
B5 Time & commercial pressure= 3.96 Time & commercial pressure= 3.529
B6 Financial issues= 3.56 Financial issues= 3.118
B7 Lack of top management commitment= 4.44 Lack of top management commitment= 3.824
B8 Design/Construction Dichotomy= 3.5 Design/Construction Dichotomy= 2.941
B9 Educational issues=3.88 Educational issues= 3.294
B10 Lack of process based PMS= 3.8 Lack of process based PMS= 3.588
Q35- it appears that almost the same proportion of respondents of each group provided a
‘Yes’ answer to question 35 (range 19% - 17%).
Q36- it appears that those which deal with private organisations were slightly more willing
to take part in the interviews (range 46% - 35%).
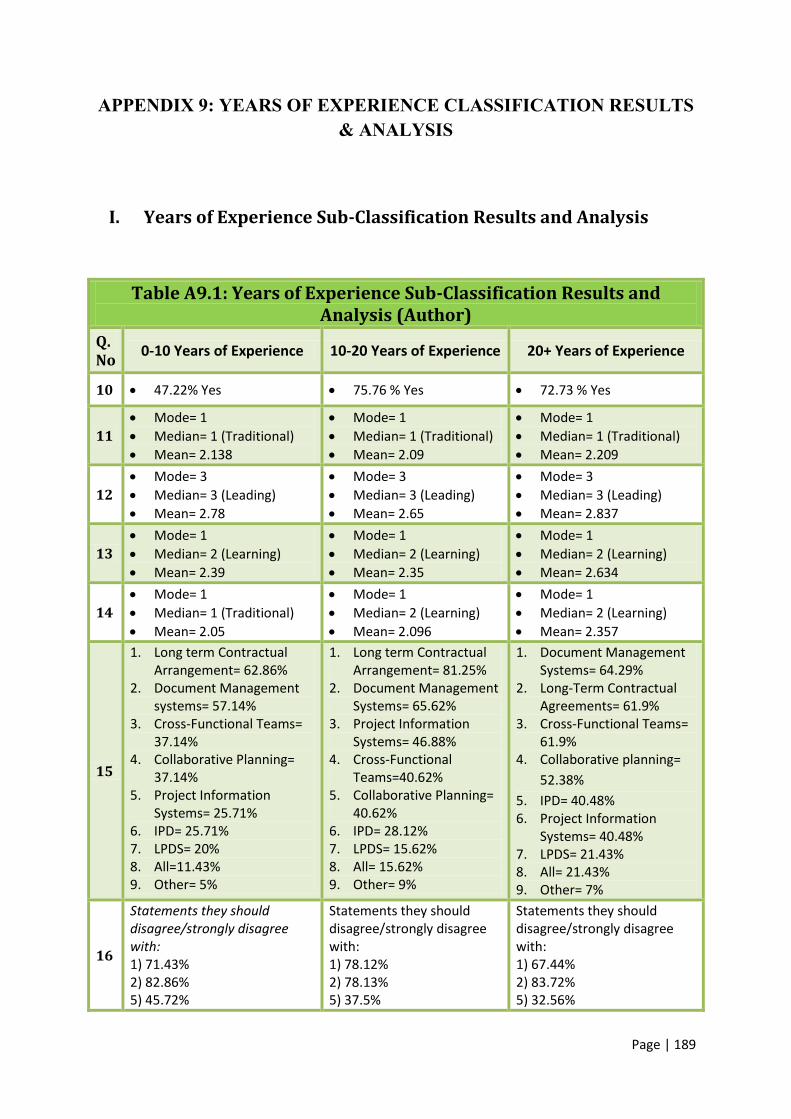
Page | 189
APPENDIX 9: YEARS OF EXPERIENCE CLASSIFICATION RESULTS & ANALYSIS
I. Years of Experience Sub-Classification Results and Analysis
Table A9.1: Years of Experience Sub-Classification Results and Analysis (Author)
Q. No
0-10 Years of Experience 10-20 Years of Experience 20+ Years of Experience
10 47.22% Yes 75.76 % Yes 72.73 % Yes
11
Mode= 1
Median= 1 (Traditional)
Mean= 2.138
Mode= 1
Median= 1 (Traditional)
Mean= 2.09
Mode= 1
Median= 1 (Traditional)
Mean= 2.209
12
Mode= 3
Median= 3 (Leading)
Mean= 2.78
Mode= 3
Median= 3 (Leading)
Mean= 2.65
Mode= 3
Median= 3 (Leading)
Mean= 2.837
13
Mode= 1
Median= 2 (Learning)
Mean= 2.39
Mode= 1
Median= 2 (Learning)
Mean= 2.35
Mode= 1
Median= 2 (Learning)
Mean= 2.634
14
Mode= 1
Median= 1 (Traditional)
Mean= 2.05
Mode= 1
Median= 2 (Learning)
Mean= 2.096
Mode= 1
Median= 2 (Learning)
Mean= 2.357
15
1. Long term Contractual Arrangement= 62.86%
2. Document Management systems= 57.14%
3. Cross-Functional Teams= 37.14%
4. Collaborative Planning= 37.14%
5. Project Information Systems= 25.71%
6. IPD= 25.71% 7. LPDS= 20% 8. All=11.43% 9. Other= 5%
1. Long term Contractual Arrangement= 81.25%
2. Document Management Systems= 65.62%
3. Project Information Systems= 46.88%
4. Cross-Functional Teams=40.62%
5. Collaborative Planning= 40.62%
6. IPD= 28.12% 7. LPDS= 15.62% 8. All= 15.62% 9. Other= 9%
1. Document Management Systems= 64.29%
2. Long-Term Contractual Agreements= 61.9%
3. Cross-Functional Teams= 61.9%
4. Collaborative planning=
52.38%
5. IPD= 40.48% 6. Project Information
Systems= 40.48% 7. LPDS= 21.43% 8. All= 21.43% 9. Other= 7%
16
Statements they should disagree/strongly disagree with: 1) 71.43% 2) 82.86% 5) 45.72%
Statements they should disagree/strongly disagree with: 1) 78.12% 2) 78.13% 5) 37.5%
Statements they should disagree/strongly disagree with: 1) 67.44% 2) 83.72% 5) 32.56%
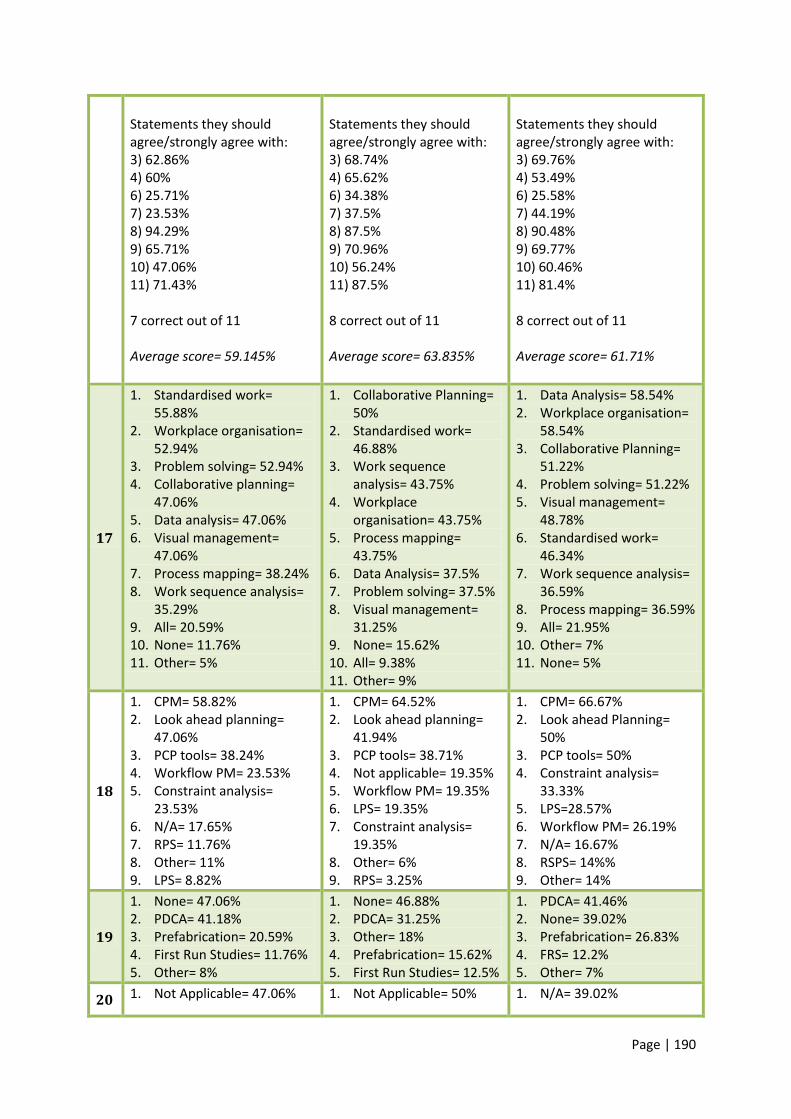
Page | 190
Statements they should agree/strongly agree with: 3) 62.86% 4) 60% 6) 25.71% 7) 23.53% 8) 94.29% 9) 65.71% 10) 47.06% 11) 71.43% 7 correct out of 11 Average score= 59.145%
Statements they should agree/strongly agree with: 3) 68.74% 4) 65.62% 6) 34.38% 7) 37.5% 8) 87.5% 9) 70.96% 10) 56.24% 11) 87.5% 8 correct out of 11 Average score= 63.835%
Statements they should agree/strongly agree with: 3) 69.76% 4) 53.49% 6) 25.58% 7) 44.19% 8) 90.48% 9) 69.77% 10) 60.46% 11) 81.4% 8 correct out of 11 Average score= 61.71%
17
1. Standardised work= 55.88%
2. Workplace organisation= 52.94%
3. Problem solving= 52.94% 4. Collaborative planning=
47.06% 5. Data analysis= 47.06% 6. Visual management=
47.06% 7. Process mapping= 38.24% 8. Work sequence analysis=
35.29% 9. All= 20.59% 10. None= 11.76% 11. Other= 5%
1. Collaborative Planning= 50%
2. Standardised work= 46.88%
3. Work sequence analysis= 43.75%
4. Workplace organisation= 43.75%
5. Process mapping= 43.75%
6. Data Analysis= 37.5% 7. Problem solving= 37.5% 8. Visual management=
31.25% 9. None= 15.62% 10. All= 9.38% 11. Other= 9%
1. Data Analysis= 58.54% 2. Workplace organisation=
58.54% 3. Collaborative Planning=
51.22% 4. Problem solving= 51.22% 5. Visual management=
48.78% 6. Standardised work=
46.34% 7. Work sequence analysis=
36.59% 8. Process mapping= 36.59% 9. All= 21.95% 10. Other= 7% 11. None= 5%
18
1. CPM= 58.82% 2. Look ahead planning=
47.06% 3. PCP tools= 38.24% 4. Workflow PM= 23.53% 5. Constraint analysis=
23.53% 6. N/A= 17.65% 7. RPS= 11.76% 8. Other= 11% 9. LPS= 8.82%
1. CPM= 64.52% 2. Look ahead planning=
41.94% 3. PCP tools= 38.71% 4. Not applicable= 19.35% 5. Workflow PM= 19.35% 6. LPS= 19.35% 7. Constraint analysis=
19.35% 8. Other= 6% 9. RPS= 3.25%
1. CPM= 66.67% 2. Look ahead Planning=
50% 3. PCP tools= 50% 4. Constraint analysis=
33.33% 5. LPS=28.57% 6. Workflow PM= 26.19% 7. N/A= 16.67% 8. RSPS= 14%% 9. Other= 14%
19
1. None= 47.06% 2. PDCA= 41.18% 3. Prefabrication= 20.59% 4. First Run Studies= 11.76% 5. Other= 8%
1. None= 46.88% 2. PDCA= 31.25% 3. Other= 18% 4. Prefabrication= 15.62% 5. First Run Studies= 12.5%
1. PDCA= 41.46% 2. None= 39.02% 3. Prefabrication= 26.83% 4. FRS= 12.2% 5. Other= 7%
20 1. Not Applicable= 47.06% 1. Not Applicable= 50% 1. N/A= 39.02%
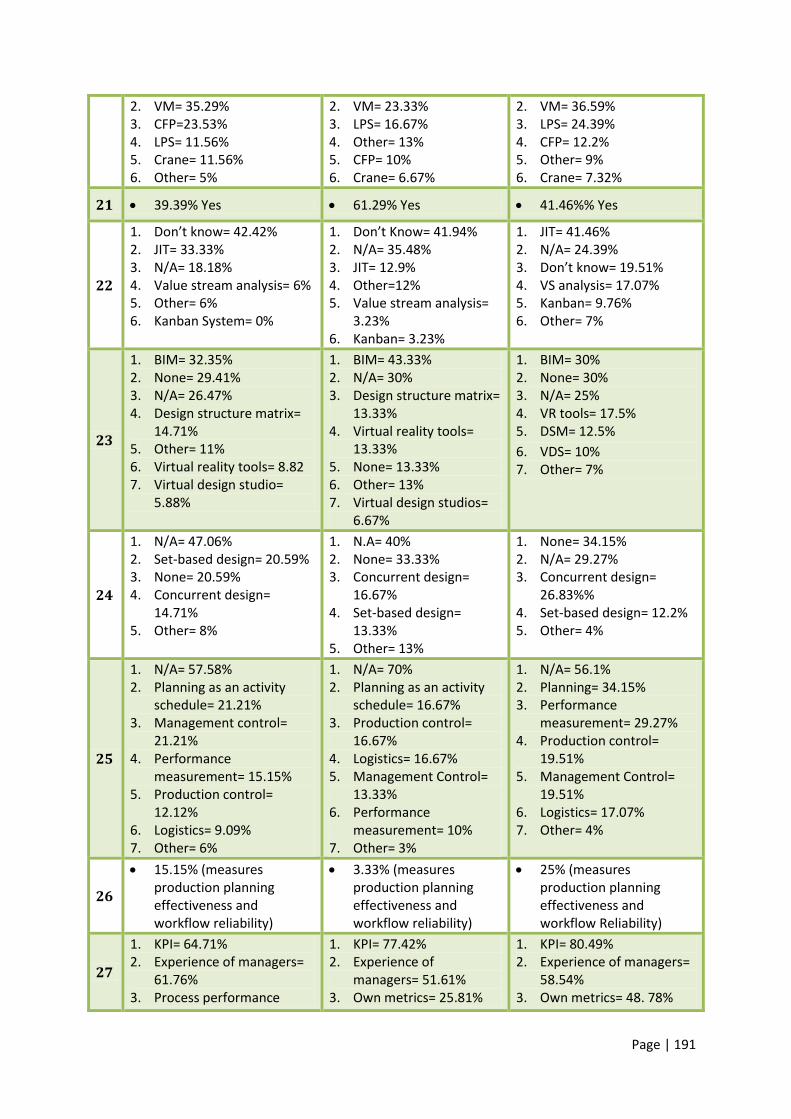
Page | 191
2. VM= 35.29% 3. CFP=23.53% 4. LPS= 11.56% 5. Crane= 11.56% 6. Other= 5%
2. VM= 23.33% 3. LPS= 16.67% 4. Other= 13% 5. CFP= 10% 6. Crane= 6.67%
2. VM= 36.59% 3. LPS= 24.39% 4. CFP= 12.2% 5. Other= 9% 6. Crane= 7.32%
21 39.39% Yes 61.29% Yes 41.46%% Yes
22
1. Don’t know= 42.42% 2. JIT= 33.33% 3. N/A= 18.18% 4. Value stream analysis= 6% 5. Other= 6% 6. Kanban System= 0%
1. Don’t Know= 41.94% 2. N/A= 35.48% 3. JIT= 12.9% 4. Other=12% 5. Value stream analysis=
3.23% 6. Kanban= 3.23%
1. JIT= 41.46% 2. N/A= 24.39% 3. Don’t know= 19.51% 4. VS analysis= 17.07% 5. Kanban= 9.76% 6. Other= 7%
23
1. BIM= 32.35% 2. None= 29.41% 3. N/A= 26.47% 4. Design structure matrix=
14.71% 5. Other= 11% 6. Virtual reality tools= 8.82 7. Virtual design studio=
5.88%
1. BIM= 43.33% 2. N/A= 30% 3. Design structure matrix=
13.33% 4. Virtual reality tools=
13.33% 5. None= 13.33% 6. Other= 13% 7. Virtual design studios=
6.67%
1. BIM= 30% 2. None= 30% 3. N/A= 25% 4. VR tools= 17.5% 5. DSM= 12.5%
6. VDS= 10% 7. Other= 7%
24
1. N/A= 47.06% 2. Set-based design= 20.59% 3. None= 20.59% 4. Concurrent design=
14.71% 5. Other= 8%
1. N.A= 40% 2. None= 33.33% 3. Concurrent design=
16.67% 4. Set-based design=
13.33% 5. Other= 13%
1. None= 34.15% 2. N/A= 29.27% 3. Concurrent design=
26.83%% 4. Set-based design= 12.2% 5. Other= 4%
25
1. N/A= 57.58% 2. Planning as an activity
schedule= 21.21% 3. Management control=
21.21% 4. Performance
measurement= 15.15% 5. Production control=
12.12% 6. Logistics= 9.09% 7. Other= 6%
1. N/A= 70% 2. Planning as an activity
schedule= 16.67% 3. Production control=
16.67% 4. Logistics= 16.67% 5. Management Control=
13.33% 6. Performance
measurement= 10% 7. Other= 3%
1. N/A= 56.1% 2. Planning= 34.15% 3. Performance
measurement= 29.27% 4. Production control=
19.51% 5. Management Control=
19.51% 6. Logistics= 17.07% 7. Other= 4%
26
15.15% (measures production planning effectiveness and workflow reliability)
3.33% (measures production planning effectiveness and workflow reliability)
25% (measures production planning effectiveness and workflow Reliability)
27
1. KPI= 64.71% 2. Experience of managers=
61.76% 3. Process performance
1. KPI= 77.42% 2. Experience of
managers= 51.61% 3. Own metrics= 25.81%
1. KPI= 80.49% 2. Experience of managers=
58.54% 3. Own metrics= 48. 78%

Page | 192
measures= 29.41% 4. Own metrics= 26.47% 5. International
benchmarking= 17.65% 6. Balanced Score cards=
11.76% 7. LPS= 8.82% 8. DQI= 8.82% 9. QMPMS= 5.88% 10. None= 5.88% 11. Other= 5%
4. Process Performance measures= 19.35%
5. Balanced score cards= 16.13%
6. LPS= 12.9% 7. International
benchmarking= 9.68% 8. None= 9.68% 9. QMPMS= 6.45% 10. DQI= 3% 11. Other= 3%
4. Process PM= 31.71%% 5. LPS= 24.39% 6. Balanced Scorecards=
24.39% 7. International
benchmarking= 17.07% 8. QMPMS= 14.63% 9. DQI= 9.76% 10. Other= 4% 11. None= 2.44%
28
Mean score for ‘non-financial’ performance indicators (Only those achieving a score of 8 and above will be considered) 1. Safety= 9.47 2. Customer Satisfaction=
9.11 3. Quality= 8.941 4. Functionality= 8.242 5. Productivity= 8.117 6. Team performance= 7.882 7. Planning Efficiency= 7.823
Mean score for ‘non-financial’ performance indicators (Only those achieving a score of 8 and above will be considered) 1. Safety= 9.129 2. Customer Satisfaction=
9.193 3. Quality= 8.451 4. Productivity= 8.064 5. Functionality= 8.032 6. Team performance=
8.032 7. Planning Efficiency=
7.806
Mean score for ‘non-financial’ performance indicators (Only those achieving a score of 8 and above will be considered) 1. Safety= 9.804 2. Customer Satisfaction=
9.195 3. Quality= 8.902 4. Team performance=
7.609 5. Productivity= 7.365 6. Planning Efficiency= 7.317 7. Functionality= 7.048
29
1. less waste= 83.87% 2. Improved
productivity=74.19% 3. Reduced cost= 74.19% 4. fewer defects and
improved quality= 64.52% 5. increased profit/turnover
AND more client satisfaction 51.61%
1. Less waste= 74.19% 2. Improved productivity=
64.52% 3. Fewer defects and
improved quality= 64.52%
4. More client satisfaction= 54.84%
5. improved safety and health conditions= 51.61%
1. Improved productivity= 71.43%
2. Fewer defects and improved quality= 71.43%
3. Less waste= 69.05% 4. Reduced cost= 64.29% 5. More client satisfaction=
59.52%
30
1. Cost and Value Management= 66.67%
2. Risk Management= 54.55%
3. LC= 21.21% 4. All= 18.18% 5. SC assistance= 15.15% 6. Other= 9%
1. Cost and Value Management= 48.39%
2. Risk Management= 45.16%
3. All= 32.26% 4. SC assistance= 32.26% 5. LC= 12.9% 6. Other= 6%
1. Risk Management= 60% 2. Cost and Value
Management= 52.5% 3. All= 27.5% 4. SC assistance= 25% 5. LC= 17.5% 6. Other= 5%
31
1. International standards= 45.16%
2. BREEAM= 35.48% 3. All= 12.9% 4. N/A= 12.9%
1. International standards= 61.29%
2. BREEAM= 48.39% 3. SC assistance= 25.81% 4. N/A= 16.13%
1. International standards= 45.24%
2. BREEAM= 35.71% 3. SC assistance= 26.19% 4. LC= 19.05%
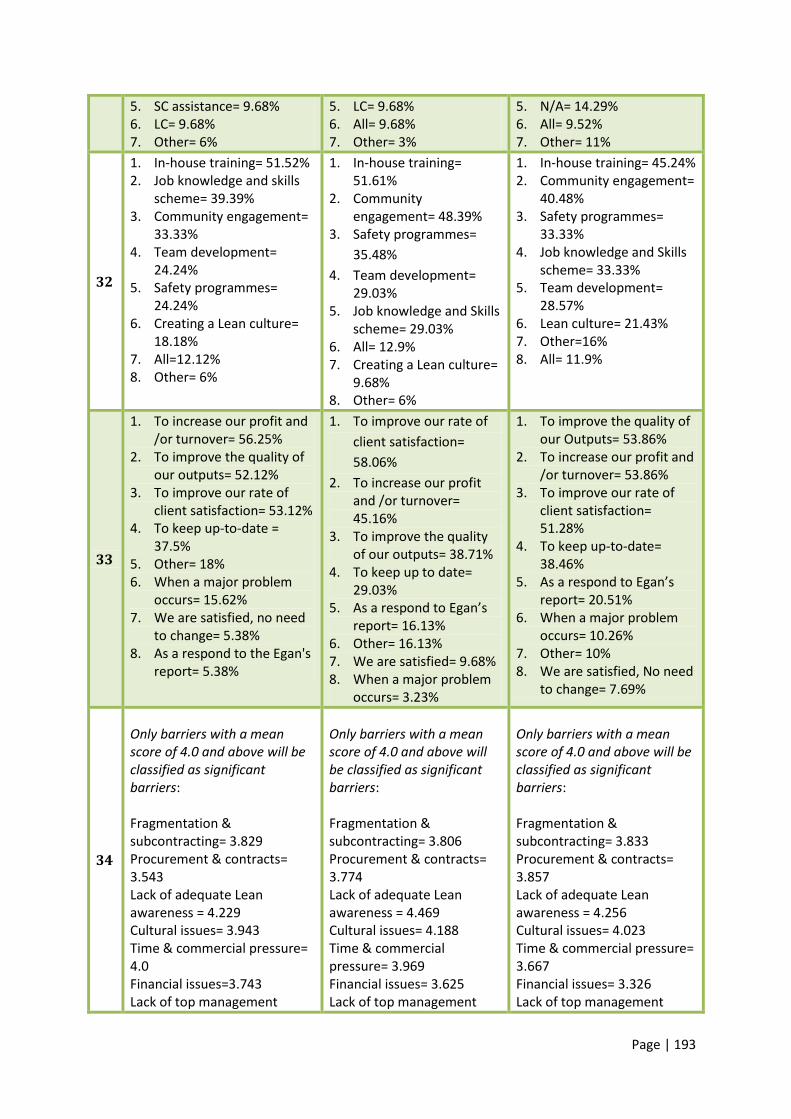
Page | 193
5. SC assistance= 9.68% 6. LC= 9.68% 7. Other= 6%
5. LC= 9.68% 6. All= 9.68% 7. Other= 3%
5. N/A= 14.29% 6. All= 9.52% 7. Other= 11%
32
1. In-house training= 51.52% 2. Job knowledge and skills
scheme= 39.39% 3. Community engagement=
33.33% 4. Team development=
24.24% 5. Safety programmes=
24.24% 6. Creating a Lean culture=
18.18% 7. All=12.12% 8. Other= 6%
1. In-house training= 51.61%
2. Community engagement= 48.39%
3. Safety programmes=
35.48%
4. Team development= 29.03%
5. Job knowledge and Skills scheme= 29.03%
6. All= 12.9% 7. Creating a Lean culture=
9.68% 8. Other= 6%
1. In-house training= 45.24% 2. Community engagement=
40.48% 3. Safety programmes=
33.33% 4. Job knowledge and Skills
scheme= 33.33% 5. Team development=
28.57% 6. Lean culture= 21.43% 7. Other=16% 8. All= 11.9%
33
1. To increase our profit and /or turnover= 56.25%
2. To improve the quality of our outputs= 52.12%
3. To improve our rate of client satisfaction= 53.12%
4. To keep up-to-date = 37.5%
5. Other= 18% 6. When a major problem
occurs= 15.62% 7. We are satisfied, no need
to change= 5.38% 8. As a respond to the Egan's
report= 5.38%
1. To improve our rate of
client satisfaction=
58.06%
2. To increase our profit and /or turnover= 45.16%
3. To improve the quality of our outputs= 38.71%
4. To keep up to date= 29.03%
5. As a respond to Egan’s report= 16.13%
6. Other= 16.13% 7. We are satisfied= 9.68% 8. When a major problem
occurs= 3.23%
1. To improve the quality of our Outputs= 53.86%
2. To increase our profit and /or turnover= 53.86%
3. To improve our rate of client satisfaction= 51.28%
4. To keep up-to-date= 38.46%
5. As a respond to Egan’s report= 20.51%
6. When a major problem occurs= 10.26%
7. Other= 10% 8. We are satisfied, No need
to change= 7.69%
34
Only barriers with a mean score of 4.0 and above will be classified as significant barriers: Fragmentation & subcontracting= 3.829 Procurement & contracts= 3.543 Lack of adequate Lean awareness = 4.229 Cultural issues= 3.943 Time & commercial pressure= 4.0 Financial issues=3.743 Lack of top management
Only barriers with a mean score of 4.0 and above will be classified as significant barriers: Fragmentation & subcontracting= 3.806 Procurement & contracts= 3.774 Lack of adequate Lean awareness = 4.469 Cultural issues= 4.188 Time & commercial pressure= 3.969 Financial issues= 3.625 Lack of top management
Only barriers with a mean score of 4.0 and above will be classified as significant barriers: Fragmentation & subcontracting= 3.833 Procurement & contracts= 3.857 Lack of adequate Lean awareness = 4.256 Cultural issues= 4.023 Time & commercial pressure= 3.667 Financial issues= 3.326 Lack of top management
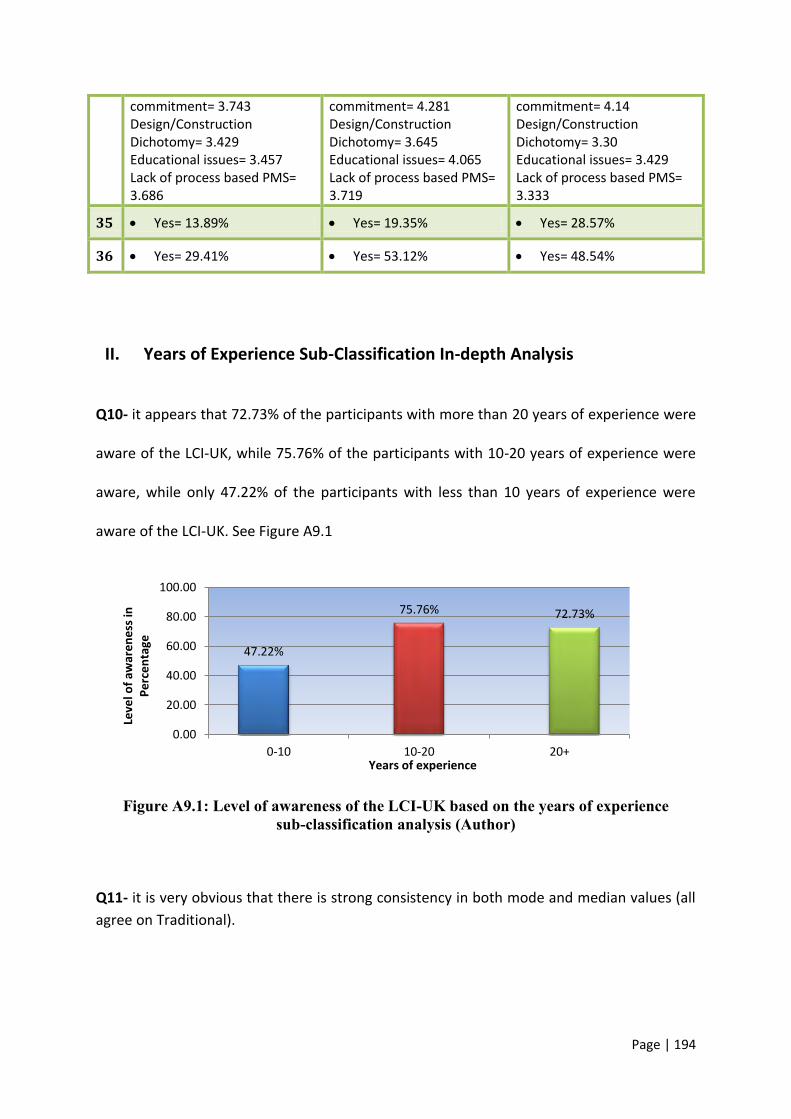
Page | 194
commitment= 3.743 Design/Construction Dichotomy= 3.429 Educational issues= 3.457 Lack of process based PMS= 3.686
commitment= 4.281 Design/Construction Dichotomy= 3.645 Educational issues= 4.065 Lack of process based PMS= 3.719
commitment= 4.14 Design/Construction Dichotomy= 3.30 Educational issues= 3.429 Lack of process based PMS= 3.333
35 Yes= 13.89% Yes= 19.35% Yes= 28.57%
36 Yes= 29.41% Yes= 53.12% Yes= 48.54%
II. Years of Experience Sub-Classification In-depth Analysis
Q10- it appears that 72.73% of the participants with more than 20 years of experience were
aware of the LCI-UK, while 75.76% of the participants with 10-20 years of experience were
aware, while only 47.22% of the participants with less than 10 years of experience were
aware of the LCI-UK. See Figure A9.1
Figure A9.1: Level of awareness of the LCI-UK based on the years of experience sub-classification analysis (Author)
Q11- it is very obvious that there is strong consistency in both mode and median values (all
agree on Traditional).
47.22%
75.76% 72.73%
0.00
20.00
40.00
60.00
80.00
100.00
0-10 10-20 20+
Leve
l of
awar
en
ess
in
Pe
rce
nta
ge
Years of experience
Page | 195
Q12- there seems to be strong consistency in both of the modal and median responses, but
a very little difference in the mean values as respondents with more than 20+ years of
experience obtained a value which is slightly higher than the others.
Q13- there seems to be no variation in the median and modal values, but a little difference
in the mean values as those with 20+ years of experience obtained a slightly higher score
(range 2.35 – 2.64). These results suggest that experience makes a very little difference to
the level of lean commitment.
Q14- there is consistency in the modal responses, but median responses show noticeable
variation, as respondents with the smallest amount of experience (1-10) years of experience
provided the least optimistic responses suggesting no training, increasing slightly as
experience increases.
Q15- it is clear that all agree on top two: long term contractual agreements and document
management systems; and also agree on bottom three: LPDS, All, and Other. However, the
‘All’ option was selected by 21.43% of the respondents with 20+ years of experience
decreasing steadily as experience decreases. It is also obvious that those with 10-20 years of
experience ranked project information systems as 3rd, while the others ranked it
considerably lower.
Q16- it seems that experience does not make a significant difference to the level of
understanding of lean concepts and practices. Both answered 8 statements correctly and
the range of scores was from 59.145% for respondents with 0-10 years of experience to
63.835% for those with 10-20 years of experience.
Page | 196
Q17- all agree on bottom 3 – All, None and Other. No obvious consensus otherwise, as each
level puts tasks in different order. For example, respondents with 0-10 years of experience
put standardised work 1st declining very significantly as years of experience increases. Those
with 10-20 years of experience put collaborative planning schedules 1st but others ranked it
lower. Also, those with 20+ years of experience put data analysis as number one but others
ranked it significantly lower.
Q18- it is noticeable that the awareness of the use of LPS increases as the years of
experience increases. For those with 0-10 years of experience, LPS was selected by 8.82% of
the respondents and it ranked the last in order according to their modal responses; while
for those with 10-20 years of experience, it was selected by 19.35% of the respondents and
ranked the 6th in order. On the other side, 28.57% of those with 20+ years of experience
selected LPS and it ranked the 5th in order according to their modal response.
Q19- it s noticeable that respondents with 20+ years of experience are the most aware of
the techniques used for minimising uncertainty in production processes, as they put PDCA
as number 1 according to their modal responses. For all other sub-classifications, PDCA
came second after ‘None’.
Q20- all agree on top two (not applicable and visual management). Alternatively, it seems
that experience makes a noticeable difference to the level of awareness of using of LPS for
organising the movement of materials, crews and production processes; as it was selected
by 24.39% of the respondents with 20+ years of experience, declining significantly as
experience decreases (range 11.56% - 24.39%).
Page | 197
Q21- it appears that those in the middle (10-20 years of experience) are the most aware of
the management concepts (TQM, SCM, CE) as they achieved a score of 61.29%, while the
other two groups (0-10 and 20+) achieved scores of about 39% and 41% respectively.
Q22- it can be seen that respondents with more than 20 years of experience are the most
aware to supply techniques than the others.
Q23- By referring to the years of experience and managerial position sub-classifications, all
except graduates agree that BIM should come 1st. However, it seems that respondents with
10-20 years of experience and holding medium managerial positions tend to have a slightly
higher level of awareness to BIM than others.
Q24- it seems that those with less than 10 years of experience are slightly more aware of
design concurrent and/or set-based design strategies than the others.
Q25- All agree on top two (N/A & planning as an activity schedule) and all put ‘Other’ at
bottom. No other consensus otherwise.
Q26- there seems to be significant variations. Respondents with 10-20 years of experience
are the least aware (only 3.33% provided a correct answer), respondents with 0-10 years of
experience are more aware than those with 10-20 years of experience (15.15%), while
respondents with 20+ years of experience are the most aware (25%). Again, as the PPC
value is used as a metric for commitment reliability there tends to be a direct relation
between the frequency of using LPS for performance measurement and understanding the
function of the PPC value in LPS (Figure A9.2 below).
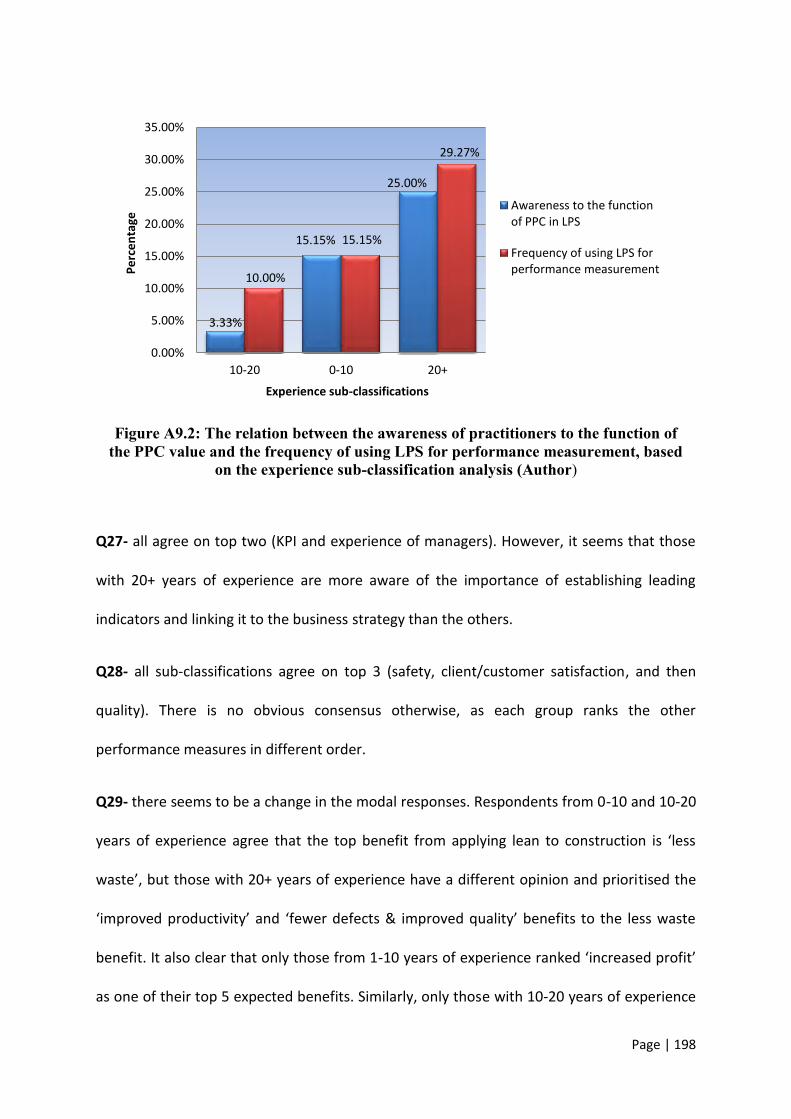
Page | 198
Figure A9.2: The relation between the awareness of practitioners to the function of the PPC value and the frequency of using LPS for performance measurement, based
on the experience sub-classification analysis (Author)
Q27- all agree on top two (KPI and experience of managers). However, it seems that those
with 20+ years of experience are more aware of the importance of establishing leading
indicators and linking it to the business strategy than the others.
Q28- all sub-classifications agree on top 3 (safety, client/customer satisfaction, and then
quality). There is no obvious consensus otherwise, as each group ranks the other
performance measures in different order.
Q29- there seems to be a change in the modal responses. Respondents from 0-10 and 10-20
years of experience agree that the top benefit from applying lean to construction is ‘less
waste’, but those with 20+ years of experience have a different opinion and prioritised the
‘improved productivity’ and ‘fewer defects & improved quality’ benefits to the less waste
benefit. It also clear that only those from 1-10 years of experience ranked ‘increased profit’
as one of their top 5 expected benefits. Similarly, only those with 10-20 years of experience
3.33%
15.15%
25.00%
10.00%
15.15%
29.27%
0.00%
5.00%
10.00%
15.00%
20.00%
25.00%
30.00%
35.00%
10-20 0-10 20+
Pe
rce
nta
ge
Experience sub-classifications
Awareness to the function of PPC in LPS
Frequency of using LPS for performance measurement

Page | 199
included ‘improved safety and health conditions’ to their top 5 expected benefits and it
replaced the ‘reduced cost’ benefit.
Q30- it appears that respondents with 0-10 years of experience are the most optimistic
about the profitability of LC (21.21%, 3rd rank), then comes those with 20+ years of
experience (17.5%, 5th rank), and finally those with 10-20 years of experience are the least
optimistic (12.9%, 5th rank). On the other hand, the latter achieved the highest scores for
supply chain assistance and the ‘All’ option (approximately 32%).
Q31- it appears that all agree on the top two (international standards and BREEAM) and the
bottom choice (Other). However, it is clear that the awareness of the possibility/importance
of adopting LC and supply-chain assistance (as ways for achieving environmental
considerations) increases as experience increases.
Q32- it appears that those with 10-20 years experience are the least aware/optimistic about
the idea of creating a lean culture within their organisations, while the most experienced
(20+) are the most interested. The responses in percentage were as follows: 18.18% for
those with 0-10 years, 21.43% for those with 20+, but only 9.68% for those with 10-20 years
of experience and it figured in a lower level (based on the modal response sequence).
Q33- it appears that all agree on top four, but with no consistency in their modal responses.
Also, the results indicate that the awareness to governmental reports, such as the Egan’s
report, increases as experience increases. The Egan’s report option was selected by 5.38% of
the respondents with 0-10 years of experience and it ranked at the bottom of their modal
responses, 16.13% of those from 10-20 and ranked 5th and, then 20.51% of those with 20+
years of experience and also ranked 5th.
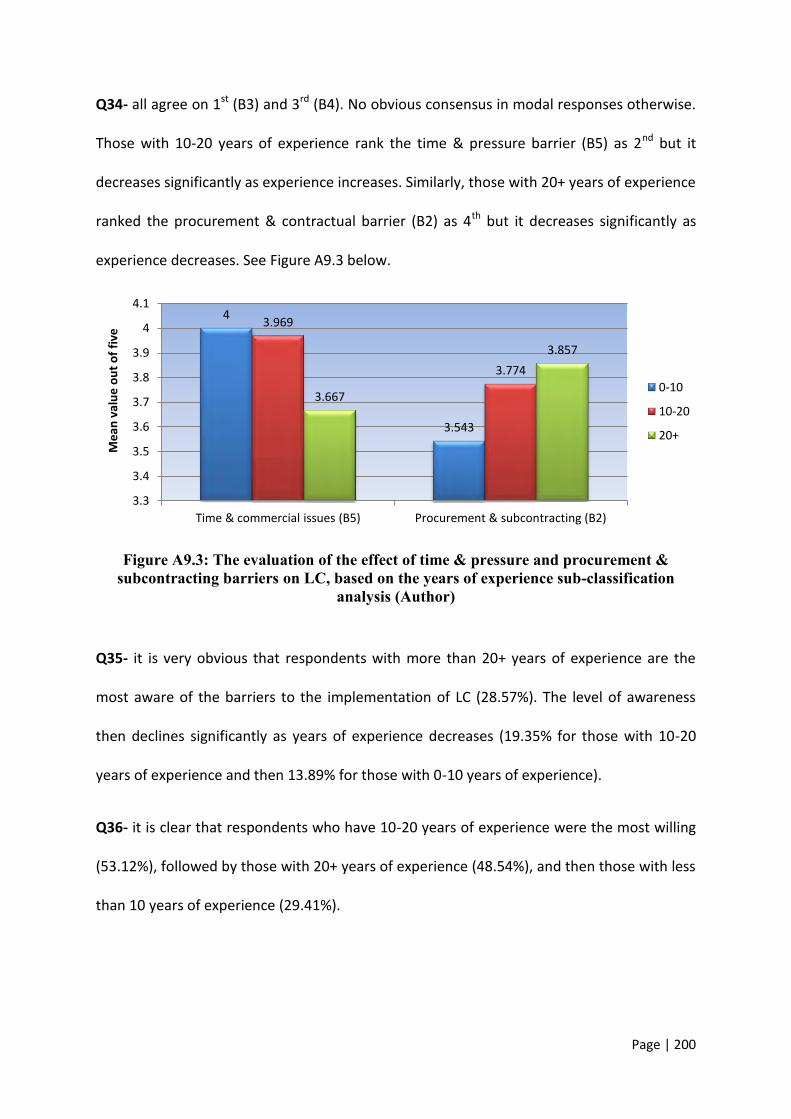
Page | 200
Q34- all agree on 1st (B3) and 3rd (B4). No obvious consensus in modal responses otherwise.
Those with 10-20 years of experience rank the time & pressure barrier (B5) as 2nd but it
decreases significantly as experience increases. Similarly, those with 20+ years of experience
ranked the procurement & contractual barrier (B2) as 4th but it decreases significantly as
experience decreases. See Figure A9.3 below.
Figure A9.3: The evaluation of the effect of time & pressure and procurement & subcontracting barriers on LC, based on the years of experience sub-classification
analysis (Author)
Q35- it is very obvious that respondents with more than 20+ years of experience are the
most aware of the barriers to the implementation of LC (28.57%). The level of awareness
then declines significantly as years of experience decreases (19.35% for those with 10-20
years of experience and then 13.89% for those with 0-10 years of experience).
Q36- it is clear that respondents who have 10-20 years of experience were the most willing
(53.12%), followed by those with 20+ years of experience (48.54%), and then those with less
than 10 years of experience (29.41%).
4
3.543
3.969
3.774
3.667
3.857
3.3
3.4
3.5
3.6
3.7
3.8
3.9
4
4.1
Time & commercial issues (B5) Procurement & subcontracting (B2)
Me
an v
alu
e o
ut
of
five
0-10
10-20
20+
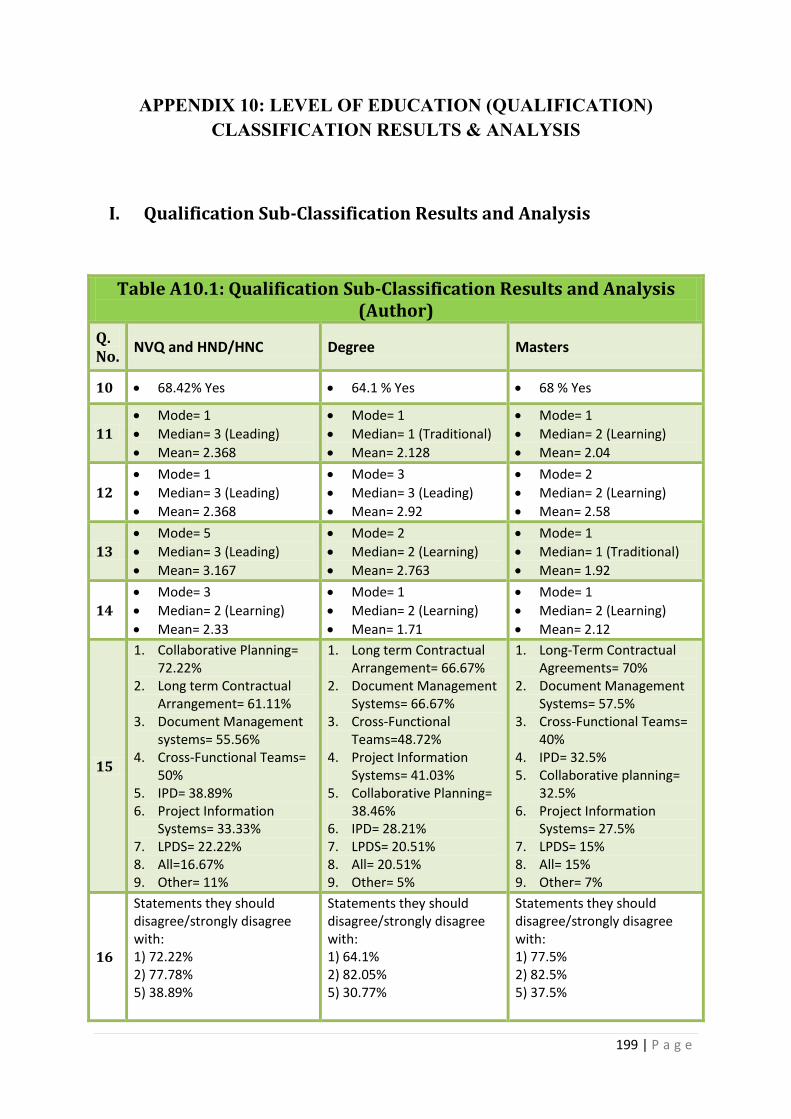
199 | P a g e
APPENDIX 10: LEVEL OF EDUCATION (QUALIFICATION) CLASSIFICATION RESULTS & ANALYSIS
I. Qualification Sub-Classification Results and Analysis
Table A10.1: Qualification Sub-Classification Results and Analysis (Author)
Q. No.
NVQ and HND/HNC Degree Masters
10 68.42% Yes 64.1 % Yes 68 % Yes
11
Mode= 1
Median= 3 (Leading)
Mean= 2.368
Mode= 1
Median= 1 (Traditional)
Mean= 2.128
Mode= 1
Median= 2 (Learning)
Mean= 2.04
12
Mode= 1
Median= 3 (Leading)
Mean= 2.368
Mode= 3
Median= 3 (Leading)
Mean= 2.92
Mode= 2
Median= 2 (Learning)
Mean= 2.58
13
Mode= 5
Median= 3 (Leading)
Mean= 3.167
Mode= 2
Median= 2 (Learning)
Mean= 2.763
Mode= 1
Median= 1 (Traditional)
Mean= 1.92
14
Mode= 3
Median= 2 (Learning)
Mean= 2.33
Mode= 1
Median= 2 (Learning)
Mean= 1.71
Mode= 1
Median= 2 (Learning)
Mean= 2.12
15
1. Collaborative Planning= 72.22%
2. Long term Contractual Arrangement= 61.11%
3. Document Management systems= 55.56%
4. Cross-Functional Teams= 50%
5. IPD= 38.89% 6. Project Information
Systems= 33.33% 7. LPDS= 22.22% 8. All=16.67% 9. Other= 11%
1. Long term Contractual Arrangement= 66.67%
2. Document Management Systems= 66.67%
3. Cross-Functional Teams=48.72%
4. Project Information Systems= 41.03%
5. Collaborative Planning= 38.46%
6. IPD= 28.21% 7. LPDS= 20.51% 8. All= 20.51% 9. Other= 5%
1. Long-Term Contractual Agreements= 70%
2. Document Management Systems= 57.5%
3. Cross-Functional Teams= 40%
4. IPD= 32.5% 5. Collaborative planning=
32.5% 6. Project Information
Systems= 27.5% 7. LPDS= 15% 8. All= 15% 9. Other= 7%
16
Statements they should disagree/strongly disagree with: 1) 72.22% 2) 77.78% 5) 38.89%
Statements they should disagree/strongly disagree with: 1) 64.1% 2) 82.05% 5) 30.77%
Statements they should disagree/strongly disagree with: 1) 77.5% 2) 82.5% 5) 37.5%

200 | P a g e
Statements they should agree/strongly agree with: 3) 77.78% 4) 61.11% 6) 33.34% 7) 16.67% 8) 88.89% 9) 83.33% 10) 44.44% 11) 72.22% 7 correct out of 11 Average score= 60.6%
Statements they should agree/strongly agree with: 3) 64.11% 4) 61.54% 6) 23.07% 7) 43.59% 8) 92.11% 9) 57.9% 10) 56.41% 11) 84.62% 8 correct out of 11 Average score= 60.02%
Statements they should agree/strongly agree with: 3) 60% 4) 52.5% 6) 25% 7) 33.34% 8) 92.5% 9) 72.5% 10) 61.54% 11) 80% 8 correct out of 11 Average score= 61.35%
17
1. Workplace organisation= 66.67%
2. Standardised work= 66.67%
3. Problem solving= 66.67% 4. Collaborative planning=
61.11% 5. Data analysis= 61.11% 6. Visual management=
61.11% 7. Work sequence analysis=
50% 8. Process mapping= 50% 9. All= 22% 10. Other= 11% 11. None= 0%
1. Problem solving= 58.97%
2. Collaborative Planning= 56.41%
3. Data Analysis= 53.85% 4. Workplace organisation=
53.85% 5. Visual management=
51.28% 6. Standardised work=
51.28% 7. Process mapping=
48.72% 8. Work sequence
analysis= 33.33% 9. All= 17.95% 10. None= 10.26% 11. Other= 7%
1. Workplace organisation= 43.59%
2. Collaborative Planning= 38.46%
3. Standardised work= 38.46%
4. Work sequence analysis= 35.9%
5. Data Analysis= 33.33% 6. Problem solving= 33.33% 7. Process mapping= 28.21% 8. Visual management=
25.64% 9. All= 17.95% 10. None= 12.82% 11. Other= 5%
18
1. CPM= 72.22% 2. Look ahead planning=
55.56% 3. PPC tools= 50% 4. Constraint analysis=
33.33% 5. Not Applicable= 22.22% 6. Workflow PM= 16.67% 7. LPS= 16.67% 8. RPS= 16.67% 9. Other= 0%
1. CPM= 60.53% 2. Look ahead planning=
44.74% 3. PCP tools= 34.21% 4. Constraint analysis=
26.32% 5. Not applicable= 18.42% 6. WF PM= 18.42% 7. Other= 18% 8. LPS= 15.79% 9. RPS= 7.89%
1. CPM= 64.1% 2. Look ahead Planning=
53.85% 3. PCP tools= 46.15% 4. Workflow PM= 30.77% 5. LPS=25.64% 6. Constraint analysis=
25.64% 7. N/A= 12.82% 8. RSPS= 10.26% 9. Other= 7%
19
1. None= 50% 2. PDCA= 33.33% 3. Prefabrication= 33.33% 4. First Run Studies= 11.11% 5. Other= 0%
1. None= 50% 2. PDCA= 38.46% 3. Prefabrication= 12.82% 4. First Run Studies=
12.82% 5. Other= 10%
1. None= 43.95% 2. PDCA= 41.03% 3. Prefabrication= 20.51% 4. FRS= 10.26% 5. Other= 10%
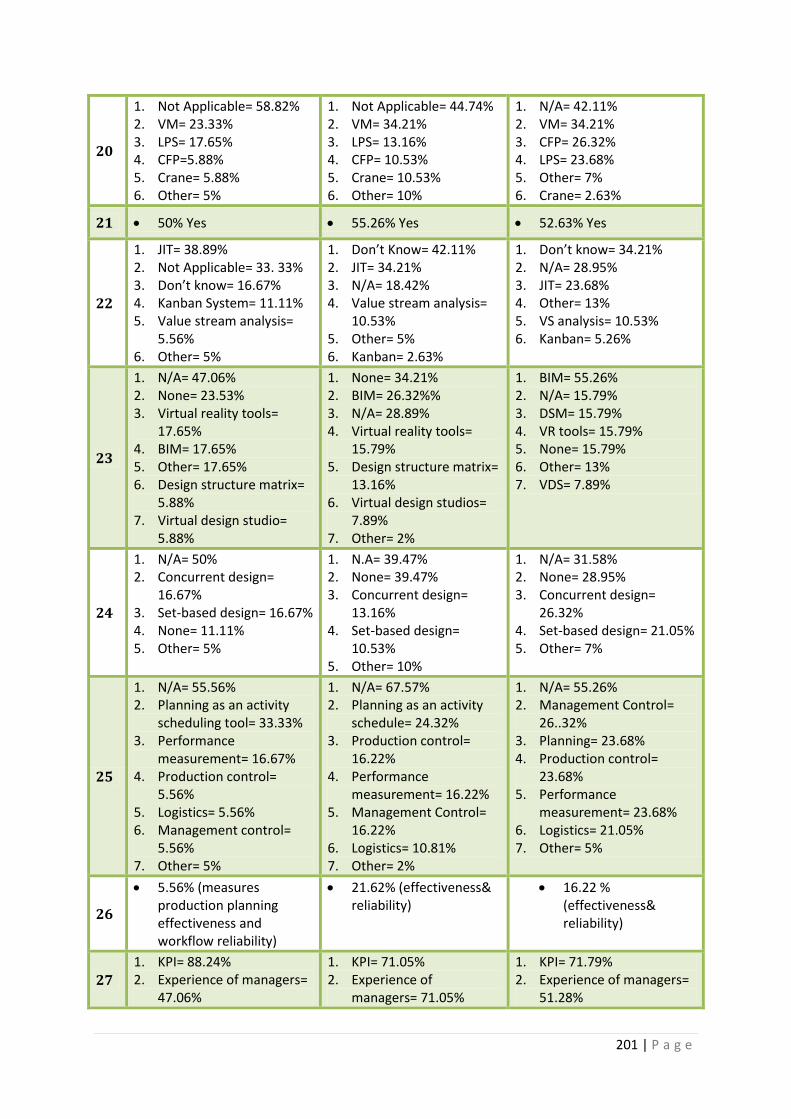
201 | P a g e
20
1. Not Applicable= 58.82% 2. VM= 23.33% 3. LPS= 17.65% 4. CFP=5.88% 5. Crane= 5.88% 6. Other= 5%
1. Not Applicable= 44.74% 2. VM= 34.21% 3. LPS= 13.16% 4. CFP= 10.53% 5. Crane= 10.53% 6. Other= 10%
1. N/A= 42.11% 2. VM= 34.21% 3. CFP= 26.32% 4. LPS= 23.68% 5. Other= 7% 6. Crane= 2.63%
21 50% Yes 55.26% Yes 52.63% Yes
22
1. JIT= 38.89% 2. Not Applicable= 33. 33% 3. Don’t know= 16.67% 4. Kanban System= 11.11% 5. Value stream analysis=
5.56% 6. Other= 5%
1. Don’t Know= 42.11% 2. JIT= 34.21% 3. N/A= 18.42% 4. Value stream analysis=
10.53% 5. Other= 5% 6. Kanban= 2.63%
1. Don’t know= 34.21% 2. N/A= 28.95% 3. JIT= 23.68% 4. Other= 13% 5. VS analysis= 10.53% 6. Kanban= 5.26%
23
1. N/A= 47.06% 2. None= 23.53% 3. Virtual reality tools=
17.65% 4. BIM= 17.65% 5. Other= 17.65% 6. Design structure matrix=
5.88% 7. Virtual design studio=
5.88%
1. None= 34.21% 2. BIM= 26.32%% 3. N/A= 28.89% 4. Virtual reality tools=
15.79% 5. Design structure matrix=
13.16% 6. Virtual design studios=
7.89% 7. Other= 2%
1. BIM= 55.26% 2. N/A= 15.79% 3. DSM= 15.79% 4. VR tools= 15.79% 5. None= 15.79% 6. Other= 13% 7. VDS= 7.89%
24
1. N/A= 50% 2. Concurrent design=
16.67% 3. Set-based design= 16.67% 4. None= 11.11% 5. Other= 5%
1. N.A= 39.47% 2. None= 39.47% 3. Concurrent design=
13.16% 4. Set-based design=
10.53% 5. Other= 10%
1. N/A= 31.58% 2. None= 28.95% 3. Concurrent design=
26.32% 4. Set-based design= 21.05% 5. Other= 7%
25
1. N/A= 55.56% 2. Planning as an activity
scheduling tool= 33.33% 3. Performance
measurement= 16.67% 4. Production control=
5.56% 5. Logistics= 5.56% 6. Management control=
5.56% 7. Other= 5%
1. N/A= 67.57% 2. Planning as an activity
schedule= 24.32% 3. Production control=
16.22% 4. Performance
measurement= 16.22% 5. Management Control=
16.22% 6. Logistics= 10.81% 7. Other= 2%
1. N/A= 55.26% 2. Management Control=
26..32% 3. Planning= 23.68% 4. Production control=
23.68% 5. Performance
measurement= 23.68% 6. Logistics= 21.05% 7. Other= 5%
26
5.56% (measures production planning effectiveness and workflow reliability)
21.62% (effectiveness& reliability)
16.22 % (effectiveness& reliability)
27
1. KPI= 88.24% 2. Experience of managers=
47.06%
1. KPI= 71.05% 2. Experience of
managers= 71.05%
1. KPI= 71.79% 2. Experience of managers=
51.28%
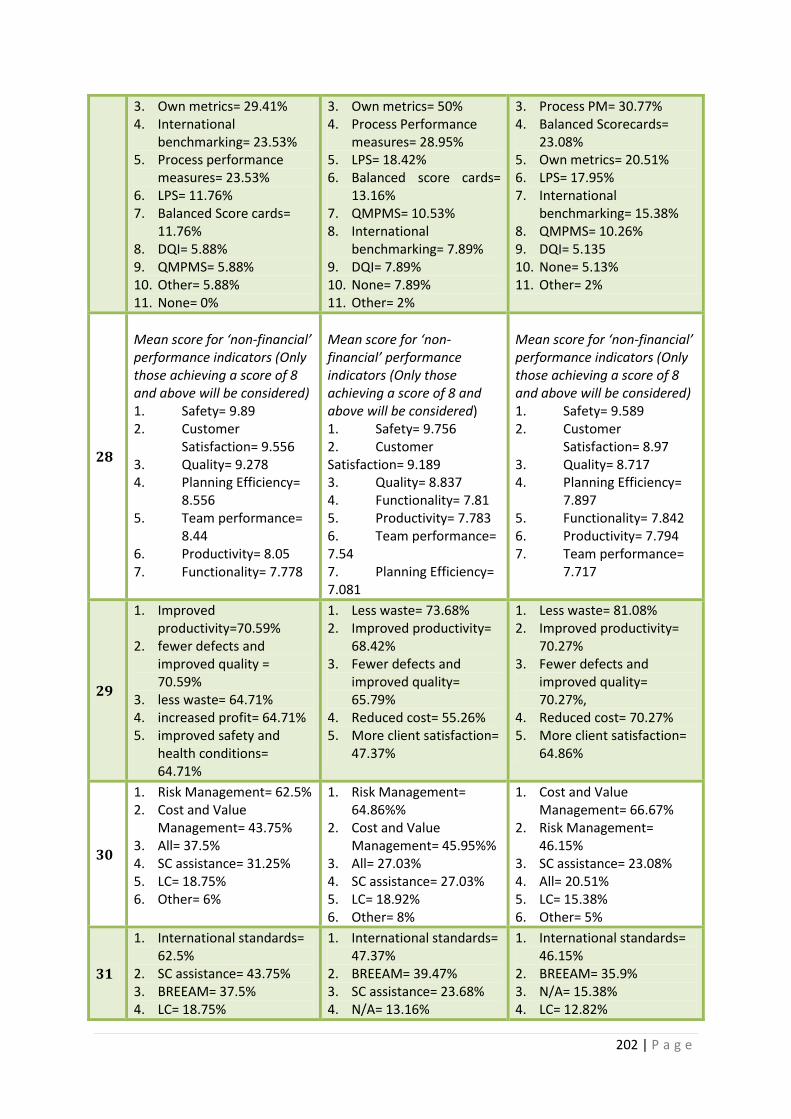
202 | P a g e
3. Own metrics= 29.41% 4. International
benchmarking= 23.53% 5. Process performance
measures= 23.53% 6. LPS= 11.76% 7. Balanced Score cards=
11.76% 8. DQI= 5.88% 9. QMPMS= 5.88% 10. Other= 5.88% 11. None= 0%
3. Own metrics= 50% 4. Process Performance
measures= 28.95% 5. LPS= 18.42% 6. Balanced score cards=
13.16% 7. QMPMS= 10.53% 8. International
benchmarking= 7.89% 9. DQI= 7.89% 10. None= 7.89% 11. Other= 2%
3. Process PM= 30.77% 4. Balanced Scorecards=
23.08% 5. Own metrics= 20.51% 6. LPS= 17.95% 7. International
benchmarking= 15.38% 8. QMPMS= 10.26% 9. DQI= 5.135 10. None= 5.13% 11. Other= 2%
28
Mean score for ‘non-financial’ performance indicators (Only those achieving a score of 8 and above will be considered) 1. Safety= 9.89 2. Customer
Satisfaction= 9.556 3. Quality= 9.278 4. Planning Efficiency=
8.556 5. Team performance=
8.44 6. Productivity= 8.05 7. Functionality= 7.778
Mean score for ‘non-financial’ performance indicators (Only those achieving a score of 8 and above will be considered) 1. Safety= 9.756 2. Customer Satisfaction= 9.189 3. Quality= 8.837 4. Functionality= 7.81 5. Productivity= 7.783 6. Team performance= 7.54 7. Planning Efficiency= 7.081
Mean score for ‘non-financial’ performance indicators (Only those achieving a score of 8 and above will be considered) 1. Safety= 9.589 2. Customer
Satisfaction= 8.97 3. Quality= 8.717 4. Planning Efficiency=
7.897 5. Functionality= 7.842 6. Productivity= 7.794 7. Team performance=
7.717
29
1. Improved productivity=70.59%
2. fewer defects and improved quality = 70.59%
3. less waste= 64.71% 4. increased profit= 64.71% 5. improved safety and
health conditions= 64.71%
1. Less waste= 73.68% 2. Improved productivity=
68.42% 3. Fewer defects and
improved quality= 65.79%
4. Reduced cost= 55.26% 5. More client satisfaction=
47.37%
1. Less waste= 81.08% 2. Improved productivity=
70.27% 3. Fewer defects and
improved quality= 70.27%,
4. Reduced cost= 70.27% 5. More client satisfaction=
64.86%
30
1. Risk Management= 62.5% 2. Cost and Value
Management= 43.75% 3. All= 37.5% 4. SC assistance= 31.25% 5. LC= 18.75% 6. Other= 6%
1. Risk Management= 64.86%%
2. Cost and Value Management= 45.95%%
3. All= 27.03% 4. SC assistance= 27.03% 5. LC= 18.92% 6. Other= 8%
1. Cost and Value Management= 66.67%
2. Risk Management= 46.15%
3. SC assistance= 23.08% 4. All= 20.51% 5. LC= 15.38% 6. Other= 5%
31
1. International standards= 62.5%
2. SC assistance= 43.75% 3. BREEAM= 37.5% 4. LC= 18.75%
1. International standards= 47.37%
2. BREEAM= 39.47% 3. SC assistance= 23.68% 4. N/A= 13.16%
1. International standards= 46.15%
2. BREEAM= 35.9% 3. N/A= 15.38% 4. LC= 12.82%

203 | P a g e
5. N/A= 12.5% 6. All=6.25% 7. Other= 0%
5. LC= 13.16% 6. All= 10.53% 7. Other= 7%
5. All= 10.26% 6. SC assistance= 10.26% 7. Other= 10%
32
1. In-house training= 64.71%
2. Job knowledge and skills scheme= 58.82%
3. Team development= 35.29%
4. Community engagement= 35.29%
5. Creating a Lean culture= 29.41%
6. Safety programmes= 29.41%
7. All=11.76% 8. Other= 5%
1. In-house training= 47.37%
2. Community engagement= 39.47%
3. Team development= 34. 2%
4. Job knowledge and Skills scheme= 31.58%
5. Safety programmes= 28.95%
6. Creating a Lean culture= 15.79%
7. All= 15.79% 8. Other= 15%
1. Community engagement= 48.72%
2. In-house training= 41.03% 3. Safety programmes=
33.33% 4. Job knowledge and Skills
scheme= 25.64% 5. Team development=
23.08% 6. Lean culture= 12.82% 7. All= 10.26% 8. Other= 5%
33
1. To improve our rate of client satisfaction= 62.5%
2. To keep up-to-date with any new emerging management concepts= 50%
3. To increase our profit and /or turnover= 50%
4. To improve the quality of our outputs= 37.5%
5. As a respond to the Egan's report= 25%
6. When a major problem occurs/occurred=12.5%
7. Other= 12% 8. We are satisfied, no need
to change= 0%
1. To improve the quality of our outputs= 55.26%
2. To improve our rate of client satisfaction= 55.26%
3. To increase our profit and /or turnover= 52.63%
4. To keep up to date= 28.95%
5. We are satisfied= 13.16%
6. Other= 13% 7. As a respond to Egan’s
report= 10.53% 8. When a major problem
occurs= 5.26%
1. To increase our profit and /or turnover= 54.05%
2. To improve our rate of client satisfaction= 48.65%
3. To improve the quality of our outputs= 48.65%
4. To keep up-to-date= 32.43%
5. As a respond to Egan’s report= 21.62%
6. Other= 13% 7. When a major problem
occurs= 10.81% 8. We are satisfied, No need
to change= 8.11%
34
Only barriers with a mean score of 4.0 and above will be classified as significant barriers: Fragmentation & subcontracting= 3.353 Procurement & contracts= 3.588 Lack of Lean awareness & understanding= 4.235 Cultural issues= 4.235 Time & commercial pressure= 3.824 Financial issues= 3.588
Only barriers with a mean score of 4.0 and above will be classified as significant barriers: Fragmentation & subcontracting= 3.947 Procurement & contracts= 3.684 Lack of Lean awareness = 4.231 Cultural issues= 3.846 Time & commercial pressure= 3.895 Financial issues= 3.308
Only barriers with a mean score of 4.0 and above will be classified as significant barriers: Fragmentation & subcontracting= 3.868 Procurement & contracts= 3.763 Lack of Lean awareness = 4.282 Cultural issues= 4.154 Time & commercial pressure= 3.846 Financial issues= 3.487
204 | P a g e
Lack of top management commitment= 4.118 Design/Construction Dichotomy= 3.313 Educational issues= 3.412 Lack of process based PMS= 3.588
Lack of top management commitment= 3.846 Design/Construction Dichotomy= 3.324 Educational issues= 3.474 Lack of process based PMS= 3.526
Lack of top management commitment= 4.128 Design/Construction Dichotomy= 3.395 Educational issues= 3.816 Lack of process based PMS= 3.744
35 Yes= 23.53% Yes= 21.62% Yes= 15%
36 Yes= 35.29% Yes= 41.03% Yes= 46.15%
II. Qualification Sub-Classification In-depth Analysis
Q10- it seems that education makes very little difference to the level of awareness of the
LCI-UK (range 64% - 68%).
Q11- it is obvious that there is no change in modal response, but the mean value shows
marked variation as lower education obtained the highest score declining steadily as
education level increases. When it comes to median responses, those holding HNC/HND
provided an optimistic evaluation and obtained a median value equal to 3 (Leading),
followed by those holding masters who obtained a median value equal to 2 (Learning), and
then those holding a degree provided the least optimistic evaluation (Traditional).
Q12- there seems to be no consistency in the responses. Respondents holding masters
obtained a median value equal to 2 (Learning) unlike the other two groups which obtained a
median value equal to 3 (Leading). However, it is also obvious that respondents holding
HNC/HND obtained the lowest mode and mean values, respondents holding masters came
in the middle, while respondents holding a degree obtained the highest scores.
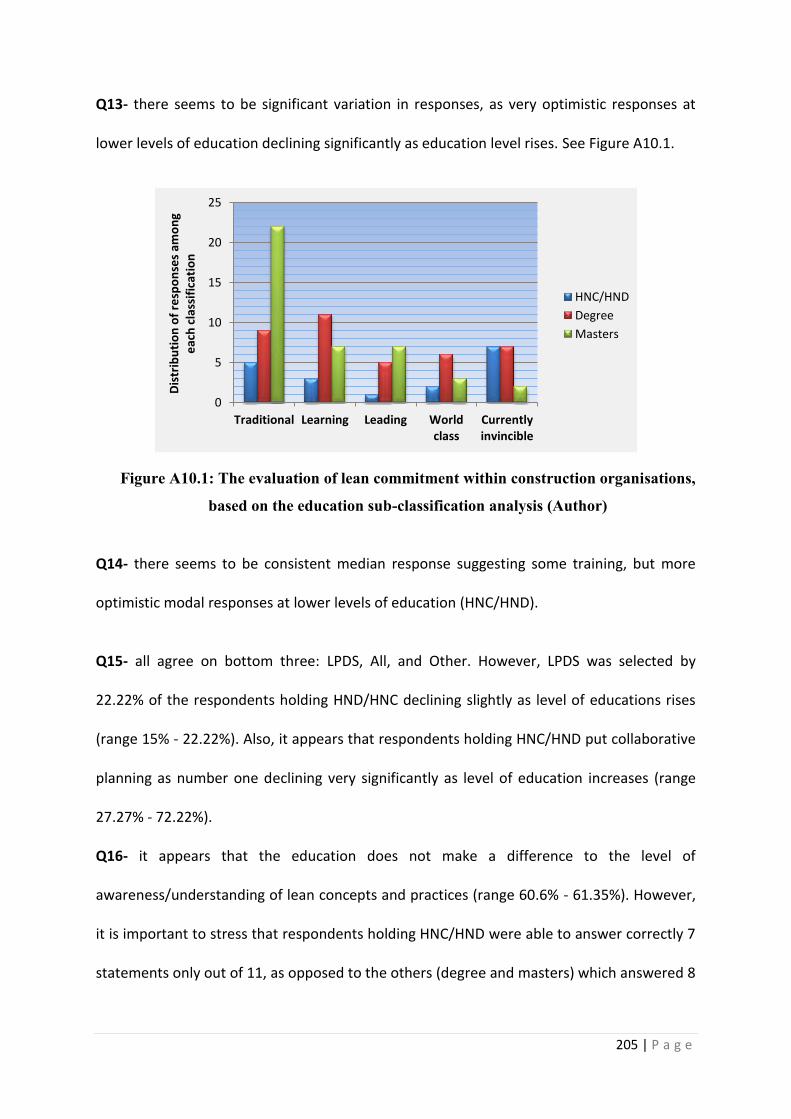
205 | P a g e
Q13- there seems to be significant variation in responses, as very optimistic responses at
lower levels of education declining significantly as education level rises. See Figure A10.1.
Figure A10.1: The evaluation of lean commitment within construction organisations,
based on the education sub-classification analysis (Author)
Q14- there seems to be consistent median response suggesting some training, but more
optimistic modal responses at lower levels of education (HNC/HND).
Q15- all agree on bottom three: LPDS, All, and Other. However, LPDS was selected by
22.22% of the respondents holding HND/HNC declining slightly as level of educations rises
(range 15% - 22.22%). Also, it appears that respondents holding HNC/HND put collaborative
planning as number one declining very significantly as level of education increases (range
27.27% - 72.22%).
Q16- it appears that the education does not make a difference to the level of
awareness/understanding of lean concepts and practices (range 60.6% - 61.35%). However,
it is important to stress that respondents holding HNC/HND were able to answer correctly 7
statements only out of 11, as opposed to the others (degree and masters) which answered 8
0
5
10
15
20
25
Traditional Learning Leading World class
Currently invincible
Dis
trib
uti
on
of
resp
on
ses
amo
ng
eac
h c
lass
ific
atio
n
HNC/HND
Degree
Masters
206 | P a g e
statements correctly. That is because respondents holding HNC/HND did not agree with S10
(they achieved a frequency score= 44.44%).
Q17- all agree on bottom 3 – All, None and Other. No obvious consensus otherwise, as each
level ranks tasks in different order.
Q18- it is obvious that all agree on top three (CPM, look ahead planning, and PPC tools).
Respondents holding masters ranked LPS as 5th but those holding a degree and HNC/HND
put it noticeably lower.
Q19- there appears to be strong consensus in the modal responses. In all cases, None came
1st and then PDCA, Prefabrication, FRS, and other.
Q20- it comes into view that all agree on top two (not applicable and visual management).
However, respondents holding masters ranked CFP as number 3, declining significantly as
level of education decreases (range 5.88% - 26.32%). Also, although those holding masters
ranked LPS as 4th which is one level lower than the others, they selected it more frequently
than them.
Q21- it seems that education makes very little difference to the experience with the
management concepts mentioned in the question (range 50% - 55%). While when referring
to the managerial position sub-classification analysis, it is clear that the awareness of those
management concepts (TQM, SCM, and CE) increases as the managerial position increases
(range 20% - 42%) where middle management are slightly more aware than senior
managers. However, when focussing on the experience sub-classification analysis, it is more
obvious that those in the middle (10-20 years of experience) are the most aware as they

207 | P a g e
achieved a score of 61.29%, while the other two groups (0-10 and 20+) achieved scores of
about 39% and 41% respectively.
Q22- there seems to be significant variations to the level of awareness of using JIT as a
supply technique; as respondents holding HNC/HND ranked it first, declining steadily as the
level of education rises (See Table A10.2).
Table A10.2: The level of awareness of JIT as a supply technique, based on the qualification sub-classification analysis (Author)
Modal Order NVQ and HNC/HND Bachelors degree Masters degree
1 JIT= 38.89% Don’t Know= 42.11% Don’t know= 34.21%
2 N/A= 33.33% JIT= 34.21% N/A= 28.95%
3 Don’t know= 16.67% N/A= 18.42% JIT= 23.68%
Q23- there seems to be very significant variations in the modal responses, as respondents
holding masters ranked BIM as number one, declining significantly as the level of education
decreases (range 17.65% - 55.26%). These considerable variations undoubtedly suggest that
the level of awareness of BIM increases as the level of education increases (Table A10.3).
Table A10.3: The level of awareness of BIM, based on the education sub-classification analysis (Author)
Modal Order
NVQ and HNC/HND Bachelors degree Masters degree
1 N/A= 47.06% None= 34.21% BIM= 55.26%
2 None= 23.53% BIM= 26.32%% N/A= 15.79%
3 Virtual reality tools= 17.65%
N/A= 28.89% DSM= 15.79%
4 BIM= 17.65% Virtual reality tools= 15.79%
Virtual reality tools= 15.79%
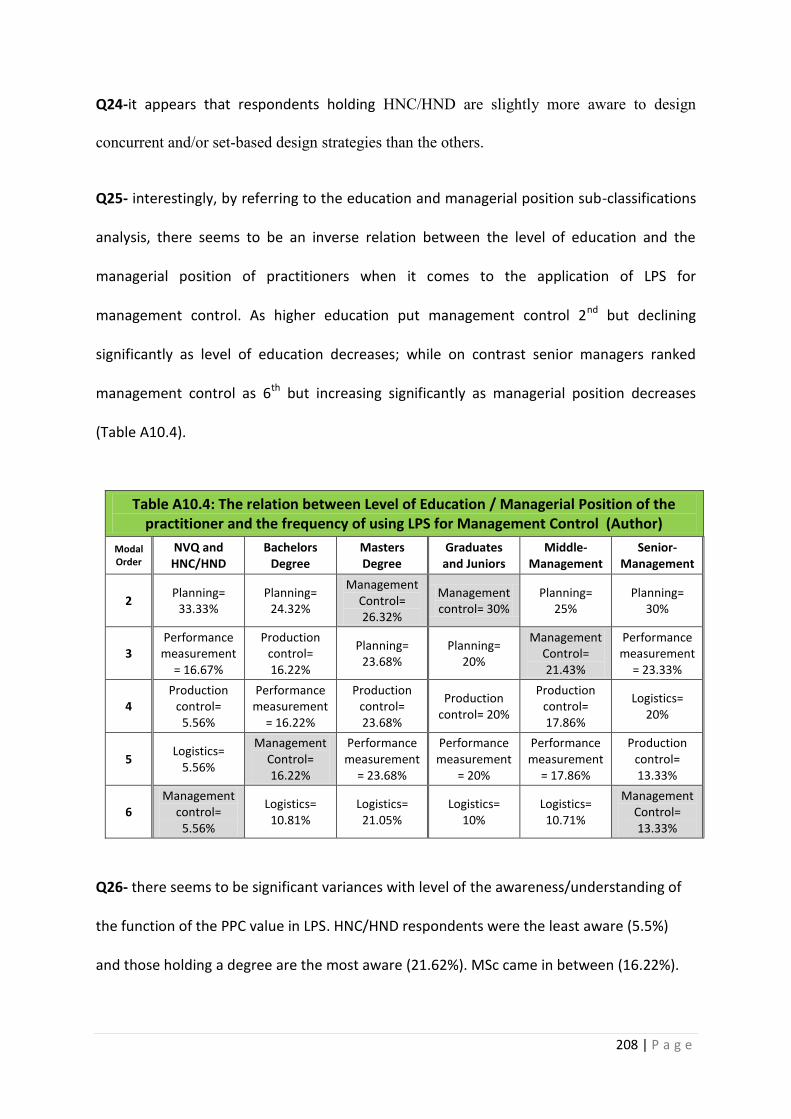
208 | P a g e
Q24-it appears that respondents holding HNC/HND are slightly more aware to design
concurrent and/or set-based design strategies than the others.
Q25- interestingly, by referring to the education and managerial position sub-classifications
analysis, there seems to be an inverse relation between the level of education and the
managerial position of practitioners when it comes to the application of LPS for
management control. As higher education put management control 2nd but declining
significantly as level of education decreases; while on contrast senior managers ranked
management control as 6th but increasing significantly as managerial position decreases
(Table A10.4).
Table A10.4: The relation between Level of Education / Managerial Position of the practitioner and the frequency of using LPS for Management Control (Author)
Modal Order
NVQ and HNC/HND
Bachelors Degree
Masters Degree
Graduates and Juniors
Middle-Management
Senior-Management
2 Planning=
33.33% Planning=
24.32%
Management Control= 26.32%
Management control= 30%
Planning= 25%
Planning= 30%
3 Performance measurement
= 16.67%
Production control= 16.22%
Planning= 23.68%
Planning= 20%
Management Control= 21.43%
Performance measurement
= 23.33%
4 Production
control= 5.56%
Performance measurement
= 16.22%
Production control= 23.68%
Production control= 20%
Production control= 17.86%
Logistics= 20%
5 Logistics=
5.56%
Management Control= 16.22%
Performance measurement
= 23.68%
Performance measurement
= 20%
Performance measurement
= 17.86%
Production control= 13.33%
6 Management
control= 5.56%
Logistics= 10.81%
Logistics= 21.05%
Logistics= 10%
Logistics= 10.71%
Management Control= 13.33%
Q26- there seems to be significant variances with level of the awareness/understanding of
the function of the PPC value in LPS. HNC/HND respondents were the least aware (5.5%)
and those holding a degree are the most aware (21.62%). MSc came in between (16.22%).
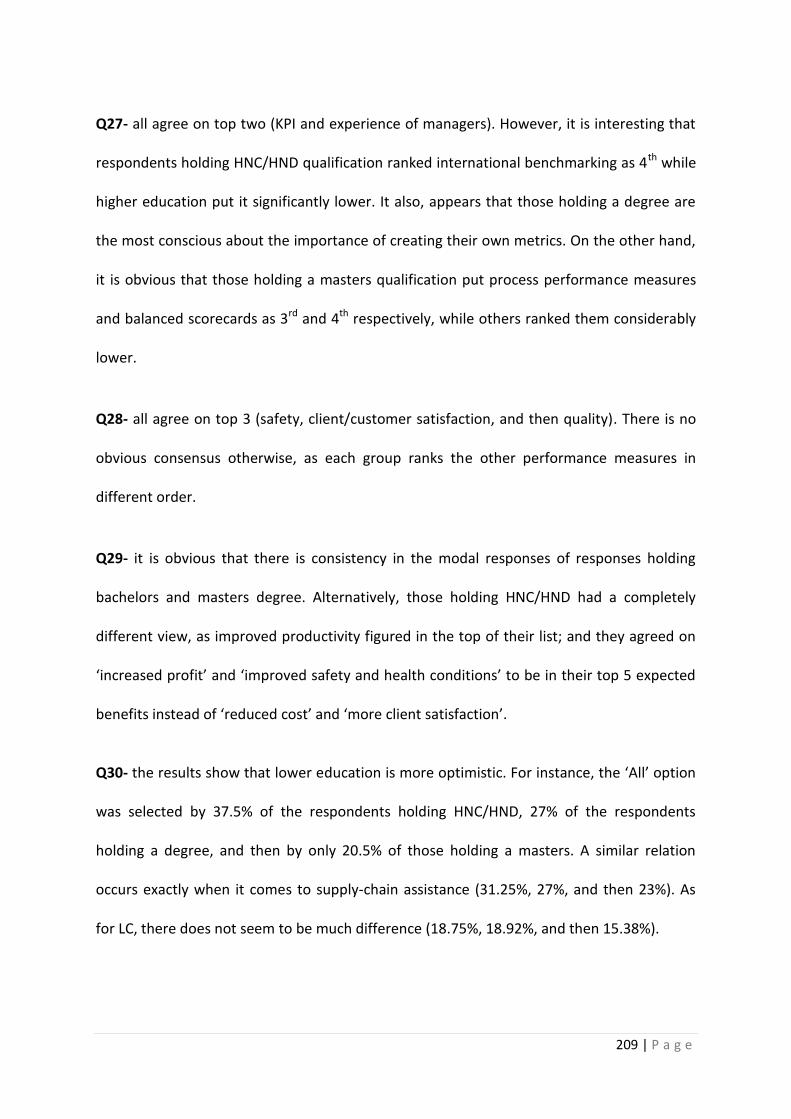
209 | P a g e
Q27- all agree on top two (KPI and experience of managers). However, it is interesting that
respondents holding HNC/HND qualification ranked international benchmarking as 4th while
higher education put it significantly lower. It also, appears that those holding a degree are
the most conscious about the importance of creating their own metrics. On the other hand,
it is obvious that those holding a masters qualification put process performance measures
and balanced scorecards as 3rd and 4th respectively, while others ranked them considerably
lower.
Q28- all agree on top 3 (safety, client/customer satisfaction, and then quality). There is no
obvious consensus otherwise, as each group ranks the other performance measures in
different order.
Q29- it is obvious that there is consistency in the modal responses of responses holding
bachelors and masters degree. Alternatively, those holding HNC/HND had a completely
different view, as improved productivity figured in the top of their list; and they agreed on
‘increased profit’ and ‘improved safety and health conditions’ to be in their top 5 expected
benefits instead of ‘reduced cost’ and ‘more client satisfaction’.
Q30- the results show that lower education is more optimistic. For instance, the ‘All’ option
was selected by 37.5% of the respondents holding HNC/HND, 27% of the respondents
holding a degree, and then by only 20.5% of those holding a masters. A similar relation
occurs exactly when it comes to supply-chain assistance (31.25%, 27%, and then 23%). As
for LC, there does not seem to be much difference (18.75%, 18.92%, and then 15.38%).
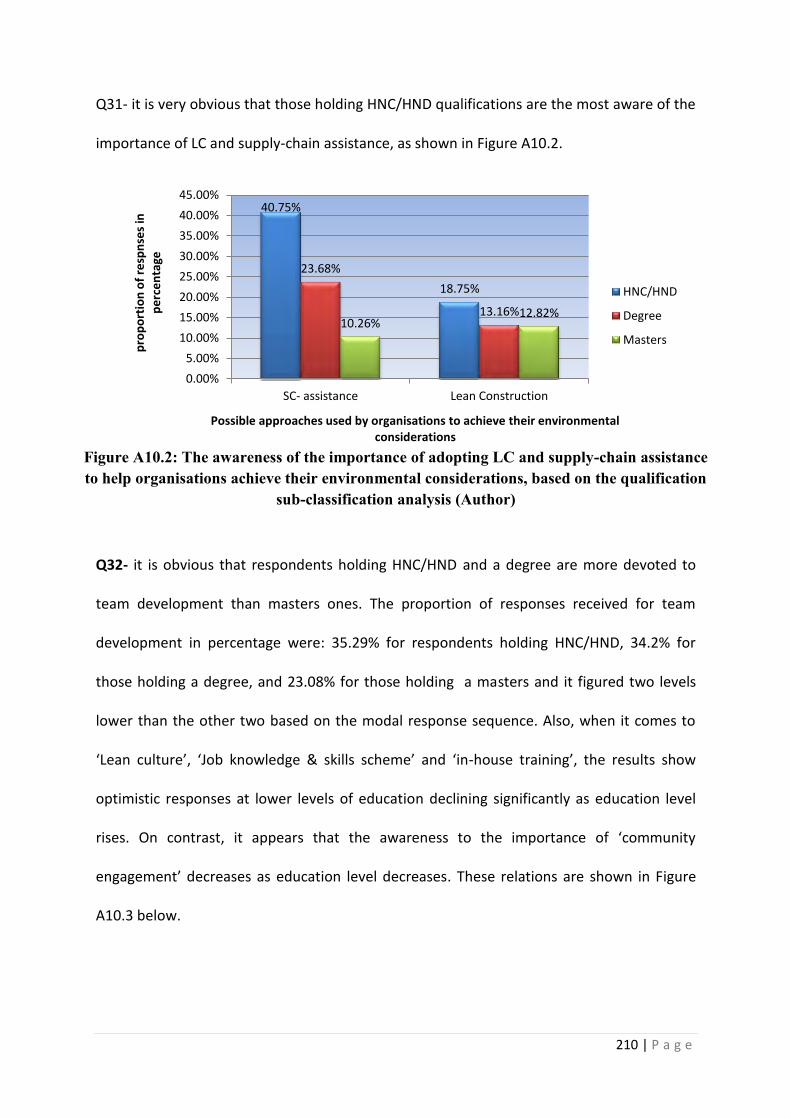
210 | P a g e
Q31- it is very obvious that those holding HNC/HND qualifications are the most aware of the
importance of LC and supply-chain assistance, as shown in Figure A10.2.
Figure A10.2: The awareness of the importance of adopting LC and supply-chain assistance to help organisations achieve their environmental considerations, based on the qualification
sub-classification analysis (Author)
Q32- it is obvious that respondents holding HNC/HND and a degree are more devoted to
team development than masters ones. The proportion of responses received for team
development in percentage were: 35.29% for respondents holding HNC/HND, 34.2% for
those holding a degree, and 23.08% for those holding a masters and it figured two levels
lower than the other two based on the modal response sequence. Also, when it comes to
‘Lean culture’, ‘Job knowledge & skills scheme’ and ‘in-house training’, the results show
optimistic responses at lower levels of education declining significantly as education level
rises. On contrast, it appears that the awareness to the importance of ‘community
engagement’ decreases as education level decreases. These relations are shown in Figure
A10.3 below.
40.75%
18.75%
23.68%
13.16% 10.26%
12.82%
0.00%
5.00%
10.00%
15.00%
20.00%
25.00%
30.00%
35.00%
40.00%
45.00%
SC- assistance Lean Construction
pro
po
rtio
n o
f re
spn
ses
in
pe
rce
nta
ge
Possible approaches used by organisations to achieve their environmental considerations
HNC/HND
Degree
Masters

211 | P a g e
Figure A10.3: The responses to how social considerations are achieved in construction organisations, based on the education sub-classification analysis
(Author)
Q33- it appears that there is no consistency amongst the three groups. At each level, the
reasons are ranked differently. Also, respondents holding HNC/HND are the only group
(amongst all groups in the overall secondary analysis) where the option of keeping up to
date with any new emerging concepts is ranked 2nd.
Q34- all agree on 1st (B3) and 3rd (B4). No obvious consensus in modal responses otherwise.
Those with 10-20 years of experience rank the time & pressure barrier (B5) as 2nd but it
decreases significantly as experience increases. Similarly, those with 20+ years of experience
ranked the procurement & contractual barrier (B2) as 4th but it decreases significantly as
experience decreases. These relations are shown in Figure A10.4 below.
0.00%
10.00%
20.00%
30.00%
40.00%
50.00%
60.00%
70.00%
In-house training
Job knowledge & skills scheme
Team development
Lean culture Community engagement
Am
ou
nt
of
resp
on
ses
in p
erc
en
tage
Approaches for achieving social benefits
HNC/HND
Degree
Masters
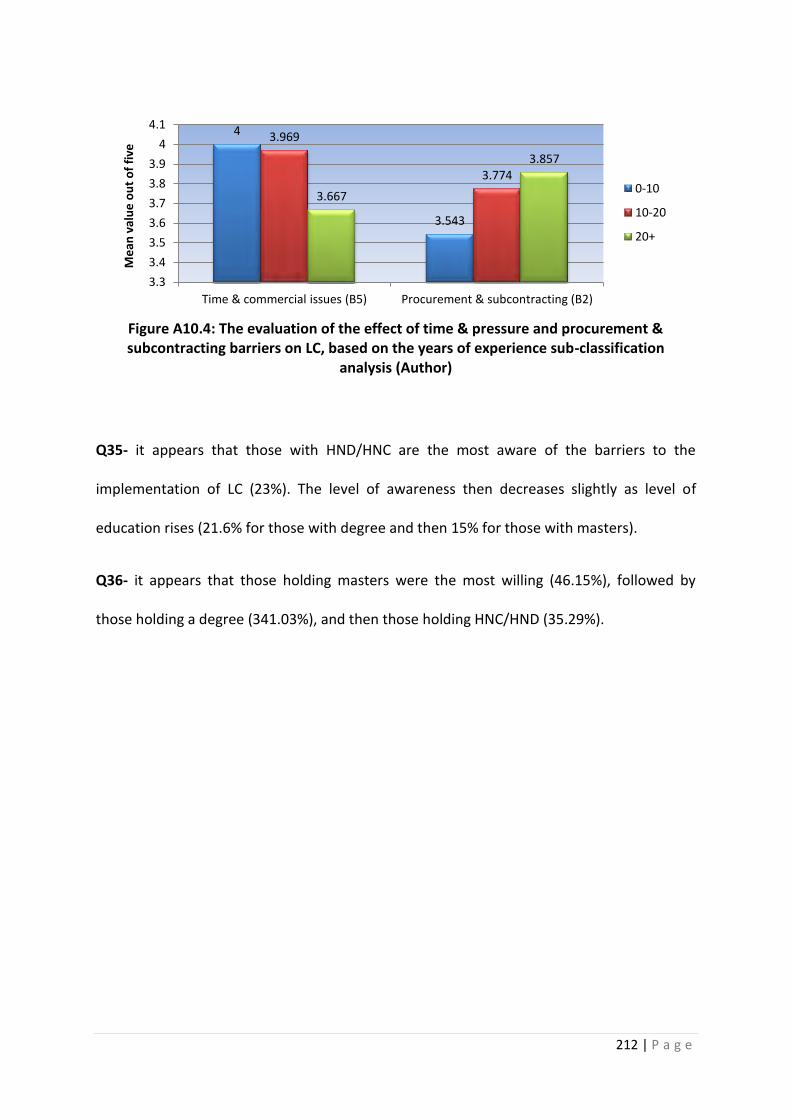
212 | P a g e
Figure A10.4: The evaluation of the effect of time & pressure and procurement & subcontracting barriers on LC, based on the years of experience sub-classification
analysis (Author)
Q35- it appears that those with HND/HNC are the most aware of the barriers to the
implementation of LC (23%). The level of awareness then decreases slightly as level of
education rises (21.6% for those with degree and then 15% for those with masters).
Q36- it appears that those holding masters were the most willing (46.15%), followed by
those holding a degree (341.03%), and then those holding HNC/HND (35.29%).
4
3.543
3.969
3.774
3.667
3.857
3.3
3.4
3.5
3.6
3.7
3.8
3.9
4
4.1
Time & commercial issues (B5) Procurement & subcontracting (B2)
Me
an v
alu
e o
ut
of
five
0-10
10-20
20+
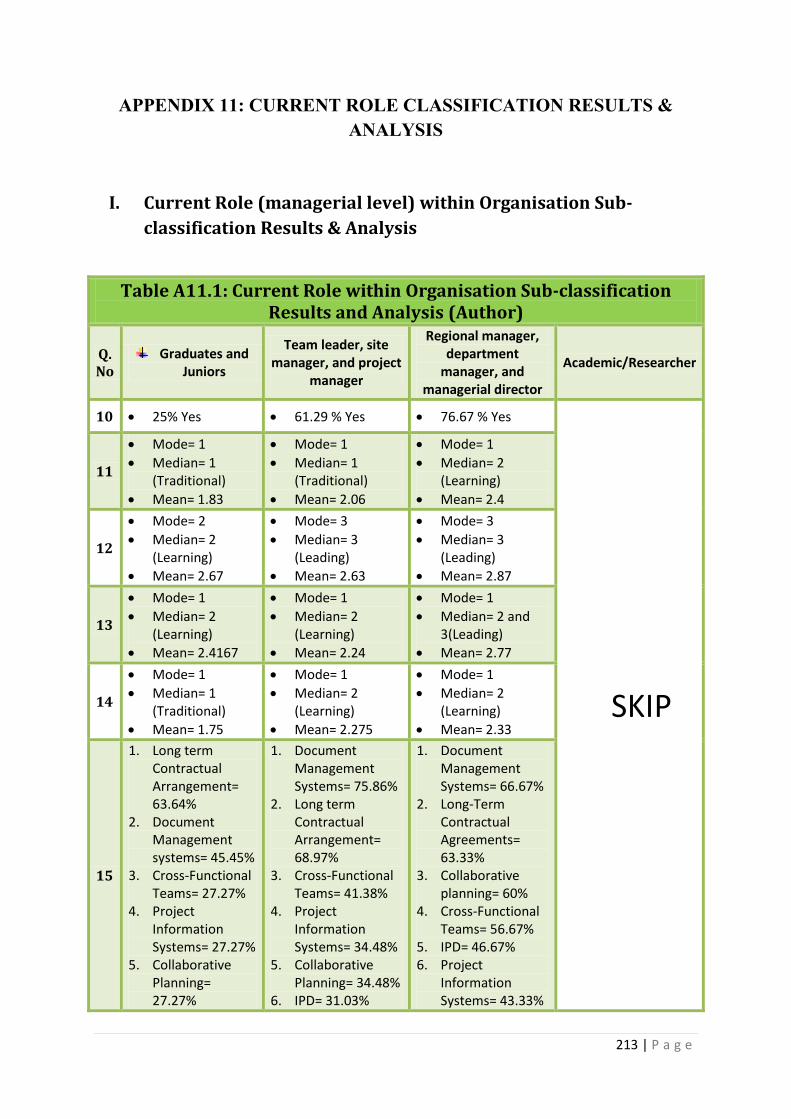
213 | P a g e
APPENDIX 11: CURRENT ROLE CLASSIFICATION RESULTS & ANALYSIS
I. Current Role (managerial level) within Organisation Sub-
classification Results & Analysis
Table A11.1: Current Role within Organisation Sub-classification Results and Analysis (Author)
Q. No
Graduates and Juniors
Team leader, site manager, and project
manager
Regional manager, department
manager, and managerial director
Academic/Researcher
10 25% Yes 61.29 % Yes 76.67 % Yes
SKIP
11
Mode= 1
Median= 1 (Traditional)
Mean= 1.83
Mode= 1
Median= 1 (Traditional)
Mean= 2.06
Mode= 1
Median= 2 (Learning)
Mean= 2.4
12
Mode= 2
Median= 2 (Learning)
Mean= 2.67
Mode= 3
Median= 3 (Leading)
Mean= 2.63
Mode= 3
Median= 3 (Leading)
Mean= 2.87
13
Mode= 1
Median= 2 (Learning)
Mean= 2.4167
Mode= 1
Median= 2 (Learning)
Mean= 2.24
Mode= 1
Median= 2 and 3(Leading)
Mean= 2.77
14
Mode= 1
Median= 1 (Traditional)
Mean= 1.75
Mode= 1
Median= 2 (Learning)
Mean= 2.275
Mode= 1
Median= 2 (Learning)
Mean= 2.33
15
1. Long term Contractual Arrangement= 63.64%
2. Document Management systems= 45.45%
3. Cross-Functional Teams= 27.27%
4. Project Information Systems= 27.27%
5. Collaborative Planning= 27.27%
1. Document Management Systems= 75.86%
2. Long term Contractual Arrangement= 68.97%
3. Cross-Functional Teams= 41.38%
4. Project Information Systems= 34.48%
5. Collaborative Planning= 34.48%
6. IPD= 31.03%
1. Document Management Systems= 66.67%
2. Long-Term Contractual Agreements= 63.33%
3. Collaborative planning= 60%
4. Cross-Functional Teams= 56.67%
5. IPD= 46.67% 6. Project
Information Systems= 43.33%
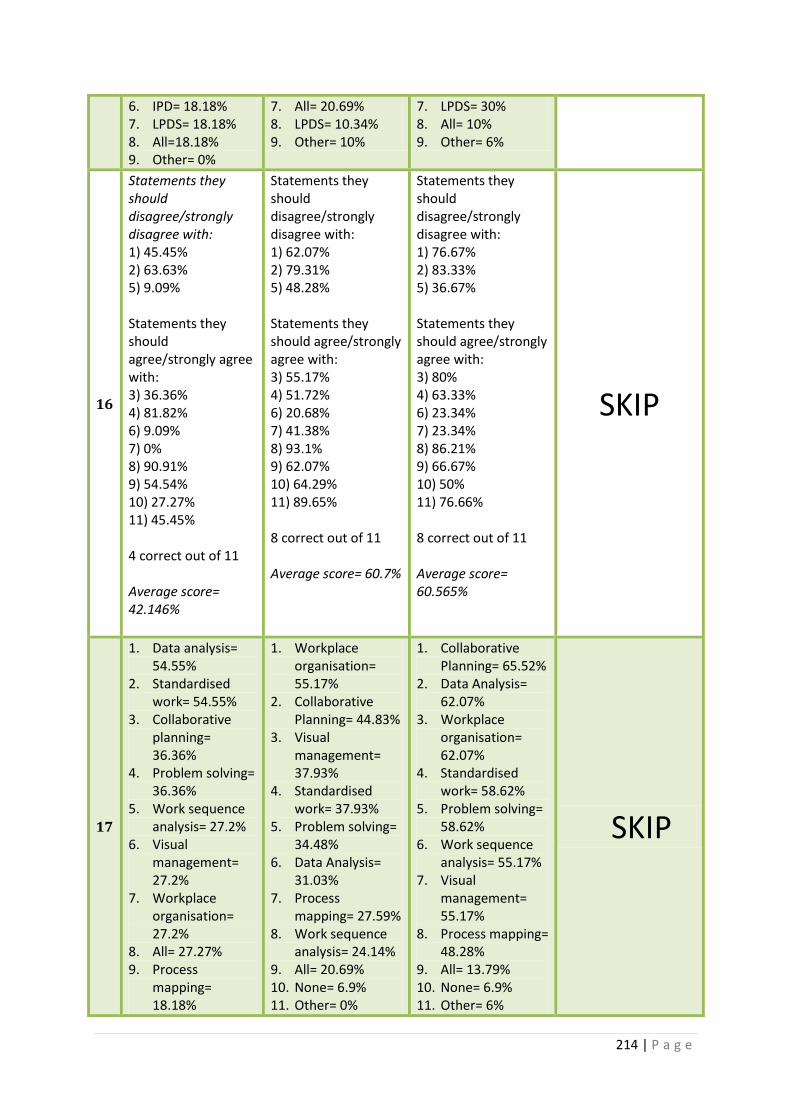
214 | P a g e
6. IPD= 18.18% 7. LPDS= 18.18% 8. All=18.18% 9. Other= 0%
7. All= 20.69% 8. LPDS= 10.34% 9. Other= 10%
7. LPDS= 30% 8. All= 10% 9. Other= 6%
16
Statements they should disagree/strongly disagree with: 1) 45.45% 2) 63.63% 5) 9.09% Statements they should agree/strongly agree with: 3) 36.36% 4) 81.82% 6) 9.09% 7) 0% 8) 90.91% 9) 54.54% 10) 27.27% 11) 45.45% 4 correct out of 11 Average score= 42.146%
Statements they should disagree/strongly disagree with: 1) 62.07% 2) 79.31% 5) 48.28% Statements they should agree/strongly agree with: 3) 55.17% 4) 51.72% 6) 20.68% 7) 41.38% 8) 93.1% 9) 62.07% 10) 64.29% 11) 89.65% 8 correct out of 11 Average score= 60.7%
Statements they should disagree/strongly disagree with: 1) 76.67% 2) 83.33% 5) 36.67% Statements they should agree/strongly agree with: 3) 80% 4) 63.33% 6) 23.34% 7) 23.34% 8) 86.21% 9) 66.67% 10) 50% 11) 76.66% 8 correct out of 11 Average score= 60.565%
SKIP
17
1. Data analysis= 54.55%
2. Standardised work= 54.55%
3. Collaborative planning= 36.36%
4. Problem solving= 36.36%
5. Work sequence analysis= 27.2%
6. Visual management= 27.2%
7. Workplace organisation= 27.2%
8. All= 27.27% 9. Process
mapping= 18.18%
1. Workplace organisation= 55.17%
2. Collaborative Planning= 44.83%
3. Visual management= 37.93%
4. Standardised work= 37.93%
5. Problem solving= 34.48%
6. Data Analysis= 31.03%
7. Process mapping= 27.59%
8. Work sequence analysis= 24.14%
9. All= 20.69% 10. None= 6.9% 11. Other= 0%
1. Collaborative Planning= 65.52%
2. Data Analysis= 62.07%
3. Workplace organisation= 62.07%
4. Standardised work= 58.62%
5. Problem solving= 58.62%
6. Work sequence analysis= 55.17%
7. Visual management= 55.17%
8. Process mapping= 48.28%
9. All= 13.79% 10. None= 6.9% 11. Other= 6%
SKIP
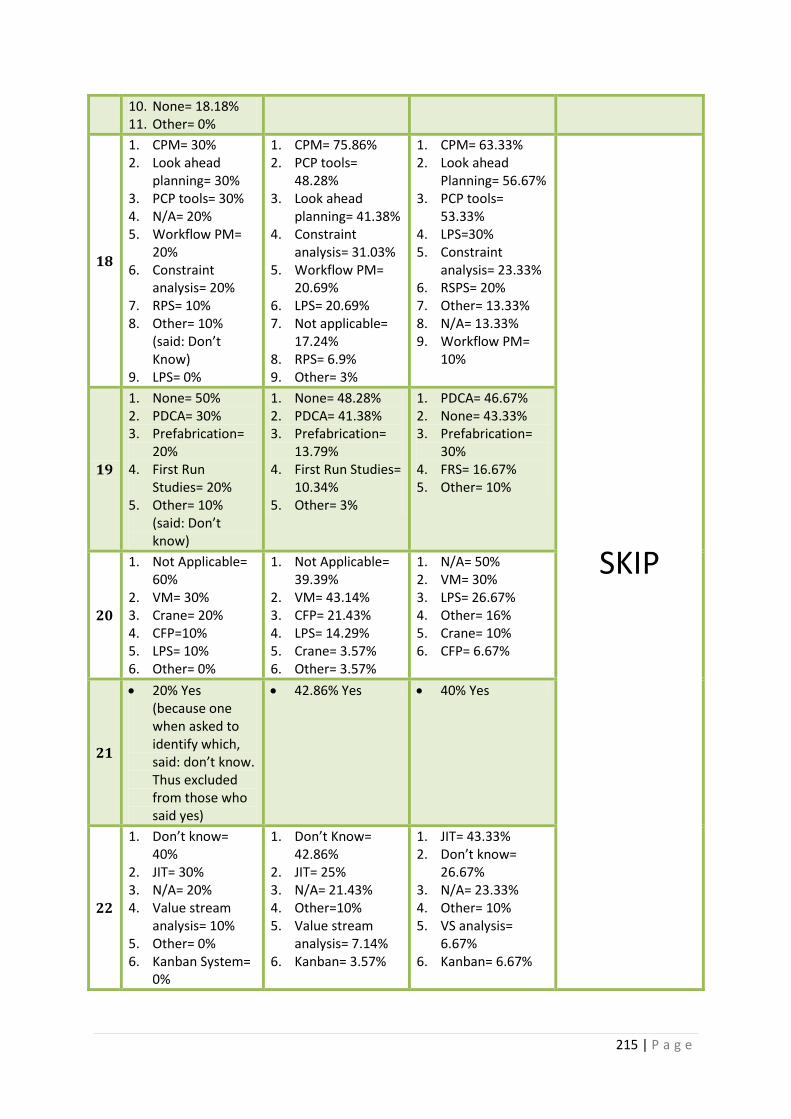
215 | P a g e
10. None= 18.18% 11. Other= 0%
18
1. CPM= 30% 2. Look ahead
planning= 30% 3. PCP tools= 30% 4. N/A= 20% 5. Workflow PM=
20% 6. Constraint
analysis= 20% 7. RPS= 10% 8. Other= 10%
(said: Don’t Know)
9. LPS= 0%
1. CPM= 75.86% 2. PCP tools=
48.28% 3. Look ahead
planning= 41.38% 4. Constraint
analysis= 31.03% 5. Workflow PM=
20.69% 6. LPS= 20.69% 7. Not applicable=
17.24% 8. RPS= 6.9% 9. Other= 3%
1. CPM= 63.33% 2. Look ahead
Planning= 56.67% 3. PCP tools=
53.33% 4. LPS=30% 5. Constraint
analysis= 23.33% 6. RSPS= 20% 7. Other= 13.33% 8. N/A= 13.33% 9. Workflow PM=
10%
SKIP
19
1. None= 50% 2. PDCA= 30% 3. Prefabrication=
20% 4. First Run
Studies= 20% 5. Other= 10%
(said: Don’t know)
1. None= 48.28% 2. PDCA= 41.38% 3. Prefabrication=
13.79% 4. First Run Studies=
10.34% 5. Other= 3%
1. PDCA= 46.67% 2. None= 43.33% 3. Prefabrication=
30% 4. FRS= 16.67% 5. Other= 10%
20
1. Not Applicable= 60%
2. VM= 30% 3. Crane= 20% 4. CFP=10% 5. LPS= 10% 6. Other= 0%
1. Not Applicable= 39.39%
2. VM= 43.14% 3. CFP= 21.43% 4. LPS= 14.29% 5. Crane= 3.57% 6. Other= 3.57%
1. N/A= 50% 2. VM= 30% 3. LPS= 26.67% 4. Other= 16% 5. Crane= 10% 6. CFP= 6.67%
21
20% Yes (because one when asked to identify which, said: don’t know. Thus excluded from those who said yes)
42.86% Yes 40% Yes
22
1. Don’t know= 40%
2. JIT= 30% 3. N/A= 20% 4. Value stream
analysis= 10% 5. Other= 0% 6. Kanban System=
0%
1. Don’t Know= 42.86%
2. JIT= 25% 3. N/A= 21.43% 4. Other=10% 5. Value stream
analysis= 7.14% 6. Kanban= 3.57%
1. JIT= 43.33% 2. Don’t know=
26.67% 3. N/A= 23.33% 4. Other= 10% 5. VS analysis=
6.67% 6. Kanban= 6.67%

216 | P a g e
23
1. N/A= 40% 2. BIM= 30% 3. Design structure
matrix= 10% 4. None= 10% 5. Other= 10% 6. Virtual reality
tools= 0% 7. Virtual design
studio= 0%
1. BIM= 37.93% 2. None= 27.59 3. Virtual reality
tools= 24.14% 4. Design structure
matrix= 17.24% 5. Virtual design
studios= 10.34% 6. N/A= 10.34% 7. Other= 3%
1. BIM= 34.48% 2. None= 34.48% 3. N/A= 27.59% 4. Other= 17% 5. VR tools= 13.79% 6. DSM= 6.9%
7. VDS= 6.9%
SKIP
24
1. N/A= 60% 2. Concurrent
design= 30% 3. Set-based
design= 20% 4. Other= 10%
(said: Don’t know)
5. None= 0%
1. None= 42.86% 2. N.A= 28.57% 3. Set-based
design= 21.43% 4. Concurrent
design= 14.29% 5. Other= 7%
1. None= 43.33% 2. N/A= 30% 3. Concurrent
design= 20%% 4. Other= 10% 5. Set-based
design= 6.67%
25
1. N/A= 50% 2. Management
control= 30% 3. Planning as an
activity schedule= 20%
4. Production control= 20%
5. Performance measurement= 20%
6. Logistics= 10% 7. Other= 10%
(said: Don’t Know)
1. N/A= 60.71% 2. Planning as an
activity schedule= 25%
3. Management Control= 21.43%
4. Production control= 17.86%
5. Performance measurement= 17.86%
6. Logistics= 10.71% 7. Other= 0%
1. N/A= 60% 2. Planning= 30% 3. Performance
measurement= 23.33%
4. Logistics= 20% 5. Production
control= 13.33% 6. Management
Control= 13.33% 7. Other= 10%
26
ZERO % (measures production planning effectiveness and workflow reliability)
22.22% (measures production planning effectiveness and workflow reliability)
23.33% (measures production planning effectiveness and workflow Reliability)
27
1. Experience of managers= 70%
2. KPI= 30% 3. International
benchmark= 20% 4. None= 20% 5. DQI= 10% 6. QMPMS= 10% 7. Own metrics=
1. KPI= 82.76% 2. Experience of
managers= 51.61%
3. Process PM= 34.48%
4. Own metrics= 31.03%
5. Balanced score
1. KPI= 75.86% 2. Experience of
managers= 68.96%
3. Own metrics=
55.17%
4. Process PM= 31.03%%
5. LPS= 24.14%
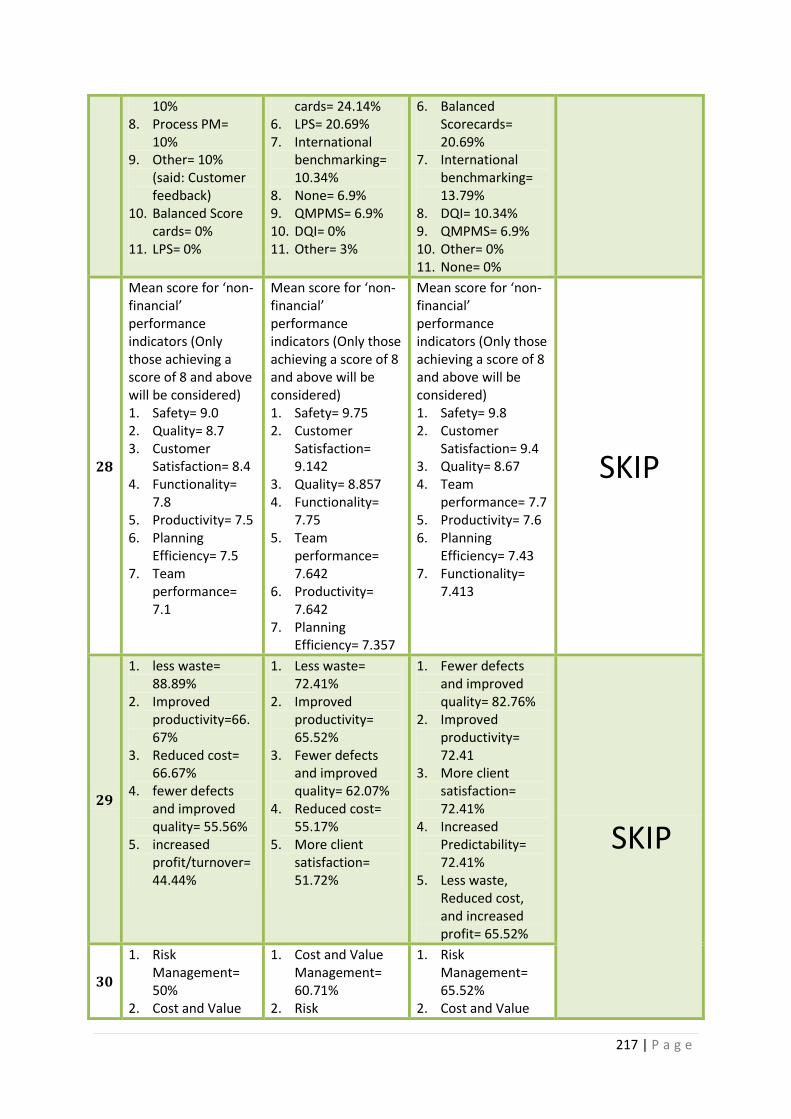
217 | P a g e
10% 8. Process PM=
10% 9. Other= 10%
(said: Customer feedback)
10. Balanced Score cards= 0%
11. LPS= 0%
cards= 24.14% 6. LPS= 20.69% 7. International
benchmarking= 10.34%
8. None= 6.9% 9. QMPMS= 6.9% 10. DQI= 0% 11. Other= 3%
6. Balanced Scorecards= 20.69%
7. International benchmarking= 13.79%
8. DQI= 10.34% 9. QMPMS= 6.9% 10. Other= 0% 11. None= 0%
28
Mean score for ‘non-financial’ performance indicators (Only those achieving a score of 8 and above will be considered) 1. Safety= 9.0 2. Quality= 8.7 3. Customer
Satisfaction= 8.4 4. Functionality=
7.8 5. Productivity= 7.5 6. Planning
Efficiency= 7.5 7. Team
performance= 7.1
Mean score for ‘non-financial’ performance indicators (Only those achieving a score of 8 and above will be considered) 1. Safety= 9.75 2. Customer
Satisfaction= 9.142
3. Quality= 8.857 4. Functionality=
7.75 5. Team
performance= 7.642
6. Productivity= 7.642
7. Planning Efficiency= 7.357
Mean score for ‘non-financial’ performance indicators (Only those achieving a score of 8 and above will be considered) 1. Safety= 9.8 2. Customer
Satisfaction= 9.4 3. Quality= 8.67 4. Team
performance= 7.7 5. Productivity= 7.6 6. Planning
Efficiency= 7.43 7. Functionality=
7.413
SKIP
29
1. less waste= 88.89%
2. Improved productivity=66.67%
3. Reduced cost= 66.67%
4. fewer defects and improved quality= 55.56%
5. increased profit/turnover= 44.44%
1. Less waste= 72.41%
2. Improved productivity= 65.52%
3. Fewer defects and improved quality= 62.07%
4. Reduced cost= 55.17%
5. More client satisfaction= 51.72%
1. Fewer defects and improved quality= 82.76%
2. Improved productivity= 72.41
3. More client satisfaction= 72.41%
4. Increased Predictability= 72.41%
5. Less waste, Reduced cost, and increased profit= 65.52%
SKIP
30
1. Risk Management= 50%
2. Cost and Value
1. Cost and Value Management= 60.71%
2. Risk
1. Risk Management= 65.52%
2. Cost and Value

218 | P a g e
Management= 50%
3. All= 20% 4. LC= 10% 5. Other= 10%
(said: Don’t know)
6. SC assistance= 0%
Management= 39.29%
3. All= 28.57% 4. SC assistance=
17.86% 5. LC= 3.57% 6. Other= 0%
Management= 51.72%
3. SC assistance= 34.48%
4. All= 31.03% 5. LC= 31.03 6. Other= 5%
31
1. BREEAM= 33.33%
2. All= 22.22% 3. N/A= 22.22% 4. SC assistance=
11.11% 5. LC= 11.11% 6. Other= 11 %
(said: Don’t Know)
7. International standards= 0%
1. International standards= 65.52%
2. BREEAM= 44.83% 3. SC assistance=
24.14% 4. N/A= 10.34% 5. All= 6.9% 6. LC= 3.45% 7. Other= 3%
1. International standards= 48.28%
2. BREEAM= 27.59% 3. LC= 20.69% 4. N/A= 17.24% 5. SC assistance=
17.24% 6. Other= 13% 7. All= 6.7%
SKIP 32
1. In-house training= 30%
2. N/A= 20% 3. Creating a Lean
culture= 20% 4. All= 20% 5. Job knowledge
and skills scheme= 10%
6. Community engagement= 10%
7. Team development= 10%
8. Safety programmes= 10%
9. Other= 10% (said: Not sure what you mean)
1. In-house training= 58.62%
2. Safety programmes= 44.83
3. Community engagement= 41.38%
4. Job knowledge and Skills scheme= 37.93%
5. Team development= 31.03%
6. All= 10.34% 7. Creating a Lean
culture= 10.34% 8. Other= 0%
1. In-house training= 46.67%
2. Community engagement= 43.33%
3. Job knowledge and Skills scheme= 26.67%
4. Team development= 26.67%
5. Safety programmes= 26.67%
6. Lean culture= 20%
7. Other=13% 8. All= 10%
33
1. To increase our profit = 55.56%
2. To improve our rate of client satisfaction= 44.44%
3. To improve the quality of our outputs= 33.33%
1. To improve the quality of our outputs= 48.28%
2. To improve our
rate of client
satisfaction=
48.28%
3. To increase our
1. To improve our rate of client satisfaction= 65.52%
2. To improve the quality of our Outputs= 62.07%
3. To increase our profit and /or
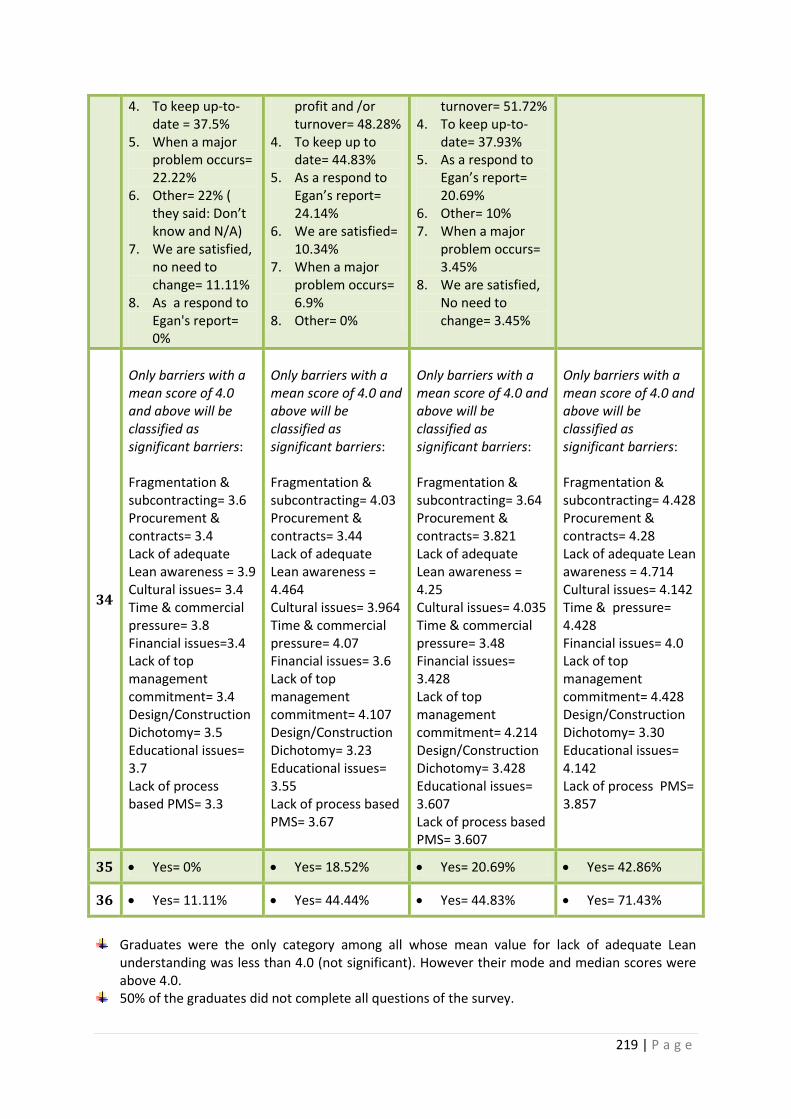
219 | P a g e
4. To keep up-to-date = 37.5%
5. When a major problem occurs= 22.22%
6. Other= 22% ( they said: Don’t know and N/A)
7. We are satisfied, no need to change= 11.11%
8. As a respond to Egan's report= 0%
profit and /or turnover= 48.28%
4. To keep up to date= 44.83%
5. As a respond to Egan’s report= 24.14%
6. We are satisfied= 10.34%
7. When a major problem occurs= 6.9%
8. Other= 0%
turnover= 51.72% 4. To keep up-to-
date= 37.93% 5. As a respond to
Egan’s report= 20.69%
6. Other= 10% 7. When a major
problem occurs= 3.45%
8. We are satisfied, No need to change= 3.45%
34
Only barriers with a mean score of 4.0 and above will be classified as significant barriers: Fragmentation & subcontracting= 3.6 Procurement & contracts= 3.4 Lack of adequate Lean awareness = 3.9 Cultural issues= 3.4 Time & commercial pressure= 3.8 Financial issues=3.4 Lack of top management commitment= 3.4 Design/Construction Dichotomy= 3.5 Educational issues= 3.7 Lack of process based PMS= 3.3
Only barriers with a mean score of 4.0 and above will be classified as significant barriers: Fragmentation & subcontracting= 4.03 Procurement & contracts= 3.44 Lack of adequate Lean awareness = 4.464 Cultural issues= 3.964 Time & commercial pressure= 4.07 Financial issues= 3.6 Lack of top management commitment= 4.107 Design/Construction Dichotomy= 3.23 Educational issues= 3.55 Lack of process based PMS= 3.67
Only barriers with a mean score of 4.0 and above will be classified as significant barriers: Fragmentation & subcontracting= 3.64 Procurement & contracts= 3.821 Lack of adequate Lean awareness = 4.25 Cultural issues= 4.035 Time & commercial pressure= 3.48 Financial issues= 3.428 Lack of top management commitment= 4.214 Design/Construction Dichotomy= 3.428 Educational issues= 3.607 Lack of process based PMS= 3.607
Only barriers with a mean score of 4.0 and above will be classified as significant barriers: Fragmentation & subcontracting= 4.428 Procurement & contracts= 4.28 Lack of adequate Lean awareness = 4.714 Cultural issues= 4.142 Time & pressure= 4.428 Financial issues= 4.0 Lack of top management commitment= 4.428 Design/Construction Dichotomy= 3.30 Educational issues= 4.142 Lack of process PMS= 3.857
35 Yes= 0% Yes= 18.52% Yes= 20.69% Yes= 42.86%
36 Yes= 11.11% Yes= 44.44% Yes= 44.83% Yes= 71.43%
Graduates were the only category among all whose mean value for lack of adequate Lean
understanding was less than 4.0 (not significant). However their mode and median scores were above 4.0.
50% of the graduates did not complete all questions of the survey.
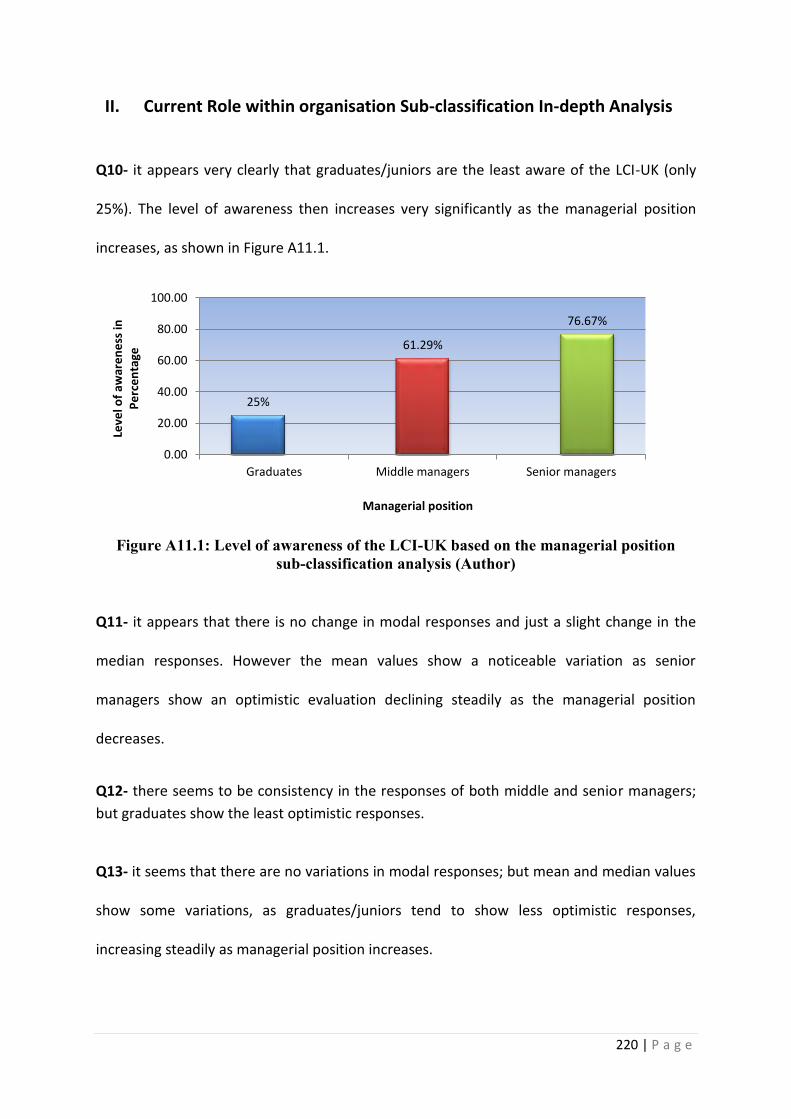
220 | P a g e
II. Current Role within organisation Sub-classification In-depth Analysis
Q10- it appears very clearly that graduates/juniors are the least aware of the LCI-UK (only
25%). The level of awareness then increases very significantly as the managerial position
increases, as shown in Figure A11.1.
Figure A11.1: Level of awareness of the LCI-UK based on the managerial position sub-classification analysis (Author)
Q11- it appears that there is no change in modal responses and just a slight change in the
median responses. However the mean values show a noticeable variation as senior
managers show an optimistic evaluation declining steadily as the managerial position
decreases.
Q12- there seems to be consistency in the responses of both middle and senior managers;
but graduates show the least optimistic responses.
Q13- it seems that there are no variations in modal responses; but mean and median values
show some variations, as graduates/juniors tend to show less optimistic responses,
increasing steadily as managerial position increases.
25%
61.29%
76.67%
0.00
20.00
40.00
60.00
80.00
100.00
Graduates Middle managers Senior managers
Leve
l of
awar
en
ess
in
Pe
rce
nta
ge
Managerial position
221 | P a g e
Q14- there is no change in modal responses, but median shows obvious variations as
graduates provided the least optimistic responses, increasing gradually as managerial
position rises.
Q15- it appears that both middle and senior managers put document management systems
1st, but graduates/juniors ranked long term contractual agreements as 1st. Also, all agree
that the ‘Other’ option comes at bottom. Alternatively, it is obvious that middle managers
ranked LPDS slightly lower than the others. Another important observation is that senior
managers ranked collaborative planning as 3rd (60%) declining noticeably as managerial
position decreases (range 27.27% - 60%).
Q16- there seems to be significant variations, as graduates/juniors obtained much lower
scores than middle and senior managers (range 42.146% - 60.7%). Furthermore, were able
to answer only 4 statements correctly out of 11. They statements they could not answer
correctly were S1, S3, S6, S7, S10 and S11. The graduates/juniors were the only group which
their average level of awareness/understanding of lean concepts & practices was less than
50% (exactly 42.146%).
Q17- all agree on bottom two: None and Other. No obvious consensus otherwise. However,
it seems that graduates provided more optimistic responses, as they ranked the ‘All’ option
as 8th declining steadily as managerial position rises (range 13.79% - 27.27%).
Q18- it is very obvious that the awareness of the use of LPS increases as the managerial role
increase. ‘None’ of the graduates/juniors within this study selected the LPS; while 20.69% of
those who represent the middle management sub-classification selected LPS and it ranked
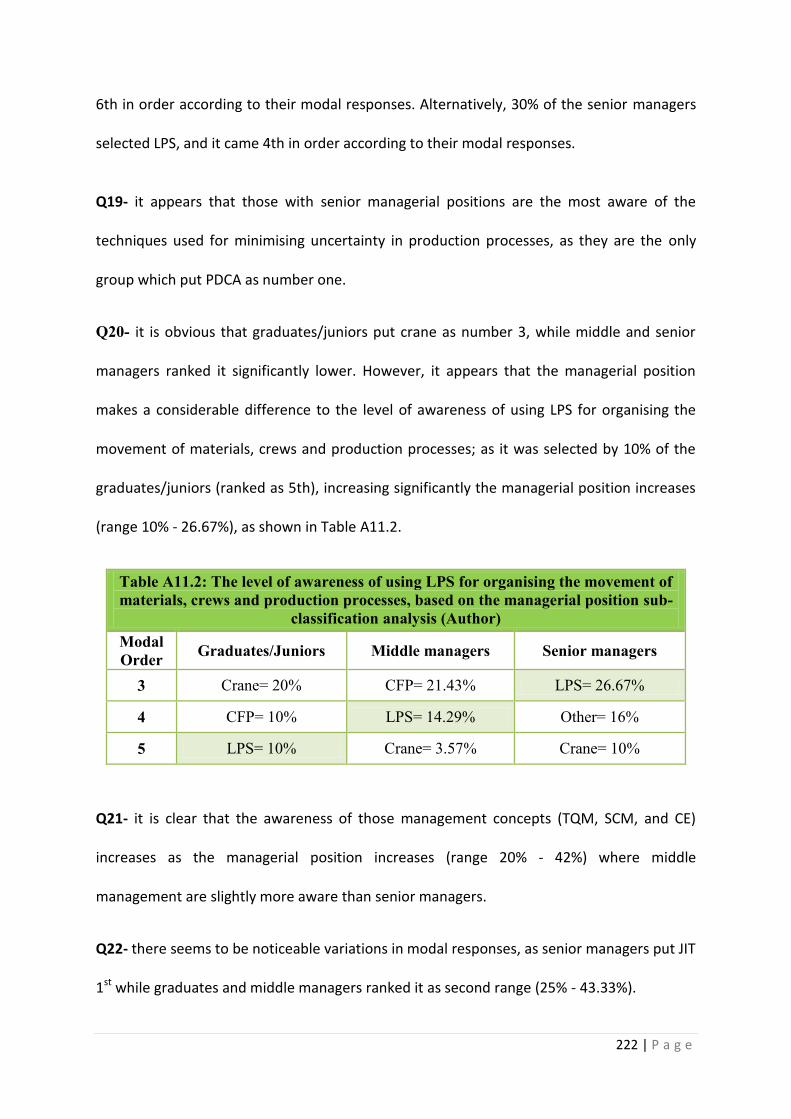
222 | P a g e
6th in order according to their modal responses. Alternatively, 30% of the senior managers
selected LPS, and it came 4th in order according to their modal responses.
Q19- it appears that those with senior managerial positions are the most aware of the
techniques used for minimising uncertainty in production processes, as they are the only
group which put PDCA as number one.
Q20- it is obvious that graduates/juniors put crane as number 3, while middle and senior
managers ranked it significantly lower. However, it appears that the managerial position
makes a considerable difference to the level of awareness of using LPS for organising the
movement of materials, crews and production processes; as it was selected by 10% of the
graduates/juniors (ranked as 5th), increasing significantly the managerial position increases
(range 10% - 26.67%), as shown in Table A11.2.
Table A11.2: The level of awareness of using LPS for organising the movement of materials, crews and production processes, based on the managerial position sub-
classification analysis (Author) Modal Order Graduates/Juniors Middle managers Senior managers
3 Crane= 20% CFP= 21.43% LPS= 26.67%
4 CFP= 10% LPS= 14.29% Other= 16%
5 LPS= 10% Crane= 3.57% Crane= 10%
Q21- it is clear that the awareness of those management concepts (TQM, SCM, and CE)
increases as the managerial position increases (range 20% - 42%) where middle
management are slightly more aware than senior managers.
Q22- there seems to be noticeable variations in modal responses, as senior managers put JIT
1st while graduates and middle managers ranked it as second range (25% - 43.33%).
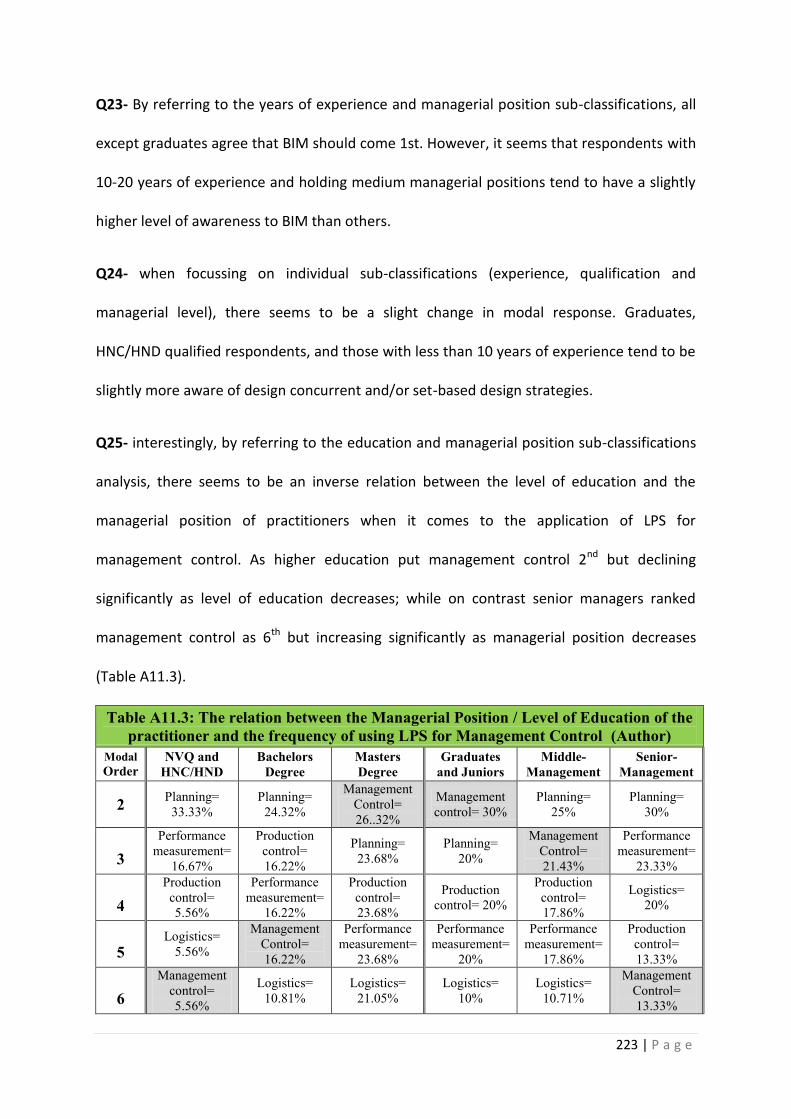
223 | P a g e
Q23- By referring to the years of experience and managerial position sub-classifications, all
except graduates agree that BIM should come 1st. However, it seems that respondents with
10-20 years of experience and holding medium managerial positions tend to have a slightly
higher level of awareness to BIM than others.
Q24- when focussing on individual sub-classifications (experience, qualification and
managerial level), there seems to be a slight change in modal response. Graduates,
HNC/HND qualified respondents, and those with less than 10 years of experience tend to be
slightly more aware of design concurrent and/or set-based design strategies.
Q25- interestingly, by referring to the education and managerial position sub-classifications
analysis, there seems to be an inverse relation between the level of education and the
managerial position of practitioners when it comes to the application of LPS for
management control. As higher education put management control 2nd but declining
significantly as level of education decreases; while on contrast senior managers ranked
management control as 6th but increasing significantly as managerial position decreases
(Table A11.3).
Table A11.3: The relation between the Managerial Position / Level of Education of the practitioner and the frequency of using LPS for Management Control (Author)
Modal Order
NVQ and HNC/HND
Bachelors Degree
Masters Degree
Graduates and Juniors
Middle-Management
Senior-Management
2 Planning= 33.33%
Planning= 24.32%
Management Control= 26..32%
Management control= 30%
Planning= 25%
Planning= 30%
3 Performance
measurement= 16.67%
Production control= 16.22%
Planning= 23.68%
Planning= 20%
Management Control= 21.43%
Performance measurement=
23.33%
4 Production control= 5.56%
Performance measurement=
16.22%
Production control= 23.68%
Production control= 20%
Production control= 17.86%
Logistics= 20%
5 Logistics=
5.56%
Management Control= 16.22%
Performance measurement=
23.68%
Performance measurement=
20%
Performance measurement=
17.86%
Production control= 13.33%
6 Management
control= 5.56%
Logistics= 10.81%
Logistics= 21.05%
Logistics= 10%
Logistics= 10.71%
Management Control= 13.33%

224 | P a g e
Q26- none of the graduate/junior respondents were able to solve this question correctly
(obtained a score equal to Zero). This is the lowest score amongst all sub-classifications of
the overall secondary analysis.
Q27- it is very obvious that graduates/juniors rely very heavily on the experience of
managers for performance managers. Also they are the least aware amongst all other
groups within the overall secondary analysis of the importance of using process
performance measures and leading indicators; as they ranked them as 7th and 8th but middle
and senior managers put them significantly higher. Based on the graduates’ modal
responses, it appears that leading indicators which are linked to the business strategy,
process performance measures, other, balanced scorecards, and LPS were figured in the
bottom 5 respectively.
Q28- By referring to the overall secondary analysis, it appears that all sub-classifications
agree on top 3 (safety, client/customer satisfaction, and then quality), except for the
graduates/juniors group which ranked client satisfaction as 3rd in importance according to
their viewpoint. There is no obvious consensus otherwise, as each group ranks the other
performance measures in different order.
Q29- there seems to be two significant observations. First, the graduates/juniors are the
only group amongst all groups in the overall secondary analysis that one of their top 5
benefits achieved a weighted score of less than 50%. Secondly, the senior managerial group
is the only group amongst all groups in the overall secondary analysis that selected ‘Fewer
defects and improved quality’ as their top expected benefit. Also, those senior managers are
also the only group which added ‘Increased Predictability’ to their top 5 benefits list
(achieving a score= 72.41%). Furthermore, 3 different benefits, namely: reduced cost,
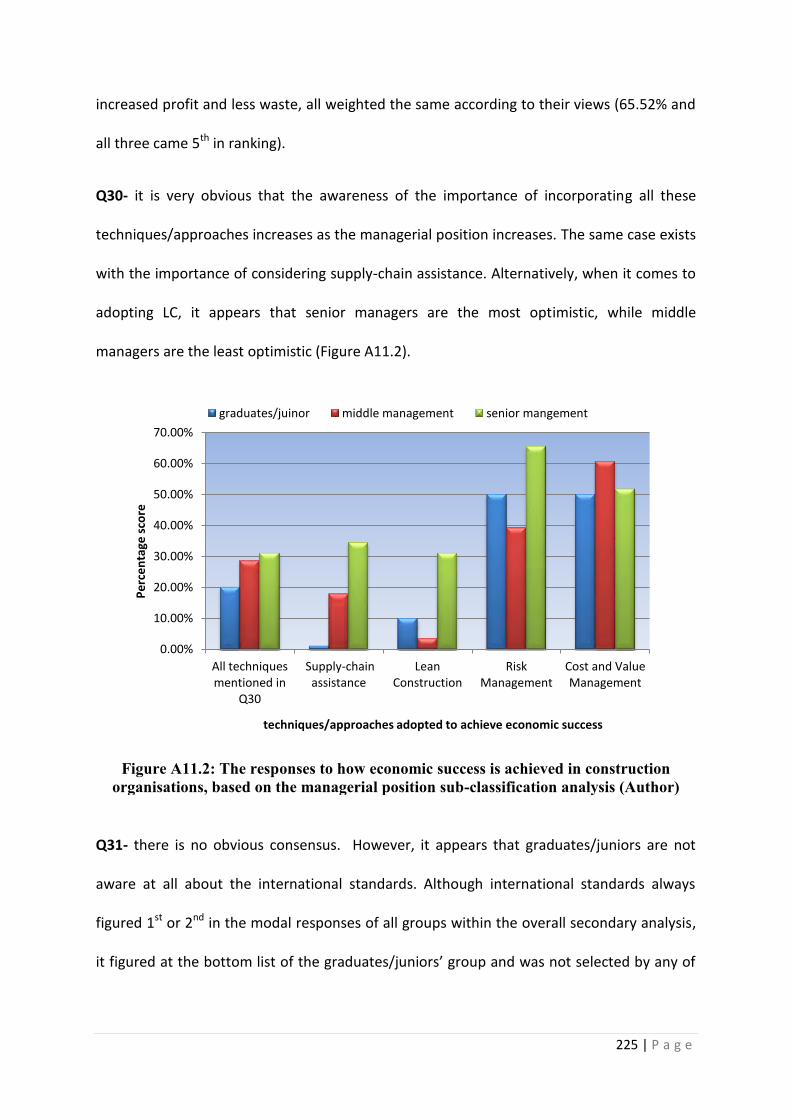
225 | P a g e
increased profit and less waste, all weighted the same according to their views (65.52% and
all three came 5th in ranking).
Q30- it is very obvious that the awareness of the importance of incorporating all these
techniques/approaches increases as the managerial position increases. The same case exists
with the importance of considering supply-chain assistance. Alternatively, when it comes to
adopting LC, it appears that senior managers are the most optimistic, while middle
managers are the least optimistic (Figure A11.2).
Figure A11.2: The responses to how economic success is achieved in construction organisations, based on the managerial position sub-classification analysis (Author)
Q31- there is no obvious consensus. However, it appears that graduates/juniors are not
aware at all about the international standards. Although international standards always
figured 1st or 2nd in the modal responses of all groups within the overall secondary analysis,
it figured at the bottom list of the graduates/juniors’ group and was not selected by any of
0.00%
10.00%
20.00%
30.00%
40.00%
50.00%
60.00%
70.00%
All techniques mentioned in
Q30
Supply-chain assistance
Lean Construction
Risk Management
Cost and Value Management
Pe
rce
nta
ge s
core
techniques/approaches adopted to achieve economic success
graduates/juinor middle management senior mangement
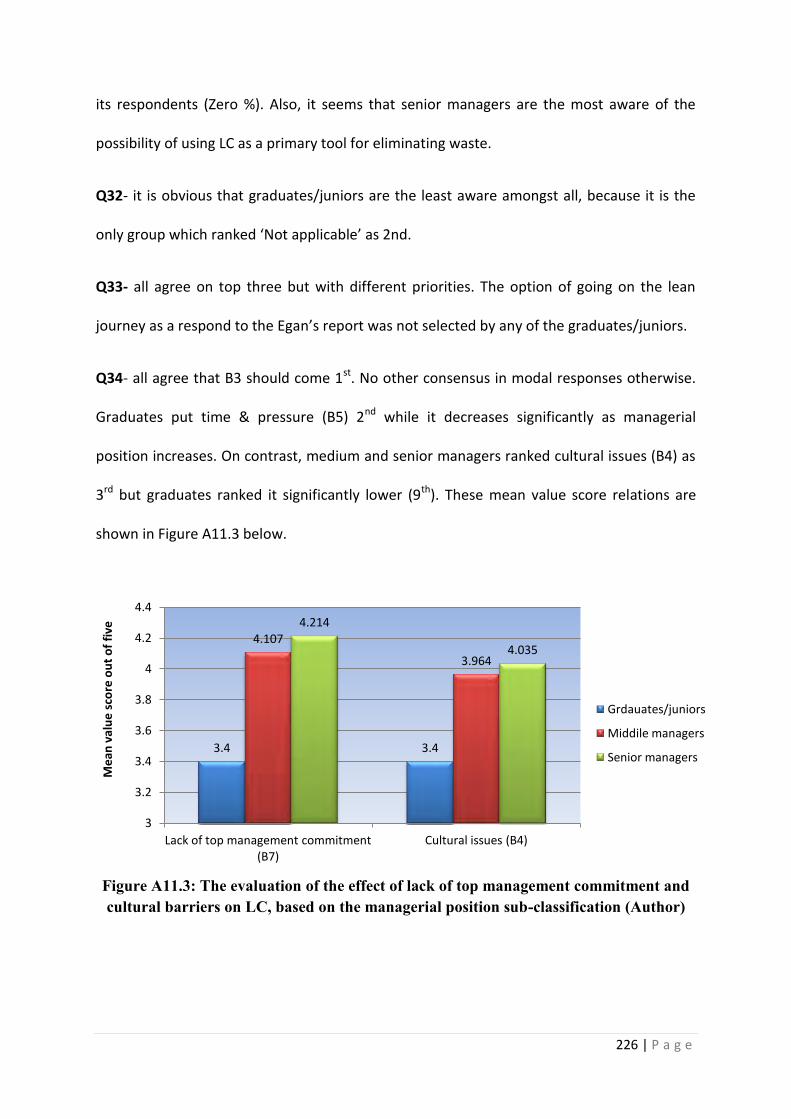
226 | P a g e
its respondents (Zero %). Also, it seems that senior managers are the most aware of the
possibility of using LC as a primary tool for eliminating waste.
Q32- it is obvious that graduates/juniors are the least aware amongst all, because it is the
only group which ranked ‘Not applicable’ as 2nd.
Q33- all agree on top three but with different priorities. The option of going on the lean
journey as a respond to the Egan’s report was not selected by any of the graduates/juniors.
Q34- all agree that B3 should come 1st. No other consensus in modal responses otherwise.
Graduates put time & pressure (B5) 2nd while it decreases significantly as managerial
position increases. On contrast, medium and senior managers ranked cultural issues (B4) as
3rd but graduates ranked it significantly lower (9th). These mean value score relations are
shown in Figure A11.3 below.
Figure A11.3: The evaluation of the effect of lack of top management commitment and cultural barriers on LC, based on the managerial position sub-classification (Author)
3.4 3.4
4.107
3.964
4.214
4.035
3
3.2
3.4
3.6
3.8
4
4.2
4.4
Lack of top management commitment (B7)
Cultural issues (B4)
Me
an v
alu
e s
core
ou
t o
f fi
ve
Grdauates/juniors
Middile managers
Senior managers
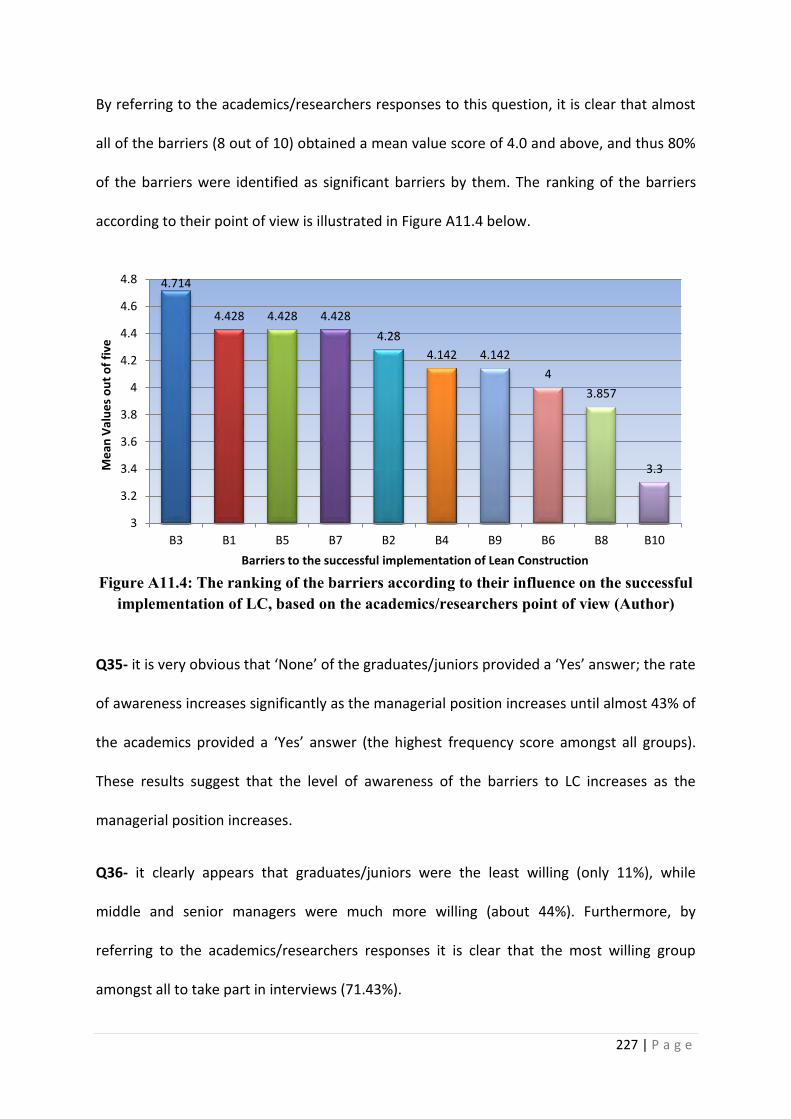
227 | P a g e
By referring to the academics/researchers responses to this question, it is clear that almost
all of the barriers (8 out of 10) obtained a mean value score of 4.0 and above, and thus 80%
of the barriers were identified as significant barriers by them. The ranking of the barriers
according to their point of view is illustrated in Figure A11.4 below.
Figure A11.4: The ranking of the barriers according to their influence on the successful implementation of LC, based on the academics/researchers point of view (Author)
Q35- it is very obvious that ‘None’ of the graduates/juniors provided a ‘Yes’ answer; the rate
of awareness increases significantly as the managerial position increases until almost 43% of
the academics provided a ‘Yes’ answer (the highest frequency score amongst all groups).
These results suggest that the level of awareness of the barriers to LC increases as the
managerial position increases.
Q36- it clearly appears that graduates/juniors were the least willing (only 11%), while
middle and senior managers were much more willing (about 44%). Furthermore, by
referring to the academics/researchers responses it is clear that the most willing group
amongst all to take part in interviews (71.43%).
4.714
4.428 4.428 4.428
4.28
4.142 4.142
4
3.857
3.3
3
3.2
3.4
3.6
3.8
4
4.2
4.4
4.6
4.8
B3 B1 B5 B7 B2 B4 B9 B6 B8 B10
Me
an V
alu
es
ou
t o
f fi
ve
Barriers to the successful implementation of Lean Construction
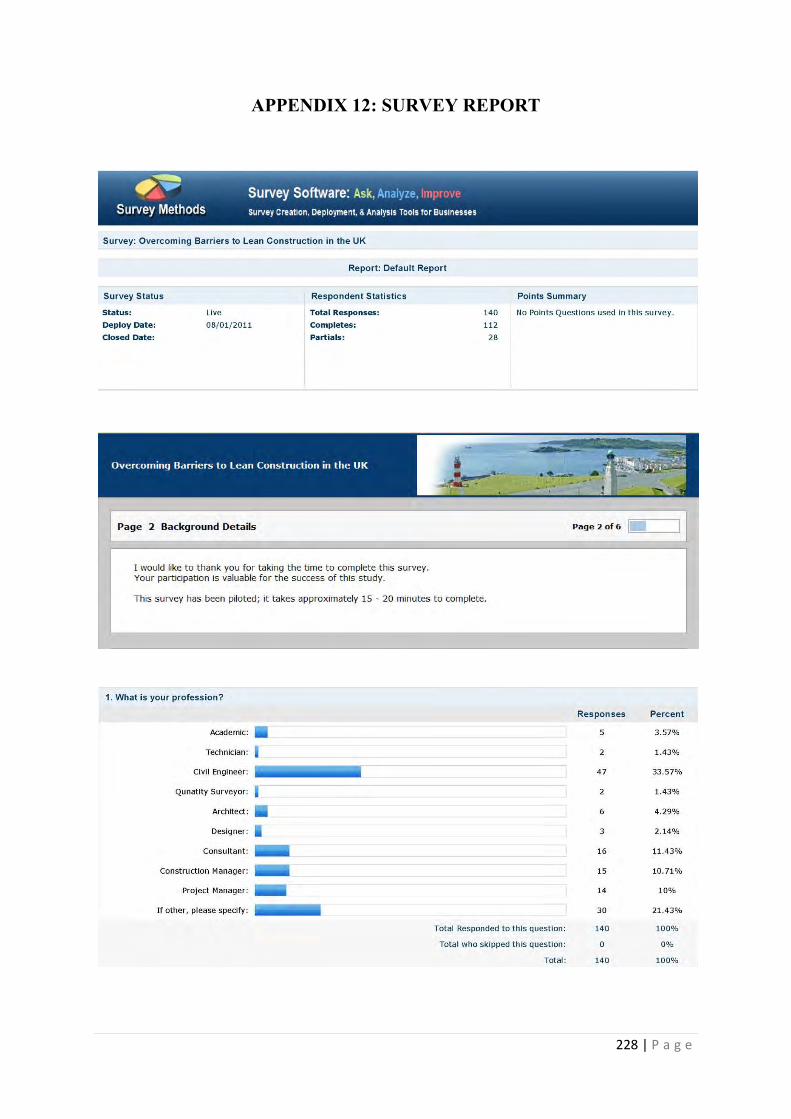
228 | P a g e
APPENDIX 12: SURVEY REPORT
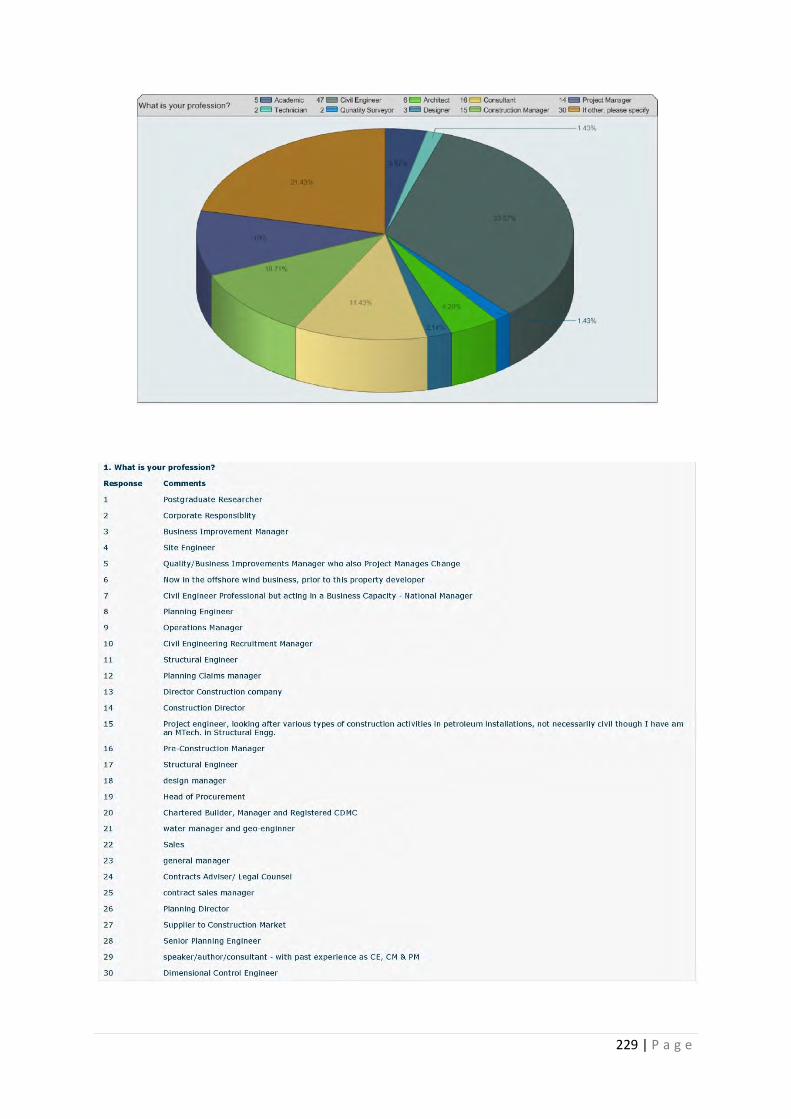
229 | P a g e
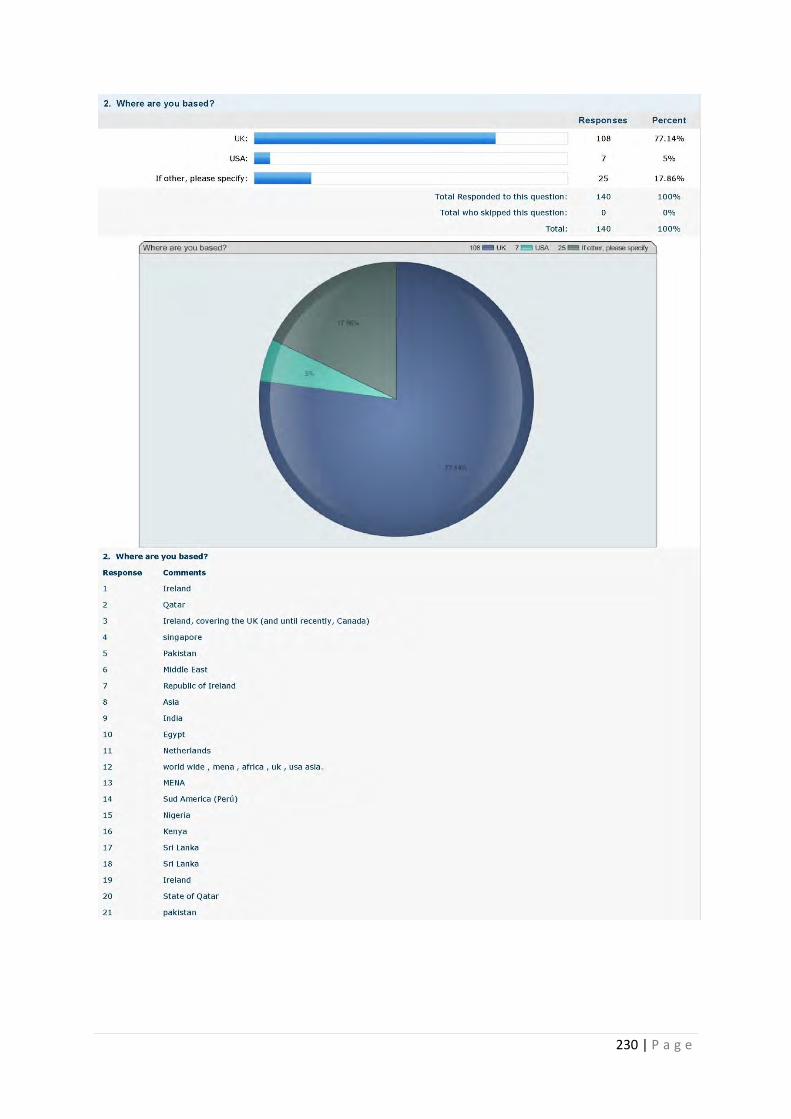
230 | P a g e
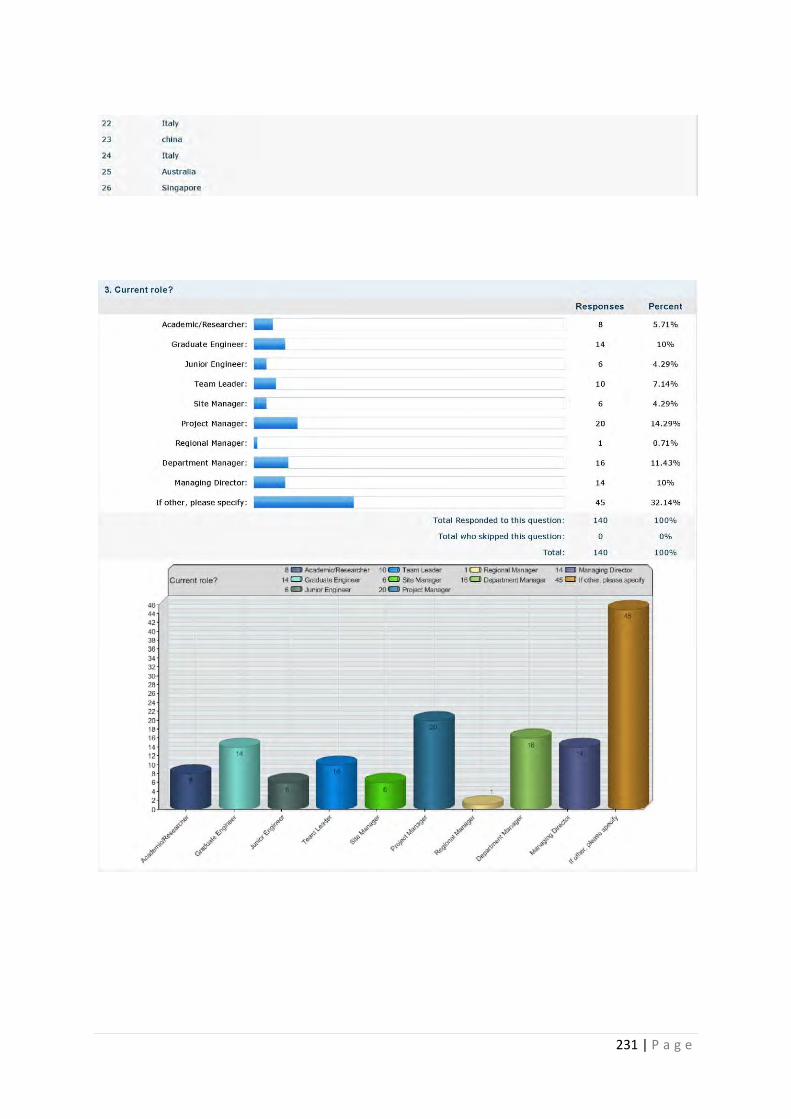
231 | P a g e

232 | P a g e
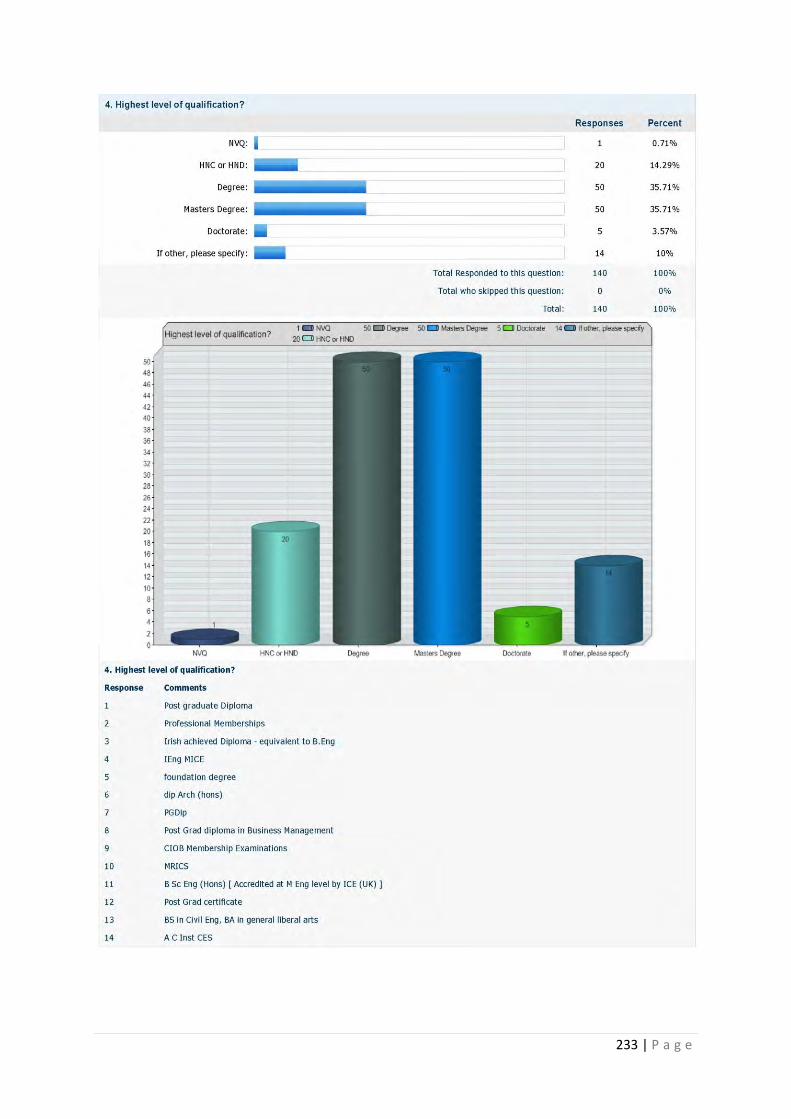
233 | P a g e
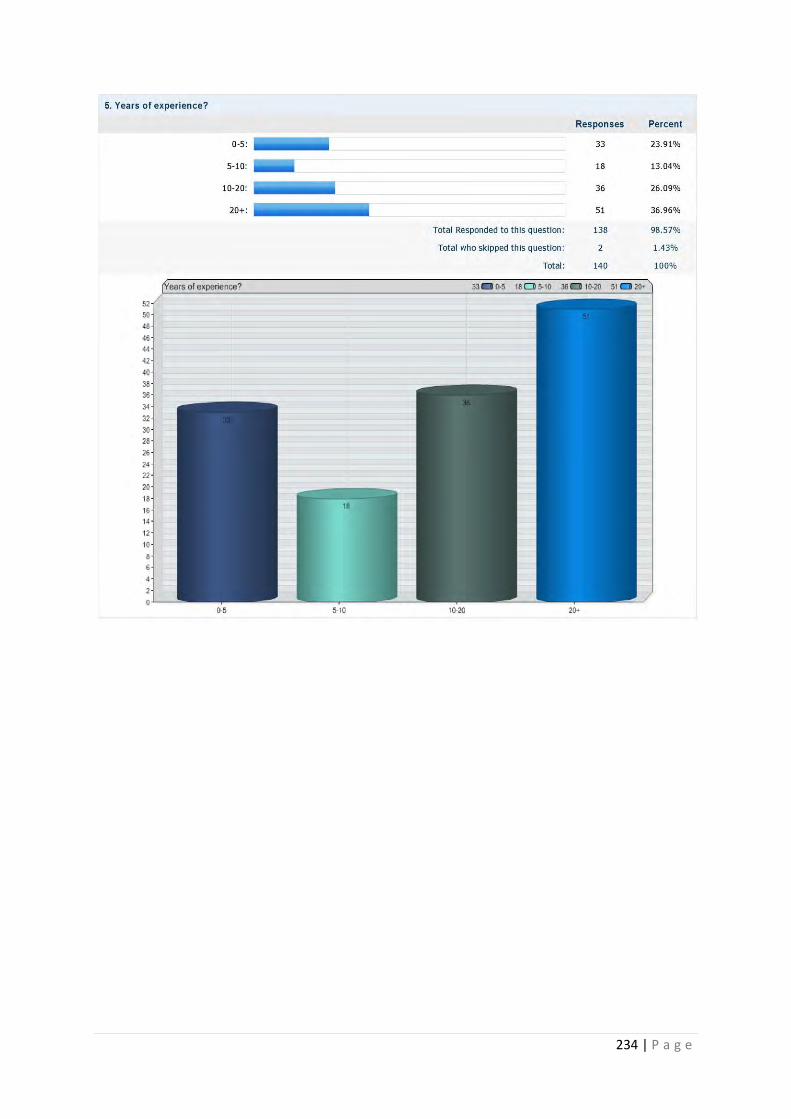
234 | P a g e
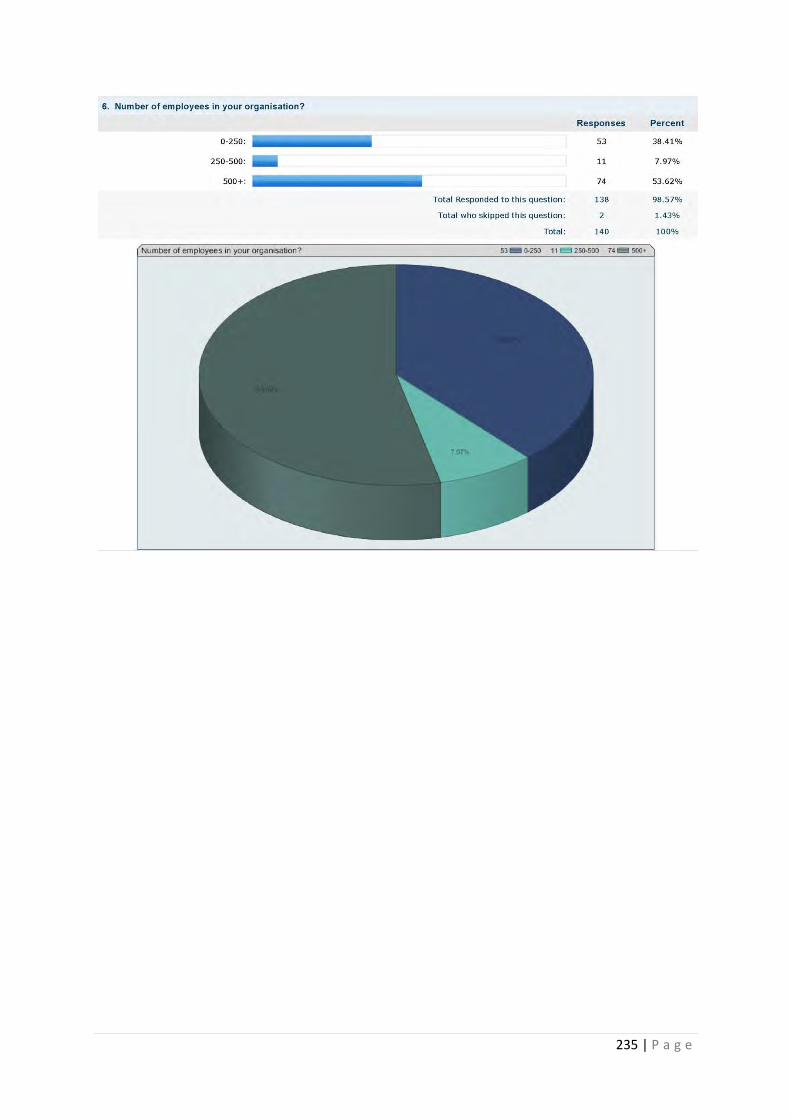
235 | P a g e

236 | P a g e
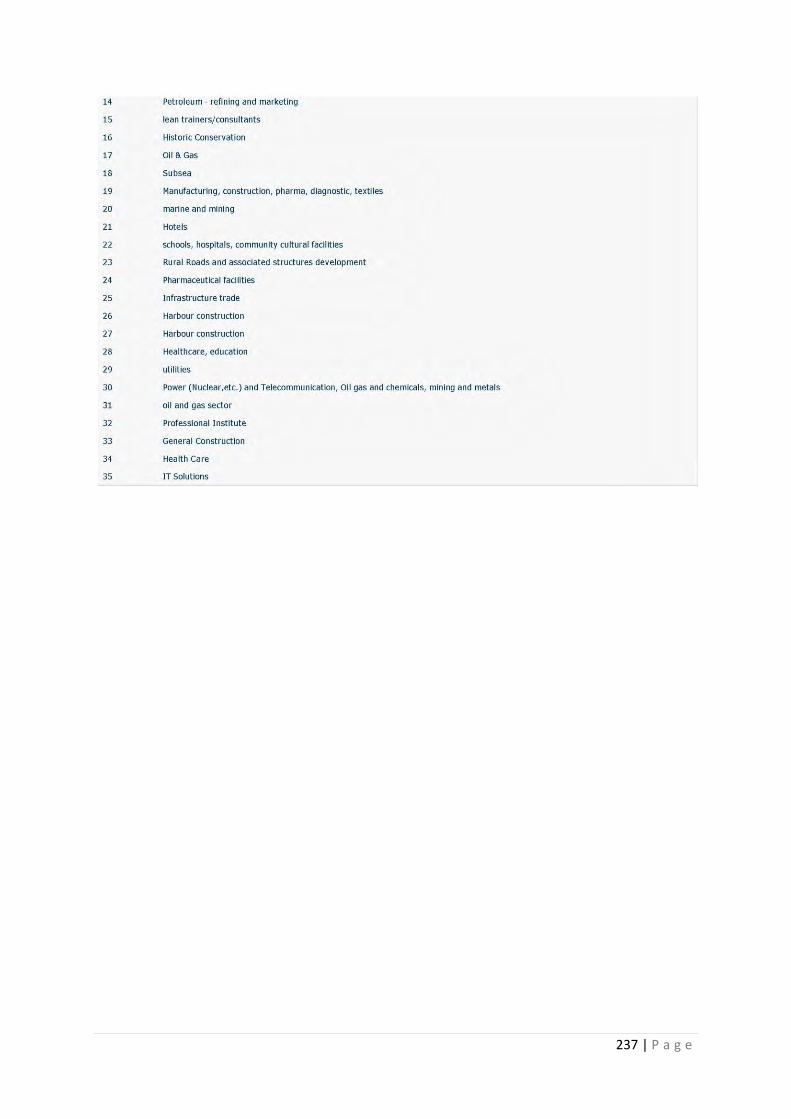
237 | P a g e
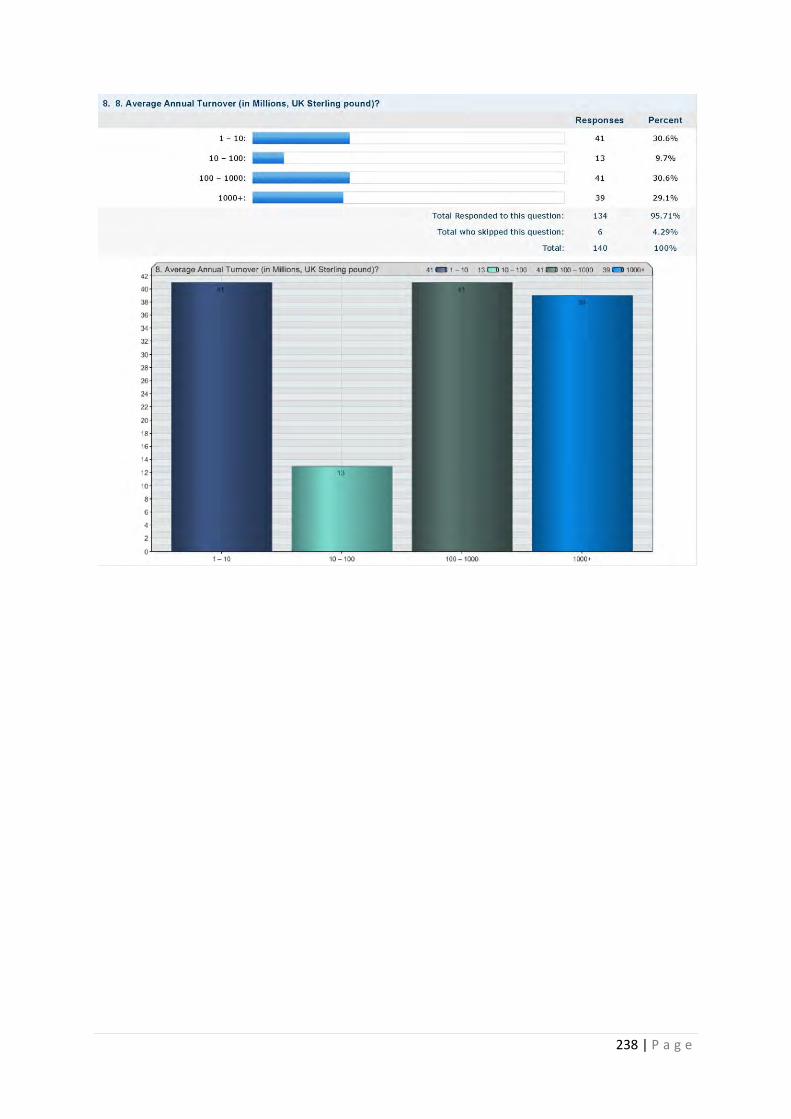
238 | P a g e
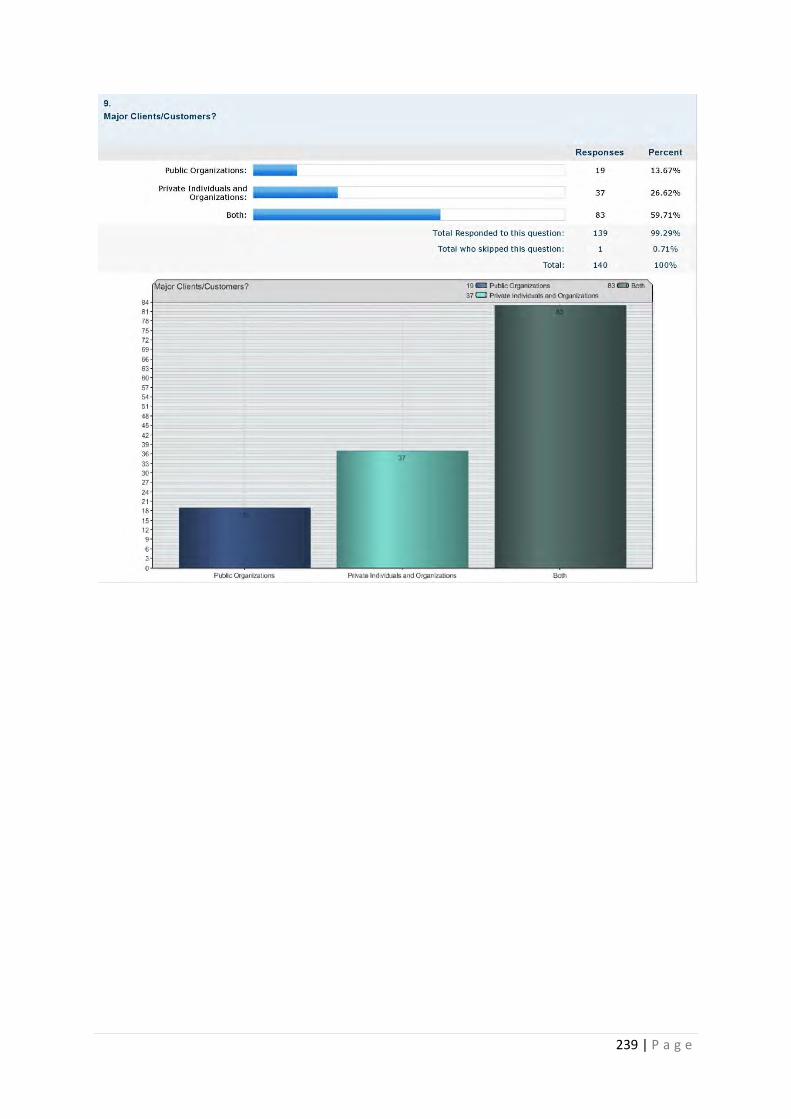
239 | P a g e
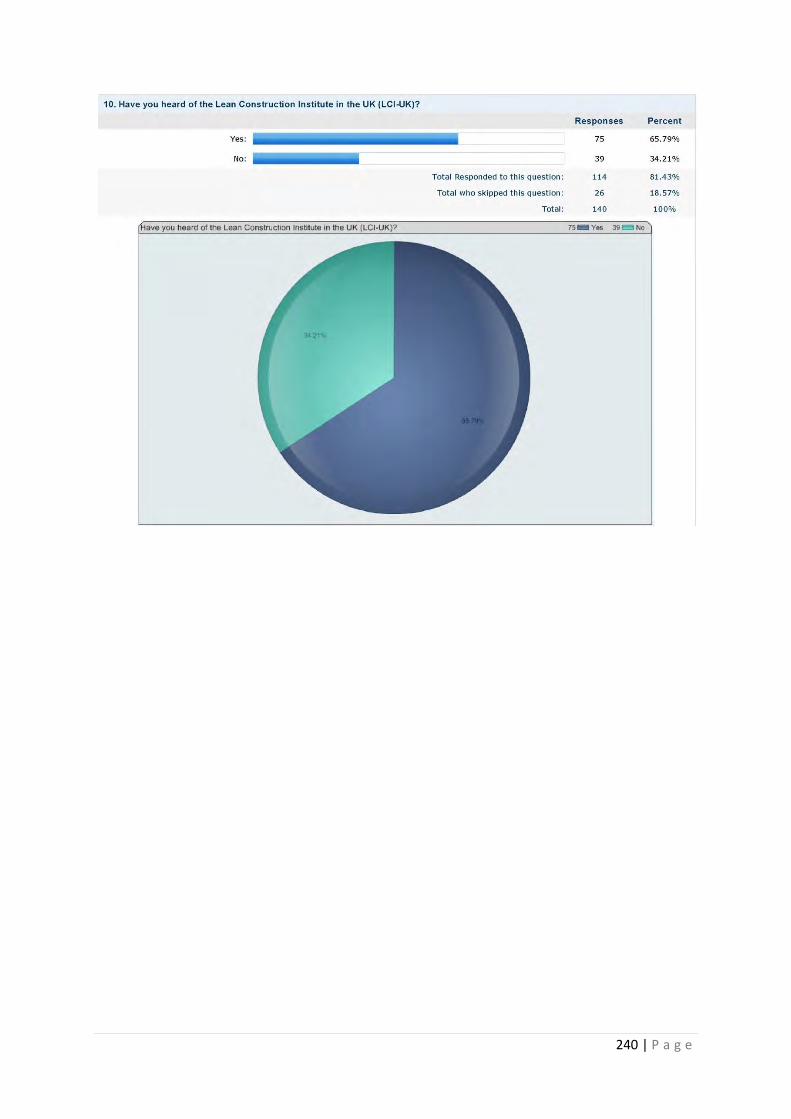
240 | P a g e
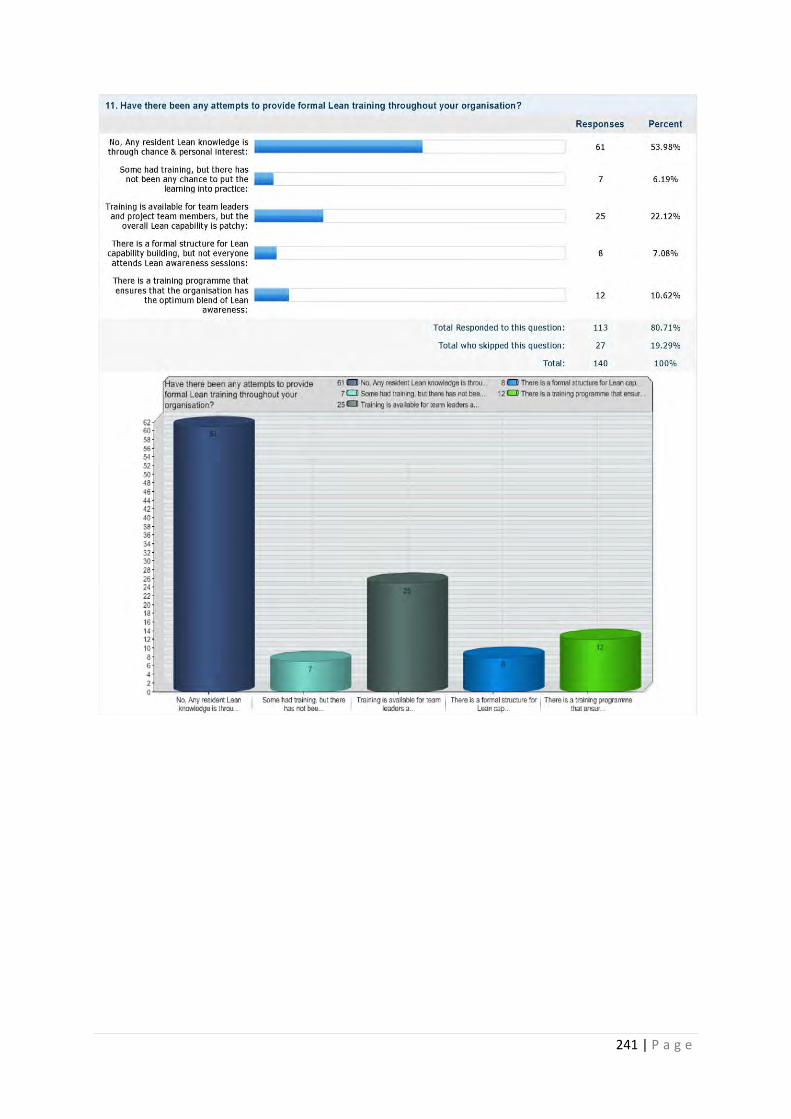
241 | P a g e
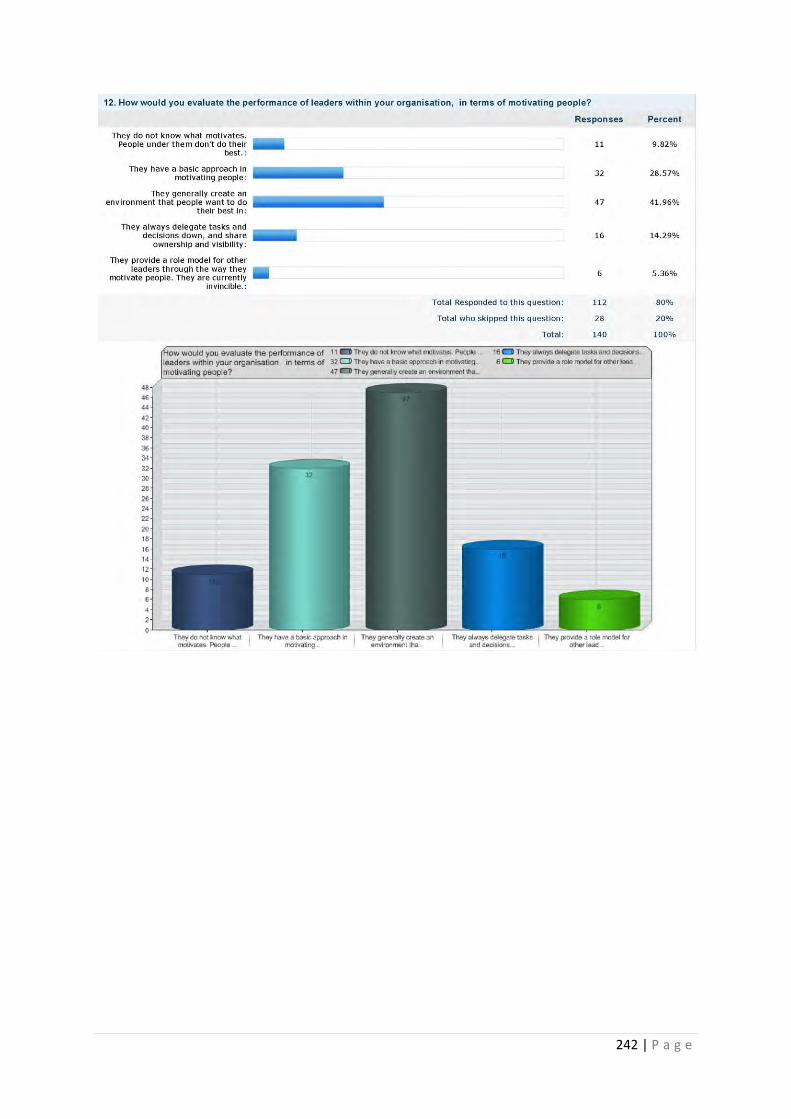
242 | P a g e
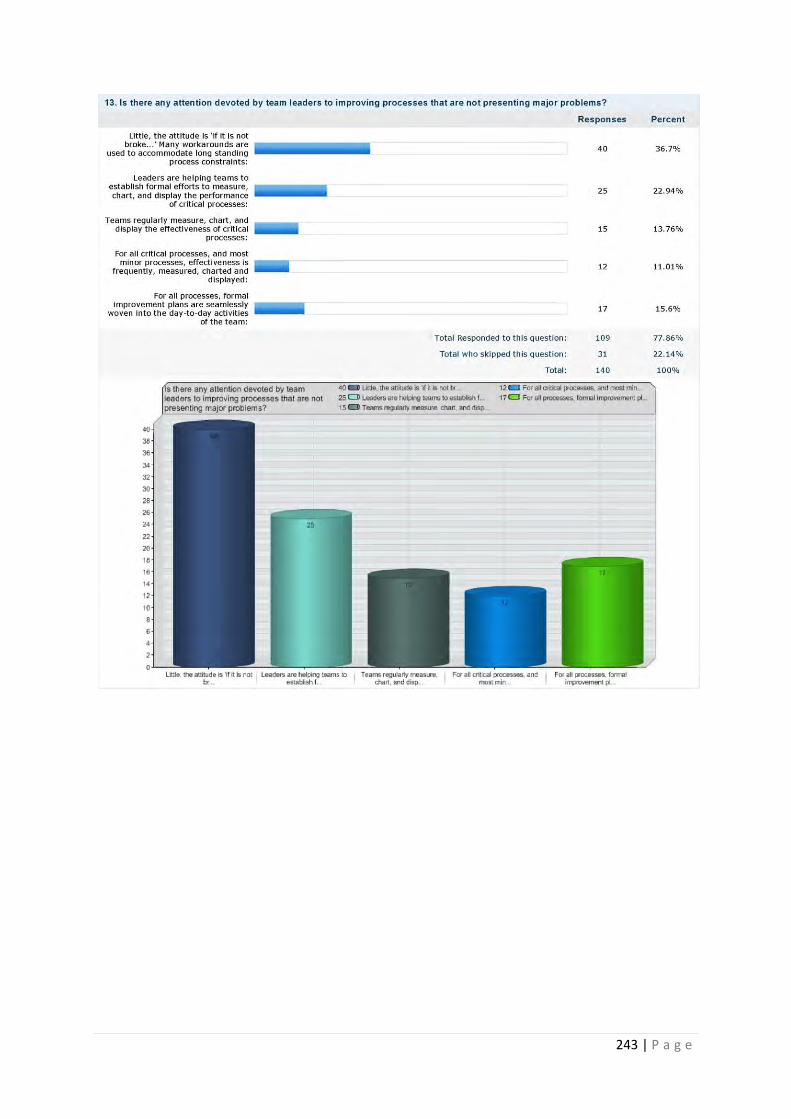
243 | P a g e
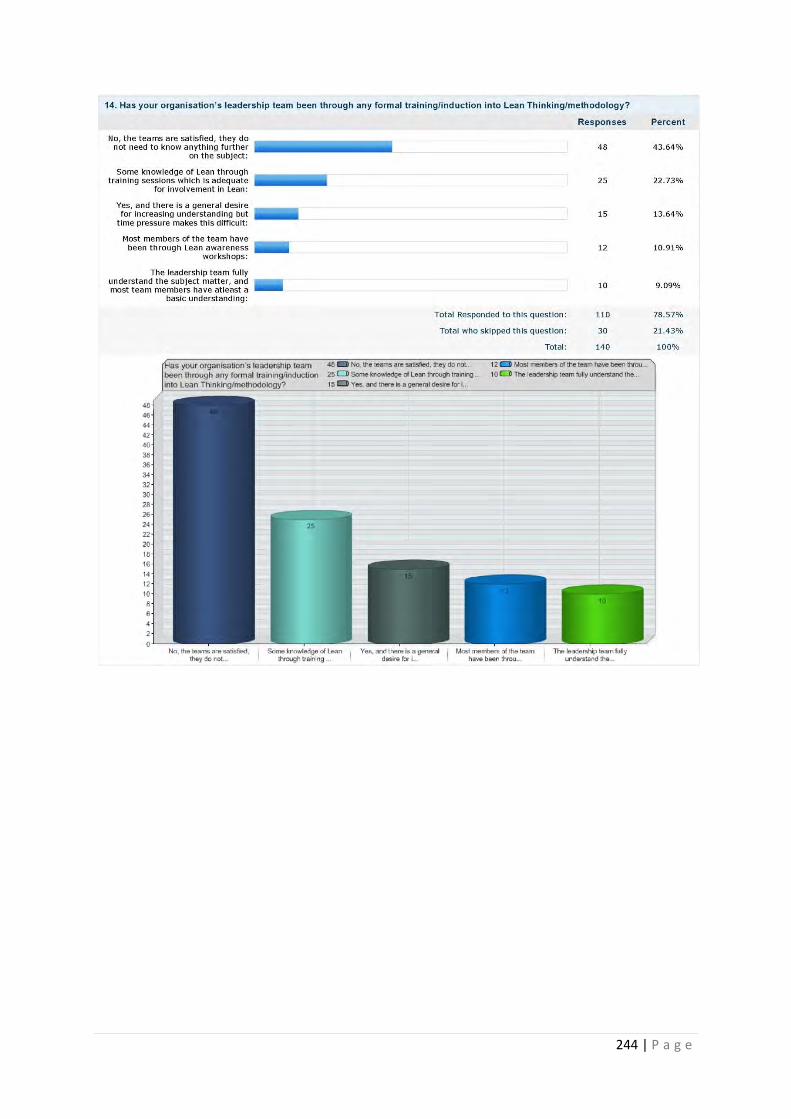
244 | P a g e
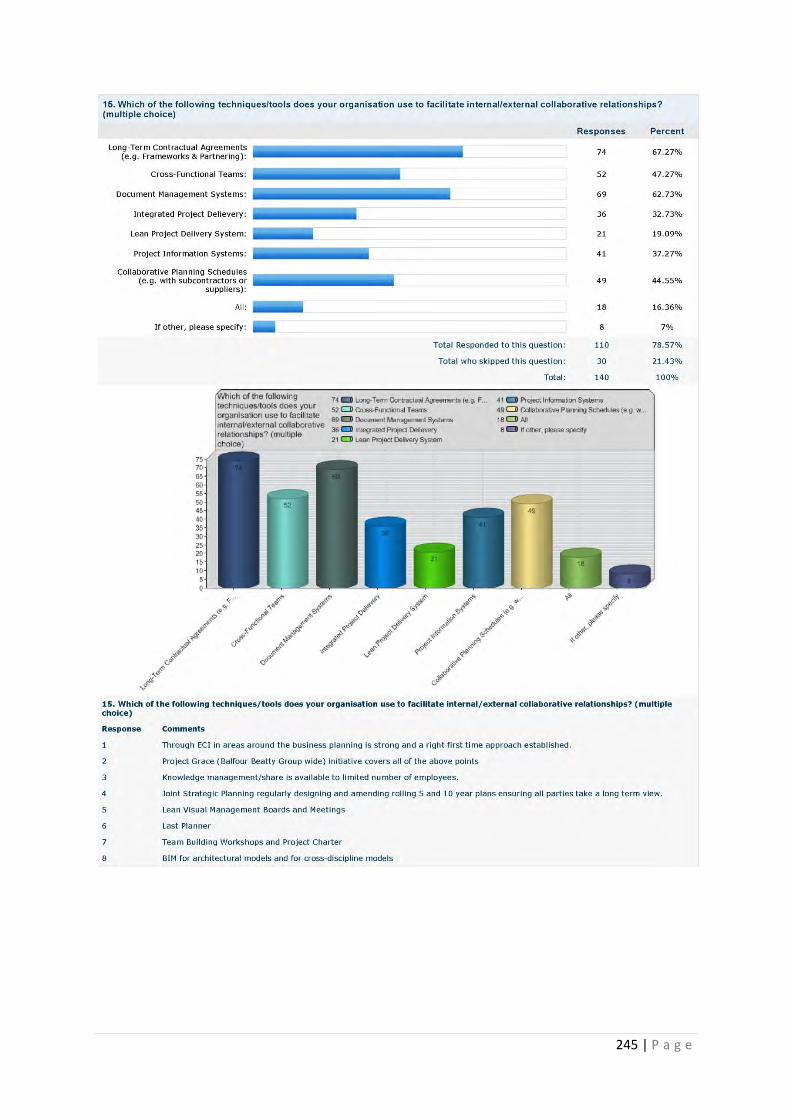
245 | P a g e
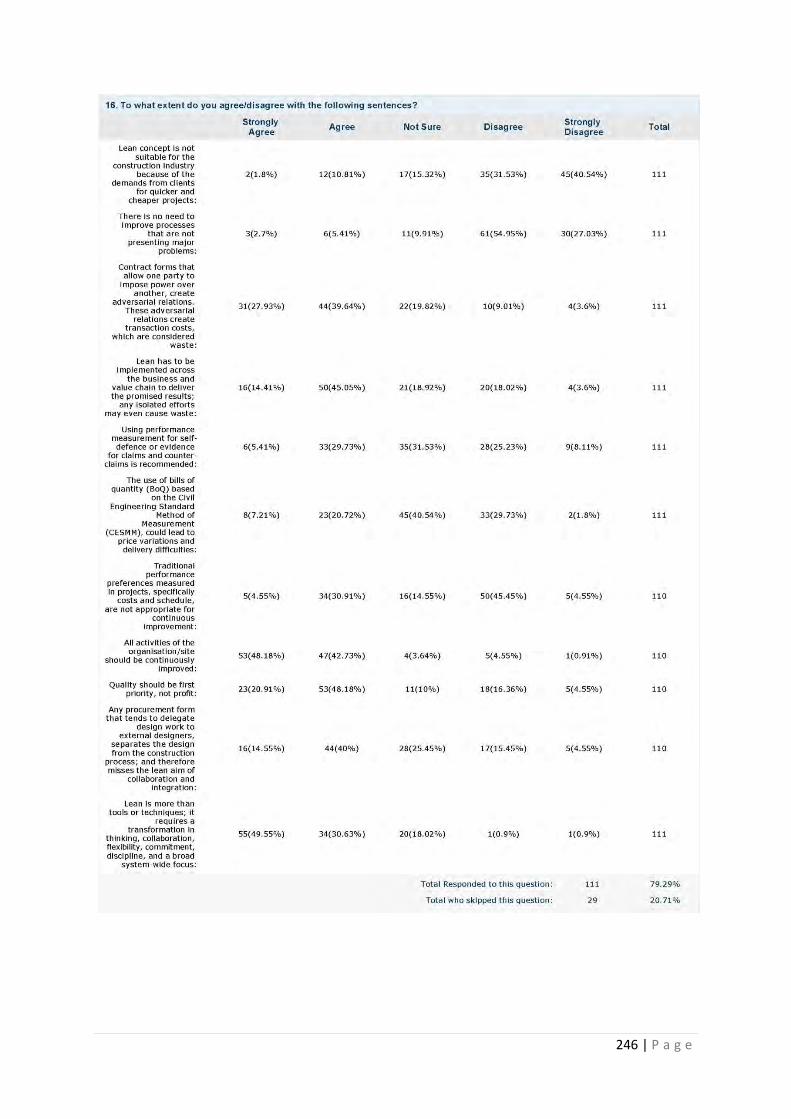
246 | P a g e
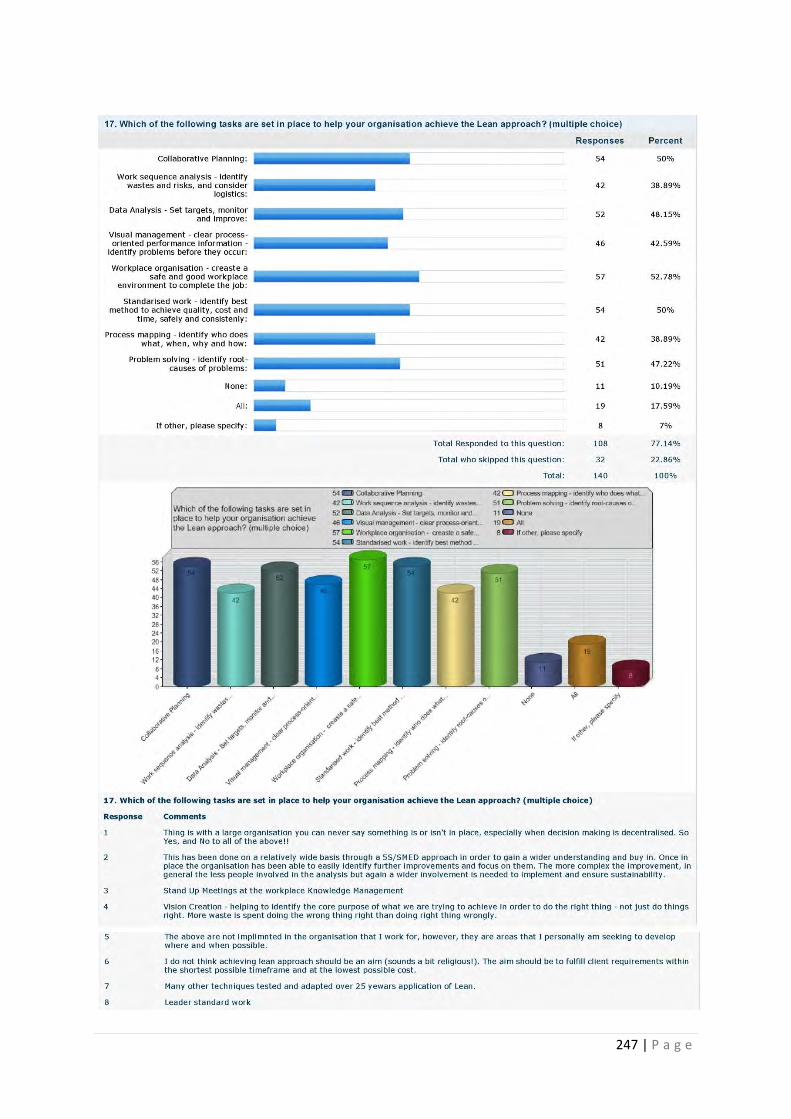
247 | P a g e
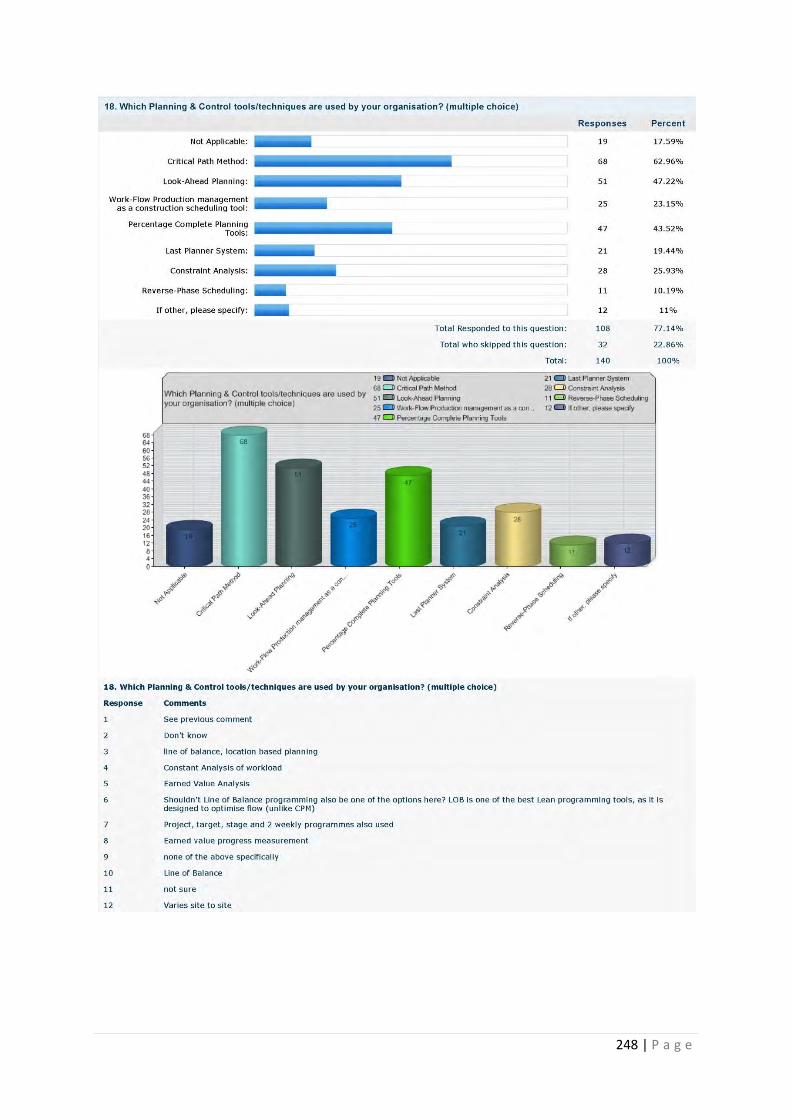
248 | P a g e
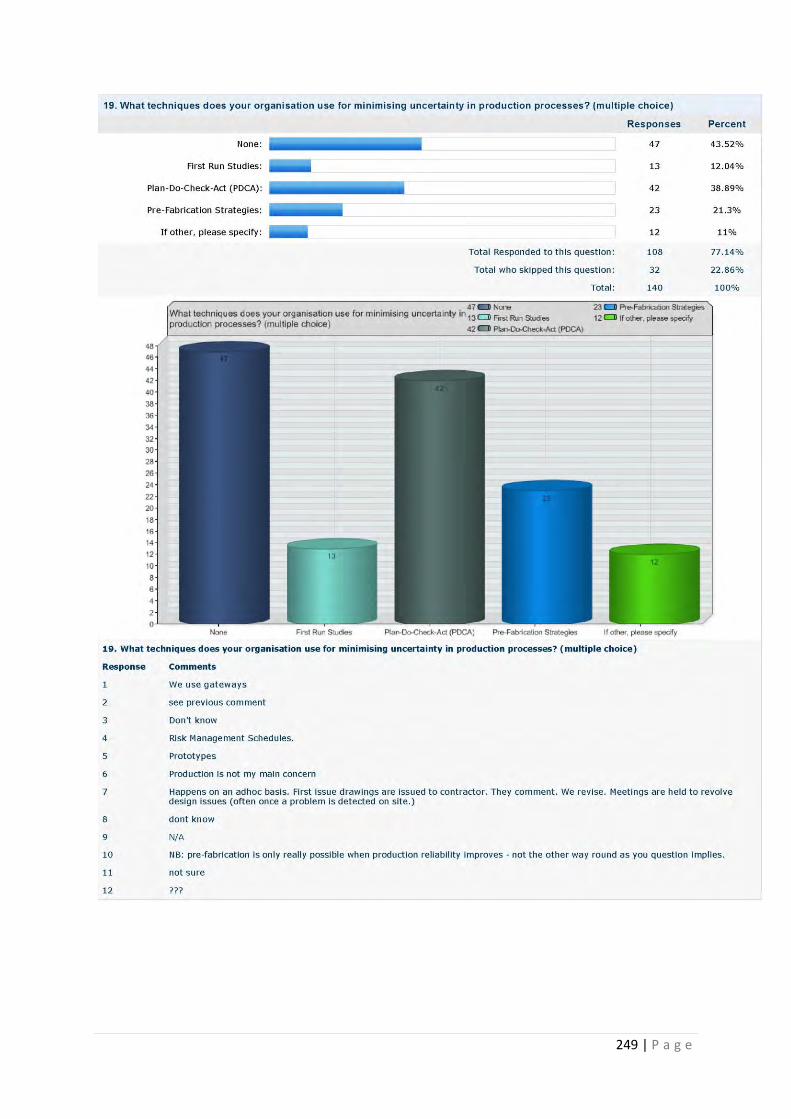
249 | P a g e

250 | P a g e

251 | P a g e
252 | P a g e
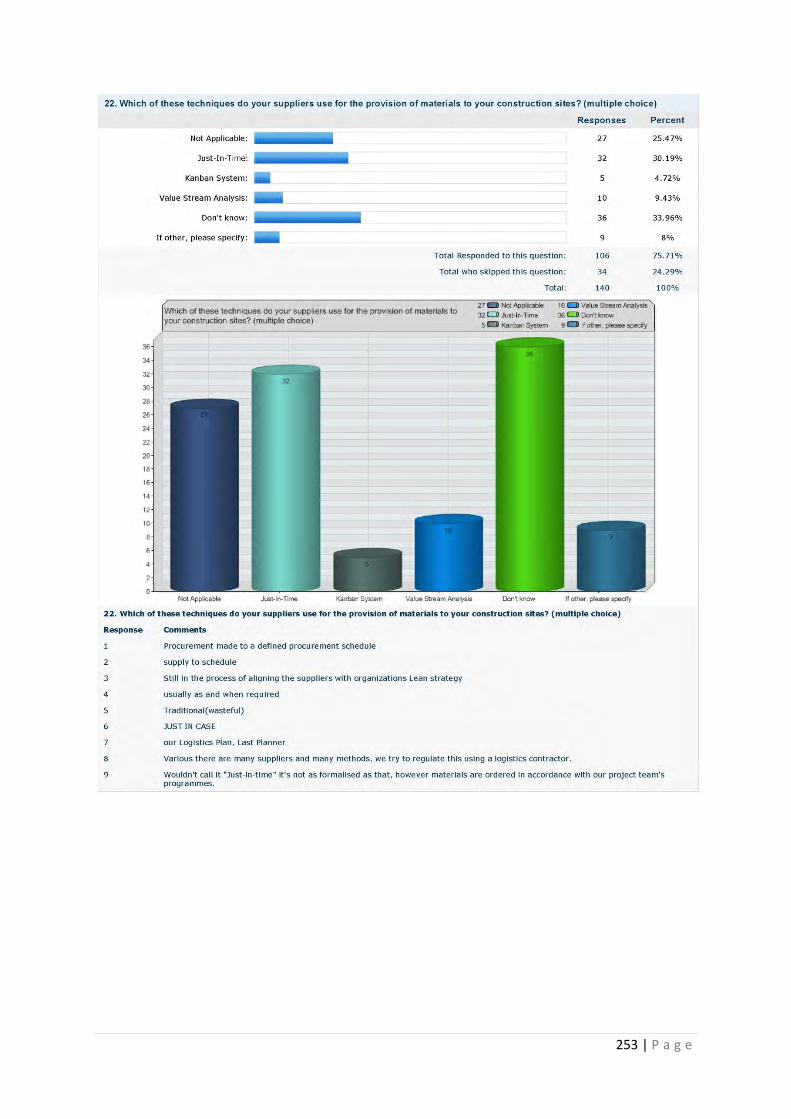
253 | P a g e
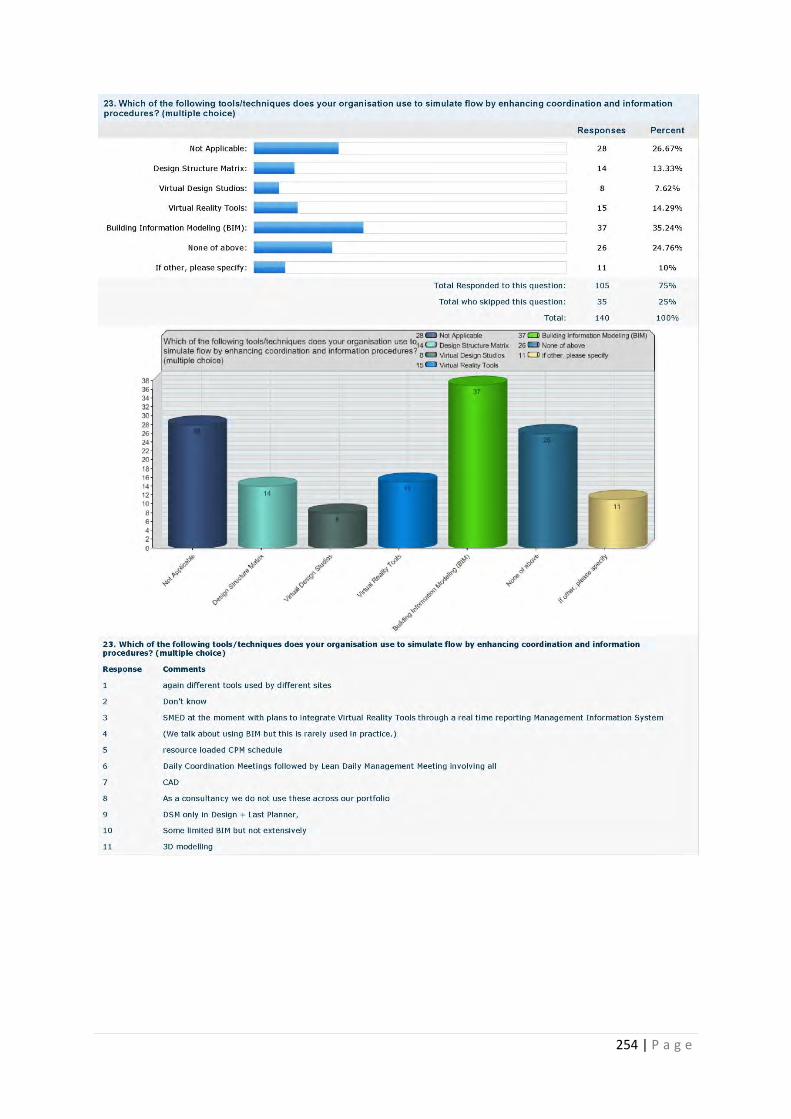
254 | P a g e
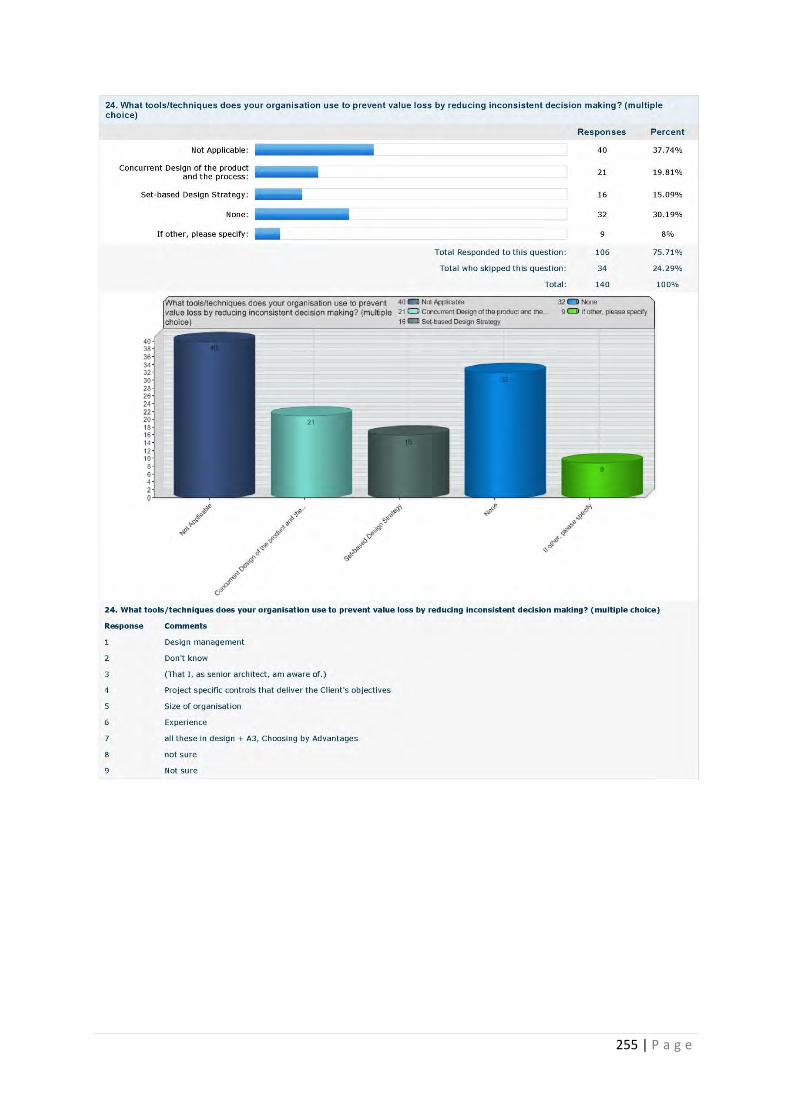
255 | P a g e

256 | P a g e
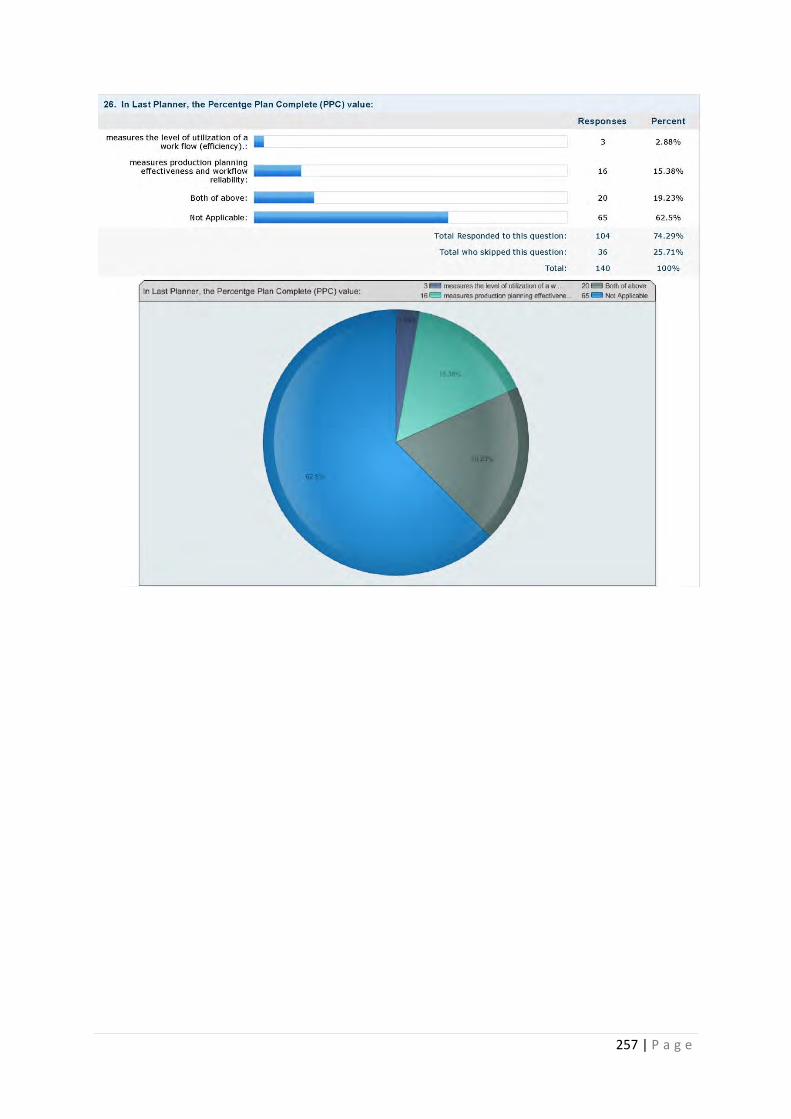
257 | P a g e
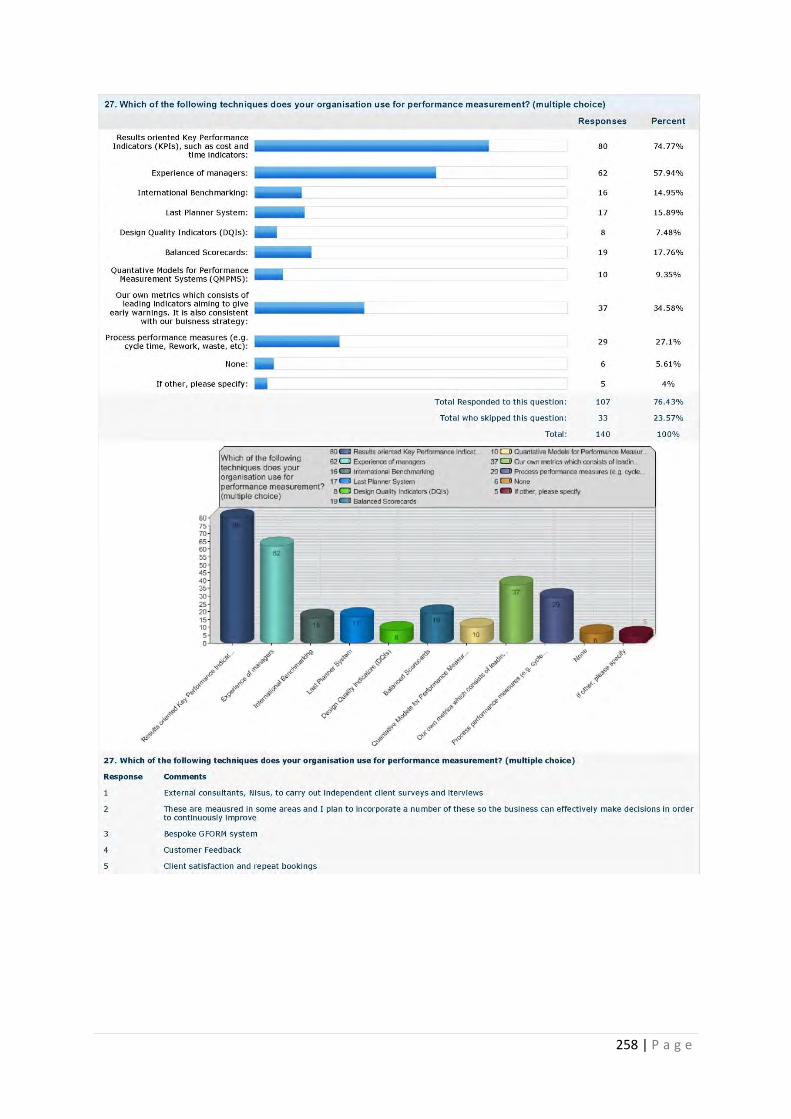
258 | P a g e

259 | P a g e
Quality Safety Client
satisfaction Functionality
Planning efficiency
Team performance
Productivity
9.00 9.00 9.00 8.00 9.00 9.00 9.00
10.00 10.00 10.00 1.00 1.00 1.00 1.00
10.00 10.00 10.00 8.00 8.00 7.00 7.00
9.00 10.00 10.00 9.00 9.00 7.00 9.00
9.00 10.00 10.00 9.00 8.00 8.00 8.00
10.00 10.00 10.00 8.00 9.00 10.00 7.00
10.00 10.00 10.00 8.00 8.00 10.00 10.00
8.00 10.00 9.00 7.00 4.00 6.00 5.00
9.00 10.00 10.00 9.00 8.00 8.00 8.00
10.00 10.00 10.00 10.00 10.00 10.00 10.00
8.00 8.00 10.00 7.00 6.00 9.00 8.00
10.00 10.00 10.00 10.00 10.00 10.00 10.00
10.00 10.00 10.00 10.00 10.00 10.00 10.00
10.00 10.00 10.00 9.00 9.00 9.00 9.00
10.00 10.00 10.00 10.00 8.00 8.00 10.00
8.00 10.00 10.00 8.00 7.00 7.00 7.00
7.00 10.00 9.00 8.00 4.00 5.00 6.00
9.00 10.00 9.00 10.00 9.00 9.00 9.00
10.00 10.00 10.00 9.00 10.00 10.00 9.00
8.00 8.00 10.00 8.00 9.00 9.00 9.00
9.00 10.00 10.00 6.00 7.00 7.00 7.00
10.00 10.00 10.00 10.00 10.00 10.00 8.00
9.00 10.00 7.00 4.00 5.00 6.00 8.00
8.00 10.00 9.00 4.00 7.00 6.00 5.00
10.00 10.00 10.00 10.00 10.00 10.00 10.00
7.00 10.00 9.00 4.00 5.00 6.00 8.00
10.00 10.00 8.00 8.00 8.00 8.00 8.00
9.00 10.00 9.00 8.00 7.00 5.00 7.00
8.00 10.00 5.00 5.00 6.00 5.00 5.00
10.00 10.00 10.00 8.00 8.00 9.00 9.00
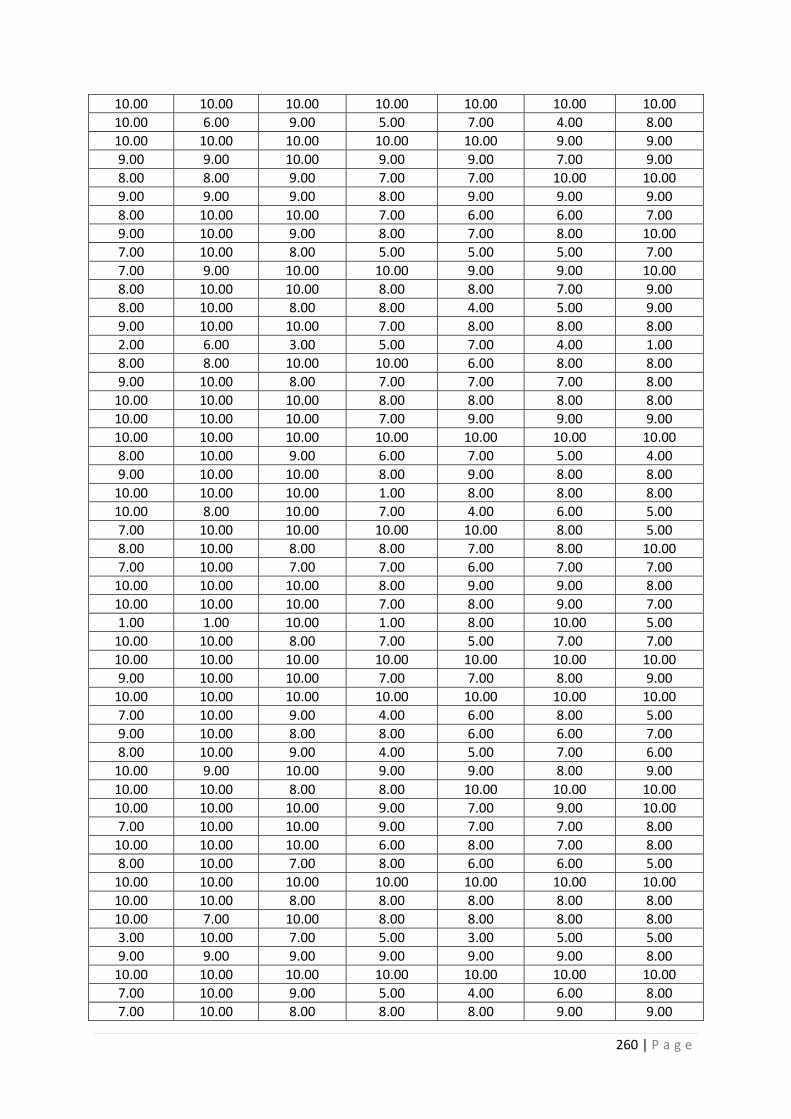
260 | P a g e
10.00 10.00 10.00 10.00 10.00 10.00 10.00
10.00 6.00 9.00 5.00 7.00 4.00 8.00
10.00 10.00 10.00 10.00 10.00 9.00 9.00
9.00 9.00 10.00 9.00 9.00 7.00 9.00
8.00 8.00 9.00 7.00 7.00 10.00 10.00
9.00 9.00 9.00 8.00 9.00 9.00 9.00
8.00 10.00 10.00 7.00 6.00 6.00 7.00
9.00 10.00 9.00 8.00 7.00 8.00 10.00
7.00 10.00 8.00 5.00 5.00 5.00 7.00
7.00 9.00 10.00 10.00 9.00 9.00 10.00
8.00 10.00 10.00 8.00 8.00 7.00 9.00
8.00 10.00 8.00 8.00 4.00 5.00 9.00
9.00 10.00 10.00 7.00 8.00 8.00 8.00
2.00 6.00 3.00 5.00 7.00 4.00 1.00
8.00 8.00 10.00 10.00 6.00 8.00 8.00
9.00 10.00 8.00 7.00 7.00 7.00 8.00
10.00 10.00 10.00 8.00 8.00 8.00 8.00
10.00 10.00 10.00 7.00 9.00 9.00 9.00
10.00 10.00 10.00 10.00 10.00 10.00 10.00
8.00 10.00 9.00 6.00 7.00 5.00 4.00
9.00 10.00 10.00 8.00 9.00 8.00 8.00
10.00 10.00 10.00 1.00 8.00 8.00 8.00
10.00 8.00 10.00 7.00 4.00 6.00 5.00
7.00 10.00 10.00 10.00 10.00 8.00 5.00
8.00 10.00 8.00 8.00 7.00 8.00 10.00
7.00 10.00 7.00 7.00 6.00 7.00 7.00
10.00 10.00 10.00 8.00 9.00 9.00 8.00
10.00 10.00 10.00 7.00 8.00 9.00 7.00
1.00 1.00 10.00 1.00 8.00 10.00 5.00
10.00 10.00 8.00 7.00 5.00 7.00 7.00
10.00 10.00 10.00 10.00 10.00 10.00 10.00
9.00 10.00 10.00 7.00 7.00 8.00 9.00
10.00 10.00 10.00 10.00 10.00 10.00 10.00
7.00 10.00 9.00 4.00 6.00 8.00 5.00
9.00 10.00 8.00 8.00 6.00 6.00 7.00
8.00 10.00 9.00 4.00 5.00 7.00 6.00
10.00 9.00 10.00 9.00 9.00 8.00 9.00
10.00 10.00 8.00 8.00 10.00 10.00 10.00
10.00 10.00 10.00 9.00 7.00 9.00 10.00
7.00 10.00 10.00 9.00 7.00 7.00 8.00
10.00 10.00 10.00 6.00 8.00 7.00 8.00
8.00 10.00 7.00 8.00 6.00 6.00 5.00
10.00 10.00 10.00 10.00 10.00 10.00 10.00
10.00 10.00 8.00 8.00 8.00 8.00 8.00
10.00 7.00 10.00 8.00 8.00 8.00 8.00
3.00 10.00 7.00 5.00 3.00 5.00 5.00
9.00 9.00 9.00 9.00 9.00 9.00 8.00
10.00 10.00 10.00 10.00 10.00 10.00 10.00
7.00 10.00 9.00 5.00 4.00 6.00 8.00
7.00 10.00 8.00 8.00 8.00 9.00 9.00

261 | P a g e
9.00 10.00 9.00 9.00 9.00 9.00 8.00
10.00 10.00 10.00 10.00 10.00 10.00 10.00
9.00 10.00 8.00 8.00 5.00 6.00 7.00
10.00 10.00 10.00 9.00 9.00 10.00 10.00
8.00 10.00 8.00 8.00 8.00 8.00 8.00
10.00 10.00 10.00 8.00 8.00 8.00 8.00
10.00 10.00 10.00 9.00 10.00 9.00 9.00
7.00 8.00 8.00 8.00 5.00 7.00 3.00
10.00 9.00 10.00 9.00 8.00 8.00 8.00
8.00 8.00 10.00 9.00 7.00 7.00 7.00
8.00 8.00 10.00 10.00 8.00 8.00 8.00
9.00 10.00 9.00 8.00 10.00 8.00 8.00
9.00 10.00 10.00 9.00 9.00 9.00 9.00
10.00 10.00 9.00 8.00 7.00 7.00 8.00
9.00 10.00 9.00 8.00 9.00 9.00 8.00
10.00 10.00 8.00 8.00 7.00 7.00 7.00
10.00 10.00 10.00 10.00 10.00 10.00 8.00
8.00 10.00 9.00 7.00 4.00 5.00 6.00
9.00 10.00 8.00 9.00 9.00 9.00 9.00
6.00 1.00 5.00 7.00 5.00 5.00 9.00
8.00 10.00 9.00 6.00 5.00 5.00 4.00
5.00 10.00 9.00 4.00 7.00 8.00 8.00
8.00 9.00 8.00 8.00 8.00 6.00 6.00
10.00 10.00 10.00 8.00 8.00 9.00 8.00
10.00 10.00 10.00 2.00 10.00 8.00 3.00
10.00 10.00 8.00 8.00 7.00 7.00 9.00
10.00 10.00 5.00 5.00 5.00 10.00 5.00
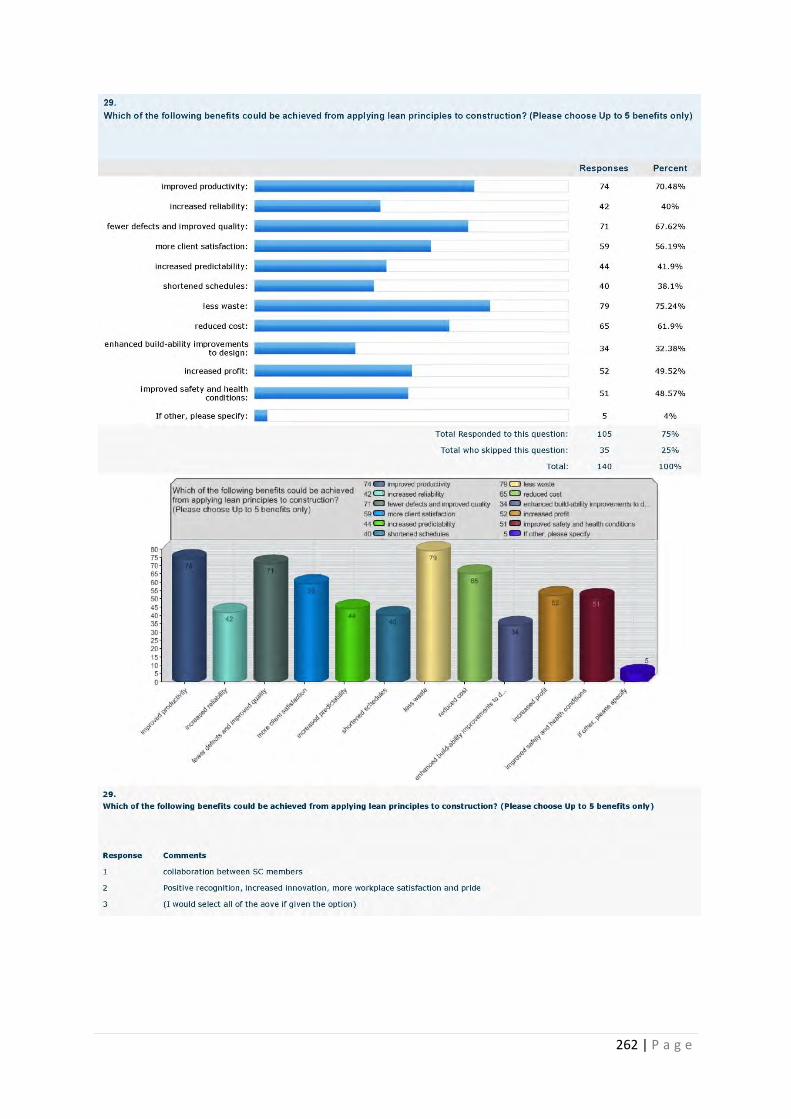
262 | P a g e

263 | P a g e
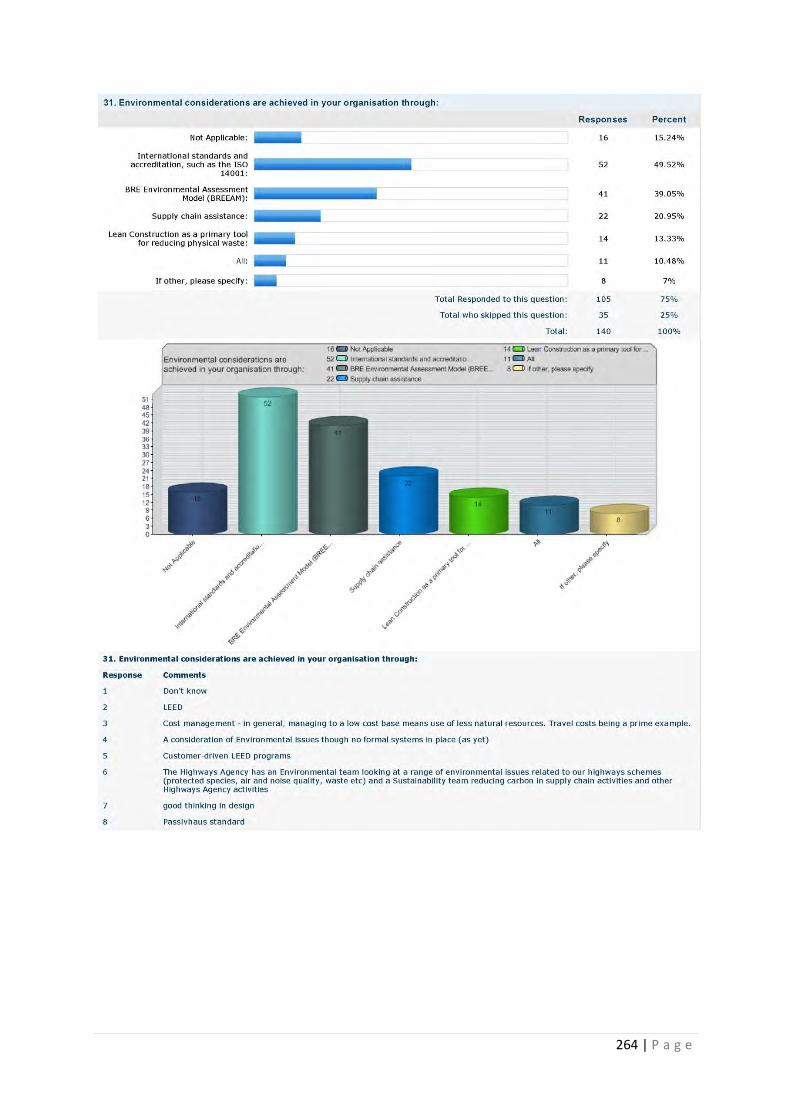
264 | P a g e
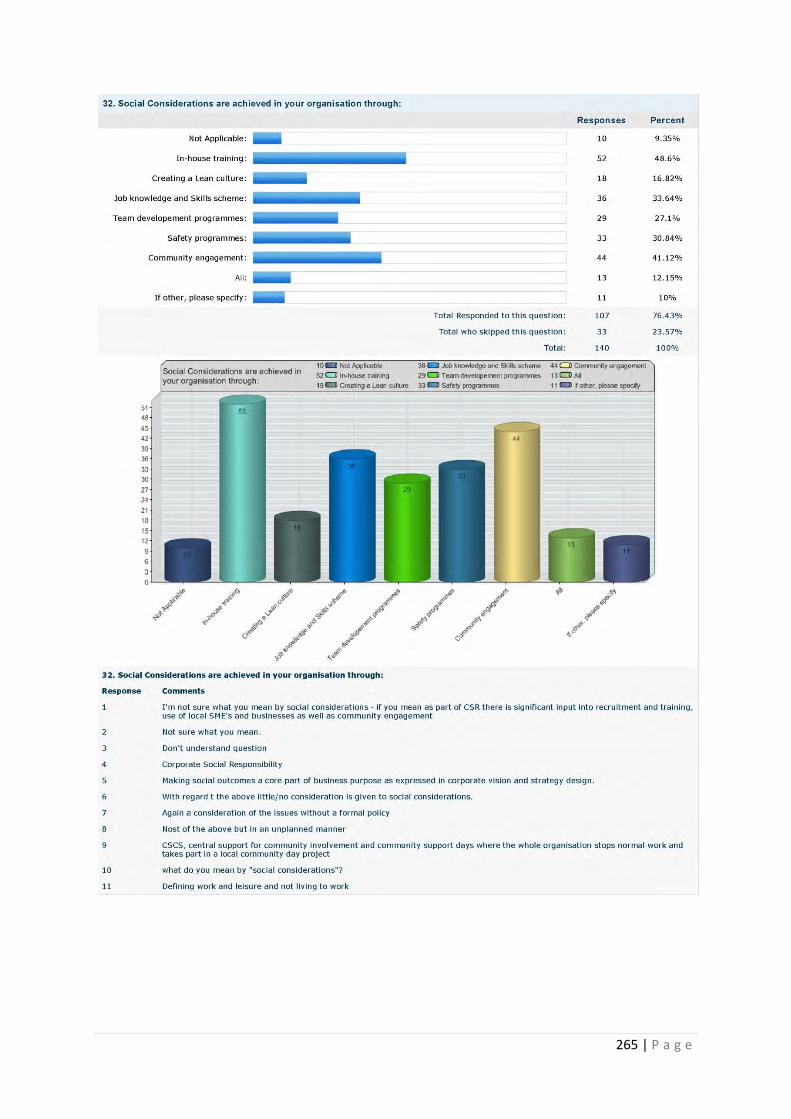
265 | P a g e
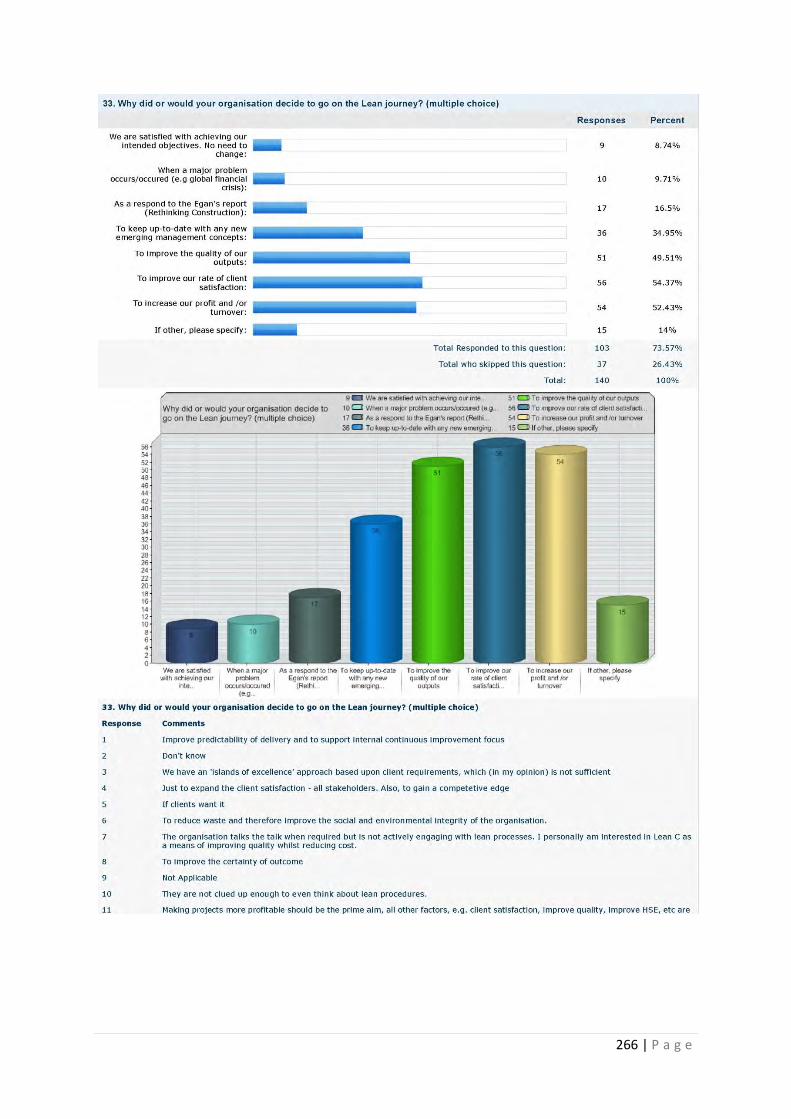
266 | P a g e
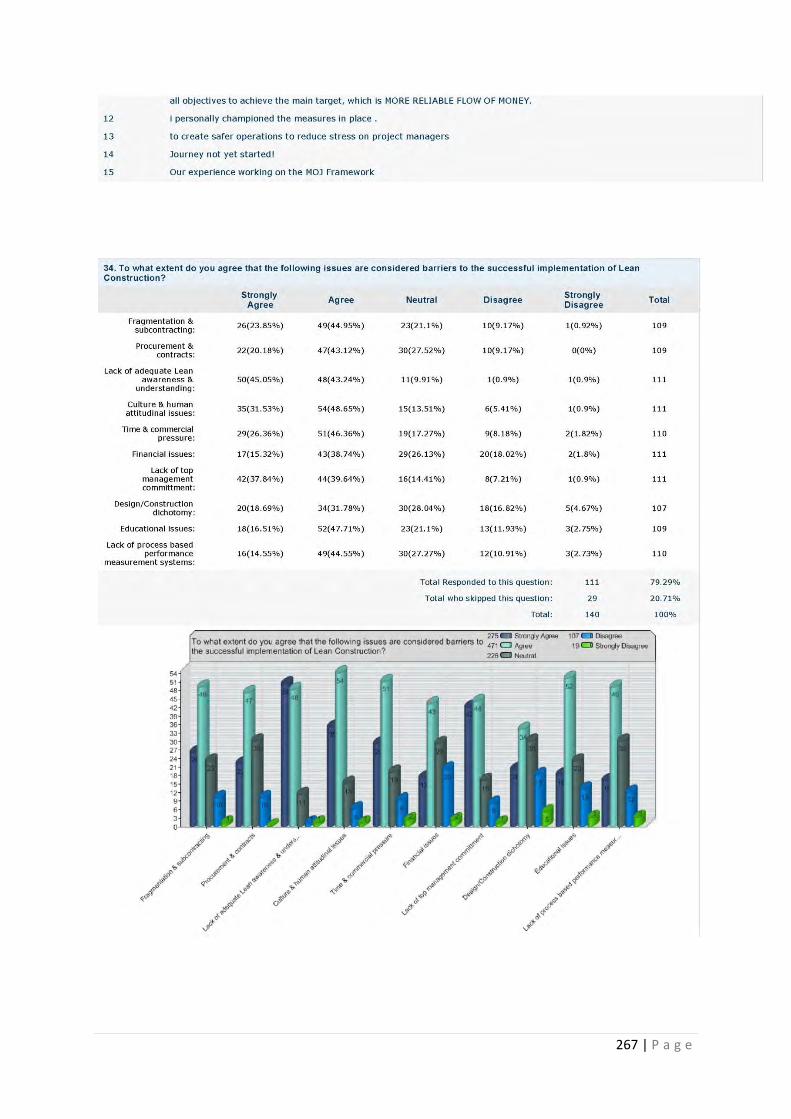
267 | P a g e
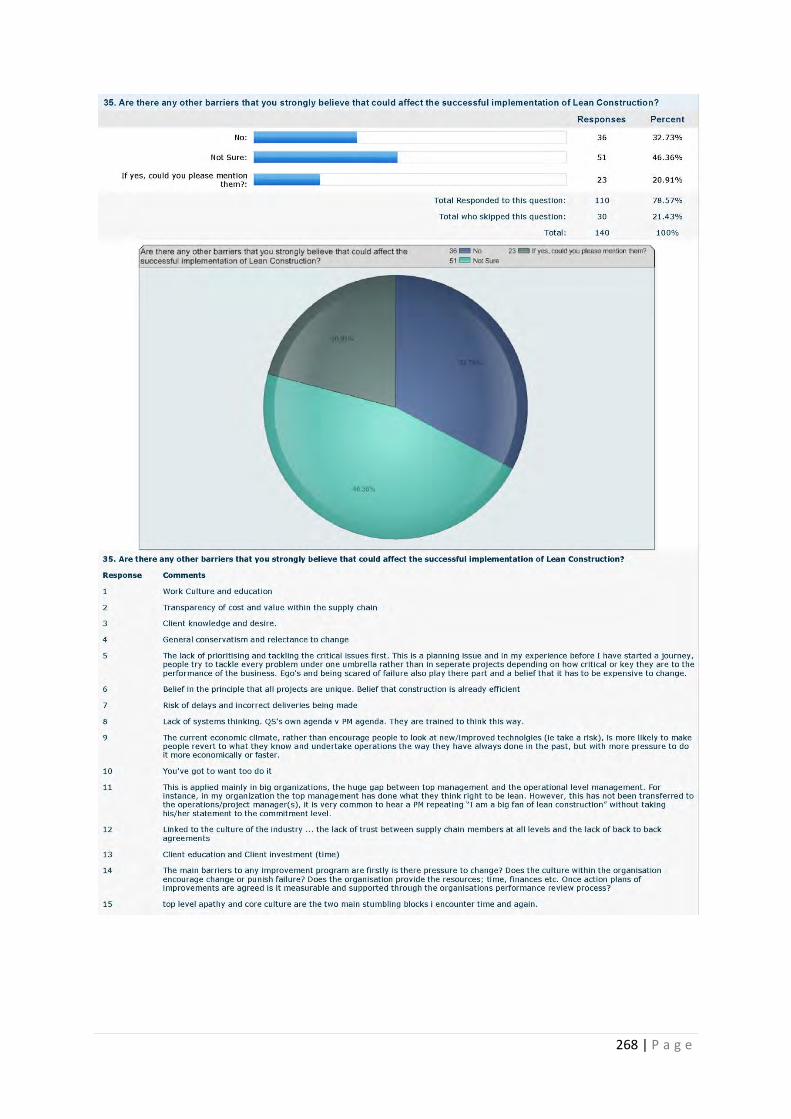
268 | P a g e
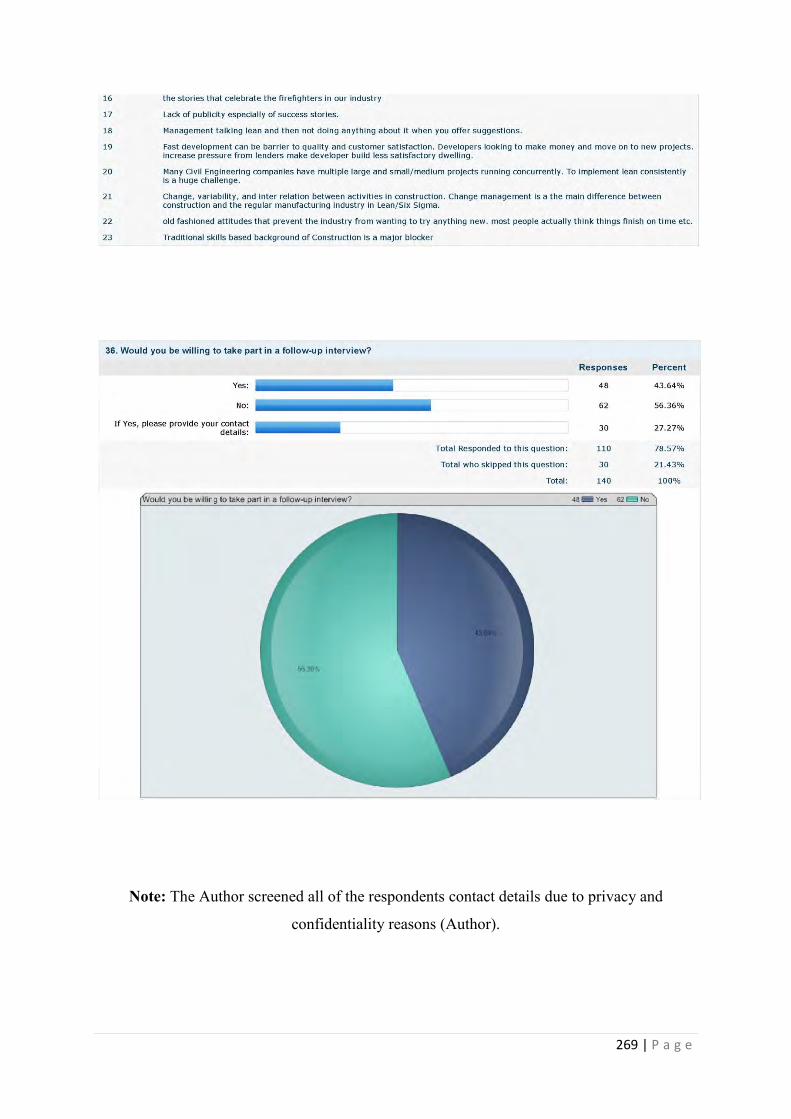
269 | P a g e
Note: The Author screened all of the respondents contact details due to privacy and
confidentiality reasons (Author).
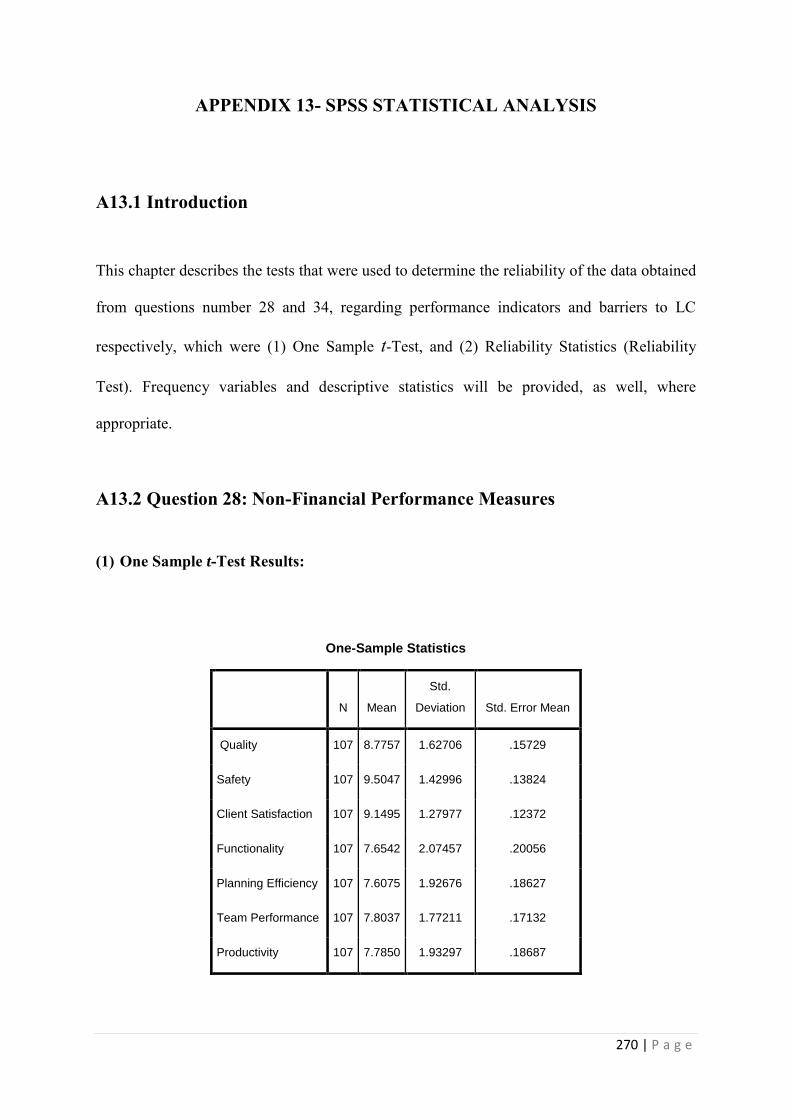
270 | P a g e
APPENDIX 13- SPSS STATISTICAL ANALYSIS
A13.1 Introduction
This chapter describes the tests that were used to determine the reliability of the data obtained
from questions number 28 and 34, regarding performance indicators and barriers to LC
respectively, which were (1) One Sample t-Test, and (2) Reliability Statistics (Reliability
Test). Frequency variables and descriptive statistics will be provided, as well, where
appropriate.
A13.2 Question 28: Non-Financial Performance Measures
(1) One Sample t-Test Results:
One-Sample Statistics
N Mean
Std.
Deviation Std. Error Mean
Quality 107 8.7757 1.62706 .15729
Safety 107 9.5047 1.42996 .13824
Client Satisfaction 107 9.1495 1.27977 .12372
Functionality 107 7.6542 2.07457 .20056
Planning Efficiency 107 7.6075 1.92676 .18627
Team Performance 107 7.8037 1.77211 .17132
Productivity 107 7.7850 1.93297 .18687
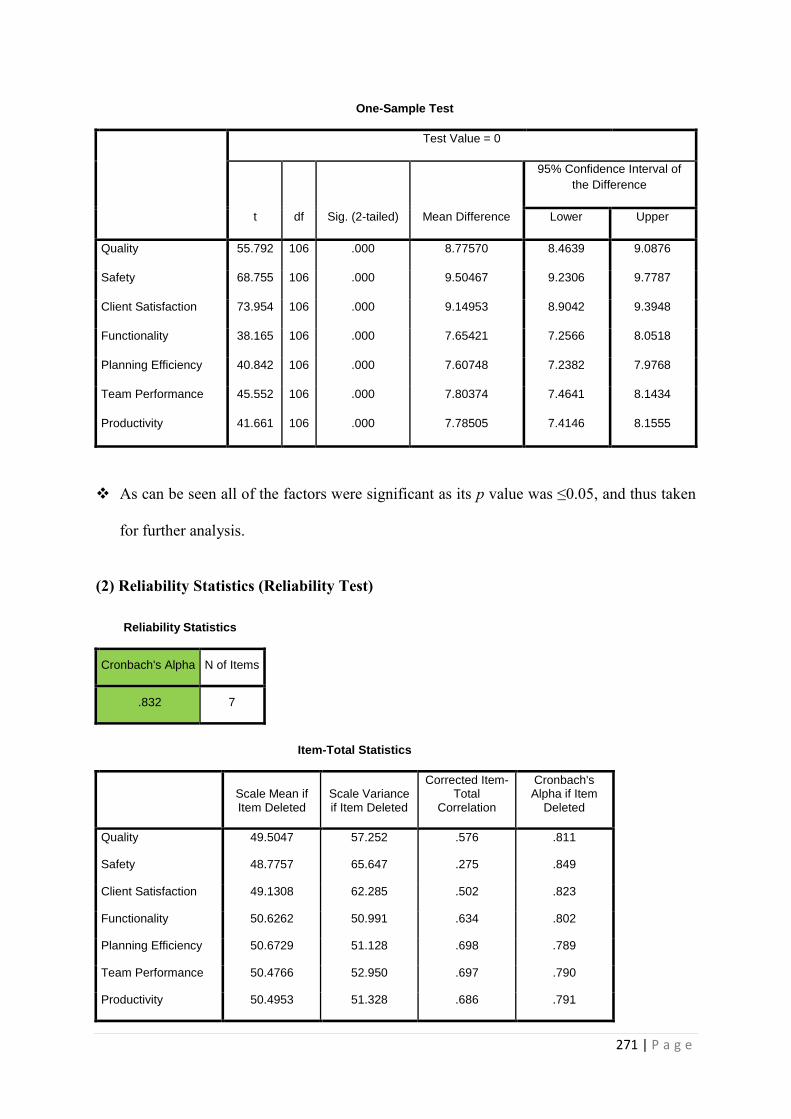
271 | P a g e
One-Sample Test
Test Value = 0
t df Sig. (2-tailed) Mean Difference
95% Confidence Interval of
the Difference
Lower Upper
Quality 55.792 106 .000 8.77570 8.4639 9.0876
Safety 68.755 106 .000 9.50467 9.2306 9.7787
Client Satisfaction 73.954 106 .000 9.14953 8.9042 9.3948
Functionality 38.165 106 .000 7.65421 7.2566 8.0518
Planning Efficiency 40.842 106 .000 7.60748 7.2382 7.9768
Team Performance 45.552 106 .000 7.80374 7.4641 8.1434
Productivity 41.661 106 .000 7.78505 7.4146 8.1555
As can be seen all of the factors were significant as its p value was ≤0.05, and thus taken
for further analysis.
(2) Reliability Statistics (Reliability Test)
Reliability Statistics
Cronbach's Alpha N of Items
.832 7
Item-Total Statistics
Scale Mean if Item Deleted
Scale Variance if Item Deleted
Corrected Item-Total
Correlation
Cronbach's Alpha if Item
Deleted
Quality 49.5047 57.252 .576 .811
Safety 48.7757 65.647 .275 .849
Client Satisfaction 49.1308 62.285 .502 .823
Functionality 50.6262 50.991 .634 .802
Planning Efficiency 50.6729 51.128 .698 .789
Team Performance 50.4766 52.950 .697 .790
Productivity 50.4953 51.328 .686 .791
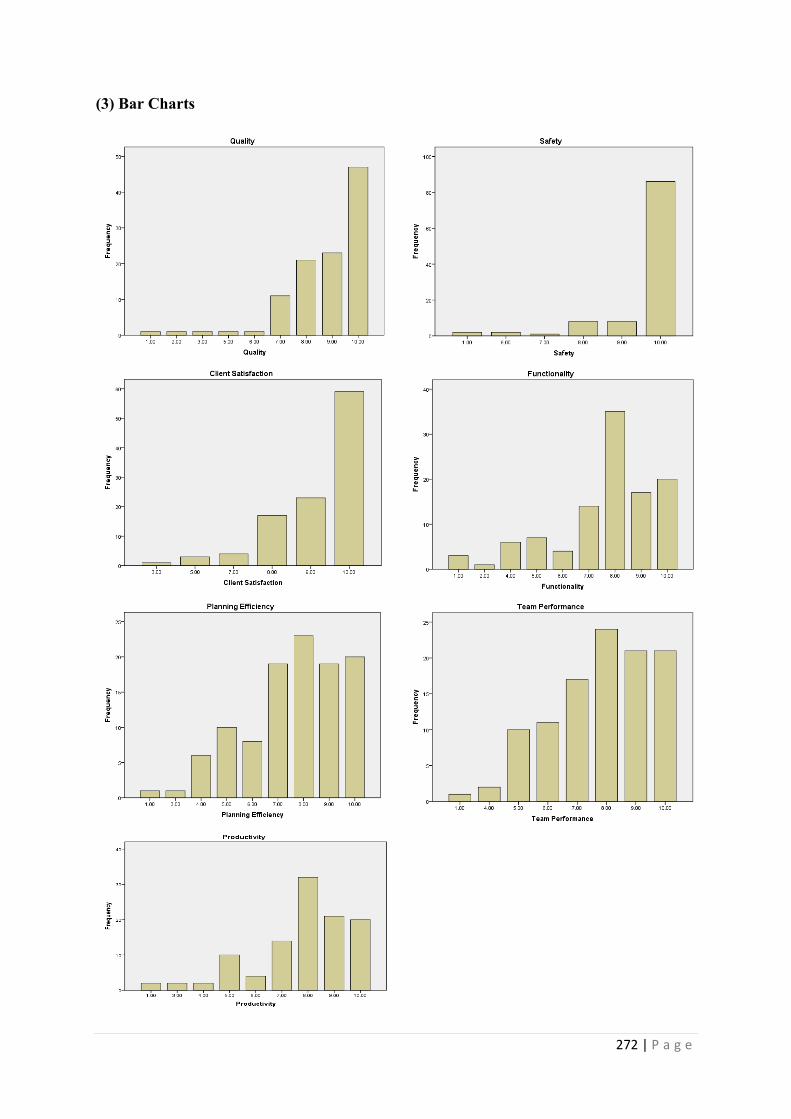
272 | P a g e
(3) Bar Charts
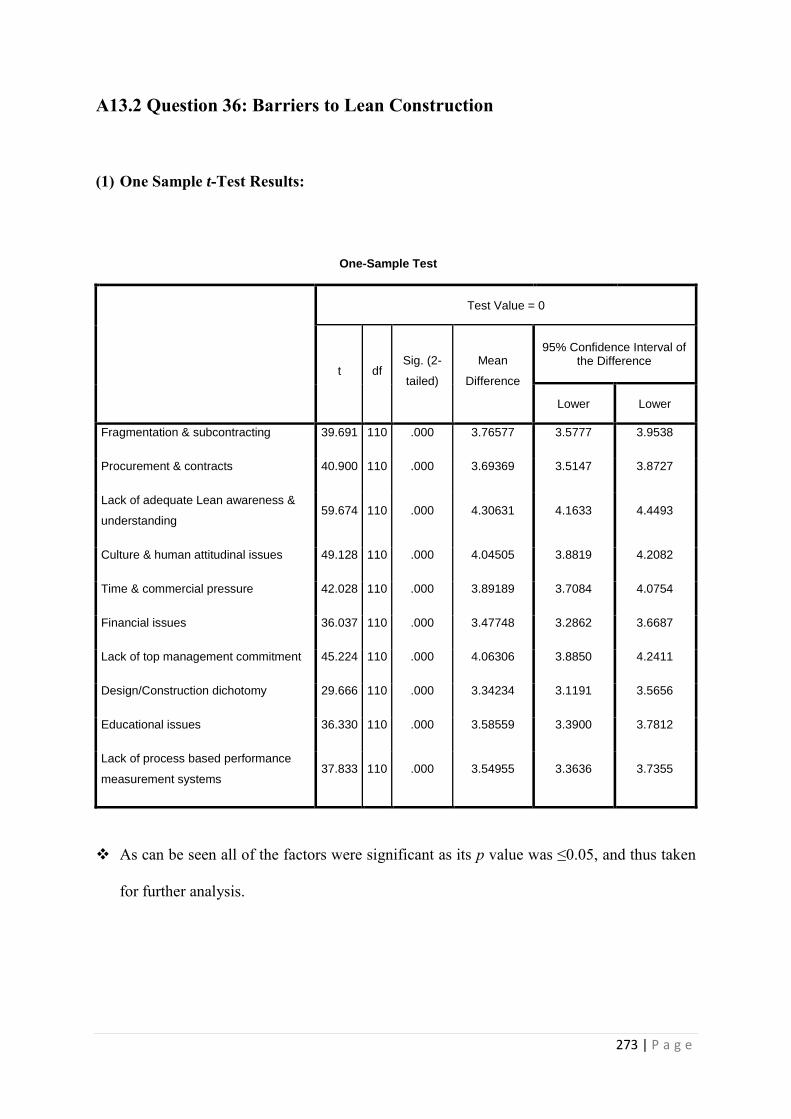
273 | P a g e
A13.2 Question 36: Barriers to Lean Construction
(1) One Sample t-Test Results:
One-Sample Test
Test Value = 0
t df Sig. (2-
tailed)
Mean
Difference
95% Confidence Interval of the Difference
Lower Lower
Fragmentation & subcontracting 39.691 110 .000 3.76577 3.5777 3.9538
Procurement & contracts 40.900 110 .000 3.69369 3.5147 3.8727
Lack of adequate Lean awareness &
understanding 59.674 110 .000 4.30631 4.1633 4.4493
Culture & human attitudinal issues 49.128 110 .000 4.04505 3.8819 4.2082
Time & commercial pressure 42.028 110 .000 3.89189 3.7084 4.0754
Financial issues 36.037 110 .000 3.47748 3.2862 3.6687
Lack of top management commitment 45.224 110 .000 4.06306 3.8850 4.2411
Design/Construction dichotomy 29.666 110 .000 3.34234 3.1191 3.5656
Educational issues 36.330 110 .000 3.58559 3.3900 3.7812
Lack of process based performance
measurement systems 37.833 110 .000 3.54955 3.3636 3.7355
As can be seen all of the factors were significant as its p value was ≤0.05, and thus taken
for further analysis.
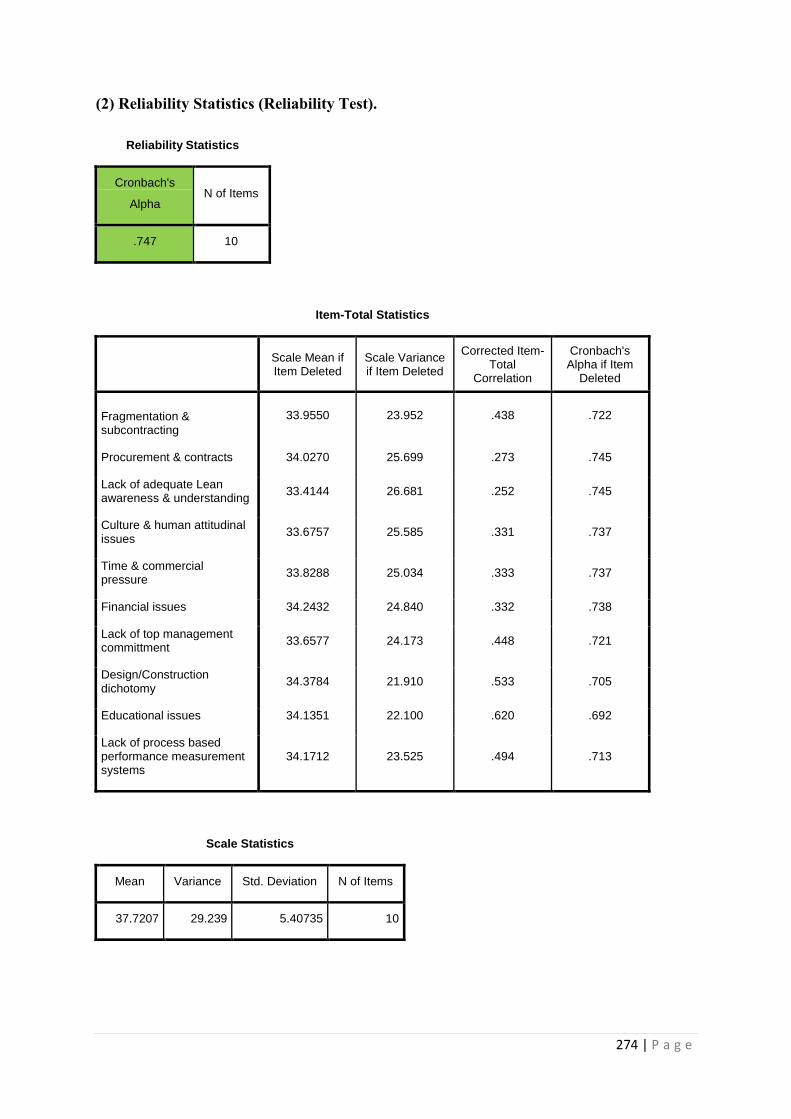
274 | P a g e
(2) Reliability Statistics (Reliability Test).
Reliability Statistics
Cronbach's
Alpha N of Items
.747 10
Item-Total Statistics
Scale Mean if Item Deleted
Scale Variance if Item Deleted
Corrected Item-Total
Correlation
Cronbach's Alpha if Item
Deleted
Fragmentation & subcontracting
33.9550 23.952 .438 .722
Procurement & contracts 34.0270 25.699 .273 .745
Lack of adequate Lean awareness & understanding
33.4144 26.681 .252 .745
Culture & human attitudinal issues
33.6757 25.585 .331 .737
Time & commercial pressure
33.8288 25.034 .333 .737
Financial issues 34.2432 24.840 .332 .738
Lack of top management committment
33.6577 24.173 .448 .721
Design/Construction dichotomy
34.3784 21.910 .533 .705
Educational issues 34.1351 22.100 .620 .692
Lack of process based performance measurement systems
34.1712 23.525 .494 .713
Scale Statistics
Mean Variance Std. Deviation N of Items
37.7207 29.239 5.40735 10
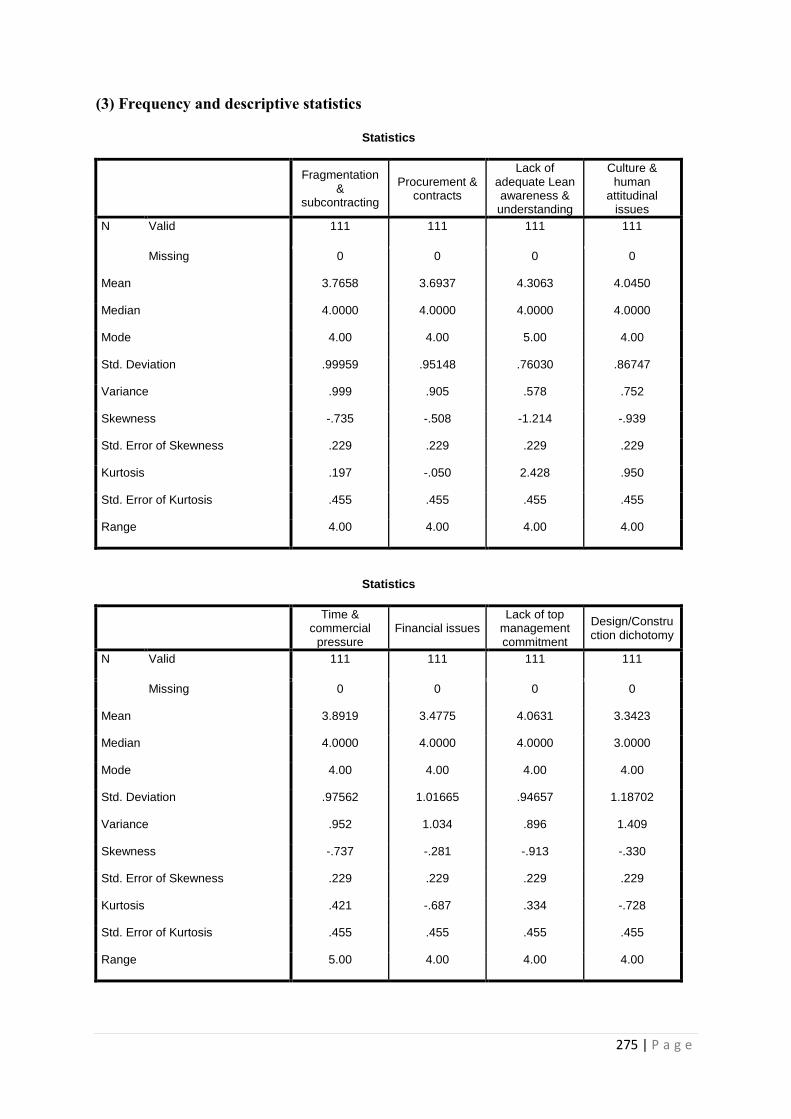
275 | P a g e
(3) Frequency and descriptive statistics
Statistics
Fragmentation
& subcontracting
Procurement & contracts
Lack of adequate Lean awareness & understanding
Culture & human
attitudinal issues
N Valid 111 111 111 111
Missing 0 0 0 0
Mean 3.7658 3.6937 4.3063 4.0450
Median 4.0000 4.0000 4.0000 4.0000
Mode 4.00 4.00 5.00 4.00
Std. Deviation .99959 .95148 .76030 .86747
Variance .999 .905 .578 .752
Skewness -.735 -.508 -1.214 -.939
Std. Error of Skewness .229 .229 .229 .229
Kurtosis .197 -.050 2.428 .950
Std. Error of Kurtosis .455 .455 .455 .455
Range 4.00 4.00 4.00 4.00
Statistics
Time &
commercial pressure
Financial issues Lack of top
management commitment
Design/Construction dichotomy
N Valid 111 111 111 111
Missing 0 0 0 0
Mean 3.8919 3.4775 4.0631 3.3423
Median 4.0000 4.0000 4.0000 3.0000
Mode 4.00 4.00 4.00 4.00
Std. Deviation .97562 1.01665 .94657 1.18702
Variance .952 1.034 .896 1.409
Skewness -.737 -.281 -.913 -.330
Std. Error of Skewness .229 .229 .229 .229
Kurtosis .421 -.687 .334 -.728
Std. Error of Kurtosis .455 .455 .455 .455
Range 5.00 4.00 4.00 4.00

276 | P a g e
Educational issues
Lack of process based
performance measurement
systems
N Valid 111 111
Missing 0 0
Mean 3.5856 3.5495
Median 4.0000 4.0000
Mode 4.00 4.00
Std. Deviation 1.03983 .98847
Variance 1.081 .977
Skewness -.727 -.600
Std. Error of Skewness .229 .229
Kurtosis .053 .072
Std. Error of Kurtosis .455 .455
Range 4.00 4.00
(4) Histograms
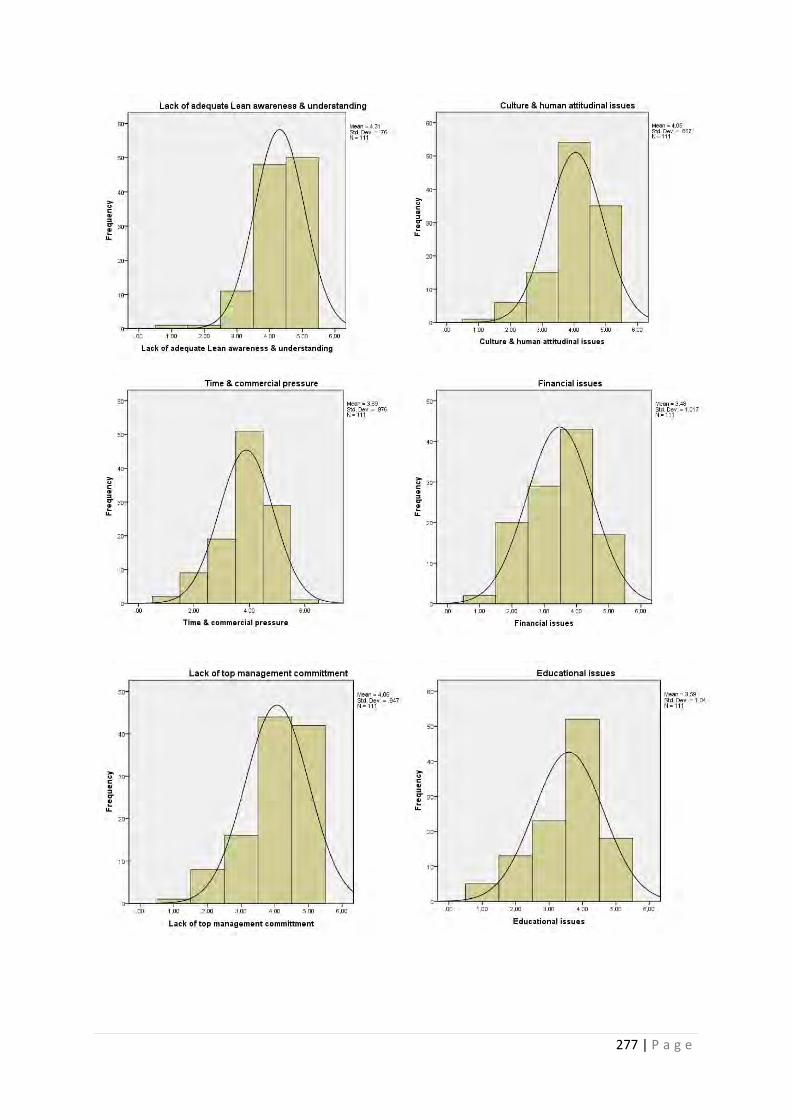
277 | P a g e

278 | P a g e
279 | P a g e
APPENDIX 14: FULL TRANSCRIPTS OF THE INTERVIEWS
A14.1 Semi Structured Interviews
Based on the outcomes of the questionnaire, particularly the identification of the significant
barriers to the implementation of LC, a number of semi-structured interviews were
conducted, in accordance with the procedures outlined in the research methodology chapter,
to help the author to investigate deeper and achieve the objective of proposing a strategy for
overcoming the barriers identified. All interviews were recorded after receiving written
permission from the interviewees, as it is good research practice especially in case of semi-
structured interviews (Thomas et al., 2005). All interviews were asked two main questions:
(1) to describe the nature of each of the three significant barriers identified (e.g. how it exists
and why); and (2) to propose a strategy or provide recommendations for overcoming these
barriers.
Note: The author faced some difficulties when carrying out the full transcript of the first
interview which was conducted through internet webcam on Skype program, due to internet
connection problems which affected the quality of the recorded sound. Therefore, there might
be a few/minor mistakes with a limited amount of words & sentences.
A14.1.1 Interviewee number 1
This interview was conducted through internet webcam on Skype program. The interviewee
is a Consultant/Author/Certified Professional Speaker in the construction industry, with more
than 30 years of experience, and holding a bachelors degree in civil engineering. The full
transcript is illustrated below.
Author: One question from the questionnaire asked participants to arrange barriers in order
of their influence. The top three barriers identified were lack of adequate lean awareness and
understanding, cultural barriers, and lack of top management commitment. This interview
will consist of two parts; the first part will focus on the top three barriers, their nature, and
280 | P a g e
how and why they occur. The second part will focus on the strategy to overcome these
problems. The principles of lean are simple so why is there an issue with understanding?
Interviewee: I think the problem is that people don’t understand what lean is; which is a
basic problem. We went through a process during the 70s, 80s and 90s, finding different ways
of restructuring companies, to become leaner and leaner and leaner. Re-structuring
companies meant getting rid of people. There was constant pressure to reduce the number of
people. This is what lean was conceived as, a way to get rid of people. But what Tioni
introduced into this concept, and I think this is absolutely critical, is that what they do is they
don’t eliminate people’s jobs when...say you and I are working on a project. Only one needs
to do it, so logic says one of us has to go. Tioni said that is ridiculous. If it’s not costing me
any more to have you do it by yourself, the second week I can go do something else and it’s
totally paid for because I’m not any worse off than I was yesterday. I’m only paying for two
people but now I get more work done. It’s about changing the mentality saying ok even if
we’re going to do something I don’t know how to do right now they can afford to have me
learn it. I can try to get invested in something new in the business because you’re paying for
it. Just because we’re doing two peoples jobs I’m not an extra burden. We would have had to
have hired someone else and put a cost on it. Now I’m no worse off. We reinvest that saving
in growth. And I think once companies demonstrate that kind of a mentality I think it can
change. This is part of the resistance. People feel it’s a threat to their jobs. Once they realise
it’s not lean gets embraced. So when you have a system that works people are happy, they
enjoy their job. It’s a matter of getting through this culture and education of explaining really
what it is. There’s a problem when people misunderstand it, not when they understand it. I
think this links to the second part about senior management.
Author: Is this due to fear? Fear of failure? Or just because they are not aware of the benefits
and don’t want to take any kind of risk?
Interviewee: Exactly. One of the other things we went through in the 60s, 70s, 80s was we
tried these new gimmicks and most didn’t work. Some weren’t well thought out, not accurate.
People didn’t report what did happen when they did get results. For example, a guy says I
painted my boat and the boat went up, but the boat went up because the water went up not
because he painted it. In business that happens, people do things and then the business takes
off; but it had no impact upon their business, it was because the economy took off so
281 | P a g e
everybody’s business took off. So they write a book on this and it has no impact. That’s part
of the problem. So what happens is we go through these fads or concepts. And so what
happens is people say why am I going to invest time and energy in this fad because in six
months there will be another one. What that does to a certain extent is it makes it self-
perpetuating. If nobody tries to implement the new ideas, they’re not going to be successful
and in six months they’ll try something else. So it perpetuates and we get this thing. This is
the other thing with lean; people don’t understand it will work. One of the things you need to
do is do small things in the beginning to get medium results. If you try to do big things that
will take five years to turn this thing around, people aren’t interested. But if we see medium
results tomorrow, this isn’t so bad. So I think it’s partly how we approach it so it goes back to
senior management. Senior management doesn’t like they’re committed, this is why it has to
be senior management preaching it day in day out. Then you realise they’re going to do this.
But if management doesn’t mention it and just says here you workers take care of this it says
nobody cares and why am I wasting my time; so it’s a big struggle.
Author: Yes. One of the participants commented that one of the problems is the traditional
skills-based background of construction workers. So the skills that the construction workforce
have are based on traditional skills, so this is a root problem .They are not innovative.
Interviewee: Right. The construction industry, historically, has employed people for brawn
and not for their brain. Just do what you’re told, this is the mentality. This goes through the
entire construction industry. Something that I’m writing a lot about now is the supply-chain;
which is the push and pull part of lean. I can never figure out how it applies to construction,
but the concept is that every project is a prototype and so what we need to do is bring the
team together, all the experts. How do we make it the most constructable? How do we get the
best results? We need all that expertise. Most engineers do not know how to build things,
they have an idea but they don’t have the techniques. For example, when I got out of college,
I am a civil engineer. I did surveying but when I showed up on the job I didn’t know how to
do it because I don’t know the practical applications because I knew how to do it but not
actually how to do it. In college they never teach you the practical part of it. You need the
experts out there every day understanding the problems. I’m reading an article about steel
fabrication, for example. When engineers do it they have all these crazy details. Whereas
when the steel manufacturers do it they standardise every connection as much as possible,
this reduces costs substantially because they know what to do and how to do it to make it
282 | P a g e
work. So the problem is we see, even in the professional part of the business, there is a lack
of mutual respect back and forward. That’s the key. We have to create mutual respect. We all
have different skills. I’m always telling people I can write a book on what I know about
construction, no problem; but I can write 10 books on what I don’t know. We all just have a
slither, a small slither on the industry. We have all these experts around us, but we have all
kinds of inefficiency and problems. The problem is this lack of respect. This is why we have
this resistance; until we resolve it we’re not going to solve the problem. And this is what lean
and some other approaches try to accentuate saying we have to collaborate. We need to
respect one another.
Author: A quick question about the supply chain. When I say supply chain assistance is an
important factor in lean construction, is it more about the main contractor assisting the
downstream or the sub-contractors and the suppliers helping the main contractor to achieve
sustainability?
Interviewee: I can break it into three pieces. The highest one starts with the design; this one
you can’t do without the owner’s permission. Tiesto agreed that he’s going to do a design
build, an approach that will bring all the trade experts together. They can identify issues with
materials, and deal with maintenance issues, not just constructability. If a guy is in the air-
conditioning business, he knows what works and what doesn’t. That’s the first one, but that
takes a mentality. We’re going to get everyone participating in the design. The second step,
all the contractors have it totally within their scope. Instead of me going out to 20 contractors
for the lowest price I go out to the guy I think is the most qualified and I sit with him and try
to work out how to lower his price. When we do this from project to project we’ll simplify
this process and learn from projects. So we build a relationship ongoing and it’s a two-way
street. He’s helping the general contractor to be more efficient, the guys helping the sub-
contractor to be more efficient and we’re limiting the waste and the mistakes which will
lower our costs and allows us to turn a lower bid. You have to know the qualifications; you
need to go to someone with the expertise so it’s a matter of matching up everybody. So you
have that process but the general contractor doesn’t have to go out and find 50 guys for the
lowest price, he needs to find the lowest real price and he does that by working with him. The
third one is really logistics; the logistics is managing the flow of the material. This gets back
to lean, the whole process. According to statistics, on an average construction job the supplies
of material that are going to be installed as part of the project are moved 4.5 times before
283 | P a g e
being installed. What’s with that? Manufacturing has got to the point just in time for delivery
so they don’t have to store it and so they only handle it once.
Construction needs to do the same thing. Construction has never done that because it has
always taken the attitude that it’s not my responsibility. We tend to be very small companies;
the average contractor only has 20 people. Then even when the companies get bigger they
don’t tend to do that. Project management teaches us to focus on our projects. One of my
colleagues brought up a thing. He said if you’re a major contractor in Sinsinaby, you may
have 10 projects going on at a time and may be getting 10 deliveries from Chicago each
week. If we worked as a company we could reduce it to five truck loads to save money. He
says you’re a small contractor so why not go to all the contractors in town and see what
deliveries are coming from Chicago that week. Schedule them all to come at the same time
and everyone will reduce their price. Statistics have found they can reduce the costs of a
project by up to 4%. That is significant, when you think that a sub-contractor makes about
2.5%. Yet, by focusing on logistics we can reduce costs by 4%. So that’s the three that I think
you can do. But it is a collaboration thing and takes everyone to work together.
Author: Ok, I’ll now ask two questions. First, in the UK we have qualifications called HNC
and HND, which are slightly lower than degrees. I noticed that holders of these qualifications
are more optimistic about lean compared to BSc and MSc students who are more pessimistic
about lean. I feel that this may be down to work experience and because lean is more about
processing. Maybe students leave universities substance thinking, focusing on final results
rather than the process? Is this a correct observation in your opinion?
Interviewee: I think you have hit on something critical. I have never seen a study like that
but I’ve had the experience without the study. The problem is that most of the kids that come
out of college have no construction experience; they have never worked with the trades. They
don’t understand the problems. They have got all the theory from the professors and the big
picture; you just do this. They often teach project management instead of lean in college so
that’s what they come out with and what they believe works. The other guys in the field, who
have taken courses and who have practical experience, see that this isn’t working and see the
problems. So when a guy talks about lean they see that it can make a difference. They need
that practical experience. They don’t get it. I think you need that field experience as a
balance. In the 70s, they took their engineers and put them in the field. The practical
284 | P a g e
applications that you learned were incredible. But too often now they make kids out of
college project managers. They have no experience, they don’t understand. So when kids
graduate from college they have got a lot of gaps, just because they don’t have any
experience. So this is what I think part of the problem. Just do it mentality. They look down
on the workers because they have a degree, and they’re taught this. The officers help
perpetuate that, telling them how smart they are. We see that in every industry.
Author: Ok. My next question is about the US Government; have they done anything to help
implement lean? Maybe we can learn from the experiences.
Interviewee: They haven’t done much. Too often, they are focused on this low-bid mentality.
You still have a conventional wisdom that we need competition and the only way to get that
is the low bid. And the low bid squelches a good part of that because it prevents the
collaboration. Lean doesn’t work. It works internally; you can improve your own efficiency.
But the real problem is not internal to any one trade, it’s between the trades. So I think no we
have done a very poor job. That’s why I keep writing and encouraging people to change. But
it’s a slow process as that’s the way they have been doing business for hundreds of years.
Author: Regarding the strategies, what about a certification scheme to make it obligatory for
all new workers/graduates to have a basic examination to demonstrate their awareness of
lean, like with health and safety?
Interviewee: That’s absolutely one of the things that should be done. That’s the problem;
what happens is people talk the buzz words but don’t really do it. There has to be some sort
of system. You need to make sure the person you’re hiring has the credentials and if the
credential’s meaningful and you’ve made the person learn it then he can do the job. If they
don’t have it and they say they can it gives the impetus a bad need, for example design build.
So you’re absolutely right, they need a certification program. You could have different levels,
because for example a foreman doesn’t need to be at the same level as someone that’s
running a project.
Author: Yes. One other question please; it’s about overcoming the lack of top management
commitment. People here need to have certain experience and qualifications to achieve a
chartered status; so why not include a condition concerning lean that he must have supervised
285 | P a g e
a certain amount of projects with lean, hold a specific certification or passed specific exams?
Here, you will encourage managers to take training programs about lean and I consider it
important to know about lean if you are a chartered engineer.
Interviewee: Yes, I agree with you. Part of the problem is that most people with degrees
don’t go back to school, that’s the statistic. So they don’t learn what lean is. I’ve read a dozen
books on the subject, but I’m the exception. So I think we have to have a process to force
people to do it and then they go I didn’t understand this and finally a light bulb goes off. If
everybody gets certified then that will become the norm, but it’s going to take some effort
because all the engineers are going to fight you but that’s not to say we don’t say it, try it and
don’t push it.
Author: How can I convince owners, especially those that don’t know about lean? What will
he gain if I tell him come have a lean certificate?
Interviewee: We have to show them. There is a concept called dominant proof; dominant
proof is evidence that when anyone looks at it they can agree on the same answer. How you
get dominant proof is by measuring. We need to measure performance, and when you start
measuring lean projects versus non-lean projects you will start to see the performance
difference. When you put that evidence in front of an owner he says I want to know more. So
we have to measure, but there are enough lean projects out there to start gathering data and
measuring. You need to have the data.
Author: Thank you for your time. Do you have any further comments before we end the
interview?
Interviewee: Owners want lower costs. I think there’s 30-40% waste in the system at least;
this has been documented. But it’s hard to get people to change; the only people we can
change are those looking for a solution, those with an open-mind. As we see more success,
more and more people will change. Then there are some that will never change. There are
two key points, which are better pre-planning and management of the downstream supply;
these are almost the same thing. It’s bringing that effort together; in other words we need to
put the time and effort in the front end to understand what we’re trying to do and bring all the
expertise. To expect the contractor to perform at high efficiency, we need to practice and

286 | P a g e
function as a team. That’s exactly what’s wrong with our industry; we have to change that
concept that if we’re going to compete at the highest level we need to practice and function as
a team, and the only way we’re going to achieve this is by applying these concepts. If you go
to this downstream mentality then you have an opportunity to work lean together between the
trades. If we do it over and over, it’s the next project that is going to benefit from the ideas
that you create on this project.
Author: That’s great. It’s been a very interesting interview. I have learned a lot, thank you
very much.
Interviewee: My pleasure. If I can be of any further assistance, feel free to give me a call;
I’m happy to work with you. I’d love to see you’re report when you finally finish it.
Author: Yes of course. Thank you, bye.
A14.1.2 Interviewee number 2
This interview was also conducted through internet webcam on Skype program. The
interviewee is a Productivity Manager/Lean facilitator in one of the leading contracting
companies in the UK (AAT is almost equal to £1000 Millions); with (10-20) years of
practical experience and holding a masters degree. The full transcript is provided below.
Author: The survey I conducted identified three major barriers: lack of adequate lean
awareness and understanding, human and cultural issues and lack of top management
commitment. I will ask you for your opinion on the nature of each of the barriers, starting
with lack of adequate lean awareness and understanding.
Interviewee: Practitioners do not understand the basic concepts. The problem is that people
see lean as tools rather than understanding its whole philosophy. Organisations which have
taken up the complete philosophy are implementing lean more successfully than those who
just focussed on the lean tools. Some companies say they are applying lean but they are not.
This is because they do not have a lean culture/attitude within their organisation and it is not
287 | P a g e
applied on a broad system-wide focus Also, people think that lean will increase the amount of
labour work which is not the case. By implementing lean they will improve the efficiency and
effectiveness of the production.
Author: What about human attitudes and cultural issues?
Interviewee: culture implementation takes a lot of time because it is a change of mind-sets,
behaviours and acts that you have adopted for a long time; and it gets resisted by humans by
nature - reluctant to change. Within the UK construction industry or environment in general,
there is an issue of human rights (e.g. you cannot discriminate, you do not need to restraint
culture), and some people think to certain extent that lean may have a negative effect on their
culture, which is not the case. Within an organisation, it will strengthen the relation between
employees; and between organisations and their supply chain. However if your supply chain
is not performing to your required standards you can change them. This is the message from
the client now, if we as a contractor and our supply chain do not show to the clients that we
are adopting a lean culture, we will not have work from them.
Author: That’s brilliant, so how and why is there a lack of commitment from top managers?
Interviewee: top management wants to see the complete aspects of the cost benefit ratios.
They want to see the benefits and the profits out of it, but they also have to understand that
lean has to be implemented completely not by parts. If you implement lean by parts, you may
gain benefits but you will never see the bigger picture. To understand the bigger picture, you
have to take up the philosophy and establish a lean culture within the organisation. They have
to focus on the philosophy and the culture rather than the tools. The problem is that the top
management wants to see tangible benefits, big profits, time savings or anything which could
enhance their relations with the clients, or an outstanding edge from the competitors. Another
important issue is that top managers usually ask: how much money could I save? The people
don’t understand that lean is not for cost cutting. Lean will not cut your cost but yes it will
save you money. There is two different ways of looking at things. If people say cost cuttings
they will focus totally on cost cutting and ignore the main benefits. The benefits are that they
will improve the flow of work, eliminate waste, improve productivity and improve the main
productive hours

288 | P a g e
Author: One of the participants of my survey mentioned that in large organisations, there is a
big gap between operational managements and top management. Do you agree?
Interviewee: I cannot generalise the case. However if there is a gap between operational
managements and top management; to fill that gap we have to show the senior board the
tangible benefits, in order to gain their interest.
Author: That is fine. Now, the second part of the interview will focus on the strategy to
overcome these problems. Could you provide me with some recommendations or proposed
ideas to overcome those three barriers we have just discussed?
Interviewee: There is a need to develop a training matrix in organisations for different levels
of understanding. With that training the basic message will be seen, but for example if you
give the training to the senior management, you will show them the cost benefits, middle
management you can show them that out of the lean procedures they can reduce time, cost,
and when you come to the bottom level (e.g. Juniors) you can show them that they could
increase their productivity and finish their tasks in fewer hours. Each of these levels should
understand and realise the benefits that they could gain from adopting lean. When you apply
a training agreement you will try to understand the individual level and their perspectives.
I also believe that the government needs to create a state of emergency. One of the reasons
health and safety is important is because it is law, so you have to do that. People are not very
committed to lean or quality because it is not a law and they can get off with that!
Author: Do you think that lean principles need to be introduced to the curriculum at
Universities and Colleagues to increase the awareness of Lean?
Interviewee: Absolutely, raising the awareness level right from academics at universities,
colleagues and institutes is essential, so when graduates join companies they already have at
least the basic levels of understanding and be more able to adopt with the procedures.
Author: Ok, I will tell you some comments I have received from other participants. I would
like your opinion on them. One said that there is a lack of publicity, particularly of successful
stories concerning lean. Do you agree?

289 | P a g e
Interviewee: Yes. A good solution is bringing the media and newspapers to highlight the
success stories of companies that implement lean successfully, to increase the awareness of
the public.
Author: Others highlighted the case of lack of incentives as a main barrier. Do you have any
comments on that issue?
Interviewee: Benefits and profits that companies gain from applying lean should also be
translated to the labour force or to anyone who contributed to achieving that profit. That will
bring all the people together and each of them will get benefit out of it. Incentives are
essential and don’t have to be in the form of money only; incentives could be in the form of
time-off, relaxation, working in a healthy environment, and even in the form of vouchers.
Some companies just start doing lean and ask the labours to do more and they are not getting
anything. That is a killer.
Author: Do you agree that benefits awarded should be based on the profitability of the
production rather than productivity rates?
Interviewee: I strongly agree. That is because although the productivity rate may remain the
same or even be slightly less (when applying lean), but as there is less waste it may be more
profitable. On the other side may be before they had a higher productivity rate but they had to
spend more time or waste more resources and thus reduce the profitability. ‘They have to see
the cost-benefit ratio’. To achieve this, companies need to establish cost and performance
indicators.
Author: Would you recommend organisations to hire external consultants/lean facilitators?
Interviewee: Yes. When companies start to decide going on the lean journey, they need to
have a steering group to take them to the right direction. They will need to hire an external
consultant to make them understand the basic principles for a certain time, or allocate a lean
facilitator/champion to educate the rest of the employees.

290 | P a g e
Author: Do you agree that procurement should be based on organisations’ lean initiatives
rather than the traditional approach of just selecting the lowest price?
Interviewee: If the Government pushes the agenda, clients will be encouraged to base the
selection of their supply chain on those who can demonstrate their lean attitude and lean
maturity. An example of this is the BAA, and the HALMAT produced by the HA. Similarly,
Network rail as a client and Cross rail as a client, should both follow the same approach. That
could be the best direction or route. However, even if the government does not push the
agenda, it could still be done still if the major clients in the UK such as the HA, BAA, Cross
Rail, Network Rail, etc. make a block and make it very clear to their supply chain that they
must demonstrate their Lean initiatives along with their career profile in order to win any
bids.
Author: As you mentioned earlier, health and safety was previously ignored, but since the
government made it a law it has become a priority. Now everyone who works on a site must
take a construction health and safety test. I proposed that in order to increase lean awareness,
a lean construction certification scheme should be implemented. This could cover the basics
and as with the health and safety test different levels of workers could take different levels of
exams. Do you agree with that?
Interviewee: The government is strongly recommended to establish a Lean Construction
Certification Scheme (LCCS), with the same idea of the CSCS, to provide practitioners with
required knowledge at different levels. This will help to break down the cultural issues, and
provide at least a basic level of awareness and understanding to Lean principles. It has been
noticed that Governmental reports such as (Latham’s and Egan’s report increased the
industries’ awareness to the importance of quality and productivity. A certification scheme
established by the government will definitely lead to a positive take up and a positive culture
change.
Another good idea is that professional institutions need to add LC to their objectives; which
means that every engineer needs to demonstrate a specific level of Awareness and
understating to lean principles as a condition for obtaining a chartered or incorporated status.
This will encourage practitioners to go for lean training programmes.
291 | P a g e
Author: Last question please. Do you agree that organisations need to device their own
metrics for evaluating performance, so that the lean could be successfully implemented?
Perhaps, creating something similar to the HALMAT, which suits their business needs?
Interviewee: Yes. Organisations need to Establish a lean measurement assessment tool to
evaluate the lean maturity levels of their supply chain such as that produced by the HA.
However, one concern about the HALMAT is that it is mainly based on a qualitative analysis
rather than a quantitative one. When it comes to measuring a culture, it is difficult to bring it
into numbers (quantify it). Thus, this issue needs to be carefully addressed. One proposed
solution is that companies may have to show from their previous projects what sort of cost
benefits have they saved and how they achieved that.
Author: OK, so finally I would like to ask if you are happy with the way the interview has
been conducted. Do you have any other comments?
Interviewee: Thank you, it was fine. You have already taken up a very brave step by taking
up a project at this level for an MSc study; and I wish you all the best.
A14.1.3 Interviewee number 3
This interview was conducted by telephone. The interviewee is a Quality/Business
Improvements Manager in a medium construction organisation (£100-1000 Millions); has 5-
10 years of experience and holding an NVQ degree. The full transcript is given below.
Author: One question from the questionnaire asked participants to arrange barriers in order
of their influence. The top three barriers identified were lack of adequate lean awareness and
understanding, cultural barriers and lack of top management commitment. So for the first
question, I want to your opinion about the nature of these barriers.
Interviewee: Cannot hear what is being said ...If they don’t explain what’s happening and
why it’s happening then generally that lack of knowledge turns off, if you know what I
mean?
292 | P a g e
Author: Yes, so is it more about using unsuitable methodologies or that they are not aware of
the basic principles, or is it both?
Interviewee: It can be both of them. In the construction industry now people have started to
acknowledge that lean is a good way to go but there are instances where they say that sounds
good, go and do it.
Author: Yes, go on and do it without adequate planning.
Interviewee: Exactly.
Author: So what kinds of cultural issues/barriers hinder the implementation of lean
construction?
Interviewee: The usual excuse is that this is the way we have always done it. Culturally,
people get settled in what they’re doing, no matter where they’re from. Change is seen as
adding more work.
Author: Someone told me that because of human rights laws in the UK that state that you
cannot restrain culture so some people due to lack of understanding feel that lean is an
approach that goes against their human rights. For example, if they don’t do well they may
get fired. Do you understand?
Interviewee: Yes, I understand what they’re saying. But it’s not that easy as that now. I
mean, firing is always the last resort. You deal with the process, make sure that the process is
correct for business, monitor and tweak it; if someone is then still not performing you then
follow the correct procedures and you can get rid of them.
Author: But you are allowed to do that with your supply chain if they’re not meeting your
standards? That’s nothing to do with human rights, it’s just business right?
Interviewee: Yes, with your supply chain it’s completely different. You sign a contract, if
it’s a good contract it will outline expectations, targets and objectives that will get monitored.
293 | P a g e
If they’re really under-performing then you can terminate the contract and pass it to someone
else.
Author: Last question about lack of top management commitment, how does that happen?
Do they agree with the idea but not follow it, or do they not agree with it from the beginning?
Interviewee: It depends where your top management starts.
Author: Sorry, does it always mean the senior board or just the managers above you?
Interviewee: It’s an interesting one. It depends on the set-up of the company. I would say the
managers above me. If my company was a big company, with lots of smaller companies
running within it and someone at the top decides that that’s what you’re going to do but the
smaller companies don’t then that’s where that can happen.
Author: Fine, ok. So now the second question concerns a strategy for overcoming these
barriers. So firstly, how can we overcome the lack of adequate lean understanding and
awareness?
Interviewee: Well, it’s about information isn’t it and seeing is believing. You have to talk to
your people and make sure that they’re involved. I’m very much a fan of 5S/SMED.
Author: Can we talk about 5S quickly please as all I know from literature is that it can be
used for organising a warehouse but elsewhere I have read that it is not only limited to that,
that’s just how you start organising your company or organisation. So what is meant by 5S?
Interviewee: 5S is derived from the production manufacturing. So the first S is system sort,
where you sieve through your stuff and see what you want to keep. The second one is
straightening so you put it in, in an organised manner. The third S is sweep and shine, so you
clean it up and make it presentable. The fourth one is standardise so what you do should be
the same everywhere. The last one is sustain, so you keep it going and improve it. A lot of
examples are around warehouses and depots but you can apply those five principles to
anything you do.

294 | P a g e
Author: Ok. So what do you think about training, whether formal training or having a
training matrix for different levels? Do you think a formal training agreement is necessary for
lean?
Interviewee: Absolutely. If you look at the top-performing companies, they have it built in.
So if someone joins they will be trained in the basic lean principles. On the other hand, I
would say that it could be part of the induction.
Author: Yes, but does that mean that lean has to already be part of the strategy used by the
company?
Interviewee: It depends what level you want to go in at. If I employed someone to work for
me I would spend a week giving them an induction and include my lean stuff in with it. If it
was offsite then it’s slightly different; here we go back to the 5S stuff, where you can
practically do it. So ideally you would have a week for your employees to learn the principles
and then onsite they should be doing it.
Author: Ok. Also, can the government help to disseminate lean principles amongst the
construction industry?
Interviewee: It comes down to money. If they threw a bit more money and regulations on it
maybe yes. In a business you want to make profit.
Author: Yes. One individual told me that because lean isn’t a law people think that they can
get out of it. Because health and safety became a law, it is a priority for designers for
example. Here I thought as the government made a health and safety certification scheme,
maybe they could do a lean construction certification scheme?
Interviewee: In the last company I worked for we actually rolled out a Level 2 NVQ in Lean
Business Improvement. It went through the basics of ... and we had to find something that
needed to be improved and that’s what we got marked on. It was a massive success. It was
spread across 60 people, including people from our business and from the client we worked
for. It made us work together, and it was really good. The only issue was the amount of time
it consumed, but the benefit we got was massive.
295 | P a g e
Author: Ok, so yes. I’ll now move on to the second barrier. I think we can overcome cultural
issues by education and training, for example rolling out NVQs like you just mentioned.
Interviewee: Yes.
Author: Lack of top managing commitment. I was talking to a manager from another
company recently; he told me that the middle management has to show their managers the
cost benefit ratio from applying lean. But how can middle management do that if they don’t
have the resources and tools to help them do that?
Interviewee: They can’t effectively. It all depends on the manager. It’s generally those who
are organised and methodical who meet their targets and budgets. Then you get the other
guys who just go out and do what they need to do to get by but can hit their targets. It can be
manipulated as well. But you’re quite right, how do they do that if they don’t know how to
apply it. The answer is they can’t. It needs to be directed from the top down and filter down
to the bottom. Once it hits the bottom it then needs to rebound back up.
Author: Yes. I’ll now give you some statements and I want your comments on them. What
about the highway agency, they now encourage their supply chains to go on the lean journey
and have created their own assessment tool to ensure all their suppliers have lean maturity.
Do you think all major clients in the UK can follow the same approach and encourage all
companies to go lean in order to win bids? This may also push the agenda of the government.
Interviewee: Absolutely. I mean the highway agency works for the government. We work
for the highways agency. So it’s that filtering down. The HA supply chain is massive.
Author: What made the HA take such a big step?
Interviewee: Basically it’s because they realised they were getting ripped off. They were
overpaying for lots of stuff. The other key driver was because there isn’t much money around
anymore and the government is tightening their purse.
Author: So what has lean got to do with this?
296 | P a g e
Interviewee: Lean will make their review how they operate. It comes down to processes,
making sure that they work for them and the people that are feeding into them. It will also
look into how you get paid and the way it’s being carried out. So it’s a just tool to do that in a
methodical and effective way.
Author: Ok. About the HALMAT, the highway lean maturity assessment tool. I have been
told that it is based on more qualitative analysis, not numbers. So it may not be completely
fair. For example, someone may visit your organisation and score your staff following an
interview. The score he gives will be more based on his own judgement.
Interviewee: I think qualitative has kicked in now because the highway agency is interested
in how much it’s going to cost and how long can you guarantee it’s going to last. So the
reason they’re doing that is because they’re focusing on the long-term rather than short-term.
Author: Ok, if a company wants to start on the lean journey do they need to employ an
external consultant?
Interviewee: I believe they do. I learned what I know from an external consultant agency. If
you don’t it’s down to interpretation.
Author: Is it for a certain amount of time, until one of the team leaders picks up the ideas and
take over as team facilitator?
Interviewee: Yes, absolutely. We had a consultant company in for six months; it cost a lot of
money, but the benefits were great. We did nine weeks of rolling out across the whole
workforce, about 150 people, and from that about six people were identified to be lean
champions. So we had extended training; we shadowed the consultant agency through
another business. It was all based around practical training. One week in a classroom and five
weeks practical training.
Author: Are they that expensive? How can small companies afford them?
297 | P a g e
Interviewee: It’s about how long you have them. They are expensive but if you embrace it
you’ll get your return on it in the next six months. Small organisations should not worry so
much about financial problems as they will need an external consultant for less time than
large organisations because they have fewer employees
Author: What about showing lean awareness in order to gain chartered or incorporated status
in order. This may encourage managers to attend lean training seminars and programmes.
Interviewee: I personally agree with that. But you’ll be hard pushed to find a majority who
agree with that. One of the comments I always get is we are doing it in the first place, but
obviously people aren’t because if they were we wouldn’t be embarking on a lean journey.
But I think that idea is good but you’d have to be quite specific as to who would do it.
Author: Ok. One of the participants gave me a good example. Health and safety was
previously ignored, but since the government made it a law it has become a priority. Now
everyone who works on a site must take a construction health and safety test. I proposed that
in order to increase lean awareness, a lean construction certification scheme should be
implemented. This could cover the basics and as with the health and safety test different
levels of workers could take different levels of exams. Do you agree with that?
Interviewee: Yes, a certification scheme would help to increase the level of awareness. I also
do recommend NVQ lean courses.
Author: Thank you very much, that was great.
Interviewee: No worries, thanks very much. If you need anything else give me a shout.
Author: Thank you, bye.
A14.1.4 Interviewee number 4
This was a face to face interview. The interviewee is an Architectural Designer (recent
junior) in a small organisation (£1-10 Millions); holding a masters degree and starting
recently a doctorate study. The full transcript is provided below.
298 | P a g e
Author: The survey I conducted identified three major barriers: lack of adequate lean
awareness and understanding, human and cultural issues and lack of top management
commitment. I will ask you for your opinion on the nature of each of the barriers, starting
with lack of adequate lean awareness and understanding.
Interviewee: I have done a similar previous research on the application of lean philosophy to
Architectural firms and the aim was to find out the understanding of lean and if people are
aware of it. I broke down the lean tools and techniques using simple words, for example I
asked companies if they used 3D AutoCAD. Many companies did. What they didn’t realise
was that that is a lean tool. That is just an example. My questionnaire actually asked them if
they knew about lean construction institute and the term lean, and many of them didn’t. But
the next question broke down lean, putting it in simple terms and many of them answered
yes. So I think people are using lean, but without realising. So the awareness isn’t there, and
therefore there is a need for them to have that appreciation of lean. Even when I started my
research, my main aim was to improve the process efficiency and at that point I didn’t know
anything about lean. I went and did some research and was not able to link lean with what I
wanted to achieve, which was lean efficiency in the office. So I think it is just a term that’s
out there that not many people know.
Author: Ok. So what about human and cultural issues? How does that act as a barrier?
Interviewee: Yes, ok. I did my MSc thesis and came back to the office very keen to
implement lean tools and techniques, but the office was very resistant to change. People get
very used to the way they do things and have been very reluctant to accept change. For
example, I have proposed that they use Revit instead of 2D AutoCAD but they are not ready
to change.
Author: Ok, what about lack of top management commitment?
Interviewee: Yes, I think that is also very important because in the present climate with the
recession top management is not interested in investing. But what they don’t realise is that it
is a long-term investment but they think for right now it is a waste of time. Obviously, if the
management is not involved it’s going to be hard to get the people underneath involved. So
299 | P a g e
management need to take the initiative and get involved, and then filter it down to the staff to
let them know yes this needs to be done and then probably that could help to remove the
barrier.
Author: Ok, so is lack of top management commitment related to understanding? Perhaps
they are not committed due to lack of understanding? Or are there other reasons, for example
cultural issues? What do you think is the main reason?
Interviewee: In my personal opinion, I don’t think they’re ready to invest their money at this
moment in time.
Author: So now, the interview focuses on proposing a strategy for overcoming these
barriers.
Interviewee: Ok. I have been doing a bit of research and I think, rather than picking up lean
tools and techniques and saying let’s apply them, what needs to be done is to have group
meetings. Management should be involved as well, so the team can understand the process
and work out how to improve it. It will allow the team to come up with a combined strategy
to overcome the issues and will allow everyone to get involved.
Author: Ok, I will tell you some comments I have received from other participants. I would
like your opinion on them. One said that there is a lack of publicity, particularly of successful
stories concerning lean. Do you agree?
Interviewee: Yes, I don’t think that it is well published because I have only come across it
because I’m interested in the topic. If I hadn’t been I don’t think I would have even known
what lean was.
Author: Ok. Another participant suggested that clients should be encouraged to select
contractors and designers who engage in lean practices, using a set of criteria to help them.
The Highway Agency has done this. Their supply chain has to be involved in lean and they
do a survey on the companies that work with them based on their application of lean. Some
people think this a good idea and with the Highway Agency being a governmental
organisation this may influence companies to go lean. Do you agree or are you against
forcing companies?
300 | P a g e
Interviewee: Even the government is saying that by 2016 all design companies should be
using BIM, which will force them to use lean. I think that this is good, because left to them
they wouldn’t do it.
Author: Ok. Do you think the government can make the real difference to help implement
lean?
Interviewee: Yes, they are trying to achieve this zero waste target which has a deadline. The
only way to achieve this is by implementing lean tools and techniques because lean is all
about minimising waste.
Author: Ok. One of the participants gave me a good example. Health and safety was
previously ignored, but since the government made it a law it has become a priority. Now
everyone who works on a site must take a construction health and safety test. I proposed that
in order to increase lean awareness, a lean construction certification scheme should be
implemented. This could cover the basics and as with the health and safety test different
levels of workers could take different levels of exams. Do you agree with that?
Interviewee: There are already some certifications for lean, for example with the black belts.
Author: But I think that that type of certification you just mentioned focuses more on
methodologies, rather than basic awareness. So what would your opinion be of my
suggestion?
Interviewee: I’m not sure. I wouldn’t say no though, so I’d say I’m neutral.
Author: Ok. Do you have anything else to add to the interview?
Interviewee: Ok, from my own understanding of lean, small companies aren’t really
interested. But I did a bit of research, and noticed that big companies and contractors are
investing into lean. There is in fact a PhD proposal going on about optimising process energy
and carbon efficiency which is being sponsored by a construction company. So they are
interested in finding out what tools and techniques can be used, but at this point they
301 | P a g e
probably don’t have lean in mind. But this can be achieved using lean, which they may not be
aware of.
Author: Ok, so last question. How to diffuse lean and increase awareness across the
construction industry?
Interviewee: I am a member of CIOB and when I go for their meetings they always talk
about Constructing Excellence; which does a lot with lean. Apart from that I don’t hear much
about them. So I think there is a need to increase awareness.
Author: So you think professional institutions should organise occasional seminars on lean
for their members to increase their awareness?
Interviewee: Yes.
Author: Ok, great. Thank you.
Interviewee: You’re welcome
Copyright © 2022 FDOKUMEN