A Statistical Test for Host-Parasite Coevolution - Oxford ...
18
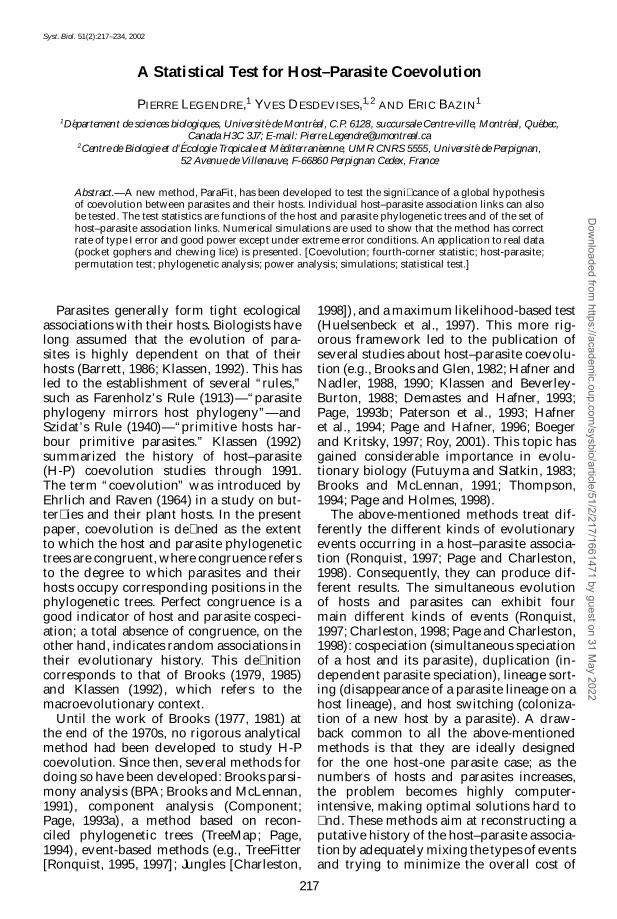
Syst. Biol. 51(2):217–234, 2002 A Statistical Test for Host–Parasite Coevolution PIERRE LEGENDRE, 1 YVES DESDEVISES , 1, 2 AND ERIC B AZIN 1 1 D´ epartement de sciences biologiques, Universit´ e de Montr´ eal, C.P. 6128, succursale Centre-ville, Montr´ eal, Qu´ ebec, Canada H3C 3J7; E-mail: [email protected] 2 Centre de Biologie et d’ ´ Ecologie Tropicale et M´ editerran´ eenne, UMR CNRS 5555, Universit´ e de Perpignan, 52 Avenue de Villeneuve, F-66860 Perpignan Cedex, France Abstract.—A new method, ParaFit, has been developed to test the signi cance of a global hypothesis of coevolution between parasites and their hosts. Individual host–parasite association links can also be tested. The test statistics are functions of the host and parasite phylogenetic trees and of the set of host–parasite association links. Numerical simulations are used to show that the method has correct rate of type I error and good power except under extreme error conditions. An applicatio n to real data (pocket gophers and chewing lice) is presented. [Coevolution; fourth-corner statistic; host-parasite; permutation test; phylogenetic analysis; power analysis; simulations; statistical test.] Parasites generally form tight ecological associations with their hosts. Biologists have long assumed that the evolution of para- sites is highly dependent on that of their hosts (Barrett, 1986; Klassen, 1992). This has led to the establishment of several “rules,” such as Farenholz’s Rule (1913)—“parasite phylogeny mirrors host phylogeny”—and Szidat’s Rule (1940)—“primitive hosts har- bour primitive parasites.” Klassen (1992) summarized the history of host–parasite (H-P) coevolution studies through 1991. The term “coevolution” was introduced by Ehrlich and Raven (1964) in a study on but- ter ies and their plant hosts. In the present paper, coevolution is de ned as the extent to which the host and parasite phylogenetic trees are congruent, where congruence refers to the degree to which parasites and their hosts occupy corresponding positions in the phylogenetic trees. Perfect congruence is a good indicator of host and parasite cospeci- ation; a total absence of congruence, on the other hand, indicates random associations in their evolutionary history. This de nition corresponds to that of Brooks (1979, 1985) and Klassen (1992), which refers to the macroevolutionary context. Until the work of Brooks (1977, 1981) at the end of the 1970s, no rigorous analytical method had been developed to study H-P coevolution. Since then, several methods for doing so have been developed: Brooks parsi- mony analysis (BPA; Brooks and McLennan, 1991), component analysis (Component; Page, 1993a), a method based on recon- ciled phylogenetic trees (TreeMap; Page, 1994), event-based methods (e.g., TreeFitter [Ronquist, 1995, 1997]; Jungles [Charleston, 1998]), and a maximum likelihood-based test (Huelsenbeck et al., 1997). This more rig- orous framework led to the publication of several studies about host–parasite coevolu- tion (e.g., Brooks and Glen, 1982; Hafner and Nadler, 1988, 1990; Klassen and Beverley- Burton, 1988; Demastes and Hafner, 1993; Page, 1993b; Paterson et al., 1993; Hafner et al., 1994; Page and Hafner, 1996; Boeger and Kritsky, 1997; Roy, 2001). This topic has gained considerable importance in evolu- tionary biology (Futuyma and Slatkin, 1983; Brooks and McLennan, 1991; Thompson, 1994; Page and Holmes, 1998). The above-mentioned methods treat dif- ferently the different kinds of evolutionary events occurring in a host–parasite associa- tion (Ronquist, 1997; Page and Charleston, 1998). Consequently, they can produce dif- ferent results. The simultaneous evolution of hosts and parasites can exhibit four main different kinds of events (Ronquist, 1997; Charleston, 1998; Page and Charleston, 1998): cospeciation (simultaneous speciation of a host and its parasite), duplication (in- dependent parasite speciation), lineage sort- ing (disappearance of a parasite lineage on a host lineage), and host switching (coloniza- tion of a new host by a parasite). A draw- back common to all the above-mentioned methods is that they are ideally designed for the one host-one parasite case; as the numbers of hosts and parasites increases, the problem becomes highly computer- intensive, making optimal solutions hard to nd. These methods aim at reconstructing a putative history of the host–parasite associa- tion by adequately mixing the types of events and trying to minimize the overall cost of 217 Downloaded from https://academic.oup.com/sysbio/article/51/2/217/1661471 by guest on 31 May 2022
-
Upload
khangminh22 -
Category
Documents
-
view
0 -
download
0
Transcript of A Statistical Test for Host-Parasite Coevolution - Oxford ...
Syst. Biol. 51(2):217–234, 2002
A Statistical Test for Host–Parasite Coevolution
PIERRE LEGENDRE,1 YVES DESDEVISES,1,2 AND ERIC BAZIN1
1Departement de sciences biologiques, Universite de Montreal, C.P. 6128, succursale Centre-ville, Montreal, Quebec,Canada H3C 3J7; E-mail: [email protected]
2Centre de Biologie et d’Ecologie Tropicale et Mediterraneenne, UMR CNRS 5555, Universite de Perpignan,52 Avenue de Villeneuve, F-66860 Perpignan Cedex, France
Abstract.—A new method, ParaFit, has been developed to test the signi�cance of a global hypothesisof coevolution between parasites and their hosts. Individual host–parasite association links can alsobe tested. The test statistics are functions of the host and parasite phylogenetic trees and of the set ofhost–parasite association links. Numerical simulations are used to show that the method has correctrate of type I error and good power except under extreme error conditions. An application to real data(pocket gophers and chewing lice) is presented. [Coevolution; fourth-corner statistic; host-parasite;permutation test; phylogenetic analysis; power analysis; simulations; statistical test.]
Parasites generally form tight ecologicalassociations with their hosts. Biologists havelong assumed that the evolution of para-sites is highly dependent on that of theirhosts (Barrett, 1986; Klassen, 1992). This hasled to the establishment of several “rules,”such as Farenholz’s Rule (1913)—“parasitephylogeny mirrors host phylogeny”—andSzidat’s Rule (1940)—“primitive hosts har-bour primitive parasites.” Klassen (1992)summarized the history of host–parasite(H-P) coevolution studies through 1991.The term “coevolution” was introduced byEhrlich and Raven (1964) in a study on but-ter�ies and their plant hosts. In the presentpaper, coevolution is de�ned as the extentto which the host and parasite phylogenetictrees are congruent, where congruence refersto the degree to which parasites and theirhosts occupy corresponding positions in thephylogenetic trees. Perfect congruence is agood indicator of host and parasite cospeci-ation; a total absence of congruence, on theother hand, indicates random associations intheir evolutionary history. This de�nitioncorresponds to that of Brooks (1979, 1985)and Klassen (1992), which refers to themacroevolutionary context.
Until the work of Brooks (1977, 1981) atthe end of the 1970s, no rigorous analyticalmethod had been developed to study H-Pcoevolution. Since then, several methods fordoing so have been developed: Brooks parsi-mony analysis (BPA; Brooks and McLennan,1991), component analysis (Component;Page, 1993a), a method based on recon-ciled phylogenetic trees (TreeMap; Page,1994), event-based methods (e.g., TreeFitter[Ronquist, 1995, 1997]; Jungles [Charleston,
1998]), and a maximum likelihood-based test(Huelsenbeck et al., 1997). This more rig-orous framework led to the publication ofseveral studies about host–parasite coevolu-tion (e.g., Brooks and Glen, 1982; Hafner andNadler, 1988, 1990; Klassen and Beverley-Burton, 1988; Demastes and Hafner, 1993;Page, 1993b; Paterson et al., 1993; Hafneret al., 1994; Page and Hafner, 1996; Boegerand Kritsky, 1997; Roy, 2001). This topic hasgained considerable importance in evolu-tionary biology (Futuyma and Slatkin, 1983;Brooks and McLennan, 1991; Thompson,1994; Page and Holmes, 1998).
The above-mentioned methods treat dif-ferently the different kinds of evolutionaryevents occurring in a host–parasite associa-tion (Ronquist, 1997; Page and Charleston,1998). Consequently, they can produce dif-ferent results. The simultaneous evolutionof hosts and parasites can exhibit fourmain different kinds of events (Ronquist,1997; Charleston, 1998; Page and Charleston,1998): cospeciation (simultaneous speciationof a host and its parasite), duplication (in-dependent parasite speciation), lineage sort-ing (disappearance of a parasite lineage on ahost lineage), and host switching (coloniza-tion of a new host by a parasite). A draw-back common to all the above-mentionedmethods is that they are ideally designedfor the one host-one parasite case; as thenumbers of hosts and parasites increases,the problem becomes highly computer-intensive, making optimal solutions hard to�nd. These methods aim at reconstructing aputative history of the host–parasite associa-tion by adequately mixing the types of eventsand trying to minimize the overall cost of
217
Dow
nloaded from https://academ
ic.oup.com/sysbio/article/51/2/217/1661471 by guest on 31 M
ay 2022

218 SYSTEMATIC BIOLOGY VOL. 51
the estimated evolutionary scenario. They at-tempt to answer the question, What is themost probable coevolutionary history of thehost–parasite association, given the costs ofthe different events?
PRINCIPLE OF THE TEST
In the present paper, we want to know ifthe data agree with a model of coevolutionof the hosts and parasites. The correspond-ing null hypothesis (H0) is that the evolutionof the two groups, as revealed by the twophylogenetic trees and the set of H-P associa-tion links, has been independent, which is thesame as saying that one is random with re-spect to the other. Strict coevolution requirestwo conditions to be ful�lled:
1. Ideally, the “true phylogenies” of the hostsand parasites should be the same. In ec-toparasites, for instance, the similaritymay be attributable to the geographic sep-aration of the host lineages, which leadsto allopatric speciation of the hosts andparasites (e.g., Barker, 1994; Hafner et al.,1994). These phylogenies are known, how-ever, only by the estimates that have beenworked out by researchers; these estimatesmay be imperfect.
2. The hosts and parasites located in cor-responding positions of their respectivetrees must be associated (linked).
Ideally, there should be a one-to-one re-lationship between the hosts and parasites,but the existence of several parasites per hostor several hosts per parasite does not ruleout a strict pattern of coevolution generated,for example, by parasite intrahost speciation,or by host speciation not followed by para-site speciation (called “parasite inertia” byPaterson and Banks, 2001). In all cases, eachH-P link must be assessed separately for its �tto the coevolution hypothesis, given the un-certainties of the estimates of the two phylo-genetic trees and the H-P association matrix.
Coevolution can be tested by the methodwe describe here, focusing on the structure ofthe two trees and the matrix of host–parasitelinks. The global null hypothesis is that evo-lution of the hosts and parasites has been in-dependent. One can also consider hypothe-ses about individual H-P links to estimatethe contribution of each link to the overallrelationship.
DESCRIPTION OF THE PARAFIT TESTSTATISTICS
ParaFit Statistic for the Global Testof Host–Parasite Coevolution
Statistically assessing a hypothesis of H-Pcoevolution requires combining three typesof information that are jointly necessary todescribe the situation: the phylogeny of theparasites, the phylogeny of the hosts, and theobserved H-P associations (Fig. 1). A phy-logeny can be described by a matrix of patris-tic distances among the species along the tree(Lapointe and Legendre, 1992). These in turncan be transformed into a matrix of principalcoordinates (Gower, 1966; principal coordi-nate analysis is also described in textbooksof biological multivariate statistics, e.g.,Legendre and Legendre, 1998) having n rowsand at most n ¡ 1 columns. If only the treetopology is to be used, without considerationof the differences in branch lengths, one maycode the tree with branch lengths of 1 beforecomputing the patristic distance matrix. Ma-trices B and C in Figure 1 were so obtainedand respectively represent the phylogeny ofthe parasites and that of the hosts. MatrixA represents the H-P associations: With the
FIGURE 1. The three elements of the H-P coevolutionproblem can be translated into rectangular data matricesA, B, and C. See text.
Dow
nloaded from https://academ
ic.oup.com/sysbio/article/51/2/217/1661471 by guest on 31 M
ay 2022
2002 LEGENDRE ET AL.—HOST–PARASITE COEVOLUTION 219
parasites in rows and the hosts in columns,a 1 is written where a parasite has been em-pirically found to be associated to a host and0’s are used elsewhere.
If the reconstructed phylogeny for eitherthe hosts or the parasites, or both, is un-certain (e.g., poorly resolved phylogeny oruncertainty among several almost equiva-lent trees), one can use, instead of patris-tic distances, a matrix of phylogenetic dis-tances computed directly from the raw data(morphology, DNA sequences, and so forth).Matrix B or C can be derived from that matrixby using principal coordinate analysis. Be-cause distances do not necessarily obey thefour-point condition (Buneman, 1974), theyare more remote from the “true tree” than anestimated phylogeny would be and thus maybe considered to represent a more noisy formof information; however, this does not inval-idate the use of the corresponding principalcoordinates for testing a hypothesis of H-Pcoevolution.
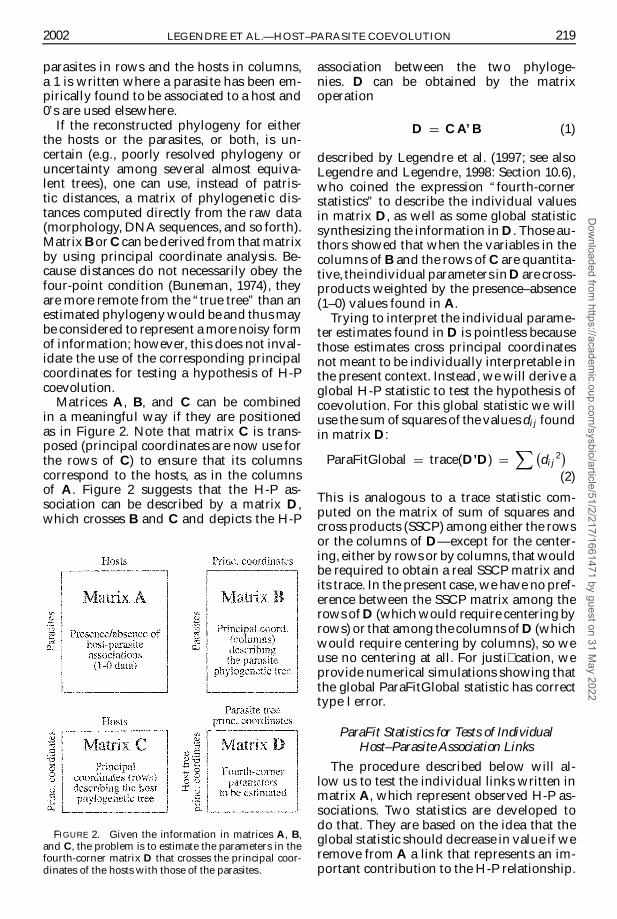
Matrices A, B, and C can be combinedin a meaningful way if they are positionedas in Figure 2. Note that matrix C is trans-posed (principal coordinates are now use forthe rows of C) to ensure that its columnscorrespond to the hosts, as in the columnsof A. Figure 2 suggests that the H-P as-sociation can be described by a matrix D,which crosses B and C and depicts the H-P
FIGURE 2. Given the information in matrices A, B,and C, the problem is to estimate the parameters in thefourth-corner matrix D that crosses the principal coor-dinates of the hosts with those of the parasites.
association between the two phyloge-nies. D can be obtained by the matrixoperation
D D C A’ B (1)
described by Legendre et al. (1997; see alsoLegendre and Legendre, 1998: Section 10.6),who coined the expression “fourth-cornerstatistics” to describe the individual valuesin matrix D, as well as some global statisticsynthesizing the information in D. Those au-thors showed that when the variables in thecolumns of B and the rows of C are quantita-tive, the individual parameters in D are cross-products weighted by the presence–absence(1–0) values found in A.
Trying to interpret the individual parame-ter estimates found in D is pointless becausethose estimates cross principal coordinatesnot meant to be individually interpretable inthe present context. Instead, we will derive aglobal H-P statistic to test the hypothesis ofcoevolution. For this global statistic we willuse the sum of squares of the values di j foundin matrix D:
ParaFitGlobal D trace(D’D) DX ¡
di j2¢
(2)
This is analogous to a trace statistic com-puted on the matrix of sum of squares andcross products (SSCP) among either the rowsor the columns of D—except for the center-ing, either by rows or by columns, that wouldbe required to obtain a real SSCP matrix andits trace. In the present case, we have no pref-erence between the SSCP matrix among therows of D (which would require centering byrows) or that among the columns of D (whichwould require centering by columns), so weuse no centering at all. For justi�cation, weprovide numerical simulations showing thatthe global ParaFitGlobal statistic has correcttype I error.
ParaFit Statistics for Tests of IndividualHost–Parasite Association Links
The procedure described below will al-low us to test the individual links written inmatrix A, which represent observed H-P as-sociations. Two statistics are developed todo that. They are based on the idea that theglobal statistic should decrease in value if weremove from A a link that represents an im-portant contribution to the H-P relationship.
Dow
nloaded from https://academ
ic.oup.com/sysbio/article/51/2/217/1661471 by guest on 31 M
ay 2022
220 SYSTEMATIC BIOLOGY VOL. 51
For the test, consider the H-P link k frommatrix A. If we replace the value 1 that rep-resents this link in matrix A with a 0 (nolink), we obtain a new matrix A(k). We nowcompute
trace(k) DX ¡
di j2¢ (3)
where the di j values now are those result-ing from theproductD D C A(k)0B. Using thetrace statistic from Eq. 2, that we call “trace,”we obtain with the following equation a �rsttest statistic for an individual link k:
ParaFitLink1(k) D trace ¡ trace(k) (4)
This formula measures the contribution oflink k to the global trace statistic.
The second statistic is constructed similarto a partial F -statistic (see, for instance, Sokaland Rohlf, 1995: Eq. 16.14) that would havelost its degrees of freedom in the numera-tor and denominator. This loss is of no con-sequence in permutation testing because thereference and permuted values of the statis-tic are affected in the same way by a con-stant multiplicative term, so that the orderingof the reference and permuted values (>, D,or <) is not changed by eliminating the de-grees of freedom. The numerator of the statis-tic is [trace – trace(k)] from Eq. 4. The de-nominator is analogous to a residual sum ofsquares. To construct the denominator, weneed a measure of the maximum trace valuethat can occur in D. The maximum possi-ble value occurs when the hosts and parasitephylogenetic trees are fully congruent—a rel-evant reference situation to test a hypothesisof coevolution. In that case, it can be shownthat the trace of D is equal to the sum ofsquares of the eigenvalues of the principalcoordinates found in matrix B or matrix C.In principal coordinate analysis, the eigen-values measure the variances of the princi-pal coordinates (Gower, 1966; Legendre andLegendre, 1998). In most empirical situa-tions, the estimates of the two phylogenetictrees will not be exactly alike, so we willactually use:
TraceMax
D max(sum of squared eigenvalues of B,
sum of squared eigenvalues of C) (5)
as our estimate of maximum trace value.
The second test statistic that we arepropos-ing for an individual link k is thus:
ParaFitLink2(k) D (trace ¡ trace(k))=
(TraceMax ¡ trace) (6)
This statistic cannot be used when the hostand parasite phylogenetic trees are identicalbecause, in that situation, the denominator ofEq. 6 is 0. This situation may happen in sim-ulation work but should rarely occur whenanalyzing empirical data.
On occasions, trace(k) may happen to beslightly larger than trace. This is of no conse-quence because it indicates a situation wherethe H-P relationship is stronger withoutlink k than with it. In other words, link k doesnot increase the global H-P relationship andthus is not indicative of H-P coevolution. Thetest of signi�cance (next section) will never�nd such a link signi�cant—which is thecorrect answer.
TESTING PROCEDURES
Novel statistics, such as described inEqs. 2, 4, and 6, may be tested for signi�canceby using the method of permutations, alsocalled randomization, which is now widelyused in biological work. The method is de-scribed in several texts (e.g., Sokal and Rohlf,1995; Manly, 1997; Legendre and Legendre,1998).
Global Test of Host–Parasite Coevolution
Consider matrices A, B, and C describedabove. The two phylogenetic trees are givenas �xed because they have been formedthrough evolutionary time; we are not di-rectly interested in testing their similarity.The random component is clearly the set ofassociation links found in matrix A, which,under the null hypothesis, may changethrough ecological time. Siddall (1996) pro-vides other arguments in favor of randomiz-ing the H-P associations. The test will involverandom permutations of the hosts associ-ated with each parasite because the parasitesparasitize the hosts, not the opposite. Ac-cordingly, if there is no coevolutionary H-Passociation, each parasite species should par-asitize hosts selected at random on the hostphylogenetic tree. This is the null hypothesisof the test (H0). The alternative hypothesis(H1) is that the positions of the individual
Dow
nloaded from https://academ
ic.oup.com/sysbio/article/51/2/217/1661471 by guest on 31 M
ay 2022

2002 LEGENDRE ET AL.—HOST–PARASITE COEVOLUTION 221
H-P links are not random but associate cor-responding branches of the two evolution-ary trees; in that sense, they are criticalto the overall H-P association. The testingprocedure is as follows:
1. Compute matrix D by using Eq. 1. Com-pute statistic ParaFitGlobal by using Eq.2, which provides the reference value(ParaFitGlobal ref) for the test. Save thisvalue as traceref for use with the tests ofindividual H-P links, described below.
2. To obtain a realization of the null hy-pothesis, permute at random the valueswithin each row of matrix A, and do thisindependently from row to row. Recom-pute matrix D by Eq. 1 and the statis-tic ParaFitGlobal by Eq. 2. This providesa value (ParaFitGlobal¤) of the statisticunder permutation. Save each value astrace¤ D ParaFitGlobal¤ for use with thetests of individual H-P links (below).
3. Repeat step 2 a large number of times toobtain an estimate of the distribution ofthe statistic under permutation. Add thereference value ParaFitGlobalref to the dis-tribution, following Hope (1968).
4. Calculate the one-tailed probability(P-value) of the data under the null hy-pothesis as the proportion of values in theParaFitGlobal¤ distribution that are largerthan or equal to ParaFitGlobalref. Thetest indicates that the data are unlikelyto correspond to the null hypothesis ifParaFitGlobalref is larger than or equalto most (say, 95% for ® D 0.05) of theParaFitGlobal¤ values obtained underpermutation.
Tests of Individual Host–ParasiteAssociation Links
Tests of individual H-P association linkscan also be computed to determine the prob-ability that individual H-P links conform tothe null hypothesis. This is done as follows:
1. Compute TraceMax from matrices B andC by using Eq. 5.
2. Choose a H-P link k and remove it frommatrix A.
3. Compute matrix D for the modi�edmatrix A by using Eq. 1. Computetrace(k) by Eq. 3. Calculate the val-ues of the two reference statistics forthe tests, ParaFitLink1(k)ref (Eq. 4) and
ParaFitLink2(k)ref (Eq. 6), by using thevalue traceref saved from the global test ofcoevolution.
4. Permute at random the values within eachrow of matrix A, independently from rowto row, using the same sequence of ran-dom permutations as were used duringthe global test of H-P coevolution (above).Recompute matrix D by using Eq. 1 andtrace(k)¤ by Eq. 3, and then recomputethe values of the two statistics underpermutation: ParaFitLink1(k)¤ (Eq. 4) andParaFitLink2(k)¤ (Eq. 6), using the valuetrace¤ saved from the global test of coevo-lution.
5. Repeat step 2 a large number of times toobtain an estimate of the distribution ofthe two statistics under permutation. Addthe reference valuesParaFitLink1(k)ref andParaFitLink2(k)ref to the distributions, fol-lowing Hope (1968).
6. Calculate the one-tailed probabilities(P-values) of the data under the null hy-pothesis as the proportions of values inthe ParaFitLink1(k)¤ and ParaFitLink2(k)¤
distributions that are larger than or equalto ParaFitLink1(k)ref or ParaFitLink2(k)ref,respectively. The tests indicate that link kis unlikely to be random with re-spect to the coevolutionary structure ifParaFitLink1(k)ref or ParaFitLink2(k)ref islarger than or equal to most (say, 95%for ® D 0.05) of the ParaFitLink1(k)¤ orParaFitLink2(k)¤ values, respectively, ob-tained under permutation.
NUMERICAL S IMULATIONS
Type I Error
Simulations have been performed to checkthe type I error and power of the test of H-Pcoevolution. Type I error occurs when thenull hypothesis is rejected although the dataconform to H0. To be valid, a test of signif-icance should have a rate of rejection of thenull hypothesis no larger than the nominal(®) signi�cance level of the test when H0 istrue (Edgington, 1995).
To study type I error, we used simulateddata from random phylogenetic trees for thehosts and parasites and a matrix A contain-ing links sampled at random (without repli-cation) from among all possible H-P links.Unrooted random additive (i.e., phyloge-netic) trees were generated according to themethod of Pruzansky et al. (1982). The two
Dow
nloaded from https://academ
ic.oup.com/sysbio/article/51/2/217/1661471 by guest on 31 M
ay 2022

222 SYSTEMATIC BIOLOGY VOL. 51
random trees were transformed into matri-ces B (for the parasites) and C (for the hosts)by using principal coordinate analysis. Thestatistics for the global test and for the indi-vidual H-P links were calculated and testedby using random permutations.
A simulation study can never explore allparameter combinations. The simulation ef-fort reported here for type I error involves thefollowing parameter combinations, whichwe considered represented commonly en-countered situations in H-P studies:
² 10 hosts, 10 parasites. Number ofrandom H-P links: f5, 10, 15, 20, 25g.
² 10 hosts, 15 parasites. Number of ran-dom H-P links: f5, 10, 15, 20, 25g.
² 15 hosts, 10 parasites. Number ofrandom H-P links: f5, 10, 15, 20, 25g.
For each combination of parameters,10,000 random simulations were produced;99 random permutations were used in eachtest of signi�cance. The statistic of interestis the rate of rejection of the null hypothesis,the type I error rate, which was computed forvarious signi�cance levels, ® D f0.01, 0.02,0.03, 0.04, 0.05g, together with 95% con�-dence intervals based on the results of the10,000 independent simulations. Optimally,the rate of rejection of the null hypothesiswill be approximately equal to ®, the value ofwhich should lie within the 95% con�denceinterval of the rejection rate.
Power
A test of signi�cance should be able toreject the null hypothesis in most instanceswhen H0 is false. The ability to reject H0in these circumstances is referred to as thepower of the test. In the present study, poweris de�ned as the rate of rejection of the nullhypothesis when H0 is false by construct.Power was studied by using the same type ofsimulations as described above, except thatthis time the alternative hypothesis (H1) wasmade to be true. Three types of simulationswere done:
1. A random additive tree was generated,as described above, for each simulation,but here the same tree was used for theparasites (matrix B) and the hosts (matrixC); this is a condition for coevolution. AH-P link was created between each hostand the parasite that was found in the
corresponding position on the tree. Next,a certain percentage of randomly locatedlinks were added to matrix A (withoutreplication of existing links) by the sameprocedure as in the type I error study. Thesimulation parameters were as follows:10 hosts, 10 parasites, 10 basic H-P links.The number of random H-P links addedto the basic links was f0%, 10%, 20%, . . . ,100%g, or f0, 1, 2, . . . , 10g supplementaryrandom links, for a total of f10, 11, 12, . . . ,20g links.
2. In the second series of power simulations,a random additive tree was generated foreach simulation, and the same tree wasused for the parasites (matrix B) and hosts(matrix C). H-P links were created be-tween each host and the parasite in the cor-responding position on the common tree.Next, a certain percentage of randomly-located links were removed from the listand replaced (without replication of ex-isting links) with randomly located links.The simulation parameters were as fol-lows: 10 hosts, 10 parasites, 10 basic H-Plinks. The number of random H-P links re-placing basic links was f0%, 10%, 20%, . . . ,100%g, or f0, 1, 2, . . . , 10g links.
3. In the third type of power simulations, thehost and parasite phylogenetic trees weremade to have a common portion, whereasthe remainder of each tree was ran-dom. The number of coevolving specieswas the main parameter in these simu-lations. (In the previous types of simula-tions, the trees were the same, but some ofthe links were random. In the present sim-ulations, the two trees were only partiallysimilar; coevolutionary links were createdonly in the similar portions of the trees,and the remaining links were random.)The simulation parameters were as fol-lows: 10 hosts, 10 parasites, 10 H-P links.The number of species that shared thesame tree (coevolving species) was: f0, 1,2, 3, 4, 5, 6, 7, 8, 9g; hence the numberof independent species (not coevolving)was f10, 9, 8, 7, 6, 5, 4, 3, 2, 1g.
In all power simulations, there were 10,000independent simulations per combination ofparameters, and 99 permutations per test.
Power was computed for various sig-ni�cance levels ® D f0.01, 0.02, 0.03, 0.04,0.05g. The 95% con�dence intervals werenot plotted because they would have made
Dow
nloaded from https://academ
ic.oup.com/sysbio/article/51/2/217/1661471 by guest on 31 M
ay 2022

2002 LEGENDRE ET AL.—HOST–PARASITE COEVOLUTION 223
the graphs dif�cult to read. We want toidentify the simulated situations in whichpower was low, medium, or high, to provideguidance for interpretation of real-casestudies. We also want to see if one of thestatistics (ParaFitLink1 and ParaFitLink2)created for the tests of individual H-P linkshad higher power than the other, at least insome situations.
All the simulations described abovewere repeated with random rooted ul-trametric trees instead of unrooted addi-tive trees. The generation of random ul-trametric trees for n species involved twosteps, described by Lapointe and Legendre(1991):
1. Random node positions were obtained bydrawing n ¡ 1 numbers at random froma uniform (0, 1] distribution and placingthese values in the subdiagonal of an n £ nmatrix. The remainder of the matrix was�lled by using the procedure FillMat ofLapointe and Legendre (1991).
2. The species (1 to n) were attributed at ran-dom to the leaves of the tree.
This procedure yields a random ultrametrictree, which is a special type of phylogenetictree. The simulation results were very sim-ilar to those obtained when using randomunrooted additive trees. Only the latter arediscussed in detail below.
S IMULATION RESULTS
Global Test of Host–Parasite Coevolution
Type I error was correct in all cases, sowe can conclude that the global test is valid.Figure 3a shows the results for random andindependent phylogenies for the hosts andthe parasites, for equal numbers of hosts (10)and parasites (10) and various numbers (5to 25) of random H-P links; the signi�cancelevel used in the permutation tests (® D 0.01,0.02, 0.03, 0.04, 0.05) was always within the95% con�dence interval of the type I errorrate. Repeating the simulations for type Ierror but using unequal numbers of hostsand parasites (10, 15 and 15, 10) gave resultssimilar to those presented in Figure 3a: Thesigni�cance levels of the permutation testswere always within the con�dence intervalsof the type I error rates computed from the10,000 simulations. Similar results were ob-tained again when the two phylogenies were
the same but the H-P links were positionedat random.
The power study is based on simulationsin which the null hypothesis is false byconstruct; we are thus certain that thedata used in these simulations representsimulated cases of coevolution. When thedata exactly conformed the hypothesis ofcoevolution, power was maximum, the nullhypothesis being rejected in nearly all cases(Figs. 3b and 3c: number of random linksor supplementary random links D 0). Powerdecreased as the number of supplementaryrandom links added to the coevolutionarystructure increased (Fig. 3b). For ® D 0.05,power was »55% when there were asmany supplementary random links (10) ascoevolutionary links (10).
Power also decreased as coevolutionarylinks were replaced by random links (Fig. 3c).When all coevolutionary links were replacedby random links (10 random links in Fig. 3c),the rejection level, which measures type I er-ror in that case, was equal to the ® signi�-cance level of the test. This is not a surprisingresult; it simply indicates that the simulationmethod used to generate replacement linkswas correct.
When the host and parasite phylogenetictrees contained a common portion, the re-mainder of each tree being random, powerwas affected by the proportion of coevolvingspecies (Fig. 3d): With no coevolving species(left side of the graph), we are in a situa-tion where H0 is true, and the simulationresults are identical to those of Figure 3a.Power increased with the number of coe-volving species, to reach a maximum whenall species were coevolving; the rejectionrate was then 100% or very nearly so, as inFigures 3b and 3c (left sides). As the numberof coevolving species increased, the globaltest was more likely to identify as signi�-cant the coevolutionary relationship presentin portions of the trees, but power was lowwhen <70% of the species were coevolving.The effect on the global test is the same aswhen the host and parasite trees were thesame but some of the coevolutionary linkshad been replaced by random links (Fig. 3c,abscissa reversed). We conclude that coevo-lution may not be detected by the global testwhen a good portion of the hosts and para-sites are not coevolving.
The third series of power simulations wasrepeated with larger numbers of hosts and
Dow
nloaded from https://academ
ic.oup.com/sysbio/article/51/2/217/1661471 by guest on 31 M
ay 2022

FIG
UR
E3.
Glo
balt
esto
fH-P
coev
olu
tion
(Par
aFit
Glo
bals
tati
stic
).(a
)Typ
eIe
rror
rate
san
d95
%co
n�
den
cein
terv
als,
at®
D0.
01to
0.05
,oft
he
test
for
5to
25H
-Pas
soci
atio
nli
nks
(abs
ciss
a).T
he
phy
loge
nies
wer
ege
ner
ated
ind
epen
den
tly
for
the
hos
tsan
dth
ep
aras
ites
.The
con�
den
cein
terv
als
are
base
don
10,0
00re
plic
ate
sim
ula
tion
sfo
rea
chco
mbi
nat
ion
ofp
aram
eter
s.(b
)Pow
erof
the
glob
alte
stof
H-P
coev
olu
tion
insi
mu
lati
ons
inw
hich
an
um
ber
ofsu
pp
lem
enta
ryra
nd
omH
-Plin
ks(a
bsci
ssa)
wer
ead
ded
toth
eco
evol
uti
onar
ylin
ks.(
c)Sa
me
as(b
),bu
tfo
rsi
mu
lati
ons
inw
hic
hso
me
(abs
ciss
a)of
the
coev
olu
tion
ary
links
wer
ere
mov
edan
dre
pla
ced
byra
nd
omH
-Plin
ks.(
d)
Sam
eas
(b),
butf
orsi
mu
lati
ons
inw
hic
hth
ep
hylo
gene
tic
tree
sof
the
hos
tsan
dp
aras
ites
con
tain
eda
com
mon
por
tion
,the
rem
ain
der
ofea
chtr
eebe
ing
rand
om.A
bsci
ssa:
num
ber
ofco
evol
ving
spec
ies.
All
thes
esi
mu
lati
ons
wer
efo
r10
host
san
d10
par
asit
es.
224
Dow
nloaded from https://academ
ic.oup.com/sysbio/article/51/2/217/1661471 by guest on 31 M
ay 2022

2002 LEGENDRE ET AL.—HOST–PARASITE COEVOLUTION 225
parasites and more links. The power of theglobal test increased with host and parasitesample sizes, for given proportions of coevo-lutionary links.
Tests of Individual Host–ParasiteAssociation Links
In tests of individual H-P association links,type I error was always correct for both statis-tics, ParaFitLink1 and ParaFitLink2, whetherthe numbers of hosts and parasites wereequal (10, 10) or unequal (15, 10 or 10,15). Therefore, the two statistics providevalid tests of signi�cance. As an example,Figures 4a and 4b present the type I errorrates obtained for the �rst H-P link of eachsimulation, in a 10,000-simulation run in-volving 10 hosts and 10 parasites.
For pure coevolutionary structures, thetest of an individual link using statisticParaFitLink1 had good power, but not asgood as that of the global test: CompareFigure3b with Figure 5a (left, where the num-ber of supplementary links is 0), Figure 3cwith Figure 6a (left, where the number of ran-dom links is 0), and Figure 3d with Figure 7a(right, where all 10 species were coevolv-ing). Tests using ParaFitLink2 also have fairlygood power, but this cannot be shown forpure coevolutionary structures for reasonsgiven above. The power of individual testsincreases with the number of hosts and para-sites for given proportions of coevolutionarylinks (simulation results not shown in detail).
In the presence of supplementary randomlinks (supplementary to a saturated coevo-lutionary model containing a coevolution-ary link for every H-P pair), the statisticParaFitLink1 generally had greater powerthan ParaFitLink2 for detecting the linksthat signi�cantly contributed to H-P coevo-lution (Fig. 5). As noted above, statisticParaFitLink2 cannot be computed for a per-fect coevolutionary structure in the absenceof random links—which is why no rejectionrate is reported for the situation of no sup-plementary link (Fig. 5b).
The power of the test of individual co-evolutionary H-P links decreased as theproportion of supplementary random linksincreased. For ParaFitLink1, for instance(Fig. 5a), the presence of as many sup-plementary links (10) as coevolutionarylinks (10) reduced power by about half,compared with the power for simulations
without supplementary random links. WithParaFitLink1, the probability of correctlydetecting a coevolutionary link (Fig. 5a)was 1.5 to 2.5 times greater than that ofwrongly declaring a random link signi�cant(Fig. 5c). The difference is not as great forstatistic ParaFitLink2 (compare Figs. 5b and5d). Accordingly, the ParaFitLink1 statistic ispreferable in this situation. (In Fig. 5d, a sin-gle supplementary link added to a perfectcoevolutionary structure cannot be tested be-cause the test of signi�cance requires thatthe added link be removed, which bringsus back to the perfect coevolutionary case,where the ParaFitLink2 statistic cannot becomputed.) Figures 5c and 5d also show thatin the presence of coevolutionary links, typeI error for the tests of the random links wasgreater than ®; as a consequence, test re-sults in this situation have to be interpretedconservatively.
When coevolutionary links were replacedby random links, the coevolutionary modelwas no longer saturated, meaning that it didnot contain a coevolutionary link for eachH-P pair. In that case, statistic ParaFitLink2had greater power than ParaFitLink1 fordetecting the links that signi�cantly con-tributed to H-P coevolution (Figs. 6a, 6b).With both statistics, the probability of cor-rectly detecting a coevolutionary link (Figs.6a, 6b) was 1.5 to 2 times greater than that ofwrongly declaring a random link signi�cant(Figs. 6c, 6d) in the presence of 20% randomlinks. Note that the graphs in Figures 6c and6d converge towards the alpha signi�cancelevel when all 10 coevolutionary links havebeen replaced by random links. Figures 6cand 6d also show that in the presence of co-evolutionary links, the type I error on the ran-dom links exceeded ®; consequently, test re-sults in this situation have to be interpretedconservatively.
When the host and parasite phylogenetictrees contained a common portion and theremainder of each tree was random, bothpower and type I error were affected by theproportion of coevolving species (Fig. 7). Thepower to detect signi�cant coevolutionarylinks increased with the proportion of co-evolving species (Figs. 7a, 7b) in the sameway as the global test of signi�cance did(Fig. 3d). On the other hand, type I errorfor the test of the random links increasedwell above the ® signi�cance level when thenumber of coevolutionary species reached
Dow
nloaded from https://academ
ic.oup.com/sysbio/article/51/2/217/1661471 by guest on 31 M
ay 2022

FIG
UR
E4.
Typ
eIe
rror
rate
san
d95
%co
n�d
ence
inte
rval
s,at
®D
0.01
to0.
05,o
fth
ete
stof
ind
ivid
ual
H-P
asso
ciat
ion
for
the
�rs
tH-P
coev
olu
tion
ary
link
gene
rate
dd
uri
ng
each
sim
ula
tion
,for
5to
25H
-Pas
soci
atio
nli
nks.
(a)P
araF
itL
ink1
stat
isti
c.(b
)Par
aFit
Lin
k2st
atis
tic.
Sim
ula
tion
sw
ere
for1
0ho
sts
and
10p
aras
ites
;sim
ilarr
esu
lts
wer
eob
tain
edw
ith
10ho
sts
and
15p
aras
ites
and
wit
h15
hos
tsan
d10
par
asit
es.
226
Dow
nloaded from https://academ
ic.oup.com/sysbio/article/51/2/217/1661471 by guest on 31 M
ay 2022

FIG
UR
E5.
Pow
erof
the
test
ofin
div
idu
alH
-Pas
soci
atio
nin
sim
ula
tion
sin
whi
chra
ndom
lylo
cate
dlin
ksw
ere
add
edto
mat
rix
A.S
imu
lati
ons
wer
efo
r10
host
san
d10
par
asit
es;t
her
ew
ere
also
10co
evol
uti
onar
yli
nks
and
0to
10su
pp
lem
enta
ryra
ndom
link
s.(a
)Sim
ula
tion
resu
lts
for
one
ofth
eco
evol
uti
onar
yH
-Plin
ks,P
araF
itL
ink1
stat
isti
c.(b
)Par
aFit
Lin
k2st
atis
tic.
(c)S
imu
lati
onre
sult
sfo
ron
eof
the
sup
ple
men
tary
rand
omH
-Pli
nks,
Par
aFit
Lin
k1st
atis
tic;
(d)
Par
aFit
Lin
k2st
atis
tic.
227
Dow
nloaded from https://academ
ic.oup.com/sysbio/article/51/2/217/1661471 by guest on 31 M
ay 2022

FIG
UR
E6.
Pow
erof
the
test
ofin
div
idu
alH
-Pas
soci
atio
nin
sim
ula
tion
sin
whi
cha
cert
ain
per
cen
tage
ofra
ndom
ly-l
ocat
edlin
ksw
ere
rem
oved
from
mat
rix
Aan
dre
pla
ced
wit
hra
ndom
lylo
cate
dlin
ks.T
he
sim
ula
tion
sw
ere
for
10ho
sts
and
10p
aras
ites
.The
rew
ere
also
10co
evol
uti
onar
ylin
ks;0
to10
ofth
emw
ere
rep
lace
dw
ith
rand
omli
nks.
(a)
Sim
ula
tion
resu
lts
for
one
ofth
eco
evol
uti
onar
yH
-Pli
nks,
Par
aFit
Lin
k1st
atis
tic.
(b)
Par
aFit
Lin
k2st
atis
tic.
(c)
Sim
ula
tion
resu
lts
for
ara
ndom
H-P
link
rep
laci
ng
aco
evol
uti
onar
ylin
k,P
araF
itL
ink1
stat
isti
c;(d
)Par
aFit
Lin
k2st
atis
tic.
228
Dow
nloaded from https://academ
ic.oup.com/sysbio/article/51/2/217/1661471 by guest on 31 M
ay 2022

FIG
UR
E7.
Pow
erof
the
test
ofin
div
idu
alH
-Pas
soci
atio
nin
sim
ula
tion
sin
wh
ich
the
phy
loge
neti
ctr
eeof
the
hos
tsan
dth
atof
the
par
asit
esw
ere
par
tly
sim
ilar
and
par
tly
rand
om.T
her
ew
ere
10ho
sts,
10p
aras
ites
,an
d10
link
sin
this
par
ticu
lar
seto
fsim
ula
tion
s.A
bsci
ssa:
num
ber
ofsp
ecie
sof
host
san
dp
aras
ites
(am
ong
10)t
hats
har
edth
esa
me
tree
and
wer
elin
ked
.(a)
Sim
ula
tion
resu
lts
for
one
ofth
eco
evol
uti
onar
yH
-Plin
k,P
araF
itL
ink1
stat
isti
c.(b
)Par
aFit
Lin
k2st
atis
tic.
(c)S
imu
lati
onre
sult
sfo
ron
eof
the
rand
omH
-Pli
nks,
Par
aFit
Lin
k1st
atis
tic;
(d)
Par
aFit
Lin
k2st
atis
tic.
229
Dow
nloaded from https://academ
ic.oup.com/sysbio/article/51/2/217/1661471 by guest on 31 M
ay 2022

230 SYSTEMATIC BIOLOGY VOL. 51
about one-half the total number of species;the effect on statistic ParaFitLink1 was lessimportant than on statistic ParaFitLink2(Figs. 7c, 7d), making ParaFitLink1 seempreferable. The probability of correctly de-tecting a coevolutionary link was greaterthan that of wrongly declaring a randomlink signi�cant by about the same factor withboth statistics (compare Figs. 7a with 7c andFigs. 7b with 7d); that is, the two statis-tics are equivalent from that point of view.Considering the smaller degree of in�ationof type I error displayed by ParaFitLink1,compared with ParaFitLink2, ParaFitLink1seems preferable in this situation. In any case,test results in this situation have to be inter-preted cautiously.
Further simulations conducted with largernumbers of hosts and parasites and morelinks showed that power of the ParaFitLink1and ParaFitLink2 tests increased with in-creasing host and parasite sample sizesfor given proportions of coevolutionarylinks.
INTERPRETATION OF THE TEST RESULTS
The null hypothesis of the global test of sig-ni�cance for H-P coevolution is that the evo-lution of the two groups, as revealed by thetwo phylogenetic trees and the set of H-P as-sociation links, has occurred independently.Test results are interpreted as follows:
² A signi�cant global test result indicatesthat the test has detected a signi�cantH-P association, with a probability oftype I error equal to ®.
² A nonsigni�cant global test result indi-cates either that there is no H-P asso-ciation, or that the H-P association ismasked by supplementary random H-Plinks (see the results of the �rst series ofpower simulations in which randomlylocated links were added to matrix A), orthe structure is a mixed one with parts ofthe two trees coevolving whereas otherportions are not coevolving (see the re-sults of the second and third series ofpower simulations). The test has goodpower only when most of the host andparasite species are coevolving and thenumber of random links is not too great.Tests of individual H-P links are still pos-sible but results must be interpreted con-servatively, as discussed below.
In the tests of individual H-P associationlinks, the null hypothesis is that the link be-ing tested is random. Results of tests of indi-vidual links are interpreted as follows:
² When results of the global test and thetest of an individual link are both signif-icant, the test has detected a signi�cantH-P link, with a probability of type I er-ror equal to ®.
² When the global test gives a signi�cantresult and the test of an individual linkdoes not, the data do not support thehypothesis that the link represents a co-evolutionary link. Because the test of in-dividual links has less power than theglobal test, the test of a H-P link based ona small number of hosts, parasites, andcoevolutionary links may turn out not tobe signi�cant because of lack of power.
² When the result of the global test is notsigni�cant but that of the test of an in-dividual link is, then presumably we aredealing with a mixed structure contain-ing perhaps a coevolutionary structurewith some random links added (as inthe �rst series of power simulations), orperhaps the structure has a coevolution-ary portion and a random one (as in thesecond and third series of power simu-lations). Only links that are very highlysigni�cant should be considered, to com-pensate for the fact that the tests of indi-vidual links have in�ated type I error inthis situation.
² When neither the global test nor the testof an individual link gives signi�cant re-sults, the link is unlikely to represent acoevolutionary H-P association.
In summary, the ParaFitLink1 statistic gen-erally behaved better in simulations andshould be preferred to ParaFitLink2.
APPLICATION OF THE TEST: GOPHERSAND LICE
We tested our method by using phylo-genetic trees for pocket gophers and theirchewing lice (Hafner and Nadler, 1988, 1990;Hafner et al., 1994) reconstructed from themtDNA cytochrome oxidase I sequencesused in Hafner et al. (1994). This data set hasbecome a test case for coevolutionary stud-ies and has been reexamined several timeswith various new methods (e.g., Ronquist,
Dow
nloaded from https://academ
ic.oup.com/sysbio/article/51/2/217/1661471 by guest on 31 M
ay 2022

2002 LEGENDRE ET AL.—HOST–PARASITE COEVOLUTION 231
FIGURE 8. Pocket gophers and chewing lice phylogenetic trees and H-P links. Signi�cant H-P links arerepresented by full lines, nonsigni�cant links by dashed lines.
1995; Page, 1996; Charleston, 1998). Weused Hasegawa–Kishino–Yano (HKY85)corrected distances because of an observedheterogeneity of nucleotide frequencies andthe occurrence of a transition bias. Trees werereconstructed using the neighbor-joiningmethod (Saitou and Nei, 1987) availablein the program PAUP¤ (Swofford, 2001).We used this method to quickly obtain anestimate of the phylogeny of the hosts andparasites; however, this should not be takenas an endorsement of neighbor-joining asthe best method for exploring tree space.The trees that we obtained differ slightlyfrom those published by Hafner et al. (1994)because we used distances corrected under adifferent evolutionary model. This produceda topology slightly different from that pub-lished in Hafner et al. (1994). The exact treetopology, however, is of little importance forillustrating our method in the present study.
Coevolution was �rst tested by using theglobal ParaFit statistic (H0: evolution of thehosts and parasites has occurred indepen-dently). The result, that the null hypothesismust be rejected (permutational P D 0:001after 999permutations), supports the alterna-tive hypothesis (H1) of coevolution, revealedby the similarity of the two phylogenetictrees and the matrix of H-P association links.
This result is in agreement with previousstudies on this H-P model, which suggest animportant amount of cospeciation betweenpocket gophers and their chewing lice. Whenwe assessed the signi�cance of each H-Passociation, using the ParaFitLink1 statistic(tested at ® D 0.05), we found that 7 of the17 H-P links were not signi�cant (Fig. 8).
The signi�cant links display extensive co-evolution between the hosts and parasites.The discrepancies between the two phylo-genies are associated with the nonsigni�cantH-P links. If we remove those from Figure 8,and remove also the species that have nosigni�cant H-P link, the result is two identi-cal phylogenetic trees displaying perfect co-evolution for a subset of the gophers and lice(Fig. 9).
The ParaFit method does not intendto infer an evolutionary scenario explain-ing the observed historical association be-tween gophers and their lice—in contrastto the TreeMap method, for example. Itdid allow us, however, to identify (1) thehosts and parasites that have probably un-dergone cospeciation and (2) the speciesmost likely to have been subjected to host-switching or sorting events (parasite extinc-tion, or primary absence on daughter hostlineage)
Dow
nloaded from https://academ
ic.oup.com/sysbio/article/51/2/217/1661471 by guest on 31 M
ay 2022

232 SYSTEMATIC BIOLOGY VOL. 51
FIGURE 9. Pruned trees: The trees are now identical and display perfect coevolution for a subset of the animals.
DISCUSSION
We have described anew method designedto answer the biological question: Do the par-asites tend to use hosts that occupy corre-sponding positions in the phylogenetic tree?The ParaFit method allows one to performa statistical test of this particular global hy-pothesis of coevolution and also to test thesigni�cance of each H-P link contributing tothe relationship, thereby leading to the iden-ti�cation of the species involved in cospe-ciation. Through this process, the incongru-ent H-P links are also identi�ed—links thatare often worth examining. Previously de-scribed methods either did not provide sta-tistical tests (such as BPA), tested only aglobal �t (such as TreeMap), or tested thecontributions of different kinds of events tothe overall relationship (such as TreeFitter).ParaFit permits one to deal with any kind ofH-P association in a reasonable amount ofcomputing time.
Johnson et al. (2001) have recently pro-posed a method, involving several calcula-tion steps, whose objective is very similar tothat of ParaFit: to identify the incongruenciesin the list of H-P links so as to produce a jointscenario of the cospeciation and incongruentevents. They used cospeciation as the nullmodel for statistical testing, and the test ad-mittedly overestimated the number of con-gruent (i.e., cospeciation) events. In ParaFit,in contrast, the null model is the indepen-dence of the H-P associations. In hypothesistesting, identifying cospeciation events by re-jecting a null hypothesis with a known (andsmall) type I error is better than failing toreject a null hypothesis of cospeciation with
an unknown (and usually large, especiallywith a small sample size) type II error. TheJohnson et al. method certainly takes muchlonger to compute than ParaFit and wouldbe dif�cult to compute for moderate to largedata sets.
Another advantage of ParaFit is that if, forsome reason, one or the other phylogenetictree is not available, phylogenetic distancescan be used instead of trees. This is a use-ful feature because distances can be directlycomputed from raw data (morphology, se-quences, and so on), without having to re-construct a tree. The distance matrix is trans-formed into a rectangular matrix by principalcoordinate analysis before being used in theParaFit program. This can be interesting inthe case of poorly resolved phylogenies ormultiple trees, which often present a prob-lem in this kind of studies, or if one doesnot want or need to estimate the phylogeny.On the other hand, when phylogenetic treesare available, they can be expressed as dis-tance matrices by calculating patristic dis-tances among the species (i.e., the leavesof the tree). The patristic distance matrices,transformed by principal coordinate analy-sis, are then used in the ParaFit tests.
The statistics ParaFitLink1 and Para-FitLink2 both have their usefulness.ParaFitLink1 has greater power for correctlydetecting coevolutionary links in saturatedcoevolutionary models that contain addi-tional random links, whereas ParaFitLink2has greater power for correctly detectingcoevolutionary links in unsaturated coevo-lutionary models, in which only a fractionof the links are coevolutionary and the other
Dow
nloaded from https://academ
ic.oup.com/sysbio/article/51/2/217/1661471 by guest on 31 M
ay 2022
2002 LEGENDRE ET AL.—HOST–PARASITE COEVOLUTION 233
links are random. ParaFitLink2 cannot beused in perfect coevolutionary situationsbecause its denominator is then zero.
A FORTRAN program (PARAFIT: sourcecode, compiled versions for Macintosh andDOS, and program documentation) to carryout the H-P coevolution test described in thispaper is available on the website <http://www.fas.umontreal.ca/biol/legendre/> aswell as the site of the Society for SystematicBiologists <http://www.systbiol.org>. Theuser’s manual contains matrices A, B, andC used to compute the gopher–lice examplediscussed in this paper, as well as the patristicdistance matrices that led to B and C.
ACKNOWLEDGMENTS
We are grateful to Vladimir Makarenkov, who cour-teously gave us a C version of the subroutine gener-ating the unrooted random additive trees (followingPruzansky et al., 1982) that we used in our simulations,and to Mark Hafner for providing us with the DNA se-quence data for pocket gophers and their lice. Interestingcomments on the manuscript were provided by RodericPage, Mark Siddall, and Adrian Paterson. This researchwas supported by NSERC grant no. OGP0007738 to P.L.Y.D. was supported by a scholarship from Le Fonds pourla Formation de Chercheurs et l’Aide a la Recherche (FondsFCAR), Gouvernement du Quebec. E.B. was supportedby a scholarship from Le Conseil regional de Bretagne.
REFERENCES
BARKER, S. C. 1994. Phylogeny and classi�cation,origins, and evolution of host associations of lice.Int. J. Parasitol. 24:1285–1291.
BARRETT, J. A. 1986. Host–parasite interactions and sys-tematics. Pages 1–17 in Coevolution and systematics(A. R. Stone and D. L. Hawksworth, eds.). ClarendonPress, Oxford, U.K.
BOEGER, W. A., AND D. C. KRITSKY. 1997. Coevolu-tion of the Monogenoidea (Platyhelminthes) basedon a revised hypothesis of parasite phylogeny. Int. J.Parasitol. 27:1495–1511.
BROOKS, D. R. 1977. Evolutionary history of some pla-giorchioid trematodes of anurans. Syst. Zool. 26:277–279.
BROOKS, D. R. 1979. Testing the context and extent ofhost–parasite coevolution. Syst. Zool. 28:299–307.
BROOKS, D. R. 1981. Hennig’s parasitological method: Aproposed solution. Syst. Zool. 30:229–249.
BROOKS, D. R. 1985. Historical ecology: A new approachto studying the evolution of ecological associations.Ann. Mo. Bot. Gard. 72:660–680.
BROOKS, D. R., AND D. R. GLEN. 1982. Pinworms and pri-mates: A case study in coevolution. Proc. Helminthol.Soc. Wash. 49:76–85.
BROOKS, D. R., AND D. A. MCLENNAN. 1991. Phylogeny,ecology, and behavior. A research program in compar-ative biology. Univ. of Chicago Press, Chicago.
BUNEMAN, P. 1974. A note on the metric properties oftrees. J. Comb. Theory B 17:48–50.
CHARLESTON, M. A. 1998. Jungles: A new solution tothe host/parasite phylogeny reconciliation problem.Math. Biosci. 149:191–223.
DEMASTES , J. W., AND M. S. HAFNER. 1993. Cospecia-tion of pocket gophers (Geomys) and their chewing lice(Geomydoecus). J. Mammal. 74:521–530.
EDGINGTON, E. S. 1995. Randomization tests, 3rd edi-tion. Marcel Dekker, New York.
EHRLICH, P. R., AND P. H. RAVEN. 1964. Butter�ies andplants: A study in coevolution. Evolution 18:586–608.
FARENHOLZ, H. 1913. Ectoparasiten und Abstam-mungslehre. Zool. Anz. 41:371–374.
FUTUYMA, D. J., AND M. SLATKIN. 1983. Coevolution.Sinauer Associates. Sunderland, Massachusetts.
GOWER, J. C. 1966. Some distance properties of latentroot and vector methods used in multivariate analysis.Biometrika 53:325–338.
HAFNER, M. S., AND S. A. NADLER. 1988. Phylogenetictrees support the coevolution of parasites and theirhosts. Nature 332:258–259.
HAFNER, M. S., AND S. A. NADLER. 1990. Cospeciation inhost–parasite assemblages: Comparative analysis ofrates of evolution and timing of cospeciation events.Syst. Zool. 39:192–204.
HAFNER, M. S, P. D. SUDMAN, F. X. VILLABLANCA,T. A. SPRADLING, J. W. DEMASTES , AND S. A.NADLER. 1994. Disparate rates of molecular evolu-tion in cospeciating hosts and parasites. Science 265:1087–1090.
HOPE, A. C. A. 1968. A simpli�ed Monte Carlo test pro-cedure. J. R. Stat. Soc. B 50:35–45.
HUELSENBECK, J. P., B. RANNALA, AND Z. YANG.1997. Statistical tests of host–parasite cospeciation.Evolution 51:410–419.
JOHNSON, K. P., D. M. DROWN, AND D. H. CLAYTON.2001. A data based parsimony method of cophyloge-netic analysis. Zool. Scr. 30:79–87.
KLASSEN, G. J. 1992. Coevolution: A history ofthe macroevolutionary approach to study-ing host–parasite associations. J. Parasitol. 78:573–587.
KLASSEN, G. J., AND M. BEVERLEY-BURTON. 1988. NorthAmerican fresh water ancyrocephalids (Monogenea)with articulating haptoral bars: Host–parasite coevo-lution. Syst. Zool. 37:179–189.
LAPOINTE, F.-J., AND P. LEGENDRE. 1991. The generationof random ultrametric matrices representing dendro-grams. J. Classif. 8:177–200.
LAPOINTE, F.-J., AND P. LEGENDRE. 1992. A statisticalframework to test the consensus among additive trees(cladograms). Syst. Biol. 41:158–171.
LEGENDRE, P., R. GALZIN, AND M. L. HARMELIN-VIVIEN.1997. Relating behavior to habitat: Solutions to thefourth-corner problem. Ecology 78:547–562.
LEGENDRE, P., AND L. LEGENDRE. 1998. Numericalecology, 2nd English edition. Elsevier Science BV,Amsterdam.
MANLY, B. J. F. 1997. Randomization, bootstrap andMonte Carlo methods in biology, 2nd edition.Chapman and Hall, London.
PAGE, R. D. M. 1993a. COMPONENT 2.0. Tree compari-son software for the use with Microsoft Windows. TheNatural History Museum, London.
PAGE, R. D. M. 1993b. Parasites, phylogeny and cospe-ciation. Int. J. Parasitol. 23:499–506.
PAGE, R. D. M. 1994. Parallel phylogenies: Recon-structing the history of host–parasite assemblages.Cladistics 10:155–173.
Dow
nloaded from https://academ
ic.oup.com/sysbio/article/51/2/217/1661471 by guest on 31 M
ay 2022

234 SYSTEMATIC BIOLOGY VOL. 51
PAGE, R. D. M. 1996. Temporal congruence revisited:Comparison of mitochondrial DNA sequence diver-gence in cospeciating pocket gophers and their chew-ing lice. Syst. Biol. 45:151–167.
PAGE, R. D. M., AND M. A. CHARLESTON. 1998. Treeswithin trees—Phylogeny and historical associations.Trends Ecol. Evol. 13:356–359.
PAGE, R. D. M., AND M. S. HAFNER. 1996. Molecular phy-logenies and host–parasite cospeciation: Gophers andlice as a model system. Pages 255–270 in New uses fornew phylogenies (P. H. Harvey, A. J. Leigh Brown,J. Maynard Smith, and S. Nee, eds.). Oxford Univ.Press, New York.
PAGE, R. D. M., AND E. H. HOLMES . 1998. Molecularevolution: A phylogenetic approach. BlackwellScience, Oxford, U.K.
PATERSON, A. M., AND J. B. BANKS. 2001. Analytical ap-proaches to measuring cospeciation of host and par-asites: Through a glass, darkly. Int. J. Parasitol. 31:1012–1022.
PATERSON, A. M., R. D. GRAY, AND G. P. WALLIS. 1993.Parasites, petrels and penguins: Does louse presencere�ect seabird phylogeny? Int. J. Parasitol. 23:515–526.
PRUZANSKY, S., A. TVERSKY, AND J. D. CARROLL. 1982.Spatial versus tree representations of proximity data.Psychometrika 47:3–19.
RONQUIST, F. 1995. Reconstructing the history of host–parasite associations using generalised parsimony.Cladistics 11:73–89.
RONQUIST, F. 1997. Phylogenetic approaches in co-evolution and biogeography. Zool. Scr. 26:313–322.
ROY, B. A. 2001. Patterns of association between cru-cifers and their �ower-mimic pathogens: Host jumpsare more common than coevolution or cospeciation.Evolution 55:41–53.
SAITOU, N., AND M. NEI. 1987. The neighbor-joiningmethod: A new method for reconstructing phyloge-netic trees. Mol. Biol. Evol. 4:406–425.
SIDALL, M. E. 1996. Phylogenetic covariance probabil-ity: Con�dence and historical associations. Syst. Biol.45:48–66.
SOKAL, R. R., AND F. J. ROHLF. 1995. Biometry—The prin-ciples and practice of statistics in biological research,3rd edition. W. H. Freeman, New York.
SWOFFORD, D. L. 2001. PAUP¤ . Phylogenetic analysis us-ing parsimony (¤and other methods). Version 4b8.Sinauer Associates, Sunderland, Massachusetts.
SZIDAT, L. 1940. Beitrage zum Aubfau eines naturlichenSystems der Trematoden. I. Die Entwicklung vonEchinocercaria choanophila U. Szidat zu Cathaema-sia hians und die Ableitung der Fasciolidae von denEchinostomidae. Z. Parasitenk. 11:239–283.
THOMPSON, J. N. 1994. The coevolutionary process.Univ. of Chicago Press, Chicago.
Received 10 August 2001; accepted 15 November 2001Associate Editor: Roderic D. M. Page
Dow
nloaded from https://academ
ic.oup.com/sysbio/article/51/2/217/1661471 by guest on 31 M
ay 2022