A stability indicating RP-HPLC method for the simultaneous estimation of metronidazole, clindamycin...
11
*Corresponding Author Address: Mr. Naga Raju Potnuri, Associate Professor, Joginpally B.R. Pharmacy College, Yenkapally (V), Moinabad (M), R.R. (Dist.), A.P, India; E-mail: [email protected] World Journal of Pharmaceutical Sciences ISSN (Print): 2321-3310; ISSN (Online): 2321-3086 Published by Atom and Cell Publishers © All Rights Reserved Available online at: http://www.wjpsonline.org/ Original Article A stability indicating RP-HPLC method for the simultaneous estimation of metronidazole, clindamycin and clotrimazole in bulk and their combined dosage form Rajendar L *1 , Naga Raju Potnuri 2 , and Narsimha Rao R 3 Department of Pharmaceutical Analysis, Joginpally B.R. Pharmacy College, Yenkapally, Moinabad, R.R. Dist, A.P, India Received: 08-12-2014 / Revised: 21-12-2014 / Accepted: 28-12-2014 ABSTRACT A simple, specific, and precise stability indicating reverse phase high performance liquid chromatography method was developed and validated as per the ICH guidelines for the simultaneous determination of Metronidazole, Clindamycin and Clotrimazole in bulk and combined dosage forms. The quantification was carried out by using Hypersil BDS C18 (4.6*250mm, 5m) column at 30 0 c with Phosphate Buffer pH 4.5: Methanol: Acetonitrile in the ratio of 30:20:50 % V/V as mobile phase, pH 4.5 adjusted by using 0.1M ortho phosphoric acid. The flow rate is 1 mL/min and the estimation is carried out by using PDA detector at 210 nm. The retention time of Metronidazole, Clindamycin and Clotrimazole were 1.636, 2.289 and 4.928 minutes respectively. The linearity was observed from 25-150μg/mL with correlation coefficient 0.999 for Metronidazole, Clindamycin and Clotrimazole. The LOD and LOQ of Metronidazole, Clindamycin and Clotrimazole were found to be 1.77 & 5.35μg/mL, 2.55 & 7.77μg/mL and 1.28 & 5.25μg/mL respectively and the statistics data for the MNZ, CDM and CTM were concluded that the method was found to be simple, reliable, selective, reproducible and accurate. The method was successfully used for quality control analysis of Metronidazole, Clindamycin and Clotrimazole. Keywords: Metronidazole (MNZ), Clindamycin (CDM) and Clotrimazole (CTM), RP-HPLC, Stability and Validation. INTRODUCTION Metronidazole is used as an anti-protozoal and it is 2-methyl-5-nitroimidazole-1-ethanol [1]. It is widely used for antibacterial activity against gram- negative aerobes and gram-positive bacteria, including bacteriode fragilis that produces β- lactamases [2] and also used in the treatment of amoebiasis, trichomoniasis, lambliasis, and anaerobic infections [3, 4]. It is one of the most promising agents in combination with antimicrobial agents used in the eradication of helicobacter pylori, a recognized cause of gastritis and duodenal ulcers [5, 6, 7]. Clindamycin is methyl 7-chloro- 6,7,8-trideoxy-6-{[(4R)-1-methyl-4-propyl-L- prolyl]amino}-1-thio-L-threo-α-D-galacto- octopyranoside [8, 9] and it is a semi synthetic derivative of lincomycin. It is active against gram- positive aerobes and highly active against both gram-positive and negative anaerobes [10]. Clindamycin inhibits bacterial protein synthesis at the level of the bacterial ribosome. Clotrimazole is an antifungal agent and it is used for primarily in the treatment of superficial fungal infections [11]. Chemically it is known as 1-[(2-chlorophenyl) di phenyl methyl]-1H-imidazole [12, 13]. Clotrimazole is used to treat skin infections such as athlete's foot, jock itch, ringworm, and other fungal skin infections like lightening or darkening of the skin of the neck, chest, arms, or legs. This medication is also used to treat a skin condition known as pityriasis (tinea versicolor) and Small amounts this drug also used to treat yeast infections in pregnant women. Few analytical methods were reported in the literature, such as determination of Metronidazole, Clindamycin, and Clotrimazole present in individual or in combination with other drugs. However literature survey reveals that, there is no method for the simultaneous estimation of Metronidazole, Clindamycin, and Clotrimazole in bulk and their combined dosage form by reversed phase-HPLC. Chemical structure of Metronidazole,
-
Upload
independent -
Category
Documents
-
view
0 -
download
0
Transcript of A stability indicating RP-HPLC method for the simultaneous estimation of metronidazole, clindamycin...
*Corresponding Author Address: Mr. Naga Raju Potnuri, Associate Professor, Joginpally B.R. Pharmacy College, Yenkapally (V),
Moinabad (M), R.R. (Dist.), A.P, India; E-mail: [email protected]
World Journal of Pharmaceutical Sciences ISSN (Print): 2321-3310; ISSN (Online): 2321-3086
Published by Atom and Cell Publishers © All Rights Reserved
Available online at: http://www.wjpsonline.org/
Original Article
A stability indicating RP-HPLC method for the simultaneous estimation of
metronidazole, clindamycin and clotrimazole in bulk and their combined dosage form
Rajendar L
*1, Naga Raju Potnuri
2, and Narsimha Rao R
3
Department of Pharmaceutical Analysis, Joginpally B.R. Pharmacy College, Yenkapally, Moinabad, R.R. Dist,
A.P, India
Received: 08-12-2014 / Revised: 21-12-2014 / Accepted: 28-12-2014
ABSTRACT
A simple, specific, and precise stability indicating reverse phase high performance liquid chromatography
method was developed and validated as per the ICH guidelines for the simultaneous determination of
Metronidazole, Clindamycin and Clotrimazole in bulk and combined dosage forms. The quantification was
carried out by using Hypersil BDS C18 (4.6*250mm, 5m) column at 300c with Phosphate Buffer pH 4.5:
Methanol: Acetonitrile in the ratio of 30:20:50 % V/V as mobile phase, pH 4.5 adjusted by using 0.1M ortho
phosphoric acid. The flow rate is 1 mL/min and the estimation is carried out by using PDA detector at 210 nm.
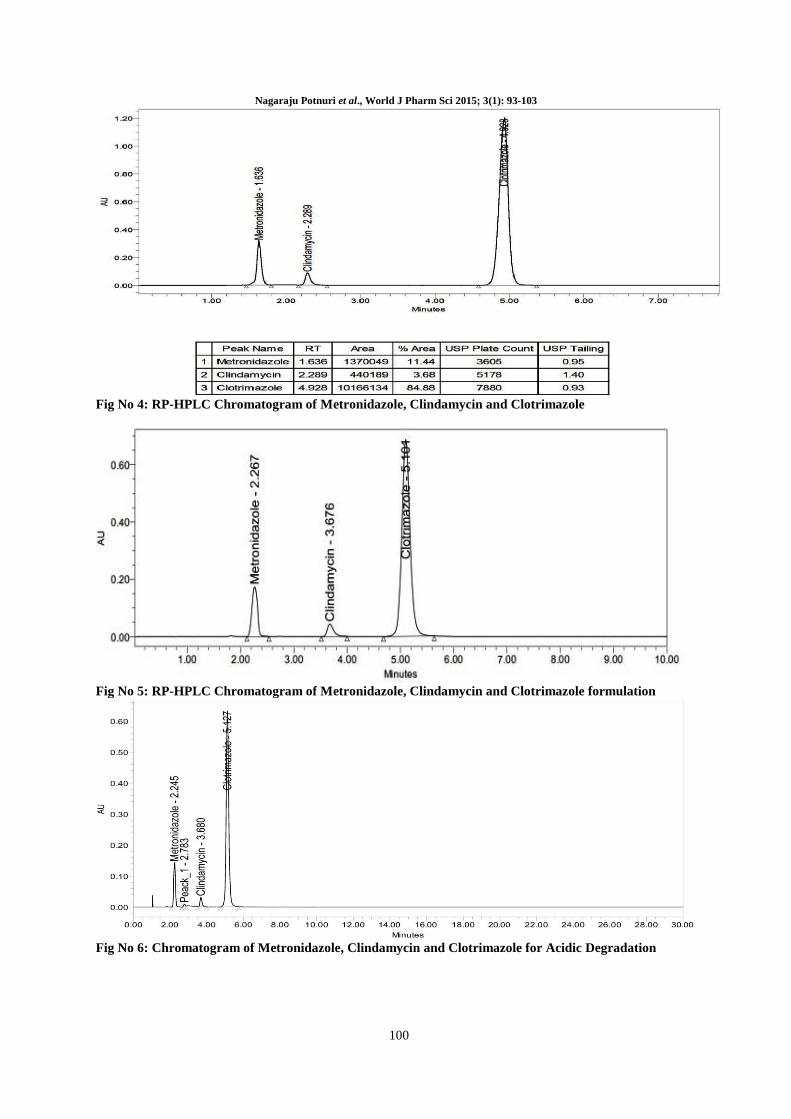
The retention time of Metronidazole, Clindamycin and Clotrimazole were 1.636, 2.289 and 4.928 minutes
respectively. The linearity was observed from 25-150μg/mL with correlation coefficient 0.999 for
Metronidazole, Clindamycin and Clotrimazole. The LOD and LOQ of Metronidazole, Clindamycin and
Clotrimazole were found to be 1.77 & 5.35μg/mL, 2.55 & 7.77μg/mL and 1.28 & 5.25μg/mL respectively and
the statistics data for the MNZ, CDM and CTM were concluded that the method was found to be simple,
reliable, selective, reproducible and accurate. The method was successfully used for quality control analysis of
Metronidazole, Clindamycin and Clotrimazole.
Keywords: Metronidazole (MNZ), Clindamycin (CDM) and Clotrimazole (CTM), RP-HPLC, Stability and
Validation.
INTRODUCTION
Metronidazole is used as an anti-protozoal and it is
2-methyl-5-nitroimidazole-1-ethanol [1]. It is
widely used for antibacterial activity against gram-
negative aerobes and gram-positive bacteria,
including bacteriode fragilis that produces β-
lactamases [2] and also used in the treatment of
amoebiasis, trichomoniasis, lambliasis, and
anaerobic infections [3, 4]. It is one of the most
promising agents in combination with antimicrobial
agents used in the eradication of helicobacter
pylori, a recognized cause of gastritis and duodenal
ulcers [5, 6, 7]. Clindamycin is methyl 7-chloro-
6,7,8-trideoxy-6-{[(4R)-1-methyl-4-propyl-L-
prolyl]amino}-1-thio-L-threo-α-D-galacto-
octopyranoside [8, 9] and it is a semi synthetic
derivative of lincomycin. It is active against gram-
positive aerobes and highly active against both
gram-positive and negative anaerobes [10].
Clindamycin inhibits bacterial protein synthesis at
the level of the bacterial ribosome. Clotrimazole is
an antifungal agent and it is used for primarily in
the treatment of superficial fungal infections [11].
Chemically it is known as 1-[(2-chlorophenyl) di
phenyl methyl]-1H-imidazole [12, 13].
Clotrimazole is used to treat skin infections such as
athlete's foot, jock itch, ringworm, and other fungal
skin infections like lightening or darkening of the
skin of the neck, chest, arms, or legs. This
medication is also used to treat a skin condition
known as pityriasis (tinea versicolor) and Small
amounts this drug also used to treat yeast infections
in pregnant women.
Few analytical methods were reported in the
literature, such as determination of Metronidazole,
Clindamycin, and Clotrimazole present in
individual or in combination with other drugs.
However literature survey reveals that, there is no
method for the simultaneous estimation of
Metronidazole, Clindamycin, and Clotrimazole in
bulk and their combined dosage form by reversed
phase-HPLC. Chemical structure of Metronidazole,
Nagaraju Potnuri et al., World J Pharm Sci 2015; 3(1): 93-103
94
Clindamycin and Clotrimazole are shown in Figure
No. 1, 2 & 3 respectively.
MATERIALS AND METHODS
Materials: Metronidazole, Clindamycin and
Clotrimazole pure drugs were obtained as a gift
sample from Dewcare Concept (P) Ltd, Gujarat,
India. HPLC grade Acetonitrile, Methanol and
water [filtered through 0.2µ filters] were purchased
from Merck, Mumbai, India. Potassium dihydrogen
phosphate and ortho phosphoric acid were
purchased from Rankem, RFCL limited, New
Delhi, India.
Preparation of Solutions
Stock and Standard solution: The stock solution
prepared from pure drugs of 50mg of
Metronidazole, Clindamycin and Clotrimazole
were taken in 50mL volumetric flask and dissolved
in 10mL of HPLC grade methanol, and diluted up
to the mark with diluent.
The standard solution prepared from 10mL of stock
solution was taken in 100mL volumetric flask and
diluted up to the mark with diluent to get a
concentration of 100μg/mL of Metronidazole,
Clindamycin and Clotrimazole.
Phosphate Buffer pH 4.5: Dissolve 6.8g of
potassium di-hydrogen phosphate in 1000mL of
HPLC grade water (filtered through 0.2μ filters)
and degassed. Adjust the pH to 4.5 by 0.1M ortho
phosphoric acid.
Sample solution: 20 tablets (Shekit-V) of
Metronidazole, Clindamycin and Clotrimazole
were powdered and an amount of the powder
equivalent to 50mg of Metronidazole, Clindamycin
and Clotrimazole was accurately weighed and
transferred to the 50mL volumetric flask, made up
to the volume with Diluent. The solution was
placed in an ultrasonicator for 30 minutes and
filtered through a 25 mm, 0.45 μm nylon syringe
filter. 10mL of this solution was taken and diluted
to 100mL by using a diluent to get a final
concentration of 100μg/mL. Five replicate sample
solutions were prepared in similar manner.
HPLC Instrumentation and Conditions
Instrumentation: Waters HPLC system consisting
of WATERS 2695 separation module, an inbuilt
auto sampler, column oven and WATERS 2996
(PDA) detector was employed throughout the
analysis. Chromatography was performed on a
Hypersil BDS C18 column. A sonerex sonicator
was used for sonication and the data was acquired
by using the EM Power2 software.
Optimized chromatographic conditions:
Chromatography was performed on a Hypersil
BDS C18 column using mobile phase containing
mixture of Phosphate Buffer pH 4.5: Methanol:
Acetonitrile in the ratio of 30:20:50 % V/V. The
mobile phase was filtered through membrane filter
(0.45 µm), and vacuum degassed by sonication
prior to use. The pump pressure and run time was
maintained at 1500-2000 psi and 10 minutes
respectively. Chromatography was performed at
300C with flow rate at 1 mL/min and detection was
carried out at 210 nm. Instrumentation and
optimized chromatographic conditions for
proposed method details are shown in Table No 1.
RESULTS AND DISCUSSION
Validation study of Metronidazole, Clindamycin
and Clotrimazole: The Method validation was
performed as per ICH guidelines for the
simultaneous estimation of Metronidazole,
Clindamycin and Clotrimazole in bulk and
combined dosage form. The method was validated
with respect to parameters including accuracy,
precision, linearity, robustness, specificity, system
suitability, LOD and LOQ [14].
Assay of Metronidazole, Clindamycin and
Clotrimazole: The developed method was applied
to the assay of Metronidazole, Clindamycin and
Clotrimazole in combined dosage forms. The drug
content was estimated with an average of six
determinations, and results were given in Table No
2. The results were similar to the labeled claim of
market formulations. The standard and sample
chromatograms of Metronidazole, Clindamycin and
Clotrimazole were shown in Figure No 3 and 4
respectively.
Specificity: The specificity of the proposed method
was established by injecting the placebo and
mobile phase solution in triplicate and the
chromatograms were recorded. Comparison of
chromatograms revealed that there were no
interactions between the placebo and sample peaks.
Finally, it was indicated that the method was
specific.
Accuracy: The accuracy was determined by
calculating the recovery of Metronidazole,
Clindamycin and Clotrimazole at 50, 100, & 150%
and they were added to pre quantified sample
solution. The recovery studies were carried out in
the dosage form in triplicate each in the presence of
placebo. The mean percentage recovery of MNZ,
CDM and CTM at each level was not less than
99%, and not more than 102%. The percentage
recovery of Metronidazole, Clindamycin and
Clotrimazole was found to be in the range of 99 to
Nagaraju Potnuri et al., World J Pharm Sci 2015; 3(1): 93-103
95
101%. The results are shown in the Table No 3, 4
and 5.
Precision: Precision should be investigated by
using authentic and homogeneous samples. The
Precision of this method was expressed as S.D and
%RSD of series of repeated measurements.
Precision of MNZ, CDM and CTM determination
by proposed method were ascertained by repeated
analysis of homogeneous samples of
Metronidazole, Clindamycin and Clotrimazole
standard solutions in the intraday under the similar
conditions. The method precision result was shown
in Table No 6.
Linearity: Linearity of the proposed method was
established by using series of standard solutions of
Metronidazole, Clindamycin & Clotrimazole, and
these studies are repeated in triplicate with different
stock solutions. The curve obtained by
concentration on x-axis and peak area on y-axis
against showed linearity in the concentration range
of 25 to 150μg/mL for MNZ, CDM and CTM and
its correlation coefficient is 0.999 and linearity
graph is shown in Graph No 1. The regression
equation of MNZ, CDM and CTM were found to
be Y = 12285x + 7337 & Y = 3723x – 2718 and Y
= 72477x + 37486 respectively. The Linearity and
statistical analysis of data are shown in Table No 7,
8 and 9.
Robustness: The robustness was evaluated by the
analysis of Metronidazole, Clindamycin and
Clotrimazole under different experimental
conditions such as slight changes in
chromatographic conditions like change of flow
rate (±0.2 mL/min), temperature (±50C), and
mobile phase composition (± 5%). It was
distinguished that there were no changes in the
chromatograms, and the parameters were within the
limits, which indicates that the method was robust
and suitable for routine use. The complete results
are shown in Table No 10, 11 & 12 and the method
is having good system suitability.
Limit of Detection: The limit of detection (LOD)
has established the minimum concentration at
which the analyte can be reliably detected. LOD is
determined by the signal to noise ratio and
generally acceptable detection limit ratio is 3:1. It
was found for Metronidazole, Clindamycin &
Clotrimazole is 1.77, 2.55 and 1.28 μg/mL
respectively.
Limit of Quantification: The limit of
quantification (LOQ) has established the minimum
concentration at which the analyte can be reliably
quantified. LOQ is determined by the signal to
noise ratio and a typical signal to noise ratio is 10:1
which is acceptable for estimating the
quantification limit. It was found to be 5.35, 7.77
and 5.25 μg/mL for Metronidazole, Clindamycin &
Clotrimazole respectively.
System suitability: This test was conducted on
freshly prepared Metronidazole, Clindamycin and
Clotrimazole standard solution and was used for
the evaluation of the system suitability parameters
such as retention time, area, USP tailing and
theoretical plates, limit of detection and limit of
quantification. Five replicate injections for a
system suitability test were injected into the
chromatographic system. Finally the proposed
method is having good system suitability and its
parameters are shown in Table No 13.
FORCED DEGRADATION STUDY
Forced degradation studies were conducted to
evaluate the stability and specificity of the method.
The acceptable limit for consideration in the
present study is between 5 to 20% for
chromatographic assays [15, 16]. The specificity of
the developed method was evaluated by using
different ICH prescribed stress conditions like
acidic, basic, oxidative, and thermal. Acidic
degradation studies are performed by taking 10 mL
of stock solution in 50 mL volumetric flask. 10 mL
of 5N HCL was added to the stock solution and
these solutions were kept at reflux for 4 hours.
Finally this solution was neutralized with 5 N
NaOH. Alkali degradation studies are performed by
taking 10 mL of stock solution in 50 mL
volumetric flask. 10 mL of 5 N NaOH was added
to the stock solution and these solutions were kept
at reflux for 4 hours. Finally this solution was
neutralized with 5N HCL. Oxidative degradation
studies are performed by taking 10 mL of stock
solution in 50 mL volumetric flask and 10 mL of
3% hydrogen peroxide added to the flask. These
mixtures were kept for up to 3 days in the dark.
Thermal degradation studies are performed by
taking 10 mL of stock solution in 50 mL
volumetric flask and then sample solution were
heated to 800c for 15-60 minutes. Photo
degradation studies are performed by taking 10 mL
stock solution in 50 mL volumetric flask and this
solution exposing to the ultraviolent light by
keeping this flask in UV chamber for 7days or 200
Watt hours/m2 in photo stability chamber.
Neutral degradation studies are performed by
taking 10 mL stock solution in 50 mL volumetric
flask and this solution refluxing the drug in water
for 6 hours at 60ºC. Finally forced degradation
studies of Metronidazole, Clindamycin and
Clotrimazole concluded that purity of angle less
than purity of threshold and forced degradation
Nagaraju Potnuri et al., World J Pharm Sci 2015; 3(1): 93-103
96
chromatogram were shown in Figure No 6 to 11.
All the Degradation summary results were shown
in Table No: 14
CONCLUSION
A stability indicating RP-HPLC method for
simultaneous estimation of Metronidazole,
Clindamycin and Clotrimazole in bulk and
pharmaceutical dosage forms is established. The
method is simple, accurate, linear, sensitive and
reproducible as well as economical for the effective
quantitative analysis of Metronidazole,
Clindamycin and Clotrimazole in bulk and
combined dosage forms. The method was
validated, and all the method validation parameters
were tested and shown to produce satisfactory
results. The method is free from interactions of the
other ingredients and excipients used in the
formulations. Finally, concluded that the method is
suitable for use in the routine quality control
analysis of Metronidazole, Clindamycin and
Clotrimazole in active pharmaceutical ingredients
and in pharmaceutical dosage forms.
ACKNOWLEDGEMENTS
The authors would like to thank the management of
Dewcare Concept (P) Ltd, Gujarat, India for the
gift sample of drugs used in this investigation.
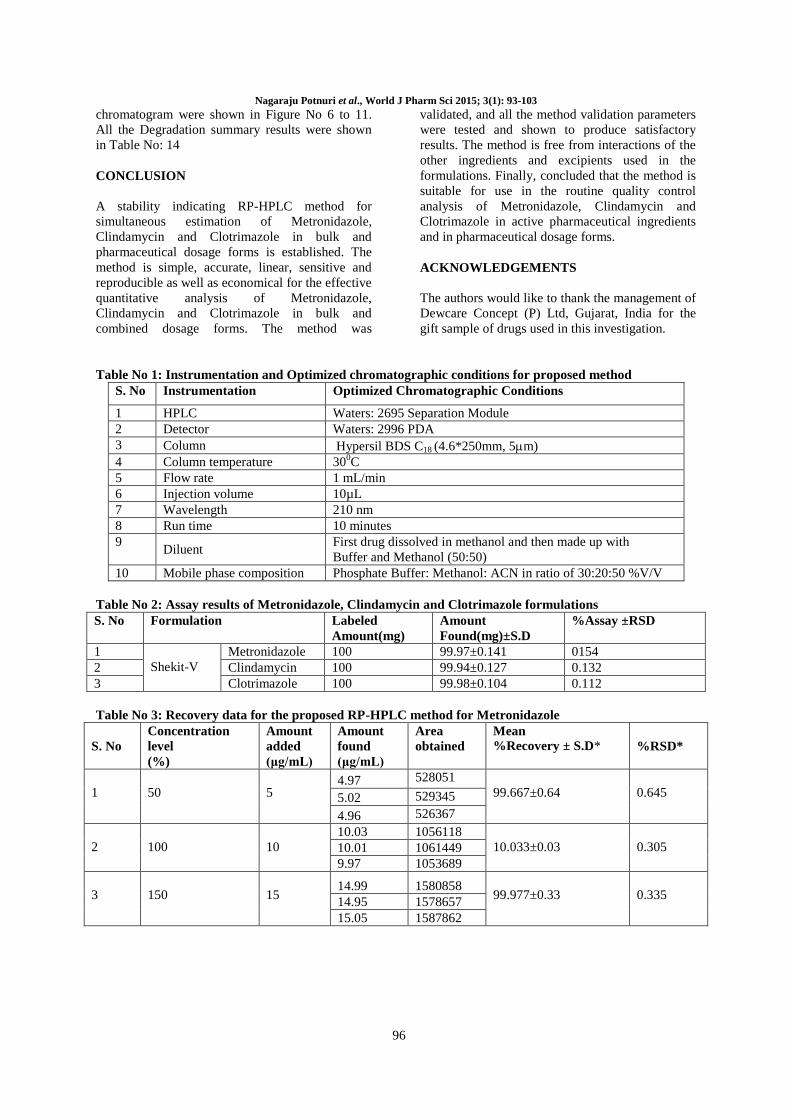
Table No 1: Instrumentation and Optimized chromatographic conditions for proposed method
S. No Instrumentation Optimized Chromatographic Conditions
1 HPLC Waters: 2695 Separation Module
2 Detector Waters: 2996 PDA
3 Column Hypersil BDS C18 (4.6*250mm, 5m)
4 Column temperature 300C
5 Flow rate 1 mL/min
6 Injection volume 10µL
7 Wavelength 210 nm
8 Run time 10 minutes
9 Diluent
First drug dissolved in methanol and then made up with
Buffer and Methanol (50:50)
10 Mobile phase composition Phosphate Buffer: Methanol: ACN in ratio of 30:20:50 %V/V
Table No 2: Assay results of Metronidazole, Clindamycin and Clotrimazole formulations
S. No Formulation Labeled
Amount(mg)
Amount
Found(mg)±S.D
%Assay ±RSD
1
Shekit-V
Metronidazole 100 99.97±0.141 0154
2 Clindamycin 100 99.94±0.127 0.132
3 Clotrimazole 100 99.98±0.104 0.112
Table No 3: Recovery data for the proposed RP-HPLC method for Metronidazole
S. No
Concentration
level
(%)
Amount
added
(μg/mL)
Amount
found
(μg/mL)
Area
obtained
Mean
%Recovery ± S.D*
%RSD*
1
50
5 4.97 528051
99.667±0.64
0.645 5.02 529345
4.96 526367
2
100
10
10.03 1056118
10.033±0.03
0.305 10.01 1061449
9.97 1053689
3
150
15 14.99 1580858
99.977±0.33
0.335 14.95 1578657
15.05 1587862
Nagaraju Potnuri et al., World J Pharm Sci 2015; 3(1): 93-103
97
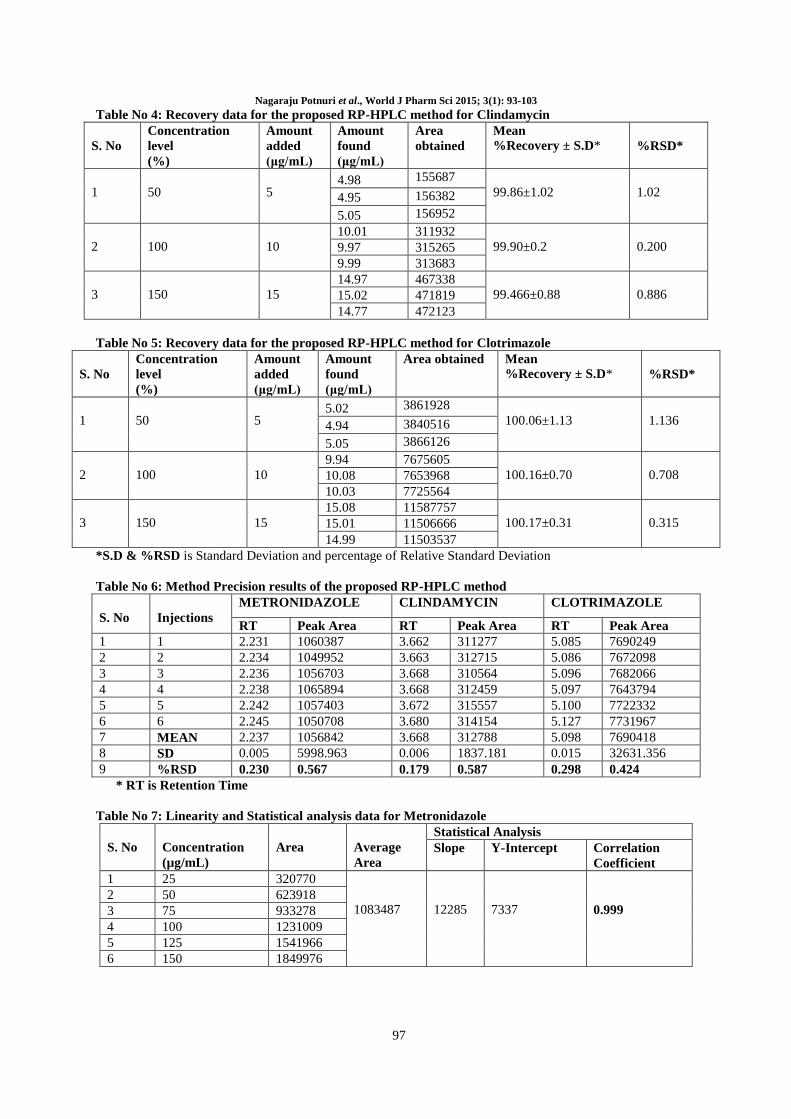
Table No 4: Recovery data for the proposed RP-HPLC method for Clindamycin
S. No
Concentration
level
(%)
Amount
added
(μg/mL)
Amount
found
(μg/mL)
Area
obtained
Mean
%Recovery ± S.D*
%RSD*
1
50
5 4.98 155687
99.86±1.02
1.02 4.95 156382
5.05 156952
2
100
10
10.01 311932
99.90±0.2
0.200 9.97 315265
9.99 313683
3
150
15
14.97 467338
99.466±0.88
0.886 15.02 471819
14.77 472123
Table No 5: Recovery data for the proposed RP-HPLC method for Clotrimazole
S. No
Concentration
level
(%)
Amount
added
(μg/mL)
Amount
found
(μg/mL)
Area obtained Mean
%Recovery ± S.D*
%RSD*
1
50
5 5.02 3861928
100.06±1.13
1.136 4.94 3840516
5.05 3866126
2
100
10
9.94 7675605
100.16±0.70
0.708 10.08 7653968
10.03 7725564
3
150
15
15.08 11587757
100.17±0.31
0.315 15.01 11506666
14.99 11503537
*S.D & %RSD is Standard Deviation and percentage of Relative Standard Deviation
Table No 6: Method Precision results of the proposed RP-HPLC method
S. No
Injections
METRONIDAZOLE CLINDAMYCIN CLOTRIMAZOLE
RT Peak Area RT Peak Area RT Peak Area
1 1 2.231 1060387 3.662 311277 5.085 7690249
2 2 2.234 1049952 3.663 312715 5.086 7672098
3 3 2.236 1056703 3.668 310564 5.096 7682066
4 4 2.238 1065894 3.668 312459 5.097 7643794
5 5 2.242 1057403 3.672 315557 5.100 7722332
6 6 2.245 1050708 3.680 314154 5.127 7731967
7 MEAN 2.237 1056842 3.668 312788 5.098 7690418
8 SD 0.005 5998.963 0.006 1837.181 0.015 32631.356
9 %RSD 0.230 0.567 0.179 0.587 0.298 0.424
* RT is Retention Time
Table No 7: Linearity and Statistical analysis data for Metronidazole
S. No
Concentration
(µg/mL)
Area
Average
Area
Statistical Analysis
Slope Y-Intercept Correlation
Coefficient
1 25 320770
1083487
12285
7337
0.999
2 50 623918
3 75 933278
4 100 1231009
5 125 1541966
6 150 1849976

Nagaraju Potnuri et al., World J Pharm Sci 2015; 3(1): 93-103
98
Table No 8: Linearity and Statistical analysis data for Clindamycin
S. No
Concentration
(µg/mL)
Area
Average
Area
Statistical Analysis
Slope Y-Intercept Correlation
Coefficient
1 25 90163
322663
3723
2718
0.999
2 50 180540
3 75 275080
4 100 370938
5 125 461161
6 150 558093
Table No 9: Linearity and Statistical analysis data for Clotrimazole
S. No
Concentration
(µg/mL)
Area
Average
Area
Statistical Analysis
Slope Y-Intercept Correlation
Coefficient
1 25 1921943
6385509
72477
37486
0.999
2 50 3638642
3 75 5435830
4 100 7316584
5 125 9100014
6 150 10900039
Table No 10: Robustness results of the proposed RP-HPLC method for Metronidazole
S. No
Parameters
Peak Area
RT*
USP
Optimized Used Plate
Count
Tailing
Factor
1
Flow rate ( ±0.2)
1 mL/min
0.8 1168256 2.449 2549 0.93
1.2 1064695 2.273 2605 0.89
2
Temperature ( ±50c)
300c
25 1168256 2.449 2549 0.93
35 1072359 2.273 2603 0.89
3
Mobile phase
composition (± 5%)
30:20:50
25:30:45 988254 2.276 2471 0.92
35:10:55 1075190 2.445 2275 0.93
Table No 11: Robustness results of the proposed RP-HPLC method for Clindamycin
S. No
Parameters
Peak Area
RT*
USP
Optimized Used Plate
Count
Tailing
Factor
1
Flow rate ( ±0.2)
1 mL/min
0.8 334147 3.975 5010 1.39
1.2 307212 3.678 4723 1.38
2
Temperature ( ±50c)
300c
25 337974 3.975 4979 1.42
35 310739 3.678 4698 1.40
3
Mobile phase
composition (± 5%)
30:20:50
25:30:45 245773 3.689 4890 1.38
35:10:55 267727 3.906 5036 1.39
Table No 12: Robustness results of the proposed RP-HPLC method for Clotrimazole
S. No
Parameters
Peak
Area
RT*
USP
Optimized Used Plate
Count
Tailing
Factor
1
Flow rate ( ±0.2)
1 mL/min
0.8 8421299 5.510 4990 1.03
1.2 7675106 5.099 4958 1.07
2
Temperature ( ±50c)
300c
25 8433990 5.510 4988 1.03
35 7690710 5.099 4954 1.07
3
Mobile phase
composition (± 5%)
30:20:50
25:30:45 6190578 5.114 6601 1.14
35:10:55 6837097 5.318 6477 1.13
* RT is Retention Time

Nagaraju Potnuri et al., World J Pharm Sci 2015; 3(1): 93-103
99
Table No 13: System Suitability Parameters of the proposed RP-HPLC method
Parameters METRONIDAZOLE CLINDAMYCIN CLOTRIMAZOLE
Linearity range(μg/mL) 25-150 25-150 25-150
Regression equation Y = 12285x + 7337 Y = 3723x - 2718 Y = 72477x + 37486
Correlation coefficient(r2) 0.999 0.999 0.999
Retention time (minutes) 1.636 2.289 4.928
Theoretical plates 3605 5178 7880
Tailing factor 0.95 1.40 0.93
Limit of Detection (μg/mL) 1.77 2.55 1.28
Limit of Quantitation (μg/mL) 5.35 7.77 5.25
Capacity factor (k) 1.045 1.018 1.025
Wavelength-Isosbestic point 210
Table No 14: Forced Degradation results of proposed RP-HPLC method
Degradation conditions
METRONIDAZOLE CLINDAMYCIN CLOTRIMAZOLE
Purity of Purity of Purity of
Angle Threshold Angle Threshold Angle Threshold
Control sample -- -- -- -- -- --
Acidic Degradation 0.222 0.292 0.636 1.442 0.157 0.627
Alkali Degradation 0.133 0.282 0.257 0.434 0.111 0.659
Oxidative Degradation 0.133 0.282 0.257 0.434 0.111 0.659
Thermal Degradation 0.149 0.288 0.178 0.357 0.124 0.883
Photo Degradation 0.883 0.283 0.239 0.430 0.121 0.694
Neutral Degradation 0.145 0.284 0.245 0.245 0.152 0.731
Fig No 1: Metronidazole
Fig No 2: Clindamycin
Fig No 3: Clotrimazole
Nagaraju Potnuri et al., World J Pharm Sci 2015; 3(1): 93-103
100
Fig No 4: RP-HPLC Chromatogram of Metronidazole, Clindamycin and Clotrimazole
Fig No 5: RP-HPLC Chromatogram of Metronidazole, Clindamycin and Clotrimazole formulation
Fig No 6: Chromatogram of Metronidazole, Clindamycin and Clotrimazole for Acidic Degradation

Nagaraju Potnuri et al., World J Pharm Sci 2015; 3(1): 93-103
101
Fig No 7: Chromatogram of Metronidazole, Clindamycin and Clotrimazole for Alkali Degradation
Fig No 8: Chromatogram of Metronidazole, Clindamycin and Clotrimazole for Oxidative Degradation
Fig No 9: Chromatogram of Metronidazole, Clindamycin and Clotrimazole for Thermal Degradation

Nagaraju Potnuri et al., World J Pharm Sci 2015; 3(1): 93-103
102
Fig No 10: Chromatogram of Metronidazole, Clindamycin and Clotrimazole for Photo Degradation
Fig No 11: Chromatogram of Metronidazole, Clindamycin and Clotrimazole for Neutral Degradation
Graph No 1:Linearity Graph of Metronidazole, Clindamycin & Clotrimazole
Nagaraju Potnuri et al., World J Pharm Sci 2015; 3(1): 93-103
103
REFERENCES 1. Sean C. Sweetman., Martindale: The complete drug reference, 37th Ed, Pharmaceutical Press, London, 2011, 924.
2. Lamp KC et al. Lacy M.K.Pharmacokinetics and pharmacodynamics of the nitroimidazole antimicrobials. Clin Pharmacokinet 1999;
36(5): 353-373. 3. A. Menelau et al. Simultaneous quantification of amoxicillin and metronidazole in plasma using high-performance liquid
chromatography with photodiode array detection. J. Chromatogr. 1999; B 731: 261-266.
4. C. Hoffmann et al. Comparative bioavailability of metronidazole formulations (Vagimid) after oral and vaginal administration. Int. J. Clin. Pharmacol. Ther. 1995; 33: 232-239.
5. A. Menelau et al. Simultaneous quantification of amoxicillin and metronidazole in plasma using high-performance liquid
chromatography with photodiode array detection. J. Chromatogr.1999; B 731: 261-266. 6. P.T. Pollak. A liquid chromatography assay for the study of serum and gastric juice metronidazole concentrations in the treatment of
Helicobacter pylori. Ther. Drug Monitoring.1996; 18: 678-687.
7. J.I.D. Wibawa et al. Quantification of metronidazole in small volume biological samples using narrow bore high-performance liquid chromatography. J. Chromatogr. 2001; B 761: 213-219.
8. Sean C. Sweetman., Martindale: The complete drug reference, 37th Ed, Pharmaceutical Press, London, 2011, 272.
9. Merck & co. Inc., The Merck Index, an Encyclopedia of Chemicals, Drugs and Biologicals, 14th Ed., white house station, New Jersey,
2006, 2356.
10. A. Forist et al. Clindamycin Bioavailability from Clindamycin-2-Palmitate and Clindamycin-2-Hexadecylcarbonate in Man. Journal of
Pharmacokinetics and Biopharmaceutics. 1973; 1(2), 89-98. 11. Seth SD, Seth V. Text book of pharmacology, 3rd Ed. India: Elsevier; 2009; X 91-98.
12. Sean C. Sweetman., Martindale: The complete drug reference, 37th Ed, Pharmaceutical Press, London, 2011, 317.
13. Merck & co. Inc., The Merck Index, an Encyclopedia of Chemicals, Drugs and Biologicals, 14th Ed., white house station, New Jersey, 2006, 941.
14. ICH Q2 (R1), Validation of Analytical Procedures: Text and Methodology. 2005. 15. Hildegard Brummer. How to approach a forced degradation study, life science technical bulletin, 2011; 31: 1-4.
16. George Ngwa., Forced Degradation as an Integral Part of HPLC stability indicating method development, Drug delivery technology,
2010; 10(5): 56-59.