A sport and physical activity needs assessment for children ...
195
A sport and physical activity needs assessment for children and young people In the London boroughs of Camden and Islington September 2013 Produced by
-
Upload
khangminh22 -
Category
Documents
-
view
3 -
download
0
Transcript of A sport and physical activity needs assessment for children ...

A sport and physical activity needs assessment
for children and young people
In the London boroughs of Camden and Islington
September 2013
Produced by
2
Contents
List of figures and tables
Executive summary
1 Introduction 14
1.1 Origins of the report 14
1.2 The importance of a physically active population 14
1.3 Project objectives 16
1.4 The approach 16
1.5 Scope and definitions of the research 18
1.6 Structure of the report 20
2 The strategic context 21
2.1 Introduction 21
2.2 National policy context 23
2.3 London and sub-regional policy context 28
2.4 Local demographics 30
2.5 Local policy context 33
3 Methodology 40
3.1 Introduction 41
3.2 Project steering group 42
3.3 Project initiation 42
3.4 Desk research 42
3.5 Semi-structured telephone interviews – key stakeholders 43
3.6 Focus groups – key children and young people groups 43
3.7 Online stakeholder survey – range of providers 44
3.8 Children and young people survey (CYP survey) – primary and secondary schools 45
3.9 Community health environment scan survey (CHESS) 47
3.10 Structured activity in CHESS zones 48
3.11 Facilitated workshop 49
3.12 Report preparation 49
3.13 Limitations 49
3
4 Findings 52
4.1 Introduction 52
4.2 Current participation 53
4.3 Barriers and motivations 65
4.4 Demand 105
4.5 Supply 118
5 Recommendations 163
6 References 189
Appendices
A – Camden’s policies that relate to physical activity and young people
B – Pro-Active Camden’s strategy content relevant to young people
C – Islington’s policies that relate to physical activity and young people
D – Pro-Active Islington strategy action plan - actions relevant to this project
E – Project steering group members and dates
F – List of telephone interviews undertaken
G – Stakeholder survey
H – Breakdown of the types of organisations who responded to the stakeholder survey
I – CYP survey – primary school
J – CYP survey – secondary school
K – Details of the dates and times of CHESS scans
L – Full list of identified needs
M – Measuring participation
Annexes
Community Health and Environment Scan Surveys (CHESS) reports
1 – The Somers Town Community Association
2 – The Queen’s Crescent Community Association (QCCA)
3 – The Surma Community Centre Youth Project (West Euston)
4 – Fresh Youth Academy and The Zone youth clubs

4
5 – The Lift Youth Centre
6 – The Platform Arts Venue for Young People
5
List of figures and tables
Figure Page number
Figure 1: Diagram outlining the logic approach taken to the needs assessment
17
Figure 2: Components of physical activity (adapted from Start Active, Stay Active)
19
Figure 3: Policies and investments that potentially impact upon sport and physical activity for young people
24
Figure 4: Methodology summary
41
Figure 5: CYP survey results showing the proportion of young people in primary and secondary schools in Camden and Islington who achieved HSE 2008 ‘meets’, ‘some’ and ‘low’ categories on participation in sport and physical activity
55
Figure 6: CYP survey results showing the proportion of young people in primary and secondary schools in Camden and Islington and the number of days they participated in over 60 minutes of physical activity during the previous week
56
Figure 7: HSE 2008 results showing the proportion of boys and girls aged 2 – 15 nationally who meet CMO recommended guidelines for physical activity
58
Figure 8: CYP results showing the proportion of girls and boys in primary and secondary schools in Camden and Islington and the number of days they participated in over 60 minutes of physical activity during the previous week
59
Figure 9: HSE 2008 results showing the proportion of children meeting CMO recommendations for physical activity by equivalised household income and gender
60
Figure 10: CYP survey results showing primary and secondary school girls and boys preference for physical activity over other activities
64
Figure 11: CYP survey results showing the proportion of young people who chose certain reasons why they don’t do more physical activity (respondents were able to choose three options from the full list)
69
Figure 12: CYP survey results showing the proportion of young people who chose certain reasons why they take part in physical activity (respondents were able to choose three options from the full list)
70
Figure 13: CYP survey results showing various reasons why young people said they don’t take part in more physical activity in relation to the amount of physical activity they’d done during the previous week
73
Figure 14: CYP survey results showing various reasons why young people said they take part in physical activity in relation to the amount of physical
76
6
activity they’d done during the previous week Figure 15: CYP survey results showing the words chosen by primary school respondents when asked to describe the perfect place they would exercise (shown as a ‘word cloud’ where most commonly used words appear larger)
114
Figure 16: CYP survey results showing the words chosen by secondary school respondents when asked to describe the perfect place they would exercise (shown as a ‘word cloud’ where most commonly used words appear larger)
117
Figure 17: Stakeholder survey results showing community providers and schools’ motivations for providing physical activities to young people in Camden
145
Figure 18: Stakeholder survey results showing groups specifically targeted by providers in Camden
146
Figure 19: Stakeholder survey results showing the challenges providers in Camden face when trying to get young people to take part in physical activity
147
Figure 20: Stakeholder survey results showing community providers and schools’ motivations for providing physical activities to young people in Islington
148
Figure 21: Stakeholder survey results showing groups specifically targeted by providers in Islington
149
Figure 22: Stakeholder survey results showing the challenges providers in Islington face when trying to get young people to take part in physical activity
150
Figure 23: Stakeholder survey results showing factors that would support providers to get young people physically active in Camden
151
Figure 24: Stakeholder survey results showing factors that would support providers to get young people physically active in Islington
152
Figure 25: Stakeholder survey results showing provider views on what attracts young people to take part in their activities - Camden
153
Figure 26: Stakeholder survey results showing provider views on what attracts young people to take part in their activities - Islington
153
Figure 27: Stakeholder survey results showing the words chosen by providers when asked how it might be possible to get more young people active (shown as a ‘word cloud’ where most commonly used words appear larger)
154
Figure 28: Stakeholder survey results showing the most effective ways providers have found to promote physical activity to young people in Camden
157
7
Figure 29: Stakeholder survey results showing the most effective ways providers have found to promote physical activity to young people in Islington
157
Figure 30: CYP survey results showing ways in which young people would like to find out about exercise opportunities
158
Figure 31: The complexity and speed of impact proposed for the recommendations
164
Table
Page number
Table 1: Chief Medical Officers’ (CMO) physical activity guidelines for young people
22
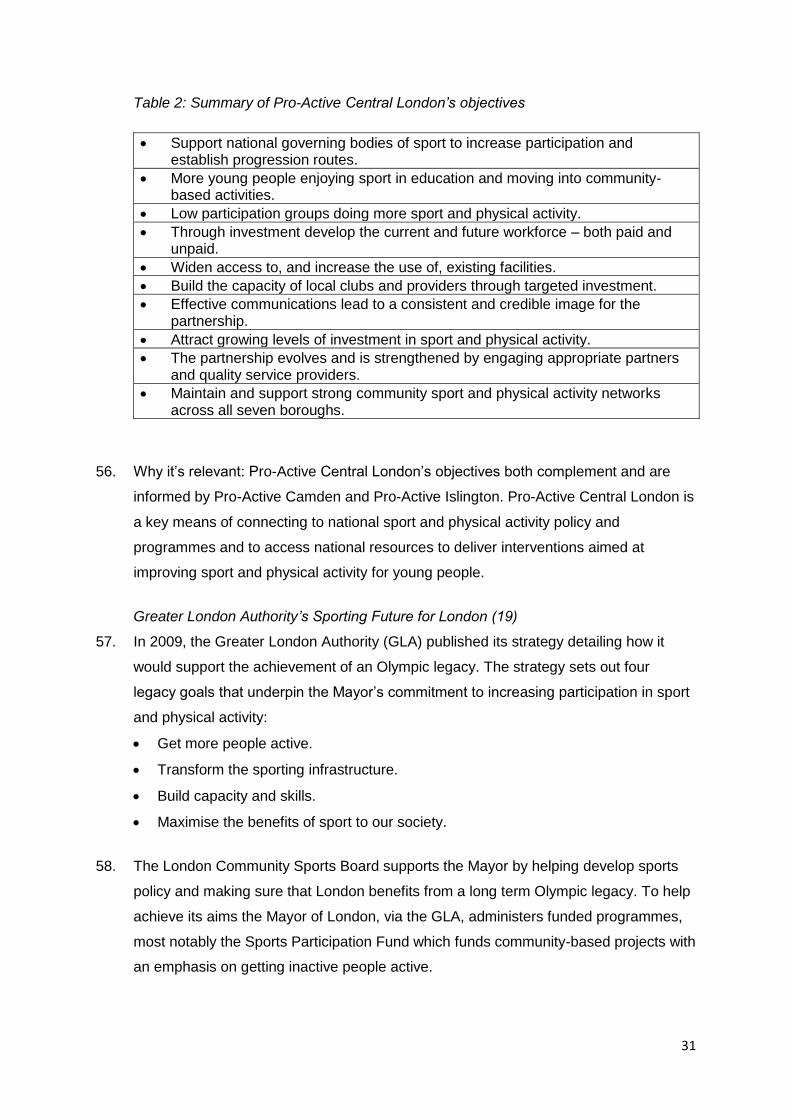
Table 2: Summary of Pro-Active Central London’s objectives
29
Table 3: Camden and Islington’s ethnic diversity compared against England and London
32
Table 4: Details of focus groups held in Camden and Islington
44
Table 5: Summary of CYP survey responses by school year
46
Table 6: HSE 2008 results showing the percentage of boys and girls achieving CMO recommended guidelines for physical activity
57
Table 7: CYP survey results showing young people’s preferences for physical activity over other activities
63
Table 8: Identified themes used to organise research findings into the barriers and motivators for young people when taking part in physical activity
67
Table 9: CYP survey results showing the top 10 activities which young people in Camden overall and young people in primary and secondary schools would like to do
107
Table 10: CYP survey results showing the top 10 activities which young people in Islington overall and young people in primary and secondary schools would like to do
108
Table 11: CYP survey results showing the top 10 activities young people in Camden and Islington would like to do
108
Table 12: CYP survey results showing the top 10 activities which girls and boys in Camden and Islington would like to do
109
Table 13: CYP survey results showing the top 10 activities different ethnic groups of young people would most like to do
110
Table 14: CYP survey results showing the top 10 activities young people with a disability would most like to do
111
8
Table 15: CYP survey results showing the activities young people with different preferences for physical activity would most like to do
112
Table 16: Taking Part survey results showing the top 10 sports young people between 5-10 and 11-15 participated in during the previous four weeks
113
Table 17: Results from focus group with parents of 5-8 year olds showing key factors, in priority order, for an ideal play space for their children to be active
116
Table 18: Data from Get Active London showing the clubs and activities available to disabled people in Camden
120
Table 19: Top 10 activities chosen by Camden respondents in the CYP survey when asked which activities they would like to do
121
Table 20: Results from the stakeholder survey showing activities provided by schools and community providers
122
Table 21: List of assets in Somers Town CHESS zone scanned by young people
123
Table 22: Number of facilities scanned in Somers Town CHESS zone and grade awarded
124
Table 23: Summary of findings and needs taken from Somers Town CHESS scan
125
Table 24: List of assets in QCCA CHESS zone scanned by young people
126
Table 25: Number of facilities scanned in QCCA CHESS zone and grade awarded
127
Table 26: Summary of findings and needs taken from QCCA CHESS scan
127
Table 27: List of assets in Surma Centre CHESS zone scanned by young people
129
Table 28: Number of facilities scanned in Surma Centre CHESS zone and grade awarded
130
Table 29: Summary of findings and needs taken from the Surma Centre CHESS scan
130
Table 30: List of assets in Fresh Youth Academy/The Zone CHESS zone scanned by young people
132
Table 31: Number of facilities scanned in Fresh Youth Academy/The Zone CHESS zone and grade awarded
133
Table 32: Summary of findings and needs taken from Fresh Youth Academy/The Zone CHESS scan
133
Table 33: Data from Get Active London showing the clubs and activities available to disabled people in Islington
135
9
Table 34: Top 10 activities chosen by Islington respondents in the CYP survey when asked which activities they would like to do
136
Table 35: Results from the stakeholder survey showing activities provided by schools and community providers
137
Table 36: List of assets in The Lift CHESS zone scanned by young people
139
Table 37: Number of facilities scanned in The Lift CHESS zone and grade awarded
140
Table 38: Summary of findings and needs taken from The Lift CHESS scan
140
Table 39: List of assets scanned in Platform CHESS zone by young people
142
Table 40: Number of facilities scanned in Platform CHESS zone and grade awarded
143
Table 41: Summary of findings and needs from the Platform CHESS scan
143
Table 42: Number of hours of structured activity sessions a week required for 0-18 year olds in CHESS zones based on current population estimates
161
Table 43: Number of hours of structured activity a week required based on future population predictions
162
10
A sport and physical activity needs assessment for children and young people in the
London boroughs of Camden and Islington
Executive summary
This report provides an analysis of data collected as part of a research project funded by
Camden Council and Islington Council. The research sought to understand the needs of the
boroughs in their provision of physical activity for young people aged 0-18 (0-25 for disabled
young people) with a view to increasing their participation in it.
Research areas
The research focussed on the following areas:
Strategic context - Local and national policies which relate to physical activity for young
people.
Participation - The extent to which young people in Camden and Islington participate in
physical activity.
Motivations and barriers - The factors which provide barriers and motivations to young
people when taking part in sport and physical activity.
Supply and demand - The supply and demand of sport and physical activity opportunities
for young people.
Methodology
The research was carried out between March and August 2013 using a mixed methodology
approach. Both qualitative and quantitative information was collected from a range of
sources and perspectives to meet the project objectives. These included:
A survey of young people (CYP survey) - 1,696 responses across 37 primary and 11
secondary schools.
Six focus groups with various cohorts of young people, parents/carers and sport and
physical activity stakeholders.
34 telephone interviews with a range of stakeholders.
Desk research.
A survey of 73 local stakeholders.
11
Community health environment scan survey (CHESS) - assessments of six identified
geographical areas of need. These were carried out by local young people walking
around the areas, providing insight and opinion.
Findings
The following headline findings were found in each of the research areas:
Strategic context findings:
There is significant wider research evidence of the contribution that physical activity can
make to prevent non-communicable diseases. This has led to greater emphasis in
national, regional and local policy on improving physical activity levels.
Most of the key policies related to increasing physical activity levels within Camden and
Islington have a common thread. This is to recognise the benefits physical activity can
have on improving the lives of young people.
There is no national system for measuring the physical activity levels of all young people.
In comparison to London and England, Camden and Islington both share characteristics
which have been evidenced to impact negatively on the physical activity levels of young
people. These include:
o A high density population.
o An ethnically diverse population.
o High childhood obesity rates.
o Areas of significant deprivation and high levels of child poverty.
Participation findings:
There is a low level of participation in physical activity among young people in Camden
and Islington, with only 11% of all respondents to the CYP survey meeting the Chief
Medical Officers’ (CMO) guidelines (recommendations on how much physical activity
people should do to be healthy).
Levels of physical activity decrease as young people get older.
Lower levels of activity were reported across all ages by girls than boys. The decline in
participation as girls get older is also steeper.
Participation in physical activity by young people in Camden and Islington did not change
depending on socio-economic status or the deprivation of the area lived in.
Disabled young people were found to have lower participation levels than non-disabled
young people. 41% of disabled young people reported doing 60 minutes of physical
activity on zero days in the last week compared to 32% of non-disabled people.
12
Lower participation in physical activity was reported by those from an Asian/Asian British
background and in particular, those of an Asian/Asian British – Bangladeshi background.
National research suggests a growing concern at the risk of sedentary behaviour.
Motivations and barriers findings:
The motivations and barriers that influence young people’s participation have been
grouped into five themes – personal priorities, self-perception, impact of others,
perception/experience of provision and environmental context.
For girls and disabled young people some of the barriers and motivators were
particularly evident.
For girls the significant barriers affecting levels of participation were:
o Lack of a physical activity habit formed at an early age.
o Lack of confidence when it comes to physical activity and sport.
o Self-consciousness when taking part.
o Lack of role models.
o Availability of suitable activities.
For disabled young people the significant barriers affecting their participation were:
o Reluctance to travel.
o Lack of confidence.
o Parental affordability.
o Availability of suitable activities.
Some young people can’t take part in physical activities because their parents can’t
afford to pay for them. This is a particular concern for parents with multiple siblings,
those from low income backgrounds, those with children with learning disabilities and
parents of under-5s.
Demand findings:
The top five activities most in demand from young people that responded to the CYP
survey were (in rank order) football, tennis, bowling, trampolining and dodgeball.
There are considerable differences between primary and secondary aged young people
in terms of the activities they would most like to do as well as between girls and boys
across Camden and Islington.
Young people were asked what their perfect places to exercise in would look like.
Responses to this question suggest that they would like environments that:
o Offer a choice or a variety of activities.
o Enable them to be with friends.
o Have lots of space.
13
o Are local to them.
Supply findings:
Get Active London (the main single source of information on how to be active in
Camden and Islington) has limited information on the activities young people and
disabled young people in Camden and Islington are most interested in.
Catering for demand is sometimes an issue for approximately half of the providers that
responded to the stakeholder survey. The majority of providers think that demand for
physical activity provision will increase in the next five years. However, these providers
stated a lack of funding, a lack of facilities and a lack of qualified staff/volunteers as the
key challenges in relation to getting more young people active.
Evidence from the areas explored through the CHESS scans suggests that those parts
of the boroughs lack a range of high quality, age-appropriate facilities for young people
to be active in. Many of the outdoor facilities reviewed by young people in the CHESS
zones were deemed to be in need of improvement (34% needing significant
improvement and 47% needing some improvement).
Young people have a variety of needs when it comes to physical activity opportunities
and these should be reflected by the provision that is available. Consideration must be
given to catering for a range of skill levels, providing competition for some, but not
others and for learning and achievement, but again, not for all. The need to provide
social, fun and safe physical activities also came out strongly.
In the areas explored through CHESS, the young people identified a number of access
issues that prevented or could prevent their use of physical activity facilities such as
children’s playgrounds and multi-use games areas. These issues included facilities
being poorly lit, locked, situated within gated communities and signs which create a
negative perception of the facility e.g. signs warning against drug use. The evidence
also suggests the need to improve access for young people to school facilities outside
of the school day.
The assessment of structured provision (physical activity opportunities led by an adult)
within the CHESS zones suggests that if young people are to have access to three
hours of structured physical activity a week then there is need for a significant increase
in supply.
The production of this research was made more difficult by the lack of information
available about young people’s physical activity habits. While many services within the
councils, and their commissioned leisure contractors, collate data about when and how
young people are being physically active, it has been found that this is often piecemeal,
inconsistent and incomplete.
14
Recommendations
The following recommendations have been made:
Easing the path to a physically active lifestyle
1. Establish a physical activity pathway to help all young people become more physically
active.
2. Encourage all young people to form a physically active lifestyle.
Using data to make the right decisions
3. Establish a toolkit based on the National Obesity Observatory’s standard evaluation
framework for physical activity to monitor and evaluate young people’s participation in
physical activity.
4. Collate and integrate data across services on young people’s participation in physical
activity.
Getting the right message across
5. Raise awareness of the recommended levels of physical activity for young people to be
healthy.
6. Improve the promotion and communication of physical activity provision across the
boroughs.
Places to be active
7. Improve the quality, range and appropriateness of facilities and other places for physical
activity.
8. Ensure young people have more access to all community assets.
A suitable workforce
9. Develop the workforce so that it is better able to engage with and respond to the physical
activity needs of all young people.
Activities for all
10. Make more activities more affordable.
11. Create more, and a greater choice of, physical activity opportunities.
12. Ensure provision is high quality, appropriate and tailored to the differing needs of young
people.
Reducing inequalities

15
13. Increase levels of physical activity among girls.
14. Increase levels of physical activity among disabled people.
16
Section 1
Introduction
1.1 Origins of the report
1. In February 2013, Pro-Active Camden and Pro-Active Islington, the borough-wide
strategic partnerships for sport and physical activity in Camden and Islington,
commissioned Press Red, a sport and physical activity consultancy, to undertake a
sport and physical activity needs assessment for children and young people across the
boroughs of Camden and Islington. By understanding young people’s needs in this
context, the aim was for the partnerships to obtain a robust evidence base from which
to further enhance the planning and implementation of sport and physical activity
services for young people.
2. This needs assessment was undertaken during a period in which sport and physical
activity was in the spotlight like never before. The London 2012 Olympic and
Paralympic Games laid down a challenge to create a legacy that inspired a generation
of young people to be active (1). An overarching backdrop to the project was to
support the creation of this Olympic legacy in Camden and Islington.
1.2 The importance of a physically active population
3. An overall increase in participation in physical activity (including sport) has the
potential to improve the physical and mental health of the population, reduce all-cause
mortality and improve life expectancy (2). Physical activity (including sport) is
associated with reduced risk of over 20 health conditions including cardiovascular
disease, type 2 diabetes and some cancers (3).
4. Since this connection between physical activity and health was made in the 1950s a
strong body of evidence on the health benefits of sport and physical activity has grown
(2). This has led to the CMO recommending physical activity levels for the general
population which can deliver health benefits that also serve to raise awareness of the
health impact of leading an inactive lifestyle (2).
17
5. Recently there has been greater emphasis on taking a ‘life course approach’ to
physical activity; it has become increasingly recognised that it is important to be active
throughout our lives. Physical activity is central to a baby’s normal growth and
development. This continues through school and into adulthood and older years. In
2011, the recommended physical activity levels were amended to include specific
guidance for early years (0-5 years) and children and young people (5-18 years) (2).
6. Existing research (4) suggests that there is a significant gap between the physical
activity levels recommended by the CMO and the actual levels being undertaken. The
Health Survey of England 2008 (HSE 2008), the largest study of its kind, suggests that
only a third of boys and a quarter of girls meet the recommended levels (4).
7. The consequences of physical inactivity are quite striking. In the UK, it is estimated
that physical inactivity causes (5):
10.5% of coronary heart disease cases.
18.7% of colon cancer cases.
17.9% of breast cancer cases.
13% of type 2 diabetes cases.
16.9% of premature all-cause mortality.
8. The burden of physical inactivity on the economy has become an increasingly
prevalent issue. In 2006/07, the estimated cost of physical inactivity to the NHS was
(5):
£117m for stroke.
£542m for heart disease.
£65m for colorectal cancers.
£54m for breast cancer.
£158m for type 2 diabetes.
9. For year 2009/10 the costs of physical inactivity in Camden and Islington were
estimated at £3,328,600 and £3,146,477 respectively (6).
10. Participation in sport and physical activity brings with it a wider range of other benefits
for young people than just health, including:
Learning social skills.
Developing key workplace skills such as teamwork and leadership.
Experiencing winning and losing.

18
Improving educational attainment (7).
11. Taking part in sport and physical activity is a way for young people to engage in
positive activities which build their resilience, social and emotional skills (8). There is
also growing evidence that it can contribute to wider social outcomes such as crime
reduction, less anti-social behaviour and greater social cohesion, as well as reduced
pollution and congestion through active travel (2).
1.3 Project objectives
12. The project objectives outlined in the original request for quotation document were to:
Identify and assess the current physical activity offer for young people and highlight
gaps in provision.
Identify the barriers to participation experienced by young people.
Identify the factors that contribute to young people being physically active.
Identify and demonstrate an evidence base of current need for physical activity
participation to inform future resource allocation.
Develop a forecast for longer term need for physical activity.
Make recommendations on the provision of physical activity in Camden and
Islington identifying:
o Future delivery of activity and targeted interventions in the short and
medium term.
o How to develop an Olympic and Paralympic physical activity legacy offer.
o A method for recording long term measurement of physical activity levels
across each borough for individual projects.
13. The ultimate aim is for this needs assessment is to support the partnerships to
increase the physical activity levels of young people aged 0-18 (up to 24 years for
disabled people) across the two boroughs.
1.4 The approach
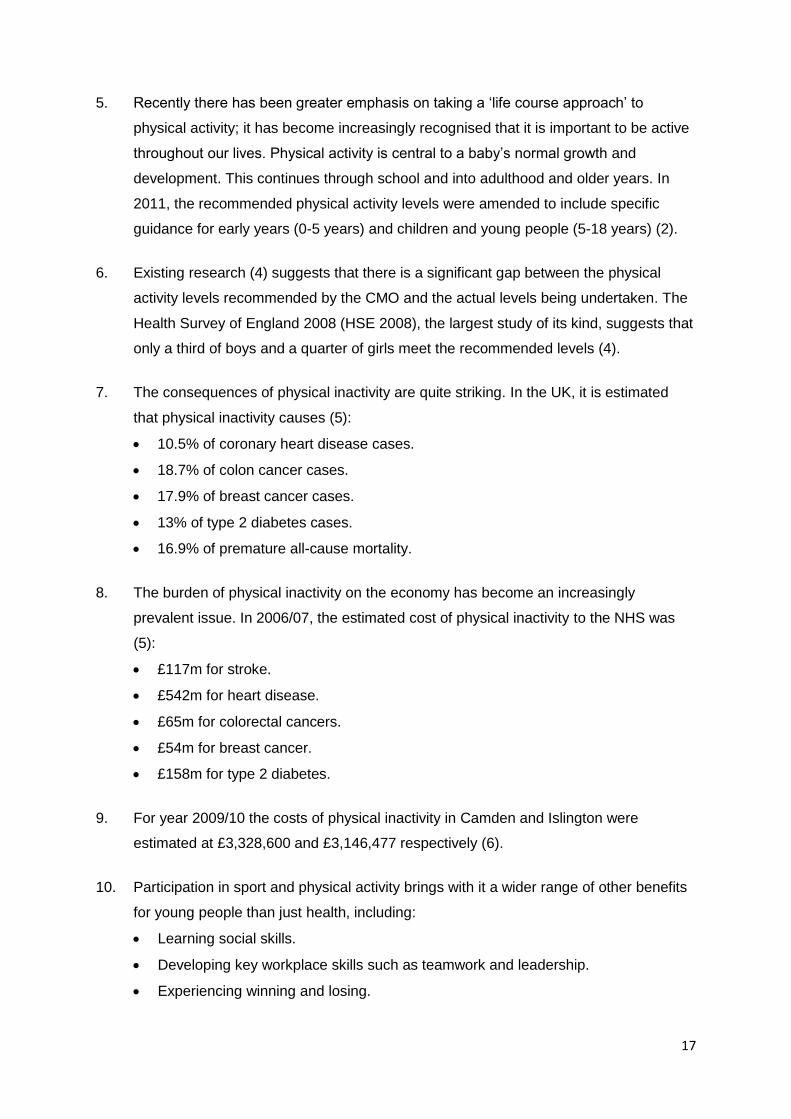
14. Figure 1 provides a diagrammatic explanation of the logic approach taken to this
needs assessment. A need has been defined as “a gap between real and ideal that is
both acknowledged by community values and potentially amenable to change” (9). For
this project, needs were found by identifying what is required to bridge the gap
between the real (i.e. current levels of participation) and the ideal (CMO
19
recommendations). Identified needs are then analysed to enable recommendations
and solutions for the future provision of physical activity to be made.
Figure 1: Diagram outlining the logic approach taken to the needs assessment
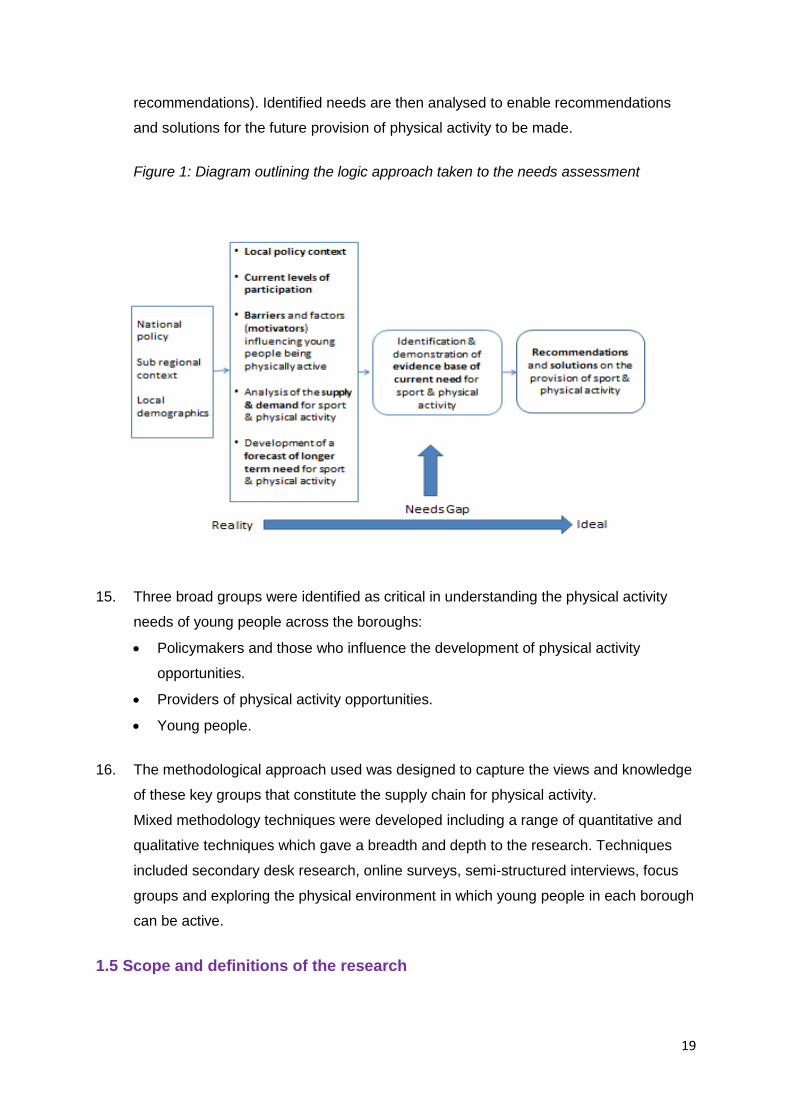
15. Three broad groups were identified as critical in understanding the physical activity
needs of young people across the boroughs:
Policymakers and those who influence the development of physical activity
opportunities.
Providers of physical activity opportunities.
Young people.
16. The methodological approach used was designed to capture the views and knowledge
of these key groups that constitute the supply chain for physical activity.
Mixed methodology techniques were developed including a range of quantitative and
qualitative techniques which gave a breadth and depth to the research. Techniques
included secondary desk research, online surveys, semi-structured interviews, focus
groups and exploring the physical environment in which young people in each borough
can be active.
1.5 Scope and definitions of the research
20
17. The research was focused on children and young people aged 0-18 (0-25 for disabled
people) who live, go to school or work in the boroughs. Throughout the report the
overarching term ‘young people’ is used to refer to children and young people, unless
referring to specific age groups.
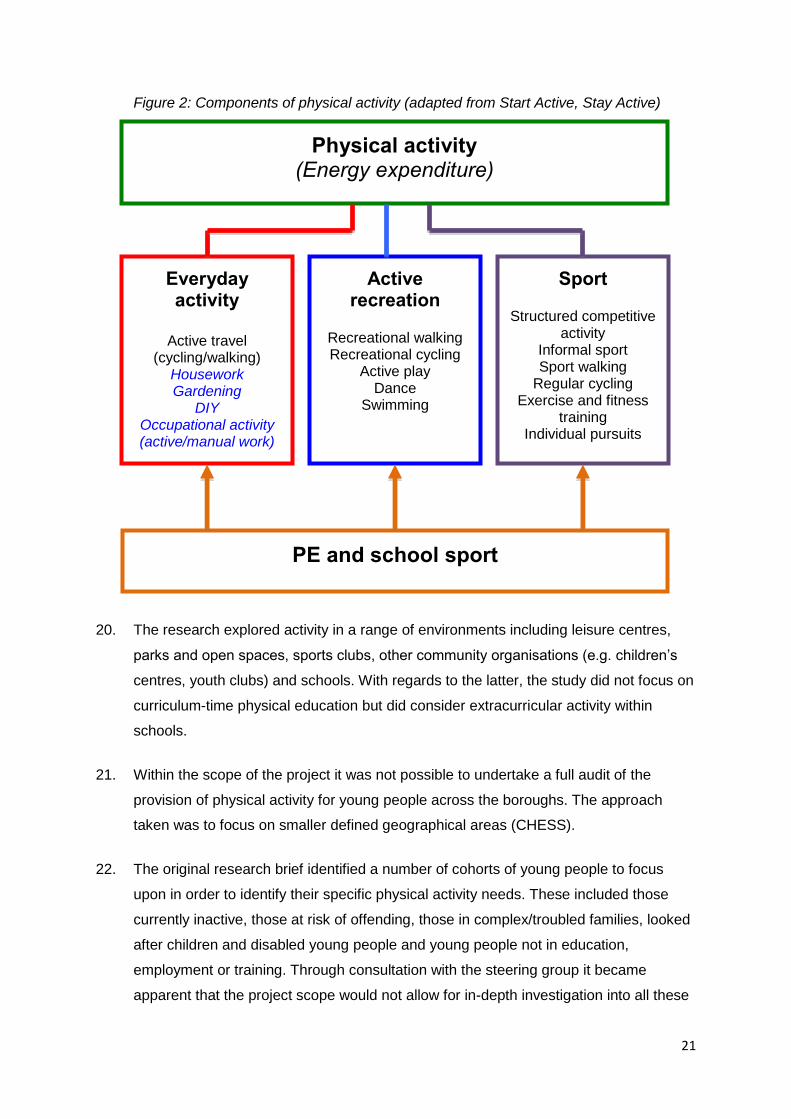
18. In line with Start Active, Stay Active (2011), this needs assessment includes all forms
of activity such as everyday walking or cycling to get from A to B, active play, work-
related activity, active recreation (such as working out in a gym), dancing, playing
active games, as well as organised and competitive sport (2). This is represented
diagrammatically in figure 2. Using this definition, sport is one of a number of ‘products’
that comes under the banner of ‘physical activity’. It should be noted that the scope of
this needs assessment did not include most elements of ‘everyday activity’.
Housework, gardening, DIY and occupational activities were not considered but active
travel was within the scope.
19. Throughout the report, the overarching term ‘physical activity’ is used unless
specifically discussing a physical activity sub-product such as ‘sport’, ‘exercise’ or
‘active play’. This is highlighted in figure 2:
21
Figure 2: Components of physical activity (adapted from Start Active, Stay Active)
20. The research explored activity in a range of environments including leisure centres,
parks and open spaces, sports clubs, other community organisations (e.g. children’s
centres, youth clubs) and schools. With regards to the latter, the study did not focus on
curriculum-time physical education but did consider extracurricular activity within
schools.
21. Within the scope of the project it was not possible to undertake a full audit of the
provision of physical activity for young people across the boroughs. The approach
taken was to focus on smaller defined geographical areas (CHESS).
22. The original research brief identified a number of cohorts of young people to focus
upon in order to identify their specific physical activity needs. These included those
currently inactive, those at risk of offending, those in complex/troubled families, looked
after children and disabled young people and young people not in education,
employment or training. Through consultation with the steering group it became
apparent that the project scope would not allow for in-depth investigation into all these
Physical activity
(Energy expenditure)
Everyday activity
Active travel
(cycling/walking) Housework
Gardening
DIY
Occupational activity
(active/manual work)
Active recreation
Recreational walking
Recreational cycling
Active play
Dance
Swimming
Sport
Structured competitive activity
Informal sport Sport walking
Regular cycling
Exercise and fitness training
Individual pursuits
PE and school sport

22
groups. As a result, emphasis was placed on young disabled people and young
women and girls without discounting the other groups identified.
23. The research did not consider the resources available either now or in the future to
provide physical activity services to young people. However, the aim was to build an
understanding of the broad resource parameters which partners within the Pro-Active
partnerships are operating within and to be realistic about what is possible.
1.6 Structure of the report
24. The report is structured in the following way:
Section 2 provides the overarching strategic context. It identifies the relevant
national, regional and borough-level policies relevant to sport and physical activity
for young people.
Section 3 provides a description of the project methodology and the various
research techniques employed.
Section 4 presents findings from the research. This includes current activity levels
among young people, identification of the factors that can impact on participation
levels, the barriers and motivations to being active faced by young people,
information on the supply of opportunities in the boroughs together with information
on the demand for activities from young people in Camden and Islington. Finally, a
forecast of longer term need for physical activity is presented.
Section 5 presents a series of key recommendations together with a range of
potential solutions.
Section 6 presents references for quoted sources used throughout the report.
23
Section 2
The strategic context
Summary
There is significant evidence that physical activity benefits the health and social
development of young people. In line with this the Chief Medical Officers
recommend that:
Children of pre-school age who are capable of walking unaided should be
physically active for at least 180 minutes spread throughout the day.
Children and young people aged 5-18 should engage in moderate to
vigorous intensity physical activity for at least 60 minutes every day.
There is no national system for measuring the physical activity levels of all young
people.
Relative to London and England, Islington and Camden both share
characteristics that impact negatively on the physical activity levels of young
people. Characteristics include a dense population, high ethnic diversity, high
obesity rates, many areas which are significantly deprived and high levels of
child poverty.
There has been a growing recognition in national, regional and local policy of the
need to increase physical activity levels in order to benefit the development of
young people and as a preventative action to reduce lifestyle-related diseases in
later life.
2.1 Introduction
25. This section provides an overview of national policies which relate to young people’s
physical activity, covering the following areas:
National policies.
London and sub-regional policies.
Local demographics.
Local policies.

24
26. Evidence on the importance of physical activity to health and wellbeing has grown
considerably in recent years. Physical inactivity is now regarded as the fourth leading
cause of global mortality (1). It is now widely recognised that regular physical activity
can reduce the risk of many non-communicable diseases including obesity, type 2
diabetes, coronary heart disease and certain types of cancer (2).
27. For young people, leading a physically active life can have many health benefits
including:
Immediate and long-term physical and psychological benefits (2).
The development of motor skills (2).
Maintaining a healthy weight (2).
Enhancing bone and muscular development (2).
Developing a healthy cardiovascular system (1).
28. Helping young people gain a habit for physical activity early in life and ensuring they
maintain high activity levels into adulthood will reduce the risk of non-communicable
diseases, which may impact later in life (2).
CMO guidelines
29. The Chief Medical Officers of the four home nations set out joint guidelines in 2011 for
the amount of physical activity that young people should do to achieve health benefits.
A summary of the guidelines can be found below (2):
Table 1: Chief Medical Officers’ physical activity guidelines for young people
EARLY YEARS (under-5s)
1. Physical activity should be encouraged from birth, particularly through floor-based play and water-based activities in safe environments.
2. Children of pre-school age who are capable of walking unaided should be physically active daily for at least 180 minutes (three hours), spread throughout the day.
3. All under 5s should minimise the amount of time spent being sedentary (being restrained or sitting) for extended periods (except time spent sleeping).
CHILDREN AND YOUNG PEOPLE (5–18 years)
1. All children and young people should engage in moderate to vigorous intensity physical activity for at least 60 minutes and up to several hours every day.
2. Vigorous intensity activities, including those that strengthen muscle and bone, should be incorporated at least three days a week.
3. All children and young people should minimise the amount of time spent being sedentary (sitting) for extended periods.
25
2.1.1 Measuring young people’s physical activity levels
30. HSE 2008 was the last England-wide measurement of the physical activity levels of
young people against the CMO recommendation of ‘an hour a day’. Currently there is
no national population-wide measurement of the physical activity levels of young
people. However, the Department for Culture, Media and Sport (DCMS) undertake the
Taking Part survey that tracks the frequency of young people’s participation in sport
(defined as having participated in a sporting activity for 30 minutes or more in the last
four weeks).
31. Moving forward, the DCMS and Sport England propose to integrate the sport element
of the Taking Part survey with Sport England’s Active People Survey. This will provide
national and local data on participation in sport for people aged 14 and over. It is
unknown whether these plans will lead to the measurement of physical activity levels
of young people aged 14 and over against the CMO guidelines. It is also unknown
whether there are plans to provide a national tool for measuring physical activity levels
or sports participation levels of young people under the age of 14.
2.2 National policy context
32. Over the last decade there has been a surge of new national policies which highlight
the need for young people to be active. The coalition government (and its partners)
has implemented a number of policies and investments that potentially impact upon
physical activity for young people. These policies are being implemented in an
extremely challenging economic environment with significant savings being made
across government departments.

26
Figure 3: Policies and investments that potentially impact upon physical activity for
young people
2.2.1 Young people
Every Child Matters (3)
33. In 2003 the previous government published Every Child Matters (ECM) in response to
the tragic death of Victoria Climbie. ECM was the national framework for local change
programmes to build services around the needs of young people. This framework was
underpinned by the Children Act 2004. At the heart of ECM was the desire for all
children, no matter what their background or circumstances, to achieve the following
five outcomes that were seen as key to wellbeing in childhood and later life:
Be healthy.
Stay safe.
Enjoy and achieve.
Make a positive contribution.
Achieve economic wellbeing.
34. Why it’s relevant: Children’s services in Camden and Islington are still working to these
outcomes.
HEALTH & PHYSICAL ACTIVITY
Previous administration
Marmot Review
Current government
Start Active Stay Active Healthy Lives Healthy People NICE Guidance
YOUNG PEOPLE
Previous administration
Every Child Matters
Current government
Early Years Foundation Framework
Positive for Youth School sport investment
LOCAL GOVERNMENT
Current government
Localism Bill
SPORT & 2012 LEGACY
Current government
Plans for the Legacy from the 2012 Olympic and Paralympic Games
Creating a Sporting Habit for Life
27
Early Years Foundation Stage (4)
35. Sets up the mandatory framework for all providers working with children under five
years old. It sets out the responsibilities of these providers to deliver a programme that
provides physical development opportunities which includes physical activity.
36. Why it’s relevant: It sets out the responsibilities of service providers in this key area to
ensure appropriate physical activity opportunities for this age group.
Positive for Youth (5)
37. The government’s cross-department strategy for young people aged 13-19 which
seeks to promote the voice of young people and the role they play in society. It sets
out a vision for “society that is positive for youth”. It also encourages continued
investment into positive activities for young people at a local level due to the benefits
that participation in these activities brings. It confirms the government’s commitment to
the School Games – a national school sport competition structure.
38. Why it’s relevant: It continues the previous government’s policy of asking local
government and its partners to ensure that there are appropriate positive activities
available to young people and that they know about them. It also provides funding to
help schools take part in the School Games.
School sport investment (6)
39. Investment has changed with the end of funding for the School Sport Partnership
infrastructure. New investment is being provided for the School Games (see above) as
well as ring-fenced funding for primary schools (£150m a year for 2013/14 and
2014/15) to spend on PE and school sport provision.
40. Why it’s relevant: This change of investment has had significant impact upon sport and
physical activity provision in and around schools, which presents different opportunities
moving forward.
2.2.2 Health and physical activity
Fair Society, Healthy Lives – The Marmot Review (7)
41. Sets out the evidence to show that people of higher socio-economic status have better
health due to the greater number of opportunities open to them. It sets out six key
policy objectives:
Give every child the best start in life.
28
Enable all children, young people and adults to maximise their capabilities and
have control over their lives.
Create fair employment and good work for all.
Ensure healthy standard of living for all.
Create and develop healthy sustainable places and communities.
Strengthen the role and impact of ill health prevention.
42. Why it’s relevant: It was significant in shaping the government’s public health white
paper, Healthy Lives, Healthy People and other key policies. It also provides significant
evidence to use both universal and targeted services within the six policy objectives.
Healthy Lives, Healthy People (8)
43. The white paper specifically focused on setting out the coalition government’s policy
for public health in England. It builds upon the findings of Fair Society, Healthy Lives –
The Marmot Review and the headline public health policy developments first set out in
Equity and Excellence: Liberating the NHS. It sets out the case for investing in public
health and developments in three main areas:
A radical new approach – the approach will also be based on the Nuffield Council
on Bioethics intervention ladder that outlines a range of approaches to promote
and influence positive lifestyle changes.
Health and wellbeing throughout life.
A new public health system with strong local and national leadership.
44. The white paper has also been underpinned by various other documents including the
publication of Healthy Lives, Healthy People: A call to action on obesity in England (9)
which aims for “a sustained downward trend in the level of excess weight in children by
2020.” Improving Outcomes and Supporting Transparency (10) is the public health
outcomes framework that sets out a range of public health outcomes. There are 19
indicators that physical activity has been evidenced to have an impact upon.
45. Why it’s relevant: Instigated significant change across the NHS and local authorities
with regards to public health responsibilities. Establishes further evidence and
responsibilities to take preventative action to tackle sedentary behaviour and obesity.
National Institute for Health and Care Excellence (NICE) Guidelines
46. NICE have produced a number of guidance documents for all those who have a direct
or indirect role in and responsibility for promoting physical activity for young people.
29
This includes those working in the NHS, education, local authorities and the wider
public, private, voluntary and community sectors. Of particular relevance are:
NICE Public Health guidance 4 – four commonly used methods to increase
physical activity (11).
NICE Public Health guidance 8 – physical activity and the environment (12).
NICE Public Health guidance 17 – promoting physical activity for children and
young people (13).
NICE Public Health guidance 41 – walking and cycling: local measures to promote
walking and cycling as forms of travel or recreation (14).
47. Why it’s relevant: They set out a series of recommendations for local authorities and
their partners to consider improving the take-up of physical activity based upon the
best evidence of need and of practice that works.
2.2.3 Local government
Localism bill (15)
48. The coalition government’s localism bill aims to give “power back to people and
communities” through decentralisation. It identifies six key actions to achieve this:
Lift the burden of bureaucracy.
Empower communities to do things their way.
Increase local control of public finance.
Diversify the supply of public services.
Open up government to public scrutiny.
Strengthen accountability to local people.
49. Why it’s relevant: It abolished the national indicators set for local authorities and
secured the statutory duty on local authorities to publish sustainable community
strategies based on need and focused on priority outcomes. It also gives communities
the right to bid/buy to own or run local assets for community use.
2.2.4 Sport and 2012 legacy
Plans for the legacy from the 2012 Olympic and Paralympic Games (16)
50. DCMS published a legacy plan for the London 2012 Olympic and Paralympic Games.
The plan includes a number of different policy developments, grouped in to four areas:
Harnessing the UK’s passion for sport to increase grassroots participation,
30
particularly by young people – and to encourage the whole population to be more
physically active.
Exploiting to the full the opportunities for economic growth offered by hosting the
Games.
Promoting community engagement and achieving participation across all groups in
society through the Games.
Ensuring that the Olympic Park can be developed after the Games as one of the
principal drivers of regeneration in east London.
51. Why it’s relevant: It sets out a range of changes to investment into sporting
infrastructure and programmes. It signifies a shift towards focusing on sport for young
people rather than adults.
Creating a Sporting Habit for Life: A New Youth Sport Strategy (17)
52. DCMS’ strategy on helping to deliver a sporting legacy from the 2012 Games.
53. Why it’s relevant: It focuses future sporting investment on young people aged 14 and
over, has a focus on competitive sport, seeks to improve links between schools and
clubs and states that national governing bodies be held to account for increasing
sporting participation by 1 x 30 minute session a week. It also sets out changes to the
Active People survey to enable measurement of this.
2.3 London and sub-regional policy context
Pro-Active Central London Partnership (18)
54. Across London there are five Pro-Active partnerships working across defined
geographical boundaries. Both the boroughs of Camden and Islington are located in
the central London sub-region and therefore play an active role in the work of the Pro-
Active Central London Partnership. The aim of the partnership is to improve the lives
of people living and working in central London through physical activity. The
Partnership has a vision of “partners collaborating effectively to increase participation
and the quality and sustainability of sport and physical activity in central London.”
55. Pro-Active Central London acts as a connector between Pro-Active Camden and Pro-
Active Islington and regional and national agencies such as Sport England. It plays a
significant role in coordinating national investment and programmes (including those
for young people) within the seven boroughs in which it operates.
31
Table 2: Summary of Pro-Active Central London’s objectives
Support national governing bodies of sport to increase participation and establish progression routes.
More young people enjoying sport in education and moving into community-based activities.
Low participation groups doing more sport and physical activity.
Through investment develop the current and future workforce – both paid and unpaid.
Widen access to, and increase the use of, existing facilities.
Build the capacity of local clubs and providers through targeted investment.
Effective communications lead to a consistent and credible image for the partnership.
Attract growing levels of investment in sport and physical activity.
The partnership evolves and is strengthened by engaging appropriate partners and quality service providers.
Maintain and support strong community sport and physical activity networks across all seven boroughs.
56. Why it’s relevant: Pro-Active Central London’s objectives both complement and are
informed by Pro-Active Camden and Pro-Active Islington. Pro-Active Central London is
a key means of connecting to national sport and physical activity policy and
programmes and to access national resources to deliver interventions aimed at
improving sport and physical activity for young people.
Greater London Authority’s Sporting Future for London (19)
57. In 2009, the Greater London Authority (GLA) published its strategy detailing how it
would support the achievement of an Olympic legacy. The strategy sets out four
legacy goals that underpin the Mayor’s commitment to increasing participation in sport
and physical activity:
Get more people active.
Transform the sporting infrastructure.
Build capacity and skills.
Maximise the benefits of sport to our society.
58. The London Community Sports Board supports the Mayor by helping develop sports
policy and making sure that London benefits from a long term Olympic legacy. To help
achieve its aims the Mayor of London, via the GLA, administers funded programmes,
most notably the Sports Participation Fund which funds community-based projects with
an emphasis on getting inactive people active.
32
59. Why it’s relevant: The GLA’s priority of increasing participation of Londoners and
getting inactive people active complements the objectives of a range of Camden and
Islington stakeholders.
Inclusive and Active 2 (20)
60. Inclusive and Active 2 is a sport and physical activity strategy for disabled people in
London with a vision of ‘active disabled Londoners’. The strategy identifies targeted
outcomes that will result in disabled people in London being able to access physical
activity opportunities of their choice at the level of their choice. Inclusive and Active 2 is
divided into five key overarching themes:
Changing the culture.
Inclusive activity.
More people, more active.
Diversifying the sector.
Skilling the sector.
61. Each of these themes is divided into numbered actions. Partner agencies – including
Camden Council and Pro-Active Islington – have created organisation-specific action
plans that sit underneath this strategy and define each stakeholder’s role in delivering
the target outcomes.
62. Why it’s relevant: Research has shown that disabled people are less active than non-
disabled people. This strategy aims to reduce this inequality. Both Camden and
Islington have created an action plan to support the achievement of Inclusive and
Active 2 across their boroughs.
2.4 Local demographics
63. The following information relevant to this needs assessment provides an insight into
the demographic picture of Camden and Islington.
64. The populations of both boroughs (21):
Camden - 220,338.
Islington - 206,125.
65. The population density of both boroughs is significant. They are both twice as densely
populated as London as a whole and significantly more densely populated than
England (21):
33
Islington – 138.7 persons per hectare (pph).
Camden – 101.1pph.
London – 52pph.
England – 4.1pph.
2.4.1 Age/gender/ethnicity
66. Both boroughs have a lower proportion of 0-18 year olds than London and England
(21):
Camden – 18.99%.
Islington – 18.81%.
London – 23.31%.
England – 22.66%.
67. Camden has a higher proportion of female residents than nationally, which may be
significant given the greater difficulties reported in encouraging females to participate
in physical activity (21):
Camden – 51.04% female.
Islington – 50.8% female.
England – 50.82% female.
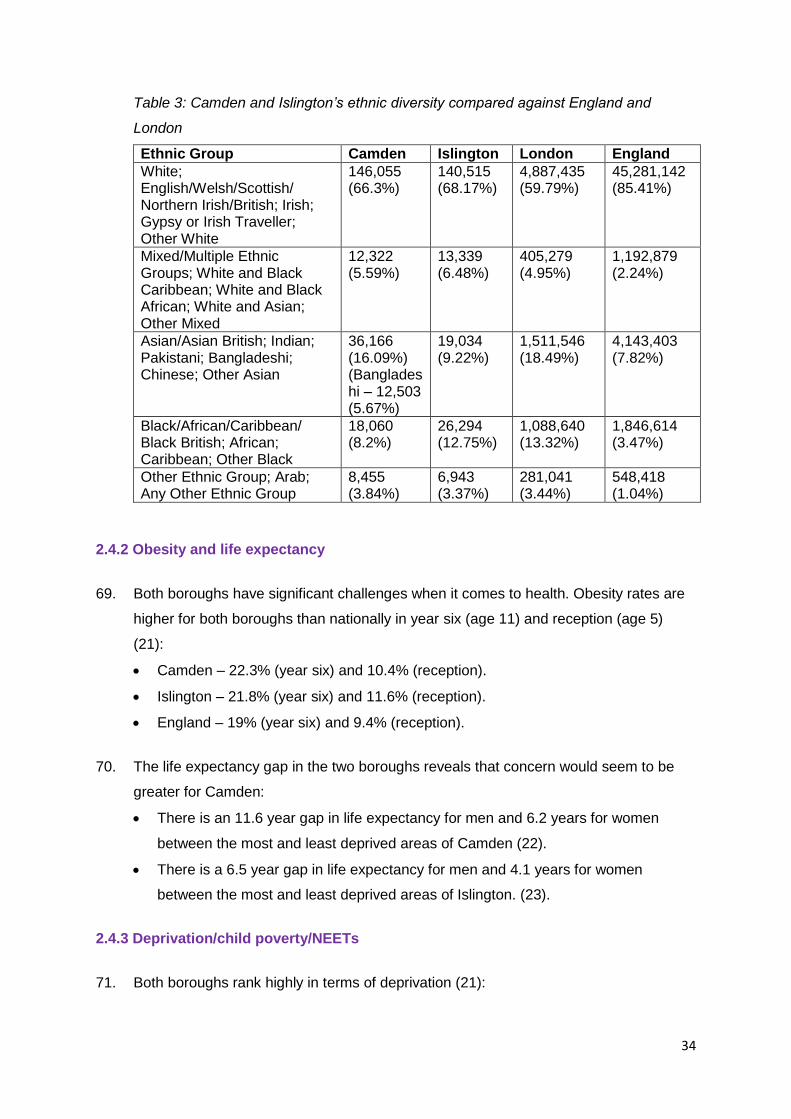
68. Both boroughs have a rich ethnic diversity, featuring a more diverse make-up than the
country as a whole. Of particular significance is Camden’s Bangladeshi community,
which accounts for 5.67% of the population (21). A more detailed breakdown of both
boroughs’ ethnic diversity compared against England and London is shown in table 3.
34
Table 3: Camden and Islington’s ethnic diversity compared against England and
London
Ethnic Group Camden Islington London England
White; English/Welsh/Scottish/ Northern Irish/British; Irish; Gypsy or Irish Traveller; Other White
146,055 (66.3%)
140,515 (68.17%)
4,887,435 (59.79%)
45,281,142 (85.41%)
Mixed/Multiple Ethnic Groups; White and Black Caribbean; White and Black African; White and Asian; Other Mixed
12,322 (5.59%)
13,339 (6.48%)
405,279 (4.95%)
1,192,879 (2.24%)
Asian/Asian British; Indian; Pakistani; Bangladeshi; Chinese; Other Asian
36,166 (16.09%) (Bangladeshi – 12,503 (5.67%)
19,034 (9.22%)
1,511,546 (18.49%)
4,143,403 (7.82%)
Black/African/Caribbean/ Black British; African; Caribbean; Other Black
18,060 (8.2%)
26,294 (12.75%)
1,088,640 (13.32%)
1,846,614 (3.47%)
Other Ethnic Group; Arab; Any Other Ethnic Group
8,455 (3.84%)
6,943 (3.37%)
281,041 (3.44%)
548,418 (1.04%)
2.4.2 Obesity and life expectancy
69. Both boroughs have significant challenges when it comes to health. Obesity rates are
higher for both boroughs than nationally in year six (age 11) and reception (age 5)
(21):
Camden – 22.3% (year six) and 10.4% (reception).
Islington – 21.8% (year six) and 11.6% (reception).
England – 19% (year six) and 9.4% (reception).
70. The life expectancy gap in the two boroughs reveals that concern would seem to be
greater for Camden:
There is an 11.6 year gap in life expectancy for men and 6.2 years for women
between the most and least deprived areas of Camden (22).
There is a 6.5 year gap in life expectancy for men and 4.1 years for women
between the most and least deprived areas of Islington. (23).
2.4.3 Deprivation/child poverty/NEETs
71. Both boroughs rank highly in terms of deprivation (21):
35
Islington – 14th most deprived out of 353 local authorities (the majority of Islington’s
lower super output areas also fall in the bottom quintile nationally).
Camden – 74th most deprived out of 353 local authorities.
72. Child poverty is measured as the proportion of children living in households on out-of-
work benefits:
Based on income calculations in 2009, 38% of children in Camden are living in
poverty in real terms (14,000 children), compared to 21% nationally. Of these
children, just over two-thirds live in lone parent households and just under half in
households with three or more children (22).
45.2% of Islington children live in workless households (this measure excludes
households in low paid work, therefore underestimates the scale of child poverty in
Islington) (23).
73. Figures for young people aged 16-19 known to be NEET (not in employment,
education or training) reveal that both boroughs compare negatively to London and
England:
Camden – 351 in June 2012, equivalent to 8.1% of the cohort (22).
Islington – 7.7% (still high compared to the central London average of 6.6% but
has fallen substantially since 2005 when it stood at nearly 16%) (23)
London – 4.1% (22).
England – 5.9% (22).
74. Why it’s relevant: There are a number of demographic factors such as gender,
ethnicity, disability and deprivation that are known to impact upon the physical activity
levels of young people.
2.5 Local policy context
75. There are a number of key documents within Camden and Islington that recognise the
importance of supporting the boroughs’ young people. This section highlights those
which have implications for the provision of physical activity. A chart showing Camden
and Islington’s policies which relate to physical activity and young people can be found
in appendices A and C, respectively.
36
2.5.1 Camden
The Camden Plan 2012-2017 (24)
76. Camden Council’s five-year vision. The aim is to “make Camden a better borough – a
place where everyone has a chance to succeed and where nobody gets left behind.”
77. Why it’s relevant: A number of the priorities for action set out in the Camden Plan are
relevant to increasing activity levels among young people. These include:
Ensuring all children have the best start in life.
Recognising that the future of children is one of the biggest concerns for the
borough.
Increasing the life expectancy of people living in Camden’s most deprived areas to
reduce the health inequality that currently exists.
Change for Children and Families – Delivering the Camden Plan (25)
78. This plan articulates how Camden will deliver the strategic objectives within the
Camden Plan that are related to children and families. The vision is for Camden to be
a place where every child and young person has a chance to succeed and where
nobody gets left behind.
79. Why it’s relevant: The improvement of physical activity opportunities for young people
is recognised well within the plan. That this could contribute to a range of intended
outcomes for a number of the cohorts identified as a focus in the plan is also
acknowledged. More broadly, physical activity can help reduce inequalities in the
borough – a central theme of the plan. In particular, the plan highlights the importance
of young people achieving a healthy weight and living active lives.
Pro-Active Camden Sport and Physical Activity Strategy (26)
80. This strategy is driven by and aligned with Camden’s community strategy. See
appendix B for a synopsis of relevant information from this strategy.
81. Why it’s relevant: This strategy was developed with the mandate to increase physical
activity levels across the borough. While its objectives are all relevant to young
people’s physical activity in Camden, the evidence base for this strategy was adults
(aged 16 and over).
Health in Camden. Camden’s Shadow Health and Wellbeing Board: Joint Health and
Wellbeing Strategy 2012 to 2013 (27)
37
82. Camden’s health and wellbeing board has the aim of improving health and reducing
health inequalities for its residents. It has two priorities:
Healthy weight, healthy lives.
Complex families.
83. In short, the aim is to support more children to reach their full potential and to increase
the number of people with healthy weight, living healthy lives.
84. Why it’s relevant: The prioritisation of healthy weight, healthy lives in the strategy
means there is a link to the development of physical activity for young people. The
strategy’s recognition of the importance of creating an environment where all residents
can live active lives and families can be active together also has implications for this
report.
NHS Camden Clinical Commissioning Group (CCG) Prospectus (28)
85. This prospectus sets out Camden CCG’s vision, which is as follows: Working with the
people in Camden to achieve the best health for all.
86. Why it’s relevant: Physical activity can significantly contribute to the prevention of a
range of health-related conditions. Camden CCG works in partnership with the
borough’s health and wellbeing board and will therefore be aware of the healthy
weight, healthy lives priority.
Camden Equality Taskforce – Final Report (29)
87. This report identifies six recommendations which have the aim of tackling the
inequality that exists in Camden. These include:
Increasing participation in work, education and training for 14-19 year olds from low
attaining groups.
Test new ways of financing and delivering services which help make every
Camden pound count.
Camden should become a ‘no wrong door’ borough.
88. Why it’s relevant: Physical activity can contribute towards reducing inequalities that
exist in the health and wellbeing of residents.
38
89. Findings
There is a good policy context across key services for increasing physical activity
levels within Camden.
There is a particularly strong link to the contribution that increasing physical
activity levels among young people can make to the outcomes and actions set
out in Camden’s children and families plan.
The link to the health and wellbeing strategy is mainly through the role physical
activity can play in weight management.
Pro-Active Camden’s strategy sets out objectives that are still valid though it was
established to increase the physical activity levels of adults.
2.5.2 Islington
Our Vision for 2020 (30)
90. Islington’s sustainable community strategy set out by the local strategic partnership in
2008. Its vision for 2020 is “creating a stronger, more sustainable community in which
everyone has access to excellent services and is able to fulfil their potential.”
91. Why it’s relevant: A significant number of the priorities for action set out in Our Vision
for 2020 are related to the provision of physical activity. This provides a positive policy
context within which to implement the recommendations of this report.
Closing the Gap: The Final Report of the Islington Fairness Commission (31)
92. Islington has some of the largest differences between wealth and poverty. The
Islington Fairness Commission was established to bring together stakeholders from
across the borough’s public, private and voluntary sectors to explore how to make the
borough fairer for all of its communities. It collated evidence and set out 19
recommendations for how all stakeholders could take action to make Islington fairer for
all of its communities and residents.
93. Why it’s relevant: The Islington Fairness Commission’s findings have played a
significant role in shaping the policies of Islington Council and its partners. It highlights
the need to get the population physically active to help address health and social
inequalities. It specifically recognises the need to help people be more physically
active and to open up facilities to all parts of the community.

39
A Fair Chance in Life for All – Islington Children and Families Strategy 2011-15 (32)
94. Islington Council’s Children and Families Partnership strategy setting out their vision
for improving the lives of children and families in Islington. It takes forward
recommendations made by Islington’s Fairness Commission and seeks to improve
outcomes for children, young people and their families. It identifies their role in
changing children’s lives as a champion, a catalyst and a commissioner. Its vision for
2020 is “we want Islington to be the best place for children and young people to grow
up.”
95. Why it’s relevant: The strategy recognises that access to physical activity for young
people can contribute to their personal and social development. It sets out objectives
to ensure that all young people have access to places and opportunities to be
physically active. It also sets out commissioning intentions to secure activities,
including physical activities, for young people.
Islington’s Joint Health and Wellbeing Strategy 2013-2016 (33)
96. Prepared by Islington’s health and wellbeing board, this strategy’s vision is to “reduce
health inequalities and improve the health and wellbeing of the local population, its
communities and residents.”
97. Why it’s relevant: The strategy provides further recognition of the need to improve both
universal and targeted services within the borough. With the objective of giving “every
child the best start in life”, it also shows how increasing the number of physically active
young people can contribute to a range of health improvements in the borough. Other
suggested improvements, such as increasing the number of mental health champions,
could provide opportunities for the implementation of the findings of this project. The
strategy articulates Pro-Active Islington’s responsibilities for getting more people
active.
Islington Clinical Commissioning Group (CCG) High-level Commissioning Intentions
for 2013/14 (34)
98. The CCG’s vision is “to develop a new partnership between patients and their
clinicians that together commissions health services of high quality and good value for
money and meets the needs of the population of Islington.” (35).
99. Why it’s relevant: The CCG recognises its role in the prevention of long term
conditions that may be addressed by increasing the levels of physical activity in young
40
people. These intentions are clearly aligned with Islington’s Joint Health and Wellbeing
Strategy and have a shared objective of giving “every child the best start in life.”
Towards a Fairer Islington: Corporate Plan 2011-15 (36)
100. Islington Council’s corporate plan sets out priorities and a range of actions to make
Islington fairer. It also makes clear how the council will contribute to delivering the
recommendations set out by Islington’s Fairness Commission.
101. Why it’s relevant: This plan clearly states Islington Council’s focus up to 2015. It
includes a number of areas relevant to this project such as improving public space,
developing a core sustainable offer for youth, leisure and play services and helping
people adopt healthier behaviours. These intentions should be taken into account
when implementing the proposed recommendations. The plan incorporates the themes
of “giving every child the best start in life” from the health and wellbeing strategy and of
breaking the cycle of poverty from A Fair Chance in Life for all.
The Pro-Active Islington Strategy 2012-2017 (37)
102. Pro-Active Islington has recently refreshed its strategy and action plan, detailing action
that needs to be taken across partners to increase levels of physical activity and sport
among children, young people and adults. See appendix D for a synopsis of relevant
information from this strategy.
103. Why it’s relevant: As the main strategy and action plan for the council and its partners
to increase physical activity levels in the borough, this strategy sets out Pro-Active
Islington members’ commitments for the next four years. It’s linked to the three
objectives of the joint Health and Wellbeing Strategy and Islington Council’s corporate
priority of “delivering high quality, efficient services within available resources.”
104. Findings
Most of the key policies related to increasing physical activity levels within Islington
have a common thread, which is to recognise the benefits it can bring to improving
the lives of young people.
There is a very clear link between the health and wellbeing strategy and Pro-Active
Islington’s physical activity strategy, with the two strategies sharing three goals.
Pro-Active Islington’s strategy sets out a range of actions to improve the supply
and demand for physical activity among young people which this report can inform.
41
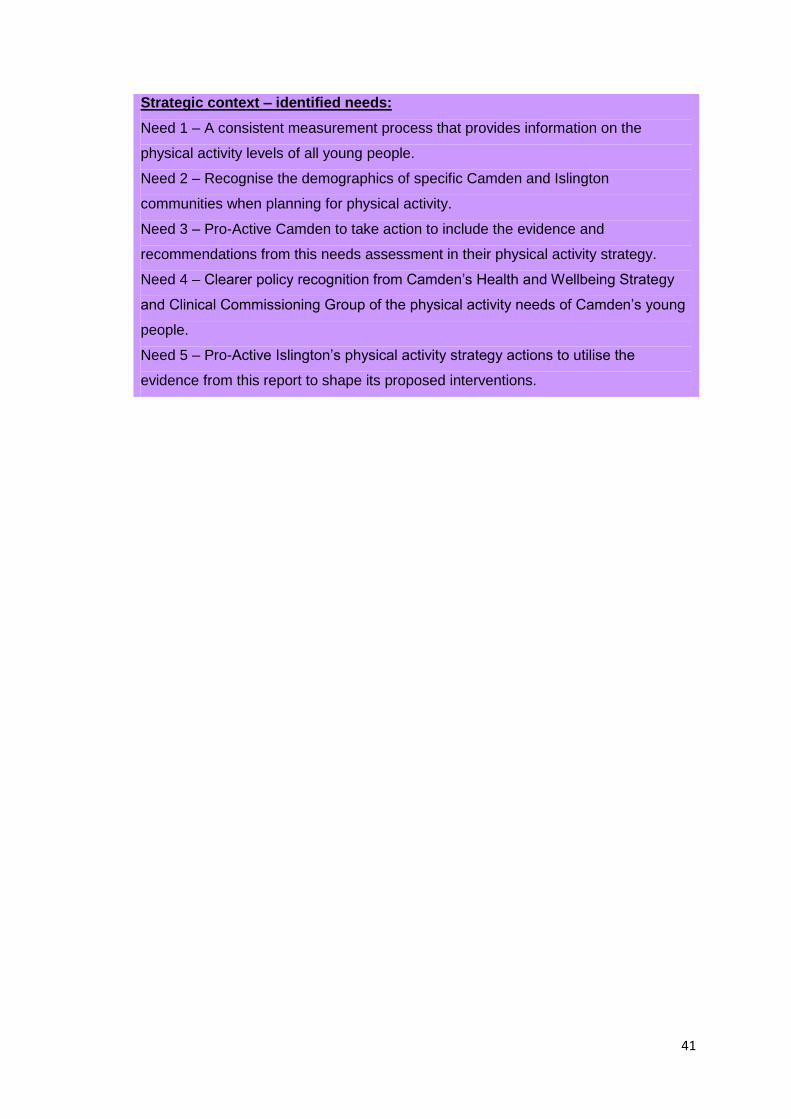
Strategic context – identified needs:
Need 1 – A consistent measurement process that provides information on the
physical activity levels of all young people.
Need 2 – Recognise the demographics of specific Camden and Islington
communities when planning for physical activity.
Need 3 – Pro-Active Camden to take action to include the evidence and
recommendations from this needs assessment in their physical activity strategy.
Need 4 – Clearer policy recognition from Camden’s Health and Wellbeing Strategy
and Clinical Commissioning Group of the physical activity needs of Camden’s young
people.
Need 5 – Pro-Active Islington’s physical activity strategy actions to utilise the
evidence from this report to shape its proposed interventions.
42
Section 3
Methodology
Summary
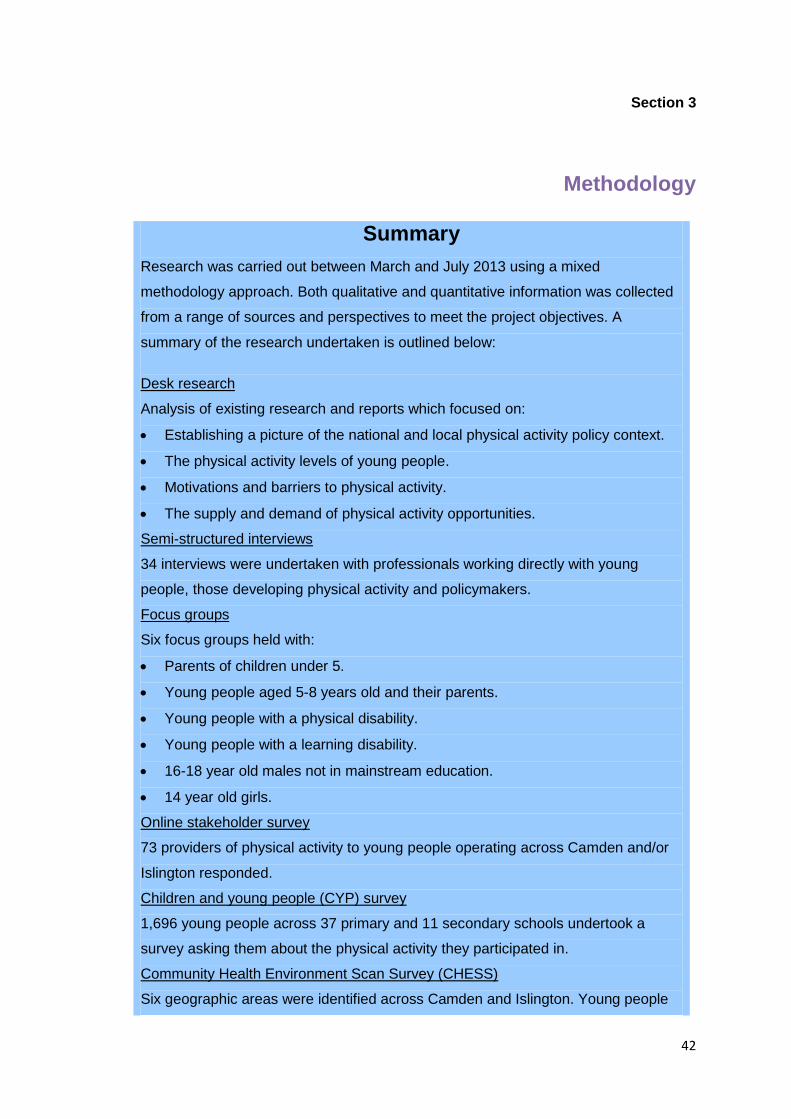
Research was carried out between March and July 2013 using a mixed
methodology approach. Both qualitative and quantitative information was collected
from a range of sources and perspectives to meet the project objectives. A
summary of the research undertaken is outlined below:
Desk research
Analysis of existing research and reports which focused on:
Establishing a picture of the national and local physical activity policy context.
The physical activity levels of young people.
Motivations and barriers to physical activity.
The supply and demand of physical activity opportunities.
Semi-structured interviews
34 interviews were undertaken with professionals working directly with young
people, those developing physical activity and policymakers.
Focus groups
Six focus groups held with:
Parents of children under 5.
Young people aged 5-8 years old and their parents.
Young people with a physical disability.
Young people with a learning disability.
16-18 year old males not in mainstream education.
14 year old girls.
Online stakeholder survey
73 providers of physical activity to young people operating across Camden and/or
Islington responded.
Children and young people (CYP) survey
1,696 young people across 37 primary and 11 secondary schools undertook a
survey asking them about the physical activity they participated in.
Community Health Environment Scan Survey (CHESS)
Six geographic areas were identified across Camden and Islington. Young people
43
explored the areas, giving their views on the propensity for their local environments
to support young people being physically active.
3.1 Introduction
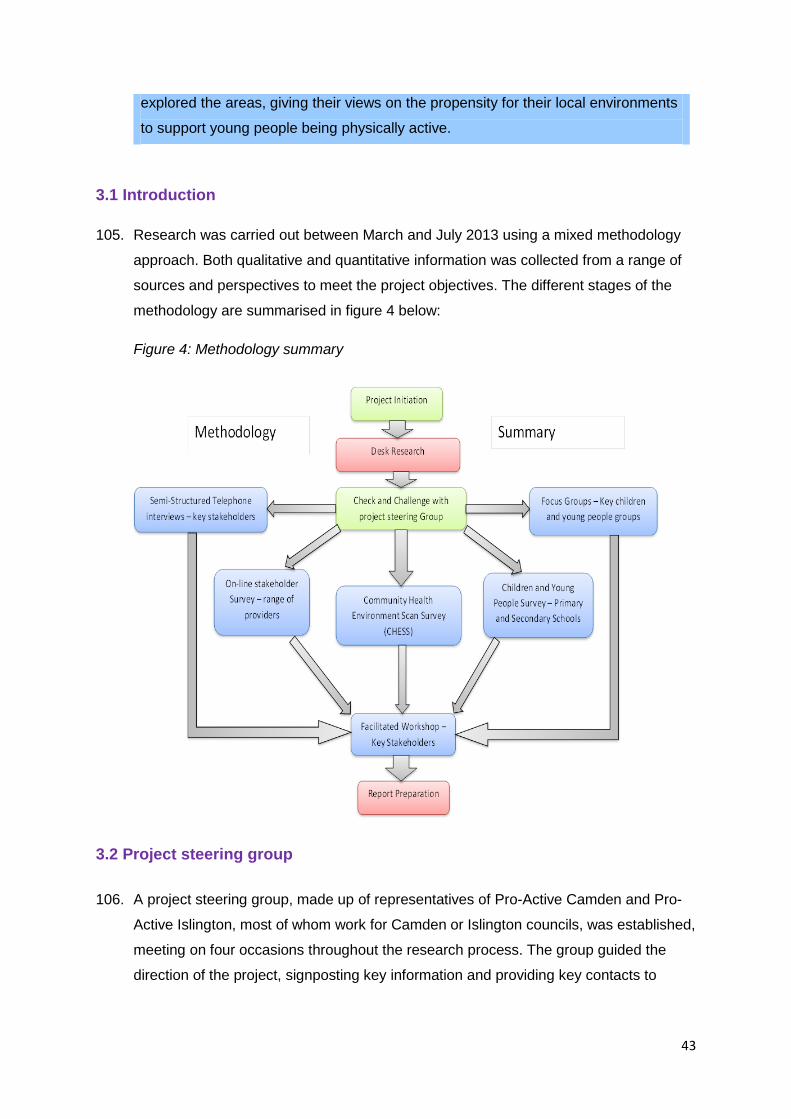
105. Research was carried out between March and July 2013 using a mixed methodology
approach. Both qualitative and quantitative information was collected from a range of
sources and perspectives to meet the project objectives. The different stages of the
methodology are summarised in figure 4 below:
Figure 4: Methodology summary
3.2 Project steering group
106. A project steering group, made up of representatives of Pro-Active Camden and Pro-
Active Islington, most of whom work for Camden or Islington councils, was established,
meeting on four occasions throughout the research process. The group guided the
direction of the project, signposting key information and providing key contacts to

44
support the delivery of the methodology (see appendix E for a list of members and
dates).
3.3 Project initiation
107. At this stage the project steering group confirmed the scope of the work, the outputs
required, the approach, timescales and deliverables of the project. In particular, it was
decided that the focus of the project be on the provision of physical activity outside of
curriculum time and that the preferred option to capture the views of young people
would be through a bespoke survey rather than using the Me and My Lifestyle survey.
3.4 Desk research
108. A wide range of existing information relevant to this project was assimilated and
evaluated from reports, surveys, studies and statistics across a range of areas. The
desk research focused on the following areas:
Strategic context – national priorities for physical activity for young people.
Local context – demographics of the boroughs and any particular issues which
may impact on the physical activity of young people.
Current provision – any available information on current supply within the
boroughs.
National/international research – relating to the needs, barriers and motivations of
young people towards taking part in physical activity. This included information on
specific cohorts of young people such as girls, disabled young people and ethnic
minorities.
Local information – on current physical activity participation levels of young people
and their needs, motivations and barriers towards taking part in it.
Active Spaces Initiatives – gathering of background and contextual information to
assess where findings from this project could inform these initiatives.
109. Desk research continued throughout the project. Further documents were identified,
reviewed and integrated into the findings of the project. Key findings and emerging
themes from desk research were presented to the project steering group to confirm
understanding and identify gaps in information.
45
3.5 Semi-structured telephone interviews – key stakeholders
110. A range of stakeholders across Camden and Islington were identified by the project
steering group to participate in semi-structured telephone interviews. They included
those working directly with young people and policymakers and influencers operating
in senior positions. Interviews followed a broad structure with questions tailored to
each interviewee to capture specific knowledge and expertise.
111. A total of 34 telephone interviews were undertaken across the boroughs with 17 from
Camden and 17 from Islington (see appendix F for a list of interviews undertaken).
3.6 Focus groups – key children and young people groups
112. Focus groups were held with six cohorts of young people across Camden and
Islington. Groups were determined by the project steering group based on a range of
factors, including:
Priority groups identified by Camden and Islington.
Groups identified by a lack of available evidence from desk research.
Groups whose views were less likely to be captured through other techniques
within the agreed methodology.
113. The focus groups were designed to probe some of the themes identified from desk
research and fieldwork already undertaken in order to deepen understanding of these
areas.
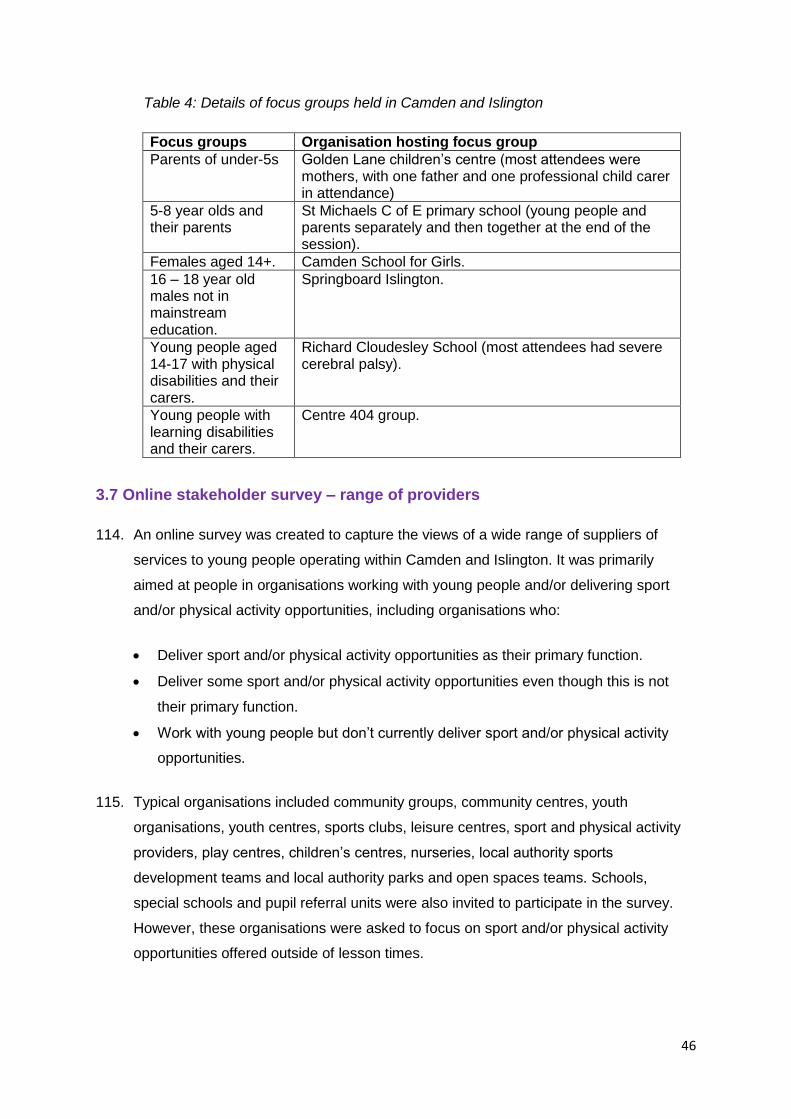
46
Table 4: Details of focus groups held in Camden and Islington
Focus groups Organisation hosting focus group
Parents of under-5s Golden Lane children’s centre (most attendees were mothers, with one father and one professional child carer in attendance)
5-8 year olds and their parents
St Michaels C of E primary school (young people and parents separately and then together at the end of the session).
Females aged 14+. Camden School for Girls.
16 – 18 year old males not in mainstream education.
Springboard Islington.
Young people aged 14-17 with physical disabilities and their carers.
Richard Cloudesley School (most attendees had severe cerebral palsy).
Young people with learning disabilities and their carers.
Centre 404 group.
3.7 Online stakeholder survey – range of providers
114. An online survey was created to capture the views of a wide range of suppliers of
services to young people operating within Camden and Islington. It was primarily
aimed at people in organisations working with young people and/or delivering sport
and/or physical activity opportunities, including organisations who:
Deliver sport and/or physical activity opportunities as their primary function.
Deliver some sport and/or physical activity opportunities even though this is not
their primary function.
Work with young people but don’t currently deliver sport and/or physical activity
opportunities.
115. Typical organisations included community groups, community centres, youth
organisations, youth centres, sports clubs, leisure centres, sport and physical activity
providers, play centres, children’s centres, nurseries, local authority sports
development teams and local authority parks and open spaces teams. Schools,
special schools and pupil referral units were also invited to participate in the survey.
However, these organisations were asked to focus on sport and/or physical activity
opportunities offered outside of lesson times.

47
116. The survey centred on understanding why organisations provide physical activity and
what challenges they face in doing so. It also included questions on the types of
opportunities that are provided to young people, which age groups and/or cohorts are
targeted and what attracts them to these opportunities (see appendix G for a copy of
the stakeholder survey).
117. The survey was circulated to as wide a range of contacts as possible via the project
steering group members. In total, 73 responses were received including 14 operating
in Camden and 34 operating in Islington. An additional 20 reported that they operate in
both boroughs with five respondents leaving this question blank. Respondents who
chose ‘other’ represented a range of organisations including charities, local authority
departments, a yoga centre and a folk arts development centre, among others. Details
of the types of organisations who responded to the stakeholder survey can be found in
appendix H.
3.8 Children and young people survey (CYP survey) – primary and secondary
schools
118. The views of a broad range of young people were obtained via a survey conducted
through schools.
119. Initially the Me and My Lifestyle (MMLS) survey tool was explored as a possibility for
collecting this information. MMLS has the benefit of linking responses to school
information databases, enabling comparison with demographic factors. However, it
was agreed with the project steering group that this survey would not gather enough
insight into the motivations and barriers to participation in physical activity perceived by
young people.
120. A bespoke survey to gather the views of young people was therefore developed and
tested using an online survey tool. The survey would help understand their needs in
terms of current participation levels, activity preferences and the perceived barriers
and motivations to taking part in physical activity (see appendix I for a copy of the
primary school CYP survey and appendix J for a copy of the secondary school CYP
survey).
121. Each primary and secondary school within Camden and Islington (including special
schools and pupil referral units) was invited to take part in the survey. It was targeted
at young people in year groups 3-6 (ages 7-11) in primary schools and 7-13 (11-18) in
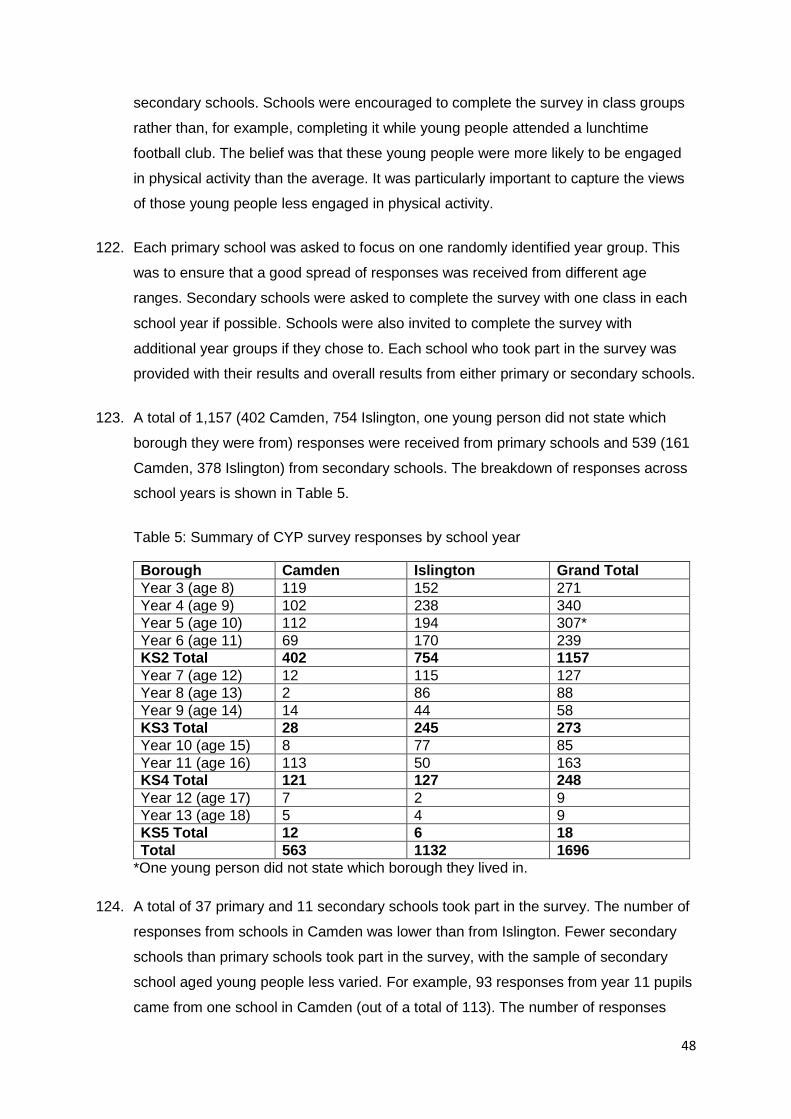
48
secondary schools. Schools were encouraged to complete the survey in class groups
rather than, for example, completing it while young people attended a lunchtime
football club. The belief was that these young people were more likely to be engaged
in physical activity than the average. It was particularly important to capture the views
of those young people less engaged in physical activity.
122. Each primary school was asked to focus on one randomly identified year group. This
was to ensure that a good spread of responses was received from different age
ranges. Secondary schools were asked to complete the survey with one class in each
school year if possible. Schools were also invited to complete the survey with
additional year groups if they chose to. Each school who took part in the survey was
provided with their results and overall results from either primary or secondary schools.
123. A total of 1,157 (402 Camden, 754 Islington, one young person did not state which
borough they were from) responses were received from primary schools and 539 (161
Camden, 378 Islington) from secondary schools. The breakdown of responses across
school years is shown in Table 5.
Table 5: Summary of CYP survey responses by school year
Borough Camden Islington Grand Total
Year 3 (age 8) 119 152 271
Year 4 (age 9) 102 238 340
Year 5 (age 10) 112 194 307*
Year 6 (age 11) 69 170 239
KS2 Total 402 754 1157
Year 7 (age 12) 12 115 127
Year 8 (age 13) 2 86 88
Year 9 (age 14) 14 44 58
KS3 Total 28 245 273
Year 10 (age 15) 8 77 85
Year 11 (age 16) 113 50 163
KS4 Total 121 127 248
Year 12 (age 17) 7 2 9
Year 13 (age 18) 5 4 9
KS5 Total 12 6 18
Total 563 1132 1696
*One young person did not state which borough they lived in.
124. A total of 37 primary and 11 secondary schools took part in the survey. The number of
responses from schools in Camden was lower than from Islington. Fewer secondary
schools than primary schools took part in the survey, with the sample of secondary
school aged young people less varied. For example, 93 responses from year 11 pupils
came from one school in Camden (out of a total of 113). The number of responses
49
received from young people in years 12 and 13 was very low. This could have been
due to the timing of the survey when these students may have been taking exams or
on study leave. The number of responses from key stage 3 pupils in Camden was also
low.
3.9 Community Health Environment Scan Survey (CHESS)
125. CHESS is a tool that systematically examines how built environments encourage or
discourage healthy lifestyle options (e.g. lack of healthy food outlets, outdoor space to
encourage active play and tobacco use). The strength of CHESS is that it is an
empirical assessment tool that measures the availability and accessibility of healthy
lifestyle options. CHESS reviews existing community assets and provides
opportunities for change, shaping community intervention planning by focusing on
what the community needs to address three key risk factors for chronic disease (i.e.
unhealthy diet, physical inactivity and tobacco use). CHESS operates under license
from US company, Matrix Solutions.
126. This project is focused on the physical activity elements of CHESS. Working in
partnership with youth clubs in six locations across Camden and Islington, young
people who attend the youth clubs (supported by youth workers) carried out
assessments (known as ‘scans’) of places (known as ‘assets’) where anyone could
take part in physical activity within a specific zone (usually within a 400-800m radius of
the youth club). Teams of young people walked around their allocated area visiting
identified assets. Each young person used a customised tablet computer (Nexus 7)
equipped with a CHESS application to answer questions and record their opinions of
each asset. During some scans, teams also came across additional assets, which
were also scanned.
127. Following the scans, insight workshops were organised with the Press Red team,
youth workers and the young people. These were a chance for the young people to
further discuss and grade assets based on their findings and opinions.
128. A total of six CHESS scans were undertaken as part of this project. Working with the
project steering group, the most appropriate areas to be scanned were agreed. The
selection of areas was based on the assumption that high levels of deprivation and
obesity and low levels of physical activity based on the Active People (16+) survey (1)
were appropriate proxy measures for determining areas most in need. It was agreed
50
that these areas would benefit most from CHESS scans. The scans took place in the
following areas:
Camden/Islington – Fresh Youth Academy/The Zone.
Camden – Somers Town.
Islington – The Platform.
Islington – The Lift.
Camden – Queen’s Crescent Community Association.
Camden – Surma Centre.
129. Further details on dates and times of the CHESS scans can be found in appendix K.
Further details on the CHESS scan process can be found within each individual
CHESS report (annex 1-6).
3.10 Structured activity in CHESS zones
130. A forecast of the gap between the current supply of structured activities (defined as
organised activities led by an adult) and the ideal current and future supply of
structured activities was also carried out. Ideal supply was based on the previous
Labour government’s policy recommendations that schools and community
organisations offer young people three hours of structured physical activity per week
outside of PE. Firstly, an analysis of the current supply of structured activities for 0-18
year olds within CHESS zone was completed. This resulted in an estimate of the
average number of hours of structured activity for 0-18 year olds per week currently
available in each CHESS zone. Using estimated population figures of 0-18 year olds
living in each CHESS zone (further detail on how population figures were calculated
can be found in appendix 1 within each CHESS report), it was possible to understand
the amount of structured activity required in each CHESS zone to offer all 0-18 year
olds three hours of structured activity per week. By comparing this figure against actual
current supply, it was possible to understand the difference between current and ideal
supply of structured activity. The same calculations were also produced based on
2018 projected populations of 0-18 year olds. Further detail on the model used to
make these estimates can be found in section 4.5.4.
51
3.11 Facilitated workshop
131. A facilitated workshop led by Press Red was held on the 20th June 2013. Attendees
included project steering group members, stakeholders and youth workers from both
Camden and Islington. The purpose of the workshop was to share findings from desk
research and fieldwork, discuss emerging themes and look at potential solutions and
recommendations. Findings from the research to date were presented although some
fieldwork was outstanding due to difficulties in arranging some telephone interviews,
focus groups and CHESS scans. Stakeholders discussed specific themes and
potential recommendations for actions within each of the boroughs.
3.12 Report preparation
132. Findings from the research methodologies were analysed and shared for discussion at
a number of internal project group meetings. Early analysis of findings was also shared
with the project steering group at regular intervals. A final report was then prepared
drawing out the physical activity needs of young people. A series of key
recommendations are identified, together with a range of potential solutions.
3.13 Limitations
133. The following limitations relating to the research were identified.
134. Results from a recent survey with school teachers across Islington primary schools
were not available at the time of preparing this report.
Stakeholder survey
135. The stakeholder survey was distributed by the project steering group, who then
forwarded it onto their contacts. Responses could be biased by the type of people who
are more likely to respond to surveys rather than a representative sample of all
organisations.
CYP Survey
136. It is possible that schools more engaged with the importance of physical activity were
more likely to undertake the CYP survey.
137. Young people may provide different answers in a formal school setting than they would
outside of school.
52
138. Question 9, which asked young people to recall how much exercise they had done
during the last seven days may have been challenging, particularly for younger
children and those with learning difficulties. We did advise primary school teachers that
if they felt pupils would struggle with this question they could leave it blank. The results
suggest that there weren’t any whole class groups who decided not to enter this
information but for younger years it may be not be completely accurate at individual
level.
139. Question 6, which asked young people if they considered themselves to be a disabled
person, may have produced some unreliable answers. We had 42 responses from the
Samuel Rhodes special school but only around half of respondents identified
themselves as having a disability. This was recognised in the analysis of the findings.
Teachers of young disabled people were asked to support young people to complete
the survey where appropriate. This may also have created variations on individual
responses depending on their approach, although efforts were made to minimise this
by sending out guidance notes to each school.
Focus groups
140. Due to the time constraints for delivery of the project, the field research techniques
were undertaken concurrently, although in some cases it was possible to use
outcomes from one technique to inform preparation for another. For example, some of
the focus groups were not held until the CYP survey results were collated. Where this
was the case the focus group design incorporated those results.
CHESS scans
141. CHESS scans were completed with the assistance of young people aged between 16
and 18. Although they were asked to comment upon and grade assets from the point
of view of the age range the asset was targeted at, it should be recognised that
opinions and grades came from a limited age range.
142. Not all assets during CHESS scans were scanned by the young people as not all were
open or available to be scanned at the time. This was particularly relevant for schools.
Structured activities in CHESS zones
143. While every effort was made to collect as much information as possible, it became
apparent that limited information on structured activities for young people was
available. With this in mind, it should be noted that some data may be missing from
findings. This ‘data gap’ will impact on the level of additional supply calculated as

53
necessary to enable young people to achieve three hours of structured activity per
week.
144. Some organisations advertised structured activities but may not have been clear how
long sessions lasted for, how many times a week they occurred or how many weeks a
year they ran for. Where this information was not collected, reasonable estimates were
made.
54
Section 4
Findings
4.1 Introduction
145. This section presents findings from the research detailed in section 3 – methodology.
From these findings, a set of needs relevant to both boroughs have been established.
These are also presented within this section, which appears as follows:
4.2 – Current participation – An analysis of the current levels of participation in
physical activity by young people in Camden and Islington. As well as a general
overview, an examination of participation by gender, socio-economic status, those
with special educational needs, ethnicity, body mass index, sedentary behaviour,
by preference for physical activity and by active travel is also included.
4.3 – Barriers and motivations – An analysis of the barriers which young people
face, as well as the motivations which compel them, when taking part in physical
activity. These are explored using the following themes – personal priorities, self-
perception, impact of others, perception/experience of provision and environmental
context.
4.4 – Demand – An analysis of the demand for physical activity by young people in
Camden and Islington. This is explored first by each borough individually and then
by the combined demands of the two boroughs.
4.5 – Supply – An analysis of the supply of physical activity in Camden and
Islington. Firstly, this is explored by looking at the opportunities provided by both
boroughs individually. Then, the views of organisations that provide physical
activity opportunities across both boroughs individually and combined are
presented. The section finishes with analysis of the current level of supply of
structured activities, which includes a forecast of what supply might need to look
like in 2018 to meet demand.
55
4.2 Current participation
Summary
There is a low level of participation in physical activity among young people in
Camden and Islington, with 11% of all respondents to the CYP survey meeting
CMO guidelines. Participation decreases as young people get older.
The problem is more acute for girls with lower activity levels reported across all
ages by girls than boys. The decline in participation as young people get older is
sharper for girls also.
Participation in physical activity by young people in Camden and Islington did not
change depending on socio-economic status or the deprivation of the area lived
in.
Disabled young people’s participation at the higher end of the scale is similar to
non-disabled young people. However, there are a higher percentage of disabled
young people not achieving 60 minutes of physical activity on any of the previous
seven days when compared to non-disabled young people.
Lower participation in physical activity was reported by those from an Asian/Asian
British background and in particular, those of an Asian/Asian British –
Bangladeshi background.
National research suggests a growing concern at the risk of sedentary behaviour.
Young people across Camden and Islington reported a preference for physical
activities over other activities. However, preference for physical activity
decreases with age and is less so for girls.
4.2.1 Introduction
146. This section details findings from research into the current levels of participation in
physical activity by Camden and Islington’s young people. From this, it is possible to
understand the extent to which young people in the boroughs meet CMO guidelines
(1). The section also contains an analysis of participation in physical activity by various
cohorts of young people.
It should be noted that differences in responses to the CYP survey between the two
boroughs were not found to be statistically significant. This indicates that participation
levels and motivations and barriers identified by the survey are consistent across both
boroughs. Where Camden and Islington percentage rates are quoted separately this is
for comparison with other information sources only.
56
4.2.2 Overview
147. The Health Survey for England 2008 (HSE 2008) (2) is the most up to date source of
national information on both self-reported and objective measures of physical activity.
A total of 15,102 adults and 7,521 children were interviewed for the survey. The survey
defined three levels of classification:
Meets – at least 60 minutes of moderate activity on all seven days in the last week.
Some – 30 to 59 minutes of moderate activity on all seven days in the last week.
Low – Fewer than 30 minutes of moderate activity on each day, or moderate
activity of 60 minutes or more on fewer than seven days in the last week.
148. The HSE 2008 found that nationally:
32% of boys and 24% of girls between the ages of two and 15 meet the CMO
recommendation of participating in over 60 minutes of physical activity on every
day during the previous week.
149. The CYP survey, completed by 1,696 young people across Camden and Islington,
found lower levels of physical activity than the HSE 2008 national findings. However, it
should be noted that there were differences in the methodologies of each survey,
which means direct comparisons between the two cannot be made. The CYP survey
found that:
11% of all respondents currently meet CMO recommendations for participation in
physical activity.
This figure was slightly higher in Camden (11.9%) than Islington (11.23%).
Participation in physical activity by young people in Camden and Islington
decreases as young people get older. This is similar to findings made by HSE 2008
(see figure 5).
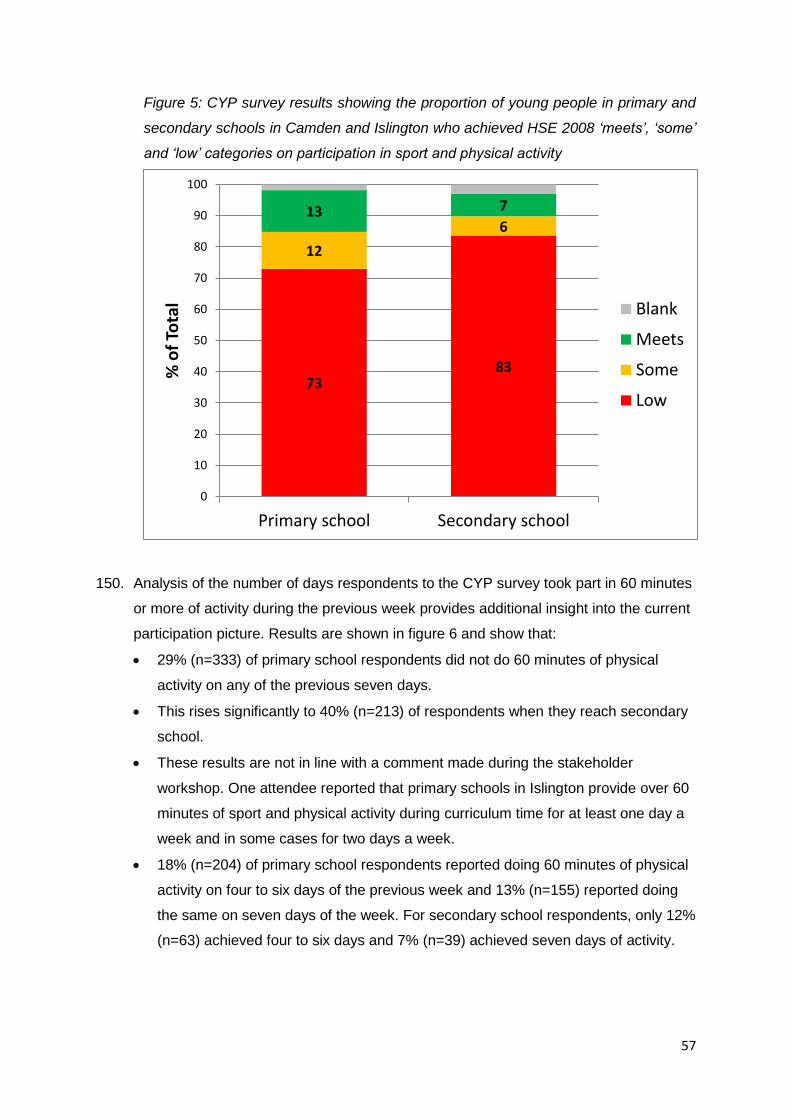
57
Figure 5: CYP survey results showing the proportion of young people in primary and
secondary schools in Camden and Islington who achieved HSE 2008 ‘meets’, ‘some’
and ‘low’ categories on participation in sport and physical activity
150. Analysis of the number of days respondents to the CYP survey took part in 60 minutes
or more of activity during the previous week provides additional insight into the current
participation picture. Results are shown in figure 6 and show that:
29% (n=333) of primary school respondents did not do 60 minutes of physical
activity on any of the previous seven days.
This rises significantly to 40% (n=213) of respondents when they reach secondary
school.
These results are not in line with a comment made during the stakeholder
workshop. One attendee reported that primary schools in Islington provide over 60
minutes of sport and physical activity during curriculum time for at least one day a
week and in some cases for two days a week.
18% (n=204) of primary school respondents reported doing 60 minutes of physical
activity on four to six days of the previous week and 13% (n=155) reported doing
the same on seven days of the week. For secondary school respondents, only 12%
(n=63) achieved four to six days and 7% (n=39) achieved seven days of activity.
73 83
12
6 13 7
0
10
20
30
40
50
60
70
80
90
100
Primary school Secondary school
% o
f To
tal Blank
Meets
Some
Low
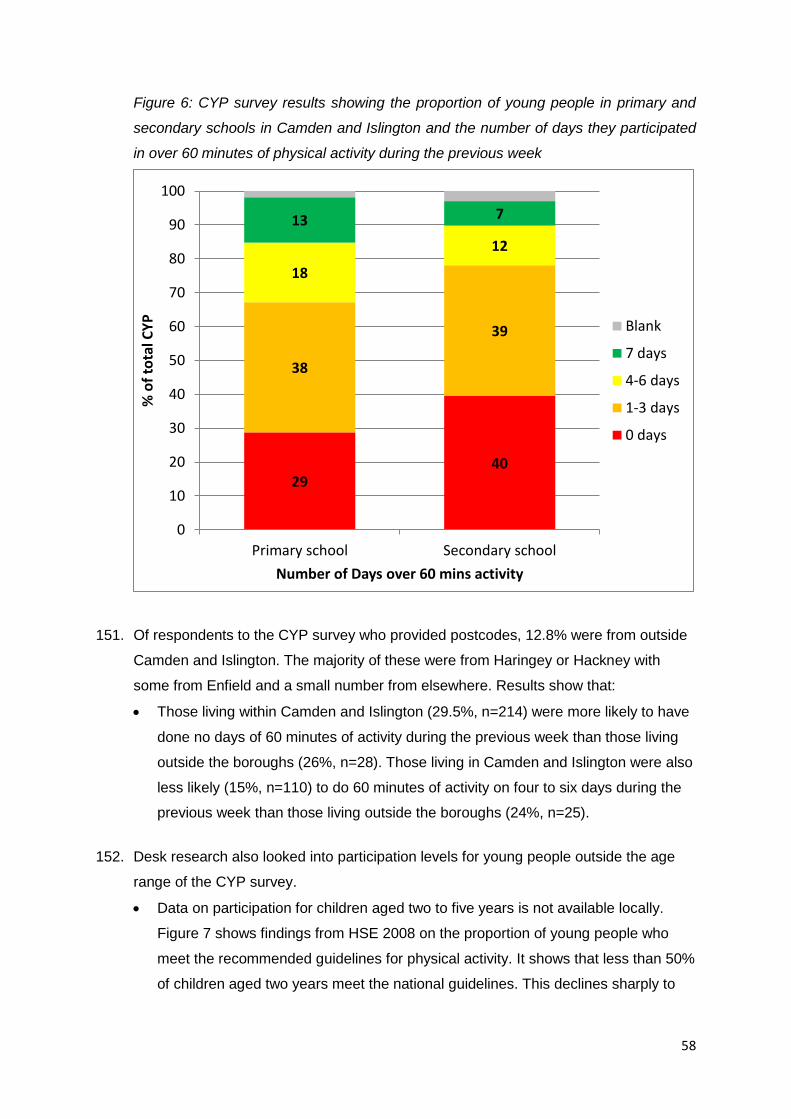
58
Figure 6: CYP survey results showing the proportion of young people in primary and
secondary schools in Camden and Islington and the number of days they participated
in over 60 minutes of physical activity during the previous week
151. Of respondents to the CYP survey who provided postcodes, 12.8% were from outside
Camden and Islington. The majority of these were from Haringey or Hackney with
some from Enfield and a small number from elsewhere. Results show that:
Those living within Camden and Islington (29.5%, n=214) were more likely to have
done no days of 60 minutes of activity during the previous week than those living
outside the boroughs (26%, n=28). Those living in Camden and Islington were also
less likely (15%, n=110) to do 60 minutes of activity on four to six days during the
previous week than those living outside the boroughs (24%, n=25).
152. Desk research also looked into participation levels for young people outside the age
range of the CYP survey.
Data on participation for children aged two to five years is not available locally.
Figure 7 shows findings from HSE 2008 on the proportion of young people who
meet the recommended guidelines for physical activity. It shows that less than 50%
of children aged two years meet the national guidelines. This declines sharply to
29 40
38
39
18
12
13 7
0
10
20
30
40
50
60
70
80
90
100
Primary school Secondary school
% o
f to
tal C
YP
Number of Days over 60 mins activity
Blank
7 days
4-6 days
1-3 days
0 days
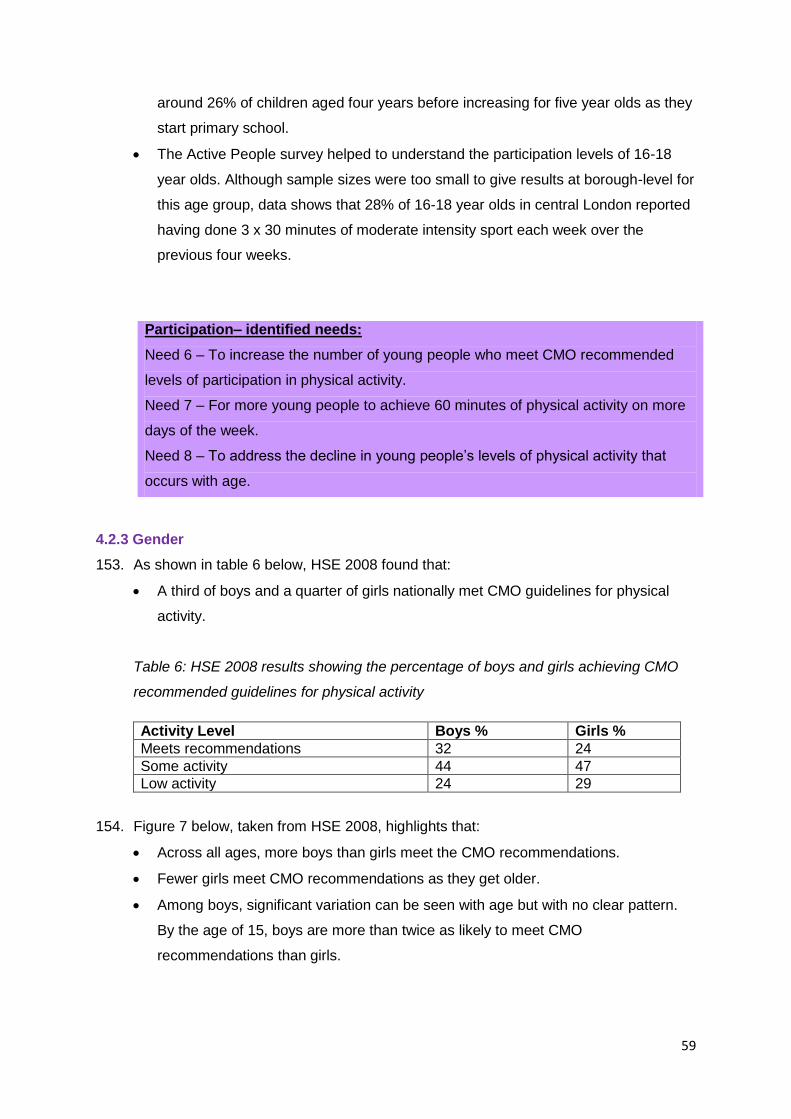
59
around 26% of children aged four years before increasing for five year olds as they
start primary school.
The Active People survey helped to understand the participation levels of 16-18
year olds. Although sample sizes were too small to give results at borough-level for
this age group, data shows that 28% of 16-18 year olds in central London reported
having done 3 x 30 minutes of moderate intensity sport each week over the
previous four weeks.
4.2.3 Gender
153. As shown in table 6 below, HSE 2008 found that:
A third of boys and a quarter of girls nationally met CMO guidelines for physical
activity.
Table 6: HSE 2008 results showing the percentage of boys and girls achieving CMO
recommended guidelines for physical activity
Activity Level Boys % Girls %
Meets recommendations 32 24
Some activity 44 47
Low activity 24 29
154. Figure 7 below, taken from HSE 2008, highlights that:
Across all ages, more boys than girls meet the CMO recommendations.
Fewer girls meet CMO recommendations as they get older.
Among boys, significant variation can be seen with age but with no clear pattern.
By the age of 15, boys are more than twice as likely to meet CMO
recommendations than girls.
Participation– identified needs:
Need 6 – To increase the number of young people who meet CMO recommended
levels of participation in physical activity.
Need 7 – For more young people to achieve 60 minutes of physical activity on more
days of the week.
Need 8 – To address the decline in young people’s levels of physical activity that
occurs with age.
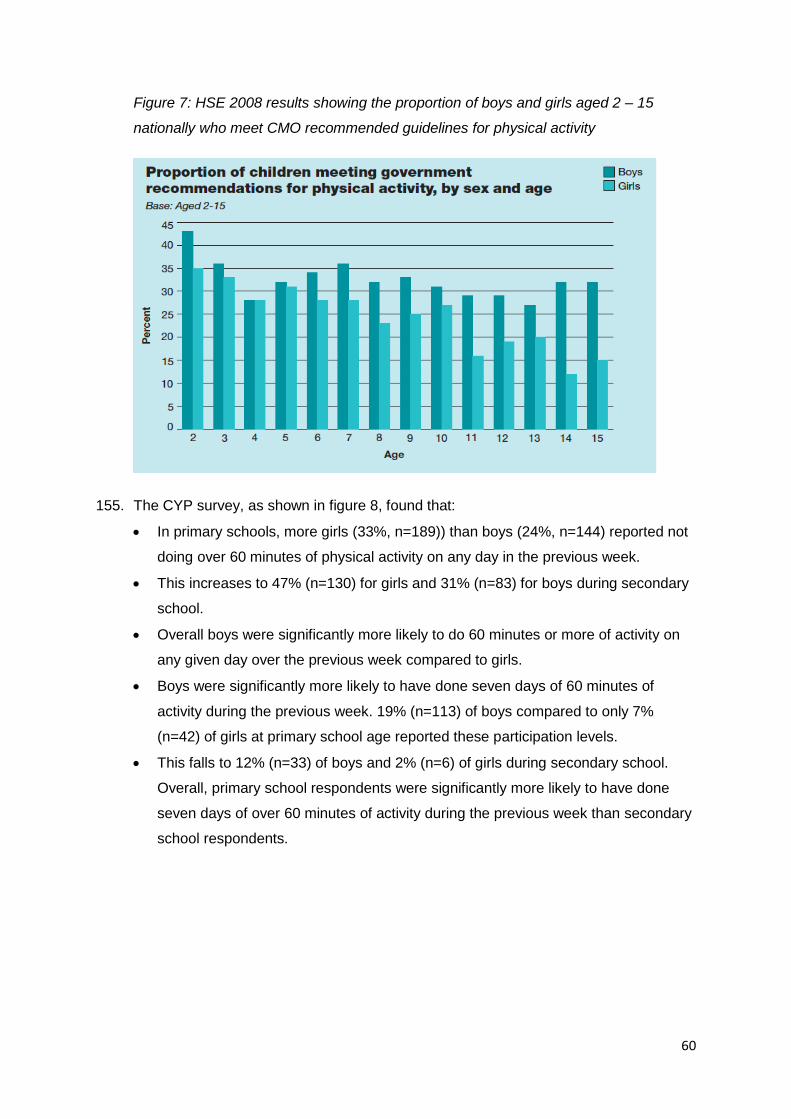
60
Figure 7: HSE 2008 results showing the proportion of boys and girls aged 2 – 15
nationally who meet CMO recommended guidelines for physical activity
155. The CYP survey, as shown in figure 8, found that:
In primary schools, more girls (33%, n=189)) than boys (24%, n=144) reported not
doing over 60 minutes of physical activity on any day in the previous week.
This increases to 47% (n=130) for girls and 31% (n=83) for boys during secondary
school.
Overall boys were significantly more likely to do 60 minutes or more of activity on
any given day over the previous week compared to girls.
Boys were significantly more likely to have done seven days of 60 minutes of
activity during the previous week. 19% (n=113) of boys compared to only 7%
(n=42) of girls at primary school age reported these participation levels.
This falls to 12% (n=33) of boys and 2% (n=6) of girls during secondary school.
Overall, primary school respondents were significantly more likely to have done
seven days of over 60 minutes of activity during the previous week than secondary
school respondents.
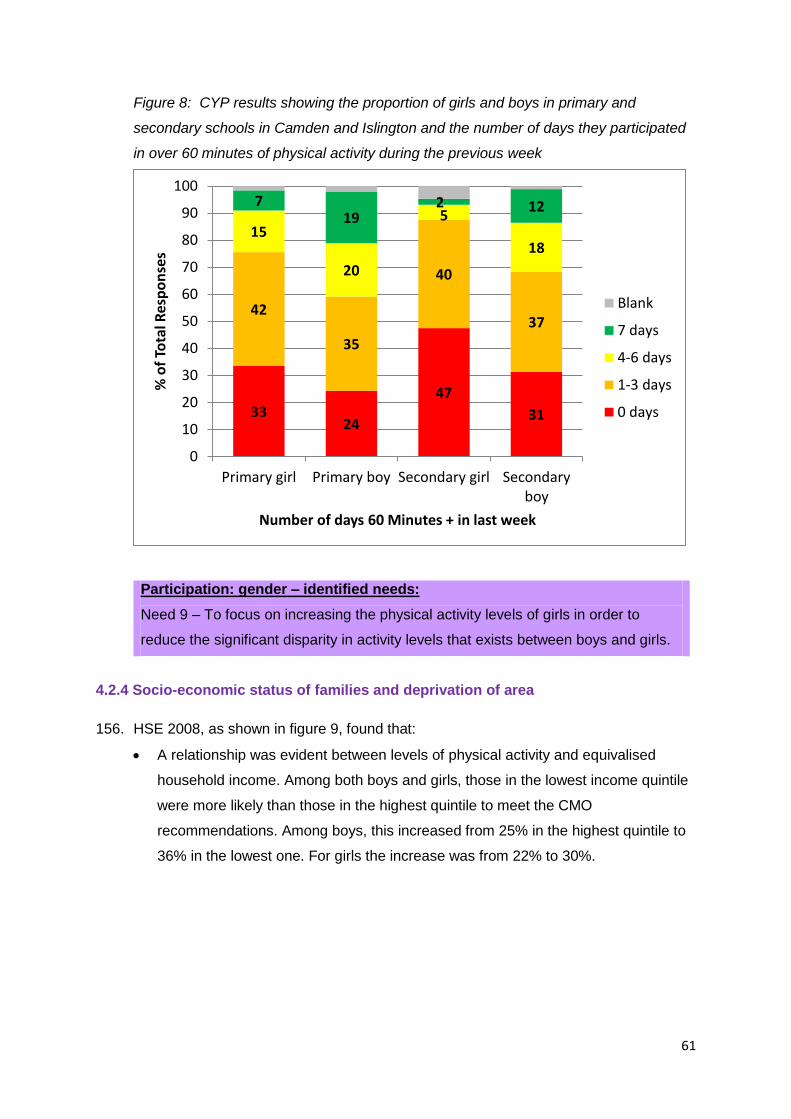
61
Figure 8: CYP results showing the proportion of girls and boys in primary and
secondary schools in Camden and Islington and the number of days they participated
in over 60 minutes of physical activity during the previous week
Participation: gender – identified needs:
Need 9 – To focus on increasing the physical activity levels of girls in order to
reduce the significant disparity in activity levels that exists between boys and girls.
4.2.4 Socio-economic status of families and deprivation of area
156. HSE 2008, as shown in figure 9, found that:
A relationship was evident between levels of physical activity and equivalised
household income. Among both boys and girls, those in the lowest income quintile
were more likely than those in the highest quintile to meet the CMO
recommendations. Among boys, this increased from 25% in the highest quintile to
36% in the lowest one. For girls the increase was from 22% to 30%.
33 24
47
31
42
35
40
37
15
20
5
18
7 19
2 12
0
10
20
30
40
50
60
70
80
90
100
Primary girl Primary boy Secondary girl Secondaryboy
% o
f To
tal R
esp
on
ses
Number of days 60 Minutes + in last week
Blank
7 days
4-6 days
1-3 days
0 days

62
Figure 9: HSE 2008 results showing the proportion of children meeting CMO
recommendations for physical activity by equivalised household income and gender
157. Valid postcodes were provided by just over half of CYP survey respondents (n=831).
These postcodes were mapped against the Indices of Multiple Deprivation (IMD)
assigned to each of their corresponding lower super output areas. Responses were
then analysed by national quintiles, which are comparable between Camden and
Islington. No clear pattern emerged from this analysis. However, it was found that:
For respondents living within the most deprived areas in Camden and Islington
there was little difference in the levels of activity reported compared with overall
figures. A possible explanation for this could be down to small sample sizes when
analysing survey respondents by postcode and deprivation level.
For those in the second most deprived quintile nationally, the number of young
people who reported no days of activity during the previous week was much lower
than the overall total (26%, n=75 compared to 32%, n=545). The percentage of
respondents in this quintile (46%, n=133) who reported 60 minutes or more of
activity between one and three days during the previous week was higher than the
overall figure (39%, n=652).
158. A further finding from the PE and Sport Survey (3) was that:
Schools in deprived areas were over-represented among the lowest performing
schools in terms of their participation in PE/school sport.
63
4.2.5 Disability/special educational needs
159. As part of the CYP survey young people were asked to identify whether they believed
they had a disability. In total 51 young people identified themselves as disabled with a
further 67 ‘unsure’. The results indicated that:
More respondents who answered ‘yes’ (41%, n=21) and ‘yes’ and ‘unsure’
combined (35%, n=41) reported doing no days of more than 60 minutes of physical
activity over the last week than those who answered ‘no’ (32%, n=492).
A larger proportion of non-disabled young people (39%, n=600) reported doing
over 60 minutes of physical activity on 1-3 days in the last week than those who
answered ‘Yes’ (33%, n=17) and those who answered ‘Yes’ and ‘Unsure’
combined (25%, n=30).
The proportion of people who reported doing 4-6 and 7 days of over 60 minutes of
physical activity during the previous week were similar for disabled and non-
disabled young people.
160. The Taking Part survey (4) found that:
Young people with a limiting long-term illness/disability (81.4%) were significantly
less likely to have done sport in the last four weeks than those who did not report a
limiting long-term illness/disability (89.6%).
161. The PE and Sport survey found that:
The lowest performing schools, in terms of their achievement in PE/school sport,
tended to have a higher proportion of pupils with special educational needs.
Participation: disability – identified needs:
Need 10 – For more disabled young people to achieve the CMO recommended
guidelines for physical activity.
Need 11 – To support more disabled young people to undertake 60 minutes on at
least 1-3 days of the week.
4.2.6 Ethnicity
162. The CYP survey found that:
Young people from a white background reported higher levels of physical activity
than those from non-white backgrounds. Those with ‘White British’ (14%, n=74)
and ‘Other White’ (15%, n=23) backgrounds were slightly more likely than the

64
overall total (11%, n=194) to do seven days of over 60 minutes of activity during
the previous week.
45% (n=84) of those from an Asian/Asian British background (including Indian,
Pakistani, Bangladeshi and Other) did not achieve 60 minutes or more of physical
activity during the previous week. This figure was notably higher (49%, n=62) for
those within this group of an Asian/Asian British – Bangladeshi background. This
compares to 32% for all respondents to the survey. Fewer respondents (9%, n=11)
with an Asian/Asian British - Bangladeshi background did 7 days of 60 minutes or
more physical activity during the previous week than the overall total (11%).
163. The PE and Sport Survey found that:
Schools with the lowest levels of participation tended to have a relatively high
proportion of children from an ethnic minority background and vice versa.
Participation: ethnicity – identified needs:
Need 12 – For more young people from non-white ethnic groups to achieve the CMO
guidelines.
Need 13 – In comparison to other ethnic groups, to increase the physical activity
levels of young people from a Bangladeshi background specifically.
4.2.7 Body mass index (BMI)
164. HSE 2008 found that:
The proportion of young people who met CMO recommendations did not vary
depending on whether they were categorised as ‘overweight’, ‘obese’ or ‘not
overweight or obese’.
4.2.8 Sedentary activity
165. Evidence from HSE 2008 suggests a growing concern at the risk of sedentary
behaviour. Although most research has focused on the relationship between sedentary
behaviour and obesity, some research also suggests that sedentary behaviour is
independently associated with all-cause mortality, type 2 diabetes, some types of
cancer and metabolic dysfunction (5).
166. It is possible for individuals to meet CMO guidelines but still spend large amounts of
time engaging in sedentary activity. A large amount of time spent being sedentary may
65
increase the risk of some health outcomes, even among people who are active at
CMO recommended levels (5).
167. According to HSE 2008, average sedentary time was very similar for boys and girls on
both weekdays and weekend days and this generally increases with age.
168. Household income was clearly linked to sedentary behaviour. For both boys and girls,
as household income decreases, the amount of sedentary time increases – particularly
when the proportion of time spent watching television is analysed. So while those from
lower income families are more likely to meet CMO recommendations, they are also
likely to spend more time engaging in sedentary activity compared to those from higher
income families.
169. Among both boys and girls there was a relationship between time spent engaging in
sedentary activity and their BMI category. Those classified as obese were likely to
spend more time engaging in sedentary activity than those classified as overweight. In
turn, those classified as overweight were likely to spend more time engaging in
sedentary activity than those not classified as overweight or obese.
Participation: sedentary activity – identified needs:
Need 14 – To reduce the amount of time young people spend in sedentary activities.
4.2.9 Physical activity preferences
170. Through the CYP survey, young people were asked about their preference for physical
activity over other activities. Each respondent chose the statement which they thought
most reflected their view. Results for this question can be seen in table 7:
Table 7: CYP survey results showing young people’s preferences for physical activity
over other activities
Options Description Camden Islington Overall
Option 1 I really enjoy exercise and would choose to do it over most other activities
35% 32% 33%
Option 2 I enjoy exercise and it would be high on my list of things to do but not always at the top
29% 28% 29%
Option 3 I sometimes enjoy exercise but I prefer to do other activities
19% 21% 21%
Option 4 I prefer to do other activities rather than exercise
7% 9% 8%
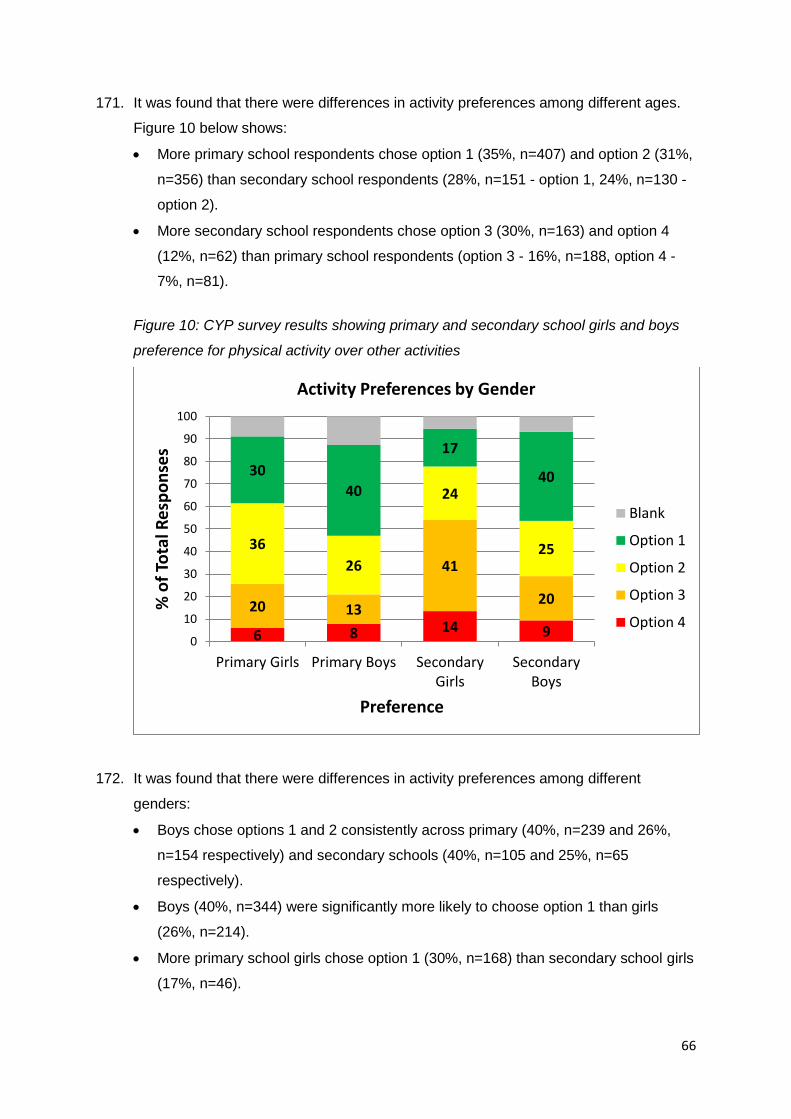
66
171. It was found that there were differences in activity preferences among different ages.
Figure 10 below shows:
More primary school respondents chose option 1 (35%, n=407) and option 2 (31%,
n=356) than secondary school respondents (28%, n=151 - option 1, 24%, n=130 -
option 2).
More secondary school respondents chose option 3 (30%, n=163) and option 4
(12%, n=62) than primary school respondents (option 3 - 16%, n=188, option 4 -
7%, n=81).
Figure 10: CYP survey results showing primary and secondary school girls and boys
preference for physical activity over other activities
172. It was found that there were differences in activity preferences among different
genders:
Boys chose options 1 and 2 consistently across primary (40%, n=239 and 26%,
n=154 respectively) and secondary schools (40%, n=105 and 25%, n=65
respectively).
Boys (40%, n=344) were significantly more likely to choose option 1 than girls
(26%, n=214).
More primary school girls chose option 1 (30%, n=168) than secondary school girls
(17%, n=46).
6 8 14 9
20 13
41
20
36
26
24
25
30
40
17
40
0
10
20
30
40
50
60
70
80
90
100
Primary Girls Primary Boys SecondaryGirls
SecondaryBoys
% o
f To
tal R
esp
on
ses
Preference
Activity Preferences by Gender
Blank
Option 1
Option 2
Option 3
Option 4
67
Many more primary school girls (36%, n=202) chose option 2 than boys (26%,
n=154). However, this decreases sharply for girls at secondary school age to 24%
(n=65) but not for boys (25%, n=65).
Overall, girls were significantly more likely to choose option 3 than boys.
4.2.10 Participation through active travel
173. In recent years, travel to and from school has been recognised as an opportunity for
young people to be physically active. While the primary research for this needs
assessment did not specifically explore the extent of active travel in Camden and
Islington, two national surveys provide insight into the extent to which young people
are physically active through travel.
174. HSE 2008 found that:
Almost two thirds of 2-15 year olds who attended school, nursery or playgroup in
the previous week had walked to or from school on at least one day of the week
(63% of boys and 65% of girls).
175. The 2011 National Travel survey (6), which collected data from nearly 8,000 British
households covering over 18,000 individuals on personal travel including travel to
school, found that:
In 2011, 49% of trips to and from school by primary school respondents were made
by foot. This was slightly lower than in 1995/97 when 53% of trips were made by
foot.
Among secondary school respondents in 2011, 38% of school trips were made by
foot. This was slightly lower than in 1995/97 when 42% of trips were made by foot.
3% of school trips by secondary school respondents were made by bicycle.
For trips to school of less than one mile in length, walking was the most popular
mode of travel for both primary and secondary school respondents, accounting for
84% and 89% of trips respectively.
4.3 Barriers and motivations
Summary
Young people are not taking part in physical activity because there are barriers
preventing them from doing so. These need to be reduced or removed to make it
easier for young people to access physical activity. Equally, there are motivators
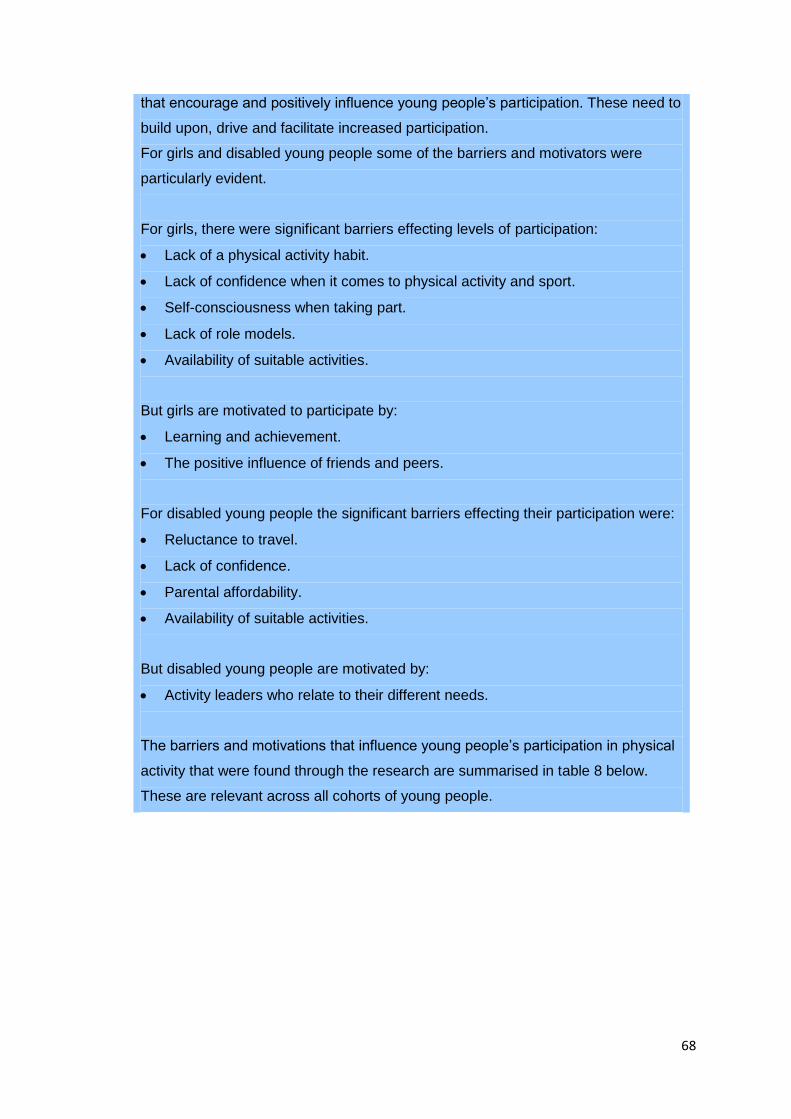
68
that encourage and positively influence young people’s participation. These need to
build upon, drive and facilitate increased participation.
For girls and disabled young people some of the barriers and motivators were
particularly evident.
For girls, there were significant barriers effecting levels of participation:
Lack of a physical activity habit.
Lack of confidence when it comes to physical activity and sport.
Self-consciousness when taking part.
Lack of role models.
Availability of suitable activities.
But girls are motivated to participate by:
Learning and achievement.
The positive influence of friends and peers.
For disabled young people the significant barriers effecting their participation were:
Reluctance to travel.
Lack of confidence.
Parental affordability.
Availability of suitable activities.
But disabled young people are motivated by:
Activity leaders who relate to their different needs.
The barriers and motivations that influence young people’s participation in physical
activity that were found through the research are summarised in table 8 below.
These are relevant across all cohorts of young people.

69
Table 8: Identified themes used to organise research findings into the barriers and
motivators for young people when taking part in physical activity
Theme Barriers Motivators
Personal priorities The decisions young people take in terms of how they spend their time, where they go and what they do.
Perceived lack of time. Lack of physical activity
habit. Apathy. Reluctance to travel.
Learning and achievement.
Competition. Being good at
sport.
Perception of self The way young people feel about themselves and their abilities. This impacts on how they feel about trying something new/different.
Lack of confidence. Self-consciousness.
Body image. To be healthy.
Impact of others The people (and messages) that influence young people.
Parental affordability. Parental beliefs. Daily pressures on
parents. Family responsibilities. Friends doing other
things. Lack of role models.
Parental support.
Friends and peers.
Inspirational events and role models.
Perception/experience of provision The reactions that young people have to existing provision. This may be through direct experience or pre-existing perceptions they have of it.
Cost. Workforce suitability. Availability of provision
unknown. Availability of activity.
Fun and social.
More choice. Coach
/leaders.
Environmental context The environmental factors that impact on young people’s choices and behaviours.
Access to activities locally.
Safety/territorialism. Lack of green and open
space.
Local activity.
4.3.1 Introduction
176. This section details findings from research into the barriers and motivators that
influence young people in Camden and Islington when taking part in physical activity.
177. By understanding the barriers that make it more difficult for young people to take part
in physical activity, it becomes possible to identify actions required to remove or
reduce these barriers. Equally, by understanding the reasons why young people do
take part in physical activity, it becomes possible to identify actions required to further
encourage and facilitate their participation.

70
178. To understand young people’s barriers and motivators when taking part in physical
activity, five themes were identified to organise research findings (see table 8 above).
Themes are presented by barriers first and followed by motivations with needs
identified at the end of each theme. The section begins with two graphs that show
young people’s responses from the CYP survey when asked why they don’t take part
in more physical activity (figure 11) and why they do take part in physical activity
(figure 12). Answer options in full are provided in the CYP survey, which can be found
in appendices I and J.
179. Note: through the CYP survey, young people were asked to identify their top three
reasons why they take part in physical activity as well as their top three reasons why
they do not take part in more physical activity. Percentage figures from the CYP survey
quoted in this section are therefore percentages of the overall number of times an
answer option was chosen.
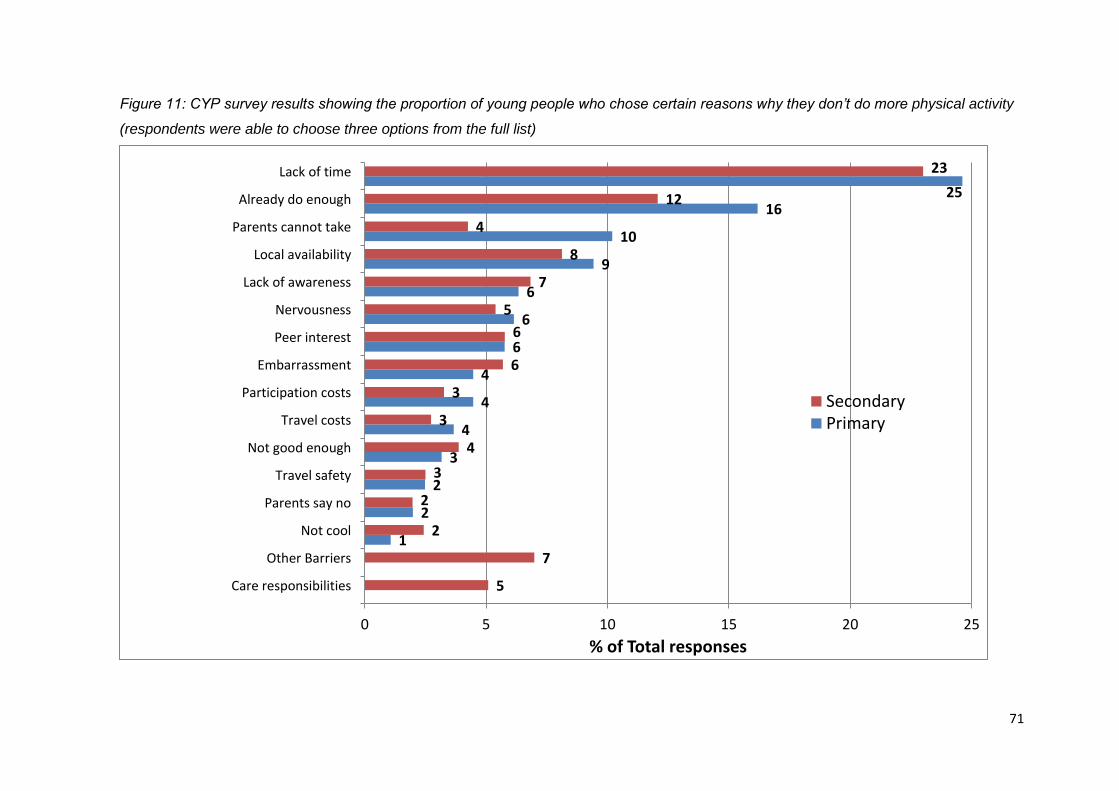
71
Figure 11: CYP survey results showing the proportion of young people who chose certain reasons why they don’t do more physical activity
(respondents were able to choose three options from the full list)
1
2
2
3
4
4
4
6
6
6
9
10
16 25
5
7
2
2
3
4
3
3
6
6
5
7
8
4
12
23
0 5 10 15 20 25
Care responsibilities
Other Barriers
Not cool
Parents say no
Travel safety
Not good enough
Travel costs
Participation costs
Embarrassment
Peer interest
Nervousness
Lack of awareness
Local availability
Parents cannot take
Already do enough
Lack of time
% of Total responses
SecondaryPrimary
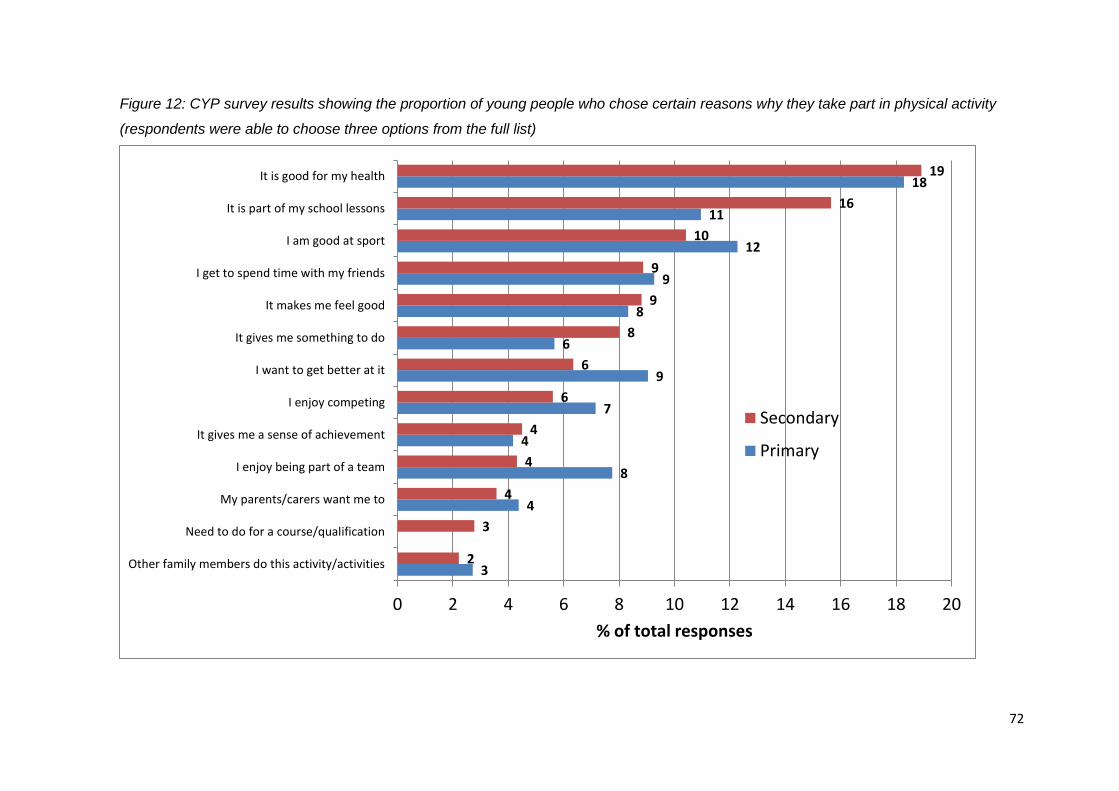
72
Figure 12: CYP survey results showing the proportion of young people who chose certain reasons why they take part in physical activity
(respondents were able to choose three options from the full list)
3
4
8
4
7
9
6
8
9
12
11
18
2
3
4
4
4
6
6
8
9
9
10
16
19
0 2 4 6 8 10 12 14 16 18 20
Other family members do this activity/activities
Need to do for a course/qualification
My parents/carers want me to
I enjoy being part of a team
It gives me a sense of achievement
I enjoy competing
I want to get better at it
It gives me something to do
It makes me feel good
I get to spend time with my friends
I am good at sport
It is part of my school lessons
It is good for my health
% of total responses
Secondary
Primary
4.3.2 - Personal priorities
Barrier - perceived lack of time.
180. Finding:
Young people perceive they have a lack of time when, in fact, they prioritise other
activities over physical activity.
Evidence
181. Source - CYP survey:
When asked why they don’t take part in more physical activity, 25% (n=645) of
primary school and 23% (n=303) of secondary school responses chosen were ‘I
don’t have enough time’.
Primary and secondary respondents who chose activity preference option 2 (see
table 7 for descriptions of physical activity preferences) were significantly more
likely to choose ‘I don’t have enough time’ than those who chose options 1, 3 and
4.
182. Source – Desk research:
Street Games recently undertook an investigation into the attitudes of 14-16 year
olds towards sport (7). Their study found that ‘a lack of time’ was the most
significant barrier to young people being active. It also found that the main reason
for this was due to school/college work. Two other studies also highlighted the
impact of school/college work (5, 8).
A number of articles reviewed found that young people had a lack of time to
prioritise physical activity (5, 7, 8). This was due to preferences for other activities
such as playing on games consoles (7), being too busy seeing friends/socialising
(7) and looking after younger siblings (9).
183. Source – 14+ girls’ focus group:
The 14+ girls stated that starting secondary school was the main factor why they’d
become less active. The increase in homework from primary to secondary school
was cited as a reason for a lack of time outside of school hours. They also stated
that they were often tired after school.
One 14+ girl commented: “I have other priorities, activities such as art and music.”
74
184. Source - stakeholder interviews:
Local stakeholders felt that young people had a lack of time for physical activity
because they spent too much time taking part in sedentary activities. They felt that
boys in particular spent a large amount of time playing computer games. One said
that this meant “they stay indoors more and stop socialising.”
Barrier - lack of physical activity habit
185. Findings:
If young people are not in the habit of taking part in physical activity, it can be hard
to reintroduce them to it. This is particularly relevant to girls.
Young people who do a low amount of physical activity would like to do more
whereas those who do a lot do as much as they want to do.
Some young people are not aware of the level of physical activity they should be
doing to be healthy according to CMO guidelines.
Evidence
186. Source - CYP survey:
When asked why they don’t take part in more physical activity, young people who
did not do 60 minutes or more of physical activity on any of the previous seven
days, were less likely to choose ‘I already do as much exercise as I want to’ (see
Figure 13).
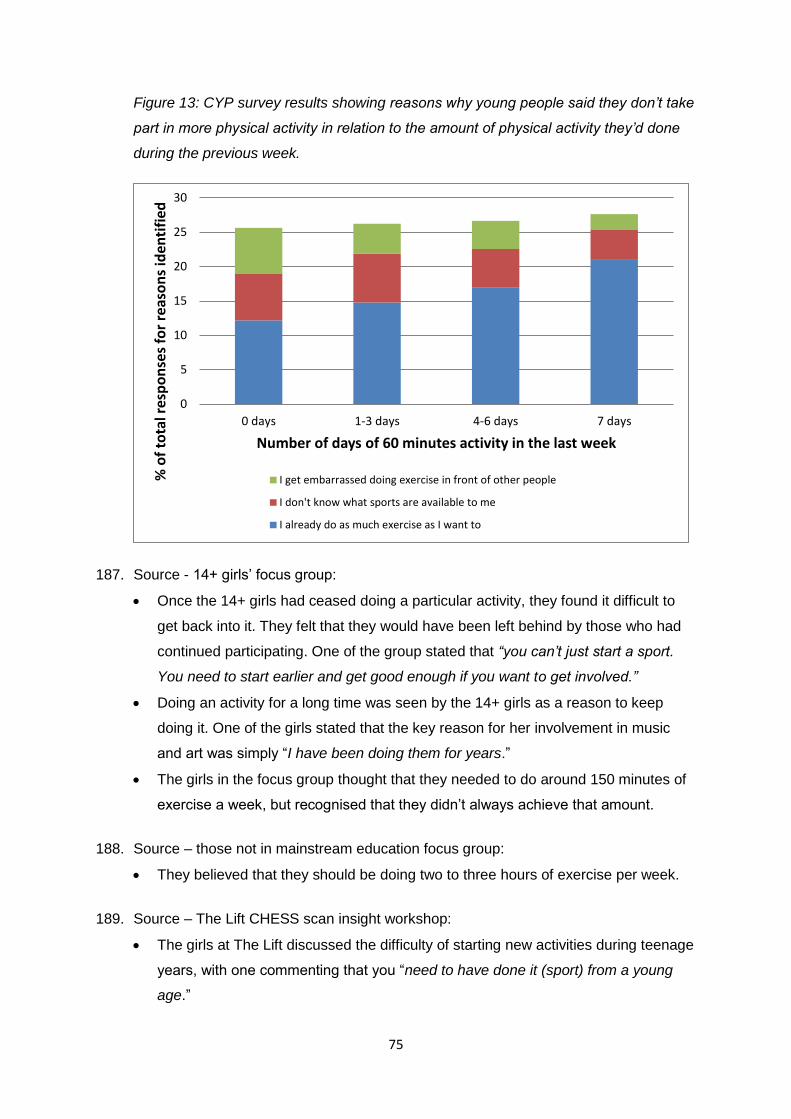
75
Figure 13: CYP survey results showing reasons why young people said they don’t take
part in more physical activity in relation to the amount of physical activity they’d done
during the previous week.
187. Source - 14+ girls’ focus group:
Once the 14+ girls had ceased doing a particular activity, they found it difficult to
get back into it. They felt that they would have been left behind by those who had
continued participating. One of the group stated that “you can’t just start a sport.
You need to start earlier and get good enough if you want to get involved.”
Doing an activity for a long time was seen by the 14+ girls as a reason to keep
doing it. One of the girls stated that the key reason for her involvement in music
and art was simply “I have been doing them for years.”
The girls in the focus group thought that they needed to do around 150 minutes of
exercise a week, but recognised that they didn’t always achieve that amount.
188. Source – those not in mainstream education focus group:
They believed that they should be doing two to three hours of exercise per week.
189. Source – The Lift CHESS scan insight workshop:
The girls at The Lift discussed the difficulty of starting new activities during teenage
years, with one commenting that you “need to have done it (sport) from a young
age.”
0
5
10
15
20
25
30
0 days 1-3 days 4-6 days 7 days
% o
f to
tal r
esp
on
ses
for
reas
on
s id
enti
fied
Number of days of 60 minutes activity in the last week
I get embarrassed doing exercise in front of other people
I don't know what sports are available to me
I already do as much exercise as I want to

76
Barrier - apathy
190. Finding:
Some young people feel apathetic about physical activity.
Evidence
191. Source - CYP survey:
16 secondary respondents commented (using the free text option on question 11)
that they were ‘lazy’ or ‘can’t be bothered’ when asked why they did not do more
physical activity.
‘I already do as much exercise as I want to’ was the second most popular reason
that primary school (16%, n=424) and secondary school (12%, n=159)
respondents gave for not doing more physical activity.
The less physical activity young people reported doing over the previous seven
days, the more likely they were to choose ‘it’s part of my school lessons’ as a
reason why they take part in physical activity (see figure 14). This suggests that
those who take part in a lower amount of physical activity take part because it is
compulsory as part of their school lessons.
192. Source - 14+ girls’ focus group:
The 14+ girls were also apathetic to physical activity. One commented: “I can’t be
bothered with it” while another saw physical activity as “taking too much time”,
listing factors such as getting changed and drying as problematic.
193. Source - desk research:
Some young people have a lack of motivation or apathy towards being active and
would rather do other things like spend time with their friends (7). In a study by
Sport Wales, 17% of young people cited ‘don’t like playing sport’ as a barrier to
extracurricular sports participation (8).
Barrier - reluctance to travel
194. Finding:
Young people were reluctant to travel to take part in physical activity and would
only take part in activities which were close to their homes.
77
Evidence
195. Source - CYP survey:
8% (n=107, the 3rd most popular option) of secondary school responses chosen
were ‘the sport and physical activities I would like to do are not available near
enough to where I live’ as a reason for not doing more exercise.
196. Source – young people not in mainstream education focus group:
Since one boy had moved away from local facilities, the extra distance to travel
now deterred him from continuing to use them.
197. Source - learning disability focus group:
Those with learning disabilities cannot travel too far to activities as they only have a
limited amount of time for their session.
198. Source – Somers Town CHESS scan insight workshop:
During the planning process of the CHESS scan, the young people were very clear
on the boundaries of their area and were reluctant to cross the major roads that
were set as the boundaries for the Somers Town CHESS zone.
Motivation - learning and achievement
199. Finding:
The chance to learn and achieve new skills is a motivation for young people to take
part in physical activity.
Evidence
200. Source - CYP survey:
Overall, 9% (n=316) of responses chosen as a reason for taking part in physical
activity were ‘I want to get better at it’. This was a less popular choice for
secondary school respondents (6%, n=103).
The more physical activity young people reported doing over the previous seven
days, the more likely they were to choose ‘I get to spend time with my friends’, ‘I
am good at sport’ and ‘I enjoy being part of a team’ as reasons why they take part
in physical activity.
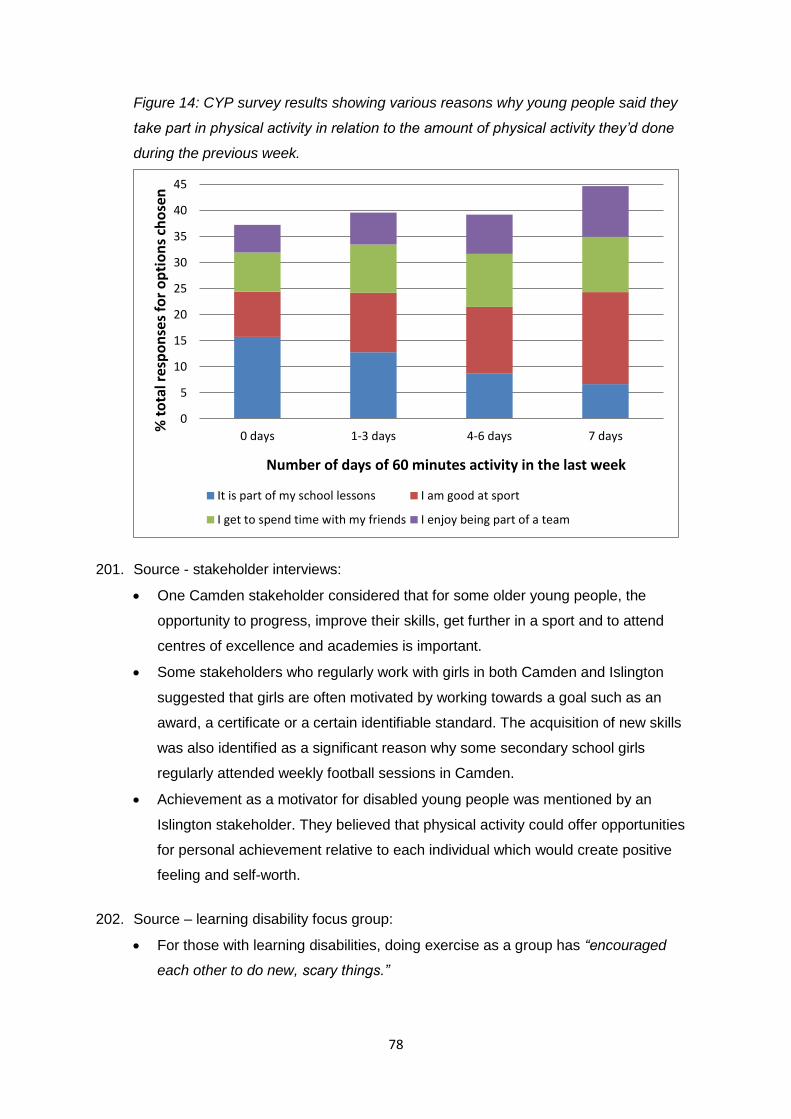
78
Figure 14: CYP survey results showing various reasons why young people said they
take part in physical activity in relation to the amount of physical activity they’d done
during the previous week.
201. Source - stakeholder interviews:
One Camden stakeholder considered that for some older young people, the
opportunity to progress, improve their skills, get further in a sport and to attend
centres of excellence and academies is important.
Some stakeholders who regularly work with girls in both Camden and Islington
suggested that girls are often motivated by working towards a goal such as an
award, a certificate or a certain identifiable standard. The acquisition of new skills
was also identified as a significant reason why some secondary school girls
regularly attended weekly football sessions in Camden.
Achievement as a motivator for disabled young people was mentioned by an
Islington stakeholder. They believed that physical activity could offer opportunities
for personal achievement relative to each individual which would create positive
feeling and self-worth.
202. Source – learning disability focus group:
For those with learning disabilities, doing exercise as a group has “encouraged
each other to do new, scary things.”
0
5
10
15
20
25
30
35
40
45
0 days 1-3 days 4-6 days 7 days
% t
ota
l res
po
nse
s fo
r o
pti
on
s ch
ose
n
Number of days of 60 minutes activity in the last week
It is part of my school lessons I am good at sport
I get to spend time with my friends I enjoy being part of a team
79
203. Source - desk research:
Motivators for taking part in physical activity can include the desire to experiment
with different activities (10), the opportunity to work towards an event or
participating in fundraising that has a physical activity element to it (11). A
qualitative study by the English Federation of Disability Sport (EFDS) highlighted
the opportunity to develop social skills as a motivator for disabled people (12).
Motivation - competition
204. Finding:
Competition can act as a motivator for some young people to take part in physical
activity.
Evidence
205. Source - CYP survey:
7% (n=250) of primary school and 6% (n=91) of secondary school responses
chosen were ‘I enjoy competing’ as a reason for taking part in physical activity.
Significantly more boys chose this option than girls.
206. Source - stakeholder interviews:
Competition was usually raised in relation to more ‘sporty’ young people. One
Camden stakeholder noted about primary school children that “they like the skill
development and the competition, both inter and intra-school environments and
representing the school.”
207. Source - desk research:
For some people lack of a competition makes physical activity more enjoyable.
However, for some people (girls more than boys), competition is a motivator (13).
Research by Allender et al (2006) suggests that the level of competition needs to
be relevant to the individual (10).
Motivation - being good at sport
208. Finding:
Being good at sport was perceived by young people as a reason to take part in
physical activity.
80
Evidence
209. Source - CYP survey:
‘I am good at sport’ was the second most chosen option when primary school
respondents were asked why they take part in physical activity (12%, n=429). It
was the third most chosen option by secondary school respondents (10%, n=169).
Boys (15% n=274 primary, 13% n=112 secondary) were more likely to choose this
option than girls (9% n=155 primary, 7% n=57 secondary).
‘Bangladeshi’ and ‘other ethnic group’ respondents were less likely to choose this
option than those from other ethnic groups.
As shown in figure 14, the more physical activity young people reported taking part
in over the previous seven days, the more likely they were to choose this option.
Similarly, those who chose activity preference 1 (see table 7 for descriptions of
physical activity preferences) were significantly more likely to choose this option
and ‘I enjoy competing’ than those who chose activity preferences 2, 3 or 4.
Those who chose activity preference 3 (see table 7 for descriptions of physical
activity preferences) were significantly less likely to choose ‘I am good at sport’
than those who chose options 1, 2 and 4.
Barriers and motivations: personal priorities – identified needs:
Need 15 – For young people to give physical activity a higher priority and to support
them to fit it into their daily lives.
Need 16 – For young people to form a physical activity habit from an earlier age.
Need 17 – To support young people to travel to participate in physical activities
outside their local areas.
Need 18 – To better understand why some young people are apathetic towards
being physically active and whether they would be more active if the offer was right
for them.
Need 19 – To build on the opportunities for learning and achievement that present
themselves through physical activity.
Need 20 – To provide competitive opportunities that are appropriate to each
individual’s needs.
Need 21 – To encourage more young people to perceive that they are competent at
physical activity.
Need 22 – For young people, their parents/carers and those who work with young
people to have greater awareness of the recommended CMO level of physical
activity to be healthy.
81
4.3.3 Self-perception
Barrier - lack of confidence
210. Finding:
A significant number of young people, and in particular girls, lack confidence in
their ability to do physical activity.
Some young people feel that they are not good enough to participate in physical
activity because they didn’t acquire the right skills at an early enough age.
Evidence
211. Source - CYP survey:
Those who chose activity preference option 3 (see table 7 for descriptions of
physical activity preferences) were significantly more likely to choose ‘I don’t think I
am good enough to join in with other sport and activity groups’ as a reason why
they don’t take part in more physical activity.
More primary school respondents from a Bangladeshi background (8%, n=17)
chose ‘I am nervous about trying new activities/meeting new people’ than primary
school respondents overall (6%, n=161).
212. Source - stakeholder interviews:
One stakeholder, when referring to activity sessions in a youth club setting, stated
“…they (young people) might feel not good enough to take part in…sessions,
whereas we take anyone on.”
213. Source - desk research:
There is evidence that activities can be dominated by more ‘sporty’ young people,
which leaves other young people too intimidated to attend sessions and with a
sense of inferiority (7).
Some disabled young people have a lack of confidence and self- belief which can
act as a barrier to them being active (12).
214. Source - stakeholder interviews:
More than one local stakeholder felt that the competitive nature of PE in schools
left many young people behind, leaving them with fewer skills. They also noted
that older young people who were overweight often had delicate self-esteem
issues that could act as a barrier to their participation. One comment, describing
82
the effects of being overweight, included: “There’s the physical side of it and then
the emotional side of it as well and the psychological. There’s a lot of evidence
that shows the stigma of it, especially for young girls.”
Other local stakeholders also stated that girls may lack confidence at 14+ if they’d
not had much experience of an activity or that previous experience had not been
positive.
One local stakeholder noted the difference in confidence levels between boys and
girls, citing that boys are naturally given a football to play with and that this affects
girls as teenagers.
215. Source - 14+ girls’ focus group:
The 14+ girls struggled with the idea of starting a sport at age 14, feeling that
most clubs and facilities only appealed to those already good at that activity. They
felt that by not starting a sport young enough they were not able to join a club later
in life. They also felt that it was important to start early in order to be able to
interact socially with other young people of similar abilities.
216. Source - The Lift CHESS scan insight workshop:
One 16 year old girl stated that “athletics clubs are hard to get into. Everyone’s
too good - it’s intimidating to go into a club.”
Barrier - self-consciousness
217. Finding:
Young people, and in particular secondary school girls, often feel self-conscious
when taking part in physical activity.
Evidence
218. Source - CYP survey:
A greater percentage of secondary school responses (6%, n=75) chosen were ‘I
get embarrassed doing exercise in front of other people’ as a reason why they
don’t take part in more physical activity compared to primary school responses
chosen (4%, n=117).
Secondary school girls (8%, n=56) were significantly more likely to choose this
option than secondary school boys (3%, n=19).
As shown in figure 13, the less physical activity young people reported taking part
in over the previous seven days, the more likely they were to choose this option.
83
While only 6% (n=75) of secondary school responses chosen were ‘I get
embarrassed doing exercise in front of other people’, those secondary school
respondents who chose activity preference options 3 and 4 (see table 7 for
descriptions of activity preferences) chose this barrier 8% (n=35) and 9% (n=15)
of the time respectively.
219. Source – stakeholder interviews:
Stakeholders felt that some young people, particularly girls, don’t like being seen
to be sweaty, that there was a stigma attached to being overweight and that some
don’t like doing PE at school because of their body image. One commented
“some of them don’t like doing PE, They don’t like the idea of sweating in the sun
while they are doing it.”
220. Source - 14+ girls’ focus group:
The 14+ girls felt that taking part in physical activity, particularly when done in
public, can create feelings of self-consciousness. One commented that when her
and her friends train at Cantelowes Park, there are a lot of boys around, which
means they get embarrassed.
221. Source - Somers Town CHESS scan insight workshop:
This point was echoed by a young female commenting on Polygon Road urban
gym, who said “(it) feels way too open which may make some people feel
uncomfortable.”
222. Source - desk research:
A number of the sources reviewed found that self-esteem and body image are
barriers faced by secondary school girls when taking part in physical activity (5, 7,
10, 11, 13, 14). Inappropriate sports kit and being physically active in public can
exacerbate perceptions about their body image (10). There are also perceptions
that sport is unfeminine and more of a male pastime (7, 10, 13). The study by
Street Games found that young people did not like the physical exertion of activity.
This was seen to deter teenage girls in particular (7).
Motivation - body image
223. Finding:
The desire to have a positive body image can encourage young people, and in
particular older young people, to take part in physical activity.
84
Evidence
224. Source - stakeholder interviews:
One stakeholder who works across Camden and Islington commented that “for the
older age group it’s (participating in physical activity) because they recognise that
they are overweight and want to do something about it. For a lot of them it’s being
teased and the stigma behind it in schools.”
Talking specifically about girls in Camden one stakeholder commented that
“everyone says you can spot a Camden girl anywhere. They’ve got this image.
Image is such a big influence these days being near Camden Market and the Lock
– it’s quite a trendy area. It’s all about image and what they wear and how they
look. So for some of them, fitness and their health is actually a huge motivational
tool.”
A Camden stakeholder suggested that what motivates young people is less about
consciously wanting to be healthy and more about the desired physical outcomes,
such as “to build muscles” and “I want to look good.”
225. Source - desk research:
Young people are motivated to take part in physical activity in order to control their
body weight and to improve/enhance their body shape (7, 10). The study by
Allender et al suggests that pressure to conform to popular ideals of beauty are
important reasons for teenage girls being physically active (10).
226. Source – The Lift CHESS scan insight workshop:
“It’s not about being healthy, it’s more about looking good and losing weight,” (16
year old female on CHESS insight workshop).
Motivation - to be healthy
227. Findings:
Young people understand the link between taking part in physical activity and good
health.
The parents of under-5s saw physical activity as a way to maintain the good health
of their children.
Evidence
228. Source - CYP survey:
Both primary and secondary school respondents chose ‘it’s good for my health’ as
the most common reason why they took part in physical activity.
85
Girls (20%, n=494) were slightly more likely than boys (17%, n=452) to choose this
option.
The less physical activity young people reported taking part in over the previous
seven days, the more likely they were to choose this option as a reason for taking
part in physical activity.
Young people with a white British background were significantly less likely to
choose this option than those from other ethnic backgrounds.
229. Source - parents of under-5s focus group:
The parents of under-5s ensured their children were physically active because of
its health benefits, which were seen in the context of encouraging the healthy
development of their child. Comments received by the parents included “helps
develop bones” and “maintains a healthy appetite and wears them out so they
sleep properly.”
230. Source - 14+ girls’ and learning disability focus groups:
Both groups had an understanding of the health benefits of physical activity. What
is less clear is whether these groups were actually motivated to take part in
physical activity by the health benefits it brings or whether they merely understood
that physical activity has health benefits.
231. Source - stakeholder interviews:
One stakeholder who works across both boroughs commented that they were
“dubious as to whether direct health messages to young people would work in
terms of encouraging them to be more active”. However, they also suggested that
direct health messages targeted at parents/carers could have a positive impact.
232. Source – young people not in mainstream education focus group:
While young people not in mainstream education are aware of the actual health
benefits of taking part in physical activity, there was limited knowledge of the
requisite levels of physical activity required to be healthy.
Barriers and motivations: self-perception – identified needs:
Need 23 – To build confidence in young people and especially girls when
taking part in physical activity.
Need 24 – To reduce levels of self-consciousness when taking part in physical
activity in teenage girls and young people with weight issues.
86
Need 25 – To capitalise on the potential of physical activity to improve some
young people’s body image.
4.3.4 Impact of others
Barrier – parental affordability
233. Finding:
Some young people can’t take part in physical activities because their parents can’t
afford to pay. This is particularly true for parents with multiple siblings, those from
low income backgrounds, those with children with learning disabilities and parents
of under-5s.
Parents’ perception of how much activities cost can result in fewer young people
taking part in physical activity.
Evidence
234. Source – stakeholder interviews:
One stakeholder felt that parents from low income families wouldn’t prioritise
spending money on physical activity unless there were benefits such as free
childcare.
There was also a feeling among stakeholders that parents had misperceptions
about the cost of being physically active. One comment stated that “I think a lot of it
comes down to parents. I think parents think it costs a lot of money to be physically
active – ‘we can’t afford gym memberships, we can’t afford to do those nice things’
– not realising that there are free and low cost options that you can do.”
Stakeholders also felt that affordability becomes more of an issue for parents with
multiple siblings as even at low prices “the costs stack up”. A local stakeholder
stated that “you’ve got a lot of young people who financially can’t afford it or their
parents can’t afford it due to the fact they just can’t or you’ve got parents who have
more than one or two siblings – they may have four or five.”
235. Source – learning and physical disability focus groups:
The young people with learning and physical disabilities felt that, as they were
often from poorer backgrounds, they still had to pay and that even with a disability
concession this was a problem. They also felt that many of the more interesting
activities they wanted to do (e.g. horse riding) would be too expensive. It was also
87
pointed out that appropriate facilities for disabled people are often further away,
resulting in higher transport costs.
236. Source – parents of under-5s focus group:
The parents of under-5s had been looking at sports clubs but had found them to be
very expensive. They saw cost as a major deterrent and felt that up-front payments
were too large a sum, were too risky if their children didn’t like the activity and that
money was wasted if they couldn’t attend for one week of the course.
Barrier – parental beliefs
237. Findings grouped under the theme of parental beliefs have been divided up into two
sub-themes – parents’ behaviour patterns and parental concerns over safety.
Parents’ behaviour patterns
238. Findings:
If parents have negative feelings about physical activity, they can have a negative
impact on the participation of their children in physical activity.
Parents’ levels of participation in physical activity can affect the participation levels
of their children.
Evidence
239. Source – stakeholder interviews:
Stakeholders viewed some parents’ behaviour patterns as a barrier to young
people taking part in physical activity. They saw gaming and watching television as
a big barrier. One Islington stakeholder, when carrying out home visits, often found
“the family inside with the curtains shut, watching television.”
Another stakeholder mentioned that young people copied sedentary behaviour
from their parents and that if parents were active, their children would follow suit.
They also stated that if parents had ‘buy-in’ (to messages around the importance of
physical activity), this would help more young people take part.
It was also mentioned by local stakeholders that many parents were often unaware
of parks, even if local. Additionally, they felt that many parents were in denial about
the weight of their children, comparing them to what they saw as the norm, which is
getting bigger.
The attitudes and beliefs of parents were also seen as a significant barrier.
Stakeholders felt that parents needed to believe that, for example, it is good for
88
their children to walk to school. One stated “if parents don’t value and encourage
participation, young girls won’t either”.
240. Source – desk research:
HSE 2008 found that young people were more likely to be classified as having ‘low’
physical activity levels if their parents were also in this ‘low’ category (2).
Young people’s activity levels may be influenced by their parents’ behaviour.
Disinterest in physical activity by parents may influence their children negatively
(9). Similarly, parents placing higher priority on other parts of their children’s lives
may do the same (7).
241. Source – physical disability focus group:
It was found that there is a lack of advice for parents of physically disabled young
people on ways to get them physically active. Carers said simply not knowing how
to play specific sports puts parents off playing sport with children with disabilities
out of school. Many believed that if such information was shared, families of
children with disabilities may be more confident to engage and arrange physical
activity out of school.
242. Source – parents of 5-8 year olds focus group:
Parents in this group stated that they didn’t take part in structured physical activity
themselves as they didn’t have time for it.
Parental concerns over safety
243. Findings
Parents’ perceptions of safety may result in their children not taking part in physical
activity.
Evidence
244. Source – stakeholder interviews:
It was felt by stakeholders that the safety concerns of parents were a barrier for
young people. They felt that parents would prefer to have their children at home,
where they know they are safe and aren’t getting into trouble. One Islington
stakeholder said “it’s important the parent feels comfortable with their children
taking part. If there has been an incident in a local park for example, they will keep
their children away”.

89
They also stated that they didn’t think parents wanted to collect children in the dark
(attendance at clubs in winter is less). The stakeholders thought that some parents
could be overprotective. One example raised was the difficulties faced when
engaging Asian girls in Somers Town. They felt that parents were often more
protective of girls than boys.
245. Source – desk research:
Parents’ concerns over safety (in terms of both the physical activity itself and the
local environment) was identified as a barrier in a number of the sources reviewed
(5, 7, 10, 13, 14).
Barrier – daily pressures on parents
246. Finding:
Parents can be unable to take their children to participate in physical activity due to
other commitments.
Evidence
247. Source – CYP survey:
‘My parents are not able to take me’ (10%, n=267) was the 3rd most chosen option
by primary school respondents when they were asked why they didn’t do more
exercise.
More primary school girls (12%, n=152) than boys (9%, n=114) chose this option.
More primary school respondents from Islington (11%, n=182) than Camden (9%,
n=84) chose this option.
248. Source – parents of under-5s focus group:
The parents of under-5s felt that jobs, other childcare commitments and housework
reduced time for them to support their children’s participation in activities.
The parents of under-5s said that their children watched between 2.5 and 4 hours
of television/tablet computer per day. However, they also stated that they tried to
limit the amount of television they watched.
249. Source – stakeholder interviews:
One Islington stakeholder was particularly keen that parents were active with their
children, stating that it “alleviates the childcare issue that presents itself if the adult
wants to be active.” Additionally, taking part in physical activity together was seen
to encourage a good relationship between parents and children.
90
Stakeholders mentioned that parents of young people with learning disabilities
required a high level of support (often one-to-one) to help their children to be
active. This challenge was compounded when parents had obligations to other
siblings.
250. Source – learning disability focus group:
It was stated in this group that many parents are very busy and do not have the
time to take children with physical disabilities to engage in sporting activities.
Additionally, it was found that they often came from large families and that parents
had obligations to other children.
Barrier – family responsibilities
251. Finding:
Some young people, particularly those from a Bangladeshi background, have to
look after members of their family, which results in them taking part in less physical
activity.
Evidence
252. Source – CYP survey:
‘I have to look after people in my family’ was the 4th most chosen option by
Bangladeshi secondary respondents (10%, n=13) when asked why they don’t take
part in more physical activity. Overall, secondary respondents chose this option 5%
(n=67) of the time.
253. Source – stakeholder interviews:
Local stakeholders stated that some young people could not attend after-school
clubs as they had to look after younger siblings. They stated that Bangladeshi girls
have to pick up siblings and go home straight after school.
Barrier – Other interests of friends
254. Finding:
Young people like to do activities with their friends, meaning that they are
sometimes put off activities if their friends aren’t interested in them.
Evidence
255. Source – CYP survey:
91
‘My friends want to do other things’ was chosen by 10% (n=13) of secondary
Bangladeshi respondents when asked why they don’t take part in more physical
activity. Overall, secondary respondents chose this option 6% (n=76) of the time.
Primary school respondents in Islington who chose activity preference options 3
and 4 (see table 7 for descriptions of activity preferences) chose ‘my friends want
to do other things’ as a reason why they don’t take part in more physical activity
9% (n=26) and 10% (n=14) of the time respectively. Overall, primary school
respondents only chose this option 6% (n=151) of the time.
256. Source – desk research:
A study by Street Games that focused on 14-16 year olds found that the second
and third most frequently cited reasons preventing them from doing sport and
physical activity were ‘no one to go with’ and ‘too busy seeing friends/socialising’
(7). A study by Sport Wales also found that having ‘no one to go with’ was a
significant reason why young people do not participate in extracurricular sport (8).
Barrier – lack of role models
257. Finding
Participation in physical activity by girls is impacted negatively by the lack of
positive role models to inspire them.
Evidence
258. Source – stakeholder interviews:
A lack of role models for girls was raised by local stakeholders as a barrier. It was
perceived by the stakeholder that this could possibly be further compounded by the
majority of activity leaders tending to be male. In addition, another Camden
stakeholder reflected that “even Jessica Ennis has become a role model for the
wrong reasons” (her body rather than her athletic achievement) and that “girls
would struggle to see the point of exercising if their bodies weren’t like hers.”
259. Source – desk research:
The review by Allender et al into the barriers faced by older girls found that they
require realistic role models for all body types and competency levels rather than
the current sporty types (10).
The Women's Sport and Fitness Foundation report that only 4% of sports coverage
in national and local print media is dedicated to women's sport and that there is a
dearth of female role models to inspire the next generation of healthy active
92
women. The report goes on to recommend that relevant agencies should think
about which local women or girls could be promoted as role models. These could
be coaches, volunteers or athletes at any level and who work to help inspire and
motivate other women and girls (14).
Motivation – parental support
260. Finding:
Parents can motivate their children to take part in physical activity by being
interested in what they do and setting a good example by being active themselves.
Evidence
261. Source – stakeholder interviews:
One Camden stakeholder who manages a community programme said “parental
interest was key.” They talked about the positive impact of parents attending their
sessions and asking how their child was getting on.
One Islington stakeholder suggested that parents’ participation in physical activity
influences their children, saying “if the parents are active, the young person will feel
more comfortable being active.”
The provision of childcare was also seen as a positive factor that encourages
parents and carers to involve their children in physical activity. One commented
that “parents love the holiday camps because it’s free childcare. They can drop
them off between 8 and 9 and collect between 5 and 6”.
262. Source – parents of under-5s focus group:
Parents of under-5s value the opportunity for physical activity to support the
development of their children.
263. Source – desk research:
A number of studies revealed that parents’ positive behaviour can be a motivating
factor (as negative behaviour can be a barrier) in encouraging their children to
take part in physical activity (5, 9, 10, 12, 13). Parental interest/encouragement
and providing money for activity costs were highlighted in particular. One study
reported how parents of younger children can find ways to help them be active,
such as inviting friends over so their children are more likely to engage in active
play (11). A couple of sources highlighted that parental influence declines as
young people get older with their peers becoming more of an influencing factor
on their physical activity behaviour (5, 10, 13).
93
Motivation – positive influence of friends and peers
264. Finding:
Young people enjoy taking part in physical activity because they get to spend
time socialising with their friends.
Evidence
265. Source – CYP survey:
Boys were marginally more likely than girls to choose ‘I get to spend time with my
friends’ when asked why they take part in physical activity.
Secondary school boys (10%, n=88) were more likely to choose this option than
secondary school girls (7%, n=56).
Primary school respondents (8%, n=271) were significantly more likely than
secondary school respondents (4%, n=70) to choose ‘I enjoy being part of a
team’ when asked why they take part in physical activity.
As shown in figure 14, the more physical activity young people reported doing
over the previous seven days, the more likely they were to choose ‘I get to spend
time with my friends’ as an option for why they take part in physical activity.
266. Source – Stakeholder interviews:
A number of stakeholders commented on the importance of peer groups
including one Camden stakeholder who said “it helps if their group of friends is
sporty”. One Islington stakeholder mentioned that their attendance registers show
that new attendees come with people who already attend, suggesting that “their
friend tells them what they have been doing and then they want to come along
too.”
More than one stakeholder commented that peer groups are more important for
adolescent girls.
267. Source – 14+ girls focus group:
For the 14+ girls, ‘doing things with mates’ came across as a primary reason why
they get involved in after school activities.
Comments included:
o “Only go to the gym if I have someone to go with – otherwise it gets boring.”
This person also said that they were more likely to be more disciplined and do
more exercise if they were with a friend as they would set challenges
together.
94
o “I like to go swimming with mates – we swim around for fun and not do
lengths.”
268. Source – desk research:
Spending time with friends was identified as a key motivator to taking part in
physical activity in a number of the studies reviewed (5, 7, 10, 12, 13), particularly
for females.
The report by Street Games suggests the social factor of sport and physical
activity is a key participation motivator. The report cites a study by Duncan et al
(1993) which found that peers will influence enjoyment, companionship and
recognition which then influences the perception of competence and the affective
emotional responses to participation (7).
Motivation – inspirational events and role models
269. Finding:
Young people can be inspired to take part in physical activities by large-scale
sporting events and by well known, professional sportspeople.
Evidence
270. Source – stakeholder interviews:
Some local stakeholders considered how “big events like the Olympics and their
role models” and “holding big events locally” can “inspire young people and keep
sport and physical activity in their minds.” One of these stakeholders had observed
an ex-Olympian engaging with some young people and was impressed by how
much it inspired them.
Barriers and motivations: impact of others – identified needs:
Need 26 – For further (financial) support for some families to be able to afford access
to physical activity.
Need 27 – For parents/carers to have greater awareness of low cost or free physical
activity opportunities.
Need 28 – For some parents/carers to place a higher value on their own and their
children’s levels of physical activity.
Need 29 – For parents/carers to feel that their child is safe when taking part in
activities.
Need 30 – To make it easier for parents/carers to fit physical activity into the every-
day lives of their children.
95
Need 31 – For young people to be able to access physical activity with friends and to
be able to socialise through the physical activity opportunity.
Need 32 – For girls to have more positive female physical activity role models.
Need 33 – To provide opportunities for families and siblings of varying ages to be
physically active together.
Need 34 – To consider the transport costs faced by disabled young people and their
parents/carers to access physical activity provision.
Need 35 – To influence friendship groups (rather than individuals) to take part in
physical activity.
4.3.5 Perception/experience of provision
Barrier – cost
271. Finding:
Young people can find the cost of physical activity to be prohibitive, especially as
they get older.
Evidence
272. Source - stakeholder interviews:
Local stakeholders felt that the cost of sporting provision was often a barrier to
young people. One stated that the cost of leisure facilities, setting up activities and
equipment could prove prohibitive.
There was an opinion expressed by some local stakeholders that young people
might engage with activities more if there was a small charge, rather than if they
were free stating that “it makes them [young people] put a value on it” (Islington
stakeholder). The large amount of expensive private providers in the boroughs was
also noted. Young people also felt that costs grew as you got older. They also
stated that traditional sports such as football took priority for bookings and that
other sports were more expensive to put on so couldn’t be offered for free.
273. Source - 14+ girls’ focus group:
The 14+ girls felt that there were more opportunities for physical activity available
to boys and that they were, more importantly, affordable. They also said the
activities that are of interest to them are more expensive with zumba, at £7 a
session, singled out.
274. Source – various CHESS scan insight sessions:
96
Cost was an issue at various facilities in CHESS zones. For example, several
comments were made concerning Kentish Town sports centre, including “it is a bit
pricey”, “all it needs is better pricing” and “it is expensive.”
275. Source – desk research
A study by Mulvihill (2000) on behalf of NICE found that expense, cost of organised
sports and activities and cost of public transport were inhibiting factors for physical
activity for 5-15 year olds (5).
276. Source – parents of 5-8 year olds focus group:
This group were inhibited by up-front fees for many activities. They felt that making
a lump sum payment was a risk as their children might not be willing or able to
attend all sessions. They also found that many clubs were oversubscribed.
Barrier - unsuitable workforce
277. Finding:
Young people can be inspired to take part in physical activity by activity leaders, as
long as they have a good understanding of how to relate to young people and are
able to lead informally.
Evidence
278. Source - stakeholder interviews:
The positive influence of local role models, e.g. youth workers, sports leaders etc.
was highlighted by a number of stakeholders who coordinate youth activity. Their
ability to relate to young people and understand their needs was highlighted. A
couple of providers working in both Camden and Islington emphasised the benefits
of activity leaders coming through their own programmes, accessing training and
then delivering in the same environment in which they grew up in. One stated “we
are fortunate to have some really good people who become infectious to the young
people in the local area – they become the coaches to the young people in their
local area.”
One Islington stakeholder remarked on the need to find coaches within different
sports who can relate to young people. They stated that young people don’t always
trust outside organisations but do trust youth workers. Another stakeholder
identified that “coaches going into schools who turn up late, who are disengaged
with kids, or it changes, every lesson they’ve got a different coach and that will just
affect participation more so than anything else.”
97
279. Source – young people not in mainstream education focus group:
As mentioned by some of the boys in this group, there were certain characteristics
required to be a suitable activity leader. These included the ability to behave in an
informal manner and to treat participants as equals rather than in a pupil-teacher
fashion.
280. Source - The learning disability focus group:
Those with learning disabilities felt that their complex needs were not understood
and staff and coaches weren’t trained to work with young people with severe
disabilities. The carers of this group felt that local sport centres were not entirely
aware of the issues faced by those with special educational needs or trained to
work with them.
281. Source – desk research:
A report by Health Scotland (2012) found examples of young people giving up
activity due to a short-tempered activity leader. Another gave up because the
activity organiser at a youth club left (7).
Barrier - availability of provision is unknown
282. Finding
Young people can find it hard to know what activities are available to them.
Evidence
283. Source - CYP survey:
More secondary school girls (8%, n=56) than secondary school boys (6%, n=34)
chose ‘I don’t know what sports are available to me’ when asked why they don’t
take part in more physical activity.
The less physical activity young people reported doing over the previous seven
days, the more likely they were to choose this option as a reason why they don’t
take part in more physical activity (see figure 13).
284. Source - stakeholder interviews:
Local stakeholders reported that it was often hard for young people to know what
activities were available to them. They mentioned information on websites not
being well presented and it being difficult to find out what was on in the community
and how to access it.
98
Another stakeholder (from Islington) commented on the difficulty of reaching young
people and parents via schools as “teachers were often bombarded and unable to
pass on information to young people.” They also felt it was difficult to get
information to parents of older children.
285. Source - 14+ girls’ focus group:
This group stated that they might not know where to go to take part in less
traditional activities like zumba or yoga (it’s more obvious where traditional sports
are happening).
286. Source - Desk research:
A study by EFDS found that for disabled people the ability to find information about
opportunities is inherently difficult, especially after leaving school and that there is
no obvious central resource to look for or promote opportunities (12).
Barrier - availability of suitable activities
287. Findings:
There is a perception that fewer activities are targeted at girls than boys. Girls from
certain backgrounds may also require female-only provision.
There is not enough provision for disabled young people.
There is a lack of local provision of suitable physical activities.
Evidence
288. Source - stakeholder interviews:
Stakeholders felt that provision of activities was a problem, particularly for girls.
They believed there wasn’t enough variety of non-traditional activities and that
there were often taster sessions for sports, e.g. basketball, but then no facilities
beyond this.
Stakeholders outlined a number of barriers in terms of activity provision. They
mentioned that most activities were targeted at boys and that there were less clubs
for girls in sports like football and basketball. It was felt that dance had become
hugely popular but that it wasn’t equal to other activities in terms of provision and
encouragement. It was also stated that girls from certain cultural backgrounds don’t
necessarily want to mix with boys and that they need something specific for them
with appropriate instructors.
289. Source - learning and physical disability focus groups:
99
There was limited provision for the needs of young people with learning disabilities.
This group stated that local centres had limited availability and did not necessarily
understand their needs. They found it hard to secure bookings and were often
turned away. They also mentioned that they had limited opportunities to swim, as
timetables were often full.
Few respondents from the physical disability focus group said that they engaged in
physical activity in their own time. Their carers suggested that many spent all of
their time at weekends in their chairs. Another stated that post-school, there were
few opportunities to engage in physical activity, commenting “once these kids
leave, unless they go to college, that’s it.”
290. Source – CYP survey:
‘The sports and activities I would like to do are not available near enough to where
I live’ was the 3rd and 4th most chosen option for secondary and primary school
respondents when asked why they don’t do more exercise.
291. Source – various CHESS scan insight workshops:
The young people felt that there wasn’t enough appropriate, local provision for
them to be physically active.
292. Source – desk research:
Allender et al (2006) reported that girls were often bored by the traditional sports
offered in PE and that non-traditional activities such as dance were more popular
as they provided the opportunity for fun and enjoyment without competition (10).
293. Source – parents of 5-8 year olds focus group:
This group found limited opportunities for their children to be active locally. Various
factors were mentioned including a lack of age-appropriate playgrounds, the
closing down of community centres, many parents not having gardens where
children could play unsupervised and having nowhere to go during winter months.
Motivation - fun-focused provision
294. Findings:
There is a cohort of young people, in particular those who are less ‘sporty’, who
would prefer to take part in physical activity which has an emphasis on fun.
Some young people would be encouraged to take part in more physical activity if
there was an emphasis on socialising at the session.
100
Evidence
295. Source - stakeholder interviews:
A large number of stakeholders believed that the focus of provision should be on
providing fun first and the activity second, particularly in reference to less sporty
young people. One Islington stakeholder commented that “you’re not going to lure
them in with ‘come and try netball’, because they’re not particularly interested in
sport – [it’s about] come and have fun with your friends, we’re going to do some
games and there might be some netball.”
Two practitioners who oversee programmes for girls believe it is important to
provide activities in an environment that has an emphasis on socialising. When
talking about a girls’ football programme in Camden, one stakeholder commented
“you get kids that come along because their friends come along…they’re there
every week though…some just like a place to meet with their friends and be part of
a team.”
One Islington stakeholder commented that “enjoyment, fun, flexibility – this is what
encourages them. Personal and social development deals with a lot of issues like
poor body image, lack of confidence as to whether they will have to wear the right
kit and whether they’ll fit in. The social aspects are very important.”
Another Islington stakeholder felt that too often, we try to move young people on to
get them to progress to more formalised competition and participation. They
suggested that some young people prefer to participate in the informal and fun
social environment in which they first accessed the activity. There was a view that
some funding pots wrongly encourage this progression: “It’s remembering to
continue to deliver to that agenda. What some sports clubs get wrong is they get
people in and then say ‘OK, you’re in the team now and we are going to play a
game’ – which can turn them off as they just want to have some fun…if you are
going to engage someone who is unsporty, then they may stay unsporty. They may
take to an activity for a while but don’t want to progress that activity more than they
are currently doing.”
296. Source - learning disability focus group:
The young people with learning disabilities commented on activities “being fun” and
leaving them with funny anecdotes about their experience. One carer commented
that it provides a memorable highlight of the week for these young people to be
active together.
297. Source – young people not in mainstream education focus group:
101
The young people not in mainstream education stated that the ability to play team
sports with friends was a positive factor and that an element of competition
enhances the experience.
298. Source - 14+ girls’ focus group:
The 14+ girls found non-competitive sports more appealing because they feel less
pressure to be good at them. They also preferred to do activities with friends. One
commented that “with friends, the activity is more fun, so there is more reason to
be active.” Interestingly, the traditional team sports (netball, hockey) were not seen
as competitive if played among friends.
299. Source - parents of under-5s focus group:
One parent commented that the “opportunity for interacting with other kids their
age also helps to build their (children’s) vocabulary and social skills.”
300. Source – desk research:
A range of studies highlighted fun and enjoyment as a motivator (5, 7, 12, 13, 14).
The report by Street Games (2013) suggests that young people’s fun and
enjoyment is very much derived from being with their mates and making new
friends (7).
Motivation - Choice of a wide range of activities
301. Finding:
Young people are open to trying less traditional activities.
Evidence
302. Source - stakeholder interviews:
Most local stakeholders recognised that breadth of choice was an important factor
for young people. One Islington stakeholder commented that young people “would
like to try new exciting physical activities - things like parkour.” There was also a
view that the activity programmes should not remain static, with one stakeholder
commenting on the “need to keep changing things around – offer school activities
for no more than a term.”
303. Source - 14+ girls’ focus group:
The 14+ girls were more attracted to less traditional activities, perceiving them to
be more fun than typically ‘sporty’ activities.
102
304. Source - parents of under-5s and physical and learning disability focus groups:
Respondents from all of these groups were open to trying any new activities. It
became apparent that for physically disabled young people those who were less
able were usually the ones who were more enthusiastic and confident when trying
a new activity.
305. Source – desk research:
In a review of literature, Lamb (2013) found that an element of choice was an
important factor in motivating young people towards physical activity (15).
306. Source – various CHESS scan insight workshops:
Several groups of young people on CHESS scans commented on the need for
variety in the activities available at assets.
Motivation - the coach/leader
307. Finding
Young people enjoy taking part in physical activity when activity leaders are able to
engage with them.
Evidence
308. Source - stakeholder interviews:
The ability of the person delivering the activity to positively engage with young
people was identified by a number of stakeholders as a motivator. One stakeholder
commented that “if you can’t build rapport with the people you are working with it
doesn’t really matter how much you know about football, gymnastics or whatever –
it’s making that contact and connection with that individual.”
Another stakeholder commented that they had noticed a difference between
traditional sports coaches and youth worker coaches, stating that there was a need
for more of the latter and that there be more focus placed on the wellbeing of the
individual. They commented that “it’s about developing the whole person. So we
might get them more involved, for example, in delivering the warm-up rather than
the coach. It’s really important if you want to motivate young people, they need to
feel that they are contributing to it - rather than someone just telling them, shouting
at them “do this”, “do that”. The other level is about encouragement and support.
Not all of them are confident, not all of them are good at it, but it’s about how you
coach and approach them and how much you involve them, praise them or get
them to help other young people who may not be so good.”
103
Barriers and motivations: perception/experience of provision – identified
needs:
Need 36 – For physical activity provision to be more affordable to more young people.
Need 37 – For activity leaders who can relate to young people and understand their
needs. This is a particular need for disabled young people.
Need 38 – For young people to have easy access to information about what physical
activities are available to them.
Need 39 – For greater levels of targeted activities to be made available, in particular
for girls and disabled young people.
Need 40 – For physical activity provision that focuses on fun and socialising.
Need 41 – To ensure that young people have a breadth of activity choice and that
their options change over time.
4.3.6 Environmental context
Barrier - access to activities and facilities locally
309. Finding:
Young people, and in particular disabled young people, are often unable to
physically access the activities and facilities that they would like to.
Evidence
310. Source - stakeholder interviews:
They stated that the sports they were interested in were not available within the
borough and that they needed to have activities near where they live. Dance was
given as an example of an activity that young people weren’t able to access.
311. Source - learning disability focus group:
The young people with learning disabilities felt that parents were often anxious to
take their children to activities because they’d had experience of it not working out
before.
312. Source – physical disability focus group:
One carer from this group commented that “the top three things needed are
accessibility, people there to help and facilities such as extra disabled changing
rooms.”
313. Source – desk research:
104
The report by EFDS (2012) found that a lack of suitable facilities and equipment
prevents disabled people from participating. Centrally located provision was difficult
and expensive to attend (12).
314. Source – various CHESS scan insight workshops:
There were a range of access issues which came up during CHESS scans. These
included poor lighting, locked outdoor facilities and indoor facilities not being
accessible.
Barrier - safety/territorialism
315. Finding
A feeling of a lack of safety can stop young people from taking part in some
activities.
Evidence
316. Source - stakeholder interviews:
Stakeholders felt that young people were reluctant to go to other schools, had a
fear of crime when travelling to new locations and that, when travelling
independently, there were areas they would and wouldn’t go to.
One stakeholder, when talking about barriers said “There are issues around fear of
crime or travelling to new locations.”
Other comments included:
o “When we run sessions at Talacre for 16+, they are all from the local
estate. It’s quite hard to get any of the young people to come down
because of the postcode rivalries…”
o “It’s unlikely they will invite a group of young people from Kilburn, for
example, because there is a known rivalry between the two groups.”
317. Source – young people not in mainstream education focus group:
Some of this group were often nervous about going somewhere they didn’t know.
This was linked to unwritten rules about territorial boundaries.
318. Source – various CHESS scan insight workshops:
It was observed in various CHESS zones that the young people undertaking the
scan were reluctant to walk into certain local areas due to territorial concerns.
During five of the six CHESS scans, the young people raised concerns about
safety at assets in their local area.
105
319. Source – desk research:
The Women’s Sport and Fitness Foundation’s report (2008) into barriers to sport
highlighted personal safety as a particular issue for females (14).
Barrier - lack of open or green spaces
320. Finding:
A lack of green and open spaces means that young people don’t have enough
opportunity to take part in physical activity.
Evidence
321. Source - stakeholder interviews:
Stakeholders saw a lack of open and green spaces as problematic, stating that it
denied young people a place for recreational activity (meeting friends and playing)
and the chance to be spontaneous by kicking a ball in the park etc. It was stated by
one stakeholder that across 30 of the primary schools in Islington supported within
their team, “not one … has a piece of grass.”
Motivation - local provision
322. Finding:
Young people like to take part in activities close to their homes.
Evidence
323. Source - stakeholder interviews:
One Camden stakeholder believes “a significant number of young people access
the estate-based opportunities because it’s local to them and they see it.”
324. Source – Surma CHESS scan insight workshop:
The young people in the Surma CHESS scan identified that the assets closer to
residential areas tended to be more popular than the ones that were further away.
Motivation – safety
325. Finding:
A feeling of safety can help young people to take part in physical activity.
Evidence
326. Source - stakeholder interviews:
106
One Islington stakeholder commented that “sometimes they (young people) want
something structured rather than unstructured because they don’t feel safe in going
somewhere on their own or just going out on the streets among their own peers.
They [would] like something where they have coaches/adults about so there is an
element of safety/security”. However, it was recognised that this type of provision
may equally act as a deterrent to some young people.
327. Source - various CHESS scan insight workshops:
It was felt that adding structure to activities at Ossulston Estate (Somers Town)
could attract more girls as they would feel safer taking part with an adult present.
More generally across the CHESS scans, the young people often commented on
safety as an important factor when taking part in physical activity and often
highlighted facilities they liked which felt safe to use.
328. Source -Desk research
Allender et al (2006) cite a study by Porter (2002) that showed that parents are
more likely to be supportive of activity within a safe play environment (10).
Barriers and motivations: environmental context – identified needs:
Need 42 – To provide greater access to activities and facilities locally to young
people.
Need 43 – For young people to feel safe when travelling to and accessing physical
activity.
Need 44 – To find ways to improve access to green and open space for physical
activity.
4.4 Demand
Summary
The top five activities most in demand from young people that responded to the
CYP survey are (in rank order) football, tennis, bowling, trampolining and
dodgeball. There is considerable difference between primary and secondary aged
young people in terms of the activities they would most like to do as well as
between boys and girls across Camden and Islington.
Young people were asked what their perfect places to exercise in would look like.
Responses to this question suggest that they would like environments that offer a
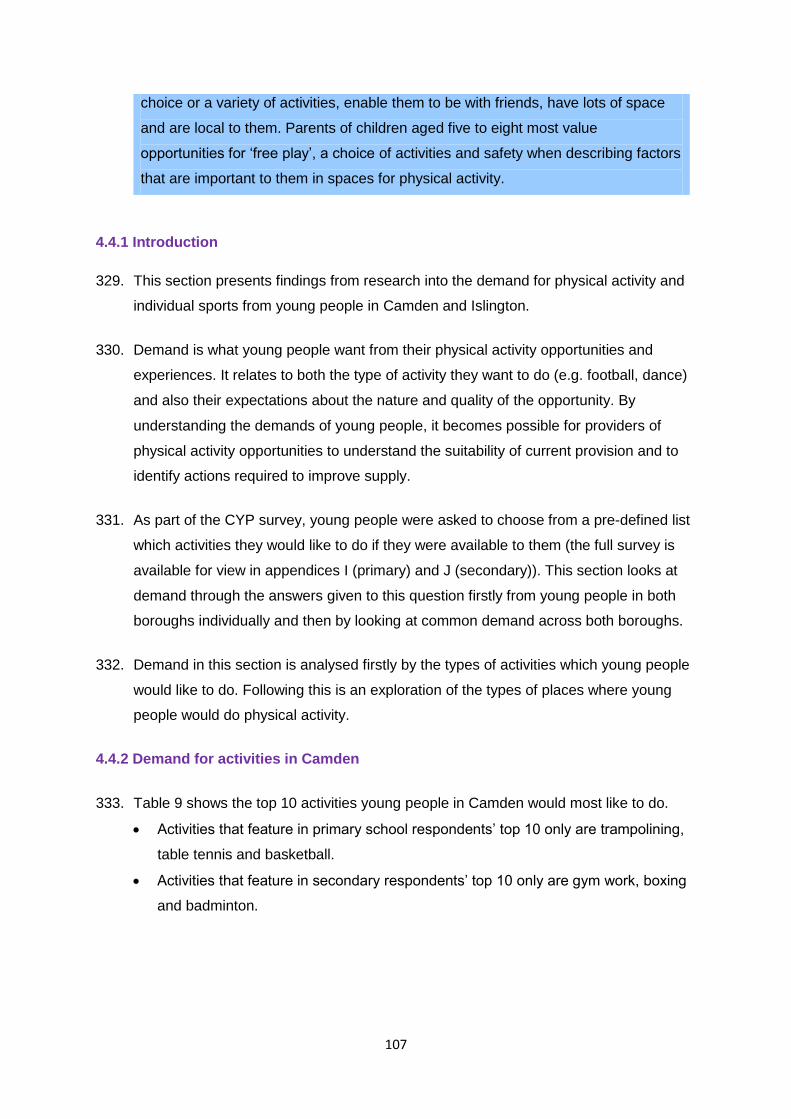
107
choice or a variety of activities, enable them to be with friends, have lots of space
and are local to them. Parents of children aged five to eight most value
opportunities for ‘free play’, a choice of activities and safety when describing factors
that are important to them in spaces for physical activity.
4.4.1 Introduction
329. This section presents findings from research into the demand for physical activity and
individual sports from young people in Camden and Islington.
330. Demand is what young people want from their physical activity opportunities and
experiences. It relates to both the type of activity they want to do (e.g. football, dance)
and also their expectations about the nature and quality of the opportunity. By
understanding the demands of young people, it becomes possible for providers of
physical activity opportunities to understand the suitability of current provision and to
identify actions required to improve supply.
331. As part of the CYP survey, young people were asked to choose from a pre-defined list
which activities they would like to do if they were available to them (the full survey is
available for view in appendices I (primary) and J (secondary)). This section looks at
demand through the answers given to this question firstly from young people in both
boroughs individually and then by looking at common demand across both boroughs.
332. Demand in this section is analysed firstly by the types of activities which young people
would like to do. Following this is an exploration of the types of places where young
people would do physical activity.
4.4.2 Demand for activities in Camden
333. Table 9 shows the top 10 activities young people in Camden would most like to do.
Activities that feature in primary school respondents’ top 10 only are trampolining,
table tennis and basketball.
Activities that feature in secondary respondents’ top 10 only are gym work, boxing
and badminton.
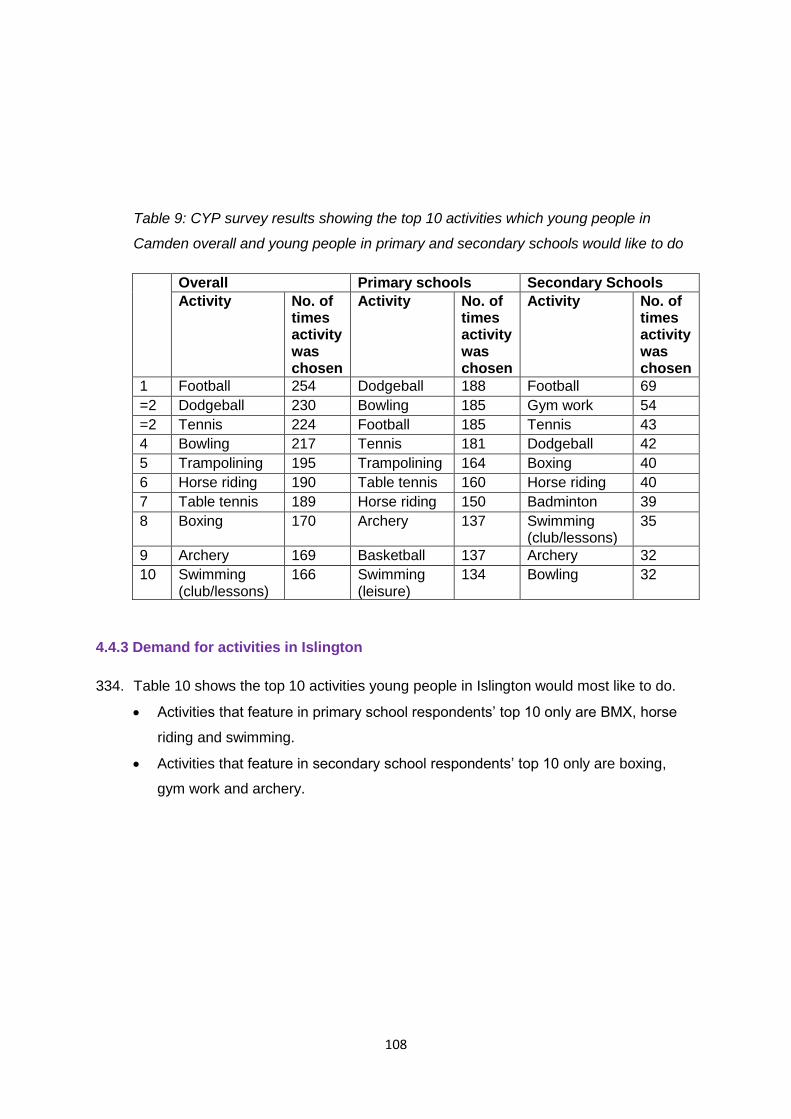
108
Table 9: CYP survey results showing the top 10 activities which young people in
Camden overall and young people in primary and secondary schools would like to do
Overall Primary schools Secondary Schools
Activity No. of times activity was chosen
Activity No. of times activity was chosen
Activity No. of times activity was chosen
1 Football 254 Dodgeball 188 Football 69
=2 Dodgeball 230 Bowling 185 Gym work 54
=2 Tennis 224 Football 185 Tennis 43
4 Bowling 217 Tennis 181 Dodgeball 42
5 Trampolining 195 Trampolining 164 Boxing 40
6 Horse riding 190 Table tennis 160 Horse riding 40
7 Table tennis 189 Horse riding 150 Badminton 39
8 Boxing 170 Archery 137 Swimming (club/lessons)
35
9 Archery 169 Basketball 137 Archery 32
10 Swimming (club/lessons)
166 Swimming (leisure)
134 Bowling 32
4.4.3 Demand for activities in Islington
334. Table 10 shows the top 10 activities young people in Islington would most like to do.
Activities that feature in primary school respondents’ top 10 only are BMX, horse
riding and swimming.
Activities that feature in secondary school respondents’ top 10 only are boxing,
gym work and archery.
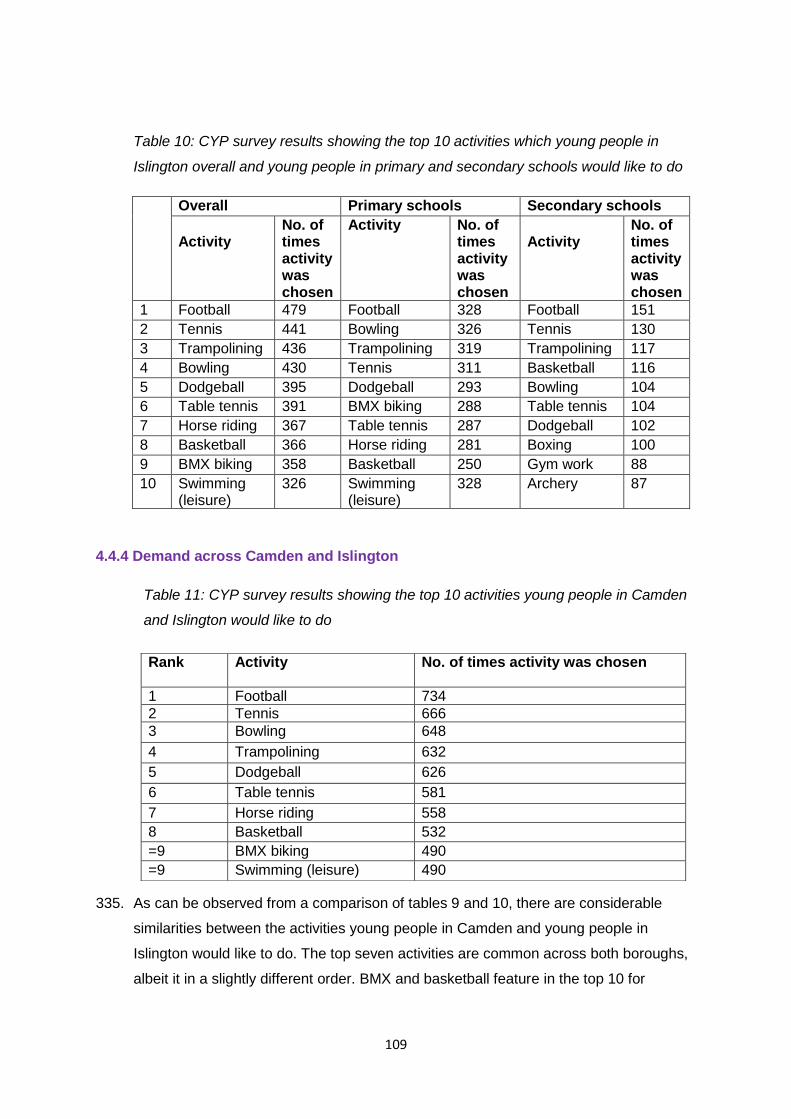
109
Table 10: CYP survey results showing the top 10 activities which young people in
Islington overall and young people in primary and secondary schools would like to do
Overall Primary schools Secondary schools
Activity
No. of times activity was chosen
Activity No. of times activity was chosen
Activity
No. of times activity was chosen
1 Football 479 Football 328 Football 151
2 Tennis 441 Bowling 326 Tennis 130
3 Trampolining 436 Trampolining 319 Trampolining 117
4 Bowling 430 Tennis 311 Basketball 116
5 Dodgeball 395 Dodgeball 293 Bowling 104
6 Table tennis 391 BMX biking 288 Table tennis 104
7 Horse riding 367 Table tennis 287 Dodgeball 102
8 Basketball 366 Horse riding 281 Boxing 100
9 BMX biking 358 Basketball 250 Gym work 88
10 Swimming (leisure)
326 Swimming (leisure)
328 Archery 87
4.4.4 Demand across Camden and Islington
Table 11: CYP survey results showing the top 10 activities young people in Camden
and Islington would like to do
335. As can be observed from a comparison of tables 9 and 10, there are considerable
similarities between the activities young people in Camden and young people in
Islington would like to do. The top seven activities are common across both boroughs,
albeit it in a slightly different order. BMX and basketball feature in the top 10 for
Rank Activity No. of times activity was chosen
1 Football 734
2 Tennis 666
3 Bowling 648
4 Trampolining 632
5 Dodgeball 626
6 Table tennis 581
7 Horse riding 558
8 Basketball 532
=9 BMX biking 490
=9 Swimming (leisure) 490
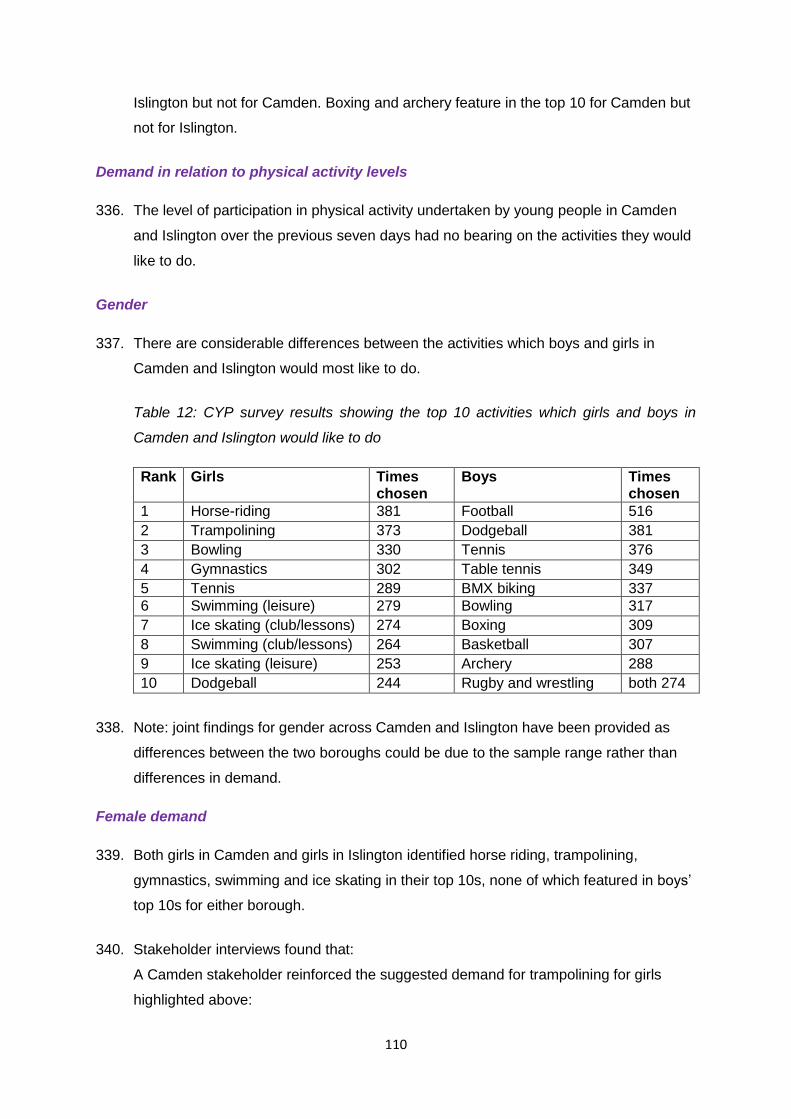
110
Islington but not for Camden. Boxing and archery feature in the top 10 for Camden but
not for Islington.
Demand in relation to physical activity levels
336. The level of participation in physical activity undertaken by young people in Camden
and Islington over the previous seven days had no bearing on the activities they would
like to do.
Gender
337. There are considerable differences between the activities which boys and girls in
Camden and Islington would most like to do.
Table 12: CYP survey results showing the top 10 activities which girls and boys in
Camden and Islington would like to do
Rank Girls Times chosen
Boys Times chosen
1 Horse-riding 381 Football 516
2 Trampolining 373 Dodgeball 381
3 Bowling 330 Tennis 376
4 Gymnastics 302 Table tennis 349
5 Tennis 289 BMX biking 337
6 Swimming (leisure) 279 Bowling 317
7 Ice skating (club/lessons) 274 Boxing 309
8 Swimming (club/lessons) 264 Basketball 307
9 Ice skating (leisure) 253 Archery 288
10 Dodgeball 244 Rugby and wrestling both 274
338. Note: joint findings for gender across Camden and Islington have been provided as
differences between the two boroughs could be due to the sample range rather than
differences in demand.
Female demand
339. Both girls in Camden and girls in Islington identified horse riding, trampolining,
gymnastics, swimming and ice skating in their top 10s, none of which featured in boys’
top 10s for either borough.
340. Stakeholder interviews found that:
A Camden stakeholder reinforced the suggested demand for trampolining for girls
highlighted above:
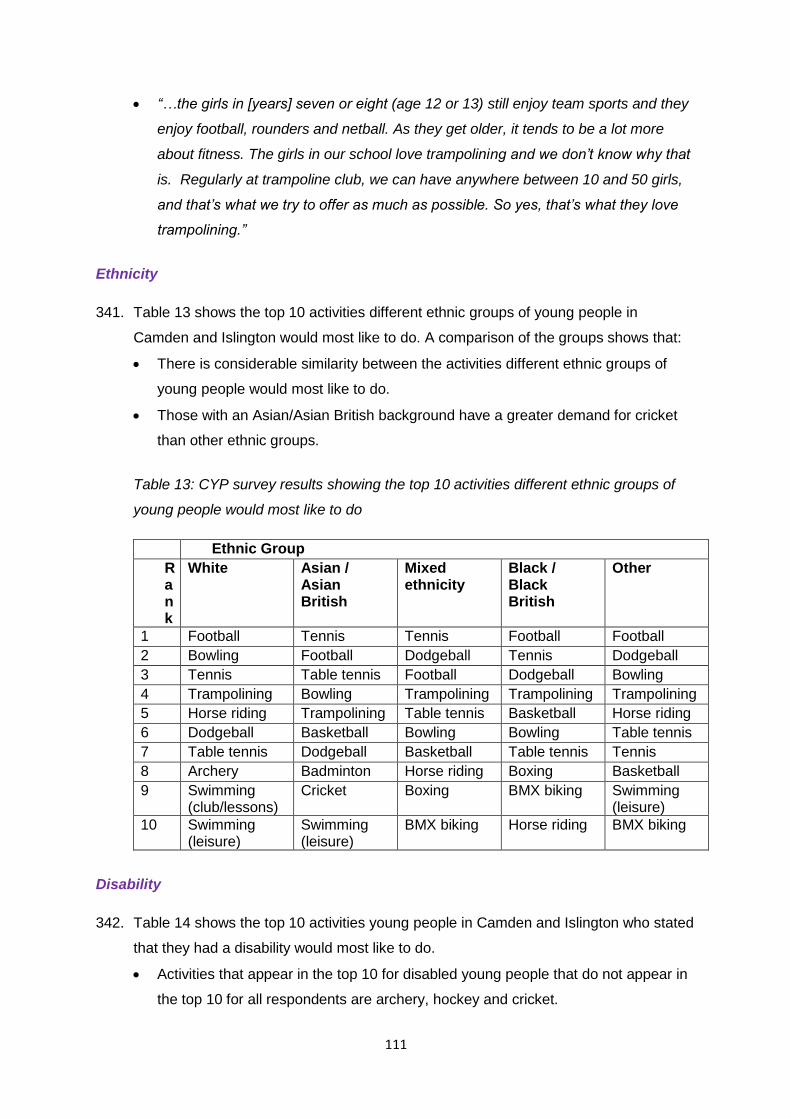
111
“…the girls in [years] seven or eight (age 12 or 13) still enjoy team sports and they
enjoy football, rounders and netball. As they get older, it tends to be a lot more
about fitness. The girls in our school love trampolining and we don’t know why that
is. Regularly at trampoline club, we can have anywhere between 10 and 50 girls,
and that’s what we try to offer as much as possible. So yes, that’s what they love
trampolining.”
Ethnicity
341. Table 13 shows the top 10 activities different ethnic groups of young people in
Camden and Islington would most like to do. A comparison of the groups shows that:
There is considerable similarity between the activities different ethnic groups of
young people would most like to do.
Those with an Asian/Asian British background have a greater demand for cricket
than other ethnic groups.
Table 13: CYP survey results showing the top 10 activities different ethnic groups of
young people would most like to do
Ethnic Group
Rank
White Asian / Asian British
Mixed ethnicity
Black / Black British
Other
1 Football Tennis Tennis Football Football
2 Bowling Football Dodgeball Tennis Dodgeball
3 Tennis Table tennis Football Dodgeball Bowling
4 Trampolining Bowling Trampolining Trampolining Trampolining
5 Horse riding Trampolining Table tennis Basketball Horse riding
6 Dodgeball Basketball Bowling Bowling Table tennis
7 Table tennis Dodgeball Basketball Table tennis Tennis
8 Archery Badminton Horse riding Boxing Basketball
9 Swimming (club/lessons)
Cricket Boxing BMX biking Swimming (leisure)
10 Swimming (leisure)
Swimming (leisure)
BMX biking Horse riding BMX biking
Disability
342. Table 14 shows the top 10 activities young people in Camden and Islington who stated
that they had a disability would most like to do.
Activities that appear in the top 10 for disabled young people that do not appear in
the top 10 for all respondents are archery, hockey and cricket.

112
343. A number of respondents involved in the focus group for physically disabled young
people also mentioned archery as something new that they would like to try out as “it
looks accessible to wheelchair users”. Carers also suggested a desire for greater
opportunities for disabled young people to use hydro-pools and have rebound therapy
(trampolining).
344. Stakeholder interviews found that:
An Islington stakeholder commenting on the activities young disabled people like to
do said “we get lots of feedback from children and parents they would like to swim.
The students would also like to try wheelchair football but the costs of the chairs
are prohibitive. They would also love to try climbing, abseiling and skiing but the
school cannot find anywhere to do them that have the right equipment.”
345. Although the focus group with young people with a learning disability did not identify
any specific activities, they were enthusiastic about trying anything that was available
to them.
Table 14: CYP survey results showing the top 10 activities young people with a
disability would most like to do
Young people not in mainstream education
346. The focus group with young people not in mainstream education reinforced the
importance of football as a key activity. The majority of the group usually met up with
friends at weekends to play football. A time and place is arranged, but the activity is
unstructured and without coaches or referees present. Few reported being involved in
other physical activities beyond football.
Rank Activity
1 Football
2 Dodgeball
3 Archery
4 Tennis
5 BMX biking
6 Hockey
7 Trampolining
8 Bowling
9 Boxing
10 Cricket
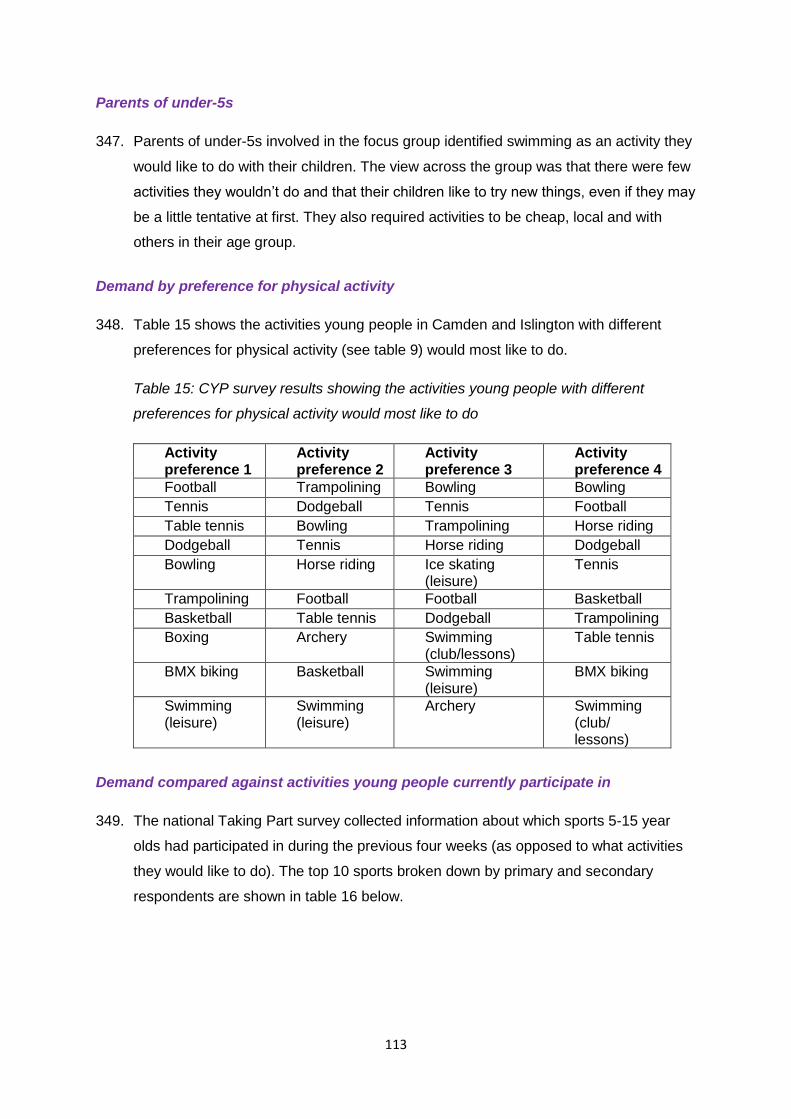
113
Parents of under-5s
347. Parents of under-5s involved in the focus group identified swimming as an activity they
would like to do with their children. The view across the group was that there were few
activities they wouldn’t do and that their children like to try new things, even if they may
be a little tentative at first. They also required activities to be cheap, local and with
others in their age group.
Demand by preference for physical activity
348. Table 15 shows the activities young people in Camden and Islington with different
preferences for physical activity (see table 9) would most like to do.
Table 15: CYP survey results showing the activities young people with different
preferences for physical activity would most like to do
Activity preference 1
Activity preference 2
Activity preference 3
Activity preference 4
Football Trampolining Bowling Bowling
Tennis Dodgeball Tennis Football
Table tennis Bowling Trampolining Horse riding
Dodgeball Tennis Horse riding Dodgeball
Bowling Horse riding Ice skating (leisure)
Tennis
Trampolining Football Football Basketball
Basketball Table tennis Dodgeball Trampolining
Boxing Archery Swimming (club/lessons)
Table tennis
BMX biking Basketball Swimming (leisure)
BMX biking
Swimming (leisure)
Swimming (leisure)
Archery Swimming (club/ lessons)
Demand compared against activities young people currently participate in
349. The national Taking Part survey collected information about which sports 5-15 year
olds had participated in during the previous four weeks (as opposed to what activities
they would like to do). The top 10 sports broken down by primary and secondary
respondents are shown in table 16 below.
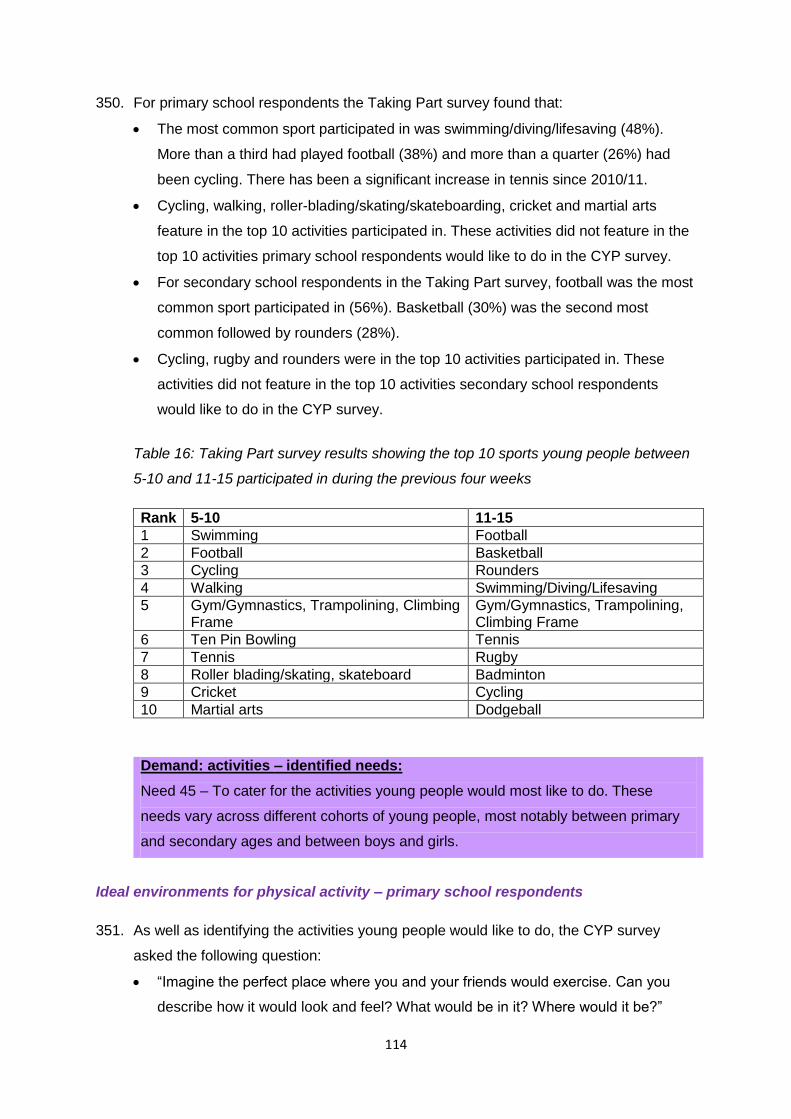
114
350. For primary school respondents the Taking Part survey found that:
The most common sport participated in was swimming/diving/lifesaving (48%).
More than a third had played football (38%) and more than a quarter (26%) had
been cycling. There has been a significant increase in tennis since 2010/11.
Cycling, walking, roller-blading/skating/skateboarding, cricket and martial arts
feature in the top 10 activities participated in. These activities did not feature in the
top 10 activities primary school respondents would like to do in the CYP survey.
For secondary school respondents in the Taking Part survey, football was the most
common sport participated in (56%). Basketball (30%) was the second most
common followed by rounders (28%).
Cycling, rugby and rounders were in the top 10 activities participated in. These
activities did not feature in the top 10 activities secondary school respondents
would like to do in the CYP survey.
Table 16: Taking Part survey results showing the top 10 sports young people between
5-10 and 11-15 participated in during the previous four weeks
Rank 5-10 11-15
1 Swimming Football
2 Football Basketball
3 Cycling Rounders
4 Walking Swimming/Diving/Lifesaving
5 Gym/Gymnastics, Trampolining, Climbing Frame
Gym/Gymnastics, Trampolining, Climbing Frame
6 Ten Pin Bowling Tennis
7 Tennis Rugby
8 Roller blading/skating, skateboard Badminton
9 Cricket Cycling
10 Martial arts Dodgeball
Demand: activities – identified needs:
Need 45 – To cater for the activities young people would most like to do. These
needs vary across different cohorts of young people, most notably between primary
and secondary ages and between boys and girls.
Ideal environments for physical activity – primary school respondents
351. As well as identifying the activities young people would like to do, the CYP survey
asked the following question:
“Imagine the perfect place where you and your friends would exercise. Can you
describe how it would look and feel? What would be in it? Where would it be?”
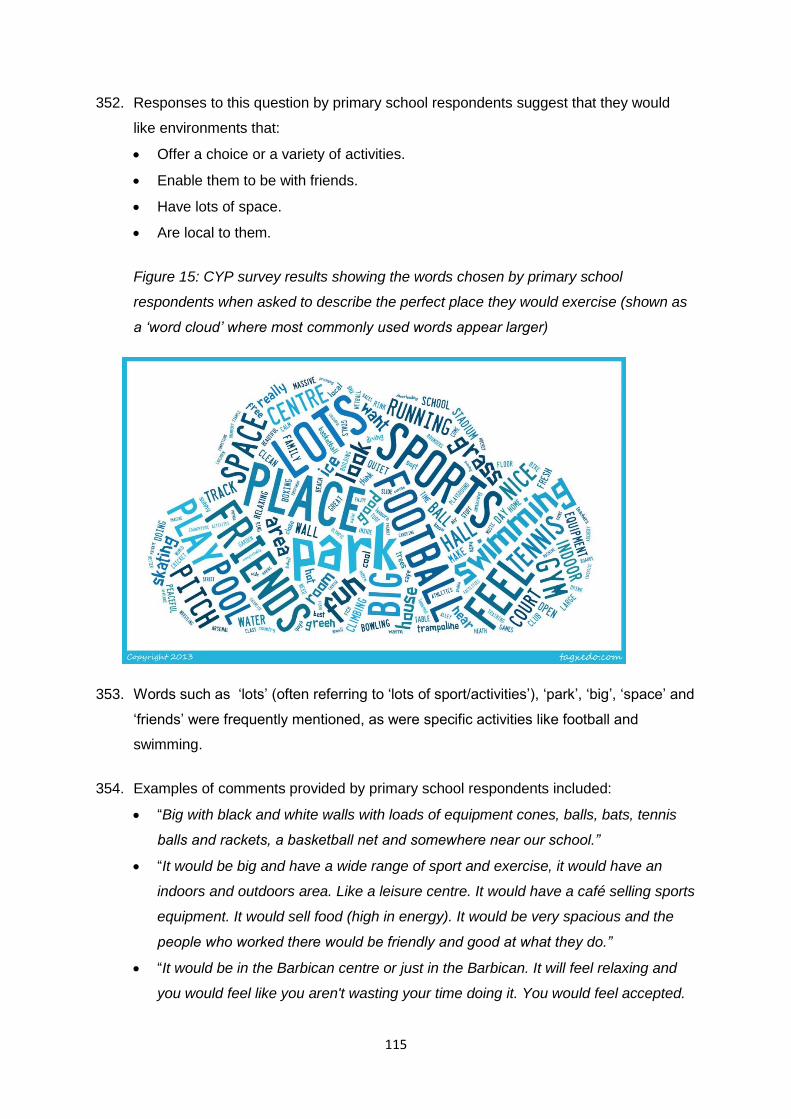
115
352. Responses to this question by primary school respondents suggest that they would
like environments that:
Offer a choice or a variety of activities.
Enable them to be with friends.
Have lots of space.
Are local to them.
Figure 15: CYP survey results showing the words chosen by primary school
respondents when asked to describe the perfect place they would exercise (shown as
a ‘word cloud’ where most commonly used words appear larger)
353. Words such as ‘lots’ (often referring to ‘lots of sport/activities’), ‘park’, ‘big’, ‘space’ and
‘friends’ were frequently mentioned, as were specific activities like football and
swimming.
354. Examples of comments provided by primary school respondents included:
“Big with black and white walls with loads of equipment cones, balls, bats, tennis
balls and rackets, a basketball net and somewhere near our school.”
“It would be big and have a wide range of sport and exercise, it would have an
indoors and outdoors area. Like a leisure centre. It would have a café selling sports
equipment. It would sell food (high in energy). It would be very spacious and the
people who worked there would be friendly and good at what they do.”
“It would be in the Barbican centre or just in the Barbican. It will feel relaxing and
you would feel like you aren't wasting your time doing it. You would feel accepted.
116
It would be a spacious area with lots of different facilities. It would have mirrors on
the walls.”
“The perfect place for me and my friends to exercise is in the park. Because there
is lots of space to play in. For example, I could play football with my friend.”
“I would feel happy when I went there with my friends.”
“It would look big and feel cool and air in my face. It would be in a big building. It
would be round the corner of my house.”
“It would be at a large field and it is really close to my house and you don't have to
listen to the rules and there is so much activities you could choose from. It would
feel fresh and nice to be out there in the open and I would like looking at the view.”
Ideal environments for physical activity – 5-8 year olds
Parents of 5-8 year olds most value opportunities for ‘free play’, a choice of
activities and safety.
355. The focus group with parents of 5-8 year olds explored views on the ideal
environments for their child to be active. Consensus across the group was that
children do not need more structured activity than they already get from school to be
physically active. Their view was that their child’s entire day in school involved
structured activities and that they welcome having the freedom to do their own thing
i.e. free play. Children can therefore be left to their own devices, as long as equipment
is provided. Most parents mentioned an adventure playground aimed at young people
aged 4-12 as an ideal park. The parents were asked to prioritise a list of key factors for
an ideal play space for their child to be active, shown in table 17.
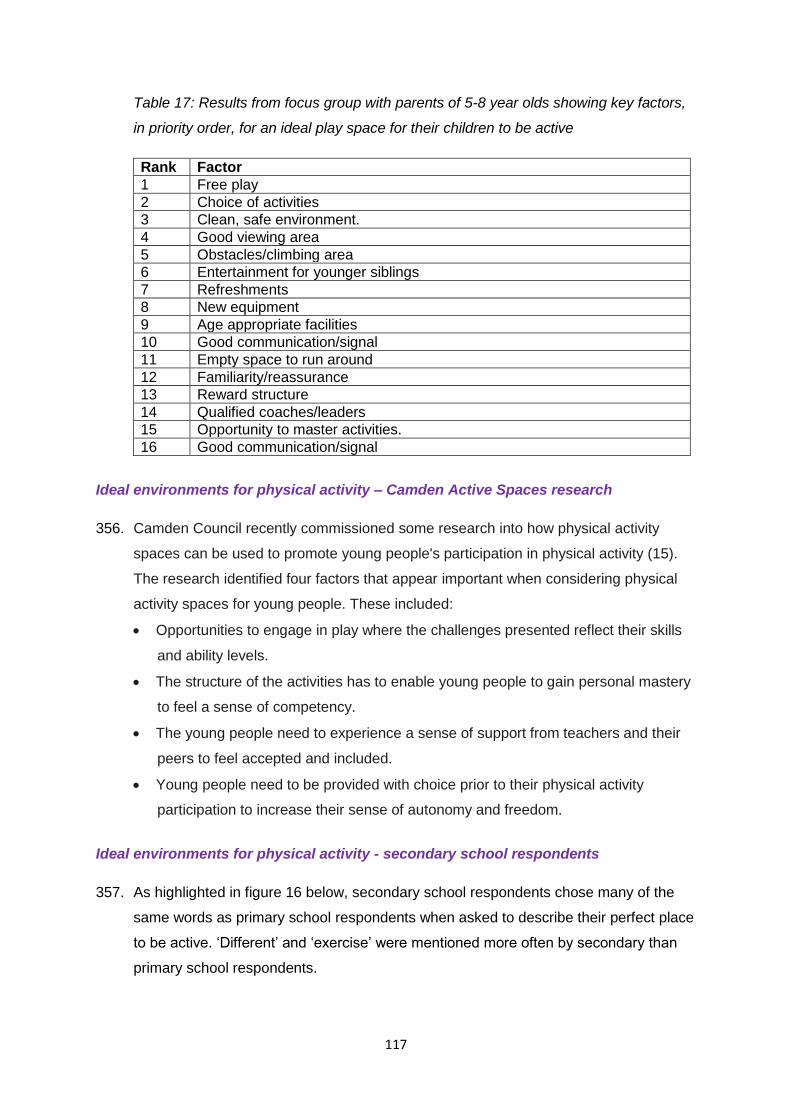
117
Table 17: Results from focus group with parents of 5-8 year olds showing key factors,
in priority order, for an ideal play space for their children to be active
Rank Factor
1 Free play
2 Choice of activities
3 Clean, safe environment.
4 Good viewing area
5 Obstacles/climbing area
6 Entertainment for younger siblings
7 Refreshments
8 New equipment
9 Age appropriate facilities
10 Good communication/signal
11 Empty space to run around
12 Familiarity/reassurance
13 Reward structure
14 Qualified coaches/leaders
15 Opportunity to master activities.
16 Good communication/signal
Ideal environments for physical activity – Camden Active Spaces research
356. Camden Council recently commissioned some research into how physical activity
spaces can be used to promote young people's participation in physical activity (15).
The research identified four factors that appear important when considering physical
activity spaces for young people. These included:
Opportunities to engage in play where the challenges presented reflect their skills
and ability levels.
The structure of the activities has to enable young people to gain personal mastery
to feel a sense of competency.
The young people need to experience a sense of support from teachers and their
peers to feel accepted and included.
Young people need to be provided with choice prior to their physical activity
participation to increase their sense of autonomy and freedom.
Ideal environments for physical activity - secondary school respondents
357. As highlighted in figure 16 below, secondary school respondents chose many of the
same words as primary school respondents when asked to describe their perfect place
to be active. ‘Different’ and ‘exercise’ were mentioned more often by secondary than
primary school respondents.
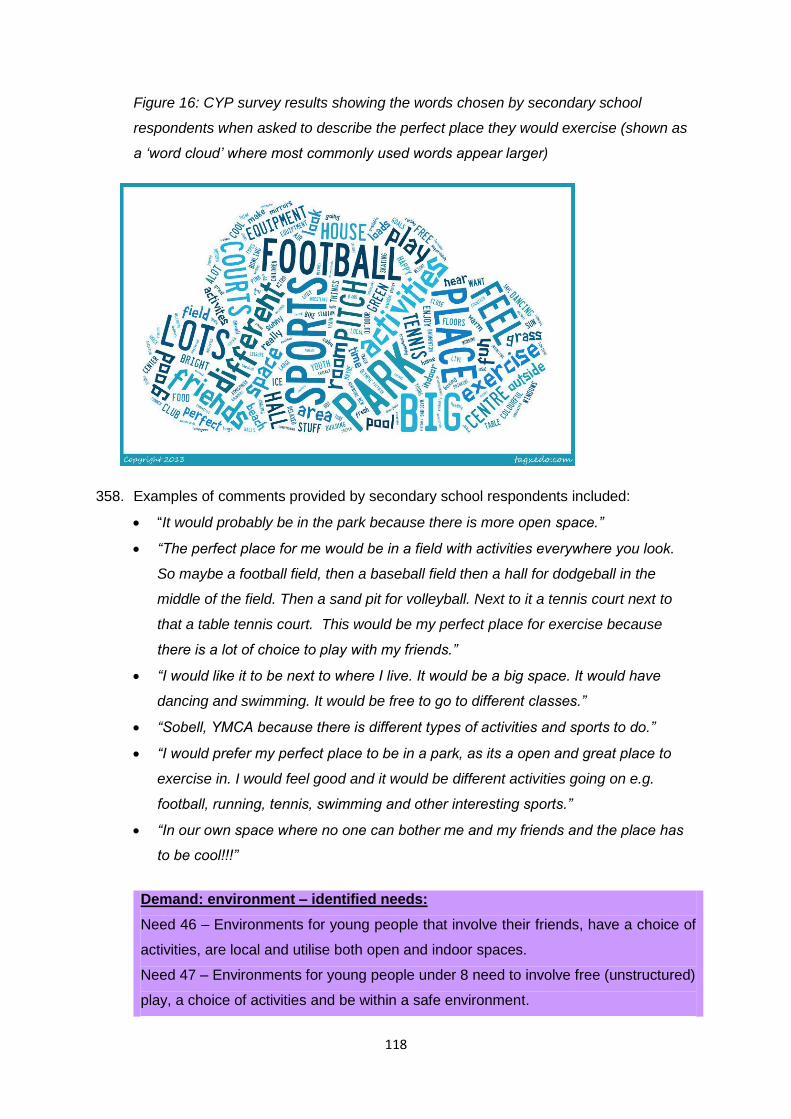
118
Figure 16: CYP survey results showing the words chosen by secondary school
respondents when asked to describe the perfect place they would exercise (shown as
a ‘word cloud’ where most commonly used words appear larger)
358. Examples of comments provided by secondary school respondents included:
“It would probably be in the park because there is more open space.”
“The perfect place for me would be in a field with activities everywhere you look.
So maybe a football field, then a baseball field then a hall for dodgeball in the
middle of the field. Then a sand pit for volleyball. Next to it a tennis court next to
that a table tennis court. This would be my perfect place for exercise because
there is a lot of choice to play with my friends.”
“I would like it to be next to where I live. It would be a big space. It would have
dancing and swimming. It would be free to go to different classes.”
“Sobell, YMCA because there is different types of activities and sports to do.”
“I would prefer my perfect place to be in a park, as its a open and great place to
exercise in. I would feel good and it would be different activities going on e.g.
football, running, tennis, swimming and other interesting sports.”
“In our own space where no one can bother me and my friends and the place has
to be cool!!!”
Demand: environment – identified needs:
Need 46 – Environments for young people that involve their friends, have a choice of
activities, are local and utilise both open and indoor spaces.
Need 47 – Environments for young people under 8 need to involve free (unstructured)
play, a choice of activities and be within a safe environment.
119
Need 48 – Activity opportunities that offer choice, provide challenges appropriate to
young people’s abilities and which enable them to meet these challenges.
Need 49 – Young people need to be supported by appropriate others (teachers,
peers) to fully engage in the activities on offer.
4.5 SUPPLY
359. This section presents findings from research into the supply of physical activity
opportunities for young people in Camden and Islington.
360. Supply refers to provision that is available for young people to be physically active. It
relates to the type and quality of activities available. Qualities may include the location,
environment and activity availability. By understanding current supply, it is possible to
assess how it meets the demands of young people.
361. Supply is explored in the following three sub-sections:
Analysis of the supply of physical activity opportunities provided by Camden and
Islington separately. This includes looking at data from the Get Active London
website, the stakeholder survey and CHESS scans.
The views of organisations that provide physical activity opportunities for young
people across the two boroughs individually and combined.
An analysis of the current supply of structured activities and a forecast of the
supply required in order to increase the number of young people who meet CMO
guidelines.
4.5.1 SUPPLY OF SPORT AND PHYSICAL ACTIVITY IN CAMDEN
Summary
Get Active London has limited information on the activities young people and
disabled young people in Camden and Islington are most interested in. This
suggests that young people may have difficulty finding out about physical activity
opportunities. There is a broad match between the types of activities young people
would like to do and the activities provided by stakeholder survey respondents.
However, in Camden analysis suggests a lack of supply for bowling, horse riding and
archery. In Islington it suggests a lack of supply for trampolining, bowling, horse
riding and BMX (similarly, there were no clubs or opportunities for these activities on
Get Active London).
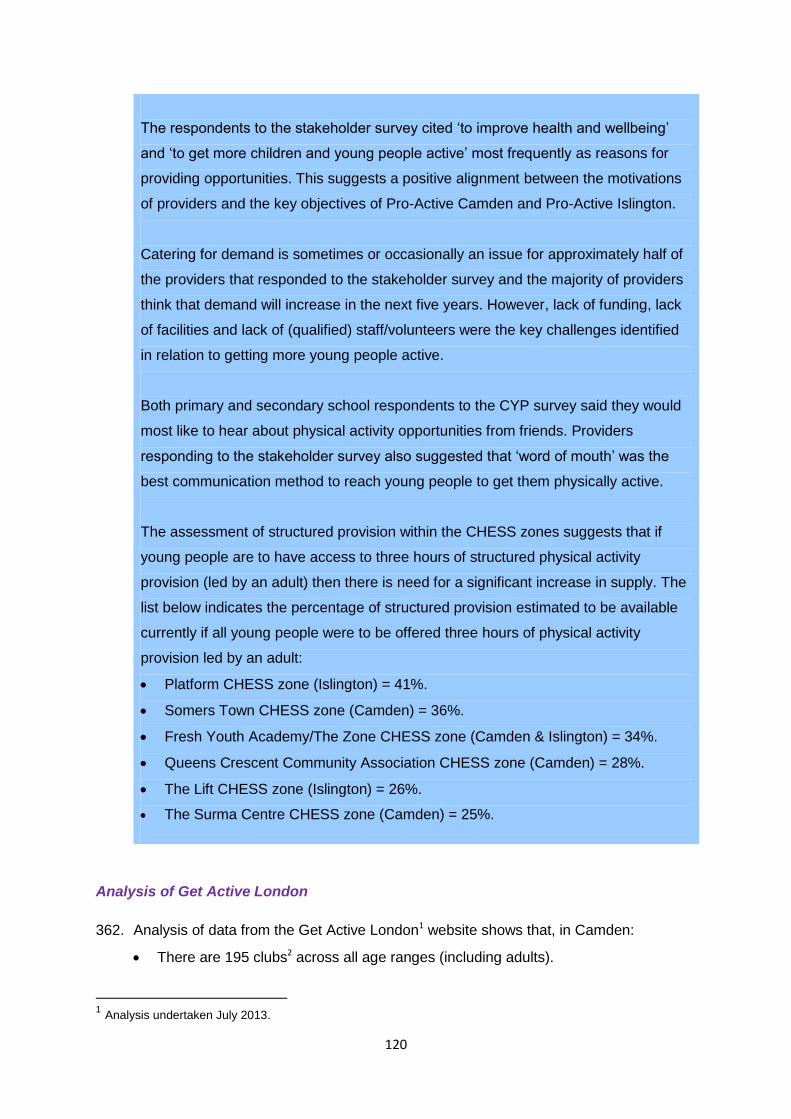
120
The respondents to the stakeholder survey cited ‘to improve health and wellbeing’
and ‘to get more children and young people active’ most frequently as reasons for
providing opportunities. This suggests a positive alignment between the motivations
of providers and the key objectives of Pro-Active Camden and Pro-Active Islington.
Catering for demand is sometimes or occasionally an issue for approximately half of
the providers that responded to the stakeholder survey and the majority of providers
think that demand will increase in the next five years. However, lack of funding, lack
of facilities and lack of (qualified) staff/volunteers were the key challenges identified
in relation to getting more young people active.
Both primary and secondary school respondents to the CYP survey said they would
most like to hear about physical activity opportunities from friends. Providers
responding to the stakeholder survey also suggested that ‘word of mouth’ was the
best communication method to reach young people to get them physically active.
The assessment of structured provision within the CHESS zones suggests that if
young people are to have access to three hours of structured physical activity
provision (led by an adult) then there is need for a significant increase in supply. The
list below indicates the percentage of structured provision estimated to be available
currently if all young people were to be offered three hours of physical activity
provision led by an adult:
Platform CHESS zone (Islington) = 41%.
Somers Town CHESS zone (Camden) = 36%.
Fresh Youth Academy/The Zone CHESS zone (Camden & Islington) = 34%.
Queens Crescent Community Association CHESS zone (Camden) = 28%.
The Lift CHESS zone (Islington) = 26%.
The Surma Centre CHESS zone (Camden) = 25%.
Analysis of Get Active London
362. Analysis of data from the Get Active London1 website shows that, in Camden:
There are 195 clubs2 across all age ranges (including adults).
1 Analysis undertaken July 2013.
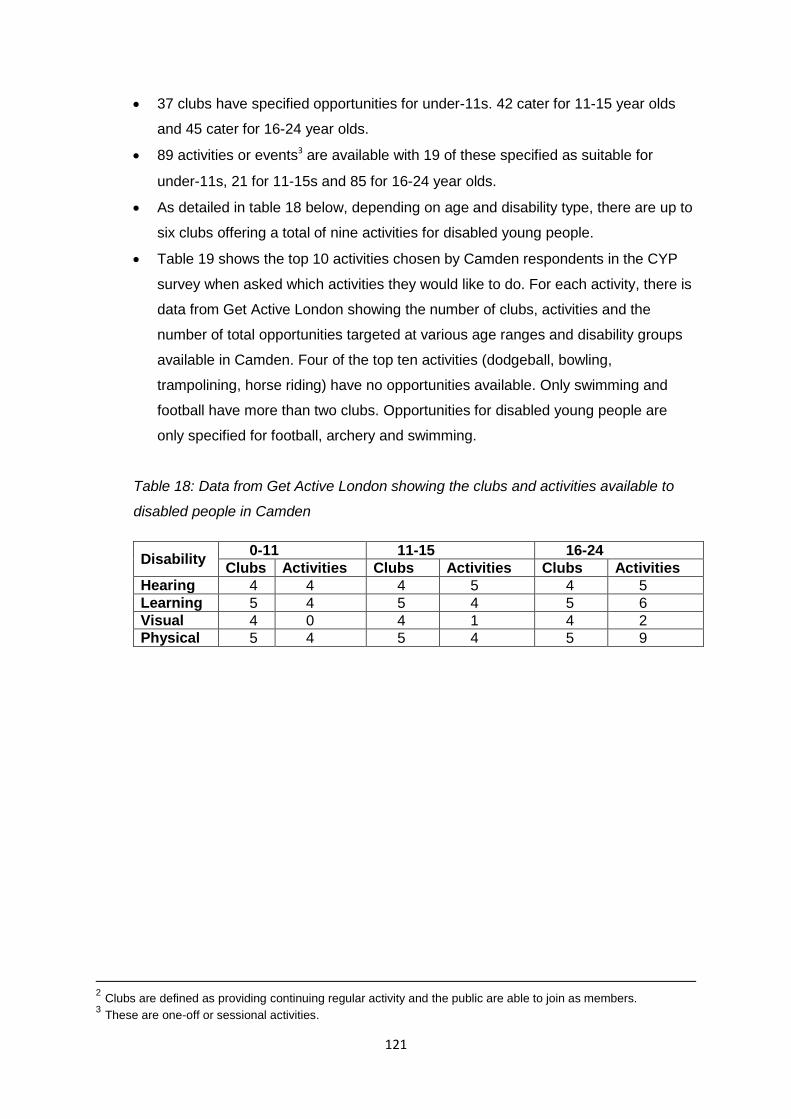
121
37 clubs have specified opportunities for under-11s. 42 cater for 11-15 year olds
and 45 cater for 16-24 year olds.
89 activities or events3 are available with 19 of these specified as suitable for
under-11s, 21 for 11-15s and 85 for 16-24 year olds.
As detailed in table 18 below, depending on age and disability type, there are up to
six clubs offering a total of nine activities for disabled young people.
Table 19 shows the top 10 activities chosen by Camden respondents in the CYP
survey when asked which activities they would like to do. For each activity, there is
data from Get Active London showing the number of clubs, activities and the
number of total opportunities targeted at various age ranges and disability groups
available in Camden. Four of the top ten activities (dodgeball, bowling,
trampolining, horse riding) have no opportunities available. Only swimming and
football have more than two clubs. Opportunities for disabled young people are
only specified for football, archery and swimming.
Table 18: Data from Get Active London showing the clubs and activities available to
disabled people in Camden
Disability 0-11 11-15 16-24
Clubs Activities Clubs Activities Clubs Activities
Hearing 4 4 4 5 4 5
Learning 5 4 5 4 5 6
Visual 4 0 4 1 4 2
Physical 5 4 5 4 5 9
2 Clubs are defined as providing continuing regular activity and the public are able to join as members. 3 These are one-off or sessional activities.
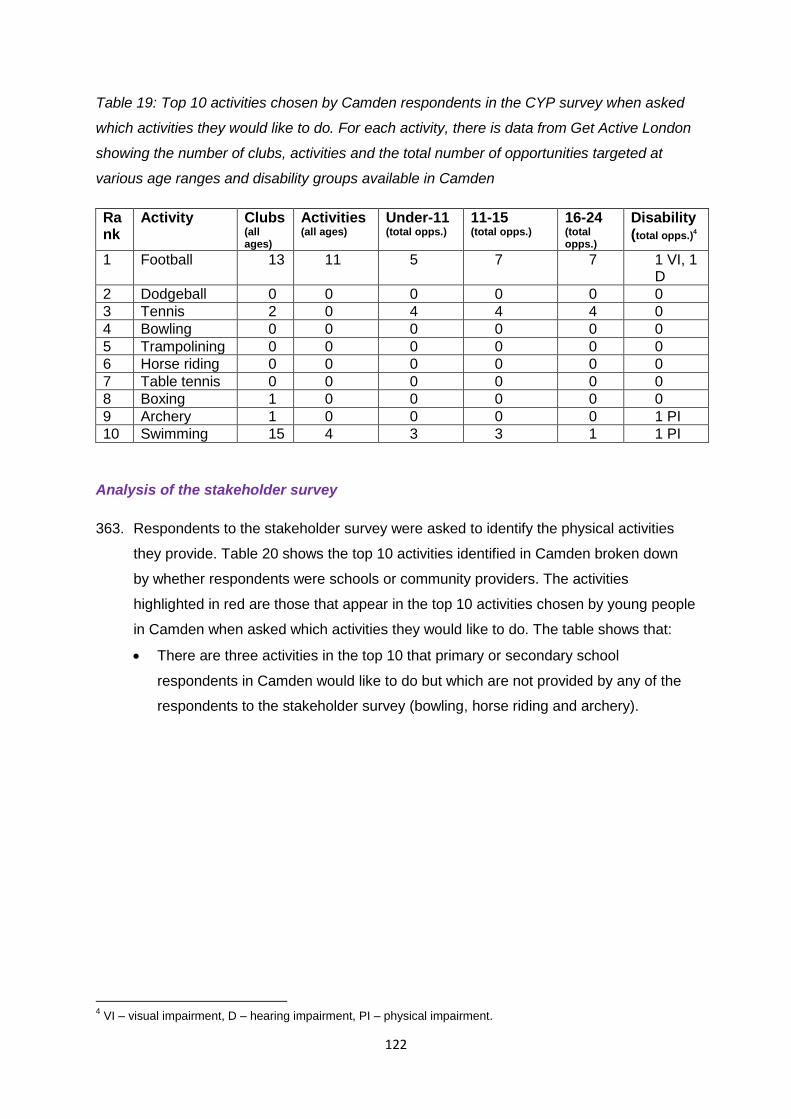
122
Table 19: Top 10 activities chosen by Camden respondents in the CYP survey when asked
which activities they would like to do. For each activity, there is data from Get Active London
showing the number of clubs, activities and the total number of opportunities targeted at
various age ranges and disability groups available in Camden
Rank
Activity Clubs (all ages)
Activities (all ages)
Under-11 (total opps.)
11-15 (total opps.)
16-24 (total opps.)
Disability (total opps.)
4
1 Football 13 11 5 7 7 1 VI, 1 D
2 Dodgeball 0 0 0 0 0 0
3 Tennis 2 0 4 4 4 0
4 Bowling 0 0 0 0 0 0
5 Trampolining 0 0 0 0 0 0
6 Horse riding 0 0 0 0 0 0
7 Table tennis 0 0 0 0 0 0
8 Boxing 1 0 0 0 0 0
9 Archery 1 0 0 0 0 1 PI
10 Swimming 15 4 3 3 1 1 PI
Analysis of the stakeholder survey
363. Respondents to the stakeholder survey were asked to identify the physical activities
they provide. Table 20 shows the top 10 activities identified in Camden broken down
by whether respondents were schools or community providers. The activities
highlighted in red are those that appear in the top 10 activities chosen by young people
in Camden when asked which activities they would like to do. The table shows that:
There are three activities in the top 10 that primary or secondary school
respondents in Camden would like to do but which are not provided by any of the
respondents to the stakeholder survey (bowling, horse riding and archery).
4 VI – visual impairment, D – hearing impairment, PI – physical impairment.
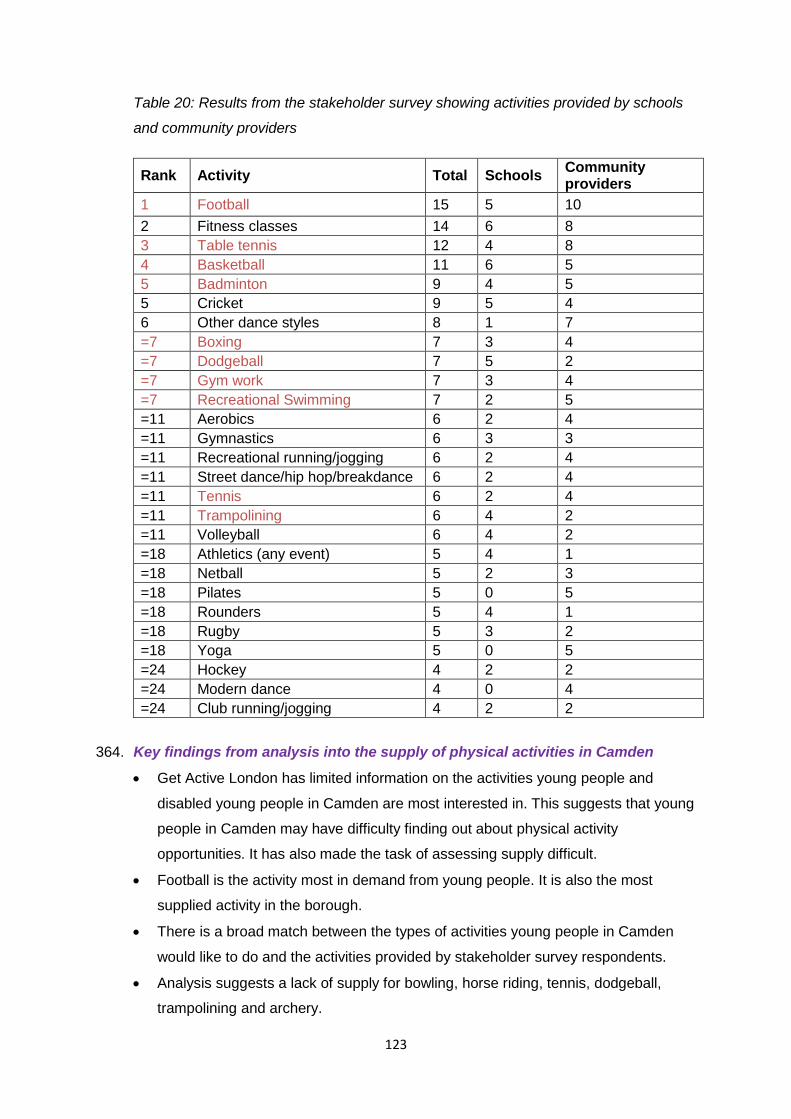
123
Table 20: Results from the stakeholder survey showing activities provided by schools
and community providers
Rank Activity Total Schools Community providers
1 Football 15 5 10
2 Fitness classes 14 6 8
3 Table tennis 12 4 8
4 Basketball 11 6 5
5 Badminton 9 4 5
5 Cricket 9 5 4
6 Other dance styles 8 1 7
=7 Boxing 7 3 4
=7 Dodgeball 7 5 2
=7 Gym work 7 3 4
=7 Recreational Swimming 7 2 5
=11 Aerobics 6 2 4
=11 Gymnastics 6 3 3
=11 Recreational running/jogging 6 2 4
=11 Street dance/hip hop/breakdance 6 2 4
=11 Tennis 6 2 4
=11 Trampolining 6 4 2
=11 Volleyball 6 4 2
=18 Athletics (any event) 5 4 1
=18 Netball 5 2 3
=18 Pilates 5 0 5
=18 Rounders 5 4 1
=18 Rugby 5 3 2
=18 Yoga 5 0 5
=24 Hockey 4 2 2
=24 Modern dance 4 0 4
=24 Club running/jogging 4 2 2
364. Key findings from analysis into the supply of physical activities in Camden
Get Active London has limited information on the activities young people and
disabled young people in Camden are most interested in. This suggests that young
people in Camden may have difficulty finding out about physical activity
opportunities. It has also made the task of assessing supply difficult.
Football is the activity most in demand from young people. It is also the most
supplied activity in the borough.
There is a broad match between the types of activities young people in Camden
would like to do and the activities provided by stakeholder survey respondents.
Analysis suggests a lack of supply for bowling, horse riding, tennis, dodgeball,
trampolining and archery.
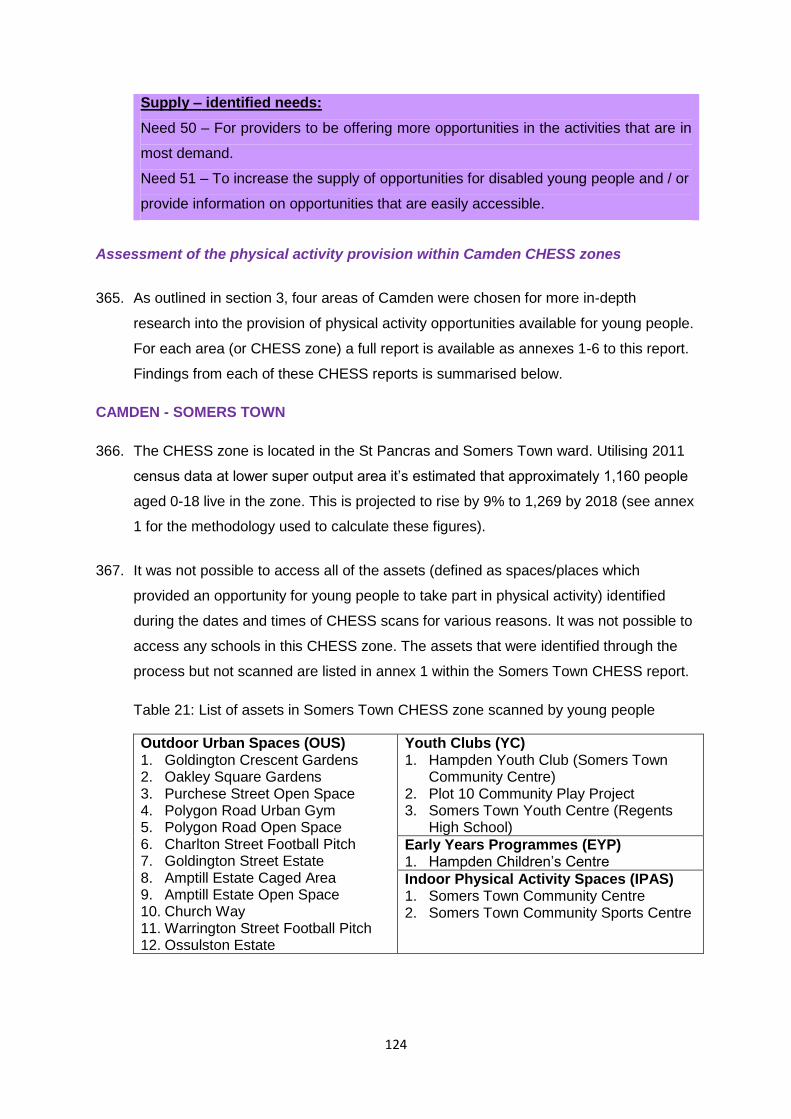
124
Supply – identified needs:
Need 50 – For providers to be offering more opportunities in the activities that are in
most demand.
Need 51 – To increase the supply of opportunities for disabled young people and / or
provide information on opportunities that are easily accessible.
Assessment of the physical activity provision within Camden CHESS zones
365. As outlined in section 3, four areas of Camden were chosen for more in-depth
research into the provision of physical activity opportunities available for young people.
For each area (or CHESS zone) a full report is available as annexes 1-6 to this report.
Findings from each of these CHESS reports is summarised below.
CAMDEN - SOMERS TOWN
366. The CHESS zone is located in the St Pancras and Somers Town ward. Utilising 2011
census data at lower super output area it’s estimated that approximately 1,160 people
aged 0-18 live in the zone. This is projected to rise by 9% to 1,269 by 2018 (see annex
1 for the methodology used to calculate these figures).
367. It was not possible to access all of the assets (defined as spaces/places which
provided an opportunity for young people to take part in physical activity) identified
during the dates and times of CHESS scans for various reasons. It was not possible to
access any schools in this CHESS zone. The assets that were identified through the
process but not scanned are listed in annex 1 within the Somers Town CHESS report.
Table 21: List of assets in Somers Town CHESS zone scanned by young people
Outdoor Urban Spaces (OUS) 1. Goldington Crescent Gardens 2. Oakley Square Gardens 3. Purchese Street Open Space 4. Polygon Road Urban Gym 5. Polygon Road Open Space 6. Charlton Street Football Pitch 7. Goldington Street Estate 8. Amptill Estate Caged Area 9. Amptill Estate Open Space 10. Church Way 11. Warrington Street Football Pitch 12. Ossulston Estate
Youth Clubs (YC) 1. Hampden Youth Club (Somers Town
Community Centre) 2. Plot 10 Community Play Project 3. Somers Town Youth Centre (Regents
High School)
Early Years Programmes (EYP) 1. Hampden Children’s Centre
Indoor Physical Activity Spaces (IPAS) 1. Somers Town Community Centre 2. Somers Town Community Sports Centre

125
The types of facilities and provision found at assets
368. Table 22 sets out the different facilities suitable for physical activity found within the 18
assets. For clarity, each asset may have more than one facility and may also offer
structured opportunities (organised provision that is led by an adult) for physical
activity e.g. classes/sessions/clubs or afterschool clubs. The table also indicates:
The number of assets that offered programmed classes/sessions/clubs for young
people.
The agreed grade5 given by the young people at the facilitated insight workshop for
each asset they scanned (where an asset had more than one facility the grade has
been applied to all facilities unless scanned separately).
It should be noted that Hampden youth centre and Somers Town community
centre share the same facilities but both offer different physical activity classes to
young people. The facilities have been counted once but the
classes/sessions/clubs have been counted against each organisation. Somers
Town youth centre and Somers Town community sports centre also share the
same facilities, based at Regents High School. These have again been counted
once but the classes/sessions/clubs have been counted against each organisation.
Furthermore, the grading of the facilities have been rated ‘A’ (the grade awarded to
Somers Town youth centre). The classes/sessions/clubs have been graded
separately.
Table 22: Number of facilities scanned in Somers Town CHESS zone and grade
awarded
Type of facility / provision Total Grade A Grade B Grade C
Children’s playground 6 0 3 3
Space for physical activity* 5 1 1 3
Multi-use games area** 7 1 4 2
Outdoor gym 1 0 1 0
Classes/sessions/clubs 6 5 0 1
Adventure playground 1 1 0 0
Indoor space *** 4 4 0 0
Gym 1 1 0 0
TOTALS 31 13 9 9 * Outdoor space big enough for small group physical activity including green space, open space and school yards ** Various surfaces *** Includes: halls and sports halls large enough to support group physical activity
5 Grades defined as:
A = this asset is really good and we would like more of this please. B = this asset is ok and with some improvements it could be well used. C = this asset will struggle to be used. It’s not what children and young people want, change it please.
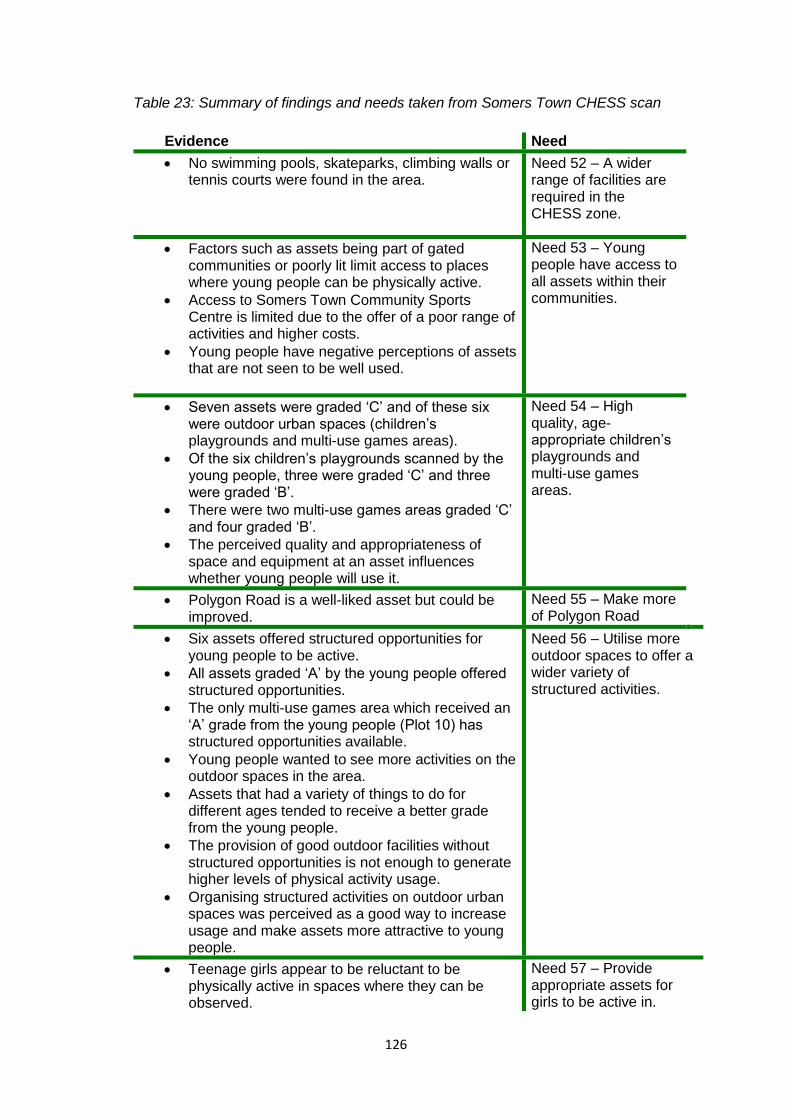
126
Table 23: Summary of findings and needs taken from Somers Town CHESS scan
Evidence Need
No swimming pools, skateparks, climbing walls or tennis courts were found in the area.
Need 52 – A wider range of facilities are required in the CHESS zone.
Factors such as assets being part of gated communities or poorly lit limit access to places where young people can be physically active.
Access to Somers Town Community Sports Centre is limited due to the offer of a poor range of activities and higher costs.
Young people have negative perceptions of assets that are not seen to be well used.
Need 53 – Young people have access to all assets within their communities.
Seven assets were graded ‘C’ and of these six were outdoor urban spaces (children’s playgrounds and multi-use games areas).
Of the six children’s playgrounds scanned by the young people, three were graded ‘C’ and three were graded ‘B’.
There were two multi-use games areas graded ‘C’ and four graded ‘B’.
The perceived quality and appropriateness of space and equipment at an asset influences whether young people will use it.
Need 54 – High quality, age-appropriate children’s playgrounds and multi-use games areas.
Polygon Road is a well-liked asset but could be improved.
Need 55 – Make more of Polygon Road
Six assets offered structured opportunities for young people to be active.
All assets graded ‘A’ by the young people offered structured opportunities.
The only multi-use games area which received an ‘A’ grade from the young people (Plot 10) has structured opportunities available.
Young people wanted to see more activities on the outdoor spaces in the area.
Assets that had a variety of things to do for different ages tended to receive a better grade from the young people.
The provision of good outdoor facilities without structured opportunities is not enough to generate higher levels of physical activity usage.
Organising structured activities on outdoor urban spaces was perceived as a good way to increase usage and make assets more attractive to young people.
Need 56 – Utilise more outdoor spaces to offer a wider variety of structured activities.
Teenage girls appear to be reluctant to be physically active in spaces where they can be observed.
Need 57 – Provide appropriate assets for girls to be active in.
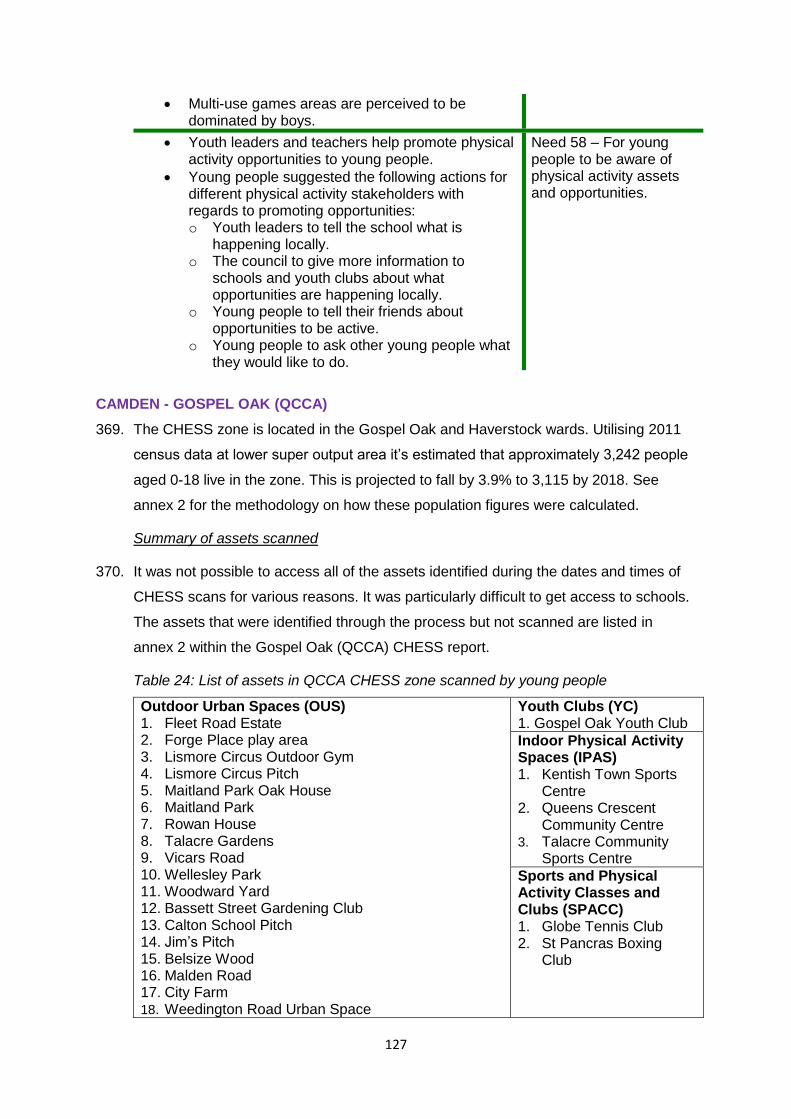
127
Multi-use games areas are perceived to be dominated by boys.
Youth leaders and teachers help promote physical activity opportunities to young people.
Young people suggested the following actions for different physical activity stakeholders with regards to promoting opportunities: o Youth leaders to tell the school what is
happening locally. o The council to give more information to
schools and youth clubs about what opportunities are happening locally.
o Young people to tell their friends about opportunities to be active.
o Young people to ask other young people what they would like to do.
Need 58 – For young people to be aware of physical activity assets and opportunities.
CAMDEN - GOSPEL OAK (QCCA)
369. The CHESS zone is located in the Gospel Oak and Haverstock wards. Utilising 2011
census data at lower super output area it’s estimated that approximately 3,242 people
aged 0-18 live in the zone. This is projected to fall by 3.9% to 3,115 by 2018. See
annex 2 for the methodology on how these population figures were calculated.
Summary of assets scanned
370. It was not possible to access all of the assets identified during the dates and times of
CHESS scans for various reasons. It was particularly difficult to get access to schools.
The assets that were identified through the process but not scanned are listed in
annex 2 within the Gospel Oak (QCCA) CHESS report.
Table 24: List of assets in QCCA CHESS zone scanned by young people
Outdoor Urban Spaces (OUS) 1. Fleet Road Estate 2. Forge Place play area 3. Lismore Circus Outdoor Gym 4. Lismore Circus Pitch 5. Maitland Park Oak House 6. Maitland Park 7. Rowan House 8. Talacre Gardens 9. Vicars Road 10. Wellesley Park 11. Woodward Yard 12. Bassett Street Gardening Club 13. Calton School Pitch 14. Jim’s Pitch 15. Belsize Wood 16. Malden Road 17. City Farm 18. Weedington Road Urban Space
Youth Clubs (YC) 1. Gospel Oak Youth Club
Indoor Physical Activity Spaces (IPAS) 1. Kentish Town Sports
Centre 2. Queens Crescent
Community Centre 3. Talacre Community
Sports Centre
Sports and Physical Activity Classes and Clubs (SPACC) 1. Globe Tennis Club 2. St Pancras Boxing
Club
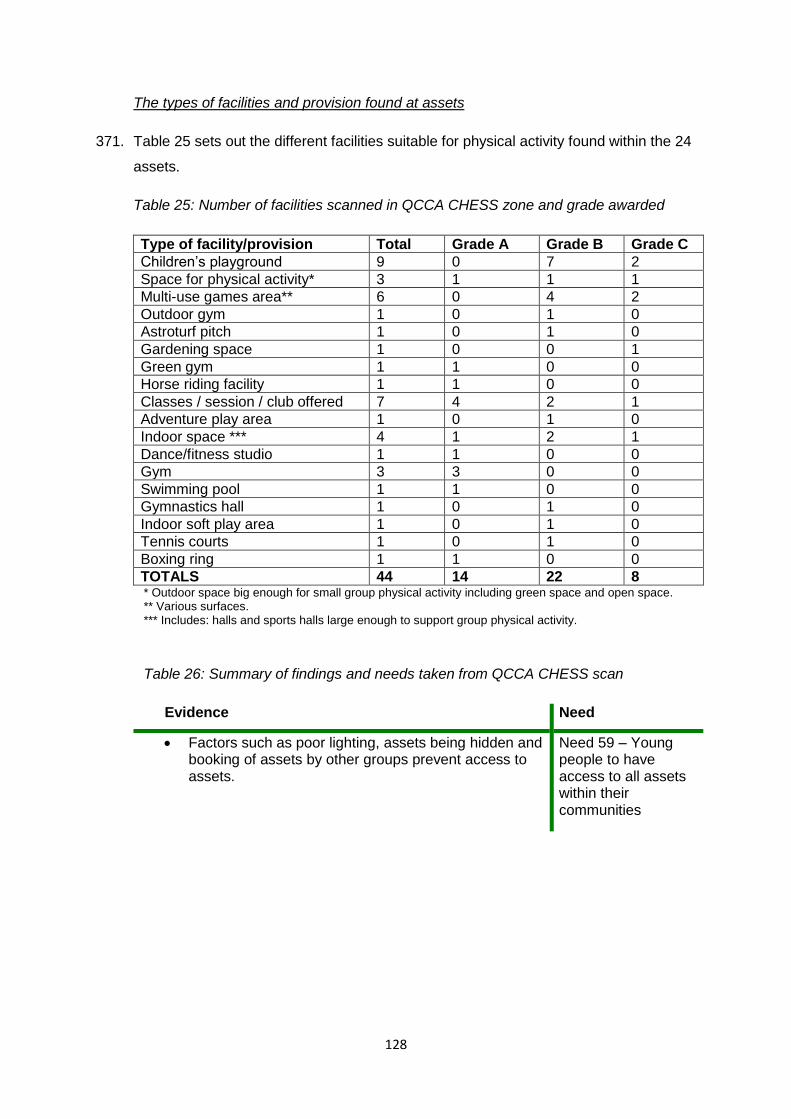
128
The types of facilities and provision found at assets
371. Table 25 sets out the different facilities suitable for physical activity found within the 24
assets.
Table 25: Number of facilities scanned in QCCA CHESS zone and grade awarded
Type of facility/provision Total Grade A Grade B Grade C
Children’s playground 9 0 7 2
Space for physical activity* 3 1 1 1
Multi-use games area** 6 0 4 2
Outdoor gym 1 0 1 0
Astroturf pitch 1 0 1 0
Gardening space 1 0 0 1
Green gym 1 1 0 0
Horse riding facility 1 1 0 0
Classes / session / club offered 7 4 2 1
Adventure play area 1 0 1 0
Indoor space *** 4 1 2 1
Dance/fitness studio 1 1 0 0
Gym 3 3 0 0
Swimming pool 1 1 0 0
Gymnastics hall 1 0 1 0
Indoor soft play area 1 0 1 0
Tennis courts 1 0 1 0
Boxing ring 1 1 0 0
TOTALS 44 14 22 8 * Outdoor space big enough for small group physical activity including green space and open space. ** Various surfaces. *** Includes: halls and sports halls large enough to support group physical activity.
Table 26: Summary of findings and needs taken from QCCA CHESS scan
Evidence Need
Factors such as poor lighting, assets being hidden and booking of assets by other groups prevent access to assets.
Need 59 – Young people to have access to all assets within their communities
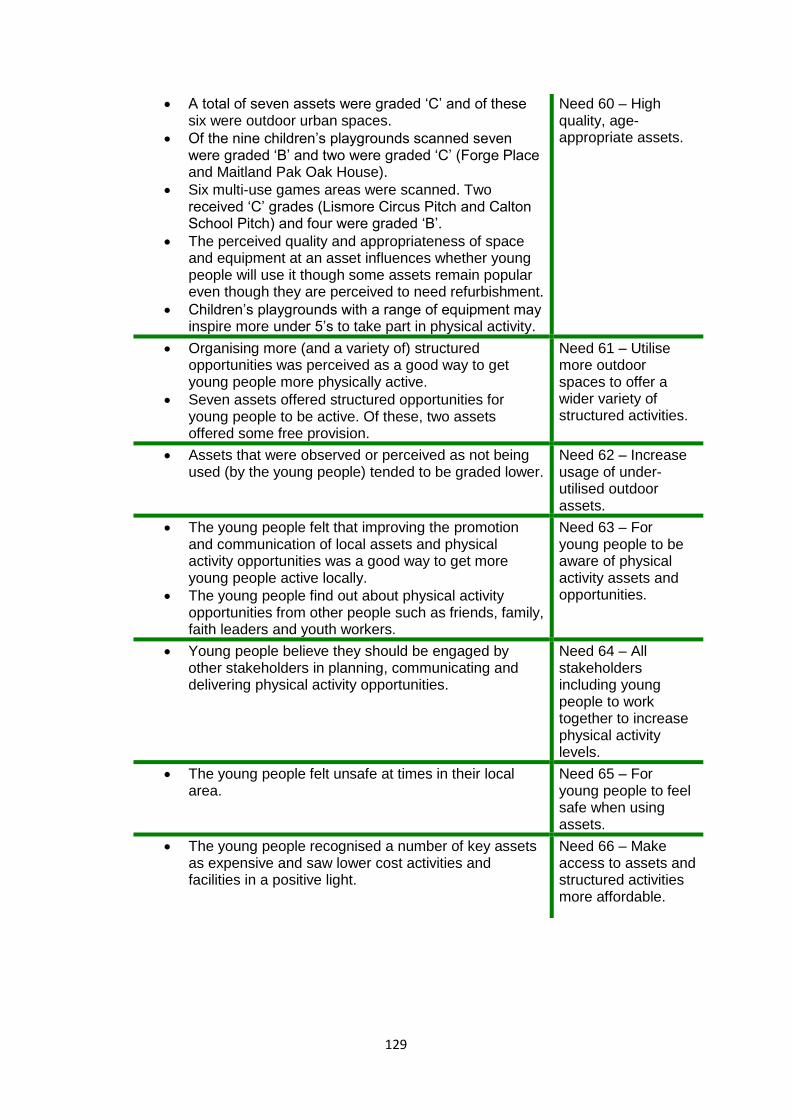
129
A total of seven assets were graded ‘C’ and of these six were outdoor urban spaces.
Of the nine children’s playgrounds scanned seven were graded ‘B’ and two were graded ‘C’ (Forge Place and Maitland Pak Oak House).
Six multi-use games areas were scanned. Two received ‘C’ grades (Lismore Circus Pitch and Calton School Pitch) and four were graded ‘B’.
The perceived quality and appropriateness of space and equipment at an asset influences whether young people will use it though some assets remain popular even though they are perceived to need refurbishment.
Children’s playgrounds with a range of equipment may inspire more under 5’s to take part in physical activity.
Need 60 – High quality, age-appropriate assets.
Organising more (and a variety of) structured opportunities was perceived as a good way to get young people more physically active.
Seven assets offered structured opportunities for young people to be active. Of these, two assets offered some free provision.
Need 61 – Utilise more outdoor spaces to offer a wider variety of structured activities.
Assets that were observed or perceived as not being used (by the young people) tended to be graded lower.
Need 62 – Increase usage of under-utilised outdoor assets.
The young people felt that improving the promotion and communication of local assets and physical activity opportunities was a good way to get more young people active locally.
The young people find out about physical activity opportunities from other people such as friends, family, faith leaders and youth workers.
Need 63 – For young people to be aware of physical activity assets and opportunities.
Young people believe they should be engaged by other stakeholders in planning, communicating and delivering physical activity opportunities.
Need 64 – All stakeholders including young people to work together to increase physical activity levels.
The young people felt unsafe at times in their local area.
Need 65 – For young people to feel safe when using assets.
The young people recognised a number of key assets as expensive and saw lower cost activities and facilities in a positive light.
Need 66 – Make access to assets and structured activities more affordable.
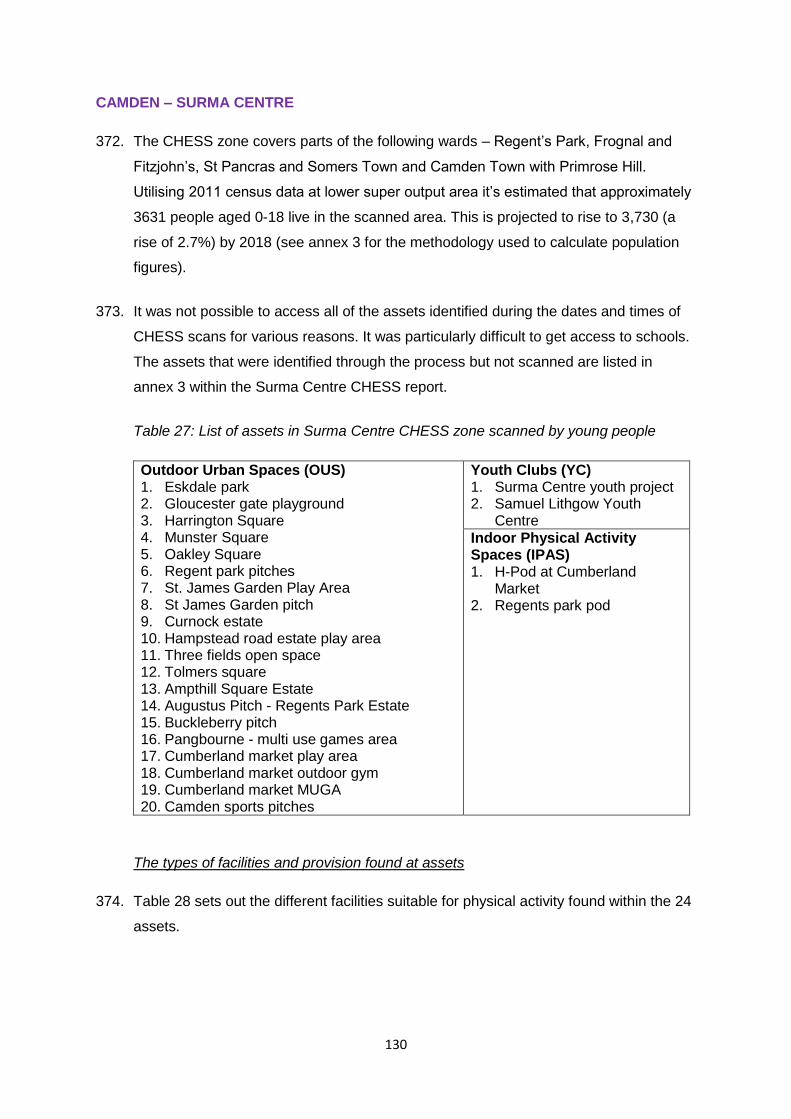
130
CAMDEN – SURMA CENTRE
372. The CHESS zone covers parts of the following wards – Regent’s Park, Frognal and
Fitzjohn’s, St Pancras and Somers Town and Camden Town with Primrose Hill.
Utilising 2011 census data at lower super output area it’s estimated that approximately
3631 people aged 0-18 live in the scanned area. This is projected to rise to 3,730 (a
rise of 2.7%) by 2018 (see annex 3 for the methodology used to calculate population
figures).
373. It was not possible to access all of the assets identified during the dates and times of
CHESS scans for various reasons. It was particularly difficult to get access to schools.
The assets that were identified through the process but not scanned are listed in
annex 3 within the Surma Centre CHESS report.
Table 27: List of assets in Surma Centre CHESS zone scanned by young people
Outdoor Urban Spaces (OUS) 1. Eskdale park 2. Gloucester gate playground 3. Harrington Square 4. Munster Square 5. Oakley Square 6. Regent park pitches 7. St. James Garden Play Area 8. St James Garden pitch 9. Curnock estate 10. Hampstead road estate play area 11. Three fields open space 12. Tolmers square 13. Ampthill Square Estate 14. Augustus Pitch - Regents Park Estate 15. Buckleberry pitch 16. Pangbourne - multi use games area 17. Cumberland market play area 18. Cumberland market outdoor gym 19. Cumberland market MUGA 20. Camden sports pitches
Youth Clubs (YC) 1. Surma Centre youth project 2. Samuel Lithgow Youth
Centre
Indoor Physical Activity Spaces (IPAS) 1. H-Pod at Cumberland
Market 2. Regents park pod
The types of facilities and provision found at assets
374. Table 28 sets out the different facilities suitable for physical activity found within the 24
assets.
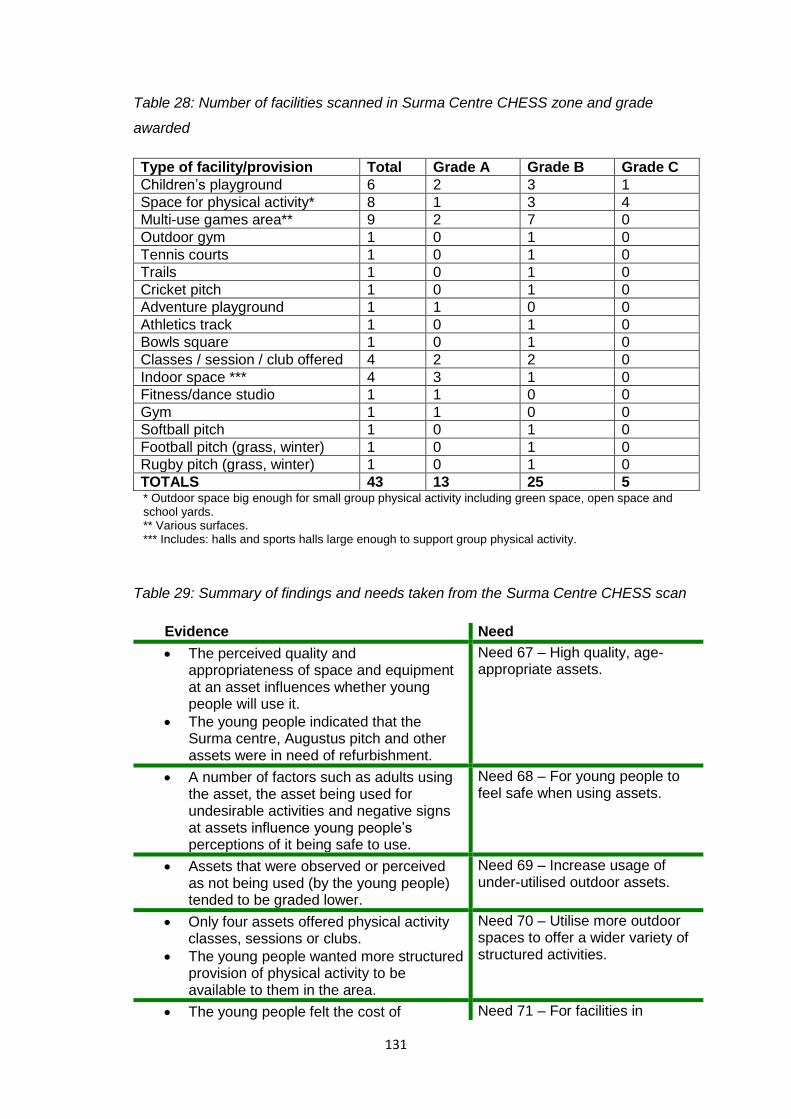
131
Table 28: Number of facilities scanned in Surma Centre CHESS zone and grade
awarded
Type of facility/provision Total Grade A Grade B Grade C
Children’s playground 6 2 3 1
Space for physical activity* 8 1 3 4
Multi-use games area** 9 2 7 0
Outdoor gym 1 0 1 0
Tennis courts 1 0 1 0
Trails 1 0 1 0
Cricket pitch 1 0 1 0
Adventure playground 1 1 0 0
Athletics track 1 0 1 0
Bowls square 1 0 1 0
Classes / session / club offered 4 2 2 0
Indoor space *** 4 3 1 0
Fitness/dance studio 1 1 0 0
Gym 1 1 0 0
Softball pitch 1 0 1 0
Football pitch (grass, winter) 1 0 1 0
Rugby pitch (grass, winter) 1 0 1 0
TOTALS 43 13 25 5 * Outdoor space big enough for small group physical activity including green space, open space and school yards. ** Various surfaces. *** Includes: halls and sports halls large enough to support group physical activity.
Table 29: Summary of findings and needs taken from the Surma Centre CHESS scan
Evidence Need
The perceived quality and appropriateness of space and equipment at an asset influences whether young people will use it.
The young people indicated that the Surma centre, Augustus pitch and other assets were in need of refurbishment.
Need 67 – High quality, age-appropriate assets.
A number of factors such as adults using the asset, the asset being used for undesirable activities and negative signs at assets influence young people’s perceptions of it being safe to use.
Need 68 – For young people to feel safe when using assets.
Assets that were observed or perceived as not being used (by the young people) tended to be graded lower.
Need 69 – Increase usage of under-utilised outdoor assets.
Only four assets offered physical activity classes, sessions or clubs.
The young people wanted more structured provision of physical activity to be available to them in the area.
Need 70 – Utilise more outdoor spaces to offer a wider variety of structured activities.
The young people felt the cost of Need 71 – For facilities in
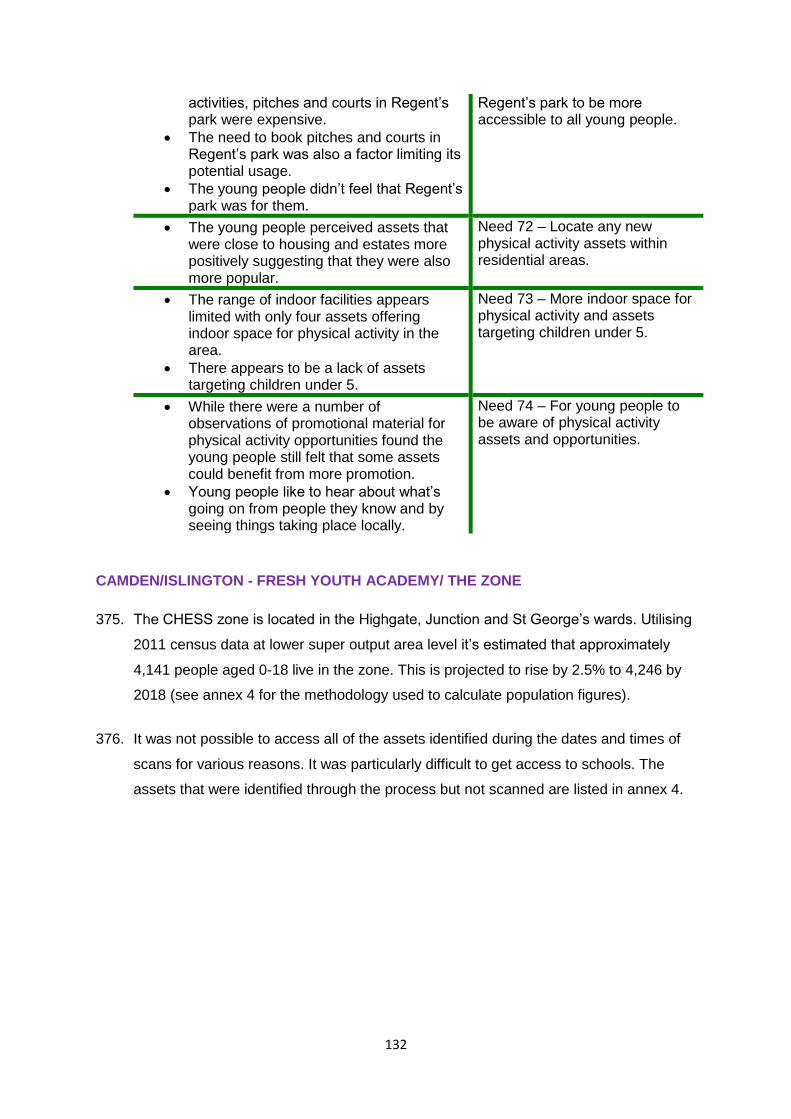
132
activities, pitches and courts in Regent’s park were expensive.
The need to book pitches and courts in Regent’s park was also a factor limiting its potential usage.
The young people didn’t feel that Regent’s park was for them.
Regent’s park to be more accessible to all young people.
The young people perceived assets that were close to housing and estates more positively suggesting that they were also more popular.
Need 72 – Locate any new physical activity assets within residential areas.
The range of indoor facilities appears limited with only four assets offering indoor space for physical activity in the area.
There appears to be a lack of assets targeting children under 5.
Need 73 – More indoor space for physical activity and assets targeting children under 5.
While there were a number of observations of promotional material for physical activity opportunities found the young people still felt that some assets could benefit from more promotion.
Young people like to hear about what’s going on from people they know and by seeing things taking place locally.
Need 74 – For young people to be aware of physical activity assets and opportunities.
CAMDEN/ISLINGTON - FRESH YOUTH ACADEMY/ THE ZONE
375. The CHESS zone is located in the Highgate, Junction and St George’s wards. Utilising
2011 census data at lower super output area level it’s estimated that approximately
4,141 people aged 0-18 live in the zone. This is projected to rise by 2.5% to 4,246 by
2018 (see annex 4 for the methodology used to calculate population figures).
376. It was not possible to access all of the assets identified during the dates and times of
scans for various reasons. It was particularly difficult to get access to schools. The
assets that were identified through the process but not scanned are listed in annex 4.

133
Table 30: List of assets in Fresh Youth Academy/The Zone CHESS zone scanned by
young people
Outside Urban Spaces (OUS) 1. Archway Park 2. Brecknock estate play area 3. Brecknock estate play area, south court yard 4. Cantelowes Gardens children’s play area 5. Cantelowes Gardens sports pitch 6. Cantelowes Gardens outdoor gym 7. Cantelowes skate park 8. Darmouth Hill Park 9. Fortress Way 10. Girdlestone Park 11. Hampstead Heath swimming pond (women) 12. Hampstead Heath swimming pond (men) 13. Parliament Hill exercise place 14. Parliament Hill playground 1 15. Parliament Hill playground 2 16. Parliament Hill tennis courts 17. Parliament Hill Bowling Club 18. Parliament Hill athletic field 19. Parliament Hill adventure playground 20. Parliament Hill cricket field 21. Parliament Hill Lido 22. Upper Hilldrop estate 23. Leighton Crescent Gardens 24. Waterlow Park 25. Market Road football pitches 26. Montpelier Gardens
Walking/Cycling Trail 1. Walking/Cycling trail
Youth Clubs (YC) 1. Fresh Youth Academy 2. The Zone
Early Years Programmes (EYP) 1. Konstam Centre 2. One/Ten o’clock club
Indoor Physical Activity Spaces (IPAS) 1. Archway Leisure Centre 2. Hampstead Heath
Education Centre 3. Islington Tennis Centre 4. Hilldrop Community
Centre
After School Programmes (ASP) 1. Brookfield Primary School 2. The Bridge School
The types of facilities and provision found at assets
377. Table 31 sets out the different facilities suitable for physical activity found within the 37
assets (not including the street scan).
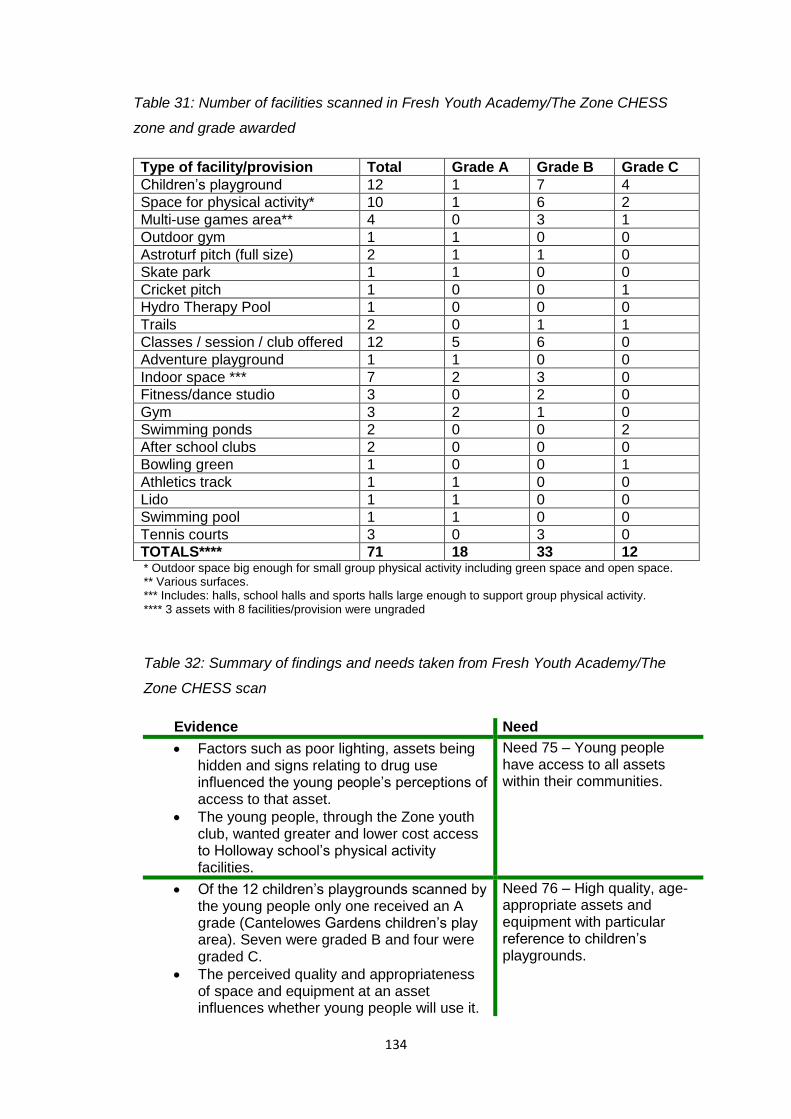
134
Table 31: Number of facilities scanned in Fresh Youth Academy/The Zone CHESS
zone and grade awarded
Type of facility/provision Total Grade A Grade B Grade C
Children’s playground 12 1 7 4
Space for physical activity* 10 1 6 2
Multi-use games area** 4 0 3 1
Outdoor gym 1 1 0 0
Astroturf pitch (full size) 2 1 1 0
Skate park 1 1 0 0
Cricket pitch 1 0 0 1
Hydro Therapy Pool 1 0 0 0
Trails 2 0 1 1
Classes / session / club offered 12 5 6 0
Adventure playground 1 1 0 0
Indoor space *** 7 2 3 0
Fitness/dance studio 3 0 2 0
Gym 3 2 1 0
Swimming ponds 2 0 0 2
After school clubs 2 0 0 0
Bowling green 1 0 0 1
Athletics track 1 1 0 0
Lido 1 1 0 0
Swimming pool 1 1 0 0
Tennis courts 3 0 3 0
TOTALS**** 71 18 33 12 * Outdoor space big enough for small group physical activity including green space and open space. ** Various surfaces. *** Includes: halls, school halls and sports halls large enough to support group physical activity. **** 3 assets with 8 facilities/provision were ungraded
Table 32: Summary of findings and needs taken from Fresh Youth Academy/The
Zone CHESS scan
Evidence Need
Factors such as poor lighting, assets being hidden and signs relating to drug use influenced the young people’s perceptions of access to that asset.
The young people, through the Zone youth club, wanted greater and lower cost access to Holloway school’s physical activity facilities.
Need 75 – Young people have access to all assets within their communities.
Of the 12 children’s playgrounds scanned by the young people only one received an A grade (Cantelowes Gardens children’s play area). Seven were graded B and four were graded C.
The perceived quality and appropriateness of space and equipment at an asset influences whether young people will use it.
Need 76 – High quality, age-appropriate assets and equipment with particular reference to children’s playgrounds.

135
More imaginative and varied equipment to encourage physical activity is needed at children’s playgrounds.
10 assets were graded A by the young people. This included seven outdoor urban spaces. These 10 assets have 18 types of facilities/provisions available at them. Four grade A assets offered structured opportunities appropriate to their targeted age group.
No asset that offered structured opportunities such as classes/sessions/clubs or afterschool clubs was graded C.
The young people wanted to see more structured activities taking place on local outdoor assets.
The Saturday Night Project is seen as good practice for offering young people a choice of physical activities in a social and safe environment.
The young people want greater choice of activities.
Need 77 – Utilise more spaces to offer a wider variety of structured activities.
Assets that were observed or perceived as not being used (by the young people) tended to be graded lower.
Need 78 – Increase usage of under-utilised outdoor assets.
Despite assets targeting an even spread of age ranges across the whole CHESS zone, the young people found a lack of provision for young people aged over 11 in the area around the Zone youth club.
Need 79 – More assets for teenagers in the area around the Zone youth club.
The young people commented positively on assets that provided free or low cost activities.
Need 80 – Make access to assets and structured activities more affordable.
There were no observations of promotional material for physical activity opportunities found anywhere other than within indoor assets.
Activities taking place on outdoor assets did not seem to be promoted.
Young people like to hear about what’s going on from their friends and youth workers.
Need 81 – For young people to be aware of physical activity assets and opportunities.
The young people suggested that roads were dangerous for them to cycle on.
Rather than walk, young people prefer to take the bus as it is free and easy to use.
Need 82 – Promote active travel.
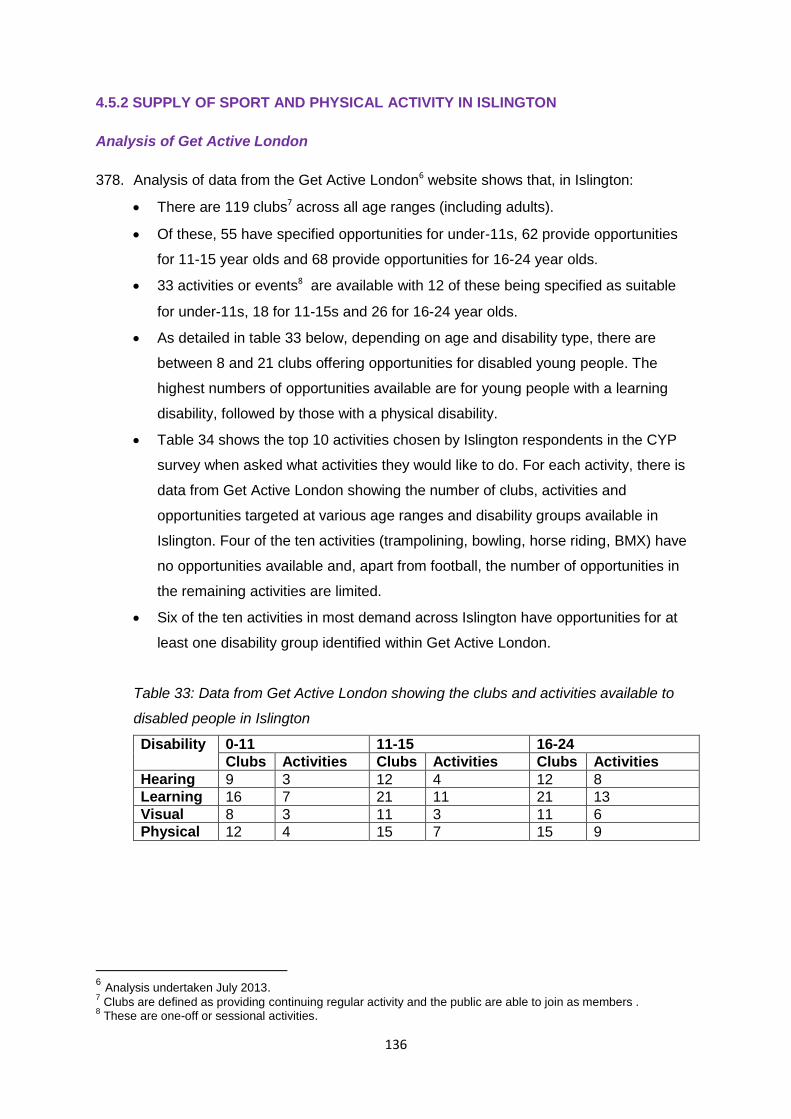
136
4.5.2 SUPPLY OF SPORT AND PHYSICAL ACTIVITY IN ISLINGTON
Analysis of Get Active London
378. Analysis of data from the Get Active London6 website shows that, in Islington:
There are 119 clubs7 across all age ranges (including adults).
Of these, 55 have specified opportunities for under-11s, 62 provide opportunities
for 11-15 year olds and 68 provide opportunities for 16-24 year olds.
33 activities or events8 are available with 12 of these being specified as suitable
for under-11s, 18 for 11-15s and 26 for 16-24 year olds.
As detailed in table 33 below, depending on age and disability type, there are
between 8 and 21 clubs offering opportunities for disabled young people. The
highest numbers of opportunities available are for young people with a learning
disability, followed by those with a physical disability.
Table 34 shows the top 10 activities chosen by Islington respondents in the CYP
survey when asked what activities they would like to do. For each activity, there is
data from Get Active London showing the number of clubs, activities and
opportunities targeted at various age ranges and disability groups available in
Islington. Four of the ten activities (trampolining, bowling, horse riding, BMX) have
no opportunities available and, apart from football, the number of opportunities in
the remaining activities are limited.
Six of the ten activities in most demand across Islington have opportunities for at
least one disability group identified within Get Active London.
Table 33: Data from Get Active London showing the clubs and activities available to
disabled people in Islington
Disability 0-11 11-15 16-24
Clubs Activities Clubs Activities Clubs Activities
Hearing 9 3 12 4 12 8
Learning 16 7 21 11 21 13
Visual 8 3 11 3 11 6
Physical 12 4 15 7 15 9
6 Analysis undertaken July 2013. 7 Clubs are defined as providing continuing regular activity and the public are able to join as members .
8 These are one-off or sessional activities.
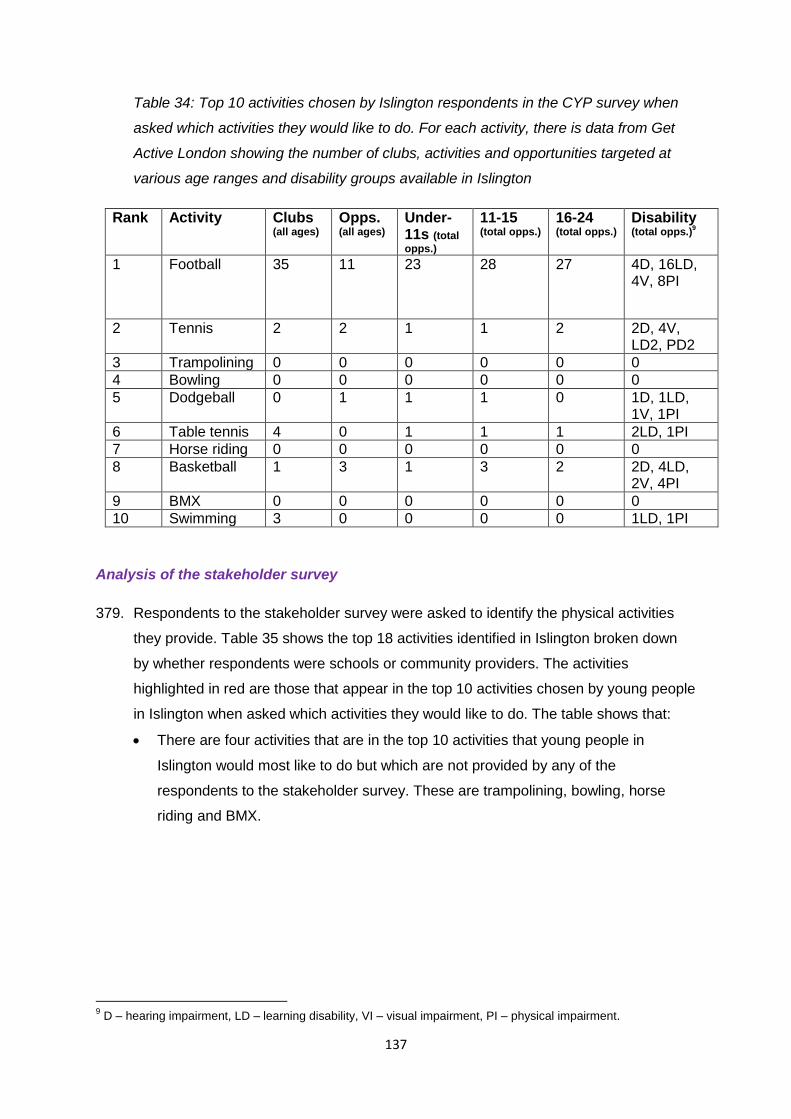
137
Table 34: Top 10 activities chosen by Islington respondents in the CYP survey when
asked which activities they would like to do. For each activity, there is data from Get
Active London showing the number of clubs, activities and opportunities targeted at
various age ranges and disability groups available in Islington
Rank Activity Clubs (all ages)
Opps. (all ages)
Under-11s (total
opps.)
11-15 (total opps.)
16-24 (total opps.)
Disability (total opps.)
9
1 Football 35 11 23 28 27 4D, 16LD, 4V, 8PI
2 Tennis 2 2 1 1 2 2D, 4V, LD2, PD2
3 Trampolining 0 0 0 0 0 0
4 Bowling 0 0 0 0 0 0
5 Dodgeball 0 1 1 1 0 1D, 1LD, 1V, 1PI
6 Table tennis 4 0 1 1 1 2LD, 1PI
7 Horse riding 0 0 0 0 0 0
8 Basketball 1 3 1 3 2 2D, 4LD, 2V, 4PI
9 BMX 0 0 0 0 0 0
10 Swimming 3 0 0 0 0 1LD, 1PI
Analysis of the stakeholder survey
379. Respondents to the stakeholder survey were asked to identify the physical activities
they provide. Table 35 shows the top 18 activities identified in Islington broken down
by whether respondents were schools or community providers. The activities
highlighted in red are those that appear in the top 10 activities chosen by young people
in Islington when asked which activities they would like to do. The table shows that:
There are four activities that are in the top 10 activities that young people in
Islington would most like to do but which are not provided by any of the
respondents to the stakeholder survey. These are trampolining, bowling, horse
riding and BMX.
9 D – hearing impairment, LD – learning disability, VI – visual impairment, PI – physical impairment.
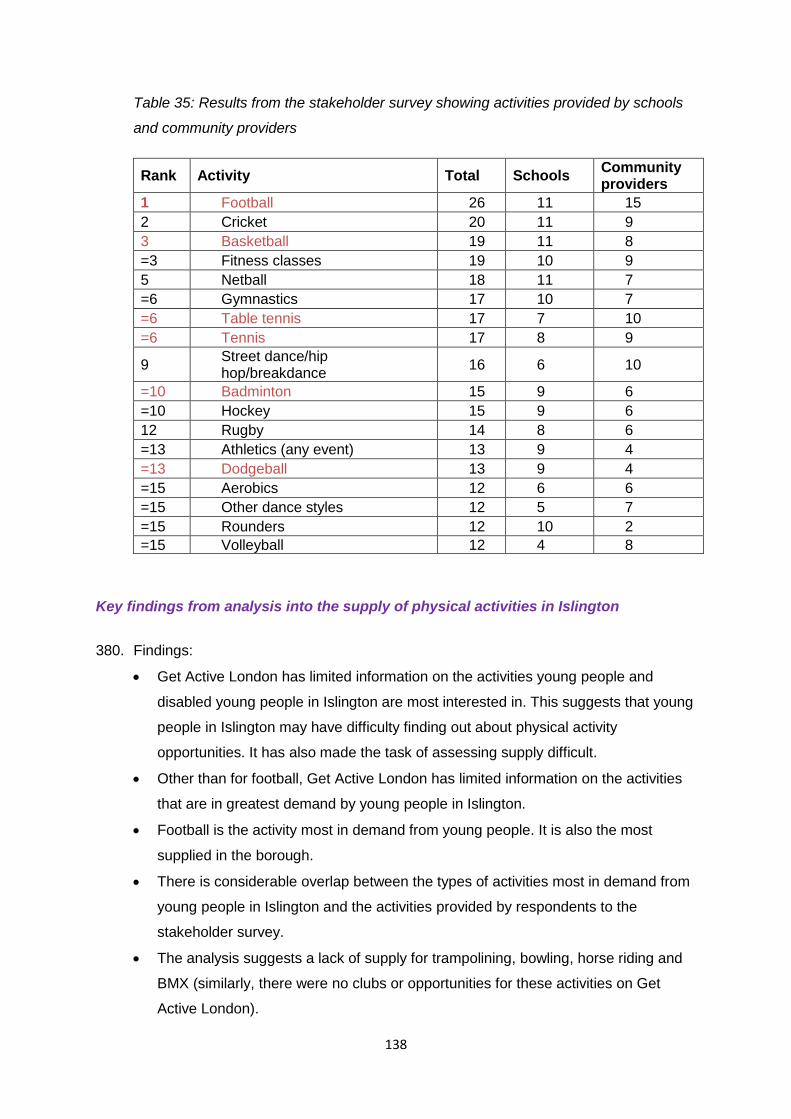
138
Table 35: Results from the stakeholder survey showing activities provided by schools
and community providers
Rank Activity Total Schools Community providers
1 Football 26 11 15
2 Cricket 20 11 9
3 Basketball 19 11 8
=3 Fitness classes 19 10 9
5 Netball 18 11 7
=6 Gymnastics 17 10 7
=6 Table tennis 17 7 10
=6 Tennis 17 8 9
9 Street dance/hip hop/breakdance
16 6 10
=10 Badminton 15 9 6
=10 Hockey 15 9 6
12 Rugby 14 8 6
=13 Athletics (any event) 13 9 4
=13 Dodgeball 13 9 4
=15 Aerobics 12 6 6
=15 Other dance styles 12 5 7
=15 Rounders 12 10 2
=15 Volleyball 12 4 8
Key findings from analysis into the supply of physical activities in Islington
380. Findings:
Get Active London has limited information on the activities young people and
disabled young people in Islington are most interested in. This suggests that young
people in Islington may have difficulty finding out about physical activity
opportunities. It has also made the task of assessing supply difficult.
Other than for football, Get Active London has limited information on the activities
that are in greatest demand by young people in Islington.
Football is the activity most in demand from young people. It is also the most
supplied in the borough.
There is considerable overlap between the types of activities most in demand from
young people in Islington and the activities provided by respondents to the
stakeholder survey.
The analysis suggests a lack of supply for trampolining, bowling, horse riding and
BMX (similarly, there were no clubs or opportunities for these activities on Get
Active London).
139
Assessment of the physical activity provision within Islington CHESS zones
381. As outlined in section 3, two further areas of Islington were chosen for more in-depth
research into the provision of physical activity opportunities available for young people.
For each area (or CHESS zone) a full report is available as an annex to this report.
Findings from each of these CHESS reports are summarised below. See table 32 for a
summary of findings from the joint Camden and Islington CHESS report (Fresh Youth
Academy/The Zone).
ISLINGTON – THE LIFT
382. The CHESS zone is located in the Barnsbury, St Mary’s, Clerkenwell, Bunhill and
Caledonian wards. Utilising 2011 census data at lower super output area it’s estimated
that approximately 3,299 people aged 0-18 live in the zone. This is projected to rise by
5.4% to 3,477 by 2018 (see annex 5 for the methodology used to calculate population
figures).
383. It was not possible to access all of the assets identified during the dates and times of
scans for various reasons. It was particularly difficult to get access to schools. The
assets that were identified through the process but not scanned are listed in annex 5
within the Lift CHESS report.
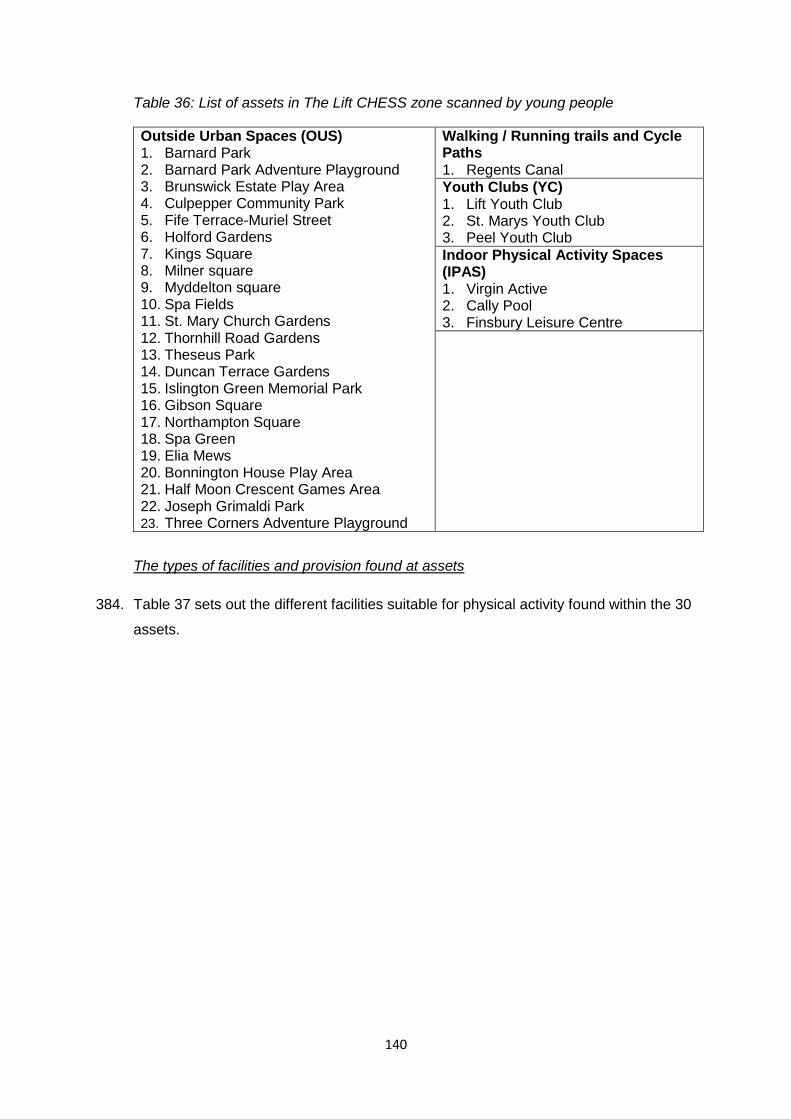
140
Table 36: List of assets in The Lift CHESS zone scanned by young people
Outside Urban Spaces (OUS) 1. Barnard Park 2. Barnard Park Adventure Playground 3. Brunswick Estate Play Area 4. Culpepper Community Park 5. Fife Terrace-Muriel Street 6. Holford Gardens 7. Kings Square 8. Milner square 9. Myddelton square 10. Spa Fields 11. St. Mary Church Gardens 12. Thornhill Road Gardens 13. Theseus Park 14. Duncan Terrace Gardens 15. Islington Green Memorial Park 16. Gibson Square 17. Northampton Square 18. Spa Green 19. Elia Mews 20. Bonnington House Play Area 21. Half Moon Crescent Games Area 22. Joseph Grimaldi Park 23. Three Corners Adventure Playground
Walking / Running trails and Cycle Paths 1. Regents Canal
Youth Clubs (YC) 1. Lift Youth Club 2. St. Marys Youth Club 3. Peel Youth Club
Indoor Physical Activity Spaces (IPAS) 1. Virgin Active 2. Cally Pool 3. Finsbury Leisure Centre
The types of facilities and provision found at assets
384. Table 37 sets out the different facilities suitable for physical activity found within the 30
assets.
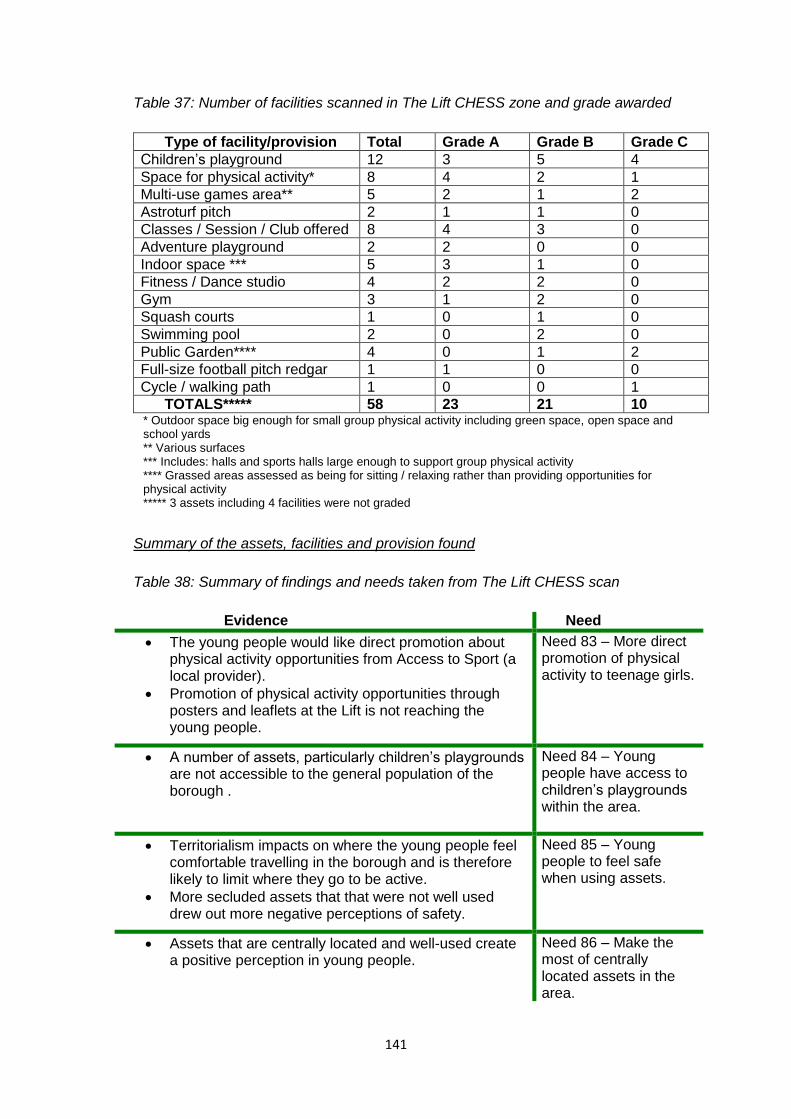
141
Table 37: Number of facilities scanned in The Lift CHESS zone and grade awarded
Type of facility/provision Total Grade A Grade B Grade C
Children’s playground 12 3 5 4
Space for physical activity* 8 4 2 1
Multi-use games area** 5 2 1 2
Astroturf pitch 2 1 1 0
Classes / Session / Club offered 8 4 3 0
Adventure playground 2 2 0 0
Indoor space *** 5 3 1 0
Fitness / Dance studio 4 2 2 0
Gym 3 1 2 0
Squash courts 1 0 1 0
Swimming pool 2 0 2 0
Public Garden**** 4 0 1 2
Full-size football pitch redgar 1 1 0 0
Cycle / walking path 1 0 0 1
TOTALS***** 58 23 21 10 * Outdoor space big enough for small group physical activity including green space, open space and school yards ** Various surfaces *** Includes: halls and sports halls large enough to support group physical activity **** Grassed areas assessed as being for sitting / relaxing rather than providing opportunities for physical activity ***** 3 assets including 4 facilities were not graded
Summary of the assets, facilities and provision found
Table 38: Summary of findings and needs taken from The Lift CHESS scan
Evidence Need
The young people would like direct promotion about physical activity opportunities from Access to Sport (a local provider).
Promotion of physical activity opportunities through posters and leaflets at the Lift is not reaching the young people.
Need 83 – More direct promotion of physical activity to teenage girls.
A number of assets, particularly children’s playgrounds are not accessible to the general population of the borough .
Need 84 – Young people have access to children’s playgrounds within the area.
Territorialism impacts on where the young people feel comfortable travelling in the borough and is therefore likely to limit where they go to be active.
More secluded assets that that were not well used drew out more negative perceptions of safety.
Need 85 – Young people to feel safe when using assets.
Assets that are centrally located and well-used create a positive perception in young people.
Need 86 – Make the most of centrally located assets in the area.
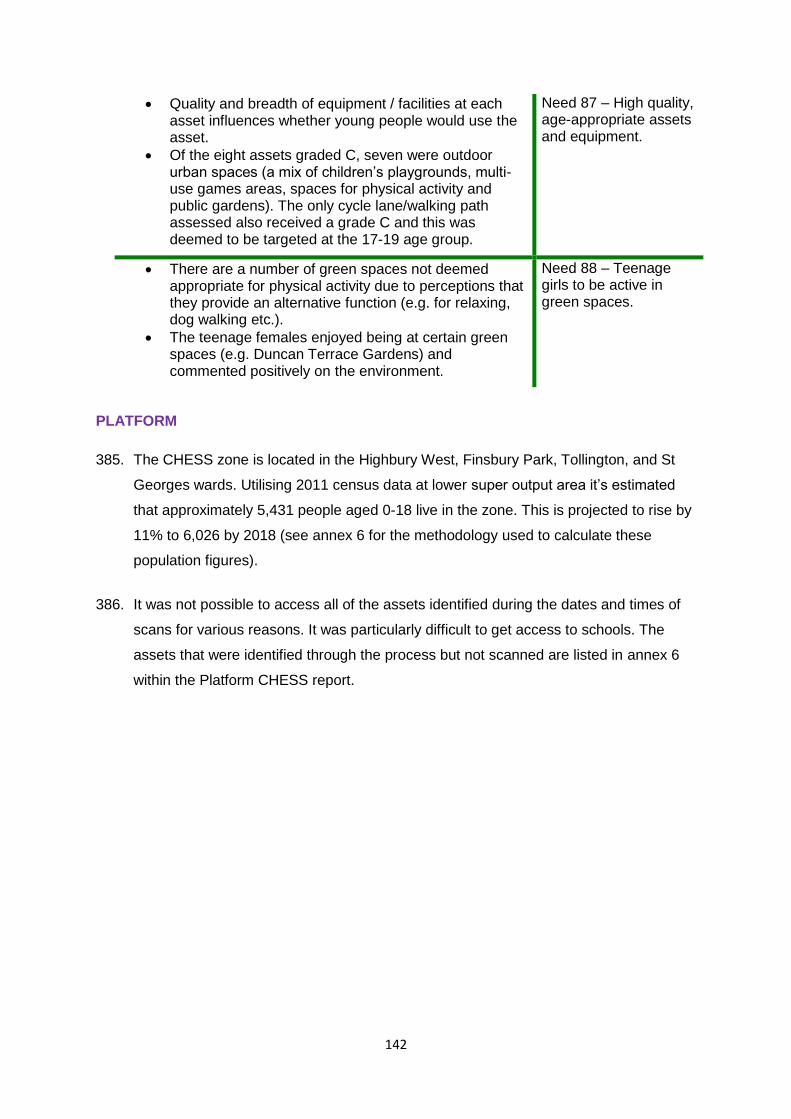
142
Quality and breadth of equipment / facilities at each asset influences whether young people would use the asset.
Of the eight assets graded C, seven were outdoor urban spaces (a mix of children’s playgrounds, multi-use games areas, spaces for physical activity and public gardens). The only cycle lane/walking path assessed also received a grade C and this was deemed to be targeted at the 17-19 age group.
Need 87 – High quality, age-appropriate assets and equipment.
There are a number of green spaces not deemed appropriate for physical activity due to perceptions that they provide an alternative function (e.g. for relaxing, dog walking etc.).
The teenage females enjoyed being at certain green spaces (e.g. Duncan Terrace Gardens) and commented positively on the environment.
Need 88 – Teenage girls to be active in green spaces.
PLATFORM
385. The CHESS zone is located in the Highbury West, Finsbury Park, Tollington, and St
Georges wards. Utilising 2011 census data at lower super output area it’s estimated
that approximately 5,431 people aged 0-18 live in the zone. This is projected to rise by
11% to 6,026 by 2018 (see annex 6 for the methodology used to calculate these
population figures).
386. It was not possible to access all of the assets identified during the dates and times of
scans for various reasons. It was particularly difficult to get access to schools. The
assets that were identified through the process but not scanned are listed in annex 6
within the Platform CHESS report.
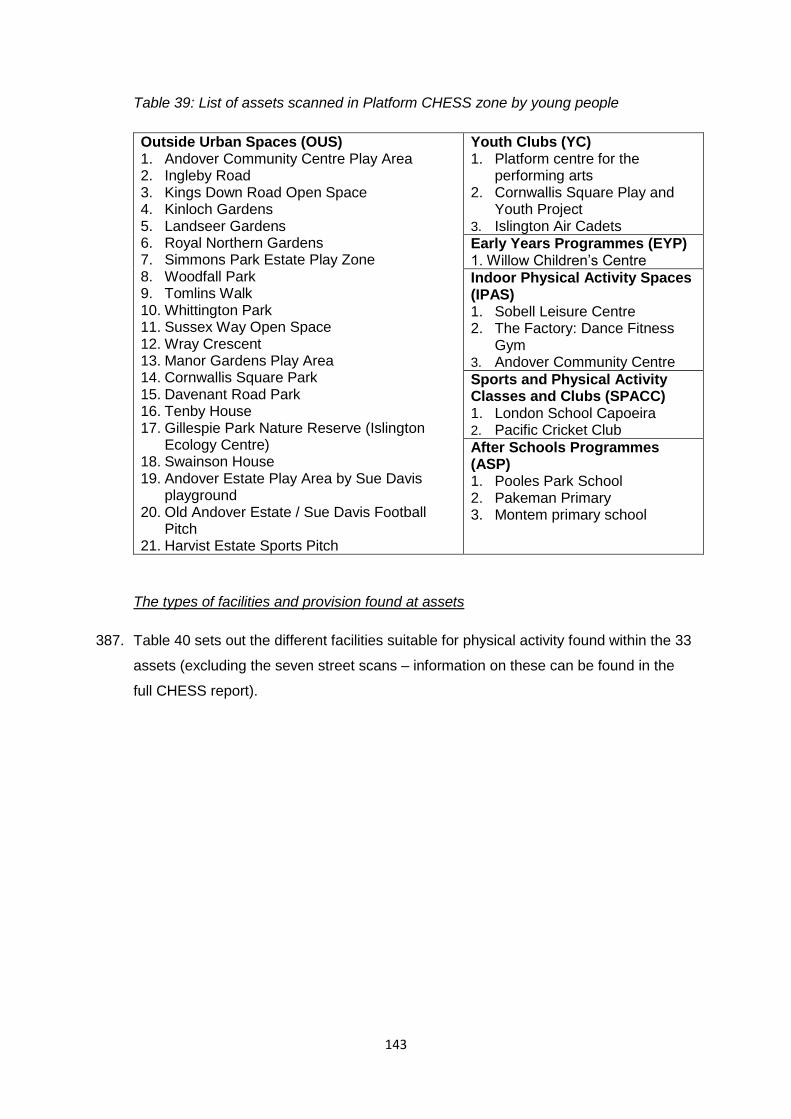
143
Table 39: List of assets scanned in Platform CHESS zone by young people
Outside Urban Spaces (OUS) 1. Andover Community Centre Play Area 2. Ingleby Road 3. Kings Down Road Open Space 4. Kinloch Gardens 5. Landseer Gardens 6. Royal Northern Gardens 7. Simmons Park Estate Play Zone 8. Woodfall Park 9. Tomlins Walk 10. Whittington Park 11. Sussex Way Open Space 12. Wray Crescent 13. Manor Gardens Play Area 14. Cornwallis Square Park 15. Davenant Road Park 16. Tenby House 17. Gillespie Park Nature Reserve (Islington
Ecology Centre) 18. Swainson House 19. Andover Estate Play Area by Sue Davis
playground 20. Old Andover Estate / Sue Davis Football
Pitch 21. Harvist Estate Sports Pitch
Youth Clubs (YC) 1. Platform centre for the
performing arts 2. Cornwallis Square Play and
Youth Project 3. Islington Air Cadets
Early Years Programmes (EYP) 1. Willow Children’s Centre
Indoor Physical Activity Spaces (IPAS) 1. Sobell Leisure Centre 2. The Factory: Dance Fitness
Gym 3. Andover Community Centre
Sports and Physical Activity Classes and Clubs (SPACC) 1. London School Capoeira 2. Pacific Cricket Club
After Schools Programmes (ASP) 1. Pooles Park School 2. Pakeman Primary 3. Montem primary school
The types of facilities and provision found at assets
387. Table 40 sets out the different facilities suitable for physical activity found within the 33
assets (excluding the seven street scans – information on these can be found in the
full CHESS report).

144
Table 40: Number of facilities scanned in Platform CHESS zone and grade awarded
Type of facility/provision Total Grade A Grade B Grade C
Children’s playground 19 1 9 9
Space for physical activity* 9 3 4 1
Climbing wall 2 0 2 0
Multi-use games area** 7 1 5 1
Outdoor gym 1 1 0 0
Astroturf pitch (full size) 1 1 0 0
Skate park 1 1 0 0
Cricket pitch 1 0 1 0
Outdoor table tennis 3 1 2 0
Trails 1 0 1 0
Classes / session / club offered 9 2 4 0
Adventure playground 1 1 0 0
Indoor space *** 9 3 2 1
Fitness/dance studio 4 0 3 0
Gym 2 0 2 0
Ice rink 1 0 1 0
Afterschool clubs 3 1 1 0
Squash courts 1 0 1 0
TOTALS**** 75 16 38 12 * Outdoor space big enough for small group physical activity including green space, open space and school yards. ** Various surfaces. *** Includes: halls, classrooms, dojo, sports halls and school halls large enough to support group physical activity. **** Four assets including nine facilities were not graded.
Table 41: Summary of findings and needs from the Platform CHESS scan
Evidence Need
Factors such as negative signage and assets locked or only lit at certain times of day frustrate young people and could be a barrier preventing access to assets to be physically active.
Need 89 – Young people have access to all assets within their communities.
The perceived quality and appropriateness of space and equipment at an asset influences whether young people will use it.
Of the 19 children’s playgrounds scanned by the young people only one received an ‘A’ grade (Whittington Park). Nine were graded ‘B’ and nine were graded ‘C’.
There is a lack of variety in equipment used on children’s playgrounds.
Need 90 - High quality, age-appropriate children’s playgrounds.
A number of factors such as location of asset, whether it’s well used or not, being well lit and tidiness influence young people’s perceptions of it
Need 91 – For young people to feel safe when using assets.
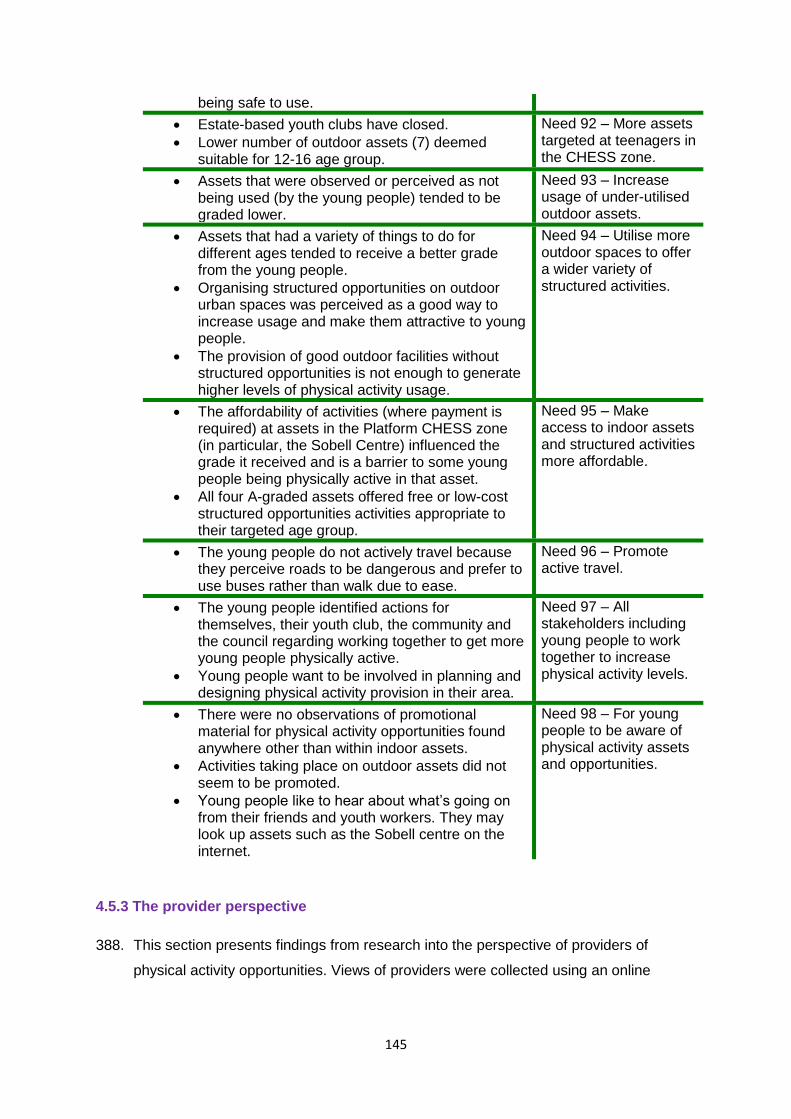
145
being safe to use.
Estate-based youth clubs have closed.
Lower number of outdoor assets (7) deemed suitable for 12-16 age group.
Need 92 – More assets targeted at teenagers in the CHESS zone.
Assets that were observed or perceived as not being used (by the young people) tended to be graded lower.
Need 93 – Increase usage of under-utilised outdoor assets.
Assets that had a variety of things to do for different ages tended to receive a better grade from the young people.
Organising structured opportunities on outdoor urban spaces was perceived as a good way to increase usage and make them attractive to young people.
The provision of good outdoor facilities without structured opportunities is not enough to generate higher levels of physical activity usage.
Need 94 – Utilise more outdoor spaces to offer a wider variety of structured activities.
The affordability of activities (where payment is required) at assets in the Platform CHESS zone (in particular, the Sobell Centre) influenced the grade it received and is a barrier to some young people being physically active in that asset.
All four A-graded assets offered free or low-cost structured opportunities activities appropriate to their targeted age group.
Need 95 – Make access to indoor assets and structured activities more affordable.
The young people do not actively travel because they perceive roads to be dangerous and prefer to use buses rather than walk due to ease.
Need 96 – Promote active travel.
The young people identified actions for themselves, their youth club, the community and the council regarding working together to get more young people physically active.
Young people want to be involved in planning and designing physical activity provision in their area.
Need 97 – All stakeholders including young people to work together to increase physical activity levels.
There were no observations of promotional material for physical activity opportunities found anywhere other than within indoor assets.
Activities taking place on outdoor assets did not seem to be promoted.
Young people like to hear about what’s going on from their friends and youth workers. They may look up assets such as the Sobell centre on the internet.
Need 98 – For young people to be aware of physical activity assets and opportunities.
4.5.3 The provider perspective
388. This section presents findings from research into the perspective of providers of
physical activity opportunities. Views of providers were collected using an online
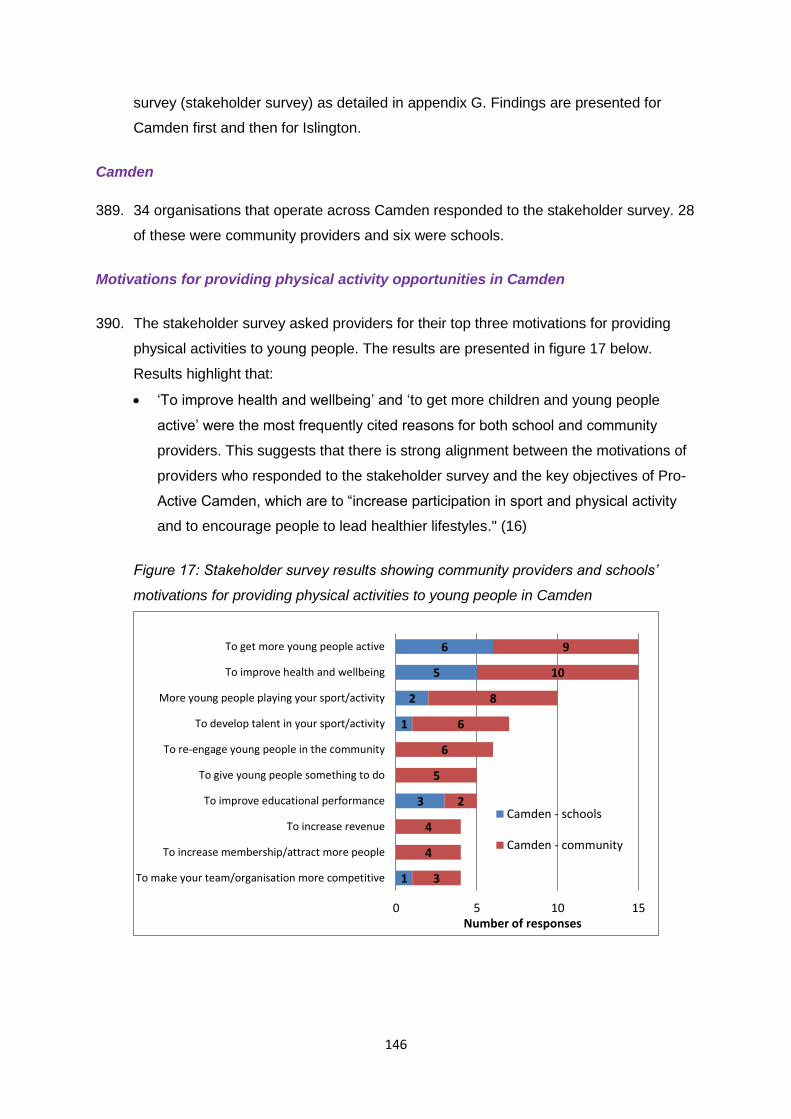
146
survey (stakeholder survey) as detailed in appendix G. Findings are presented for
Camden first and then for Islington.
Camden
389. 34 organisations that operate across Camden responded to the stakeholder survey. 28
of these were community providers and six were schools.
Motivations for providing physical activity opportunities in Camden
390. The stakeholder survey asked providers for their top three motivations for providing
physical activities to young people. The results are presented in figure 17 below.
Results highlight that:
‘To improve health and wellbeing’ and ‘to get more children and young people
active’ were the most frequently cited reasons for both school and community
providers. This suggests that there is strong alignment between the motivations of
providers who responded to the stakeholder survey and the key objectives of Pro-
Active Camden, which are to “increase participation in sport and physical activity
and to encourage people to lead healthier lifestyles." (16)
Figure 17: Stakeholder survey results showing community providers and schools’
motivations for providing physical activities to young people in Camden
1
3
1
2
5
6
3
4
4
2
5
6
6
8
10
9
0 5 10 15
To make your team/organisation more competitive
To increase membership/attract more people
To increase revenue
To improve educational performance
To give young people something to do
To re-engage young people in the community
To develop talent in your sport/activity
More young people playing your sport/activity
To improve health and wellbeing
To get more young people active
Number of responses
Camden - schools
Camden - community

147
Cohorts targeted by providers in Camden
391. The stakeholder survey asked providers to identify groups their activities are
specifically targeted to. The responses are presented in figure 18 below.
Figure 18: Stakeholder survey results showing groups specifically targeted by
providers in Camden
Ability to meet demand in Camden
392. The stakeholder survey asked providers whether they were able to meet the current
demand for physical activities. The results highlight that:
Catering for demand is sometimes an issue for half of the providers that responded
to the survey (17).
Eight out of 34 providers (four schools and four community providers) stated that
they can always meet current demand.
Challenges faced by providers in Camden
393. The stakeholder survey asked providers to identify their top challenges in getting more
young people active. Responses are presented in figure 19 below.
1
3
2
3
3
2
3
3
5
7
3
6
7
10
7
7
8
8
11
9
10
0 5 10 15 20
Other
Young people from complex families
Inactive young people
NEETS
Young people with learning difficulties
Young people with physical disabilities
We don’t specifically target any groups
Young people from low income families
Ethnic minority groups
Boys
Girls
Number of responses
Camden - schools
Camden - community
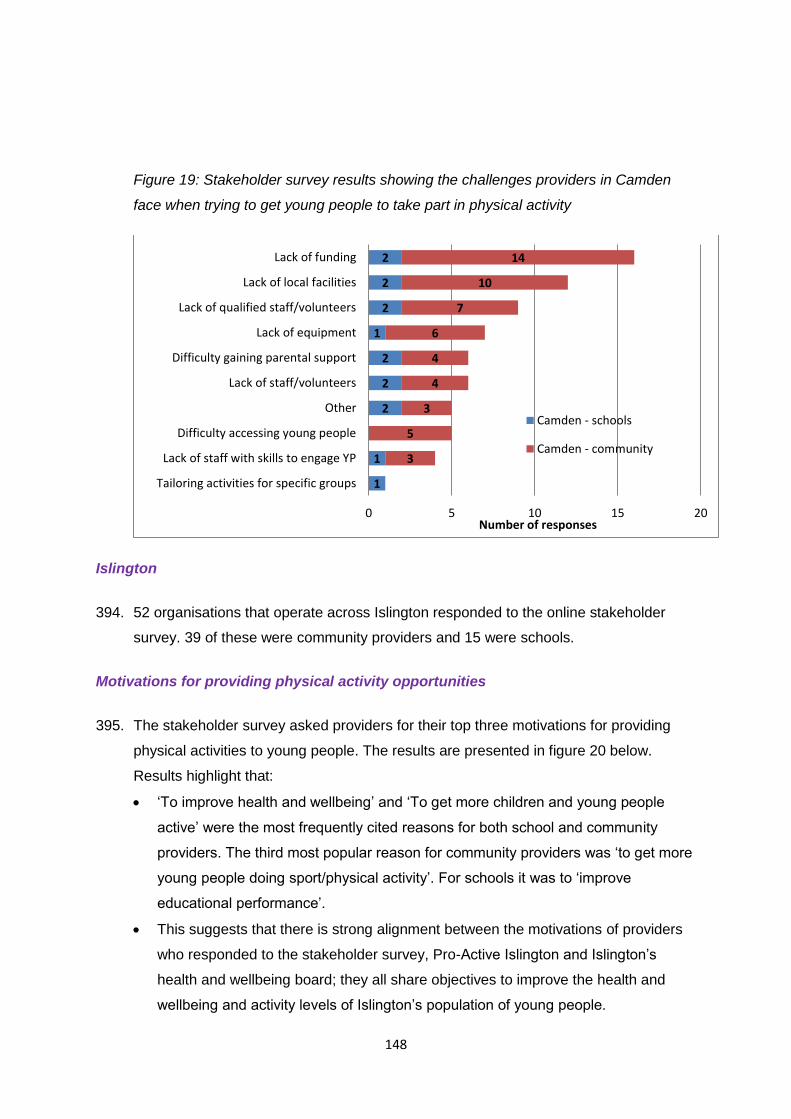
148
Figure 19: Stakeholder survey results showing the challenges providers in Camden
face when trying to get young people to take part in physical activity
Islington
394. 52 organisations that operate across Islington responded to the online stakeholder
survey. 39 of these were community providers and 15 were schools.
Motivations for providing physical activity opportunities
395. The stakeholder survey asked providers for their top three motivations for providing
physical activities to young people. The results are presented in figure 20 below.
Results highlight that:
‘To improve health and wellbeing’ and ‘To get more children and young people
active’ were the most frequently cited reasons for both school and community
providers. The third most popular reason for community providers was ‘to get more
young people doing sport/physical activity’. For schools it was to ‘improve
educational performance’.
This suggests that there is strong alignment between the motivations of providers
who responded to the stakeholder survey, Pro-Active Islington and Islington’s
health and wellbeing board; they all share objectives to improve the health and
wellbeing and activity levels of Islington’s population of young people.
1
1
2
2
2
1
2
2
2
3
5
3
4
4
6
7
10
14
0 5 10 15 20
Tailoring activities for specific groups
Lack of staff with skills to engage YP
Difficulty accessing young people
Other
Lack of staff/volunteers
Difficulty gaining parental support
Lack of equipment
Lack of qualified staff/volunteers
Lack of local facilities
Lack of funding
Number of responses
Camden - schools
Camden - community
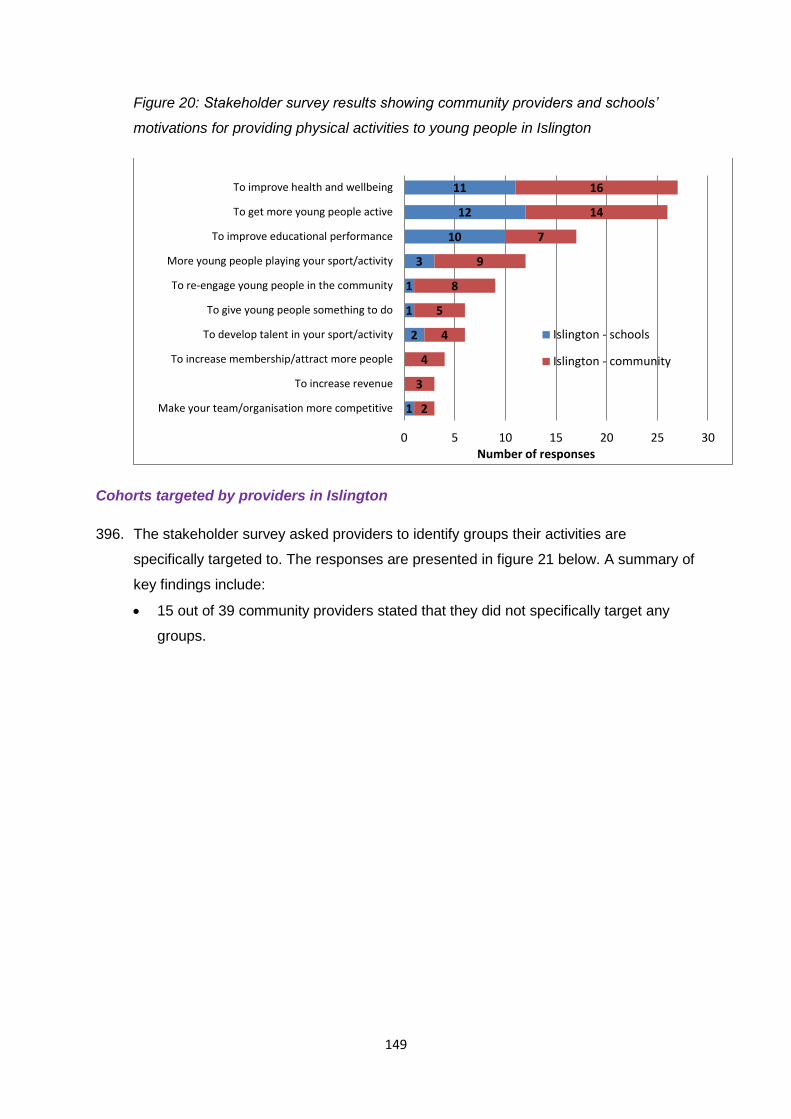
149
Figure 20: Stakeholder survey results showing community providers and schools’
motivations for providing physical activities to young people in Islington
Cohorts targeted by providers in Islington
396. The stakeholder survey asked providers to identify groups their activities are
specifically targeted to. The responses are presented in figure 21 below. A summary of
key findings include:
15 out of 39 community providers stated that they did not specifically target any
groups.
1
2
1
1
3
10
12
11
2
3
4
4
5
8
9
7
14
16
0 5 10 15 20 25 30
Make your team/organisation more competitive
To increase revenue
To increase membership/attract more people
To develop talent in your sport/activity
To give young people something to do
To re-engage young people in the community
More young people playing your sport/activity
To improve educational performance
To get more young people active
To improve health and wellbeing
Number of responses
Islington - schools
Islington - community
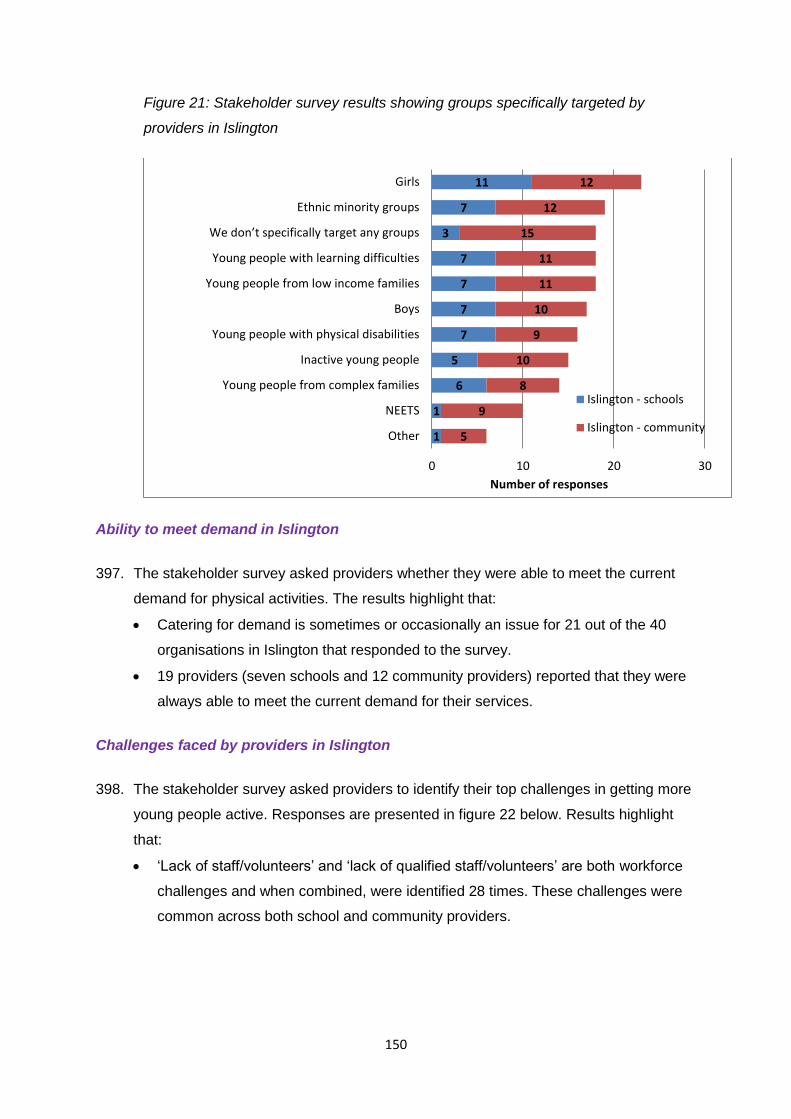
150
Figure 21: Stakeholder survey results showing groups specifically targeted by
providers in Islington
Ability to meet demand in Islington
397. The stakeholder survey asked providers whether they were able to meet the current
demand for physical activities. The results highlight that:
Catering for demand is sometimes or occasionally an issue for 21 out of the 40
organisations in Islington that responded to the survey.
19 providers (seven schools and 12 community providers) reported that they were
always able to meet the current demand for their services.
Challenges faced by providers in Islington
398. The stakeholder survey asked providers to identify their top challenges in getting more
young people active. Responses are presented in figure 22 below. Results highlight
that:
‘Lack of staff/volunteers’ and ‘lack of qualified staff/volunteers’ are both workforce
challenges and when combined, were identified 28 times. These challenges were
common across both school and community providers.
1
1
6
5
7
7
7
7
3
7
11
5
9
8
10
9
10
11
11
15
12
12
0 10 20 30
Other
NEETS
Young people from complex families
Inactive young people
Young people with physical disabilities
Boys
Young people from low income families
Young people with learning difficulties
We don’t specifically target any groups
Ethnic minority groups
Girls
Number of responses
Islington - schools
Islington - community

151
Figure 22: Stakeholder survey results showing the challenges providers in Islington
face when trying to get young people to take part in physical activity
Supporting providers in Camden and Islington
399. The stakeholder survey asked respondents for their views on what would help them
get more young people involved in physical activity. This was a free text answer so in
order to analyse their responses, they were grouped into themes. The number of times
themes were mentioned can be seen in figures 23 (Camden) and 24 (Islington). The
most common theme for Camden was related to the cost of providing activities and
young people’s ability to pay for them. This was the second most common theme in
Islington.
400. Example answers include:
“The age-old problem more money spent on better facilities that price out
youngsters of our communities in favour of adults from law firms and banks.
Councils pay no heed to the need to allow 9-16 year olds to hire local all weather
pitches from 5-9pm instead allow the said lawyers and bankers this prime time
spots and then wonder why kids find trouble at these times. (sports club working
across both boroughs).”
“More free available locations for young people to use, without paying expensive
fees in renting out venues. (Camden youth organisation).”
“Grants to offer sessions at a subsidised cost, and suitable venues at affordable
cost! (provider working across both boroughs).”
1
3
4
2
1
5
2
6
8
9
1
5
5
7
9
6
10
6
8
13
0 5 10 15 20 25
Tailoring activities for specific groups
Other
Lack of equipment
Lack of staff with skills to engage YP
Difficulty accessing young people
Difficulty gaining parental support
Lack of local facilities
Lack of qualified staff/volunteers
Lack of staff/volunteers
Lack of funding
Number of responses
Islington - schools
Islington - community

152
“More free equipment, coaches and special needs competitions. (Islington
School).”
401. In Islington, the most common theme was related to staffing. This was the case for
both school and community providers. Staffing was the joint second most popular
theme (with facilities) across Camden providers, although it was the most common
theme from Camden schools.
402. Example answers include:
“Ensure that clubs are always run by a reliable coach/teacher (school operating
across both boroughs).”
“Increased knowledge in local sports centres so that staff have skills to support
physical disabilities plus complex needs. funding for families to gain support for
their child to attend (transport cost, carer support)(Islington School).”
“Better quality Youth Workers (Islington Youth Centre).”
“More sports specific funding to employ qualified, CRB checked coaches who can
run extra sessions. Only 4 staff in PE and hard to run 5 football teams, 5 rugby
teams, 2 basketball teams, table tennis, badminton and fitness between just us!
(Camden School).”
Figure 23: Stakeholder survey results showing factors that would support providers to
get young people physically active in Camden
1
1
1
1
2
1
1
1
2
2
4
3
4
3
5
0 1 2 3 4 5 6 7
Equipment
Parents
Access
Transport
Funding
Marketing
Facilities
Staff
Cost
Number of responses
Camden - schools
Camden - community
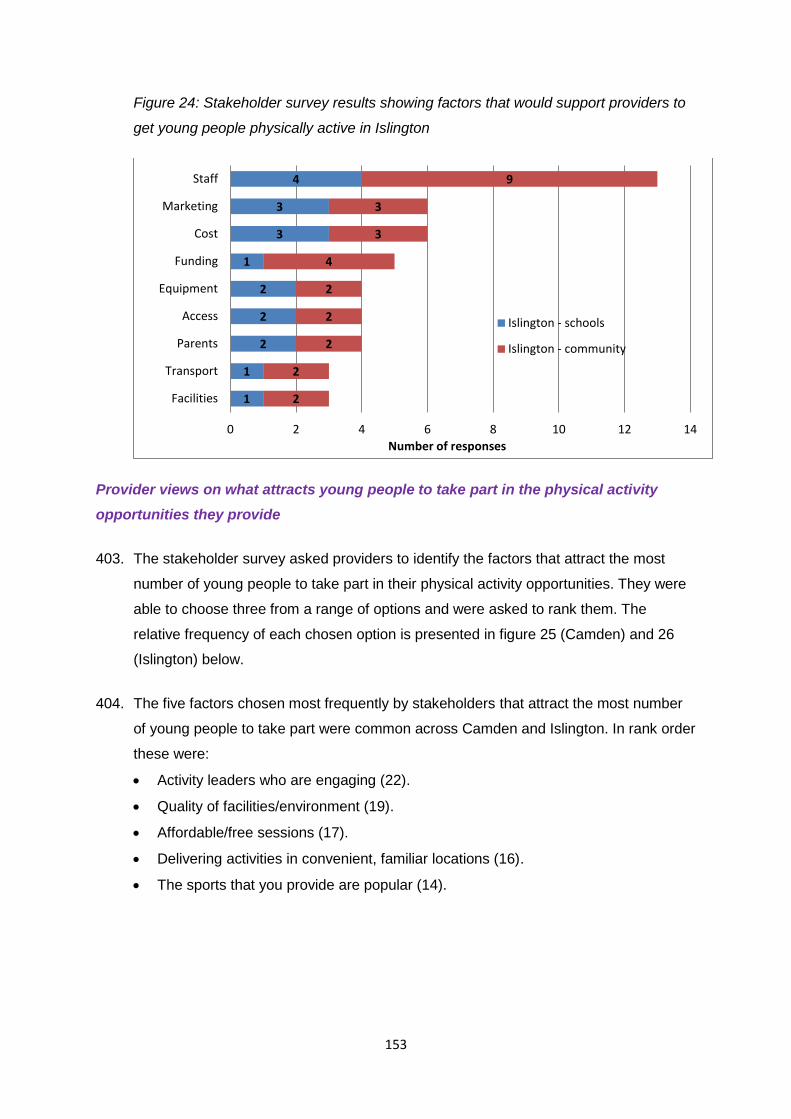
153
Figure 24: Stakeholder survey results showing factors that would support providers to
get young people physically active in Islington
Provider views on what attracts young people to take part in the physical activity
opportunities they provide
403. The stakeholder survey asked providers to identify the factors that attract the most
number of young people to take part in their physical activity opportunities. They were
able to choose three from a range of options and were asked to rank them. The
relative frequency of each chosen option is presented in figure 25 (Camden) and 26
(Islington) below.
404. The five factors chosen most frequently by stakeholders that attract the most number
of young people to take part were common across Camden and Islington. In rank order
these were:
Activity leaders who are engaging (22).
Quality of facilities/environment (19).
Affordable/free sessions (17).
Delivering activities in convenient, familiar locations (16).
The sports that you provide are popular (14).
1
1
2
2
2
1
3
3
4
2
2
2
2
2
4
3
3
9
0 2 4 6 8 10 12 14
Facilities
Transport
Parents
Access
Equipment
Funding
Cost
Marketing
Staff
Number of responses
Islington - schools
Islington - community
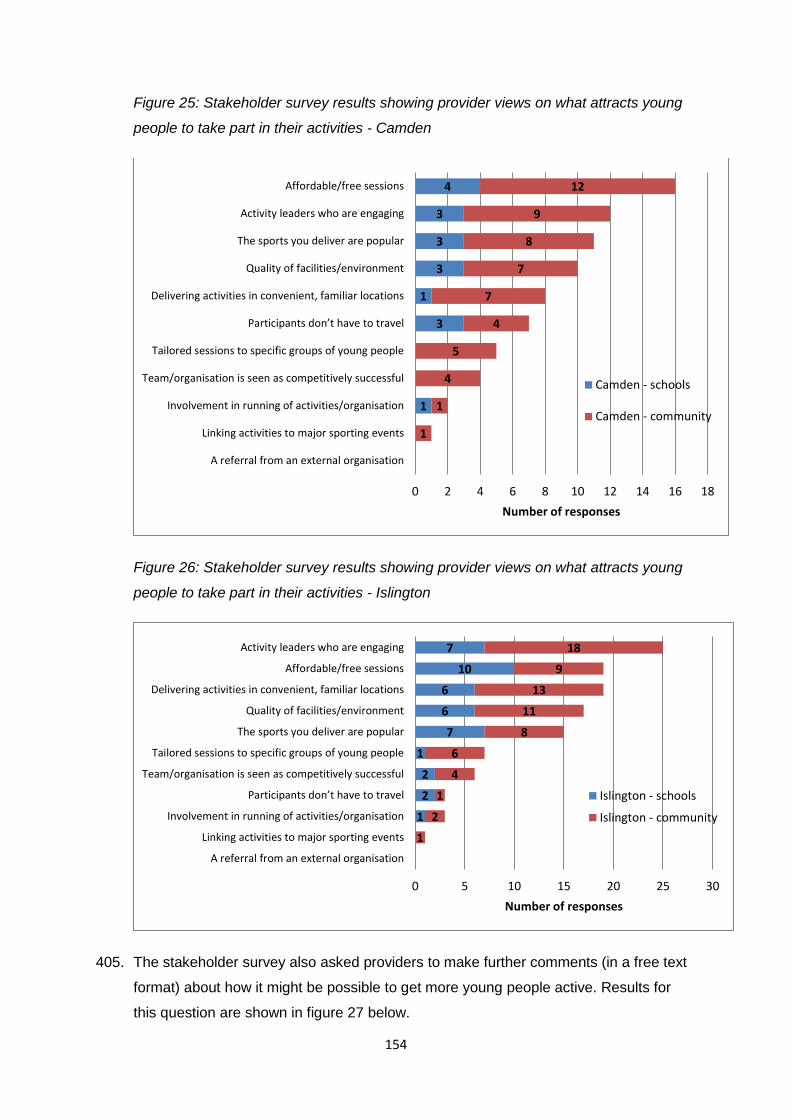
154
Figure 25: Stakeholder survey results showing provider views on what attracts young
people to take part in their activities - Camden
Figure 26: Stakeholder survey results showing provider views on what attracts young
people to take part in their activities - Islington
405. The stakeholder survey also asked providers to make further comments (in a free text
format) about how it might be possible to get more young people active. Results for
this question are shown in figure 27 below.
1
3
1
3
3
3
4
1
1
4
5
4
7
7
8
9
12
0 2 4 6 8 10 12 14 16 18
A referral from an external organisation
Linking activities to major sporting events
Involvement in running of activities/organisation
Team/organisation is seen as competitively successful
Tailored sessions to specific groups of young people
Participants don’t have to travel
Delivering activities in convenient, familiar locations
Quality of facilities/environment
The sports you deliver are popular
Activity leaders who are engaging
Affordable/free sessions
Number of responses
Camden - schools
Camden - community
1
2
2
1
7
6
6
10
7
1
2
1
4
6
8
11
13
9
18
0 5 10 15 20 25 30
A referral from an external organisation
Linking activities to major sporting events
Involvement in running of activities/organisation
Participants don’t have to travel
Team/organisation is seen as competitively successful
Tailored sessions to specific groups of young people
The sports you deliver are popular
Quality of facilities/environment
Delivering activities in convenient, familiar locations
Affordable/free sessions
Activity leaders who are engaging
Number of responses
Islington - schools
Islington - community
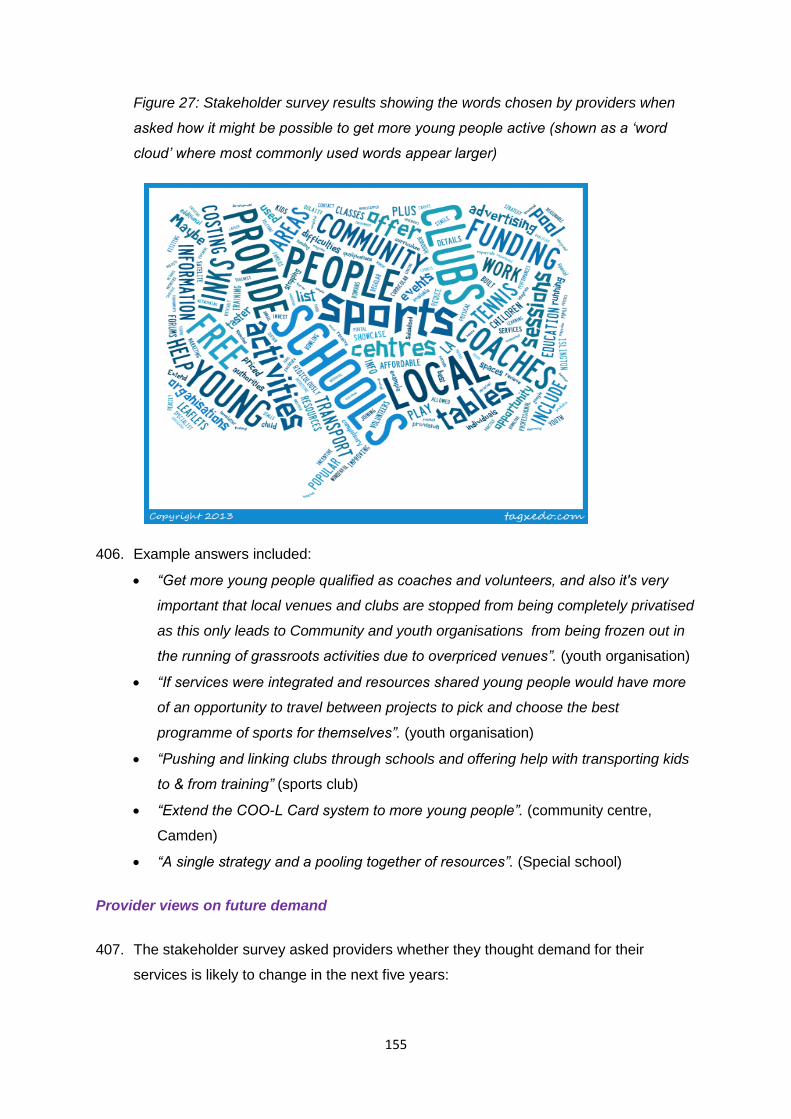
155
Figure 27: Stakeholder survey results showing the words chosen by providers when
asked how it might be possible to get more young people active (shown as a ‘word
cloud’ where most commonly used words appear larger)
406. Example answers included:
“Get more young people qualified as coaches and volunteers, and also it's very
important that local venues and clubs are stopped from being completely privatised
as this only leads to Community and youth organisations from being frozen out in
the running of grassroots activities due to overpriced venues”. (youth organisation)
“If services were integrated and resources shared young people would have more
of an opportunity to travel between projects to pick and choose the best
programme of sports for themselves”. (youth organisation)
“Pushing and linking clubs through schools and offering help with transporting kids
to & from training” (sports club)
“Extend the COO-L Card system to more young people”. (community centre,
Camden)
“A single strategy and a pooling together of resources”. (Special school)
Provider views on future demand
407. The stakeholder survey asked providers whether they thought demand for their
services is likely to change in the next five years:
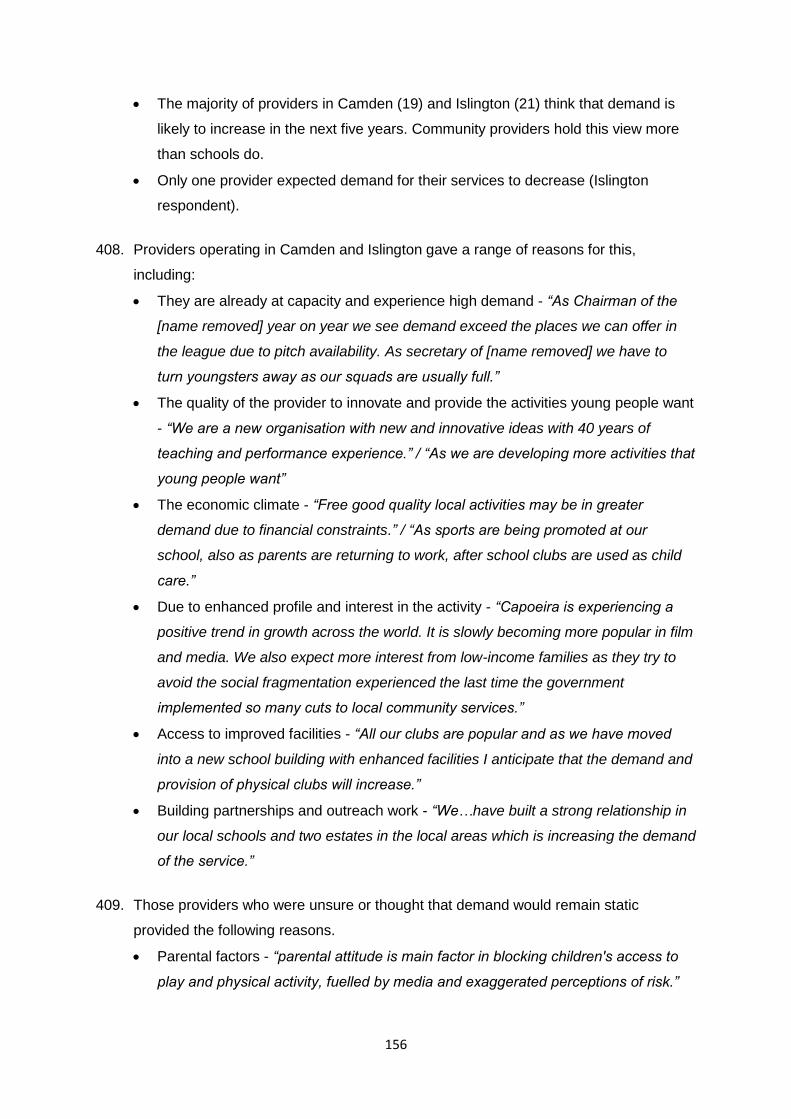
156
The majority of providers in Camden (19) and Islington (21) think that demand is
likely to increase in the next five years. Community providers hold this view more
than schools do.
Only one provider expected demand for their services to decrease (Islington
respondent).
408. Providers operating in Camden and Islington gave a range of reasons for this,
including:
They are already at capacity and experience high demand - “As Chairman of the
[name removed] year on year we see demand exceed the places we can offer in
the league due to pitch availability. As secretary of [name removed] we have to
turn youngsters away as our squads are usually full.”
The quality of the provider to innovate and provide the activities young people want
- “We are a new organisation with new and innovative ideas with 40 years of
teaching and performance experience.” / “As we are developing more activities that
young people want”
The economic climate - “Free good quality local activities may be in greater
demand due to financial constraints.” / “As sports are being promoted at our
school, also as parents are returning to work, after school clubs are used as child
care.”
Due to enhanced profile and interest in the activity - “Capoeira is experiencing a
positive trend in growth across the world. It is slowly becoming more popular in film
and media. We also expect more interest from low-income families as they try to
avoid the social fragmentation experienced the last time the government
implemented so many cuts to local community services.”
Access to improved facilities - “All our clubs are popular and as we have moved
into a new school building with enhanced facilities I anticipate that the demand and
provision of physical clubs will increase.”
Building partnerships and outreach work - “We…have built a strong relationship in
our local schools and two estates in the local areas which is increasing the demand
of the service.”
409. Those providers who were unsure or thought that demand would remain static
provided the following reasons.
Parental factors - “parental attitude is main factor in blocking children's access to
play and physical activity, fuelled by media and exaggerated perceptions of risk.”

157
A need for new activities - “Unless there are new activities to participate in, pupils
will stay doing the same as they always have. Also, unless parents are behind
them, supporting and encouraging them, nothing will change.”
The extent to which sport is promoted - “It depends how well sport is delivered and
promoted in school and at grassroots level outside of school.”
410. In addition to provider’s views on whether demand might change, some stakeholders
raised the need for planning to take into account a real or potential increase in
demand.
411. One Islington stakeholder mentioned that the athletics club at Finsbury Park has
struggled to cater for the demand from young people following the London 2012
Games.
412. Another stakeholder who works with young people with special educational needs
raised that there is evidence of growth in the number of children with complex
disabilities because more babies are surviving at birth due to advances in medicine
and surgery.
Communications and promotion
413. The stakeholder survey asked providers what were the most effective ways they have
found to promote their organisation and its activities to young people. Providers were
able to choose three options. The results are presented in figure 28 (Camden) and 29
(Islington):
‘Direct contact with young people in schools’ was the most chosen method of
promotion for schools in both Camden and Islington.
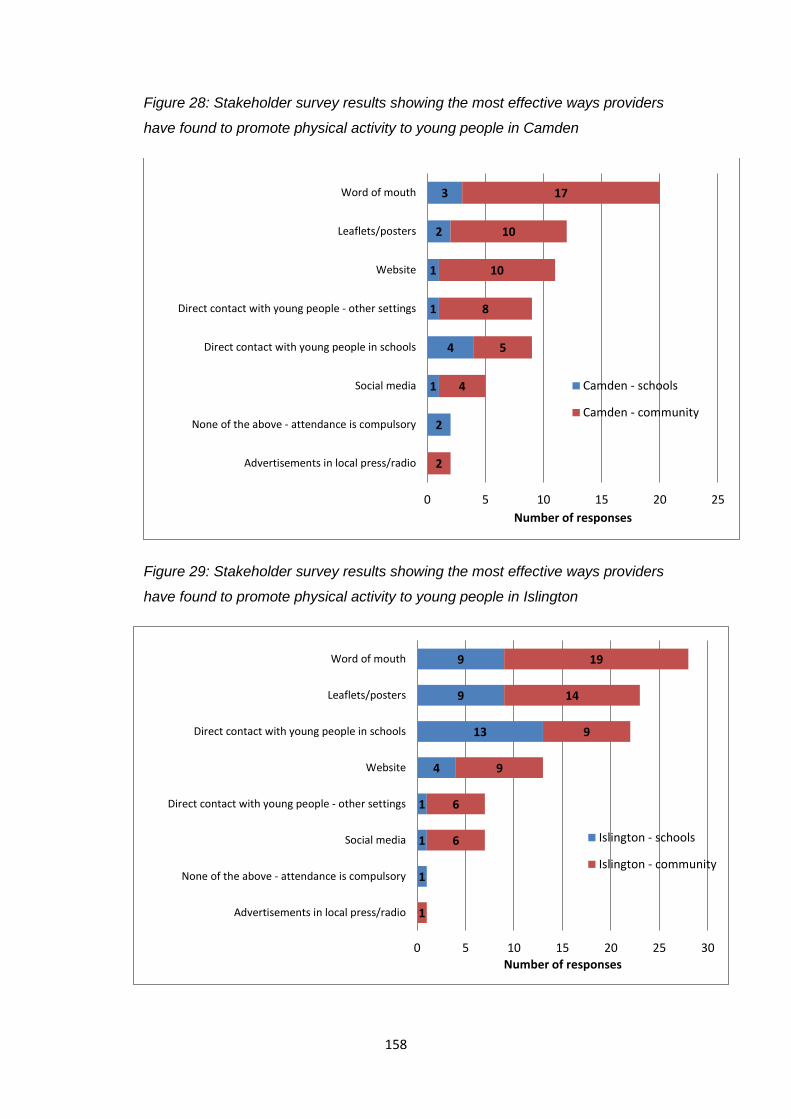
158
Figure 28: Stakeholder survey results showing the most effective ways providers
have found to promote physical activity to young people in Camden
Figure 29: Stakeholder survey results showing the most effective ways providers
have found to promote physical activity to young people in Islington
2
1
4
1
1
2
3
2
4
5
8
10
10
17
0 5 10 15 20 25
Advertisements in local press/radio
None of the above - attendance is compulsory
Social media
Direct contact with young people in schools
Direct contact with young people - other settings
Website
Leaflets/posters
Word of mouth
Number of responses
Camden - schools
Camden - community
1
1
1
4
13
9
9
1
6
6
9
9
14
19
0 5 10 15 20 25 30
Advertisements in local press/radio
None of the above - attendance is compulsory
Social media
Direct contact with young people - other settings
Website
Direct contact with young people in schools
Leaflets/posters
Word of mouth
Number of responses
Islington - schools
Islington - community
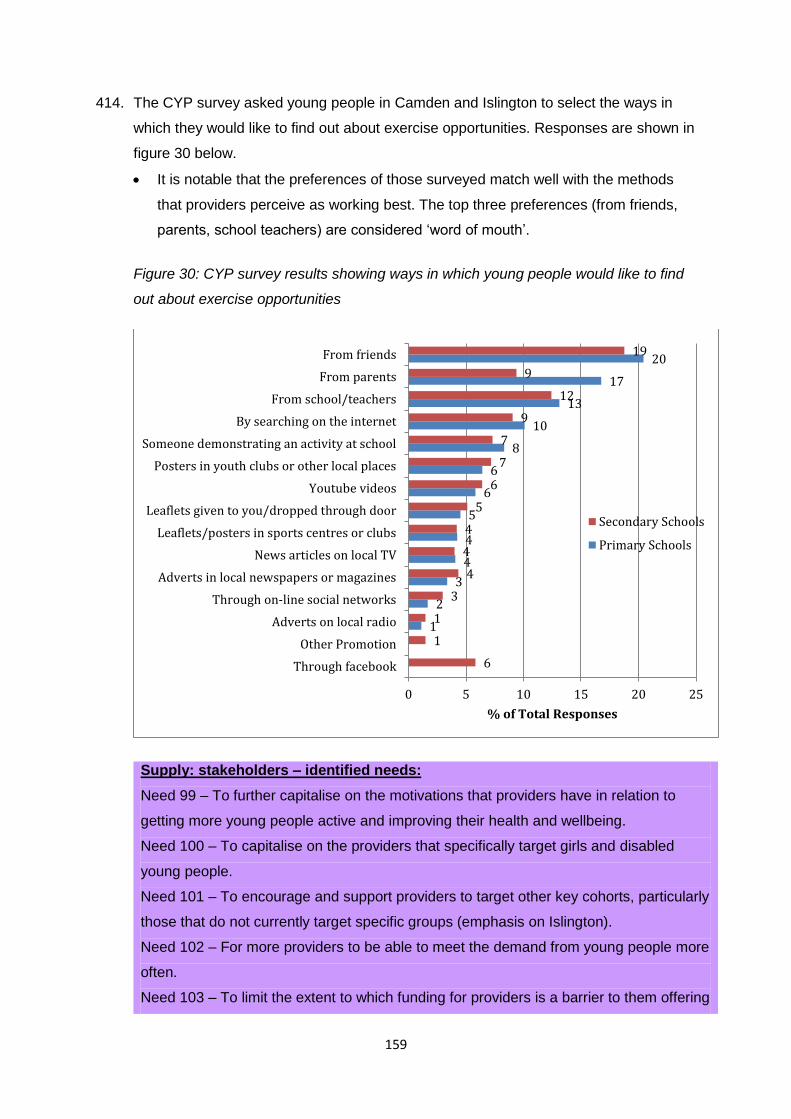
159
414. The CYP survey asked young people in Camden and Islington to select the ways in
which they would like to find out about exercise opportunities. Responses are shown in
figure 30 below.
It is notable that the preferences of those surveyed match well with the methods
that providers perceive as working best. The top three preferences (from friends,
parents, school teachers) are considered ‘word of mouth’.
Figure 30: CYP survey results showing ways in which young people would like to find
out about exercise opportunities
Supply: stakeholders – identified needs:
Need 99 – To further capitalise on the motivations that providers have in relation to
getting more young people active and improving their health and wellbeing.
Need 100 – To capitalise on the providers that specifically target girls and disabled
young people.
Need 101 – To encourage and support providers to target other key cohorts, particularly
those that do not currently target specific groups (emphasis on Islington).
Need 102 – For more providers to be able to meet the demand from young people more
often.
Need 103 – To limit the extent to which funding for providers is a barrier to them offering
1
2
3
4
4
5
6
6
8
10
13
17
20
6
1
1
3
4
4
4
5
6
7
7
9
12
9
19
0 5 10 15 20 25
Through facebook
Other Promotion
Adverts on local radio
Through on-line social networks
Adverts in local newspapers or magazines
News articles on local TV
Leaflets/posters in sports centres or clubs
Leaflets given to you/dropped through door
Youtube videos
Posters in youth clubs or other local places
Someone demonstrating an activity at school
By searching on the internet
From school/teachers
From parents
From friends
% of Total Responses
Secondary Schools
Primary Schools
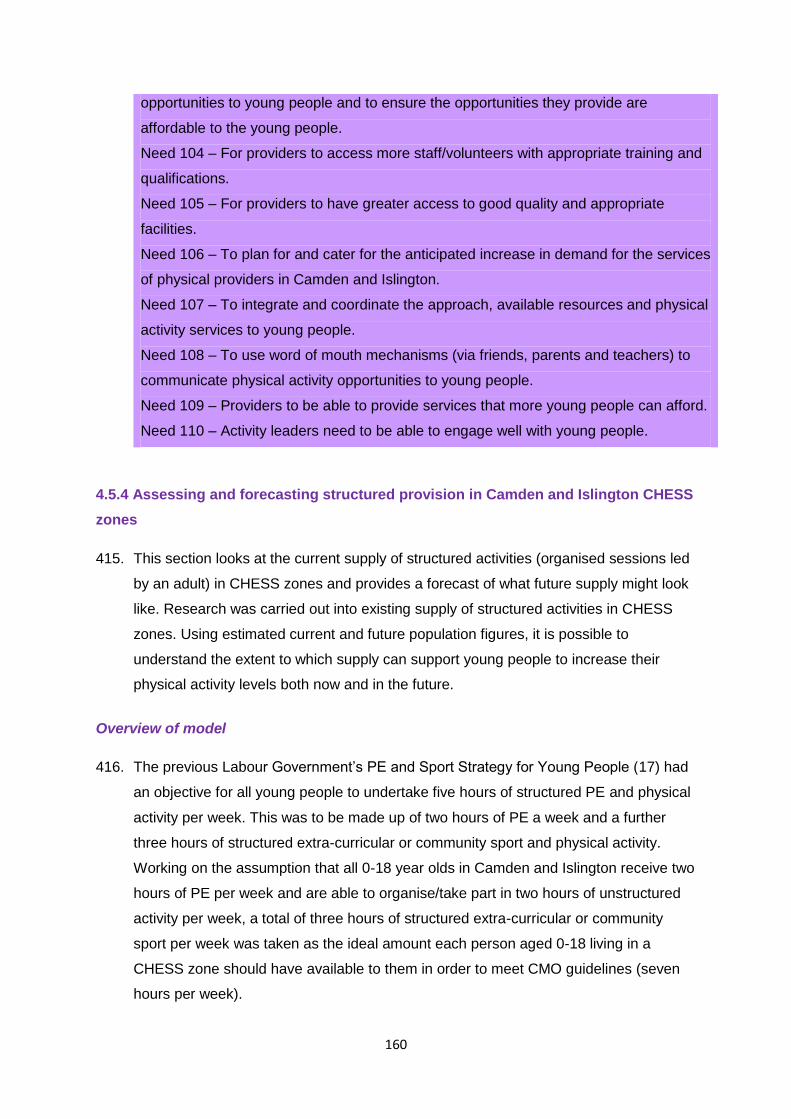
160
opportunities to young people and to ensure the opportunities they provide are
affordable to the young people.
Need 104 – For providers to access more staff/volunteers with appropriate training and
qualifications.
Need 105 – For providers to have greater access to good quality and appropriate
facilities.
Need 106 – To plan for and cater for the anticipated increase in demand for the services
of physical providers in Camden and Islington.
Need 107 – To integrate and coordinate the approach, available resources and physical
activity services to young people.
Need 108 – To use word of mouth mechanisms (via friends, parents and teachers) to
communicate physical activity opportunities to young people.
Need 109 – Providers to be able to provide services that more young people can afford.
Need 110 – Activity leaders need to be able to engage well with young people.
4.5.4 Assessing and forecasting structured provision in Camden and Islington CHESS
zones
415. This section looks at the current supply of structured activities (organised sessions led
by an adult) in CHESS zones and provides a forecast of what future supply might look
like. Research was carried out into existing supply of structured activities in CHESS
zones. Using estimated current and future population figures, it is possible to
understand the extent to which supply can support young people to increase their
physical activity levels both now and in the future.
Overview of model
416. The previous Labour Government’s PE and Sport Strategy for Young People (17) had
an objective for all young people to undertake five hours of structured PE and physical
activity per week. This was to be made up of two hours of PE a week and a further
three hours of structured extra-curricular or community sport and physical activity.
Working on the assumption that all 0-18 year olds in Camden and Islington receive two
hours of PE per week and are able to organise/take part in two hours of unstructured
activity per week, a total of three hours of structured extra-curricular or community
sport per week was taken as the ideal amount each person aged 0-18 living in a
CHESS zone should have available to them in order to meet CMO guidelines (seven
hours per week).
161
417. To calculate current supply, the number of hours of structured activity provided by
each asset annually within CHESS zones was counted. To this figure was added 10
hours a week of structured activity during term time for each primary school in the
CHESS zone. The same was then added for secondary schools, using 16 hours a
week10. The total figure was then divided by 52 to give an average weekly supply of
structured activities within CHESS zones.
418. To calculate the extent of the supply required, an assumption was made that each
structured activity session can accommodate 20 young people. This was based on a
review of how many young people attend an average Sportivate session11.
419. To understand the number of hours of structured activity required in each CHESS
zone to provide the current population of 0-18 year olds with three hours a week, the
following calculations were made:
Current 0-18 population of CHESS zone X 3 (hours required per week) = total
number of hours a week needed by 0-18 year olds in CHESS zones.
Total number of hours a week needed by 0-18 year olds in CHESS zones / 20
(people per session) = total number of hours of sessions a week required.
Total number of hours of sessions a week required – current number of hours of
sessions a week supplied within CHESS zones = number of additional hours a
week required within CHESS zones to enable all 0-18 year olds living within the
zones to access three hours of structured activity per week.
420. It should be noted that this model assesses supply against an objectively identified
level of desired structured activity. It does not consider whether there is, or will be in
future, the demand from the young people to take up this supply.
Assessing current supply
421. While researching existing levels of supply two relevant findings were identified:
Finding information on what structured activities are available is a considerable
challenge as there is no central or single location where supply information is
collated.
There is limited supply of structured activities that specifically targets girls and
disabled young people.
10 Camden school sport survey 2011/12 found that, on average, primary schools offered 10 afterschool clubs and
secondary schools offered 16. These figures have been utilised to estimate weekly afterschool provision. 11
Sportivate is a government-funded programme that provides weekly sessions of sport for 14-25 year olds. It operates in both Camden and Islington.
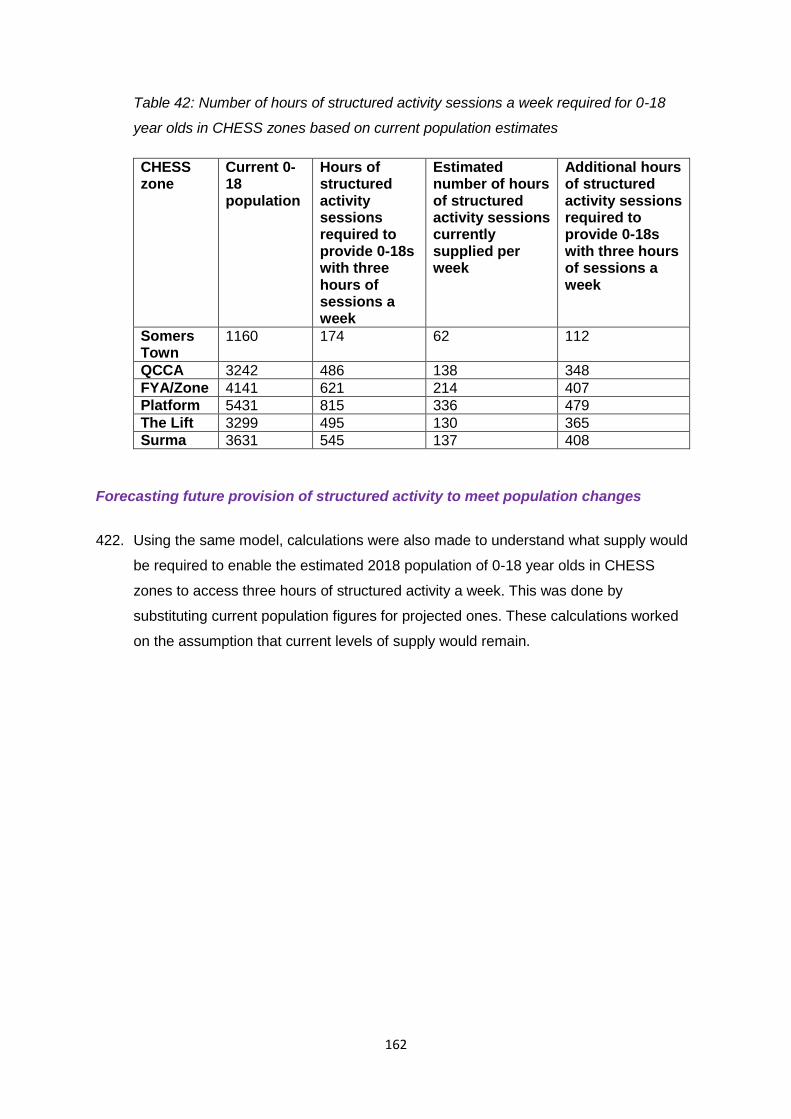
162
Table 42: Number of hours of structured activity sessions a week required for 0-18
year olds in CHESS zones based on current population estimates
CHESS zone
Current 0-18 population
Hours of structured activity sessions required to provide 0-18s with three hours of sessions a week
Estimated number of hours of structured activity sessions currently supplied per week
Additional hours of structured activity sessions required to provide 0-18s with three hours of sessions a week
Somers Town
1160 174 62 112
QCCA 3242 486 138 348
FYA/Zone 4141 621 214 407
Platform 5431 815 336 479
The Lift 3299 495 130 365
Surma 3631 545 137 408
Forecasting future provision of structured activity to meet population changes
422. Using the same model, calculations were also made to understand what supply would
be required to enable the estimated 2018 population of 0-18 year olds in CHESS
zones to access three hours of structured activity a week. This was done by
substituting current population figures for projected ones. These calculations worked
on the assumption that current levels of supply would remain.
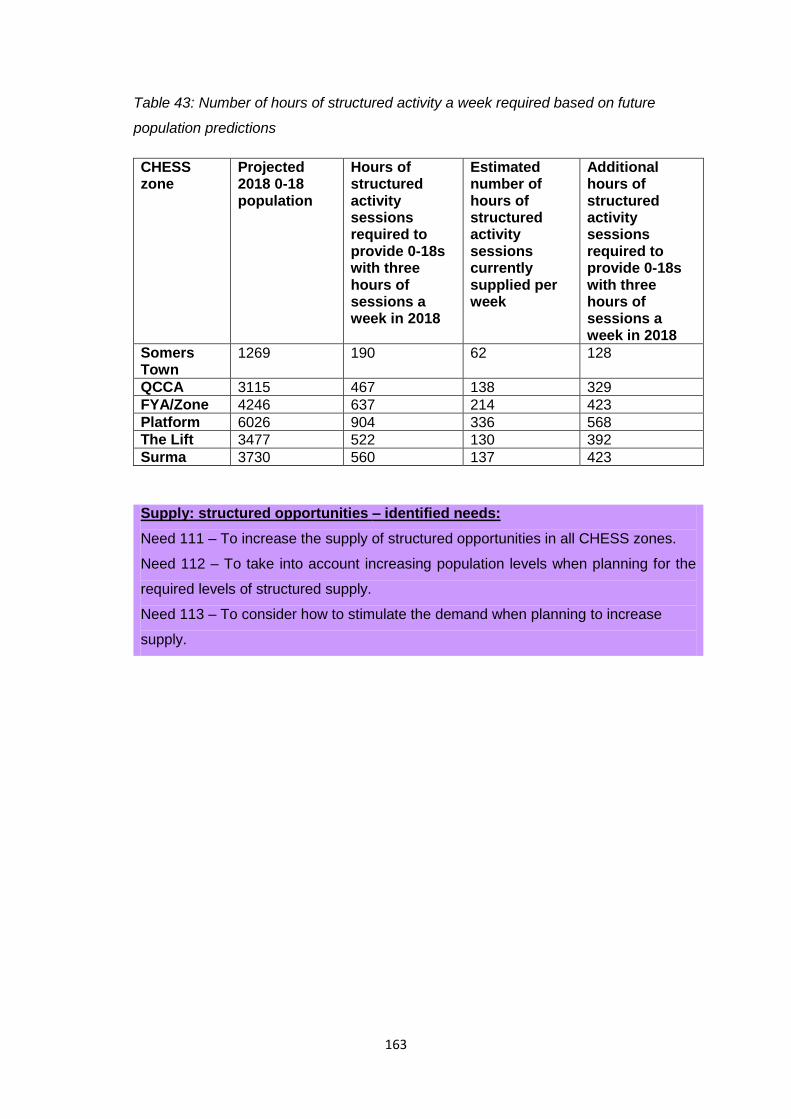
163
Table 43: Number of hours of structured activity a week required based on future
population predictions
CHESS zone
Projected 2018 0-18 population
Hours of structured activity sessions required to provide 0-18s with three hours of sessions a week in 2018
Estimated number of hours of structured activity sessions currently supplied per week
Additional hours of structured activity sessions required to provide 0-18s with three hours of sessions a week in 2018
Somers Town
1269 190 62 128
QCCA 3115 467 138 329
FYA/Zone 4246 637 214 423
Platform 6026 904 336 568
The Lift 3477 522 130 392
Surma 3730 560 137 423
Supply: structured opportunities – identified needs:
Need 111 – To increase the supply of structured opportunities in all CHESS zones.
Need 112 – To take into account increasing population levels when planning for the
required levels of structured supply.
Need 113 – To consider how to stimulate the demand when planning to increase
supply.
164
Recommendations and solutions
Section Five
5.1 Introduction
423. This section takes the identified needs from this report (section 4) and uses them to
build a set of recommendations for Pro-Active Camden and Pro-Active Islington. To
support the implementation of these recommendations the following has been outlined
for each:
A short explanation.
The number of the needs that the recommendation addresses – a full list of needs
can be found in appendix L.
A proposed lead service.
A list of services and partner organisations that the recommendation has
implications for.
A timeframe for implementation:
o Short – next 12 months.
o Medium – one to two years.
o Long – two to three years.
A number of possible solutions to aid the implementation of each recommendation.
Olympic legacy
424. Recommendations six and nine are proposed as the basis of an Olympic legacy offer
within both boroughs. These recommendations have been proposed because:
They offer a quick speed of impact.
They are visible to the community and offer the best opportunities for promoting
legacy efforts.
They will impact upon all young people.
A subjective assessment of recommendation complexity and timescales to impact
425. Figure 31 below is a subjective assessment of when action should be taken, how
complex it might be to implement the recommendations, along with a view on the
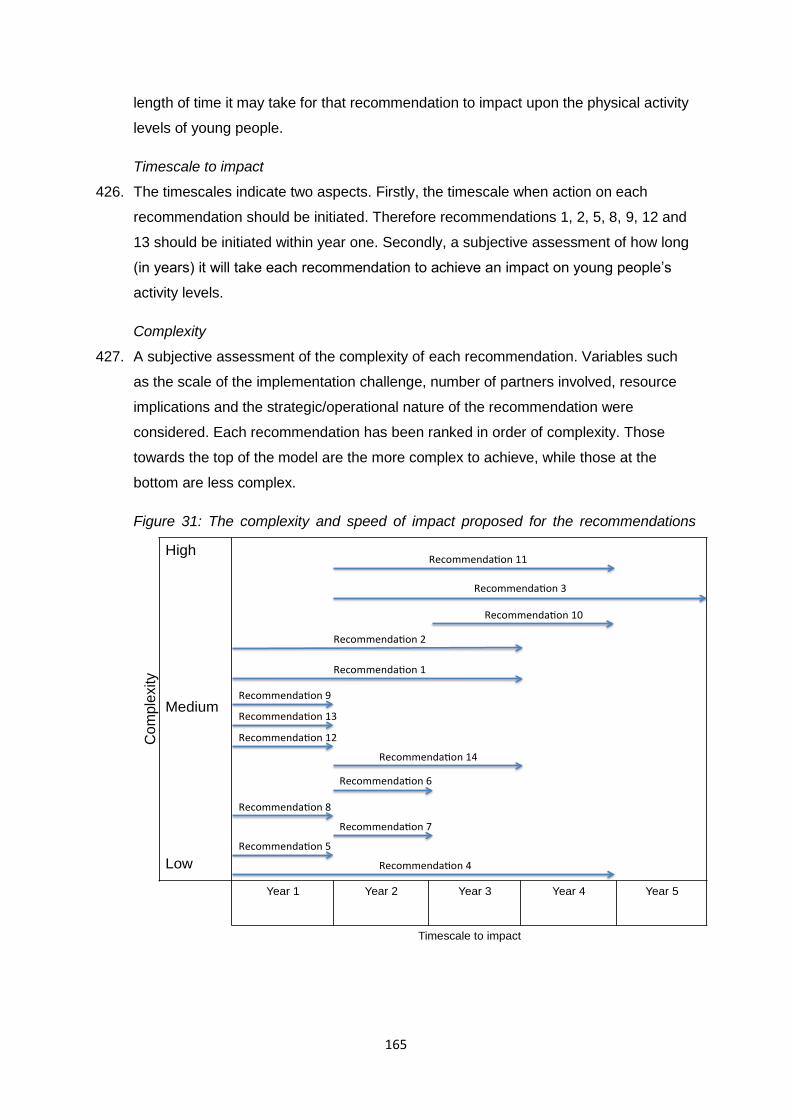
165
length of time it may take for that recommendation to impact upon the physical activity
levels of young people.
Timescale to impact
426. The timescales indicate two aspects. Firstly, the timescale when action on each
recommendation should be initiated. Therefore recommendations 1, 2, 5, 8, 9, 12 and
13 should be initiated within year one. Secondly, a subjective assessment of how long
(in years) it will take each recommendation to achieve an impact on young people’s
activity levels.
Complexity
427. A subjective assessment of the complexity of each recommendation. Variables such
as the scale of the implementation challenge, number of partners involved, resource
implications and the strategic/operational nature of the recommendation were
considered. Each recommendation has been ranked in order of complexity. Those
towards the top of the model are the more complex to achieve, while those at the
bottom are less complex.
Figure 31: The complexity and speed of impact proposed for the recommendations
Co
mple
xity
High
Medium
Low
Year 1 Year 2 Year 3 Year 4 Year 5
Timescale to impact
Recommenda on4
Recommenda on5
Recommenda on7
Recommenda on8
Recommenda on6
Recommenda on14
Recommenda on12
Recommenda on13
Recommenda on1
Recommenda on9
Recommenda on3
Recommenda on2
Recommenda on10
Recommenda on11
166
Easing the path to a physically active lifestyle
Recommendation 1: Establish a physical activity pathway to help all young people
become more physically active.
428. Too many young people are not doing enough physical activity to benefit their health.
For many young people their existing experience of physical activity isn’t motivating
them to achieve the required levels. Furthermore, the physical activity levels of certain
groups of young people (girls and disabled young people) are significantly lower than
the general population.
429. There are many stakeholders, including services within the councils and their partner
organisations, involved in shaping the physical activity experience that young people
are exposed to. This is currently uncoordinated and seemingly left to chance outside of
statutory PE provision. If young people’s physical activity levels are going to improve
then it will require the combined efforts of all stakeholders to implement a clear ‘user
journey’ that helps young people (and their parent/carers) identify and take part in the
physical activity opportunity that is right for their circumstances. This physical activity
pathway will meet the differing needs of all young people and recognise that sport is a
product that meets the needs of only some young people.
430. Bringing providers of physical activity opportunities together to be clear on the
contribution they can make to the physical activity pathway will be key to its success.
The research suggests that the majority of physical activity providers are primarily
motivated by getting more young people active and improving their health and
wellbeing. This ‘common purpose’ between commissioners, policymakers and
providers needs to be capitalised upon.
Addresses needs: 2, 3, 4, 5, 6, 7, 11, 12, 13, 64, 97, 99, 101, 102, 103, 106, 107,
112.
Lead services: Public health and leisure12.
This recommendation has implications for:
Health and wellbeing boards.
Children’s trusts.
12 Refers to leisure, sport and physical activity development teams within both councils.
167
Camden and Islington council’s commissioners and policymakers from services
such as youth, play, park and open spaces, complex families and school
improvement.
Pro-Active Camden and Pro-Active Islington members.
Clinical commissioning groups.
School management teams.
Children’s centres.
Camden and Islington council’s services delivering physical activity opportunities to
young people such as youth, play and school improvement.
Leisure contractors.
Timeframe: Short term to medium term.
Solutions:
a. Take the evidence and recommendations from this project to key decision making
groups to embed across key policies and instigate desired action. These might
include:
Health and wellbeing boards.
Clinical commissioning groups.
Children’s trusts.
b. Make the case for the physical activity pathway and engage decision makers from
the following key partnerships and council services, including:
Complex families.
Adult social care.
Parks and open spaces.
Housing.
Play and youth.
Community safety.
School improvement.
c. Review the membership and/or the terms of reference of the Pro-Active
partnerships in light of engaging with services listed above and to ensure
appropriate representation to develop and support the physical activity pathway.
d. Pro-Active Camden to review its strategy and ensure it focuses on young people
as well as adults, clearly setting out how it contributes to the physical activity
pathway.
168
e. Pro-Active Islington to use the evidence of this needs assessment to strengthen
delivery of the elements of its strategy which focusses on young people and set out
how they contribute to the physical activity pathway.
f. Ensure the physical activity pathway:
Reflects the breadth of physical activity provision from everyday activity
including active travel through to sport.
Establishes processes to support young people in critical transitions between
children’s centres, schools, colleges and community environments.
g. Establish a local physical activity pathway delivery pilot in each borough. These
should consider:
Initially focussing on the Gospel Oak area in Camden to make the most of the
Talacre Sports Centre and the QCCA as key facilities and resources.
Initially focussing on the Platform CHESS area in Islington to make the most of
the Sobell centre’s marketing expertise and outreach work and the Platform
youth centre as a key facility in the area.
Leadership from relevant services from within Camden and Islington councils
that will help bring together relevant schools, children’s centres, facilities and
community providers.13
Formulation of local ‘delivery groups’ made up of representatives from
organisations that deliver physical activity opportunities in the locality.
The initial purpose of the groups to explore how those organisations involved
contribute and can support delivery of the physical activity pathway locally.
How to incentivise involvement/contribution from schools and community
groups such as giving preferential access to funding or discounted facility
access.
h. Work with providers of physical activity opportunities from across the borough to:
Establish their needs for spaces/facilities.
Establish their workforce needs.
Ensure provision of activities that young people want to do most is available.
To secure funding for the provision of more opportunities.
Engage them in the local physical activity pathway delivery pilot in each
borough where relevant.
13 Refers to a wide range of not-for-profit organisations that provide physical activity facilities and opportunities in
the local community.
169
Recommendation 2: Encourage all young people to form a physically active lifestyle.
431. Physical activity levels of young people reduce as they get older, particularly during
early teen years. Once young people (and in particular, girls) stop taking part in
physical activity they find it difficult to get back into it. They feel that a certain level of
competence is required and that they lack the confidence to take that step back into it.
Further effort is required to ensure all young people learn and develop fundamental
movement skills early in their lives in order to instil the habit of a physical activity
lifestyle.
Addresses needs: 8, 16, 21, 23.
Lead service: Public health.
This recommendation has implications for:
Pro-Active Camden and Pro-Active Islington members.
Camden and Islington council’s services commissioning and delivering physical
activity opportunities to young people such as play, youth, leisure services, parks
and open spaces.
Children’s centres.
Schools.
Youth centres.
Leisure contractors.
Community providers of physical activity opportunities.
Timeframe: Medium to long term.
Solutions:
a. Influence all schools and children’s centres to sign up to the healthy
schools/children’s centres programmes. Consider increasing the number of
minutes of physical activity schools offer young people (not just through PE) to
three hours.
b. Establish plans to influence the creation and maintenance of a physically active
lifestyle in children’s centres and schools. Utilise:
Healthy schools and healthy children’s centre programme.
Joining up the Primary School Sports Premium to secure full time primary PE
teachers working across schools.
School nurses.
170
c. Use and promote the British Heart Foundation National Centre for Physical Activity
& Health's resource: Practical Strategies For Promoting Physical Activity. Promote
with primary schools and community organisations that can influence young
people's physical activity behaviour (Promote the version targeted at 11-18 year
olds to secondary schools and colleges once published).
d. Influence children’s centres and schools to focus delivery of the curriculum on
practising the fundamental movement skills rather than specific sports or activities.
Explore the potential use of skills achievement awards to encourage young people
to progress and to support identifying young people’s ability level.
e. Introduce a programme of multi-skills courses targeted at young people aged
between 13 and 16 to help reintroduce fundamental movement skills to those that
are dropping out of regular physical activity due to lack of confidence or skill.
Consider:
A focus on learning and achievement.
Provision must be fun and social.
Encouraging ‘mastery’ of the basic movement skills.
Teenage taster and beginner sessions.
Progression into suitable opportunities e.g. Satellite Clubs, ‘back 2…’, sport
clubs, gym sessions etc.
f. Utilise an appropriate coaching workforce who are sympathetic to these needs
rather than focussed on sporting performance.
g. Develop more affordable opportunities for parents and their children (under 5s and
0-11s) to be active together. Consider using children’s centres as hubs and focus
provision on building confidence in moving.
h. Establish processes to support young people in critical transitions between
educational settings and between education and community physical activity
provision.
Using data to make the right decisions
Recommendation 3: Establish a toolkit based on the National Obesity Observatory’s
standard evaluation framework for physical activity to monitor and evaluate young
people’s participation in physical activity.
432. One of the objectives of the project was to provide a specific recommendation on
measuring young people’s participation in physical activity. Currently, there is no
consistent method for this taking place in the boroughs or from other agencies.
Detailed data on who is taking part in what and for how long can help organisations
171
understand participation, providing greater knowledge on how to increase it. Further
detail discussing this objective is set out in appendix M.
Addresses needs: 1.
Lead service: Public health.
This recommendation has implications for:
Camden and Islington council’s commissioners and policymakers from play, youth,
leisure and school improvement services.
Timeframe: Short to medium term.
Solutions:
a. Establish agreement to use and implement the tool-kit across all services that
commission physical activity projects.
b. Make use of the tool-kit a condition for all commissioned projects.
c. Ensure that all commissioned physical activity projects have an appropriate
budget to implement the toolkit to monitor and evaluate the project.
d. Encourage partner organisations to use the toolkit by providing resources and
training. Consider how the data that is collected is used to build knowledge
about sport and physical activity for young people.
e. Provide incentives to encourage partner organisations to utilise the toolkit e.g.
financial incentives or access to lower cost facilities for accurate
implementation and data reporting.
Recommendation 4: Collate and integrate data across services on young people’s
participation in physical activity.
433. Accurate information regarding a user’s (in this case young people) behaviour is a
crucial element of any effective supply chain and is critical to being able to plan and
successfully invest resources accordingly. The production of this research was made
more difficult by the lack of information available about young people’s physical activity
habits. While many services within the councils, and their commissioned leisure
contractors, collate data about when and how young people are being physically
active, it has been found that this is often inconsistent and incomplete.
Addresses needs: 1.
172
Lead service: Leisure.
This recommendation has implications for:
Camden and Islington policymakers in services such as public health, youth, play,
parks and open spaces and schools improvement.
Leisure contractors commissioned to deliver on behalf of the councils.
Timeframe: Medium to long term.
Solutions:
a. Identify all services collating and holding information on young people’s physical
activity behaviour.
b. Initiate the project within a small geographic area to help understanding of what
systems are already being utilised across services.
c. Find an integrated system that works across facilities and mobile devices for use
by outreach workers.
d. Consider how it can be integrated with existing systems that leisure contractors
may be utilising.
e. Implement the system with the potential of rolling out to wider commissioned
partners to support the implementation of the monitoring and evaluation framework
set out in recommendation 2.
Getting the right message across
Recommendation 5: Raise awareness of the recommended levels of physical activity
for young people to be healthy.
434. Research shows that the large majority of young people are not meeting the CMO’s
guidelines for physical activity. In particular, girls, disabled young people and those
from a Bangladeshi background are failing to meet the guidelines. It is also apparent
that as young people age, the less likely they are to meet them. Evidence also
suggests that young people know physical activity is good for their health yet don’t
appear to be aware of the recommended levels. Parents, peers and others that work
with young people have an influence on young people’s physical activity behaviour.
However, they too are not aware of the CMO guidelines.
435. An increasing body of evidence suggests that the amount of time young people spend
in sedentary activities is at least as important, in terms of a young person’s health, as
the amount of time spent undertaking physical activity. National research shows that
173
those from lower income homes spend more time participating in sedentary activities
than those with higher incomes. Raising awareness of recommended physical activity
levels should include communicating the health risks to excessive sedentary activity.
Addresses needs: 6, 7, 8, 11, 12, 13, 14, 15, 18, 22, 28, 30.
Lead service: Public health.
This recommendation has implications for:
Health and wellbeing boards.
Children’s trusts.
Clinical commissioning groups.
Pro-Active Camden and Pro-Active Islington.
Camden and Islington council’s commissioners and policymakers from play, youth,
leisure services and parks and open spaces.
Timeframe: Short, medium and long term.
Solutions:
a. Any efforts to raise awareness need to be focussed on informing the following
groups of the amount of physical activity recommended by the CMO (and its health
benefits) for young people:
Parents/carers.
Policymakers.
GPs.
Teachers.
Early years practitioners.
All other people working directly with young people.
b. Train all people working with young people on key messages about the levels of
physical activity that young people should achieve.
c. Utilise existing campaigns such as Change for Life and Nike’s Designed to Move.
Link into existing communication plans and actions of Pro-Active Camden and Pro-
Active Islington.
d. A coordinated campaign focussed on encouraging young people to be active
should also be established though messages should focus on motivators such as
activities being fun, social and done with friends and family.
174
e. The use of peer role models, mini-health champions, local community champions
and ‘celebrities’ (including elite athletes and personalities who can demonstrate
active behaviour) should be considered to spread the word among young people
about the importance of being active.
f. In line with solution ‘e’ (above), relevant Camden Council services should evaluate
the impact of the young ambassadors and mini-health champions projects as
possible models for creating peer ‘physical activity champions’ to influence activity
levels. These programmes should consider:
Including both ‘sporty’ and ‘non-sporty but active’ young people.
Establish key messages to help spread the word consistently.
Link young ‘physical activity champions’ into existing young people panels such
as the youth council.
g. Pro-Active Islington to consider the findings of Camden’s evaluation of young
ambassadors and mini-health champions projects and establish their own projects
if effective. Integrate with youth health trainer programme and health champion
scheme.
Recommendation 6: Improve the promotion and communication of physical activity
provision across the boroughs.
436. Young people lacked awareness of the physical activity opportunities that were
available to them. There is currently no coherent, single source of information where
young people can go to find out which activities were happening where and when.
437. Young people prefer to hear about opportunities for physical activity through word of
mouth. Related to the promotion of opportunities are the motivations and barriers
which affect young people when taking part in physical activity. In particular, perceived
time pressures, safety and the fun/social and learning/achievement elements of
physical activity are relevant to how it should be promoted. Young people need to be
aware of the breadth of physical activity options available to them, i.e. not just sport.
Finally, different barriers and motivations were found for different cohorts of young
people, suggesting a need for targeted promotion.
Addresses needs: 12, 13, 15, 19, 25, 29, 30, 35, 38, 51, 58, 63, 74, 81, 82, 83, 86,
96, 98, 108, 113.
Lead service: Leisure.
175
This recommendation has implications for:
Camden and Islington council’s services planning, delivering or promoting physical
activity opportunities to young people such as public health, play, youth and parks
and open spaces.
Pro-Active Camden and Pro-Active Islington members.
Communication departments of councils.
Marketing departments of leisure contractors.
Community providers of physical activity opportunities.
Children’s centres and schools.
Timeframe: Short to medium term.
Solutions:
a. Focus promotion and communication of opportunities and facilities on the following
messages for parents/carers and young people:
How to fit it into your day.
Why it is important for the health of young people.
How to get involved safely.
Finding affordable opportunities.
Showing the breadth of ways to be physically active including through active
travel and informal play (i.e. not just sport).
b. Communication and promotion should capitalise on the particular motivations some
young people have for being active including:
Having fun and socialising.
Enhancing their body image.
Learning and achievement.
c. The evidence suggests that there should be an increased focus on promoting
facilities and opportunities in a manner which appeals to secondary aged girls,
disabled young people and young people from a Bangladeshi background.
d. Establish a single source of consolidated information that is easily accessible,
extensive in its content and covering as wide a range of opportunities as possible
from across the public, voluntary and private sectors. This information source
needs to include opportunities that are most in demand and cover the following
areas in detail:
The date, time, cost and venue details.
Who the session is targeted at.
176
Explanation of activity.
Contact details.
e. Utilise the local physical activity pathway delivery pilots (proposed in
recommendation 1) in each borough to:
Bring together key council services, leisure contractors and community
providers to cooperate on improving promotion of all opportunities to be active
in the area.
Establish how best to improve promoting the most popular activities that young
people would like to do.
Share the expertise of leisure contractors with other community providers
(where competition is not an issue).
Test and evaluate word of mouth approaches (that can be scaled up) to
promote opportunities.
Explore how parents/carers can be supported to inform young people about
local opportunities to be physically active.
Explore using young physical activity champions within schools.
The groups should include youth workers, engagement officers, teachers, early
years practitioners and local coaches to help them know what is taking place
locally.
f. Attach a ring-fenced promotional budget to all physical activity commissions.
g. Implement positive signs in and around community physical activity facilities that
encourage and inform people about how they could be active in that space.
Places to be active
Recommendation 7: Improve the quality, range and appropriateness of facilities and
other places for physical activity.
438. As both boroughs are densely populated, space for young people to be active is at a
premium. Evidence from the areas explored through CHESS scans suggests that
those parts of the boroughs lack a range of high quality, age-appropriate facilities14 for
young people to be active in. Some of the CHESS zones also had limited facilities
available to certain groups. These included facilities targeted at teenagers generally
14 *(e.g. leisure centres, community venues, green and open spaces).
177
and indoor spaces available for girls. Many of the outdoor facilities reviewed by young
people in the CHESS zones were deemed in need of improvement.
439. Young people and parents/carers have indicated a number of factors with regards to
the improvement of the facility stock that would help get more young people active.
The factors included having a choice of facilities, perception that the facility is safe,
playground equipment being high quality and varied and facilities being local.
Addresses needs: 46, 47, 52, 54, 55, 56, 60, 65, 67, 68, 72, 73, 76, 79, 85, 87, 90,
91, 92, 105.
Lead service: Leisure.
This recommendation has implications for:
Camden and Islington councils’ services that plan, design and fund physical activity
facilities such as public health, play, youth, parks and open spaces, planning,
housing, regeneration, school improvement and transport.
Facility owning community providers of physical activity opportunities.
Pro-Active Camden and Pro-Active Islington members.
School management teams.
Timeframe: Short to medium term.
Solutions:
a. Influence existing facility refurbishment strategies to improve and maintain the
quality of appropriate facilities for different cohorts of young people. Take into
account improvement actions and evidence from CHESS (further detail can be
found in individual CHESS reports). Also consider:
Undertaking footfall/user research at children’s playgrounds to understand who
uses them and how.
The creation of more indoor space for physical activity for young people.
Explore the feasibility of overhead covering of multi-use games areas to
increase usage during poor weather and winter months.
Improving the variety and choice of equipment at children’s playgrounds.
Design of playgrounds for under 5s and under 11s need to have greater
emphasis on physical activity utilising factors set out in paragraph 355 and
feedback from focus groups with parents listed in paragraph 354.
178
Making multi-use games areas suitable for more activities including marking
them out for a range of different sports/activities.
Using the characteristics of assets that are popular to inform improvements.
Collaborating with the local community on developments.
The needs of different cohorts of young people when planning what age
group(s) the facility will be aimed at and how it will be designed.
Locating any new facilities in residential areas and on popular thoroughfares for
children and parents e.g. near schools or children’s centres.
b. Seek contribution for the development and refurbishment of facilities for physical
activity through planning Section 106 and the Community Investment Levy.
c. Link Active Spaces playground developments to findings from the CHESS reports
and consider placing an Active Space in each of the following CHESS zones:
Camden – Surma Centre, Somers Town and QCCA.
Islington – Platform and Lift.
d. Influence the development of lanes exclusively for cyclists in areas around schools
and other key community facilities to encourage more young people to cycle to
school.
Recommendation 8: Ensure young people have more access to all community assets.
440. In the areas explored through CHESS, the young people identified a number of issues
that prevented or could prevent their use of physical activity facilities such as children’s
playgrounds and multi-use games areas. These issues included facilities being poorly
lit, locked, situated within gated communities and signs which create a negative
perception of the facility e.g. signs warning against drug use.
441. The evidence also suggests the need to improve access for young people to school
facilities outside of the school day and to facilities that are hired out to other users at
key times of the day. Furthermore, young people indicate reluctance to travel to
access facilities outside of their local area.
Addresses needs: 17, 42, 44, 53, 59, 71, 75, 84, 89.
Lead service: Leisure.
This recommendation has implications for:
Camden and Islington services such as youth, play, parks and open spaces and
school improvement.
179
School governors and management teams.
Leisure contractors and other community organisations that control access to local
facilities.
Timeframe: Short to medium term.
Solutions:
a. Address the specific access issues found at facilities within CHESS zones and set
out in specific CHESS reports.
b. Influence schools to open up facilities for young people to use outside school
hours. Explore how funding programmes such as Sport England’s Satellite Club,
Active Spaces and Sportivate can be utilised to incentivise schools.
c. Maximise the availability and use of appropriate facility space for young people
across CHESS zones. This should include:
Extending the hours available (of sites that can be booked for private use) for
organisations offering young people physical activity opportunities.
Working with leisure contractors and community providers to make more indoor
space available for opportunities to young people in the winter months.
Ensure that there is sufficient access to the activities in most demand from
young people.
d. Work with community providers to establish their needs for spaces/facilities to be
able to increase their supply of physical activity opportunities to young people.
Consider:
The needs of youth clubs, sports clubs, schools, SEN schools and other
community providers.
The pricing of the space to make it more accessible to more groups.
A suitable workforce
Recommendation 9: Develop the workforce so that it is better able to engage with and
respond to the physical activity needs of all young people.
442. Coaches, teachers, leaders, youth workers and play workers all play an important role
in supporting young people to fully engage in physical activity. These people directly
delivering physical activity opportunities to young people play a crucial role in shaping
the young person’s perceptions of their competence and confidence in being physically
active. They are also able to positively impact on the young person’s views of their
180
experience, and engagement, in being physically active. The organisations that
employ these people recognise their importance and suggest they require better
access to more people with the right skills and qualifications if they are going to grow
provision. This is particularly the case for organisations working directly with disabled
young people. The research also found that some young people value coaches and
leaders with the empathy and social skills to engage with them over and above
technical proficiency in delivering a specific activity.
Addresses needs: 21, 23, 24, 37, 49, 104, 110.
Lead service: Leisure.
This recommendation has implications for:
Pro-Active Camden and Pro-Active Islington members.
Camden and Islington council’s services commissioning and delivering physical
activity opportunities to young people such as play, youth, leisure services, public
health, parks and open spaces.
Children’s centres.
Schools.
Youth centres.
Leisure contractors.
Community providers of physical activity opportunities.
Timeframe: Medium to long term.
Solutions:
a. Undertake a workforce skills assessment and establish a workforce development
plan that:
Includes both paid and unpaid roles.
Is focussed on the broad range of people that can support young people to be
physically active including activity leaders, coaches, teachers, early years
practitioners and youth workers.
Identifies both technical and social skills required to effectively work with young
people of all ages.
Improves training for volunteers in clubs and community organisations.
Links to existing workforce development plans for those working with young
people.
181
b. Implement measures to improve the standard of coaching provision, including:
Minimum standards based on Sports Coach UK recommendations including
the need for a young person specific qualification/module.
Regular monitoring and evaluation of performance.
Placing an emphasis on creating an appropriate coaching workforce who are
sympathetic to these needs rather than focussed on sporting performance.
c. Establish young sport leader programmes across schools and youth centres. A
focus should be on teenage girls (healthy lifestyles leadership) and disabled young
people.
d. Recruit more people to support the delivery of physical activity opportunities and
implement training to provide clear guidance around expectations and strategies,
including:
Both paid and unpaid roles.
Youth workers.
More female coaches.
More activity leaders.
More coaches/leaders with the skills to work with disabled people.
Recruiting more leaders able to lead the delivery of the most popular activities
that young people would like to do.
e. Establish (and grow) apprenticeships for young people to help them enter the sport
and physical activity workforce.
Opportunities for all
Recommendation 10: Make more activities more affordable
443. The views of young people and parents suggest that a number of young people cannot
afford the cost of existing physical activity facilities and provision available to them.
While there is evidence of some free and low cost activities within the CHESS zones, it
would appear that the scale of this is limited. Some young people and families require
specific support to help them afford the cost of available activities. This is particularly
the case for disabled young people and families with multiple siblings. Some facilities
or activities are unaffordable to disabled young people due to transportation costs.
Addresses needs: 26, 27, 34, 36, 66, 80, 95, 109.
Lead service: Leisure.
182
This recommendation has implications for:
Camden and Islington services providing physical activity facilities and provision
such as youth, play and parks and open spaces.
School management teams.
Leisure contractors.
Clubs and community providers.
Timeframe: Short term.
Solutions:
a. Expand the use of discount cards (COO-L/Free Izz cards) for targeted groups to
give greater discounts to broaden access. Possible target groups include:
Teenage girls.
Disabled young people.
Those in complex families.
NEETS (utilised as an incentive).
Those on free school meals and low incomes.
b. Expand access to free/very low cost physical activity opportunities in key facilities
in the CHESS zones.
c. Work with leisure contractors and the community sector to:
Establish ‘family friendly’ affordable pricing and offer discounts for
parents/carers with multiple children.
Develop affordable opportunities for parents and children (under 5s and 0-11s)
to be active together. Consider using children’s centres as hubs.
Utilise promotional techniques such as ‘bring a friend’ promotions to encourage
more young people to take part in opportunities.
d. Explore the feasibility of reducing the lower age of the Give It a Go programme in
Camden. This should be specifically focussed on reaching inactive teenagers and
exploring the feasibility of establishing a family offer.
Recommendation 11: Create more, and a greater choice of, physical activity
opportunities.
444. Greater supply of structured activities would help more young people meet CMO
guidelines on physical activity. Working on the basis that young people need to
undertake an hour’s physical activity per day, current levels of structured activity were
found to be too low to meet this demand.
183
445. Many outdoor facilities are considered to be under-used with young people often
stating that structured provision would encourage their use. It was also found that
there was less provision targeted at teenagers. Analysis of the activities demanded by
young people suggests that provision should be targeted at different groups, that
young people enjoy variation and are keen to try new activities.
Addresses needs: 41, 45, 50, 55, 61, 62, 69, 70, 77, 78, 79, 86, 92, 93, 94, 111, 112.
Lead service: Leisure.
This recommendation has implications for:
Pro-Active Camden and Pro-Active Islington members.
Camden and Islington council’s services commissioning and delivering physical
activity opportunities to young people such as play, youth, public health, parks and
open spaces.
Leisure contractors.
Community providers of physical activity opportunities.
Children’s centres.
Schools.
Youth centres.
Timeframe: Short term.
Solutions:
a. Support the local physical activity pathway delivery pilot in each borough to
establish a clear picture of supply through a full audit. Including:
Leisure contractors.
Schools.
Youth clubs.
Sports clubs.
Colleges.
Community groups and charities.
b. Establish a coordinated approach to the use of young people-focussed investment
in sport (such as Sportivate, Satellite Club funding and Primary School Sport
Premium):
Secure match funding.
Invest in activities that young people want to do.
184
Involve youth workers in planning and implementation.
Explore whether using the local physical activity pathway delivery pilot in each
borough is a suitable mechanism for coordinating this funding.
c. Expand delivery on estates, in areas of social housing and other priority locations
(some locations are identified in the full CHESS reports). Consider:
Use of multi-use games areas.
Most appropriate providers.
Variety of provision.
Multi-activity provision.
Age appropriateness.
Making provision fun and social.
The activities that are in demand from young people.
d. Increase provision in educational settings/facilities. Consider:
Schools/colleges and children centres.
‘Attaching’ multi-skills/sport coaches/leaders to designated children’s centres or
primary schools.
Funding for specialist PE teachers at key primary schools.
Linking voluntary sport clubs to schools.
e. Target any new provision to ensure it doesn’t just provide a further opportunity for
the sporty cohort of young people. Consider commissioning appropriate suppliers
from within the communities such as Access to Sport, Street Games and Arsenal
FC.
f. Influence providers to make available a greater variety of activities in local areas.
Consider:
Utilising evidence of demand for activities.
Creating greater weekend provision for families and young people across the
boroughs particularly through leisure contractors.
g. Work with schools and GPs to identify high-risk inactive young people. Expand
specialist provision and interventions available such as Change for Life clubs and
Exercise on Referral.
h. Identify events and festivals (those with and without a physical activity focus) and
identify how they can be used to provide opportunities to take part in and promote
physical activity.
i. Explore how to instigate greater cycling within the borough. Consider:
Use of parks and open spaces for cycling events.
Using cycle leaders to cycle with young people to school along busier routes.
185
j. Create and test a model for providing small ‘seed-corn’ budgets to groups of young
people to get their peers/friends more active. Consider:
Implementing through key youth centres.
Match funding from other funding streams.
Recommendation 12: Ensure provision is high quality, appropriate and tailored to the
differing needs of young people.
446. Young people have a variety of needs when it comes to physical activity opportunities
and these should be reflected by the provision that is available. Consideration must be
given to catering to a range of skill levels, providing a chance for competition for some,
but not others and for learning and achievement, but again, not for all. The need to
provide social and fun physical activity also came out strongly from research. Safety is
a key concern for young people as is the need for families to be able to take part in
physical activity together.
Addresses needs: 19, 20, 29, 31, 33, 40, 43, 46, 48, 49, 65, 68, 85, 91.
Lead service: Leisure.
This recommendation has implications for:
Pro-Active Camden and Pro-Active Islington members.
Camden and Islington council’s services commissioning and delivering physical
activity opportunities to young people such as play, youth, public health, parks and
open spaces.
Leisure contractors.
Community providers of physical activity opportunities.
Children’s centres.
Schools.
Youth centres.
Timeframe: Medium to long-term.
Solutions:
a. Work with existing providers of physical activity opportunities to young people
(possibly through the local physical activity pathway delivery pilot in each borough)
to review and identify how existing provision meets the needs of different cohorts of
young people across the borough. Consider:
186
Target age.
Target groups.
Facilities used.
Whether emphasis is social or for beginners.
Whether young people (and parents/carers) view the provision as safe.
b. Influence leisure contractors to develop programming in conjunction with:
Young people from the local area.
Other community providers.
Youth workers.
c. Camden Council to commission its own version of the Saturday Night Project
(SNP) that provides a regular, large scale and safe opportunity for teenagers to
socialise and be active. Build young person involvement into the design process.
d. Islington Council to build on the success of the SNP. Consider:
Introducing another event in the borough or develop smaller derivatives of the
SNP (e.g. dance competitions) at regular intervals.
Build young person involvement into the design process.
Consider the use of outdoor urban spaces and parks – make the events feel
unique.
e. Expand the amount of existing and new provision that is focused on ‘enjoyment
through socialising’ or ‘hanging out with mates’ as the primary focus. Co-produce
this provision with young people.
f. When developing physical activity programmes, identify whether the social aspect
is a primary driver. If it is, consciously develop the programme/project to meet this
need rather than focussing on the delivery of the physical activity.
g. Identify opportunities for physical activity provision to be linked to other areas of
interest to young people such as arts, music and fashion through existing events
and providers.
h. Involve young people in the commissioning and decision making processes
regarding provision of physical activity.
i. Put in place policies to ensure all funding is awarded to partners that can evidence
consultation and engagement with parents and young people. Identify and share
effective practice of involving young people in consultation and decision-making.
Make this available to providers.
j. Explore creating ‘social spaces’ for young people that encourage them to
congregate informally and be active.
187
Reducing inequalities
Recommendation 13: Increase levels of physical activity among girls.
447. The physical activity levels of girls are significantly lower than boys and this activity
gap increases with age. Girls also prioritise being active less than boys, as well as
having a lower preference for taking part in physical activities as opposed to other
activities. Research shows a significant reduction in physical activity levels at the early
secondary school ages. At this age, girls experience particular barriers to being active
that are related to confidence, body image and self-consciousness. There is a need to
take action to address these issues, which may centre on the types of activities
provided, the way they are promoted and the types of facilities they take place at.
Addresses needs: 9, 23, 24, 32, 39, 57, 83, 88, 100.
Lead service: Public health.
This recommendation has implications for:
Pro-Active Camden and Pro-Active Islington members.
Camden and Islington council’s services commissioning and delivering physical
activity opportunities to young people such as play, youth, leisure services, public
health, parks and open spaces.
Children’s centres.
Schools.
Youth centres.
Leisure contractors.
Community providers of physical activity opportunities.
Timeframe: Short, medium and long-term.
Solutions:
a. Undertake a specific, targeted campaign to raise physical activity levels amongst
girls that:
Is mindful of presenting physical activity in an appropriate way – fun, easy and
social.
Articulates the available supply.
Is sensitive to the barriers for girls such as self-consciousness and lack of
confidence.
188
Focuses on secondary school age.
Considers links with national campaigns that can help support this target group
such as Changing the Game for Girls.
b. Utilise the evidence from this project to inform the Pro-Active Camden and Pro-
Active Islington action on provision for girls. Particularly:
Regarding the type of activities girls would most like to do.
Using indoor space.
The motivators and barriers for girls.
c. Increase age-appropriate provision for girls. Consider:
The findings about the most popular activities that girls would like to try.
Using indoor space to address barriers around self-perception.
The use of dance and other performing arts.
Achievement/recognition-focussed opportunities e.g. working towards an
award.
d. Capitalise on the significant number of providers that are already specifically
targeting girls to expand the provision of ‘girls-only’ sessions.
e. Commissioners and budget holders to refocus resources on the development of
new physical activity opportunities for girls. Explore opportunities to access
external funding to provide additional resource.
f. Any new interventions should include supporting girls to establish the confidence in
the fundamental movement skills to help them stay active for life.
g. Establish a programme for identifying and utilising positive female role models that
demonstrate the right active lifestyle behaviour. This should include taking action to
recruit and train more female coaches and activity leaders.
Recommendation 14: Increase levels of physical activity among disabled people.
448. Research found that disabled young people have lower levels of physical activity than
non-disabled young people. It was found that they encountered more barriers to
physical activity than their non-disabled peers, including difficulty accessing facilities,
transport, a lack of opportunities and staff/leaders who can cater for their specific
needs. It was also found that there was a lack of information available on opportunities
for young disabled people to be active.
Addresses needs: 10, 11, 34, 37, 39, 51, 100.
Lead service: Leisure.
189
This recommendation has implications for:
Pro-Active Camden and Pro-Active Islington members.
Camden and Islington council’s services commissioning and delivering physical
activity opportunities to young people such as play, youth, leisure services, public
health, parks and open spaces.
Children’s centres.
SEN schools.
Youth centres.
Leisure contractors.
Community providers of physical activity opportunities.
Timeframe: Short, medium and long-term.
Solutions:
a. Budget holders to refocus resources to provide greater emphasis on the
development of new provision for disabled young people. Explore opportunities to
access external funding to provide additional resource.
b. Facilitate discussions between SEN schools and organisations for disabled people
with providers (including leisure contractors). This should:
Identify what physical activity provision is already available.
Include action to increase age appropriate provision for disabled young people.
Address concerns with existing supply such as pool temperature and skills of
those working with disabled people.
Be incorporated into Inclusive and Active 2 plan.
c. Utilise the evidence from this needs assessment to inform the Pro-Active Camden
and Pro-Active Islington action on provision for disabled young people. The
particular barriers that disabled young people face around lack of support, access
to facilities and available activities should be addressed.
d. Camden Council to ensure Sport England funded disability project positively
impacts disabled young people as well as adults.
e. Utilise disability specialist organisations (e.g. Panathlon, Disability Sports Coach,
EFDS) to provide specialist training on working with young people with different
needs to:
Coaches/activity leaders.
Leisure attendants.
Lifeguards.
Early years practitioners.

190
SEN school teachers.
191
References
Section Six
Section 1: Introduction
1. Department for Culture, Media & Sport (2012). Inspiring a generation: A taking part report on the 2012 Olympic and Paralympic Games. Department for Culture, Media & Sport; London UK.
2. Department of Health (2011). Start Active, Stay Active: A report on physical activity from the four home countries’ Chief Medical Officers. The Department of Health; London, UK.
3. Sport England (2012). Improving Health Through Participation in Sport: a review of
research and practice. Sport England; London, UK.
4. Health Survey of England (2008). National Centre for Social Research; London, UK.
5. Economic costs of inactivity (2013). British Heart Foundation for Physical Activity and Health; Loughborough, UK
6. Sport England local area profile [online]. Available from www.sportengland.org
7. Culture and Sport Evidence Programme (2010). Understanding the impact of
engagement in culture and sport: A systematic review of the learning impacts for young people. Department for Culture, Media and Sport; London, UK.
8. HM Treasury & Department for Children, Schools and Families (2007). Aiming high
for young people: a ten-year strategy for positive activities. HM Treasury & Department for Children, Schools and Families; London, UK.
9. Allender, S. et al. (2006). Understanding participation in sport and physical activity among children and adults: a review of qualitative studies. Health Education Research, Theory & Practice, vol.21 no.6.
Section 2: The strategic context
1. World Health Organization (2010). Global recommendations on physical activity for health. WHO Press; Geneva, Switzerland.
2. Department of Health (2011). Start Active, Stay Active: A report on physical activity from the four home countries’ Chief Medical Officers. The Department of Health; London, UK.
3. HM Treasury (2003). Every Child Matters. The Stationery Office; London, UK.
192
4. Department of Education (2012). Statutory framework for the early years foundation
stage. Department of Education; London, UK.
5. Department of Education (2011). Positive for Youth: A new approach to cross-government policy for young people aged 13 to 19. Department of Education; London, UK.
6. Department for Education (2013) http://www.education.gov.uk/ schools/ adminandfinance/ financialmanagement/primary
7. Marmot, M (2010). Fair Society, Healthy Lives: The Marmot Review. The Marmot
Review, London, UK.
8. Department of Health (2010). Healthy Lives, Healthy People: Our strategy for public health in England. Department of Health, London, UK.
9. Department of Health (2011). Healthy Lives, Healthy People: A call to action on obesity in England. Department of Health; London, UK.
10. Department of Health (2012). Healthy Lives, Healthy People: Improving outcomes
and supporting transparency. Department of Health; London, UK.
11. National Institute for Health and Clinical Excellence (2006). Four commonly used methods to increase physical activity: NICE public health guidance 4. NICE, Manchester, UK.
12. National Institute for Health and Clinical Excellence (2008). Physical activity and the environment: NICE public health guidance 8. NICE, Manchester, UK.
13. National Institute for Health and Clinical Excellence (2009). Promoting physical activity for children and young people: NICE public health guidance 17. NICE, Manchester, UK.
14. National Institute for Health and Clinical Excellence (2012). Walking and cycling: local measures to promote walking and cycling as forms of travel or recreation: NICE public health guidance 41. NICE, Manchester, UK.
15. Department for Communities and Local Government (2011). A plain English guide to the Localism Bill. DCLG, London, UK.
16. Department for Culture, Media and Sport (2010). Plans for the Legacy from the 2012 Olympic and Paralympic Games. DCMS, London, UK.
17. Department for Culture, Media and Sport (2012). Creating a Sporting Habit for Life: A New Youth Sport Strategy. DCMS, London, UK.
18. PRO-ACTIVE Central London (2013). About PRO-ACTIVE Central London. Available at [www.pro-activecentrallondon.org].
19. The Mayor of London (2009). A sporting future for London. Greater London Authority, London, UK. Available from [http://www.london.gov.uk/priorities/sport]
193
20. Inclusive and Active 2. A sport and physical activity strategy for disabled people in London 2010-2015. Greater London Authority, London, UK. Available at [http://www.interactive.uk.net]
21. Office for National Statistics (2011). Census for England and Wales.
22. London Borough of Camden (2010). Joint Strategic Needs Assessment.
23. London Borough of Islington (2011). Joint Strategic Needs Assessment.
24. Camden Council (2012). The Camden Plan 2012-2017. Camden Council, Camden, UK.
25. Camden Children’s Trust Partnership Board (2012). Change for Children and families: Delivering the Camden plan. London, UK.
26. Pro-Active Camden (2009). Sport and physical activity strategy. Camden, UK.
27. Camden’s shadow health and wellbeing board: Health in Camden - joint health and wellbeing strategy 2012 to 2013.
28. NHS Camden Clinical Commissioning Group (2013). 2013-14 Prospectus. Camden, UK.
29. Camden’s Equality Taskforce (2013). Camden’s Equality Taskforce Final Report. Camden Council, Camden, UK.
30. Islington Strategic Partnership (2008). Our Vision for 2020 – the Islington we want to be. Islington Strategic Partnership, London, UK.
31. The Islington Fairness Commission (2011). Closing the gap - The final report of the Islington Fairness Commission. The Islington Fairness Commission, London, UK.
32. Children and Families Partnership (2011). A fair chance in life for all – Islington Children and Families Strategy 2011-15. Islington Council Children’s Services, London, UK.
33. Islington’s Shadow Health and Wellbeing Board (2013). Islington’s Joint Health and Wellbeing Board Strategy 2013-2016. London Borough of Islington, London, UK.
34. Islington CCG (2013). Islington CCG High Level Commissioning Intentions for 2013/14. Islington CCG, London, UK.
35. Islington CCG (2013). Our Vision, Mission Statement and Objectives. Available at http://www.islingtonccg.nhs.uk/about-us/vision.htm
36. Regeneration, Strategy and Partnerships (2011). Towards a fairer Islington: corporate plan 2012- 2015. London Borough of Islington, London, UK.
194
37. ProActive Islington (2012). The ProActive Islington strategy 2012-2017. NHS North Central London and London Borough of Islington, London, UK.
Section 3: Methodology
1. Sport England, Active People Survey
Section 4: Findings
1. Department for Health (2011). Start Active, Stay Active: A report on physical activity from the four home countries’ Chief Medical Officers. The Department for Health; London, UK.
2. Health Survey of England (2008). National Centre for Social Research; London, UK.
3. Department for Children, Schools and Families (2009). PE and Sport Survey
2009/10: Children and young people’s participation in sporting opportunities.
Department for Children, Schools and Families, London, UK.
4. Department for Culture, Media and Sport (2011). Taking Part: The National Survey of
Culture, Leisure and Sport. Department for Culture, Media and Sport, London, UK.
5. Mulvihill, C et al. (2000). Qualitative research among young people aged 5-15 years
and parents. Health Education Authority, London, UK.
6. Department for Transport (2012). National Travel Survey: 2011. Department for
Transport, London, UK.
7. Street Games (2013). Scoping Exercise Into Young People’s (14-16) Attitudes &
Engagement In Sport. Street Games.
8. Sport Wales (2009). Young people’s participation in sport (2009), no.62. Available on
line from www.sportwales.org.uk [accessed 4 April 2013]
9. Dagkas, S. & Strathi, A. (2007). Exploring social and environmental factors affecting
adolescents’ participation in physical activity. European physical education review.
10. Allender, S. et al. (2006). Understanding participation in sport and physical activity among children and adults: a review of qualitative studies. Health Education Research, Theory & Practice, vol.21 no.6.
11. Nicholson, L (2012). Development of key themes for physical activity promotion for
the early years, children and young people. Health Scotland, Scotland.
12. Rankin, M. (2012). Understanding the barriers to participation in sport. English
Federation of Disability Sport [online]. Available from www.efds.co.uk [accessed 28
March 2013]
195
13. Sport England, Unpublished research [accessed March 6th 2013]
14. Women’s Sport and Fitness Foundation (2009). Barriers to sports participation for
women and girls [online]. Available from www.wsff.org.uk [accessed 28 March 2013].
15. Lamb, D (2013). Camden Active Spaces – input into the psychology research
requirements [unpublished].
16. Pro-Active Camden (2009). Sport and physical activity strategy. Camden, UK.
17. Department for Culture, Media & Sport and Department for Children, School &
Families (2008). PE and Sport Strategy for Young People. Department for Culture,
Media & Sport and Department for Children, School & Families, London, UK.