Extractive Industries in Arid and Semi-Arid Zones - IUCN Portal

A SPATIAL ASSESSMENT OF RIVERINE ECOSYSTEMS AND WATER SUPPLY IN ASEMI-ARID ENVIRONMENT
L. B. SMITH-ADAO,a* J. L. NEL,a D. LE MAITRE,a A. MAHERRYa and E. R. SWARTZb
a CSIR, Natural Resources and the Environment, PO Box 320, Stellenbosch 7599, South Africab South African Institute for Aquatic Biodiversity, Private Bag 1015, Grahamstown 6140, South Africa
ABSTRACT
A spatial assessment was conducted in the semi-arid area of South Africa, to: (1) identify priority areas for the conservation of river andgroundwater ecosystems; (2) examine surface and groundwater quality for human consumption and (3) investigate the rehabilitation ofdegraded areas to highlight ‘win-win’ situations for both environmental and human use. A systematic conservation plan was produced,highlighting river conservation areas (river types, fish species and connectivity areas), moderate-impact management areas(groundwater-surface water interaction and recharge areas) and river rehabilitation areas. The proposed river selections wouldachieve the biodiversity targets of 33 (66%) of the 50 river types; feasible rehabilitation would increase this to 92%. The greatestgroundwater-surface water interaction and recharge (30 to> 50mm!1) values are concentrated around the mountainous regions of theLittle Karoo. This is because the main aquifers in the mountains, table mountain group (TMG) quartzites, yield naturally good qualitywater for human consumption. River reaches of unacceptable surface water quality were classified as degraded water resource deliveryareas where the poor water quality was primarily due to saline return flows from irrigation and the impacts of other anthropogenicactivities including abstraction of freshwater which otherwise would have diluted the return flows. Only the middle reaches of theGouritz and Groot Rivers represent a possible win–win situation for both the environment and human use. Copyright # 2010 JohnWiley & Sons, Ltd.
key words: semi-arid; biodiversity; conservation planning; water quality; water resources
Received 20 October 2009; Revised 23 March 2010; Accepted 10 May 2010
INTRODUCTION
Growing demand for water, driven by economic devel-opment, rising living standards and growth in humanpopulation (Gleick et al., 2004; Zeman et al., 2006) haveresulted in widespread degradation of freshwater ecosystemsespecially in arid regions. Here, the term ‘freshwater eco-system’ refers to all inland water bodies whether saline orfresh, including lakes, wetlands, rivers, groundwater andestuaries (Nel et al., 2008). There is now compellingevidence that freshwater ecosystems are among the mostendangered ecosystems worldwide with few retainingtheir original functional condition (Jenkins, 2003; Nilssonet al., 2005; Dudgeon et al., 2006). The situation is furthercompounded by global climate change which presents a newuncertainty in the provision of water resources, potentiallyescalating the existing level of freshwater stress and the needfor further infrastructure to improve water availability forhuman use (Malmqvist and Rundle, 2002; Kiparsky andGleick, 2004).The degradation of freshwater ecosystems and loss of
biodiversity inevitably leads to the loss of ecosystem
services (MA, 2005). Replacing ecosystem services withtechnological substitutes, such as water purification plantsor desalination can be very expensive (Heal, 2000; Tilmanet al., 2002). It is therefore in society’s best interest to ensurethat freshwater ecosystems are allocated an adequate supplyof good quality of water to sustain their health, functioningand benefits to humanity (Tharme, 2003; Arthington et al.,2006). Whilst it is not always possible to allocate most of thewater for the conservation of freshwater ecosystems, it isequally undesirable and unsustainable to utilize all fresh-water ecosystems to their maximum potential (Dynesiusand Nilsson, 1994; Rodrıguez et al., 2006). Such trade-offsbetween conservation and utilization must be explicitlyconsidered in allocating freshwater for human use.An important aspect of examining trade-offs is to identify
priority areas for conservation so that they can be considered inplans for sustainable development of water resources.Systematic conservation planning is an applied field ofconservation science that provides tools for identifyingconservation priorities. The goal of systematic conservationplanning is to represent the full range of biodiversity in aregion and plan for its persistence (Margules and Sarkar,2007). Although pioneered in the terrestrial realm (Margulesand Pressey, 2000; Cowling and Pressey, 2003), severalsystematic freshwater ecosystem conservation assessments
RIVER RESEARCH AND APPLICATIONS
River Res. Applic. 27: 1298–1314 (2011)
Published online 28 June 2010 in Wiley Online Library(wileyonlinelibrary.com) DOI: 10.1002/rra.1427
*Correspondence to: L. B. Smith-Adao, CSIR, Natural Resources and theEnvironment, PO Box 320, Stellenbosch 7599, South Africa.E-mail: [email protected]
Copyright # 2010 John Wiley & Sons, Ltd.

and plans have emerged in recent years (Higgins, 2003; Linkeet al., 2007; Thieme et al. 2007; Roux et al., 2008; Nel et al.2009). However, far fewer conservation plans have beendeveloped for arid or semi-arid regions than for humid regions.
Semi-arid and arid areas are seldom seen as prioritiesfor research because of their harsh climates, widespreaddistribution and limited resources (Young and Kingsford,2006; Allsop et al., 2007). Yet, it is in a dry environmentwhere trade-offs can be particularly intense because rapidlyincreasing populations are reliant on very limited freshwaterresources and the need for more drinking water is parti-cularly acute (Davies et al., 1994; Kingsford, 2000; Kinget al., 2003). Unpredictable droughts of extended durationand high temperatures often compound this situation (King-sford, 2000; Young and Kingsford, 2006). Rivers in aridenvironments are also usually more dependent on ground-water input through discharge from aquifers that maintainsperennial flows (Murray et al., 2003; Boulton and Hancock,2006). Human activities in areas that have high recharge canhave a negative effect on the functioning of groundwaterdependent ecosystems (Boulton and Hancock, 2006).Identifying areas of high groundwater recharge allows forpro-active management of these deleterious activities. Gro-undwater sources should therefore receive special attentionin conservation management strategies for more aridregions.
The overall aim of the present study was to develop asystematic conservation plan for a semi-arid area in SouthAfrica and to identify areas of significance for biodiversity,surface water and groundwater supply and rehabilitation.The relationship and spatial congruence (i.e. overlap) bet-ween these factors were evaluated in order to assess howthey can ultimately be integrated with catchment manage-ment and conservation. Specifically, the objectives were to:
1. Identify spatial priorities for conserving river andgroundwater ecosystems.
2. Examine groundwater and surface water chemistry toidentify areas with suitable water for domestic use andareas that have been degraded through human activities.
3. Examine prospects for rehabilitating degraded areas tohighlight ‘win-win’ situations where rehabilitation objec-tives would satisfy both conservation and the provision ofgood quality water for human utilization.
This study limits the definition of ‘riverine ecosystems’ toriver and groundwater systems only, whether fresh or saline;other water bodies require further investigation and were notincluded in the analyses.
STUDY SITE CHARACTERIZATION
The study area is just over 47 000 km2 in southwestern SouthAfrica (Figure 1). The east-west oriented mountains of the
Langeberg and Outeniqua ranges in the south and theWitteberg and Swartberg ranges in the north, separate thestudy area into three distinct regions, Figure 1 (van Wyk andSmith, 2001). These regions are characterized by differentgeology, climate and vegetation.
The geology of the Great Karoo consists of Karoosediments such as Bokkeveld marine sediments and doleriticintrusions, resulting in rivers with high suspension loads andhigh salinity. The montane soils of the central Little Karooand southern coastal areas are derived from sandstones of theCape Supergroup, resulting in tributary streams that are clearwith low salinity. The main rivers of the Little Karoo drainover the shales of the Karoo sediments and remain similarin chemical characteristics to the upper reaches in theGreat Karoo. The shorter coastal rivers drain over shalesand tillites of the Cape Supergroup and are typically peatcoloured from the indigenous vegetation (CGS, 1997; RHP,2007).
Surface water runoff in terms of volume is predominantlyin the form of flash floods, but there is strong base-flowassociated with tributary streams that are fed from ground-water sources in the mountain ranges (Le Maitre et al.,2009). The Olifants, Groot and Gamka Rivers are the maintributaries of the Gouritz system (Figure 3). Mean annualprecipitation decreases from east to west, ranging frommore than 1500mm per year in the mountains and temperatecoastal areas to less than 200mm per year in the dry inlandareas (Midgley et al., 1994; DWAF, 2003). Mean annualevaporation ranges between 1300 and 1400mm.a!1 alongthe coast, increasing inland to 1800–2200mm.a!1 and2000–2600mm.a!1 in the central and northern parts of thecatchment, respectively. Mean annual runoff (MAR) of theGouritz catchment is in the order of 695 millionm3, 81% ofwhich stems from the Great and Little Karoo regions;the remainder originating in the rivers of the coastal belt(Midgley et al., 1994). Groundwater is a very importantsource of water in the drier areas for rural domestic use,stock watering and, to a lesser extent, irrigation. Sourcingand maintaining good quality ground water is thereforeimportant in these areas (Le Maitre et al., 2009).
Water utilization in the study area is high, and waterdemand for the year 2000 exceeded the available yield byalmost 10%. The available yield is defined as the volume(millionm3) of water that can be yielded by the existingwater supply schemes (e.g. dams, weirs) with a likelihood ofrunning dry in 1 to 50 years. This takes into account thecapacity of the dams and temporal variability of the flows,particularly during prolonged droughts (DWAF, 2004).
The natural vegetation in the study area has been degradedby overgrazing and transformed by cultivation (Thompsonet al., 2009). Land use in the arid areas consists of mainlysheep, ostrich and goat farming (Milton et al., 1997; Palmerand Hoffman, 1997; Herling et al., 2009). The Little Karoo
Copyright # 2010 John Wiley & Sons, Ltd. River Res. Applic. 27: 1298–1314 (2011)
DOI: 10.1002/rra
A SPATIAL ASSESSMENT OF RIVERINE ECOSYSTEMS AND WATER SUPPLY 1299

also has limited areas of irrigated land but irrigationaccounts for 75% of all the water demand in the GouritzWMA (Le Maitre and O’Farrell, 2008; Le Maitre et al.,2009).
METHODS
Data collation
We used a systematic conservation planning approach toidentify conservation priorities and to assess options thatwill allow long-term persistence of biodiversity (Margulesand Pressey, 2000; Margules and Sarkar, 2007). All sys-tematic approaches to conservation planning share threeprinciples. These are representation, persistence and quan-titative conservation target setting. Representation refers tothe need to sufficiently conserve the full array of biodiversityfeatures in a planning domain, whereas persistence requirespreservation of the natural processes that support andgenerate biodiversity (Nel et al., 2008). Spatial efficiency inachieving conservation targets is underpinned by the con-cept of complementarity in which priority areas are selectedto complement each other in their biodiversity content(Sarkar et al., 2006). In reviewing areas selected during
the conservation planning process, we also made use oflong-standing local expert knowledge in a diverse range ofresearch fields (botany, ecology, conservation science,hydrology, limnology and geomorphology). Geographicalinformation system (GIS) software was used to overlayseveral spatial datasets and to analyse spatial relationshipsamong biodiversity, water quality and groundwater sources.A single integrated GIS layer was then produced.Sub-catchments and river networks. We delineated sub-
catchments within the study area to use as planning units foridentifying priority areas. These are appropriate unitsbecause catchments integrate lateral connectivity (acrossaquatic-terrestrial gradients) and vertical connectivity(groundwater interactions) (Nel et al., 2006). Sub-catch-ments were modelled in GIS using Arc Hydro (ESRI, 2005),which combined a 90m digital elevation model (USGS,2003) with the 1: 500 000 rivers (DWAF, 2006).The consequences of combining these two GIS layers ofdiffering spatial resolution resulted in some regions of thestudy area having catchment boundary inaccuracies whichwere subsequently corrected manually. Catchment bound-aries were delineated around each river segment, where asegment was defined as the stretch of river betweenconfluences.We used the 1:500 000 rivers GIS layer (DWAF,
Figure 1. Study area location and land degradation map (Van den Berg et al., 2008; Thompson et al., 2009) for the coastal areas in the south (1), the inter-montane valley of the Little Karoo (2) and the Great Karoo in the north (3).
Copyright # 2010 John Wiley & Sons, Ltd. River Res. Applic. 27: 1298–1314 (2011)
DOI: 10.1002/rra
1300 L. B. SMITH-ADAO ET AL.

2006) as the river network for the conservation assessment,and supplemented this layer with an additional seven rivers,that were included by river experts based on their importancefor fish conservation and/or river health monitoring.
River condition. The condition of main rivers in the studyarea was assessed spatially using ecological status categoriesdeveloped for the national Water Situation AssessmentModel (Kleynhans, 2000), national river health programmedata and expert review. River condition assesses the degreeof ecological modification from the natural condition ordegree of intactness (Nel et al., 2008). Main rivers are thoserivers that pass through a quaternary catchment into abordering quaternary catchment, where quaternary catch-ments are similar to the US Geological Survey cataloguingunits (Nel et al., 2007). Six physical and biotic attributes(flow, inundation, water quality, stream bed condition, alieninvasive instream biota, riparian or stream bank condition)were examined in both instream and riparian habitatsaccording to six present ecological status categories(Table 1) which reflect varying degrees of river condition,from A (natural) to F (critically modified) as described byNel et al. (2009). For the purpose of this study, all mainrivers in category A or B were considered intact.
We modelled the condition of smaller streams based onthe proportion of remaining natural land cover in the sub-catchment. Where no other data exist, this has been used as aproxy at a sub-catchment level (Amis et al., 2007; Linkeet al., 2007). The mean percentage natural land cover wascalculated per sub-catchment as well as within a 100m and500m buffer on either side of the river. Buffers were definedusing a combination of expert inputs and comparisons offine-scale data with modelled outputs. The minimum ofthese three indices was then assigned to each river reach.Any river reach where the percentage natural land cover was"75% was assumed to be intact and assigned to an ABcategory (Table 1). Reaches with a natural land cover score<75% were assigned to a Z category, i.e. not intact (Nelet al., 2009). These data were reviewed by local experts andrefined where necessary. The proportion of intact rivers in
the study area was then calculated using the length ofmain rivers and their smaller streams in the 1:500 000 GISlayer.
River types. River types were defined for all rivers withinour river network and were based on a hierarchical frame-work for characterizing river ecosystems that share the samebiological response potential and similar biodiversity (Nelet al., 2006; Dollar et al., 2007; Nel et al., 2008). Theframework incorporates ecoregional, hydrological and geo-morphological descriptors that can be used as coarse-filtersurrogates of river biodiversity (Nel et al., 2009). Riverecoregions developed by Kleynhans et al. (2005), based onthe ecoregional classification approach by Omernik (1987),were used. The hydrological classes characterizing theriver as ‘perennial’ or ‘non-perennial’ were extracted fromthe 1:500 000 river layer (DWAF, 2006). Geomorphologicalzones were delineated (Moolman et al., 2002) using sevenslope categories proposed by Rowntree andWadeson (1999)that were grouped into four ecologically-relevant zones:mountain streams, upper foothills, lower foothills and low-land rivers. Ecoregional, hydrological and geomorphologi-cal characterizations for each stream were then combined toderive the final stream-level river type, representing distinctcombinations of physical descriptors defining the differentphysical habitats (Roux et al., 2008).
Fish sanctuaries. The fish databases of the South AfricanInstitute for Aquatic Biodiversity, Albany Museum andCapeNature (covering 1970-2006) were used to extractdistribution records of seven indigenous freshwater fishspecies that occur in the study area (Table 2), with onehistorically isolated lineage of Pseudobarbus tenuis possiblybeing an unrecognized endemic species (Swartz et al.,2009). During an expert workshop, fish sanctuaries foreach of these species were identified using the fish data toguide decisions. Sanctuaries were based on choosing themost ‘secure’ and ‘viable’ fish populations. Here ‘secure’refers to populations that have relatively few threats totheir short-terms survival, especially in terms of alien fishinvasions. Typically, secure populations are isolated fromalien invasions by physical barriers such as waterfalls.‘Viable’ is defined broadly to be a self-maintaining andrecruiting population that are large enough not to bevulnerable to extinction due to demographic variation as aresult of normal environmental variation. Few species andoptions enabled a manual selection of fish sanctuaries.
Groundwater-surface water interaction andgroundwater recharge areas
Important groundwater areas were identified by mappinghigh recharge zones and groundwater probabilities relat-ing to the contribution of groundwater to surface wateroccurrence. The latter were identified based on an approach
Table 1. Categories describing river condition (adapted fromKleynhans 2000) and the percentage river length per category
Present ecologicalstatus category
Description Riverlength%
A/B (tributaries) Natural (unmodified)to largely natural
49
B Largely natural 2C Moderately modified 32D Seriously to critically modified 8Z (tributaries) Moderately to critically modified 9
Copyright # 2010 John Wiley & Sons, Ltd. River Res. Applic. 27: 1298–1314 (2011)
DOI: 10.1002/rra
A SPATIAL ASSESSMENT OF RIVERINE ECOSYSTEMS AND WATER SUPPLY 1301

developed by Conrad and Munch (2006) which uses acombination of spatial overlays (Table 3). Each layerwas converted to a raster and each cell rated from 0 (low) to 3(high) and the individual raster layers weighted from 1(low) and 2 (high) according to data confidence, certaintyand relevance (Table 3). The rasters were then summedaccording to the weighting in GIS and the results assigned aprobability of ‘low’, ‘medium’ or ‘high’ groundwater/sur-face water interaction, where areas in the latter twocategories were considered significant. The resulting mapis a predictive model based on desktop GIS data and expertinterpretation. Recharge areas were mapped using spatiallyexplicit data from the national Groundwater ResourceAssessment Phase II (DWAF, 2005) at a 1 km by 1 km
resolution. Areas with recharge values> 30mm.a!1 wereclassified as high groundwater recharge areas.Sub-catchment water quality . Water quality is defined as
the chemical, physical, aesthetic and biological attributes ofwater which determine its fitness for a range of uses and forprotecting the health and integrity of aquatic ecosystems(DWAF, 1996). Electrical conductivity (EC) data for surfacewater and groundwater were extracted from DWAF’s WaterManagement System database (4750 and 3141 data pointsrespectively, collected from 1997 to 2007). These were usedto assess the fitness for domestic consumption or supplybased on Target Water Quality Range (TWQR) values fromDWAF’s domestic guideline on water quality (DWAF,1996). Median values for EC for each aquifer type were
Table 2. Indigenous freshwater fish species present in this study, together with their number of viable populations, endemicity andconservation status (IUCN, 2007)
Scientific name Common name Number of viablepopulations chosen
Endemic/indigenous
IUCN conservationstatus
Anguilla mossambica Longfin eel 2 Indigenous Least concernBarbus anoplus Chubbyhead barb 4 Indigenous Least concernGalaxias zebratus Cape galaxias 2 (Coastal form)
4 (Slim form)Indigenous Least concern
Labeo umbratus Moggel 3 Indigenous Least concernPseudobarbus asper, ‘‘Keurbooms’’ Small scale redfin 6 Indigenous EndangeredPseudobarbus tenuis,‘‘Gouritz’’ Slender redfin 6 Endemic /
IndigenousNear threatened
Sandelia capensis Cape kurper 4 (Bos form)4 (Kamanasie form)
Indigenous Data deficient
Table 3. GIS data layers used to map the probability of groundwater-surface water interaction
Layer Description Source Weighting
Hydroterrains Hydroterrains basedon aquifer type andcharacteristics
Reclassified 1:1 MillionGeology, CGS
2
Table MountainGroup Buffer
A 300m buffer zoneto incorporate contact zones
1:1 Million Geology. CGS 2
Mega-Faults A 300m buffer was appliedto lineaments
1:1 Million Geology, CGS 2
Baseflow K. Sami Baseflow estimates DWAF, 2005 2Springs A 300m buffer was applied
to the 1:50 000 springsSurveys and Mapping 2
Groundwater Levels Poor resolution groundwaterlevels were classified
GRAII (DWAF, 2005) 1
National Land Cover 2000 NLC was reclassified accordingto groundwater/surface waterinteraction probability
ARC and CSIR(Van den Berg et al., 2008)
1
Jan Vlok Vegetation Map Vegetation reclassified accordingto groundwater/surface waterinteraction probability
SKEP 1
National Wetland Map Beta version SANBI 1NBI GDE Probability Based on high, medium and low. 2
Copyright # 2010 John Wiley & Sons, Ltd. River Res. Applic. 27: 1298–1314 (2011)
DOI: 10.1002/rra
1302 L. B. SMITH-ADAO ET AL.

calculated to standardize water quality classification for allthe surface and groundwater monitoring stations that hadmore than one measurement.
All sub-catchments containing TWQR values for surfacewater above 300mS/m, which represented poor waterquality for domestic use (DWAF, 1996), were assessedfurther to ascertain whether the poor water quality was aresult of naturally high salinity or human induced pollution.To this end, the dominant geological formation and ground-water surface-interaction were assessed within each ofthese sub-catchments since some geological formations inthe study area deliver water of naturally poor quality (i.e.groundwater TWQR values EC> 300mS/m). Areas under-lain with Bokkeveld shale and Witteberg sandstone geolo-gical groups, which are known to deliver water of naturallyhigh salinity and pH (Meyer, 1999) and characterized byhigh groundwater–surface water interaction were excluded.
The remaining sub-catchments of poor water qualitywere then flagged as areas where water quality is poor orunacceptable owing to human induced factors such as salinereturn flows from irrigation and severe land degradation dueto poor grazing practices. To this end, we combined a 100mresolution data layer (Thompson et al., 2009) and a 30mresolution data layer (Van den Berg et al., 2008) of landdegradation to determine to what extent land use changescould have influenced the state of freshwater ecosystems andwater resource quality in the study area.
Data analysis
Conservation targets. River types and fish species wereused as biodiversity surrogates to achieve representation forriver biodiversity. Conservation targets for each river typewere set as 20% of the total length of that river type (i.e. onlyrivers with a condition of ‘intact’), acknowledging that thisis a simplistic method of target setting that will need to berefined as knowledge evolves (Nel et al., 2009). Minimumconservation targets for fish species varied between twoto six ‘viable’ populations per species and were set usingexpert knowledge based on the threatened status of thefish species and its level of endemicity in the study area(Table 2). In addition, a rule was set that each fish populationsatisfying a target must, wherever possible, be situated on adifferent major river system to potentially capture higherlevels of genetic diversity and to minimize the risk that alocal impact could threaten all the prioritized populations.
River condition per river type was examined in GIS tocalculate the total intact length of each river type. River typesthat could not meet their target within intact systems wereflagged for an assessment of rehabilitation potential, whichwas guided by other data layers (e.g. land use, river conditionand groundwater-surfacewater interaction) and long-standing
local expert opinion. Similarly, any fish sanctuary that was notintact was investigated for rehabilitation.
Identifying freshwater conservation areas. We quantifieda subset of the biodiversity within each planning unit (i.e.sub-catchment), as well as other criteria mentioned below.Five key steps were used to design a freshwater conservationarea network for the study area (Figure 2). We used CLUZ(Smith, 2005) and MARXAN (Ball and Possingham, 2000;Possingham et al., 2000) conservation planning supporttools to optimize the following multiple objectives duringinitial selection of sub-catchments: (1) achieving com-plementarity and partial longitudinal connectivity duringselection for representation; (2) aligning as far as possiblewith existing terrestrial protected areas and (3) favouringselection of sub-catchments containing known localities ofindigenous fish, wetlands and high groundwater recharge.Water quality data were not included in this initial selectionprocess. MARXAN is a complementarity-based algorithm,which strives for spatial efficiency (Sarkar et al., 2006) whileCLUZ is an interface to view and process the data inArcview (ESRI, 2005). Several scenarios were examined totest the sensitivity and selection frequency of the MARXANoutputs (Ball and Possingham, 2000).
We began by pre-selecting (earmarking) all sub-catchmentsflagged as fish sanctuaries and then running MARXAN toachieve residual river type conservation targets. We thenassigned a uniform boundary penalty to all non-headwatercatchments. This boundary penalty favours the selectionof longitudinally connected planning units. To achieveobjectives (2) and (3) we applied MARXAN’s planning unitcost to each sub-catchment. Marxan assigns a planning unitcost as one of the methods to meet conservation targets whileminimizing costs (Ball and Possingham, 2000; Possinghamet al., 2000). This cost allows certain planning units withsimilar biodiversity features to be favoured over others andcan be expressed as area of the planning unit, monetary costor a relative measure. In a Marxan portfolio the cost of allplanning units allows an assessment of the relative cost ofconserving one planning unit versus another. A uniformplanning unit cost of 500 was assigned to all sub-catchmentsand those sub-catchments containing a high proportion(>20%) of protected areas, known fish localities, knownwetland localities or high groundwater recharge were‘discounted’ by 100 (i.e. planning unit cost ranged from200 to 500). Where choices of sub-catchments exist forachieving conservation targets, the planning units with thelowest cost will be favoured.
‘Marginal’ sub-catchments were then removed (Figure 2),which included those sub-catchments containing shortstretches of river reach that were considered too small tobe viable, or those where experts did not agree with theoutcome of the automated selection. Those sub-catchmentswhere rehabilitation was deemed feasible were next
Copyright # 2010 John Wiley & Sons, Ltd. River Res. Applic. 27: 1298–1314 (2011)
DOI: 10.1002/rra
A SPATIAL ASSESSMENT OF RIVERINE ECOSYSTEMS AND WATER SUPPLY 1303

Figure 3. River condition categories (adopted from Kleynhans 2000) and fish sanctuary areas.
Figure 2. Flow chart of key steps determining the conservation portfolio in the study.
Copyright # 2010 John Wiley & Sons, Ltd. River Res. Applic. 27: 1298–1314 (2011)
DOI: 10.1002/rra
1304 L. B. SMITH-ADAO ET AL.

considered. Those that were able to achieve residual con-servation targets once rehabilitated were selected as part ofthe conservation area network and flagged for rehabilitation.
Additional upstream sub-catchments needed for main-taining downstream conservation areas were then addedmanually to the selected set to derive a conservation areanetwork that would support both representation andpersistence. This had to be done, because the boundarypenalty only achieved partial connectivity for representa-tion. Finally, we assigned desired level of protection to eachselected sub-catchment, depending on the reason for itsselection. All sub-catchments required for representationshould be managed in a largely natural condition and weretherefore allocated a high level of protection. Sub-catc-hments for maintaining upstream-downstream linkages orfor management of groundwater may be able to withstandmoderate levels of utilization, and were therefore afforded amoderate protection.
Rehabilitation for both conservation and improvement ofwater quality
The extent of land degradation was used to interpretrelationships between poor land management and sub-catchments with poor water quality owing to human-inducedfactors. This highlighted sub-catchments where rehabilita-tion would result in improvement of surface water quality.Similarly, sub-catchments that, with rehabilitation, wouldhelp meet the objectives of achieving representation andconnectivity in the conservation area network wereidentified. ‘Win-win’ situations were thus highlighted whereobjectives for improved water quality and conservationoverlapped.
RESULTS
Sub-catchments, river condition and river types
The study area was subdivided into 912 planning unitswith an average size of approximately 107 km2, rangingfrom 9 to 853 km2. Approximately 51% of the 1:500 000river network is intact, 32% moderately modified and 17%seriously to critically modified (i.e. the percentage riverlength per category) (Table 1). Comparisons made betweenthe river condition of main rivers and tributaries indicatedthat only 7% of main rivers are currently intact, while mostof the tributaries (75%) are intact (Figure 3).
Fifteen ecoregions, two flow types, and four geomorpho-logical zones spatially overlaid, resulted in 50 distinctstream-level river types within the study area. Assessmentof conservation targets for each river type against rivercondition indicated that 31 (62%) river types would be ableto achieve their targets in intact river systems. This implies
that rehabilitation will have to be investigated if theremaining 19 river types are to be represented in intactsystems. According to methods of setting endangermentlevels used by Nel et al. (2007), the 19 river types wouldbe considered critically endangered (38%); whilst 8% ofthe remaining 31 river types would be endangered, 10%vulnerable and 44% currently not threatened if the IUCNconservation status categories are used.
Fish sanctuaries
We identified a total of 11 fish sanctuary sub-catchmentsand 28 sub-catchments required for connectivity relatedto fish movement between and within these sanctuaries(Figure 3). For many species, options for placing fishsanctuaries were limited because of extensive developmentand degradation of rivers in the area. In the few instanceswhere options existed for placement of sanctuary areasfactors such as land use, existing conservation initiativesand complementarity were considered. The proposed riverreaches for fish sanctuary areas are all located in the LittleKaroo (central and eastern parts) and coastal regions.
Groundwater-surface water interaction andgroundwater recharge areas
Areas of high and moderate likelihood of groundwater-surface water interaction are shown in Figure 4. The sub-catchments containing river reaches of the Touws, Olifantsand Gouritz rivers have moderate to high groundwater–surface water interaction probability based on the spatiallayers used in Table 3. Furthermore, these rivers receive acomponent of groundwater fed baseflow (DWAF, 2005; LeMaitre et al., 2009). This implies that there is probably adirect dependency of these rivers and their sub-catchmentson groundwater.
High groundwater recharge areas (30 to> 50mm.a!1)occur throughout the Little Karoo and coastal regions(Figure 4). However, the highest values are concentrated inthe mountainous regions of the eastern part of the LittleKaroo. Groundwater recharge values (0 to 15mm.a!1) inthe Great Karoo are low because of the low permeability ofthe shales and the fine textured soils derived from them.However, inhabitants of the small towns and farmers dependlargely on groundwater for domestic use, household veget-ables and fruit and water for livestock.
Sub-catchment water quality
When looking at Figure 1, the Great Karoo is characterizedmainly by natural vegetation with degraded and irrigatedcultivated areas particularly concentrated around the townsof Touwsrivier, Prince Albert, Leeu Gamka and BeaufortWest. Approximately 22% of the Little Karoo region is
Copyright # 2010 John Wiley & Sons, Ltd. River Res. Applic. 27: 1298–1314 (2011)
DOI: 10.1002/rra
A SPATIAL ASSESSMENT OF RIVERINE ECOSYSTEMS AND WATER SUPPLY 1305

largely natural, 53% moderately degraded, 15% severelydegraded due to poor grazing practices and 10% is culti-vated. Irrigated crops and pastures occur around the towns ofLadismith, Calitzdorp, Oudshoorn and Dysselsdorp. Dry-land crops primarily characterize the coastal areas, >80%(Figure 1).Human impacts on the water quality in the Touws,
Groot, Olifants, Gouritz and Sand Rivers have increased thesalinity to levels that are poor or unacceptable for humanconsumption (Figures 1 and 5). The upper reaches of theserivers are in good condition with salinity increasing down-stream as the cumulative effect of human activities such aspoor grazing practices and irrigated agriculture results inseverely degraded land and saline return flows.The natural saline groundwater is one of the main factors
affecting the use of available surface and groundwaterresources in the Karoo (Le Maitre et al., 2009). Areas withunacceptable groundwater quality are restricted to the south-western part of the Little Karoo and in the lower reaches ofthe Gouritz River above the estuary, with the mountainousregions generally having good quality surface water andgroundwater.The water quality in the Touws River and lower reaches of
the Gouritz River have a natural high salinity as a result ofthe high contribution to baseflow from the naturally more
saline Witteberg sandstone and Bokkeveld shale lithologies,in contrast to the low salinity Olifants River, which has ahigh water abstraction (DWAF, 2003, 2004; Le Maitre et al.,2009) and is underlain by quaternary sediments whichgenerally have high yields of good quality water (Meyer,1999).Surface water in sub-catchments which have low
groundwater contribution to baseflow are more likely tobe impacted by surface activities such as poor grazingpractices, compared to sub-catchments with high ground-water contributions to baseflow where groundwater qualitywill play a more significant role in the quality of the surfacewater.
Freshwater conservation area network
All fish species and 31 river types can be represented in106 of the 912 sub-catchments (12%) in the planning region(Figure 6). A further 208 sub-catchments (23%) are requiredto maintain longitudinal linkages, and manage groundwaterin important groundwater-surface water interaction andrecharge areas (predominantly in the Little Karoo andcoastal regions). In addition, the 19 river types that are notachieving their conservation targets through the prioritiza-tion of intact systems were each assessed in terms of their
Figure 4. High areas of recharge and groundwater-surface water interaction probability.
Copyright # 2010 John Wiley & Sons, Ltd. River Res. Applic. 27: 1298–1314 (2011)
DOI: 10.1002/rra
1306 L. B. SMITH-ADAO ET AL.

potential for rehabilitation (Table 4, Figure 6). Sub-catchments containing river reaches that, potentially, canbe rehabilitated to an intact condition strongly coincide withthe identified conservation areas. The 28 sub-catchmentsselected for rehabilitation are located in the Little Karoo andcoastal regions. Rehabilitation will ensure that an additional15 (30%) river types will meet their targets. In total,therefore, rehabilitation efforts can ensure that 92% of theriver type conservation targets are met, as opposed to thecurrent level of 62%. It is not possible to meet conservationtargets for the remaining four river types (Table 4), asrehabilitation of these river types to an intact condition (i.e.A or B category) is not feasible because these river types arebeing managed for economic (usually consumptive)activities and highly impacted. Two of these four rivertypes can be considered ‘endemic’ to the area, defined hereas, having "90% of its national range falling within aspecific area (sensu Nel et al., 2006).
Rehabilitation for both conservation and improvement ofwater quality
Two sub-catchments containing river reaches of theTouws and the Gourtiz Rivers were identified as having poorsurface water quality due to both natural and anthropogenic
factors (Figure 6) whereas the remaining three sub-catchments containing river reaches of the Olifants, Grootand Sand Rivers have poor surface water quality mainlybecause of anthropogenic factors.
A comparison of the conservation, rehabilitation and pooror unacceptable water quality sub-catchments shows thatonly two sub-catchments (i.e. the middle reaches of theGouritz and Groot Rivers) represented a win-win situation,where rehabilitation would benefit both riverine conserva-tion and ensure a good quality water supply for humanutilization (Figure 6). None of the five sub-catchments ofunacceptably low water quality overlapped with theconservation areas selected for representation in the plan(i.e. the sub-catchments requiring high levels of protection),while only two sub-catchments overlapped with moderateimpact management areas for groundwater-surface waterinteraction and recharge.
DISCUSSION
Conserving river and groundwater ecosystems
Water resources in this semi-arid environment are heavilyutilized particularly the more permanent main rivers andgroundwater (DWAF, 2004). This assessment revealed that
Figure 5. Poor or unacceptable surface water and groundwater quality areas (median EC values).
Copyright # 2010 John Wiley & Sons, Ltd. River Res. Applic. 27: 1298–1314 (2011)
DOI: 10.1002/rra
A SPATIAL ASSESSMENT OF RIVERINE ECOSYSTEMS AND WATER SUPPLY 1307

just over 50% of these main river ecosystems have becomedegraded (Table 1) and options for conservation of naturalsystems are diminishing. Similar results are reported aroundthe world (Revenga et al., 2005; Dudgeon et al. 2006;Abell et al., 2007; Linke et al., 2007; Nel et al., 2007;Thieme et al., 2007). Our finding that a higher proportion oftributaries are intact compared to main rivers (Figure 6)also supports national findings (Nel et al., 2007, 2009).Tributaries therefore play a critical role in conserving thefreshwater biodiversity of this area and providing a widerange of goods and services.In this semi-arid region, groundwater derived largely from
the high rainfall headwater/upper catchments (i.e. highwater yield/recharge areas, Figure 4) plays a particularlyimportant role in the ecological functioning of surfacewaters, maintaining river pools that serve as crucial refugiain the summer low flow months, sustaining river baseflows,and maintaining wetlands and riparian vegetation (Hayashiand Rosenberry, 2002; Hughes, 2005; Boulton and Hancock,2006). In addition, it is a critical water resource for peopleliving in the area. However, much of the water used in theLittle Karoo is actually obtained from catchments whichare situated to the north of the Witteberg-SwartbergMountain ranges hence, within the Great Karoo (Le Maitreet al., 2009). Identifying areas of high groundwater-surface
water interaction and recharge serves as a first step insustaining groundwater to maintain functioning ecologicalsystems and ecosystem services. From a biodiversityviewpoint areas of high groundwater–surface water inter-action are also areas of high productivity that support highfauna and flora biodiversity (Boulton and Hancock, 2006).The conservation area network presented here provides a
spatial means of achieving representation of freshwaterbiodiversity in the long term. It should be seen as a first levelof assessment after which further refinement should takeplace at local levels (Margules and Pressey, 2000). Theconservation area network identifies priority conservationareas (river types and fish sanctuaries) that require a highlevel of protection (16% of the study area), moderate impactmanagement areas (groundwater-surface water interactionand recharge areas and connectivity areas) where userestrictions are less severe (23% of the study area) andrehabilitation areas (Figure 6). These multiple zones ofprotection acknowledge that water and hence freshwatersystems cannot be locked away from human use entirely.They are similar to the hierarchical protection strategyproposed by Abell et al. (2007) for freshwater ecosystems,which defines three zones of protection – freshwater focalareas, critical management zones and catchment managementzones. Management of freshwater focal areas focuses
Figure 6. Conservation portfolio areas and poor or unacceptable water quality areas.
Copyright # 2010 John Wiley & Sons, Ltd. River Res. Applic. 27: 1298–1314 (2011)
DOI: 10.1002/rra
1308 L. B. SMITH-ADAO ET AL.
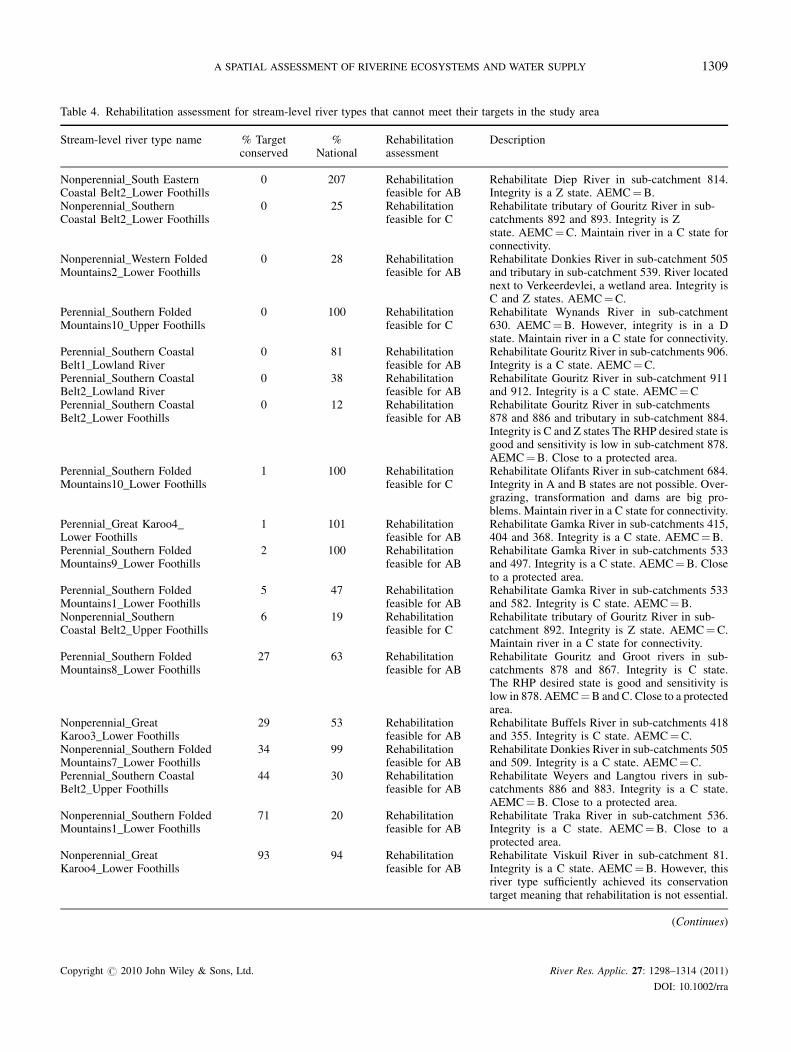
Table 4. Rehabilitation assessment for stream-level river types that cannot meet their targets in the study area
Stream-level river type name % Targetconserved
%National
Rehabilitationassessment
Description
Nonperennial_South EasternCoastal Belt2_Lower Foothills
0 207 Rehabilitationfeasible for AB
Rehabilitate Diep River in sub-catchment 814.Integrity is a Z state. AEMC#B.
Nonperennial_SouthernCoastal Belt2_Lower Foothills
0 25 Rehabilitationfeasible for C
Rehabilitate tributary of Gouritz River in sub-catchments 892 and 893. Integrity is Zstate. AEMC#C. Maintain river in a C state forconnectivity.
Nonperennial_Western FoldedMountains2_Lower Foothills
0 28 Rehabilitationfeasible for AB
Rehabilitate Donkies River in sub-catchment 505and tributary in sub-catchment 539. River locatednext to Verkeerdevlei, a wetland area. Integrity isC and Z states. AEMC#C.
Perennial_Southern FoldedMountains10_Upper Foothills
0 100 Rehabilitationfeasible for C
Rehabilitate Wynands River in sub-catchment630. AEMC#B. However, integrity is in a Dstate. Maintain river in a C state for connectivity.
Perennial_Southern CoastalBelt1_Lowland River
0 81 Rehabilitationfeasible for AB
Rehabilitate Gouritz River in sub-catchments 906.Integrity is a C state. AEMC#C.
Perennial_Southern CoastalBelt2_Lowland River
0 38 Rehabilitationfeasible for AB
Rehabilitate Gouritz River in sub-catchment 911and 912. Integrity is a C state. AEMC#C
Perennial_Southern CoastalBelt2_Lower Foothills
0 12 Rehabilitationfeasible for AB
Rehabilitate Gouritz River in sub-catchments878 and 886 and tributary in sub-catchment 884.Integrity is C and Z states The RHP desired state isgood and sensitivity is low in sub-catchment 878.AEMC#B. Close to a protected area.
Perennial_Southern FoldedMountains10_Lower Foothills
1 100 Rehabilitationfeasible for C
Rehabilitate Olifants River in sub-catchment 684.Integrity in A and B states are not possible. Over-grazing, transformation and dams are big pro-blems. Maintain river in a C state for connectivity.
Perennial_Great Karoo4_Lower Foothills
1 101 Rehabilitationfeasible for AB
Rehabilitate Gamka River in sub-catchments 415,404 and 368. Integrity is a C state. AEMC#B.
Perennial_Southern FoldedMountains9_Lower Foothills
2 100 Rehabilitationfeasible for AB
Rehabilitate Gamka River in sub-catchments 533and 497. Integrity is a C state. AEMC#B. Closeto a protected area.
Perennial_Southern FoldedMountains1_Lower Foothills
5 47 Rehabilitationfeasible for AB
Rehabilitate Gamka River in sub-catchments 533and 582. Integrity is C state. AEMC#B.
Nonperennial_SouthernCoastal Belt2_Upper Foothills
6 19 Rehabilitationfeasible for C
Rehabilitate tributary of Gouritz River in sub-catchment 892. Integrity is Z state. AEMC#C.Maintain river in a C state for connectivity.
Perennial_Southern FoldedMountains8_Lower Foothills
27 63 Rehabilitationfeasible for AB
Rehabilitate Gouritz and Groot rivers in sub-catchments 878 and 867. Integrity is C state.The RHP desired state is good and sensitivity islow in 878. AEMC#B and C. Close to a protectedarea.
Nonperennial_GreatKaroo3_Lower Foothills
29 53 Rehabilitationfeasible for AB
Rehabilitate Buffels River in sub-catchments 418and 355. Integrity is C state. AEMC#C.
Nonperennial_Southern FoldedMountains7_Lower Foothills
34 99 Rehabilitationfeasible for AB
Rehabilitate Donkies River in sub-catchments 505and 509. Integrity is a C state. AEMC#C.
Perennial_Southern CoastalBelt2_Upper Foothills
44 30 Rehabilitationfeasible for AB
Rehabilitate Weyers and Langtou rivers in sub-catchments 886 and 883. Integrity is a C state.AEMC#B. Close to a protected area.
Nonperennial_Southern FoldedMountains1_Lower Foothills
71 20 Rehabilitationfeasible for AB
Rehabilitate Traka River in sub-catchment 536.Integrity is a C state. AEMC#B. Close to aprotected area.
Nonperennial_GreatKaroo4_Lower Foothills
93 94 Rehabilitationfeasible for AB
Rehabilitate Viskuil River in sub-catchment 81.Integrity is a C state. AEMC#B. However, thisriver type sufficiently achieved its conservationtarget meaning that rehabilitation is not essential.
(Continues)
Copyright # 2010 John Wiley & Sons, Ltd. River Res. Applic. 27: 1298–1314 (2011)
DOI: 10.1002/rra
A SPATIAL ASSESSMENT OF RIVERINE ECOSYSTEMS AND WATER SUPPLY 1309

largely on conserving biodiversity features for representa-tion and is likely to be restrictive, with diminishingrestrictions in the latter two zones where the focus islargely on persistence.Management interventions for priority conservation areas
and moderate impact management areas in this studyinclude: managing the headwater catchments to sustain riverflows, releasing flows from existing instream dams to meetthe environmental flow requirements, providing free passagefor migratory species, controlling groundwater and surfacewater abstraction, controlling point and non-point pollutionsources, maintaining natural vegetation cover and riparianbuffer zones of appropriate widths, controlling stock access,reduce or eliminate dredging/bulldozing operations, impro-ving land use management practices and controlling thespread of invasive alien fish. In the case of the latter,maintaining or restoring natural connectivity may notalways be desirable, since discontinuity with main riversoften allows persistence of indigenous fish species that arevulnerable to displacement by alien invasive species presentin the main river, either through competition, habitat alterat-ion or predation. This is especially true for semi-aridrivers that are often characterized by spatial and temporaldiscontinuities of flow (Kingsford, 2000; Young andKingsford, 2006).In these situations, we recommend investigating fish
population management strategies such as the strategicplacement of weirs in the lower tributaries of fish sanctuariesthat contain species vulnerable to displacement by alieninvasive fish. Prior to implementing such a strategy, the plansshould be subjected to a full environmental impact assess-ment that also assesses the impacts that such weirs wouldhave on a broader range of biotic and physical attributes.Monitoring the outcomes of conservation actions resultingfrom this assessment and planning should include indicatorsevaluating the health of rivers and groundwater systemsthrough for example the River Health Programme (Roux,2001), setting environmental flows (Arthington et al., 2010)and implementation of comprehensive Ecological Reservedetermination studies (Brown et al., 2006).
Developing the conservation area network relied onseveral data layers, all of which have limitations that needaddressing in future studies. The data on which the conditionof main rivers is based are outdated and condition oftributaries is modelled from land cover data that under-estimates land degradation (Rouget et al., 2006) andprobably channel degradation/impacts in the study area.The level of groundwater recharge is likely to be under-estimated since the recharge assessment did not accountfor recharge from flood surface water flows, which would beexpected to contribute to the overall groundwater stored inthe study area aquifers (DWAF, 2005). We used long-standing expert review to help address these issues in thisstudy, however, empirical data are needed to better developmodelled predictions of surface water/groundwater inter-action and conservation targets that are adequate at capt-uring representation and persistence of each biodiversityfeature and river biodiversity data. We recommend that fieldverification be undertaken in selected sub-catchments toconfirm that they contain the particular biodiversity featuresfor which they were selected.
Assessing water quality for domestic use
Water quality is an important issue in the study area, withsalinization, high evaporation rates and water pollutionbeing the key issues (DWAF, 2004). An indication from thisassessment is that diffuse pollution from flood irrigationmost likely played a major role in the poor or unacceptablewater quality results obtained for the Sand, Groot, Olifants,Touws and Gouritz rivers (Figure 5). These river reaches arecharacterized by return flows (i.e. containing sediment,pesticides and nutrients) from irrigated agriculture andseverely degraded land, Figure 1 (Le Maitre and O’Farrell,2008; Le Maitre et al., 2009). These return flows alsopercolate into soils to become part of the groundwater(Ellington et al., 2004; Le Maitre et al., 2009). Similarly, thesediments (eroded soil material) reduce the water quality inriverine channels (van Rensburg et al., 2008). Alien invasiveplants in the study area further exacerbate this situation by
Table 4. (Continued)
Stream-level river type name % Targetconserved
%National
Rehabilitationassessment
Description
Perennial_Southern FoldedMountains7_Lower Foothills
93 91 Rehabilitationfeasible for AB
Rehabilitate Groot River in sub-catchments 794and 770. Integrity is C state. AEMC#C.Maintainriver in a C state for connectivity. However, thisriver type sufficiently achieved its conservationtarget meaning that rehabilitation is not essential.
The target is 20% of the total length and the national range within the study area of the river types is expressed as a percentage. Percentages greater than 100%resulted from adding seven extra rivers to the 1:500 000 river layer. The rehabilitation assessment was based on the best attainable management class (AEMC)data (Kleynhans, 2000), river condition, land use (Van den Berg et al., 2008), River Health Programme data (RHP, 2007) and expert opinion.
Copyright # 2010 John Wiley & Sons, Ltd. River Res. Applic. 27: 1298–1314 (2011)
DOI: 10.1002/rra
1310 L. B. SMITH-ADAO ET AL.

reducing runoff and streamflow and thus, aggravating thesalination of the lower river reaches thereby also reducingaquatic habitat integrity and water quality (Le Maitreand O’Farrell, 2008; Le Maitre et al., 2009). It is widelyacknowledged that water quantity and quality are linked andthat attention should be paid to managing both (King et al.,2008; Deksissa et al., 2003).
The data indicated that concentrations of EC are very highin five sub-catchments (Figure 5). A consequence of highEC values is that water in these sub-catchments will need tobe purified before it can be used for human consumption(Tilman et al., 2002). This increases water-supply cost,particularly if the process is technically complex andexpensive such as in the case of inorganic salt removalby means of reverse osmosis. Good quality surface waterrequires only clarification and disinfection treatments whichare considerably cheaper (Postel and Thompson, 2005; StatsSA, 2005). Hence, the implication is that: (1) mainstreamwater is not cheap to purify and (2) mountain tributary wateris probably cleaner and cheaper to purify.
Rehabilitation prospects
We identified areas where rehabilitation of degradedsystems would greatly improve representation of freshwaterbiodiversity (Figure 6) – a third more river types would beadequately represented with successful rehabilitation. Two‘endemic’ river types that represent biotopes for aquaticbiota that are unique within the study area could not achievetheir biodiversity targets in intact river systems becauserehabilitation of these river types is not feasible (Table 4).These river types cannot be conserved elsewhere in SouthAfrica and are considered critically endangered in SouthAfrica because they have failed to meet the national target inintact systems (Nel et al., 2006). Maintaining or rehabilitat-ing these critically endangered river types to the highestattainable ecological condition will still achieve someconservation benefit, even though their condition may not beconsidered intact. However, from a biodiversity viewpointrehabilitation actions should focus first on the systems thatcan achieve conservation in intact systems. This impliesthat least disturbed sites should be the main target forrehabilitation while highly degraded sites receive the lowestpriority for action (Gordon et al., 2004).
Rehabilitation interventions should address identifiedimpacts/threats in order to improve river health. In the studyarea alien invasive vegetation, over-abstraction, agriculturalpractices, land use change and dams have modified the bedand banks of many rivers, resulting in flow modification,habitat destruction and soil erosion and water qualityproblems. Furthermore, alien fish pose a major threat toriver functioning and indigenous fish (DWAF, 2003, 2004).Rehabilitation activities in the study area that address
impacts include riparian alien vegetation removal combinedwith indigenous re-vegetation, gully and riverbank/bed ero-sion protection through basket/blanket gabions, instreamhabitat structures to increase riverbed heterogeneity, remov-ing unwanted or badly managed structures in the rivers (e.g.weirs and dams), wetland construction to manage waterquality, re-introduction of indigenous faunal species, fishpassage structures and elimination of exotic fish species suchas bass or carp. Control of invasive alien fish include manualremoval through nets, traps or angling; or the use of rotenone(fish poison) which must be preceded by an environmentalimpact assessment to determine impacts on the indigenousbiodiversity. A multi-disciplinary approach undertakenwithin a catchment management strategy is needed (Gordonet al., 2004).
Rehabilitation efforts that yield benefit for both con-servation and improved water quality offer the opportunityof a potential win-win situation in the study area. Out of the28 sub-catchments where rehabilitation is feasible, only twowill provide such a win-win opportunity (Figure 6). Thissupports warnings of frequent conflict between optimizingconservation priorities and ecosystem services (Egoh et al.,2007; Naidoo et al., 2008). However, where conservationand ecosystem service objectives do coincide, they shouldbe used to build awareness of the need for conservation topromote sustainability.
CONCLUSIONS
This study offers a novel and generic example of how toincorporate river types and groundwater processes intospatial planning, which to date has largely been ignored inmost freshwater conservation plans (Nel et al., 2009). Thisis a particularly important aspect to consider in semi-aridregions, such as the Little Karoo, where both people andecosystems are highly dependent on groundwater resources.It is therefore critical to manage human activities in highrecharge headwater catchments. However, it is important tobear in mind that much of the water used in the Little Karoois sourced from catchments in the Great Karoo (Le Maitreet al., 2009).
Our study area is the focus of numerous terrestrialbioregional conservation initiatives (Ashwell et al., 2006).While these initiatives recognize the critical importance ofwater for this semi-arid region, this study presents the firstsystematic conservation assessment that has explicitly consi-dered representation and persistence of riverine ecosystemsand their associated biota. The conservation area networkpresented here therefore offers an important tool to theseinitiatives allowing more informed, science-based decisionsregarding freshwater ecosystem conservation strategies. Italso informs local community-based programmes that
Copyright # 2010 John Wiley & Sons, Ltd. River Res. Applic. 27: 1298–1314 (2011)
DOI: 10.1002/rra
A SPATIAL ASSESSMENT OF RIVERINE ECOSYSTEMS AND WATER SUPPLY 1311

focus on clearing alien vegetation, reintroducing indigenousvegetation, and the building of fish ladders (Ashwell et al.,2006).Currently, the land use planning processes and water
resource use planning processes in the study area are notwell integrated. Since freshwater ecosystems are intimatelylinked to the surrounding land and the human activities thatinfluence them, there is a need for integrated land andwater management. This should ideally take place within thecontext of an integrated catchment management strategydeveloped in collaboration with stakeholders to facilitate thedynamic interplay between management actions, ongoingmonitoring and the formulation and testing of relevantresearch (Driver et al. 2003; Knight et al. 2006; Cowlinget al., 2008). Efforts should be made to incorporate theoutputs of this freshwater conservation assessment into localmunicipal land use planning (e.g. in integrated developmentplans) and decision-making. It is unlikely that the GouritzWMA will be able to support further development thatwould require additional water resources. Economic acti-vities such as ecotourism or game farms that require lesswater should therefore be encouraged.
ACKNOWLEDGEMENTS
The authors gratefully acknowledge financial support fromthe CSIR which contributed towards a growing understand-ing of freshwater conservation planning. Particular thanksgo to CapeNature officials at the George and Stellenboschoffices, Cecile Reed and Christine Colvin for their ecologi-cal and groundwater input respectively. Comments made onearlier drafts by colleagues in the CSIR’s BiodiversityResearch Group are also highly appreciated.
REFERENCES
Abell R, Allan JD, Lehner B. 2007. Unlocking the potential of protectedareas for freshwaters.Biological Conservation 134: 48–63. DOI:10.1016/j.biocon.2006.08.017.
Allsop N, Gaika L, Knight R, Monakisi C, Hoffman MT. 2007. The impact
of heavy grazing on an ephemeral river system in the succulent karoo,South Africa. Journal of Arid Environments 71: 82–96. DOI:10.1016/j.jaridenv.2007.03.001.
Amis MA, Rouget M, Balmford A, Thuiller W, Kleynhans CJ, Day J, Nel J.2007. Predicting freshwater habitat integrity using land-use surrogates.
Water SA 33(2): 215–221.Arthington AH, Bunn SE, Poff NL, Naiman RJ. 2006. The challenge of
providing environmental flow rules to sustain river ecosystems. Ecologi-cal Applications 16(4): 1311–1318. DOI: 10.1890/ 1051-0761.
Arthington AH, Naiman RJ, McClain ME, Nilssons C. 2010. Preserving the
biodiversity and ecological services of rivers: new challenges and
research opportunities. Freshwater Biology 55: 1–16. DOI: 10.1111/j.1365-2427. 2009.02340.x.
Ashwell A, Sandwith T, Barnett M, Parker A, Wisani F. 2006. Fynbos
Fynmense: people making biodiversity work, SANBI Biodiversity Series4. SANBI: Pretoria, South Africa.
Ball I, Possingham H. 2000. Marxan (v1.8.2): Marine Reserve Design
Using Spatially Explicit Annealing. Manual prepared for The GreatBarrier Reef Marine Park Authority, Australia. Available online:
http://www.ecology.uq.edu.au/marxan.htm.
Boulton AJ, Hancock PJ. 2006. Rivers as groundwater-dependent ecosys-
tems: a review of degrees of dependency, riverine processes and manage-ment implications. Australian Journal of Botany 54: 133–144. DOI:
10.1071/BT050740067-1924/06/020133.
Brown C, Pemberton C, Birkhead A, Bok A, Boucher C, Dollar E, HardingW, Kamish W, King J, Paxton B, Ractliffe S. 2006. In support of water-
resource planning-highlighting key management issues using DRIFT: a
case study. Water SA 32(2): 181–192.CGS (Council for Geoscience). 1997. The 1:1000000 scale geological map ofthe Republic of South Africa. Council for Geoscience: Pretoria, South Africa.
Conrad J, Munch Z. 2006. Groundwater Assessment of the North-West
Sandveld and Saldanha Peninsula as an Integral Component of the
C.A.P.E Fine-Scale Biodiversity Planning Project. GEOSS Report Num-ber G2006/ 09-01. Geohydrological and Spatial Solutions International
(Pty) Ltd: Stellenbosch, South Africa.
Cowling RM, Pressey RM. 2003. Introduction to systematic conservationplanning in the Cape Floristic Region. Biological Conservation 112: 1–13. DOI:10.1016/S0006-3207(02) 00418-4.
Cowling RM, Egoh B, Knight TA, O’Farrel P, Reyers B, Rouget M, Roux D,
Welz A, Wilhelm-Rechman A. 2008. An operational model for main-streaming ecosystem services for implementation. PNAS 105: 9483–
9488. DOI: 10.1073/pnas.0706559105.
Davies BR, Thoms MC, Walker KF, O’Keefe JH, Gore JA. 1994. Dryland
rivers: their ecology, conservation and management. In The RiversHandbook, (Vol. 2) Calow P, Petts GE (eds.) Blackwell Scientific
Publications: Oxford; 484–511.
Deksissa T, Ashton PJ, Vanrolleghem PA. 2003. Control options for riverwater quality improvement: a case study of TDS and inorganic nitrogen in
the Crocodile River (South Africa). Water SA 29(2): 209–217.Dollar ESJ, James CS, Rogers KH, Thoms MC. 2007. A framework for
interdisciplinary understanding of rivers as ecosystems. Geomorphology89(860): 147–162. DOI:10.1016/j.geomorph.2006.07.022.
Driver A, Desmet P, Rouget M, Cowling R, Maze K. 2003. Succulent Karoo
Ecosystem Plan. Biodiversity Component. Technical Report. Cape Con-
servation Unit. Report No CCU 1/03. Botanical Society of South Africa:South Africa.
Dudgeon D, Arthington AH, Gessner MO, Kawabata Z, Knowler D,
Leveque C, Naiman RJ, Prieur-Richard AH, Soto D, Stiassny MLJ.
2006. Freshwater biodiversity: importance, threats, status, and conserva-tion challenges. Biological Reviews 81(2): 163–182. DOI:10.1017/
S1464793105006950.
DWAF. 1996. South AfricanWater Quality Guidelines (2nd Edition). Volume1. Domestic Water Use. Department of Water Affairs and Forestry:
Pretoria, South Africa. Available online: http://www.dwaf.gov.za/iwqs/
wq_guide/index.asp
DWAF (Department of Water Affairs and Forestry). 2003. Gouritz WaterManagement Area. Overview of water resources availability and utilis-
ation. Report P WMA 16/000/00/0203. Department of Water Affairs and
Forestry: Pretoria, South Africa. Available online: http://www.dwa.-
gov.za/Documents/Default.aspxDWAF. 2004. Gouritz WMA Internal Strategic Perspective. Version 1.
March 2004. Report P WMA 16/000/00/0304. Department of Water
Affairs and Forestry: Pretoria, South Africa. Available online: http://www.dwa.gov.za/Documents/Default.aspx
DWAF. 2005. Groundwater Resource Assessment, Phase II. Department of
Water Affairs and Forestry: Pretoria, South Africa. Available online:
http://www.dwa.gov.za/Groundwater/Documents.aspxDWAF. 2006. South African 1:500 000 river coverage. Resource Quality
Services Directorate, Department of Water Affairs and Forestry: Pretoria,
Copyright # 2010 John Wiley & Sons, Ltd. River Res. Applic. 27: 1298–1314 (2011)
DOI: 10.1002/rra
1312 L. B. SMITH-ADAO ET AL.
South Africa. Available online: http://www.dwaf.gov.za/iwqs/gis_data/
river/rivs500k.htmlDynesius M, Nilsson C. 1994. Fragmentation and flow regulation of river
systems in the Northern Third of theWorld. Science 266(5186): 753–762.DOI: 10.1126/science.266.5186.753.
Egoh B, Rouget M, Reyers B, Knight AT, Cowling RM, van Jaarsveld AS,Welz A. 2007. Integrating ecosystem services into conservation assess-
ments: a review. Ecological Economics 63: 714–721. DOI: 10.1016/j.ecolecon.2007.04.007.
Ellington RG, Usher BH, van Tonder GJ. 2004. Quantification of the impact
of irrigation on the aquifer under the Vaalharts Irrigation Scheme. In
Water Resources of Arid Areas, Stephenson D, Shemang EM, Chaoka
TR (eds). Taylor & Francis Group: London; 47–55.ESRI (Environmental Systems Research Institute). 2005. Arc Hydro Tools
v1.1 Final-Tutorial. ESRI: Redlands, USA.
Gleick PH, Cain NL, Haasz D, Henges-Jeck C, Hunt C, Kiparsky M,
Moench M, Palaniappan M, Srinivasan V, Wolff G. 2004. The World’sWater 2004–2005: The Biennial Report on Freshwater Resources. Island
Press: Washington, DC.
Gordon ND, McMahon TA, Finlayson BL, Gippel CJ, Nathan RJ. 2004.Stream Hydrology: An Introduction for Ecologists, Second edition. John
Wiley and Sons, Ltd: Chichester; 429 pp.
Hayashi M, Rosenberry DO. 2002. Effects of groundwater exchange on the
hydrology and ecology of surface waters. Ground Water 40(3): 309–316.DOI:d10.1111/j.1745-6584.2002.tb02659.x.
Heal G. 2000. Nature and the Marketplace: Capturing the Value of
Ecosystem Services. Isand Press: Washington, DC.
Herling MC, Cupido CF, O’Farrell PJ, Du Plessis L. 2009. The financialcosts of ecologically non-sustainable farming practices in a semi-arid
system. Restoration Ecology 17(6): 827–836. DOI: 10.1111/j.1526-
100X.2008.00419.x.Higgins JV. 2003. Maintaining the ebbs and flows of the landscape:
conservation planning for freshwater ecosystems. In Drafting a conser-
vation blueprint: a practitioner’s guide to regional planning for biodi-
versity, Groves CR (ed.). Island Press: Washington, DC.Hughes DA. 2005. Hydrological issues associated with the determination of
environmental water requirements of ephemeral rivers. River Research
and Applications 21(8): 899–908. DOI: 10.1002/rra.857.IUCN (World Conservation Union). 2007. The 2007 IUCN Red List of
Threatened Species. IUCN: Gland, Switzerland. Available online: http://
www.iucnredlist.org
JenkinsM. 2003. Prospects for biodiversity. Science 302(5648): 1175–1177.DOI: 10.1126/science.1088666.
King JM, Tharme RE, De Villiers MS. 2008. Environmental flow assess-
ments for rivers: Manual for the building block methodology (Updated
Edition). WRC Report TT 354/08. Water Research Commission: Pre-toria, South Africa. Available online: http://www.wrc.org.za/Pages/Dis-
playItem.aspx?ItemID=3675&FromURL=%2fPages%2fKH_Advanced-
Search.aspx%3fa%3dKing%26start%3d1%26df%3d3%26dt%3d1%
26o%3d1%26as%3d1King J, Brown C, Sabet H. 2003. A scenario-based holistic approach to
environmental flow assessments for rivers. River Research and Appli-
cations 19(5–6): 619–639. DOI: 10.1002/rra.709.Kingsford RT. 2000. Protecting or pumping rivers in arid regions of the
world? Hydrobiologia 427: 1–11.Kiparsky M, Gleick PH. 2004. Climate Change and California Water
Resources. In The Worlds Water, Gleick P (ed.). Island Press: Washington.Kleynhans CJ. 2000. Desktop Estimates of the Ecological Importance and
Sensitivity Categories (EISC), Default Ecological Management Classes
(DEMC), Present Ecological Status Categories (PESC), Present Attain-
able Ecological Management Classes (Present AEMC), and Best Attain-able Ecological Management Class (Best AEMC) for Quaternary
Catchments in South Africa. DWAF Report, Institute for Water Quality
Studies: Pretoria, South Africa.Kleynhans CJ, Thirion C, Moolman J. 2005. A Level I River Ecoregion
Classification System for South Africa, Lesotho and Swaziland. Report
No. N/0000/00/REQ0104. Resource Quality Services, Department of
Water Affairs and Forestry: Pretoria, South Africa.Knight AT, Cowling RM, Campbell BM. 2006. An Operational Model for
Implementing Conservation Action. Conservation Biology 20(2): 408–419. Doi:10.1111/j.1523-1739.2006.00305.x.
Le Maitre DC, O’Farrell P. 2008. Social-Ecological Resilience in a Dry
Environment: People and Water Resources in the Little Karoo. In
Advancing Sustainability Science, Burns ME, Weaver AVB (eds).
SUN PRESS: Stellenbosch, South Africa.Le Maitre D, Colvin C, Maherry A. 2009. Water resources in the Klein
Karoo: the challenge of sustainable development in a water-scarce area.
South African Journal of Science 105: 39–48.Linke S, Pressey RL, Bailey RC, Norris RH. 2007. Management options for
river conservation planning: condition and conservation re-visited.
Freshwater Biology 52: 918–938. DOI:10.1111/j.1365-2427.2006.
01690.x.Malmqvist B, Rundle S. 2002. Threats to the running water ecosystems of
the world. Environmental Conservation 29: 134–153. DOI:10.1017/
S0376892902000097.
Margules CR, Pressey RL. 2000. Systematic conservation planning. Nature405: 243–253. DOI:10.1038/35012251.
Margules CR, Sarkar S. 2007. Systematic Conservation Planning. Univer-
sity Press: Cambridge.
MA (Millennium Ecosystem Assessment). 2005. Ecosystems and HumanWell-being: Synthesis. Island Press: Washington, DC; Available online:
http://www.maweb.org/en/products.aspx.
Meyer PS. 1999. An Explanation of the 1:500000 General HydrogeologicalMap, Oudtshoorn 3320. Department ofWaterAffairs and Forestry: Pretoria.
Midgley DC, Pitman WV, Middleton BJ. 1994. The Surface Water
Resources of South Africa 1990 (1st ed.). Volumes 1 to 6. Report Numbers
298/1.1/94 to 298/6.1/94 (text) and 298/1.2/94 to 298/6.2/94 (maps) andCD-ROM with selected data sets. Water Research Commission: Pretoria,
South Africa.
Milton SJ, Yeaton RI, Dean WRJ, Vlok JHJ. 1997. Succulent Karoo. In
Vegetation of southern Africa, Cowling RM, Pierce SM, Richardson DM(eds). Cambridge University Press: Cambridge, UK; 131–166.
Moolman J, Kleynhans CJ, Thirion C. 2002. Channel Slopes in the Olifants,
Crocodile and Sabie River Catchments. Internal Report No. N/0000/
00REH/0102. Department of Water Affairs and Forestry: Institute forWater Quality Studies, Pretoria, South Africa, 41 pp.
Murray BR, Zeppel MJB, Hose GC, Eamus D. 2003. Groundwater-depen-
dent ecosystems in Australia: it’s more than just water for rivers.Ecological Management and Restoration 4(2): 110–113. DOI:10.1046/J.1442-8903.2003.00144.x.
Naidoo R, Balmford A, Costanza R, Fisher B, Green RE, Lehner B,
Malcolm TR, Ricketts TH. 2008. Global mapping of ecosystem servicesand conservation priorities. PNAS 15(105): 9495–9500. DOI: 10.1073/pnas.0707823105.
Nel JL, Belcher A, Impson ND, Kotze IM, Paxton B, Schonegevel LY,
Smith-Adao LB. 2006. Conservation Assessment of Freshwater Biodi-versity in the Olifants/Doorn Water Management Area: Final Report.
CSIR Report Number CSIR/NRE/ECO/ER/2006/0182/C. CSIR: Stellen-
bosch, South Africa.Nel JL, Roux DJ, Maree GA, Kleynhans CJ, Moolman J, Reyers B, Rouget
M, Cowling RM. 2007. Rivers in peril inside and outside protected areas:
a systematic approach to conservation assessment of river ecosystems.
Diversity and Distributions 13: 341–352. DOI: 10.1111/j.1472-4642.2006.00308.x.
Copyright # 2010 John Wiley & Sons, Ltd. River Res. Applic. 27: 1298–1314 (2011)
DOI: 10.1002/rra
A SPATIAL ASSESSMENT OF RIVERINE ECOSYSTEMS AND WATER SUPPLY 1313
Nel JL, Roux DJ, Abell R, Ashton PJ, Cowling RM, Higgins JV, ThiemeM,
Viers JH. 2008. Progress and challenges in freshwater conservationplanning. Aquatic Conservation: Marine Freshwater Ecosystem 18: 1–12. DOI: 10.1002/aqc.1010.
Nel JL, Reyers B, Roux DJ, Richard M. 2009. Expanding protected areas
beyond their terrestrial comfort zone: identifying spatial options for riverconservation Cowling. Biological Conservation 142: 1605–1616. DOI:10.1016/j.biocon.2009.02.031.
Nilsson C, Reidy CA, Dynesius M, Revenga C. 2005. Fragmentation andflow regulation of the world’s large river systems. Science 308: 405–408.DOI: 10.1126/science.266.5186.753.
Omernik JM. 1987. Ecoregions of the conterminous United States. Annals
of the Association of American Geographers 77(1): 118–125.Palmer AR, Hoffman MT. 1997. Nama-karoo. In Vegetation of Southern
Africa, Cowling RM, Richardson DM, Pierce SM (eds). Cambridge
University Press: Cambridge.
Possingham HP, Ball IR, Andelman S. 2000. Mathematical Methods forIdentifying Representative Reserve Networks. In Quantitative Methods
for Conservation Biology, Ferson S, Burgman M (eds). Springer-Verlag:
New York; 291–305.Postel SL, Thompson BH Jr. 2005. Watershed protection: capturing the
benefits of nature’s water supply services. Natural Resources Forum 29:98–108. DOI:10.1111/j.1477-8947.2005.00119.x.
Revenga C, Campbell I, Abell R, De Villiers P, Bryer M. 2005. Prospects formonitoring freshwater ecosystems towards the 2010 targets. Philosophi-
cal Transactions of the Royal Society 360(1454): 397–413. DOI:10.1098/rstb.2004.1595.
RHP (River Health Programme). 2007. State of rivers report: Rivers of theGouritz Water Management Area. DWAF: Pretoria. Available online:
http://www.csir.co.za/rhp/state_of_rivers.html
Rodrıguez JP, Beard TD Jr, Bennett EM, Cumming GS, Cork S, Agard J,Dobson AP, Peterson GD. 2006. Trade-offs across space, time, and
ecosystem services. Ecology and Society 11(1): article 28. Available
online: http://www.ecologyandsociety.org/vol11/iss1/art28/
Rouget M, Cowling RM, Vlok J, Thompson M, Balmford A. 2006. Gettingthe biodiversity intactness index right: the importance of habitat degra-
dation data. Global Change Biology 12: 2032–2036. DOI: 10.1111/
j.1365-2486.2006.01238.x.
Roux DJ. 2001. Strategies used to guide the design and implementation of aNational River Monitoring Programme in South Africa. Environmental
Monitoring and Assessment 69: 131–158. 10.1023/A:1010793505708.Roux DJ, Nel JL, Ashton PJ, Deacon AR, de Moor FC, Hardwick D, Hill L,
Kleynhans CJ, Maree GA, Moolman J, Scholes RJ. 2008. Designingprotected areas to conserve riverine biodiversity: lessons from a hypothe-
tical redesign of the Kruger National Park. Biological Conservation 141:100–117. DOI:10.1016/j.biocon.2007.09.002.
Rowntree KM,Wadeson RA. 1999. A hierarchical geomorphological model
for the classification of selected South African rivers. WRC Report No.
497/1/99. Water Research Commission: Pretoria.
Sarkar S, Pressey RL, Faith DP, Margules CR, Fuller T, Stoms DM, MoffettA, Wilson KA, Williams KJ, Williams PH, Andelman S. 2006. Biodi-
versity conservation planning tools: present status and challenges for the
future. Annual Review of Environment and Resources 31: 123–159.DOI:10.1146/annurev.energy.31.042606.085844.
Smith RJ. 2005. Conservation Land-Use Zoning (CLUZ) software. CLUZ
guide version 1.6.Durrell Institute of Conservation and Ecology: Canter-
bury, UK. Available online: http://www.mosaic-conservation.org/cluz/Stats SA (Statistics South Africa). 2005. Natural resources accounts: Water
quality accounts for South Africa, 2000. Statistics South Africa: Pretoria,
South Africa.Swartz ER, Skelton PH, Bloomer P. 2009. Phylogeny and biogeography of
the genus Pseudobarbus (Cyprinidae): Shedding light on the drainage
history of rivers associated with the Cape Floristic Region. Molecular
Phylogenetics and Evolution 51: 75–84. DOI: 10.1016/j.ympev.2008.10.017.
Tharme RE. 2003. A global perspective on environmental flow assessment:
emerging trends in the development and application of environmental
flow methodologies for rivers. River Research and Applications 19: 397–442. DOI: 10.1002/rra.736.
Thieme M, Lehner B, Abell R, Hamilton SK, Kellndorfer J, Powell G,
Riveros J. 2007. Freshwater conservation planning in data-poor areas: anexample from a remote Amazonian basin (Madre de Dios River, Peru and
Bolivia). Biological Conservation 135(4): 484–501. DOI: 10.1016/j.bio-con.2006.10.054.
Thompson M, Vlok J, Rouget M, Hoffman MT, Balmford A, Cowling RM.2009. Mapping land transformation in a heterogeneous environment: a
rapid and cost effective approach for assessment and monitoring.
Environmental Management 43: 585–596. DOI: 10.1007/s00267-008-9228-x.
Tilman D, Cassman KG, Matson PA, Naylor R, Polasky S. 2002. Agricul-
tural sustainability and intensive production practices. Nature 418: 671–677. DOI:10.1038/nature01014.
USGS (United States Geological Survey). 2003. Shuttle Radar Topography
Mission (SRTM). Report No. 071-03. USGS Center for Earth Resources
Observation and Science: USA. Available online: http://egsc.usgs.gov/
isb/pubs/factsheets/fs07103.htmlVan den Berg EC, Plarre C, van den Berg HM, Thompson MW. 2008. The
South African National Land Cover 2000. Agricultural Research Council
(ARC) and Council for Scientific and Industrial Research (CSIR),
Pretoria. Report No. GW/A/2008/86.van Rensburg LD, Strydom MG, du Preez CC, Bennie ATP, le Roux PAL,
Pretorius JP. 2008. Prediction of salt balances in irrigated soils along the
lower Vaal River, South Africa. Water SA 34(1): 11–18.van Wyk AE, Smith GF. 2001. Regions of floristic endemism in SouthernAfrica. Umdaus Press: Hatfield, South Africa.
Young W, Kingsford RT. 2006. Flow variability in large unregulated dry
rivers. In Ecology of desert rivers, Kingsford RT (ed.). CambridgeUniversity Press: Cambridge; 47–75.
Zeman C, Rich M, Rose J. 2006. World water resources: trends, challenges,
and solutions.Reviews in Environmental Science and Biotechnology 5(4):333–346. DOI: 10.1007/s11157-005-4089-8.
Copyright # 2010 John Wiley & Sons, Ltd. River Res. Applic. 27: 1298–1314 (2011)
DOI: 10.1002/rra
1314 L. B. SMITH-ADAO ET AL.
Copyright © 2022 FDOKUMEN