A spatial analysis of the physical and social environmental correlates of discarded needles
10
A spatial analysis of the physical and social environmental correlates of discarded needles Luc de Montigny a,n , Anne Vernez Moudon b , Barbara C. Leigh c , Sun-Young Kim d a The Surveillance Lab, McGill University, Montre´al, Que´bec, Canada H3A 1A3 b Urban Design & Planning, University of Washington, USA c Alcohol and Drug Abuse Institute, University of Washington, USA d Environmental and Occupational Health Sciences, University of Washington, USA article info Article history: Received 16 July 2010 Received in revised form 12 January 2011 Accepted 22 January 2011 Available online 2 March 2011 Keywords: Needle disposal Injection drug users Discarded needles Spatial analysis Canada abstract The role that the urban environment plays in influencing drug users’ injection and needle disposal decisions is poorly understood. We identified potential attractors and deterrents of needle discarding, and then used a geographic information system (GIS) to quantify these factors for a neighborhood in Montre ´ al, Canada. In multivariate logistic regression, discarded needles were found to have more associations with physical factors than with social factors. Visual exposure and proximity to a single- room occupancy hotel, a payphone, an adult service or a pawnshop were important physical environmental predictors. These findings are discussed in relation to developing public health and urban design-based harm reduction approaches to needle discarding in public space. & 2011 Elsevier Ltd. All rights reserved. 1. Background 1.1. Discarded needles Discarded needles and syringes (hereafter ‘‘discarded needles’’ or simply ‘‘discards’’) are those used by injection drug users (IDUs) and then abandoned in public places. Discarded needles cause critical harm, both directly and indirectly. Discards are a sign of serious social breakdown and incivility (Innes, 2004). There is a widely held and understandable, yet false, belief that discards readily transmit blood-borne pathogens. Although laboratory testing has shown that blood-borne viruses survive in needles long enough to justify concerns about needle-stick infections (Thompson et al., 2003), very few infections have ever been documented for non-medical needle-sticks (Garcia-Algar and Vall, 1997; Libois et al., 2005), even in situations where needle-sticks were relatively frequent (CPS Infectious Diseases and Immunization Committee, 2008; Lawitts, 2002) or in cases when post-stick anti-viral therapy was not administered (O’Leary and Green, 2003; Russell and Nash, 2002). Non-drug using populations view discards with fear and repulsion. Thus discards reduce the quality of life of the residents and merchants blood-borne who encounter them. Moreover, concerned citizens may direct their resentment into organized opposition to much-needed services for IDUs, such as the closing of life-saving needle exchange programs (NEPs) (Broadhead et al., 1999). Traditional strategies for reducing discards have focused on restricting access to injecting equipment, making it illegal for IDUs to carry injecting equipment, and directing police to target IDUs, either formally (by enforcing anti-paraphernalia laws) or informally (stopping suspected IDUs and overtly patrolling outside NEPs). Yet limiting access to sterile equipment and prohibiting its possession have dire consequences on the health of IDUs, in terms of infection rates and injection-related injuries (Wodak and Cooney, 2006). Crackdowns by police tend to displace, rather than reduce drug use, increasing the number of discards and shifting them into previously unexposed neighborhoods (Wood et al., 2004). These negative consequences of current practices in reducing discards are particularly unfortunate, given that a majority of IDUs report preferring to use safe disposal options over unsafe methods of discarding (Neale, 1998). In contrast, drop-boxes represent a relatively new and promising strategy for combating discarded needles. These public-access, always-open, anonymous and safe facilities for needle disposal are relatively well accepted by host communities (Springer et al., 1999) and they have been associated Contents lists available at ScienceDirect journal homepage: www.elsevier.com/locate/healthplace Health & Place 1353-8292/$ - see front matter & 2011 Elsevier Ltd. All rights reserved. doi:10.1016/j.healthplace.2011.01.013 n Correspondence address: McGill Clinical & Health Informatics, 1140, av des Pins O, Montre ´ al, Que ´ bec, Canada H3A 1A3. Tel.: +514 934 1934x32999; fax: +514 843 1551. E-mail address: [email protected] (L. de Montigny). Health & Place 17 (2011) 757–766
-
Upload
washington -
Category
Documents
-
view
1 -
download
0
Transcript of A spatial analysis of the physical and social environmental correlates of discarded needles

Health & Place 17 (2011) 757–766
Contents lists available at ScienceDirect
Health & Place
1353-82
doi:10.1
n Corr
Montrea
E-m
journal homepage: www.elsevier.com/locate/healthplace
A spatial analysis of the physical and social environmental correlates ofdiscarded needles
Luc de Montigny a,n, Anne Vernez Moudon b, Barbara C. Leigh c, Sun-Young Kim d
a The Surveillance Lab, McGill University, Montreal, Quebec, Canada H3A 1A3b Urban Design & Planning, University of Washington, USAc Alcohol and Drug Abuse Institute, University of Washington, USAd Environmental and Occupational Health Sciences, University of Washington, USA
a r t i c l e i n f o
Article history:
Received 16 July 2010
Received in revised form
12 January 2011
Accepted 22 January 2011Available online 2 March 2011
Keywords:
Needle disposal
Injection drug users
Discarded needles
Spatial analysis
Canada
92/$ - see front matter & 2011 Elsevier Ltd. A
016/j.healthplace.2011.01.013
espondence address: McGill Clinical & Health In
l, Quebec, Canada H3A 1A3. Tel.: +514 934 193
ail address: [email protected] (L
a b s t r a c t
The role that the urban environment plays in influencing drug users’ injection and needle disposal
decisions is poorly understood. We identified potential attractors and deterrents of needle discarding,
and then used a geographic information system (GIS) to quantify these factors for a neighborhood in
Montreal, Canada. In multivariate logistic regression, discarded needles were found to have more
associations with physical factors than with social factors. Visual exposure and proximity to a single-
room occupancy hotel, a payphone, an adult service or a pawnshop were important physical
environmental predictors. These findings are discussed in relation to developing public health and
urban design-based harm reduction approaches to needle discarding in public space.
& 2011 Elsevier Ltd. All rights reserved.
1. Background
1.1. Discarded needles
Discarded needles and syringes (hereafter ‘‘discarded needles’’or simply ‘‘discards’’) are those used by injection drug users(IDUs) and then abandoned in public places. Discarded needlescause critical harm, both directly and indirectly. Discards are asign of serious social breakdown and incivility (Innes, 2004).There is a widely held and understandable, yet false, belief thatdiscards readily transmit blood-borne pathogens. Althoughlaboratory testing has shown that blood-borne viruses survivein needles long enough to justify concerns about needle-stickinfections (Thompson et al., 2003), very few infections have everbeen documented for non-medical needle-sticks (Garcia-Algarand Vall, 1997; Libois et al., 2005), even in situations whereneedle-sticks were relatively frequent (CPS Infectious Diseasesand Immunization Committee, 2008; Lawitts, 2002) or in caseswhen post-stick anti-viral therapy was not administered (O’Learyand Green, 2003; Russell and Nash, 2002).
ll rights reserved.
formatics, 1140, av des Pins O,
4x32999; fax: +514 843 1551.
. de Montigny).
Non-drug using populations view discards with fear andrepulsion. Thus discards reduce the quality of life of the residentsand merchants blood-borne who encounter them. Moreover,concerned citizens may direct their resentment into organizedopposition to much-needed services for IDUs, such as the closingof life-saving needle exchange programs (NEPs) (Broadhead et al.,1999).
Traditional strategies for reducing discards have focused onrestricting access to injecting equipment, making it illegal for IDUsto carry injecting equipment, and directing police to target IDUs,either formally (by enforcing anti-paraphernalia laws) or informally(stopping suspected IDUs and overtly patrolling outside NEPs). Yetlimiting access to sterile equipment and prohibiting its possessionhave dire consequences on the health of IDUs, in terms of infectionrates and injection-related injuries (Wodak and Cooney, 2006).Crackdowns by police tend to displace, rather than reduce druguse, increasing the number of discards and shifting them intopreviously unexposed neighborhoods (Wood et al., 2004).
These negative consequences of current practices in reducingdiscards are particularly unfortunate, given that a majority of IDUsreport preferring to use safe disposal options over unsafe methodsof discarding (Neale, 1998). In contrast, drop-boxes represent arelatively new and promising strategy for combating discardedneedles. These public-access, always-open, anonymous and safefacilities for needle disposal are relatively well accepted by hostcommunities (Springer et al., 1999) and they have been associated

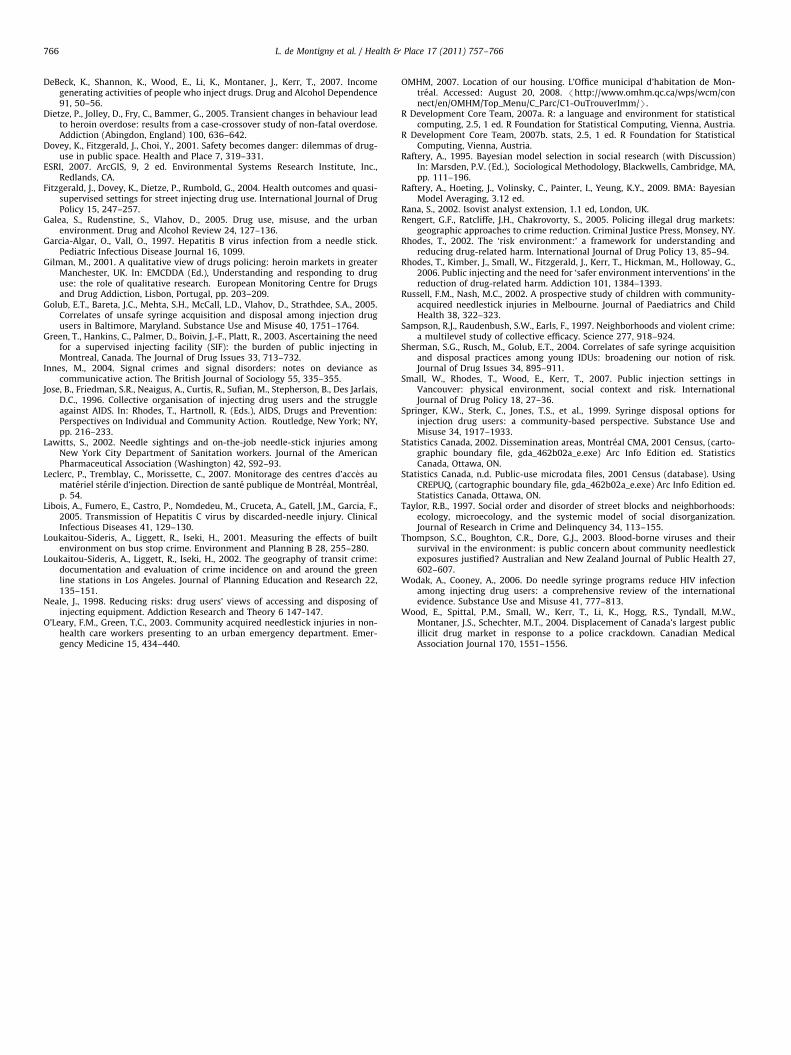
Fig. 1. Conceptual model of the ecology of public injecting and discarding
L. de Montigny et al. / Health & Place 17 (2011) 757–766758
with high decreases in discards (up to 90% reduction), althoughtheir effectiveness may diminish with distance (de Montigny et al.,2010).
Regardless of the strategies used to reduce discards, being ableto predict, where discards will occur would allow service provi-ders to better target harm reduction efforts. Specifically, it wouldbe useful to identify the environmental attractors of discarding.Knowing what these attractors are would also support interven-tions on the environment, moving or removing attractors oradding deterrents. Such interventions could provide additionaltools for discouraging discards around sensitive areas, such asschools and children’s play areas.
Little is known about the environmental aspects of discarding.Published literature on discarding behavior is limited and focuseson non-spatial aspects, such as who discards and how oftendiscarding occurs (Cleland et al., 2007; Golub et al., 2005;Sherman et al., 2004). Anecdotal evidence suggests that certainspaces are more heavily affected than others, and that the spatialdistribution of discards may be clustered even within a high druguse neighborhood. Evidence on where public injection, the sourceof discards, takes place, indicates that injection and disposalchoices made by IDUs are influenced by identifiable features oftheir physical as well as social surroundings (Galea et al., 2005).
Drug users must navigate many obstacles to obtain and usedrugs. These activities take place in space, mostly urban spaces(Rhodes, 2002). Thus the urban environment plays a key role inshaping IDUs’ behavior, which is influenced by social, structural,and situational factors (Jose et al., 1996). Public injectors them-selves have reported environmental considerations as part oftheir rationale for choosing a location for public injection, show-ing some consensus in their preferences (Green et al., 2003).
1.2. Study aims
In this research we sought to clarify the environmentalcontexts of discarding, at the scale where injection and disposaldecisions were made, in order to help service-providers andpublic health officials locate safe needle-disposal programs andmanage the negative externalities associated with the use ofinjection drugs. Specifically, we aimed to identify physical andsocial environmental factors associated with discarded needles,which could serve as a proxy for public injection.
1.3. Conceptualizing the ecology of public injecting and needle
discarding
When injecting in public, IDUs prioritize: (1) avoiding detection,especially by police; (2) minimizing time between acquiring andinjecting drugs; and (3) finding a relatively safe, clean and quietplace (Green et al., 2003). Thus characteristics of the physicalenvironment determine what prospects an area offers for theacquisition, use and disposal of drugs and needles. Characteristicsof the social environment determine how those opportunities aremoderated by formal and informal social controls. Fig. 1 illustratesour approach to identify and organize environmental factors by theirexpected influence on public injecting and discarding decisions. Theconceptual diagram is based on the hypotheses that: (1) IDUs willseek out certain types of places to inject and will discard the needlenear where the injection occurs, and (2) places of public injectionand discard are typically located in close proximity to where IDUsobtain drugs. Influences on the IDU behavior include the physicalenvironment, which provides a range of public places within whichthe IDU behavior occurs, each with its own characteristics. They alsoinclude the social environment in that non-IDUs, such as residents,
merchants and law enforcement officers, limit access to and controluse of certain places more than others.
Within this framework, we conceived of three types of spacesassociated with IDU behavior: spaces for (1) drug acquisition,(2) injection, and (3) needle disposal. These spatial constructsserved to identify and select independent variables of the physicalenvironment. Acquisition anchors encompass features of the builtenvironment that represent starting places for the acquisition ofdrugs or injection equipment. Opportunity spaces encompasslocations in which public injection could take place, and thecharacteristics of these spaces that could modify their suitabilityfor public injection. Disposal options encompass facilities thatprovide the means to dispose of soiled needles, either safely orunsafely.
A fourth construct, that of social controls serves to identify andselect variables describing the social environment (influenceshown as dotted lines in Fig. 1). Social controls encompassindirect measures of social efficacy. Social actors can exerciseformal control, such as the key activities of police and privatesecurity, as well as the informal control of intolerant residents.Control can be active (e.g., search and seizure by police) or passive(e.g., presence of a patrol car).
2. Methods
2.1. Setting
A 2001 estimate placed the Montreal IDU population between4300 and 12,500 individuals (Archibald et al., 2001), with thedrug of choice being cocaine, which was associated with frequentdaily injections (Green et al., 2003). The study area (shown inFig. 2), part of the Sainte-Marie neighborhood, is centered on themost active injection drug use area of the city (Leclerc et al.,2007). Sainte-Marie is known to be home to a long-standingpopulation of IDUs, as well as being one of the city’s centers fordrug sales.
2.2. Research design
We used a spatial case-control approach to estimate the effectsof the physical and social environments on the likelihood of agiven location having been the site of one or more discards(a case) vs. having been the site of zero discards (a control). Theunit of sampling and analysis was the point (xy coordinate) wherediscards were collected or where the control site was selected.

Fig. 2. Map of study area
Fig. 3. Map of the sampling frame
L. de Montigny et al. / Health & Place 17 (2011) 757–766 759
2.3. Data and measurement
2.3.1. Discarded needles
2.3.1.1. Data collection. This study used discarded needle datacollected by Spectre de rue (Street Specter), which recovered dis-cards from all non-park, publicly accessible open spaces fromJanuary 2001 to December 2006. Street Specter, a not-for-profitcommunity organization primarily serving IDUs, collected dis-carded needles through two coordinated programs. The mainprogram employed a full-time staff to conduct weekly discard‘‘sweeps’’ of the study area. The complementary program, namedTapaj, periodically hired street youth to clean targeted alleys,vacant lots and other open spaces. All discards found during thesweeps and the clean-ups were collected, documented anddestroyed. The boundaries of the sweep program defined thestudy area. Discard sites were relatively evenly distributed acrossfour location types: 297 (21%) in alleys, 312 (22%) in parking lots,326 (23%) on sidewalks and 481 (34%) in other locations. Addi-tional details on the collection of discard data can be foundelsewhere (de Montigny et al., 2010).
Needles discarded in city parks were excluded from thesample. Street Specter did not collect discards in parks, as thesewere the jurisdiction of the Public Works department of the Cityof Montreal. Frequent turnover of City staff and logistic difficul-ties led to the loss of more than half of the monthly records ofpark discards for the study period. Moreover the documentationwas of lower spatial precision than that of non-park discards.Many of the non-park data were missing for the 2004 calendaryear, and were excluded from the analysis.
2.3.1.2. Control sampling. The case points consisted of all discretelocations at which one or more discards were collected by StreetSpecter. Between the weekly sweeps and the clean-up efforts, StreetSpecter reported collecting 11,285 individual discards at 1713 dis-crete locations. The documentation for 241 of these locations (14% oftotal) was insufficiently precise for accurate geocoding. Those dis-cards locations were omitted, leaving a valid sample of 1472 locationswhere one or more discard was collected during the study period.Positional error was estimated to be less than 5 m.
For each case, three control points were selected using strati-fied random sampling, where strata were defined by the type oflocation where discards were typically found (alley, sidewalk,
parking lot or other). The sample included 4416 controls matchedto 1472 cases on location type, but otherwise followed a model ofcomplete spatial randomness within the sampling frame (Fig. 4).To match the potential spatial distribution of cases, control pointswere constrained to the area covered by the Street Specter sweepsand clean-up efforts.
The sampling frame was composed of all publicly accessibleoutdoor spaces with the exception of street rights-of-way (wherevehicular traffic deterred opportunities for injection); parks(where discards were not collected by Street Specter); and theprivate open space surrounding one office building that con-ducted its own, undocumented, discard sweeps. The samplingframe, shown in Fig. 3, totaled 0.89 km2 (221 acres), representing38% of the study area.
2.3.2. Environmental factors
Table 1 lists the factors considered in the study. Individualvariables are recorded for each type of space defined in theconceptual framework, with some variables potentially playingmultiple roles in the ecology of injection and therefore fitting intomore than one type of space. The table also includes the datasource, the type of measurement for each variable, and eachvariable’s hypothesized relationship with discarded needles.Variables also are listed by organizing construct below (show insquare brackets).
2.3.2.1. Physical environment
2.3.2.1.1. Variables. The acquisition anchors construct includedlocations where drugs could be acquired (bars, bus shelters, andbus stops); facilities for contacting drug sellers (payphones);places where shadow-work could take place (metro entrance,liquor stores, adult services, such as saunas, massage parlors, andstrip clubs), or be exchanged for money (automated tellermachines (ATMs), pawnshops); the home location of IDUs

Table 1Environmental factors considered as potential attractors or deterrents of discarded needles, with data source and measurement.
Environmental factors Hypothesized relationshipa Source of data Type of measurementb
Acquisition anchorsDrug acquisition
Bar m Env. audit Walking distance
Bus shelter m Env. audit Walking distance
Bus stop m Env. audit Walking distance
Payphone m Env. audit Walking distance
Needle-washing site m Informants Walking distance
Funding acquisition
Adult servicec m Env. audit Walking distance
Automated teller machine m Env. audit Walking distance
Liquor store m Env. audit Walking distance
Metro entrance m Env. audit Walking distance
Pawnshop m Env. audit Walking distance
Shelter m Env. audit Walking distance
Single room occupancy hotel m Env. audit Walking distance
Needle acquisition
Needle exchange programd m Health Dept Walking distance
Pharmacyd m Env. audit Walking distance
Opportunity spacesPotential injection sites
Dumpsterd m Env. audit Walking distance
Hiding place m Env. audit Walking distance
Access and exposure
Embeddedness mk Env. audit Walking distance
Visual exposure mk Env. audit Isovist field
Artificial lighting mk Env. audit Straight-line distance
Disposal optionsSafe
Needle exchange programd k Health Dept Walking distance
Pharmacyd k Env. audit Walking distance
Unsafe
Dumpsterd k Env. audit Walking distance
Garbage bin k Env. audit Walking distance
Social controlsPolice activity
Police station k Env. audit Walking distance
Neighborhood susceptibility
Family mobility m Census % of total families
Low income m Census % of total families
Male unemployment m Census % of total population
Renter-occupier m Census % of total families
Single female-headed family m Census % of total families
Visible minority m Census % of total population
Public housing m Env. audit Walking distance
Land-use composition
Residential density m Tax records Dwelling units/acre
Commercial coverage m Tax records % of land area
Gentrification (2005–2007)
Commercial rent increase k Tax records % increase
Property value increase k Tax records % increase
a Hypothesized: m Attractor; k Deterrent; mk Complex relationship (quadratic).b Walking distance is in meters to nearest feature (e.g., distance from case/control point to nearest bar); straight-line distance and isovist field are explained in the
text.c Adult services include strip clubs, massage parlors, saunas and sex stores.d Factors are listed twice if they had divergent potential relationships to discards.
L. de Montigny et al. / Health & Place 17 (2011) 757–766760
(shelters, single-room occupancy hotels (SROs)); and facilitiesthat provide sterile needles (NEPs, pharmacies).
The opportunity spaces construct included specific places, suchas stairwells and doorways (hiding places) and behind trashcontainers (dumpsters). In addition to the spaces themselves,we considered characteristics of these spaces, which includedlevels of exposure (visual exposure, artificial lighting) and acces-sibility (embeddedness—the distance from nearest public right-of-way).
The disposal options construct included safe disposal facilities(NEPs, pharmacies) and unsafe facilities (garbage bins, dump-sters). Discarding, the least safe disposal option, required nofacilities.
2.3.2.1.2. Data collection. Data for the majority of the physicalenvironment factors were collected in situ through an environ-mental audit. The City of Montreal provided a highly detaileddigital map of the study area, showing such objects as buildingfootprints, street rights-of-way and alleys, bus shelters, fencelines, public structures and light standards. Using print-outs ofthe map, one author and two research assistants walked everysidewalk and alley in the study area, and recorded the location ofmissing features, such as commercial establishments (e.g., bars,adult services, and liquor stores), payphones, ATMs, and hidingplaces. This information was then geocoded and overlaid onto thedigital map to create a geospatial data-set. The locations of theNEPs were obtained from the Montreal Health Department.

L. de Montigny et al. / Health & Place 17 (2011) 757–766 761
Our community partners identified and plotted a unique potentialconfounder. Specter staff informed us that during part of thestudy period a hotel located in the study area had operated as ashooting gallery and a relatively stable point of drug sales. Onmultiple occasions the hotel’s garbage bags had been stolen forthe used needles they contained. It is believed that IDUs removedthe needles to ‘‘wash’’ them, i.e., recover and inject drug residue.These needles subsequently were discarded in large numbers inthe alleys and parking lots adjacent to the hotel.
2.3.2.1.3. Data processing. The data were processed in GIS tomap and measure physical environmental features of interest,and access and exposure. All environmental measures were takenfrom the perspective of a person standing or walking throughoutdoor space. Since the discarding observed occurred in publiclyaccessible outdoor spaces other than trafficked streets, it wasappropriate to assume that IDUs moved on foot and not in cars.Also, because the study area was small and IDUs moved through itby walking, fine-grained distance measures best captured thepossible influence of the environment on behavior, including theIDU’s perception and experience of the immediate environment.
Measurement was performed using one of four GIS-basedtechniques. For variables capturing features of the built environ-ment that occupied a discrete location (i.e., point-referenceddata), distances were measured as those covered by walking fromeach case/control point to the closest feature (e.g., closest pay-phone). The accessibility variable, embeddedness, was measuredusing the walking distance from a case/control point to thenearest street right-of-way; the GIS technique is identical to theabove distance measure, except it was based on line features.Exposure variables required more complicated measurementtechniques. For visual exposure, we used isovist fields (Batty,2001): for all publicly accessible outdoor spaces, we delineatedthe area contained within a line-of-sight which was uninter-rupted by buildings or fences. Finally, artificial lighting wasmeasured using the uninterrupted straight-line distance betweenpublicly accessible spaces and the nearest source of artificial light.
A full description of the GIS-based mapping process andmeasurement techniques is available elsewhere (de Montigny,2008).
2.3.2.2. Social environment
2.3.2.2.1. Variables. The social controls construct included mea-sures of police presence (police station); neighborhood suscept-ibility (family mobility, low income, male unemployment, renter-occupier, single female-headed family, visible minority, publichousing); land-use composition (residential density, commercialcomposition); and gentrification (changes to residential propertyvalue and commercial rent).
2.3.2.2.2. Data collection. Data for the social environment fac-tors were obtained from secondary sources, as well as from theenvironmental audit. Data for the neighborhood susceptibilityfactors came from the 2001 Canadian census (Statistics Canada,n.d., 2001), and were geocoded using digital boundary files of thedissemination areas in the study area (Statistics Canada, 2002).Dissemination areas are the smallest geographical unit for whichCanadian census data are released to the public; they have atarget population of 400–700 residents. Data for land-use com-position and gentrification were obtained from the City ofMontreal tax roles (City of Montreal, 2007), and were geocodedusing digital boundary files of the tax parcels for the study area.The locations of public housing units were obtained from Mon-treal’s municipal housing office (OMHM, 2007). The location ofthe police station was mapped during the environmental audit.
2.3.2.2.3. Data processing. Measurement for the point-basedvariables, public housing and police station, were based on walking
distance as described above. Variables derived from areal data(census and parcel data) were measured by assigning the value fora given dissemination area (e.g., percentage of families living onlow income) to all case or control points falling within thatdissemination area (DA); parcel data were first aggregated to thedissemination area-level (e.g., average increase in commercial rentfor each dissemination area), then assigned to case/control points.
2.4. Analysis
We used logistic regression to test the association betweenenvironmental characteristics and the presence or absence ofdiscards. To guide variable selection, we used Bayesian ModelAveraging (BMA), which accounts for model uncertainty inherentin the selection process (Raftery, 1995).
Social variables were hypothesized to have linear relationshipswith discards. Variables measured based on distance to discretephysical features were considered to have a logarithmic relation-ship with discards, because spatial influence is greater at shorterdistances. For example, moving from 1 to 10 m away from apayphone is unlikely to have the same effect as moving from 101to 110 m away. To facilitate the interpretation of the modelresults, we inversed all distance measures to convert them to‘‘proximity’’ measures, thus a positive association was evidencethat the variable acted as a discard attractor, and a negativeassociation evidence of a deterrent.
In addition to the linear and log–linear relationships, weassessed the significance of quadratic terms for the access andexposure variables: embeddedness, visual exposure and artificiallighting. IDUs may seek out a location for public injection that ishidden enough to avoid apprehension by police, but not so hiddenas to prove fatal in the case of an overdose (Dovey et al., 2001). Atnight, light is needed to inject, yet too much light will drawattention to the act. Privacy requires at least stepping off thesidewalk, but walking far down an alley only delays a much-needed fix.
Coding, manipulation and measurement of geospatial datawork was performed using ArcGIS, version 9.2 (ESRI, 2007), withthe Hawth’s Tools (Beyer, 2007), Isovist Analyst (Rana, 2002) andSpatial Analyst (ESRI, 2007) extensions. Our computations werebased on software packages in the open-source computer lan-guage R, version 2.5.1 (R Development Core Team, 2007a).Regression modeling was performed within the stats packageusing the function glm (R Development Core Team, 2007b).Bayesian Model Averaging tools were taken from the BMA
package (Raftery et al., 2009).
3. Results
3.1. Sample description
A visual inspection of Fig. 4 revealed clear clustering of casepoints (discards) compared to control points; the locations atwhich discards were reported were not uniformly or randomlydistributed. This observation corroborated experience in the field.Even when controlling for location type, different spaces haddifferent levels of discards. For example, many discards werecollected from certain alleys, while other alleys had few discards.
The range of the values for the distance-based measures wasconsiderable (see Table 2), with some points falling on physicalfeatures themselves (minimum value for bus shelter: 0), whileother points fell more than a 1.6-km (1-mile) walk away from theclosest feature (e.g., liquor store, metro entrance). Median dis-tance values varied from about 50–1000 m. Median values for allhypothesized attractors were smaller for cases than controls.

Fig. 4. Maps of the case and control points
1 In previous work using longitudinal methods, we found that the installation
of dropboxes was associated with a strong decrease in discarded needles
(de Montigny et al., 2010). The Montreal program had targeted discard ‘‘hotspots,’’
by placing dropboxes in areas where disproportional numbers of discards were
known to cluster. This crucial cause-and-effect (first elevated discards, then
dropbox, then reduction in discards) would be lost in cross-sectional analysis,
such as the one used here due to the limitations of the environmental data
collection. To avoid showing a misleading positive association between dropboxes
and discards, we chose to omit dropboxes from this study.
L. de Montigny et al. / Health & Place 17 (2011) 757–766762
Median distance and number of features were inversely propor-tional in most cases. Smaller median distances for variables withmore features (e.g., shelters vs. SRO hotels) reflected higherclustering of the features.
3.2. Regression analysis
Of the 32 individual variables considered, 14 were retained inthe regression model and had associations with discards that weresignificant at the 0.05-level (see Table 3). Proximity to bus shelters,bus stops, payphones, the needle-washing site, adult services,metro entrances, pharmacies, pawnshops and hiding places waspositively associated with discard locations, as was the proportionof commercial land-use (percent of private land in a given dis-semination area occupied by commerce). Proximity to familymobility (percent of all families within a given dissemination areathat were living elsewhere in the previous five years) was nega-tively associated with discard locations. Of the three access andexposure variables we tested for a quadratic relationship withdiscards, the quadratic term was significant for embeddednessonly. Proximity to nearest right-of-way was positively associatedwith discards from 0 to 53 m, then became negatively associatedfor greater distances (all else being equal). Visual exposure waslinearly and negatively associated with discard locations.
As an illustration of how to interpret odds ratios in thiscontext: When holding all other variables constant, the probabi-lity of finding a discard at the foot of a payphone was 39.1% (CI:27.9–51.6%), compared to a 10.2% probability (CI: 8.9–11.6%) offinding a discard three city blocks away (300 m from the nearestpayphone). The probability of finding a discard in an open parkinglot (visual exposure of 3500 m2) was 11.9% (CI: 10.7–13.2%),compared to a 24.2% probability (CI: 20.5–28.3%) of finding adiscard in a narrow alley (visual exposure of 300 m2). There was a19% probability (CI: 15.6–22.9%) of finding a discard at a location
in a DA with the minimum level of mobility (32.4% of families),which was almost twice the probability (11.0%, CI:9.6–12.7%) of finding a discard at a location where mobility washighest (81.5% of families). The probability of finding a discard ata location in a DA with no commercial land-use was 12% (CI:10.8–13.5%), which was half the probability (25.2%, CI: 20.4–30.7%) of finding a discard when the land-use composition was29.5% commercial.
4. Discussion
This work presented a novel approach to research on needlediscarding and public injection. We considered IDU spatial beha-vior at the intra-neighborhood level to explain the clustering ofdiscarded needles. Using multivariate logistic regression, wefound that the physical features of urban spaces – representingthe locations of drug and funding acquisition (acquisitionanchors), and potential injection sites (opportunity spaces) andtheir accessibility and exposure – were associated significantlywith discards. Although to a lesser extent, some of the socialcharacteristics of the environment were also significant predic-tors. No measure of locations of disposal options, either safe orunsafe, had a significant negative association with discards.1
4.1. Acquisition anchors
Discards were more likely to be found near bus stops, pay-phones, adult services, pawnshops and single-room occupancyhotels (SROs). Transit facilities have been associated with marginalactivity and crime (Loukaitou-Sideris et al., 2001, 2002). Bus stopscan provide cover for drug sellers ‘‘working a corner’’ or drug buyerswaiting for a drop-off. The finding for payphones was in keepingwith the qualitative literature, which reported that fluid drugmarkets meant that sellers went to their buyers once a phone callsignaled adequate funds (Barendregt et al., 2006; Blanken et al.,2001; Gilman, 2001). The significance of adult services could beexplained by a connection between massage parlors, strip clubs,saunas and injection drug use, by way of prostitution. The literaturehas long recognized the connection between prostitution and druguse (for a concise review, see DeBeck et al., 2007). Similarly, SROshave been associated with prostitution and shooting galleries, aswell as with providing day-by-day shelter to IDUs, who may havetrouble finding or affording more stable housing. Pawnshops havebeen associated with injection drug use as facilitators of shadow-work that IDUs may use to finance their addictions by pawningtheir own belongings or fencing stolen goods.
Proximity to pharmacies, a measure of both potential needleacquisition and potential safe disposal, was positively associatedwith discard locations. This significant association was surprisingbecause responses to a survey conducted with study area phar-macists suggested that pharmacies were used very little by IDUseither for acquiring or disposing of needles (data not shown;available from the corresponding author).
Not significantly associated with discards were the locations ofgarbage bins, bars, bus shelters, ATMs, shelters, dumpsters, liquorstores, metro entrances, and NEPs. Though the needle-washing

Table 2Summary statistics of physical and social environmental characteristics of discarding vs. non-discarding sites in a neighborhood of Montreal.
Potential correlates Cases Controls
n Min Median Max Min Median Max
Acquisition anchorsDrug acquisition
Bar (m) 36 3 149 815 3 246 784
Bus shelter (m) 22 0 187 593 3 221 629
Bus stop (m) 74 0 91 540 1 126 613
Payphone (m) 76 0 89 604 1 138 573
Needle-washing site (m) 1 4 973 1970 7 1040 2,200
Funding acquisition
Adult service (m) 11 3 269 1078 1 393 1164
ATM (m) 20 4 262 1236 7 355 1331
Liquor store (m) 2 4 552 1541 6 653 1692
Metro entrance (m) 10 13 576 1718 6 778 1,883
Pawnshop (m) 9 1 318 961 7 401 1132
Shelter (m) 8 7 295 1041 3 334 1022
SRO hotel (m) 14 16 623 1579 3 834 1727
Needle acquisition
NEP (m) 3 10 419 1485 3 556 1466
Pharmacy (m) 4 1 357 905 9 432 1052
Opportunity spacesPotential injection sites
Dumpster (m) 33 3 169 699 1 213 809
Hiding place (m) 509 0 52 611 0 89 584
Access and exposure
Embeddedness (m) n/a 0 16 119 0 10 140
Visual exposure (m2) n/a 3 2248 7844 10 2823 7844
Artificial lighting (categories) Count (%) Count (%)
o5 m to nearest light n/a 126 (12) 386 (12)
5–30 m n/a 717 (68) 2245 (70)
430 m n/a 211 (20) 558 (18)
Disposal optionsSafe
NEP (m) 3 10 419 1485 3 556 1466
Pharmacy (m) 4 1 357 905 9 432 1052
Unsafe
Dumpster (m) 33 3 169 699 1 213 809Garbage bin (m) 333 1 53 600 1 77 549
Social controlsPolice activity
Police station (m) 1 108 1016 1761 6 1019 1874Neighborhood susceptibility
Family mobility (%) n/a 32 67 82 32 68 82Low income (%) n/a 15 45 72 6 44 72Male unemployment (%) n/a 13 31 64 13 31 64Renter-occupier (%) n/a 52 84 97 36 82 97Single female-headed family (%) n/a 0 16 56 0 16 56Visible minority (%) n/a 0 13 42 0 14 42Public housing (m) 46 1 205 741 3 257 968
Land-use composition
Residential density (DUA) n/a 2.8 19.4 170.8 2.8 17.8 170.8Commercial coverage (%) n/a 0.0 5.3 29.5 0.0 2.5 29.5
Gentrification (2004–2007)
Commercial rent (% change) n/a 0.0 46.8 72.6 0.0 46.8 72.6Property value (% change) n/a 28.7 58.5 64.5 28.7 58.9 64.5
n: Number of features in the study area (e.g., number of individual hiding places).
DUA: Dwelling units per acre.
L. de Montigny et al. / Health & Place 17 (2011) 757–766 763
site variable had a strong association with discards, it representeda particular and unique event, and should be viewed more acontrol variable used to adjust the association of the other, morerepresentative variables.
4.2. Opportunity spaces
Our findings regarding associations between discarding andopportune locations and environmental conditions for injection
were in partial agreement with the literature. Dovey et al. (2001)built the theory that the ‘‘liminality’’ of open spaces – which wemeasured as visual exposure and embeddedness – had quadratic(first positive then a negative) influence on public injection. Theyshowed qualitative evidence that IDUs would seek out spaces thatwere removed from the public eye enough to avoid detectionduring injection, but not so concealed that overdosing wouldprove fatal. In our study, embeddedness also had a quadratic, butrelatively weak association with discards; the walking distance

Table 3Odds ratios and 95% confidence intervals of physical and social environmental
correlates of discarded needles in a neighborhood of Montreal, 2001–2006
Variables Expectedrelationship
Odds ratio (95% CI)
Acquisition anchorsDrug acquisition
Bus stop (log m) m 1.18 (1.07–1.31)
Payphone (log m) m 1.36 (1.22–1.50)
Needle-washing site (log m) m 1.77 (1.57–1.99)
Funding acquisition
Adult service (log m) m 1.26 (1.13–1.40)
Pawnshop (log m) m 1.27 (1.13–1.42)
SRO hotel (log m) m 1.47 (1.32–1.63)
Needle acquisition
Pharmacy (log m) m 1.25 (1.12–1.39)
Opportunity spacesPotential injection sites
Hiding place (log m) m 1.12 (1.04–1.22)
Access and exposure
Embeddedness (10 m) mk 1.23 (1.14–1.34)
Squared embeddedness 0.98 (0.97–0.99)
Visual exposure (log m2) mk 0.70 (0.64–0.77)
Social controlsNeighborhood susceptibility
Family mobility (%) m 0.99 (0.98–0.99)
Land-use composition
Commercial composition (%) m 1.03 (1.02–1.04)
Legend: m Positive; k Negative; mk Quadratic.
Study period excludes 2004 due to missing discard data.
The log-inverse of the distance was used as a proximity measure to facilitate
interpretation of the model results; a positive association was evidence that the
variable acted as a discard attractor, and a negative association evidence of
deterrence.
L. de Montigny et al. / Health & Place 17 (2011) 757–766764
from a given location to the nearest street was positivelyassociated with discards from 1 to 53 m, and then was negativelyassociated for greater distances. We found no evidence of aquadratic association for visual exposure. Yet visual exposuredid appear to be a strongest deterrent to discarding. This findingwas in keeping with the literature on public injection (Small et al.,2007). Along with the importance of visual privacy, we found thathiding places, such as alcoves, recessed doorways and staircases,also were associated significantly with discard locations.
4.3. Social controls
Given the importance ascribed in past research to the socialdeterminants of marginalized behavior, the results of our studywere surprising. Only the measure of family mobility was sig-nificantly, but negatively associated with discards, suggestingthat higher residential turn-over played a protective role. Theapparent lack of influence of susceptibility variables was unex-pected, but might be explained by the scale of our analysis. Drugsales cluster within cities and these geographic areas (‘‘hot-spots’’) share socio-demographic characteristics (Rengert et al.,2005). So, though socio-demographic factors influence drug use atthe scale of the city, these factors may be less important ininfluencing drug use within afflicted neighborhoods. The disse-mination area might have been too small a unit of data capturewith which to pick up the effects of the social environment or,more intriguingly, the social characteristics might have relativelylittle influence at the intra-neighborhood scale.
Regarding the influence of land use on discards, we found thatas the proportion of commercial space increased, so did thelikelihood of finding a discard. This finding supported one of twocompeting views summarized in the literature on illegal activity
and land-use composition: one that in commercial areas, shopperswere typically not residents and thus felt less responsible for thebehavior of others, and two, that in the same commercial areas,higher pedestrian flows represented more potential victims andprovided more cover for criminals (Sampson et al., 1997; Taylor,1997). The finding did not support the second argument thatcommercial strips attract shoppers, thus increasing ‘‘eyes on thestreet,’’ which in turn deters crime (Crowe, 2000).
Failure to find an association, either positive or negative,between the police station and discarded needles may beexplained by the weak relationship between the location of thestation and the presence of police ‘‘on the street.’’ Though policepresence certainly is elevated in the immediate proximity of thestation, police presence beyond this perimeter is determined bypre-established patrol routes and dispatching in reply to com-plaints, not by distance to the station.
4.4. Implications for research and policy
Research on discarding has mostly fallen through the crackbetween drug epidemiology and environmental criminology,with, on one hand, the geographic aspects of drug markets havingbeen the subject of sophisticated quantitative analyses, and, onthe other hand, the spatial aspects of public injection having beenstudied using equivalently rigorous, but qualitative methods. Thisstudy addressed a gap in research by examining the long-termpatterns of discards in relation to fine-grained features of theurban environment and using sophisticated GIS-based metrics.
The identification of environmental correlates of discardsshowed that the behavior of IDUs was – to an extent – predictableand adaptive, and influenced measurably by their environmentalsettings. The findings suggested that physical interventions,whether through service provision or urban design, were promis-ing tools for reducing discarding and managing public injection.Our finding that discards were associated with distance measuresat the logarithmic scale is encouraging as it supports the theorythat the immediate environment matters most and its influence‘‘decays’’ relatively quickly with distance. Policy makers shouldnote that small-scaled, targeted interventions could have con-siderable effect on public injection and discarding.
Knowing which environmental features may attract, or at leastfacilitate, public injecting and discarding will allow public healthagencies and service providers to better target their harm reduc-tion efforts. Using key environmental features as guides for thelocation of safe disposal facilities, such as drop-boxes, shouldimprove their efficacy. It would also make clean-up efforts, suchas needle-sweeps, more efficient. The harm reduction literaturereports that transient and homeless IDUs discard most, which isto say that discards are a calling card of the hardest-to-reach.Knowing where to look to find discards should help outreachworkers contact these IDUs.
A relatively direct, if controversial and risky, application of ourfindings is ‘‘situational crime prevention.’’ The term, borrowedfrom environmental criminology, refers to design interventionsthat discourage illegal behavior by making targeted activitiesmore difficult or by increasing the risk of apprehension. Removingpayphones and bus shelters, moving bus stops, closing alleys, andbanning adult services and pawnshops would likely make a givenarea less attractive to IDUs. These interventions might reducepublic injecting, but more likely this inelastic behavior wouldonly be displaced. (Moreover, non-IDUs use payphones and busshelters too.) Situational crime prevention can be a good approachfor dealing with specific problems, such as discards recurring inspaces used by children, but when it is used as a blanket strategyit is more likely to hinder than to help (Rhodes et al., 2006).

L. de Montigny et al. / Health & Place 17 (2011) 757–766 765
Though managing public injection is discussed predominantlyfrom the perspective of benefits to host communities, Fitzgeraldet al. (2004) found evidence of a decrease in fatal overdoses whenpublic injection shifted to ‘‘semi-supervised’’ settings. Conversely,in their study of non-fatal overdose Dietze et al. (2005) found thatshifting from a private location to a public location tripled theodds of overdosing. Using design and social interventions to guideIDUs to inject in less isolated settings could save lives. Of course,tolerating public injection in specified open spaces is hardly goodpublic health policy or social justice. IDUs need and deserve saferinjection options, which should be coupled with treatment andsupport services—such as the safe injection site opened inVancouver in 2003, and recently proposed for Montreal for 2011(CBC.ca, 2010).
4.5. Study limitations
Police activity strongly influences the behavior of IDUs, yet wecould not obtain data on police presence or procedure other thanthe proxy measure of station location. It is not clear that omittingbetter measures biased our analysis, nor what effect includingbetter measures would have had on our findings. Of the variablesincluded in the models, few seem likely to have been related toboth discards and police activity. Areas with higher commercialcomposition may have been patrolled more frequently thanresidential areas; bars, SRO hotels and pawnshops could haveattracted more police attention than other commercial establish-ments, as could have shelters and public housing. On one handpolice activity (specifically crack-downs) has been associatedwith increased discarding (Cooper et al., 2005); on the other handroutine policing is thought to deter or displace illegal activitysuch as drug injection (Wood et al., 2004).
Our discard data represented only a sample of all needlesdiscarded in the study area during the study period. An unknownnumber of discards were collected by parties other than StreetSpecter and thus went unreported. Street Specter’s collectionefforts were thorough and systematic; the staff began sweepsearly in the morning, generally before business hours; StreetSpecter served as the go-to authority for discarded needles andfielded complaints by residents and business owners; and noother organized clean-up effort was in operation during thestudy period. Thus, with the possible exception of clean-up effortsby shelter and public housing staff speculated on earlier, we donot believe that the sample was biased.
Due to inadequate documentation, we were unable to geocode241 discard locations, which account for 14% of all reportedlocations. All of the omitted records came from the Tapaj program(all sweep discard locations were geocoded). To test for possiblebias due to omitting these records, we reran our model using onlysweep data (i.e., excluding all Tapaj data). There were no quali-tative differences between the results of the analysis of the twodatasets.
Data available on needles discarded in parks were less com-plete, less reliable and less spatially precise than the dataavailable for non-park discards. We limited our analysis to non-park spaces exclusively. Additional research is required to deter-mine if our findings can be generalized to parks.
Discarding is thought to be highly, but not perfectly explainedby public injection; IDUs do not always discard immediately afterinjecting, i.e., at the site of injection. Some environmental factorsmay influence discarding but not public injection, and vice versa.Though we believe that the correlation between patterns ofdiscards and patterns of public injection are high enough to makequalified inferences about public injection based on our findings,unscrambling shared and separate influences will require addi-tional research.
5. Conclusion
Discarding is a final step in a process that starts with theraising of funds, and proceeds with the acquisition of drugs andinjection equipment before moving on to the public injectionitself. The process is spatial, as each of these steps requires a spaceto host it. The results of a multivariate logistic regression largelysupported our hypothesis that physical environmental character-istics made some spaces more attractive to an IDU than others.We found that discards were associated with spaces typical ofwhere drugs were acquired and spaces where injection was likelyto take place. The study results also showed that tolerance of IDUsin these spaces and their movement between them might beinfluenced by other users of the space. Our findings may be usefulto public health and physical planning decision-makers in theirattempts to reduce the harm associated with injection drug use.
Acknowledgements
The authors thank our primary community partners, Spectre de
rue, without whose hard work and generous help the researchwould have been impossible. Specific recognition goes to DannyRaymond, who inspired the research, and Robert Beaudry andJean-Sebastien Mercier-Lamarche to whom he passed the torch.L’anonyme, Cactus Montreal and the Direction de la sante publique
de l’Ile de Montreal also contributed substantially to the research.We recognize as well the good work of our research assistants:Torsten Bernhardt, Tessa Greegor, Seunghoon Park and EricScharnhorst. This work was supported by the Robert WoodJohnson Foundation (grant 61232).
References
Archibald, C.P., Jayaraman, G.C., Major, C., Patrick, D.M., Houston, S.M., Sutherland,D., 2001. Estimating the size of hard-to-reach populations: a novel methodusing HIV testing data compared to other methods. AIDS 15, S41–S48.
Barendregt, C., van der Poel, A., van de Mheen, D., 2006. The rise of the mobilephone in the hard drug scene of Rotterdam. Journal of Psychoactive Drugs 38,77–87.
Batty, M., 2001. Exploring isovist fields: space and shape in architectural andurban morphology. Environment and Planning B 28, 123–150.
Beyer, H.L., 2007. Hawth’s analysis tools for ArcGIS, 3.27 ed. /www.spatialecology.comS.
Blanken, P., Barendregt, C., Zuidmulder, L., 2001. Retail-level drug dealing inRotterdam. In: EMCDDA (Ed.), Understanding and responding to drug use: therole of qualitative research. European Monitoring Centre for Drugs and DrugAddiction, Lisbon, Portugal, pp. 175–184.
Broadhead, R.S., van Hulst, Y., Heckathorn, D.D., 1999. The impact of a needleexchange’s closure. Public Health Reports 114, 439–447.
CBC.ca, 2010. Safe-injection sites to open in Quebec. Canadian BroadcastingCorporation. Accessed: Dec 10, 2010. /http://www.cbc.ca/canada/montreal/story/2010/12/01/safe-injection-hiv-cactus-montreal.htmlS.
City of Montreal, 2007. Property assessment role. Ville de Montreal. Accessed:May, 2007. /http://ville.montreal.qc.ca/pls/portal/url/page/evaluation_fonciere_en/REP_EVALUATION_FONCIERE/ROLE_EVALUATION_FONCIERES.
Cleland, C.M., Deren, S., Fuller, C.M., Blaney, S., McMahon, J.M., Tortu, S., Des Jarlais,D.C., Vlahov, D., 2007. Syringe disposal among injection drug users in Harlemand the Bronx during the New York state expanded syringe access demonstra-tion program. Health Education and Behavior 34, 390–403.
Cooper, H., Moore, L., Gruskin, S., Krieger, N., 2005. The impact of a police drugcrackdown on drug injectors’ ability to practice harm reduction: a qualitativestudy. Social Science and Medicine 61, 673–684.
CPS Infectious Diseases and Immunization Committee, 2008. Needle stick injuriesin the community. Position Statement. Pædiatrics and Child Health 13,205–210.
Crowe, T., 2000. Crime prevention through environmental design: applications ofarchitectural design and space management concepts 2nd ed. Butterworth-Heinemann, Oxford, UK.
de Montigny, L., 2008. Discarded needles and the urban environment: a spatialanalysis of attractors, deterrents and disposal options, Urban Design &Planning Group. University of Washington, Seattle, p. 142.
de Montigny, L., Vernez Moudon, A., Leigh, B., Kim, S.Y., 2010. Assessing a drop boxprogramme: a spatial analysis of discarded needles. International Journal ofDrug Policy 21, 208–214.
L. de Montigny et al. / Health & Place 17 (2011) 757–766766
DeBeck, K., Shannon, K., Wood, E., Li, K., Montaner, J., Kerr, T., 2007. Incomegenerating activities of people who inject drugs. Drug and Alcohol Dependence91, 50–56.
Dietze, P., Jolley, D., Fry, C., Bammer, G., 2005. Transient changes in behaviour leadto heroin overdose: results from a case-crossover study of non-fatal overdose.Addiction (Abingdon, England) 100, 636–642.
Dovey, K., Fitzgerald, J., Choi, Y., 2001. Safety becomes danger: dilemmas of drug-use in public space. Health and Place 7, 319–331.
ESRI, 2007. ArcGIS, 9, 2 ed. Environmental Systems Research Institute, Inc.,Redlands, CA.
Fitzgerald, J., Dovey, K., Dietze, P., Rumbold, G., 2004. Health outcomes and quasi-supervised settings for street injecting drug use. International Journal of DrugPolicy 15, 247–257.
Galea, S., Rudenstine, S., Vlahov, D., 2005. Drug use, misuse, and the urbanenvironment. Drug and Alcohol Review 24, 127–136.
Garcia-Algar, O., Vall, O., 1997. Hepatitis B virus infection from a needle stick.Pediatric Infectious Disease Journal 16, 1099.
Gilman, M., 2001. A qualitative view of drugs policing: heroin markets in greaterManchester, UK. In: EMCDDA (Ed.), Understanding and responding to druguse: the role of qualitative research. European Monitoring Centre for Drugsand Drug Addiction, Lisbon, Portugal, pp. 203–209.
Golub, E.T., Bareta, J.C., Mehta, S.H., McCall, L.D., Vlahov, D., Strathdee, S.A., 2005.Correlates of unsafe syringe acquisition and disposal among injection drugusers in Baltimore, Maryland. Substance Use and Misuse 40, 1751–1764.
Green, T., Hankins, C., Palmer, D., Boivin, J.-F., Platt, R., 2003. Ascertaining the needfor a supervised injecting facility (SIF): the burden of public injecting inMontreal, Canada. The Journal of Drug Issues 33, 713–732.
Innes, M., 2004. Signal crimes and signal disorders: notes on deviance ascommunicative action. The British Journal of Sociology 55, 335–355.
Jose, B., Friedman, S.R., Neaigus, A., Curtis, R., Sufian, M., Stepherson, B., Des Jarlais,D.C., 1996. Collective organisation of injecting drug users and the struggleagainst AIDS. In: Rhodes, T., Hartnoll, R. (Eds.), AIDS, Drugs and Prevention:Perspectives on Individual and Community Action. Routledge, New York; NY,pp. 216–233.
Lawitts, S., 2002. Needle sightings and on-the-job needle-stick injuries amongNew York City Department of Sanitation workers. Journal of the AmericanPharmaceutical Association (Washington) 42, S92–93.
Leclerc, P., Tremblay, C., Morissette, C., 2007. Monitorage des centres d’acc�es aumateriel sterile d’injection. Direction de sante publique de Montreal, Montreal,p. 54.
Libois, A., Fumero, E., Castro, P., Nomdedeu, M., Cruceta, A., Gatell, J.M., Garcia, F.,2005. Transmission of Hepatitis C virus by discarded-needle injury. ClinicalInfectious Diseases 41, 129–130.
Loukaitou-Sideris, A., Liggett, R., Iseki, H., 2001. Measuring the effects of builtenvironment on bus stop crime. Environment and Planning B 28, 255–280.
Loukaitou-Sideris, A., Liggett, R., Iseki, H., 2002. The geography of transit crime:documentation and evaluation of crime incidence on and around the greenline stations in Los Angeles. Journal of Planning Education and Research 22,135–151.
Neale, J., 1998. Reducing risks: drug users’ views of accessing and disposing ofinjecting equipment. Addiction Research and Theory 6 147-147.
O’Leary, F.M., Green, T.C., 2003. Community acquired needlestick injuries in non-health care workers presenting to an urban emergency department. Emer-gency Medicine 15, 434–440.
OMHM, 2007. Location of our housing. L’Office municipal d’habitation de Mon-treal. Accessed: August 20, 2008. /http://www.omhm.qc.ca/wps/wcm/connect/en/OMHM/Top_Menu/C_Parc/C1-OuTrouverImm/S.
R Development Core Team, 2007a. R: a language and environment for statisticalcomputing, 2.5, 1 ed. R Foundation for Statistical Computing, Vienna, Austria.
R Development Core Team, 2007b. stats, 2.5, 1 ed. R Foundation for StatisticalComputing, Vienna, Austria.
Raftery, A., 1995. Bayesian model selection in social research (with Discussion)In: Marsden, P.V. (Ed.), Sociological Methodology, Blackwells, Cambridge, MA,pp. 111–196.
Raftery, A., Hoeting, J., Volinsky, C., Painter, I., Yeung, K.Y., 2009. BMA: BayesianModel Averaging, 3.12 ed.
Rana, S., 2002. Isovist analyst extension, 1.1 ed, London, UK.Rengert, G.F., Ratcliffe, J.H., Chakrovorty, S., 2005. Policing illegal drug markets:
geographic approaches to crime reduction. Criminal Justice Press, Monsey, NY.Rhodes, T., 2002. The ‘risk environment:’ a framework for understanding and
reducing drug-related harm. International Journal of Drug Policy 13, 85–94.Rhodes, T., Kimber, J., Small, W., Fitzgerald, J., Kerr, T., Hickman, M., Holloway, G.,
2006. Public injecting and the need for ‘safer environment interventions’ in thereduction of drug-related harm. Addiction 101, 1384–1393.
Russell, F.M., Nash, M.C., 2002. A prospective study of children with community-acquired needlestick injuries in Melbourne. Journal of Paediatrics and ChildHealth 38, 322–323.
Sampson, R.J., Raudenbush, S.W., Earls, F., 1997. Neighborhoods and violent crime:a multilevel study of collective efficacy. Science 277, 918–924.
Sherman, S.G., Rusch, M., Golub, E.T., 2004. Correlates of safe syringe acquisitionand disposal practices among young IDUs: broadening our notion of risk.Journal of Drug Issues 34, 895–911.
Small, W., Rhodes, T., Wood, E., Kerr, T., 2007. Public injection settings inVancouver: physical environment, social context and risk. InternationalJournal of Drug Policy 18, 27–36.
Springer, K.W., Sterk, C., Jones, T.S., et al., 1999. Syringe disposal options forinjection drug users: a community-based perspective. Substance Use andMisuse 34, 1917–1933.
Statistics Canada, 2002. Dissemination areas, Montreal CMA, 2001 Census, (carto-graphic boundary file, gda_462b02a_e.exe) Arc Info Edition ed. StatisticsCanada, Ottawa, ON.
Statistics Canada, n.d. Public-use microdata files, 2001 Census (database). UsingCREPUQ, (cartographic boundary file, gda_462b02a_e.exe) Arc Info Edition ed.Statistics Canada, Ottawa, ON.
Taylor, R.B., 1997. Social order and disorder of street blocks and neighborhoods:ecology, microecology, and the systemic model of social disorganization.Journal of Research in Crime and Delinquency 34, 113–155.
Thompson, S.C., Boughton, C.R., Dore, G.J., 2003. Blood-borne viruses and theirsurvival in the environment: is public concern about community needlestickexposures justified? Australian and New Zealand Journal of Public Health 27,602–607.
Wodak, A., Cooney, A., 2006. Do needle syringe programs reduce HIV infectionamong injecting drug users: a comprehensive review of the internationalevidence. Substance Use and Misuse 41, 777–813.
Wood, E., Spittal, P.M., Small, W., Kerr, T., Li, K., Hogg, R.S., Tyndall, M.W.,Montaner, J.S., Schechter, M.T., 2004. Displacement of Canada’s largest publicillicit drug market in response to a police crackdown. Canadian MedicalAssociation Journal 170, 1551–1556.