A socio-technical investigation into the electrical end use ...
478
A socio-technical investigation into the electrical end use patterns of information, communication and entertainment technologies in UK homes Michael Coleman Institute of Energy and Sustainable Development De Montfort University This thesis is submitted to De Montfort University in partial fulfilment of the requirements for the award of Doctor of Philosophy January 2011
-
Upload
khangminh22 -
Category
Documents
-
view
3 -
download
0
Transcript of A socio-technical investigation into the electrical end use ...

A socio-technical investigation into the electrical end use patterns of information,
communication and entertainment technologies in UK homes
Michael Coleman
Institute of Energy and Sustainable Development
De Montfort University
This thesis is submitted to De Montfort University in partial fulfilment of the requirements for the award of Doctor of Philosophy
January 2011


i
Abstract
Information, communication and entertainment (ICE) appliances are consumer electronics
and information and communication technologies (ICT). Forecasts suggest that ICE
appliance use will soon become the most significant domestic electricity end-use in the
UK. Knowledge concerning “real world” ICE electricity consumption is currently limited
and it has been suggested that this deficiency could lead to ineffective policy programmes.
This socio-technical study measured ICE appliance electricity consumption in fourteen UK
households‟ and undertook household interviews to explore the behavioural factors that
influenced the measurements recorded. The interviews were informed by two social
psychology theories: (i) Triandis‟ (1977) Theory of Interpersonal Behaviour (TIB);
(ii) Rogers‟ (2003) Diffusion of Innovations Theory (DIT).
The study supports the position that ICE appliance use and standby power consumption
are significant electricity end-uses in UK homes. Key appliances that contributed to the
sample‟s average electricity consumption are identified. Inconspicuous electricity
consumption from network appliances is an issue of particular concern due to policy gaps.
The interviews found that a range of internal and external factors influenced ICE appliance
use. Behavioural intentions and habits were found to be facilitated or impeded by personal
ability, knowledge and physical constraints. Social structures and expectations also
supported the more expansive ownership and use of ICE appliances and energy
consumption was an issue largely excluded from adoption decisions. The findings imply
that a multifaceted approach is required to reduce household ICE appliance electricity
consumption.
This study supports the recent implementation of minimum energy performance standards
and provides further recommendations that include: (i) improved product design; (ii) the
expansion of mandatory energy labelling; (iii) improved electricity consumption feedback in
UK homes; (iv) the use of behaviour change campaigns; (v) the integration of ICE
appliance energy saving objectives into UK policies.

ii
Acknowledgements
First and foremost I would like to thank my supervisors Dr Andrew Wright, Dr Neil Brown
and Dr Steven Firth for their patience, support and excellent supervision. I would also like
to express my gratitude to Dr Rob Wall and Dr Richard Bull for their guidance and
encouragement. Many people have helped me at the IESD and I thank them sincerely for
providing an enjoyable and inspiring place of work. Thanks are also due to Clive Lewis
and the staff at Digital Living for providing technical support.
In particular I thank all those involved in the CaRB project, especially Dr Ljiljana
Marjanovic-Halburd, Harry Bruhns and Dr Alex Summerfield, for the enjoyable
collaboration on the ASHREA paper, and Dr Tracey Crosbie for her encouragement and
advice.
Finally, special acknowledgements to Jason Holmes who‟s “straight taking” encouraged
me to return to higher education and Dr Kerry Kirwan for being a great housemate and
friend during my time in Leicester. Importantly, I express my appreciation to all the
participants who agreed to take part in this study. I thank them for their time, patience and
openness.
Above all I am grateful to my parents, sister and brother-in-law for all their love and
support.

iii
Contents
Abstract ................................................................................................................................. i
Acknowledgements .............................................................................................................. ii
Contents .............................................................................................................................. iii
List of Figures ..................................................................................................................... vii
List of Tables ....................................................................................................................... xi
Abbreviations and acronyms .............................................................................................. xv
Chapter 1. Introduction ..................................................................................................... 1
1.1 Thesis overview ..................................................................................................... 1
1.2 Climate change: a motivation for carbon dioxide emission reduction .................... 2
1.3 The UK Government‟s response to climate change ............................................... 4
1.4 The UK building stock ............................................................................................ 5
1.5 The rapid increase of domestic appliance use in the UK ....................................... 7
1.6 Consumer electronics and ICT appliances ............................................................ 8
1.7 Existing research and gaps in knowledge ............................................................ 10
1.8 Aims and objectives ............................................................................................. 12
1.9 Thesis structure.................................................................................................... 12
Chapter 2. Literature review 1: ICE appliances and domestic energy consumption ...... 15
2.1 Introduction .......................................................................................................... 15
2.2 Background: Operational functions, energy forecasts and policy ........................ 15
2.3 Modelling and monitoring studies......................................................................... 35
2.4 Summary .............................................................................................................. 54
Chapter 3. Literature Review 2: Energy consumption and behaviour ............................ 55
3.1 Introduction .......................................................................................................... 55
3.2 Traditions of research .......................................................................................... 56
3.3 The influence of socio-demographics and physical factors .................................. 58
3.4 What is behaviour? .............................................................................................. 60
3.5 Internal factors: a psychological perspective of energy behaviour ....................... 61
3.6 External factors: A sociological perspective of energy behaviour ........................ 72

iv
3.7 The Theory of Interpersonal Behaviour (TIB) ...................................................... 78
3.8 Diffusion of Innovations Theory (DIT) .................................................................. 89
3.9 Summary ........................................................................................................... 103
Chapter 4. Literature Review 3: ICE appliances and socio-technical research ............ 104
4.1 Introduction ........................................................................................................ 104
4.2 Socio-technical domestic energy research ........................................................ 104
4.3 The argument for inter-disciplinary research ..................................................... 114
4.4 Literature review summary ................................................................................ 115
4.5 Research questions ........................................................................................... 117
Chapter 5. Research methodology .............................................................................. 119
5.1 Introduction ........................................................................................................ 119
5.2 Philosophy of „real world‟ research .................................................................... 119
5.3 Research design: a mixed methods approach .................................................. 122
5.4 Research methods ............................................................................................ 130
5.5 Quantitative data collection: ICE appliance electricity consumption monitoring 140
5.6 Quantitative data processing and analysis ........................................................ 149
5.7 Qualitative data collection: ICE appliance household interviews ....................... 172
5.8 Qualitative data processing and analysis .......................................................... 181
5.9 Socio-demographic questionnaire ..................................................................... 184
5.10 Summary ........................................................................................................ 184
Chapter 6. Results: Average household ICE appliance electricity consumption .......... 186
6.1 Introduction ........................................................................................................ 186
6.2 Description of the households ........................................................................... 187
6.3 Average household electricity consumption ...................................................... 194
6.4 Average household power mode electricity consumption ................................. 203
6.5 Average appliance power loads of the ICE appliances ..................................... 218
6.6 Average appliance duration of use in power modes .......................................... 222
6.7 Average household electricity consumption and power load profiles ................ 226
6.8 Summary ........................................................................................................... 229
Chapter 7. Results: Variations in household ICE appliance electricity consumption ... 230

v
7.1 Introduction ........................................................................................................ 230
7.2 Variations in whole house and ICE appliance electricity consumption .............. 231
7.3 Variations in ICE appliance categories electricity consumption ......................... 237
7.4 Variations in video appliance electricity consumption ........................................ 241
7.5 Variations in audio appliance electricity consumption ........................................ 248
7.6 Variations in computing appliance electricity consumption ................................ 251
7.7 Variations in telephony appliances electricity consumption ............................... 257
7.8 Summary ............................................................................................................ 258
Chapter 8. Results: Operational behaviour ................................................................... 260
8.1 Introduction ........................................................................................................ 260
8.2 Patterns of ICE appliance use and common goals ............................................ 263
8.3 Personal characteristics ..................................................................................... 266
8.4 Affect and emotions ........................................................................................... 267
8.5 The consequences of ICE appliance use ........................................................... 271
8.6 Social influences ................................................................................................ 279
8.7 Habits and routines ............................................................................................ 282
8.8 Facilitating conditions ......................................................................................... 285
8.9 Summary ............................................................................................................ 307
Chapter 9. Results: Ownership and adoption ............................................................... 308
9.1 Introduction ........................................................................................................ 308
9.2 Personal characteristics and innovativeness ..................................................... 308
9.3 Types of decisions ............................................................................................. 309
9.4 Social influences: the ICE society ...................................................................... 311
9.5 The purchase decision ....................................................................................... 318
9.6 Summary ............................................................................................................ 331
Chapter 10. Discussion ............................................................................................... 333
10.1 Introduction ..................................................................................................... 333
10.2 Household ICE appliance electricity consumption .......................................... 333
10.3 Household ICE appliance behaviour .............................................................. 340
10.4 Facilitating ICE appliance energy saving ........................................................ 347

vi
Chapter 11. Conclusions ............................................................................................ 365
11.1 Main findings .................................................................................................. 365
11.2 Contribution to knowledge ............................................................................. 370
11.3 Limitations and future research ...................................................................... 371
References ....................................................................................................................... 372
Appendices ...................................................................................................................... 397

vii
List of Figures
Figure 1-1 UK domestic energy consumption by main end-use 1970-2006 ......................... 6
Figure 1-2 Percentage change in UK domestic energy demand from 1971 to 2001 ............ 7
Figure 1-3 UK domestic electricity consumption by appliance categories. ........................... 9
Figure 2-1 Depiction of appliance power modes ................................................................ 18
Figure 3-1 Fishbein and Ajzen‟s Theory of Reasoned Action ............................................ 63
Figure 3-2 Ajzen‟s Theory of Planned Behaviour ............................................................... 64
Figure 3-3 Schwartz‟s norm-activation model .................................................................... 66
Figure 3-4 Stern‟s value-belief-norm theory of environmentalism ...................................... 67
Figure 3-5 Triandis' Theory of Interpersonal Behaviour ..................................................... 79
Figure 3-6 Technology Acceptance Model ......................................................................... 85
Figure 3-7 Technology Acceptance Model 2 ...................................................................... 86
Figure 3-8 Diffusion of Innovations Theory ........................................................................ 90
Figure 3-9 The Innovation-decision process ...................................................................... 95
Figure 3-10 Diffusion of innovations curve ......................................................................... 97
Figure 4-1 Annual electricity consumption range for entertainment appliances ............... 111
Figure 4-2 Annual electricity consumption range for ICT appliances ............................... 111
Figure 5-1 The main mixed methods designs .................................................................. 128
Figure 5-2 Thesis research design ................................................................................... 129
Figure 5-3 Schematic of the AMS..................................................................................... 143
Figure 5-4 Power consumption profile from Calibration 1 ................................................ 144
Figure 5-5 Example data exported from the MySQL database ........................................ 150
Figure 5-6 Example filtered data ...................................................................................... 150
Figure 5-7 Data columns for an LCD television ................................................................ 155
Figure 5-8 Plot of an LCD monitor‟s electricity consumption ............................................ 156
Figure 5-9 Plot of an LCD monitor‟s electricity consumption with moving average .......... 157
Figure 5-10 Examples of the limitations of the truth gate ................................................. 158
Figure 5-11 Example analysis data for a LCD television .................................................. 160
Figure 5-12 Electricity consumption data for a DVD player .............................................. 162

viii
Figure 5-13 Total two week electricity consumption and hours of use values recorded for
an LCD television ............................................................................................................. 168
Figure 5-14 Total two week electricity consumption and hours of use values recorded for
an LCD television for two days of the week ..................................................................... 168
Figure 5-15 A section of total two week hourly electricity consumption values for an LCD
television .......................................................................................................................... 169
Figure 5-16 Total two week electricity consumption from ICE appliance categories ....... 174
Figure 5-17 Total two week ICE appliance electricity consumption on days of the week 175
Figure 5-18 Total two week ICE appliance electricity consumption by hours of the day from
ICE appliance categories ................................................................................................. 176
Figure 5-19 Total two week ICE appliance electricity consumption by hours of the day from
active and standby power modes .................................................................................... 177
Figure 5-20 Total two week ICE appliance electricity consumption by hours of the day for
weekdays and weekend days .......................................................................................... 178
Figure 5-21 Individual video appliance patterns of use .................................................... 179
Figure 6-1 Appliances ownership rates in the video category ......................................... 191
Figure 6-2 Appliances ownership rates in the audio category ......................................... 192
Figure 6-3 Appliances ownership rates in the computing category ................................. 193
Figure 6-4 Appliances ownership rates in the telephony category .................................. 193
Figure 6-5 Average household two week electricity consumption from video appliances
power modes ................................................................................................................... 207
Figure 6-6 Percentage of the average household video appliance electricity consumption,
from power modes, for the two week monitoring period .................................................. 207
Figure 6-7 Average household two week electricity consumption from audio appliances
power modes ................................................................................................................... 210
Figure 6-8 Percentage of audio appliances electricity consumption from power modes for
two week monitoring period ............................................................................................. 210
Figure 6-9 Average household two week electricity consumption from computing
appliances power modes ................................................................................................. 213
Figure 6-10 Percentage of computing appliances two week electricity consumption from
power modes ................................................................................................................... 213

ix
Figure 6-11 Average daily ICE appliance power consumption for average household .... 226
Figure 6-12 Average daily ICE appliance power consumption for weekend days for the
average household ........................................................................................................... 228
Figure 6-13 Average daily ICE appliance power consumption for working weekdays for the
average household ........................................................................................................... 228
Figure 7-1 Households total two week ICE appliance electricity consumption for the plotted
against whole house electricity consumption ................................................................... 233
Figure 7-2 Annual total electricity consumption totals per appliance consumption group
and dwelling for the first year of monitoring ...................................................................... 234
Figure 7-3 Households‟ two week ICE appliance standby power electricity consumption
plotted against the two week whole house electricity consumption .................................. 235
Figure 7-4 Percentage contribution of ICE appliance categories to individual households
total ICE appliance electricity consumption for two week monitoring period .................... 239
Figure 7-5 Households‟ two week video appliance electricity consumption from appliance
types ................................................................................................................................. 242
Figure 7-6 Households‟ two week active and standby power mode electricity consumption
for the main video appliances ........................................................................................... 244
Figure 7-7 Households total two week STB electricity consumption from power modes. 245
Figure 7-8 Total two week STB electricity consumption, grouped by appliance type and
general patterns of use ..................................................................................................... 247
Figure 7-9 Households‟ two week audio appliance electricity consumption ..................... 249
Figure 7-10 Households two week active and standby power mode electricity consumption
for the main audio appliances .......................................................................................... 251
Figure 7-11 Households‟ two week computing appliance electricity consumption (1) ...... 252
Figure 7-12 Households‟ two week computing appliance electricity consumption (2) ...... 252
Figure 7-13 Percentage of households two week whole house electricity consumption from
computing network appliances ......................................................................................... 254
Figure 7-14 Households two week active and standby power mode electricity consumption
for the main computing appliances (1) ............................................................................. 255
Figure 7-15 Households two week active and standby power mode electricity consumption
for the main computing appliances (2) ............................................................................. 256

x
Figure 7-16 Households‟ two week telephony appliance electricity consumption ........... 258
Figure 10-1 Summary of key elicited factors that influenced ICE appliance use; overlayed
onto the Theory of Interpersonal Behaviour ..................................................................... 341

xi
List of Tables
Table 2-1 International Standby Power Data Project ......................................................... 21
Table 2-2 Computer power mode definitions...................................................................... 22
Table 2-3 Projected ICE electricity consumption ................................................................ 25
Table 2-4 Projected ICE electricity consumption ................................................................ 25
Table 2-5 EuP preparatory studies ..................................................................................... 36
Table 2-6 Metering campaign characteristics ..................................................................... 42
Table 2-7 Average measured consumption per appliance ................................................. 42
Table 4-1 Appliance use categories ................................................................................. 109
Table 5-1 Summary of the cross-disciplinary nature of this thesis ................................... 122
Table 5-2 Summary of main research methods used in household energy research ...... 123
Table 5-3 Data required for the thesis research questions ............................................... 126
Table 5-4 Household types .............................................................................................. 136
Table 5-5 Summary of participant selection process ........................................................ 137
Table 5-6 Summary of thesis research phases ................................................................ 139
Table 5-7 Example data collected from a STB with an active load of around 12W .......... 145
Table 5-8 AMS electricity consumption data for 30W load ............................................... 146
Table 5-9 Example data collected from a charger with a load of around 1W ................... 147
Table 5-10 Example AMS data for the 60W load ............................................................. 148
Table 5-11 Example AMS electricity consumption data for the 160W load ...................... 148
Table 5-12 Summary of individual appliance analysis spreadsheet columns .................. 154
Table 5-13 Truth gate criteria cells for an LCD television in household 13 ...................... 157
Table 5-14 Example Excel formula used on appliance summary worksheets ................. 167
Table 5-15 Stages of the template analysis ..................................................................... 182
Table 6-1 Definitions of key terms used in chapter 6 ....................................................... 187
Table 6-2 Comparision of household type for the study sample and UK housing stock .. 188
Table 6-3 Summary of participating households key socio-demographic characteristics 189
Table 6-4 ICE appliances monitored ................................................................................ 190

xii
Table 6-5 Total two week whole house and ICE appliance electricity consumption for the
sample of households ...................................................................................................... 195
Table 6-6 Average household two week electricity consumption for ICE appliance
categories ........................................................................................................................ 196
Table 6-7 Average household two week electricity consumption from video appliances 197
Table 6-8 Average household two week electricity consumption from audio appliances 199
Table 6-9 Average household two week electricity consumption from computing
appliances ........................................................................................................................ 200
Table 6-10 Average household two week electricity consumption from telephony
appliances ........................................................................................................................ 202
Table 6-11 The fifteen most significant electricity consuming ICE appliances for the sample
of households during the two week monitoring period ..................................................... 203
Table 6-12 Average household two week ICE appliance electricity consumption from
power modes ................................................................................................................... 204
Table 6-13 Average household two week electricity consumption from power mode use for
the ICE appliance categories ........................................................................................... 205
Table 6-14 Percentage of average household two week ICE appliance electricity
consumption from power mode use for the main ICE appliance categories .................... 205
Table 6-15 Average household two week electricity consumption from video appliance
power modes ................................................................................................................... 206
Table 6-16 Average household two week electricity consumption from audio appliance
power modes ................................................................................................................... 209
Table 6-17 Average household two week electricity consumption from computing
appliances power modes ................................................................................................. 212
Table 6-18 Average household two week electricity consumption from telephony appliance
power modes ................................................................................................................... 214
Table 6-19 The fifteen ICE appliances with the highest two week active power mode
electricity consumption for the average household .......................................................... 216
Table 6-20 The fifteen ICE appliances with the highest two week standby power mode
electricity consumption for the average household .......................................................... 217
Table 6-21 Average video appliance power loads ........................................................... 219
xiii
Table 6-22 Average audio appliance power loads ........................................................... 220
Table 6-23 Average computing appliance power loads .................................................... 221
Table 6-24 Average daily video appliance duration of use in different appliance states .. 223
Table 6-25 Average daily audio appliance duration of use in different appliance states .. 224
Table 6-26 Average daily computing appliance duration of use in different appliance states
......................................................................................................................................... 225
Table 6-27 Average daily telephony appliance duration of use in different operational
states ................................................................................................................................ 226
Table 7-1 Two week ICE appliance and whole house electricity consumption for the
sample of households ...................................................................................................... 232
Table 7-2 Variation in households‟ two week ICE appliance standby consumption ......... 236
Table 7-3 Households two week electricity consumption from ICE appliance categories 237
Table 7-4 Range of ICE appliance categories two week electricity consumption ............ 238
Table 7-5 Households‟ two week electricity consumption from ICE appliance categories
active and standby power modes ..................................................................................... 240
Table 7-6 The range of households‟ two week electricity consumption from ICE appliance
categories‟ active and standby power modes ................................................................... 240
Table 7-7 Range of two week video appliance electricity consumption ........................... 242
Table 7-8 Total two week television power mode electricity consumption for study sample
from televisions used in different household locations ..................................................... 247
Table 7-9 Range of two week audio appliance electricity consumption ........................... 249
Table 7-10 Audio electricity consumption in high audio using households ...................... 250
Table 7-11 Range of two week computing appliance electricity consumption ................. 253
Table 8-1 Interview participants gender and age ............................................................. 262
Table 10-1 Comparison of thesis and REMODECE results: annual average household
electricty consumption from ICE appliances..................................................................... 335
Table 10-2 Comparison of thesis and REMODECE results: the percentage of annual
average household electricty consumption from standby power modes .......................... 336
Table 10-3 Comparison of thesis and REMODECE results: annual average appliance
electricity consumption from ICE appliances .................................................................... 337

xiv
Table 10-4 Comparison of key results gained from thesis and MTP home computer
monitoring ........................................................................................................................ 338
Table 10-5 Summary of key findings: ICE appliance electricity consumption monitoring 339
Table 10-6 Summary of key findings: ownership and adoption of ICE appliances .......... 345

xv
Abbreviations and acronyms
3D Three dimensional
AMS Appliance monitoring system
AV Audio-visual
BSI British Standards Institution
CaRB Carbon Reductions in Buildings
CD Compact disk
CO2 Carbon dioxide
CRT Cathode ray tube
DBIS Department for Business, Innovation and Skills
DCLG Department for Communities and Local Government
DCMS Department for Culture, Media and Sport
DE Germany
DECADE Domestic Equipment and Carbon Dioxide Emissions
DECC Department for Energy and Climate Change
Defra Department for the Environment, Food and Rural Affairs
DOE US Department of Energy
DIT Diffusion of Innovations Theory
DK Denmark
DofH Department of Health
DSM Demand side management
DTI Department of Trade and Industry
DVD Digital versatile disk
EHCS English Housing Conditions Survey
EICTA European Information and Communications Technology Industry
Association
ePSU External power supply unit
ESR Energy Saving Recommended Scheme

xvi
EST Energy Saving Trust
EU European Union
EuP Energy-using products
FR France
GOS The Government Office for Science
GSM Global System for Mobile communications
HD High Definition
HDD Hard disk drive
HDTV High definition television
HEEP Household Energy End-use Project
ICE Information, communication and entertainment
ICT Information and communication technologies
IEA International Energy Agency
IEC International Electrotechnical Commission
IEGMP Independent Expert Group on Mobile Phones
IPCC Intergovernmental Panel on Climate Change
IS Information Systems
Kg Kilogram
kWh Kilo Watt hour
LCD Liquid crystal display
LED Light emitting diode
MDS Mobile data services
MEPS Minimum energy performance standards
MtC Mega tonnes carbon
MTP Market Transformation Programme
NAM Norm-activation model
NEP New Environmental Paradigm
NRPB National Radiological Protection Board

xvii
OECD Organisation for Economic Co-operation and Development
ONS Office for National Statistics
PBC perceived behavioural control
PC Personal computer
QUAL Qualitative
QUAN Quantitative
RCEP Royal Commission on Environmental Pollution
REMODECE Residential Monitoring to Decrease Energy Use and Carbon Emissions in
Europe
STB Set-top box
TAM Technology Acceptance Model
TIB Theory of Interpersonal Behaviour
TPB Theory of Planned Behaviour
TRA Theory of Reasoned Action
TV Television
TWh Terra Watt hour
U/C Unclassifiable standby
UK United Kingdom
UNFCCC United Nations framework convention on climate change
US United States
VBN Value-belief-norm theory
VCR Video Cassette Recorder
VPN Virtual Private Network
W Watt
WGM White Goods Monitor
Wh Watt hour

xviii

1
Chapter 1. Introduction
This chapter begins with an overview of this thesis (section 1.1) and the overarching
motivation for this research; climate change mitigation (section 1.2). This is followed by a
summary of the UK Government‟s response to climate change (section 1.3) and the
importance of the UK building stock to UK Government action (section 1.4). A summary of
domestic appliances contribution to UK energy consumption (section 1.5) is followed by a
brief synopsis of the growth of ICE appliance use in UK homes (section 1.6). Existing
research in this area and gaps in knowledge are then briefly discussed (section 1.7). The
principal aims and objectives of the research are presented (section 1.8) and the structure
of the thesis is outlined (section 1.9).
1.1 Thesis overview
This thesis documents socio-technical research undertaken to explore the fastest growing
domestic electricity end-use in UK dwellings: information, communication and
entertainment (ICE) appliance use. ICE appliances are:
1. Consumer electronics: such as televisions, set-top boxes, DVD players, video
cassette recorders (VCRs), radios, audio systems and games consoles;
2. Information and communication technologies (ICT): such as desktop computers,
laptops, printers, scanners, routers and cordless telephones.
The electricity consumption from these appliances has increased rapidly in UK homes over
the past ten to fifteen years and has been linked to the emergence of new technologies
and services, and the formation of new more energy intensive patterns of use (Ellis,
2009a). Current forecasts suggest that ICE appliance use will soon become the most
significant domestic electricity end-use in the UK (Defra, 2008b; Defra, 2008c; Owen,
2007). This growth is also evident throughout European Union (EU) and Organisation for
Economic Co-operation and Development (OECD) countries. National and international
policymakers are now faced with the challenge of implementing measures to deal with a
continuously evolving and increasingly energy intensive electricity end-use (Ellis, 2009a).
Due to the rapid change of ICE technologies knowledge concerning ICE electricity

2
consumption is very limited and it has been suggested that this deficiency could lead to
ineffective policy programmes (Defra, 2008b; Defra, 2008c; Crosbie, 2008).
This thesis contends that to gain a more complete understanding of current ICE appliance
electricity consumption it is necessary to undertake socio-technical research. Therefore,
this research has collected electricity consumption measurements and household
interview data to explore ICE appliances use in a sample of UK homes. Although the
sample of households is relatively small (n=14), it is anticipated that the findings from this
research will contribute to current knowledge by providing: (i) “real world” electricity
consumption data for a range of ICE appliances; (ii) accurate patterns of use data; (iii) data
regarding behavioural factors that influenced the patterns of use recorded. Furthermore,
the challenge of combining research methods from technical, psychological and
sociological disciplines provides a further insight into the practicalities of ICE appliance
data collection.
This research was carried out as part of the Carbon Reductions in Buildings (CaRB)
project, a major, four year research project, funded by the Carbon Trust and the
Engineering and Physical Sciences Research Council. CaRB involved a consortium of
five UK universities and was conducted between autumn 2004 and March 2009. CaRB‟s
overall aim was to investigate the associated carbon dioxide (CO2) emissions from UK
domestic and non-domestic buildings and to develop a social-technical model of energy
use in buildings (CaRB, 2009). Thus, this PhD research was conceived to complement
the results from CaRB and reflect the inter-disciplinary ethos of the project.
1.2 Climate change: a motivation for carbon dioxide emission reduction
Successive scientific research studies have provided convincing evidence that the Earth‟s
average global temperature is increasing primarily due to the release of greenhouse gases
from human activates (IPCC, 2001; IPCC, 2007a). The weight of current scientific
evidence is surmised in the Fourth Assessment Report of the Intergovernmental Panel on
Climate Change (IPCC, 2007a), which states that there is a >90% probability that
anthropogenic greenhouse gas emissions are responsible for increased global
temperatures.

3
CO2 is regarded as the primary greenhouse gas responsible for driving anthropogenic
global warming (IPCC, 2007a). It is released through the combustion of fossil fuels, such
as coal, natural gas and crude oil derived fuels, which has increased substantially “from a
pre-industrial value of about 280 ppm to 379 ppm in 2005” (IPCC, 2007a p2). Greenhouse
gases, such as CO2, absorb solar radiation reemitted from the earth‟s surface and release
this energy into the Earth‟s atmosphere. Similar to the effect of the panes of glass in a
greenhouse, this phenomenon holds solar heat within the Earth‟s atmosphere thus
increasing atmospheric temperature (Boyle, Everett and Ramage, 2003).
The implication of anthropogenic global warming is that Earth‟s complex climatic systems
are being altered and that the Earth‟s biosphere is at risk from the negative environmental
effects of a more hostile climate and rising temperatures (IPCC, 2001; IPCC, 2007b). The
potential effects of climate change includes rising sea levels, more intense and frequent
extreme weather events, droughts and flooding, and changes to biodiversity and
agriculture (IPCC, 2001; IPCC, 2007b). Climate change could also have social and
economic consequences that may be “on a scale similar to those associated with the great
wars and the economic depression of the first half of the 20th century” (Stern, 2007 p572).
Such threats have elevated climate change science to a high position on the international
political agenda and have led to international cooperation to mitigate climate change
through the reduction of CO2 emissions (UNFCCC, 2008). For example, the EU has
committed to a 20% reduction of greenhouse gas emissions by 2020 (relative to 1990
levels), which will increase to 30% should other developed countries commit to similar
levels (European Commission, 2009). The UK Government has also committed to
extensive CO2 emission reductions and now faces the challenge to deliver policies to meet
these demanding targets.

4
1.3 The UK Government‟s response to climate change
Current UK Government policy can be traced back to the year 2000 when the Royal
Commission on Environmental Pollution released the twenty-second report, Energy – The
Changing Climate. The report identified the need for the UK to reduce CO2 emissions by
60% by 2050 (compared to 1990 emissions levels) to mitigate the threat of climate change
(RCEP, 2000). The UK government accepted the Royal Commission‟s recommendations
and placed this emissions target as a key policy goal (DTI, 2003).
The need to take a coordinated approach to UK energy and climate change policy led to
the creation of the UK government Department for Energy and Climate Change (DECC) in
October 2008. One of the first actions taken by the DECC was the acceptance of the
recommendation, by Lord Turner's Committee on Climate Change, to reduce UK CO2
emissions by 80% by 2050 (compared to 1990 emissions levels) (DECC, 2008). This
more challenging target will require the rapid introduction of new far-reaching policies
(Boardman, 2008; GOS, 2008).
Existing climate change policies are outlined through the 2006 publication Climate
Change: The UK Programme 2006 (Defra, 2006), the UK Energy Efficiency Action Plan
2007 (Defra, 2007a) and through the strategic White Paper on Energy, Meeting the Energy
Challenge (DTI, 2007). More recently the UK Government set out its long-term strategy
for the transition towards a lower carbon society. The UK Lower Carbon Transition Plan
(DECC, 2009a) includes a target to reduce the CO2 emissions from homes by 29%, by
2020, compared with 2008 levels.
In addition to climate change, the Carbon Transition Plan and White Paper on Energy,
recognise that the UK‟s reliance on imported energy (which involves long supply routes
often through politically unstable regions) has made the UK economy vulnerable to energy
supply disruption from international disputes, accidents or terrorism and has provided the
conditions for energy supply to be used as a political lever. The reduction of energy
consumption, and the introduction of energy efficiency measures, is therefore seen as a
fundamental part of national security (DECC, 2009a; DTI, 2007).

5
1.4 The UK building stock
The UK‟s building stock is responsible for approximately 50% of national energy
consumption and around 45% of the nation‟s CO2 emissions (DTI, 2002; Defra, 2007a).
Thus, the reduction of energy use from buildings is considered as a vital opportunity to
meet UK CO2 reduction targets (DTI, 2007; Defra, 2007a; Defra, 2006). The need to
reduce energy use in domestic buildings has been identified as a key part of efforts to
address climate change (CLG Committee, 2008). Households are responsible for “about
30 per cent of total UK energy use and about 27 per cent of carbon dioxide emissions on
an end user basis” (Defra, 2006 p74).
For this thesis, domestic energy use can be defined as the energy directly used within
households. It therefore includes energy used for: (i) space heating; (ii) water heating;
(iii) cooking; (iv) appliances and lighting. This energy use accounts for overall annual
carbon emissions of approximately 43.7 MtC (Defra, 2006). To meet the UK government
target of an 80% reduction by 2050, domestic emissions must fall to around 8.2 MtC per
annum (DECC, 2009b).
Although there was a fall in total domestic energy consumption (which includes all energy
types, such as electricity and natural gas) of around 9% between 2004 and 2007, UK
domestic energy consumption has followed a generally increasing trend since the 1970s
(DECC, 2009b). Figure 1-1 below shows this trend and highlights that the recent decrease
appears to relate to a reduction in energy used for cooking and space heating.
For cooking, this reduction has been linked to lifestyle changes, such as increased
consumption of convenience foods and more frequent use of non-domestic catering
establishments (DTI, 2002). For space heating, despite the delivery of energy reduction
measures, the reasons for the recent decrease are still uncertain due to fluctuations that
have occurred in the past (such as between 1993 and 1995) and the influence of
variations in external temperature (Boardman, 2007). In contrast, the water heating and
lighting and appliance categories show a more constant increase in energy consumption.

6
Figure 1-1 UK domestic energy consumption by main end-use 1970-2006 (DECC, 2009b)
In 2007 space heating accounted for the highest amount of energy consumption in the UK,
around 56.2%, followed by water heating, around 25.6%, lighting and appliances, around
15.3%, and finally cooking, around 2.9% (DECC, 2009b). Due to space and water heating
making up the largest portion of domestic energy use, these areas have traditionally been
seen as those with the most potential to make significant CO2 emissions and the
“promotion of energy efficient measures in this sector have therefore been high profile”
(Owen, 2006 p12). However, there is growing concern regarding the increased energy
consumption from domestic appliances (DTI, 2004; MTP, 2006a; Owen, 2007; Crosbie,
2008; Ellis, 2009a).
This concern is reflected in two issues. Firstly, in contrast to space and water heating,
which are largely fuelled by natural gas (i.e. over 80% of UK heating systems use natural
gas) (DCLG, 2006a) domestic appliances are powered by electricity. Natural gas
produces around 0.20 Kg CO2/kWh whereas the electricity consumed by domestic
appliances produces around 0.50 Kg CO2/kWh (Defra, 2009b). Thus, in terms of CO2
0.0
10.0
20.0
30.0
40.0
50.0
60.0
1970 1975 1980 1985 1990 1995 2000 2005
En
erg
y (
Mil
lio
n to
nn
es o
f o
il e
qu
ivale
nt)
Space heating
Water heating
Cooking
Lighting and appliances
Total domestic energy
Year

7
emissions, lighting and appliance use has an increased significance. For example, figures
published by the Department for Communities and Local Government (DCLG) in 2006,
attributed 53% of household CO2 emissions to space heating; 20% to water heating; 5% to
cooking; and 22% to appliances and lighting (DCLG, 2006b). Therefore, appliances and
lighting is the second largest energy end-use in terms of CO2 emissions.
1.5 The rapid increase of domestic appliance use in the UK
In 2002 the DTI report Energy Consumption in the United Kingdom stating that between
“1970 and 2000, energy consumption in lighting and appliances increased by 157 per
cent” (DTI, 2003 p23). This makes the lighting and appliance category the fastest growing
domestic energy end-use in the UK. Figure 1-2 provides an illustration of this trend from
English Housing Conditions Survey (EHCS) data, presented by the DCLG (2006a).
Figure 1-2 Percentage change in UK domestic energy demand from 1971 to 2001 (DCLG*,
2006a) *Data sourced from English Housing Conditions Survey
Some researchers have linked the growth of the lighting and appliance end-use to a
number of socio-demographic changes, such as the general increase in the UK
population‟s living standards, life expectancy, disposable income, and increases in smaller
and fragmented households (Boardman et al., 2005; DTI, 2002; Herring, 1995). All of
these factors have led to a steep increase in the level of ownership of household electrical

8
appliances, which accounted for approximately 16% of annual UK domestic CO2
emissions in 2005 (DCLG, 2006a; Defra, 2006). It is widely anticipated that this trend will
continue as a result of further increases in appliance ownership, the rapid development of
services and the further diversification of products on the consumer market (Ellis, 2009a;
Defra, 2006; MTP, 2006a; Owen, 2006).
1.6 Consumer electronics and ICT appliances
To better understand the rapid growth of the appliance and lighting end-use it is necessary
to view DECC (2009b) data in more detail. Figure 1-3 shows DECC (2009b) electricity
consumption data, provided by the Market Transformation Programme (MTP), for the main
appliance categories: (i) lighting; (ii) cooking appliances; (iii) cold appliances (appliances
used for cooling food and beverages, such as fridges and freezer); (iv) wet appliances
(appliances used for cleaning and laundry, such as dishwashers and washing machines
etc); (v) consumer electronics (such as televisions, DVD players and audio equipment etc);
(vi) ICT (such as computers, routers, printers etc).

9
Figure 1-3 UK domestic electricity consumption by appliance categories. Data provided by
the MTP (DECC, 2009b) The growth in Cooking appliances relates to increased use of
electricity consuming appliances, such as microwave ovens etc.
It can be seen that over the past 10 years consumer electronics and ICT appliances have
been the most rapidly growing domestic electricity end-use (DECC, 2009b). In
comparison, the other categories appear to be either in decline or experiencing more
limited growth. Reasons for this situation are complex (and will be discussed in more
detail in chapter 2), but key factors include: (i) the improved efficiency of cold and lighting
appliances; (ii) the rapid emergence of new, more energy intensive, consumer electronics
and ICT products and services; (iii) market changes, such as the falling prices of consumer
electronics and ICT products; (iv) the emergence of more energy intensive patterns of use.
Although the data presented in Figure 1-3 show consumer electronics and ICT appliances
as separate appliance types, the distinction between the two categories has become more
ambiguous. In recent years a high level of convergence has occurred across these
appliance categories, with ICT appliances now being used for accessing television and
Lighting
Cold
Wet
Consumerelectronics
ICT
Cooking
0
200
400
600
800
1,000
1,200
1,400
1,600
1,800
2,000
1970 1975 1980 1985 1990 1995 2000 2005
Ele
ctr
icit
y c
on
su
mp
tio
n
(Th
ou
sa
nd
to
nn
es
of
oil e
qu
iva
len
t)
Year
Lighting
Cold
Wet
Consumer electronics
ICT
Cooking

10
radio broadcasts, playing DVDs and CDs, and as a means of telephony. Consumer
electronics appliances, such as televisions, set-top boxes and games consoles, can be
connected to the Internet, televisions can be used as visual displays for computers, and
video recording appliances use hard disk drive technologies that were once the distinct
domain of ICT appliances. This convergence suggests that investigations into the use of
ICT and consumer electronics appliances should be conducted in parallel to gain a more
complete understanding of the dynamics of their use. This rationale follows work by Owen
(2007) who combined the consumer electronics and ICT categories into the ICE category.
1.7 Existing research and gaps in knowledge
Chapters 2, 3 and 4 of this thesis present the results of literature reviews regarding
technical and behavioural aspects of household ICE appliance electricity consumption.
The results of these reviews suggest that currently there are a number of significant gaps
in knowledge. Firstly, there is only limited household ICE appliance electricity
consumption data from “real world” energy monitoring in the UK (Defra, 2008b; Defra,
2008c; MTP, 2009b). Although a number of recent studies have monitored aspects of ICE
appliance electricity consumption, these have taken place in other EU and OECD
countries (De Almeida et al., 2008; Isaacs et al., 2006a; Bennich and Persson, 2006).
Therefore, the results from these studies are subject to the effects of cultural and
contextual differences (e.g. in terms of appliance types, building infrastructure and
behavioural patterns) (MTP, 2009b). For the UK, this leaves uncertainty regarding: (i) the
actual levels of electricity consumption from different ICE appliances; (ii) the actual levels
of electricity consumption from different appliance power modes; (iii) the relative
contribution of different ICE appliances to UK domestic electricity consumption.
Social science research has suggested that potentially 60-70% of the variation in
household electricity consumption cannot be explained by background variables, such as
basic socio-demographics and dwelling type (Gram-Hanssen, Kofod and Petersen, 2004).
Thus, household behaviour appears to have a significant influence on ICE appliance
electricity consumption, but only limited data concerning the behavioural aspects of ICE
appliance use is currently available (Defra, 2008b; Defra, 2008c; MTP, 2009b; IVFIRDC,
2007).

11
Some scholars argue that energy research has retained a predominantly technical focus
(Gram-Hanssen, 2002, Jeeninga and Huenges Wajer, 1999) and that social science
energy research has also traditionally been quantitative in nature (Crosbie, 2006).
Therefore, energy research may have often failed to identify some of the deeper aspects
of energy behaviour that can be obtained from qualitative research methods (Crosbie,
2006; Strang, 1997). However, both qualitative and quantitative investigations into
household energy behaviour have often not measured energy consumption. Therefore,
many technical and social scientists are calling for energy studies to take a socio-technical
approach, so that: (i) behavioural investigations can be grounded in accurate consumption
data; (ii) technical studies do not neglect the influence of behaviour (Camilleri, 2009;
Isaacs, et al., 2006; Firth et al., 2008; Crosbie, 2006; Steg and Vlek, 2009; Steg, 2008).
An additional aspect to this thesis research is that it applies Triandis‟ (1977) Theory of
Interpersonal Behaviour, and elements of Rogers‟ (2003) Diffusion of Innovations Theory,
as a framework for the collection and analysis of the interview data. The Theory of
Interpersonal Behaviour has received little attention from environmental psychology
research. Thus, its inclusion in this thesis research provides a degree of new knowledge,
regarding the suitability of this theory, for future energy research.
It is anticipated that the data collected from this thesis will be useful to those involved in:
(i) appliance and electricity modelling; (ii) appliance and electricity consumption
forecasting; (iii) energy and environmental behavioural research; (iv) the development of
ICE appliance policy; (v) the design of ICE appliances; (vi) the development of socio-
technical research methodologies.

12
1.8 Aims and objectives
In light of the current gaps in knowledge this thesis presents socio-technical research
undertaken to investigate household ICE appliance electricity consumption in UK homes.
Thus, the overarching aim of this exploratory study is to:
Improve knowledge and understanding of the patterns of electricity consumption
attributable to information, communication and entertainment appliance use within UK
households.
The following objectives were identified to achieve this aim:
1. Identify to what extent patterns of ICE appliance use contribute to overall
household electricity consumption in a sample of UK households.
2. Explore the underlying factors that influence patterns of ICE appliance
consumption in a sample of UK households.
3. Provide recommendations to help inform policy aimed at reducing CO2 emissions
from ICE appliance use in UK households.
4. Develop a socio-technical methodology applicable to household electrical
appliance studies.
1.9 Thesis structure
This thesis has eleven chapters. The chapters that follow this introduction are outlined
below.
Chapter 2. Literature review 1: ICE appliances and domestic energy consumption
Presents a review of technical aspects of ICE appliance use and the development of
appliance sector policy. This includes the review of current ICE appliance forecasts and
previous monitoring studies.
13
Chapter 3. Literature review 2: Energy consumption and behaviour
Provides a review of literature from the social sciences to explore the potential social and
psychological factors that influence the adoption and use of ICE appliances. This chapter
introduces the two theories used to inform the thesis and presents the rationale for the use
of a socio-technical approach.
Chapter 4. ICE appliances and socio-technical energy research
Provides a review of literature from socio-technical research that has investigated
domestic ICE appliance electricity consumption. This chapter also provides a brief
summary of the three literature review chapters and outlines this thesis‟ research
questions.
Chapter 5. Research methodology
Focuses on the development of the research methodology and research methods used for
this thesis research. This includes a description of the electricity monitoring equipment
and interview schedule used for the research and the approach taken to data processing
and analysis.
Chapter 6. Results: Average household ICE appliance electricity consumption
Presents results based on the electricity consumption measurements recorded in the
sample of households. The broad aim of this chapter is to describe the typical ICE
appliance electricity consumption that occurred in the study sample.
Chapter 7. Results: Variations in household ICE appliance electricity consumption
Presents electricity consumption results that illustrate the wide variation in households‟
patterns of ICE appliance electricity consumption and highlights the influence of the
different appliances‟ power characteristics and patterns of behaviour.
Chapter 8. Operational behaviour
Presents results from the household interviews, which identify key behavioural factors that
influenced householders‟ ICE appliance use and household electricity consumption.

14
Chapter 9. ICE appliance ownership and adoption
Presents results from the household interviews, which identify key factors that influenced
householders‟ ownership and adoption of ICE appliances.
Chapter 10. Discussion
Discusses the findings from the ICE appliance monitoring and interviews, in respect to
previous research and describes potential implications for product design and the
development of policy.
Chapter 11. Conclusions
Presents a brief summary of key findings from the thesis and a discussion of the
contribution to knowledge. Limitations of the research are highlighted along with potential
areas for future research.

15
Chapter 2. Literature review 1: ICE appliances and domestic
energy consumption
2.1 Introduction
A literature review was undertaken to investigate the reasons for the rapid growth of ICE
appliance electricity consumption in UK homes. ICE appliance electricity consumption is
dependent on three important factors: (i) the number of appliances; (ii) the operational
performance of the appliances; (iii) how the appliances are used (Green and Ellegård,
2007). Therefore, it is necessary to understand issues that relate to the technical and
operational characteristics of ICE appliances and householders motivations for the
procurement and use of the appliances. This chapter focuses on technical and operational
issues. It begins with a review of background literature to describe the key operational
functions associated to ICE appliances electricity consumption, current forecasts of
domestic ICE appliance use in the UK (and other EU and OCED countries) and the policy
programmes that influence the UK appliance sector (section 2.2). It continues with a
review of some of the key scoping and monitoring studies that have provided some of the
impetus for current policy programmes (section 2.3). This highlights some of the current
gaps in knowledge and points towards the need to better understand underlying causes of
household behaviour.
2.2 Background: Operational functions, energy forecasts and policy
2.2.1 Operational functions
Fundamentally, an ICE appliance, such as a television, consumes a certain amount of
electricity to provide its operational functions (i.e. vision and sound). The intensity of this
electricity consumption is a central factor in determining the overall energy consumption
from the appliance. Subsequently the type and power characteristics of an appliance will
influence household electricity consumption. Due to the range of features that ICE
appliances now offer, devises will frequently possess a variety of power requirements
(Fung, Aulenback, Ferguson, and Ugursal, 2003). For instance, in the UK, televisions
commonly operate with the use of a remote control, which can be used to turn the device

16
on and off, without using the on/off switch located on the appliance or disconnecting it from
the mains power supply. When a television is turned off by the remote control it often
continues to draw electricity from the mains supply, in readiness to be turned on again
remotely. A device in this operational state is commonly referred to as being on “standby”.
Many ICE appliances can also consume standby power when the remote feature is
disengaged (by using the power switch on the device) and the device is simply plugged
into the mains supply. This energy use commonly occurs as a result of product design,
which allows components (such as transformers and switch mode power supply units) to
maintain a current from the mains. Although standby power may be relatively small, its
importance should not be underestimated. Standby power often operates 24 hours a day,
each day of the year, and thus can exceed active power use for some devices on an
annual basis. Therefore, the collective standby power from a nation‟s appliances can
account for a significant amount of energy consumption. In 2007 the International Energy
Agency estimated this to be between 5% and 10% of total electricity use in most homes
(IEA, 2007a).
Although standby power is a term used throughout energy literature, its meaning varies
considerably. The European and British Standard definition of the standby power mode is
expressed through BS EN 62301:2005 as the:
…lowest power consumption mode which cannot be switched off (influenced) by the user
and that may persist for an indefinite time when an appliance is connected to the main
electricity supply and used in accordance with the manufacturer‟s instructions.
(BSI, 2005 p6)
This is consistent with US Department of Energy (DOE) and the International
Electrotechnical Commission (IEC) definitions. In essence, standby power is “the lowest
power when connected to the mains electricity supply” (Harrington et al., 2007 p1286).
Other definitions of standby power have included a broader range of power modes. The
IEA states that:

17
Standby power is the electricity consumed by appliances while switched off or not
performing their primary functions.
(IEA, 2007b p1)
The term “not performing their primary functions” includes additional power modes, such
as when a television is turned off by the remote control or when a compact disk (CD)
player has finished playing a CD, and the display is still functioning. For these two
examples, there could be a lower power level when the television or CD player is simply
plugged into the mains, which by the BS EN definition is the true standby power mode.
Differences in operational features between appliances types, and similar appliances
produced by different manufacturers (e.g. some appliances can only be activated with a
remote control), also make it difficult to define standby power, because standby power is
irrespective of functionality (Payne and Meier, 2004).
Payne and Meier (2004) argue that due to appliances lowest power consumption occurring
in different operational modes, that:
…"standby" is a power level, not an operational mode. While it is sometimes more
convenient to talk about a product's "standby mode", that really refers to the mode at
which the device consumes its standby level, since there is no mode consistent across all
devices that is the standby mode.
(Payne and Meier, 2004 p11-143)
Payne and Meier describe a number of “low power modes”, which are in between the
unplugged and active power modes, and categorise them as sleep and “off” modes.
Figure 2-1 below illustrates these power modes and power levels for a typical ICE
appliance. It is apparent that although the energy consumption from the “sleep” mode
does not contribute to any actual use of the appliance, neither can it be categorised as
standby power due to the lower “off” power mode.

18
Figure 2-1 Depiction of appliance power modes (Payne and Meier, 2004 p11-143)
The existence of low power modes, not covered by the BSI, IEC and DEO definitions of
standby power, has led to a more complex definition within the recent Eco-design of
Energy-using Products (EuP) Directive. The Directive states that:
„standby mode(s)‟ means a condition where the equipment is connected to the mains
power source, depends on energy input from the mains power source to work as intended
and provides only the following functions, which may persist for an indefinite time:
- reactivation function, or reactivation function and only an
indication of enabled reactivation function, and/or
- information or status display;
(European Commission, 2008 p46-47)
Despite the emergence of a more inclusive definition, the complexity of standby power is
still a problem for any party involved in appliance power measurement, because it is
difficult to make an accurate comparison of different products that are continually
developing more complex power requirements. For example, Jones and Harrison (2009)

19
describe work to create a new power measurement method for STBs (the next edition of
the IEC 62087 standard). The authors highlight that eleven measurements are required to
cover all the potential operational modes of a STB (Jones and Harrison, 2009).
Televisions with internal digital signal receivers have also become more challenging to
measure due to the development of more complex functions. Four standby power modes
can be defined for televisions: (i) Off standby (appliance is connected to a power source,
provides neither sound nor vision, cannot be switched into another mode with the remote
control, an external or internal signal; (ii) Passive standby (appliance is connected to a
power source, provides neither sound nor vision, but can be switched into another mode
with the remote control or an internal signal); (iii) Active standby low (as with passive
standby, and can additionally be switched into another with an external signal); (iv) Active
standby high (as with active standby low, and is exchanging/receiving data with/from an
external source) (Jones and Harrison, 2009).
This situation creates difficulties for a researcher interested in monitoring appliances,
because the differentiation between power modes becomes difficult when using field
monitoring equipment that cannot measure power consumption to the same resolution as
laboratory equipment. Further uncertainty relates to whether continuously operating low
power devices, such as network and telecommunications equipment, should be included in
standby power consumption investigations (Harrington et al., 2007). Network appliances,
such as STBs, routers, modems and telephones, have the primary function of linking
households to external network systems, such as television services and the Internet.
Many network appliances often remain continuously in an active power mode, even when
a television or computer was not being used. By definition, an appliance being used in this
way is always in the active power mode. However, electricity consumption from network
appliances, when a television or computer is not also active, can be considered as a form
of standby power consumption, because rather than delivering their primary functions the
devices are effectively in a state of “ready” or maintaining network integrity (i.e. is providing
a similar function to the active standby mode).

20
As a result, some important appliance studies have included active network appliances in
their evaluations of standby consumption. For example, many of the STBs included in the
exemplar study by EES (2006) were in the “on mode”. The research found that around
60% of owners “left their set top box in active standby mode for 24 hours of the day” (EES,
2006 p31) and that these appliances were of particular importance to standby
consumption due to their relatively high continuous power loads. Similarly, in the
REMODECE project, electricity consumption from STBs and routers, that were active but
not being used, was also categorised as a form of active standby consumption (Grinden
and Feilberg, 2008; De Almeida et al., 2008). This complex situation is reflected in
research by McAllister and Farrell who argue that “the standby condition varies by
appliance and thus lacks specificity” (McAllister and Farrell, 2007 p1178). In their research
they avoided using the term standby power wherever possible in order to retain clarity.
Despite issues of clarity this thesis has chosen to refer to the term standby power,
because of its widespread use throughout existing literature and in policy circles. This
study also classifies electricity consumption from active network appliances, when the
associated televisions or computers are not active, as active standby consumption.
Despite concerns over the exact definition, this approach allows a more representative
assessment of the electricity consumption from network appliances to be gained, because
it separates electricity consumption that is not providing an appliance‟s primary function or
providing a “useful” purpose. Thus, this thesis uses the term “standby consumption” to
represent electricity consumption, from a range of low power loads that did not provide
appliances‟ primary functions.
For this research standby power is subdivided into active, passive and off standby modes,
to reflect the terms used in IEC standards and previous research studies, such as the EES
standby study (EES, 2006). This approach was also used by the International Standby
Power Data Project (2008), which aims to collate appliance standby power consumption
data from a number of countries (ISPDP, 2008). Table 2-1 below provides definitions of
these power modes.

21
Table 2-1 International Standby Power Data Project (2008).
Power mode Description
Active The power used when the appliance is performing its primary function (e.g. when a television is on and providing images and/or sound).
Active standby
The power used when the appliance is on, but not performing its main function (e.g. when a DVD recorder is on but not recording or playing).
Passive standby
The power used when the appliance is not performing its main function, but is in a state waiting to be switched on or is performing a secondary function (e.g. when a television has been switched off by the remote control).
Off standby Off standby mode is when an appliance, that has an off switch, is connected to a power source, but is not waiting or performing any function. It can only be activated when the power switch on the appliance is activated (e.g. when a computer monitor is switched off, but still plugged into the mains power supply).
Although this approach neglects other standby modes, such as active standby high and
active standby low, it is believed that a significantly detailed assessment of standby power
can be gained from this approach. In addition, these definitions allow a degree of
harmonisation to power mode definitions for computing appliances outlined through the US
Environmental Protection Agency‟s long established Energy Star energy labelling initiative
for ICT equipment (the success of which has resulted in its adoption across the EU). The
Energy Star definitions are presented in Table 2-2.

22
Table 2-2 Computer power mode definitions (Energy Star, 2009)
Power mode: Energy Star
Power mode: Thesis
Energy Star description
Active state
Active The state in which the computer is carrying out useful work in response to a) prior or concurrent user input or b) prior or concurrent instruction over the network. This state includes active processing, seeking data from storage, memory, or cache, including idle state time while awaiting further user input and before entering low power modes.
Idle State
Active standby The state in which the operating system and other software have completed loading, a user profile has been created, the machine is not asleep, and activity is limited to those basic applications that the system starts by default.
Sleep mode
Passive standby A low power state which the computer is capable of entering automatically after a period of inactivity or by manual selection. A computer with sleep capability can quickly “wake” in response to network connections or user interface devices with a latency of ≤ 5 seconds from initiation of wake event to system becoming fully usable including rendering of display.
Off mode
Off standby The power consumption level in the lowest power mode which cannot be switched off (influenced) by the user and that may persist for an indefinite time when the appliance is connected to the main electricity supply and used in accordance with the manufacturer‟s instructions.
A final important aspect of standby power electricity consumption is whether one considers
electricity consumption from all of the standby power modes to be wasted energy.
Electricity consumption from the off standby mode can be regarded as wasted energy,
because it does not provide a function. However, in many situations passive standby and
active standby power does provide a function. For example, passive standby power
enables the remote control reactivation function for televisions and active standby power
allows software updates, from service providers, to be transferred regularly to STBs. The
value of standby power can therefore be subjective, but for those involved in the
environmental agenda there is a general consensus that most standby functions are not
essential and do not warrant the amount of electricity that they consume. As a result,
standby consumption has become the focus of both technical and social energy research

23
and has led to a variety of policy initiatives to reduce household consumption through
improved product design and behaviour change.
2.2.2 International forecasts of ICE appliance electricity consumption
Chapter 1 outlined that domestic ICE appliance use is now the fastest growing electricity
end-use in UK homes (DECC, 2009; Owen, 2007). This trend is also evident in other EU
and OECD countries. Electricity consumption from ICE appliances grew globally, by
nearly 7% per annum between 1990 and 2008, and accounts for around 15% of global
domestic electricity consumption. The IEA now predicts that global energy use from ICE
equipment will double by 2022 and will increase threefold by 2030. This means that by
2020 ICE appliances will be the largest domestic end-use category in many OECD
countries (Ellis, 2009a).
Data gathered by the IEA suggests a number of reasons for this trend:
Increased penetration of ICE products;
New services (e.g. digital broadcasting, broadband and wireless services);
The adoption of larger television screen sizes (with Liquid Crystal Display (LCD)
and Plasma technologies;
Falling consumer prices;
Increased networking of devices (between appliances in the home and external
devices and service providers).
(Ellis, 2009a; Ellis, 2009b)
Although, the IEA presents these reasons, it also indicates that understanding is far from
complete. In the conference paper used to launch the IEA‟s assessment, the author
states:
A real understanding of the factors influencing changes [in] consumption patterns can only
be gained by examining detailed end-use assessments based on reputable data. While the

24
monitoring needed to support such bottom-up assessments is far from universal, data from
several major economies offers strong clues as to why residential electricity consumption
has increased markedly over the past decade.
(Ellis, 2009b p3)
The quote introduces two important points that will be explored in more detail throughout
this chapter. Firstly, the information currently available to policy makers offers “clues”
rather than a clear understanding. This is because much of the existing assessments are
derived largely from market and manufacturer data sources. Secondly, it presents the
argument that to gain a comprehensive understanding requires detailed monitoring data,
which is currently very limited.
2.2.3 UK domestic ICE appliance electricity consumption projections
In the UK, most projections of future ICE appliance electricity consumption are obtained
through the MTP. The MTP is a largely governmentally funded organisation (managed by
Defra), which was established to help integrate sustainable development into the
production and consumption of many household and industrial products. The MTP is
responsible for the collection of data, to establish the current and future environmental
impacts of products (such as ICE appliances) and to support the implementation of
product policy (MTP, 2009a).
In 2006 the MTP forecast that, with no action, consumer electronics electricity
consumption could rise to over 32 TWh by 2010 and over 50 TWh by 2020, from the 2004
baseline figure of approximately 17.3 TWh (MTP, 2006a). When figures for domestic ICT
electricity consumption are also included in Table 2-3, it is suggested that by 2020, ICE
appliances may account for around 55.6 TWh.

25
Table 2-3 Projected ICE electricity consumption (MTP, 2006a)
2004 (TWh) 2010 (TWh) 2020 (TWh)
Consumer electronics* 17.3 32.4 50.4
Domestic ICT** 1.6 4.4 5.2
Total ICE 18.9 36.8 55.6
* Televisions, digital TV adapters, video recording equipment and external power supply units
** PCs and laptops, monitors and imaging equipment
The predictions presented in Table 2-3 include only a selection of the main ICE appliances
and do not include the potential effects of the implementation of new policies or the
introduction of new technologies in the future (MTP, 2006a). Although the MTP provide
additional scenarios that include the effects of policy changes, they retain a degree of
uncertainty due to the dynamic nature of the sector and the extent to which current ICE
appliance policy is in place.
Evidence to support this opinion is apparent through more recent consumption forecasts
(MTP, 2008). Table 2-4 shows that in 2008 the MTP predicted that by 2020, with no
action, ICE appliances would result in consumption around 7 TWh less than previously
anticipated. Surprisingly, the anticipated 2020 estimate for consumer electronics electricity
consumption, was 32.5% less than previously thought and ICT is anticipated to be around
280% more than previously thought.
Table 2-4 Projected ICE electricity consumption (MTP, 2008a)
2007 (TWh) 2020 (TWh)
Consumer electronics* 18.5 34.0
Domestic ICT** 12.0 14.6
Total ICE 30.5 48.6
* Televisions, digital TV adapters, video recording equipment and external power supply units
** PCs and laptops, monitors and imaging equipment
More recent forecasts from the MTP are presented in a Defra consultation document that
includes consumer electronics and ICT appliances. The forecasts provide much more

26
encouraging outlook due to baseline projections including recently agreed policies, such
as the EuP Directive (to be described in section 2.2.5). The forecasts suggest that, with
no further action, the electricity consumption from consumer electronics could rise from
20.8 in 2009 to 21.5 TWh by 2020. Similarly, with no further action, it is predicted that
household ICT electricity consumption could increase from 6.5 TWh in 2009 to 6.9 TWh by
2020 (Defra, 2009). Despite these more optimistic forecasts, it is clear that ICE appliance
electricity is still predicted to increase and the variations in the MTP‟s predictions highlight
a degree of uncertainty. Boardman (2007) appears to agree with this view and argues
that, in respect to appliances as a whole, the “rate and level of this future growth is difficult
to predict and different authorities come up with quite widely varying projections”
(Boardman, 2007 p27).
When documents concerning the MTP‟s modelling work are reviewed, it is suggested that
predictions are largely based on consumption measurements gained through controlled
conditions (i.e. laboratory consumption measurements) and UK appliance stock levels and
other “trusted” data sources (e.g. the EU Energy Star database for ICT appliances) (MTP,
2008b).
Although it is suggested that data concerning usage patterns are also collected, it appears
that the MTP‟s predictions are limited by a lack of “real world” consumption measurements
and insufficient knowledge of consumers purchasing activities and patterns of use.
Amongst a number of risks discussed within Defra‟s 2008 consumer electronics and ICT
policy briefs (compiled by the MTP) is the recognition that:
Weaknesses in knowledge about market and technology trends, and the relationship
between the performance of products measured under test conditions and what is
achieved in real life could all lead to reduced effectiveness of the policy programme.
(Defra, 2008b p12; Defra, 2008c p17)

27
The key implications of this statement are that UK policies to address rising ICE appliance
use could be ineffective and that there is an urgent need for real world ICE appliance
research to support policy development.
This position is also reflected in the MTP‟s current understanding of standby power
electricity consumption. In 2009 the MTP produced a revised version its UK standby
power consumption estimations. The estimates were compiled through the use of the
MTP‟s modelling work and its publically accessible “What-if Tool” and suggest that, in
2006, 7.2 TWh of electricity was attributable to standby and of this around 5.2 TWh is from
domestic consumption (MTP, 2009b). However, the MTP concedes that “this is likely to be
a low estimate as there are a number of product groups not included [and that the] lack of
accurate data available for these product groups means that it is difficult to make confident
estimates” (MTP, 2009b p2). Domestic standby power consumption therefore probably
ranges between 6.1 to 12.2 TWh, which equates to between 5.2% and 10.5% of UK
domestic electricity consumption (MTP, 2009b).
The MTP provides a number of tables describing products where there is significant
confidence in the estimates. This includes televisions, STBs, VCR and DVD equipment,
computers and displays, and printers. However, a number of ICE appliances are not
included in modelling estimates and where there is large uncertainty on usage. These
include a range of audio appliances (such as, clock radios, compact Hi-Fi, amplifiers,
speakers, tuners, CD players, cassette players, vinyl record players), video games
consoles, home theatre systems, and modems (routers).
The MTP states that “accuracy of the data is variable as there are only a few studies on
the subject” (MTP, 2009b p9) and that all the studies have weaknesses. These include
the following:
Small sample sizes;
Deficiency in data concerning the time the appliances spend in each mode;
No distinction between the different types of standby power consumption in the
values provided;

28
Most studies are based on non UK appliances, which have different designs,
supply frequencies and patterns of user behaviour;
Some data only concern the latest products on sale, and not the current stock;
Data have been collected in different years, which is a key issue for products that
evolve quickly (such as ICE appliances);
No overall consistency in the methodology for measuring standby power and the
categorisation of products.
(MTP, 2009)
Importantly, the MTP highlights that at present there is “little data on behaviour of
appliance users” (MTP, 2009b p10). Although much of the recommendations of the
Briefing Note point to improved product energy efficiency, it is also suggested that “simple
changes in user behaviour could lead to major reductions in standby power consumption”
(MTP, 2009b p10).
Despite limited data, the MTP‟s predictions all point towards the rapid growth of ICE
appliance electricity consumption and a number of critical issues for this trend. These
include technical issues, such as the performance of STBs (which are permanently
energised to receive updated software whether active or in a standby mode), increased
network connectivity (which causes appliances to remain in higher power modes), poor
product design, the level of standby savings being too low to influence consumer purchase
decisions and the rapid development of new technologies (MTP, 2009b).
2.2.4 UK policy programmes
Many of the current UK policies affecting ICE appliances are derived from the White Paper
on Energy (DTI, 2007), which tie to the cross-cutting themes of the UK Government
Sustainable Development Strategy (Defra, 2005). This includes the aim to promote “better
products and services, which reduce the environmental impacts from the use of energy,
resources, or hazardous substances” (Defra, 2005 p44). Within the White Paper on
Energy the government states that it will:

29
Implement measures to improve the adoption of energy efficient products, and
help stimulate innovation and global competition with international partners to
increase standards and provide a greater choice of energy efficient products to
consumers;
Promote international co-operation on product labelling and standards, particularly
in respect to standby power;
Work with suppliers to encourage more efficient goods and services;
Publish a succession of consultation papers presenting analysis of how the
performance of products will need to improve between the present and 2020.
(DTI, 2007; Defra, 2008b)
It is apparent that the main theme of UK policy relates to improving appliance energy
efficiency and work by the MTP has helped to facilitate the improved energy efficiency of a
number of appliance types. For example, the annual electricity consumption of some
appliance categories, such as cold appliances and lighting, have been in decline in recent
years, which in part can be attributed to policies implemented to improve the efficiency of
these product groups (Owen, 2006). The introduction of statutory energy labelling (which
allows consumers to compare the energy efficiency of appliances through an efficiency
scale from G-A++ depending on appliance type) has incorporated energy efficiency into
consumer purchasing decisions.
Cold appliances are also subject to minimum standard regulation, which “means those
products with efficiencies of D or worse (or F or worse for chest freezers) are no longer
available” (Defra, 2008a p7). Voluntary agreements adopted by manufacturers of cold
appliances have also “encouraged the production of A-rated models and discouraged the
production of C-rated models (D and E for chest freezers)” (Defra, 2008a p7). As a result,
over 50% of current sales of most cold appliances (with the exception of chest freezers)
consist of A-rated (or above) appliances and a typical new upright freezer now uses
around 26% less energy than an equivalent model in 2000 (Defra, 2008a).

30
In contrast, until relatively recently, there has been only limited UK policy measures to
address rising ICE appliance electricity consumption. Although televisions will be subject
to mandatory energy labelling from November 2011 (European Commission, 2010),
mandatory energy labelling currently excludes ICE appliances. Thus, efforts to raise the
profile of energy efficient ICE appliances has been largely limited to voluntary initiatives,
such as partnerships with retailers and the voluntary adoption of energy labels (e.g. the
Energy Saving Trust‟s (EST) Energy Saving Recommended Scheme (ESR) and Energy
Star) (Defra, 2008b; Defra, 2008c).
Central to UK government action is its intent to introduce “product standards and targets to
phase out the least efficient products” (Defra, 2008b p1). To achieve this objective the UK
government has set minimum energy performance standards (MEPS) for a range of ICE
appliances via those established by the Energy-using Products (EuP) Directive (Defra,
2009). Other policies include a retailer initiative, but Crosbie (2008) highlights that so long
as a retailer‟s sales-weighted score is positive, in respect to sales of energy efficient
appliances, a retailer can still gain an overall “green rating” despite selling appliances that
do not fall within the standards. Retailers also do not have to provide consumers with
information about the energy efficiency of individual ICE appliances. Crosbie also argues
that this form of initiative only concentrates on current appliance technologies, and does
not contend with the service infrastructures which have a fundamental influence on the use
and development of new ICE appliance technologies (Crosbie, 2008)
Other actions that have been taken in light of Government aims have been the
improvement of public sector procurement, the promotion of pro-environmental behaviour,
and support for smart metering. The overall effect of these actions is still unclear and in
respect to pro-environmental behaviour, this work is still in its infancy (Defra, 2008c; Defra,
2009).
Further issues that impact on the UK Government‟s response to ICE appliance use, can
be found in the Digital Britain policy report (DBIS and DCMS, 2009), which outlines the
Government‟s policy aims to develop the UK‟s digital economy. Within the report are
ambitious aims and objectives to expand the UK‟s digital services and telecommunications

31
infrastructure and encourage the use of these services by UK households. The report
identifies a number of key initiatives that include: (i) the expansion and improvement of
broadband, digital broadcasting and mobile communication infrastructures: (ii) changes to
the education system to provide householders with ICT skills from a young age; (iii)
programmes to promote the benefits of being online and increase the delivery of public
services via the Internet; (iv) programmes to give lower income households access to
digital services (this includes grants to provide affordable technology such as personal
computers, digital radios and STBs for digitally excluded citizens); (v) programmes to
increase communities use of digital media to maintain social networks (DBIS and DCMS,
2009).
The overall aims of the Digital Britain report suggest that increasing the use of ICE
appliances in all UK homes is considered as a fundamental policy for the UK‟s economic
growth. Increased domestic ICE energy consumption appears to be an inevitable outcome
from these policies, but the impact that this will have on household electricity consumption
and CO2 emissions is given little attention. The 239 page report only mentions climate
change on one page, where it argues that “telecommunications is green technology” (DBIS
and DCMS, 2009 p83) due to its potential to reduce CO2 emissions from transport and its
potential to facilitate smart metering systems. It does not however discuss the potential
effect of increased domestic energy consumption from increase occupancy at home (e.g.
ICE appliance use, space heating and lighting etc).
Although the report mentions the need for energy efficient appliances, other intended
programmes contradict this position. For instance, the reuse or recycling of personal
computers in lower income households may cause less energy efficient appliances to be
retained within UK homes. This initiative also appears to contradict the aims of the White
Paper on Energy, which looks to encourage the substitution of inefficient appliances with
new more efficient products. It can also be contended that the programme to replace
analogue radios with digital radios may have a similar impact. Although the report argues
that the electricity consumption of digital radios is now broadly comparable to analogue
radios (and that some digital radios consume less electricity than an energy saving light

32
bulb) the report concedes that “cheaper digital equipment has yet to achieve parity” (DBIS
and DCMS, 2009 p98).
2.2.5 EU policy programmes for ICE appliances
Due to ICE appliance being internationally traded goods, a key condition for UK policy is
the harmonisation with EU programmes. Although this can be viewed as a risk to the UK
(e.g. EU indicative standards could be lower than those required in the UK), international
co-operation is vital, because unilateral UK policies can only influence UK manufactured
products (Defra, 2008b; Defra, 2008c). Work at the EU level provides an important
opportunity to improve international efforts. The recent implementation of European
policies, such as the Energy-using Products (EuP) Directive, has provided a new level of
impetus to deal with the ICE appliances electricity consumption. The EuP Directive aims
to improve the environmental performance of energy using products by reducing the
energy consumption and other negative environmental impacts of products throughout
their life cycle. This will require manufacturers to systematically address the energy
consumption of their products at the design stage (European Commission, 2005).
Improved energy efficiency is seen as an important criterion, due to the Directive‟s
emphasis on the introduction of low cost measures with a high potential to reduce
greenhouse gases. Although mandatory or voluntary consumer information programmes
and industry agreements are included in the EuP Directive, the main focus is the
introduction of minimum energy performance standards (Ellis, 2009a). The EuP Directive
affects a wide variety of ICE appliances, which have annual sales above 200,000 units in
the EU.
For example, the horizontal theme “standby and off-mode losses” aims to reduce the
impact of standby energy consumption across appliance types covered by the Directive.
This will lead to a statutory requirement not to exceed a 1 Watt standby power for a range
of ICE appliances, by 2013. In addition to “standby and off-mode losses” the following ICE
products have been selected:
Personal computers and computer monitors (this includes laptops);

33
Consumer electronics: televisions;
Imaging equipment: copiers, faxes, printers, scanners and multifunctional devices;
Simple television set-top boxes;
Complex television set-top boxes;
Battery chargers, power supplies.
(European Commission, 2008)
The EuP Directive‟s use of voluntary agreements may also be seen as a potential
weakness. Despite some success through the EU industrial “Codes of Conduct”, other
voluntary initiatives have been less successful. Voluntary agreements for televisions and
a number of video recorder technologies were organised by the European, Information and
Communications Technology Industry Association (EICTA). In 2003 fourteen EICTA
members agreed to improve the performance of a number of ICE appliances. However,
EICTA found that some aspects of standby performance had actually worsened in the first
year due to technological and market changes. Insufficient consumer awareness in
purchase decisions, and a lack of returns on investment, resulted in EICTA terminating its
commitment (Ellis, 2009a).
2.2.6 Policy issues
Although UK and EU policy initiatives are a welcome development, the fact that they
predominantly concentrate on technical fixes can be viewed as a limitation. This type of
approach concentrates on current products, and does not tackle the underlying service
infrastructures which influence the use and development of new ICE appliances. Crosbie
(2008) found that service providers, marketing and service infrastructures had a significant
influence on the formation of new more energy intensive television practices. Thus, the
EuP Directive‟s technical focus results in there being little attempt “to understand the
practices and infrastructures that shape energy use, which are an essential element of
developing and marketing energy efficient products” (Crosbie 2008, p2192).

34
An illustration of how practices and infrastructures can relate to energy efficiency policy
can be found in work concerning the rebound effect. The rebound effect or “take-back”
can occur when an action to reduce energy consumption, such as better energy efficiency,
results in another, often unexpected, action that partially offsets the level of energy
reduction gained (Hertwich, 2005). For example, the installation of more energy efficient
boilers, or insulation, can result in more extensive heating of the home. Similarly, if energy
efficient light bulbs are introduced to luxuriously illuminate a dwelling, the benefit of
increased efficiency (i.e. financial savings) may increase the consumer‟s desire for even
more extensive illumination (Midden, Kaiser and McCally, 2007; Hertwich, 2005). Findings
by De Almeida, Fonseca, Feilberg, Grinden, Kreitz and Dupret (2009) support this position.
Although there is need to consolidate their results, the authors found that for cold
appliances and dishwashers:
Generally, the benefit achieved with the reduction of the electrical consumption have been
partially lost due to behaviour changes or choice of larger equipments, which consume
more electricity.
(De Almeida et al., 2009 p18)
Such factors suggest that focussing exclusively on the technical aspects of energy
efficiency could constrain the potential benefits achieved. It follows that the consideration
of consumers‟ primary motives for the adoption and use of ICE appliances should also be
seen as an important element for the implementation of successful energy reduction
policies (Midden, et al. 2007; Hertwich, 2005).
A further aspect of ICE electricity consumption is the impact of existing appliances in UK
homes. Although it is anticipated that the replacement of ICE appliances will occur more
rapidly in the next five to ten years, at present many devices remain in use within homes
for a considerable number of years. For example, in the EU, televisions remain in use, on
average, for between ten to fifteen years (Stobbe, 2007a). Therefore, policy measures
may also need to also focus on altering householder behaviour in favour of more energy

35
efficient practices (i.e. use energy more carefully) if the UK government‟s CO2 emissions
targets are to be met.
This is an opinion evident in recent policy research in the UK. In her proposed strategy to
reduce UK domestic CO2 emissions by 80%, by 2050, Boardman (2007) estimates that at
least a third of the carbon savings in the domestic sector would come from behaviour
changes (Boardman, 2007). In respect to appliances Boardman argues that:
…standby may have been reduced to a minimum by regulation, but someone still has to
turn the appliance off. Whilst technology has a major role in reducing demand, it is not a
panacea.
(Boardman, 2007 p81)
The need for an urgent reduction in CO2 emissions implies that behavioural strategies to
reduce ICE appliance electricity consumption will be an important component, but specific
ICE appliance behaviour change initiatives are still not in place and there are no current
mandatory energy labelling schemes to influence consumer purchasing behaviour (Defra,
2008b; Defra, 2008c).
2.3 Modelling and monitoring studies
Section 2.2 has described that there are still significant gaps in knowledge concerning UK
ICE appliance electricity consumption and uncertainty regarding future predictions, due to
the lack of real world electricity consumption data and a need to better understand usage
patterns. Policy stakeholders have pointed to the need for more detailed information, from
accurate appliance monitoring, in order to introduce more effective policies. This section
presents literature that has been used to inform the current assessment of ICE appliance
use.

36
2.3.1 The EuP preparatory studies
The EU‟s decision to establish the EuP Directive, in 2005, led to a number of preparatory
studies being undertaken to inform the implementation process. In addition, to a horizontal
standby study, a number of specific ICE appliance studies were conducted (see Table
2-5).
Table 2-5 EuP preparatory studies
Lot No. Description
3 Personal Computers: (desktops & laptops) and computer monitors
4 Imaging equipment: copiers, faxes, printers, scanners, multifunctional devices
5 Consumer electronics: televisions
7 Battery chargers and external power supplies
18 Complex set top boxes (with conditional access and/or functions that are always on)
The preparatory studies investigated the environmental impact of existing products,
exploring the potential environmental improvements that can be made through better
design and manufacture. Thus, the reports include predictions of the potential benefits of
technical and operational improvements and the implementation of policies to develop
market conditions. To achieve this aim, the studies reviewed contemporary data, which
help to illustrate some of the gaps in current knowledge.
For example, the Lot 5 preparatory study focuses on television use in the EU and
concludes that much of the observed growth in electricity consumption is related to two
key issues: (i) increased ownership; (ii) increased adoption of larger flat-screen LCD and
plasma televisions (which have higher on power mode power requirements often in excess
of 100 Watts and up to 300 Watts). In addition, the introduction of High Definition (HD)
broadcasting has also resulted in increased power requirements for new televisions. The
on (active) mode is therefore the most significant form of television electricity consumption
and it was estimated that this would increase from 40 TWh in 2005, to 76 TWh in 2010
(Stobbe, 2007d)

37
The report acknowledges that, in respect to CRT television technologies, “policy measures
in the framework of the EuP can hardly address these products, although they contribute
to the total energy consumption of TVs on stock in the European Union” (Stobbe, 2007c
p8). This is because CRT televisions are anticipated to be phased out by 2015. This
highlights that the measures within the EuP Directive can only influence new products.
Existing appliances are therefore excluded from a central EU policy and can continue to
influence household electricity consumption despite the need for the rapid reduction of
CO2 emissions.
As well as baseline estimates, the other EuP preparatory studies contain scenarios for
future annual electricity consumption. These estimates are based around EU stock level
data and power consumption data from manufacturers and industry bodies. Therefore,
there is no clear inclusion of real world electricity consumption data. This is reflected in
the use of an average of 4 hours per day of on (active mode) television use for its EU-25
base-case (baseline) estimate and 5 hours per day for future scenarios. These figures
were gained from a number of existing international consumer surveys, which typically
varied from 2.5 to 5hrs of use per day. No clear patterns of use for standby power and the
off mode could be obtained, so the report uses a series of scenario based estimates.
These use profiles were applied to both living room and bedroom televisions, due to
limited data available concerning differences in their hours of use (Stobbe, 2007e).
Other preparatory studies, such as the Lot 18 report concerning complex STBs (STBs that
allow conditional access, i.e. they can process and apply targeted data from a service
provider), use the same use profile as a basis for electricity consumption estimates,
combined with additional information gained from a focus group meeting with stakeholders
(Bio Intelligence Service, 2008). Again this highlights a gap in knowledge concerning
patterns of consumer electronics appliance use.
Although standby power consumption was seen as less significant for television electricity
consumption, the future growth of “networked” standby power consumption was seen as a
significant issue. Networked standby power equates to a form of active standby, when a
television‟s internal digital receiver (or a STB) is required to update software to maintain

38
interoperability and security. The television broadcasting industry requires televisions and
STBs to remain continuously in active standby, in order to receive security updates that
prevent the illegal copying of broadcast material (Stobbe, 2007c). Interestingly, for
complex STBs, the estimates suggest that active and active standby modes are of equal
importance in electricity consumption terms and that:
...the choice of the use pattern is a critical parameter when estimating the environmental
impacts related to complex STBs. The longer the device is on-mode or in active standby,
the higher the impacts.
(Bio Intelligence Services, 2008 p VIII-36).
The report goes on to state that the significance of potential measures (such as “auto
power down options” and “hard off switches”) also change depending on the use pattern
applied. This suggests that the lack of real world data may have implications for the
selection of the most appropriate policy measures.
For the Lot 3 study into Personal Computers, the main sources of data for household
patterns of use are from a number of international studies (IVF Industrial Research and
Development Corporation (IVFIRDC), 2007). These include a report for the US
Department of Energy, which focuses on making a preliminary estimate of ICT electricity
consumption in the USA, and three scenarios (TIAX LLC, 2006). However, the TIAX LLC
report used telephone surveys to estimate appliance use in different power modes, which
it describes as the most uncertain aspect behind its results (TIAX LLC, 2006). This type of
survey method relies on individuals perceptions of use rather than actual use. Other
sources include a German report by Schlomann (2005) (which provides several estimates
based on literature studies and experience), data from Energy Star and a large Japanese
survey of computer use by Williams and Hatanaka (2005). An additional questionnaire
was sent to leading companies and institutions concerning the entire Lot 3 assessment
and these responses were taken into consideration (IVFIRDC, 2007).

39
The most informative data came from a study for the MTP (2006b) that provided
monitoring data for domestic personal computer use in the UK. The results from the MTP
study will be discussed in more detail in section 2.3.5, but according to IVFIRDC “these
values can be regarded as the best available figures” (IVFIRDC, 2007 p95). These data
were also used to inform the estimates and scenarios regarding current and future
electricity consumption from domestic personal computers. However, consumption data
for this task was largely gained from manufacturers and existing Energy Star datasets
(Energy Star accreditation requires compliance to measurement standards) (IVFIRDC,
2007). Thus, within the final recommendations there is the request for further appliance
monitoring studies. The report states:
In order to better understand the usage pattern, and to further develop energy efficient
equipment, there is a need to study the usage pattern for computers and computer
monitors. Available reports are often old, and the usage tends to change when new
applications are available.
(IVFIRDC, 2007 p262)
The report goes on to state that current studies are “often based on questionnaires rather
than measuring (logging) the behaviour, which gives less reliable results” (IVFIRDC, 2007
p262). Moreover, it argues that measurement data:
...can be complemented with a survey where the users are asked questions, in order to
better understand underlying causes of their behaviour. Such a study would aid in the
development of new computer systems.
(IVFIRDC, 2007 p262)
Thus, the EU preparatory studies highlight the need for ICE appliance monitoring and that
future investigations would be more valuable, if underlying causes for behaviour were also
investigated. This is an argument that is also evident in previous household appliance
monitoring studies.

40
2.3.2 Why monitor household ICE appliances?
Domestic energy end-use monitoring provides the detailed information necessary to better
understand the ways that households use energy. In respect to ICE appliances, it
provides the level of electricity consumption of different appliances, their power demand
and their frequency of use in different power modes. The availability of this type of
information is useful to policy-makers, appliance manufacturers and electricity producers
and distributors. In a publication for the Residential Monitoring to Decrease Energy Use
and Carbon Emissions in Europe (REMODECE) project it is highlighted that monitoring
campaigns allow stakeholders to:
Better understand the operational characteristics of appliances, and their cycles of
use in the “real world”, away from the laboratory;
Prioritise areas of consumption that are of greatest concern;
Introduce better informed and effective policy measures;
Improve the accuracy of forecasting future electricity consumption and the
identification of new trends of electricity use;
Improve information given to appliance users, so that energy efficiency awareness
campaigns can be more effective;
Improve knowledge of electricity demand and load curves (which is of use to
electricity producers and distributers) to improve DSM programmes;
Better evaluate the effects of previous initiatives;
Develop test and experimental conditions for appliance standards, to better reflect
real world use.
(ENERTECH, 2006)
Conducting electricity monitoring at the appliance level is still not an easy task, which is
reflected in there being only limited data of this type, but a number of previous studies
have provided valuable data that has led to changes to energy policy.

41
2.3.3 Appliance monitoring campaigns
In Europe in the 1990s, the increasing demand for domestic electricity led to a number of
metering campaigns being undertaken by utility companies and national energy agencies
to better understand how electricity was being used (i.e. how much and for what type of
activities). These campaigns provided electricity consumption data for bottom-up
forecasting models, the development of DSM programmes and the improvement of energy
conservation policies (Lebot, Lopes, Waide and Sidler, 1997; ENERTECH, 2006).
Although some of these first European campaigns date back to the late 1980s, the more
comprehensive campaigns can be traced back to a 1992 Danish Energy Agency study.
The study involved the monitoring of twenty homes to measure the effect of substituting
existing appliances with more energy efficient alternatives. More in depth research
occurred in Sweden, between 1991 and 1992, when sixty-six homes were monitored by
NUTEK (the Swedish energy and environment agency). Similar research was also
undertaken in other European countries. The CCE (Portuguese energy and environment
agency) monitored twenty-five homes, in 1995, for two periods of fifteen days and the
CIEL campaign monitored ninety-four French homes for a one month period. The
ECODROME project monitored twenty French homes, from 1995 to 1996, for a two year
period and measured existing appliances in the first year and the effects of their
substitution with more energy efficient alternatives in the final year. In the UK, the
Electricity Association monitored one-hundred homes between 1992 and 1996 (Sidler,
1995; Lobot et. al, 1997).
A conference paper by Lobot et al. (1997) compares five of these European end-use
metering campaigns. The review illustrates the range of approaches taken by the
monitoring campaigns, which are summarised in Table 2-6. The results from the projects
provide a collection of comparable electricity consumption data across a range of
appliances and are presented in Table 2-7.

42
Table 2-6 Metering campaign characteristics (Lebot et al., 1997)
Name of Project
CIEL1 ECODROME3 CCE2 NUTEK4 EA5
Location Bourgogne, France
Drôme, France Portugal Sweden Britain
Sample size (No. of households)
115 20 25 66 100
Year of project
1995 95-96 1995 91-93 1992-96
Duration of the metering
1 month 2 years 2 x 15 days 2 years 1 year
Main data and frequency of metering
W,Wh,/10min W,Wh /10min Wh /5min Wh/day W/30min
Questionnaire Yes Yes No No No
End-use Main individual appliances only
Main individual appliances only
Main individual appliances only + total power demand
Main individual appliances only
-
Table 2-7 Average measured consumption per appliance (Lebot et al. 1997)
Appliance CIEL1 (kWh/year)
ECODROME3 (kWh/year)
CCE2 (kWh/year)
NUTEK4 (kWh/year)
EA5 (kWh/year)
Fridge 373 363 274 485 320
Fridge/Freezer 581 720 622 763 655
Freezer 617 629 729 1048 615
Washing Machine 235 263 145 315 240
Dishwasher 262 293 284 568 360
Clothes drier 480 379 347 372 260
TV 140 203 152
Lighting 500 425
Halogen 242
The focus of these campaigns was on the “main” individual appliances, which at the time
were dominated by cold, wet, cooking and lighting appliances. Therefore, the ICE
appliances included in these studies were largely limited to televisions, VCRs and audio

43
equipment. Nevertheless, the body of research provided a number of important findings in
respect to ICE appliance use. In each country it was possible to observe electricity
consumption patterns, such as duration of use, and determine energy consumption loads
for the appliances. The results highlighted that for some appliances there are
considerable variations in electricity consumption across countries, which the authors
linked to cultural factors (e.g. freezers more commonly located in the kitchen or a heated
room in Sweden thereby increasing electricity demand) (Lobot et. al, 1997).
The existence of cultural factors suggests that UK ICE appliance use cannot be accurately
derived from foreign studies and that there is a need for UK research. This is an issue
highlighted by Strang (in Boardman, Favis-Mortlock, Hinnells, Lane, Milne, Palmer, Small,
Strang and Wade, 1995) who states:
It is possible to draw, to some extent, on the experiences of other countries, but given the
wide cultural differences, this has limited comparative value.
(Boardman et al., 1995 p164)
With respect to television use, annual energy consumption was fairly consistent across the
campaigns (around 165 kWh/year), but varied by more than a factor of ten in each panel.
The variation in television standby power consumption was even larger. Standby power
accounted for around 50% of the annual television electricity consumption for some
households, while not used in other households. However, the research could not point to
clear reasons for this being the case (Lebot, et al. 1997).
CIEL is an interesting study, because it also used a household questionnaire, which
“detailed, for example, the brand, type and age of the appliances, their location within the
house and the manner in which they were being used” (Sidler, 1995 p17). The research
provided a number of unexpected results, such as the average electricity consumption of
VCRs and televisions being almost the same. This was surprising due to VCRs typically
being used for only a few hours each week. It appeared that most VCRs were being used
in a standby mode, whilst others were left in an active mode by householders due to the

44
VCR tuners providing better performance than their televisions. CIEL also showed the
effects of seasonal variation. During the winter, televisions were used 25% more than in
summer and 34% more than spring/autumn. In respect to audio equipment CIEL found
that HI-FIs had limited use, however no reliable estimates of standby power could be
ascertained, because of the insufficient resolution of the monitoring equipment (Sidler,
1995).
Despite the use of the questionnaire, the CIEL report was unable to answer aspects of the
measured electricity consumption, such as why the electricity consumption of secondary
televisions (i.e. the second most used television in a house) was 59% higher in summer.
The report states that:
It is not possible to offer a satisfactory explanation for this phenomenon unless more
information can be gathered about who within the family is generally watching these sets
and under what conditions, etc.
(Sidler, 1995 p108)
This suggests that to better understand household ICE appliance electricity consumption it
is necessary to apply additional methods of data collection to understand the influence of
behaviour. Nevertheless, the results of these monitoring campaigns provided a valuable
insight into the energy use of household appliances and helped concentrate policy
initiatives on the most energy intensive appliances, such as cold appliances. The
campaigns also emphasised the effect of standby power modes on household electricity
consumption and provide evidence that behavioural factors have a significant impact on
household ICE appliance electricity consumption.
Following the CEIL and ECODROME campaigns a larger energy end-use campaign was
commissioned by the European Union, in 2000, called EURECO. The main objectives of
the project were to help inform EU policy by: (i) confirming the results of ECODROME;
(ii) assessing the potential electricity savings in the domestic sector (this was to be done

45
through simulation rather than direct product replacement); (iii) identifying new patterns of
consumption (ENERTECH, 2002; Sidler, 2003).
The project monitored household appliances in approximately one-hundred homes in four
participating countries (Denmark: 100, Greece: 96, Portugal: 99 and Italy: 102) at ten
minutely intervals for a duration of one month. With respect to the ICE appliances, not all
the appliances were monitored independently due to the lack of monitoring devices.
Therefore, the system monitored “audiovisual sites”, which were comprised of the main
groups of devices (e.g. television, VCR, STB) and “computer sites”. However, the
monitoring system did allow televisions (and VCRs in Italy) to be monitored independently,
which provided detailed analysis of these two appliance types. Other non-continuously
monitored audiovisual appliances had their standby characteristics recorded with a
Wattmeter. A detailed questionnaire was also used to assess participants‟ habits and to
collect socio-economic data (ENERTECH, 2002; Sidler, 2003).
The appliances monitored were selected from two lists, the first being compulsory
appliances (household consumption, all cold appliances, all light sources, audiovisual,
clothes-washer), the second list was considered optional if there were spare meters
(Sidler, 2003). Interestingly, personal computers were on the second list, which indicates
the lower level of priority given to ICT appliances at the time.
EURECO provided detailed data from which hourly to monthly energy profiles could be
produced for most appliances (ENERTECH, 2002). This type of information identified
which appliances were responsible for the largest levels of electricity consumption, when
they were being used and the electricity consumption in different power modes. However,
the approach of monitoring “sites” limited the detail of the data gained for ICE appliances.
The annualised average electricity consumption for consumer electronics appliances, over
the four countries, was 312 kWh/year, and standby power accounted for, on average,
38.5% of this electricity consumption. For ICT appliances, the annualised average
electricity consumption was 172 kWh/year and on average 30% of this consumption was
from standby consumption (ENERTECH, 2002). Such findings led to the recommendation

46
that ICE appliances standby power modes should be reduced to 1 W or lower through EU
legislation (ENERTECH, 2002). Interestingly, the conclusions predicted the potential
impact of increased home computer use and highlighted the influence of behavioural
patterns:
This usage, even used in moderation, draws a big quantity of electricity. All the more so,
when this equipment is badly used, or used very intensively, it might become the most
important in the household.
(ENERTECH, 2002 p200)
Importantly, the effects of proposed minimum standards regulation and energy labelling for
cold appliances appeared to have reduced consumption from these appliance types,
because manufacturers had improved appliance efficiency to prepare for these initiatives.
Thus, monitoring surveys can both help to identify potential future trends in electricity
consumption and the effectiveness of policy measures.
2.3.4 Standby power monitoring studies
Standby power consumption is of particular importance to this thesis, because of the
prevalence of these modes in the design of ICE appliances. Awareness of standby power
electricity consumption can be traced back to the late 1980s when researchers, such as
Alan Meier, estimated that the “miscellaneous” or “other” end-uses (which includes ICE
appliances) could significantly contribute to US households‟ electricity consumption (IEA,
2001). In Europe the emergence of standby power through studies, such as EURECO,
had a considerable impact on the direction of some ICE appliance research and policy.
This is particularly due to the general opinion that the majority of standby power electricity
consumption does not provide a useful purpose.
As a result, a variety of studies took place in Europe and other OECD countries in the
1990s and early 2000s that specifically focused on standby power. This included: (i)
whole house measurement studies – where every appliance that uses standby in a
household is measured (e.g. Sidler, 2000; Nakagomi, Ohashi, Tanaka, Nakagami, 2001;

47
Ross and Meier, 2000); (ii) bottom-up estimates – which estimate average standby
consumption per household, or at a national level, from measurements of specific
appliances which are then multiplied by the saturation of the appliances recorded (e.g.
Rainer, Meier and Greenberg, 1996; Harrington and Kleverlaan, 2001; Meier, Lin, Liu and
Li, 2004); (iii) new product measurement studies – where standby power requirements of
new appliances are measured in stores or factories (e.g. Fung, Aulenback, Ferguson,
Ugursal, 2003; Bertoldi, Aebischer, Edlington, Hershberg, Lebot, Lin, Marker, Meier,
Nakagami, Shibata, Siderius, and Webber 2002).
There are advantages and disadvantages with the methods outlined. Firstly, whole house
measurement “can establish a reasonably accurate and highly credible estimate of
standby power use in a region” (Bertoldi et al., 2002), but such studies are generally small
and thus not necessarily representative of national consumption. Bottom-up estimates are
usually reasonably accurate for common household appliances (e.g. televisions), but fail to
capture an accurate picture of the use of appliances where saturation levels are less well
understood (i.e. new appliances on the market). Although new product measurements
provide a rapid method to collect standby power data, this method fails to incorporate older
and existing technologies, which are more commonly found in households. These
measurements are therefore more likely to reflect future stock profiles (Bertoldi et al.,
2002).
In the early 2000s, the IEA (2001) and Bertoldi et al. (2002) assessed the results of many
of the worldwide standby power studies that had been conducted and assessed the types
of policies necessary to reduce this end-use. This work was constrained due to the
different measurement procedures applied by the different monitoring studies, differences
in sample group characteristics and the different definitions of standby power used. Also,
differences in the age of appliances across nations made direct comparison difficult. In
addition, due to power supplies having higher losses at higher voltages, an appliance in
the UK or Australia (240 Volt mains supply) may have a higher standby consumption in
comparison to one in Japan (100 Volt) or the US (115 Volt and 230 Volt) (IEA, 2001).

48
Appliances control characteristics also varied. For instance, televisions in some countries,
such as the US, tend not to have a hard-off switch, which means that the remote control is
always active when the appliance is not in use (Harrington, et al. 2007). The US television
is therefore often in a higher power state than a European equivalent television (i.e. the US
televisions lowest power mode equates to a UK television in passive standby). These
differences highlight the need for real world standby consumption monitoring in the UK.
The assessments made by these two reviews suggest a degree of uncertainty. Bertoldi et
al. (2002) estimated that standby power was responsible for between 3 and 10 per cent of
domestic electricity consumption, whilst the IEA (2001) estimated that between 3 and 13
per cent of domestic electricity consumption was from standby power consumption in
OECD countries. Nevertheless, the conclusions from the assessments indicated efficiency
improvements in this area could significantly contribute to global CO2 emission reduction.
To achieve this Bertoldi et al. (2002) and IEA (2001) called for an internationally
harmonised approach to the development of programmes to improve appliance efficiency,
for existing and future technologies, and thus reduce standby power consumption.
Harmonised energy labelling was also seen as a means to influence the appliance market,
and the potential effects of the move to digital broadcasting was highlighted as a concern.
The prevalence of standby power electricity consumption still remains and there is still
uncertainty regarding its quantification. Harrington et al. (2007) argues that although the
energy consumption from major appliances is generally well understood “there is a
significant portion of residential sector and commercial sector electricity consumption,
most commonly called “miscellaneous end uses”, that is not well understood or
documented” (Harrington et al., 2007 p1285). The US “miscellaneous” end-use category
includes “plug-in” appliances, such as ICE appliances, which have a substantial share of
standby power consumption (Nordman and McWhinney, 2006; Harrington et al., 2007).
More recent standby power studies have presented similar figures to those previously
measured and there is now a general consensus that for most OCED countries, standby
power accounts for around 10% of total domestic electricity consumption.

49
For example, the Australian EES (2006) study measured 120 homes and provided detailed
spot measurements of around eight-thousand appliances. The research estimated that
around 10.7% of Australia‟s domestic electricity consumption results from standby power
and over 70% of this standby load is attributable to ICE appliances. When the results were
compared to a similar study conducted in 2000, it suggested a growth in standby power of
around 12% per household (EES, 2006).
In Europe, the EuP Preparatory Study, Lot 6 “Standby and Off-mode Losses” provides an
extensive evaluation of standby power in the EU. The study collated and evaluated a vast
range of data from standby power studies and estimated that around 6.5% of household
electricity consumption was attributable to the fifteen appliance types covered by the EuP.
When extrapolated to include all mains connected household appliances, the report
estimates standby power to account for 10.1 % of household electricity (Stobbe, 2007b).
Although such estimates provide a useful benchmark for the UK, as mentioned previously,
data from other countries cannot be directly applied to the UK with complete certainty, due
to variations in cultural and infrastructural characteristics. In the UK, estimates concerning
domestic standby power electricity consumption come mainly from MTP projections which
are constrained by limited monitoring data (described in section 2.2.3). However, Vowles,
Boardman and Lane (2001) measured thirty-two UK homes‟ standby power consumption
and concluded that between 6 and 10% of annual household electricity demand was from
standby power consumption. The authors estimated that around 6.2% of total domestic
electricity consumption could reasonably be attributed to standby power. Thus, the study
confirmed that standby power was a significant aspect of UK domestic electricity
consumption.
An important aspect to Vowles et al.‟s (2001) study is that it coupled the quantitative
results with discussions with participants and with questionnaire responses gained from a
survey of 120 households to investigate awareness and behavioural aspects of standby
use. Thus, the findings from the study will be described in more detail in chapter 4.

50
2.3.5 Recent monitoring studies‟ interest in household behaviour
In the monitoring studies reviewed so far, the predominant focus of data collection has
been the measurement of household appliance electricity consumption. A number of more
recent monitoring campaigns have taken a similar approach, but have taken a greater
interest in householder behaviour.
In New Zealand, the Household Energy End-use Project (HEEP) collected a variety of data
from 398 homes, which including energy use, temperature, appliances, and hot water use
between 1997 and 2005 (Isaacs, Camilleri, French, Pollard, Saville-Smith, Fraser,
Rossouw and Jowett, 2006a). Additional occupant data were collected through a survey
at the installation phase. Appliances in one-hundred homes were monitored, at the
appliance level, with one to three appliances monitored each month. Due to limitations in
available monitoring equipment data for some appliances was limited or not recorded at all
(Isaacs et al., 2006a).
Some of the results from the research are difficult to compare to the UK, due to 75% of
New Zealand‟s domestic electricity consumption being attributable to water heating, but a
general pattern of increased ICE appliance use was reported and 51% of standby
consumption was from entertainment appliances (Isaacs et al., 2006a). Furthermore, the
results from HEEP highlight that the collection of “real world” data is essential to
understand domestic electricity consumption. In a conference paper, the authors describe
that “real data can challenge conventional thinking and even result in changes to official
statistics” (Isaacs, Camilleri and French, 2006b p10) and conclude that “market surveys
and thermal models based on “conventional knowledge” are no substitute for monitored
data” (Isaacs et al., 2006b p10). The reason for this is the importance of householder
behaviour. The authors argue that:
The interaction between the house, energy-using appliances and occupant behaviour is so
complex that it is simply not possible to predict energy use. Thermal simulation models
need data of good quality and accuracy in order to give valid predictions and that data just
has to be collected – there is no other reliable way to get it. Often the most important

51
determinants of energy use are behavioural, and no physical model can provide the
details.
(Isaacs et al., 2006b p10)
Conclusions from the HEEP study also highlight the validity of understanding extremes of
household electricity consumption. Isaacs et al. (2006b) argue that many research studies
have been focused on the application of statistical analysis to derive average electricity
consumption values, but this raises the question; “are the extreme values statistical
anomalies (and therefore should be excluded from a robust analysis) or are they realistic
reflections of the huge spread of energy use” (Isaacs et al., 2006b p10).
Isaacs et al. (2006b) also believe that such extremes “are not measurement outliers – they
may only occur in a few houses, but they are real cases that cannot be dismissed” (Isaacs
et al., 2006b p10). This belief suggests that the detailed evaluation of real cases of
electricity consumption can add to current understanding of energy use, even though the
average consumption values for households and appliances are less meaningful in terms
of a larger population. This is important for the validity of this thesis work when it is
considered that the sample size is relatively small.
A further conclusion from the HEEP study is apparent through a recent overview of the
study by Camilleri (2009). He states that “HEEP answered the questions of „what‟ and
„how‟ energy is used, but did not do well with the „why‟” (Camilleri, 2009 p7). A potential
reason for this is reflected in the statement that the occupant survey “should have been
developed more than it was [and that] early and ongoing participation of a social scientist
and statistician are vital” (Camilleri, 2009 p7). This suggests that in order to better
understanding domestic electricity consumption it is necessary to also investigate the
context and underlying motivations for the measurements recorded.
Research by Firth, Lomas, Wright and Wall (2008), as part of the CaRB project, supports
this position. The Firth et al. (2008) study investigated domestic appliance electricity
consumption by analysing data from five-minutely average whole house power

52
consumption measurements that were recorded, over a two year period, for seventy-two
dwellings at five sites in the UK. However, no householder survey was undertaken.
Techniques were developed to estimate appliance electricity consumption from three
appliance groups; (i) cold appliance consumption; (ii) active appliance consumption; (iii)
continuous and standby consumption (Firth et al., 2008).
The Firth et al. (2008) results show a large variation in the annual electricity consumption,
even in sites with a similar size or built form. This suggests that in the UK “built form is not
a strong determining factor in household electricity use” (Firth et al., 2008 p935). Instead it
appears that factors such as household size, number and type of appliance and patterns
of use are more relevant. When compared, year one and year two results show an
increase, on average, of 10.2% for continuous and standby appliances and 4.9% for active
appliances. Cold appliances were shown to have decreased by 1.5%. This reflects the
UK trend of increasing ICE appliance use and the improved efficiency of cold appliances.
High and low energy using householders were responsible for the overall increase in
electricity consumption, which was through the increased electricity consumption of
continuous and standby appliances and active appliances (Firth et al., 2008).
The study establishes the role of monitoring to better understand the trends in dwellings
electricity consumption, but the work found that active appliances (which includes many
ICE appliances) were difficult to identify and “there were often no discernable pattern of
use” (Firth et al., 2008 p932). This suggests that more detailed monitoring, at the
appliance level, is necessary to investigate the factors for household electricity
consumption. Importantly, Firth et al. (2008) argue that:
Only by linking measured data, such as that used in this paper, with quantitative surveys of
appliance ownership can greater insight can be gained and only by linking such studies
with qualitative social science research to understand the motivations and drivers for
appliance usage, can policies for reducing consumption can be reliably framed.
(Firth et al., 2008 p935)

53
The MTP (2006b) investigation into home computer use is another study that recommends
the use of qualitative data collection. The study provided the Lot 3 EuP preparatory study
with some of the best available data for household computer use (IVFIRDC, 2007). The
research aimed to establish the average length that computers were used in different
power modes, determine the number of computers with power management features and
examine patterns of behaviour (MTP, 2006b). The methodology applied to the research
included the monitoring of the main computer unit with unobtrusive electrical power data
loggers, for a period of two weeks, at one minutely intervals (MTP, 2006b).
Questionnaires were administered, by an interviewer, to collect information concerning the
following:
Computer type and specification;
Age of computer and general patterns of use;
Socio-demographics;
Power management functions (in some cases the interviewer accessed the
computer control panel).
The sample consisted of eighty households across the UK, recruited from ten regions
within England, in order to be as representative as possible. The research provided
average patterns of use and electricity consumption data for computer base units and
identified that despite 95% of the computers having power management features most of
the householders did not use them (MTP, 2006b). For example, 86% of the computers
could activate “system standby”, but only 22% operated with this function (MTP, 2006b).
Also, 60% of respondents used the computers for work related activities and 80% for other
activities, which suggests that computer use is linked to more flexible working patterns and
is more integrated into daily activities (MTP, 2006b).
Despite the research providing data concerning user behaviour, the report acknowledges
that it would be “very valuable to investigate this behaviour further” (MTP, 2006b p23).
The report recommends that qualitative research could provide answers to questions, such
as whether computer users are unaware of power management features and why they are
not taking advantage of them.

54
Two recent large-scale monitoring campaigns that have collected ICE appliance electricity
consumption data are the REMODECE project and an electricity end-use campaign
conducted by the Swedish Energy Agency (De Almeida et al., 2008; Bennich and Persson,
2006). In addition to the collection of electricity consumption measurements, these studies
also included the collection of social data. Therefore, these studies have been included in
chapter 4.
2.4 Summary
This chapter has provided an overview of literature regarding current and future
predictions of household ICE appliance use and some of the key policy issues in this
sector. There is only limited contemporary “real world” ICE appliance data concerning UK
households‟ appliance usage patterns and standby power consumption. This deficit in
knowledge is restricting UK modelling and forecasting, and the implementation of effective
policy measures. The review of domestic electricity monitoring campaigns has shown that
the provision of accurate usage patterns can help to fill this gap in knowledge and even
exploratory studies have the potential to reveal new and potentially significant forms of
domestic electricity consumption.
Importantly, the literature review identified that electricity consumption monitoring studies
have not always been able to answer why measurements recorded in homes occurred.
Studies have concluded that the inclusion of social science research methods, to
investigate householders‟ behaviour, would provide more comprehensive results from
future research. Chapter 4 will return to this argument through a review of a number of
studies that have included both technical and social science research methods. However,
Chapter 3 first reviews a body of social science research that has shown household
behaviour to be a significant factor for variance in household energy consumption.

55
Chapter 3. Literature Review 2: Energy consumption and
behaviour
3.1 Introduction
This chapter presents a literature review undertaken to examine existing research that has
investigated domestic ICE appliance electricity consumption behaviour. It became
apparent that behaviour can influence ICE appliance electricity consumption in two main
ways: (i) appliance use (i.e. the extent to which appliances are used in different power
modes); (ii) appliance ownership (i.e. number and operational characteristics of the
appliances).
The review focussed on social science literature to examine: (i) the social and
psychological factors that influence the adoption and use of ICE appliances; (ii) the
theories that have been developed and applied to help understand energy behaviour;
(iii) the research methods and methodologies that have been applied in this field of
research. This identified that relevant social science research has largely investigated
household energy consumption from two key perspectives. Psychologists have generally
investigated the internal processes that influence behaviour (e.g. individuals‟ attitudes,
values, personal norms) and sociologists have largely been concerned with external
influences (e.g. social, institutional and political factors).
There was only relatively limited literature from psychology that specifically focuses on ICE
appliance electricity consumption. However, there is a growing body of research from
environmental psychology, which has investigated behavioural aspects of domestic energy
consumption and factors involved in other environmentally significant behaviours (e.g.
travel behaviour, recycling, etc). In contrast, the field of sociology provided a number of
studies that have investigated ICE appliance adoption and use.
This chapter begins with an introduction to the traditions of energy research (section 3.2).
The potential influence of socio-demographic factors on ICE appliance use are then
reviewed (section 3.3). This is followed by a brief account of what this thesis considers to

56
be energy related behaviour (section 3.4). Literature from social and environmental
psychology is then detailed (section 3.5) and is followed by a review of literature from
sociological (section 3.6). A description of two theoretical models that were found to be
particularly informative to this thesis is then presented (section 3.7 and 3.8).
3.2 Traditions of research
Many social scientists contend that efforts to reduce household energy consumption have
largely been focused on the development of technical solutions (Gram-Hanssen, 2002;
Jeeninga and Huenges Wajer, 1999; Crosbie, 2006). Jelsma (2004) describes the
prominence of an “engineering approach” that looks towards technical innovation as the
means to deliver energy efficient goods and services. Although engineers and physical
scientists continue to improve energy efficiency, it is also apparent that household energy
consumption continues to rise (Crosbie, 2006). According to Gram-Hanssen (2002) the
notion that technological progress is not the exclusive solution to the reduction of domestic
energy consumption can be traced back to the 1970s. She highlights that “a Swedish
study by Lundström and Lindström showed that the energy consumption of technically
similar houses could differ by a factor of three to four” (Gram-Hanssen, 2002 p79). This
finding echoes the 1970s Twin Rivers study in the USA, which found that across a
community of identical houses: (i) the variation in household energy consumption was as
great as two to one; (ii) where houses changed occupants during the study, the energy
consumption of the new occupants could not be predicted from the previous residents;
(iii) following the retrofitting to a common standard, the residents with high energy
consumption remained at the top of an energy consumption ranking (Socolow, 1978;
Seligman et al., 1978). Thus, it concluded that behavioural factors can significantly
influence household energy consumption.
In addition to the divide between the physical and social sciences, it is also evident that
different approaches to understanding behaviour separate the social sciences. Firstly,
there is the view that behaviour is the result of processes that are “internal” to the
individual (i.e. an individual‟s attitudes, values, habits and personal norms will influence
behaviour). The “internalist” perspective assumes that individuals are autonomous agents,
free from the constraints of social structure. Research concerning internal processes is

57
often referred to be at the micro-level, which has largely been the domain of social
psychology (Jackson, 2005).
In contrast, there is the view that behaviour is the result of “external” processes (i.e. the
characteristics of society and culture). The “externalist” perspective views individuals as
agents constrained by the influence of external forces beyond their comprehension or
control. Research concerning these external or societal processes is often referred to be
at the macro-level. This has largely been the focus of sociology and anthropology, which
traditionally concentrates on groups, communities and cultures (Jelsma, 2004; Jackson,
2005; Martiskainen, 2007).
This difference in perspectives has led social scientists to investigate human aspects of
energy use in different ways. Quantitative research methods have traditionally dominated
the fields of building science, economics and psychology, while qualitative research are
more traditionally applied within anthropology and sociology (Crosbie, 2006). The two
distinct perspectives towards behaviour, and methods of inquiry, present an
epistemological question for this thesis: from which perspective should behaviour be
investigated? Guidance to answer this question came from Jackson (2005). When
discussing consumer policy development he contends that:
Searching for robust and useful things to say about consumer motivations and behaviours
is often, therefore, a case of weighing up the „balance of evidence‟ from a wide variety of
studies from different kinds of perspective and establishing broad understandings from
which to inform more detailed and more specific policy development.
(Jackson, 2005 p6)
Therefore, this thesis has reviewed literature from a number of perspectives, which
includes research from psychology and sociology.

58
3.3 The influence of socio-demographics and physical factors
Both psychologists and sociologists agree that socio-demographic (e.g. age, gender, level
of education, income) and physical factors (e.g. dwelling size, dwelling type, location) can
influence household energy consumption (Lutzenhiser, 1993; Boardman et al., 1995).
These factors are distinct from internal psychological motivations and many external social
influences (e.g. institutions, social structure), but have frequently been linked to patterns of
energy behaviour (Wall, 2006; Gram-Hannsen, Kofod and Petersen, 2004). Section 1.5
highlighted that socio-demographic variables have been linked to the growth of the lighting
and appliance end-uses over the past thirty to forty years. The general increase in the UK
population‟s living standards has increased households disposable income, which has in
turn facilitated the purchase of traditionally non-essential appliances. The UK‟s population
growth and the emergence of smaller, fragmented households, has also led to the
increased use of household appliances (Boardman et al., 2005; DTI, 2002; Herring, 1995).
The Domestic Equipment and Carbon Dioxide Emissions (DECADE) project used
questionnaire surveys and interviews to help understand consumer appliance behaviour.
The research found “clear correlations between socio-economic class and knowledge
about environmental issues, environmental concern, „green behaviour‟ and receptivity to
various policies” (Boardman et al., 1995 p159). A link was also found between gender,
educational qualifications, environmental knowledge and concern (Boardman et al., 1995).
Research by Mansouri, Newborough and Probert (1996) used a questionnaire survey, to
investigate social and psychological aspects of energy consumption from domestic
electrical appliances. The research found that factors such as higher annual income and
greater numbers of householders, correlated to increased total electricity consumption.
Households‟ adoption of energy efficient appliances also appeared to increase with higher
levels of educational qualifications. In respect to ICE appliances, Mansouri et al. (1996)
found that the highest ownership level for colour-televisions and VCRs (the latest
technologies at that time) was reported by households with higher annual incomes and
least in households with low annual incomes. However, the research found large
variations in types and numbers of appliances owned by households, and there were
considerable variations in usage patterns. Electricity consumption could “vary enormously

59
even between two households with an identical set of appliances” (Mansouri, et al., 1996
p252), which suggests that socio-demographic factors provide only a limited explanation.
Isaacs et al. (2006a) developed appliance ownership models to understand the factors that
influence the type and number of appliances in New Zealand homes (but not electricity
consumption). Interestingly, the research found that life stage, income and tenure were
more important than floor area and number of occupants. However, despite the models
often explaining around 40% of the variation in appliance ownership, the research
concluded that the models were limited, because “when people‟s behaviour or personal
choice dominates variation then almost anything is possible” (Isaacs et al., 2006a p90).
Gram-Hannsen, Kofod and Petersen (2004) undertook one of the largest domestic
electricity consumption studies. Data from over 50,000 dwellings in Denmark were
analysed and household size provided the most significant explanation for electricity
consumption across each dwelling type. The research used Danish household electricity
consumption data gained from the EURECO project and investigated appliance end-uses.
For the ICE appliances, older households (i.e. households with older occupants) used
standby functions less than younger households and the increased use of standby power
consumption and computers correlated to increasing levels of income (Gram-Hanssen et
al., 2004). Interestingly, households‟ view of their carefulness in saving energy, showed
that television, radio and standby power electricity consumption was less when there was
an interest in energy saving. Although the Gram-Hanssen et al. (2004) research identified
the influence of some socio-demographic variables, the research concluded that socio-
demographic variables could not explain 60-70% of the variation in electricity consumption
and that other lifestyle and behavioural factors were of importance (Gram-Hanssen et al.,
2004).
Thus, although disposable income, household composition, life stage, gender and
education can help to understand aspects of ICE appliance ownership and electricity
consumption, socio-demographic and physical factors can only provide a limited
explanation. Therefore, household behaviour appears to play a significant role in

60
household energy consumption, which is reflected in comments expressed by Gram-
Hanssen:
...we know quite a lot about how energy consumption levels correlate to technical factors
on the one hand and to socio-economic and demographic factors on the other. We also
know that culture shapes demand for energy although we still do not know why the energy
consumption of “similar families” in “similar houses” can differ by a factor of three or four.
(Gram-Hanssen, 2002 p80)
3.4 What is behaviour?
The definition of behaviour can in itself be a complex issue. Simplistically it can be defined
as a “generic term covering acts, activities, responses, reactions, movements, processes,
operations, etc: in short, any measurable response of an organism” (Reber and Reber,
2001 p82). For some this definition is too limited and should include other phenomena,
such as mental representation, rather than just the overt measurable act. For instance,
understanding individuals underlying knowledge of energy consumption, rather than just
measured consumption, may also be important, because this may help determine why
some individuals refrain from particular energy consumption behaviours (Reber and
Reber, 2001).
ICE appliance behaviours can be viewed as direct or indirect. Direct energy use relates to
the acts that result in electricity consumption due to householder use, whereas indirect
energy use relates to the energy used to produce, transport and dispose of goods and
services (Steg, 2008). This thesis focuses on the direct use of energy. Gardner and Stern
(2002) categorise direct household energy consumption into two types of behaviour:
(i) efficiency; (ii) curtailment. Efficiency behaviours relate to “one-shot” behaviours, such
as investment (e.g. the purchase of more energy efficient appliances), whereas curtailment
behaviours relate to repetitive efforts to reduce energy consumption, such as patterns of
use (e.g. turning off appliances when not in use, activating appliances low power
management settings, not using standby power functions). However, it is important to

61
appreciate that “energy consumption in itself is not behaviour, but rather a consequence of
behaviours” (Martiskainen, 2007 p12).
This thesis is interested in the behaviours that influence electricity consumption from ICE
appliances and views behaviour as human acts that influence the degree of ICE appliance
electricity consumption. These acts can result in energy either being consumed or not
being consumed. Fundamentally, behaviour can result in: (i) the operational use of ICE
appliances in different power modes; (ii) the adoption of particular ICE appliances.
3.5 Internal factors: a psychological perspective of energy behaviour
This section seeks to understand the factors that have consistently been linked to
behaviour from the psychological perspective. Environmental psychology has generally
investigated energy behaviours through two main approaches: (i) the investigation of the
determinants of behaviour through theory driven research; (ii) the investigation of the
effectiveness of behaviour change interventions that aim to increase pro-environmental
behaviour (Abrahamse, Steg, Vlek and Rothengatter, 2005).
Theory driven research has used models to help explain the determinants of behaviour.
These models “are generally built from a set of conceptual premises, and some form of
causal relationship between dependent and independent variables” (Jackson, 2005 p21).
Research using models continues to use predominantly quantitative methods.
Questionnaires are often administered to a sample of the population to gain self-reported
responses (usually scaled responses) in order to determine the significance of variables
and the value of the theoretical model to particular behaviours (Steg and Vlek, 2009).
Thus, much of the literature and concepts presented in this section are based on results
from the statistical analysis of questionnaire responses.
There are a number of advantages when using theoretical models. Bamberg and Schmidt
(2003) argue that models can be used as a theoretical framework to systematically
organise and relate research findings. Similarly, Jackson (2005) argues that models
provide heuristic frameworks to help explore and conceptualise behaviour and can help
researchers to understand the social and psychological influences on mainstream and pro-

62
environmental behaviour. When discussing future environmental psychology research,
Steg and Vlek (2009) argue that:
A theory-driven approach towards the behavioural components of environmental problems
will provide a strong basis for understanding and managing these problems (following Kurt
Lewin, 1951, p. 169): „„Nothing is as practical as a good theory‟‟.
(Steg and Vlek, 2009 p315)
Therefore, many psychologists believe that “behavioural models are the principal tool for
understanding behaviour” (Darnton, 2008a p2). A wide variety of models have been
developed, but it is beyond the scope of this thesis to describe them all (see Jackson,
2005 for a comprehensive review). However, a number of models have been used
frequently to explore environmentally significant behaviour and have contributed to the
identification of key factors that influence energy consumption behaviour.
3.5.1 Rational choice
The traditional “rational” choice approach to behaviour asserts “that behaviour is the
outcome of rational deliberations in which individuals seek to maximise their own expected
„utility‟” (Jackson, 2005 p27). In other words, individuals make reasoned choices based on
the expected costs and benefits of different actions (Martiskainen, 2007). Thus, it is
assumed that an individual will choose actions that provide the greatest value or least cost
to themselves (e.g. in terms of financial benefit, effort, comfort, etc) (Jackson, 2005; Steg
and Vlek, 2009). This process has lead to rational choice models often being referred to
as „expectancy value models‟ (Jackson, 2005).
Although economic and other cost factors are clearly important determinants of individuals‟
behaviour, rational choice theory has received criticism due to its assumption that all
individuals have the time and information necessary to make rational decisions and that
individuals are only concerned with their own self-interest (Kollmus and Agyeman, 2002;
Jackson, 2005; Martiskainen, 2007). In light of such criticism, a number of theories
attempted to alter rational choice theory with the inclusion of other behavioural factors.

63
3.5.2 Attitudes, beliefs and values
Attitude can be defined as “a general evaluation reaction towards an object, a person, an
issue, a behavior or other entity” (Staats, 2003 p171) and a belief as “any proposition that
is accepted to be true” (Colman, 2001 p84). Thus, attitudes differ from beliefs, because
they involve the process of evaluation (i.e. positive or negative). In the 1970s attitude was
found to correlate with both conservation behaviour (e.g. feelings of obligation, the
importance of energy conservation to society) and with unwillingness to conserve energy
(e.g. comfort, health) (Lutzenhiser, 1993; Becker, Seligman, Fazio and Darley, 1981). A
succession of more systematic studies attempted to model the underlying processes that
were believed to influence conservation behaviour. These early studies often used
Fishbein and Ajzen‟s Theory of Reasoned Action (TRA) (shown in Figure 3-1), which
contends that individuals behave in response to their beliefs about the outcomes of their
behaviour and the value that they connect to the outcomes (Lutzenhiser, 1993). Thus, the
TRA is founded on „expectancy value theory‟ (i.e. people expect certain value (or utility)
from the outcomes of their behaviour) (Martiskainen, 2007).
Figure 3-1 Fishbein and Ajzen‟s Theory of Reasoned Action (Jackson, 2005 p46)
In the TRA an individual‟s beliefs about and evaluation of the outcomes of a given
behaviour result in an attitude towards the behaviour. This influences an individual‟s
intention to act in particular way (Darnton, 2008b). Intention is the key determinant of

64
behaviour and is “the deliberate plan to perform the behaviour” (Staats, 2003 p174).
Intention is also influenced by an individual‟s subjective norm (Staats, 2003). The
subjective norm is the individual‟s perception of whether people who are of importance to
the individual (e.g. friends, family, peers etc) think he/she should or should not perform the
behaviour (Jackson, 2005).
The TRA assumes that one‟s intention is a consistent indicator of actual behaviour.
However, behaviour often occurs when individuals do not have complete volitional control
(i.e. the willingness or the choice) (Jackson, 2005). Ajzen‟s (1991) Theory of Planned
Behaviour (TPB) attempts to deal with situations where there is incomplete volitional
control. The TPB (shown in Figure 3-2) includes the construct of perceived behavioural
control (PBC), which can be defined as an individual‟s belief of how easy or difficult it is to
perform the behaviour. Thus, the TPB contends that the development of an attitude, the
influence of the subjective norm and the perceived degree of control to perform the
behaviour, form an intention that can be used to predict actual behaviour (Jackson, 2005).
Figure 3-2 Ajzen‟s (1991) Theory of Planned Behaviour (Jackson, 2005 p49)

65
The TPB has been used widely in environmental psychology research, but many studies
have measured the relationships between attitudes, intention and perceived behavioural
control rather than actual behaviour (Jackson, 2005; Martiskainen, 2007). This has led to
criticism of the TPB, because environmental attitudes often have a small impact on actual
pro-environmental behaviour (Kollmuss and Agyeman, 2002) and there is often a
difference between what people say and what they actually do (Darnton, 2008b). The
TPB‟s inherent assumption that individuals are rational has led to further criticism
(Jackson, 2005; Martiskainen, 2007).
Nevertheless, TPB has been successful in explaining the role of attitudes and beliefs for a
number of types of environmental behaviour and findings from intervention studies have
supported this view (Steg and Vlek, 2009). For example, Brandon and Lewis (1999) found
that, although “environmental attitudes had no statistically significant effect on previous
(historic) consumption” (Brandon and Lewis, 1999 p83), people with pro-environmental
attitudes (who had not previously engaged in conservation actions) were more inclined to
alter their energy behaviour.
Within TRA and TPB is the notion that an individual‟s value of a behavioural outcome can
influence the behaviour process. Stern et al. (1995) argue that deep-seated values and
worldviews play an over-arching role in peoples‟ behaviour. Values are conceptualised “as
broad-based dispositions which are constructed earlier in life than beliefs and attitudes;
they are also more stable over time” (Darnton, 2008 p14). Worldviews are wide-ranging
belief-systems, which give people their general outlook on reality and influences what an
individual values to be important (Gardner and Stern, 2002). These values and
worldviews are seen as filters, for new information, that facilitate the development of
congruent attitudes and beliefs that consequently determine behaviour (Poortinga, Steg,
Vlek, 2004). Studies that have examined the value-basis of environmental beliefs and
behaviour, have generally found that the more strongly individuals possess altruistic, pro-
social, self-transcendent or biospheric values, the more likely they are to display pro-
environmental behaviours (Steg and Vlek, 2009). Thus, values are partly responsible for
shaping behavioural motivation (Kollmuss and Agyeman, 2002).

66
3.5.3 Morality and normative influence
Connected to values is the idea of moral and normative influence. Although the TRA and
TPB incorporate normative influences to some degree (through subjective norm), it has
been suggested that this aspect “exhausts neither the range of normative influences nor
the importance of altruistic or moral values in individual behaviour” (Jackson, 2005). A
number of energy and environmental studies have investigated the influence of moral and
normative concerns using Schwartz‟s (1977) norm-activation model (NAM) or Stern‟s
(2000) value-belief-norm theory of environmentalism (VBN) (Steg and Vlek, 2009). The
NAM (shown in Figure 3-3) contends that personal norms (i.e. personal belief about the
morality of the behaviour) are the only determinant of environmental behaviour. Personal
norms are subject to an individual‟s awareness of consequences and ascription of
responsibility, which also moderate the link between the personal norm and the behaviour.
In other words, the relationship between the personal norm and behaviour is stronger
when an individual is aware of the negative consequences of not engaging in the
behaviour and where the individual accepts responsibility for these consequences
(Jackson, 2005).
Figure 3-3 Schwartz‟s norm-activation model (Jackson, 2005 p55)
The VBN model (shown in Figure 3-4) contends that pro-social attitudes and personal
moral norms are the predictors of pro-environmental behaviour (Jackson, 2005;
Martiskainen, 2007). The VBN model “links value theory, norm-activation theory, and the
New Environmental Paradigm (NEP) perspective through a causal chain of five variables

67
leading to behaviour” (Stern, 2000 p412). The theory assumes that acceptance of the
NEP (a set of pro-environmental values and worldview (Gardner and Stern, 2002)) results
in a level of awareness of the consequences antecedent in the NAM. The degree of
acceptance of the NEP correlates positively with biospheric and altruistic values, and
negatively with egoistic values (Jackson, 2005). Accordingly, the acceptance of the NEP
correlates positively with the awareness of the consequences of an individual‟s actions.
This leads to an awareness of responsibility to reduce those consequences and a personal
norm is developed to partake in pro-environmental behaviour (Jackson, 2005; Stern,
2000).
Figure 3-4 Stern‟s (2000) value-belief-norm theory of environmentalism (Stern, 2000 p412)
Studies that have used NAM and VBN have been able to link norms to low cost
environmental behaviours and “good intentions” (e.g. willingness to change behaviour and
accept policy change) (Steg and Vlek, 2009). Although such behaviours may be seen as
relatively unimportant, they may enable significant infrastructural changes to be made,
such as the acceptance of fuel taxes or more stringent building codes (Kollmuss and
Agyeman, 2002). However, a problem for value models is that there appears to be a
“relatively weak correlation between personal norms and indicators of pro-environmental
behaviour” (Jackson, 2005 p58). Although this does not negate the importance of moral
values to environmental behaviour, it does suggest that other factors may improve the
explanation of behavioural variance (Jackson, 2005).

68
3.5.4 Affective influence and symbolism
The influence of factors, such as morals and norms, moves the understanding of
behaviour away from rational theory. NAM argues that the awareness of consequences is
a feeling of moral obligation, which suggests an emotional involvement. Thus, affect (i.e.
emotions) appears to be an important determinant of behaviour (Darnton, 2008b). Pooley
and O‟Connor (2000) found that affect was a significant predictor of attitudes toward a
range of environmental issues and Kollmuss and Agyeman (2002) highlight that emotions
help shape beliefs, values, and attitudes towards the environment. Lindenburg and Steg
(2007) argue that emotional reactions to environmental problems appear to relate to pro-
environmental behaviour and highlight that individuals are more likely to engage in pro-
environmental behaviour, when they derive pleasure and satisfaction. For instance, Ojala
(2008) found that a “mix of negative emotions (worry) and positive emotions (hope and joy)
about the environmental problems was positively related to recycling” (Ojala, 2008 p777).
Jackson states that “consumers build affective relationships with products and respond at
an emotional level to decisions about what to buy and how to behave” (Jackson, 2005
pvii). This affective relationship may link to the degree of symbolism involved in the
adoption and use of material goods. Lutzenhiser (1993) highlights that a cluster of studies
suggested that, in addition to their functional use, household appliances can have
collective meanings and must conform to status expectations. Consequently, affective
factors and symbolism may often override the cognitive processes that influence behaviour
(Darnton, 2008b). This may be of particular importance to the purchase and use of ICE
appliances, because many ICE appliances are inherently focussed on the provision of
pleasure (i.e. entertainment) and some ICE appliances have been found to possess a
degree of social symbolism (Gram-Hanssen, 2005).
3.5.5 Habitual behaviour
In many situations, “behaviour is habitual and guided by automated cognitive processes,
rather than being preceded by elaborate reasoning” (Steg and Vlek, 2009 p312). Habits
provide an important benefit to people‟s daily activities, because habitual behaviour
reduces the cognitive effort needed for routine decisions and frees cognitive resources for
more important and taxing mental processes (Jackson, 2005). As a result, habits can

69
override aspects of the behavioural decision-making process. For example, Klöckner and
Matthies (2004) found that habitual behaviour inhibited the processes of moral decision-
making for travel mode choice. Similar research by Bamberg and Schmidt found that
behaviour was often “elicited in an automatic fashion by situational cues” (Bamberg and
Schmidt, 2003 p281). In other words, when an individual frequently acts in the same way,
in a particular situation, the situation can become mentally associated with the behaviour.
The more frequently this occurs, the stronger the association becomes, and the more likely
that a particular behaviour will take place (Steg and Vlek, 2009). Therefore, habitual
behaviour can be very difficult to change, because habits become deeply embedded into
everyday activities (Gudbjerg and Gram-Hanssen, 2006) and people will often only focus
on, and be influenced by, information that supports their existing habits and routines (Steg
and Vlek, 2009).
Although routine behaviour has very close parallels with habitual behaviour (i.e. routines
are automatic, without self-instruction) routines can be considered as slightly distinct. This
is because, by definition, routines imply a degree of ritual. For example, Reber and Reber
(2001) define a routine as an “oft-repeated pattern of behaviour which tends to occur at
appropriate times, e.g. the morning ritual of washing, grooming and dressing” (Reber and
Reber, 2001 p634). Thus, whereas habits can be considered as automatic cognitive
processes, routines are mundane forms of ritual behaviour, which have little symbolic
meaning associated to them.
Traditionally, social psychology has excluded the role of habitual behaviour in many
investigations (Verplanken, Aarts and Van Kippenberg, 1997), but many recent studies
suggest that habits play an important role (Maréchal, 2009; Steg, 2008; Bamberg and
Schmidt, 2003; Stern, 2000; Verplanken et al., 1997), and particularly in respect to
everyday activities, such as ICE appliance use (Gram-Hanssen, 2005; Moreau and
Wilbrin, 2005).
3.5.6 Agency, self-efficacy and perceived control
Agency is an individual‟s perception (either rightly or wrongly) of whether an action can be
achieved (Darnton, 2008b). For environmental psychologists agency is described through

70
the concept of self-efficacy. Self-efficacy refers to an individual‟s confidence in their ability
to undertake an action and to persist with that action (Anable, Lane and Kelay, 2006).
Thus, perceived self-efficacy can influence whether an individual attempts an action, the
degree of persistence shown when an individual encounters problems, and in due course
whether the behaviour takes place (Jackson, 2005).
Energy research has linked self-efficacy to individuals‟ ability, skills, knowledge and
access to information. Thus, improving individuals‟ knowledge of energy consumption has
been seen as a key means to alter energy behaviours. This often involves the provision of
information (e.g. increase knowledge to influence individuals‟ beliefs and the evaluation
process) or feedback (e.g. provide knowledge of positive or negative consequences, or
give rewards). For example, in a review of intervention studies Abrahamse et al. (2005)
state that “attitude and knowledge are generally positively related to energy savings”
(Abrahamse et al., 2005 p282). Recent research by Thøgerson and Grønhøj (2010) also
supports this position. The research concluded that electricity saving effort depended on
self-efficacy factors and that improved knowledge through feedback could empower and
motivate households to reduce their energy consumption.
3.5.7 Contextual factors
Behaviour cannot be attributed to individuals‟ internal motivations alone. Many external or
contextual factors can facilitate or constrain environmental behaviour. Stern (2000)
describes a wide variety of social, economic and political contextual influences on
behaviour, such as interpersonal relationships, advertising, policy, regulations, institutional
factors, monetary incentives and technological and physical constraints. Steg (2008)
contends that internal factors, such as attitudes, values, norms and habits, should be
studied in combination with contextual factors, such as physical infrastructure, special
product characteristics, advertising and shared socio-cultural objectives (e.g. income and
material growth). Similarly, Abrahamse et al. (2005) recommend that equally important to
psychological energy studies are the macro-level factors, such as societal development.
The authors argue that macro-level factors:

71
...shape the physical infrastructure and technical apparatus that condition behavioral
choices and energy use associated with these choices. It is therefore important to
consider household energy conservation from a multidisciplinary perspective.
(Abrahamse et al., 2005 p283)
The contextual role of technology is more deeply explored by Midden et al. (2007), who
contend that technology not only influences the outcome of behaviours (e.g. the level of
energy consumption), but as a dominant context, it creates the conditions in which most
human behaviours occur. In other words, technologies such as ICE appliances, by their
very nature, facilitate or restrain behaviour. However, contextual factors have not been
systematically examined by many environmental psychology studies and are rarely
included in theoretical models. Steg and Vlek (2009) comment that this:
...is remarkable, given that environmental psychology aims to study transactions between
humans and their environment, and thus should be particularly interested in examining the
effects of contextual factors on behaviour.
(Steg and Vlek, 2009 p312)
Recently, Uzzell and Räthzel (2009) have called for a far-reaching transformation of
environmental psychology that considers both micro and macro-level factors in respect to
production and consumption. They argue that “neither the individual, the social group nor
the setting can be defined without reference to the others” (Uzzell and Räthzel, 2009
p348). From this transformative perspective, it appears that a more integrated approach to
energy research is necessary.
Underlying elements of this view are also evident in comments made by Stern (2000).
Although Stern provides the VBN, to understand the predisposition towards pro-
environmental behaviour, he argues that future models of environmentally significant
behaviour should include four causal variables: (i) attitudinal factors; (ii) contextual factors;
(iii) personal capabilities; (iv) habitual behaviour. Jackson (2005) highlights that Stern‟s
argument echoes previous work undertaken by Triandis (1977), who integrated these four

72
causal variables into his Theory of Interpersonal Behaviour (TIB). This has led a number
of scholars to assert that the TIB could be of significant use to energy and environmental
research (Bamberg and Schmidt, 2003; Jackson, 2005; Martiskainen, 2007; Darnton,
2008b). Before presenting this argument in more detail, it is informative to review energy
research from sociology, which provides evidence of the influence of contextual and
habitual factors specific to ICE appliance use.
3.6 External factors: A sociological perspective of energy behaviour
In general, sociology has paid relatively less attention to internal processes (Reber and
Reber, 2001), but in common with psychology, sociology has often explored behaviour
through the use of theories and models. Some social theories suggest that our
behaviours, and even individuals‟ concept of self, are largely socially constructed (e.g.
social identity theory) (Jackson, 2005). More recently, researchers have looked to social
practice theories to help investigate energy consumption and the influence of cultural and
lifestyle factors on behaviour.
3.6.1 Social structure, lifestyle and culture
Giddens‟ (1984) theory of structuration, attempts to explain how agency and structure are
connected. The theory argues that people‟s subjectivity is mediated through social
interaction, which shapes people‟s idea of reality and the behaviour that they display
(Jackson, 2005). An important aspect of Giddens‟ work is that it connects people‟s
ordinary everyday routines to the long-standing evolution of social institutions. The theory
presents a model that “portrays social structure as both the medium and the outcome of
people‟s ordinary social practices” (Jackson, 2005 p90). Thus, agency is largely “the
process of being enmeshed in the repetitive, routine practices of everyday life” (Jackson,
2005 p91).
Gram-Hanssen (2005) and Beard (2005) cite the work of Bourdieu who contends that an
individual‟s “habitus” (a deep-rooted unconscious structure comprised of values, norms,
attitudes and preferences) influences everyday behaviour. Habitus is developed through
the social structures that shape childhood development, such as parental and material
conditions. Bourdieu uses differences in habitus to divide society into distinct social

73
classes and argues that the inherent “taste” of these classes, influences the acquisition of
particular goods and the performance of behaviours (Gram-Hanssen, 2005; Berard, 2005).
Gram-Hannsen (2005) suggests that Bourdieu‟s hierarchical class approach must be
questioned, but she argues that there is evidence to support the “idea of consumption as a
way of showing group belonging and of how there might be some types of hierarchies
between different lifestyle groups” (Gram-Hanssen, 2005 p1242).
Lifestyle is a term widely used by social science researchers to refer to differences in
patterns of behaviour amongst groups or subcultures within society (Lutzenhiser, 1993;
Jelsma, 2004). This view is reflected in research that has shown energy behaviour to be
linked to cultural differences (Jelsma, 2004; Strang, 1997; Wilhite, Nakagami, Masuda and
Yamaga, 1996). However, research concerning socio-demographic variables suggests
that concepts of lifestyle “only partially describe patterns of activities that are relevant for
understanding energy use” (Gram-Hanssen et al., 2004 p75). Thus, some sociology
researchers have looked to routine energy consuming practices for an explanation.
3.6.2 Social practices
Despite theoretical differences Giddens and Bourdieu contend that behaviour is based in
routine practices and formed by social structure (Gram-Hanssen, 2008). Social practice
theories suggest that the constitution of social life is better understood through concrete
practices rather than through the more abstract structures evident in Giddens and
Bourdieu‟s work (Gram-Hanssen, 2008; Warde, 2005). From this perspective both social
structure and individuality result from the fundamental social practices that are undertaken
in our lives (Warde, 2005).
Practice theory is informed by the understanding that people‟s use of goods and services
is not driven by considering their activities as consumption (Reckwitz, 2002). Instead
people are concerned about doing things, such as cooking, cleaning or viewing television
(Warde, 2005). Warde (2005) and Gram-Hanssen (2008) highlight work by Schatzki
(1996) who states that a practice consists of doings and sayings that are organised into an
overall method. For example, the practice of washing clothes has a number of different
projects “like sorting the clothes, washing them and drying them: each consisting of many

74
possible different doings and sayings” (Gram-Hanssen, 2008 p2). These doings and
sayings are underpinned by a variety of practical and representational factors (e.g.
understandings, rules, principles, beliefs, emotions, etc). It follows that a practice exists
both as a coordinated entity, prior to action, as well as through its performance. A
practice‟s existence, and the social meanings held in the practice, link individual behaviour
to wider society (Warde, 2005; Gram-Hanssen, 2008) and the objects necessary to
perform a practice link to the development of new practices and consumption (Shove and
Pantzar, 2005).
From this position, household energy consumption, such as ICE appliance use, involves a
variety of technologies and culturally informed decisions made by householders, both of
which are influenced by particular institutional arrangements (Crosbie and Guy, 2008;
Reckwitz, 2002). In this way, practices are free from the attitudinal factors, in psychology,
by focusing “not on decision-making but on the daily routines within which cooking,
lighting, heating and bathing, etc. are enacted” (Crosbie and Guy, 2008 p224).
3.6.3 Routines and ICE appliance practices
Practice theory has led sociological energy research to focus on the more mundane
aspects of consumption, arguing that a central part of society‟s consumption is based on
everyday routines. Work by Shove (2006), Gram-Hanssen (2008; 2010) and Røpke,
Christensen and Jensen (2010) have indicated that the dynamics of social practices are
connected to rising energy consumption and technological development. Gram-Hanssen
(2008) argues that ICE appliance routines are distinctive, because they alter very quickly
as technologies are superseded and fashions and householders‟ interests change (Gram-
Hanssen, 2008).
Specific insights into ICE appliance use can be gained from Gram-Hanssen‟s (2005) study
of teenagers‟ use of ICE appliances. Data were collected through semi-structured
interviews with nine Danish households. The research found that, although there were
large variations in the reported extent of use, there were strong similarities in the types of
ICE appliances that teenagers and households possess, which reflected household norms.

75
This allowed both children and parents to facilitate individualised use in the households
(Gram-Hanssen, 2005).
Interestingly, energy conservation did not factor strongly in either the adoption or use of
ICE appliances, even in families concerned with energy saving or their environmental
behaviour. For example, all the households were aware that their standby power
behaviour influenced their electricity consumption, but very few of them actually did
anything to reduce it. Although the risk of climate change did not motivate energy saving,
the fear of house fires was a strong motivation to turn off appliances (Gram-Hanssen,
2005).
The influence of habits was a significant factor for a number of households and in cases
reflected the idea of habitus. Standby power use was also influenced by contextual
factors, such as the degree of accessibility to mains plug sockets and preferences to
watch television in the living rooms, because of the more comfortable conditions.
Appliances location also appeared to influence household practices. Some households
had an office-like place for computers, so that computer activities were separated from
other household activities. In contrast, households with computers in living areas tended
to integrate computer use more into family life. A number of social influences appeared to
influence ICE appliance adoption. Schoolwork was a reason given for the adoption of
computers and “the possession of ICT was important for the positions teenagers had in
their peer-group” (Gram-Hanssen, 2005 p1243).
Røpke et al. (2010) contend that the integration of ICE appliance use into everyday
practices is the latest round of household electrification and that it is comparable to the
diffusion of previous electricity consuming technologies that have altered society. In their
research, Røpke et al. undertook fourteen in depth semi-structured interviews with work
colleagues and personal acquaintances (in total seventeen informants were interviewed).
The research found that ICE appliance use had become diverse and highly integrated into
household practices, particularly in respect to the development of social networks,
communication and information gathering. For example, informants kept their computers
turned on for extensive periods to maintain connection to email, Facebook and instant

76
messaging services. Most of these informants undertook this more energy intensive
practice due to the inconvenience of activating computers (Røpke et al., 2010).
Crosbie (2008) presents similar research, which focuses on household television
practices. She used in-depth interviews to collect qualitative data from twenty UK homes.
Only three households made an effort not to use standby power and the remaining
seventeen reported that “they habitually left their televisions on standby” (Crosbie, 2008
p2194). Research by the EST argues that laziness is the key reason for the use of
standby power modes in UK homes (EST, 2006), however Crosbie found that television
design appeared to be an important contributor to increased energy consumption.
Standby power modes were integrated into the design of the appliances, through functions
such as timers and digital receivers‟ updating protocols.
Crosbie argues that “habits by their very nature are integrated into the way in which we
live” (Crosbie, 2008 p2194) and that it is therefore unsurprising that householders have
altered their daily routines, and the placement of ICE appliances and mains sockets, in
ways that lead to the use of standby power modes. The individualised use of ICE
appliances was also prevalent and responses suggested that it was “socially unacceptable
to have less than two televisions in the home” (Crosbie, 2008 p2196). The study suggests
that this social norm is reflected in the wide range of services that are now available and,
to avoid household disharmony, multiple television ownership allows householders‟ to view
their preferred broadcast materials.
Crosbie (2008) concluded that householders‟ choice of television co-evolves with the
development and marketing of new technologies and services and that this has led to
more energy intensive practices. These new practices appear to have become embedded
in everyday routines. This is important, because as people reconfigure their household
infrastructure to support these new practices, it becomes increasingly difficult to encourage
householders to reduce their household energy consumption (Crosbie, 2008). Current UK
policy initiatives fail to deal with these aspects of energy consumption, because improved
product energy efficiency does not influence increased ownership or individualised use in
the home. To achieve this would require a new approach to the marketing of televisions,

77
so that products and services were designed for the whole family to enjoy together
(Crosbie, 2008).
Gram-Hanssen (2005) and Crosbie‟s (2008) research indicate that habits, emotions and
contextual factors can play an important role in ICE appliance adoption and use. The
studies also highlight that qualitative methods can explore the underlying factors involved
in participants behaviour, in more detail than the statistical quantitative approaches more
widely used in psychology. This argument is supported by Abrahamse et al., who found
that psychology intervention studies usually “reveal only to what extent interventions have
been successful, without providing insight into the reasons why” (Abrahamse et al., 2005
p283).
However, in common with questionnaire responses, qualitative interview responses are
frequently based on participants‟ perceptions of energy consumption rather than actual
energy consumption and do not provide a means to directly compare the relative electricity
consumption of households‟ practices. Robson (2002) highlights that self-reporting cannot
be assumed to be completely valid. This in itself is an interesting issue, because the
prevalence of habitual or routine ICE appliance behaviours suggests that participants may
not be fully aware of their own patterns of use. In contrast, Lobot et al. (1997) emphasise
that energy monitoring can correct false assumptions given by respondents, which
suggests that the direct measurement of electricity consumption provides a more robust
method to investigate ICE behaviours.
3.6.4 Frameworks for ICE appliance behaviour research
Sections 3.5 and 3.6 have highlighted that theoretical models have been used widely in
social science research. Although a wide variety of theoretical models have been applied
to environmental psychology studies, the majority of these models focus on a select
number of behavioural determinants and have been found to relate to some environmental
behaviours but not to others. Nevertheless, theoretical models can be used as heuristic
frameworks to explore, conceptualise and explain many of the determinants of behaviour
(Jackson, 2005; Steg and Vlek, 2009). The complex range of factors that have been found
to influence household energy behaviour, suggests that inter-disciplinary research will

78
require more comprehensive models that include both internal and external factors. Thus,
this literature review sought to identify theoretical models that could be used to help guide
the investigation of ICE appliance behaviours. This part of the review identified two
theories of particular interest: (i) Triandis‟ (1977) Theory of Interpersonal Behaviour (TIB);
(ii) Rogers‟ (2003) Diffusion of Innovations Theory (DIT).
3.7 The Theory of Interpersonal Behaviour (TIB)
The Theory of Interpersonal Behaviour (TIB) is a theoretical model developed by social
psychologist Harry Triandis (1977; 1980) to help explain and predict behaviour (Bamberg
and Schmidt (2003). The TIB integrates „expectancy value theory‟ with other factors such
as habit, emotions and contextual factors (Jackson, 2005). As a result, a number of
scholars have expressed support for the use of Triandis‟ (1977) TIB for energy and
environmental research (e.g. Jackson, 2005; Martiskainen, 2007).
Triandis (1977) contends that behaviour consists of acts, which are socially defined
patterns of muscular movements and therefore a physical activity. Acts do not have
meaning in themselves, but have meaning from the contexts in which they happen, and
are usually performed in a series of organised patterns that correspond to particular goals
and intentions (Triandis, 1977). A goal is “an outcome of a sequence of specific acts”
(Triandis, 1977 p5) and a behavioural intention is “a cognitive antecedent of an act”
(Triandis, 1977 p5). Intentions can be either specific or general. For instance, the specific
intention to switch on a television may result from the general intention to be entertained.
Switching on a television requires a series of acts (e.g. locating a remote control, using the
on button etc). Thus, acts relate to specific intentions.
The probability of an act is dependent on three main factors: (i) the behavioural intention to
undertake the act; (ii) the strength of the habit to undertake the act; (iii) the presence or
absence of conditions that facilitate the performance of the act (Triandis, 1977). Figure
3-5 shows how these main factors interrelate.

79
Figure 3-5 Triandis' (1977) Theory of Interpersonal Behaviour

80
Figure 3-5 shows that an act is dependent on intention, which is an immediate antecedent
of behaviour. Importantly, habit also mediates behaviour, which can be measured by the
number of times the act has already been performed. Both intention and habit are
moderated by objective conditions that can facilitate or impede behaviour (Triandis, 1977).
The influence of habit and intention is reflected in the degree to which an act is automatic,
as opposed to deliberate (i.e. the more deliberate the greater the influence of intention).
The influence of habit is the result of the social situation and individual differences, such as
personality. For example, the more the social situation is similar to those where an act has
occurred in the past, the greater the influence of habit. Similarly, individuals‟ may also be
what Triandis terms „creatures of habit‟, which may result in a tendency to perform habitual
behaviour (Triandis, 1977).
The influence of intention will also be dependent on social situations and individuals‟
differences. Triandis argues that if a social situation is novel and the behaviour has not
become automatic, the influence of intention will be greater than in a familiar situation
(Triandis, 1977). It may also be anticipated that some individuals will be predisposed to
intentionally seek to experience new behaviour patterns, and thus actively suppress the
relative influence of habit in relation to intention (Triandis, 1977).
The influence of habit and intention are mediated by the ability of an individual to conduct
the act through the facilitating conditions. Even if an individual has undertaken an act
numerous times in the past and fully intends to carry out the act, it is impossible to
undertake it, if the individual is completely restricted from doing so. Thus, the facilitating
conditions regulate an individual‟s ability to perform behaviours (Triandis, 1977).
It must be highlighted that the relationship between intention and habit is a complex and
dynamic phenomenon. The relative influence of habit and intention vary throughout the
course of a series of acts. Over time, as individuals experience situations more frequently,
there is a general move from intention to habitual behaviour (i.e. habits form and have a
greater influence). Therefore, behaviour generally moves towards a habitual pattern, but
habits can be broken through the intervention of behavioural intent (Triandis, 1977).

81
3.7.1 Intention
It is apparent from Figure 3-5 that intention is influenced by three key antecedents:
(i) perceived consequences; (ii) affect; (iii) social factors.
3.7.1.1 Perceived consequences
The term perceived consequences refers to a person‟s bet that certain consequences will
follow a given behaviour, based on knowledge and previous experience (Triandis, 1977).
The “greater the frequency of contiguity of behavior and outcome, the stronger the
connection between behavior and perceived consequences” (Triandis, 1977 p16).
Perceived consequences can therefore be compared to the rational process of forming an
attitude, as expressed in expectancy value theory, such as the TRA (Jackson, 2005).
However, Triandis (1980) contends that attitude is more pervasive (than expressed in the
TRA) and is also charged with affect. For instance, the extent to which an individual
values the consequences also influences behavioural intention. Value of consequences
refers “to how good or how bad one would feel if a particular consequence actually
happened” (Triandis, 1977 p9).
3.7.1.2 Affect
Affect “refers to the emotions a person feels at the thought of a behaviour” (Triandis, 1977
p9). The emotion may be either positive (e.g. pleasant) or negative (e.g. unpleasant) and
may range from strong to weak. Triandis also argues that affect relates to situational cues
(a signal that guides behaviour) that become associated with certain pleasant or
unpleasant outcomes of a particular behaviour (Triandis, 1977).
3.7.1.3 Social factors
Social factors are “the norms, roles, and general behavioral intentions that derive from the
relationship between our subject and other people” (Triandis, 1977 p13). Norms are
defined as “beliefs that certain behaviours are correct, appropriate, or desirable and other
behaviours are incorrect, inappropriate, immoral, or undesirable” (Triandis, 2007 p8).
These can range from being very weak to very strong and differ across individuals and
societies. For Triandis, norms appear to be social norms which determine what should

82
and should not be done (Jackson, 2005) and personal norms based on the individual‟s
moral beliefs (Bamberg and Schmidt, 2003).
The self-concept “consists of self-attributed traits and behavior patterns” (Triandis 1977,
p14) and is linked to self-image, “a person‟s ideas about who he or she is” (Triandis, 1977
p9). This includes self-esteem (the degree to which a person values themselves) and the
ideas a person possesses about “what behaviors are correct, appropriate or desirable”
(Triandis, 1977 p9). For instance, if individuals consider themselves to be environmentally
responsible, then they are more likely to have behavioural intentions consistent with
environmentally responsible behaviour. Triandis argues that our self-concept is strongly
influenced by what friends, family and important people to us think of us. This is
“communicated by the way others act towards us” (Triandis, 1977 p15) and influenced by
memories of past behaviour. Rules of behaviour, such as social etiquette, are also
considered as determines of behaviour (Triandis, 1977).
Roles can be defined as “sets of behaviors that are considered appropriate for persons
holding particular positions in a group” (Triandis, 1977 p8). For example, in most societies
there are traditional behaviours associated to being a father or mother, an executive or
labourer etc. This may be particularly relevant to the dynamics of a household.
Contractual arrangements are usually very specific, such as two individuals agreeing to
interact at a certain time (e.g. telephone or email at an arranged time). Self-monitoring is
defined as “self-observation and self-control guided by situational cues to social
appropriateness” (Triandis, 1977 p14). In other words, people often decide the way they
wish to present themselves to others, through the observation and evaluation of the social
environment.
3.7.2 Habit
Triandis describes habits as “situation-behaviour sequences that are or have become
automatic, so that they occur without self-instruction” (Triandis, 1980 p204). A habit‟s
strength is indexed by the number of times that the act has previously occurred. Triandis
argues that habits are learned through: (i) the magnitude of reinforcement; (ii) its contiguity
in time; (iii) settings and contexts of cues; (iv) the clarity, simplicity and familiarity of cues;

83
(v) confidence that learning is possible; (vi) the extent to which other individuals provide
reinforcement (Triandis, 1980).
3.7.3 Facilitating conditions
A key argument in Triandis‟ model is that the facilitating conditions mediate the
performance of a given behaviour. The facilitating conditions component relates to the
geography of the environment, which may facilitate or prevent an act from occurring
(Triandis, 1980). Although, a wide variety of facilitating conditions can be envisaged,
Triandis (1977) cites the ability of the person to undertake the act, knowledge and arousal.
Ability can be understood in a number of ways. Firstly, it suggests that an individual‟s
personal capacity, such as mental ability (e.g. skills) and physical ability (e.g. degree of
physical mobility), can determine the performance of a given behaviour. Secondly,
Triandis also implies that physical constraints (i.e. constraints from the physical
environment) also facilitate or impede behaviour. For example, Triandis states that:
... if a man is gagged, he may not be able to spit in anybody‟s face, no matter how
frequently he has done it in the past or how high his level of behavioral intentions might be.
(Triandis, 1977 p12)
Knowledge relates to an individual‟s understanding of how to undertake an act. However,
it may also relate to an individual‟s understanding of the consequences of the act. For
example, knowledge could influence: (i) whether or how an appliance is operated;
(ii) awareness of standby power consumption; (iii) the link between energy consumption
and climate change.
Triandis (1977) also contends that arousal of an individual facilitates an act. Either a high
drive or a situation (which is applicable to the individual‟s values) may increase the
probability of the behaviour (Triandis, 1980). For example, Triandis highlights that a
hungry man is more likely to eat food than one who is already satisfied (Triandis, 1977).
As is evident from Figure 3-5, Triandis (1977) includes arousal within the facilitating

84
conditions construct. However, arousal can be considered as distinct from other
facilitating conditions, due to being a physiological phenomenon rather than an exclusively
external factor (Triandis, 1980).
3.7.4 Recent examples of TIB research
The TIB has received little attention in energy research, however support for its use can be
found from other research disciplines. The health sciences have used the TIB more widely
and studies have shown the model to be effective for a range of social behaviours
(Winzenberg and Higginbotham, 2003). Research by Gagnon, Godin, Gagné, Fortin,
Lamothe, Reinharz and Cloutier (2003) concluded that the TIB had advantages over other
models due to its more comprehensive approach and Gagnon, Sánchez and Pons (2006)
supported the use of the TIB, because it could be applied to a variety of situations in the
field of implementation science.
Valois, Desharnais, and Godin (1988) compared predictive strength of the TRA and the
TIB, in respect to exercise intention and behaviour, and found the TIB to be a better
approach to understanding exercise intentions. Interestingly, the research found that
affect had an important influence on intention, and concluded that “the emotional
dimension of attitude is the main aspect to consider in the development of health
promotion interventions” (Valois et al., 1988 p470). Boots and Treloar (2000) applied the
TIB to investigate the prediction of medical interns‟ attendance of an educational
programme. The research found that the intention to attend was largely predicted by the
perceived benefits from the programme, but actual attendance was best predicted by
facilitating conditions and habit (Boots and Treloar, 2000). Research by Winzenberg and
Higginbotham (2003) investigated factors affecting the intention of educational providers to
deliver effective medical education to general practitioners. The types of factors identified
through the qualitative research were consistent with the TIB, which provided additional
support for the use of the model in future health research (Winzenberg and Higginbotham,
2003).
In the field of environmental psychology, Bamberg and Schmidt (2003) compared the
predictive strength of the TPB, NAM and the TIB for travel mode choice and found that the

85
inclusion of habit made the TIB a better predictor of behaviour than either the TPB or
NAM. The NAM model explained 14% of the behavioural variance, whereas intention,
from the TIB and the TPB, explained around 45% of the variance. After controlling the
effect of intention, habit had “a significant, even stronger effect on behaviour” (Bamberg
and Schmidt, 2003 p279). Bamberg and Schmidt concluded that car use is a habitual
choice process that, rooted in past conscious considerations, usually involves routine
shaped automatic associations between situations and habitually chosen options
(Bamberg and Schmidt, 2003).
A number of information systems (IS) studies, in fields such as organisational and
managerial economics, provide findings relevant to the TIB and ICE appliance use. Often
this branch of economics has used the Technology Acceptance Model (TAM), and its
successor TAM2, which are based on the TRA (shown in Figure 3-6 and Figure 3-7)
(Legris, Ingham, and Collerette, 2003). However, the TAM models are subject to the same
criticisms of rational choice theory, so a number of studies have applied the TIB.
Figure 3-6 Technology Acceptance Model (Legris et al., 2003 p193)

86
Figure 3-7 Technology Acceptance Model 2 (Legris et al., 2003 p200)
Paré and Elam (1995) used the TIB to investigate the discretionary use of computers by
knowledge workers. The research found that perceived consequences, affect (anxiety)
towards computer use, internal beliefs and habits were dominant factors for the prediction
of computer usage. Due to constraints to the study, not all of the factors in the TIB could
be investigated and the results could only explain 30% of usage variance. Thus, the
authors conclude that future research should include more elements of the TIB (Paré and
Elam, 1995). Paré and Elam (1995) also compare their results to similar research by
Thompson, Higgins and Howell (1991). Paré and Elam argue that both sets of results
“confirm that Triandis‟ theory of behaviour should be applied for understanding and
explaining computer usage behaviour in a voluntary environment” (Paré and Elam, 1995
p226).
Cheung, Chang and Lai (2000) adapted the TIB to help investigate Internet usage at work.
The study excluded the habit construct and used the social factors construct as a direct

87
influence on Internet use and an indirect influence on affect. The construct complexity (the
opposite of perceived ease of use in TAM) was also included. In contrast to other
research in this field, Cheung et al. (2000) found that facilitating conditions (i.e. IS support)
had the most significant effect on Internet use in the workplace. The research found that
social factors had the second most significant role, suggesting that a social environment,
which encourages the use of the Internet, makes individuals feel more positive about its
use (Cheung et al., 2000). Interestingly, Cheung et al. concluded that the positive impact
from the combination of social pressure and the near-term consequences (e.g. usefulness
of the Internet) resulted in users‟ affect (i.e. enjoyment) being a less important factor.
Cheung et al. also found that complexity had a significant negative effect on direct Internet
use and indirectly through affect and short and near term consequences. Thus, ease of
use appears to increase the use of the Internet.
Similar research by Chang and Cheung (2001) investigated graduate students‟ intention to
use the Internet. The adapted model found that affect, social factors, facilitating conditions
and near-term consequences had positive impacts on intention to use the Internet.
Interestingly, affect was found to be the most important factor in the formation of students‟
intention. Chang and Cheung (2001) also found that complexity had a significant negative
indirect effect on students‟ intention to use the Internet. This finding supports previous IS
research regarding the „ease of use‟ construct in the TAM and TAM2 (Legris et al., 2003).
More recent research by Bina, Karaiskos and Giaglis (2007) investigated the adoption of
mobile data services (MDS) with the TIB and an additional “ease of use” construct taken
from TAM. The research found that facilitating conditions (e.g. financial barriers) were of
particular significance and concluded that the TIB‟s generic framework provided a useful
means to cover the multiplicity of MDS features and specific usage characteristics. The
construct of ease of use can also be found in earlier diffusion research under the guise of
complexity (Rogers and Shoemaker, 1971). This branch of social research provides a
large body of empirical studies that has focused on the adoption of technology. The
literature review found that diffusion theory was of particular relevance to this thesis and is
described in the following section.

88
3.7.5 Summary of the TIB
Unlike other psychological models the TIB “captures many of the criticisms levelled at
rational choice theory” (Jackson, 2005 p95). The examples above highlight that this
enables the framework to be adapted to a range of behavioural circumstances, which
includes the adoption and use of new technologies. The TIB is one of the few theories to
incorporate emotional, habitual, social and contextual factors, alongside the constructs
found in rational choice derived models. The TIB‟s habit and contextual constructs also
allow the model to link “to people‟s everyday consuming behaviours” (Martiskainen, 2007
p23). Thus, the TIB relates closely to elements of practice theory and traditional
psychological constructs. Jackson provides the following words to succinctly describe the
model.
In summary, my behaviour in any particular situation is, according to Triandis, a function
partly of what I intend, partly of my habitual responses, and partly of the situational
constraints and conditions under which I operate. My intentions in their turn are influenced
by social, normative and affective factors as well as by rational deliberations. I am neither
fully deliberative, in Triandis‟ model, nor fully automatic. I am neither fully autonomous nor
entirely social. My behaviours are influenced by my moral beliefs, but the impact of these
is moderated both by my emotional drives and my cognitive limitations.
(Jackson, 2005 p 95)

89
3.8 Diffusion of Innovations Theory (DIT)
There is a recognised body of research that has focussed specifically on the adoption of
new technologies. Much of this research has been undertaken within the established
framework of DIT, which is accredited to the work of Rogers and Shoemaker (1971). As a
result of further empirical research, there have been a number of revisions to the theory
and the most recent, presented by Rogers (2003), reveals a number of issues particularly
relevant to this thesis. Rogers describes diffusion as “the process in which an innovation
is communicated through certain channels over time among the members of a social
system” (Rogers, 2003 p5). Thus, DIT is a social theory concerned with the spread of new
ideas, products and social practices, throughout a society or from one society to another
(Anable et al., 2006). This is particularly relevant to ICE appliance adoption due to the
continuous integration of new technologies into the domestic environment. DIT uses four
key constructs to explain the diffusion process: (i) the innovation; (ii) communication
channels; (iii) time; (iv) the social system (Rogers, 2003). An overview is provided below
in Figure 3-8.

90
Figure 3-8 Diffusion of Innovations Theory (Rogers, 2003)
DIFFUSION OF
INNOVATIONS

91
3.8.1 The Innovation
An innovation is defined as “an idea, practice, or object that is perceived as new by an
individual or other unit of adoption” (Rogers, 2003 p12). An important aspect of the
diffusion of an innovation is the newness of the idea which Rogers argues provides
diffusion with a special character. If an individual perceives that an idea is new, then it is
an innovation, even though the idea may have been established some time previously.
Consequently, the newness element of an innovation causes a level of uncertainty, and
perceived risk, within the process of diffusion (Rogers, 2003). In order for an adopter to
overcome this uncertainty there is an important element of information gathering within the
decision to adopt. It follows that the quality, availability and the way that information is
communicated plays a significant role in diffusion.
DIT applies five key characteristics to explain why there are differences in the rate of
diffusion (see points 1-5 below). Innovations that are perceived to possess these
characteristics will be adopted more rapidly than other innovations (Rogers, 2003).
1. Relative advantage is the “degree to which an innovation is perceived to be better than
the idea it supersedes” (Rogers and Shoemaker, 1971 p22). Relative advantage is
often expressed in terms of economic benefit, but it can take a variety of other social
forms. All that matters “is whether an individual perceives the innovation
advantageous” (Rogers, 2003 p15).
2. Compatibility is the “degree to which an innovation is perceived as being consistent
with the existing values, past experiences, and needs of the receivers” (Rogers and
Shoemaker, 1971 p22). Compatibility is fundamentally linked to the social system. If
an innovation is incompatible with social values and norms, it will not be adopted as
rapidly as an innovation that is considered to be compatible (Rogers, 2003).
3. Complexity is the “degree to which an innovation is perceived as difficult to understand
and use” (Rogers and Shoemaker, 1971 p22). Thus, innovations that are more readily

92
comprehended by the members of a social system will be adopted more easily
(Rogers, 2003).
4. Trialability is “the degree to which an innovation may be experimented with on a limit
basis” (Rogers and Shoemaker, 1971 p23). The process of experimentation (e.g.
adoption through an instalment plan) enables adopters to answer questions of
uncertainty, as it is possible to learn by doing without full commitment (e.g. full financial
investment).
5. Observability is “the degree to which the results of an innovation are visible to others”
(Rogers and Shoemaker, 1971 p23). The more easily potential adopters can see the
results of an innovation, the more likely they are to adopt. Rogers (2003) highlights
that visibility stimulates the discussion of new ideas which facilitates the transfer of
information.
Rogers (2003) contends that 49%-87% of the variance in the rate of adoption can be
explained by the perceived attributes, which suggests that it is prudent to include this
aspect of DIT to investigate the adoption of ICE appliances.
3.8.2 Communication Channels
Diffusion is a type of communication whereby participants create and exchange
information to reach a mutual understanding concerning a new idea (Rogers, 2003). In its
simplest form the process of diffusion involves: (i) an innovation; (ii) an individual (or other
unit of adoption) that has either knowledge or experience of the innovation; (iii) an
individual (or other unit of adoption) that does not have either knowledge or experience of
the innovation; (iv) a communication channel that connects the two individuals (or units of
adoption).
A communication channel is the mode by which information is transferred. The nature and
characteristics of the information transfer determines both the conditions under which the
information will or will not be transferred and the subsequent effect (Rogers, 2003). Mass

93
media channels (such as television, radio, newspapers, etc) provide a very rapid form of
information transfer, in which it is possible to communicate with a large number of
recipients. In contrast, interpersonal channels involve face-to-face information exchange,
but are more effective at persuading individuals to adopt (Rogers, 2003).
Rogers (2003) highlights that diffusion studies have shown that “most individuals do not
evaluate an innovation on the basis of scientific studies of its consequences” (Rogers,
2003 p18), but rather on a subjective evaluation of an innovation “that is conveyed to them
from other individuals like themselves who have already adopted the innovation” (Rogers,
2003 p18). This fundamental involvement of peer networks makes diffusion a social
process, which involves interpersonal communication relationships. The transfer of ideas
occurs most frequently between two individuals who are similar, which Rogers (2003)
defines this as homophilous communication. Homophily is “the degree to which two or
more individuals who interact are similar in certain attributes, such as beliefs, education,
socioeconomic status, and the like” (Rogers, 2003 p19). In contrast, heterophily is defined
as “the degree to which two or more individuals who interact are different in certain
attributes” (Rogers, 2003 p19). Rogers (2003) argues that homophilous interpersonal
communication (e.g. via neighbours, work colleagues and friends) produces the most
effective form of communication, because it is likely to produce a more enjoyable and
rewarding communication experience.
3.8.3 Time
Time is involved in diffusion in a number of different ways: (i) the innovation-decision
process; (ii) the degree of innovativeness (the relative earliness or lateness of the
adoption); (iii) the innovations rate of adoption through an overall social system. The
innovation-decision process occurs when an individual (or decision-making unit) passes
from first knowledge of an innovation to the confirmation of this decision. Rogers (2003)
has conceptualised five key steps in the innovation-decision process.
1. Knowledge: when knowledge of the innovation‟s existence is gained and a degree
of understanding concerning its function is realised. An individual‟s socioeconomic

94
and personal characteristics can influence this stage of the innovation decision
(Rogers, 2003);
2. Persuasion: when an individual gains either a favourable or unfavourable attitude
toward the innovation. The attitude formation includes the active gathering of
information to assist the evaluation of the characteristics of the innovation. Rogers‟
(2003) contends that main type of thinking is affective (or feeling) at this stage, as
opposed to cognitive (or knowing) at the knowledge stage;
3. Decision: when an individual engages in activities that lead to a choice to either
adopt or reject the innovation;
4. Implementation: when an individual uses the innovation;
5. Confirmation: when an individual looks for verification for the innovation-decision
that has been made (this decision may be reversed if the individual is subject to
conflicting messages about the innovation).
Figure 3-9 shows the innovation-decision process and although the sequence of these five
steps is not definitive, they do provide a simple rationale for the way in which individuals
decide to adopt an innovation (Rogers, 2003). In essence the innovation-decision process
is as an information gathering and processing activity, whereby an individual goes through
a process of reducing the uncertainty about the innovation and its potential consequences.
Within this process mass media can significantly influence the early knowledge seeking
stage, however as evaluations become more reliant on specific information the influence of
interpersonal communication becomes predominant. This is because interpersonal
communication provides more detailed information and reassurance, which reduces
uncertainty (Rogers, 2003).

95
Figure 3-9 The Innovation-decision process (Rogers, 2003)

96
The innovation-decision process requires time for the five steps to be completed.
Individuals vary in the time necessary to go through this process, which is dependent on
the individual‟s (or groups) characteristics and the conditions under which it takes place
(Rogers, 2003). Rogers describes five main categories of innovativeness.
1. Innovators are active seekers of information about new ideas, and generally have a
high level of mass media exposure and interpersonal networks that extend outside
their local system. Innovators are the first to adopt and are able to deal with
uncertainty (Rogers, 2003).
2. Early adopters are a more integrated part of the social system and look for advice
and information from early adopters before adopting the idea. Due to early
adopters possessing a reasonably high degree of innovativeness, they serve as
role models for the social system and help to generate the critical mass in the
diffusion process (Rogers, 2003).
3. Early majority adopters tend to adopt an innovation just prior to the average
members of a system. They interact frequently with their peers but, rarely occupy
positions of opinion leadership with a system. They provide the key
interconnections within the social system‟s interpersonal networks (Rogers, 2003).
4. Late majority adopters tend to adopt the innovation closely after the average
member of the system. Adoption may result from increased peer pressure or the
economic necessity emanating from the existing level of adoption (Rogers, 2003).
Innovations are evaluated with considerable care and will not be adopted without
the majority of the system having already adopted the innovation (i.e. uncertainty
must be reduced to a minimum) (Rogers, 2003).
5. Laggards are the final social group to adopt the innovation. They have almost no
opinion leadership and can be consider as possessing very limited interpersonal
connections. They possess conservative values and use the past as a central
point of reference. Much of their social interactions are predominantly with other

97
traditionalists and adoption only occurs when they are certain that an innovation
will be successful (Rogers, 2003).
Figure 3-10 shows how the diffusion of an innovation within a social system generally
follows an S-shaped distribution curve. More recent research has suggested that the
diffusion curve may be too simplistic for some innovations (Kauffman and
Techatassanasoontorn, 2006). Nevertheless, despite adjustments and criticisms, “the
basics of it still remain valid” (De Marez Lieven and Verleye Gino, 2004 p238).
Figure 3-10 Diffusion of innovations curve (Rogers, 2003)
3.8.4 The Social System
Diffusion always occurs within a social system, which creates boundaries that influence
the way that an innovation can diffuse. Social structure is defined as “the patterned
arrangements of the units in a system” (Rogers, 2003 p24) and is the component of a
system that provides a degree of regularity and stability to human behaviour. Therefore,
structure embodies a form of information that can decrease uncertainty. For example,

98
bureaucracy provides a deeply structured hierarchy, which controls the decision process
and the relationships within the system. An informal structure also exists within the
interpersonal networks that interlace a social system. This communication structure is
often created in a system “in which homophilous sets of individuals are grouped together
in cliques” (Rogers, 2003 p24). These features of communication structure help to predict
the behaviour of members of system and when they are likely to adopt (Rogers, 2003).
Therefore, the structure of a social system can have a significant influence on the diffusion
of an innovation either by facilitating or obstructing the adoption process. In addition, the
innovativeness of the individual is affected by both an individual‟s personal attributes and
by the characteristics of the social system (Rogers, 2003). For instance, the norms of a
social system define what is considered to be acceptable behaviour and can act as a
barrier to change and the adoption of new innovations.
Rogers argues that “the most innovative member of a system is very often perceived as a
deviant from the social system and is accorded a status of low credibility by the average
members of the system” (Rogers, 2003 p26). Therefore, other more influential members
of the system provide the information and advice to the masses. Rogers describes these
members as opinion leaders. Opinion leadership is “the degree to which an individual is
able to influence other individuals‟ attitudes or overt behaviour informally in a desired way
with relative frequency” (Rogers, 2003 p27). Rogers argues that opinion leadership is
informal and not part of the individual‟s formal position or status within the system and is
earned and maintained by the individual‟s technical competence, accessibility within the
social system, and conformity to the social norms of the system (Rogers, 2003). Opinion
leaders‟ strong interpersonal relationships enable them to act as social models whose
innovative behaviour is imitated by the other members of their social system. However,
their credibility and opinion leadership can be lost if they appear too much like professional
change agents, no longer reflect social norms or are over used by change agents as a
concerted tool for diffusion of a particular innovation (Rogers, 2003).
A change agent is “an individual who influences clients‟ innovation-decisions in a direction
deemed desirable by a change agency” (Rogers, 2003 p27). In contrast to an opinion

99
leader, a change agent is not a member of the social system, but is a professional who
works for the objectives of the change agency. In this sense a change agent usually has a
vested interest in seeking to directly influence a social system to adopt (or hold back) an
innovation.
Change agents are often heterophilous due to their specialist knowledge which creates
communication problems for the diffusion of their innovation. Thus, change agents will
often use the opinion leaders of a social system, in order to permeate the interpersonal
communication channels of a system, which are essential for the diffusion process
(Rogers, 2003). Rogers describes three key types of innovation-decisions.
1. Optional innovation-decisions are made by individual members of a system,
independent of the decisions made by other members of the system. Even though the
norms and interpersonal communication networks of the social system will have an
influence, the individual is the main unit of decision making.
2. Collective innovation-decisions are made by group consensus among the members of
a social system (e.g. by vote in an election).
3. Authority innovation-decisions are made by the few members of a social system that
have power, status, or the technical expertise to decide to implement the adoption of
an innovation for the entire social system. Individual members of a social system have
little or no influence and must comply with the adoption of the innovation.
Rogers (2003) also describes contingent innovation-decisions. These are less common
decisions and “can be made only after a prior innovation-decision” (Rogers, 2003 p30).
For example, individuals in the US could only decide to have seat belts installed in their
cars following the collective decision to introduction legislation (Rogers, 2003).
The final aspect of diffusion and social systems is termed by Rogers as the consequences
of innovations. Consequences are “the changes that occur to an individual or to a social

100
system as a result of the adoption or rejection of an innovation” (Rogers, 2003 p30).
Change agents will often encourage the introduction of innovations into a system that they
anticipate will create desirable, direct and anticipated consequences. However, often
innovations will result in unanticipated consequences that are indirect and undesirable to
the social system.
3.8.5 Examples of DIT research
Many diffusion studies have used DIT to help measure the rate of adoption of products or
ideas and explore the barriers to the diffusion process. It is difficult under the constraints
of this thesis to provide an extensive literature review. Therefore, this section provides a
modest summary of studies that have used DIT. Despite a number of weaknesses (e.g.
regarding the forecasting of adoption, an inherent pro-innovation bias) the DIT framework
has been reviewed favourably by many researchers (Faiers and Neame, 2006). The
theory has been used to investigate the adoption of a variety of products and innovations,
such as agricultural products (Rogers, 2003), medical treatments and technology (Lee,
2004), renewable energy innovations (Faiers and Neame, 2006; Arkesteijn and
Oerlemans, 2005; Kirwan, 2008), mobile communications technologies (Hsu, Lu, and Hsu,
2007) and digital television (Chan-Olmsted and Chang, 2006; Weber and Evans, 2002).
The perceived attributes of innovations have been found to explain product adoption or
intention to adopt. For example, Lee (2004) investigated nurses‟ adoption of a
computerised care plan system through in-depth interviews. Lee compared interview data
against Rogers‟ five perceived attributes and found the DIT “appropriately described
nurses‟ perceptions toward new technology use in their daily practice” (Lee, 2004 p237).
However, Lee also states that the major limitation of the study was its exclusion of other
components of DIT, such as relative knowledge, decision-making and communication
channels.
Zhou (2008) used the perceived attributes of DIT, combined with TAM, to investigate the
voluntary and forced adoption of the Internet by journalists. The research found that
perceived attributes were the most powerful predictors of adoption and that relative
advantage and ease of use (complexity) were the most significant (Zhou, 2008). Similarly,

101
Dupagne (1999) found that the relative advantage of HDTV (such as picture sharpness
and screen size) was important to the intention to adopt. Atkin, Neuendorf Jeffres and
Skalski (2003) investigated the adoption of digital television and found a degree of support
for the early adopter profiles derived from diffusion theory, and that the awareness gained
from direct experience with a technology (i.e. trialability) is vital to allow individuals to
ascertain relative advantage (Atkin et al., 2003). The characteristics of an innovation are
also reflected in recent consumer research. In the EuP preparatory study for televisions,
questionnaire responses from leading television manufacturers indicated that price,
design, display technology and functionality were the most important factors in the
purchase decision process (Stobbe, 2007e).
Kang (2002) used DIT to investigate the early adoption of digital cable services and argues
that DIT “provides a systematic demand side explanation of how new innovative
technologies are communicated, evaluated, adopted, and reevaluated by consumers”
(Kang, 2002 p195). Research by Weber and Evans (2002) examined the role of the media
in the successful adoption of digital television in Britain. The research used a content
analysis methodology to examine digital television articles from between 1996 and 2002
(Weber and Evans, 2002). The results found a correlation between the extent of media
coverage, the timing and use of the media‟s language, and the rate of diffusion. Thus,
mass media appeared to be an important factor in the diffusion of digital television
services.
Kauffman and Techatassanasoontorn (2006) conducted research into the early diffusion of
digital wireless telephones. The results were “consistent with some of the past theoretical
predictions and empirical findings of diffusion of innovation research” (Kauffman and
Techatassanasoontorn, 2006 p446). In particular, adopter characteristics and social
influence appear to have an impact on technology adoption decisions, especially for later
adopters, who turned to friends and family to inform the decision. However, the “adoption
patterns did not follow a normal distribution and did not map exactly into Rogers‟ five
adopter categories” (Kauffman and Techatassanasoontorn, 2006 p432). Thus, the authors
support Meade and Islam (2006) who argue that although the body of diffusion research is
extensive, only a number of key hypotheses have been satisfactorily resolved. This is due

102
to the diffusion of innovations process being complex, involving a large number of
individual decisions.
Research by Rijnsoever, Hameren, Walraven and van Dijk (2009) also suggests limitations
with the DIT. Rather than investigating a single product, Rijnsoever et al. (2009)
investigated the adoption of clusters of consumer electronics (i.e. bundles of products that
consumers view as heavily interrelated). These were television, computer, gadget and
music appliances. The research found that only the computer and music clusters had a
degree of explanatory power consistent with Rogers‟ contended range of 49%-87%.
Furthermore, the research found that the attributes were poor indicators of adoption unless
the interrelationships between attributes were included in the model. The Rijnsoever et al.
(2009) study concluded that the attributes are heavily dependent on each other and that
overall, the five attributes of DIT do not fit with the consumer electronics domain.
However, Rijnsoever et al. (2009) are not entirely dismissive of DIT.
The implication is that the influence of the other variables mentioned by Rogers (e.g.
adopter characteristics, type of innovation-decision, exposure to communication channels
or change agents and the social system) is probably much larger than earlier assumed.
(Rijnsoever et al., 2009 p419)
Rijnsoever et al. (2009) argue that future research should focus on this issue. Thus,
exploring the communication channels, social system and householders decision
processes with the DIT may provide a degree of improved theoretical understanding in
respect to ICE appliances.
3.8.6 DIT summary
DIT suggests that individuals‟ undertake an internal evaluation of the attributes of an
innovation before making the decision whether or not to adopt. This involves the formation
of an attitude towards an innovation, which is influenced by an individual‟s characteristics,
such as innovativeness. An important aspect of the formation of the attitude relates to
external elements, both through the social system and the way that information is

103
communicated to the individual. Thus, DIT includes both internal and external factors as
influences of adoption behaviour.
This thesis is not specifically concerned with measuring the rate of adoption of ICE
appliances within households. Rather, it is interested in factors that influence the
ownership of ICE appliances. Therefore, many of the limitations of DIT, which were
touched on in section 3.8.5, are of less significance to this thesis. For this thesis, the DIT‟s
innovation-decision process (shown in Figure 3-9) is of particular use, because it provides
a structured means to include key factors that have been found to influence individuals‟
adoption decisions based in previous empirical research.
3.9 Summary
This chapter has provided an overview of literature from the social sciences that has
investigated household energy consumption. The review revealed that ICE appliance
electricity consumption has been investigated by the field of sociology, largely from an
external perspective. Energy research from the discipline of environmental psychology
provides an insight into internal influences on behaviour, but there are gaps in knowledge
concerning ICE appliance use. Furthermore, leading scholars argue that, to understand
behavioural influences more comprehensively, it is worthwhile to explore both internal and
external factors.
Theoretical models provide a means to investigate behaviour more systematically and two
models were identified as frameworks to support the investigation of ICE appliance
behaviours. Rogers‟ (2003) DIT provides a means to include key factors that have been
found to influence individuals‟ adoption decisions based in previous empirical research.
Although Triandis‟ (1977) TIB has received little use in environmental research, its
inclusion of internal and external factors (that includes affect, habits and facilitating
conditions) has led to growing support for its use in energy research.

104
Chapter 4. Literature Review 3: ICE appliances and socio-
technical research
4.1 Introduction
This chapter provides a review of relevant literature that does not fall neatly into either
technical or social science energy research. Chapter 2 and chapter 3 imply a consensus
between the social and physical sciences that the combination of social and technical
research methods (i.e. socio-technical research) can provide more accurate and revealing
findings. Although socio-technical research is still largely a novel approach to energy
research, a number of more recent studies have investigated ICE appliance use.
However, many of these studies have retained a predominantly technical focus and have
mainly incorporated their social science component from the sociological perspective. A
further characteristic of these studies is that frequently the technical and social elements
have not been fully integrated. Often independent samples are used for the collection of
the social and technical data, which introduces a degree of separation between the
findings. Nevertheless, the literature provides contemporary and valuable results that also
highlight the benefits of the socio-technical methodology.
The chapter begins with a review of relevant socio-technical energy research (section 4.2).
This is followed by a brief review of literature that supports the argument for undertaking
inter-disciplinary energy research (section 4.3). A brief summary of the key issues raised
by the literature review chapters is then presented (section 4.4). Finally, the main
research questions for this thesis are outlined (section 4.5).
4.2 Socio-technical domestic energy research
In section 2.3.4, standby power research by Vowles et al. (2001) was briefly presented.
The study can be classed as socio-technical research, because it coupled the quantitative
results with discussions with householders and with questionnaire responses to investigate
householder awareness and behaviour. Appliances standby power was measured with a
Wattmeter and user estimates were used to estimate total standby power electricity
consumption. Some appliances were not measured due to either being mains wired or

105
inaccessible and due to such complexities computing appliances were excluded from the
study, which made it impossible to assess the total ICE appliance standby consumption.
Cordless telephones were assumed to be in standby for 23.5 hours per day, and
measurements were taken without the telephone attached. Answer-phones and faxes
were assumed to be in standby for 23 hours and 55 minutes per day. However, user
estimates can be an unreliable means to determine usage patterns, which is a further
limitation of the study (Vowles et al., 2001).
Vowles et al.‟s (2001) study concluded that between 6 and 10% of annual household
electricity demand was from standby power consumption and that around 6.2% of total
domestic electricity consumption could reasonably be attributed to standby power. The
research also found that householders implemented different approaches to using different
appliances‟ standby power functions and that there was a strong polarisation between
participants who always turned appliances off and those who left them in standby (i.e.
generally householders always use standby for a given appliance or not). Only television
use provided a significant number of responses where householders both used standby
and off modes. Vowles et al. (2001) suggest that this is due to televisions being used
more frequently.
In general, a large proportion of the questionnaire respondents claimed not to switch off
consumer electronic equipment. A key response for this practice was for purposes of
convenience. However, a significant proportion of respondents also refuted convenience
as a motivation, and often highlighted technical constraints (e.g. losing programmed
settings) and lack of awareness as key factors. For appliances where features, such as
clocks, were not set correctly, it was assumed that a lack of power switches and
inaccessibility to plug sockets was responsible for standby use. In respect to awareness
of standby consumption, the majority of respondents were able to identify items in standby
if there was a visible LED (light emitting diode) power indicator or continuous display. In
contrast, only 27% of appliances without a visible standby power indicator were correctly
recognised to be consuming electricity. Although visibility appeared to raise awareness,
respondents generally regarded standby power to be of little concern due to the perceived
low level of energy consumption (Vowles et al., 2001).

106
A further aspect of the Vowles et al.‟s study is that households were presented with the
survey data for their homes and over the subsequent three weeks the responses to this
information were studied. Three quarters of the households were surprised at the results
and half of the households altered their usage patterns. It was estimated that these
changes represented a 25% reduction in standby power consumption among the sample
(Vowles et al., 2001).
An intervention study by Gudbjerg and Gram-Hanssen (2006) investigated methods to
alter ICE appliance standby consumption in thirty Danish homes. Findings from this study
were also re-evaluated in a recent paper by Gram-Hanssen (2010). The study only
monitored high electricity consuming homes, but provided a number of useful findings for
this thesis. Typically, four data loggers were installed, in each home, to monitor groups of
ICT and consumer electronics appliances at hourly intervals for a year. Following the
monitoring, ten homes were selected for interviews to explore the reasons for the changes
observed in the monitoring data (Gudbjerg and Gram-Hanssen, 2006).
The initial monitoring data identified that standby power consumption accounted for, on
average, 9% of the sample‟s total household electricity consumption and 42% of total ICE
appliance electricity consumption. The study concluded that, in addition to reducing
appliances‟ standby power loads, there is a need to facilitate individuals‟ ability to turn off
appliances with hard-off switches on ICE appliances and at mains sockets. Interestingly,
the research highlighted the role of contextual factors (e.g. access to plug sockets) and
habits in standby power consumption, and how householders‟ attitudes and values (e.g.
towards financial cost or environmental harm) can also influence behaviour (Gudbjerg and
Gram-Hanssen, 2006).
Section 3.3 introduced research by Gram-Hanssen et al. (2004), which analysed energy
consumption data from over 50,000 Danish households. An additional aspect of the study
was the collection of qualitative data through ten interviews with households that took part
in the EURECO project. Results concerning ICE appliance standby use appeared to be
unclear. Some households turned appliances off standby without being aware of it, due to

107
convenience (e.g. groups of appliances that used the same socket) or fear of fire.
Interestingly, one householder explained that he once telephoned his wife to turn off a
light, despite having five computers which were always on standby. An explanation for this
paradox was habit and “habitus”. Since his childhood, turning off lights had been an issue,
whereas ICE standby is a relatively new energy consumption issue, and was not
integrated into daily routines. In general, the interviews showed a relatively “low
correspondence between the actual distribution of electricity on end-uses and the families
focus on energy savings” (Gram-Hanssen et al., 2004 p84). However, householders
comfort, financial benefit and environmental values and attitudes appeared to influence
overall household electricity consumption.
The Swedish Energy Agency recently monitored the electricity consumption in four-
hundred households (Zimmermann, 2009; Bennich and Persson, 2006; Bennich, Lopes,
Öfverholm, and Kadic, 2009). Measurements were recorded at ten minutely intervals for a
year in forty homes and for a month in the remaining homes. ICE appliances were
monitored with serial meters placed between the socket outlet and the appliances.
Although televisions were monitored separately, the majority of ICE appliances were
monitored in groups. For example, computing appliances were monitored together and
audio-visual appliances (e.g. Hi-Fi systems, STBs, games consoles, VCRs, DVD players)
were monitored from one “site”. As a result, individual appliance data is not easily
determined from the results. Nevertheless, results from the study showed that a growth in
ICE appliance use, and particularly computers, had negated the effect of improvements in
other appliances efficiency (e.g. cold appliances) (Bennich et al., 2009). The study
concluded that the reduction of ICE appliance standby power loads to below 1W could
provide significant reductions in household electricity consumption and that a national
standby power programme should encourage the use of manual switches. The study also
recommended that households should be encouraged to use laptops rather than desktop
computers. On average, laptops were found to use 35 kWh per year as opposed to 343
KWh for desktop computers (Zimmermann, 2009)
Connected to the quantitative study is research by Green and Ellegård (2007) who
conducted interviews to “increase the understanding of electricity use in households and

108
serve policy makers with insights about who to direct policy measures towards” (Green
and Ellegård, 2007 p1907). In their paper, the results from fourteen household interviews
are presented. In eight of these households participants, above twelve years, used time
diaries (for two weekdays and one weekend day) and log books to record their use of a
number of specific appliances, to relate variations in behavioural patterns. The interviews
were not directly connected to electricity consumption measurements (leaving the
research open to the inaccuracies discussed at the beginning of this section) but, the study
provides some interesting qualitative findings.
Green and Ellegård contend that one of the most striking findings was householder‟s
ownership of several ICE appliances. Key factors for this, included higher standards of
living, decreases in the cost of ICE appliances and the individualised use of appliances
regardless of household size. For instance, “conflicts regarding who should use the device
in some cases are solved by buying another, more modern one” (Green and Ellegård ,
2007 p1910). The adoption of newer technologies also reflects this process. Although
older televisions and computers were replaced, they remained in the household, facilitating
individualised use. Individualised use was also linked to changes in the structure of
everyday lives, such as more flexible working hours and householders perceived need to
use appliances instantly (Green and Ellegård, 2007).
To make sense of the appliance usage patterns, Green and Ellegård classified appliance
use into several categories (presented in Table 4-1). Communal use was found to be
highly relevant to television use, which constituted an undemanding way for householders
to be together after work. Individual use patterns were also significant for ICE appliance
use and often involved more energy intensive practices. For example, householders often
worked on computers and listened to radios and televisions. Interestingly, some
teenagers used Internet messaging to discuss television programmes as they were
watching them (Green and Ellegård‟s, 2007).

109
Table 4-1 Appliance use categories (Green and Ellegård, 2007)
Appliance use categories Description
Communal use When two or more household members use an appliance together
Use for common goals When the use of an appliance serves several members
Serial use When the same appliance is used repeatedly by different members at different times
Parallel use When different appliances, of the same type, are used at the same time in different locations within the house.
Individual simultaneous use When several appliances are used by an individual at the same time.
Individual by turn use When a number of appliances are on at the same time, but the individual alternates between them.
Individual double use When more than one device is used to meet an objective.
An important aspect of increased ICE appliance use relates to service provision, which
allows devices to be used day and night. Daytime broadcasting and more channels have
allowed Swedish householders to use ICE appliances for company during periods of being
alone (e.g. watching television, communicating with friends over the Internet). This form of
ICE appliance use appears to relate to an individual‟s character. For instance, low
patterns of use related to some householders preference for a silent atmosphere or
interest in leisure activities that resulted in low occupancy. Thus, the study emphasises
that external factors, such as service infrastructure and leisure and working practices, can
influence ICE appliance consumption. It also highlights that the individualisation of
household activities has evolved with services and technological development, and is
resulting in more energy intensive ICE appliance practices (Green and Ellegård‟s, 2007).
The REMODECE project is one of the most recent and comprehensive research studies,
to investigate electricity consumption in European households (De Almeida et al., 2008).
The research focused on new loads, such as ICE appliances, due to there being no
available information concerning this end-use. Research was conducted in the following
countries: Belgium, Bulgarian, Czech Republic, Denmark, France, Germany, Greece,
Hungary, Italy, Portugal, Romania and Norway. In the twelve countries involved (which

110
excludes the UK) one hundred households were monitored and questionnaires were
collected from five hundred households (De Almeida et al., 2008).
Measurements of the main household appliances were recorded at ten minutely intervals,
for a period of about two weeks. Due to the monitoring of lighting and air-conditioning
units, and due to holidays, summer months were avoided. Appliance measurements were
recorded with serial loggers, but due to the limited availability of loggers (five to ten loggers
per household) often groups of appliances were measured together. Spot measurements
of smaller appliances, that could not be monitored, were also recorded (De Almeida et al.,
2009). Standby power consumption was divided into two main power modes “off-standby”
and “active-standby” (includes the definitions of passive and active standby used by this
thesis). In addition to power monitoring, the project also investigated the hours of use per
day for the appliances, in the different power modes, to provide an insight into people‟s
behaviour. To further understand behaviour, the research used a questionnaire which
included both quantitative and qualitative questions (De Almeida et al., 2008).
Overall, REMODECE found that ICE appliances consumed 22% of the appliance and
lighting end-use (refrigeration accounted for 28% and lighting accounted for 18%).
Standby power from all appliances is reported as around 11% of total electricity
consumption in the REMODECE publishable report (De Almeida et al., 2008). However, a
revised analysis of the data suggests that around 9.4% of total electricity consumption was
from standby (De Almeida et al., 2009). This was most prevalent from ICE appliances,
which used around half their electricity consumption in standby. Figure 4-1 and Figure 4-2
present the range of annual electricity consumption for several ICE appliances. It can be
seen that televisions and desktop computers are the highest electricity consuming
appliances. Most of the differences between the minimum and maximum values in the
figures can be explained by households‟ different technologies and patterns of use (De
Almeida et al., 2008).

111
Figure 4-1 Annual electricity consumption range for entertainment appliances (De Almeida
et al., 2008 p45)
Figure 4-2 Annual electricity consumption range for ICT appliances (De Almeida et al., 2008
p45)

112
In respect to behaviour, the surveys suggest that households are more likely to turn off ICT
appliances than entertainment appliances. However, other ICT appliances, such as
routers and fax machines, remain on due to the fear that settings may be lost. On
average, around 40% of households do not turn off televisions on the device, preferring to
use the standby function. Hi-Fi systems were present in most households and generally
had significant standby consumption (De Almeida et al., 2008). User behaviour had a
significant impact on the electricity consumption from ICT appliances. In some cases
users leave computers on, when they are not in use, to avoid rebooting the computer or
because they have some tasks running. Respondents in Romania and Germany also
mentioned concerns about damaging the computer (De Almeida et al., 2008).
Interestingly, it was also found that most households do not turn off set-top boxes when
not in use (De Almeida et al., 2009).
Although the majority of the sample used power save functions, there appeared to be
misconceptions, as 50% of households thought that the activation of the screen saver
reduces electricity consumption and around 40% of the respondents had no knowledge
that appliances could consume electricity after being switching off. Furthermore, the use
of multiple sockets with a single switch (to help reduce standby consumption) was only
used by around 50% of the respondents. The survey suggests that the “most important
criteria for buying a new domestic appliance is the price, followed by the electricity
consumption, and by the ease of use” (De Almeida et al., 2008 p37). However, electricity
consumption may be an issue more relevant to cold and wet appliances, because it was
found that “knowledge about the energy star label is scarce among households, and it is
not a buying factor in most cases” (De Almeida et al., 2008 p35). The research also
suggests that the way in which households receive information about energy efficiency is
important to purchase decisions. The research concludes that:
The best information sources to spread information about electricity savings in the
residential sector seem to be TV announcements and written media, such as magazines
and newspapers. Comprehensive information campaigns are very important to increase
the household‟s awareness, for the proper selection and operation of appliances.
(De Almeida et al., 2008 p38).

113
Despite the surveys providing a degree of complementary data, it appears that, similar to
the Swedish Energy Agency study, the two datasets were not directly combined and the
research does not appear to have extensively delved into why certain actions taken by
householders existed. Thus, underlying behavioural factors (such as habit, attitudes,
beliefs etc) discussed in chapter 3, were not evident in REMODECE‟s final report.
When the questionnaire used by the survey is reviewed (REMODECE, 2008), it is
apparent that there is only limited investigation of ICE appliance behaviours and a very
limited potential to gain qualitative responses. Furthermore, although the majority of
respondents gave credible answers, some of the participants “were influenced by the
options presented, giving convenient answers that reward them as being “energy
consciousness” or having a “green” image” (De Almeida et al., 2008 p25). Also, questions
which investigated technical aspects of appliances or specific consumption had high
percentages of invalid responses. Thus, the questionnaire approach appears to have
been a more restricted means to gather detailed data in comparison to the qualitative
interviews used in other research.
An important aspect to this thesis is that the majority of studies presented in the literature
review chapters were undertaken overseas. Jeeninga and Huenges Wajer (1999) contend
that findings in one country cannot always be translated directly to another country.
Similarly, REMODECE found that although many of the behaviours were common in
different countries, there were large variations in the extent to which they occurred:
Generally speaking, Denmark and Eastern European countries (except CZ) present the
worst behaviour in what concerns leaving the entertainment equipment on the stand-by
mode, instead of turning it off with the button. This poor behaviour will have consequences
in the final electricity consumption of stand by loads of the households. Belgium and
Germany are the countries presenting the best behaviour when it comes to turning off the
devices with the switch when they are not being used.
(De Almeida et al., 2008 p29).

114
UK homes were not included in the REMODECE study and there is an obvious gap in
knowledge. Thus, a contemporary UK study to monitor ICE appliance use, and investigate
householder behaviour, can contribute to new understanding by identifying whether
findings from the research studies presented in the literature reviews are also relevant to
UK households.
4.3 The argument for inter-disciplinary research
Chapters 2 and 3 have highlighted that, traditionally, technical and social science energy
research has taken a mono-disciplinary approach. Similarly, within the social sciences,
internal and external factors for energy consumption have often been investigated
separately. Increasingly, scholars from the physical sciences, psychology and sociology
are calling for a more integrated approach to energy research. The call for inter-
disciplinary research is evident across two fronts. Firstly, as indicated through section
3.5.7, a number of leading environmental psychologists now advocate the inclusion of
contextual factors into energy research (Uzzell and Räthzel, 2009; Steg and Vlek, 2009;
Abrahamse et al., 2005; Stern, 2000). For example, in a discussion of future research
Steg (2008) states that the influence of internal and contextual factors:
...implies that interdisciplinary approaches are needed to get a full understanding of energy
use, the factors influencing it and ways to reduce it. Most studies to date have followed a
monodisciplinary approach, and provide a limited view at most as they consider only a
selective set of factors influencing energy use and energy conservation.
(Steg, 2008 p4451)
In addition to an inter-disciplinary approach, from within the social sciences, both
psychologists and sociologists point towards socio-technical research. For instance, Steg
and Vlek state that, to avoid the inaccuracies of self-reported behaviour, it is “advisable to
measure actual behaviour whenever possible” (Steg and Vlek, 2009 p315). McDougall et
al. (1981) draw attention to research that “indicated major discrepancies between subjects‟
reports and interviewers‟ observations of conservation actions” (McDougall et al., 1981

115
p345). Abrahamse et al. (2005) advise that self-reported behaviours may also be
influenced by social desirability and highlight that the inclusion of technical work can
identify high impact behaviours and help translate household energy behaviour into its
environmental impact (e.g. in terms of energy consumption and CO2 emissions). Similarly,
sociologists, such as Crosbie (2006), contend that:
...energy monitoring studies offer the potential to provide valuable insights into which daily
household energy consuming activities might be most influenced by social and cultural
factors, and where energy saving initiatives should be focused to have the greatest impact.
(Crosbie, 2006 p741)
Thus, for many scholars inter-disciplinary energy research is required, as these “studies
allow us to get a broader and more comprehensive view of the issues involved and of
successful ways to reduce household energy use” (Steg, 2008 p4452).
4.4 Literature review summary
The literature review chapters have established that there are gaps in existing knowledge
concerning: (i) the “real world” electricity consumption from the use of ICE appliances in
UK homes; (ii) underlying behavioural factors that influence ICE appliance electricity
consumption in UK homes. This is due to current understanding largely being derived
from modelling, self-reported surveys and non-UK based studies.
Literature from psychology, sociology and socio-technical research has highlighted a
variety of factors that can influence energy behaviour. However, there are still gaps in
knowledge regarding the underlying reasons for variations in UK household energy
consumption and particularly in respect to ICE appliance use.
From the psychological perspective, there has been limited research that specifically
focuses on ICE appliance behaviour and from the sociological perspective research has
often been based upon participants‟ perceived patterns of use rather than the direct
measurement of usage patterns. Existing socio-technical research has often excluded key

116
appliance types or not directly linked electricity consumption measurements to the social
element of the studies. Although non-UK based studies, such as REMODECE, have
identified reasons for particular behaviours they have not extensively delved into why such
actions occur. As a result the review identified the following key research issues:
1. Socio-technical research that combines appliance monitoring techniques with a
social science investigation of behaviour provides a more integrated and
meaningful way to explore household energy consumption. In addition to the
collection of electricity consumption measurements, social science data founded on
accurate objective measurement of patterns of use provides a more robust
approach to behaviour research;
2. Due to previous socio-technical energy studies largely collecting technical and
social data independently, the development and application of an integrated
methodology can also contribute to new understanding in the wider field of socio-
technical research;
3. Social science theoretical models can be used as heuristic frameworks to help
conceptualise and structure behaviour investigations. The use of an inter-
disciplinary social science framework, that includes both internal and external
influences on behaviour, may allow a more comprehensive means to explore
household ICE appliance use;
4. Qualitative interviews appear to facilitate a more detailed understanding of why
patterns of energy consumption occur, in comparison to the use of quantitative or
qualitative questionnaires.
Thus, it can be argued that new knowledge can be gained from a contemporary UK study
to collect detailed ICE appliance monitoring measurements that is integrated with the
collection of qualitative data to investigate the factors that influence the patterns of
behaviour recorded. To assist in the exploration of behavioural factors, the literature
review established that Triandis‟ (1977) TIB and Rogers‟ (2003) DIT were two particularly
relevant theories to help explore internal and external determinants of ICE appliance use.

117
The TIB has received little use in energy or environmental research and its inclusion in this
study adds a further degree of originality to this thesis.
4.5 Research questions
Based on the main aim and objectives of this thesis, and the results of a literature review,
the following research questions were developed.
1. To what extent does the ICE appliance end-use contribute to overall household
electricity consumption in a sample of UK households?
2. To what extent do different ICE appliances contribute to household electricity
consumption in a sample of UK households?
The review of literature identified that ICE appliances operate in a number of different
power modes. Therefore, the research also seeks to answer:
3. To what extent do the different appliance power modes contribute to household
electricity consumption in a sample of UK households?
4. What variations in patterns of ICE appliance electricity consumption exist in a
sample of UK households?
In order to explore the reasons for patterns of household ICE appliance electricity
consumption, two key aspects of householder behaviour were identified for investigation:
(i) appliance use; (ii) appliance ownership. This led to the following two research
questions:
5. What factors influence UK householders‟ patterns of ICE appliance use?
6. What factors influence UK householders‟ decisions to adopt ICE appliances and
technologies?

118
Two theoretical frameworks were identified to help focus the exploration of households‟
patterns of ICE appliance use and adoption decisions: (i) Triandis‟ (1977) Theory of
Interpersonal Behaviour; (ii) Rogers‟ (2003) Diffusion of Innovations Theory. This led to
the following research question:
7. Do the Theory of Interpersonal Behaviour and Diffusion of Innovations Theory
provide suitable frameworks for the investigation of ICE appliance behaviours?
A key motivation for undertaking this research study was to inform policy aimed at
reducing CO2 emissions from the ICE appliance end-use. This led to the final research
question:
8. What policy recommendations can be ascertained from the research findings?

119
Chapter 5. Research methodology
5.1 Introduction
This chapter outlines the methodology applied to this study to meet the aims of this thesis
and answer the research questions presented in chapter 4. This chapter begins with a
description of the underlying philosophical assumptions that influence the research
methodology (section 5.2). The research design and the research methods are then
described (sections 5.3 and 5.4). A description of the methods used for the collection and
analysis of the ICE appliance monitoring data is presented (sections 5.5 and 5.6). This is
followed by a description of the methods used for the collection and analysis of qualitative
data (sections 5.7 and 5.8) and the rationale for the collection of socio-demographic data
is outlined (section 5.9). Finally, a brief chapter summary is presented (section 5.10).
5.2 Philosophy of „real world‟ research
The research methodology can be understood as the overarching framework that guides
the process of research. When conducting “real world” research the development of the
research methodology is influenced by the philosophical assumptions concerning reality
(Gray, 2004). Philosophical assumptions relate to: (i) ontology – the nature of reality and
existence; (ii) epistemology – the limit to which reality can be known and what it means to
know (Creswell and Plano Clark, 2007). These assumptions fundamentally shape the
philosophical worldview of research and the process of inquiry (Gray, 2004).
An ontological perspective has historically dominated Western philosophy, where reality is
viewed “as being composed of clearly formed entities with identifiable properties” (Gray,
2004 p17). This view of a stable reality, with unchanging outcomes, contends that
symbols and language are accepted as clear representations of the real world. A
postmodern epistemological perspective has challenged this view by taking into account
processes of change and the notion that the extent to which reality can be known is limited
(Gray, 2004). Ontological and epistemological perspectives have led to the formation of
distinct paradigms towards academic research (Cresswell, 2007).

120
For instance, positivism is aligned to the traditional ontological perspective where reality
consists of what can be experienced by the senses and can be measured through direct
scientific observation and scientific inquiry (Gray, 2004). However, positivism has received
criticism from many social scientists for failing to provide a wider representation of reality
and for a tendency to present results as facts (Gray, 2004). Although the post-positivist
paradigm recognises many of these criticisms, many scholars have argued that positivist
paradigms can only provide limited understanding of social phenomenon. Thus, many
social researchers align themselves to constructivism, which contends that reality is
socially constructed and the notion of an objective reality that can be known is rejected
(Robson, 2002; Gray, 2004). The understanding or meaning of phenomena is formed
through research participants and their subjective views, and participants are viewed as
helping to construct the reality with the researcher (Creswell and Plano Clark, 2007;
Robson, 2002). However, positivists argue that such research lacks the objectivity
necessary to test a hypothesis without a degree of bias (Creswell and Plano Clark, 2007).
Pragmatism diverts away from the traditional connection between the researcher‟s
philosophical worldview and the choice of methodology, by focusing on the consequences
of the research and the selection of a methodology that is most suited to the research
questions. Thus, pragmatism offers a theoretical philosophy that supports the use of a
variety of research methods. Consequently, it has been closely associated with mixed
methods research, which combines both qualitative and quantitative research techniques
(Creswell and Plano Clark, 2007). Bergman warns that although many mixed methods
texts encourage researchers to be pragmatic, “pragmatism is difficult to apply as an
antidote to incompatibility” (Bergman, 2008 p12). In other words, pragmatism should not
be seen as a means to justify a vague, and methodologically unsatisfactory “anything
goes” approach to research.
Although this thesis takes a pragmatic perspective, the philosophical assumptions
underlying this study reflect two distinct paradigms. The collection of quantitative data (i.e.
ICE appliance electricity consumption measurements) reflects an ontology and
epistemology that is aligned with the post-positivist paradigm. Reality is viewed as
objective and independent of the researcher, although it is appreciated that the research is

121
restricted by limits in experimental control (e.g. participants may alter their behaviour
during the monitoring period and monitoring equipment may introduce a degree of error).
For the qualitative interviews, the reality is not independent, due to the participation of the
researcher in the data collection process. Responses from participants are viewed as
subjective and context dependent. Unlike a fundamental constructivist perspective (which
contends that responses cannot be considered as an accurate representation of a
participant‟s inner reality), this thesis considers qualitative responses to be representative
of participants‟ attitudes, beliefs and such like. Thus, this element of this research is
situated between the post-positivist and constructivist paradigms. Ontologically and
epistemologically, this “middle ground” approach follows work by Wall (2006) and Reeves
(2009) who both contend that although no research method can provide direct access to
participants‟ mental states, the responses gained from participants provide a useful means
(and arguably the only available means) to explore participants actions in the real world.
Therefore, this thesis views participant responses as realistic language (e.g. I refrain from
using standby because of my environmental beliefs), whilst recognising a degree of
uncertainty that they are truly representative of reality.
The socio-technical approach applied by this thesis is a reflection of the pragmatic
research philosophy. Socio-technical research combines the collection of technical data
(e.g. energy consumption) and social data (e.g. interview or questionnaire responses) and
spans the physical and social sciences. In contrast, inter-disciplinary research can remain
in the distinct domains of the physical or social sciences. For instance, combining aspects
of psychology and sociology can be considered as inter-disciplinary, within the boundaries
of the social sciences, but without the inclusion of a technical component, it cannot be
considered as socio-technical. The range of cross-disciplinary elements inherent to this
thesis are summarised in Table 5-1.

122
Table 5-1 Summary of the cross-disciplinary nature of this thesis
Cross-disciplinary themes
Description
Pragmatism This thesis‟ research paradigm includes perspectives from post-positivism and constructivism.
Socio-technical This thesis uses methods from the physical sciences and social sciences to collect: (i) technical data to quantify the electricity consumption of ICE appliances and patterns of use; (ii) “social” data to explore the behavioural factors that affect the measurements recorded.
Inter-disciplinary This thesis uses approaches from the physical sciences, psychology and sociology. The inter-disciplinary work includes: (i) combining research methods from the physical and social sciences (i.e. socio-technical); (ii) combining perspectives from psychology and sociology to investigate both internal and external factors that influence household behaviour.
Mixed methods approach
Includes the collection of both quantitative and qualitative data.
5.3 Research design: a mixed methods approach
The research design refers to “the plan of action that links the philosophical assumptions
to specific methods” (Creswell and Plano Clark, 2007 p4). Research methods are the
techniques used to collect and analyse data (Silverman, 2006). Crosbie (2006) provides a
review of the main research methods that have been used in household energy research,
which are summarised in Table 5-2. Energy monitoring provides the only method to
accurately record patterns of electricity consumption, free from the influence of self-report
bias (Lopes et al., 1997; Crosbie, 2006). Thus, conducting whole house and ICE
appliance level energy monitoring was a method fundamentally required to help answer
this study‟s research questions. However, energy monitoring does not provide the data
necessary to explore why people undertake energy consuming behaviours (Crosbie,
2006). Therefore, a number of additional research methods were considered to
investigate the factors that influence patterns of household electricity consumption.

123
Table 5-2 Summary of main research methods used in household energy research
Method Description
Energy monitoring
Energy monitoring generates quantitative data based on actual energy use to better understand patterns of energy consumption. Unless combined with other research methods this approach provides no information to explore why people undertake energy consuming behaviours (Crosbie, 2006).
Self-reported surveys
Largely used to generate quantitative data from large randomly selected samples that are suitable for statistical analysis (Creswell and Plano Clark, 2007). Standardised closed questions are usually used to gain descriptive data (e.g. distribution of characteristics such as socio-demographics) or interpretive data (e.g. explanations of phenomena and correlations). Provides a rapid and economic means to gain data representative of large populations. However, threats to validity include low response rates, misunderstandings of survey questions and susceptibility to self-report bias (Robson, 2002). The closed question format restricts the deeper exploration of why respondents undertake energy consuming behaviours (Crosbie, 2006).
Administered surveys
Similar to self-reported surveys, this method is largely used to collect quantitative data through standardised closed questions (Robson, 2002). Advantages of this approach are that the interviewer can clarify questions (i.e. reduce misunderstandings) and encourage interviewee participation and involvement (Robson, 2002). However, data can be affected by interviewer bias and the loss of anonymity can result in participants being less open (Robson, 2002). The closed question format also restricts the deeper exploration of why respondents undertake energy consuming behaviours and is susceptible to self-report bias (Crosbie, 2006).
Structured interviews
This method is very similar to administrated surveys (Robson, 2002; Crosbie, 2006). However, open-ended questions can be used to collect qualitative data, which must be captured by the interviewer word for word. Sample sizes are usually small (due to time and economic constraints), which reduces the representativeness of the sample (Robson, 2002). The largely closed question and structured format restricts the deeper exploration of why respondents undertake energy consuming behaviours and is susceptible to self-report bias (Crosbie, 2006).
Unstructured interviews
This approach uses non-standardised, open-ended questions to generate qualitative data (Robson, 2002). Sample sizes are small (due to time and economic constraints), but offers the greatest opportunity to use probing questions to uncover, in depth, why participants undertake energy consuming behaviours (Crosbie, 2006). This method is susceptible to self-report bias and is difficult for the novice (Robson, 2002; Crosbie, 2006).
Semi-structured interviews
This method uses open-ended questions to generate qualitative data and sits between structured and unstructured interview methods (Crosbie, 2006). Uses an interview schedule to ensure that responses are gained to answer the overarching research questions (Robson, 2002), but allows the flexibility to use probing questions to explore deeper issues as they are raised (Crosbie, 2006). Sample sizes are small and susceptible to self-report bias (Crosbie, 2006).
Focus groups
Provides and efficient means to generate large amounts of qualitative data from a group of people, at the same time (Robson, 2002). This method can provide information concerning why participants undertake energy consuming behaviours (Crosbie, 2006). However, it is difficult to follow up individuals‟ views and group dynamics can affect individuals‟ contribution (Robson, 2002). Sample sizes are generally small and susceptible to self-report bias (Crosbie, 2006).

124
Self-reported and administered surveys have been used widely in energy research to
investigate statistical relationships between energy consumption, socio-demographic
variables and lifestyle and technical factors (Crosbie, 2006). Environmental psychologists
have also frequently used quantitative data collected via surveys to investigate the
determinants of behaviour through statistical analysis (Jackson, 2005). However, due to
survey methods largely employing closed questions, it is difficult to uncover “the reasons
why different groups consume different amounts of energy” (Crosbie, 2006 p747-748).
Although surveys can include open-ended questions “it is likely to be an inefficient and
ineffective procedure, taking a great deal of time to analyse” (Robson, 2002 p234).
Therefore, qualitative methods of data collection are more suited to the generation of the
in-depth data necessary to explore factors that influence different levels of household
energy consumption (Crosbie, 2006). Focus groups can provide a highly efficient method
to collect qualitative data, because data are collected from several people at the same
time and there is the opportunity to listen and observe people as they share and compare
their experiences (Robson, 2002; Crosbie, 2006). However, for this thesis the use of focus
groups would have restricted the researcher‟s ability to probe the specific details of each
household‟s monitoring results due to each household having unique patterns of ICE
appliance use and ownership. In addition, it would have been impossible to retain
households‟ confidentiality.
Crosbie (2006) contends that in-depth interviews provide the greatest opportunity to ask
probing questions when compared to other data collection methods. She argues that:
...in-depth interviews can be used to uncover the reasons why research respondents make
particular energy consuming decisions and the constraints and opportunities which shape
those decisions.
(Crosbie, 2006 p747)
Robson (2002) describes three main types of interview methods: (i) structured interviews;
(ii) unstructured interviews; (iii) semi-structured interviews. Structured interviews are very

125
similar to administered surveys, because the closed question format restricts the focus of
the interview (Crosbie, 2006). In contrast, unstructured interviews provide a non-
standardised, open-ended and in-depth means to collect data. Interviewees are
encouraged to talk freely, in their own terms, about the research topic and the researcher
is able to delve into issues as they arise (Robson, 2002). However, when data concerning
specific details are required, the free flowing nature of unstructured interviews can result in
specific aims of the research not being covered (Robson, 2002).
The semi-structured interview sits in the middle ground. Robson (2002) refers to
interviewers bringing a “shopping list” of topics to the semi-structured interview to ensure
that the responses necessary to answer the research questions are collected. The
researcher focuses the interview through the use of an interview schedule, which details
specific topics and questions to be discussed. However, the interview schedule is less
restrictive than for a structured interview and the researcher has more freedom to delve
into issues as and when they arise. Irrelevant questions, to specific interviewees, can also
be omitted or additional ones can be included. This “tailoring” of the questions allows
unexpected and interesting issues raised by interviewees to be pursued in more detail
(Robson. 2002; Silverman, 2006).
For this thesis, the semi-structured interview was the most suitable method. This was due
to two main factors: (i) the presentation of results from the appliance monitoring was an
intrinsic part of the interview and this unavoidably required a degree of structure; (ii) the
need to ask “why” patterns of energy consumption occurred required a degree of flexibility
in the interview process. A further influence was the researcher‟s existing level of
experience. Although, the researcher had some previous experience of conducting
interviews, the interview schedule provided a useful “safety net” to help manage the overall
interview process and ensure that the data generated from the interviews helped to
answer the research questions.
Table 5-3 shows how this thesis‟ research questions have guided the research design to
generate both quantitative and qualitative data.

126
Table 5-3 Data required for the thesis research questions
Research questions Research method
Data Reason for use of research method
Q1. To what extent does the ICE appliance end-use contribute to overall household electricity consumption in a sample of UK households?
Electricity consumption monitoring (technical)
Quantitative To collect technical data to accurately and objectively measure households‟ ICE appliance and whole house electricity consumption
Q2. To what extent do different ICE appliances contribute to household electricity consumption in a sample of UK households?
Electricity consumption monitoring (technical)
Quantitative As above
Q3. To what extent do the different appliance power modes contribute to household electricity consumption in a sample of UK households?
Electricity consumption monitoring (technical)
Quantitative As above and to accurately and objectively measure electricity consumption from the different appliance power modes
Q4. What variations in patterns of ICE appliance electricity consumption exist in a sample of UK households?
Electricity consumption monitoring (technical)
Quantitative To collect technical data to accurately and objectively record households‟ patterns of ICE appliance electricity consumption in the different power modes
Q5. What factors influence UK householders‟ patterns of ICE appliance use?
Interviews (social)
Qualitative To explore the factors that influenced households‟ operational use of appliances
Q6. What factors influence UK householders‟ decisions to adopt ICE appliances and technologies?
Interviews (social)
Qualitative To explore the factors that influenced households‟ decisions to adopt ICE appliances
Q7. Do the TIB and DIT provide useful frameworks for the investigation of ICE appliance behaviours?
Study evaluation
Q8. What policy recommendations can be ascertained from the research findings?
Study evaluation
Investigations that combine the collection of quantitative and qualitative data are
commonly known as mixed methods studies. Although mixed methods research has its
origins in the 1950s, it is still regarded as a relatively new research approach and has only
gained distinct recognition over the past 15 years (Creswell and Plano Clark, 2007).

127
Therefore, mixed methods research has received relatively limited use in the field of
household energy research (Crosbie, 2006). However, a prerequisite for any mixed
methods study is that the combination of quantitative and qualitative methods must provide
a better understanding of the research problem than if the approaches were conducted
independently (Creswell and Plano Clark, 2007; Tashakkori and Teddlie, 1998; Bergman,
2008).
There are a variety of mixed methods designs to structure research. Research can involve
the collection of data from a series of multiple studies, within a larger programme of
enquiry, or through a single study, such as this thesis. The degree to which one type of
data dominates or is mixed within a study can also vary. For instance, qualitative interview
data can be used to help focus the subsequent collection of quantitative data through a
questionnaire (e.g. Moreau and Wilbrin, 2005) or quantitative data can be used to identify
particular phenomenon that can subsequently be explored in more detail through
qualitative data collection (e.g. Wall and Crosbie, 2009). Figure 5-1 below provides a brief
overview of key mixed methods designs (Creswell and Plano Clark, 2007).

128
Figure 5-1 The main mixed methods designs (from Creswell and Plano Clark, 2007)
For this thesis, the overall design is considered to be more closely aligned to the
Explanatory Design. However, the aim of this thesis was to adopt a balanced
methodological approach towards the technical and social components and avoid the
common occurrence of social sciences being treated as an “add-on” (Owens and Driffill,
2008). This is reflected in comments by Crosbie who contends:
If we are to begin to understand the complex socio-cultural nature of household energy
consuming practices we can not merely tack some qualitative interviews or focus groups

129
on to the end of quantitative research strategies; rather, they must be central to the
research perspective taken.
(Crosbie, 2006 p749)
Thus, understanding the factors that influence ICE appliance electricity consumption is
considered as important as quantifying the electricity consumption. The qualitative data
supports the quantitative data, by investigating the reasons for the electricity consumption
measurements recorded, and likewise, the patterns of ICE appliance use recorded support
the qualitative data, by providing an accurate record of household behaviour. This aspect
of the research design echoes the Triangulation Design, because an equal emphasis is
given to both of the data types. Therefore, this thesis‟ research design may better fit the
notation QUAN → QUAL. The research design is illustrated in Figure 5-2.
Figure 5-2 Thesis research design

130
5.4 Research methods
As presented in the previous section, quantitative data were collected through the use of
electricity monitoring equipment to measure a sample of UK households‟ ICE appliance
and whole house electricity consumption. Qualitative data were collected through semi-
structured household interviews to explore the factors and underlying motivations that
affected the patterns of electricity consumption recorded. The methods of data collection
and analysis applied to the electricity consumption monitoring are outlined in sections 5.5
and 5.6. The methods used for the household interviews are outlined in sections 5.7 and
5.8.
5.4.1 Ethics
The ethical issues relating to this thesis fundamentally concern the households that
participated in this research. In line with De Montfort University policy, all individual
research participants were informed prior to the involvement in the study (both at the
monitoring and interview stages) that any research outputs would ensure their complete
anonymity and that they could withdraw from the study at any time. All personal data were
kept confidential and stored securely at De Montfort University.
5.4.2 Validity
Validity can be understood as the truthfulness of research findings. To ensure that
research findings are valid, the research design must seek to address issues of validity
during the collection and analysis of data (Silverman, 2006). The threats to validity and
the methods applied to avoid them are described for each method of quantitative and
qualitative data collection and analysis in sections 5.6.4 and 5.8.2. For this thesis, a clear
advantage of the mixed methods design is that the quantitative data captures actual
patterns of behaviour and avoids many of the issues of validity otherwise inherent in self-
reports of ICE appliance use (Crosbie, 2006). Conversely, the dialogue with participants
provided the opportunity to address issues of validity concerning the electricity
measurements recorded (e.g. concerns regarding the differentiation of particular standby
power modes could be resolved). This aspect of the research design echoes the widely
used “triangulation” research strategy, which uses either multiple sources of data
collection, a combination of research methods or different theories to improve the rigour of

131
research and counter threats to validity (Gray, 2004; Robson, 2002). To a degree, this
reasoning motivated the mixed methods approach used in this thesis. However, the
different research methods were applied to answer distinct research questions. Therefore,
the research design was not triangulation by definition – “checking the results of a
qualitative method with those of a quantitative method (or vice versa)” (Robson, 2002
p372) – but was a mixed methods design using complementary research methods.
5.4.3 Generalisation of the results and sampling approach
Initially, this thesis intended to collect electricity consumption measurements from around
fifty households and conduct interviews from a selection of around twenty households from
the sample. As the research proceeded the monitoring sample was reduced to twenty
households due to technical difficulties, the workload involved and the conviction that the
research design should be applied consistently across the sample (each household being
monitored and interviewed). However, the sample was reduced further due to continued
difficulties with the monitoring equipment and time constraints. Thus, this thesis consists
of an in-depth study of fourteen UK households‟ ICE appliance electricity consumption.
5.4.3.1 Limits to the generalisation of the results
Given that this research seeks to improve understanding of UK domestic ICE appliance
electricity consumption, and provide recommendations to inform policy, the small sample
size raises the question of whether the findings from this research can be generalised to
the wider UK population. The generalisation of results relates to the external validity of the
research and is a standard aim for most quantitative research studies. This is usually
achieved by statistical sampling procedures, which allows the degree of
representativeness of a sample to be checked and broader inferences about a larger
population to be made (Robson, 2002). To achieve this, a large sample size is required to
reduce bias and capture representative characteristics of a larger population (Silverman,
2006).
Both electricity monitoring studies and qualitative studies (irrespective of a study
attempting to combine both research techniques) are faced with the difficulties in the
generation of results that can be generalised to larger populations. This is because the

132
methods of data collection and analysis are difficult to apply to a large sample. Collecting
household energy monitoring data “is a difficult, time-consuming and expensive process”
(Isaacs et al., 2006a p9) and “is usually not practical when a large sample size is targeted”
(Tso and Yau, 2003 p1680). Thus, most energy monitoring studies “can only involve small
population samples that are usually drawn from the same locale” (Lopes et al., 1997 p2).
This inevitably produces results that can be difficult to extrapolate to a larger population
(Lopes et al., 1997).
For example, despite the REMODECE project collecting electricity consumption
measurements from one hundred homes, in each of the twelve participating countries, the
project concedes that the “sample used for the monitoring campaign should not be
regarded as representative and statistical inference cannot be directly applied to
households” (Larsonneur, 2006 p7). Therefore, REMODECE highlights that the study was
more concerned with the identification of patterns of use, equipment efficiency and
behaviours that could reveal typical profiles and common electricity consumption
characteristics at the European level (Larsonneur, 2006). Similar issues are reflected in
the standby power study by Ross and Meier (2000). The research concluded that their
sample of ten homes:
...cannot provide definitive evidence of the magnitude of standby power consumption.
However, it can provide new insights to the scope of the problem and the opportunities for
reducing it.
(Ross and Meier, 2000 p6)
The constraint to the sample size is mirrored in the qualitative component of this thesis.
Representative sampling procedures are typically unavailable to qualitative researchers,
because larger sample sizes prevent the type of intensive analysis most commonly used in
qualitative research (Silverman, 2006). Therefore, the generalisation of results has been
the subject of much scientific debate between scholars from opposing philosophical
positions across a quantitative and qualitative divide (Kvale, 1994). Similar to those
involved in energy monitoring studies, scholars who support the use of qualitative methods

133
also argue that smaller, detailed research studies can provide new and valid insights. For
example, Gray (2004) contends that:
...just because a study does not find results that are capable of generalization does not
mean they have no relevance. A small case study, for example, may produce findings that
are interesting and possibly indicative of trends worthy of replication by further research.
And from a perspective-seeking view they may be seen as valid in their own right.
(Gray, 2004 p89)
Similarly, Crosbie (2006) cites Wilk and Wilhite (1986) who argue that qualitative methods:
...yield finely grained and detailed information that cannot be obtained through
questionnaires, and they often provide unexpected insights and lead to productive new
lines of inquiry.
(Wilk and Wilhite, 1986 p52: cited by Crosbie, 2006 p740)
Thus, despite the small sample size it is believed that the results from this thesis can
contribute to current understanding of ICE appliance electricity consumption in the UK.
Overall, the practical constraints, inherent to domestic electricity consumption monitoring
and the use of qualitative research methods, directed this study to concentrate on a
smaller sample size. This smaller sample size dictates that the results gained from this
thesis cannot be generalised to the wider UK population. However, the quantitative data
provides the opportunity (in a field significantly deficient in real world consumption data) to
examine actual ICE appliance electricity consumption in the UK and compare real world
measurements against current estimates and similar research. Likewise, the qualitative
data has the potential to identify underlying motivations for new patterns of domestic
electricity consumption. As a result, it is believed that the findings from this research could
inform future research and in due course could help to inform policies to reduce domestic
ICE appliance electricity consumption.

134
5.4.3.2 Sampling approach
A range of research methods literature assert that the most valid means to gain
representative data is through the use of probability sampling and in particular random
sampling (Creswell and Plano Clark, 2007; Silverman, 2006; Robson, 2002; Wheater and
Cook, 2000; Tashakkori and Teddlie, 1998; Henry, 1990). Methods of probability sampling
allow the probability that a participant will be included in a sample to be specified and thus
the potential for sample bias to be assessed (Robson, 2002).
For this thesis, random sampling was considered to be unwarranted for a number of
reasons. Although the sample size restricted representativeness, the research aimed to
gain a variety of household types to explore a more diverse range of patterns of use. An
issue with the random selection of a small sample is that very similar participants can be
randomly selected (Robson, 2002).
Of particular significance to this study, was the consideration of practical issues. The
monetary value of the monitoring equipment meant that it was essential to ensure that
“trustworthy” households were recruited. Also, it became evident during early trials that
the monitoring equipment might require field adjustments. Thus, it was necessary to
ensure that participants would be willing to provide repeated access, particular at the early
stages of the monitoring phase.
As a result a more purposive approach was sought to help incorporate a range of
household types into this study, and allow practical considerations to be addressed.
Purposive sampling can be described as a sampling approach where “the researcher
deliberately selects the subjects against one or more trait to give what is believed to be a
representative sample” (Gray, 2004 p87). The disadvantage of this approach is that the
researcher may inadvertently neglect a significant population trait or characteristic, or may
be subconsciously biased during the sample selection (Gray, 2004). Despite this
disadvantage purposive sampling can be found in many energy research studies. For
example, a number of studies have used samples comprised of work colleagues or
acquaintances (Meier et al., 2004; Røpke et al., 2010; Wall and Crosbie, 2009; Kofod,
2008).

135
Silverman (2006) argues that purposive sampling can be a useful method to improve the
generalisation of research within a small sample size. However, he states that “this does
not provide a simple approval of any case we happen to choose” (Silverman, 2006 p306).
Thus, it is necessary to think “critically about the parameters of the population we are
interested in” (Silverman, 2006 p306). Therefore, this thesis faced the position of
attempting to generate a relatively diverse sample whilst balancing practical considerations
and the need to reduce the potential for the researcher‟s subjectivity to bias the sample
selection.
The sampling strategy chosen for this thesis was snowball sampling, which is considered
to be a distinct form of purposive sampling (Henry, 1990; Robson, 2002). Snowball
sampling relies on the researcher to select an initial participant /participants, who in turn
identify other potential participants in the population. As previously identified participants
name other participants, the sample develops like a snowball (Henry, 1990). Wall and
Crosbie (2009) highlight that for “exploratory research with a qualitative component,
snowball sampling offers practical advantages, not least the ability to quickly recruit
participants at a low cost” (Wall and Crosbie, 2009 p2). Such advantages have led other
energy studies to also use snowball sampling, such as the Hungarian constituent of the
REMODECE project (Kofod, 2008).
For this research, snowball sampling offered a number of practical benefits. Firstly, due to
the process of participant identification being, to an extent, out of the control of the
researcher, it was possible to remove a degree of the researcher‟s subjectivity. Secondly,
it reduced the time and financial constraints associated with other sample selection
methods. Thirdly, by recruiting initial participants from within the researcher‟s
acquaintances, it was also possible to minimise potential dwelling access problems.
Issues of security (e.g. the monitoring equipment, the researcher‟s wellbeing) were also
mitigated due to the good faith between participants throughout the participant chain.

136
5.4.3.3 Sampling procedures
A disadvantage of snowball sampling is that a degree of homogeny can be formed within
the sample, due to participants often nominating members of the population from a similar
social demographic or worldview. To reduce homogeny, participants were asked to
nominate potential households that had different characteristics to their own. To aid
diversity within the sample, the following criteria were used as a means to guide the
selection process: (i) household type (see Table 5-4); (ii) stage of life (e.g. retired, working,
etc); (iii) gender; (iv) dwelling type (where possible). Household type was the primary
parameter and households were distinguished from one another with reference to basic
UK Office of National Statistics (ONS) classifications shown in Table 5-4 (ONS, 2009a).
Thus, the selection process aimed to gain a spread of these main household types.
Table 5-4 Household types
Household types
Married / cohabiting couple Lone parent
One person
Two or more unrelated adults
With dependent children only
With non-dependent children only
With no children
With dependent children
With no dependent children
Two or more families
Households were selected through a number of additional parameters: (i) households
must possess a relatively “typical” range of appliance types (e.g. at least one television);
(ii) the household must not be a secondary residence; (iii) the household must not be
exceptionally large (i.e. over 6 householders). Unlike some other energy studies (such as
the REMODECE project) households were not considered ineligible against other criteria,
such as households with relatively unusual appliances (household server) and homes
serving as offices. This decision was taken on reflection of arguments made by Isaacs et
al. (2006b) who contend that households with more extreme values of energy consumption
are “real cases that cannot be dismissed” (Isaacs et al., 2006b p10). In addition, it was
also believed that such subjectivity from the researcher would introduce a significant
degree of bias into the sampling process that would weaken the exploratory nature of the
study by removing households that may provide particularly interesting findings. Table 5-5
summarises how participants were contacted.

137
Table 5-5 Summary of participant selection process
Stage Description
Stage 1. Initial households were contacted directly by the researcher from his acquaintances.
Stage 2. The households were asked to identify other potential participant households at the appliance monitoring stage.
Stage 3. Potential households forwarded their contact details to the researcher via the previous participants.
Stage 4. The researcher contacted potential households to discuss the aims of the research, details of the monitoring and interview process and the general requirements of the study (e.g. the need to unplug appliances to fit the monitoring equipment). Participants were also asked about the general occupancy of their homes and their ICE appliance ownership.
Stage 5. Potential households were given the opportunity to consider whether to participate in the study and were contacted at a later date for confirmation and to arrange a suitable time for the monitoring (to ensure that no unusual occupancy patterns were likely to occur). All participants were also informed that they could withdraw from the study at any time.
5.4.4 Phases of the research
The use of a variety of research methods resulted in a number of distinct phases of the
research to be completed in preparation for the main data collection phase. These are
summarised in Table 5-6 below. Each phase of the research revealed particular issues
and challenges to be overcome and facilitated the development of the final procedures
used for the collection and analysis of the main study data. Each of the phases of research
will be described in more detail in subsequent sections or the appendices, but it is of value
to introduce a number of key issues that significantly influenced the progress of this thesis.
The appliance monitoring system was a pivotal aspect of this research and was received
in July 2007 having been calibrated by the manufacturers. Initial experimental tests of the
equipment identified a number of significant problems that made the equipment unfit for
the purpose of the study and the equipment was returned to the suppliers. Following the
identification of methods to mitigate these problems, tests were undertaken at domestic
sites, which identified further problems to be overcome. Technical difficulties persisted

138
during the pilot studies, and combined with the characteristics of the appliance monitoring
equipment, resulted in considerable work being undertaken to adapt the techniques used
to analyse the electricity consumption data. Thus, there was a significant delay between
the monitoring undertaken for the first pilot and the subsequent interview.
Table 5-6 also shows that calibration of the appliance monitoring equipment occurred in
2009. This appears to be an unusual time to conduct such an activity, but the reasoning
was based on a mixture of diligence and opportunism. As mentioned previously, the
monitoring equipment was calibrated by the manufacturer, prior to its delivery, and
supportive evidence of this was provided by the supplier. However, following software
updates to the equipment, tests were conducted prior to its return to the field. At this time
laboratory equipment had become available that could be used to assess the
measurement accuracy of the monitoring system. Therefore, the tests were combined
with a calibration procedure to confirm measurement accuracy.

139
Table 5-6 Summary of thesis research phases
Research phase Tasks Location Date undertaken Objective
Development of appliance electricity monitoring system
Controlled tests The IESD July 2007 to Aug 2007 To test the appliance monitoring equipment under “experimental” conditions.
Domestic test 1 IESD staff homes
Aug 2007 to Jan 2008 To test the appliance monitoring equipment under “domestic” conditions.
Domestic test 2 IESD staff homes
Feb 2008 Further tests of the monitoring equipment and the development of quantitative data analysis techniques.
Calibration 1 The IESD March 2008 To test software upgrade to appliance monitoring equipment and confirm the appliance monitoring equipment was measuring power electricity consumption accurately.
Calibration 2 The IESD May 2009 and June 2009
To confirm the appliance monitoring equipment was measuring low power electricity consumption accurately.
Development of interview schedule
The IESD Sept 2007 to Oct 2008 To prepare and structure key questions for interviews.
Pilot study 1 Participant‟s home (n=1)
Monitoring: Mar 2008; Interview Nov 2008
To test the methods of data collection and analysis in preparation for the main study.
Pilot study 2 Participant‟s home (n=1)
Monitoring: Aug 2008; Interview Nov 2008
To test the methods of data collection and analysis in preparation for the main study.
Main study Participants‟ homes (n=12)
Nov 2008 to Oct 2009 To collect data for final thesis.

140
5.5 Quantitative data collection: ICE appliance electricity consumption
monitoring
This section describes the collection and analysis of the quantitative data from the ICE
appliance electricity consumption monitoring. This was achieved through the installation of
two distinct types of electricity monitoring equipment at each site: (i) a current clamp
logger, to measure whole house electricity consumption; (ii) an appliance monitoring
system (AMS). Before describing the equipment, the rationale for the monitoring period
and the logging interval used in this thesis are outlined.
5.5.1 Monitoring period
The monitoring period is the overall time period that energy consumption data are
collected. A short monitoring period (e.g. a number of weeks) is more likely to be subject
to the effects of seasonal variation (e.g. households may watch television more often in
winter months) and unusual influences on occupancy (e.g. from unusual weather events,
school holidays, participants illness, etc). A long monitoring period (e.g. months to a year)
has the benefit of providing more representative measurements of consumption, but can
constrain the use of monitoring equipment (i.e. sample size) and result in unmanageable
amounts of data (Lopes et al., 1997).
For this thesis, a two week monitoring period was used. The two week duration was
considered to be sufficient for the exploratory nature of this research, as initial tests
identified that consistent patterns of consumption could be discerned from the data
recorded. Similar research also suggests that a two week monitoring period is sufficient
for appliance monitoring. For example, the REMODECE project also used a two week
monitoring period and extrapolated the results to produce yearly averages of ICE
appliance electricity consumption (De Almeida, 2009). However, it must be recognised
that annual estimates derived from short monitoring periods contain issues of validity
(Lopes et al., 1997) and the data recorded by this thesis are therefore considered as
“snapshots” of the households‟ electricity consumption.

141
5.5.2 Logging interval
The logging interval is the time period between the integrated energy consumption
measurements recorded. Lopes et al. contend that attention should be given to ensure
that the logging interval “is sufficiently short for the task in hand without generating
unwieldy quantities of data” (Lopes et al., 1997 p3). The authors recommend that
“between 5 to 10 minutes is sufficient to be able to analyse most appliance cycles” (Lopes
et al., 1997 p3). Previous appliance monitoring studies have often used 10 minutely
logging intervals (De Almeida, 2008; Bennich and Persson, 2006; Lebot et al. 1997; Sidler,
1998; ENERTECH, 2002), but for this thesis the monitoring equipment were set at five
minutely intervals to allow a more detailed record of electricity consumption to be gained.
5.5.3 ICE appliances monitored
Despite the AMS having the capacity to monitor twenty appliances there was a significant
likelihood that households would use more than twenty ICE appliances in their homes
(Marjanovic-Halburd, Coleman, Bruhns, Summerfield and Wright, 2008). To maintain a
consistent approach to the types of appliances monitored, priority was given to higher
energy consuming appliances (televisions, desktop computers and laptop computers).
Appliances that were reported to be used infrequently (e.g. stored in cupboards, on
shelves, in unused bedrooms, etc) would not be monitored at the expense of appliances
reported to be more regularly in use. This decision-making required consultation with
householders during the installation of the AMS.
Small portable battery powered ICE appliances, such as mobile telephones, portable
games consoles, and small portable radios were excluded from the monitoring for practical
reasons. Firstly, these smaller devises were considered less important in energy
consumption terms than larger appliances (e.g. televisions, STBs, computers, etc), and it
was envisaged that in some homes there could be four or more such devises (e.g. mobile
telephones). Thus, the monitoring of these devises would be at the expense of higher
electricity consuming appliances. Secondly, due to the characteristics of the AMS,
householders would have to remember to power or charge an appliance from a fixed
power point. It was anticipated that this may not always occur and could significantly
interfere with householders‟ use of other appliances. However, larger mobile technologies,

142
such as laptop computers, were included in this research based on the supposition that
householders would generally operate them from a single socket point. For the majority of
households this was the case (i.e. laptops were located in a fixed location similar to the
use of desktop computers). In the remaining households, participants charged laptops
from a fixed socket point during the monitoring period.
5.5.4 Elcomponent SPCmini current clamp logger
The households‟ whole house electricity consumption was monitored to determine the
amount of electricity consumed by individual and groups of ICE appliances, relative to total
household electricity consumption. The monitoring device used was a SPCmini single
channel current logger manufactured by Elcomponent Ltd. The SPCmini logger was
selected, because it provided a relatively low cost and simple means to gain accurate
whole house electricity consumption data. A more detailed description of the logger and
its installation is provided in Appendix A.
5.5.5 Appliance Monitoring System
ICE appliance electricity consumption measurements were recorded by an innovative
energy monitoring system that was originally developed for small businesses and domestic
dwellings. The AMS was developed by Digital Living Limited, a small UK business that
specialises in energy monitoring systems. The CaRB project purchased three sets of the
AMS (just prior to the commencement of this PhD) due to its unique characteristics, such
as its provision of a straightforward data management system allowing rapid data transfer
via the Internet.
The AMS consists of four distinct types of devices: (i) the Tridium JACE gateway; (ii)
twenty White Goods Monitors (WGM); (iii) the LON Converter; (iv) the GSM (Global
System for Mobile Communications) Modem.
Figure 5-3 below shows an overall schematic of the AMS. The JACE is the gateway
controller for the AMS and controls the overall transfer and storage of the electricity
consumption data. The JACE is connected to up to twenty WGMs; electricity consumption

143
loggers that can be placed into a three pin mains socket and allow an appliance to be
plugged into them. Electricity consumption measurements from the WGMs are transferred
to the JACE via the dwelling‟s ring mains. To facilitate the communication, a LON
Converter is used to process the LONWORKS signal. Each JACE is connected to a GSM
Modem, which was configured to transfer data each day (via a secure Virtual Private
Network (VPN)) to a central database server hosted by Digital Living. The data were
stored in a MySQL database and were accessible through a user interface via the Internet.
A more detailed description of the AMS is provided in Appendix A.
Figure 5-3 Schematic of the AMS (Digital Living, 2007)
As mentioned in section 5.4.4, the AMS underwent a series of tests prior to the main study
phase. These tests explored the general characteristics and accuracy of the AMS.
Furthermore, a number of problems were identified that required the further development
of the system. The results from the tests have been documented in detail in Appendix B
WGMs
LON converter
JACE Gateway
GSM Modem GSM network
(secure VPN)
IESD computer
Server
Power-Line Carrier communications – LONWORKS protocol
Internet MySQLdatabase

144
for a number of reasons. Firstly, the results provide evidence of the accuracy of the AMS.
Secondly, the experience gained during the development of the AMS may be of use to
future appliance research as it influenced the installation procedures and the subsequent
techniques used to analyse the data recorded. Furthermore, data from the tests provides
a useful means to highlight the AMS‟ key characteristics. A further aspect of the appliance
monitoring was work undertaken to ensure that the installation process was completed
safely, which are described in Appendix C.
5.5.6 AMS characteristics
Data from the AMS accuracy tests (described in Appendix B) were used to produce power
consumption profiles that demonstrate the characteristics of the system while measuring
different loads. Figure 5-4 below shows a comparison of the measurements recorded, on
the second day of the first test, by the AMS and the Hameg HM8115-2 power meter used
to gain reference values. Power values from the AMS data were calculated with equations
1, 2 and 3 presented in Appendix B.
Figure 5-4 Power consumption profile from Calibration 1
0.00
20.00
40.00
60.00
80.00
100.00
120.00
140.00
160.00
180.00
200.00
220.00
240.00
AMS
Hameg
Po
wer
(Watt
s)
Time (hh:mm)

145
Characteristic 1: 1Wh resolution
The WGMs record incremental measurements of electricity consumption at a 1 Wh
resolution. This characteristic contrasts with other electricity monitoring equipment, which
often measures power consumption or electricity currents. Table 5-7 shows data collected
from a STB with a load of around 12 W. This highlights that a minimum load of 12 W is
required in order for each five minutely timestamp to provide a 1 Wh measurement.
Table 5-7 Example data collected from a STB with an active load of around 12 W
Timestamp WGM Value (kWh) Logging interval (min) Energy (kWh)
30/06/2009 03:04 7.27400017 5 0.001
30/06/2009 03:09 7.2750001 5 0.001
30/06/2009 03:14 7.27600002 5 0.001
30/06/2009 03:19 7.27699995 5 0.001
30/06/2009 03:24 7.27799988 5 0.001
30/06/2009 03:29 7.27899981 5 0.001
30/06/2009 03:34 7.28000021 5 0.001
From Figure 5-4 it can be seen that the WGMs 1 Wh resolution can result in an uneven
distribution of energy consumption values to logging intervals. For example, Table 5-8
shows the data gained from the 30 W load. The 1 Wh resolution results in a regular
variation in the energy consumption value, which influences the average power
consumption calculated for the five minutely intervals. This produces the distinct peaks
and troughs in power consumption that can be seen for other loads in Figure 5-4. This
characteristic means that an individual interval cannot be considered as truly
representative of an appliance‟s power consumption. Thus, preceding and following
power values also have to be considered.

146
Table 5-8 AMS electricity consumption data for 30 W load
Time_Stamp WGM_Value Δ time (min) Energy (kWh) Power (W)
19/03/2008 11:06 0.93699998 5.00 0.002 24.00
19/03/2008 11:11 0.94000000 5.00 0.003 36.00
19/03/2008 11:16 0.94199997 5.00 0.002 24.00
19/03/2008 11:21 0.94499999 5.00 0.003 36.00
19/03/2008 11:26 0.94700003 5.00 0.002 24.00
19/03/2008 11:31 0.94999999 5.00 0.003 36.00
19/03/2008 11:36 0.95200002 5.00 0.002 24.00
19/03/2008 11:41 0.95499998 5.00 0.003 36.00
The 1 Wh resolution also has a significant influence on the analysis of the data for low
power modes. Table 5-9 shows the data collected from the second test for a load of
around 1 W. The zero measurements suggest that no electricity was being consumed
between 13:39 and 14:34 (i.e. it was turned off), whereas in reality electricity was being
consumed, but below the WGM‟s level of resolution. Similarly, the example suggests that
all the electricity consumption from the charger occurred between 14:34 and 14:39, rather
than over the preceding hour. Therefore, analytical techniques were required to
differentiate between a “hidden” zero value (i.e. when low power consumption was
occurring, but not visible) and a “true” zero value (i.e. when the appliance was actually off),
so that electricity consumption could be allocated to the correct power mode (discussed in
more detail in section 5.6).

147
Table 5-9 Example data collected from a charger with a load of around 1 W
Timestamp WGM Value (kWh) Logging interval (min) Energy (kWh)
02/06/2009 13:39 1.465999960
02/06/2009 13:44 1.465999960 5 0.0000
02/06/2009 13:49 1.465999960 5 0.0000
02/06/2009 13:54 1.465999960 5 0.0000
02/06/2009 13:59 1.465999960 5 0.0000
02/06/2009 14:04 1.465999960 5 0.0000
02/06/2009 14:09 1.465999960 5 0.0000
02/06/2009 14:14 1.465999960 5 0.0000
02/06/2009 14:19 1.465999960 5 0.0000
02/06/2009 14:24 1.465999960 5 0.0000
02/06/2009 14:29 1.465999960 5 0.0000
02/06/2009 14:34 1.465999960 5 0.0000
02/06/2009 14:39 1.467000010 5 0.0010
Characteristic 2: the five minutely interval
Another issue relates to measurements gained from consumption events beginning or
ending at varying stages of the five minute interval. The effect of this characteristic is that
energy consumed over only a portion of an interval is attributed to the entire interval. As a
result, the subsequent power value calculated is an underestimation of actual power
consumption. For example, Table 5-10 shows energy consumption data from the AMS,
where it can be seen that the final measurement‟s power value is derived from a load that
was actually in operation for approximately two minutes of the interval. Thus, the two
minutes of energy consumption, at a power of 60 W, has been averaged over the whole
five minutes, which produces the value of around 24 W. The implication of this
characteristic was that for appliances that operated in a number of power modes, energy
consumption could potentially be attributed to a low power mode when in fact the device is
in an active mode for a portion of a time interval.

148
Table 5-10 Example AMS data for the 60 W load
Time_Stamp WGM_Value Δ time (min) Energy (kWh) Power (W)
18/03/2008 12:05 17.47999954 5.05 0.005 59.40
18/03/2008 12:10 17.48500061 5.00 0.005 60.01
18/03/2008 12:15 17.48999977 5.00 0.005 59.99
18/03/2008 12:20 17.49200058 4.95 0.002 24.25
Figure 5-4 also shows that the duration periods recorded by the AMS often begin and end
after those inferred from the Hameg power meter data. This is caused by the AMS‟ five
minutely time interval, which can result in a temporal error of up to five minutes.
Characteristic 3: Inconsistent polling
The effects of characteristic 2 can be made worse in the event of inconsistent polling (i.e.
longer time intervals). This is a form of measurement error that is difficult to quantify as
such events occur randomly. Inconsistent polling, in combination with the 1 Wh resolution,
can also influence the power consumption values gained from the data. For instance, for
the 160 W load in Figure 5-4, it can be seen that there appears to be a distinct dip in
power consumption at 13:22, which is followed by a peak at 13:41. Table 5-11 shows that
inconsistent polling led to 1 Wh measurements being apportioned disproportionately to
each interval and a more extreme form of the under/over estimation of power consumption
described previously.
Table 5-11 Example AMS electricity consumption data for the 160 W load
Time_Stamp WGM_Value Δ time (min) Energy (kWh) Power (W)
19/03/2008 12:41 1.01100004 5.00 0.013 156.00
19/03/2008 12:46 1.02400005 5.00 0.013 156.00
19/03/2008 12:51 1.03799999 5.00 0.014 168.00
19/03/2008 12:56 1.05100000 5.00 0.013 156.00
19/03/2008 13:01 1.06400001 5.00 0.013 156.00
19/03/2008 13:06 1.07799995 5.00 0.014 168.00
19/03/2008 13:11 1.09099996 5.00 0.013 156.00
19/03/2008 13:16 1.10500002 5.00 0.014 168.00
19/03/2008 13:22 1.12000000 6.70 0.015 134.33
19/03/2008 13:41 1.17200005 18.30 0.052 170.49
19/03/2008 13:46 1.18499994 5.00 0.013 156.00
19/03/2008 13:51 1.19799995 5.05 0.013 154.46

149
In order to mitigate the effects of these characteristics data analysis techniques were
developed to apportion electricity consumption to the appropriate power mode.
5.6 Quantitative data processing and analysis
The processing and analysis of the quantitative data has been undertaken in Microsoft
Excel due to its proven capability to manage the type of data collected and the
researcher‟s familiarity with the software. The analysis of the data was conducted by
simply copying the processed data, for each appliance, into a pre-developed analysis
spreadsheet template. The prewritten formulae, within the cells of the spreadsheet,
automatically calculated key values of electricity consumption (e.g. total electricity
consumption, electricity consumption in the different standby power modes, minutes of use
etc) and produced charts and summary tables. This method enabled relatively rapid
analysis of the data, in order to conduct the interviews as quickly as possible after the
completion of the monitoring.
5.6.1 Data processing
5.6.1.1 AMS data
Data were exported from the Digital Living MySQL database into an Excel spreadsheet (in
text format). All the appliance data were contained within a single worksheet. Figure 5-5
shows that the data consisted of the following information: (i) WGM_ID – an identification
code for each WGM used; (ii) w_value – the incremental electricity consumption
measurements (in kWh); (iii) timestamp – the time the data were polled; (iv)
WGM_description – the appliance name entered into the MySQL database; (v)
DMU_Location – the location name entered into the MySQL database (a dwelling number
was used to ensure anonymity). Two additional data columns, which were irrelevant for
the DMU systems, produced the term NULL.

150
Figure 5-5 Example data exported from the MySQL database
The primary data necessary for analysis were the timestamp data, the w_value and the
WGM description. Therefore, the first stage of data processing was to remove the
irrelevant columns (WGM_ID, DMU_Location, RecID and wwww). The timestamp data
were then converted into a format that the Excel spreadsheet could recognise and the data
were filtered, so that each appliance had a separate individual worksheet (shown in Figure
5-6).
Figure 5-6 Example filtered data
The next stage of data processing was to identify and remove any obvious data error
values. Three new data columns were used to calculate: (i) Δt (the time interval between
each proceeding timestamp); (ii) the electricity consumption consumed during each
interval (kWh); (iii) the average power consumption measured over each interval. These
were calculated with equations 1, 2 and 3 presented in Appendix B.

151
During the data processing, it was apparent that erroneous electricity consumption was
measured in three of the households. Following discussions with the households it was
identified that in household 2 an electric razor was briefly used in a WGM designated for a
printer and in household 10 an electric heater was used in a WGM designated for an audio
system. For both of these cases the data were removed from the analysis. In household
3, two appliances were inadvertently connected to the wrong WGM on the last day of the
electricity monitoring. These electricity consumption measurements were transferred to
the appropriate appliance.
Due to inconsistent polling, on occasion very short time intervals (e.g. 1-3 minutes) that
registered a 1 Wh increment could result in an overly high power value being calculated.
During the development of the analysis spreadsheet, it was discovered that the removal of
short time intervals improved the interpretation of the data. However, this process
extended the preceding time interval. As a result this action was only conducted when the
short interval had occurred in the middle of a period when the appliance was operating
continuously in a particular power mode.
5.6.1.2 Whole house data
The data recorded by the current clamp loggers were transferred to a PC through the use
of the manufacturer‟s designated PowerPackPro software and a Bluetooth connection.
These data included time-stamped power measurements, which were exported into an
Excel spreadsheet and screened for potential errors. To assist in this process the total
energy consumption recorded was compared to electricity meter readings that were
recorded at the time of installation and removal of the current clamp logger.
For household 1, an incorrect timestamp was displayed next to each electricity
consumption measurement due to a problem with the internal clock settings of the PC
used to activate the logger. The timestamps were corrected to correspond to the period of
installation. For household 13, it was not possible to install the current clamp logger due to
access difficulties (the meter cables were concealed). Therefore, an estimate of the whole
house electricity consumption has been used based on meter readings recorded at the
dwelling. The first meter reading was recorded at 14:00 hours, on the day prior to the

152
beginning of the monitoring and the second meter reading was recorded at 13:42, on the
day following the end of the monitoring. Thus, an approximately fifteen day whole house
electricity consumption measurement was recorded. This measurement was used to
calculate an average daily electricity consumption value and derive an estimate for the
fourteen day monitoring period. Despite the potential for error, it is believed that a
reasonable estimate has been gained for the household. This is due to relatively
consistent daily patterns of occupancy being recorded at the household by the appliance
monitoring (both weekends and weekdays). Furthermore, a discussion with the
householders confirmed that no unusual electricity consumption events occurred during
the monitoring period and that occupancy patterns remained relatively constant throughout
the week.
5.6.2 Data analysis: Household level
As mentioned previously, the analysis of the electricity consumption data for each
household was undertaken in a predesigned Excel spreadsheet. Processed data were
simply copied into the analysis spreadsheet, which automatically calculated key values of
electricity consumption, for each appliance, and produced charts and summary tables.
This section describes the analysis spreadsheet, the techniques used to differentiate
between patterns of electricity consumption and the outputs gained.
5.6.2.1 Individual appliance analysis
The analysis spreadsheet used thirty-three separate worksheets constructed to analyse
individual appliance data. Each appliance worksheet was designated to one of four ICE
appliance categories, so that predesigned formulae in summary worksheets could
automatically calculate the electricity consumption from appliances that were used for
similar purposes. The four ICE appliance categories were:
1. Video appliances (e.g. televisions, STBs, VCRs, DVD players, games consoles,
etc);
2. Audio appliances (e.g. Hi-Fi equipment, radios, etc);
3. Computing appliances (e.g. desktop computers, laptops, printers, routers, etc);

153
4. Telephony appliances (e.g. cordless telephones, answer-phones).
Ten worksheets were designated for video appliances, six for audio appliances, thirteen
for computing appliances and four for telephony appliances to accommodate variations in
the households‟ appliance ownership (i.e. households often owned predominantly video or
computing appliances). Unused worksheets for the particular household were simply
deleted to allow the summary sheets formulae to function.
The time-stamped incremental electricity consumption data were organised into columns,
which allowed the energy consumption and power values to be calculated for each five
minutely interval. Additional moving average (for power consumption) and “truth gate”
columns were also created to help apportion electricity consumption to the different power
modes. Table 5-12 summarises the Excel formula used for the calculations and Figure 5-7
shows a screen shot of the data columns on an individual appliance worksheet (for an
LCD television).

154
Table 5-12 Summary of individual appliance analysis spreadsheet columns
Column Description Excel formula
A Processed timestamp data.
B Processed WGM incremental energy consumption measurement (kWh).
C Time interval (min). =(A3-A2)*24*60
D Electricity consumption (kWh). =B3-B2
E Average power (W). =(D3*1000)/(C3/60)
F Moving average: used to produce graphs to help to identify different power modes.
=AVERAGE(E2:E4)
G Active power mode; “truth gate”. =IF(AND(F3>$S$4,D3>0),TRUE,FALSE)
H Active standby power mode; “truth gate”.
=IF(AND(F3<$R$5,F3>$S$5,D3>0),TRUE,FALSE)
I Passive standby power mode; “truth gate”.
=IF(AND(F3<$R$6,F3>$S$6,D3>0),TRUE,FALSE)
J Off standby power mode; “truth gate”. =IF(AND(F3<$R$7,F3>$S$7,D3>0),TRUE,FALSE)
K Off (appliance switch off at the mains power supply)
=IF((D3=0),TRUE,FALSE)
L Unclassifiable standby: used when an appliance was known to be in a standby mode, but it was impossible to attribute it to a specific power mode.
In such cases, the word TRUE was simply entered in to the column cells.
M Day of the week. =TEXT(A3, "dddd")
N Hour of the day. =TEXT(A3, "hh")
O “Unknown” electricity consumption: used to identify periods of extensive missing data (i.e. long time intervals, above 20 minutes). For a number of appliances it was impossible to attribute electricity consumption to a specific power mode and all electricity consumption was allocated to the Unknown column.
=IF(C3>20,D3,0)

155
Figure 5-7 Data columns for an LCD television recorded in household 13

156
5.6.2.1.1 Moving average
The moving average column (shown in Figure 5-7) was used to produce charts to help
identify the electricity consumption attributable to different power modes. The moving
average mitigated the effects of the AMS‟s 1 Wh resolution by averaging the power
consumption values of cells before and after a given timestamp. Figure 5-8 shows a plot
of the unaltered average power consumption measurements for an LCD computer monitor
(from column E). Although a distinct pattern of power consumption from the active power
mode and the passive standby power mode is evident, the 1 Wh resolution of the AMS
(combined with the effect of slight variations in the time intervals) results in the active
power values overlapping with the power values when the appliance was in the passive
standby mode. This overlapping makes it difficult to attribute energy consumption to a
particular power mode.
Figure 5-8 Plot of an LCD monitor‟s electricity consumption recorded in household 13
Figure 5-9 shows the same appliance data from Figure 5-8, but with the power averaged
(with the moving average) over the previous and following power consumption cells. It can
be seen that the series of power consumption values become more clearly defined and it
is possible to calculate a cut off point between the power modes (as indicated by the red
line).
0
5
10
15
20
25
29 Jun 30 Jun 01 Jul 02 Jul 03 Jul 04 Jul 05 Jul 06 Jul
Mon 29/6/2009 to Sun 5/7/2009

157
Figure 5-9 Plot of an LCD monitor‟s electricity consumption recorded in household 13 with
the moving average (active power consumption occurs above the red line).
5.6.2.1.2 Power modes “truth gate”
By identifying cut off points between the different power modes, for a given appliance, it
was possible to use a “truth gate” to determine which power mode was responsible for
each time interval‟s energy consumption. Each potential power mode was given a “truth
gate” column, which produced either a “TRUE” or “FALSE” output depending on whether
the value contained in the corresponding moving average cell, fell within a specified value
range. This was achieved by using Excel‟s “IF” function, which was linked to the “truth
gate” criteria cells and could be adjusted for each appliance. Table 5-13 shows the “truth
gate” criteria cells for a television.
Table 5-13 Truth gate criteria cells for an LCD television in household 13
Although the “truth gate” provided an automated method to apportion electricity
consumption to different power modes, it was limited due to two main effects: (i) the
moving average added higher power consumption values to cells that were actually zero
or in a low power mode (and were classified as the “active” power mode); (ii) time intervals
where low power electricity consumption was occurring, but below the 1 Wh threshold,
0
5
10
15
20
25
29 Jun 30 Jun 01 Jul 02 Jul 03 Jul 04 Jul 05 Jul 06 Jul
Mon 29/6/2009 to Sun 5/7/2009
Max Min
Active NA 15.00
Active Standby
Passive Standby 15.00 1.00
Off Standby 1.00 0.00

158
displayed zero electricity consumption (and were classified as “mains off”). Examples of
these effects are shown in Figure 5-10.
Figure 5-10 Examples of the limitations of the truth gate in apportioning power mode
electricity consumption correctly in an appliance worksheet prior to manual correction
A number of methods were tested to mitigate these problems. For example, by specifying
that the “truth gate” formula only gave a “TRUE” output if an energy consumption
measurement was also in column D, it was possible to prevent “TRUE” outputs from being
displayed in intervals where no electricity consumption was recorded. In order to correct
cells where low power electricity consumption was known to be occurring, it was found that
the simplest method was to correct the “truth gate” columns manually. This involved
copying and re-pasting the “truth gate” columns as “values”, and altering periods of
different power mode usage appropriately. The example presented previously, in Figure
5-7, shows data for a LCD television where the zeros in the “truth gate” columns have
been manually manipulated to correctly show passive standby electricity consumption.
Despite this method being relatively time consuming it offered a number of benefits.
Firstly, this technique allowed the researcher to become very familiar with the data and
better understand the characteristics of the AMS. Thus, it was possible to identify distinct
patterns in the data (such as the number of zeros in between a series of 1 Wh
measurements), which helped to correctly allocate electricity consumption to the different
No electricity consumption actually occurred in this interval
Standby power electricity consumption was actually occurring in this interval

159
standby power modes. Secondly, the process of data screening resulted in a more in-
depth analysis of the data. Any small variation in the energy consumption recorded was
examined in detail and it is believed that many potential errors in the data were reduced.
A further example of the benefit of manual screening is evident in Figure 5-11. As
highlighted in section 5.5.6, when a higher power mode is used for a portion of an interval,
the value of electricity consumption can be similar to that of a lower power mode. Figure
5-11 shows that at the end of the period of active use, a 1 Wh measurement (Column E:
Row 125) results in a value that could be interpreted as a measurement caused by the
television‟s passive standby power mode (Column E: Row 133). However, it can be seen
that there are no intervals with a zero energy consumption value, prior to the 1 Wh
measurement in Row 125. Therefore, it can be assumed that this electricity consumption
was from the active mode, because there was not sufficient time for the standby power
mode to produce the 1 Wh energy consumption measurement. Thus, in order to allocate
some energy consumption values to the appropriate power mode, it was necessary to
evaluate the preceding and following intervals. This is an activity that would have been
difficult to conduct automatically.
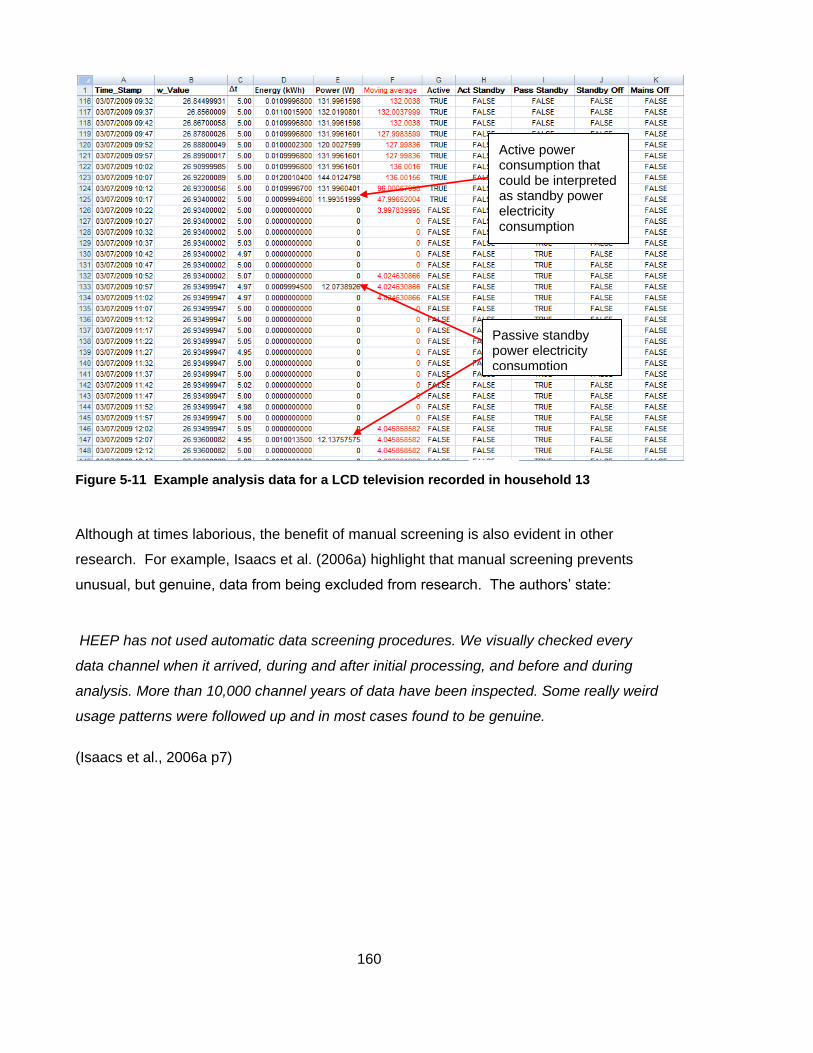
160
Figure 5-11 Example analysis data for a LCD television recorded in household 13
Although at times laborious, the benefit of manual screening is also evident in other
research. For example, Isaacs et al. (2006a) highlight that manual screening prevents
unusual, but genuine, data from being excluded from research. The authors‟ state:
HEEP has not used automatic data screening procedures. We visually checked every
data channel when it arrived, during and after initial processing, and before and during
analysis. More than 10,000 channel years of data have been inspected. Some really weird
usage patterns were followed up and in most cases found to be genuine.
(Isaacs et al., 2006a p7)
Active power consumption that could be interpreted as standby power electricity consumption
Passive standby power electricity consumption

161
5.6.2.1.3 Potential errors in power mode analysis
Power mode electricity consumption
Despite every effort being made to reduce errors in the data analysis process, it must be
recognised that the 1Wh resolution of the AMS introduces a degree of error. An example
of this can be seen in Figure 5-11 previously, which shows data for a television. Figure
5-11 shows that when the television is in the passive standby power mode, around 13 zero
energy consumption measurements were recorded prior to the 1 Wh measurement (e.g.
Column D: Row 133 to 147). But, only seven zero energy consumption measurements
were recorded prior to the 1 Wh measurement following active use (Column D: Row 133).
This suggests that around half of the energy for this interval, actually resulted from the
previous use in the active power mode. This type of effect was also apparent in reverse,
when an appliance was put into a fully active mode from a standby power mode. Thus,
electricity consumed during standby power modes could be allocated to the active power
mode, when the appliance has been turned on prior to a 1 Wh measurement being
recorded (e.g. the appliance has become active with up to twelve preceding zero energy
consumption measurements).
The potential error from this effect is dependent on the number of times an appliance was
turned from one power mode to another and the time of use (i.e. the point before the next
incremental 1 Wh measurement). As a result, it is difficult to quantify the effect of the error
with any certainty. Although work was undertaken to attempt to tackle this problem, it
became apparent that this would be a difficult and very time consuming process. Due to
the equal chance that an appliance would be turned from one power mode to another,
midway between 1 Wh measurements, it was decided that this error was, to a degree,
likely to cancel itself out (if one accepts the law of averages) and this form of error was
accepted as a constraint of the AMS‟s 1 Wh resolution.
Duration of power mode use
A pragmatic approach was also taken to uncertainty regarding the measurement of the
duration of appliances in low power modes. Due to the 1 Wh resolution, it is difficult to
know exactly when some appliances were used in a low power mode, because a number

162
of zero energy consumption measurements are likely to have occurred prior to a 1 Wh
measurement. For example, Figure 5-12 shows data for a DVD player that was put into a
standby power mode.
Figure 5-12 Electricity consumption data for a DVD player, recorded at household 2,
apportioned to the passive standby power mode
The first energy consumption measurement occurred at 13:30 (Column D: Row 3211) but,
it is uncertain exactly when the activation occurred, because the appliance could have
been activated up to around 9 intervals previously (this is also more uncertain due to the
variation in the duration of the intervals at this time). Although preceding (or following)
intervals could have been estimated for such cases, it was decided to start and end the
allocation of power modes at intervals containing energy consumption measurements.
Appliance could have been activated in the standby power mode anywhere in this time period

163
This was because a WGM could have been at a midpoint between registering the 1 Wh
and any estimate, even based on good reasoning, could have been incorrect and could
have introduced subjective error into the results. It was considered more prudent to
accept error from the resolution of the AMS, rather than from the researcher‟s subjectivity.
Although this approach will undoubtedly cause a degree of error, this will be an
underestimation of appliances duration in particular standby power modes rather than the
overestimation. Therefore, results concerning the duration of particular standby power
modes are a minimum usage, but based on solid consumption measurements rather than
subjectivity.
Unclassifiable standby power and unknown electricity consumption
The apportioning of electricity consumption measurements to power modes was often
straightforward for many of the appliances monitored in this study. Appliances active and
standby power modes were usually easily identifiable (e.g. the LCD monitor shown in
Figure 5-9) and other appliances frequently remained in the same power mode throughout
the monitoring period (e.g. STBs, VCRs, DVD players, routers, printers and audio
equipment). In such cases, observations made while installing and uninstalling the
monitoring equipment allowed the correct power mode to be applied. The selection of
standby power modes could also be confirmed at the interview by discussing the patterns
of appliance use with householders. Nevertheless, it must be accepted there is the
potential for some human error in some cases (e.g. VCRs set to record broadcasts) when
differentiating between standby power modes was more difficult.
However, it is believed that such error was kept to a minimum by using an “unclassifiable
standby” (U/C) column. This was used in cases where it was not possible to ascertain that
electricity consumption occurred through the use of a specific standby power mode, but it
was known that the appliance was in a standby power mode. This was due to some
appliances standby power modes having very similar power consumption values (e.g.
within 1 or 2 W) or due to periods of inconsistent polling. By entering a “TRUE” output in
the unclassifiable standby column, it was possible to allocate energy consumption to
overall standby power consumption totals, whilst avoiding the introduction of error into the
results for specific power modes.

164
In a few cases, it was not possible to ascertain whether an appliance was in an active or a
standby power mode. This resulted from either missing data (e.g. very long time intervals)
or from appliances having similar power values for active and standby power modes (this
mainly affected digital radios and telephony equipment). For such cases, the data were
removed from power mode calculations by being recorded in a separate “Unknown”
energy consumption column.
The identification of computers active and passive standby power modes
A number of issues related specifically to desktop and laptop computers. Similar to the
MTP‟s (2006b) investigation of home computers, it was often difficult to discern when
computers entered active standby or passive standby power modes due to automatic low
power management settings. This was due to computers often operating in a wide range
of power loads while active (e.g. depending on software requirements and the number of
applications in use).
Although reports from householders suggested that the majority of the computers
monitored in this study did not have power management settings enabled, it is possible
that computers with factory default settings may have entered into standby power modes.
An additional issue for laptop computers is that standby power measurements can also be
influenced by batteries state of charge (EES, 2006). Therefore, it is possible that active
standby and passive standby power electricity consumption from computers may have
been inadvertently attributed to the active power mode. The results presented for desktop
and laptop standby power mode electricity consumption must therefore be viewed as a
conservative estimate.
The calculation of network appliances standby power consumption
In a number of households network appliances (e.g. STBs, routers, modems and
telephones) often remain continuously in an active power mode, even when a television or
computer was not being used. Similar to the approaches used in ESS (2006) and the
REMODECE project, in such cases, electricity consumption was categorised as a form of
active standby, because the appliances were not providing their primary functions. A

165
report from REMODECE states that for routers and STBs “standby is calculated as the
consumption in the hours when the associated PC or TV is not in use” (Grinden and
Feilberg, 2008 p7). This thesis has also adopted this approach.
Values for STBs standby power electricity consumption were calculated with the following
method. The total duration value for active television use was divided by the total duration
of the corresponding active STB use. This produced the fraction of the two week
monitoring period that each STB was being used to actively view broadcast material. This
fraction was used to calculate the amount of electricity consumption that could be
apportioned to the active and active standby power modes (shown in the equations 5, 6
and 7).
Equation 5
Equation 6
Equation 7
This approach was also applied to households that used AV boosters and AV senders
continuously in an active mode. In households 1, 2 and 6, VCRs were occasionally used
to record television programmes. Therefore, the active use of VCRs was incorporated into
the calculations to account for the STBs active electricity consumption when connecting
the VCRs to broadcast material.

166
A similar approach was also used for routers and modems by dividing the total duration of
active computer use by the duration of router and modem use for each household.
However, for one of the households (household 12) the Internet access was delivered
through a device that also connected the household‟s telephones to the service provider‟s
telephone network. This device was categorised as always being in an active power
mode, due to it continuously providing one of its primary functions (i.e. connecting the
telephones to the external network), even though telephones were not in continuous use.
A limitation of the calculations is that active standby values may be underestimated. For
STB use in households 1, 3 and 6 a portion the active VCR use may have been to view
video cassettes rather than for recording. Similarly, electricity consumption values gained
for routers and modems will not account for the simultaneous use of computers in a
household. Thus, although the results gained provide a much more representative
assessment of the appliances electricity consumption, they may underestimate active
standby power consumption from network appliances and must be viewed as a
conservative evaluation.
5.6.2.1.4 Individual appliance summary analysis
With the addition of data columns to indicate the day and hour of each electricity
consumption measurement, it was possible to calculate a range of energy consumption
and duration of use values for each appliance. This was largely achieved by using Excel‟s
“SUMIF” and “SUMPRODUCT” functions to sum either the measured energy consumption
or the interval duration for different power modes. The “SUMPRODUCT” function allowed
more complex array combinations to be used, so that values could be gained for the
different hours of week and weekend days for the different power modes. Table 5-14
shows some examples of the Excel formula used.

167
Table 5-14 Example Excel formula used on appliance summary worksheets
Output Description Excel formula
Total energy consumption
Summed all the energy measurements recorded by the different power modes.
=SUM(D3:D5000)
Total energy consumption from active power mode
Summed all the energy measurements if the active column stated “TRUE”.
=SUMIF(G3:G5000,"TRUE", D3:D5000)
Total duration in active power mode
Summed all the time intervals if the active column stated “TRUE”.
=SUMPRODUCT(--(G3:G5000=TRUE),C3:C5000)
Total energy consumption from active power mode on Mondays
Summed all the energy measurements if the active mode stated “TRUE” and the day column stated “Monday”.
=SUMPRODUCT(--(M3:M5000="Monday"),--(G3:G5000=TRUE),D3:D5000)
Total energy consumption from active power mode between 1am and 2am
Summed all the energy measurements if the active mode stated “TRUE” and the hour column stated “01”.
=SUMPRODUCT(--(N3:N5000="01"),--(G3:G5000=TRUE),D3:D5000)
Total energy consumption from active power mode between 1am and 2am on weekend days
Summed all the energy measurements if the active mode stated “TRUE” and the hour column stated “01”, for Saturdays and Sundays only.
=(SUMPRODUCT(--($N$3:$N$5000="01"),--($G$3:$G$5000=TRUE),--($M$3:$M$5000="Saturday"),$D$3:$D$5000))+(SUMPRODUCT(--($N$3:$N$5000="01"),--($G$3:$G$5000=TRUE),--($M$3:$M$5000="Sunday"),$D$3:$D$5000))
The cells containing the energy consumption and duration of use calculations were
organised into tables, so that totals and subtotals of electricity consumption and hours of
use could be easily calculated. This structure facilitated the crosschecking of the values
gained to reduce the potential for error from mistakes in the formulae. Examples of the
different tables are shown in Figure 5-13, Figure 5-14 and Figure 5-15.

168
Figure 5-13 Total two week electricity consumption and hours of use values recorded for an
LCD television at household 13
Figure 5-14 Total two week electricity consumption and hours of use values recorded for an
LCD television at household 13 for two days of the week
Total Energy use Energy %
Active 22.043 99.49
Active Standby 0.000 0.00
Passive Standby 0.111 0.50
Off Standby 0.001 0.00
UNCLASIFFIED Standby 0.000 0.00
Unknown 0.000 0.00
Total 22.155 100.00
Hours of use total Mins Hours Days
Active 10110.000 168.50 7.02
Active Standby 0.000 0.00 0.00
Passive Standby 8159.867 136.00 5.67
Off Standby 1885.067 31.42 1.31
UNCLASIFFIED Standby 0.000 0.00 0.00
Mains Off 0.000 0.00 0.00
Unknown 0.000 0.00 0.00
Total (Not including unknown) 20154.933 335.92 14.00
Average hours of use per day Mins Hours Days
Active 722.14 12.04 0.50
Active Standby 0.00 0.00 0.00
Passive Standby 582.85 9.71 0.40
Off Standby 134.65 2.24 0.09
UNCLASIFFIED Standby 0.00 0.00 0.00
Mains Off 0.00 0.00 0.00
Unknown 0.00 0.00 0.00
Total (Not including unknown) 1439.64 23.99 1.00
Total energy use by day (kWh)
Monday kWh kWh % Hours
Active 0.6 26.2 4.6
Active Standby 0.0 1.1 0.4
Passive Standby 0.0 0.0 0.0
Off Standby 0.0 1.5 42.9
UNCLASIFFIED Standby 0.0 0.0 0.0
Unknown 0.0 0.0 0.0
Total (Not including unknown) 0.7 28.7 48.0
Tuesday kWh kWh % Hours
Active 0.0 0.0 0.0
Active Standby 0.0 0.0 0.0
Passive Standby 0.0 0.0 0.0
Off Standby 0.0 1.8 47.9
UNCLASIFFIED Standby 0.0 0.0 0.0
Unknown 0.0 0.0 0.0
Total (Not including unknown) 0.0 1.8 47.9
Wednesday kWh kWh % Hours
Active 0.1 4.7 0.8
Active Standby 0.0 0.0 0.0
Passive Standby 0.0 0.0 0.0
Off Standby 0.0 1.7 47.2
UNCLASIFFIED Standby 0.0 0.0 0.0
Unknown 0.0 0.0 0.0
Total (Not including unknown) 0.2 6.4 48.1
Thursday kWh kWh % Hours
Active 0.2 9.1 1.7
Active Standby 0.2 9.4 1.9
Passive Standby 0.0 0.0 0.0
Off Standby 0.0 1.6 44.4
UNCLASIFFIED Standby 0.0 0.0 0.0
Unknown 0.0 0.0 0.0
Total (Not including unknown) 0.5 20.1 47.9
Friday kWh kWh % Hours
Active 0.4 14.5 2.6
Active Standby 0.0 0.0 0.0
Passive Standby 0.0 0.0 0.0
Off Standby 0.0 1.6 45.5
UNCLASIFFIED Standby 0.0 0.0 0.0
Unknown 0.0 0.0 0.0
Total (Not including unknown) 0.4 16.1 48.1
Saturday kWh kWh % Hours
Active 0.3 10.4 1.8
Active Standby 0.0 0.7 0.2
Passive Standby 0.0 0.0 0.0
Off Standby 0.0 1.7 46.0
UNCLASIFFIED Standby 0.0 0.0 0.0
Unknown 0.0 0.0 0.0
Total (Not including unknown) 0.3 12.9 48.0
Sunday kWh kWh % Hours
Active 0.3 11.7 2.0
Active Standby 0.0 0.7 0.2
Passive Standby 0.0 0.0 0.0
Off Standby 0.0 1.6 45.7
UNCLASIFFIED Standby 0.0 0.0 0.0
Unknown 0.0 0.0 0.0
Total (Not including unknown) 0.3 14.0 47.9
Total (Not including Unknown) 2.5 100.0 335.9
Total (Including Unknown) 2.5 100.0 335.9

169
Figure 5-15 A section of total two week hourly electricity consumption values for an LCD
television at household 13
5.6.2.2 Whole house analysis
The processed whole house electricity consumption data were added to the analysis
spreadsheet on a separate worksheet, which allowed each household‟s total two week
electricity consumption to be calculated. Due to the AMS being powered by the dwelling‟s
mains electricity supply, its contribution was subtracted from the total energy consumption.
This was derived from electricity consumption values supplied by Digital Living, who had
measured the AMS‟ load through a number of tests. Each system, excluding the WGMs,
was found to use 3.90 kWh over 14 days (0.28 kWh per day) and each WGM consumed
0.084 kWh over 14 days (0.006 kWh per day) (Watson, 2009).
5.6.2.3 Summary worksheets
Due to the data in each individual appliance worksheet being based on an identical
template, the data for each appliance were easily summarised in two summary
worksheets: (i) appliance level; (ii) appliances categories. The appliance level summary
worksheet tabularised the key calculations for each appliance. This allowed the
appliances‟ electricity consumption and hours use to be compared to other appliances,
total ICE electricity consumption and total whole house electricity consumption.
Similarly, the appliance categories summary worksheet allowed the comparison of the
main categories of ICE appliances: (i) video; (ii) audio; (iii) computing; (iv) telephony.
Thus, it was possible to understand the relative contribution of groups of appliances that
were often used together for similar purposes. The two separate summary sheets used
unconnected formulae, which allowed the crosschecking of values for error.
Energy use by hours 00:00 - 01:00 01:00 - 02:00 02:00 - 03:00 03:00 - 04:00 04:00 - 05:00 05:00 - 06:00
Active 0.144 0.000 0.000 0.017 0.000 0.179
Active Standby 0.000 0.000 0.000 0.000 0.000 0.000
Passive Standby 0.007 0.010 0.011 0.008 0.007 0.009
Off Standby 0.000 0.000 0.001 0.000 0.000 0.000
UNCLASIFFIED Standby 0.000 0.000 0.000 0.000 0.000 0.000
Unknown 0.000 0.000 0.000 0.000 0.000 0.000
Total 0.151 0.010 0.012 0.025 0.007 0.188

170
The data within the summary sheets allowed a range of charts to be plotted and key
energy consumption values to be calculated. This enabled each households‟ patterns of
ICE appliance use to be identified (e.g. time of use, power mode use, appliances used
most frequently, most energy consuming appliances etc) and provided a basis from which
to conduct the household interviews. The presentation of these data is described in more
detail in section 5.7.3.1.
5.6.3 Data analysis: Sample level
In order to compile the electricity consumption results, for the entire sample, data from
each household‟s appliance level summary worksheet were compiled in Excel workbooks.
These data were used to calculate average electricity consumption values, compare the
different households and produce the tables and charts presented in chapters 6 and 7. By
using separate workbooks for different aspects of the sample‟s electricity consumption (i.e.
total two week electricity consumption, power mode consumption, load profiles, etc) it was
also possible to undertake further error checks during the production of the final results.
5.6.4 Validity of the appliance monitoring results
The validity of the results gained from the appliance monitoring is subject to a number of
potential sources of error that this research has attempted to reduce to a minimum.
Threats to the validity from the monitoring equipment have been addressed through
extensive testing to ensure that there was an acceptable level of accuracy in the
measurements recorded. The apportionment of the measured electricity consumption, to
each appliance‟s different power modes, contains the error inherent in the constraints
associated to the resolution of the AMS and the subsequent methods of data analysis
described in section 5.6.2. It is believed that the analysis techniques used in this research
(which includes the manual screening of data, extensive manual checking of spreadsheet
formulae and the cross checking of values produced by the spreadsheets) reduces the
error to an acceptable level, so that the quantitative results of this research can be trusted
with an adequate level of confidence.

171
Notwithstanding the efforts made by the researcher, it must be conceded that there are
underlying threats to the validity of the results associated to the relatively short monitoring
period used for this study. As described previously in section 5.5.1, the effects of seasonal
variation and unusual patterns of occupancy will have influenced the results gained.
Therefore, the electricity consumption measurements recorded must be considered as
snapshots of the households‟ ICE appliance use. An additional issue of validity also
concerns the influence of the monitoring equipment on householder‟s behaviour. Wood
and Newborough (2003) highlight research that suggests that a common problem for
monitoring campaigns is the Hawthorne effect, whereby “subjects may behave differently
because they know they are being studied” (Wood and Newborough, 2003 p824). In order
to attempt to address this issue, households were asked to behave as they normally would
and informed that the key aim of the study was to investigate current household ICE
appliance use and not energy conservation.
In subsequent discussions with the households, the majority of participants reported that
they had not altered their behaviour and that the results gained were a good
representation of their patterns of electricity consumption. However, two householders
indicated that their behaviour had been modified to some extent. In household 10, one
householder indicated that on two occasions she did not unplug her laptop computer,
when “normally” she would have switched the external power supply off at the mains
socket. A similar issue also occurred at household 11, where a householder reported that
she would often turn her laptop off at the mains socket, but refrained from this behaviour
during the monitoring period. Due to the limited occurrence of this issue it is not
considered to be a significant threat to the validity of the overall results and it was decided
not to manipulate the data as this would have introduced a degree of subjective bias into
the analysis. Despite the potential for error, it is believed that the results presented in this
thesis provide a robust assessment of the two week ICE appliance electricity consumption
recorded at each of the participating households.

172
5.7 Qualitative data collection: ICE appliance household interviews
This section describes the collection and analysis of the qualitative data from the
household interviews. The interviews were facilitated by two key tools. Firstly, results
from the appliance monitoring were presented to each household in the form of a series of
charts. Secondly, questions exploring why the patterns of use had occurred were
organised with an interview schedule informed by elements of the Theory of Interpersonal
Behaviour (TIB) and Diffusion of Innovations Theory (DIT).
5.7.1 Semi-structured interviews
The rationale for conducting the semi-structured interviews was to gather information to
explain why each household‟s patterns of ICE appliance electricity consumption occurred.
As described in section 5.3, the decision to use this particular research method was
reflected in the type of data necessary to answer the research questions and practical and
ethical considerations.
5.7.2 Location of the interviews and householders involved
The use of the appliance monitoring results necessitated face-to-face interviews, because
it would have been impractical to conduct telephone interviews. The interviews were
conducted at the participants‟ homes with as many of the householders present as
possible. In all but two of the households, all the household members were present. For
one household the children were omitted from the interview (ages 1 and 5), and for
another, one of the householders was unable to attend (a dependent adult).
The use of group interviews had a number of benefits. Firstly, responses from one
householder were often enriched by another. For example, one householder would often
question another‟s response (e.g. “no, you always leave the TV on”), which encouraged
interviewees to reflect more deeply about their behaviour and generate discussion free
from the influence of the researcher. As a result, themes evident in the data frequently
emerged from responses that were provided without direct questioning. However, a
disadvantage of this method was that some householders could be more dominant in the

173
interview and it was important for the researcher to try and be as inclusive as possible with
the questioning.
The location of the interviews was also beneficial. By conducting the interview in the
environment where the electricity consumption measurements occurred, householders had
a clear frame of reference when describing reasons for their behaviour (e.g. participants
sometimes pointed to appliances). Furthermore, it was also possible to make a number of
observations and, where necessary, confirm that standby power consumption had been
attributed to the correct power mode.
5.7.3 Interview design and schedule
The interview schedule provided a means to structure the semi-structured interviews and
ensure that responses were gained to help answer the research questions. The interview
schedule was separated into two parts: (i) questions to explore the reasons for the
patterns of use recorded; (ii) questions to explore the reasons for the ownership of the
appliances.
5.7.3.1 The use of the ICE appliance monitoring data
The first part of the interview was facilitated through the presentation of the results from
the ICE appliance monitoring. Due to the large amount of data gained from the
monitoring, it was necessary to present the results as succinctly, and understandably, as
possible (e.g. technical aspects of the research, such as standby power modes, were new
to some participants). Key aspects of the appliance monitoring (e.g. the contribution of
ICE appliances to whole house electricity consumption and the percentage of electricity
consumption from standby power modes) were collated in a summary table, along with
issues of particular interest to be investigated (i.e. specific patterns of appliance use or
ownership). This information was supplemented by a series of charts, which were
developed to illustrate the main results from the appliance monitoring. Examples are show
and described in Figures 5-16 to 5-21.

174
Total energy consumption by the four main appliance groups
This chart showed the relative contribution of categories of ICE appliances to total ICE
electricity consumption.
Figure 5-16 Total two week electricity consumption from ICE appliance categories recorded
at household 13
0
5
10
15
20
25
30
35
Video Audio Computing Telephony
Ele
ctr
icit
y c
on
su
mp
tio
n (k
Wh
)
Energy use by appliance category

175
Total ICE appliance consumption by days of the week
This chart illustrated the relative contribution of particular days of the week to ICE
appliance electricity consumption.
Figure 5-17 Total two week ICE appliance electricity consumption on days of the week
recorded at household 13
0
1
2
3
4
5
6
7
8
9
10
Monday Tuesday Wednesday Thursday Friday Saturday Sunday
Ele
ctr
icty
co
ns
um
pti
on
(k
Wh
)
Energy use days

176
Hourly energy consumption of main ICE appliance categories
This chart illustrated the overall energy consumption of different groups of ICE appliances
by the hours of the day. Thus, it was possible to show which hours of the day had the
most ICE appliance electricity consumption.
Figure 5-18 Total two week ICE appliance electricity consumption by hours of the day from
ICE appliance categories at household 13
0.0
0.5
1.0
1.5
2.0
2.5
3.0
3.5
Ele
ctr
icit
y c
on
su
mp
tio
n (
kW
h)
Time (h)
Total hourly electricity consumption
Video
Computing
Audio
Telephony

177
Hourly energy consumption of active and standby power modes
This chart showed the total amount of active and standby energy consumption that
occurred within each hour of the day. It was possible to highlight the relative contribution
of these power modes to overall energy consumption and highlight the influence of
appliances in active or in standby overnight.
Figure 5-19 Total two week ICE appliance electricity consumption by hours of the day from
active and standby power modes recorded at household 13
0.0
0.5
1.0
1.5
2.0
2.5
3.0
3.5
Ele
ctr
icit
y c
on
su
mp
tio
n (k
Wh
)
Time (h)
Total hourly active and standby power mode electricity consumption
Active
Standby

178
Hourly weekday and weekend energy consumption
Total ICE appliance use was also shown by separating weekend and weekday energy
consumption. This was used to discuss general differences in patterns of use at
weekends or during the week.
Figure 5-20 Total two week ICE appliance electricity consumption by hours of the day for
weekdays and weekend days recorded at household 13
0.0
0.5
1.0
1.5
2.0
2.5
Ele
ctr
icit
y c
on
su
mp
tio
n (k
Wh
)
Time (h)
Total weekend and weekday hourly electricity consumption
Weekday total
Weekend total

179
Individual ICE appliances patterns of use
One of the most useful tools was a series of charts that showed the use of individual
appliances over the two week monitoring period. The use of these charts was influenced
by Wall and Crosbie (2009), who used similar information to facilitate interviews exploring
lighting use in UK households. By displaying the power modes, rather than the actual
power consumption, it was possible to significantly reduce their complexity and quickly
illustrate general patterns of appliance usage, such as appliances that often remained in
one specific power mode and the extensive use (or non-use) of standby power modes.
More detailed patterns of use could also be explored. For example, Figure 5-21 shows
how a bedroom television (TV CRT Combi BR) is largely used in a standby power mode
overnight, often after the main television has been turned to standby. However, the level
of detail explored had to be carefully balanced against the time constraints of the interview.
Figure 5-21 Individual video appliance patterns of use for 1 week recorded at household 13

180
5.7.3.2 The use of the TIB and DIT frameworks
At the initial stage of this thesis, the study had been more orientated towards technical
aspects of ICE appliance use. However, following the review of literature it became
apparent that a more balanced mixed methods approach had the potential to provide more
meaningful results. This led to concerns that the initial approach taken towards the
interviews was too ad-hoc and that the data collected would overlook important factors that
could have influenced the measurements recorded. As presented in chapter 3, the review
of social science literature identified that the TIB (Triandis, 1977) and DIT (Rogers, 2003)
offered useful frameworks to help explore ICE appliance behaviour. Therefore, it was
decided to use the TIB to help focus questions concerning the patterns of ICE appliance
use and the DIT to help develop questions regarding ICE appliance ownership.
Interview questions were developed to facilitate the investigation of key theoretical
constructs. However, the theories were used to help inform and focus the interviews, but
not to constrain them. Therefore, the main questions were kept relatively broad and
predominately open-ended, to allow data to come freely in participants‟ words. Questions
that were closed (such as: Do you ever think about the ways that you use appliances?)
were followed by an open ended question such as, why? As particular issues arose,
prompts and probe questions were used to introduce more specific aspects of behaviour
into the discussion. The development of questions was also influenced by previous
research, such as investigating whether participants altered appliance energy
management settings (MTP, 2006b) and appliance usage patterns (Green and Ellegård,
2007). A copy of the interview schedule is included in Appendix D.
5.7.3.3 Pilots of the interview schedule
To aid the development of the interview schedule a number of “dummy runs” were
conducted with the researcher‟s acquaintances. Although these were useful to test the
wording of questions, they were limited due to not being based on actual electricity
consumption measurements. The most realistic trial of the interview schedule came from
two pilot studies conducted prior to the main study phase. As mentioned in section 5.4.4,
the interviews were conducted some time after the appliance monitoring had been
completed. Despite this delay, the results from the two households were encouraging.

181
The interviewees in both households recognised the patterns of electricity consumption
recorded and provided clear reasons for their occurrence. Furthermore, many of the
factors discussed reflected key constructs of the TIB and DIT. However, the delay
between the two components of the data collection, made it more difficult for participants
to recall specific events during the appliance monitoring. Therefore, it was important to
ensure that interviews occurred as soon after the completion of the appliance monitoring.
A number of charts also required refinement (e.g. size of fonts and scales) and two
questions were reworded to improve clarity.
5.7.3.4 Interview structure
Before the start of the interview the researcher briefly explained its purpose and gained
permission to record the interview with a digital recorder. The interviews began with a
brief summary of the main results from the appliance monitoring and the presentation of
the chart showing the electricity consumption from the four main types of ICE appliance
(shown previously in Figure 5-16). The exact order that the set of charts were presented
to the participants varied, depending upon the responses gained in the conversation.
Thus, the researcher tried to allow the conversation to evolve naturally. On average the
interviews lasted around an hour. At the end of the interview participants were thanked
and asked if they had anything else to add.
5.8 Qualitative data processing and analysis
5.8.1 Template analysis
The aim of the qualitative data analysis was to reduce the interview data to a number of
distinct factors that could be used to answer the thesis‟ research questions. This was
achieved by coding the data, a process that links extracts from the interviews to particular
concepts and themes (King, 2008). There are a variety of coding approaches, which
range from attempting to group data with predefined a priori categories to techniques used
in grounded theory, which develop codes exclusively from the interview data (Gray, 2004;
King, 2008). This thesis used the TIB and DIT as frameworks to help make sense of the
data. Therefore, constructs from the two theories were used as a priori codes. However,

182
the researcher also remained open to the emergence of new themes from the data. The
data analysis was based on King‟s (2008) template analysis framework, which provides a
clearly defined process for coding and analysing qualitative data. Table 5-15 below
summarises the main stages involved in the template analysis process (King, 2008).
Table 5-15 Stages of the template analysis
Stage Description
Stage 1. Definition of the a priori themes and codes: Themes are features of participants‟ responses that characterise perceptions and experiences that the researcher believes are relevant to the research questions. Codes are the specific labels attached to the themes. For this thesis, the a priori codes were based on constructs in the TIB and DIT.
Stage 2. Transcription and familiarisation with the data: This stage entails writing up the interview data. For this thesis, a full transcription of the interviews was undertaken to ensure that any responses that could be relevant to the research questions were not overlooked. Any information beyond the participants‟ words were also included (e.g. pauses, laughs, and gestures), which followed a transcription format informed by Silverman (2006).
Stage 3. Initial coding of the data: This stage involves the identification of parts of the transcripts that are relevant to the research questions. If encompassed by an a priori theme, a code is attached to the identified section. If there is not a relevant theme, existing themes are modified or new codes are developed.
Stage 4. Initial template: Following the initial coding of a subset of the transcripts, codes are grouped into a smaller number of higher order codes, which describe broader themes in the data. This produces a hierarchical template that structures the codes.
Stage 5. Validation of the template: This stage is completed to check the quality of the coding and reduce the effects of the researcher‟s bias in the coding process.
Stage 6. Development of the template: The initial template is developed by applying it to all of the data. Changes were made where a new code was required or a change to the hierarchy of codes was necessary to allow a better fit with the data. Irrelevant codes were also deleted. The final template is shown in Appendix E.
Stage 7. Interpret and write-up findings: The final template is used to help interpret the data and write up the research findings.
Although there is a variety of designated software to assist the analysis of qualitative data
(e.g. NVivo), the interviews were coded in Microsoft Word. The coded data were
transferred into a table within a separate Word document, so that extracts could be quickly
sorted by code, household and household member. Data were also catalogued in an

183
Excel workbook, so that the number of extracts coded under each theme could be
reviewed. This also allowed the researcher to reflect on participants‟ responses and
identify common themes.
5.8.2 Validity and reliability of the interview results
Gray contends that “one problem with qualitative research is that a standard practice for
achieving validity, reliability or any other quality indicator has yet to be established” (Gray,
2004 p346). This is reflected in the inherent subjectivity that a researcher brings to the
interviews and the interpretation of data. An important aspect to the validity of the
interview data is whether participants‟ responses truly reflected reality. The use of the
monitoring data provided a degree of validity to the results, because householders
discussed their actual patterns of behaviour rather than their perceived use. In many
cases householders were surprised by aspects of their electricity consumption, which led
them to challenge their own perceptions and encourage the discussion of influences on
their behaviour.
Arguably the main threat to the reliability of this study‟s results comes from the degree of
subjectivity that influenced the coding of data. Krippendorff (2004) supports (and
developed) the use of coefficients for measuring the degree of agreement between
independent researchers‟ coding of data. In contrast, Gray (2004) highlights that, for some
scholars, verification has no place in some methods of qualitative data analysis (e.g.
grounded theory). King (2008) recommends a “middle ground” approach. Although King
highlights that he has used statistical calculations to measure agreement he states:
I would not recommend this approach now. It is based on at least an implicit assumption
that one can objectively judge one way of defining themes as “correct”, which flies in the
face of the notion that texts are always open to a variety of readings.
(King, 2008 [online] Quality Checks)

184
King (2008) recommends that a sample of results from preliminary coding should be
compared by team members and discussed to agree an initial template. Although no
direct comparison of coding was undertaken for this thesis, the research attempted to
replicate this stage of the template analysis by consulting with a colleague (experienced in
the analysis of the qualitative data) regarding the suitability of the initial template
developed. The colleague assessed the initial template and provided support for the
structure of the themes developed. A degree of support for the reliability and validity of the
template is also reflected in the use of theory led a priori codes. These constructs have
been found consistently in previous research. Furthermore, other key themes that
emerged from the data were also evident in previous ICE appliance studies.
5.9 Socio-demographic questionnaire
Due to the small sample size, this thesis was not overly concerned with connecting ICE
appliance electricity consumption to the socio-demographic characteristics of the sample.
However, socio-demographic data were collected to help describe the types of households
involved in the research and to provide data potentially useful to any future research using
the data. A questionnaire was developed to capture the key characteristics of the
households. Questions were developed with reference to National Statistics Harmonised
Standards for Social Sources (or “NS harmonised”) (ONS, 2008). This is a method
applied to a range of UK government surveys (e.g. Census, English House Condition
Survey), which allows the socio-demographic data collected to be comparable to other
national data sets. A copy of the questionnaire is included in Appendix F.
5.10 Summary
The research methodology and design used by this research have been presented and the
research methods described. This thesis has used a mixed methods design that has
collected: (i) quantitative household electricity consumption data; (ii) qualitative interview
data. Threats to the validity of the results have been described and measures to minimise
potential error have been outlined. It is believed that the results presented in this thesis
provide a robust assessment of the two week ICE appliance electricity consumption
recorded at each of the participating households and the interview data provides an insight
into factors that influenced the measurements recorded. The following four chapters

185
present the results from the research. Chapter 6 presents the average ICE appliance
electricity consumption recorded from the sample of fourteen households. Chapter 7
presents the variations in the households‟ ICE appliance use to highlight the different
patterns of appliance electricity consumption that were recorded. This also provides a
frame of reference for the household interview results, which are presented in Chapters 8
and 9.

186
Chapter 6. Results: Average household ICE appliance electricity
consumption
6.1 Introduction
This chapter presents results based on the electricity consumption measurements
recorded, in the sample of fourteen UK households, to illustrate the typical two week ICE
appliance use that occurred in the study sample. The results include values for the
average electricity consumption per household from the different ICE appliances and
power modes. This gives an assessment of the ICE appliance electricity consumption for
the “average” household, which can be compared to similar results from other studies.
The average household electricity consumption values can be linked to the power load
requirements of the ICE appliances and the extent of their use in the different power
modes. These two aspects are explored through the presentation of average appliance
power load values and average appliance daily use values.
In the following sections, results are presented in respect to overall ICE appliance
electricity consumption, the electricity consumption from the four key categories of ICE
appliances (i.e. video, audio, computing and telephony) and the electricity consumption
from the thirty-six main appliance types monitored in this study. Some of the implications
from these results are introduced during the chapter, but will be discussed in more detail
Chapter 10. Key terms used in this chapter are defined in Table 6-1.
The chapter begins with a description of the households that took part in the study and the
types and number of ICE appliances monitored in the homes (section 6.2). Two week
average household ICE appliance electricity consumption values are then presented
(section 6.3). The average household ICE appliance electricity consumption is then
explored in more detail through the allocation of electricity consumption to the different
appliance power modes (section 6.4). The power requirements of the different ICE
appliances are then compared through average appliance power load values (section 6.5)
and the duration of the appliances‟ use is explored with average appliance daily duration of
use values (section 6.6). Finally, average household ICE appliance use is described

187
through a number of power load profiles (section 6.7) and a summary of the chapter is
presented to briefly discuss the implications of the results (section 6.8).
Table 6-1 Definitions of key terms used in chapter 6
Term Definition
ICE appliance type The ICE appliances monitored in this study are grouped into thirty-six individual appliance types. For example, LCD televisions, digital radios, desktop computers etc.
ICE appliance category The ICE appliance types are grouped into four main categories: (i) video appliances; (ii) audio appliances; (iii) computing appliances; (iv) telephony appliances.
Ownership rate Denotes the prevalence of the appliance types, in the sample of households, in percentage terms. For example, fourteen cordless telephones were monitored in the study which is an ownership rate of 100% (i.e. on average, one appliance per household)
Total electricity consumption The overall electricity consumption recorded for the two week monitoring period (expressed for a given appliance category, appliance type, etc). For the appliances this is the sum of the different power modes.
Total standby power electricity consumption
Refers to the overall electricity consumption from the sum of the different standby power modes for the two week monitoring period.
Average household electricity consumption
Refers to total electricity consumption recorded from the study sample, divided by the sample size (i.e. fourteen homes). This provides electricity consumption for the “average” household.
Average appliance electricity consumption
Refers to total electricity consumption value recorded from the study sample (for a given appliance type) divided by the number of appliances monitored.
6.2 Description of the households
6.2.1 The study households
Data from twelve of the households were collected during the main data collection phase
of the study, between November 2008 and October 2009. Due to the relatively small
sample size, the results from two additional households that took part in pilot studies,
between March 2008 and November 2008, have also been included. Typically the results
from pilot studies, or pre-tests, are usually disregarded. However, the methods used to

188
collect and analyse the data from the pilot studies were almost identical to those used in
the main data collection phase (slight changes were made to the format of some charts
used during the interviews and two interview questions were reworded). As a result, the
pilot studies provided results of comparable quality to those gained from the main study,
which allowed the pilot households to be included in initial results from the research
published in peer reviewed conference proceedings (Coleman, Wright, Brown and Firth,
2009).
6.2.2 Household composition
All the households that took part in this study were located in the Yorkshire and Humber
region of the UK. Thirteen of the households resided in houses located in Sheffield and
one in an apartment located in Leeds. Table 6-2 shows that the snowball sampling
delivered a sample diversity that generally reflects the UK‟s household composition. Table
6-3 summarises key characteristics of the households involved in this study.
Table 6-2 Comparision of household type for the study sample and UK housing stock
Household type Sample UK housing stock*
One person 21% 31%
Two or more unrelated 7% 2%
Married/cohabiting couple no children 36% 27%
Married/cohabiting couple with dependent children 14% 22%
Married/cohabiting couple with non-dependent children 7% 7%
Lone parent with dependent children 14% 6%
Lone parent with non-dependent children 0% 3%
Two or more families 0% 1%
* Figures taken from ONS (2009b)

189
Table 6-3 Summary of participating households key socio-demographic characteristics (*household reference person is the individual
responsibe for the property. In cases of shared responsibility the individual with the highest income is the reference person)
ID Household type Adult (>16)
Child (>12)
Child (<12)
Occupied weekdays daytime
Annual household income (£)
Occupation of household reference person*
Dwelling type (No. bedrooms)
1 Married couple, no children (retired)
2 - - Yes Up to 10,000 Retired: Traditional professional 1930s semi-detached (3 bed)
2 Married couple, dependent children
2 - 2 Yes 52,000 or more Employed full-time: Modern professional 1970s detached (3 bed)
3 Married couple, no children
2 - - Yes - Employed full time: Senior manager/ administrator
1930s semi-detached (3 bed)
4 One person (male) 1 - - No 41,600 to 46,799 Employed full time: Technical occupation 1950s semi-detached (3 bed)
5 Lone parent, dependent child
1 1 - Yes 15,600 to 20,799 Unemployed: Senior manager/ administrator 1930s semi-detached (3 bed)
6 Married couple, no children (retired)
2 - - Yes 52,000 or more Retired: Modern professional Victorian detached (4 bed)
7 One person (male) 1 - - No 31,200 to 36,399 Employed full time: Modern professional Victorian, end terrace (3 bed)
8 Lone parent, dependent child
1 1 - No 52,000 or more Employed full time: Senior manager/ administrator
Georgian, mid-terrace (3 bed)
9 Married couple, with non-dependent child
3 - - Yes - Employed full time: Senior manager/ administrator
1930s semi-detached (3 bed)
10 Cohabiting couple 2 - - No 46,800 to 51,999 Employed part time: Modern professional Victorian mid-terrace (4 bed)
11 Two unrelated adults 2 - - Yes 32,100 to 36,399 Employed part time and self employed part time: Modern professional
Victorian mid-terrace (3 bed)
12 Married couple, dependent children
2 2 - Yes 52,000 or more Self employed: Senior manager/ administrator Victorian detached (3 bed)
13 Cohabiting couple 2 - - No 36,400 to 41,599 Employed full time: Modern professional 2000s apartment (1 bed)
14 One person (female) 1 - - Yes 20,800 to 25,999 Retired: Modern professional 1950s semi detached (3 bed)

190
6.2.3 The ICE appliances monitored
Two week electricity consumption measurements were recorded for 224 ICE appliances in
the sample of households. However, in households 10 and 12, more than twenty ICE
appliances were in use, so two individual Hi-Fi appliances (i.e. Hi-Fi separates) were
attached to a single WGM monitor to allow the measurement of their electricity
consumption. In household 12 an LCD monitor was excluded from the study following the
visual inspection. Thus, 222 separate streams of electricity consumption data were
collected and analysed. Table 6-4 shows the start date of the households monitoring
periods and the number of ICE appliances monitored at each household (allocated to the
main ICE appliance categories). On average, computing appliances were the most
commonly owned ICE appliance, closely followed by video appliances. Appendix G
provides complete ownership details of the thirty-six appliance types for each household.
Table 6-4 ICE appliances monitored
ID Monitoring start date
ICE appliances monitored by main category
Video Audio Computing Telephony Total
01 6/3/2008 4 1 4 1 10
02 18/07/2008 6 1 4 1 12
03 16/11/2008 6 2 6 2 16
04 23/11/2008 4 0 5 1 10
05 2/12/2008 7 2 6 2 17
06 25/2/2009 6 1 6 2 15
07 1/3/2009 3 1 11 1 16
08 14/3/2009 6 6 5 2 19
09 21/3/2009 6 5 6 3 20
10 12/5/2009 7 3 10 1 20
11 12/6/2009 5 4 10 1 20
12 30/6/2009 8 5 6 2 20
13 3/7/2009 7 1 5 1 14
14 20/8/2009 5 2 4 2 13
Total 196 days 80 34 88 22 224
Ave. 14 days 5.7 2.4 6.3 1.6 16

191
Figures 6-1 to 6-4, provide the ownership rates of the different appliances monitored in the
sample. The ownership rate illustrates, as a percentage, the average household
ownership of the appliance types. It is important to note that the ownership rate does not
indicate the percentage of homes that owned the appliance types. For example, ten
games consoles were monitored by the study, which gives an ownership rate of 71%.
However, this appliance type was only found in seven of the households (i.e. 50%).
Figure 6-1 shows that CRT televisions had the highest ownership rate of any ICE
appliance (150%). Thus, on average, 1.5 CRT televisions were found in the households.
Although, the ownership of more than one CRT televisions was relatively common this
figure was particularly influenced by households 5 and 12, which both owned four CRT
televisions. Twelve of the households also owned either a complex STB or a simple STB
to receive satellite, cable or digital broadcasting services.
Figure 6-1 Appliances ownership rates in the video category
Figure 6-2 shows that integrated Hi-Fi systems were the most common audio appliance.
In total, eight households owned these appliances. This type of appliance has multiple
audio functions (e.g. amplifier, CD player, radio, cassette tape), which are usually
0 20 40 60 80 100 120 140 160
VCR/DVD
DVD recorder
HDD/DVD recorder
AV transmitter/ receiver
AV booster
STB simple
Surround sound equipment
LCD television
VCR
DVD player
STB complex
Games console
CRT television
Ownership rate (%)

192
integrated into a single unit with separate speakers. Around seven Hi-Fi separates (e.g.
amplifier, CD player, cassette deck, tuner, turntable etc) were monitored in this study, but
these were found in just four of the households.
Figure 6-2 Appliances ownership rates in the audio category
Figure 6-3 shows a high ownership of desktop and laptop computers across the sample,
with ten of the households owning more than one computer (all the households owned at
least one computer). Internet access was also high with thirteen of the households using
routers. These ownership rates are much higher than the national average, as around 70%
of UK homes are estimated to own a computer (DECC, 2009b).
0 20 40 60 80 100
Clock radio
Mp3 docking station
Analogue radio
Digital radio
Hi-Fi separates
Integrated Hi-Fi systems
Ownership rate (%)

193
Figure 6-3 Appliances ownership rates in the computing category
Figure 6-4 shows that cordless telephones were the most common telephony appliance
monitored in this study. All but one household used cordless handsets and household 9
had two separate telephone lines. Extra cordless handsets were owned by six of the
households and answer-phone machines were used in two of the homes.
Figure 6-4 Appliances ownership rates in the telephony category
0 20 40 60 80 100 120 140
Off ice printer/ copier
Desktop with LCD monitor
Printer laser
Digital photo printer
CRT monitor
Modem
External hard drive
Printer inkjet
Multi functional printer
Speakers
Laptop
Router
LCD monitor
Desktop computer
Ownership rate (%)
0 20 40 60 80 100 120
Answer-phone
Cordless telephone extra handset
Cordless telephone
Ownership rate (%)

194
6.3 Average household electricity consumption
This section describes the average ICE appliance electricity consumption per household,
based on the total two week electricity consumption recorded in the fourteen homes. The
results illustrate the relative significance of the different appliance types to the electricity
consumption recorded in the study sample. The household averages are derived by
dividing the total two week electricity consumption recorded, for a given category or
appliance type, by the fourteen homes (shown in equation 8).
Equation 8
Thus, the average household values incorporate the ownership rates, presented
previously in Figures 6-1 to 6-4. Due to not all of the households owning all of the
appliances types (or some households owning more than one of the appliance types) the
values do not directly compare the energy intensity of the appliance types. For example,
the electricity consumption from the three simple STBs monitored in the sample has been
divided by the fourteen homes rather than the number of appliances. This aspect of ICE
appliance electricity consumption is illustrated later in this chapter, when appliance power
loads are compared (section 6.5). However, supplementary tables are provided in
Appendix H, which provide average appliance electricity consumption values for the
different appliance types. To illustrate the type of data used to produce these tables, raw
two weeks total ICE appliance electricity consumption data for each household is also
presented in Appendix I.
6.3.1 Average electricity consumption: whole house and all ICE appliances
The UK government estimates that, in 2008, the average annual electricity consumption
for households located in Yorkshire and the Humber was 4080 kWh and 4478 kWh for the
UK (DECC, 2010). When these values are divided into 50 weeks (to allow two weeks
holiday) and multiplied for the duration of this study‟s monitoring period, this equates to
around 163.2 kWh per two weeks for Yorkshire and the Humber and 179.1 kWh per two
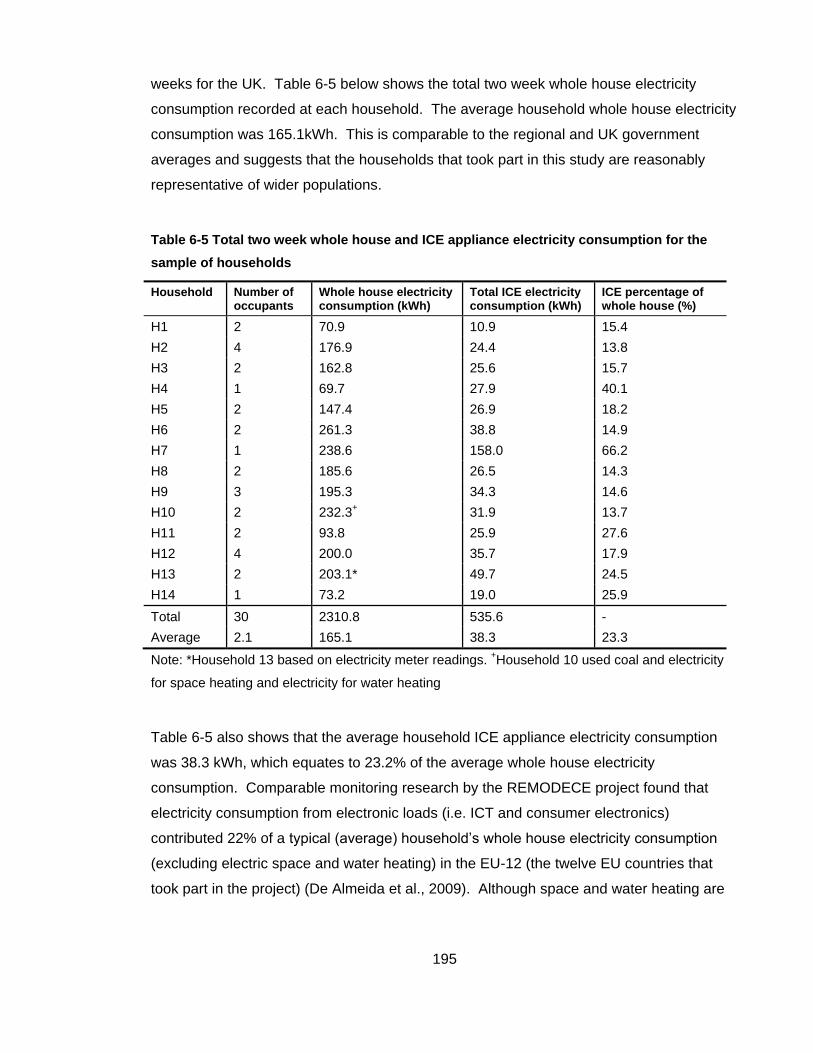
195
weeks for the UK. Table 6-5 below shows the total two week whole house electricity
consumption recorded at each household. The average household whole house electricity
consumption was 165.1kWh. This is comparable to the regional and UK government
averages and suggests that the households that took part in this study are reasonably
representative of wider populations.
Table 6-5 Total two week whole house and ICE appliance electricity consumption for the
sample of households
Household Number of occupants
Whole house electricity consumption (kWh)
Total ICE electricity consumption (kWh)
ICE percentage of whole house (%)
H1 2 70.9 10.9 15.4
H2 4 176.9 24.4 13.8
H3 2 162.8 25.6 15.7
H4 1 69.7 27.9 40.1
H5 2 147.4 26.9 18.2
H6 2 261.3 38.8 14.9
H7 1 238.6 158.0 66.2
H8 2 185.6 26.5 14.3
H9 3 195.3 34.3 14.6
H10 2 232.3+ 31.9 13.7
H11 2 93.8 25.9 27.6
H12 4 200.0 35.7 17.9
H13 2 203.1* 49.7 24.5
H14 1 73.2 19.0 25.9
Total 30 2310.8 535.6 -
Average 2.1 165.1 38.3 23.3
Note: *Household 13 based on electricity meter readings. +Household 10 used coal and electricity
for space heating and electricity for water heating
Table 6-5 also shows that the average household ICE appliance electricity consumption
was 38.3 kWh, which equates to 23.2% of the average whole house electricity
consumption. Comparable monitoring research by the REMODECE project found that
electricity consumption from electronic loads (i.e. ICT and consumer electronics)
contributed 22% of a typical (average) household‟s whole house electricity consumption
(excluding electric space and water heating) in the EU-12 (the twelve EU countries that
took part in the project) (De Almeida et al., 2009). Although space and water heating are

196
included in the whole house electricity consumption measurements for this thesis, the
average of 23% is similar to REMODECE. Therefore, the results from this thesis support
the consensus from other research that ICE appliance use has become a key contributor
to domestic electricity consumption in the UK and other EU countries.
6.3.2 Average electricity consumption: ICE appliance categories
This section describes the electricity consumption attributable to the use of the four main
appliance types. Table 6-6 shows the contribution of the four main ICE appliance
categories to the average whole house and ICE appliance electricity consumption for the
sample. On average, computing appliances were the highest energy consuming appliance
category, accounting for nearly 50% of the ICE appliance electricity consumption recorded
and around 11% of the whole house electricity consumption. This was followed by video
appliances, which accounted for around 9.2% of whole house electricity consumption.
Table 6-6 Average household two week electricity consumption for ICE appliance categories
ICE appliance category
Average household ICE electricity consumption (kWh)
% of ICE appliance electricity
consumption1
% of whole house electricity
consumption2
Video 15.2 39.9 9.2
Audio 2.7 6.9 1.6
Computing 18.7 48.8 11.3
Telephony 1.7 4.4 1.0
Total 38.3 100 23.2
1The percentage of the average household electricity consumption from all ICE appliances
(38.3 kWh). 2The percentage of the average whole house electricity consumption (165.1 kWh)
The results from this thesis are similar to those gained by the REMODECE project, which
found that entertainment appliances (i.e. video and audio) contributed 10% and office
equipment (i.e. computing) 12% of a typical (average) household‟s electricity consumption
in the EU-12 (De Almeida et al., 2009).

197
6.3.3 Average electricity consumption: video appliances
This section presents the average household electricity consumption from video
appliances. Table 6-7 shows that television use was the main form of video electricity
consumption. On average, television use resulted in around 57% of video appliance
electricity consumption and 23% of average household ICE appliance electricity
consumption. Although the majority of televisions monitored were CRT technologies, a
relatively similar amount of electricity was consumed by LCD televisions. This is largely
due to the higher power consumption of large LCD televisions and households‟ different
patterns of use (i.e. on average LCD televisions were viewed more extensively than CRT
televisions).
Table 6-7 Average household two week electricity consumption from video appliances
Appliance type Average household electricity consumption (kWh)
% of average household video electricity
consumption1
% of average household ICE electricity
consumption2
% of average household whole house electricity
consumption3
CRT television 4.65 30.5 12.1 2.8
LCD television 4.06 26.6 10.6 2.5
STB complex 3.45 22.7 9.0 2.1
VCR 0.94 6.1 2.4 0.6
Games console 0.87 5.7 2.3 0.5
HDD/DVD recorder
0.39 2.5 1.0 0.2
STB simple 0.24 1.6 0.6 0.2
DVD player 0.24 1.6 0.6 0.1
AV transmitter/ receiver
0.17 1.1 0.4 0.1
Surround sound equipment
0.10 0.7 0.3 0.06
AV booster 0.10 0.6 0.3 0.06
VCR/DVD 0.04 0.3 0.1 0.03
DVD recorder 0.00 0.0 0.0 0.0
Total 15.25 100 39.9 9.2
1The percentage of the average household electricity consumption from video appliances,
which was 15.25 kWh. 2The percentage of the average household electricity consumption
from all ICE appliances, which was 38.3 kWh. 3The percentage of the average whole house
electricity consumption, which was 165.1 kWh.

198
It is evident that complex STBs were the third highest energy consuming type of video
appliance, making them one of the most significant electricity end-uses. Since the
collection of the monitoring data, television service providers have expanded broadcasts in
high definition (HD). Although HD ready televisions were included in this study, none of
the households owned the most recent HD STBs, which generally have higher power
requirements than conventional technologies due to the provision of higher resolution
images (BIO Intelligence Service and Fraunhofer, 2008). Thus, it is likely that electricity
consumption from complex STBs use will become an even more significant end-use in UK
homes.
The average household electricity consumption from play and record equipment (i.e. VCR,
DVD and HDD appliances) was relatively low. On average, these appliances accounted
for around 4.2% of average household ICE appliance electricity consumption. On
average, older VCR technologies contributed the largest amount of electricity
consumption. More recent technologies, such as HDD/DVD recorders, did not have a high
ownership rate and it is difficult to draw any significant findings concerning their use.
However, the relatively high electricity consumption measured, from just two of these
appliance types, suggests that they are a more energy intensive means to record and view
video material.

199
6.3.4 Average electricity consumption: audio appliances
This section provides results concerning the average household electricity consumption
from audio appliances. Table 6-8 shows that, on average, integrated Hi-Fi systems were
by far the largest electricity consuming audio appliance. In terms of average household
electricity consumption, digital radios were more significant than the analogue radios.
Table 6-8 Average household two week electricity consumption from audio appliances
Appliance type Average household electricity consumption (kWh)
% of average household audio electricity
consumption1
% of average household ICE electricity
consumption2
% of average household whole house electricity
consumption3
Integrated Hi-Fi systems
1.65 62.0 4.3 1.0
Digital radio 0.41 15.5 1.1 0.3
Hi-Fi separates 0.24 8.9 0.6 0.1
Analogue radio 0.19 7.1 0.5 0.1
Clock radio 0.16 5.9 0.4 0.1
Mp3 docking station
0.01 0.5 0.03 0.01
Total 2.65 100 6.9 1.6
1The percentage of the average household electricity consumption from audio appliances,
which was 2.65 kWh. 2The percentage of the average household electricity consumption
from all ICE appliances, which was 38.3 kWh. 3The percentage of the average whole house
electricity consumption, which was 165.1 kWh.

200
6.3.5 Average electricity consumption: computing appliances
This section provides results concerning the average household electricity consumption
from computing appliances. Table 6-9 shows that, on average, desktop computers
accounted for the majority of electricity consumption from computing activities and LCD
monitors were the predominant form of computer display.
Table 6-9 Average household two week electricity consumption from computing appliances
Appliance type Average household electricity consumption (kWh)
% of average household computing electricity
consumption1
% of average household ICE electricity
consumption2
% of average household whole house electricity
consumption3
Desktop computer 10.26 54.9 26.8 6.2
Router 2.16 11.6 5.6 1.3
Laptop 1.57 8.4 4.1 1.0
LCD monitor 1.28 6.8 3.3 0.8
Multi functional printer
0.78 4.2 2.0 0.5
Modem 0.76 4.1 2.0 0.5
External hard drive 0.71 3.8 1.9 0.4
Office printer/ copier
0.42 2.3 1.1 0.3
Speakers 0.29 1.5 0.8 0.2
Desktop with LCD monitor
0.23 1.2 0.6 0.1
Printer inkjet 0.10 0.5 0.3 0.06
CRT monitor 0.08 0.4 0.2 0.05
Printer laser 0.03 0.2 0.1 0.02
Digital photo printer 0.01 0.04 0.02 0.005
Total 18.68 100 48.8 11.3
1The percentage of the average household electricity consumption from computing
appliances, which was 18.68 kWh. 2The percentage of the average household electricity
consumption from all ICE appliances, which was 38.3 kWh. 3The percentage of the average
whole house electricity consumption, which was 165.1 kWh.
Printing appliances accounted for around 7% of the average household computing
appliance electricity consumption. Multi-functional printers (which combine printing,
copying and scanning functions) were the most commonly used printing appliance.

201
Although only one office standard printer and copier was monitored during the study, this
type of non-domestic appliance has very different energy consumption characteristics to
domestic printing equipment. The total two week electricity consumption from this one
appliance was equivalent to over half of the total electricity consumption from the seven
multi-functional printers.
An interesting result was the electricity consumption attributable to network appliances,
such as routers and modems. Access to the Internet appears to have become a standard
facility in many UK homes and accounts for a significant portion of the average household
computing electricity consumption. On average, computer network devices accounted for
around 1.8% of the average household whole house electricity consumption.
6.3.6 Average electricity consumption: telephony appliances
This section provides results concerning the average household electricity consumption
from telephony appliances. Table 6-10 shows that, on average, cordless telephones
accounted for over two thirds of the telephony electricity consumption. In terms of
electricity consumption, telephony appliances were the least significant category of ICE
appliances. However, the use of traditional corded telephones, without external power
supplies (which are powered by a low current via the telephone line), would have reduced
the average household telephony electricity consumption by around 0.9%. This suggests
that increased use of cordless telephones is making telephony services a more energy
intensive activity.
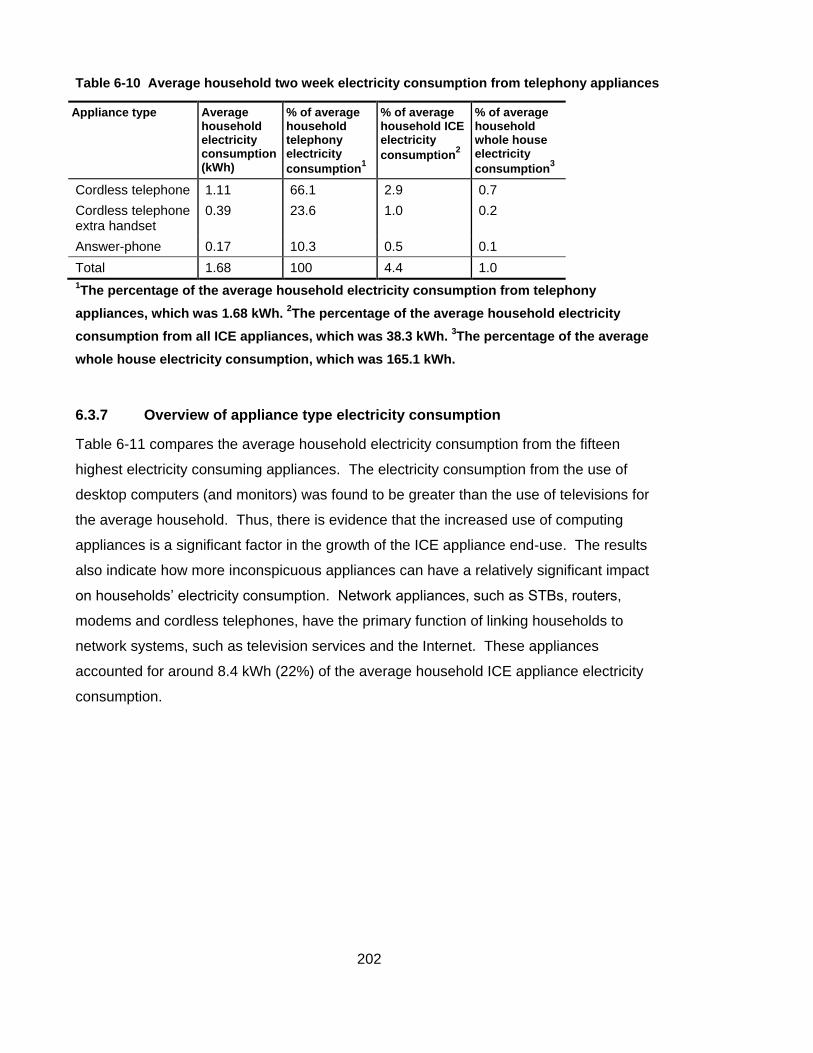
202
Table 6-10 Average household two week electricity consumption from telephony appliances
Appliance type Average household electricity consumption (kWh)
% of average household telephony electricity
consumption1
% of average household ICE electricity
consumption2
% of average household whole house electricity
consumption3
Cordless telephone 1.11 66.1 2.9 0.7
Cordless telephone extra handset
0.39 23.6 1.0 0.2
Answer-phone 0.17 10.3 0.5 0.1
Total 1.68 100 4.4 1.0
1The percentage of the average household electricity consumption from telephony
appliances, which was 1.68 kWh. 2The percentage of the average household electricity
consumption from all ICE appliances, which was 38.3 kWh. 3The percentage of the average
whole house electricity consumption, which was 165.1 kWh.
6.3.7 Overview of appliance type electricity consumption
Table 6-11 compares the average household electricity consumption from the fifteen
highest electricity consuming appliances. The electricity consumption from the use of
desktop computers (and monitors) was found to be greater than the use of televisions for
the average household. Thus, there is evidence that the increased use of computing
appliances is a significant factor in the growth of the ICE appliance end-use. The results
also indicate how more inconspicuous appliances can have a relatively significant impact
on households‟ electricity consumption. Network appliances, such as STBs, routers,
modems and cordless telephones, have the primary function of linking households to
network systems, such as television services and the Internet. These appliances
accounted for around 8.4 kWh (22%) of the average household ICE appliance electricity
consumption.

203
Table 6-11 The fifteen most significant electricity consuming ICE appliances for the sample
of households during the two week monitoring period
Appliance type Average household electricity consumption (kWh)
% of average household ICE electricity
consumption1
% of average household whole house electricity
consumption2
Desktop computer 10.26 26.8 6.2
CRT television 4.65 12.1 2.8
LCD television 4.06 10.6 2.5
STB complex 3.45 9.0 2.1
Router 2.16 5.6 1.3
Integrated Hi-Fi systems
1.65 4.3 1.0
Laptop 1.57 4.1 1.0
LCD monitor 1.28 3.3 0.8
Cordless telephone 1.11 2.9 0.7
VCR 0.94 2.4 0.6
Games console 0.87 2.3 0.5
Multi functional printer 0.78 2.0 0.5
Modem 0.76 2.0 0.5
External hard drive 0.71 1.9 0.4
Office printer/ copier 0.42 1.1 0.3
Remaining ICE appliances
3.6 9.6 2.0
Total 38.3 100% 23.2%
1The percentage of the average household electricity consumption from all ICE appliances,
which was 38.3 kWh. 2The percentage of the average whole house electricity consumption,
which was 165.1 kWh.
6.4 Average household power mode electricity consumption
This section presents the average household ICE appliance electricity consumption, from
the use of the different power modes. In section 5.6, a number of potential sources of
error in the results were described. In particular, it was highlighted that standby power
electricity consumption from network appliances and computers may be underestimated
and two additional categories of electricity consumption were used to reduce the influence
of subjective error. “Unclassifiable standby power” (U/C) electricity consumption is energy
consumption where the exact standby power mode could not be determined. “Unknown”

204
is electricity consumption that could not be attributed to either active or standby power
modes. Supplementary tables are included in Appendix J and show the percentage of
average household ICE appliance electricity consumption from each appliance type‟s
active power mode and the sum of the standby power modes.
6.4.1 Average power mode electricity consumption: ICE appliances
Table 6-12 shows that around 65% of ICE appliance electricity consumption, for the
average household, occurred from the active use of appliances. Standby power modes
accounted for 30% of the average household ICE electricity consumption. This equates to
around 7% of the average whole house electricity consumption.
Table 6-12 Average household two week ICE appliance electricity consumption from power
modes
Active (kWh)
Active standby (kWh)
Passive standby (kWh)
Off standby (kWh)
U/C standby (kWh)
Unknown (kWh)
Total standby (kWh)
Total (kWh)
Average 24.8 6.5 2.6 2.1 0.4 1.9 11.5 38.3
% 64.9 16.9 6.7 5.4 1.0 5.1 30.0 100
Results from previous standby power research (described in chapter 2) indicate a general
consensus that, for most OECD countries, standby consumption accounts for around 10%
of total domestic electricity consumption. Modelling work by the MTP suggests that
standby power consumption is responsible for between 5.2% and 10.5% of UK domestic
electricity consumption (MTP, 2009b). Although it is appreciated that this study has a
small sample size, when it is considered that this study has only monitored ICE appliance
loads, the results suggest that a figure of around 7% is a reasonable estimate.

205
6.4.2 Average power mode electricity consumption: ICE appliance categories
This section provides results concerning ICE appliance categories power mode electricity
consumption. Table 6-13 and Table 6-14 shows that the majority of ICE appliance
electricity consumption resulted from the active use of video and computing appliances.
On average, the video and computing appliance categories also accounted for the largest
amount of standby consumption.
Table 6-13 Average household two week electricity consumption from power mode use for
the ICE appliance categories
Appliance Category
Active (kWh)
Active standby (kWh)
Passive standby (kWh)
Off standby (kWh)
U/C standby (kWh)
Unknown (kWh)
Total standby (kWh)
Total (kWh)
Video 10.64 3.21 1.07 0.31 0.00 0.02 4.59 15.25
Audio 0.13 0.79 1.18 0.17 0.15 0.25 2.28 2.65
Computing 14.06 2.46 0.32 1.59 0.25 0.00 4.62 18.68
Telephony 0.00 0.00 0.00 0.00 0.00 1.68 0.00 1.68
Total 24.8 6.5 2.6 2.1 0.4 1.9 11.5 38.3
Table 6-14 Percentage of average household two week ICE appliance electricity
consumption from power mode use for the main ICE appliance categories
Appliance Category
Active (%)
Active standby (%)
Passive standby (%)
Off standby (%)
U/C standby (%)
Unknown (%)
Total standby (%)
Total (%)
Video 27.8 8.4 2.8 0.8 0.0 0.1 12.0 39.9
Audio 0.3 2.1 3.1 0.4 0.4 0.6 6.0 6.9
Computing 36.8 6.4 0.9 4.1 0.6 0.0 12.1 48.8
Telephony 0.0 0.0 0.0 0.0 0.0 4.4 0.0 4.4
Average 64.9 16.9 6.7 5.4 1.0 5.1 30.0 100.0
However, the above tables also indicate that standby consumption was particularly high for
the audio category. Around 86% of audio appliance electricity consumption was from
standby power modes. This equates to around 20% of the total ICE appliance standby
consumption for the average household. Thus, audio appliances are responsible for a
significant amount of wasted electricity, because this energy consumption was not
providing a useful purpose (e.g. none of these appliances were connected to a network).

206
For telephony appliances, it was not possible to attribute the electricity consumption to the
different power modes, due to the limitations of the AMS‟s resolution.
6.4.3 Average power mode electricity consumption: video appliances
This section presents results concerning the power mode electricity consumption from
video appliances. Table 6-15 and Figure 6-5 show the average household electricity
consumption from video appliances in the different power modes. Figure 6-6 shows the
percentage of each video appliance‟s electricity consumption from the different power
modes.
Table 6-15 Average household two week electricity consumption from video appliance
power modes
Appliance type Active (kWh)
Active standby (kWh)
Passive standby (kWh)
Off standby (kWh)
U/C standby (kWh)
Unknown (kWh)
Total standby (kWh)
Total (kWh)
CRT television 4.38 0.00 0.25 0.00 0.00 0.02 0.25 4.65
LCD television 4.01 0.00 0.04 0.00 0.00 0.00 0.04 4.06
STB complex 1.36 2.09 0.00 0.00 0.00 0.00 2.09 3.45
VCR 0.03 0.41 0.49 0.00 0.00 0.00 0.90 0.94
Games console 0.31 0.26 0.00 0.30 0.00 0.00 0.56 0.87
HDD/DVD recorder
0.24 0.07 0.08 0.00 0.00 0.00 0.15 0.39
STB simple 0.07 0.17 0.00 0.00 0.00 0.00 0.17 0.24
DVD player 0.03 0.03 0.17 0.01 0.00 0.00 0.21 0.24
AV transmitter/ receiver
0.09 0.08 0.00 0.00 0.00 0.00 0.08 0.17
Surround sound 0.10 0.00 0.00 0.00 0.00 0.00 0.00 0.10
AV booster 0.01 0.09 0.00 0.00 0.00 0.00 0.09 0.10
VCR/DVD 0.00 0.00 0.04 0.00 0.00 0.00 0.04 0.04
DVD recorder 0.00 0.00 0.00 0.00 0.00 0.00 0.00 0.00
Total 10.64 3.21 1.07 0.31 0.00 0.00 4.59 15.25

207
Figure 6-5 Average household two week electricity consumption from video appliances
power modes
Figure 6-6 Percentage of the average household video appliance electricity consumption,
from power modes, for the two week monitoring period
0.0
0.5
1.0
1.5
2.0
2.5
3.0
3.5
4.0
4.5
5.0
Ele
ctr
icit
y c
on
su
mp
tio
n (k
Wh
) Unknown
Off standby
Passive standby
Active standby
Active power
0%
10%
20%
30%
40%
50%
60%
70%
80%
90%
100%
Po
we
r m
od
e e
lec
tric
ity c
on
su
mp
tio
n (%
)
Unknown
Off standby
Passive standby
Active standby
Active

208
It is evident that television use in the active power mode was the main form of video
appliance electricity consumption. The active power mode accounted for around 96.3% of
television electricity consumption, which suggests that efforts to reduce households‟
electricity consumption from television use will require either the improved efficiency of this
power mode or changes to viewing patterns.
Despite a lower ownership rate, the active electricity consumption from LCD televisions
was similar to the CRT television value for the average household. This was due to LCD
television generally having higher power requirements in the active power mode and more
frequent active use. CRT televisions are expected to be phased out by 2015 (Stobbe,
2007c), which indicates that LCD televisions will be increasingly adopted by UK
households. As a result, it can be anticipated that average household ICE appliance
electricity consumption is likely to experience further increases.
On average, simple and complex STBs consumed a relatively large amount of electricity in
the active mode. However, on average, standby consumption was more significant and
accounted for around 61.2% of simple and complex STB electricity consumption. The
results suggest that the move to exclusively digital services, in the UK, will result in
increased domestic electricity consumption, particularly if households‟ adoption of satellite
and cable services becomes more ubiquitous. An important aspect of STBs electricity
consumption is that the active standby power mode is required to maintain network
integrity to enable regular software updates. However, the high energy consumption for
this function (i.e. twice the energy used to view broadcast material) suggests that improved
product design is required to reduce standby power loads.
This recommendation also appears to apply to play and record equipment and games
consoles. Older VCR technologies consumed 96.2% of their electricity in standby power
modes and were generally found to have little active use in the households (only three
households actively using this appliance type over the two weeks of monitoring). Similarly,
on average, 88.4% of DVD player electricity consumption was from devices in standby
power modes. Interestingly, the off standby power mode electricity consumption from

209
games consoles accounted for 95.5% of the entire off standby power electricity
consumption recorded for video appliances. This may indicate that electricity consumption
from games consoles could be significantly reduced through the inclusion of hard-off
switches (which disconnect appliance components from the mains supply) in the appliance
design.
6.4.4 Average power mode electricity consumption: audio appliances
As mentioned previously, around 86% of the audio appliance electricity consumption, for
the average household, was from standby power modes. However, the overall evaluation
of audio appliance standby power electricity consumption is believed to be an
underestimate, due to difficulties in the allocation of electricity consumption from some
digital radios power modes. Table 6-16 and Figure 6-7 show the average household
electricity consumption from audio appliances, in the different power modes. Figure 6-8
shows the percentage of audio appliances electricity consumption from the different power
modes.
Table 6-16 Average household two week electricity consumption from audio appliance
power modes
Appliance type Active (kWh)
Active standby (kWh)
Passive standby (kWh)
Off standby (kWh)
U/C standby (kWh)
Unknown (kWh)
Total standby (kWh)
Total (kWh)
Integrated Hi-Fi systems
0.07 0.56 0.87 0.15 0.00 0.00 1.58 1.65
Digital radio 0.02 0.00 0.14 0.00 0.00 0.25 0.14 0.41
Hi-Fi separates 0.01 0.06 0.00 0.02 0.14 0.00 0.23 0.24
Analogue radio 0.02 0.00 0.17 0.00 0.00 0.00 0.17 0.19
Clock radio 0.00 0.16 0.00 0.00 0.00 0.00 0.16 0.16
Mp3 docking station
0.004 0.002 0.00 0.00 0.006 0.00 0.008 0.012
Total 0.13 0.79 1.18 0.17 0.15 0.25 2.28 2.65

210
Figure 6-7 Average household two week electricity consumption from audio appliances
power modes
Figure 6-8 Percentage of audio appliances electricity consumption from power modes for
two week monitoring period
0.0
0.2
0.4
0.6
0.8
1.0
1.2
1.4
1.6
1.8E
lec
tric
ity c
on
su
mp
tio
n (k
Wh
)
Unknown
U/C standby
Off standby
Passive standby
Active standby
Active power
0%
10%
20%
30%
40%
50%
60%
70%
80%
90%
100%
Po
we
r m
od
e e
lec
tric
ity c
on
su
mp
tio
n (%
)
Unknown
U/C standby
Off standby
Passive standby
Active standby
Active power

211
Integrated Hi-Fi systems were found to be one of the most energy consuming ICE
appliances. However, little of this electricity consumption was from active use. Standby
power modes accounted for 95.8% of integrated-Hi-Fi systems‟ electricity consumption.
Thus, integrated-Hi-Fi systems were also one of the most significant appliance types to
overall ICE appliance standby consumption, being responsible for 13.7% of the total
standby consumption for the average household. Although clock radios were one of the
lowest electricity consuming appliances they were used exclusively in the standby power
mode to provide clock displays.
These findings suggest that efforts to reduce domestic electricity consumption could
benefit from reducing the standby consumption from audio equipment, and in particular
integrated Hi-Fi systems. In contrast to other appliances, such as STBs, the standby
consumption was not used to maintain network functions and could be reduced by simply
disconnecting the appliances.
6.4.5 Average power mode electricity consumption: computing appliances
This section presents results regarding the power mode electricity consumption from
computing appliances. Table 6-17 and Figure 6-9 show the average household electricity
consumption from computing appliances, in the different power modes. Figure 6-10 shows
the percentage of the computing appliances electricity consumption from the power
modes. The majority of the active electricity consumption for the average household
resulted from the use of desktop computers, which used 93.2% of their electricity
consumption in the active power mode. This equates to around 25% of the total ICE
appliance electricity consumption for the average household and was the most significant
form of ICE appliance electricity consumption. However, as mentioned section 5.6,
standby power consumption from desktop and laptop computers may be underestimated,
because of difficulties in ascertaining whether automatic power management settings
became operational (due to computers often operating in a wide range of power loads
while active). This difficulty may imply that power management settings may not have a
particularly significant impact on reducing computer‟s electricity consumption.

212
Table 6-17 Average household two week electricity consumption from computing appliances
power modes
Appliance type Active (kWh)
Active standby (kWh)
Passive standby (kWh)
Off standby (kWh)
U/C standby (kWh)
Unknown (kWh)
Total standby (kWh)
Total (kWh)
Desktop computer 9.56 0.00 0.00 0.70 0.00 0.00 0.70 10.26
Router 0.72 1.43 0.00 0.00 0.00 0.00 1.43 2.16
Laptop 1.50 0.00 0.01 0.07 0.00 0.00 0.08 1.57
LCD monitor 0.98 0.00 0.02 0.28 0.00 0.00 0.30 1.28
Multi functional printer
0.01 0.45 0.00 0.07 0.25 0.00 0.77 0.78
Modem 0.43 0.33 0.00 0.00 0.00 0.00 0.33 0.76
External hard drive 0.66 0.00 0.00 0.05 0.00 0.00 0.05 0.71
Office printer/ copier
0.10 0.04 0.29 0.00 0.00 0.00 0.33 0.42
Speakers 0.01 0.16 0.00 0.12 0.00 0.00 0.28 0.29
Desktop with LCD monitor
0.08 0.00 0.00 0.15 0.00 0.00 0.15 0.23
Printer inkjet 0.00 0.04 0.00 0.06 0.00 0.00 0.10 0.10
CRT monitor 0.00 0.00 0.00 0.08 0.00 0.00 0.08 0.08
Printer laser 0.02 0.01 0.00 0.00 0.00 0.00 0.01 0.03
Digital photo printer 0.00 0.00 0.00 0.01 0.00 0.00 0.01 0.01
Total 14.06 2.46 0.32 1.59 0.25 0.00 4.62 18.68

213
Figure 6-9 Average household two week electricity consumption from computing appliances
power modes
Figure 6-10 Percentage of computing appliances two week electricity consumption from
power modes
0
1
2
3
4
5
6
7
8
9
10
11
Ele
ctr
icit
y c
on
su
mp
tio
n (k
Wh
)
Unknown
U/C standby
Off standby
Passive standby
Active standby
Active power
0%
10%
20%
30%
40%
50%
60%
70%
80%
90%
100%
Po
we
r m
od
e e
lec
tric
ity c
on
su
mp
tio
n (%
)
Unknown
U/C standby
Off standby
Passive standby
Active standby
Active power

214
Routers and modems consumed 38.2% of the standby power electricity consumption from
computing appliances, which equates to around 15.4% of the total standby consumption
for the average household. Thus, computing network appliances appear to have become
a significant source of household standby consumption. Although, on average, none of
the printing appliance types featured amongst the very highest electricity consuming
appliances (in section 6.3.7), around 91% of printing appliances electricity consumption
was from standby power modes. This equates to around 10.5% of the total standby
consumption for the average household. Thus, much of the network and printing
appliances‟ electricity consumption served no real purpose. Furthermore, around 76% of
the off standby consumption, for the average household, was from computing appliances
(particularly computers and LCD monitors), which suggests that the inclusion of hard-off
switches, in computing equipments design, could help to reduce wasted electricity
consumption.
6.4.6 Average power mode electricity consumption: telephony appliances
Due to the limited resolution of the AMS and the similar power load requirements of
telephony appliances in the different power modes, it was not possible to ascertain the
electricity consumption for the different power modes. Table 6-18 shows that all the
telephony appliances electricity consumption has been categorised as unknown.
Table 6-18 Average household two week electricity consumption from telephony appliance
power modes
Appliance type Unknown (kWh)
Total (kWh)
Cordless telephone 1.11 1.11
Cordless telephone extra handset 0.39 0.39
Answer-phone 0.17 0.17
Total 1.68 1.68
It is probable that the vast majority of the telephony appliance electricity consumption was
in standby power modes, due to many of the households reporting that handsets were
rarely used (perhaps once or twice a day), often due to the more frequent use of mobile

215
telephones. Previous research by Vowles et al. (2001) used estimates of hours of
telephone use to estimate telephony appliance electricity consumption from spot
measurements. This thesis has avoided the use of subjective estimates to ensure that
values presented are as free from subjective error as possible. However, even with a very
conservative estimation, of four hours of active use per appliance, per day, an additional
1.4 kWh would be added to the total standby consumption for the average household.
This would result in standby power modes accounting for around 33.7% of total ICE
appliance electricity consumption and 7.8% of whole house electricity consumption.
6.4.7 Overview of appliance type power mode electricity consumption
The results in this section have highlighted that the majority of the ICE appliance electricity
consumption, for the average household, was from the active use of desktop computers,
LCD and CRT televisions, laptops and complex STBs. This is evident in Table 6-19, which
compares the fifteen appliances with the highest average household electricity
consumption from the active power mode. These five appliance types were also amongst
the highest electricity consuming ICE appliances (shown previously in section 6.3.7). This
finding suggests that the reduction of these appliance types active power electricity
consumption could provide significant gains in reducing overall domestic ICE appliance
energy consumption.

216
Table 6-19 The fifteen ICE appliances with the highest two week active power mode
electricity consumption for the average household
Appliance type Active (kWh)
Active standby (kWh)
Passive standby (kWh)
Off standby (kWh)
U/C standby (kWh)
Unknown (kWh)
Total standby (kWh)
Total (kWh)
Desktop computer
9.56 0.00 0.00 0.70 0.00 0.00 0.70 10.26
CRT television 4.38 0.00 0.25 0.00 0.00 0.02 0.25 4.65
LCD television 4.01 0.00 0.04 0.00 0.00 0.00 0.04 4.06
Laptop 1.50 0.00 0.01 0.07 0.00 0.00 0.08 1.57
STB complex 1.36 2.09 0.00 0.00 0.00 0.00 2.09 3.45
LCD monitor 0.98 0.00 0.02 0.28 0.00 0.00 0.30 1.28
Router 0.72 1.43 0.00 0.00 0.00 0.00 1.43 2.16
External hard drive
0.66 0.00 0.00 0.05 0.00 0.00 0.05 0.71
Modem 0.43 0.33 0.00 0.00 0.00 0.00 0.33 0.76
Games console 0.31 0.26 0.00 0.30 0.00 0.00 0.56 0.87
HDD/DVD recorder
0.24 0.07 0.08 0.00 0.00 0.00 0.15 0.39
Surround sound 0.10 0.00 0.00 0.00 0.00 0.00 0.00 0.10
Office printer/ copier
0.10 0.04 0.29 0.00 0.00 0.00 0.33 0.42
AV transmitter/ receiver
0.09 0.08 0.00 0.00 0.00 0.00 0.08 0.17
Desktop with LCD monitor
0.08 0.00 0.00 0.15 0.00 0.00 0.15 0.23
Remaining ICE appliances
0.28 2.10 1.91 0.55 0.40 1.88 4.96 7.22
Total 24.8 6.5 2.6 2.1 0.4 1.9 11.5 38.3
Electricity consumption from the standby power modes accounted for around 30% of the
average household ICE appliance electricity consumption. Table 6-20 compares the
fifteen ICE appliances with the highest average household electricity consumption from
standby power modes. In addition to relatively high active power mode electricity
consumption, complex STBs and routers are also amongst the appliances with highest
average household standby consumption. This indicates that network appliances have
become key contributors to domestic standby consumption. It is also apparent that audio
equipment (e.g. integrated Hi-Fi systems), printers and play and record equipment (e.g.
VCRs, DVD players) have a significant contribution to the total standby consumption for

217
the average household. In addition to the benefit from improved product design, it appears
that simple changes to behaviour could reduce the electricity consumption from these
appliances due to many of them being used infrequently.
Table 6-20 The fifteen ICE appliances with the highest two week standby power mode
electricity consumption for the average household
Appliance type Active (kWh)
Active standby (kWh)
Passive standby (kWh)
Off standby (kWh)
U/C standby (kWh)
Unknown (kWh)
Total standby (kWh)
Total (kWh)
STB complex 1.36 2.09 0.00 0.00 0.00 0.00 2.09 3.45
Integrated Hi-Fi systems
0.07 0.56 0.87 0.15 0.00 0.00 1.58 1.65
Router 0.72 1.43 0.00 0.00 0.00 0.00 1.43 2.16
VCR 0.03 0.41 0.49 0.00 0.00 0.00 0.90 0.94
Multi functional printer
0.01 0.45 0.00 0.07 0.25 0.00 0.77 0.78
Desktop computer
9.56 0.00 0.00 0.70 0.00 0.00 0.70 10.26
Games console 0.31 0.26 0.00 0.30 0.00 0.00 0.56 0.87
Modem 0.43 0.33 0.00 0.00 0.00 0.00 0.33 0.76
Office printer/ copier
0.10 0.04 0.29 0.00 0.00 0.00 0.33 0.42
LCD monitor 0.98 0.00 0.02 0.28 0.00 0.00 0.30 1.28
Speakers 0.01 0.16 0.00 0.12 0.00 0.00 0.28 0.29
CRT television 4.38 0.00 0.25 0.00 0.00 0.02 0.25 4.65
Hi-Fi separates 0.01 0.06 0.00 0.02 0.14 0.00 0.23 0.24
DVD player 0.03 0.03 0.17 0.01 0.00 0.00 0.21 0.24
STB simple 0.07 0.17 0.00 0.00 0.00 0.00 0.17 0.24
Other ICE appliances
6.73 0.41 0.51 0.45 0.01 1.88 1.37 10.07
Total 24.8 6.5 2.6 2.1 0.4 1.9 11.5 38.3
The average household results presented thus far, have provided a useful means to
understand the typical ICE appliance electricity consumption that occurred in the sample of
households. The values result from two key variables: (i) the power loads of the
appliances in the different power modes; (ii) the duration of use in the different power
modes. The influence of these variables is explored in following sections.

218
6.5 Average appliance power loads of the ICE appliances
This section presents results for the average power loads of the ICE appliances. These
results are appliance averages, rather than household averages, and are derived by
dividing each appliance type‟s average power load by the number of appliances monitored
in the different power modes. This is shown in equation 9 below.
Equation 9
These values illustrate the different power characteristics of the appliances. However, the
values presented must be viewed with a degree of caution in respect to their
representativeness of wider populations. Only a relatively small number of appliances
were monitored in this study and many of the appliances were not used in all their power
modes (e.g. some appliances remained continuously in one power mode). As a result,
some power loads cannot be presented for each appliance type‟s different power modes.
6.5.1 Average appliance power loads: video appliances
Table 6-21 shows average power loads for video appliances. In addition to the appliance
types shown in previous tables, average appliance power loads are also presented for
televisions used in different locations of the home and for two different types of complex
STBs. Basic complex STBs are used solely to decrypt “pay to view” satellite and cable
broadcast services. HDD complex STBs have an internal hard drive to provide
programme recording and real time pause functions. Although the presentation of this
level of detail goes beyond other appliance monitoring studies (i.e. STBs are often
grouped together), the values provide a reference for additional aspects of the electricity
consumption to be presented in chapter 7.

219
Table 6-21 Average video appliance power loads
Appliance type Active (W)
Active standby (W)
Passive standby (W)
Off standby (W)
CRT television 67.3 - 3.8 0.0
LCD television 102.3 - 1.1 -
CRT living area 90.9 - 2.3 0.0
LCD living area 131.6 - 0.6 -
CRT bedroom and kitchen 41.1 - 4.6 0.0
LCD bedroom and kitchen 29.0 - 1.6 -
STB simple 6.2 6.2 - -
STB complex 17.8 15.8 - -
STB complex basic 14.0 14.0 - -
STB complex HDD 26.9 20.2 - -
VCR 16.8 12.4 4.9 -
VCR/DVD 13.9* - 1.7* -
DVD player 17.2 - 2.3 -
HDD/DVD recorder 25.0 3.7* 4.6* -
AV booster 2.1 2.1 - -
AV transmitter/ receiver 3.6 3.6 - -
Games console 42.9 38.4 8.8 2.0
*only 1 appliance monitored in power mode
The comparison of the appliances in Table 6-21 provides an indication of why ICE
appliance electricity consumption has been rising rapidly in recent years. On average,
newer LCD televisions have a higher active power load than CRT televisions (largely due
to their larger average screen sizes). There is also evidence that the wider range of
functions associated with recent STB technologies are resulting in increased electricity
consumption. On average, more recent complex STBs with HDD functions required an
additional 12.9 W of power in the active mode than the older basic STBs.
Although there is only limited data concerning play and record equipment, there is some
evidence that these appliances are becoming more energy intensive. On average, the
active power load from the two HDD/DVD recorders monitored in this study is 8.2 W
greater than that for VCRs. Furthermore, one of the games consoles monitored in this
study was mainly used for viewing Blueray DVDs rather than playing computer games. On
average, this appliance used over 133 W in the active power mode (around thirteen times

220
higher than the average DVD player). LCD televisions lower average passive standby
power loads indicates that manufacturers have begun to reduce standby power loads in
more recently manufactured equipment. However, the similarity of STBs average active
and active standby loads suggests that improved efficiency of STBs standby functions
could help to reduce the electricity consumption from this appliance.
6.5.2 Average appliance power loads: audio appliances
Due to the relatively limited range of audio appliances monitored by this study, and
difficulties in attributing energy consumption to the power modes, only a limited number of
average power values have been presented in Table 6-22.
Table 6-22 Average audio appliance power loads
Appliance type Active (W) Active standby (W)
Passive standby (W)
Off standby (W)
Integrated Hi-Fi systems
19.5 16.5 12.6 3.1
Analogue radio 5.7 - 3.7 -
Digital radio 6.1 - 2.1 -
Clock radio - 2.2 - -
Mp3 docking station 5.1 0.5* - -
*only 1 appliance monitored in power mode
The values presented for digital radios must be viewed with a degree of caution. Two of
the five digital radios monitored in this study were excluded from the averages due to the
appliances having very similar active and standby power modes. The two excluded digital
radios had overall average power loads of 9.7 W and 7.8 W. Thus, there is a suggestion
that digital radios may be more energy intensive than traditional analogue radios, which is
reflected in the higher average household results presented in section 6.3.4. However,
integrated Hi-Fi systems‟ relatively high average standby power loads helps to explain why
around 96% of integrated Hi-Fi electricity consumption resulted from standby consumption.
Overall, the similarity of many of the audio appliances‟ active and standby loads suggests
a need for improvements in the energy efficiency of audio standby functions.

221
6.5.3 Average appliance power loads: computer appliances
The computing appliances‟ average power loads are shown in Table 6-17. The combined
average active power load of a desktop computer and LCD monitor is around 102 W. In
contrast, on average, laptop computer used around 30% of this power consumption.
Table 6-23 Average computing appliance power loads
Appliance type Active (W)
Active standby (W)
Passive standby (W)
Off standby (W)
Desktop computer 77.0 - 3.5* 2.8
LCD monitor 24.8 - 6.6 1.8
CRT monitor 28.0* - - 3.4*
Laptop 31.6 20.2* 11.4 2.2
Desktop with LCD monitor 98.6* - - 6.5*
Printer inkjet 11.7 2.3 - 1.3
Multi-functional printer 12.7 7.6 - 3.1*
Printer laser 52.6* 5.1* - -
Office printer/ copier 75.6* 17.4* 14.0* -
Digital photo printer - - - 0.3*
Speakers 9.5 3.4 - 5.0*
External hard drive 13.8 - - 1.1
Router 7.6 7.7 - -
Modem 7.9 7.9 - -
*only 1 appliance monitored in power mode
When it is considered that the active use of desktop computers‟ was responsible for
around 25% of average household ICE appliance electricity consumption, this finding
suggests that encouraging households to use laptops, rather than desktop computers, for
computing activities could help to reduce overall ICE appliance electricity consumption.
Conversely, this finding also suggests that desktop computers could be made more energy
efficient by using similar components to those already used in laptops.
Table 6-17 also shows that the office printer/copier monitored in this study had much
higher power loads than the more widely used domestic printers (i.e. multi-functional and
inkjet printers). This indicates how the use of non-domestic equipment in the domestic
sector can result in increased electricity consumption. The relatively low average power

222
loads for routers and modems also indicates that low continuous power loads can have a
significant impact on households‟ electricity consumption (these two appliance types
consumed around 7.6% of the average household ICE appliance electricity consumption).
6.5.4 Average appliance power loads: telephony appliances
Due to the electricity consumption of telephony appliances being apportioned to unknown
electricity consumption, average power load values for the different power modes could
not be calculated. Cordless telephones had an average power load of 3.4 W, cordless
extra handsets 2.7 W and answer-phones 3.6 W.
6.6 Average appliance duration of use in power modes
This section presents average appliance duration of use values to provide an indication of
the extent that the appliances were used in the different power modes. The
“disconnected” value indicates the average time that an appliance type was switched off at
the mains supply or unplugged. The “device off” value indicates the average time that an
appliance type was turned off by the switch on the appliance. The “device off” state can
be compared to the “standby off” mode used in previous sections. However, a number of
the appliance types, such as CRT televisions, did not consume standby electricity in this
state due to having hard-off switches. The values presented do not incorporate appliance
ownership levels. Therefore, additional duration of use values are included for the
average household in Appendix K.
6.6.1 Average appliance duration of use: video appliances
Table 6-24 shows that, on average, LCD televisions were used more frequently in the
active mode than CRT televisions and more recent HDD recording appliances were used
in the active mode more often than older VCR technologies.

223
Table 6-24 Average daily video appliance duration of use in the different appliance power
states
Appliance type Active (Hours)
Active standby (Hours)
Passive standby (Hours)
Device off (Hours)
Discon-nected (Hours)
U/C standby (Hours)
Unknown (Hours)
Total (Hours)
Television CRT 2.8 0.0 2.5 10.9 7.9 0.0 0.03 24.0
Television LCD 4.3 0.0 6.6 5.8 7.4 0.0 0.0 24.0
STB simple 5.8 13.9 0.0 0.0 4.3 0.0 0.0 24.0
STB complex 7.7 11.9 0.0 0.0 4.4 0.0 0.1 24.0
VCR 0.2 4.0 13.6 0.0 6.1 0.0 0.1 24.0
VCR/DVD* 0.2 0.0 23.8 0.0 0.0 0.0 0.0 24.0
DVD player 0.2 0.1 5.8 2.4 15.5 0.0 0.1 24.0
DVD recorder* 0.0 0.0 0.0 0.0 24.0 0.0 0.0 24.0
HDD/DVD recorder 4.6 9.6 8.4 0.0 1.4 0.0 0.0 24.0
Games console 1.0 2.3 0.0 14.3 6.4 0.0 0.1 24.0
Surround sound 1.7 0.0 0.0 7.2 15.2 0.0 0.0 24.0
AV booster 2.1 21.9 0.0 0.0 0.0 0.0 0.0 24.0
AV transmitter/ receiver
12.0 11.7 0.0 0.0 0.2 0.0 0.0 24.0
*only 1 appliance monitored
The values presented in Table 6-24 are not adjusted for the sample‟s higher ownership
rate for CRT televisions (i.e. many of the CRT televisions were used as secondary
televisions and were used less frequently). Therefore, it is useful to also view the average
household values included in Appendix K. These show that the active use of CRT
televisions was more extensive in the average household due to the 150% ownership rate
and that, on average, around 6.5 hours of television was viewed each day in the average
home.
6.6.2 Average appliance duration of use: audio appliances
Table 6-25 shows the audio appliances average daily duration of use, in the different
operational states. Audio appliances high standby consumption is reflected in the much
higher average durations of use in standby power modes. However, half of the
households that owned integrated Hi-Fi systems disconnected them when they were not in
active use. Therefore, the standby and device off states are used for around 52% of the
time and the disconnected mode is used for around 46%.

224
Table 6-25 Average daily audio appliance duration of use in the different appliance states
Appliance type Active (Hour)
Active standby (Hours)
Passive standby (Hours)
Device off (Hours)
Discon-nected (Hours)
U/C standby (hours)
Unknown (Hours)
Total (Hours)
Integrated Hi-Fi systems
0.3 2.8 5.8 4.0 11.1 0.0 0.0 24.0
Hi-Fi separates 0.1 0.7 0.0 3.4 6.9 13.0 0.0 24.0
Digital radio* 1.1 0.0 22.9 0.0 0.0 0.0 0.0 24.0
Analogue radio 1.0 0.0 11.0 0.0 12.0 0.0 0.0 24.0
Clock radio 0.0 24.0 0.0 0.0 0.0 0.0 0.0 24.0
Mp3 docking station
0.3 0.5 0.0 0.0 15.3 7.9 0.0 24.0
*Excludes two digital radios with unknown electricity consumption
Digital radios were generally not disconnected from the main electricity supply. As will be
discussed in chapter 8, householders often left appliances in standby modes to prevent
the loss of appliance settings. Clock radios were also left continually in the active standby
power mode to maintain the clock display.
6.6.3 Average appliance duration of use: computing appliances
It is apparent from Table 6-26 that, on average, desktop computers spent a greater portion
of their time in an active state than the associated LCD monitors. This difference is due to
computers often being left running without the direct involvement of a householder. The
average laptop was used in the active mode for a similar time period to desktop
computers. Thus, the significantly lower average household electricity consumption
(presented in section 6.3.5) highlights that laptop computers provide a more energy
efficient means to conduct computing activities.

225
Table 6-26 Average daily computing appliance duration of use in the different appliance
states
Appliance type Active (Hours)
Active standby (Hours)
Passive standby (Hours)
Device off (Hours)
Discon-nected (Hours)
U/C standby (hours)
Unknown (Hours)
Total (Hours)
Desktop computer
6.0 0.0 0.1 13.3 4.6 0.0 0.0 24.0
LCD monitor 2.9 0.0 1.4 14.8 4.9 0.0 0.0 24.0
CRT monitor 0.0 0.0 12.0 0.0 12.0 0.0 0.0 24.0
Desktop with LCD monitor
0.8 0.0 0.0 23.2 0.0 0.0 0.0 24.0
Laptop 5.0 0.0 0.1 4.2 14.6 0.0 0.0 24.0
Printer inkjet 0.1 2.3 0.0 10.6 10.3 0.0 0.0 24.0
Multi-functional printer
0.1 7.3 0.0 3.4 9.7 3.4 0.0 24.0
Printer laser* 0.4 1.9 0.0 21.8 0.0 0.0 0.0 24.0
Office printer/ copier*
1.3 2.2 20.5 0.0 0.0 0.0 0.0 24.0
Digital photo printer*
0.0 0.0 0.0 24.0 0.0 0.0 0.0 24.0
Speakers 0.1 7.1 0.0 6.8 10.0 0.0 0.0 24.0
External hard drive
12.0 0.0 0.0 12.0 0.0 0.0 0.0 24.0
Router 7.3 14.5 0.0 0.0 2.1 0.0 0.0 24.0
Modem 9.8 14.2 0.0 0.0 0.0 0.0 0.0 24.0
*only 1 appliance monitored
6.6.4 Average appliance duration of use: telephony appliances
Table 6-27 shows the telephony appliances average daily duration of use, in the different
operational states. For one household, a cordless telephone was intentionally
disconnected for a period of around 5.5 days. However, all the other telephony appliances
remained continuously connected to the mains power supply.

226
Table 6-27 Average daily telephony appliance duration of use in the different operational
states
Appliance type Device off (Hours)
Discon-nected (Hours)
U/C standby (hours)
Unknown (Hours)
Total (Hours)
Cordless telephone
0.0 0.6 0.0 23.4 24.0
Cordless telephone extra handset
0.0 0.0 0.0 24.0 24.0
Answer-phone 0.0 0.0 0.0 24.0 24.0
6.7 Average household electricity consumption and power load profiles
This section presents results that combine the electricity consumption and duration of use
data collected from the sample of households. Electricity consumption and power load
profiles are presented for the average household hourly ICE appliance use. The profiles
are produced at the main ICE appliance category level for clarity. Figure 6-11 shows the
power profile for an average day, for the average household.
Figure 6-11 Average daily ICE appliance power consumption for the average household
0
20
40
60
80
100
120
140
160
180
200
1 2 3 4 5 6 7 8 9 10 11 12 13 14 15 16 17 18 19 20 21 22 23 24
Po
we
r (W
)
Hours
Total ICE
Video
Audio
Computing
Telephony

227
The power values from between 3am and 6am suggests that, on average, ICE appliances
in standby and continuous active power modes produce a base load of around 78 W.
However, as will be described in chapter 7, one household used a number of computers
continuously in the active power mode. When this household was removed from the
calculation, this value falls to 50.6 W.
On average, video appliances become more active from around 7am, when televisions are
used at breakfast time. There is also a peak in video appliance consumption between
1pm and 3pm, which can be linked to lunchtime viewing. Peak active video appliance use
is between 6pm and 12am when televisions are used more intensively after working hours.
Computing appliance electricity consumption remains relatively constant, due to a number
of computers being used continuously throughout the day. However, there is also a slight
peak after working hours from 8pm. Audio and telephony appliances remain relatively
constant throughout the day, due to being predominantly used in standby power modes.
Patterns of behaviour can be seen in more detail through power profiles for an average
working weekday and an average weekend day, which are shown in Figure 6-12 and
Figure 6-13. The figures show that the average active use of video appliances begins
slightly earlier on weekdays. It is also apparent that active video appliance use results in a
higher and more constant power load throughout the average weekend day, due to higher
levels of occupancy. In contrast, there is a more noticeable peak in video appliance
electricity consumption in weekday evenings when many participants returned from work.
For computing appliances, the differences in power consumption between weekdays and
weekend days are less obvious. However, on average, there is a higher power load in
weekday mornings, which may be linked to a number of householders who worked from
home.

228
Figure 6-12 Average daily ICE appliance power consumption for weekend days for the
average household
Figure 6-13 Average daily ICE appliance power consumption for working weekdays for the
average household
0
20
40
60
80
100
120
140
160
180
200
1 2 3 4 5 6 7 8 9 10 11 12 13 14 15 16 17 18 19 20 21 22 23 24
Po
we
r (W
)
Hours of the day
Total ICE
Video
Audio
Computing
Telephony
0
20
40
60
80
100
120
140
160
180
200
1 2 3 4 5 6 7 8 9 10 11 12 13 14 15 16 17 18 19 20 21 22 23 24
Po
we
r (W
)
Hours of the day
Total ICE
Video
Audio
Computing
Telephony

229
6.8 Summary
This chapter has focused on average household ICE appliance electricity consumption
gained from the monitoring of fourteen UK households. The results support the current
consensus that ICE appliances have become a significant domestic energy end-use in UK
and EU countries. On average, around 23% of the households‟ whole house electricity
consumption was from ICE appliance use and around 7% of this consumption can be
attributed to standby power modes.
Desktop computers and televisions were the most significant electricity consuming
appliances and the majority of their electricity consumption was from the active power
mode. The results suggest that network appliances, such as STBs and routers, have
become standard equipment in many UK homes. These devices accounted for significant
amounts of average household active and standby power consumption. Audio equipment
(e.g. integrated Hi-Fi systems), printing equipment, and play and record equipment (e.g.
DVD players, VCRs) also accounted for a significant amount of average household
standby consumption due to often being left continuously in standby modes.
The results also suggest that more recent technologies (e.g. LCD televisions, HDD
complex STBs, video play and record equipment, digital radios and cordless telephones)
are more energy intensive. However, the increased use of laptop computers may have the
potential to significantly reduce the electricity consumption from domestic computing
activities. A number of potential measures to reduce ICE appliance electricity
consumption were introduced and will be discussed in more detail in chapter 10.

230
Chapter 7. Results: Variations in household ICE appliance
electricity consumption
7.1 Introduction
Although the results presented in chapter 6 provide a means to understand the typical ICE
electricity consumption that occurred in the study sample, the average values hide some of
the important variations in household appliance use. Fundamentally, the variations in ICE
appliance electricity consumption relate to three main factors:
1. The number of appliances owned by households;
2. The types of appliances owned by households (i.e. the power characteristics of the
appliances in the different power modes);
3. The patterns of use in the households (i.e. householder‟s behaviour influences the
appliances duration of use in the different power modes).
In a sense, the number and types of appliances owned by a household determines the
physical infrastructure in which electricity consumption can occur. The greater the number
of appliances, the more opportunities exist for electricity consumption. The different power
requirements of the appliances (in the different power modes) also influences the amount
of electricity consumption that occurs. For example, an hour‟s active use of an average
LCD television will consume more electricity than an average CRT television. Patterns of
use also have a critical part to play, as they determine the extent to which appliances are
actively used or left in standby power modes.
In this chapter, key variations in the fourteen households‟ ICE appliance electricity
consumption are explored. Unlike chapter 6, standby consumption has not been
separated into the different standby power modes. Although this reduces the level of
detail, it was necessary to retain clarity in the presentation of the results.

231
The chapter begins with an assessment of variations in whole house and total ICE
appliance electricity consumption (section 7.2). Variations in the electricity consumption
from the main ICE appliance categories are then presented (section 7.3). This is followed
by a more detailed review of the households‟ electricity consumption from the ICE
appliance types (sections 7.4 to 7.7). Finally, a chapter summary is provided (section 7.8).
7.2 Variations in whole house and ICE appliance electricity consumption
7.2.1 Variations in total electricity consumption
Although, on average, 23% of the sample‟s total whole house electricity consumption was
from ICE appliance use, the distribution of this electricity consumption varied considerably
within the sample. This is evident from Table 7-1, which shows that the households‟ two
week whole house electricity consumption ranged from around 70 kWh to 260 kWh and
ICE appliance electricity consumption ranged from around 11 kWh to 158 kWh. For the
majority of the households two week ICE appliance consumption was between 25 kWh to
35 kWh. Although this level of variation appears to be relatively small, it will become more
significant on an annual basis. For example, a difference of around 5 kWh per week,
between households 2 and 9, could result in an annual difference of around 250 kWh per
annum (assuming 50 weeks of electricity consumption based on the two week
measurements).

232
Table 7-1 Two week ICE appliance and whole house electricity consumption for the sample
of households
Household ICE appliance Active (kWh)
ICE appliance Standby (kWh)
ICE appliance Unknown (kWh)
Total ICE Appliance (kWh)
Whole house (kWh)
Percentage of whole house consumption from ICE (%)
H4 14.2 13.0 0.8 27.9 69.7 40.1
H1 7.4 2.3 1.3 10.9 70.9 15.4
H14 6.0 10.4 2.5 19.0 73.2 25.9
H11 18.0 5.9 2.0 25.9 93.8 27.6
H5 8.8 15.7 2.3 26.9 147.4 18.2
H3 10.6 13.0 1.9 25.6 162.8 15.7
H2 15.7 7.2 1.5 24.4 176.9 13.8
H8 6.8 16.8 2.9 26.5 185.6 14.3
H9 20.2 10.6 3.5 34.3 195.3 17.6
H12 24.9 9.8 1.0 35.7 200.0 17.9
H13 40.9 7.6 1.2 49.7 203.1 24.5
H10 14.0 14.6 3.3 31.9 232.3 13.7
H7 150.0 7.2 0.8 158.0 238.6 66.2
H6 10.0 26.7 2.1 38.8 261.3 14.9
Total 347.5 160.9 27.2 535.6 2310.8 -
Average 24.8 11.5 1.9 38.3 165.1 23.3%
Note: Household 10 used coal and electricity for space heating and electricity for water heating
To explore the variation further, Figure 7-1 shows the total two week ICE appliance
electricity consumption for each household plotted against whole house electricity
consumption. It is apparent that there is an underlying trend of increased ICE appliance
electricity consumption with increasing whole house electricity consumption, even when
the high ICE appliance electricity consumption from household 7 is excluded. It is also
evident that some of the lower whole house electricity consuming households had
relatively high proportion of their consumption from ICE appliance use. This may suggest
that ICE appliances are a particularly important end-use in lower energy using households.

233
Figure 7-1 Households total two week ICE appliance electricity consumption for the plotted
against whole house electricity consumption. Note: Household 10 used coal and electricity
for space heating and electricity for water heating
The high ICE appliance electricity consumption recorded in household 7 had a significant
influence on the average household consumption presented in chapter 6. Household 7
accounted for 29.5% of the total ICE appliance electricity consumption recorded from the
sample. This high consumption was largely from household 7‟s continuous use of
computing appliances in active power modes (including three desktop computers, two
external hard drives, a laptop). Although this appliance use appears to be very atypical, it
is probable that this type of consumption is likely to be occurring in a similar proportion of
UK homes, either through extensive computing appliance use or other activities not
captured by this study (e.g. home cinema systems and large plasma televisions, and
electricity consumption from larger household sizes).
Support for this argument is evident in results presented by Firth et al. (2008). Figure 7-2
shows electricity consumption recorded from seventy-two similar UK dwelling types, where
the results were separated into three different electricity consumption categories. ICE
H1H2H3
H4
H5
H6
H7
H8
H9
H10H11 H12
H13
H14
0
20
40
60
80
100
120
140
160
180
0 50 100 150 200 250 300
ICE
ap
pli
an
ce e
lectr
icit
y c
on
su
mp
tio
n (
kW
h)
Whole house electricity consumption (kWh)
All households
Excluding H7

234
appliance use would be included in the active appliance and continuous and standby
consumption categories. These two categories vary significantly, even in dwellings with
similar total annual electricity consumption. It is also clear that a number of these
households have very high active appliance consumption and continuous and standby
consumption, which may reflect the type of computing activities recorded in household 7.
Figure 7-2 Annual total electricity consumption totals per appliance consumption group and
dwelling for the first year of monitoring (Firth et al., 2008 p932)
Further support comes from the research by the Swedish Energy Agency, where
Zimmermann (2009) highlights that one house used 4846 kWh per year (186.4 kWh over
two weeks) from computing appliances. Thus, household 7‟s high electricity consumption
may be less unusual than first thought and may also suggest that high appliance users
may be having a particularly significant influence on wider populations‟ average domestic
electricity consumption.
7.2.2 Variations in power mode electricity consumption
In Table 7-1 values were also presented for the households‟ active and standby power
electricity consumption from ICE appliance use. The two week electricity consumption
from the active use of appliances ranged from around 6 kWh to 150 kWh and the

235
consumption from standby power modes ranged from around 2 kWh to 27 kWh. In seven
of the households (1, 11, 2, 9, 12, 13 and 7) electricity consumption from the active use of
appliances was the predominant form of ICE appliance electricity consumption. In
contrast, in four households (14, 5, 8 and 6) standby power consumption was significantly
greater than active power consumption. In three households (4, 3, 10) active and standby
power consumption was comparatively similar. As a result, despite Figure 7-1 suggesting
that there was an underlying relationship between ICE appliance electricity consumption
and whole house consumption, this was less obvious in respect to power modes. This is
evident in Figure 7-3, which shows that standby power consumption varied significantly,
even in homes with similar whole house electricity consumption.
Figure 7-3 Households‟ two week ICE appliance standby power electricity consumption
plotted against the two week whole house electricity consumption
Table 7-2 shows the percentage contribution of ICE appliance standby power consumption
to each household‟s whole house electricity consumption. In chapter 6, it was highlighted
that around 7.0% of average household ICE appliance electricity consumption was from
standby power modes. However, in terms of average percentage, ICE appliance standby
consumption was 7.7% of whole house electricity consumption. This higher value is
H1
H14
H2
H3
H11
H8H5
H4
H10
H9
H12
H6
H13H7
0
5
10
15
20
25
30
0 50 100 150 200 250 300
ICE
ap
plian
ce e
lectr
icit
y c
on
su
mp
tio
n
fro
m s
tan
db
y p
ow
er
mo
des (
kW
h)
Whole house electricity consumption (kWh)

236
largely due to the reduced influence of household 7‟s high active power mode electricity
consumption. It is also evidence that ICE appliance standby consumption was particularly
significant for seven of the homes (14, 3, 4, 10, 5, 8 and 6) where standby power modes
accounted for over 45% of their total household ICE appliance electricity consumption.
Table 7-2 Variation in households‟ two week ICE appliance standby power consumption
Household ICE appliance standby power consumption (kWh)
ICE standby as percentage of total ICE appliance electricity consumption (%)
ICE standby as percentage of whole house electricity consumption (%)
H1 2.3 20.8 3.2
H11 5.9 22.8 6.3
H2 7.2 29.5 4.1
H7 7.2 4.6 3.0
H13 7.6 15.2 3.7
H12 9.8 27.5 4.9
H14 10.4 55.1 14.3
H9 10.6 30.9 5.4
H3 13.0 51.0 8.0
H4 13.0 46.4 18.6
H10 14.6 45.7 6.3
H5 15.7 58.6 10.7
H8 16.8 63.4 9.1
H6 26.7 68.7 10.2
Min 2.3 4.6 3.0
Max 26.7 68.7 18.6
Average 11.5 38.6 7.7
In the following sections aspects of the households‟ ICE appliance use are explored in
more detail to illustrate how differences in appliance ownership and behaviour provide the
potential for a wide range of different patterns of electricity consumption to occur in UK
homes.

237
7.3 Variations in ICE appliance categories electricity consumption
7.3.1 Variations in total electricity consumption
The complex variation in households‟ ICE appliance use is illustrated through Table 7-3,
which shows each household‟s two week electricity consumption from the four main ICE
appliance categories. It is apparent that the contribution of the appliances categories
varies significantly throughout the sample, from households that predominantly used video
appliances (e.g. households 1, 2 and 3) to those that largely consumed electricity from
computing appliances (e.g. households 11 and 7). The wide variation of household
consumption is also illustrated through Table 7-4, which shows the range of consumption
that occurred for each appliance category, in terms of electricity consumption and
percentage of total two week ICE appliance electricity consumption.
Table 7-3 Households' two week electricity consumption from ICE appliance categories
Household Video (kWh)
Audio (kWh)
Computing (kWh)
Telephony (kWh)
Total (kWh)
H1 9.6 0.002 0.03 1.3 10.9
H14 5.9 4.7 5.9 2.5 19.0
H2 19.3 0.2 3.8 1.2 24.4
H3 17.1 6.2 0.4 1.9 25.6
H11 0.1 1.7 22.9 1.2 25.9
H8 8.8 7.7 7.1 2.9 26.5
H5 10.2 6.1 8.2 2.3 26.9
H4 20.0 0.0 7.1 0.8 27.9
H10 11.9 4.6 14.7 0.7 31.9
H9 17.2 0.02 13.6 3.5 34.3
H12 15.0 2.7 17.0 1.0 35.7
H6 23.5 1.9 11.3 2.1 38.8
H13 32.2 0.5 15.8 1.2 49.7
H7 22.7 0.8 133.7 0.8 158.0
Total 213.5 37.2 261.5 23.5 535.6

238
Table 7-4 Range of ICE appliance categories two week electricity consumption in terms of
total electricity consumption (kWh) and percentage of household ICE appliance electricity
consumption (%)
Range Video Audio Computing telephony
Min (kWh) 0.1 0.0 0.03 0.7
Max (kWh) 32.2 7.7 133.7 3.5
Min (%) 0.4 0.0 0.2 0.5
Max (%) 88.2 29.2 88.5 13.2
Figure 7-4 shows the households‟ ICE appliance category electricity consumption, as a
percentage of each household‟s total two week ICE appliance electricity consumption. As
mentioned in section 7.2.2, average percentage values provide a useful means to describe
variations in the households‟ electricity consumption, because in comparison to the
average household values, presented in chapter 6 (based on the sample‟s overall
electricity consumption), the average percentage values reduce the influence of higher
electricity consuming households (e.g. household 7).
In terms of average percentage, 48.4% of the households‟ ICE appliance electricity
consumption was from video appliances, 35.6% from computing, 9.8% from audio
appliances and 6.3% from telephony. Thus, in comparison to the average household
consumption values video appliances have an increased significance. This reflects that for
nine out of the fourteen households, video appliance use was the predominant form of ICE
appliance electricity consumption.

239
Figure 7-4 Percentage contribution of ICE appliance categories to individual households
total ICE appliance electricity consumption for two week monitoring period
However, it is apparent that computing appliances are still a significant ICE appliance end-
use in many homes. This is particularly the case for households with higher ICE appliance
electricity consumption. Four of the six households, with the highest ICE appliance
electricity consumption, used 40% or more of their electricity from computing equipment. It
is also of note that, in percentage terms, audio appliances were particularly significant to
five of the households (3, 5, 8, 10 and 14).
7.3.2 Variations in power mode electricity consumption
A further layer of complexity is apparent in Table 7-5, which apportions each household‟s
ICE category consumption into the active and standby power modes. The range of
electricity consumption values is also presented in Table 7-6.
0%
10%
20%
30%
40%
50%
60%
70%
80%
90%
100%
H1 H14 H2 H3 H11 H8 H5 H4 H10 H9 H12 H6 H13 H7
Perc
en
tag
e o
f ele
ctr
icit
y c
on
su
mp
tio
n
Household
Telephony
Video
Audio
Computing

240
Table 7-5 Households‟ two week electricity consumption from ICE appliance categories
active and standby power modes
House-hold
Video Active (kWh)
Video Standby (kWh)
Audio active (kWh)
Audio Standby (kWh)
Comp‟ Active (kWh)
Comp‟ Standby (kWh)
Unknown (kWh)
Total standby (kWh)
Total ICE Appliance (kWh)
H1 7.3 2.3 0.002 0.0 0.02 0.0 1.3 2.3 10.9
H14 4.1 1.7 0.0 4.7 1.9 4.0 2.5 10.4 19.0
H2 15.0 3.9 0.2 0.0 0.5 3.3 1.5 7.2 24.4
H3 10.2 6.9 0.3 5.9 0.2 0.2 1.9 13.0 25.6
H11 0.1 0.0 0.1 0.8 17.8 5.1 2.0 5.9 25.9
H8 2.6 6.2 0.4 7.4 3.8 3.2 2.9 16.8 26.5
H5 7.1 3.1 0.03 6.1 1.6 6.5 2.3 15.7 26.9
H4 12.5 7.5 0.0 0.0 1.7 5.4 0.8 13.0 27.9
H10 9.2 2.7 0.0 2.0 4.8 9.9 3.3 14.6 31.9
H9 15.8 1.4 0.02 0.0 4.4 9.2 3.5 10.6 34.3
H12 11.3 3.6 0.5 2.2 13.1 4.0 1.0 9.8 35.7
H6 9.2 14.3 0.2 1.8 0.7 10.6 2.1 26.7 38.8
H13 27.2 5.0 0.0 0.5 13.7 2.1 1.2 7.6 49.7
H7 17.2 5.5 0.1 0.7 132.6 1.1 0.8 7.2 158.0
Total 148.9 64.2 1.8 32.0 196.9 64.7 27.2 160.9 535.6
Ave. 10.6 4.6 0.1 2.3 14.1 4.6 1.9 11.5 38.3
Table 7-6 The range of households‟ two week electricity consumption from ICE appliance
categories‟ active and standby power modes; in terms of total electricity consumption (kWh)
and percentage of household ICE appliance electricity consumption (%)
Range Video active
Video standby
Audio active
Audio standby
Computing active
Computing standby
Unknown
Min (kWh) 0.1 0.0 0.0 0.0 0.02 0.0 0.8
Max (kWh) 27.2 14.3 0.5 7.4 132.6 10.6 3.5
Min (%) 0.4 0.0 0.0 0.0 0.2 0.0 0.5
Max (%) 67.4 36.9 1.4 27.9 83.9 31.1 13.2
The above tables show that there is a wide range of variation in households‟ use of the
different ICE appliance categories‟ power modes. In twelve of the households the active
use of video appliances was more significant than standby consumption. The average
percentage of the households‟ video appliance electricity consumption was 71% from the
active power mode and 29% from standby power modes, which is similar to the average
household values presented in section 6.4. However, standby power consumption from

241
computing appliances was higher than active power consumption in seven of the
households (2, 14, 4, 5, 6, 9 and 10). In these homes standby power modes accounted for
between 67% (household 10) and 94% (household 6) of computing appliance electricity
consumption.
The average percentage of households‟ computing appliance consumption was around
50% from standby power modes and 50% from the active power mode. Thus, standby
consumption appears to be more significant to the sample‟s use of computing equipment
than suggested by the average household values, presented in section 6.4 (standby power
modes accounted for around 25% of average household computing appliance electricity
consumption). This difference largely resulted from the high active use of computers in
household 7 and suggests that tackling the use of computing appliance standby power
modes could be an important means to reduce many homes overall ICE appliance
electricity consumption.
7.4 Variations in video appliance electricity consumption
7.4.1 Variations in total electricity consumption
As might be expected, for most households the use of televisions was the predominant
form of video appliance electricity consumption, ranging from around 0.1 kWh (household
11) to 25 kWh (household 13). Figure 7-5 shows the variation in the households‟ total two
week electricity consumption from the video appliances and Table 7-7 shows the wide
range of consumption that occurred, in terms of electricity consumption and percentage of
the households‟ two week video appliance electricity consumption.

242
Figure 7-5 Households‟ two week video appliance electricity consumption from appliance
types. Play and record includes VCRs, VCR/DVD, DVD players/recorders and HDD/DVD
recorders. AV network includes AV boosters and AV senders.
Table 7-7 Range of two week video appliance electricity consumption in terms of total
electricity consumption (kWh) and percentage of household video appliance electricity
consumption (%)
Range TV CRT TV LCD STB complex
STB simple
Play and record
Sound system
AV Network
Games console
Min (kWh) 0.0 0.0 0.0 0.0 0.0 0.0 0.0 0.0
Max (kWh) 11.4 22.2 11.7 1.7 3.8 1.4 2.4 3.8
Min (%) 0.0 0.0 0.0 0.0 0.0 0.0 0.0 0.0
Max (%) 80.9 84.1 50.0 16.5 30.0 12.0 8.5 40.0
*Play and record consists of VCRs, VCR/DVD, DVD players and recorders, HDD/DVD recorders.
AV network are AV boosters and AV senders.
Out of the fourteen households, nine subscribed to satellite or cable services (household 6
had 2 cable STBs), two used simple STBs, one used the digital tuner integrated in their
television and one used analogue services. Household 14 disconnected a simple STB
three days into the monitoring study and used the integrated digital tuner in the television.
0
5
10
15
20
25
30
35
H11 H14 H8 H1 H5 H10 H12 H3 H9 H2 H4 H7 H6 H13
Ele
ctr
icit
y c
on
su
mp
tio
n (
kW
h)
Household
Games console
AV network
Sound
Play and record
STB simple
STB complex
TV LCD
TV CRT

243
The five households that did not own complex STBs (households 1, 5, 8, 10 and 14) were
amongst the six households with the lowest video appliance electricity consumption, which
highlights how the ownership and use of complex STBs can result in higher overall ICE
appliance electricity consumption (Household 11 owned a complex STB, but the appliance
was only used briefly during the two weeks of monitoring).
For the eleven households that used STBs, on average, around 33% of the electricity
consumed by the STBs and their associated televisions was attributable to STBs. This
compares well to an estimate made by Turner (2009) who reviewed trends in STB energy
efficiency from a manufacturer‟s perspective. Turner contends that STBs are wrongly
perceived as power hungry devices, because for television viewing activities, “over any 24
hour period 70-80% of the energy consumption is due to the TV, not the STB” (Turner,
2009 p3).
However, the results from this study illustrate that Turner‟s assertion cannot be applied to
all households, over any 24 hour period. In five households (3, 4, 6, 7 and 12) STBs
accounted for between 44% and 65% of the electricity consumed by STBs and their
associated televisions (the average percentage was 49.5%). Thus, it can be anticipated
that for many UK households STB electricity consumption could be as significant as the
televisions used with them. This suggests that measures to reduce electricity consumption
from STBs should be considered as an important means to reduce domestic electricity
consumption.
Play and record equipment were found in eleven of the households and the average
percentage of video appliance electricity consumption from these appliances was around
11.6%. However, in three households (1, 14 and 8) play and record equipment
contributed 19.5%, 28.2% and 30.0% respectively. Similarly, games consoles were
particularly significant in three of the households (2, 8 and 10) and accounted for 11.4%,
40% and 32.3% of the households‟ video appliance electricity consumption respectively.
Although the average household electricity consumption values, presented in chapter 6,
suggested that VCRs and games consoles were generally less significant to the sample,
for some households these appliance types were an important electricity end-use.

244
7.4.2 Variations in power mode electricity consumption
The variation in households‟ two week video appliance electricity consumption from power
modes is presented in Figure 7-6. In order to maintain a degree of clarity in the chart, a
number of appliance types have been combined (e.g. televisions, STBs and play and
record appliances). It is apparent that the use of televisions in the active power mode was
a main reason for the variation in households‟ video appliance electricity consumption,
which ranged from 0.1 kWh to 24 kWh. It is also evident that standby power consumption
from play and record equipment (i.e. VCRs, DVD players HDD/DVD recorders, etc)
accounted for a significant portion of several households‟ video appliance electricity
consumption (e.g. households 14, 8, 1 and 2). In most homes play and record equipment
simply remained continuously in standby power modes, which was also the case for most
of the games consoles owned by the households.
Figure 7-6 Households‟ two week active and standby power mode electricity consumption
for the main video appliances. TV includes CRT and LCD televisions. STB includes complex
STBs and simple STBs. Play and record includes VCRs, VCR/DVD, DVD players/recorders
and HDD/DVD recorders. “Other” includes surround sound equipment and AV boosters and
AV senders.
0
5
10
15
20
25
30
35
H11 H14 H8 H1 H5 H10 H12 H3 H9 H2 H4 H7 H6 H13
Ele
ctr
icit
y c
on
su
mp
tio
n (
kW
h)
Household
Unknown
Other standby
Other active
Games consoles standby
Games consoles active
Play and record standby
Play and record active
STB standby
STB active
TV standby
TV active

245
The variation in households‟ STB electricity consumption was an important influence on
households‟ different video appliance electricity consumption. Exploring the use of STBs
in more detail provides a useful means to highlight how ICE appliance electricity
consumption relates to three key factors: (i) the number of appliances owned by
households; (ii) the types of appliance owned by households (i.e. the power
characteristics); (iii) the patterns of use (i.e. the appliances frequency of use in the different
power modes). Figure 7-7 shows the total electricity consumption from households‟ use of
STBs in the active and active standby power modes.
Figure 7-7 Households total two week STB electricity consumption from power modes.
Note: households 8 and 10 did not own STBs; household 11 only used the STB briefly;
household 14 used a simple STB on standby for three days before being disconnected from
the mains electricity supply.
Households 1 and 5 were two of the lowest STB electricity consuming households due to
using simple STBs, which have a lower power requirement than complex STBs. However,
despite the members of household 1 viewing more television programmes, they routinely
disconnected the STB from the mains electricity supply when their television or VCR was
0
2
4
6
8
10
12
14
H11 H14 H1 H5 H9 H2 H13 H12 H3 H4 H7 H6 H8 H10
To
tal S
TB
ele
ctr
icit
y c
on
su
mp
tio
n (
kW
h)
Household
Active standby
Active power

246
not being used. Thus, household 1‟s STB electricity consumption was lower than
household 5, because standby power consumption was avoided. In contrast, household
5‟s STB was continuously in an electricity consuming state.
Households 11, 9, 2, 13, 3, and 6 all used basic complex STBs. Households 11, 9 and 2
frequently disconnected their STBs from the mains, when the television was not in use,
which resulted in their STBs‟ standby power consumption being lower than households 13,
3 and 6. Households 12, 4, and 7 have relatively high STB electricity consumption due to
their use of HDD complex STBs with recording functions, which have higher average
power loads and were always in an electricity consuming state. The influence of the
number of appliances is also evident through the high consumption at household 6, which
used two basic complex STBs.
Figure 7-8 provides an alternate way to illustrate the effect of behaviour on STB electricity
consumption. Households‟ total power mode electricity consumption is grouped by STB
type and the households‟ general patterns of use. It is apparent that, due to their higher
average power loads, the three HDD complex STBs in households 4, 7 and 12 consumed
more electricity than the four basic complex STBs that were also left continuously in an
electricity consuming state in households 3, 6 and 13. The influence of householder
behaviour is also evident through the lower overall standby power consumption from the
households that regularly disconnected their basic complex STBs.

247
Figure 7-8 Total two week STB electricity consumption, grouped by appliance type and
general patterns of use. Household 6 used two basic complex STBs. Household 14 is
excluded due to disconnecting the STB three days into the monitoring period.
The use of televisions, in different household locations, is another aspect of video
appliance electricity consumption that illustrates the influence of behaviour. Table 7-8
shows the total power mode electricity consumption of televisions in three household
locations.
Table 7-8 Total two week television power mode electricity consumption for study sample
from televisions used in different household locations
Television location
Active (kWh)
Passive standby (kWh)
Off standby (kWh)
Unknown (kWh)
Total standby (kWh)
Total (kWh)
Living area 107.7 1.6 0.01 0.2 1.61 109.5
Bedrooms 7.7 2.2 0.0 0.0 2.2 10.0
Kitchens 2.1 0.2 0.0 0.0 0.2 2.3
0
5
10
15
20
25
STB simple: turned off
(H1)
STB simple: left on (H5)
STB complex (basic):
turned off (H2,9,11)
STB complex (basic): left on
(H3,6,13)
STB complex (HDD): left on
(H4,7,12)
Ele
ctr
icit
y c
on
su
mp
tio
n (
kW
h)
Active standby
Active power

248
It is evident that televisions used in living areas (i.e. lounge and dining rooms) resulted in
the largest amount of electricity consumption. Living area televisions generally had larger
screen sizes and were used more extensively. Standby power modes accounted for only
1.5% of living area television electricity consumption. This was due to a number of
households frequently turning off their televisions at the mains socket (households 1, 2, 9
and 11) or on the appliance (households 3, 4, 5, 8, 10, 12, 13 and 14) when not in use.
The majority of the CRT televisions used in living areas also had hard-off switches, which
resulted in only a small amount of standby electricity consumption being recorded.
Only three households used the passive standby power (remote control) function with
living area televisions (households 6, 7 and 13) and only one of the four households with
kitchen televisions used the passive standby mode (household 3). In contrast, the
members of five households (3, 5, 8, 12 and 13) often used remote controls to turn off
bedroom televisions at night. Thus, bedroom televisions were often in a passive standby
power mode overnight, until they were usually turned off the following morning. As a
result, around 22% of bedroom television electricity consumption resulted from the passive
standby power mode.
7.5 Variations in audio appliance electricity consumption
7.5.1 Variations in total electricity consumption
Most households did not own a wide range of audio appliances. For example, although
twelve integrated Hi-Fi systems were monitored, only eight of the households owned this
appliance type. Figure 7-9 shows the variation in the households‟ two week audio
appliance electricity consumption and Table 7-9 shows the wide range of consumption that
occurred for each appliance type. Integrated Hi-Fi systems were the most significant
electricity consuming audio appliance in seven of the homes (household 9 consumed
0.013 kWh) and radios were the main audio appliance used in six homes (household 1
consumed 0.002 kWh).

249
Figure 7-9 Households‟ two week audio appliance electricity consumption
Table 7-9 Range of two week audio appliance electricity consumption in terms of total
electricity consumption (kWh) and percentage of household audio appliance electricity
consumption (%)
Range Integrated Hi-Fi
Hi-Fi separates
Digital radio
Analogue radio
Clock radio
Mp3 station
Min (kWh) 0.0 0.0 0.0 0.0 0.0 0.0
Max (kWh) 6.1 2.0 2.6 1.8 1.0 0.1
Min (%) 0.0 0.0 0.0 0.0 0.0 0.0
Max (%) 100 43.2 58.2 100 100 38.1
Table 7-10 shows the five households with the highest audio appliance electricity
consumption in more detail. In households 3, 5, and 14, over 20% of the total household
ICE electricity consumption resulted from just one audio appliance. In households 5 and
14 a single integrated Hi-Fi resulted in over 4% and 6%, respectively, of their two week
whole house electricity consumption. These results highlight that, despite audio
appliances contributing a relatively small amount of the sample‟s overall ICE appliance
electricity consumption, these devices were particularly significant to around a third of the
households.
0
1
2
3
4
5
6
7
8
9
H4 H1 H9 H2 H13 H7 H11 H6 H12 H10 H14 H5 H3 H8
Ele
ctr
icit
y c
on
su
mp
tio
n (
kW
h)
Household
Integrated Hi-Fi
Hi-Fi separates
Digital radio
Analogue radio
Clock radio
Mp3 station

250
Table 7-10 Audio electricity consumption in high audio using households
House-hold
Audio appliance Electricity consumption (kWh)
% of ICE appliance electricity consumption
% of whole house electricity consumption
3 Integrated Hi-Fi 5.2 20.3 3.2
5 Integrated Hi-Fi 6.1 22.6 4.1
8 Integrated Hi-Fi (1) 2.8 10.7 1.5
Integrated Hi-Fi (2) 0.3 1.3 0.02
Integrated Hi-Fi (3) 1.9 7.1 1.0
Digital radio 0.8 2.8 0.4
Analogue radio 1.8 6.9 1.0
10 Hi-Fi separates 2.0 6.2 0.9
Digital radio 2.6 8.2 1.1
14 Integrated Hi-Fi 4.4 23.0 6.0
Turntable 0.3 1.6 0.4
7.5.2 Variations in power mode electricity consumption
Figure 7-10 shows that standby power modes were responsible for the majority of the
variation in audio appliance electricity consumption. As a result, there is evidence that
simple changes to behaviour could have a significant impact on some households‟
electricity consumption from audio equipment. For example, simply switching integrated
Hi-Fi systems off at the mains supply could reduce households 3, 5, 8, and 14‟s two week
ICE appliance electricity consumption by between 18.6% and 23%. In percentage terms,
these four households were also amongst the five highest standby power consuming
households (shown previously in Table 7-2), which highlights how such changes could
also make a large impact on whole house standby consumption.

251
Figure 7-10 Households two week active and standby power mode electricity consumption
for the main audio appliances (excludes Mp3 stations)
7.6 Variations in computing appliance electricity consumption
7.6.1 Variations in total electricity consumption
Household 7‟s high electricity consumption from computing appliances was responsible for
around 51% of the sample‟s total two week computing appliance electricity consumption.
In contrast there was only one very short period of computing appliance use in household
1, when appliances were activated and turned off again within a few minutes. Household
1 was also the only household without Internet connection. This marked difference in
appliance use is evident in Figure 7-11 and Figure 7-12, which show the households‟
computing appliance electricity consumption. Table 7-11 also shows the range of
consumption that occurred for each appliance type.
0
1
2
3
4
5
6
7
8
9
H4 H1 H9 H2 H13 H7 H11 H6 H12 H10 H14 H5 H3 H8
Ele
ctr
icit
y c
on
su
mp
tio
n (
kW
h)
Household
Clock radio standby
Analogue radio standby
Analogue radio active
Digital radio unknown
Digital radio standby
Digital radio active
Hi-Fi separate standby
Hi-Fi separate active
Integrated Hi-Fi standby
Integrated Hi-Fi active

252
Figure 7-11 Households‟ two week computing appliance electricity consumption (1)
Figure 7-12 Households‟ two week computing appliance electricity consumption (2)
0
20
40
60
80
100
120
140
160
H1 H3 H2 H14 H8 H4 H5 H6 H9 H10 H13 H12 H11 H7
Ele
ctr
icit
y c
on
su
mp
tio
n (
kW
h)
Household
Router
Modem
External HD
Speakers
Printer
Laptop
Monitor
Desktop and monitor
Desktop
0
2
4
6
8
10
12
14
16
18
20
22
24
H1 H3 H2 H14 H8 H4 H5 H6 H9 H10 H13 H12 H11 H7
Ele
ctr
icit
y c
on
su
mp
tio
n (
kW
h)
Household
Router
Modem
External HD
Speakers
Printer
Laptop
Monitor
Desktop and monitor
Desktop

253
Table 7-11 Range of two week computing appliance electricity consumption in terms of total
electricity consumption (kWh) and percentage of household computing appliance electricity
consumption (%)
Range Desktop Desktop and monitor
Monitor Laptop Printer Speakers External Hard drive
Modem Router
Min (kWh) 0.0 0.0 0.0 0.0 0.0 0.0 0.0 0.0 0.0
Max (kWh) 100.5 3.2 7.3 8.5 7.1 1.7 9.3 4.5 3.7
Min (%) 0.0 0.0 0.0 0.0 0.0 0.0 0.0 0.0 0.0
Max (%) 75.1 23.4 38.5 35.5 51.7 18.6 6.9 22.9 87.4
For the four households with the highest computing appliance electricity consumption (1,
7, 11, 12 and 13) the use of desktop computers resulted in over 50% of their computing
appliance electricity consumption. In households that predominantly used laptops (e.g. 4,
6, 9 and 10), the lower power loads of these computers resulted in lower overall computing
appliance consumption. As a result, other computing equipment, such as printers and
routers, accounted for a greater share of their computing appliance electricity
consumption.
Routers were the most common computer networking appliance and were found in thirteen
of the households. The electricity consumption from routers remained relatively similar in
the twelve highest electricity consuming households. This was due to households
generally leaving routers and modems continuously in an electricity consuming state.
Although four households routinely turned off their STBs, only household 3 routinely
disconnected the router from the mains supply when computers were not in use
(household 4 occasionally turned the router off). Interestingly, both household 3 and 4‟s
complex STBs remained continuously in an electricity consuming state, which highlights
how patterns of behaviour in the households were not consistent across the different
appliance types.
In percentage terms, electricity consumption from routers and modems was generally
more significant in households that used their computers less frequently. For households
4, 5, 6, 8 and 14, computer networking devices contributed over 35% of their computing

254
appliance electricity consumption and in household 2, the router accounted for over 86%
of its computing appliance electricity consumption. As a result, routers were responsible
for over 13% of households 2 and 14‟s total ICE appliance electricity consumption. The
influence of routers and modems to whole house electricity consumption is shown in more
detail Figure 7-13. For household 11 the use of a router and modem accounted for nearly
5% of its whole house electricity consumption. Although this was largely due to household
11‟s particularly low electricity consumption from video appliances, it highlights that a
relatively low power, and inconspicuous, device can have a significant impact on
household electricity consumption. This suggests that attention needs to be given to
network appliances, because there is evidence that in some homes their electricity
consumption can be greater than the computers that they support.
Figure 7-13 Percentage of households two week whole house electricity consumption from
computing network appliances
7.6.2 Variations in power mode electricity consumption
Figure 7-14 and Figure 7-15 show the households computing appliance electricity
consumption from active and standby power modes. For the four households with the
highest overall computing appliance electricity consumption (households 7, 11, 12 and 13)
0
1
2
3
4
5
6
H1 H3 H10 H9 H12 H13 H8 H6 H2 H5 H7 H14 H4 H11
Perc
en
tag
e o
f w
ho
le h
ou
se e
lectr
icit
y
co
nsu
mp
tio
n (%
)
Household
Modem
Router

255
the use of desktop computers, in the active power mode, was the primary form of
electricity consumption. However, as mentioned in section 7.3.2, standby power
consumption was responsible for the majority of computing appliance electricity
consumption in half of the households.
Figure 7-14 Households two week active and standby power mode electricity consumption
for the main computing appliances (1)
0
20
40
60
80
100
120
140
160
H1 H3 H2 H14 H8 H4 H5 H6 H9 H10 H13 H12 H11 H7
Ele
ctr
icit
y c
on
su
mp
tio
n (k
Wh
)
Household
Other standby
Other active
Network standby
Network active
Printer standby
Printer active
Monitor standby
Monitor active
Laptop standby
Laptop active
Desktop standby
Desktop active

256
Figure 7-15 Households two week active and standby power mode electricity consumption
for the main computing appliances (2). In household 9 the desktop computer had an
integrated power supply for the monitor.
In households 2, 14, 4, 5 and 6, standby power consumption from network appliances was
the main form of computing appliance electricity consumption. This ranged from 32%
(household 4) to 86.3% (household 2) of household computing appliance electricity
consumption.
In households 6, 9, 10 and 12, standby power consumption from printers were also a
significant form of standby consumption. In these four homes standby consumption from
printers ranged from 14.2% (household 12) to 41.9% (household 9) of household
computing appliance electricity consumption. This was due to at least one printer
remaining continuously in an active standby mode. In household 9 standby power
consumption from a non-domestic standard printer/copier resulted in over 13% of the
household‟s ICE appliance electricity consumption.
0
5
10
15
20
25
H1 H3 H2 H14 H8 H4 H5 H6 H9 H10 H13 H12 H11 H7
Ele
ctr
icit
y c
on
su
mp
tio
n (k
Wh
)
Household
Other standby
Other active
Network standby
Network active
Printer standby
Printer active
Monitor standby
Monitor active
Laptop standby
Laptop active
Desktop standby
Desktop active

257
These examples highlight that in many of the households, disconnecting computing
appliances from the mains supply could have significantly reduced ICE appliance
electricity consumption. Support for this argument is evident in the low computing
appliance electricity consumption monitored at household 3, where computing appliances
were regularly disconnected from the mains. On average, this household used a laptop
computer for around 20 minutes per day, which resulted in 0.4 kWh of electricity
consumption over the two weeks. In contrast, on average, household 2 used a desktop for
20 minutes per day, but due to appliances being left on standby, household 2‟s computing
appliance electricity consumption was nearly ten times greater. On average, household 6
used a desktop computer and laptop for around 35 minutes a day, but the household used
over twenty-eight times more electricity than household 3 due to high standby loads.
Another example was apparent in results from household 4. In this home a desktop and
monitor remained on standby for the whole two week monitoring period, due to the
householder‟s use of a laptop for his computing activities. The standby electricity
consumption from the desktop and monitor accounted for around 25% of the household‟s
computing appliance electricity consumption, whereas the laptop consumed around 19%,
even though, on average, it was used for over two and a half hours per day.
Furthermore, in six of the households (14, 4, 5, 6, 9 and 10) the off standby power mode
was responsible for between 20% and 30% of the households‟ computing appliance
consumption. This highlights that hard-off switches could also be a means to reduce many
homes‟ computing appliance standby power consumption.
7.7 Variations in telephony appliances electricity consumption
Figure 7-16 shows each household‟s total telephony appliance electricity consumption.
Cordless telephones were the predominant source of this consumption, which from 0 kWh
to 2.7 kWh. Extra cordless handsets were found in six of the homes, which ranged from 0
kWh to around 1.6 kWh (household 8). Answer-phones were used in two households and
electricity consumption ranged from 0 kWh to around 1.3 kWh (household 1). Variations in
the households‟ electricity consumption from telephony power modes are not presented,
because it was not possible to differentiate between the active and standby power modes.

258
Figure 7-16 Households‟ two week telephony appliance electricity consumption
7.8 Summary
This chapter has described the wide variation in the sample of households ICE appliance
electricity consumption. The results highlight that households with higher ICE appliance
electricity consumption can have a significant influence on average values gained from
wider populations. As a result, average values can hide some important variations in
household appliance use. For instance, video appliances were the most significant end-
use in most homes; this was not apparent from the results presented in chapter 6.
Furthermore, appliances that appeared to be less significant to the average household ICE
appliance electricity consumption were actually an important end-use in a number of
homes (e.g. audio appliances, printers, play and record equipment).
The results also highlight that inconspicuous end-uses (such as network appliances and
standby consumption) can be particularly significant in homes where the active use of
principal appliances (i.e. televisions and computers) is less extensive. As a result, standby
0.0
0.5
1.0
1.5
2.0
2.5
3.0
3.5
4.0
H10 H4 H7 H12 H11 H2 H13 H1 H3 H6 H5 H14 H8 H9
Ele
ctr
icit
y c
on
su
mp
tio
n(k
Wh
)
Household
Answerphone
Cordless telephone ext
Cordless telephone

259
consumption accounted for over 45% of ICE appliance electricity consumption in half of
the homes. Standby consumption from computing appliances was also found to be high in
the majority of homes, which suggests that tackling computing appliance standby
consumption could be an important means to reduce many UK homes standby loads.
Nevertheless, the results compliment key findings from the average household results by
highlighting the impact of network and computing appliances, and the use of standby
power modes, on household electricity consumption. Overall, this suggests that efforts to
reduce ICE appliance electricity consumption should be aware of the wide variations that
can occur in similar UK households and that initiatives need to address the impact of all
appliance types and the different power modes. This variation occurred due to: (i) the
number of appliances owned by households; (ii) the types of appliance owned by
households; (iii) the patterns of use. In the following chapters results are presented from
the household interviews, to provide an insight into key reasons for different ownership of
appliances and patterns of use.

260
Chapter 8. Results: Operational behaviour
8.1 Introduction
This chapter presents results from the fourteen household interviews, which identify key
factors that influenced householders‟ ICE appliance use and electricity consumption.
Factors that were found to influence the ownership and adoption of ICE technologies are
presented in chapter 9. The results illustrate a range of internal and external factors that
influenced patterns of behaviour. Where possible these factors are linked to the
household electricity consumption measurements presented in chapters 6 and 7.
However, household behaviour was often influenced by a combination of factors that
varied between appliance types and between members of the same household. This
complex interrelationship makes it difficult to discern the relative influence of each factor
on the overall electricity consumption results. Nevertheless, the results provide the
opportunity to draw on the experiences of the participants and provide examples of how
common factors could influence appliance use. These examples allow potential measures
to reduce ICE appliance electricity consumption to be identified, which are introduced
within the chapter. However, a more detailed reflection of the implication of the results is
provided in chapter 10.
The presentation of the results was influenced by Triandis‟ (1977) Theory of Interpersonal
Behaviour and Rogers‟ (2003) Diffusion of Innovations Theory, which were used as a
framework to help make sense of the interview data. Elements from the two theories were
found to relate to both the use and adoption of ICE appliances, but results concerning
appliance use are largely structured around themes from the TIB. Although this is
inevitably reflected in the design of the interview questions, data were frequently
generated without direct probing from the researcher and a number of themes emerged
that did not directly relate to constructs in the two theories. Thus, it is believed that the
theories provided a means to guide the qualitative analysis rather than constrain it.
The results presented in this chapter group the more commonly shared views of the
householders and minority views where considered to be of importance. Extracts from

261
the interviews are used to illustrate the key themes and provide evidence of the
interpretation of the data. Rather than the use of pseudonyms a coding system has been
used to ensure confidentiality of the participants and allows responses to be related to the
household electricity consumption results. For example, the codes „householder 1a‟ and
„householder 1b‟ denote the two householders who resided in household 1. The code „R‟
is used to denote the researcher, when an exchange with a householder(s) is presented.
Table 8-1 below shows the age and gender of the twenty-eight interview participants.
This chapter begins with a brief description of general patterns of ICE appliance use and
some of the common goals undertaken in the households (section 8.2). The influence of
householders‟ different personal characteristics is then presented (section 8.3). This is
followed by themes that related to affect (section 8.4) and the influence of the perceived
consequences of behaviour (section 8.5). The role of social influences (section 8.6) and
habits and routines (section 8.7) are then discussed. Contextual influences that were
found to facilitate or restrict behaviour are presented (section 8.8). Finally, a brief chapter
summary is provided (section 8.9).

262
Table 8-1 Interview participants gender and age
Household ID Gender Age
Householder 1a Male 65-74
Householder 1b Female 55-64
Householder 2a Male 39-44
Householder 2b Female 35-39
Householder 3a Male 60-64
Householder 3b Female 55-59
Householder 4 Male 30-34
Householder 5a Female 40-44
Householder 5b Female 11-15
Householder 6a Male 65-69
Householder 6b Female 65-69
Householder 7 Male 45-49
Householder 8a Female 50-54
Householder 8b Male 16-19
Householder 8c* Male 20-24
Householder 9a Male 55-59
Householder 9b Female 55-59
Householder 9c Male 25-29
Householder 10a Male 40-44
Householder 10b Female 30-34
Householder 11a Female 40-44
Householder 11b Female 25-29
Householder 12a Female 40-44
Householder 12b Male 40-44
Householder 12c Female 16-19
Householder 13a Male 35-39
Householder 13b Female 30-34
Householder 14 Female 60-64
*Householder 8c did not occupy the household during the appliance monitoring due to being away
at university, but attended part of the interview

263
8.2 Patterns of ICE appliance use and common goals
Unsurprisingly, patterns of appliance use were motivated by entertainment, information
gathering and communication goals. In common with other research, participants
described a diverse range of activities (e.g. Crosbie, 2006; Green and Ellegård, 2007;
Røpke et al., 2010). The convergent use of ICE appliances was relatively common and
mentioned in nine of the interviews. For example, household 10 used a games console to
view HD Blue-ray films and householder 13a explained “the TV is acting as an amplifier as
well, we plug in our various mobile devices and play them straight through the TV”. The
convergent use of appliances helped to explain the patterns of electricity consumption
recorded at household 11 where video appliances were rarely used. Householder 11b‟s
laptop had become a multi-functional device and was used for work, music, films, Skype
and information gathering through the Internet. Householder 11a also explained that her
recent use of a laptop was leading to similar patterns of use.
I‟ve noticed that mine is becoming a multi-function thing, so radio, I‟ll access that, occasionally I-
player...
Access to the Internet was a fundamental factor in many of these activities and was used
for a variety purposes, including research, accessing television and radio broadcasts,
playing DVDs and downloading films and music. Internet access also facilitated
communication goals, which were mentioned in eleven of the households. Common goals
included communicating with friends and family through emails and social network sites
(e.g. Facebook). In households that had higher computing appliance electricity
consumption (e.g. 7, 9, 10, 11, 12 and 13) the use of computing appliances had generally
become much more embedded into everyday activities. A good example came from
household 10 with the following exchange.
R: And what about the Internet?
10b: Definitely. I Internet bank, all my utilities are online, you know its lifestyle.
10a: All the things I‟m involved with, I definitely need the Internet... I need to have an Internet
connection that I can access at any given moment.
10b: Working from home!

264
10a: Working from home, booking gigs, keeping in touch with everybody, it‟s just I need one
basically, I mean I could ((pause)) very, very, just about manage without one but, I wouldn‟t want to
do it like that...
Similar to findings from other energy research (Gram-Hanssen, 2005; Green and Ellegård,
2007; Crosbie, 2008) behavioural goals resulted in the widespread individualised use of
appliances. Typically householders described situations where one householder may be
viewing television, while another may be using a computer or audio equipment and often
appliances of the same type (e.g. two televisions or computers) were used simultaneously
due to different personal interests. For example, the members of household 6 explained
that there different interests was a reason for the simultaneous use of two televisions and
complex STBs.
6b: ...there‟s nothing worse than having to sit in a room and watch a television programme that
you‟ve absolutely no interest in.
6a: Like tennis?
6b: Well yes, like tennis or a crime film for me. It would be an absolute anathema. I‟d have to go to
bed ((laughs)). Or go on my computer ((chuckles)).
It was also common for more than one category of ICE appliance to be used by an
individual at the same time. In eight of the fourteen homes an additional appliance, such
as a radio or television, was often used to provide a stimulus while using a computer.
Householder 10a explained “sometimes I‟ll have two computers on. I‟ll be listening to one,
while I‟m working on the other”. Householder 7 described a complex pattern of use that
could occur when one of his sons stayed with him.
Very often, well both be using computers actively, and at the same time watching telly, maybe, or
one of us will be watching the telly, and sometimes rarely, we will all be watching the telly...
The influence of “social television” was also evident in the interview data. Householder 4
explained that he would communicate with a friend via his laptop about television
programmes they were both watching.

265
R: So with TV, is that something you will be watching and having a chat about say if the football‟s
on?
4: Yeah, yeah, he‟ll say oh switch it over to BBC2, this guy‟s an idiot! That sort of thing, yeah, so
we‟ll have a bit of a laugh like that really.
R: Oh, that‟s really interesting.
4: Yeah, and then he‟ll send some U-Tube videos that he saw earlier, and say, have a look at this,
this is pretty funny.
This type of behaviour is a rapidly growing activity, social network sites (e.g Twitter and
Facebook) provide text based platforms to discuss television programmes as they are
broadcast and “the Guardian and The Telegraph, have been running blogs dissecting live
TV programmes as they happen for several years” (BBC, 2010). This form of appliance
use has the potential to fundamentally alter television use, with services providers looking
to develop more extensive social television experiences that include audio and visual
communication (BBC, 2010).
An interesting aspect of this development is the role of laptop computers and wireless
networks within the home. Householders 4, 6b and 8b all highlighted that the
simultaneous use of their televisions and computers had been facilitated by the mobility of
laptops and a wireless Internet connection. Previously, these householders had used
desktop computers away from living areas. Householder 5b also explained that the
potential to view television, in the home‟s lounge, was a factor for her wanting to own a
laptop. Therefore, although laptops may offer improved energy efficiency, they can also
facilitate more energy intensive behaviour. For example, although householder 4‟s use of
a 35 W laptop resulted in reduced computing appliance electricity consumption (a desktop
and monitor had an average power load of around 102 W), his frequently simultaneous
use of a 135 W CRT television, a 30 W complex STB and a 10 W router, actually made his
computing activities more energy intensive.

266
8.3 Personal characteristics
Responses from all fourteen of the interviews also indicated that personal characteristics,
such as personal interests, influenced both the extent of appliance use and times of use.
For instance, householder 14 explained:
...one of the reasons why I watch in the pattern that I watch on the TV for example, is because of
what I watch. So, erm, I watch the news... I only ever watch films or documentaries, so I would
never watch the telly, apart from the news, before 8 O‟clock...
Householder 10a described that his extensive use of computing appliances reflected his
interest in graphic design by stating “my interest, design interest, focuses around digital
technology”. Similarly, householder 7 expressed a strong interest in computing
technology, which is reflected in the very high electricity consumption from computing
appliances. Householder 13a, who was also from a high ICE appliance using household,
also articulated a crossover between his occupation and an interest in music.
...for my part there‟s an obvious, an obvious thing to say, I‟m a big music head and I use my
computer for finding music all the time so, or movies, but then movies is my business, so I‟m doing
both at the same time, I‟m satisfying myself emotionally and I‟m also satisfying myself from an
employment point of view. So there‟s a definite convergence of the two.
Householder 13a‟s comment highlights that personal interests were linked to pleasurable
emotions gained from the use of ICE appliances. More intensive patterns of appliance use
(e.g. individualised use) are therefore unsurprising, due to householders gaining different
levels of pleasure from the use of different appliances. Thus, affect appeared to have an
underlying role in households‟ different patterns of electricity consumption.

267
8.4 Affect and emotions
8.4.1 Pleasure and relaxation
Emotions were cited by participants in all fourteen interviews as factors for appliance use.
Householders often expressed that the entertainment derived from ICE appliance use
provided either pleasure or relaxation. Although relaxation is not necessarily a direct
emotion, it has a close association. It can be defined as a state where an individual‟s
“emotional level is diminished, especially the level of emotions such as anxiety, fear and
anger” (Reber and Reber, 2001 p621). Typical examples came from householder 1a who
described that video appliance use was for the household‟s “own personal pleasure” and
householder 2a who described the enjoyment of playing computer games with his son.
Householder 9c explained that television “takes your mind off what you‟ve been stressed
about” and householder 11b stated “if I want to de-stress I watch a movie basically, and
sometimes I need to hear music”. Strong emotions were expressed in household 13,
which was one of the households with high ICE appliance electricity consumption.
13b: We do love TV ((laughs))
R: Do you?
13a: I love TV, I love it... I can‟t envisage my life without it, I love it. I love it.
The intrinsic role of pleasure in entertainment activities suggests that affect is an important
reason for ICE appliance electricity consumption. The TIB measures affect against a
positive (i.e. pleasant) and negative (i.e. unpleasant) axis that can be either weak or
strong, but this research also found other aspects of affect in the data. Three
householders described that their mood influenced appliance use. Householder 3a cited
occasions where his mood could influence the use of audio equipment.
I mean if you‟re feeling a bit down and you don‟t know what to do, you put a record on don‟t you? A
lot of people do subconsciously, I think.

268
In direct contrast, householder 14 explained that she had to be “really quite happy to play
music” and went on to describe that her mood could also influence the use of computing
appliances.
14: My state of mind, or my state of feeling, does affect how use them. So for example, if I‟m feeling
down, I‟m more likely to be writing more complaining letters.
R: Right, so you‟re more likely to be using the computer?
14: I‟m more likely to be on the computer, I‟m less likely to be listening to the music system.
Although mood appeared to influence some householders‟ appliance use, the use of
appliances to provide a more emotionally satisfying atmosphere was cited more frequently.
8.4.2 Comfort and “background” appliance use
Participants in nine of the households cited the use of appliances to create a more
comfortable atmosphere. Householder 11a believed that the use of appliances in the
background was “definitely a comfort thing”. She explained “if I‟m cooking it‟s sort of
cosier, if I put the radio on”. Householder 2b explained that the visual function of her
television was used as a means to influence her home‟s atmosphere.
...even if we have people around, you have the TV on and the volume down, because you know it‟s
like a background thing, just a focus, to look at ((laughs)).
There was also a sense that appliance use provided a means to satisfy deeper emotional
needs. For example, the notion of company was described in six of the interviews.
Householder 12c said, “I hate it when there‟s no noise in the background, you hear every
creak and bang... so I turn the telly on for a bit of company”. Householder 4 said that his
television provided “noises in the house”, which he linked to living alone and householder
7 said:
I do live on my own most of the time and it‟s not pleasant to be in a silent mode...so it is pleasant to
have noises around as it were, signs of life and yes, a sense of warmth and light...

269
Both householders 4 and 7 also highlighted that computers provided a means to feel less
isolated. For instance, householder 4 explained:
I suppose living on my own its erm, I can have a chat with my mates while I‟m online, so that you
know, it‟s not like you‟re sat on your own.
The use of appliances to create a more comfortable atmosphere echoes findings from
previous energy research (Green and Ellegård, 2007) and has a degree of similarity to the
influential work by Wilhite et al. (1996). Wilhite et al. found that Norwegian households
were predisposed to create a “cosy” atmosphere through lighting and heating practices
and that this could lead to “overheating and over lighting as insurance against social
failure” (Wilhite et al., 1996, p.10). Although the notion of social failure was not evident in
the interviews, there was evidence that the use of appliances to provide comfort resulted in
active power mode electricity consumption that was not being fully utilised by the
householders. For example, householder 7 said:
Again I‟ll often be using this computer, which obviously doesn‟t face the TV and I‟ll be listening to
the TV sound without watching the TV.
Similarly, householder 13a said:
13a: I have the TV on a lot. For most of the time.
13b: Even when you‟re not watching it ((laughs))
13a: True. Well it‟s always on in the background, for me, the majority of the time.
R: So why is that?
13a: Well I used to have the radio on all the time, I used to have the radio on in every room, so I like
the ambient noise for a start, I also ((pause)) tend to have a TV on while I‟m working on a computer,
because it‟s going in one ear all the time. I feel like I‟m continually learning, in the background,
that‟s why I always have some form of external stimulus going on.
While talking about the “background” use of her television, householder 2b also suggested
a degree of emotional symbolism:

270
...the majority of the time it‟s on whether anyone is watching it or not. Because we haven‟t got a
gas-fire have we, I think, do you know what I mean, it‟s like the focus point in our room.
In contrast, in the two households with lowest ICE appliance electricity consumption the
background use of ICE appliances appeared to be less common. Householder 1a
highlighted that if appliances were not being utilised fully, they were disconnected from the
mains and householder 14 described she preferred a quite atmosphere in her home.
Influences such as comfort, pleasure and relaxation indicate that ICE appliances are
distinct from other appliance end-uses, such as cold and wet appliances, as it is difficult to
envisage that individuals gain a similar type of emotional response from the use of a
refrigerator or washing machine. This implies that policy instruments, designed to reduce
ICE appliance electricity consumption, have to contend with deeper emotional motivations
that drive active appliance use.
8.4.3 Energy saving: pleasure and guilt
An additional aspect of affect was evident in a number of responses that implied emotions
regarding energy saving. While discussing why he refrained from using the passive
standby function on his television, Householder 4 explained, “it makes you feel better... if
you‟re turning things off, then it does make you feel like you give a shit”. Three
householders also described feelings of guilt if they left appliances on. For instance,
householder 14 said:
I think I have a huge guilt complex, and so there‟s, I better turn these things off and save the planet,
ties in well with my big guilt complex
Although feelings of guilt can be linked to the construct of affect, this response can also be
linked to an individual‟s values, which Triandis describes as “how good or how bad one
would feel if a particular consequence actually happened” (Triandis, 1977 p9). Guilt is also
closely connected to the individual‟s moral beliefs and the idea of the personal norm

271
evident in Schwartz‟s NAM and Stern‟s VBN model (as described in section 3.5.3). These
are aspects of the results discussed in more detail in the following section.
8.5 The consequences of ICE appliance use
The TIB contends that an individual‟s perception of the consequences of a given behaviour
influences whether the behaviour will occur. This more rational evaluation is based on the
outcome of past behaviour and the degree to which an individual values the consequences
of the behaviour. Triandis contends that “much of human behavior is goal directed”
(Triandis, 1977 p17). Thus, the goals described in section 8.2 (and the degree of pleasure
gained from them) are clear consequences of ICE appliance use that are involved in the
householders‟ evaluations. However, other perceived consequences of appliance use
also influenced participants‟ patterns of use.
8.5.1 Financial cost and environmental harm
Two key themes that emerged from the data, related to the value given to the financial
cost and environmental harm associated to ICE appliance electricity consumption.
Financial cost was mentioned in ten of the interviews and environmental harm was
mentioned in eleven of the interviews as reasons for energy saving behaviours. In all but
one case, these themes emerged in discussions concerning why householders turned
appliances off (or into standby) after a period of active use or refrained from using standby
functions. In eight of these households both financial cost and environmental harm were
raised by a householder together. The following exchange with householder 13b provides
a typical example.
13b: He will go out for the afternoon and he‟ll have left the computer on. And that really bugs me.
R: Why?
13b: Just because it‟s a waste of energy, no one‟s using it.
R: And why do you see that as a waste of energy, in a sense?
13b: Well you know, I try and be kind of environmentally conscious, and just the cost.

272
The above example also highlights that in some cases, members of the same household
could have very different patterns of behaviour that reflected different levels of value
associated to the consequence of ICE appliance use. This was more obviously in three of
the households (household 3, 10 and 13). As a result, one householder‟s efforts to reduce
electricity consumption could be subjugated by another householder‟s behaviour. This not
only highlights another level of complexity inherent in the appliance monitoring data, but
also that to produce extensive reductions in electricity consumption, behavioural change
needs to occur at the household level rather than exclusively at the individual level. This
emphasises the importance of energy efficient design, because the reduction of appliance
power loads provides a consistent means to influence the energy consumption of each
household member.
The financial consequences of ICE appliance use echoes rational choice theory (described
in section 3.5.1), which contends that individuals seek to maximise their personal benefit.
The householders that cited concern for the environment often also used language that
implied moral motivations. Similar to householders‟ feelings of guilt, such comments
reflected the idea of the personal norm evident in the NAM and VBN models. For
example, householder 4 explained that environmental concern was a reason for his energy
saving behaviours.
...there‟s an awareness that there are problems with the environment and that everyone has got to
do their bit. So it‟s just a bit of an effort, and obviously we could all do a lot more but, including
myself, but yeah, I‟ve made a half arsed attempt at it anyway.
Aspects of householder 4‟s response reflect the antecedents of the personal norm. Firstly,
there is an awareness of environmental consequences (which he links to ICE appliance
electricity consumption) and secondly, he ascribes responsibility to himself. The phrase
“everyone has got to do their bit” also suggests a sense of obligation, which is a key
component of the personal norm (Wall, 2006). Awareness of the environmental
consequences of ICE appliance electricity consumption and personal responsibility were
also expressed by other householders with relatively low ICE appliance electricity
consumption. The following exchange with householder 3b provides an example.

273
R: So what makes you turn the appliances off then?
3b: Because I want to save energy.
R: Why?
3b: Because of the planet. I mean there‟s enough happening at the moment, I feel it‟s my
contribution towards saving energy. Also, because of the cost as well, so yes I do think we should.
Householder 13b was also aware of the environmental implications of ICE appliance
electricity consumption and implied a degree of personal responsibility in the following
response.
I think it‟s something I want to do. I want to do something kind of right. Because I think if enough
people do things right, then we might save a bit more energy.
Although many of the responses provided by householders did not directly include the
terms responsibility and obligation, it was clear that the majority of the householders
valued the environment and believed that the environment was worthy of protection. In
total, seventeen of the householders, in ten of the households, implied moral concern for
the environment. In most cases, there was some evidence that these participants‟
performed some energy saving behaviours due to this concern. For example, most
households did not use the passive standby (i.e. remote control) function with their
televisions. Thus, in common with previous research there was some evidence that pro-
environmental values and attitudes could result in energy saving behaviour (Steg and
Vlek, 2009; Abrahamse et al., 2005).
However, in the majority of homes, this type of behaviour was not applied to all their ICE
appliances and although, some householders mentioned that they would turn active
appliances off, when not in use, none of the participants reported that they regulated their
appliance use (i.e. to a number of hours per day) to protect the environment or save
money. This form of action would have been an effective method to reduce electricity
consumption, due to active appliances‟ higher power loads. Therefore, although most
householders had intentions to save money or protect the environment, these motivations

274
were not always strong enough to override other motivations. This was reflected in the
monitoring data, because despite all the members of the two households with the lowest
ICE appliance electricity consumption (households 1 and 14) expressing strong moral
concern, this was also the case in the majority of the higher ICE appliance electricity
consuming households (e.g. all the members of households 9, 12 and 6).
Before discussing other factors that motivated ICE appliance use, it is useful to highlight
another aspect of morality that helped to explain the electricity consumption
measurements at household 7. Householder 7 explained that his three computers (which
were continuously in an active power mode) were contributing to a global computer
network used to research malaria and AIDS. For householder 7, the subsequent cost of
the electricity consumption was viewed as a charitable contribution that aligned with his
strong interest in computers. This was an interesting aspect of this study, because it
contradicts the idea that altruistic behaviour correlates positively with pro-environmental
behaviour (as contended by the VBN model).
8.5.2 Safety
Similar to findings in other research (e.g. Gram-Hanssen, 2005; 2004) participants in six of
the households reported that concerns over safety resulted in behaviours that reduced ICE
appliance electricity consumption. The members of households 1, 2, and 11 explained
that concern over fire was an important factor for regularly disconnecting video appliances
at the mains socket and householder 13b said that concern over fire led her to turn
appliances off with switches on the devices. For household 11 disconnecting video
appliances when not in use led to the low video appliance electricity consumption recorded
over the two week monitoring period and in household 2 the concern over fire resulted in
video and computing appliances (including a complex STB) being routinely disconnected
overnight or when the house was unoccupied. As a result, this household had relatively
low standby power consumption. Interestingly, these concerns did not result in all the ICE
appliances in the households being disconnected. For example, in both household 2 and
11 routers and telephony appliances remained connected to the mains supply, which
highlights that participants had different motivations for particular appliances in the homes.

275
A further example of this phenomenon came from householder 3a, who described that he
disconnected his router due to safety concerns regarding the security of his network.
Similarly, householder 10a explained that the security of his computer was a factor in his
use of the hibernation mode, as it prevented external access when he was away from his
computer. Although safety concerns were largely reported as motivations that reduced
ICE appliance electricity consumption, there were also cases where this motivation could
increase electricity consumption. Safety for appliances was cited by householders 13a
and 10a as a reason for not frequently turning appliances off. Both householders believed
this behaviour would be detrimental to computing equipment.
8.5.3 Convenience
One consequence that emerged in ten of the interviews was the value given to
convenience, which has also been captured in previous energy research (Vowles et al.,
2001; Gram-Hanssen et al., 2004; Røpke et al., 2010). Convenience represents
householders‟ desire to reduce the effort and time taken to undertake ICE appliance goals.
For example, householder 8b explained that video appliances were left on standby “for
ease of use” and both householder 9a and 11a cited convenience as a factor for not
turning off their routers. Convenience also influenced the active use of appliances. A
typical example came from householder 13a who explained “there‟s no point turning
something off if I‟m going to come back in two minutes time”. Similarly, householder 3a
said:
...if you go and make cup of tea you don‟t go and turn the television off. I mean I do it on Saturday‟s
because I‟m in and out, but I‟m listening to the sport that‟s going on, so I‟ll go and work in the
garage and shoot back in every five minutes, because I don‟t want to keep putting it back on again.
Convenience appeared to be particularly important to the use of computers. For example,
householder 12b explained his common use of a laptop.
I don‟t shut down during the day, probably because of the way that I use it, I look at something and
then go off and do something else for an hour and then come back, and I suppose it‟s more
convenient, just to leave it on.

276
Similarly, householder 11a explained that she rarely turned her computer off, once it had
been activated.
... I might come down cook lunch, and nip out to the shops, I‟ll never turn it off in that case, it‟ll get
turned off at the end of the day... like now, it‟s on, and I‟m not using it, the radio‟s playing, I‟m not
using it, I‟m down here... I won‟t be on it for 8 hours, I might be on it for a couple out of that.
In total, participants in five of the households mentioned that convenience was an
important factor for leaving computers in an energy consuming state for prolonged periods.
Four of these households (10, 11, 12 and 13) were also amongst the five households with
the highest computing appliance electricity consumption. As will be described in section
8.8.3, convenience is closely linked to facilitating conditions, which make energy saving
either a convenient or inconvenient activity. For instance, long activation times made it
less convenient to turn computers off and the loss of appliance settings made the
reduction of standby consumption an inconvenient activity for network appliances (e.g.
routers, STBs and telephony equipment) and digital radios. Thus, convenience could
often outweigh financial and environmental motivations to undertake energy saving
behaviours.
8.5.4 Importance of work related goals
In addition to convenience, there was also evidence that the perceived value of goals
could restrict the potential for energy saving. A good example is the importance given to
work related goals. For example, householder 10a explained why he set his computer not
to automatically enter low power modes.
You don‟t want it hibernating when you‟ve not saved the work, and then you boot it up and it‟s
messed up... it basically ruins your file and mines purposely set not to do that.
Householder 13a worked extensively from home and explained that the loss of his router
settings was a risk he wasn‟t prepared to accept.

277
13a: If your home office relies entirely on the Internet, then you don‟t want to go through the
jeopardy everyday of having to reset your router and establish new connections.
R: Like if you lose your IP address?
13a: Exactly, you don‟t want that, I‟m going to leave it on and I don‟t care, the energy use can go
and screw itself. I‟m going to leave it on.
A similar sentiment was expressed in household 9, where the importance of work activities
led to the household‟s non-domestic standard printer/copier remaining on standby when
not in use. The office printer/copier was responsible for around 17% of the household‟s
overall ICE appliance electricity consumption, 77% of which was from standby
consumption. Householder 9a explained why this was the case:
9a: ...you had to have engineers to set it up that printer, so it‟s not something I feel like going, oh
whoopee let‟s get the tools out and let‟s have a play... so you tend to put it in, plug it in, system
works, leave well alone. That‟s my view of what‟s in there. If you said, it actually, it‟s interesting
that, because it has to run contrary to everything else we‟re doing, psychologically it‟s saying, that‟s
work ((points to office area))=
It was apparent in the interview that environmental concern was a particularly important
value for the members of household 9. This was evident in the monitoring data due to
video and audio appliances being routinely disconnected from the mains supply to reduce
standby consumption. However, the above insight highlights how the value given to
working activities can produce distinct psychological attitudes towards the use of particular
appliances and override motivations to save energy.
Thus, the importance of work related goals provides a good example of how participants
appeared to evaluate the value of the different consequences of their behaviour and
although financial and environmental considerations appeared to influence intentions to
save energy, this was often balanced against convenience and the degree of value given
to achieving the goal (e.g. completing work, pleasure, comfort).

278
8.5.5 Past behaviour
As contended by the TIB, many of the householders explained that the consequences of
previous behaviour influenced their current patterns of appliance use. Householders 9a
and 13a both described that previous problems with router settings had led them not to
disconnect their routers. Participants that routinely disconnected appliances from the
mains supply, due to concerns over fire (households 1, 2, and 11), attributed their
behaviours to past experiences with faulty appliances. For example, householder 2b
explained:
It‟s just through nearly having a fire once. I‟ve just been extra cautious of not setting fire to the
house ((laughs)). I turn everything off!
Householder 13b explained that concern over fire was linked to a childhood experience,
when members of the fire brigade “came to visit our school, and it really terrified me”.
Childhood experience was mentioned as an influence on behaviour in eight of the
interviews and householders often described their upbringing as an influential factor. This
theme has similarities to Bourdieu‟s concept of habitus, which has been cited in energy
research by Gram-Hanssen (2005; 2008). For example, householder 13a described how
his extensive television use was linked to childhood activities. He explained, “I always
have done, since I was a small child, I‟d sit in front of the TV for hours”. Similarly,
householder 4 linked his routine evening television use to his childhood.
I suppose it‟s as you are growing up, if your family sat around watching the TV in the evenings then
you automatically pick it up and that‟s what you do. I mean I‟m not from a family of big readers or,
we spent a lot of time at home, in the evenings, so we were always sat around the telly.
Evidence of this process was also apparent in household 2. While describing their son‟s
affinity to television and video games, householder 2b said, “we‟ve probably influenced 2c
by putting the TV on when he was at such a young age and he‟s got glued to it since”. A
number of responses also illustrated that influences during childhood could result in
reduced electricity consumption, even though households could probably afford the

279
expenditure. For example, householder 10b described routinely turning appliances off
standby due to financial expenditure, which she linked to her upbringing saying:
... I‟ve been doing that kind of thing since, for ages, it was how I was brought up... I mean we used
to get charged if we left the lights on. You know there was a 20p tin, you had to put 20p in it.
The members of household 6 also had a strong aversion to any form of waste, which they
linked to their upbringing and householder 14 also suggested that her childhood
environment (and her family‟s social class) may have also influenced her preference for a
quite atmosphere in her home.
...when I did my homework as a kid, my mum and dad wanted me to do well, they were from a
working class background, and if I was doing my homework, everything went off, to allow me to
concentrate on my homework, telly was off, they didn‟t talk...
The influence of “habitus” also links appliance use to the formation of deep-seated habits,
which is discussed in section 8.7. However, it also highlights that the social structures
experienced during childhood can also influence behaviour.
8.6 Social influences
During the interviews aspects of social influence, from wider society, were raised. Often
these responses were interlaced with reasons given for the ownership of ICE appliances.
Consequently, aspects of social influence are discussed in more detail in chapter 9.
However, one clear connection between society and the appliance monitoring data was
that majority of households with higher ICE appliance electricity consumption (e.g. 7, 9, 10,
12 and 13) described that computing appliances had become deeply integrated into their
domestic infrastructure.

280
8.6.1 Contracts
The most noticeable contracts described by householders were those made with their
employers, which influenced household occupancy. For households 4, 7 and 8, work
contracts facilitated a traditional five day working week, which led to active appliance use
being highest in weekday evenings and at weekends. For example, householder 4
explained:
...because I don‟t work strange hours, I work 9 to 5 all the time, every day of the week is probably
similar. So, I mean that graph there, that‟s why those two are a little bit lower. Erm, yeah and
because I live on my own, of course all the energy use is only going to be when I‟m here, so it‟s all
just in the evening sort of between erm, 6pm and 11pm really.
In contrast, one of the householders in households 9, 12 and 13 worked extensively from
home. The increased occupancy and use of computing appliances contributed to these
three households being amongst the five highest ICE electricity consuming households.
Employment contracts also influenced other households in the study. At least one
householder in households 3, 10 and 11 worked regularly from home (e.g. a day a week)
and householder 2b worked a four day week due to his employment contract. These more
flexible working patterns appeared to have a significant impact on households‟ computing
appliance use. In five of the six households with the highest computing appliance
electricity consumption (9, 10, 11, 12 and 13), at least one member worked regularly from
home.
8.6.2 Social norms
As described in section 8.5.1, householders who implied concern for the environment often
described moral values, which aligned more closely to the personal norm. Only two
householders tentatively suggested that there was any social pressure to use appliances
in a pro-environmental way. For example, householder 11a believed that there was a
growing awareness to save energy, saying:

281
...I think as it becomes more common. I think it‟s a bit like drink driving, a lot of people used to do
that, and now it‟s something you don‟t do because its, you know what I mean, it‟s a stigma.
However, there was clearer evidence of social norms that supported more extensive
appliance use. For instance, householder 5a explained that a factor for leaving appliances
on standby linked to other people‟s behaviour, saying “I think just purely because the
facility is there, and everyone else does it and, you just do it”. Householder 14 explained
that the daily use of her computer was encouraged by the common use of email:
I think I‟ve got into the mode of it‟s a normal sort of way of communicating, so I‟d look at my email
every day, perhaps twice a day, even though I‟m not getting that many messages ((laughs)).
A similar discussion at household 8 also highlighted that the parallel use of appliances and
social network websites had become a normal teenage activity. Householder 8b
explained:
8b: I‟d say I‟m sort of a modern teenager, so I‟m using the computer and I‟m using my music and
I‟m using my TV, maybe even all at once, and that‟s to do with my generation, sort of feel the need
to have all of these things and use them like that.
R: Because you mentioned like, using it to keep in touch with people is that=
8b: =Exactly, that‟s like what everyone‟s doing at this time, or you know, it‟s sort of a thing that
everyone‟s doing.
Householder 10b also linked the social pressure to communicate online to her use of
computing appliances.
I think there‟s a definite pressure to use Twitter and My-space and Facebook. And be online, and
have a very definite presence online, which obviously means a lot of laptop usage or a portable
device usage if you‟ve got an I-phone or similar.

282
A further aspect of social norms was reflected in comments by two householders for whom
computing was a key part of their personal and working lives. While discussing why he left
computing appliances active for extensive periods, householder 13a said:
13a: ...when it comes to fan cooled appliances and computers and things like that, I mean I‟ve
come from an environment that, of a school, that says just leave them on.
R: Why?
13a: Why not. And because of a lot of time they‟ll be working in the background, downloading.
The use of vocabulary such as “I‟ve come from an environment” and “of a school”
suggests that, within his experience of society, leaving appliances active is a socially
acceptable behaviour. Evidence for this type of norm was also apparent in a comment
made by householder 10a, who described the use of computers in his work industry.
10a: At (previous employer) or where we are, you leave computers on constantly, and never turn
them off... You just turn you monitor off and go. No one reboots anything unless you have to.
R: So do you think that‟s changed the way you use them?
10a: Er, yeah, I mean I was kind of surprised when I worked there and then I quite got into the habit
of it.
Thus, there was a suggestion that energy intensive patterns of use could be developed
from workplace norms and potentially transferred to the domestic setting. Overall, the
interviews suggested that the influence of social norms was more likely to support the
more extensive use of ICE appliances. A further aspect of householder 10a‟s response is
the reference to habitual behaviour.
8.7 Habits and routines
A key element of the TIB is that behaviour is influenced by habits formed through the
previous and repetitive performance of an act. Similar to other studies that have
investigated household energy consumption (e.g. Crosbie, 2008; Gram-Hanssen, 2004;
2005; 2006; Moreau and Wilbrin, 2005), participants in all fourteen interviews described
habit as an influence on their ICE appliance use. Typical references to habit included: “I

283
automatically turn it off when I‟ve finished using it” (householder 1b), “I‟ve got into the
habit” (householder 8b), “that is just a habitual thing” (householder 3a) and “I mean I do it
without thinking” (householder 6b).
Habits appeared to have formed around the motivations described in section 8.5 (e.g.
convenience, safety, loss of settings, etc) and contextual influences to be described in
section 8.8. In eight of the homes, habits and routines were also linked to childhood
development. This finding has parallels with work by Gram-Hanssen (2004; 2005; 2010),
which links the formation of habits to Bourdieu‟s concept of habitus.
Participants‟ described a variety of habits that could either increase or curtail electricity
consumption. For example, householder 7 explained that habit could result in his
computers remaining active even when they were not undertaking grid computing.
... I‟m habitual leaving computers on and I have done that, I feel a bit guilty about that, when they
aren‟t doing useful work... and things like not turning the telly off at the plug, that‟s kind of habitual...
Responses often reflected Triandis‟ argument that the strength of the habit is influenced by
settings, contexts, familiarity of cues and the extent to which other individuals provide
reinforcement of the behaviour (Triandis, 1980). For example, householder 4 explained
that he automatically turned his television on when he got home from work. He said, “It‟s
just force of habit really, that makes you put it on”. In contrast, the members of household
2 described that concerns about safety had led them to form the habit of disconnecting
video appliances when they left their home unoccupied. A good example of how habits
can influence behaviour is evident in the following exchange. When asked if they
consciously thought about energy saving, the members of household 9 explained that to
curtail their energy consumption they had modified their habits.
R: But is it something you are thinking about all the time while you do it, you must save energy?
9a: Well, it‟s about changing habits isn‟t it? I mean once you become aware of something, you
change your behaviour, you change your habits and you adjust accordingly.
9b: Until it becomes a habit, in itself.

284
9a: And now you don‟t even think about it do you? If you go to bed at night now, you turn the TV
off, you click the switches off.
Similar to the above quotation other responses suggested that habits rely on the
performance of a particular behaviour over time. For example, householder 13b explained
that her habit of turning off appliances could be connected to the newness of an appliance.
R: But do you ever think about that actively or is it something you do automatically?
13b: Maybe a little bit of both really. There are some things that I‟ll definitely do automatically, like
I‟ve got in a bit of a habit of turning things off. Yeah, like the TVs, I always make sure that I turn
those off properly, and there might be other things, perhaps if you get a new appliance then I‟ll
probably think about that a little bit more, until it becomes a habit as well.
As mentioned in section 8.5.2, concern over fire was an influence on householder 13b‟s
behaviour (due to education when she was a child) and appears to have resulted in the
formation of habit. Similarly, householder 12b linked his non-use of his television‟s
passive standby function to past behaviour.
... there‟s little things that erm ((pause)) that do trigger you to behave in certain ways, erm I think
that turning the main telly off, that‟s routine, established when we didn‟t have tellies with remotes,
so you had to switch it off.
Householder 13b and 12b‟s responses suggest that the generally low standby
consumption measured from televisions, throughout the sample, may be linked to habits
formed from past television use, when concerns about safety were more widespread and
before television remote controls.
The above response from householder 12b also reflects Triandis‟ (1977) argument that
habits are triggered by situational cues. The role of situational cues was also evident in
routine patterns of ICE appliance use that were described in eleven of the interviews. The
most common routines were associated to sleep patterns, which were described in nine of
the interviews. For example, householder 10b described that turning appliances off (or
285
putting appliances into standby power modes) had become part of her routine prior to
sleep.
In six of the interviews, householders also described that video appliances were routinely
used during or following meal times. An interesting example of routine behaviour came
from householder 14, who explained that, even though she had retired, her patterns of
computer use were still influenced by her old work routines (e.g. not used at weekends).
Thus, habits and routines appear to be an important influence on both energy intensive
and energy saving patterns of appliance use. As contended by the TIB, habits could be
triggered by situational cues and were developed through past behaviour. The formation
of habits during childhood, highlights that social structures can shape patterns of appliance
use. Importantly, the examples in this section also highlight that habits were formed
around other contextual factors, such as appliances‟ controls. The following section
describes a range of contextual factors that could also facilitate patterns of behaviour.
8.8 Facilitating conditions
8.8.1 Arousal
The most common theme related to arousal was the influence of tiredness, which was
mentioned in seven of the interviews. For the majority of cases tiredness was linked to
television use. For example, householder 12c explained, “I suppose if you feel tired or
erm, or you can‟t be bothered to do anything, you put the telly on”. Householders who
often used their bedroom televisions prior to sleep also described that they preferred to
use their remote handsets rather than get out of bed and use the switch on the appliance.
This helped to explain the higher percentage of passive standby power consumption from
bedroom televisions (identified in section 7.4.3).
It was also reported that, on occasion, both householders 12c and 5b were inclined to fall
asleep in bed while the television was still active. Householder 10b described a similar
pattern of use in her home saying, “I‟ll go to bed and 10a will stay up and watch, and fall

286
asleep, with the TV on”. Householder 10b suggested that the influence of alcohol could be
related to this pattern of use and that alcohol could also influence her energy saving
activities. When asked about her routine of turning appliances off at night she said, “I
wouldn‟t say, like any routine, it isn‟t 100%, it depends how much I‟ve had to drink, doesn‟t
it? ((laughs))”. When probed further about the potential influence of alcohol, the
householders provided the following exchange.
10b: ...if you are drunk, for me personally, I will forget to do the things that I would normally do. Not
always, but sometimes. Or 10a will fall asleep with all the devices still running.
R: Then you think that could actually have an impact?
10a: [Yeah]
10b: [Yeah] definitely on energy use, without a doubt.
Although quite anecdotal, the influence of alcohol on ICE appliance use could be an
interesting area for research, particularly due to current concerns relating to the UK‟s
drinking culture. Overall, arousal appears to help explain some aspects of ICE appliance
use. However, other themes linked to facilitating conditions appeared to be more
significant.
8.8.2 Ability: personal ability
By definition ability “is an individual‟s potential to perform” (Reber and Reber, 2001 p1).
Responses from twelve of the interviews were coded under “ability” themes that related to
householders personal ability to perform behaviours. Influences on householders‟ ability
to perform behaviours from the physical environment were coded separately, under
physical constraints.
The theme “capacity” was used to code a diverse range of responses that reflected
individual‟s personal ability. For example, householder 13a suggested her partner‟s more
extensive television use may have been related to his ability to watch repeats, saying, “his
capacity for repeats is amazing”. In direct contrast, householder 5a explained that her
short attention span led her to watch television for short periods of time.

287
Other personal ability themes were used to code more comparable responses. In four
interviews, participants described that they did not have a strong affinity with ICE
appliances. For example, two householders described themselves as “technophobes” and
that this led them to have limited understanding of how to operate some appliances
(particularly computing appliances). The effect of “technophobia” was that some
householders were particularly concerned not to interfere with network appliances, such as
routers and modems, and found it difficult to understand how to use appliances different
functions (e.g. power management settings). This suggests that the complexity of
appliance‟s power functions needs to be as straightforward as possible.
A number of responses linked health to the extent of active appliance use. Householder
13b explained that insomnia resulted in his common use of appliances from as early as
4am and householder 2b described how long-term ill health restricted the extent that she
left the home. Householder 9c‟s long-term ill health resulted in him spending much of his
time at home and helped to explain why household 9 had the second highest two week
electricity consumption from television use. Similarly, householder 1a explained that
despite being retired, long-term ill health also influenced his appliance use. He said
“otherwise I‟d be out, out and about doing things, so sickness has played a big part in the
amount of television I watch”.
Household 8 had the highest audio appliance electricity consumption over the two week
monitoring period. When asked why audio appliance use was significant the following
exchange occurred.
8a: I have the radio on all the time.
R: So why is that?
8a: Partly because I like it and partly because I have tinnitus, and it‟s suggested that you might
have something else going on in the background, so that it doesn‟t drive you completely mad.
Thus, for householder 8a the active “background” use of audio appliances provided a
valuable service, even if the radio was not being avidly listened to by the householder.

288
Householder 14 described appliance use that occurred outside her home, which provided
an insight into how aging can influence standby power consumption.
...my dad can‟t be getting up and down to switch the television off, he‟s got a walking frame... he‟s
going to be leaning over trying to turn it off, he‟s going to be falling over. It‟s not worth the hassle, so
he has it in standby mode all the time, he only ever uses the handset.
The above quotation highlights that standby power functions can provide a valuable
service, which is an issue often lost when concentrating on energy efficiency issues. This
also suggests that the removal of some standby functions from appliance design may not
be a preferable solution to domestic standby consumption. The emergence of the health
theme also indicates that wider social issues, that influence occupancy, can significantly
influence household electricity consumption.
8.8.3 Ability: physical constraints
8.8.3.1 Occupancy
From one perspective, each of the households‟ level of occupancy fundamentally
influenced the extent to which ICE appliance behaviours could occur. In other words,
appliances could not be operated without a householder occupying the dwelling. Common
factors that influenced occupancy, related to householders‟ general lifestyles (e.g. interests
outside the home, child care responsibilities) and factors already described in this chapter
(e.g. health, working patterns). Although occupancy clearly influenced householders‟
potential to use ICE appliances, it is not possible to use occupancy as a simple means to
predict households‟ relative electricity consumption. For example, households 1, 2, 5 and
14 reported a relatively high degree of occupancy, but were amongst the lowest ICE
appliance electricity consuming households. In contrast, household 7 had relatively low
daytime occupancy (due to working a traditional working week), but the highest ICE
appliance electricity consumption. Thus, household behaviour had a crucial part to play,
because it can influence patterns of electricity consumption when homes are both
occupied and unoccupied.

289
8.8.3.2 Access to mains electricity sockets and building infrastructure
Similar to other research (e.g. Crosbie, 2008; Gram-Hanssen, 2005; Gudbjerg and Gram-
Hanssen, 2006; Vowles et al., 2001), accessibility to mains electricity sockets was cited as
a factor for leaving appliances on standby and emerged from seven of the interviews. For
instance, the members of household 3 described that although the router and other
computing appliances were turned off at the mains supply, this behaviour was not
replicated with their video appliances due to access difficulties.
R: Right, is that something you normally do, turn things off?
3a: I will on that one (router) yeah, but not on the other ones.
3b: Well I can‟t reach them anyway, because they are behind the television (the lounge video
appliances)... Maybe if it was reachable, that‟s something well have to look at. Because that
(complex STB) is permanently on standby.
As a result, household 3‟s complex STB, VCR and DVD player remained continuously in
standby power modes. The standby consumption from these three appliances accounted
for 27.1% of the household‟s total two week ICE appliance electricity consumption. In
contrast, the household‟s standby consumption from computing appliances was relatively
low due to the accessibility of the sockets.
Around 27% of household 6‟s two week ICE appliance electricity consumption resulted
from computing appliance standby consumption. Householder 6b made it clear that, in
addition to concerns over losing appliance settings, difficulties in accessing a mains socket
was an important factor for leaving computing appliances on standby.
6b: ...well one is because it‟s right under the desk and I can‟t reach it, the main plug is under the
desk, and I would have to get on the floor, crawl under and it‟s the way the electrics are situated.
R: So, do you think that is a big influence on your be[haviour]?
6b: [Well it] is, because you can‟t get to it.
Household 13a believed that access difficulties were reflected in decisions to hide plug
sockets and appliance cables.

290
... I think the majority of people, like us, will hide ugly wires, ugly plugs, hide them away and make
them so you can‟t get at them. Anyone who‟s determined to turn off their appliances would. So, you
determine your own aesthetics in a way, to a degree, I think.
This response echoes work by Crosbie (2008), which found that the placement of ICE
appliances and mains sockets lead to the use of standby power modes. Accessibility of
mains sockets is an influence also mentioned in other energy research (Vowles et al.
2001; Gudbjerg and Gram-Hanssen, 2006; Gram-Hanssen, 2005) and suggests that
improving the accessibility of mains sockets through building design could help to reduce
appliance electricity consumption. For example, householder 4 believed that improving his
dwelling‟s infrastructure could help him to reduce his electricity consumption.
...I mean that‟s not factored in when they build houses is it really? Electricians, erm you can‟t switch
a room off, erm, that would be a good idea actually wouldn‟t it, you could actually switch the power
off to an entire room, like erm, you could have it next to the erm, light switch couldn‟t you?
A similar idea was also expressed by members of household 12.
12b: ...if you could press a button on your wall, or at night or in the morning when you go out to
work or whatever,
12a: Yeah, turn everything off.
12b: Shut down the appliances, and then click it back on, later on, then we‟d definitely be doing
that.
Although the alteration of existing dwellings infrastructures may be challenging, devices
are available that can discontinue the electricity supply to a number of appliances from a
central hub (i.e. standby limiters) (Welling, 2010). However, none of the householders
used this type of equipment, which suggests that the promotion of such equipment would
be beneficial.

291
An anecdotal aspect of dwellings construction was mentioned in household 13 (a modern
apartment). The household members explained that they experienced a high degree of
ambient noise from neighbouring apartments and often used their ICE appliances to block
out the noise. Householder 13a explained that this was even done when the householders
went to sleep.
...I‟ll leave it on for like twenty minutes, just to block out the ambient noise from the other flats until
we‟re asleep, so we put it on the timer, and then it‟s on standby.
Thus, the television remained on standby throughout the night and suggests that
improving dwellings‟ sound proofing could also help to reduce appliance use.
8.8.3.3 Appliance connectivity
In seven of the interviews participants described that the way appliances were connected
to other appliances resulted in wasted electricity consumption. For example, in
households 1, 2, 3 and 10, video appliances, other than the television and STB, needed to
be active or on standby to allow broadcast signals to be received by their television (e.g.
VCRs, DVD players). In household 12 the printer was also continuously in an active
standby power mode due to being networked to household computers.
In the majority of homes, groups of appliances were also powered by a single mains
socket through the use of an extension cable or a block socket splitter. As a result,
appliances that were not actually being used were also put into standby power modes.
The following exchange with members of household 9 provides a good example.
R: Does the VCR and DVD have to be on to watch TV?
9b: It doesn‟t, really does it? It‟s just that they‟re all=
9a: =Act[ually that‟s habit!]
9c: [It‟s just that they‟re] all on the same socket.
9a: If it‟s me, I just flick them all on.

292
These factors may help to explain why the standby power consumption from printers,
games consoles and play and record equipment was particularly high. Even households
that routinely turned these appliances off at the mains, when not in active use, would leave
them on standby while using their television or computer. The common use of extension
cables also relates to the argument, in section 8.8.3.2, that shaping dwellings‟
infrastructures around appliance use could facilitate energy saving.
8.8.3.4 Appliances operational characteristics
Section 8.5.3 highlighted that convenience influenced householders‟ behavioural intentions
and that long activation times and the loss of appliance settings could make energy saving
an inconvenient activity. Both of these perceived consequences relate to the operational
characteristics of appliances (i.e. how they function) and can be viewed as external
influences on behaviour.
8.8.3.4.1 Activation time
The time taken for appliances to become fully operational was an issue raised by a
number of householders. For householder 13a the convenience of leaving appliances
active was related to the time it took for his complex STB or computer to become fully
operational.
13a: ...the main computer, well that‟s two and a half minutes, it‟s like no, I‟m not going to wait that
long for something to boot up.
13b: You won‟t wait two and a half minutes?
13a: No.
13b: ((sighs)) ((laughs))
This sentiment appeared to be a particularly important factor in households that used
computers more extensively. For instance, householder 10a said, “If you‟ve got a huge file
that takes like 10 minutes to load up every time you need to do some work, you‟re going to
leave it on” and 11a explained, “it takes so long to power up, I might leave it on when I‟m
going out shopping”. Thus, shortening the time taken for computing equipment to become

293
operational could potentially lead to reductions in household ICE appliance electricity
consumption.
8.8.3.4.2 Loss of appliance settings
The inconvenience associated to the loss of appliance settings, is a finding common to
other research (Vowles et al., 2001; De Almeida et al., 2008). Loss of settings (e.g. timers,
clocks, tuners, connectivity, etc) was a consequence cited in nine of the interviews and
helped explain why many network appliances, audio equipment and video recording
appliances were frequently left in standby power modes. A typical response was
expressed by householder 6b, who said:
I have to reset the set-top box, and the television and the video. I have to reset all three. It‟s ever so
difficult.
Household 6 provides a good example of this issue, because the standby consumption,
from their two complex STBs alone, was responsible for around 26.4% of the household‟s
total two week ICE appliance electricity consumption. This example also highlights how
pro-environmental motivations (which were espoused by the members of household 6)
could be overridden by other influences. Concerns over the loss of settings particularly
influenced householders‟ interaction with routers and modems. For instance, householder
5a explained:
...I suppose it‟s something I don‟t like messing around with. You know, if I lose it then I‟m stuck...
I‟m not that computer literate... when things go down I really struggle and I have to call somebody
out to come and sort it.
As is evident in householder 5a‟s response, householders‟ also linked their computer
literacy to the use of routers and modems (discussed in section 8.8.4). Nevertheless, the
loss of settings issue suggests that design features that allow appliance settings to be
retained, without a continuous power load, could facilitate the reduction of standby
consumption.

294
8.8.3.4.3 Controls
Appliance controls provide the interface between the appliance and the user, so the
characteristics of the controls fundamentally influence behaviour. Appliance controls were
found to influence the use of standby power functions. For instance, householder 14
explained that she left her DVD/HDD recorder on standby, because “there‟s nothing else,
on it, to press to turn it off”. Similarly, householder 13a explained that controls influenced
his use of a DVD player, saying “that‟s actually on standby now, because it‟s made that
way... It doesn‟t have an on/off (switch)”. A number of the STBs monitored in this study
also did not have switches on the appliance due to standby functions being an integral part
of their design (i.e. to maintain network integrity). This may indicate why some of the
householders did not turn off their STBs and why those that did had to disconnect them
from the mains.
In eight of the interviews householders reported that they used some of their appliances
on/off switches and were surprised that they still remained on standby. For instance,
householder 12b explained:
...if appliances had built in that when you pressed off, it meant off, I think that would help. Because
there are quite a few of these that we switch off, effectively, but they are staying on.
Thus, there was evidence that the provision of hard-off switches could enable
householders to conduct their intentions to reduce standby consumption. Furthermore,
hard-off switches would also have an additional benefit, because they would allow
appliances to effectively be disconnected from the mains when mains sockets are
inaccessible.
The complexity of appliance controls was another issue mentioned by householders who
found it difficult to operate some of their appliances (e.g. computing appliances).
However, participants often linked these aspects of their behaviour to their lack of
knowledge, rather than the appliance controls (discussed in section 8.8.4).

295
8.8.3.4.4 Visibility
A theme closely connected to appliance controls was the visibility of the electricity
consumption from standby power modes. Participants in nine of the interviews described
that they associated standby consumption to lights and displays on their appliances. For a
number of the participants, lights provided a means to undertake energy saving activities.
A typical example was provided by householder 10b when describing her routine before
going to bed. She said, “I always make sure that the TV is turned off at the top and the
amp is turned off there, so I can‟t see a light on”.
In direct contrast, the lack of visibility of standby power consumption restricted a number of
householders‟ energy saving activities. As will be described in section 8.8.4.1, the vast
majority of householders had no knowledge that appliances could consume electricity
without a visible indication on the device. Therefore, the information relayed by appliances
appears to be an important factor for facilitating energy saving behaviours. However,
awareness gained from the appliances lights was not necessarily translated into energy
saving behaviour. For instance, when householder 13a discussed his use of a DVD
player, it was apparent that, despite the LED light, he continued to use standby power
modes:
R: Does that actually influence you, the fact there is a light?
13a: Oh definitely. Because you‟ve got something where you can go physically ((taps table)) that‟s
off. And there‟s also a frequency of use aspect to this as well, she‟s smirking!
13b: ((laughs)) because the only reason, you‟ll notice it‟s green and you‟ll make the light go to red,
you‟ll not switch it off at the back ((laughs)).
13a: Well, there is that as well ((laughs)).
Therefore, other factors presented in this chapter (such as habits and convenience) can
override the information gained from the appliances. In addition to the complex interaction
of these different factors, the unpredictability of human behaviour was also evident in the
interview data. While explaining why her printer was always activated, when she used her
laptop, householder 10b provided the following insight.

296
R: So it‟s just like a habit?
10b: Yeah, it‟s just, been on and then I‟ve just you know, and also it‟s easier for me to see when I‟ve
left my computer on, when I‟ve not switched it off at the wall, I can see that the printer light is on
more easily, it‟s quite obvious, ((laughs)) its so I remember to turn it off ((laughs)).
R: So you turn one appliance on to remember to turn the other off?
10b: Yeah, yeah ((laughs)). Unravel that! ((laughs))
Thus, householder 10b activated her printer in order to reduce the electricity consumption
from her laptop, which was a behaviour even she found difficult to explain. Nevertheless,
the interviews suggested that designing appliances to facilitate energy saving behaviours
could be an important means to reduce household ICE appliance electricity consumption.
8.8.4 Knowledge
8.8.4.1 Knowledge and awareness of ICE appliance electricity consumption
In twelve of the interviews, participants implied that they did not have a clear
understanding of the amount of electricity consumed by ICE appliances and often
suggested that they were unaware of electricity consumption from appliances continuously
left active or on standby. For example, householder 2b said:
...I don‟t really think that much, I mean I am conscious of using electricity, but maybe I don‟t think of
each particular item of equipment... as far as I‟m concerned when the TV comes on, the video
comes on, and the DVD, and the Skybox, they all come on together...
For householder 2b, lack of awareness and the connectivity of appliances facilitated the
behaviour of activating appliances that that were not necessarily going to be used. As a
result, a games console and DVD player were put into standby power modes despite there
being no practical need for them to be energised. Another example came from
householder 14 when asked why she did not deactivate her router. She explained
“because it never occurred to me. That‟s stupid, ((pause)) that it was using electricity”.

297
In some households lack of knowledge and awareness led to ICE appliance use being
excluded from other energy saving behaviours, which helped to explain why patterns of
appliance use often did not reflect households‟ assertions that pro-environmental or
financial values were important to them. For example, the members of household 12
described a variety of activities undertaken to significantly improve the energy efficiency of
their home (e.g. insulation and low energy lighting), but the way they used appliances
didn‟t always reflect their environmental values (e.g. appliances left active or on standby).
In household 8, efforts to reduce energy consumption included having stickers around the
house to encourage household members to turn lights off. However, when discussing her
ICE appliance use householder 8a explained:
...I don‟t have a concept that they use much electricity compared to other things, compared to my
tumble drier or my washing machine or a bit of the heating that‟s electric... I just don‟t think of them
as being that much.
Although householder 7‟s extensive use of computers was partly motivated by altruism, he
also had little knowledge of the electricity consumption from his ICE appliances. He
explained:
...I still think of things that heat things up as being expensive, so I think of central heating as being
expensive and cooking food and heating up water and so on... But I tend not to think of other stuff
as being a real big use of energy.
He went on to explain that “cooling things down is on the same axis”, which resulted in his
consideration of energy efficiency when he purchased cold appliances. Householder 13a
said “in terms of behaviour, I recycle, everything, furiously” and explained that energy
consumption was an important issue when purchasing cold and wet appliances. But,
when asked “do you see the consumer electronics as almost a separate entity”, he replied
“Yes, absolutely”. In this case the separation of ICE appliances from energy saving
behaviours could also be linked to the householder‟s enjoyment of appliance use and the
importance given to work activities. Thus, motivating households to reduce ICE appliance

298
electricity consumption may require measures that go beyond improving householders
knowledge.
Lack of knowledge and awareness was also evident in responses concerning standby
consumption. Although householders in ten of the interviews described that they were
aware of the concept of standby consumption, they often had little knowledge of the extent
of this end-use in their homes. For instance, householder 3a explained:
...you realise that standby uses energy, but you don‟t realise how many appliances you‟ve got on
standby.
A good example came from household 8, which consumed around 63% of its two week
ICE appliance electricity consumption from standby power modes. Despite householder
8a stating that she was aware of the concept of standby consumption, she said, “I just
didn‟t know, that they were on standby”.
Similarly, the members of household 9 believed that standby consumption was being kept
to a minimum. In reality, around 31% of the household‟s total two week ICE appliance
electricity consumption was from standby consumption. Thus, household 9 provides an
example of how householders‟ perceptions of electricity consumption were often different
to their actual consumption. As described in section 8.8.3.4, householders‟ understanding
of standby was also closely linked to the visibility of lights and displays. Out of the ten
households that stated that they were aware of standby power consumption, only one
householder was aware that appliances could consume electricity when a light was not
displayed on the device. A typical example was householder 4 who said:
...you don‟t think that just because it‟s plugged in its taking power. You would assume that it‟s
completely dormant until you press a switch to turn it on. So that is an awareness thing more than
anything.

299
Another assumption made by three participants in the study (13a, 12a and 10a) was the
belief that appliances had a significant surge of power when activated. For example,
householder 13a said:
I heard a story, possibly hypocriful or not, that it costs more energy to turn a TV on, and turn it off,
and turn it on and turn it off, in terms of surges of energy, than it does to run the TV for an hour. So
what‟s the point in turning it off? Leave it on.
Householder 13a also applied this assumption to the use of his computer and suggested
that turning appliances on and off also damaged appliances. A similar response was also
provided by householder 10a. Householder 13a said that these related to a “school of
thought” and householder 10a described the notion of damage to appliances being an
“ethos” within his work industry. These vocabularies imply that such assumptions may be
more widely held in society and reflect norms that may exist in the workplace. Some
support for this argument is evident in research by De Almeida et al. (2008), which found
that 21% of Romanian households and 13% of German households had similar concerns
about damaging equipment. However, there was no evidence from this study‟s monitoring
data to support leaving appliances active to save electricity, which suggests that there is a
need to counteract these assumptions through the dissemination of information,
particularly to those within ICT industries.
The general lack of knowledge may also help to explain why some of the lower whole
house electricity consuming households, such as household 4, 11 and 14 (shown in Table
7-1), had a higher proportion of electricity consumption from ICE appliances and standby
consumption. These households appeared to curtail other electricity end-uses due to pro-
environmental or financial values but, out of the four lowest whole house electricity
consuming households, only members from household 1 reported a more detailed
understanding of standby consumption and included all their ICE appliances in their
energy saving activities. Householders in all the interviews were also surprised by the
energy consumption of particular appliances, which gives support to the introduction of
accurate feedback mechanisms into UK homes.

300
8.8.4.2 Operational knowledge
The influence of limited operational knowledge was raised in twelve of the interviews. In
cases, lack of knowledge led to appliances being left continuously in standby power
modes. For instance, when asked why a games console remained on standby,
householder 8a replied, “I don‟t know how to turn that off”. Similarly, when householder 14
was informed of the standby consumption from her integrated hi-fi system (which
accounted for 23% of her home‟s total two week ICE appliance electricity consumption)
she replied “my god, I wonder how I turn it off”.
Limitations in householders‟ operational knowledge appeared to relate particularly to
concerns about the loss of appliance settings. As described in section 8.8.3.4.2, concern
over the loss of settings was reported in nine of the households as a factor in decisions to
leave appliances on standby and often related to network appliances (e.g. STBs, routers
and modems). For example, householder 11a said:
My knowledge is really patchy on computers and how to use them, and what they can do, and how
to fix them if they go wrong.
Householder 11a provided a good example of how this lack of operational knowledge
could manifest itself in the electricity consumption data. During the study her desktop
computer was left continuously active over a twenty hour period. She explained that this
was due to not wanting to lose unsaved work when her computer crashed, so she left the
appliance active until she obtained advice.
As mentioned in chapter 5, standby consumption from desktop and laptop computers may
be underestimated, because of difficulties in ascertaining whether automatic power
management settings. However, only three householders (4, 10b and 12a) reported that
they had activated power management settings on their computers, so that they would
enter a low power mode after a period of inactivity. The only other householders who
reported knowledge of power management settings were householders 7 and 10a, but
both these householders had ensured that the settings were deactivated to protect
unsaved work and maintain Internet connection. Thus, during periods of extensive use,

301
the large majority of computers monitored in this study remained subject to the default
power management settings, which appear to have been to remain in the active power
mode. Householder 14‟s computer was the only desktop observed to enter a low power
mode automatically, but the householder was unaware of this feature and believed that it
probably resulted from a default setting.
These findings suggest that improving the participants‟ operational knowledge could:
(i) increase the use of power management settings; (ii) encourage householders to
disconnect routers and modems. As highlighted by IVFIRDC, “this type of networking
hassle usually is simple to solve for someone with a good understanding of the different
technologies involved” (IVFIRDC, 2007 p187). Manufacturers and software designers
could encourage such behaviours by reducing the complexity of appliance controls and
ensuring power management settings do not result in the loss of unsaved work. In order
to understand why householders often had limited knowledge of such issues, the following
section explores how participants gained operational knowledge and awareness of
environmental issues.
8.8.4.3 Knowledge transfer
8.8.4.3.1 Transfer of environmental knowledge
Even though pro-environmental values did not always translate into the reduction of every
aspect of households ICE appliance electricity consumption, concern for the environment
was reported by participants in eleven of the interviews. In seven of these households,
participants reported that their knowledge that electricity consumption was connected to
environmental harm was gained from the media. ICE appliance use was also described
as an important means to gather information that facilitated energy saving behaviour.
Members of household 12 described that “eco” television programmes raised their
awareness and householder 9c explained that his concern for the environment was
influenced by television and the Internet. For instance, he said:
The discovery channel was scaring myself silly! The world is coming to an end we better do
something ((laughs)).

302
Household 9 also provided an interesting example of how interpersonal communication
channels facilitated the development of energy saving behaviours. When asked if 9c had
influenced the other household members‟ behaviour, householder 9a replied “oh, in terms
of saving energy? Dramatically”. In total, interpersonal communication channels were
reported to have influenced environmental concern in six of the households. For instance,
householder 14 described that previously living with a householder, with strong
environmental values, had influenced her behaviour. For householder 4 discussions with
friends encouraged him to save energy. He explained:
I do talk about it with people, and because you talk about it, it keeps it more at the front of your mind
doesn‟t it. So it makes you put a bit more effort in.
The role of the media and interpersonal communication channels suggests that although
environmental concern was largely linked to personal norms, there was an underlying
social influence in the formation of many householders moral concern for the environment.
This may reflect work by Thøgerson and Grønhøj (2010), which found evidence that self-
expectations were mediated through social norms. Nevertheless, as mentioned
throughout this chapter, despite households developing pro-environmental values, this
motivation was often overridden or impeded by other influences.
8.8.4.3.2 Transfer of operational knowledge
Limited operational knowledge was raised in twelve of the interviews as a factor that
influenced ICE appliance use. This raised the question of why householders lacked this
knowledge. In ten of the interviews, householders described that they largely learned to
operate appliances through interpersonal communication channels. These channels
included other householders, friends, family and work colleagues. An important aspect of
this transfer process was that information generally centred on basic skills to configure and
use appliances. Thus, householders often implied that their knowledge was limited to
what can be described as a “comfort zone”. Four of the householders expressed this
sentiment more directly. For example, householder 14 said, “I find the minimum I need to

303
do it, get somebody to show me, and then I do that”. She went on to explain, “it‟s like my
washing machine, I‟ve got one programme that I use”. Householder 9a said:
...you sort of develop what you need to know to get done, what you want to get done... the more
you use them the better you get. But also if you‟re only using a limited part of those, then that‟s
where your expertise stays and that‟s what you use it for.
The interpersonal channels used to gain knowledge appeared to exclude the transfer of
information concerning appliances electricity consumption (e.g. standby consumption,
specific appliance power loads) and technical knowledge regarding appliance settings and
networks. As a result, it appeared that householders would generally use new appliances
in the context of their existing knowledge.
Technical knowledge to inform users about standby consumption, encourage the use of
computers power management settings and allay concerns over losing settings also
appeared to have been inhibited by the information provided with appliances. For
instance, none of the householders described that this information was clearly provided by
manuals and in six of the interviews participants reported that manuals were often difficult
to understand. For instance, householder 1b said, “booklets and that with modern
technology, you know modern equipment, seems to be a bit more mind boggling”.
Similarly, householder 8a said, “there are easier ways of getting things done than reading
the manual, like asking someone else or fiddling”. Members of household 12 described an
example of how the provision of clear information could potentially facilitate their energy
saving behaviours in the following exchange.
12b: ...the (******) stuff that came with our router, it‟s got a quick start, which is great, because it‟s a
little card with about five pictures on it, and a few instructions and it just gets you going, and if that
said on it, don‟t worry, save energy switch your router off at night=
12a: =Yeah, if appliances said that, you‟d lose that fear of=
12b: =But, as it is, we‟d have to go and find out, we‟d have to ring (******) or post a query on their
website or look at the FAQs to find that out.

304
12c: And I suppose even if we did find out that we could switch it off, to go and turn it on every time
to use the laptop, just not as easy is it?
As highlighted by householder 12c, improved knowledge may not negate the influence of
other factors, such as convenience. Nevertheless, there was a strong suggestion from the
interviews that appliance manufacturers, retailers and service providers could facilitate
energy saving through the provision of more easily accessible and clearer information.
The influence of retailers and service providers was also evident in three of the interviews.
Householders 7 and 6a both reported they were told not to disconnect their STBs, routers
and modems from the mains when they were installed by the service providers. Similarly,
householder 14 was recommended not to disconnect her HDD/DVD player when it was
installed in her home by a retailer. Thus, there was some evidence that the appliance
industry could facilitate energy saving behaviour.
Another means to improve operational knowledge was also apparent in the interview data.
Householders 9a and 9b had both completed basic training courses on computing and
householders 5b, 8b and 12c, who attended school or college, reported attending lessons
on computing as part of their curriculum. However, none of these householders reported
receiving guidance on energy efficiency issues relating to computer use. Thus, the
inclusion of energy efficiency training in formal computing courses could potentially
transfer knowledge into society, particularly in respect to the finding that interpersonal
communication appears to be a key information channel.
A further aspect of knowledge transfer relates to a comment made by householder 10b.
She was one of the three householders to alter the power management settings on her
computer and despite reporting that her energy saving behaviours were motivated by
financial cost she explained:
...that‟s more a green thing actually, and that‟s from work. That‟s from getting the sort of reminders
at work, er, to look at your energy saving settings occasionally... so I thought oh yeah, I should
probably do that on my laptop at home. That‟s quite interesting that, that‟s a different motivation,
bizarrely.

305
As mentioned in sections 8.6.2 and 8.8.4.1, there was a suggestion that behaviours at the
workplace can influence domestic appliance use. The above quotation also highlights that
workplace behaviour change campaigns can also influence domestic behaviours. With at
least one member in seven of the households citing that working from home influenced
their electricity consumption, there is a suggestion that employers could help to address
the domestic electricity consumption of their employees as well as that in the workplace.
8.8.4.4 Knowledge: influence of the study
A final aspect of the influence of knowledge relates to the knowledge transferred to
participants through this study. During the interviews members from nine of the
households said that they would alter their behaviour as a result of the knowledge gained
from participating in this study. Typically, responses related to standby consumption and
householders describing that they would disconnect some of their appliances. Two
householders even undertook energy saving activities at the interview stage. Householder
10b disconnected her radio and householder 14 disconnected her integrated hi-fi system.
In doing so, householder 14 reduced her whole house electricity consumption by around
6.5% (based on the two week monitoring data).
One of the most interesting reactions came from householder 13a who had been quite
adamant that ICE appliance electricity consumption was an end-use that he was not
prepared to curtail. Towards the end of the interview the following exchange occurred.
13a: ...I don‟t know how much of that is part of this conversation, but I‟m feeling quite guilty now
((laughs)).
R: Really?
13a: Yeah, of cause, erm,.. it‟s not a bad habit to turn something off, there‟s no point using more
than perhaps you should... seeing the kWhs of things used on standby has made me kind of go
whoa a little bit.
Householder 13 then compared the electricity consumption from his bedroom television to
his router, which had used similar amounts of electricity during the two week monitoring.

306
13a: You see that‟s quite instructive, because I‟m now, that is now a concern to me, having seen
that written down... Of all the things in there that is making me go whoa. It makes me want to turn it
off or buy a different router. But that‟s now influencing my behaviour.
Obviously, it is not possible to know whether the intentions reported by householders will
have resulted in long-term reductions in electricity consumption, but householders‟ general
reactions to the information provided by this study supports previous research that
knowledge and feedback can facilitate energy savings (Abrahamse et al., 2007; Darby,
2006). The finding also indicates that energy monitoring systems can provide the
feedback necessary for householders‟ to evaluate and alter their household electricity
consumption, which supports the call for the installation of metering systems into UK
homes that provide accurate and direct feedback (Owen and Ward, 2006; Darby, 2006).
However, there was evidence that knowledge alone does not result in behaviour change.
For example, despite householder 14 expressing pro-environmental values, and being one
of the lowest energy consuming households, she explained why she would not be
regularly disconnecting some of her appliances.
...it‟s the relationship between the frequency of use, the difficulty of doing it, and how much
electricity it uses.
...now that I do know, there‟s no way that I‟m going to be crawling underneath the computer, and
trying to work out which of the wires, is the wire to the printer.
Thus, householders must also be motivated to change their behaviour and alter household
infrastructures to make energy saving a more convenient task.

307
8.9 Summary
This chapter has identified that a wide and complex range of factors can influence
household ICE appliance electricity consumption. Householders‟ different lifestyles,
interests and patterns of occupancy help to explain some of the variations in electricity
consumption and the widespread individualised use of appliances. ICE appliance use had
generally become more embedded into the everyday activities of households with higher
ICE appliance electricity consumption. This was particularly due to the use of computing
appliances for work and domestic activities. The interview analysis also identified
important factors that support key elements of the TIB. Emotions influenced the extent of
active appliance use due to the pleasure and relaxation householders gained from
services and the degree of comfort gained from ambient noise or social contact. The
evaluation of the consequences of ICE appliance use, suggests that values and attitudes
also influence patterns of appliance use. However, although financial and environmental
considerations appeared to influence intentions to save energy, this was often balanced
against convenience and the degree of value given to achieving the goal (e.g. completing
work, pleasure). The external influence of society was also apparent and social norms
were more likely to support the more extensive use of appliances. As contended by
Triandis (1977) the outcome of evaluations and the formation of habits was mediated by
facilitating conditions, such as knowledge, personal ability, appliances design, access to
mains sockets and dwelling infrastructure.
Overall, the results suggest that initiatives, aiming to reduce household ICE appliance
electricity consumption, need to address individuals‟ internal motivations and the social
and physical infrastructures in which ICE appliance behaviour occurs. Furthermore,
improving householders‟ operational knowledge and understanding of the ICE appliance
end-use may help to empower and direct households to undertake energy saving
activities.

308
Chapter 9. Results: Ownership and adoption
9.1 Introduction
This chapter presents results from the household interviews, which identify key factors that
influenced householders‟ ownership of ICE appliances. Many of the key themes that
emerged from the data linked to constructs from the DIT and TIB. In particular, the
“innovation-decision” framework, presented by Rogers‟ (2003), provided a useful means to
reflect upon extracts from the interviews. The chapter begins with a brief description of the
influence of householders personal characteristics (section 9.2). This is followed by an
evaluation of the types of purchase decisions made by the households (section 9.3). Key
social factors that influenced the households to own ICE appliances are then presented
(section 9.4). This is followed by the presentation of common factors that influenced the
purchase decision process (section 9.5). Finally, a brief chapter summary is provided
(section 9.6).
9.2 Personal characteristics and innovativeness
In section 8.3, householders‟ personal characteristics, such as personal interests, were
linked to patterns of ICE appliance use. Personal characteristics were also found to be a
factor for the ownership of appliances. For example, household 6‟s ownership of two
complex STBs was attributed to different interests in television programme material.
Participants in households 10, 13, and 14 explained that an interest in films was as a
reason for owning large LCD televisions (i.e. larger screen sizes enhance the viewing
experience) and members of households 4, 6 and 9 cited interest in sport as a factor for
adopting satellite or cable services.
Although this study did not attempt to directly measure participants‟ innovativeness, it was
evident that members of households that owned more contemporary and extensive ranges
of ICE appliances generally had a greater affinity with new technology. For example,
householder 13a explained that he relished the continued convergence of television and
computing appliances and believed that it “can only be a good thing”. When asked if he
was happy about the arrival of digitised media householder 7 said, “Absolutely, it was

309
definitely a feeling of its arrived at last”. Householder 10a also explained that his interest
in technology led him to own an extensive range of appliances.
...it‟s about enjoying the latest thing, with technology, if you like technology you are always going to
be wanting the next thing, because there‟s always a new development.
For householder 10a, this included the ownership of three games consoles. He explained:
Part of its job, part of its always being into computing and games... and always wanting to see what
the latest console offers... three different platforms gives you three different styles of types of
games, which I find interesting, and exciting at the time, when they are new and pleasurable to
experience.
Thus, for householder 10a his interest and career in multi-media design influenced his
appliance ownership. His comment also highlights that more innovative householders
appeared to gain a high degree of pleasure from the use of the equipment, which
highlights that affect can also have an underlying role in purchase decisions. In contrast,
some of the households that owned less extensive ranges of ICE appliances appeared to
be less innovative. For example, householder 1a explained that he wouldn‟t purchase new
ICE appliances if technology did not develop so rapidly. His household‟s lower level of
innovativeness was also reflected in it being the only home without Internet access.
Although individuals‟ personal characteristics influenced appliance ownership, other
factors were also important. In order to explore these factors, it is first useful to explore
the types of the adoption decisions.
9.3 Types of decisions
Rogers‟ (2003) categorises three main types of innovation decisions: (i) optional;
(ii) collective; (iii) authority. The decisions made by participants in this study were largely
optional, due to decisions being independent from those made by other members of
society (i.e. it was individuals‟ personal choice). However, decision-making also reflected
aspects of the collective and authority decision-making categories. For example,

310
households described making decisions together, particularly in respect to communal
appliances, such as televisions located in common living areas.
Perhaps more interestingly, was a degree of external influence in the decision-making
process, which linked to authority decisions. For instance, householder 1a explained that
because of the digital changeover “you are forced to buy digital items, because the powers
at be aren‟t providing an analogue supply”. However, for the majority of the households
the digital changeover was not seen as a pressure. With the exception of household 8, all
the households in this study had already adopted STBs (or televisions with internal digital
tuners) and the members of household 8 were not unduly concerned about the change.
Although householders made optional decisions, when adopting cable or satellite services,
the type of complex STBs used in the homes was often decided by service providers.
Similarly, service providers often controlled the type of router householders owned. In a
number of households the ownership of computing equipment was either integral to their
occupation or stipulated by their employer. For example, householders 13a and 12b
required computing equipment for their business activities and householder 9a owned an
office standard printer/copier due to the conditions of his employment.
Householders in six of the interviews also reported that they received ICE appliances as
gifts. An interesting aspect of this form of appliance acquisition was that the household
with the second lowest annual income (household 5) possessed four televisions (the equal
highest ownership in the sample) due to friends and relatives giving the appliances away
when they purchased new products. This illustrates how ICE appliance ownership rates
cannot always be clearly linked to socio-demographic data (e.g. household income) and
how older appliances can be kept in use in UK homes. A number of householders‟
reported that they had owned appliances (e.g. televisions and audio equipment) for up to
fifteen years, which indicates that improving the energy efficiency of new products alone
will not influence many of the appliances to be used in UK homes over the next ten years.
Thus, changing people‟s behaviour appears to be an important means to reduce ICE
appliance electricity consumption.

311
Overall, there was evidence that external factors had an influence on the appliance
ownership and that decisions could not be viewed as entirely optional. It was also
apparent that external influences could be linked to the development of the UK‟s social
system, which emerged as an important factor in all the interviews.
9.4 Social influences: the ICE society
In all fourteen of the interviews, participants described a variety of ways that society
influenced their ownership of appliances.
9.4.1 Working and domestic lives
A number of householders implied that the ownership of computing appliances was
necessary to participate fully in society. For instance, when asked if there was a social
pressure to own computers householder 9a replied “it‟s a reality” and householder 12b
said “definitely. I think the way things are geared up, makes it quite hard, certainly on the
computing side”. The members of household 12 went on to explain:
12c: It‟s more of a necessity now isn‟t it?
12b: It would be very difficult to do a lot of what we all do without that. Er, what have we been doing
the last couple of days? We‟ve bought birthday presents for friends, we‟ve bought fancy dress
costumes for a party, we‟ve tried booking a holiday=
12a: =we‟ve done my car insurance.
12b: Car insurance, banking, accounts, your college assignment ((looking at householder 12c)). I
mean how else could you do all those things?
The notion of computing appliances as a necessity is also apparent in the following
response from householder 10b, who described the Internet as a utility.
As we choose to live life now, to have a home broadband connection and a home laptop, it‟s a
necessity. It is like water or electricity, oh alright it‟s not like water, but do you know what I mean?
It‟s become a utility, an essential utility. And that is only going to carry on in society, and that‟s
sometimes where I kick against it... there‟s a part of me that wants to not have it anymore, because
I have to have it. Well, it feels like I have to have it. But, you know I work a lot from home, to have

312
the freedom to work from home, I need a broadband connection and a laptop. I want the freedom,
therefore I have to have it.
The conversation with householder 10b suggested that she found that the need to have
Internet access conflicted with other values that she held, such as her desire to live a
simpler lifestyle. Thus, there was evidence that growing social pressure to own computing
equipment are having an impact on the household environment. One consequence of this
change was that for some households work and home life had begun to merge into one.
In total, participants from seven households described working from home (excluding
householders in education). The emergence of working from home is an issue also
captured by previous research in the UK. For instance, the MTP found that 60% of
respondents used home computers for work related activities (MTP, 2006b). The extent of
working from home ranged from householder 4, who often emailed clients (based outside
the UK) in the evenings, to householders 9a, 12b and 13a who used their dwellings for
business activities. Comments from all the seven households suggested that the greater
opportunity to work flexible working patterns had influenced them to adopt computing
technologies. One good example of how working from home could alter household
appliance ownership (and electricity consumption) was through comments made at
household 9. Householder 9a owned a non-domestic standard printer/copier due to his
employment contract. He explained:
...setting up the office, it‟s like, you‟ll need a laptop, you‟ll need that (printer/copier). Latest thing
since then, is you‟ll need a Blackberry, get one, ((laughs)) () you‟ll need to synchronise that, get it
on a business system. So it‟s not like you are actually in a situation where you‟re saying, ooh I‟d
really like a Blackberry, or I‟d really like one of these. The way the world drives forward in the
commercial world, people want to stay in touch and communication, they want to communicate with
you. That side‟s very different to [that]
9b: [the] home one.
The office standard printer/copier was responsible for around 17% of household 9‟s total
two week ICE appliance electricity consumption, which shows that work activities can have

313
a significant impact on household electricity consumption. One consequence is that a
clear distinction between domestic and non-domestic electricity consumption cannot
always be made.
9.4.2 Commerce
Householder 9a‟s previous reference to the “commercial world” highlights the way
commercial structures can influence appliance ownership. In a number of the interviews,
participants believed that the commercial activities of appliance manufacturers influenced
appliance ownership. The members of household 1 explained that they felt a degree of
pressure from the relentless development of new technologies.
R: So do you feel almost a pressure to own certain appliances?
1a: It‟s not a question of owning it‟s=
1b: =keeping up with times=
1a: =that‟s right, in other words the VHS is no good, only for the tapes we‟ve already got so we
have to keep that one, but with new technology it‟s the way it is, it‟s ((pause)) commercialism really,
you‟re forced into it.
The pressure from rapidly changing technology was also cited from one householder who
was much more enthusiastic about the advancement of ICE appliances. Householder 10a
explained that the development of new computer software put him under a degree of
pressure.
...there‟s a pressure, now, to get a new laptop that‟s more powerful... there‟s a pressure from the
software companies, because they‟re utilising the faster technology in the computing... they bring
out new software and you‟re pushed to get new equipment basically.
Householder 10a also explained that, his decision to buy a “top-end” laptop was also
influenced by marketing, which indicates how companies‟ use of mass media channels
could influence appliance ownership. For some householders marketing was considered
to be quite an evasive aspect of commercial activities. Householder 10b said:

314
...it‟s there all the time, we‟re constantly being sold an idea, we‟re constantly being sold what we
should have... the latest must have device, and I think that it doesn‟t matter how intelligent or
intellectual you are, ultimately that does have an impact on you.
A similar response was received from householder 11a:
You know, it is partly a branding thing, and that‟s very subtle, isn‟t it? It‟s easier for me to sit here
and say oh no it doesn‟t affect me at all, but you know I think it is ((pause)) it is a factor.
Householder 10b also explained that the way that commerce had adapted to the
emergence of the Internet was a factor for her ownership of computing appliances. She
explained how she could now get the most financially beneficial deals online, rather than
visiting commercial outlets directly. A similar experience was provided by householder
12b, who also illustrated how the Internet has changed the way commerce operates.
... when I bought the laptop, I knew, I worked out what I wanted by researching it online, I then
bought it online, and they gave me a choice of do you want it delivering or you can pick it up at your
local store. Now, I think from basically going online and doing the research and bringing it home
and having it in front of me, a couple of hours.
A further aspect of commerce was described by householder 13a, who believed that
commerce was fundamentally responsible for determining the characteristics of appliances
on sale in the UK. He explained:
...a lot of it to my mind is commerce, is about flogging a new version of an old product... I don‟t think
that necessarily, and whether I give a crap about this is neither here nor there, how much energy
they use, HDTV, Bluerays, bigger screens, higher resolutions, no one‟s really thought about that, I
guess it‟s up to you to find out. I don‟t care I just want to watch it.
Overall, participants indicated that their appliance ownership was influenced by commerce
in a number of ways. Firstly, their own employers often influenced their ownership and
use of computing appliances. Secondly, service providers and appliance manufacturers

315
fundamentally influence the characteristics of the appliances in the homes and due to
technical developments necessitate equipment to be continually replaced. Furthermore,
commerce also indirectly influences domestic activities by encouraging the use of the
Internet for the purchase of products and services.
On reflection, energy consumption does not appear to be a central issue within these
commercial activities. Employers externalise the electricity consumption from work
activities to their employees‟ homes and appliance manufacturers and service providers
have little vested interest in their products electricity consumption, because they do not
incur the energy costs. This implies that to reduce household ICE appliance electricity
consumption, policymakers may need to create deep social change, so that both
households and commerce take responsibility for the electricity consumption of their
activities.
9.4.3 Education
The influence of social structure was also evident in responses connected to the UK‟s
education system. Part of educational institutions role is to provide people with the skills
necessary to work within society. Therefore, it was unsurprising that the use of computers
has become part of the education system. One example comes from an exchange with
householder 2b, who explained that the integration of computers into the education system
had influenced her household‟s decision to buy a computer.
I suppose its pressure from when he (eldest son) was at pre-school really, when you saw that kids
were using computers, you felt that you had to help them in the learning process with the computers
as well, if it‟s going to help them when they start school.
Similarly, householder 12a explained that her household purchased a computer due to her
daughter‟s education.
Everyone else had computers at home, and the only way she could do her homework was to stay
on at school, so that‟s why we really first got a computer.

316
Other participants in households 5, 8, 9 and 12 also stated that the use of computers
whilst in education influenced their adoption of computing appliances. Householder 9c
also described that social pressure was a factor him attending a computing course to
improve his computer literacy. This led to the following exchange.
9a: It‟s a recognition that in a modern world, you‟re going to need to be able to use a computer.
9c: Exactly, because it became a big part of society.
However, as described in section 8.7.4.3, the training received by householders was
focussed on providing people with skills to use software and excluded the transfer of
knowledge concerning energy consumption (e.g. standby power, power management
settings, the use of routers). Thus, there is also a suggestion that educational institutions
have a responsibility to incorporate energy saving into their training.
9.4.4 Social norms
In section 8.6.2, it was highlighted that there was little evidence that social norms
influenced householders‟ to reduce their ICE appliance electricity consumption. However,
there was evidence that the more extensive use of appliances was considered to be
normal behaviour (e.g. the use of email, social network sites and standby power modes).
Responses in ten of the interviews also suggested the existence of social norms that
encouraged ICE appliance ownership. Typical responses included householder 1b who
said “you just go with the flow, everybody‟s got them” and householder 2b who said “we‟d
feel pressured if we didn‟t have a TV, because the majority of households have a TV, in
this day and age, don‟t they? And computers as well”. Although householder 14 rarely
used her integrated Hi-Fi system, she explained:
14: I‟ve got a sound system, because you‟re supposed to have a sound system.
R: You‟re supposed to?
14: Well everybody‟s got a sound system.

317
Although mobile telephones were not monitored in this study, responses from four of the
interviews provided interesting insights into social pressure. For example, householder
11a implied that the non-ownership of mobile telephones was almost socially
unacceptable.
... I was very resistant to getting it and in the end it became a kind of, what‟s the word when things
get to a critical mass? Where you become like a freak for not having it. So at that point I thought,
I‟ve just got to do this, everyone‟s screaming at me to do it.
Two of the more innovative participants (householder 10a and 7) also said that there was
normative pressure to own mobile telephones. However, this focused on the use of
telephones with Internet access. Householder 7 said “I‟d begin to feel odd if I didn‟t have a
phone that had email. People would look at me a bit oddly”. There was an indication from
the interview at household 10, that these appliances have the potential to influence both
domestic electricity consumption and society. In terms of electricity consumption the
continuous access to the Internet had led householder 10a to use his laptop less
frequently, because he could quickly use email on his telephone. However, the
telephone‟s battery required a lot of charging and was usually constantly on charge when
householder 10a occupied his home.
Household 10a also explained that he would often use the Internet in a variety of new
social situations, which would not have occurred prior to his adoption of the technology. A
consequence of this new pattern of behaviour was that it allowed Internet use to intrude
into every aspect of the household‟s social life. The pervasive nature of this technology
appeared to be an issue for householder 10b (who didn‟t use this technology) who said,
“Let‟s not go into the social impact of that kind of behaviour”. Similar findings by Røpke et
al. (2010) highlight that the “pervasive integration of ICTs into everyday practices
increases the importance of the availability of mobile devices”. Although largely anecdotal,
the findings from this study suggest that the increased use of mobile devices could have
implications for both UK domestic electricity consumption and society and would therefore
be an interesting area for future research.

318
Overall, the interview data provided a variety of examples that suggested households‟
ownership of ICE appliances was influenced by society. The UK‟s social structure appears
to play an important role, through the influence of organisations that provide employment
and education and the way that commerce operates within society.
9.5 The purchase decision
DIT provides a framework for understanding purchase decisions through the innovation-
decision process. Overarching aspects of the DIT innovation-decision process have
already been described in this chapter, such as the influence of the social system and
differences in participants‟ innovativeness. However, understanding how participants form
attitudes towards new technologies reveals other factors that influence appliance
ownership.
9.5.1 Initial awareness of new ICE appliances
The first stage of the DIT innovation-decision process is when households first become
aware of ICE appliance technologies. Rogers (2003) contends that the extent of an
individual‟s interpersonal communication channels, and exposure to mass media,
increases the likelihood that the individual will actively seek information about an
innovation. Although it was not possible to measure the extent of these constructs,
householders reported that these communication channels were of importance.
In seven of the interviews householders described that marketing through mass media
channels, such as advertisements on television and in cinemas, newspapers and
magazines, influenced their awareness of ICE technologies. Similarly, participants in
seven of the interviews also described friends and work colleagues as important sources
of initial knowledge of ICE appliances. The only other significant source of awareness,
raised in four of the interviews, was the observability of new technologies in retail outlets.
Participants in only two of the interviews reported the Internet as a means to gain initial
knowledge.

319
Although, these findings highlight that communication channels are a fundamental factor
within the purchase decision process. Of more interest, to the aims of this research, is the
role of communication channels in householders‟ evaluations, which is described in
section 9.5.2.7.
9.5.2 Forming an attitude towards ICE appliances
DIT contends that following the initial knowledge of an innovation an individual gains either
a favourable or unfavourable attitude toward the innovation. The attitude formation
includes the gathering of information to assist the evaluation of the characteristics of the
innovation. All the fourteen interviews provided responses that described key aspects of
this process. According to DIT key factors that influence an individual‟s decision to adopt
an innovation relate to the perceived attributes of the innovation. Rogers (2003) provides
five key characteristics, which were used to help analyse the interview data.
9.5.2.1 Observability
Rogers (2003) contends that the more visible an innovation is to potential adopters, the
more likely they are to adopt the innovation. Responses that linked to observability were
evident in nine of the interviews. Participants in four of the households described seeing
appliances in retailers as a means of gaining awareness of new ICE appliance
technologies. In seven of the interviews householders also described seeing appliances in
people‟s homes raised their awareness of technologies. For instance, householder 2b
explained:
I‟ve seen flat screen TVs in other people‟s houses, I‟m quite envious, „cause it‟s much better than
ours, but we wouldn‟t spend the money until this one‟s on its way out, there‟s no pressure but you
do get a bit envious.
As implied in householder 2b‟s response, participants did not suggest that simply seeing
new appliances would result in a strong motivation to purchase. Purchase decisions were
more frequently linked to householders‟ needs, which appeared to temper any emotional
response to adopt a particular technology.

320
9.5.2.2 Trialability
Responses in four of the interviews linked to the DIT construct of trialability. Householders
explained that testing the appliances functions at a retailer, prior to purchase, allowed
them to address uncertainty. Similarly, householder 8b explained that the use of a friend‟s
games console allowed him to consider his purchase decision in more detail. However,
trialability did not emerge as a strong theme in the data. This may be reflected in Rogers‟
argument that trialability is more important to early adopters, because more “innovative
individuals have no precedent available to follow when they adopt” (Rogers, 2003 p258).
Although innovativeness was not directly measured, the majority of participants tended to
be more aligned with the DIT‟s early and late majority adopter categories. Thus, as will be
discussed in section 9.5.2.7, householders often reported that information gained from
their interpersonal networks was an important part of their evaluation process.
9.5.2.3 Complexity
An example of the role of complexity is evident in householder 11a‟s explanation of why
she purchased an Apple laptop rather than a laptop with the PC protocol.
...the major one was that friends said that these work, they‟re just really easy to use... you don‟t
have to install all your drivers, and being a bit of a technophobe, it just appealed to me.
However, despite householders stating that some appliances, such as computing
appliances, were often difficult to configure or use, complexity was only mentioned in three
of the interviews as a factor in purchase decisions. Thus, complexity did not appear to
discourage households from adopting ICE technologies. Perhaps a key reason for this
situation was that the functions provided by many of the ICE appliances were described as
being necessary for householders work and domestic activities.
9.5.2.4 Compatibility
In section 9.4, it was highlighted that a number of householders described the ownership
of ICE appliances as “needed” or “necessary”. These responses supported Rogers‟
argument that compatibility plays an important role in individuals‟ evaluations. Rogers

321
(2003) defines compatibility as the “degree to which an innovation is perceived as
consistent with the existing values, past experiences, and needs of potential adopters”
(Rogers, 2003 p240). In twelve of the interviews, householders reported that a factor for
their acquisition of ICE appliances was their need to conduct the types of ICE appliance
goals that were already integrated into everyday activities (e.g. entertainment,
communication with friends, work, procurement, etc). Thus, the ownership of ICE
appliances appeared to be highly compatible with the social system.
The influence of householders‟ different needs was evident in numerous responses that
appliances would only be purchased when an existing appliance had either ceased to
function properly or out of necessity. Typical examples came from householder 2a who
said “we don‟t respond to advertising saying you‟ve got to have this latest gadget. It‟s out
of necessity rather than want” and householder 3b who said “we only buy things we need”.
The notion that appliances were purchased out of necessity provides a further insight into
how ICE appliances have become deeply embedded into household infrastructures. For
instance, ICE appliances were not described as luxuries and although householders
reported that they would often use devices until they no longer functioned, their responses
always implied that appliances would be replaced to maintain their existing activities. The
following exchange, concerning household 9‟s decision to purchase a HD television,
highlights these points.
R: So, what types of issues do you consider before you buy a new appliance?
9b: Well the television, it was a necessity the last one wasn‟t it?
9a: Yeah, it was coming up to the World Cup.
9b: It was coming up to the World Cup, and it kept going off.
9c: We can‟t have that Bert ((laughs)).
9b: No, it was a necessity, so we didn‟t buy it just as a luxury and of course with it going digital,
obviously we bought a digital one didn‟t we?
9c: Up to date type, yeah.
9b: So that was a=
9a: =It was HD prepared as well. When you start looking at the price of it, commercially you think
well where is technology going to be, it‟s going to probably move forward, so you are buying it

322
looking ahead for 5 or 10 years, thinking hopefully that will be compatible with what comes forward
to take its place.
The above quotation also highlights that householders often considered the future
compatibility of their appliances. The issue of future compatibility was raised in five of the
interviews. Typically participants explained that they sought to extend the longevity of their
investment by purchasing the most up-to-date technology. As householder 1a explained
“there‟s no use buying an obsolete (television) set, for example it‟s no use buying an
analogue set, when everything‟s digital”. Householder 11a explained that her convergent
use of computers was influencing her future intensions for appliance ownership.
I‟m thinking now, do I need to buy a digital radio or will I just listen to it on my laptop? So I‟m
thinking into the future.
Similarly, householder 13a‟s more convergent use of appliances was leading him to
consider purchasing a convergent appliance to access television and Internet services.
He also implied that his needs might evolve if appliances became more affordable.
I swear if it wasn‟t an issue I‟d have the TV on in every room, all the time. With something on, and
probably different things, so if I went in a different room there‟d be something else on.
Thus, it appeared that for a number of householders future purchase decisions would be
based on the compatibility of new appliances to their changing needs, which could result in
increased ICE appliance electricity consumption.
In four of the interviews the theme of health also emerged as an influence on households
needs. For example, householder 9c‟s long term ill health led to the purchase of a
complex STB to access a wider range of television services and tinnitus had led
householder 8a to own a number of audio appliances (the highest audio ownership in the
sample). Householder 7 also explained that the ownership of a large LCD television was
partly influenced by a health issue. He said “my sight‟s beginning to go and erm, it‟s nice
to see stuff properly”.

323
Rogers‟ (2003) argument that decisions are influenced by an innovations compatibility with
past experiences was also evident in six of the household interviews. For instance,
householder 3a explained:
3a: ...I‟m sixty years of age, and 99% of my choice and householder 3b‟s choice would be based on
past experience.
R: Right.
3a: Tried and tested what we‟ve had before.
Interestingly, few of the householders indicated that the purchase of ICE appliances was
compatible with energy saving values (i.e. the pro-environmental or financial saving values
described in section 8.5.1). Only members of three households provided such responses.
Householder 1b stated “we just tend to look around and make sure we‟re getting value for
money and at the same time, at the moment, just watching the energy flow”. Similarly,
householder 14 explained that she bought a LCD television rather than a plasma television
due to concerns over electricity consumption and householder 8a explained that pro-
environmental values influenced her decision to acquire second-hand appliances. She
said, “I like the idea of reusing stuff, from a sustainability thing, and it‟s cheaper”.
The limited influence of energy saving values on the purchase of ICE appliances may be
reflected in other findings in this research. As presented in section 8.8.4.1, the use of ICE
appliances was often considered distinct from other energy saving behaviours and as
presented in section 9.4, it was reported that there was a degree of social pressure to own
ICE appliances. Similar to the previous quotations (from householder 1b and 8a)
participants in the majority of the interviews also mentioned financial cost as an influence
on their purchase decisions, which fitted more closely to Rogers‟ construct of relative
advantage.

324
9.5.2.5 Relative advantage
When asked about the factors that were considered before purchasing ICE appliances, the
majority of householders‟ responses reflected Rogers‟ construct of relative advantage.
Similar to the findings from research undertaken by Stobbe (2007e), participants
commonly referred to price, design and performance as key factors that influenced their
purchase decisions. In thirteen of the interviews, householders mentioned that price was a
key factor and in all fourteen households participants described performance (e.g. picture
quality, sound quality, processor speed, etc). Connected to performance was the range of
services that an appliance could provide, which was mentioned in six of the interviews.
More wide ranging service provision was usually mentioned in respect to the adoption of
STBs and digital radios and routers and modems provided faster and more expansive
Internet connection. In some cases the improved reception was also mentioned as a
reason for the adoption of digital radios. Appliance aesthetics was also reported to be
important in seven of the interviews. The following responses from households 12 and 13
provide typical examples that highlight these factors.
R: So, what kinds of issues do you consider before you buy particular technology...?
12b: The price, value, reliability, and with the laptop it‟ll be speed as well.
12c: Different features.
13a: Aesthetics, functionality, does it do what we want it to do, unless obviously, there‟s a fiscal
aspect to it, price as well, value for money.
Convenience was also mentioned as an advantageous reason for owning appliances. The
ownership of more than one appliance type was described as a means to allow
householders to conduct simultaneously activities (e.g. view different television
programmes or work on computers at the same time). Laptops were also described as
advantageous, because they allowed computing activities to be conducted throughout
(and outside) the home and the ownership of recording equipment allowed householders
to watch television programmes at times that were more convenient. For instance,
householder 12c explained the advantage of using the recording function on her complex
STB and access to the Internet:

325
People‟s lifestyles, nowadays, it‟s easier to record a programme, and watch it when you want to
rather than have to be in a certain time, or set a video player every time to watch something. When
I come home from college I don‟t have to go to the library, its convenience.
In cases, participants associated positive experiences and their perception of quality, to
particular brands. For example, householder 3 was adamant that his next television would
be a particular brand due to previous good performance. He also explained:
I am just looking for pure quality and reliability. They‟re the two drivers, and price. The energy is
way, way ((pause)), it just doesn‟t even get considered.
Householder 3a‟s comment that energy consumption was excluded from his purchase
decision was echoed in the majority of the interviews.
9.5.2.6 Electricity consumption and energy labels
As mentioned in section 9.5.2.4, only three householders described occasions where
electricity consumption influenced their ICE appliance purchase decisions. In each case
this was focused on televisions. Householder 1a explained that he considered energy
consumption when he bought his television, however this was not a simple process as his
decision was based on comparing information in brochures. The adoption of second-
hand televisions aligned to householder 8‟s environmental values and householder 14
explained that she purchased an LCD television, rather than plasma television, due to
concerns over electricity consumption. However, she explained that this only occurred
due to the guidance of a salesperson and that energy consumption had not been a factor
in any of her other ICE appliance purchases. In the remaining eleven households,
participants reported that the energy consumption was simply not considered. This finding
reflects research cited in the EuP preparatory study for televisions (Stobbe, 2007e). The
authors found that:

326
Price and screen size are considered the most important criteria, followed by display
quality, design, brand, and technology. Labels are unknown in this context and therefore,
like other environmental criteria, do not form a part of the buying decision.
(ISOE GmbH, 2006 cited in Stobbe, 2007e p6)
This is an interesting finding when it is considered that the majority of households reported
that pro-environmental or financial values motivated their behavioural intentions to reduce
ICE appliance electricity consumption. There was evidence that the level of information
provided at the point of sale influenced this situation. In addition to the example from
household 14, (where a salesman‟s provision of information influenced the purchase of an
LCD television), participants‟ often reported that energy labels and ratings influenced their
purchase of cold and wet appliances.
In twelve of the interviews, householders reported that they were aware of the energy
labels and ratings that were provided with cold and wet appliances. In ten of these
households, participants also stated that energy ratings had influenced their decisions to
purchase more energy efficient appliances. A typical example is provided below from
household 14.
R: And you mentioned fridges and washing machines, how did you know about that sort of energy
for=
14: =Because they have cards on them that tell you, there‟s a grading system from A to F and it
tells you. I‟ve never seen anything like that on computers or TVs... I‟ve just always assumed that
they use the same amount.
R: The same with computers?
14: Yeah, the same with computers, it doesn‟t occur to me. And I suppose, it‟s if you buy a fridge or
washing machine, there‟s a label on it, so you are aware that it is an issue. But they don‟t have
things like that on tellies or computers do they?
R: No, there are a couple of logos, but they‟re not statutory, like with the other appliances.
14: Again, it‟s just never occurred to me. And I think if it had... it would have featured. It would have
featured as part of the decision, but it just never occurred to me.

327
Similar to householder 14, the lack of mandatory energy labels for ICE appliances,
appeared to affect householders‟ purchase decisions in a number of ways. Firstly, the
large majority of householders were completely unaware of current voluntary energy
labelling schemes (such as Energy Star and the EST‟s Energy Saving Recommended
scheme). Only one participant, householder 9c, reported seeing an energy label with an
ICE appliance, which he had noticed in a retailer‟s catalogue. For some householders, the
exclusion of ICE appliances from mandatory energy labelling conveyed the message that
different appliance models would consume similar amounts of electricity. For example,
when discussing the purchase of her computer, householder 11a said “I‟ve thought, oh
well maybe there a much of a muchness, and that‟s why we don‟t have an energy rating
on them”.
Voluntary energy labelling was also described with a degree of uncertainty or mistrust in
two of the interviews about the validity of the information provided. Householder 12a said,
“if manufacturers don‟t have to do it, it‟s almost like you know ((pause)) are manufacturers
in, hand-in-hand with electricity suppliers and, do you know what I mean?” Householder
13b also explained that she was unsure about the validity of labels when made aware of
voluntary labelling schemes in the interview.
13b: ...I think if it‟s just down to a couple of people giving you an idea, of what an energy rating is,
you don‟t know whether that‟s true or not do you really, because not everybody‟s doing it, so you
might think that it‟s maybe a gimmick and you might be being charged more, you know you‟d
become a bit mistrustful, whereas if everybody‟s doing it and they have to be kind of open and
transparent, then we probably would try and pay as much as possible to get a better energy rating,
wouldn‟t we?
13a: Yeah, definitely. I think we would behave in the same way as we did when we bought our
fridge and freezer, that we made the best possible choice for the money, against the efficiency.
The above quotation also highlights another interesting finding. Participants that had
frequently stated that they were not concerned about reducing their ICE appliance use
(such as householder 13a, 3a and 7) reported that they were actually influenced by
mandatory energy ratings on cold and wet appliances. Furthermore, these householders
also said they would buy A-rated ICE appliances, should such a scheme be introduced, as

328
long as the appliances met other requirements (i.e. performance, price and reliability). A
further benefit from mandatory energy labelling is evident in the following quotation, when
householder 13a explained that this would add a level of importance to energy efficiency.
I would say that if there were an energy rating system for TVs, and it was statutory for it to be on
there... I‟d guarantee that one of the things we‟d say to each other is that‟s an A rated TV, we‟ll
have that over a B... because it would be a statute. We would think, ok that‟s important.
In all, participants in nine of the interviews stated that ICE appliance energy ratings would
influence them to purchase more energy efficient products. A good example came from
the members of household 8:
8b: I think it would, definitely because I think it would influence us on buying a fridge or whatever=
8a:=which it just has done, I just bought an A+ rated fridge.
8b: So I think it would be a good thing, that if everyone had to do it and show it on a lot of things.
8a: But I suppose there‟s less incentive for that to happen, because the usage isn‟t that big, so it
doesn‟t make as big a difference than it does with something that you use an awful lot...
The above exchange from household 8 also underlines the point made, in section 8.8.4.1,
that the participants generally had a limited understanding of the amount of electricity
consumption that was attributable to ICE appliance use. This suggests that initiatives to
improve households understanding of their ICE appliance use (e.g. feedback from smart
metering) may also help to influence purchase decisions. Furthermore, any future energy
labelling scheme might benefit from the inclusion of information concerning the cumulative
effect of ICE appliances in the home. It was also noticeable that participants were familiar
with the existing cold and wet appliance energy rating scheme, which implies that any
future ICE appliance labelling scheme should also apply this format.

329
9.5.2.7 Information gathering
As contended by Rogers (2003) interpersonal communication channels were an important
source of information for the purchase decision process and were mentioned in thirteen of
the interviews. In seven of the households, participants reported that they communicated
with friends and family members, who had a stronger interest in ICE technologies. A good
example came from householder 14.
...I ask my cousin (*****)... if you want to buy something, if he‟s already got it, he will have done a
major research project. So, when I bought the computer, I just asked him what to get.
Another good example came from householder 12b who described the influence of his
social contacts on the purchase of new appliances.
...a mate who‟s into his hi-fi, took me to a hi-fi shop in Nottingham and we listened to different
systems, and he gave me his view. I mean he reads all the magazines, so I basically went with what
he said ((laughs)) it sounded alright to me. Yeah, people who do computers, what else? ((pause))
Telly, somebody had said to us 130 is better than 50Hz for the picture or something, so we got
100Hz or something ((laughs)).
In addition to friends and family, in five of the interviews, work colleagues were reported to
be an important source of information. Householder 4 said “you have a chat with the guys
at work, see what they‟ve got and they‟ll probably influence your decision”. Interpersonal
communication with retailers was also mentioned in seven of the interviews. However,
along with manufacturers, retailers can be perceived as change agents (i.e. professionals
who have a vested interest in influencing people to adopt an innovation), which may
explain why participants in five of the households inferred a degree of suspicion about the
advice provided due to retailers‟ vested interest. For example, householder 5a explained:
I think retailers will probably just sell you what they want to sell you, or try and point you in that
direction.

330
As a result, householders often appeared to put much more faith in the information
obtained through their social networks or their own research. For instance, householder
10b said that although she took onboard advice from a television salesperson, she
corroborated the information through research on the Internet. Similarly, householder 2a
said that he put more faith in his work colleagues‟ opinions than manufacturers‟
information.
...I ask peoples advice, and also they may help me by looking on the web to see what options are
out there, and they ask me what type of thing I‟m after and they sort of help me through it. I‟m not
so influenced by advertising, because I have more knowledge by just asking the people I work with.
This finding provides a degree of support for Rogers (2003) argument that homophilous
interpersonal communication is the most effective form of communication channel for the
diffusion of innovations. As is evident in the previous two quotations, the use of the
Internet was also described as an important source of information and was reported in
seven of the households. Householder 10b explained:
The Internet‟s a great source of information, if you can be bothered to sift through it all, you can
inform yourself reasonably well.
As part of their online research, four participants‟ described accessing independent
consumer information, such as review websites and consumer advice reports. In addition,
despite not having access to the Internet, householder 1a also described using consumer
advice magazines. Thus, householders took advantage of a range of independent advice
to inform their evaluation of an appliance.
Overall, it was apparent that information gathering was a key aspect of the purchase
decision process and householders looked to independent and trusted sources of
information via their social networks and the Internet. However, it was also clear that
electricity consumption was rarely included in this process. This finding suggests that the
dissemination of credible energy efficiency information into personal communication
channels could be an important means to encourage people to acquire more energy

331
efficient appliances. The role of more informed work colleagues, friends and family
members also echoes elements of Rogers‟ idea that opinion leaders (i.e. individuals that
can influence other people‟s attitudes or behaviour with relative frequency) have an
important role in the diffusion process. Although it was not possible to determine whether
these influential individuals were actually opinion leaders by Rogers‟ (2003) definition (i.e.
their behaviour is imitated by other members of the social system), the findings suggest
that such knowledgeable individuals could potentially influence other people‟s purchase
decisions if they included energy efficiency in their advice. The uncertainty inherent in
retailers, and manufacturers, vested interests suggests that their role in encouraging
energy efficiency could be to direct consumers towards independent advice and reaffirms
the argument that mandatory labelling can provide a means to provide trustworthy and
independent energy information at the point of sale.
Householders search for independent reviews via the Internet also suggests that the
creation of a commissioned website, to disseminate independent and credible energy
efficiency information, could be an important means to inform householders‟ evaluations.
However, the absence of energy efficiency within the householders‟ current evaluations
suggests that information regarding appliances price and performance would also be
required to attract householders to the website. The influence of “opinion leaders” also
implies a need to engage with members of the public with a strong interest in ICE
appliances, because they are likely to influence the wider population‟s purchase decisions.
9.6 Summary
This chapter has described key influences on households‟ decisions to adopt ICE
appliance technologies. Similar to results concerning appliance use (presented in chapter
8), personal characteristics (e.g. interests and innovativeness) influenced decisions to own
particular appliances. However, external influences were also important. The integration
of computing appliances into work and domestic activities led many householders to
experience a degree of pressure to own computing equipment and have Internet access.
The widespread integration of ICE appliances into social structures was also described as
an influence on appliance ownership and was reflected in social norms that encouraged
the adoption and use of ICE technologies.

332
Price, performance, aesthetics and range of service provision were important issues in
householders‟ purchase decisions. However, despite households‟ general financial and
environmental concerns, energy efficiency was rarely cited as a consideration and was
largely excluded from information gathering activities. Householders often looked to
independent and trusted sources of information via their social networks and independent
reviews. The development of an independent website and focussed engagement with ICE
“opinion leaders” could be effective methods to diffuse information into the wider
population‟s purchase decisions. Importantly, the expansion of mandatory labelling to all
ICE appliances could increase awareness of the importance of energy efficiency and
provide transparent and comparable information to influence purchase decisions at the
point of sale.

333
Chapter 10. Discussion
10.1 Introduction
This chapter summarises the findings that emerged from this study in relation to the
research questions presented in section 4.5. The discussion begins with a description of
the key findings from the ICE appliance monitoring (section 10.2) and the household
interviews (section 10.3). Opportunities to reduce household ICE appliance electricity
consumption are then put forward in light of the findings (section 10.4). In each section the
findings are contrasted with results from previous research and relevant literature.
10.2 Household ICE appliance electricity consumption
Based on the aims and objectives of this study, household electricity consumption
monitoring was undertaken in fourteen UK homes to answer the following research
questions:
1. To what extent does the ICE appliance end-use contribute to overall household
electricity consumption in a sample of UK households?
2. To what extent do different ICE appliances contribute to household electricity
consumption in a sample of UK households?
3. To what extent do the different appliance power modes contribute to household
electricity consumption in a sample of UK households?
4. What variations in patterns of ICE appliance electricity consumption exist in a
sample of UK households?
Chapter 6 presented results which addressed research questions 1 to 3 by providing
average household electricity consumption values for the types of ICE appliances
monitored, in their different power modes. Chapter 7 addressed research question 4 by
identifying the variations in households‟ patterns of ICE appliance electricity consumption.
Given that the small sample size limits the generalisation of the research findings, it is
useful to compare key findings to previous research.

334
The REMODECE project (De Almeida et al., 2008; 2009; Grinden and Feilberg, 2008)
provides recent and comparable appliance monitoring results for this study. To compare
the results it was necessary to generate average annual electricity consumption values.
REMODECE generated annual estimates from two week consumption measurements by
multiplying consumption values with a factor to account for the number of utilisation days
in the year (i.e. to allow for two weeks holiday) and by using specialised software to allow
for influences such as seasonal variation (De Almeida et al., 2008). This thesis did not
have access to such software, so annual estimates were produced by simply multiplying
the two week average values by twenty-five.
Section 6.3 showed that both studies found that the percentage of average household
whole house electricity consumption from ICE appliance use was around 22-23%. Thus,
this research supports the consensus that ICE appliance use has become a key
contributor to domestic electricity consumption in the UK and other EU countries.
However, the REMODECE percentage values were based on a bottom-up assessment of
whole house electricity consumption (i.e. individual end-uses were totalled), which resulted
in an average whole house electricity consumption of around 2695 kWh per year,
excluding space and water heating. This thesis gained an average annual whole house
electricity consumption of around 4128 kWh, which included space and water heating.
Therefore, the estimate for the average household‟s annual ICE appliance electricity
consumption is around 958 kWh, in this study, as opposed to 585 kWh in the REMODECE
project.
This difference will be reflected in cultural differences, sample size and this thesis
monitoring a more extensive range of ICE appliances. Another important issue is the rapid
development of ICE technologies. This thesis monitored households between March 2008
and October 2009 (the main study began in November 2008), whereas the REMODECE
project began data collection in 2006 and was completed in all countries in September
2008 (De Almeida, 2006; Kodof, 2008). Thus, this thesis appears to have captured
changes in appliance ownership. This is evident in Table 10-1, which shows yearly
average household electricity consumption estimates for the similar appliance types

335
monitored in the studies. The higher ownership rates indicate that the results from this
thesis must be viewed as more representative of UK households with more prevalent
Internet and digital television services. In addition to the overall REMODECE EU-12
averages (which include Mediterranean and eastern European nations), Table 10-1 also
provides an additional frame of reference with results from individual western European
countries that took part in the REMODECE project (Germany, Denmark and France).
Table 10-1 Comparison of thesis and REMODECE results: annual average household
electricty consumption from ICE appliances (De Almeida et al., 2008; Grinden and Feilberg,
2008)
Appliance type Thesis ownership rate (%)
REMODECE ownership rate (%)
Thesis+
(kWh/year)
REMOECE
(kWh/year)
DE
(kWh/ year)
DK
(kWh/ year)
FR
(kWh/ year)
Computer and monitor
*128% 79% 296 218 331 249 122
Laptop 79% 42% 39 23 13 50 11
Router 93% 48% 54 28 33 39 27
Printer 114% 67% 34 22 25 28 17
TV CRT 150% 93% 116 114 152 114 65
TV LCD 57% 22% 102 42 28 42 48
DVD recorder/player
86% 67% 16 15 13 20 16
Hi-Fi 107% 72% 47 33 33 32 31
STBs 93% 41% 92 33 47 26 20
REMO (REMODECE) value for all 12 EU countries; DE (Germany); DK (Denmark); FR (France).
+Thesis value gained by multiplying two week value by 25 (to allow for two week holiday) and has
not been adjusted for seasonal variation. *Ownership rate of desktop computer.
Table 10-2 shows a comparison of the percentage of annual average household electricty
consumption estimates from standby consumption. The REMODECE values are revised
estimates from De Almeida et al. (2009). Differences in the values may be linked to the
more detailed monitoring completed by this thesis (e.g. this thesis used five rather than ten
minutely intervals, which should make the allocation of standby power more accurate).

336
The most surprising difference in the values is for routers‟ standby consumption. The
original De Almeida et al. (2008) publication reported that, on average, standby accounted
for 85% of routers‟ annual electricity consumption. The lower revised value suggests that
the researchers‟ were able to identify routers consuming less electricity when a computer
was not being used (otherwise computers must have been active for considerably long
periods). This was not the case for this thesis, routers‟ power load remained constant
irrespective of whether a computer was in use. Nevertheless, similarities in standby
consumption from desktop computers and monitors, printers and STBs, suggest that
similar patterns of use occurred in both studies. Despite larger differences for the standby
consumption from Hi-Fi and DVD equipment, both studies indicate that over half their
electricity consumption was from standby consumption.
Table 10-2 Comparison of thesis and REMODECE results: the percentage of annual average
household electricty consumption from standby power modes (De Almeida et al., 2009)
Appliance type Thesis: share of yearly consumption from
standby* (%)
REMODECE: share of yearly consumption for EU-12 from standby (%)
Computer and monitor 10.4 9.4
Laptop 5.0 13.2
Router 66.2 34.6
Printer 90.6 93.4
TV CRT 5.3 10.7
TV LCD 1.0 3.7
DVD recorder/player 89.3 66.1
Hi-Fi 96.0 55.9
STBs 61.3 52.4
*Thesis value gained by multiplying two week value by 25 (to allow for two week holiday) and has not been adjusted for seasonal variation.
Table 10-3 shows average yearly appliance electricity consumption estimates for the
appliance types, which are free from the influence of different ownership rates. Most of the
values gained by this thesis are comparable with estimates from the REMODECE project,
which suggests that this thesis has provided reasonably representative results. This

337
thesis‟ estimate of DVD recorder/player consumption may be lower due to nearly half the
DVD appliances in this study remaining disconnected for the two week monitoring period.
Table 10-3 Comparison of thesis and REMODECE results: annual average appliance
electricity consumption from ICE appliances (De Almeida et al., 2008; Grinden and Feilberg,
2008)
Appliance type Thesis+
(kWh/year)
REMODECE
(kWh/year)
DE
(kWh/year)
DK
(kWh/year)
FR
(kWh/year)
Computer and monitor *246 276 233 303 247
Laptop 50 56 37 61 31
Router 58 58 38 102 41
Printer 29 33 30 - 30
TV CRT 78 124 83 109 69
TV LCD 178 186 205 174 171
DVD recorder/player 9 23 40 25 18
Hi-Fi 35 46 21 51 38
STBs 100 75 47 83 78
Total 781 877 734 908 723
REMODECE value for all 12 EU countries; DE (Germany); DK (Denmark); FR (France). +Thesis
value gained by multiplying two week value by 25 (to allow for two week holiday) and has not been
adjusted for seasonal variation. *Average consumption of desktop computer and LCD monitor
Table 10-4 compares the thesis results for desktop computers with those gained from the
MTP (2006b) home computer study. The main difference is for the low/passive standby
values, which both studies found difficult to discern from the data. The general patterns of
electricity consumption are very similar, which suggests that the average household
computing appliance results from this thesis are likely to be representative of other UK
homes.

338
Table 10-4 Comparison of key results gained from thesis and MTP (2006b) home computer
monitoring
Aspect MTP (2006b) Thesis
Mean daily active power electricity consumption
0.49 kWh 0.46 kWh
Mean daily low/passive standby power electricity consumption
0.01 kWh 0.00 kWh
Mean daily off standby power electricity consumption
0.05 kWh 0.04 kWh
Mean daily electricity consumption all power modes
0.54 kWh 0.50 kWh
Mean active power mode 79 W 77 W
Mean power in low/passive standby power mode
30 W *3.5 W
Off standby mode 3.0 W 2.8 W
Average duration of active use 6.1 hours per day 6.0 hours per day
Average duration of low power (from power management features)
0.2 hours per day *0.1 minutes per day
Average duration of device off 15.0 hours per day 13.3 hours per day
Average duration of mains off 2.7 hours per day 4.6 hours per day
*Value based on one appliance. The mean daily electricity consumption values are gained by
multiplying the average power consumption values (kW) by the average duration of use for each
power mode.
Chapter 7 highlighted that wide variations in patterns of household ICE appliance
electricity consumption can occur. It was evident that households with high ICE appliance
electricity consumption can have a significant influence on average values gained from
larger populations and although some appliances may appear less significant to the
average household, they can actually be an important end-use in many homes (e.g. audio
appliances, printers, play and record equipment).
Standby consumption from computing appliances was also found to be high in many of the
homes and could be an important means to reduce standby loads. Inconspicuous end-
uses (such as network appliances and standby consumption) can also be particularly high
in homes where the active use of principal appliances (i.e. televisions and computers) is

339
less extensive. This suggests that initiatives need to address the impact of all appliance
types and the different power modes.
Overall, despite significant differences in sample sizes, there are similarities between this
study‟s appliance monitoring results and other recent campaigns. This suggests that the
key findings from this study are likely to be applicable to other UK homes. Table 10-5
provides a summary of key findings from this study.
Table 10-5 Summary of key findings: ICE appliance electricity consumption monitoring
Key findings
ICE appliances have become a significant domestic electricity end-use and accounted for around 23% of average household whole house electricity consumption.
A significant portion of ICE appliance electricity consumption is from standby loads. On average, around 7% of average household whole house electricity consumption was from ICE appliance standby power modes.
Desktop computers and televisions were the most significant electricity consuming appliances, with the majority of their electricity consumption from the active power mode.
Network appliances (such as STBs, routers, modems and telephony equipment) have become standard equipment in many homes. These appliances accounted for a significant portion (around 22%) of average household ICE appliance electricity consumption.
Network appliances also account for a significant portion of standby power consumption. On average, around 37% of average household ICE appliance standby consumption was from network appliances (excluding standby consumption from telephony appliances).
Audio, printing and play and record appliances also account for a significant portion of average household ICE appliance standby consumption (around 20%, 10% and 11% respectively).
More recent ICE technologies appear to be more energy intensive (e.g. LCD televisions, HDD complex STBs, video play and record equipment, digital radios and cordless telephones).
Standby consumption accounted for over 45% of ICE appliance electricity consumption in half of the households.
Standby consumption from computing appliances was found to be high in many homes (between 67% and 94% of computing appliance electricity consumption in half of the households), which suggests that tackling computing appliance standby consumption could be an important means to reduce standby loads.
The wide variation in patterns of ICE appliance electricity consumption suggests that initiatives need to address the efficiency of all appliance types in the different power modes.

340
10.3 Household ICE appliance behaviour
10.3.1 ICE appliance adoption and operational behaviour
The household interviews aimed to explore underlying factors that influenced the patterns
of ICE appliance electricity consumption recorded and answer the following research
questions:
5. What factors influence UK householders‟ patterns of ICE appliance use?
6. What factors influence UK householders‟ decisions to adopt ICE appliances and
technologies?
Chapters 8 presented results from the interview analysis to address research question 5
and chapter 9 provided results to help answer research question 6. In both chapters,
findings were compared to previous research and key constructs from the theoretical
frameworks used by this study. This suggests that many of the factors found to influence
ICE appliance behaviour are also likely to be evident in other UK homes.
The interview analysis identified that ICE appliance use was influenced by both internal
and external factors, which related to key constructs of the Theory of Interpersonal
Behaviour (TIB). Key factors that emerged from the interview data are summarised in
Figure 10-1, which organises the factors in relation to the key constructs of the TIB
(Triandis, 1977).

341
Figure 10-1 Summary of key elicited factors that influenced ICE appliance use; overlayed onto the Theory of Interpersonal
Behaviour – see figure 3-5 for Triandis‟ (1977) Theory of Interpersonal Behaviour

342
The use of the TIB helped to identify the underlying role of affect in the formation of
behavioural intentions. The pursuit of pleasurable interests led to more extensive patterns
of use also evident in other research (e.g. Gram-Hanssen, 2005; Green and Ellegård,
2007; Crosbie, 2008). For instance, the individualised and simultaneous active use of
appliances was common in the homes, so that householders could pursue their preferred
forms of entertainment. Householders desire to make a more comfortable atmosphere
also led to active appliance use, even though services were not always being fully utilised
(e.g. televisions and STBs). This finding has similarities to results from Wilhite et al.
(1996) who argue that underlying emotional motivations can make energy behaviours
resistant to rapid change. Therefore, it may be unrealistic to expect households to make
extensive reductions in their active use of televisions and computers. This suggests that
improving the energy efficiency of active power modes is a central means to reduce ICE
appliance electricity consumption. However, some householders reported instances
where televisions and STBs were left active when not being fully utilised and some
participants‟ computers were continuously left active when used intermittently over
prolonged periods. This indicates that there are opportunities to reduce active ICE
appliance electricity consumption by encouraging householders to disconnect active
appliances or put appliances in standby power modes during periods of intermittent use
(e.g. few of the householders reported using computer power management functions).
Individuals‟ behavioural intentions to reduce active and standby consumption were
influenced by attitudes towards the consequences of behaviour, such as safety, financial
cost and environmental concern. However, these issues were often balanced against
convenience and the degree of value given to achieving the goal (e.g. pleasure, work
activities). Behavioural intentions were also influenced by wider society. Work contracts,
social networking activities and social norms supported more extensive ICE appliance use,
such as social expectations to use computing appliances. In contrast, there was less
evidence that social norms motivated energy saving and environmental concern appeared
to be more strongly linked to personal norms (i.e. self-expectations).
Recent research by Thøgerson and Grønhøj (2010) also found that electricity saving was
quite strongly related to personal norms and weakly linked to social norms. However, the

343
authors argue that self-expectations were mediated through social norms and conclude
that influencing electricity consumers‟ social expectations may be an effective means to
encourage electricity saving behaviour (Thøgerson and Grønhøj, 2010). This argument
may also be applicable to this thesis, because social communication channels appeared to
facilitate the formation of environmental concern that led some households to undertake
energy saving behaviours.
As contended by Triandis (1977), habits developed from the repeated performance of
behaviours and were often triggered by situational cues. Habitual and routine behaviour
was also linked to childhood development, which has parallels to work by Gram-Hanssen
(2004; 2005; 2010) and aspects of Bourdieu‟s concept of “habitus”. This finding implies
that household and social structures can shape the formation of enduring values and
habits that can influence future appliance use. The results in chapter 9 also highlight that
social structures (e.g. employers, commerce and educational institutions) increasingly
necessitate the ownership of ICE appliances for everyday activities. This suggests that to
encourage reduced ICE appliance electricity consumption the social structures that
promote and sustain ICE appliance use also need to support energy saving.
As implied by the TIB, behavioural intentions and habits were mediated by conditions,
which could facilitate or impede energy saving intentions. Factors included physical
constraints (e.g. appliance characteristics, access to mains sockets, dwelling
infrastructure), personal ability (e.g. health and “technophobia”), arousal and
householders‟ level of knowledge (e.g. awareness of ICE appliance electricity
consumption, standby consumption, operational use). The influence of facilitating
conditions highlights a number of important issues. Firstly, appliance characteristics and
dwelling infrastructures fundamentally influence behaviour, which indicates that appliance
manufacturers and the construction industry can facilitate energy saving through improved
design (i.e. making energy saving more convenient). Secondly, improving householders‟
level of knowledge and awareness of the ICE appliance end-use (i.e. the contribution of
ICE appliances and standby consumption to household electricity consumption) could
facilitate energy saving intentions. Improving operational knowledge could also empower
householders‟ to use appliances more efficiently.

344
Support for these arguments can be found in recent research from Denmark. Gram-
Hanssen (2010) observed that the alteration of standby consumption habits most often
occurred “because of a change in knowledge and motivation, and these developments
often occurred together with a technological rearrangement” (Gram-Hanssen, 2010 p160).
Similarly, Thøgerson and Grønhøj (2010) argue that, to promote electricity saving, the
socio-structural environment (e.g. the efficiency of appliances) needs to facilitate energy
saving and individuals need to be empowered and motivated though improved self-
efficacy.
Thøgerson and Grønhøj (2010) argue that timely electricity consumption feedback (e.g.
through smart metering displays) could improve householders‟ self-efficacy by identifying
electricity end-uses and enabling households to observe the outcomes of their efforts.
Findings from this study also suggest that feedback from energy monitoring and smart
meter systems could help to facilitate energy saving by raising householders‟ awareness
of ICE appliance end-uses. However, many of the systems being considered for
widespread installation in the UK, only provide information from dwellings‟ mains supply
and it is unlikely that technology that can provide appliance specific breakdowns will be
installed widely (Owen and Ward, 2006; Fischer, 2008). Therefore, it may be difficult for
households to identify inconspicuous, but significant, power loads (e.g. network
appliances). This implies that additional mechanisms will be required to help households
to interpret electricity consumption information (discussed in sections 10.4.3 and 10.4.4).
Rogers‟ (2003) DIT innovation-decision process helped to explore appliance purchase
decisions. The UK‟s social structure appears to significantly influence the ownership of
ICE appliances, which were viewed as highly compatible with the social system and
existing household activities. Price, performance, aesthetics and service provision were
important considerations in purchase decisions. As contended by Rogers (2003)
householders described an information gathering process to inform their evaluations.
Participants‟ described a degree of mistrust concerning retailers‟ and manufacturers‟
advice (i.e. “change agents”) and looked to trusted sources of information via their social
networks. To a degree these more knowledgeable friends, relatives and work colleagues

345
reflected Rogers‟ concept of opinion leadership, which suggests that engagement with ICE
“opinion leaders” could help diffuse energy efficiency into the wider population‟s purchase
decisions. Independent reviews available via the Internet were also reported as influential
sources of information, which suggests that the development of an independent appliance
website could influence purchase decisions.
Householders‟ limited knowledge of ICE appliance electricity consumption was also
mirrored in purchase decisions and energy consumption was largely excluded from
evaluations and information gathering activities. This implies that improved electricity
consumption feedback could also help to encourage households to adopt more energy
efficient equipment. However, energy efficiency influenced many households‟ cold and
wet appliance purchase decisions and could be linked to mandatory energy labelling. This
finding supports De Almeida et al.‟s (2008) recommendation that mandatory labelling
should be expanded to ICE appliances. Key findings concerning the ownership and
adoption of ICE appliances are summarised in Table 10-6.
Table 10-6 Summary of key findings: ownership and adoption of ICE appliances
Key findings
Personal characteristics, such as interests and innovativeness, influenced decisions to own particular ICE technologies.
The widespread integration of ICE appliances into household structures and the UK‟s wider social structure (e.g. work, education, commerce) were important influences on appliance ownership and were reflected in social norms that support the ownership and use of ICE appliances.
Purchase decisions were particularly influenced by price, perceived relative advantage (e.g. performance, aesthetics and service provision) and compatibility (e.g. compatibility with existing needs, household infrastructures and future appliance development).
Householders frequently looked to independent and trusted sources of information via their social networks (e.g. friends, family members and work colleagues) and independent reviews (e.g. Internet websites, consumer advice magazines).
Energy efficiency was rarely cited as a consideration during purchase decisions and was largely excluded from information gathering activities.
Energy efficiency influenced many households‟ cold and wet appliance purchase decisions and could be linked to mandatory energy labelling. This suggests that mandatory labelling should be expanded to all ICE appliances.

346
To summarise, household ICE appliance use was influenced by a complex
interrelationship between internal and external factors that could result in wide variations in
the use of appliances‟ different power modes. The study identified that emotions, values
and social factors influenced individuals‟ behavioural intentions and personal and physical
conditions could facilitate or impede intentions and habitual behaviour. Similarly, the
ownership of appliances was influenced by internal evaluations made during purchase
decisions that were also influenced by the UK‟s social system. Knowledge of electricity
consumption played an implicit role in both ICE appliance adoption and use, which
suggests that the dissemination of information is an important tool to motivate and
empower households to develop energy saving behaviour. Thus, the challenge for
policymakers is to develop integrated policies that address individuals‟ motivations and the
social and physical infrastructures that support the adoption and use of ICE technologies.
10.3.2 The use of the Theory of Interpersonal Behaviour and Diffusion of
Innovations Theory
The use of Triandis‟ (1977) Theory of Interpersonal Behaviour (TIB) and Rogers (2003)
Diffusion of Innovations Theory (DIT) led to the following research question:
7. Do the Theory of Interpersonal Behaviour and Diffusion of Innovations Theory
provide suitable frameworks for the investigation of ICE appliance behaviours?
Findings presented by this study suggest that the TIB provides a useful framework to
investigate patterns of ICE appliance use. As previously presented in Figure 10-1, key
constructs that are often excluded from other models of behaviour helped to explain
important influences on ICE appliance behaviour. For instance, a wide range of external
“facilitating” conditions were found to moderate the performance of behavioural intentions
and influence the formation of habits. Affective and social influences were also found to
influence householders‟ behavioural intentions and subsequently their patterns of
appliance use. Habit also emerged as important influence on the use of ICE appliances.
Thus, findings from this study provide support for the use of the TIB in future energy
research due to the comprehensive range of internal and external constructs inherent in
the model.

347
Key elements of Rogers‟ (2003) Diffusion of Innovations Theory also helped to investigate
factors that influenced households‟ adoption of ICE appliances. For example, purchase
decisions involved the evaluation of the attributes of innovations, such as relative
advantage and the compatibility of ICE technologies into household infrastructures. The
investigation of communication channels helped to explore the influence of more
knowledgeable individuals (e.g. sales assistants, members of householders‟ social
networks) on purchase decisions and the transfer of environmental and operational
knowledge (which influenced householders behavioural intentions and patterns of ICE
appliance use). The DIT also helped to identify the important influence of social
structures, which appear to encourage the ownership and use of ICE appliances.
10.4 Facilitating ICE appliance energy saving: Opportunities and
recommendations
An overarching motivation for undertaking this research was to inform initiatives aimed at
reducing CO2 emissions from the ICE appliance electricity end-use. This led to the final
research question:
8. What policy recommendations can be ascertained from the research findings?
Similarities with findings from other studies suggests that, despite the small sample size,
the insights gained from this study might help inform future UK research and interventions
to reduce household electricity consumption. In the following sections the findings are
discussed in relation to current policies to highlight measures that could facilitate ICE
appliance energy saving.

348
10.4.1 Intention, appliance functions and wasted energy consumption
Before describing potential opportunities to reduce household ICE appliance electricity
consumption, it is important to emphasise that the use of ICE appliances has transformed
our society and opened up numerous possibilities to improve people‟s quality of life (e.g.
education, health, creativity, communications, employment opportunities) (DBIS and
DCMS, 2009). Participants in this study have provided examples of how ICE appliances
can enable individuals to gain pleasure and comfort, become more informed members of
society (e.g. environmental awareness), partake in education, participate in their social
networks and manage their work and domestic lives. However, this study has highlighted
that electricity consumed by ICE appliances does not always provide a useful purpose and
presents a genuine opportunity to reduce household electricity consumption.
For ICE appliances, wasted energy can be described as electricity consumption that does
not provide a useful purpose. As described in section 2.2.1, electricity consumption from
the off standby power mode can be easily categorised as wasted energy, because it does
not provide a function (i.e. an operation). Findings from this study also support the
position that passive and active standby power consumption can also be largely
considered as wasted energy. For example, the network, audio, printing and play and
record appliances monitored in this study were often left in active or passive standby
power modes, which did not provide a useful purpose to the user. There were also cases
where active power consumption could be considered as wasted energy. For instance,
televisions and STBs were left active, when not being utilised by householders and
computers were often left continuously active when householders used them intermittently
over prolonged periods.
Findings from this study suggest that wasted ICE appliance electricity consumption can be
reduced by two key ways. Technical improvements can increase energy efficiency by
reducing the power necessary to perform a given function and enabling appliances to
automatically enter into lower power modes (e.g. computers power management settings).
As mentioned briefly in 8.5.1, energy efficient design is important, because it reduces
energy consumption irrespective of user behaviour. However, technical improvements
cannot be seen as a perfect solution. Despite past improvements in energy efficiency,

349
household ICE appliance electricity consumption has continued to rise due to other
factors, such as the emergence of new technologies and increased ownership levels (De
Almeida et al., 2009; Ellis, 2009; Crosbie, 2008). A good example from this study is the
prevalence of network appliances in the households and the significant electricity
consumption that was attributable to their use.
This study has also highlighted that even appliances designed with higher levels of energy
efficiency cannot completely remove wasted energy without changes in householder
behaviour. For instance, although laptop computers provide a more energy efficient
means to undertake computing activities (in comparison to a typical desktop and monitor),
energy waste can still occur when users leave laptops active when not in direct use.
Furthermore, energy efficiency features, such as computers‟ power management settings,
are only effective if activated by the user (which was not the case for many of the
computers monitored in this study) and the benefits of improved energy efficient design
can only be realised if households purchase the most energy efficient appliances on the
market. Thus, influencing peoples‟ operational and purchase behaviours must also be
seen as a fundamental means to reduce wasted energy consumption.
In order to encourage energy saving behaviour people need to be motivated to reduce
their electricity consumption (Thøgerson and Grønhøj, 2010). As presented in section
8.5.1, although the majority of participants in this study had intentions to save energy (due
to financial and/or environmental motivations), the realisation of these intentions often did
not occur due to other internal factors and contextual conditions. An interesting aspect of
this relationship is that the design of ICE appliances can influence householders‟ intentions
to save energy (e.g. through convenience) and also facilitate or impede energy saving
intentions through appliance characteristics (e.g. appliance controls, connectivity, settings
and lights and displays).
Therefore, ICE appliance design not only influences the amount of electricity consumed
while appliances‟ are performing their functions, but also influences user behaviour. This
is important because it indicates that appliances need to be designed to not only function
with the most energy efficient power loads, but their operational functions also need to

350
facilitate users‟ intentions to save energy. A further aspect of this relationship is that many
of the appliances monitored in this study were influenced by the use of external networks,
such as the Internet, digital television services and telephone networks. Thus, the network
infrastructure that supports the use of ICE appliances also needs to be designed to
facilitate energy saving.
Overall, this indicates that initiatives to reduce wasted ICE appliance electricity
consumption must adopt a multi-faceted approach to: (i) encourage technical
improvements that support energy efficiency and energy saving behaviour; (ii) develop
social and physical infrastructures that encourage energy efficiency and energy saving
behaviour; (iii) develop personal and social expectations that motivate energy saving
behaviour.
10.4.2 Improved product design
Product design fundamentally influences how people can use appliances and is therefore
a key means to accomplish energy savings.
10.4.2.1 Energy efficiency
The results identified that one of the key opportunities to reduce ICE appliance electricity
consumption is through improvements in appliance energy efficiency. Since the
completion of this study‟s appliance monitoring, a number of minimum energy performance
standards (MEPS) have come into force in the UK, (via the EuP Directive) to improve the
efficiency of appliances (Defra, 2009b). The majority of MEPS were introduced in 2010
and are being implemented, in a two tier approach, which sets specific active and standby
power requirements for many ICE appliances. These include televisions, simple STBs,
computing equipment and games consoles. Appliances that use an external power supply
(ePSU), such as routers, digital radios and telephony appliances, are also subject to
improved efficiency standards.
Manufacturers are also bound by the horizontal theme “standby and off-mode losses”,
which set out standby power MEPS in 2009. In addition to the above appliances, this

351
regulation also includes audio equipment, printers and play and record equipment. Off
standby power consumption can be no higher than 1 W and must be below 0.5 W by 2013.
Some appliances‟ passive standby functions must also be limited to 1 W or 2 W
(depending upon the devices need for a display), which will be reduced to 0.5 W or 1 W by
2013 (Defra, 2009b).
The results from this study provide justification for the implementation of MEPS in the UK.
The substitution of many of the appliances monitored in this study with appliances that
comply with the EuP Directive would undoubtedly help to reduce households‟ standby
power consumption. For example, the majority of the sample‟s audio appliances, printers
and play and record equipment remained continuously in standby power modes higher
than 1 W. Similarly, the majority of the average household off standby power consumption
was from computing appliances and games consoles, which had loads higher than 1 W.
The results also suggest that the improved efficiency of LCD televisions and desktop
computers active power mode would also significantly reduce households‟ electricity
consumption. In addition to active power MEPS, the UK government looks towards the
continued development of new television screen technologies. LCD efficiency is expected
to double over the next few years due to the development of optical filters. Furthermore,
the emergence of LED technologies has the potential to reduce televisions‟ active power
consumption. The EuP Directive will also require new televisions to have four hour auto
power down functions in 2011 (MTP, 2009c).
Desktop computers and monitors will also have improved active power efficiency and are
expected to be increasingly substituted for more efficient laptop computers. Computers
are also required to have to be supplied with default power management settings (Defra,
2009b). However, results from this research also highlight that desktop computers could
be made much more efficient through the use of laptop components.
Despite the introduction of MEPS, without further action ICE appliance electricity
consumption is still anticipated to rise (Defra, 2009b). This is in part due to the limitations
of this form of policy. For example, the impact of the MEPS is subject to the replacement

352
rate of existing appliances (e.g. in the UK televisions are estimated to be replaced every 7
to 8 years (MTP, 2009c)) and despite potentially large reductions in power loads, standby
consumption will remain a source of largely unnecessary energy consumption. There is
also the possibility that manufacturers may be able to circumvent some MEPS. For
instance, EES (2010) highlights that a manufacturer could design a product to remain in an
active power mode in order to avoid a performance target. Furthermore, manufacturers
could also potentially produce appliances that meet standby power mode targets, but in
reality these modes could be made difficult for the user to activate (EES, 2010).
As contended by Crosbie (2008), improved product efficiency does not influence
underlying reasons for increased ownership and more extensive patterns of use (e.g.
increased ownership, individualised use). The results from this research provide some
support for this position and suggest that other measures will be required.
10.4.2.2 Power down functions
“Auto power down” functions enable appliances to automatically enter a standby power
mode after a period without operational use. At present, computers and some printing
equipment (e.g. printers that conform to the voluntary Energy Star programme) incorporate
this function (i.e. power management settings). Manufacturers of televisions and simple
STBs are obliged to include auto power down functions under the EuP Directive by 2011
and 2010 respectively. The EuP Directive stipulates that the auto power down function will
be four hours for televisions and three hours for simple STBs and voluntary agreements
for complex STBs are also expected to promote the inclusion of this function (Defra,
2009b).
Findings from chapter 6 and 7 suggest that power down functions should also be
stipulated for other appliances and ideally this should include power down functions from
active standby modes. For example, audio equipment, printers, and network appliances
were often left continuously in the active or active standby power mode when not in use.
However, findings from this thesis raise a number of concerns regarding this function for
televisions. Firstly, similar to the findings concerning computers‟ power management
settings, there is the potential for users to simply not know how to operate this feature or to

353
deactivate it to maintain their existing patterns of active use. This suggests the need for
future research, similar to this study, to evaluate the effects of new appliance features.
Secondly, findings from chapter 6 and 7 suggest that electricity consumption could be
reduced more effectively by designing supportive appliances to automatically power down
immediately after the active use of television and computers has finished. For example,
STBs, routers, modems, printers and play and record equipment were often found
continuously in a high energy consuming state (i.e. active or active standby). This is a
function discussed for network appliances by Nordman et al. (2009) and is being
considered by UK policymakers through the implementation of standardised
communication interfaces for consumer electronics. However, this is not envisaged to
occur until 2015 and there is still no mandatory obligation for its development (Defra,
2009b). Thus, findings suggest that policymakers should encourage the implementation of
this interface more rapidly.
10.4.2.3 Hard-off switches
In many of the homes participants believed that they were preventing standby power
consumption by using switches on appliances. The inclusion of hard-off switches (which
disconnect appliance components from the mains supply) in appliance design
requirements could support these intentions and would mitigate access difficulties involved
in switching appliances off at the mains supply.
10.4.2.4 Non-volatile memory
Similar to findings from other research (e.g. De Almeida et al., 2008; Vowles et al., 2001),
concern over the loss of appliance settings was a factor for the use of standby power
modes. This study supports recommendations to utilise non-volatile memory components
to eliminate power loads used for memory storage (De Almeida et al., 2008; Fraunhofer
IZM, 2007).

354
10.4.2.5 Operational activation
Improving the speed at which appliances, such as STBs and computers, become
operational could encourage householders to turn appliances off, rather than leave them in
active or standby modes. Furthermore, if computers automatically opened previously used
programmes and files, users may be encouraged to more regularly deactivate their
appliances.
10.4.2.6 Standardised controls
Results from this study and Vowles et al. (2001) suggest that UK householders‟ closely
associate standby consumption to appliance lights and displays. For instance, appliances
on standby, but without a visible light or display, were often assumed to be effectively
disconnected from the mains. Householders also often developed energy saving routines
around the visibility of appliances displays.
These findings support work by Meier and Nordman (2002), which developed a
standardised control interface for non-domestic ICT equipment. The proposed interface
uses standardised symbols and colour displays to indicate appliances‟ energy
consumption states (i.e. active, sleep and off mode). The authors argue that the “common
vocabulary” can reduce the complexity of appliance controls, improve understanding of
power mode consumption (that is transferable across appliances types) and result in
significant energy savings. This is an aspect of appliance design also supported by the
Energy Star programme, which “recommends” that manufacturers design products in
accordance with the Power Control User Interface Standard – IEEE 1621 to make power
controls more intuitive across ICT appliances (Energy Star, 2009).
Findings from this thesis provide some justification for Meier and Nordman‟s (2002)
assertions in the domestic sector and suggest that a mandatory requirement for highly
visible and standardised controls should be considered. Furthermore, the role of
situational cues in the performance of habitual behaviour suggests that visual cues could
help trigger energy saving behaviour. For example, messages to turn off connected
appliances, when a computer or television has been turned off, could encourage energy
saving behaviour.

355
10.4.2.7 Appliance functionality and networks
The widespread use of televisions and STBs to create a comfortable atmosphere suggests
that energy saving functions could be developed for “background” use. For example, a
television used in the background for audio purposes does not require the visual function
to be powered. Thus, providing functions whereby the screen is not fully energised (e.g.
uses less of the screen for images or at a lower illumination level) could lead to improved
efficiency. This argument is also relevant to the convergent use of other appliances. For
instance, a games console monitored in this study had an active power load of over 133 W
to play a Blue-ray DVD (around eight times higher than the average DVD player).
This implies that appliances should be designed to use the minimum power load required
to provide a specific function and supports the call for a “functional” approach to be taken
towards appliance design (Nordman et al., 2009; EES, 2010). This approach stipulates
that appliances should be set specific power requirements for the performance of
particular functions, to prevent wasted energy consumption from the provision of functions
that are not actually required.
EES (2010) provide an evaluation of how the functional approach could reduce network
electricity consumption by necessitating that devices are designed to enter much lower
power states when not in active use (e.g. through communication protocols) and designing
digital networks to support power management. The significance of network appliances to
household electricity consumption was a key finding from the appliance monitoring. The
majority of this electricity consumption occurred when the appliances were not providing
their primary service. Furthermore, appliances that were connected to networks could be
constrained from entering lower power modes. For example, the household with the
highest ICE appliance electricity consumption (household 7) reported that a number of
computers remained active even when they were not undertaking grid computing on an
external network. This was due to the householder deactivating his computers‟ power
management settings in order to maintain connection to the network.
Despite the commissioning of an EU preparatory study for network appliances in 2009,
there is still much uncertainty (EES, 2010) and current UK policy appears to not focus

356
closely on network appliances. For example, the MTP is still considering the future
addition of routers to the products covered by ePSU or servers and data centres (Defra,
2009b) and the “EuP process on standby specifically excluded “network standby” from its
scope” (Nordman, et al., 2009 p8). From 2012 all simple STBs will be subject to active
power mode MEPS and will require three hour auto power functions, but the future for
complex STB regulation is less certain, with initiatives being based on a voluntary code of
conduct. Complex STBs are also exempt from the EuP‟s standby power requirements due
to being considered “inappropriate” for this appliance type (Defra, 2009b).
This thesis suggests that network appliance use is an area of concern for policy and that
the principles outlined by EES (2010) and Nordman et al. (2009) should be evaluated by
UK policymakers (e.g. appliances and networks should support power management),
along with the potential development of a functional approach to appliance design, testing
and regulation.
10.4.3 Building infrastructure
A number of changes to building regulations could facilitate ICE appliance energy saving.
Although there was some anecdotal evidence that improving the sound-proofing of
dwellings could help to reduce the background use of appliances (i.e. to obscure ambient
noise from neighbouring homes), one of the key methods would be to improve
householders‟ ability to disconnect the mains power supply from appliances. This could be
achieved in a number of ways:
Consideration of the location of mains sockets.
The inclusion of a master switch, in each room, to disconnect designated mains
sockets.
The incorporation of remote “standby management” devices into dwelling
infrastructures (e.g. EDF‟s Energy EcoManager).
As discussed in section 10.3.1, some of the results support literature calling for the
installation of smart metering and energy monitoring displays into UK homes to improve
energy feedback (Owen and Ward, 2006; Darby, 2006). The results showed that people

357
are often unaware of the electricity consumption from the ICE appliance end-use and, in
particular, inconspicuous end-uses such as network appliances and standby consumption.
Ideally, feedback would need to provide information at the individual appliance level to
identify specific end-uses, but Fischer (2008) highlights that it is unlikely that the
sophisticated technology that can provide appliance specific breakdowns will be installed
widely. Nevertheless, work by Firth et al. (2008) has demonstrated that specific end-uses
can (to a degree) be ascertained from household electricity consumption data and
appliance level feedback monitors are now more widely available in the UK (e.g. the
AlertMe Kit, British Gas‟ Energy Smart monitor, EDF‟s EcoManager), which in some cases
also incorporate standby management functions (Welling, 2010). Thus, stipulating the
inclusion of feedback and standby management devices into building design could
potentially facilitate energy saving by enabling households to identify and control electricity
end-uses and observe the outcomes of their efforts.
10.4.4 Knowledge and awareness
10.4.4.1 Awareness campaigns
The household interviews found that householders were generally motivated to save
electricity due to environmental concern and fiscal advantage. However, participants‟
intentions to save energy were often inhibited by unawareness of the electricity
consumption attributable to ICE appliance use, incorrect assumptions concerning standby
consumption and limited understanding of operational functions. Although the findings
provide evidence that feedback from energy monitoring may assist households to curtail
ICE appliance electricity consumption, they also suggest that UK households need
practical information to facilitate energy saving. This argument has parallels to work by
Brandon and Lewis (1999), which found that feedback, coupled with practical energy
saving advice and pro-environmental attitudes, can go some way to reducing household
energy consumption. In light of the current paucity of electricity consumption feedback in
UK homes, awareness campaigns could promote the following:
The overall significance of the ICE appliance end-use.

358
The significance of inconspicuous appliances (e.g. routers, STBs, cordless
telephones) and standby consumption.
The occurrence of standby consumption without visible lights or displays on
appliances.
A simple energy audit to identify rarely used appliances in standby modes (e.g.
audio equipment, printers and play and record equipment, which the study found
were frequently left extensively in standby power modes).
Concerns over activation power surges do not warrant appliances being left active
for extended periods.
How to initiate computers power management settings, manage network
connections and alter household infrastructures (e.g. by using extension leads,
the use of energy monitors and/or standby management devices).
The environmental consequences of electricity consumption.
The use of standby functions via remote controls could also be promoted as a more
convenient means to reduce active power consumption when householders are using
equipment intermittently over a prolonged period. However, households would also need
to be informed that leaving appliances on standby for prolonged periods (e.g. overnight)
can result in substantial standby consumption and should be encouraged to disconnect
appliances routinely.
10.4.4.2 Knowledge transfer
The media were reported as important sources of environmental information and,
ironically, the use of ICE appliances may be an important channel to transfer energy
saving knowledge. Thus, this study supports the use of mass media awareness
campaigns. However, interpersonal communication channels were an important means of
knowledge transfer. For instance, participants often reported that they sought more
knowledgeable individuals to learn about computing equipment. Specifically engaging with
individuals who work in the ICT sector, or have a strong interest in ICE technologies, could
be a means to diffuse information. Social network sites (e.g. Facebook, Twitter, etc) could

359
also offer a means to engage with people during ICE appliance use. Supplementing
educational courses undertaken at work, school or in higher education with an “energy
saving” module (e.g. the use of power management settings, managing network
connections) could also improve operational knowledge. The study also highlighted that
manufacturers, retailers and service providers could assist energy saving through the
provision of simple and clear information with appliances.
10.4.5 Integrating energy efficiency into purchase decisions
10.4.5.1 Mandatory energy labelling
Participants were unaware of existing voluntary ICE appliance energy labelling schemes
(e.g. Energy Star and the EST‟s ESR scheme), which suggests that increased promotion
of these schemes is required. However, the study suggests that the expansion of
mandatory energy labelling would be a more effective approach due to many
householders‟ reporting that energy labels influenced their purchases of cold and wet
appliances and suggesting that mandatory labels for ICE appliances would have a similar
influence. The mandatory nature may also reduce cynicism concerning manufacturers‟
motivations for taking part in voluntary schemes and would send a clear message that
energy efficiency is of national importance. Future labelling could benefit from using the
existing A-G ratings, because participants were generally familiar with this format.
Since, the completion of this study, the EU has announced that mandatory energy labelling
will come into force for televisions from November 2011 and will use the A-G ratings
format based on the active power consumption of products (European Commission, 2010).
The results of this study support this development, but also suggest that mandatory energy
labelling should include standby power modes and be expanded across all ICE appliance
types.

360
10.4.5.2 Dissemination of information
Information gathering was a key aspect of the purchase decision process via social
networks and the Internet and individuals, who reflect Rogers‟ (2003) concept of opinion
leaders, were sought for information concerning purchase decisions. Thus, in addition to
dissemination of operational knowledge, engaging with individuals with stronger interests
in ICE appliances may be an important means to promote energy efficiency. This could be
achieved by encouraging manufacturers and retailers to market the benefits of energy
efficiency through ICE media (e.g. consumer electronics and computing magazines) and
within ICT related industries.
Householders search for independent reviews via the Internet highlights that an
independent website could be an important means to inform householders‟ evaluations.
Tait (2009) highlights the success of the European Top-Ten project, which has received
thirty million hits on its energy efficiency recommendation website. In the UK, energy
efficiency information is accessible via the EST‟s website, which aims “to endorse the top
20% energy-efficient products, and include a range of other product quality issues” (Tait,
2009 p7). None of the participants in this study reported using the EST website, which
suggests increased promotion of the website is required. However, the exclusion of
energy efficiency from purchase decisions (and the focus on price and performance)
implies that individuals will not actively seek out this information unless price and
performance are also reviewed. Therefore, presenting energy efficiency alongside other
existing independent consumer organisations‟ reviews (e.g. Which) may be a more
effective strategy.
10.4.5.3 Incentives and the rebound effect
Price was a central factor in householders‟ purchase decisions, which indicates that the
provision of fiscal incentives could be a mechanism to encourage the adoption of energy
efficient appliances. However, De Almeida et al. (2008) highlight that simply reducing
value added tax (VAT) may be inappropriate:
...this measure lowers the price of the product to the eyes of the consumer and creates a
false perception that energy efficient products don‟t have an extra cost (people usually

361
retain the gross price of a product and don‟t look whether the reduced price is the result of
a reduced VAT or not). The signal that should be sent out is exactly the opposite, meaning
that energy efficiency has a value. So, it is better if the financial incentive is given in an
indirect way in the form of personal tax credits or rebates.
(De Almeida et al., 2008 p63)
However, any form of fiscal incentive could result in the rebound effect, whereby
householders invest financial savings in other energy consuming activities (Hertwich,
2005). A good example from this study is reflected in comments from one householder
who aspired to have televisions in every room. Thus, providing more affordable energy
efficient appliances could result in more expansive television use and negate any benefits
from improved efficiency.
Another potentially negative effect relates to the use of laptop computers. The MTP
envisages that significant reductions in electricity consumption will be gained from the
increased substitution of desktop computers with laptops, due to their much better
efficiency (Defra, 2009b). Support for this policy is provided by the REMODECE project
and the Swedish Energy Agency study, which recommend that consumers should be
encouraged to use laptops rather than desktop computers (De Almeida et al., 2008;
Zimmermann, 2009). Although this study also found that laptops provided improved
efficiency, in cases, these mobile technologies also encouraged the simultaneous use of
other appliances (i.e. televisions and STBs). Service providers also encourage these
patterns of use through “social television” services. Thus, policymakers should be aware
that improving the uptake of energy efficient appliances does not address the potential for
the rebound effect and the development of more energy intensive patterns of use.

362
10.4.6 Energy sufficiency
The limitations of measures focused on energy efficiency leads to an important issue also
recognised by De Almeida et al. (2008), who state:
It is not only important to inform and motivate people in buying energy efficient
equipments, but also to draw their attention on sufficiency.
(De Almeida et al., 2008, p61)
In other words, consumers need to be encouraged to reduce the number of appliances
that they buy and, in some cases, purchase appliances with reduced functionality (e.g.
televisions with smaller screen sizes). Sufficiency can also be linked to patterns of use.
For example, reducing the extent of appliance use and the number of appliances used to
achieve an ICE goal (i.e. reduce the individualised and simultaneous use of appliances)
would help to reduce household electricity consumption. However, despite widespread
concern for the environment, none of the householders reported that they regulated their
active appliance use. Individualised and simultaneous patterns of use were embedded in
the homes and the underlying role of pleasure and comfort suggests that existing patterns
of use may be difficult to change without more far-reaching policies to alter our society‟s
values and the structures that support them.
10.4.7 Social change
Findings from this study suggest that, to deal with underlying motivations for ICE appliance
use, policymakers will need to consider measures that encourage energy efficiency and
sufficiency to become issues valued by society and promote social expectations to save
energy (i.e. marketing the waste of energy as a social stigma). Current policies appear to
largely focus responsibility for ICE appliance electricity consumption on appliance
manufacturers and retailers (i.e. improving energy efficiency). However, this study has
shown that other bodies have an important influence. For example, employers externalise
electricity consumption to the domestic sector by facilitating working from home.
Commerce, broadcasters and social network and email service providers also encourage

363
ICE appliance use, with little responsibility for the consequent household electricity
consumption.
It can be argued that any social structure that promotes and sustains the use of ICE
appliances (e.g. government, manufacturers, service providers, commerce, energy
suppliers, the construction industry, educational institutions and communication structures)
also needs to support energy saving. In a sense, this would involve the creation of a “duty
of care” to devolve responsibility into households and the organisations that encourage
(and benefit from) household ICE appliance electricity consumption. Fundamentally, this
duty of care would have to emanate from UK government policy. For example, policies set
out in the Digital Britain report (DBIS and DCMS, 2009) aim to expand the UK‟s digital
infrastructure and use of digital technologies. But, energy efficiency and sufficiency do not
appear to be a fundamental part of this strategy. This policy could be used to necessitate
power management into the development of digital networks and the inclusion of energy
saving into educational programmes. For instance, the report states that the UK
government:
...is seeking to create a seamless strategy from the very young in primary education
through a much improved education system founded on the building blocks of digital
careers and a revitalised HE skills system better aligned to the needs of a 21st century
digital economy.
(DBIS and DCMS, 2009 p187)
However, the 21st century digital economy also fundamentally requires a stable climate
and the strategy for the education system could easily integrate energy saving knowledge
and skills into the domestic and non-domestic sectors. Furthermore, the inclusion of
primary education may provide lasting benefits due to childhood development being found
to influence behaviour later on in life. With the expansion of domestic Internet access, it is
also likely that working from home will become an even more common occurrence (DBIS
and DCMS, 2009). Therefore, policy development could include measures to ensure that
non-domestic electricity consumption is not externalised to the domestic sector without

364
sufficient consideration (e.g. procurement of energy efficient appliances and employee
training).
Anecdotal findings also suggest that health was an influence on some households‟ ICE
appliance electricity consumption. This finding may be applicable to wider populations
when it is considered that the 2007 General Household Survey found that 18% of
respondents (n=16,560) “reported a long-standing illness that caused them to cut down on
their activities” (ONS, 2009c p4). Thus, policies aimed to improve the health and wellbeing
of our society could also impact on household electricity consumption if people are
encouraged to partake in non-energy consuming activities.
Perhaps as society we must also ask whether the development of new technologies (e.g.
HD and 3D television) provide genuine benefits that outweigh objectives to reduce
household electricity consumption. As contended by Boardman, “new equipment is
constantly coming onto the market, often for limited real improvements in the quality of life”
(Boardman, 2007 p28). Boardman highlights that the Australian government has adopted
an approach whereby new appliances need governmental clearance, before they can be
sold on the market. But, in order to influence the underlying motivations for appliance
ownership and use, policymakers may have to consider more far-reaching measures that
genuinely motivate responsibility for ICE appliance electricity consumption. This may
include more stringent electricity tariffs (that compel households to assess their ICE
appliance electricity consumption) and personal carbon allowances (Boardman, 2007).

365
Chapter 11. Conclusions
This study aimed to improve knowledge and understanding of the patterns of electricity
consumption attributable to information, communication and entertainment (ICE) appliance
use within UK households. The study required the development of a socio-technical
methodology that used electricity monitoring equipment and household interviews to
collect: (i) technical data to accurately and objectively measure electricity consumption
attributable to patterns of ICE appliance use; (ii) qualitative data to explore the factors that
influenced the patterns of electricity consumption recorded and ICE appliance ownership.
This chapter presents a brief summary of key findings from this thesis in respect to its aim
and objectives (section 11.1). This is followed by a discussion concerning its contribution
to knowledge (section 11.2). Limitations of the research are then briefly discussed along
with potential areas for future research (section 11.3).
11.1 Main findings
11.1.1 Patterns of ICE appliance electricity consumption
The first objective of this thesis was to identify to what extent patterns of electricity
consumption are attributable to the ICE appliance end-use. This research found that
around 23% of the average household whole house electricity consumption was from ICE
appliance use and supports the current consensus that the ICE appliance end-use has
become a key form of UK domestic electricity consumption. Standby consumption from
ICE appliances was also a significant end-use and contributed around 7% of the average
household whole house electricity consumption. Other key findings include:
Desktop computers and televisions were the most significant electricity consuming
appliances and the majority of their electricity consumption was from the active
power mode.
Network appliances (e.g. STBs and routers) have become an important electricity
end-use.

366
Network, audio, printing and play and record appliances can account for a
significant portion of household standby consumption.
More recent technologies (e.g. LCD televisions, HDD complex STBs, video play
and record equipment, digital radios and cordless telephones) appear to be more
energy intensive.
The wide variation in patterns of ICE appliance electricity consumption suggests
that initiatives need to address the efficiency of all appliance types in the different
power modes.
Importantly, the results provide evidence that network appliances, such as STBs and
routers, have become standard equipment in many UK homes. Network appliances are
an area of concern due to the high standby consumption recorded from these appliance
types and policy gaps. The wide variation in the electricity consumption measurements
also indicates that household contexts and behaviour play critical roles in ICE appliance
electricity consumption.
11.1.2 Factors that influence patterns of ICE appliance electricity consumption
The study‟s second objective was to explore the underlying factors that influence patterns
of ICE appliance electricity consumption. The results suggest that ICE appliance use was
generally more embedded into the everyday activities of households with higher ICE
appliance electricity consumption, particularly due to the use of computing appliances for
work and domestic activities. There was also evidence of more energy intensive patterns
of consumption, which can be linked to the integration of Internet services into domestic
and working activities and the adoption of digital television services, which have made
television viewing a more energy intensive activity.
A complex range of internal and external factors were found to influence ICE appliance
use. Householders‟ internal intentions to use ICE appliances were influenced by affective
factors (e.g. pleasure and comfort), social influences (e.g. norms, work contracts) and
perceived consequences of behaviour (e.g. financial cost, environmental harm, safety).

367
Although householders were often motivated to undertake energy saving behaviours these
were balanced against the convenience of undertaking the behaviour and the importance
given to ICE goals (e.g. pursuit of pleasurable, comfort, work). Habits and routines also
played a key role in patterns of appliance use and could be linked to the outcomes of past
behaviour and childhood development.
Importantly, householders‟ behavioural intentions and habits were mediated by a range of
contextual conditions. Key factors that impeded or facilitated energy saving behaviour
included the operational characteristics of appliances, dwelling infrastructure and
householders‟ knowledge and awareness (e.g. ICE appliance electricity consumption,
understanding of standby consumption, operational use).
The widespread integration of ICE appliances into household and social structures (e.g.
work, education, commerce) was an important influence on appliance ownership and was
reflected in social norms that support the ownership and use of ICE technologies. ICE
appliances were also viewed as highly compatible with the social system and existing
household activities.
Price, performance, aesthetics and service provision were important considerations in the
purchase decisions and householders frequently looked to independent and trusted
sources of information via their social networks (e.g. friends, family members and work
colleagues) and independent reviews (e.g. Internet websites, consumer advice
magazines). Individuals‟ with a more extensive knowledge of ICE technologies were
reported to influence participants purchase decisions.
Energy efficiency was rarely cited as a consideration during purchase decisions and was
largely excluded from information gathering activities. These findings suggest that there is
a need to improve the dissemination of energy efficiency product information via social
networks and independent and trusted communication channels.

368
11.1.3 Opportunities to reduce ICE appliance electricity consumption
A third objective of this thesis was to provide recommendations to help inform policy aimed
at reducing household ICE appliance electricity consumption. The wide range of internal
and external influences on ICE appliance ownership and use implies that there is not a
simple answer to address rising ICE appliance electricity consumption and the influence of
affective and social factors suggests that it may be unrealistic to expect households to
make extensive reductions in their active use of televisions and computers. However, this
study suggests that there are opportunities to reduce wasted ICE appliance electricity
consumption.
The findings suggest that an integrated approach is required that encourages the UK‟s
society to value and support energy saving. Members of such a society would be
prepared to make personal sacrifices in terms of pleasure, convenience and the aesthetic
quality of their homes. They would be informed members of society demanding
manufacturers, retailers, commerce and service providers to offer energy efficient services
and appliances. Energy sufficiency and concern for the environment would be a social
expectation in addition to one held in terms of personal morality. The social and physical
infrastructures that facilitate and support ICE appliance electricity consumption would also
be aligned to energy saving.
To develop such a society, this thesis supports the recent implementation of MEPS and
mandatory energy labelling for televisions. Further, recommendations have been made in
section 10.4, which concern:
Improved product design and the integration of power management into ICE
appliance networks.
The utilisation of behaviour change campaigns to improve householders‟
knowledge and awareness of ICE appliance electricity consumption and methods
to save energy.
The provision of improved electricity consumption feedback (e.g. through smart
metering and energy monitoring displays) to improve energy literacy and motivate
energy saving behaviour.

369
The expansion of mandatory energy labelling to all ICE appliances.
The dissemination of energy efficiency information into social networks and the
further development of independent sources of information via the Internet.
The integration of ICE appliance energy saving objectives into wider UK policies.
11.1.4 Methodological findings
The fourth and final objective of this thesis concerned the development of the socio-
technical methodology used by this study. This thesis has demonstrated that socio-
technical research can provide a comprehensive approach to understand the dynamics of
ICE appliance electricity consumption. A key strength of the mixed methods approach has
been the complementary nature of the two data-sets. The technical data provided a
reliable foundation on which to base the qualitative interviews, whilst the interview data
supported the electricity consumption analysis and identified key factors that influenced
the measurements recorded.
It is also useful to highlight some of the key lessons learned from the use of the monitoring
equipment in this study.
The equipment‟s 1 Wh resolution resulted in additional processing steps when
determining the contribution of low power loads. Many ICE appliance standby
loads will be below 1 W due to the introduction of MEPS. Therefore, monitoring
equipment should be developed with resolutions of at least 0.1 Wh.
Preliminary testing indicated that poor quality ring mains and unforeseen external
phenomenon, such as mainsborne interference, could disrupt logging intervals.
Future development of the AMS should consider wireless communication for the
transfer of interval data rather than Power Line Carrier connection.
The two week monitoring period appears to have been sufficient for the
exploratory nature of this research. However, future research would clearly
benefit from a more expansive monitoring period, to capture the influence of
seasonal variation and the adoption of new technologies.

370
The increasing use of mobile technologies is an interesting aspect of ICE
appliance use. The development of “mobile” monitoring loggers could provide a
valuable insight into electricity consumption from these devices.
11.1.5 Theoretical findings
Triandis‟ (1977) Theory of Interpersonal Behaviour (TIB) and Rogers‟ (2003) Diffusion of
Innovations Theory (DIT) provided useful frameworks to investigate household behaviour.
Although the TIB has received little attention in energy research, key constructs helped
explain important influences on behaviour. Emotions, social influences and habit emerged
as important factors and contextual conditions moderated the performance of behavioural
intentions. Furthermore, influences identified by previous research using practice theory
were also captured by this study. Thus, the TIB could provide an expansive framework to
investigate both psychological and sociological influences on other energy end-uses.
11.2 Contribution to knowledge
A primary contribution to knowledge from this thesis is the provision of detailed “real world”
electricity consumption measurements of ICE appliance use in UK homes. This
contributes to filling a current gap in the literature regarding the ICE appliance electricity
end-use in the domestic sector. In addition, this thesis has contributed to gaps in
knowledge concerning underlying behavioural factors that influence the ownership and use
of ICE appliances in the UK. Despite some findings from this research already being
known to scholars, the results from this thesis add to the debate by providing real world
evidence to support modelling work and by indicating that findings from foreign studies can
be applied to the UK perspective.
An original contribution has also been made in terms of the methodology used for this
research. Research in this field has largely followed a mono-disciplinary approach and
previous socio-technical studies have often collected technical and social data
independently. The application of Triandis‟ (1977) TIB to the exploration of energy related
behaviours also provides a degree of novelty to this thesis.

371
11.3 Limitations and future research
Limitations of this research have been discussed in this thesis and include issues relating
to the appliance monitoring equipment and potential errors in the data analysis,
generalisation of the results and the exclusion of some ICE appliances from the research.
A number of these limitations provide opportunities for future research.
The results of this study are limited by the small sample size and relatively short
monitoring period. The undertaking of a much larger and longitudinal study could not only
provide more representative results, but may capture the emergence and influence of new
technologies (e.g. HD television services) and patterns of use (e.g. social television). This
study‟s focus on the ICE appliance end-use also raises questions regarding the influence
of other electricity end-uses on the whole house measurements recorded. Thus, the
inclusion of other energy end-uses in future studies would provide more detailed insights.
Although the emergence of mobile technologies presents a practical challenge to
monitoring campaigns, this is a phenomenon not captured by this study that may have
important repercussions both for society and domestic electricity consumption. The
emergence of social television is a further area of appliance use that warrants more
detailed investigation.
Although the influence of health issues on ICE appliance use may be an anecdotal aspect
to the results, it would be interesting to understand the influence of these factors on
domestic energy consumption. Finally, the use of the TIB provided a useful framework to
understand ICE appliance use. However, further research is required to support its use in
wider energy research.

372
References
Abrahamse, W., Steg, L., Vlek, C. and Rothengatter, T. (2005). „A review of intervention
studies aimed at household energy conservation‟. Journal of Environmental
Psychology, Vol. 25, pp. 273-291.
Abrahamse, W., Steg, L. Vlek, C. and Rothengatter, T. (2007). „The effect of tailored
information, goal setting, and tailored feedback on household energy use,
energy-related behaviors, and behavioral antecedents‟. Journal of
Environmental Psychology, Vol. 27, pp. 265–276.
Anable, J., Lane, B. and Kelay, T. (2006). An Evidence Base Review of Public Attitudes to
Climate Change and Transport Behaviour, Final Report [online]. Available at
URL: http://www.dft.gov.uk/pgr/sustainable/reviewtransportbehaviourclimate
change/ [accessed 20.08.2009].
Angioletti, R. and Larsonneur, P. (2006). D4: Harmonised Monitoring Surveying
Methodology. REMODECE WP3 -Sub task 3.1 [online]. Available at URL:
http://www.isr.uc.pt/~remodece/downloads/downloads.htm [accessed
20.11.2009].
Ajzen, I. (1991). „The Theory of Planned Behavior‟. Organizational Behavior and Human
Decision Processes, Vol. 50, pp. 179-211.
Atkin, D. J., Neuendorf, K. and Jeffres, L. W. and Skalski, P. (2003). „Predictors of
Audience Interest in Adopting Digital Television‟. The Journal of Media
Economics, Vol. 16 No. 3, pp. 159-173.
BBC (British Broadcasting Corporation) (2010). How TV viewing became a social
experience (online). (Updated 1.4.2010). Available at URL:
http://news.bbc.co.uk/1/hi/programmes/click_online/8599071.stm#blq-main
[accessed 06.10.2010].
Becker, L. J., Seligman, C., Fazio, R. H. and McConnon Darley, J. „Relating Attitudes to
Residential Energy Use‟. Environment and Behavior, Vol. 13, No. 5, pp. 590-
609.

373
Bennich, P. and Persson, A. (2006). „Methodology and First Results from End-Use
Metering in 400 Swedish Households‟. In Energy Efficiency in Domestic
Appliances and Lighting: Proceedings of the 4th International Conference
EEDAL ‟06, 21-23 June 2006, London. Luxembourg: European Communities.
Bennich, P., Lopes, C., Öfverholm, E. and Kadic, Z. (2009). „How can increased technical
energy efficiency lead to increased energy consumption – answer from in-depth
metering of the electricity demand in 400 Swedish households‟. In 2009
Summer Study Proceedings, European Council for an Energy Efficient
Economy [online]. Available at URL:
http://www.eceee.org/conference_proceedings/eceee/2009/ Panel_8/8.377/
[accessed 07.3.2010].
Berard, T. J. (2005). „Rethinking Practices and Structures‟. Philosophy of the Social
Sciences, Vol. 35, No. 2, pp. 196-230.
Bergman, M. M. (2008). „The Straw Men of the Qualitative-Quantitative Divide and their
Influence on Mixed Methods Research‟. In: Advances in Mixed Methods
Research. M. M. Bergman (ed). London: Sage Publications Ltd, pp 11-21.
Bertoldi, P., Aebischer, B., Edlington, C., Hershberg, C., Lebot, B., Lin, J., Marker, T.,
Meier, A., Nakagami, H., Shibata, Y., Siderius, H. P. and Webber, C. (2002).
„Standby Power Use: How Big Is the Problem? What Policies and Technical
Solutions Can Address It?‟ In Proceedings of the 2002 ACEEE Summer Study
on Energy Efficiency in Buildings [online], p7.41-7.60. Available at URL:
http://www.eceee.org/conference_proceedings/ACEEE_buildings/2002/Panel_7
/p7_4/Paper/ [accessed 16.06.07].
Bina, M., Karaiskos, D. and Giaglis, G. M. (2007). „Motives and Barriers Affecting the Use
of Mobile Data Services‟. In proceedings Sixth International Conference on the
Management of Mobile Business (ICMB) July 9-11 2007, IEEE Computer
Society.
Bio Intelligence Services and Fraunhofer IZM (2008). Preparatory Studies for Eco-design
Requirements of EuPs (II): Lot 18 Complex set-top boxes. Final report [online].
Available at URL: http://www.ecocomplexstb.org/documents_18.php [accessed
15.10.2009].

374
Boardman, B. (2007). Home Truths: A low-carbon strategy to reduce UK housing
emissions by 80% by 2050. United Kingdom: Environmental Change Institute,
University of Oxford.
Boardman, B., Favis-Mortlock, D., Hinnells, M., Lane, K., Milne, G., Palmer, J., Small, E.,
Strang, V. and Wade, J. (1995). DECADE: Domestic Equipment and Carbon
Dioxide Emissions, Second year report. Oxford: Environmental Change
Institute.
Boots, R. F. and Treloar, C. (2000). „Prediction of intern attendance at a seminar-based
training programme: a behavioural intention model‟. Medical Education, Vol.34,
pp. 512-518.
Boyle, G., Everett, B. and Ramage, J. (2003). Energy systems and Sustainability: Power
for a Sustainable Future. Oxford: Oxford University Press.
Brandon, G. and Lewis, A. (1999). „Reducing Household Energy Consumption: A
Qualitative and Quantitative Field Study‟, Journal of Environmental Psychology.
Vol. 19, pp. 75-85.
BSI (British Standards Institution) (2005). Household electrical appliances – Measurement
of standby power. London: BSI British Standards.
Camilleri, M. (2009). Overview of NZ‟s Household Energy Enduse Project (HEEP) [online].
Available at URL: http://www.energyrating.gov.au/pubs/2009-end-use-
camilleri.pdf [accessed 23.01.2010].
CaRB (2009). Carbon Reduction in Buildings (CaRB): A socio-technical, longitudinal study
of carbon use in buildings [online]. Available at URL: http://www.carb.org.uk/
[accessed 16.02.2009].
Chang, M. K. and Cheung, W. (2001). „Determinants of the intention to use Internet/WWW
at work: a confirmatory study‟. Information and Management, Vol. 39, pp. 1-14.
Cheung, W., Chang, M. K. and Lai, V. S. (2000). „Prediction of Internet and World Wide
Web usage at work: a test of an extended Triandis model‟. Decision Support
Systems, Vol. 30, pp. 83-100.
CLG Committee (2008). Existing Housing and Climate Change. London: TSO.

375
Coleman, M., Wright, A., Brown, N. And Firth, S. (2009). „Domestic information,
communication and entertainment (ICE) appliance monitoring: A practical
perspective and implications for inter-disciplinary research‟. In Energy
Efficiency in Domestic Appliances and Lighting: Proceedings of the 5th
International Conference EEDAL ‟09, 16-18 June 2009, Berlin. Luxemburg:
European Union.
Colman, A. (2001). Oxford Dictionary of Psychology. Oxford: Oxford University Press.
Creswell, J. W. (2007). Qualitative Inquiry and Research Design. Thousand Oaks: Sage
Publications Inc.
Creswell, J. W. and Plano Clark, V. L. (2007). Designing and Conducting Mixed Methods
Research. Thousand Oaks: Sage Publications Inc.
Crosbie, T. (2006). „Household Energy Studies: The Gap between Theory and Method‟.
Energy and Environment, Vol. 17, No. 5, pp. 735-753.
Crosbie, T. (2008). „Household energy consumption and consumer electronics: The case
of television‟. Energy Policy, Vol. 36, pp. 2191–2199.
Crosbie, T. and Guy, S. (2008). „En„lightening‟ energy use: the co-evolution of household
lighting practices‟. International Journal of Environmental Technology and
Management, Vol. 9, Nos. 2/3, pp. 220-235.
Darby, S. (2006). The effectiveness of feedback on energy consumption: A review for
DEFRA on the literature on metering, billing and direct displays [online].
Available at URL: http://www.eci.ox.ac.uk/research/energy/downloads/smart-
metering-report.pdf [accessed 15.01.2008].
Darnton, A. (2008a). GSR Behaviour Change Knowledge Review: Overview of Behaviour
Change Models and their Uses, Briefing Note for Policy Makers [online].
Available at URL: http://www.peecworks.org/PEEC/PEEC_Gen/03AC00A6-
007EA7AB.2/ Darnton%202008% 20Policy%20Briefing.pdf [accessed
13.06.2009].

376
Darnton, A. (2008b). GSR Behaviour Change Knowledge Review, Reference Report: An
overview of behaviour change models and their uses [online]. Available at URL:
http://www.peecworks.org/PEEC/PEEC_Gen/03AC00A6-007EA7AB.1/Darnton
%202008%20Overview%20of%20behavior%20change%20models%20and%20
uses.pdf [accessed 13.06.2009].
DBIS and DCMS (Department for Business, Innovation and Skills and the Department for
Culture, Media and Sport) (2009). Digital Britain: Final Report. Norwich: The
Stationary Office.
DCLG (Department for Communities and Local Government) (2006a). Review of
Sustainability of Existing Buidings[sic]: The Energy Efficiency of Dwellings –
Initial Analysis [online]. Available at URL:
http://www.communities.gov.uk/documents/planningandbuilding/pdf/154500.pdf
[accessed 27.11.2008].
DCLG (Department for Communities and Local Government) (2006b). Building a Greener
Future: Towards Zero Carbon Development [online]. Available at URL:
http://www.communities.gov.uk/documents/planningandbuilding/pdf/153125.pdf
[accessed 27.11.2008].
De Almeida, A., Fonseca, P., Schlomann, B., Feilberg, N. and Ferreira, C. (2006).
„Residential Monitoring to Decrease Energy Use and Carbon Emissions in
Europe‟. In Energy Efficiency in Domestic Appliances and Lighting:
Proceedings of the 4th International Conference EEDAL ‟06, 21-23 June 2006,
London. Luxemburg: European Union.
De Almeida, A. and Fonseca, P. (2007). „Residential Monitoring to Decrease Energy Use
and Carbon Emissions in Europe‟. In 2007 Summer Study Proceedings,
European Council for an Energy Efficient Economy, Vol. 3, pp. 1261-1271.
De Almeida, A., Fonseca, P., Bandeirinha, R., Fernandes, T., Araújo, R. and Nunes, U.
(2008). Residential Monitoring to Decrease Energy Use and Carbon Emissions
in Europe (Publishable Report) [online]. Available at URL:
http://www.isr.uc.pt/~remodece/downloads/downloads.htm [accessed
20.11.2009].

377
De Almeida, A., Fonseca, P., Feilberg, N. Grinden, B., Kreitz, T. and Dupret, M. (2009).
„Characterization of the Household Electricity Consumption in the EU, Potential
Energy Savings and Specific Policy Recommendations‟. In Energy Efficiency in
Domestic Appliances and Lighting: Proceedings of the 5th International
Conference EEDAL ‟09, 16-18 June 2009, Berlin. Luxemburg: European
Union.
DECC (Department for Energy and Climate Change) (2008). UK Leads World with
Commitment to Cut Emissions by 80% by 2050 [online]. Available at URL:
http://nds.coi.gov.uk/environment/fullDetail.asp?ReleaseID=381477&NewsArea
ID=2&NavigatedFromDepartment=False [accessed 20.11.2008].
DECC (Department for Energy and Climate Change) (2009a). The UK Lower Carbon
Transition Plan [online]. Available at URL:
http://www.decc.gov.uk/publications/basket.aspx?FilePath=White+Papers%5cU
K+Low+Carbon+Transition+Plan+WP09%5c1_20090724153238_e_%40%40_l
owcarbontransitionplan.pdf&filetype=4 [accessed 12.11.2009].
DECC (Department for Energy and Climate Change) (2009b). Energy Consumption in the
UK: Domestic data tables 2009 Update [online]. Available at URL:
http://www.decc.gov.uk/media/viewfile.ashx?filepath=statistics/publications/ener
gyconsumptionintheuk/1_20090729114634_e_@@_domestic2009.xls&filetype
=4 [accessed 16.11.2009]
DECC (Department for Energy and Climate Change) (2010). Sub-national electricity
consumption data [online]. Available at URL:
http://www.decc.gov.uk/en/content/cms/statistics/regional/electricity/electricity.a
spx [accessed 17.03.2010].
Defra (Department for the Environment, Food and Rural Affairs) (2005). The UK
Government Sustainable Development Strategy. Norwich: The Stationary
Office.
Defra (Department for the Environment, Food and Rural Affairs) (2006). Climate Change:
The UK Programme 2006. London: Stationary Office.

378
Defra (Department for the Environment, Food and Rural Affairs) (2007a). UK Energy
Efficiency Action Plan 2007 [online]. Available at URL:
http://www.defra.gov.uk/environment/climatechange/uk/energy/pdf/action-plan-
2007.pdf [accessed 6.11.2007].
Defra (Department for the Environment, Food and Rural Affairs) (2008a). Policy Brief:
Improving the energy performance of domestic cold appliances [online].
Available at URL: http://www.mtprog.com/spm/files/download/byname/file/2006-
07-10%20PolicyBrief_Domestic%20Cold%20fin.pdf [accessed 8.1.2009].
Defra (Department for the Environment, Food and Rural Affairs) (2008b). Policy Brief:
Improving the energy performance of consumer electronics products [online].
Available at URL: www.mtprog.com/spm/files/download/byname/file/2006-07-
10%20Policy_Brief_consumer_electronics%20fin.pdf [accessed 12.10.2008].
Defra (Department for the Environment, Food and Rural Affairs) (2008c). Policy Brief:
Improving the energy performance of information and communication
technology products [online]. Available at URL:
http://www.mtprog.com/spm/files/download/ byname/file/2006-07-
10%20Policy_Brief_ICT%20 fin.pdf [accessed 12.10.2008].
Defra (Department for the Environment, Food and Rural Affairs) (2009a). 2009 Guidelines
to Defra / DECC's GHG Conversion Factors for Company Reporting [online].
Available at URL:
http://www.defra.gov.uk/environment/business/envrp/pdf/conversion-factors.pdf
[accessed 1.10.2009].
Defra (Department for the Environment, Food and Rural Affairs) (2009b). Energy Through
Better Products and Appliances: A consultation on analysis, aims and indicative
standards for energy efficient products 2009 – 2030. [online]. Available at URL:
http://www.defra.gov.uk/corporate/consult/energy-using-products/index.htm
[accessed 04.08.2010].
Digital Living (2007). The DMU Energy Monitoring System Installation & User Manual v0.4.
Unpublished: Digital Living Limited.

379
DofH (Department of Health) (2009). „Mobile phones and health‟. Publications policy and
guidance [website]. Available at URL: http://www.dh.gov.uk/en/Publicationsand
statistics/Publications/PublicationsPolicyAndGuidance/DH_4123979 [accessed
10.02.2009].
DTI (Department of Trade and Industry) (2002). Energy Consumption in the United
Kingdom [online]. Available at URL: http://www.dti.gov.uk/files/file11250.pdf
[accessed 6.11.2007].
DTI (Department of Trade and Industry) (2003). Our Energy Future – Creating a Low
Carbon Economy [online]. Available at URL:
http://www.dti.gov.uk/files/file10719.pdf [accessed 16.05.2007].
DTI (Department of Trade and Industry) (2006). UK Energy in Brief July 2006. London:
Stationary Office.
DTI (Department of Trade and Industry) (2007). Meeting the Energy Challenge [online].
Available at URL: http://www.dtistats.net/ewp/ewp_full.pdf [accessed
23.05.2007].
EES (Energy Efficient Strategies) (2006). 2005 Intrusive Residential Standby Survey
Report [online]. Available at URL:
http://www.energyrating.gov.au/library/pubs/200602-intrusive-survey.pdf
[accessed 17.3.2008].
EES (Energy Efficient Strategies) (2010). Standby Power and Low Energy Networks –
issues and directions [online]. Available at URL: http://www.energyrating.gov.au
[accessed 01.11.2010].
Elcomponent (2006). SPCMini User Manual. Herts, UK: Elcomponent Ltd.
Elcomponent (2006). SPCmini Electrical Energy Profile Logger – Issue 5. Herts, UK:
Elcomponent Ltd.
Ellis, M (2009a). Gadgets and Gigawatts: Policies for Energy Efficient Electronics.
France: International Energy Agency.
Ellis, M (2009b). „Gadgets and Gigawatts‟. In Energy Efficiency in Domestic Appliances
and Lighting: Proceedings of the 5th International Conference EEDAL ‟09, 16-
18 June 2009, Berlin. Luxemburg: European Union.

380
Energy Star (2009). ENERGY STAR Program Requirements for Computers: Version 5.0
[online]. Available at URL:
http://www.energystar.gov/ia/partners/prod_development/revisions/downloads/c
omputer/Version5.0_Computer_Spec.pdf [accessed 9.09.2009].
ENERTECH (2002). Demand Side Management: End-use metering campaign in 400
households of the European Community; Assessment of the Potential
Electricity Savings. European Community SAVE Programme, Project
EURECO.
ENERTECH (2006). Work Package 2: Review of All Existing European Monitoring
Campaigns in Households [online]. European Union, REMODECE Project
Available at URL:
http://www.isr.uc.pt/~remodece/downloads/REMODECE_Review_monitoring%
20campaign_D2.pdf [accessed 04.3.2009].
EST (Energy Saving Trust) 2006. Habits of a lifetime: European energy usage report.
United Kingdom: Energy Saving Trust.
European Commission (2008). COMMISSION REGULATION (EC) No 1275/2008 of 17
December 2008 implementing Directive 2005/32/EC of the European
Parliament and of the Council with regard to eco-design requirements for
standby and off mode electric power consumption of electrical and electronic
household and office equipment [online]. Available at URL: http://eur-
lex.europa.eu/LexUriServ/LexUriServ.do?uri=OJ:L:2008:339:0045:0052:EN:PD
F [accessed 20.02.2009].
European Commission (2010). COMMISSION DELEGATED REGULATION (EU) No
1062/2010 of 28 September 2010 supplementing Directive 2010/30/EU of the
European Parliament and of the Council with regard to energy labelling of
televisions [online]. Available at URL: http://eur-
lex.europa.eu/LexUriServ/LexUriServ.do?uri=OJ:L:2010:314:0064:0080:EN:PD
F [accessed 20.02.2009].
European Commission (2009). Climate Action [online]. Available at URL:
http://ec.europa.eu/environment/climat/climate_action.htm [accessed
20.06.2009].

381
European Commission (2005). Directive 2005/32/ec of the European Parliament and of the
Council Establishing a Framework for the Setting of Ecodesign Requirements
for Energy-using Products Amending Council Directive 92/42/eec and
Directives 96/57/ec and 2000/55/ec [online]. PE-CONS 3618/05, Strasbourg,
July 6th, 2005. Available at URL: http://eur-
lex.europa.eu/LexUriServ/LexUriServ.do?uri=OJ:L:2005:191:0029:0058:EN:PD
F [accessed 20.02.2009].
Faiers, A. and Neame, C. (2006). „Consumer attitudes towards domestic solar power
systems‟. Energy Policy, Vol. 34, pp. 1797-1806.
Fink, A. (1995). How to Sample in Surveys. Thousand Oaks: Sage Publications.
Firth, S., Lomas, K., Wright, A. and Wall, R. (2008). „Identifying trends in the use of
domestic appliances from household electricity consumption measurements‟.
Energy and Buildings, Vol. 40, pp 926-936.
Fischer, C. (2008). „Feedback on household electricity consumption: a tool for saving
energy?‟ Energy Efficiency, Vol. 1, pp. 79-104.
Fraunhofer IZM (2007). EuP Preparatory Study Lot 6: Standby and Off-mode Losses; Task
8 Scenario, Policy, Impact and Sensitivity Analysis. Final Report [online].
Available at URL: http://www.ecostandby.org/documents.php [accessed
20.07.2009].
Fung, A. S., Aulenback, A., Ferguson, A. and Ugursal, V. I. (2003) „Standby power
requirements of household appliances in Canada‟. Energy and Buildings, Vol.
35, pp. 217-288.
Gagnon, M., Sánchez, E. and Pons, J. (2006). „From recommendation to action:
psychosocial factors influencing physician intention to use Health Technology
Assessment (HTA) recommendations‟. Implementation Science, Vol. 1, No. 8.
Gagnon, M., Godin, G., Gagné, C., Fortin, J., Lamothe, L., Reinharz, D. and Cloutier, A.
(2003). „An adaptation of the theory of interpersonal behaviour to the study of
telemedicine adoption by physicians‟. International Journal of Medical
Informatics, Vol. 71, pp. 103-115.
Gardener, G. T. and Stern, P. C. (2002). Environmental Problems and Human Behaviour,
2nd edition. Boston: Pearson Custom Publishing.

382
Giddens, A. (1984). The Constitution of Society. Cambridge: Policy Press.
GOS (The Government Office for Science) (2008). Foresight Sustainable Energy
Management and the Built Environment Project: Final Project Report [online].
Available at URL: http://www.foresight.gov.uk/index.asp [accessed 20.12.2008].
Gram-Hanssen, K. (2002). „Technology and Culture as Explanations for Variations in
Energy Consumption‟. In 2002 Summer Study Proceedings, American Council
for an Energy Efficient Economy [online]. Vol. 8, pp. 79-90. Available at URL:
http://www.eceee.org/conference_proceedings/ACEEE_buildings/2002/Panel_8
/p8_7/ [accessed 24.7.2007].
Gram-Hanssen, K. (2005). „Teenage consumption of information and communication
technology‟. In 2005 Summer Study Proceedings, European Council for an
Energy Efficient Economy, Vol. 3, pp. 1237-1247.
Gram-Hanssen, K. (2008). „Consuming technologies – developing routines‟. Journal of
Cleaner Production, Vol. 16, No. 11, pp. 1181-1189.
Gram-Hanssen, K. (2010). „Standby Consumption in Households Analyzed With a Practice
Theory Approach. Journal of Industrial Ecology, Vol. 14, No. 1, pp. 150-165.
Gram-Hanssen, K., Kofod, C. and Petersen, K. N. (2004). „Different Everyday Lives:
Different Patterns of Use‟. In 2004 Summer Study Proceedings, American
Council for an Energy Efficient Economy [online]. Available at URL:
http://www.eceee.org/conference_proceedings/ACEEE_buildings/2004/Panel_7
/p7_7/ [accessed 24.7.2007].
Gray, D. E. (2004). Doing Research in the Real World. London: Sage Publications Ltd.
Green, A. and Ellegård, K. (2007). „Consumer behaviour in Swedish households: routines
and habits in everyday life‟. In 2007 Summer Study Proceedings, European
Council for an Energy Efficient Economy, Vol. 4, pp. 1907-1916.
Grinden, B. and Feilberg, N. (2008). Analysis of Monitoring Campaign in Europe.
REMODECE report D10 [online]. Available at URL:
http://www.isr.uc.pt/~remodece/downloads/downloads.htm [accessed
06.11.2008].

383
Guagnano, G., Hawkes, G. R., Acredolo, C. and White, N. (1986). „Innovation perception
and adoption of solar heating technology‟. The Journal of Consumer Affairs,
Vol. 20, No. 1, pp. 48-64.
Gudbjerg, E. and Gram-Hanssen, K. (2006). „Standby Consumption in Private Homes
Socio-economic Studies, Mapping and Measuring Reduction? What Works:
Campaigns or Hardware Solutions?‟ In Proceedings of the 4th International
Conference on Energy Efficiency in Domestic Appliances and Lighting (EEDAL)
2006, Vol. 3, London, UK.
Harrington, L., Brown, J., Holt, S., Meier, A., Nordman, B. and Ellis, M. (2007). „Standby
energy: building a coherent international policy framework – moving to the next
level‟. In 2007 Summer Study Proceedings, European Council for an Energy
Efficient Economy, Vol. 3, pp. 1285-1296.
Harrington, L. and Kleverlaan, P. (2001). „Quantification of Residential Standby Power
Consumption in Australia: Results of Recent Survey Work‟. Project for the
National Appliance & Equipment Energy Efficient Committee, Australian
Greenhouse Office, pp. 1–13.
Henry, G. T. (1990). Practical Sampling. Thousand Oaks: Sage Publications.
Herring, H. (1995). „Electricity Use in Minor Appliances in the UK‟. Energy, Vol.20, No. 7,
pp. 705-710.
Hertwich, E. G. (2005). „Consumption and the Rebound Effect: An Industrial Ecology
Perspective‟. Journal of Industrial Ecology, Vol. 9, No.1-2, pp. 85-98.
IEA (International Energy Agency) (2001). Things that Go Blip in the Night: Standby
Power and How to Limit it [online]. Available at URL:
http://www.iea.org/textbase/nppdf/free/2000/blipinthenight01.pdf [accessed
06.09.2007].
IEA (International Energy Agency) (2007a). Fact Sheet: Standby Power Use and the IEA
“1-watt Plan” [online]. Available at URL:
http://www.iea.org/textbase/papers/2007/standby_fact.pdf [accessed
06.09.2007].

384
IEA (International Energy Agency) (2007b). Standby Power Use and the IEA “1 watt Plan”
Version 2007 [online]. Available at URL:
http://www.iea.org/textbase/subjectqueries/standby.asp [accessed 29.06.2007]
IEGMP (2000). Mobile Phones and Health. Report of an Independent Expert Group on
Mobile Phones. Chairman, Sir William Stewart [online]. Available at URL:
http://www.iegmp.org.uk/report/text.htm [accessed 10/2/2009].
International Standby Power Data Project (2008). Power mode definitions [online].
Available at URL:
http://www.energyrating.gov.au/standbydata/app/ModeDefinitions.aspx
[accessed 06.09. 2008].
IPCC (Intergovernmental Panel on Climate Change) (2001). Climate Change 2001: The
Scientific Basis [online]. Available at URL: http://www.ipcc-wg2.org/ [accessed
16.05.2007].
IPCC (Intergovernmental Panel on Climate Change) (2007a). „Summary for Policymakers‟.
In: Climate Change 2007: The Physical Science Basis. Contribution of Working
Group I to the Fourth Assessment Report of the Intergovernmental Panel on
Climate Change [online]. Solomon, S., D. Qin, M. Manning, Z. Chen, M.
Marquis, K.B. Averyt, M.Tignor and H.L. Miller (eds). Cambridge: Cambridge
University Press, pp. 2-18. Available at URL:
http://www.ipcc.ch/pdf/assessment-report/ar4/wg1/ar4-wg1-spm.pdf [accessed
on 16.08.2008].
IPCC (Intergovernmental Panel on Climate Change) (2007b). „Summary for Policymakers‟.
In: Climate Change 2007: Impacts, Adaptation and Vulnerability. Contribution of
Working Group II to the Fourth Assessment Report of the Intergovernmental
Panel on Climate Change [online]. M.L. Parry, O.F. Canziani, J.P. Palutikof,
P.J. van der Linden and C.E. Hanson, (eds). Cambridge: Cambridge University
Press, pp. 7-22. Available at URL: http://www.ipcc-wg2.org/ [accessed on
16.09.2008].

385
Isaacs, N., Camilleri, M., French, L., Pollard, A., Saville-Smith, K., Fraser, R., Rossouw, P.
and Jowett, J. (2006a). Energy Use in New Zealand Households: Report on the
Year 10 Analysis for the Household Energy End-use Project (HEEP) [online].
Available at URL:
http://www.branz.co.nz/cms_show_download.php?id=b1ab61dd06f50e83e6a18
4b29b68a989472502ed [accessed 27/11/2007].
Isaacs, N., Camilleri, M. and French, L. (2006b) „Why Bother Collecting Data? Experiences
of the Household Energy End-use Project‟. In the American Council for Energy
Efficient Economy (ACEEE) 2006 Summer Study on Energy Efficiency in
Buildings, 13-18th August, Pacific Grove, California.
IVF Industrial Research and Development Corporation (IVFIRDC) (2007). Preparatory
studies for Eco-design Requirements of EuPs: Lot 3 Personal Computers
(desktops and laptops) and Computer Monitors Final Report (Task 1-8).
Available at URL:
http://extra.ivf.se/ecocomputer/downloads/Eup%20Lot%203%20Final%20Repo
rt%20070913%20published.pdf [accessed 20.07.2009].
Jackson, T. (2005). Motivating Sustainable Consumption a review of evidence on
consumer behaviour and behavioural change [online]. Available at URL:
http://sdrnadmin.rechord.com/wp-content/uploads/motivatingscfinal_000.pdf
[accessed 23.03.2009].
Jeeninga, H and Huenges Wajer, B. P. F. (1999). „Domestic electricity Consumption and
Life Style‟. In 1999 Summer Study Proceedings, European Council for an
Energy Efficient Economy [online]. Available at URL:
http://www.eceee.org/conference_proceedings/eceee/1999/Panel_3/p3_7/Pape
r/ [accessed 20.02.2007].
Jelsma, J. (2004). „The Engineering approach and Social Aspects of Energy Use: Mind the
Gap, but Can It Be Closed?‟ In 2004 Summer Study Proceedings, American
Council for an Energy Efficient Economy [online], pp. 147-160. Available at
URL:
http://www.eceee.org/conference_proceedings/ACEEE_buildings/2004/Panel_7
/p7_13/ [accessed 20.7.2007].

386
Kang, M. H. (2002). „Digital Cable: Exploring Factors Associated With Early Adoption‟.
Journal of Media Economics, Vol. 15, No. 3, pp. 193–207.
Kauffman, R. J. and Techatassanasoontorn, A. A. (2009). „Understanding early diffusion of
digital wireless phones‟. Telecommunications Policy, Vol. 33, pp. 432-450.
King, N. (2007). Template Analysis, [online]. Available at URL:
http://www.hud.ac.uk/hhs/research/template_analysis/ [accessed 10.10.2007].
Kirwan, K. L. (2008). Social-psychological aspects of domestic renewable energy: A study
of low-income tenants‟ responses to solar photovoltaics. PhD thesis. Leicester:
De Montfort University (UK).
Klöckner, C. A. and Matthies, E. (2004). „How habits interfere with norm-directed
behaviour: A normative decision-making model for travel mode choice‟. Journal
of Environmental Psychology, Vol. 24, pp. 319–327.
Kofod, C. (2008). Report D8 Measurement Campaigns: End Use Recording in the
Residential Sector. Residential Monitoring to Decrease Energy Use and
Carbon Emissions in Europe (REMODECE) [online]. Available at URL:
http://www.isr.uc.pt/~remodece/downloads/downloads.htm [accessed
20.11.2009].
Kollmuss, A. and Agyeman, J. (2002). „Mind the Gap: why do people act environmentally
and what are the barriers to pro-environmental behaviour?‟ Environmental
Education Research, Vol. 8, No. 3, pp. 239-260.
Krippendorff, K. (2004). Content analysis: an introduction to its methodology, 2nd edition.
London: Sage.
Kvale, S. (1994). „Ten Standard Objections to Qualitative Research Interviews‟. Journal of
Phenomenological Psychology, Vol. 25, No. 2, pp. 147-173.
Lebot, B., Lopes, C., Waide, P. and Sidler, O. (1997). „Lessons Learnt from European
Metering Campaigns of Electrical end uses in the Residential Sector‟. In 1997
Summer Study Proceedings, European Council for an Energy Efficient
Economy [online]. Available at URL:
http://test.eceee.org/library_links/proceedings/1997/pdf97/97p4-82.pdf
[accessed 20.02.2007].

387
Legris, P. Ingham, J. and Collerette, P. (2003). „Why do people use information
technology? A critical review of the technology acceptance model‟. Information
and Management, Vol. 40, pp. 191-204.
Lindenburg, S. and Steg, L. (2007). „Normative, Gain and Hedonic Goal Frames Guiding
Environmental Behavior‟. Journal of Social Issues, Vol. 63, No. 1, pp. 117-137.
Lopes, C., Waide, P., Siddler, O. and Lebot, B. (1997). „Guidelines for the Conduct of
Monitoring Campaigns: A Technological and Behavioural Approach‟. In 1997
Summer Study Proceedings, European Council for an Energy Efficient
Economy [online]. Available at URL:
http://www.eceee.org/conference_proceedings/eceee/1997/Panel_2/p2_17/Pap
er/ [accessed 20.02.2007].
Lutzenhiser, L. (1993). „Social and Behavioural Aspects of Energy Use‟. Annual Review
Energy and Environment, Vol. 18, pp. 247-289.
Maréchal, K. (2009). „The crucial role of habits in energy consumption: an evolutionary
approach on changing current patterns‟. In 2009 Summer Study Proceedings,
European Council for an Energy Efficient Economy, pp. 1693-1703.
Marjanovic, L., Coleman, M. J., Bruhns, H., Summerfield, A. and Wright, A. (2008).
„Appliances Taxonomy across both Domestic and Non-domestic Building
Sectors‟. ASHRAE Transactions, Vol. 114, Part 1.
Martiskainen, M (2007) Affecting consumer behaviour on energy demand. Final report to
EdF Energy [online]. Available at URL:
http://www.sussex.ac.uk/sussexenergygroup/documents/seg_consumer_behavi
our_final_report.pdf [accessed 17.08.2008].
McAllister, J. A. and Farrell, A. E. (2007). „Electricity consumption by battery-powered
consumer electronics: A household-level survey‟. Energy, 32, pp. 1177-1184.
McDougall, G. H. G., Claxton, J. D., Ritchie, J. R. B. and Anderson, C. D. (1981).
„Consumer Energy research: A Review‟. Journal of Consumer Research, Vol.
8, pp. 343-354.
Meade, N., and Islam,T. (2006). „Modeling and forecasting the diffusion of innovation: A
25-year review‟. International Journal of Forecasting, Vol. 22, No. 3, pp. 519-
545.

388
Meier, A., Lin, J., Liu, J. and Li, T. (2004). „Standby power use in Chinese homes‟. Energy
and Buildings, 36, pp. 1211-1216.
Meier, A. K. and Nordman, B. (2002). „The Power Control User Interface Standard:
Consultant Report P500-03-012F‟. LBLN for California Energy Commission
[online]. Available at URL: http://eetd.lbl.gov/Controls/publications/P500-03-
012F.pdf [accessed 25.11.2009].
Midden, C. J. H., Kaiser, F. G. and McCalley, T. (2007). „Technology‟s Four Roles in
Understanding Individuals, Conservation of Natural Resources‟. Journal of
Social Issues, Vol.63, No. 1, pp. 155-174.
Moreau, L. and Wilbrin, A. (2005). „Energy-related practices, representations and
environmental knowledge: A sociological study‟. In 2005 Summer Study
Proceedings, European Council for an Energy Efficient Economy [online].
Available at URL:
http://www.eceee.org/conference_proceedings/eceee/2005c/Panel_6/6104mor
eau/ [accessed 20.2.2007].
MTP (Market Transformation Programme) (2006a). Sustainable Products 2005 Policy
Analysis and Projections (updated 2006) [online]. Available at URL:
http://www.mtprog.com/ReferenceLibrary/MTP_Sustainable_Products_2005_u
pdated_26_1_06.pdf [accessed 25.06.2007].
MTP (Market Transformation Programme) (2006b). Monitoring Home Computers, Report
ID: RPICT01/06 [online]. Available at URL:
http://www.mtprog.com/ReferenceLibrary/RPICT01_06_Use_of_home_PCs_FI
NAL.pdf [accessed 02.01.2007].
MTP (Market Transformation Programme) (2008a). Policy Analysis and Projections
2006/08 [online]. Available at URL:
http://www.mtprog.com/spm/files/download/byname/file/10_07_08%20PA&P%2
008%20v1.pdf [accessed 20.05.2008].
MTP (Market Transformation Programme) (2008b). BNICT01: Underlying assumptions for
non-domestic information and communication technology (ICT): Version 2.0
[online]. Available at URL:
http://www.mtprog.com/spm/download/document/id/568 [accessed 20.02.2009].

389
MTP (Market Transformation Programme) (2009a). About MTP [online]. Available at URL:
http://www.mtprog.com/cms/about-mtp-background/#how_funded [accessed
20.08.2009].
MTP (Market Transformation Programme) (2009b). BNXS36: Estimated UK standby
electricity consumption in 2006 version 2.5 [online]. Available at URL: http://
http://www.mtprog.com/spm/download/document/id/784 [accessed 22.03.2008].
MTP (Market Transformation Programme) (2009c). BNCE TV02: Televisions (TVs)
Government Standards Evidence Base 2009: Reference Scenario Version 1.0
[online]. Available at URL: http://efficient-products.defra.gov.uk/cms/product-
strategies/subsector/consumer-electronics [accessed 06.10.2010].
Nakagomi, C., Ohashi, H., Tanaka, A. and Nakagami H. (2001). „Energy consumption
measurement survey for commercial buildings in Japan - The existence of
stand-by electricity.‟ In 2001 Summer Study Proceedings, European Council
for an Energy Efficient Economy. Vol. 2, pp. 29-31 [online]. Available at URL:
http://www.eceee.org/conference_proceedings/eceee/2001/ [accessed
20.2.2007].
Newborough, M. and Augood, P. (1999). „Demand-side management opportunities for the
UK domestic sector‟ [online]. In IEE Proceedings Generation, Transmission,
Distribution. Vol. 146, No. 3, May 1999. Available at URL:
http://ieeexplore.ieee.org/iel5/2195/17187/00790574.pdf?tp=&arnumber=79057
4&isnumber=17187 [accessed 18.10.2007].
Nordman, B. and McWhinney, M. (2006). Electronics Come of Age: A Taxonomy for
Miscellaneous and Low Power Products. Lawrence Berkeley National
Laboratory, LBNL-63559.
Nordman, B., Meier, A., Siderius, H., Harrington, L. and Ellis, M. (2009). „Network
connectivity and low-power mode energy consumption‟. In Energy Efficiency in
Domestic Appliances and Lighting: Proceedings of the 5th International
Conference EEDAL ‟09, 16-18 June 2009, Berlin. Luxemburg: European
Union.

390
NRPB (National Radiological Protection Board) (2004). „Mobile Phones and Health 2004‟.
Documents of the NRPB, Vol. 15, No. 5 [online]. Available at URL:
http://www.hpa.nhs.uk/webw/HPAweb&HPAwebStandard/HPAweb_C/1254510
624582?p=1219908766891 [accessed 14/7/2007].
ONS (Office for National Statistics) (2008). Harmonised Concepts and Questions for
Social Data Sources – Primary Standards: Demographic Information,
household composition and relationships [online]. Available at URL:
http://www.statistics.gov.uk/about/data/harmonisation/downloads/P2.pdf
[accessed 08.06.2008].
ONS (Office for National Statistics) (2009a). General Household Survey 2007: Definitions
and terms – Appendix A [online]. Available at URL:
http://www.statistics.gov.uk/STATBASE/Product.asp?vlnk=5756 [accessed
05.11.2010].
ONS (Office for National Statistics) (2009a). GH07 chapter3 – households (Excel tables)
[online]. Available at URL:
http://www.statistics.gov.uk/STATBASE/Product.asp?vlnk=5756 [accessed
05.11.2010].
ONS (Office for National Statistics) (2009c). General Household Survey 2007: Overview
Report [online]. Available at URL:
http://www.statistics.gov.uk/STATBASE/Product.asp?vlnk=5756 [accessed
05.11.2010].
Owen, P. (2006). The Rise of the Machines. London: Energy Saving Trust.
Owen, P. (2007). The ampere strikes back. London: Energy Saving Trust.
Owen, G. and Ward, J. (2006). Smart Meters: Commercial, Policy and Regulatory Drivers.
London: Sustainability First.
Owens, S. and Driffill, L. (2008). „How to change attitudes and behaviours in the context of
energy‟. Energy Policy, Vol. 36, pp. 4412–4418.
Paré, G. and Elam, J. J. (1995) „Discretionary use of personal computers by knowledge
workers: testing of a social psychology theoretical model‟. Behaviour and
Information Technology, Vol. 14, No. 4, pp. 215-228.

391
Payne, C. and Meier, A. (2004). „Many Small Consumers, One Growing Problem:
Achieving Energy Savings for Electronic Equipment Operating in Low Power
Modes‟. In proceedings 2004 ACEEE Summer Study on Energy Efficiency in
Buildings [online]. Available at URL:
http://www.osti.gov/bridge/servlets/purl/833994-mrnSCZ/native/ [accessed
15.10.2009].
Pooley, J. and O‟Connor, M. (2000). „Environmental Education and Attitudes: Emotions
and Beliefs Are What Is Needed‟. Environment and Behavior, Vol. 32, No. 5,
pp. 711-723.
Poortinga, W., Steg, L. and Vlek, C. (2004). Values, Environmental Concern, and
Environmental Behavior: A study Into Household Energy Use. Environment
and Behavior, Vol. 36, No. 1, pp. 70-93.
Rainer, L., Meier, A. and Greenberg S. (1996). „Leaking Electricity in Homes.‟ In
Proceedings of the 1996 ACEEE Summer Study on Energy Efficiency in
Buildings, Pacific Grove, CA.
RCEP (Royal Commission on Environmental Pollution) (2000). Energy – The Changing
Climate [online]. Available at URL: http://www.rcep.org.uk/newenergy.htm
[accessed 16.05.2007].
Reber, A.S. and Reber, E. S. (2001). The Penguin Dictionary of Psychology, 3rd edition.
London: The Penguin Group.
Reckwitz, A. (2002). „Toward a Theory of Social Practices: A Development in Culturalist
Theorizing‟. European Journal of Social Theory, Vol. 5, No.2, pp. 243-63.
Reeves, A. (2009). Achieving deep carbon emission reductions in existing social housing:
the case of Peabody. PhD thesis. Leicester: De Montfort University (UK).
REMODECE (2008). REMODECE Questionnaire Survey: D5 [online]. Available at URL:
http://www.isr.uc.pt/~remodece/downloads/downloads.htm [accessed
20.11.2009].
Robson, C. (2002). Real World Research. Oxford: Blackwell Publishing.
Rogers, E. M. (2003). Diffusion of Innovations, 5th edition. New York: The Free Press.
Rogers, E. M. and Shoemaker, F. (1971). Communication of Innovations: A Cross Cultural
Approach. New York: Free Press.

392
Ross, J. P. and Meier A. (2000). „Whole-House Measurements of Standby Power
Consumption‟ [online]. In Second International Conference on Energy
Efficiency in Household Appliances, Naples, Italy, 2000. Available at URL:
http://eetd.lbl.gov/ea/reports/45967.pdf [accessed 07.10.2009].
Røpke, I., Christensen, T. H., and Jensen, J. O. (2010). „Information and communication
technologies – A new round of household electrification‟. Energy Policy, Vol.
38, pp. 1764–1773.
Schatzki, T. (1996). Social Practices: A Wittgensteinian Approach to Human activity and
the Social. Cambridge: Cambridge University Press.
Schlomann, B., Cremer, C., Friedewald, M., Georgieff, P., Gruber, E., Corradini, R., Kraus,
D., Arndt, U., Mauch, W., Schaefer, H., Schulte, M., Schröder, R. (2005).
Technical and legal application possibilities of the compulsory labelling of the
standby consumption of electrical household and office appliances. Summary
of the final report to the German Federal Ministry of Economics and
Technology. Fraunhofer ISI, Research Institute for Energy Economcy (FfE),
Dresden University of Technology. Karlsruhe, Munich, Dresden.
Seligman, C., Darley, J. M. and Becker, L. J. (1978). „Behavioural Approaches to
Residential Energy Conservation‟. Energy and Buildings, Vol. 1, No. 3, pp.
325-337.
Shove, E. and Pantzar, M. (2005). „Consumers, Producers and Practices: Understanding
the invention and reinvention of Nordic walking‟. Journal of Consumer Culture,
Vol. 5, No. 1, pp. 43-64.
Siderius, H., Harrison, B., Jäkel, M. and Viegand, J. (2006). „Standby: The Next
Generation. In Energy Efficiency in Domestic Appliances and Lighting:
Proceedings of the 4th International Conference EEDAL ‟06, 21-23 June 2006,
London. Luxembourg: European Communities.
Sidler, O. (1995). Demand-Side Management End-Use Metering Campaign in the
Residential Sector: Final Report. Luxembourg: European Community SAVE
Programme.
Sidler, O. (1998). Demand-Side Management: Experimental Study of highly efficient
Electrical Appliances in Household Use. Luxembourg: European Commission.

393
Sidler, O. (2000). „Campagne de Mesures sur le Fonctionnement en Veille des Appareils
Domestiques‟. ADEME, Sophia-Antipolis, France. Report No. 99.07.092.
January.
Sidler, O (2003). „DSM: major findings of an end-use metering campaign in 400
households of four European countries. In 2002 Summer Study Proceedings,
European Council for an Energy Efficient Economy [online]. Available at URL:
http://www.eceee.org/conference_proceedings/eceee/2003c/Panel_2/2168sidle
r/ [accessed 12.09.2007].
Silverman, D. (2006). Interpreting Qualitative Data, 3rd edition. London: Sage Publications.
Socolow, R. H. (1978). „The Twin Rivers program on energy conservation in housing:
Highlights and conclusions‟. Energy and Buildings, Vol. 1, No. 3, pp. 207-242.
Staats, H. (2003). „Understanding Proenvironmental Attitudes and Behavior: An Analysis
and Review of Research Based on the Theory of Planned Behavior‟. In M.
Bonnes, T. Lee and M. Bonaiuto (eds), Psychological Theories for
Environmental Issues, Aldershot: Ashgate Publishing, pp. 171-201.
Steg, L. and Vlek, C. (2009). „Encouraging pro-environmental behaviour: An integrative
review and research agenda‟. Journal of Environmental Psychology, Vol. 29,
pp. 309-317.
Steg, L. (2008). „Promoting household energy conservation‟. Energy Policy, Vol. 36, pp.
4449-4453.
Stern, P. C., Dietz, T. and Guagnano, G. (1995). „The new ecological paradigm in social-
psychological context‟. Environment and Behavior, Vol. 27, No. 6, pp. 723-743.
Stern, N. (2007). The Economics of Climate Change: The Stern Review [online].
Available at URL: http://www.hm-
treasury.gov.uk/independent_reviews/stern_review_economics_climate_
change/stern_review_report.cfm [accessed on 17.08.2008].
Stern, P. C. (2000). „Toward a Coherent Theory of Environmentally Significant Behavior‟.
Journal of Social Issues, Vol. 56, No. 3, pp. 407-424.
Stobbe, L. (2007a) EuP Preparatory Studies “Televisions” (Lot 5) Final Report on Task 8
“Economic and Market Analysis”. Available at URL:
http://www.ecotelevision.org/ [accessed 10.08.2009].

394
Stobbe, L.(2007b). EuP Preparatory Study, Lot 6, “Standby and Off-mode Losses”, Final
Report. Available at URL: http://www.ecostandby.org/documents.php [accessed
10.08.2009].
Stobbe, L. (2007c) EuP Preparatory Studies “Televisions” (Lot 5) Final Report on Task 8
“Scenario, Policy, Impact, and Sensitivity Analysis”. Available at URL:
http://www.ecotelevision.org/ [accessed 10.08.2009].
Stobbe, L. (2007d) EuP Preparatory Studies “Televisions” (Lot 5) Final Report on Task 5
“Definition of Base Cases”. Available at URL: http://www.ecotelevision.org/
[accessed 10.08.2009].
Stobbe, L. (2007e) EuP Preparatory Studies “Televisions” (Lot 5) Final Report on Task 3
“Consumer Behaviour and Local Infrastructure”. Available at URL:
http://www.ecotelevision.org/ [accessed 10.08.2009].
Strang, V. (1997). „Contextualising values and behaviour‟. In 1997 Summer Study
Proceedings, European Council for an Energy Efficient Economy [online].
Available at URL:
http://test.eceee.org/library_links/proceedings/1997/pdf97/97p4-67-B.pdf
[accessed 12.09.2007].
Tait, J. (2009). „Working with retailers to push beyond EuP compliance: Some different
approaches used, and options for international strengthening'. In Energy
Efficiency in Domestic Appliances and Lighting: Proceedings of the 5th
International Conference EEDAL ‟09, 16-18 June 2009, Berlin. Luxemburg:
European Union.
Tashakkori, A. and Teddlie, C. (1998). Mixed methodology: Combining qualitative and
quantitative approaches. Thousand Oaks: Sage Publications Inc.
Thompson, R. L., Higgins, C. A. and Howell, J. M. (1991). „Personal computing: toward a
concept model of utilization‟. MIS Quarterly, Vol. 15, pp. 125-143.
Thøgerson, J. and Grønhøj, A. (2010). „Electricity saving in households – A social
cognitive approach‟. Energy Policy, doi:10.1016/j.enpol.2010.08.025.
TIAX LLC (2007). U. S. Residential Information Technology Energy Consumption in 2005
and 2010. USA: TIAX LLC.

395
Triandis, H. C. (1977). Interpersonal Behavior. California: Wadsworth Publishing
Company, Inc.
Triandis, H. C. (1980). „Values, attitudes, and interpersonal behavior‟. In H. E. Howe and
M. M. Page (eds.), Nebraska Symposium on Motivation 1979, pp. 195-259.
Lincoln: University of Nebraska Press.
Turner, R. (2009). „Energy efficiency trends in STBs‟. In Energy Efficiency in Domestic
Appliances and Lighting: Proceedings of the 5th International Conference
EEDAL ‟09, 16-18 June 2009, Berlin. Luxemburg: European Union.
UNFCCC (United Nations Framework Convention on Climate Change) (2008). Kyoto
Protocol [website]. Available at URL:
http://unfccc.int/kyoto_protocol/items/2830.php [accessed 17.09.2007].
Uzzell, D. and Räthzel, N. (2009). „Transforming environmental psychology‟. Journal of
Environmental Psychology, Vol. 29, pp. 340–350.
Valois, P., Desharnais, R. and Godin, G. (1988). „A comparison of the Fishbein and Ajzen
and Triandis attitudinal models for the prediction of exercise intention and
behaviour‟. Journal of Behavioral Medicine, Vol.11, No.5, pp. 459-472.
Verplanken, B., Aarts, H. and Van Kippenberg, A. (1997). „Habit, information acquisition,
and the process of making travel mode choices‟. European Journal of Social
Psychology, Vol. 27, pp. 539-560.
Vowles, J., Boardman, B. and Lane, K. (2001). „Suspecting standby? Domestic levels and
the potential for household-level reductions in the UK. In 2001 Summer Study
Proceedings, European Council for an Energy Efficient Economy [online].
Available at URL: http://www.eceee.org/conference_proceedings/ [accessed
12.09.2007].
Wall, R. (2006). Psychological and Contextual Influences on Travel Mode Choice for
Commuting. PhD thesis. Leicester: De Montfort University (UK).
Wall, R. and Crosbie, T. (2009). „Potential for reducing electricity demand for lighting in
households: An exploratory socio-technical study‟. Energy Policy, Vol. 37, No.
3, pp. 1021-1031.
Warde, A. (2005). „Consumption and Theories of Practice‟. Journal of Consumer Culture,
Vol. 5, No. 2, pp. 131-153.

396
Watson, N. (2009). Details of the Digital Living appliance monitoring system electricity load
and WGM calibration curve [email]. (Personal communication, May 2009).
Welling, D. (2010). Turn off your TV from anywhere with EDF gadget [online]. (Updated
21.9.2010). Available at URL: http://www.energychoices.co.uk/turn-off-your-tv-
from-anywhere-with-edf-gadget-210910.html [accessed 27.10.2010].
Wheater, C. P. and Cook, A. (2000). Using Statistics to Understand the Environment.
London: Routledge.
Wilhite, H., Nakagami, H., Masuda T. and Yamaga, Y. (1996). „A cross-cultural analysis of
household energy use behaviour in Japan and Norway‟. Energy Policy, Vol.
24, No. 9, pp. 795-803.
Wilk, R. and Wilhite, H. (1986). „Why Don‟t People Weatherize Their Homes? An
Ethnographic Solution‟. In Energy Efficiency: Perspectives on Individual
Behavior, (eds) W. Kempton and M. Neima. Washington, DC and Berkeley:
American Association for an Energy Efficient Economy.
Winzenberg, T. and Higginbotham, H. (2003). „Factors affecting the intention of providers
to deliver more effective continuing medical education to general practitioners:
a pilot study‟. BMC Medical Education, Vol. 3, No. 11.
Wood, G. and Newborough, M. (2003). Dynamic energy-consumption indicators for
domestic appliances: environment, behaviour and design. Energy and
Buildings, Vol. 35, pp. 821–841.
Zimmerman, J. P. (2009). End-use metering campaign in 400 households in Sweden:
Assessment of the Potential Electricity Savings. ENERTECH: Contract 17-05-
2743.

397
Appendices
This section contains background and supportive information that are relevant to this study
and have been referred to within the thesis chapters. The contents are as follows:
Appendix A: Details of electricity consumption monitoring equipment
Appendix B: Appliance Monitoring System (AMS) tests
Appendix C: AMS installation
Appendix D: Interview schedule
Appendix E: Final interview analysis template
Appendix F: Socio-demographic questionnaire
Appendix G: Study sample‟s ICE appliance ownership
Appendix H: Average appliance electricity consumption values
Appendix I: Raw total ICE appliance electricity consumption data
Appendix J: Percentage of ICE appliance electricity consumption from
appliance types active and total standby power modes
Appendix K: Average household durations of ICE appliance use

398
Appendix A: Details of electricity consumption monitoring
equipment
A.1 Elcomponent SPCmini current clamp logger
Whole house electricity consumption data were collected with a SPCmini single channel
current logger manufactured by Elcomponent Ltd (shown in Figure A-1).
Figure A-1 Current clamp logger (Elcomponent, 2006 pi)
The SPCmini comes with dedicated utility software (PowerPackPro), which provides
communication, set up and data presentation capabilities on a PC. Thus, the software
provides the interface to set the logger‟s clock settings, survey period and logging interval
(prior to activation of the logger at the installation site) and retrieve the electricity
consumption data. Communication between the logger and a PC is achieved via a
Bluetooth connection (Elcomponent, 2007; Elcomponent, 2006).
The SPCmini logger was selected, because it provided a relatively low cost method to gain
accurate whole house electricity consumption data. Table A-1 below shows the

399
specification of the SPCmini logger, which has a measurement accuracy of +/- 1%. The
device had the advantage, over other potential equipment, of being relatively easy to use.
The logger was simply clipped around the neutral phase of the dwelling‟s mains electricity
supply and then activated with a button. This reduced installation time and health and
safety concerns, by circumventing the need to significantly interfere with live electricity
supply directly. As with the appliance monitoring system, the electricity consumption
measurements were recorded at 5 minutely logging intervals.
Table A-1 Summary of the current clamp logger specifications (Elcomponent, 2007)
Specification: SPCmini current clamp logger
Connection Single Channel Current Logger
Measured parameters Amps: 2 scales (autoranging)
20A, 200A, 500A
Derived parameters kW, kWh, Cost
Accuracy +/- 1% of measurement
+/- 0.5% of scale
Storage rate (logging interval) 1 second to 30 minutes
Storage capacity 1 minute for 1 month (45000 records)
Memory Flash (non-volatile)
Software PowerPackPro

400
A.2 Digital Living Residential Appliance Monitoring System (AMS)
ICE appliance electricity consumption measurements were recorded with an energy
monitoring system developed by Digital Living. The AMS consists of four distinct types of
devices, which are described below.
A.2.1 AMS: Hardware
The Tridium JACE is the gateway controller for the data recording system (shown in Figure
A-2). The JACE controls the overall transfer and storage and of the data. The JACE is
connected to up to 20 White Goods Monitors (WGM). The WGMs (shown in Figure A-3)
are electricity consumption loggers, manufactured by Horstmann Controls PLC, which can
be placed into a three pin mains socket and allow an electrical appliance to be plugged
into them. The JACE gateway polls the WGMs at five minutely intervals to initiate the
transfer of the electricity consumption measurements recorded by the WGMs. This data is
stored in the JACE‟s solid state memory (Digital Living, 2007).
Figure A-2 JACE Gateway (Digital Living p6)

401
Figure A-3 WGM
The WGMs transfer data via a Power Line Carrier connection (i.e. through the dwellings
ring mains), using a LONWORKS communication protocol. To facilitate the
communication between the JACE gateway and the WGMs, a LON Converter is used to
process the LONWORKS signal (shown in Figure A-4 and A-5).
Figure A-4 LON Converter (Digital Living, 2007 p10)

402
Figure A-5 LON Converter (Digital Living, 2007 p10)
In the event that a poll is unsuccessful, a number of re-tries are made by the JACE, until
data has been transferred successfully. The time of each poll is recorded, so that time-
stamped incremental electricity consumption data is collected from each WGM (and
therefore each individual appliance). Each WGM also has a “Re-set” button, which is
configured to test whether the WGMs are communicating with the JACE gateway (when
the button is pressed, a LED indicator flashes on the LON Converter) (Digital Living,
2007).
If less than the twenty WGMs are required for a particular installation, an interface with the
JACE gateway is accessible (via a laptop computer taken to the installation site), so that
spare WGMs could be set to an “inactive” status. This improves the efficiency of the
systems communications, by preventing the JACE gateway from attempting to poll data
from a WGM that is not connected to the system. This feature of the AMS is important,
because it also means that all the WGMs in use, must remain in active sockets to ensure
continued communication (i.e. the socket switch must be on, as shown in A-3). If a WGM
is disengaged from the system (either by being unplugged or the socket being switched
off) the efficiency of the AMSs polling process can be compromised, due to the JACE
gateway continuously searching for the inactive WGM. This can cause fluctuations in the
logging interval (Digital Living, 2007).

403
Each systems JACE gateway is connected to a GSM Modem (see Figure A-6), which was
configured to allow data to be transferred daily, via a GSM telecommunications network, to
a central database server hosted by Digital Living (for this research the O2 GSM network
was used due to its wider coverage of the UK). The JACE gateway has solid state
technology and the capacity to store around four days of data from twenty WGMs. Thus,
in the event of the loss of GSM communications, or power failure to the JACE gateway,
there is a reasonable window to regain a GSM connection or retrieve data.
Figure A-6 GSM Modem (Digital Living, 2007 p11)
A.2.2 The back-end system
The data is stored on the Digital Living server in a MySQL database. To facilitate the
identification of data in the MySQL database, Digital Living created a user interface that is
accessible via the Internet (shown in Figure A-7). The interface allows details of the
location of each installation (and the appliances monitored) to be recorded and access to
previous records in the MySQL database. To ensure households complete anonymity, the
location field was simply a number, with the prefix “Dwelling” (e.g. Dwelling 001, Dwelling
002, etc). The resultant MySQL tables tally this information with the electricity
consumption readings, making it easier to perform queries and export data (Figure A-8)
shows the view of data recorded for an AMS test).

404
Figure A-7 Digital Living interface (Digital Living, 2007 p13)
Figure A-8 MySQL database screen accessed through phpMyAdmin

405
A.2.3 AMS characteristics
The measurement characteristics of the AMS are subject to the specification of the WGMs
(summarised in Table A-2).
A-2 Summary of WGM specifications (Digital Living, 2007)
Specification Description
Dimensions Height: 125mm
Width: 65mm
Depth: 60mm
Weight 0.25Kg
Mounting The unit plugs into a 13 amp (UK) electrical socket.
Operating voltage 220V (-20%, +25%)
Accuracy BS EN 62053-21 Class 2 (+/-2%)
Resolution 1 Watt Hour
Communication LONWORKS.
Conforms to CENELEC (European Committee for Electrical Standardisation) EN 50065: Power-Line Carrier signalling.
Primary frequency: 132.5 kHz; Secondary frequency 120.0 kHz
Overall burden 0.25 W

406
Appendix B: Appliance Monitoring System (AMS) tests
B.1 IESD controlled test
To assess the suitability of the AMS a controlled study was conducted at the Institute of
Energy and Sustainable Development (IESD). Due to delays in the manufacture of the
AMS, and the configuration of its AMS software, a „prototype‟ system was initially delivered
by Digital Living, which used a broadband connection rather than the GMS Modem to
transfer data. Therefore, the GSM communication could not be investigated.
Nevertheless, the test enabled a range of office appliances including, desktop computers,
monitors, a printer and a microwave oven and fridge-freezer in the IESD office kitchen, to
be monitored. The monitoring took place for a period of fourteen days, from 4th July 2007
until the 17th July 2007, and identified a number of issues.
Initially, inconsistent five minutely polling made it impossible to capture detailed patterns of
appliance use and the electricity consumption from different power modes. Figure B-1
shows the variance in logging intervals that occurred for a desktop computer. Thus, there
was concern that the AMS was not operating correctly. Subsequent tests by Digital Living
identified that mainsborne interference, from other electrical activities in the building, had
the potential to disrupt the LONWORKS signal. Critically, domestic appliances, such as
microwave ovens and touch-lamps, could cause “noise” within the ring mains and interfere
with the system‟s LONWORKS communication. This was a particular concern due to the
high ownership of microwave ovens in UK homes.

407
Figure B-1 Logging intervals during the IESD test for a desktop computer
During the test, one of the WGMs was disconnected from the mains supply, due to a
member of staff switching off a plug socket. This resulted in a large measurement error
being recorded when the WGM was reactivated (a negative value shown in Table B-1).
Following contact with the manufacturers it was discovered that this was due to an
operational feature of the WGM. Each WGM acts like a small electricity meter, with
electricity consumption being recorded in incremental measurements of 1 Wh (as opposed
to kWh on a household electricity meter). Within each WGM a running register of the total
electricity consumption measured by the WGM is saved in an Electrically Erasable
Programmable Read-Only Memory (EEPROM). Thus, the starting value of a WGM, for a
new installation, will be that of the final value from the proceeding installation. However,
the EEPROM has a limited write cycle, so the total register is saved every 100 Wh. If a
WGM is deactivated and then reactivated, it will resume its measurements from the last
saved 100 Wh register and can inadvertently indicate a negative energy consumption of
up to 100 Wh.
00:00
01:30
03:00
04:30
06:00
07:30
0 100 200 300 400 500 600
Tim
e In
terv
al (h
ou
rs)
Reading No.

408
Table B-1 Energy consumption data from a WGM deactivated overnight
Time_Stamp w_Value (kWh) *Energy (kWh)
05/07/07 17:30:51 0.995000 0.004
05/07/07 17:41:08 1.005000 0.01
05/07/07 17:45:46 1.010000 0.005
06/07/07 09:12:40 0.932000 -0.078
06/07/07 09:16:52 0.932000 0
06/07/07 09:21:35 0.937000 0.005
06/07/07 09:26:19 0.941000 0.004
*shows energy consumption that occurred since previous timestamp
Further tests by Digital Living suggested that the inconsistent polling had resulted from
mainsborne interference and potentially from the deactivated WGMs disrupting the polling
process. A number of solutions were recommended: (i) the acquisition of filter plugs to
reduce mains bourn interference; (ii) ensuring all WGMs remained active.
B.2 Domestic tests
Tests with six WGMs were conducted the homes of IESD staff. The first of these took
place between 16th and 22nd August 2007, but was cut short due to difficulties with the
GSM connection. The test at this home was resumed, between 12th and 20th September
2007, when Digital Living discovered that the activation of the GSM Modem, 5 minutes
prior to the activation of the JACE gateway, secured a connection. This was against the
equipment manufacturers instructions. The results from this test were encouraging, as the
AMS polled more consistently (this was attributed to the use of a plug-in mains filter).
However, the maintenance of the GSM connection remained a problem, which was
believed to be due to poor network coverage.
To deal with this problem, higher gain antennas were purchased for the GSM Modems,
which were capable of accommodating weaker GSM signals. These were tested at the
researcher‟s home (which was known to receive a poor GSM signal) between 20th Nov
2007 and 4th Dec 2007 and 14th and 20th Jan 2008. To assist in the installation process, a
mobile telephone was used to assess the strength of the GSM signal within the dwelling.
The positioning of the AMS, and the antenna, was selected by finding the strongest signal.

409
The results of these tests were encouraging. GSM connection was maintained and the
system provided consistent five minutely polling.
A further issue related to the physical dimensions of the WGMs (i.e. a WGM‟s casing can
protrude below the mains socket). In many older dwellings (where the wiring of the ring
mains occurred before regulations to fix sockets 0.3 metres above floor level), mains
sockets are often located close to floor level, which prevents a WGM from being directly
inserted into sockets. Therefore, plug extension leads were used to manage this problem.
Plug extension leads were also required in most installations due to households frequently
connecting groups of appliances to one mains socket (e.g. television, STB, DVD player,
VCR). As a result, up to four WGMs were connected through the same extension lead.
This did not have any adverse affects on the data recorded.
A final domestic test was conducted at an IESD staff member‟s home between 22nd
February and 3rd March 2008. This ten day test was undertaken to further test the
monitoring equipment and the overall procedures developed for the research. To an extent
this was considered as the first pilot for the AMS, with all the ICE appliances in the
household being monitored under the final study conditions. The results provided
invaluable data for the development of the analytical procedures and techniques used in
this research, but there were continued problems with the AMS‟s ability to provide
consistent five minutely logging intervals. Most intervals exceeded ten minutes and many
exceeded one hour. Despite it being possible to observe general patterns of appliance
use, it was impossible to allocate electricity consumption to standby power modes with any
certainty.
Work by Digital Living found that any interruption in the polling process between the JACE
gateway and a particular WGM, led to the interruption of the system‟s entire polling
process. Therefore, Digital Living developed a new polling protocol, whereby in the event
that data were not transferred immediately by a WGM, three retries were initiated. If the
retries were unsuccessful the JACE gateway would request the data at the following
scheduled interval. Although this protocol resulted in the occasional ten minutely logging
interval, it radically improved the efficiency of the systems polling. This led to a very

410
significant reduction in the disparity of the logging intervals. Thus, subsequent installations
of the AMS achieved consistent five minutely logging intervals, which enabled this thesis
research to proceed. Table B-2 summaries key problems encountered.
Table B-2 Summary of issues identified from AMS tests
Problem Description Solution
Energy measurement resolution
The ability of the AMS to monitor low power modes was limited due to the WGMs having a 1 Wh resolution. This resulted in zero energy readings for some timestamps when in actuality, low power electricity consumption was occurring.
Data analysis techniques were developed.
Inconsistent 5 minutely polling from WGMs.
Intervals varied across all appliances monitored from as little as two minutes to a number of hours. These long delays presented a significant problem as it is would be impossible to identify detailed patterns of use in the different power modes.
A new polling protocol was developed by Digital Living.
Ensure that WGMs remained in an active socket.
Mains borne interference.
Tests identified that the use of other electrical appliances, such as touch-lamps, microwave ovens (even when not in active use), had the potential to disrupt the integrity of the mains supply and disturb the polling process. The widespread use of microwave ovens in UK homes made this a significant problem.
The use of plug-in filters with each AMS. These were situated close to potentially interfering appliances, such as microwave ovens.
Measurement error
It was identified that the disconnection of a WGM would produce a large negative reading and could cause disturbance to the polling of other WGMs.
The only solution was to ensure that WGMs remained in an active socket. To help achieve this, an information guide was produced for householders as well as a demonstration at the installation.
Physical dimensions of the WGMs.
The WGMs casing protrudes below the mains socket, which makes it impossible to insert the logger into mains sockets situated close to floor level.
Mains socket extension leads were used.
GSM connection failure
In initial tests GSM connection was restricted, due to poor network coverage or failure to get the JACE gateway to recognise the GSM Modem.
Using a new installation procedure ensured that the JACE fully recognised the GSM Modem.
The acquisition of more efficient antennas enabled the AMS to maintain a GSM connection in areas with weaker network coverage.

411
B.3 AMS accuracy tests
Accuracy can be defined as the “closeness of agreement between a test result and the
accepted reference value” (AMC, 2003 p1). Thus, an electricity consumption
measurement of high accuracy has a small error. The error of a measurement is the
“result of a measurement minus the true value of the measurand [a quantity subject to
measurement]” (AMC, 2003 p1). Error is comprised of (i) random error – an element of
the error in a series of results that varies unpredictably; (ii) systematic error – an element
of the error in a series of results that is constant or varies in an expected way (AMC,
2003).
The electricity consumption measurements gained by the AMS are subject to WGMs
accuracy of +/-2% of the measurement value. Although reassurance of the WGMs‟
accuracy was provided by the suppliers, it was decided to test the WGM measurements, in
March 2008, when there was an opportunity to use recently procured laboratory
equipment. This first calibration test occurred on 18th and 19th March 2008 and measured
loads ranging from around 12W to 200W.
In May 2009, additional information regarding the WGMs accuracy was received from the
equipment suppliers. Figure B-2 shows a calibration curve for the WGMs, provided by
Horstmann Controls PLC, over the range of 20 to 2700 Watts. It can be seen that the
percentage error remains within +/-1%. However, due to many of the ICE appliances
monitored in this thesis consumed electricity below 20 W, a second series of calibration
tests were conducted to ensure the WGMs remained accurate at sub 20 W loads. These
took place on 21st and 22nd May 2009 (STB: around 6 W and 2 W charger) and 2nd June
2009 (1 W charger).

412
Figure B-2 WGM calibration curve (Watson, 2009)
In order to check the accuracy of the AMS it was necessary to compare the results from
the system against an accepted reference value. For the calibration tests, a reference
value was gained through the use of a Hameg HM8115-2 bench analogue power meter,
which has a 100mW precision and +/- 0.5% accuracy. The Hameg power meter was
configured to record appliance power measurements at two second intervals. This
provided more detailed measurements than the AMS, which is configured to record energy
consumption at five minute intervals. Loads were measured by the Hameg power meter
and the AMS, simultaneously under controlled conditions at the IESD. Controlled
conditions provide the conformity necessary for the differences between independent test
values to be attributed to random errors. Nevertheless, it must be appreciated that the
methods used did not conform to a standardised test procedure (e.g. BSi). Thus, the
results provided a means to check, rather than determine, the WGMs accuracy. Figure B-
3 shows the equipment monitoring the 2 W charger and Table B-3 summarises the test
procedures used in both tests.

413
Figure B-3 Photograph of the calibration equipment testing 2 W charger: (1) Hameg power
meter; (2) Hameg socket adaptor with 2 W charger; (3) Laptop running Hameg software;
(4) WGM; (5) JACE Gateway; (6) GSM Modem
1
2
3
4
5
6

414
Table B-3 Summary of the calibration method
Step Description
1 The AMS was set up with a WGM plugged into a single mains socket via an extension cable.
2 The Hameg power meter was attached to a laptop, so that measurements could be recorded as CSV files.
3 The loads measured by the Hameg power meter, were linked via a Hameg HZ815 power/socket adapter. The adapter has a European two pin connection, so a UK 3 pin adapter was used to enable its operation.
4 The power supply for the adapter (which provides the mains current to enable the attached appliance to be operational) was connected the WGM, so that both the AMS and the power meter could simultaneously measure the loads used.
5 Consistent loads were applied to produce relatively predictable and comparable measurement.
Calibration 1: two desk lamps were attached to an extension lead and a variety of filament bulbs (12 W, 40 W, 60 W and 100 W) were used in combination, so that a range of loads from approximately 15 W to 200 W could be measured.
Calibration 2: two appliance chargers (approximately 1 W and 2 W) and a STB (approximately 6 W) were used individually to produce constant low power loads.
6 The measurements recorded during the calibration test were saved as CSV files from which they were transferred into MS Excel for analysis.
The AMS time stamped electricity consumption measurements were used to calculate the
energy consumption recorded over each preceding interval and the average power
consumption with equations 1, 2 and 3 below (Table B-4 shows example data gained for a
40 W load).
Equation 1
–
Equation 2
–

415
Equation 3
Table B-4 Example AMS electricity consumption data
Time_Stamp WGM_Value Δ time (min) Energy (kWh) Power (W)
19/03/2008 10:11 0.90899998
19/03/2008 10:16 0.90899998 5.00 0.000 0.00
19/03/2008 10:21 0.91200000 5.00 0.003 36.00
19/03/2008 10:26 0.91600001 5.00 0.004 48.00
19/03/2008 10:31 0.91900003 5.00 0.003 36.00
19/03/2008 10:36 0.92199999 5.00 0.003 36.00
19/03/2008 10:41 0.92500001 5.05 0.003 35.64
19/03/2008 10:46 0.92799997 4.95 0.003 36.36
19/03/2008 10:51 0.93199998 5.00 0.004 48.00
19/03/2008 10:56 0.93199998 5.00 0.000 0.00
Similarly, power consumption data from the Hameg power meter were used to produce
energy consumption values from the power measurements recorded with equation 4 (as
shown in Table B-5).
Equation 4

416
Table B-5 Example Hameg electricity consumption data for a 40 W load
Time_Stamp Δt (sec) Energy (kWh) Power (Watts)
10:14:33
10:14:35 2 0.000022 39.50
10:14:37 2 0.000022 39.50
10:14:39 2 0.000022 39.40
10:14:41 2 0.000022 39.40
Accuracy results
In order to ascertain the measurement accuracy of the WGMs, it was necessary to
evaluate the measurements recorded without the influence of error from the logging
intervals. Therefore, the total energy consumption measured by the AMS, and the
average power consumption, for each load, was compared from a series of time intervals
that had received continuous loads. These values were compared against those gained
from the Hameg power meter for the corresponding time periods. Results are presented in
Table B-6 for the first calibration test and Table B-7 for the second calibration test.
It can be seen that the majority of the measurements gained from the different power loads
are within +/-2% accuracy specified by the manufacturer, and those that exceed this range
are within +/-3%. It is also evident that the differences in measurement relate to the
calculation of energy consumption, from the Hameg power meter data, below the 1 Wh
resolution.
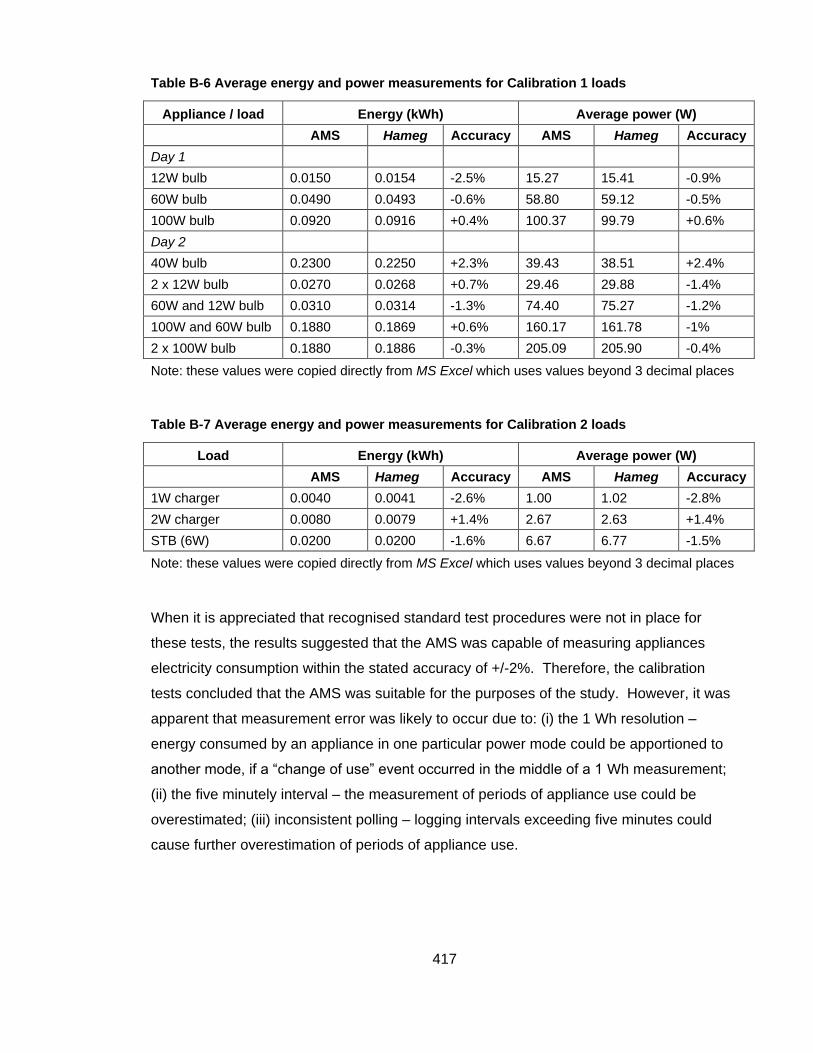
417
Table B-6 Average energy and power measurements for Calibration 1 loads
Appliance / load Energy (kWh) Average power (W)
AMS Hameg Accuracy AMS Hameg Accuracy
Day 1
12W bulb 0.0150 0.0154 -2.5% 15.27 15.41 -0.9%
60W bulb 0.0490 0.0493 -0.6% 58.80 59.12 -0.5%
100W bulb 0.0920 0.0916 +0.4% 100.37 99.79 +0.6%
Day 2
40W bulb 0.2300 0.2250 +2.3% 39.43 38.51 +2.4%
2 x 12W bulb 0.0270 0.0268 +0.7% 29.46 29.88 -1.4%
60W and 12W bulb 0.0310 0.0314 -1.3% 74.40 75.27 -1.2%
100W and 60W bulb 0.1880 0.1869 +0.6% 160.17 161.78 -1%
2 x 100W bulb 0.1880 0.1886 -0.3% 205.09 205.90 -0.4%
Note: these values were copied directly from MS Excel which uses values beyond 3 decimal places
Table B-7 Average energy and power measurements for Calibration 2 loads
Load Energy (kWh) Average power (W)
AMS Hameg Accuracy AMS Hameg Accuracy
1W charger 0.0040 0.0041 -2.6% 1.00 1.02 -2.8%
2W charger 0.0080 0.0079 +1.4% 2.67 2.63 +1.4%
STB (6W) 0.0200 0.0200 -1.6% 6.67 6.77 -1.5%
Note: these values were copied directly from MS Excel which uses values beyond 3 decimal places
When it is appreciated that recognised standard test procedures were not in place for
these tests, the results suggested that the AMS was capable of measuring appliances
electricity consumption within the stated accuracy of +/-2%. Therefore, the calibration
tests concluded that the AMS was suitable for the purposes of the study. However, it was
apparent that measurement error was likely to occur due to: (i) the 1 Wh resolution –
energy consumed by an appliance in one particular power mode could be apportioned to
another mode, if a “change of use” event occurred in the middle of a 1 Wh measurement;
(ii) the five minutely interval – the measurement of periods of appliance use could be
overestimated; (iii) inconsistent polling – logging intervals exceeding five minutes could
cause further overestimation of periods of appliance use.

418
B.4 Further problems experienced during the pilot studies
Following the initial testing of the AMS, a pilot study was undertaken in early March 2008
to assess the performance of the monitoring equipment, the installation procedures, the
methods of data analysis and the preliminary interview schedule. The household was
selected from the researcher‟s acquaintances and was the starting point for the snowball
sampling. The appliance monitoring was conducted for two weeks, between 6th and 19th
March 2008 and the interview was planned to be undertaken around two months later to
allow for further development of data analysis techniques. However, the data collected
from the appliance monitoring presented a number of unanticipated challenges (e.g.
difficulties in the differentiation of standby power modes) and a significant change was also
made to the interview schedule. It was therefore decided to complete the interview in
August 2008.
In order to further test the monitoring equipment and the methods of analysis, prior to any
interviews, a second pilot home was monitored between 18th July and 1st August 2008 and
an interview scheduled two weeks later. Unfortunately, there were a number of large gaps
in the monitoring data for three of the appliances (for one continuous time period there was
a gap of over eight hours). This required additional alterations to be made to the analysis
spreadsheet, in order to extract “unknown” power mode electricity consumption from the
final results and to prepare for similar occurrences in the future. This also led to the
reanalysis of the data from the first household. As a result of this delay, the interviews for
the both pilot households were undertaken in November 2008.
Following the occurrence of similar gaps in monitoring data, during the main study, it was
discovered that data from one of the JACE gateways was not being fully transferred to the
MySQL database by the Digital Living server. Work undertaken by Digital Living was able
to retrieve the missing data (by a manual procedure), so none of the future households
were affected by this problem. In addition, some of the missing data from the first pilot
study were also retrieved, which allowed a more complete post interview analysis to be
made.

419
B.5 Reflection on the use of the AMS
As a result of the setbacks experienced during the initial use of the AMS, and the Digital
Living service provision (i.e. the server facility and GSM transfer service) expiring in
September 2009, it must be acknowledged that fewer households were included in the
main study phase than originally intended. Nevertheless, a sufficient sample size was
obtained to help answer the research questions. Unexpectedly, the problems and
limitations encountered through the use of the AMS have also provided this thesis with
additional practical findings regarding the use of such appliance monitoring systems. It is
also interesting to acknowledge that the monitoring problems faced by this research,
paralleled those experienced by many other energy monitoring studies and in particular
the Danish cohort of the REMODECE project, who also used an adapted energy
monitoring system. These researchers state:
It was very troublesome to be the first customer using brand new intelligent smart home
wireless recording equipment as this resulted in test recordings with many types of failures
appearing in more than one year. Due to these problems, end-use recordings were only
performed in 10 households with this new equipment while recordings in 120 households
were planned.
(Kofod, 2008 p22)
To complete their study, the Danish researchers had to rent alternative monitoring
equipment and undertake „a very intensive man power effort‟ (Kofod, 2008 p22). With the
relatively limited manpower available to this thesis research, it is believed that this study
did well to gain results from fourteen of twenty households, especially when it is
considered that this research also collected qualitative data.

420
Appendix C: AMS installation
A less obvious, but very important, aspect of the appliance monitoring process was work
undertaken to ensure that the installation process was completed efficiently and safely. In
addition to general issues (such as personal safety) any work involving the interaction with
sources of live electricity presents particular health and safety issues for the researcher,
participants and the participants‟ property. Therefore, set procedures were developed for
the use of the monitoring equipment and a number of health and safety courses were
completed.
C.1 Installation and removal procedures
In addition to simple checklists (to ensure that the necessary equipment was taken to a
site) it was essential to address health and safety issues through the design of set
procedures to control the use of the monitoring equipment. These procedures were
developed from the results of a risk assessment that was administered by a qualified
member of the IESD staff (who also had extensive experience of undertaking energy
monitoring studies). The risk assessment identified and assessed the likelihood and
severity of potential risks inherent to the research. Procedures were developed and
documented to mitigate the risks identified and ensure the wellbeing of those involved in
the study. Table C-1 highlights the main health and safety actions undertaken. If any of
the onsite checks raised safety concerns, the installation was halted and participants made
aware of the potential risk.

421
Table C-1 Summary of health and safety issues
Issue Risk Action taken
Faulty monitoring equipment
Electric shock to the researcher or participants and risk of fire at dwelling.
All monitoring equipment underwent portable appliance testing (PAT) by a fully qualified contractor and a full visual inspection for any signs of damage or faults prior to use in the field.
Faulty mains supply (at meter)
Electric shock to researcher during the installation of the current clamp at the mains supply.
Visual inspection of meter cables (check for damaged insulation, moisture, etc) prior to the installation of the current clamp logger.
Gas leakage Explosion or asphyxiation from faulty mains gas supply, often situated in close proximity of electricity supply (meter) and in confined space.
Telegan Spygas (gas leakage and carbon monoxide) detector was used to test for leakages.
Faulty mains sockets
Electric shock to researcher and potential damage to the monitoring equipment.
A visual inspection in accordance to IEE / City & Guilds 2377-002 In-Service Inspection and Testing of Electrical Equipment (PATs) requirements.
Martindale BZ101 mains socket tester was used to test the wiring of each mains socket, prior to the installation of a WGM.
Faulty appliances Electric shock to researcher or participants. Damage to the monitoring equipment.
Visual inspection in accordance to IEE / City & Guilds 2377-002 In-Service Inspection and Testing of Electrical Equipment (PATs) requirements.
Positioning of GSM modem antenna
Unknown effects of RF radiation.
Positioned away from children and areas of frequent occupancy.
Manual lifting Injury to researcher when moving appliances or furniture to access mains sockets. Damage to property.
In the event that appliances or furniture needed to be moved, to install the WGMs, permission from the participants was gained and objects were moved in line with DMU training procedures.
Working at height Injury to researcher from a fall.
In the event that a piece of monitoring equipment required installation with the use of a step ladder, DMU training procedures were followed.
Extension leads and cables
The AMS power cables and plug extension leads had the potential to cause trip hazards.
All cables and extension leads were “tidied” to ensure no potential trip hazards.
Unplugging of network equipment
Loss of network settings (e.g. routers and complex STB).
Al appliances were unplugged with full permission of participants.

422
One particularly unusual issue relates to the potential exposure of participants to
radiofrequency (RF) radiation from the use of the GSM Modem. At present there is still
considerable uncertainty regarding the health effects of low level RF radiation and current
guidance from the Department of Health (DofH) (2009) is based on the report Mobile
Phones and Health, which was published by the Independent Expert Group on Mobile
Phones (IEGMP), in May 2000. The report states that there is no evidence that RF
radiation, below existing guidelines, can cause adverse health effects to the general
population, but there is evidence to suggest that mobile phone RF radiation can cause
biological effects. Therefore, the report concludes that it is not possible to say that
exposure to RF radiation, below national guidelines, is without potential adverse health
effects and recommends a precautionary approach to the use of mobile telephones
(IEGMP, 2000).
In a more recent report the National Radiological Protection Board (NRPB) highlights that
there is still a lack of hard information indicating that mobile telephone systems are
damaging to health, but that a number of more recent studies do suggest a potential link to
health problems and that the research necessary to dismiss the uncertainty has not been
undertaken (NRPB, 2004). Importantly, the NRPB argues that some people may be more
susceptible to adverse health effects of RF radiation and that children in particular may be
more vulnerable. Therefore, the NRPB advise that a precautionary approach should
continue, especially with children (NRPB, 2004).
Although the GSM Modem would only be fully active for two short periods a day (1am and
1pm) and would not be positioned close to human tissue (unlike mobile telephones, which
are positioned close to the users head), advice was sort from the suppliers of the AMS and
the antenna. Via telephone conversations both suppliers confirmed that the equipment
complied with UK regulations and guidelines and, in their opinion, did not present a
significant risk to health. Nevertheless, procedures were put in place to minimise any
contact with RF radiation. These included: (i) participants were informed that the GSM
Modem was a source of RF radiation; (ii) under no circumstances would the GSM Modem
and antenna be located near children; (iii) where practicable the GSM Modem and
antenna were located in an infrequently used location (e.g. spare bedroom); (iv) if the

423
GSM Modem and antenna were to be located in a used area (e.g. bedroom), it was
positioned well away from areas of continuous occupancy (e.g. the bed area).
C.2 Health and safety training
In order to undertake the actions summarised in Table C-1 a number of training courses
were completed. These are summarised in Table C-2 below.
Table C-2 Summary of health and safety courses completed
Course Details
IEE / City & Guilds 2377-002 In-Service Inspection and Testing of Electrical Equipment (PATs)
Provided the skills necessary to undertake a full visual inspection of portable appliances (e.g. ICE appliances). Training delivered by Connaught Compliance Electrical Services (formally NECTA).
DMU manual lifting course Provided training to move objects in accordance with UK health and safety regulations. Delivered by DMU Occupational Health and Safety Department.
DMU working at height course
Provided training to work at height and assess the suitability of equipment. Delivered by DMU Occupational Health and Safety Department.
C.3 Participant instructions
Before the installation of the monitoring equipment a brief explanation of how the AMS
operated was given to the householders present. This included the provision of
instructions to only use an appliance in a designated WGM and to keep any mains sockets
with a WGM installed, in an active state. For most of the households appliances were
usually left in active mains sockets, so this aspect of AMS‟s operational characteristics did
not interfere with their routine behaviours. For a number of householders, using the mains
socket switch was a more common behaviour. Therefore, the researcher demonstrated to
householders how appliances needed to be unplugged from the WGM rather than
switched off at the mains. To ensure that each different appliance was used in the correct
designated WGM, each appliance plug and corresponding WGM was also labelled. This
included using different coloured and shaped stickers (e.g. plug with blue triangle uses

424
WGM with blue triangle). The instructions and information about the monitoring equipment
were also provided in an “ICE appliance survey guide”, which included general information
about the study and the researcher‟s contact details. Participants were encouraged to
contact the researcher if they had a question about any aspect of the research.

425
Appendix D: Interview schedule
Interview schedule question areas
Preamble
Thanks very much for seeing me today. As you know, I‟d like to talk to you about the way
you use consumer electronics and computing appliances in your home.
I‟ve looked at the data from the electricity meters that were installed in your home and
some of my questions are based on that information, so they‟ll be specific to your
household. I‟ll also ask some questions that I‟ll be asking everyone else as well. I‟m going
to be speaking to around 20 other households in total.
I‟ll ask about why you use appliances in particular ways, and why you buy particular
appliances. Towards the end I‟d also like to ask you a few more general questions about
environmental issues.
Please bear in mind that there are no right or wrong answers to any of this. I want to learn
about actual energy use so I‟m interested in your views and you‟re very much the expert in
this interview. If there are any questions that you‟re not comfortable with, please say so
and we‟ll just move on. And if there are any questions that you don‟t understand, just say
so and I‟ll try to clarify.
The results of this research are going to contribute to a PhD and some of the results may
be published, but all the information that you give me will be reported anonymously and
there‟ll be no way to identify you personally from anything you say. I won‟t pass on any
information to any other party. If after the interview you feel that you‟d rather that your
answers weren‟t used in reports of the research, please let me know and I‟ll remove your
answers from the files.
[Ask if there are any questions. Ask permission to record interview.]

426
Consumption profiles
[Concentrating on the main energy consumption appliance/practice]
Address types of equipment in the home
[Show the householders‟ summary sheet of main appliance used/most interesting
results]
1. Time of use?
Why?
Habit
Facilitating conditions Lifestyle
2. Who was using them?
Who controls their use (turning them on and off) the most? Why?
Roles
Contracts
3. What were they being used for?
Why?
Computers: Entertainment (films, radio, games), work?
Televisions: Entertainment, radio, computers monitors, games?
4. How was the household using them?
Communally with other householders?
Different appliances at the same time: e.g. TVs, telephone, computing?
Similar appliances at the same time?
Why?
Facilitating conditions?
Were appliances actually being used or left on in the background?

427
5. Why do you use (or not use) the different power modes? [e.g. high /
low standby]
Habit
Is there knowledge of different power modes and how much electricity is
used in different modes?
Are computers set to a lower energy management setting than default?
6. Do you ever think about the ways that you use appliances?
Why?
Habit?
Perception of consequences (financial, environment)?
Self-monitoring?
Emotions, do you think appliance use is affected by the way you feel?
Used to make happy?
Standby left on when unhappy?
Is there any pressure to use appliances in certain ways?
Social norms
Do you think that the way you use appliances reflects the type of person
you are?
Self concept (I am energy efficient that is why I act that way)?
Environmentally responsible
Cost cutter
Innovative

428
7. Are you ever influenced by the way people around you use them?
Why?
Do you use your appliances differently when you are on your own?
Other householders
With friends
8. How have you learned to use appliances?
Parents / Family
Friends
Manufacturers manual
9. Can you think of any new ways that you have started to use your
appliances since you got them?
Why?
Where have you learned these new practices?
10. Do you think there is anything that constrains the way you use
your appliances?
Physical, reaching the appliances
Knowledge
Ability

429
Types of technology in home
[Looking at specific appliances: those of most significance to household e.g. TV]
I now want to ask you about the reasons why you have these types of appliances in your
home.
11. Why do you have these particular appliances in your home?
The innovation
Social influences
Householders innovativeness
Lifestyles
[If more than one of an appliance type]
Why do you own more than one of certain appliances?
Do you regularly buy new appliances?
12. [Thinking of a one particular appliance such as a TV]
What types of issues did you consider before buying [this appliance] products?
Why?
Relative advantage: the degree to which it is better than previous technology
Compatibility: the degree to which it fits in to existing values and needs
Complexity: the degree to which it is perceived to be difficult to use and understand
Risk
Newness
Appearance, lifestyle?
Does energy consumption ever influence choice?
Do change agents (retailers, friends) mention this?

430
13. Who tends to decide which appliances you buy?
Why?
14. Have there been any people who have significantly influenced your purchase
decisions?
Friends and family
Change agents, (Retailers)
15. Where do you get ideas for the types of appliances that you buy?
Mass media
Friends and family (Heterophily, Homophily)
Opinion leaders
Does seeing products in different places or situations influence you?
Observability: how easy it is to observe
Do you think that the chance to try the product out influences what you own? Why?
Trialability
16. Do you feel that you are pressured (or even forced) to own particular appliances?
Service providers, digital change over?
Work / school; computers
Society
What about any pressures not to own certain appliances?
Ask if there is anything the interviewees would like to add, close interview.

431
Appendix E: Final interview analysis template
A priori codes are in bold.
1st theme order 2nd theme order 3rd theme order 4th theme order
Appliance use
Individualised use
Communal use
Parallel use
Individual simultaneous use
Opposing behaviours
Convergent use
ICE separate end-use
Goals
Working from home
Accounts
Information gathering
Communication
Entertainment
Occupy children
Education
Procurement
Grid computing
Value of consequences
Environmental
Financial
Altruism
Convenience
Safety
Appliance performance
No value
Importance of goal
Past behaviour
Workplace
Safety
Habitus
Norms
Personal norm Appliance use

432
Appliance ownership
Environmental
Social norms
Environmental
Online presence
Appliance use
Appliance ownership
Workplace
Appliance use
Appliance ownership
Roles
Parental
Household
Contracts
Compliance with other householders
Affect
Pleasure of use
Relaxation
Comfort/ambience
Energy saving
guilt
Mood
Envy
Habit
Routines
Work patterns
Sleep
Holidays
Meals
Broadcasts
Arousal
Preceding behaviour
Tiredness
Boredom
Alcohol
Personality variables (innovativeness)
Personal interests
Career

433
Innovativeness
Personal ability
Health
Forgetfulness
Laziness
Self-discipline
Technophobe
Capacity
Physical constraints
Appliance characteristics
Controls
Settings
Visibility of energy use
Networked
Activation time
Dwelling infrastructure
Building construction
Access to sockets
Location of appliance
Occupancy
Work patterns
Retirement
Children
Health
Lifestyle
Knowledge
Operational use
Energy consumption
Standby
Environmental
Assumptions
Comfort zone
Manuals
Trial and error
Optional decision
Collective decision
Authority decision
Gift

434
Social structure
Digital society
Computer literacy
Digital changeover
ICE as utility
Commerce
Workplace
School
Opinion leaders
Social consequences
Change agents
Communication channels
Mass media
Energy saving
ID* Knowledge
ID* persuasion
Internet
Energy saving
ID* Knowledge
ID* persuasion
Interpersonal
Energy saving
Safety
Operational use
ID* Knowledge
ID* persuasion
Retailers
Work colleagues
Friends and family
Relative advantage
Price
Performance
Services
Aesthetics
Status
Convenience
Brand
Energy consumption

435
Compatibility
Existing values
Past experience
Needs
Future proof
Complexity
Trialability
Observability
Energy rating
Influence of study
*ID (innovation decision)

436
Appendix F: Socio-demographic questionnaire

437

438

439

440

441

442

443
Appendix G: Study sample’s ICE appliance ownership
Tables G-1 to G-4 show the appliance ownership for each of the fourteen households
monitored in this study.
Table G-1 Households‟ ownership of video appliances
H1 H2 H3 H4 H5 H6 H7 H8 H9 H10 H11 H12 H13 H14 Total
CRT television 1 2 2 1 4 2 0 1 0 0 2 4 1 1 21
LCD television 0 0 1 0 0 0 1 1 2 1 0 0 1 1 8
STB complex 0 1 1 1 0 2 1 0 1 0 1 1 1 0 10
STB simple 1 0 0 0 1 0 0 0 0 0 0 0 0 1 3
VCR 1 1 1 0 0 1 0 1 1 0 1 1 0 0 8
VCR/DVD 0 0 0 0 1 0 0 0 0 0 0 0 0 0 1
DVD recorder 0 0 0 0 0 1 0 0 0 0 0 0 0 0 1
HDD/DVD recorder 0 0 0 0 0 0 1 0 0 0 0 0 0 1 2
DVD player 1 1 1 0 0 0 0 1 2 0 1 1 1 0 9
Games console 0 1 0 1 1 0 0 2 0 3 0 1 1 0 10
Surround sound equipment
0 0 0 1 0 0 0 0 0 2 0 0 0 0 3
AV transmitter/ receiver
0 0 0 0 0 0 0 0 0 0 0 0 2 0 2
AV booster 0 0 0 0 0 0 0 0 0 1 0 0 0 1 2
Total 4 6 6 4 7 6 3 6 6 7 5 8 7 5 80
Table G-2 Households‟ ownership of audio appliances
H1 H2 H3 H4 H5 H6 H7 H8 H9 H10 H11 H12 H13 H14 Total
Integrated Hi-Fi systems
0 1 1 0 1 1 0 3 3 0 0 1 0 1 12
Hi-Fi separates 0 0 0 0 0 0 0 0 0 2 2 2 0 1 7
Digital radio 0 0 0 0 0 0 0 1 0 1 1 2 0 0 5
Analogue radio 1 0 0 0 0 0 1 1 1 0 0 0 0 0 4
Clock radio 0 0 1 0 0 0 0 0 0 0 1 0 1 0 3
Mp3 docking station
0 0 0 0 1 0 0 1 1 0 0 0 0 0 3
Total 1 1 2 0 2 1 1 6 5 3 4 5 1 2 34

444
Table G-3 Households‟ ownership of computing appliances
H1 H2 H3 H4 H5 H6 H7 H8 H9 H10 H11 H12 H13 H14 Total
Desktop computer
1 1 1 1 1 1 3 1 0 1 2 2 1 1 17
Desktop with LCD monitor
0 0 0 0 0 0 0 0 1 0 0 0 0 0 1
Laptop 0 0 1 1 0 1 1 1 1 2 1 1 1 0 11
LCD monitor 0 1 1 0 1 1 2 1 0 1 2 1 1 1 13
CRT monitor 1 0 0 1 0 0 0 0 0 0 0 0 0 0 2
Office printer/ copier
0 0 0 0 0 0 0 0 1 0 0 0 0 0 1
Multi functional printer
1 1 0 0 0 1 0 0 1 1 1 1 0 0 7
Printer inkjet 0 0 1 0 1 0 1 0 0 1 0 0 1 1 6
Printer laser 0 0 0 0 0 0 0 1 0 0 0 0 0 0 1
Digital photo printer
0 0 0 0 0 0 0 0 1 0 0 0 0 0 1
Speakers 1 0 1 1 1 0 0 0 0 1 2 0 0 0 7
External hard drive
0 0 0 0 0 0 2 0 0 2 0 0 0 0 4
Router 0 1 1 1 1 1 1 1 1 1 1 1 1 1 13
Modem 0 0 0 0 1 1 1 0 0 0 1 0 0 0 4
Total 4 4 6 5 6 6 11 5 6 10 10 6 5 4 88
Table G-4 Households‟ ownership of telephony appliances
H1 H2 H3 H4 H5 H6 H7 H8 H9 H10 H11 H12 H13 H14 Total
Cordless telephone
0 1 1 1 1 1 1 1 2 1 1 1 1 1 14
Cordless telephone extra handset
0 0 1 0 1 1 0 1 1 0 0 1 0 0 6
Answer-phone 1 0 0 0 0 0 0 0 0 0 0 0 0 1 2
Total 1 1 2 1 2 2 1 2 3 1 1 2 1 2 22

445
Appendix H: Average appliance electricity consumption values
The average appliance electricity consumption values are derived by dividing the total
electricity consumption recorded for each appliance type, by the number of appliances.
Table H-1 Average appliance two week electricity consumption from video appliances
Appliance type Number of appliances
Total electricity consumption (kWh)
Average appliance electricity consumption (kWh)
CRT television 21 65.1 3.10
LCD television 8 56.8 7.10
STB complex 10 48.4 4.84
VCR 8 13.1 1.64
Games console 10 12.2 1.22
HDD/DVD recorder 2 5.4 2.72
STB simple 3 3.4 1.12
DVD player 9 3.3 0.37
AV transmitter/ receiver
2 2.4 1.19
Surround sound equipment
3 1.4 0.47
AV booster 2 1.4 0.69
VCR/DVD 1 0.6 0.61
DVD recorder 1 0.0 0.00
Total 80 213.5 25.07

446
Table H-2 Average appliance two week electricity consumption from audio appliances
Appliance type Number of appliances
Total electricity consumption (kWh)
Average appliance electricity consumption (kWh)
Integrated Hi-Fi systems
12 23.1 1.92
Digital radio 5 5.8 1.16
Hi-Fi separates 7 3.3 0.47
Analogue radio 4 2.6 0.66
Clock radio 3 2.2 0.74
Mp3 docking station
3 0.2 0.06
Total 34 37.2 5.00
Table H-3 Average appliance two week electricity consumption from computing appliances
Appliance type Number of appliances
Total electricity consumption (kWh)
Average appliance electricity consumption (kWh)
Desktop computer 17 143.6 8.45
Router 13 30.2 2.32
Laptop 11 22.0 2.00
LCD monitor 13 17.9 1.38
Multi functional printer
7 10.9 1.56
Modem 4 10.6 2.66
External hard drive 4 10.0 2.50
Office printer/ copier
1 5.9 5.90
Speakers 7 4.0 0.58
Desktop with LCD monitor
1 3.2 3.19
Printer inkjet 6 1.4 0.23
CRT monitor 2 1.1 0.57
Printer laser 1 0.4 0.41
Digital photo printer 1 0.1 0.11
Total 88 261.5 31.86

447
Table H-4 Average appliance two week electricity consumption from telephony appliances
Appliance type Number of appliances
Total electricity consumption (kWh)
Average appliance electricity consumption (kWh)
Cordless telephone 14 15.5 1.11
Cordless telephone extra handset
6 5.5 0.92
Answer-phone 2 2.4 1.21
Total 22 23.5 3.24

448
Appendix I: Raw total ICE appliance electricity consumption data
Tables I1 to I5 show raw two week total electricity consumption data for the four main ICE
appliance categories.

449
Table I-1 Raw two week total electricity consumption data for video appliances
H1 H2 H3 H4 H5 H6 H7 H8 H9 H10 H11 H12 H13 H14 Total
TV CRT 1 6.338 11.353 7.329 9.867 3.951 4.769 2.015 0.093 4.101 49.816
TV CRT 2 0.000 0.573 4.059 0.000 0.893 2.960 0.379 8.864
TV CRT 3 1.061 3.032 1.495 5.588
TV CRT 4 0.374 0.412 0.786
TV LCD1 0.473 10.247 0.636 14.449 5.745 22.155 3.067 56.772
TV LCD2 0.000 0.000
STB simple 1.403 1.686 0.270 3.359
STB complex 1 2.654 6.187 8.624 4.992 8.654 1.730 0.022 5.989 2.757 41.609
STB complex 2 6.753 6.753
VCR 1.870 2.347 1.874 2.914 1.492 0.794 0.000 1.817 13.108
DVD player 1 0.000 0.696 0.175 1.150 0.199 0.000 0.000 1.112 3.332
DVD player 2 0.000 0.000
DVD recorder 0.000 0.000
VCR/DVD 0.610 0.610
HDD/DVD recorder 3.791 1.651 1.651
Surround sound 1 0.000 0.894 0.894
Surround sound 2 0.529 0.529
AV booster 0.880 0.498 1.378
AV sender 1 0.975 0.975
AV sender 2 1.403 1.403
Games console 1 2.200 1.556 0.000 3.015 2.472 0.255 0.858 10.356
Games console 2 0.508 0.820 1.328
Games console 3 0.550 0.550
Total 9.611 19.250 17.099 20.047 10.226 23.487 22.692 8.816 17.172 11.890 0.115 14.962 32.220 5.865 213.452

450
Table I-2 Raw two week total electricity consumption data for audio appliances
H1 H2 H3 H4 H5 H6 H7 H8 H9 H10 H11 H12 H13 H14 Total
Integrated Hi-Fi 1
0.199 5.193
6.079 1.949
2.825 0.004
0.215
4.365 20.829
Integrated Hi-Fi 2
0.350 0.000
0.350
Integrated Hi-Fi 3
1.873 0.009
1.882
Separate: Amplifier
0.073
0.073
Separate: CD
0.024
0.024
Separate: Turntable
0.311 0.311
Tuner and cassette
1.988
1.988
Amplifier and CD
0.914
0.914
Digital radio 1
0.753
2.616 0.841 1.268
5.478
Digital radio 2
0.301
0.301
Analogue radio 0.002
0.801 1.842 0.000
2.645
Clock radio 0.963 0.775 0.467 2.205
MP3 docking station 0.060 0.100 0.008 0.168
Total 0.002 0.199 6.156 0.000 6.139 1.949 0.801 7.743 0.021 4.604 1.713 2.698 0.467 4.676 37.168

451
Table I-3 Raw two week total electricity consumption data for computing appliances
H1 H2 H3 H4 H5 H6 H7 H8 H9 H10 H11 H12 H13 H14 Total
Desktop 1 0.014 0.324 0.028 0.640 2.214 1.863 42.199 3.320 1.370 10.965 7.602 10.027 1.871 82.437
Desktop 2 32.609 1.552 1.377 35.538
Desktop 3 25.664 25.664
Desktop and monitor 3.193 3.193
Laptop 1 0.137 1.356 0.299 8.491 0.197 1.541 2.822 2.023 3.362 0.000 20.228
Laptop 2 1.818 1.818
Computer CRT 0.010 1.130 1.140
Computer LCD 1 0.113 0.007 1.032 0.764 4.444 0.582 0.495 3.156 0.193 3.297 0.601 14.684
Computer LCD 2 2.837 0.382 3.219
Printer inkjet 0.114 0.007 0.003 0.237 0.237 0.807 1.405
Printer laser 0.409 0.409
Multi functional 0.001 0.034 3.726 1.044 3.452 0.203 2.448 10.908
Digital photo 0.106 0.106
Office copier 5.896 5.896
Comp. speakers 1 0.001 0.000 1.323 0.869 1.691 0.079 3.963
Comp. speakers 2 0.083 0.083
Router 3.280 0.100 2.672 2.183 2.787 3.675 2.574 1.859 2.116 2.074 2.067 2.199 2.630 30.216
Modem 1.872 1.841 4.524 2.402 10.639
External hard drive 1 3.496 0.019 3.515
External hard drive 2 5.781 0.688 6.469
Total 0.026 3.751 0.386 7.121 8.177 11.280 133.723 7.082 13.639 14.708 22.919 17.049 15.760 5.909 261.530

452
Table I-4 Raw two week total electricity consumption data for telephony appliances
H1 H2 H3 H4 H5 H6 H7 H8 H9 H10 H11 H12 H13 H14 Total
Cordless telephone1
1.240 1.378 0.773 1.280 0.957 0.804 1.324 1.971 0.675 1.160 0.592 1.247 1.342 14.743
Cordless telephone2
0.754
0.754
Cordless extra handset
0.553
1.044 1.167
1.550 0.781
0.434
5.529
Answer-phone 1.258
1.167 2.425
Total 1.258 1.240 1.931 0.773 2.324 2.124 0.804 2.874 3.506 0.675 1.160 1.026 1.247 2.509 23.451
Table I-5 Raw two week total electricity consumption data for ICE appliance categories
H1 H2 H3 H4 H5 H6 H7 H8 H9 H10 H11 H12 H13 H14 Total
Video 9.61 19.25 17.10 20.05 10.23 23.49 22.69 8.82 17.17 11.89 0.11 14.96 32.22 5.86 213.45
Audio 0.00 0.20 6.16 0.00 6.14 1.95 0.80 7.74 0.02 4.60 1.71 2.70 0.47 4.68 37.17
Computing 0.03 3.75 0.39 7.12 8.18 11.28 133.72 7.08 13.64 14.71 22.92 17.05 15.76 5.91 261.53
Telephony 1.26 1.24 1.93 0.77 2.32 2.12 0.80 2.87 3.51 0.67 1.16 1.03 1.25 2.51 23.45
Total 10.90 24.44 25.57 27.94 26.87 38.84 158.02 26.52 34.34 31.88 25.91 35.74 49.69 18.96 535.60

453
Appendix J: Percentage of average household ICE appliance
electricity consumption from appliance types active and standby
power modes
Tables J1 to J5 show the percentage of average household ICE appliance electricity
consumption from each appliance type‟s active power mode and the sum of the standby
power modes.
Table J-1 Percentage of average household two week ICE appliance electricity consumption
from video appliances‟ active and standby power modes. Total includes unknown electricity
consumption
Appliance type Active (%) Standby (%) Total (%)
Television CRT 11.5 0.6 12.1
Television LCD 10.5 0.1 10.6
STB Simple 0.2 0.4 0.6
STB complex 3.6 5.5 9.0
VCR 0.1 2.4 2.4
DVD player 0.1 0.6 0.6
DVD recorder 0.0 0.0 0.0
VCR/DVD recorder 0.0 0.1 0.1
HDD recorder 0.6 0.4 1.0
Surround sound 0.3 0.0 0.3
AV booster 0.0 0.2 0.3
AV sender 0.2 0.2 0.4
Games consoles 0.8 1.5 2.3

454
Table J-2 Percentage of average household two week ICE appliance electricity consumption
from audio appliances‟ active and standby power modes. Total includes unknown electricity
consumption
Appliance type Active (%) Standby (%) Total (%)
Integrated Hi-Fi systems 0.2 4.1 4.3
Stereo separates 0.0 0.6 0.6
Digital radios 0.1 0.4 1.1
Analogue radios 0.1 0.4 0.5
Clock radios 0.0 0.4 0.4
MP3 0.0 0.0 0.0
Table J-3 Percentage of average household two week ICE appliance electricity consumption
from computing appliances‟ active and standby power modes. Total includes unknown
electricity consumption
Appliance type Active (%) Standby (%) Total (%)
Desktop 25.0 1.8 26.8
Desktop and monitor 0.2 0.4 0.6
Laptop 3.9 0.2 4.1
Display CRT 0.0 0.2 0.2
Display LCD 2.6 0.8 3.3
Printer inkjet 0.0 0.3 0.3
Printer laser 0.1 0.0 0.1
Multi functional 0.0 2.0 2.0
Digital photo 0.0 0.0 0.0
Office copier 0.2 0.9 1.1
Speakers 0.0 0.7 0.8
Router 1.9 3.7 5.6
Modem 1.1 0.9 2.0
External hard drive 1.7 0.1 1.9

455
Table J-4 Percentage of average household two week ICE appliance electricity consumption
from telephony appliances‟ active and standby power modes. Total includes unknown
electricity consumption
Appliance type Active (%) Standby (%) Total (%)
Cordless telephone N/A N/A 2.9
Cordless telephone extra handset
N/A N/A 1.0
Answer-phone N/A N/A 0.5

456
Appendix K: Average household durations of ICE appliance use
Table K-1 Average household video appliance daily duration of use in the different
operational states
Appliance type Active (Hours)
Active standby (Hours)
Passive standby (Hours)
Device off (Hours)
Discon-nected (Hours)
U/C standby (Hours)
Unknown (Hours)
Total (Hours)
Television CRT 4.1 0.0 3.7 16.3 11.8 0.0 0.1 36.0
Television LCD 2.4 0.0 3.8 3.3 4.2 0.0 0.0 13.7
Television living area 5.3 0.0 3.6 12.0 6.5 0.0 0.0 27.4
Television bedroom 1.0 0.0 2.3 4.3 7.9 0.0 0.0 15.4
Television kitchen 0.3 0.0 1.7 3.3 1.6 0.0 0.0 6.9
STB complex 5.5 8.5 0.0 0.0 3.1 0.0 0.0 17.1
STB simple 0.8 2.0 0.0 0.0 0.6 0.0 0.0 3.4
VCR 0.1 2.5 7.1 0.0 3.9 0.0 0.0 13.7
VCR/DVD* 0.02 0.0 1.7 0.0 0.0 0.0 0.0 1.7
DVD player 0.1 0.1 4.2 1.7 9.3 0.0 0.0 15.4
DVD recorder* 0.0 0.0 0.0 0.0 0.0 0.0 1.7 1.7
HDD/DVD recorder 0.7 1.4 1.2 0.0 0.2 0.0 0.0 3.4
Games console 0.7 1.7 0.0 10.2 4.5 0.0 0.0 17.1
Surround sound 0.4 0.0 0.0 1.5 3.2 0.0 0.0 5.1
AV booster 0.3 3.1 0.0 0.0 0.0 0.0 0.0 3.4
AV transmitter/ receiver
1.7 1.7 0.0 0.0 0.0 0.0 0.0 3.4
*only 1 appliance monitored

457
Table K-2 Average household audio appliance daily duration of use in the different
operational states. +
Includes all digital radios
Appliance type Active (Hour)
Active standby (Hours)
Passive standby (Hours)
Device off (Hours)
Discon-nected (Hours)
U/C standby (hours)
Unknown (Hours)
Total (Hours)
Integrated Hi-Fi systems
0.3 2.4 5.0 3.4 9.5 0.0 0.0 20.6
Hi-Fi separates 0.0 0.2 0.0 1.7 4.9 1.7 0.0 8.6
Digital radio+ 0.2 0.0 4.9 0.0 0.0 0.0 2.2 7.3
Analogue radio 0.3 0.0 3.1 0.0 3.4 0.0 0.0 6.9
Clock radio 0.0 5.1 0.0 0.0 0.0 0.0 0.0 5.1
Mp3 docking station
0.1 0.1 0.0 0.0 3.3 1.7 0.0 5.1
Table K-3 Average household computing appliance daily duration of use in the different
operational states *only 1 appliance monitored
Appliance type Active (Hours)
Active standby (Hours)
Passive standby (Hours)
Device off (Hours)
Discon-nected (Hours)
U/C standby (hours)
Unknown (Hours)
Total (Hours)
Desktop computer
7.3 0.0 0.1 16.1 5.6 0.0 0.0 29.1
LCD monitor 2.7 0.0 1.3 13.7 4.5 0.0 0.0 22.3
CRT monitor 0.0 0.0 0.0 1.7 1.7 0.0 0.0 3.4
Desktop with LCD monitor
0.1 0.0 0.0 1.7 0.0 0.0 0.0 1.7
Laptop 3.9 0.0 0.1 3.3 11.5 0.0 0.0 18.9
Printer inkjet 0.02 1.3 0.0 4.6 4.4 0.0 0.0 10.3
Multi-functional printer
0.05 3.7 0.0 1.7 4.9 1.7 0.0 12.0
Printer laser* 0.03 0.1 0.0 1.6 0.0 0.0 0.0 1.7
Office copier* 0.1 0.2 1.5 0.0 0.0 0.0 0.0 1.7
Digital photo printer*
0.0 0.0 0.0 1.7 0.0 0.0 0.0 1.7
Speakers 0.04 3.5 0.0 3.4 5.0 0.0 0.0 12.0
External hard drive
3.4 0.0 0.0 3.4 0.0 0.0 0.0 6.9
Router 6.8 13.5 0.0 0.0 2.0 0.0 0.0 22.3
Modem 2.8 4.0 0.0 0.0 0.0 0.0 0.0 6.9
*only 1 appliance monitored

458
Table K-4 Average household telephony appliance daily duration of use in the different
operational states
Appliance type Active (Hours)
Active standby (Hours)
Passive standby (Hours)
Device off (Hours)
Discon-nected (Hours)
U/C standby (hours)
Unknown (Hours)
Total (Hours)
Cordless telephone
0.0 0.0 0.0 0.0 0.7 0.0 25.0 25.7
Cordless telephone extra handset
0.0 0.0 0.0 0.0 0.0 0.0 8.6 8.6
Answer-phone 0.0 0.0 0.0 0.0 0.0 0.0 3.4 3.4


![Complexitat i fenomen (socio)lingüístic [Complexity and (socio)linguistic phenomenon]](https://static.fdokumen.com/doc/165x107/63130623c32ab5e46f0c3b37/complexitat-i-fenomen-sociolingueistic-complexity-and-sociolinguistic-phenomenon.jpg)