A Small RNA-Catalytic Argonaute Pathway Tunes Germline ...
33
Article A Small RNA-Catalytic Argonaute Pathway Tunes Germline Transcript Levels to Ensure Embryonic Divisions Graphical Abstract Highlights d Catalytic activity of the Argonaute CSR-1 is essential for early embryogenesis d CSR-1 controls microtubule assembly by restricting expression of a depolymerase d CSR-1 tunes germline transcript levels guided by density of small RNA cofactors Authors Adina Gerson-Gurwitz, Shaohe Wang, Shashank Sathe, Rebecca Green, Gene W. Yeo, Karen Oegema, Arshad Desai Correspondence [email protected] In Brief The Argonaute CSR-1 employs its slicer activity to tune the transcript levels of its targets guided by the density of small RNA co-factors. CSR-1-mediated transcript tuning, rather than silencing, is essential to produce maternally loaded oocytes capable of supporting early embryogenesis. Accession Numbers GSE75128 Gerson-Gurwitz et al., 2016, Cell 165, 396–409 April 7, 2016 ª2016 Elsevier Inc. http://dx.doi.org/10.1016/j.cell.2016.02.040
-
Upload
khangminh22 -
Category
Documents
-
view
1 -
download
0
Transcript of A Small RNA-Catalytic Argonaute Pathway Tunes Germline ...

Article
A Small RNA-Catalytic Argonaute Pathway Tunes
Germline Transcript Levels to Ensure EmbryonicDivisionsGraphical Abstract
Highlights
d Catalytic activity of the ArgonauteCSR-1 is essential for early
embryogenesis
d CSR-1 controls microtubule assembly by restricting
expression of a depolymerase
d CSR-1 tunes germline transcript levels guided by density of
small RNA cofactors
Gerson-Gurwitz et al., 2016, Cell 165, 396–409April 7, 2016 ª2016 Elsevier Inc.http://dx.doi.org/10.1016/j.cell.2016.02.040
Authors
Adina Gerson-Gurwitz, Shaohe Wang,
Shashank Sathe, Rebecca Green,
Gene W. Yeo, Karen Oegema,
Arshad Desai
In Brief
The Argonaute CSR-1 employs its slicer
activity to tune the transcript levels of its
targets guided by the density of small
RNA co-factors. CSR-1-mediated
transcript tuning, rather than silencing, is
essential to produce maternally loaded
oocytes capable of supporting early
embryogenesis.
Accession Numbers
GSE75128

Article
A Small RNA-Catalytic Argonaute PathwayTunes Germline Transcript Levelsto Ensure Embryonic DivisionsAdina Gerson-Gurwitz,1,2 ShaoheWang,1,2,3 Shashank Sathe,2,4 Rebecca Green,1,2 GeneW. Yeo,2,3,4 Karen Oegema,1,2,3
and Arshad Desai1,2,3,*1Ludwig Institute for Cancer Research, San Diego, CA 92093, USA2Department of Cellular & Molecular Medicine, University of California San Diego, La Jolla, CA 92093, USA3Biomedical Sciences Graduate Program, University of California San Diego, La Jolla, CA 92093, USA4UCSD Stem Cell Program & Sanford Consortium for Regenerative Medicine, Institute for Genomic Medicine, La Jolla, CA 92093, USA
*Correspondence: [email protected]
http://dx.doi.org/10.1016/j.cell.2016.02.040
SUMMARY
Multiple division cycles without growth are a charac-teristic feature of early embryogenesis. The femalegermline loads proteins and RNAs into oocytes tosupport these divisions, which lack many qualitycontrol mechanisms operating in somatic cells un-dergoing growth. Here, we describe a small RNA-Ar-gonaute pathway that ensures early embryonic divi-sions in C. elegans by employing catalytic slicingactivity to broadly tune, instead of silence, germlinegene expression. Misregulation of one target, a kine-sin-13 microtubule depolymerase, underlies a majorphenotype associated with pathway loss. Tuning oftarget transcript levels is guided by the density ofhomologous small RNAs, whose generation mustultimately be related to target sequence. Thus, thetuning action of a small RNA-catalytic Argonautepathway generates oocytes capable of supportingembryogenesis. We speculate that the specializednature of germline chromatin led to the emergenceof small RNA-catalytic Argonaute pathways in the fe-male germline as a post-transcriptional control layerto optimize oocyte composition.
INTRODUCTION
Maternal loading of proteins and RNAs into oocytes by the fe-
male germline limits the requirement for transcriptional and
translational activity during early embryogenesis. While the ben-
efits of such a strategy are evident, it raises the question of how
the composition of the maternal load is specified since homeo-
static mechanisms that operate during growth may no longer
be relevant. Thus, specific mechanisms are likely to exist in the
female germline to ensure accurate stoichiometry of maternally
loaded components. In the process of investigating a small
RNA-Argonaute pathway previously implicated in chromosome
segregation, we uncovered a mechanism that performs such a
function in Caenorhabditis elegans.
396 Cell 165, 396–409, April 7, 2016 ª2016 Elsevier Inc.
Argonautes are a conserved class of proteins implicated in
diverse small RNA-based processes (Carmell et al., 2002;
Kuhn and Joshua-Tor, 2013; Swarts et al., 2014). Argonautes
are particularly prominent inC. elegans (Billi et al., 2014; Grishok,
2013), where they have been implicated in diverse processes,
including RNA interference (Tabara et al., 1999), transposon
silencing (Batista et al., 2008; Das et al., 2008), self-/non-self-
discrimination (Ashe et al., 2012; Gu et al., 2009; Lee et al.,
2012; Seth et al., 2013; Shirayama et al., 2012), germline immor-
tality (Buckley et al., 2012; Yigit et al., 2006), and transgenera-
tional epigenetic inheritance (Ashe et al., 2012; Buckley et al.,
2012; Shirayama et al., 2012). Of the 27 C. elegans Argonautes
(Yigit et al., 2006), only one—CSR-1—is absolutely essential
for fertility and embryo viability (Claycomb et al., 2009; Yigit
et al., 2006). CSR-1 is bound to a class of small 22-nt RNAs
with a guanosine on their 50 ends known as 22G RNAs (Gu
et al., 2009). 22G RNAs act in two different Argonaute pathways
in the germline, one employing CSR-1 and a second employing
WAGO class Argonautes (Claycomb et al., 2009; Gu et al., 2009).
CSR-1-bound 22G RNAs are homologous to germline-ex-
pressed transcripts, and CSR-1-22G RNA complexes have
been suggested to act in a diverse array of processes: chromo-
some and centromere organization (Claycomb et al., 2009),
maturation of core histone mRNAs (Avgousti et al., 2012), as-
sembly of germline ribonucleprotein structures known as P gran-
ules (Claycomb et al., 2009; Updike and Strome, 2009), protec-
tion of germline transcription via an effect on chromatin (Wedeles
et al., 2013), definition of self versus non-self in a balance with
the WAGO-22G RNA pathway that acts downstream of the
Piwi class Argonaute PRG-1 and its associated 21U RNAs
(Seth et al., 2013), promotion of sense transcription (Cecere
et al., 2014), and translational control in the mitotic zone of the
germline (Friend et al., 2012). A fundamental assumption in prior
studies has been that CSR-1 does not significantly control tran-
script levels of target genes with homology to its bound 22G
RNAs. This assumption, based on microarray analysis of csr-1
mutants (Claycomb et al., 2009) and sequencing analysis
following feeding RNAi-based reduction of CSR-1 (Campbell
and Updike, 2015), is surprising because CSR-1 has conserved
residues implicated in slicing (Yigit et al., 2006) and is required for
the major slicing activity inC. elegans extracts (Aoki et al., 2007).

A B
C
D
E
F
Figure 1. CSR-1 Inhibition Reduces Microtubule Assembly in One-Cell Embryos
(A) Immunoblot comparing a standard curve of N2 wild-type worm extract to CSR-1-depleted worm extract. b-actin serves as a loading control. Bands cor-
responding to the two CSR-1 isoforms (a and b; Figures S1A–S1C) are indicated.
(B) Images from time-lapse sequences of embryos expressing GFP::H2b (yellow arrow in control�20 s) and GFP::g-tubulin (yellow arrowheads in control�20 s)
for the indicated conditions. Time is in seconds relative to early anaphase. Scale bar, 10 mm.
(C) Plot of the position of the spindle midpoint (defined in maximal intensity projections as the midpoint between GFP::g-tubulin foci) projected onto the embryo
A-P axis at metaphase for the indicated conditions.
(D) Plot of the distribution of the minimum angle between the spindle axis (defined in maximal intensity projections by a line connecting the GFP::g-tubulin foci)
and the embryo A-P axis at metaphase for the indicated conditions.
(legend continued on next page)
Cell 165, 396–409, April 7, 2016 397

In prior work, we found that genes with homology to CSR-1-
bound 22G RNAs are in genomic regions depleted of the centro-
mere-specific histone H3 variant CENP-A (Gassmann et al.,
2012), raising the possibility that CSR-1-22G RNA complexes
limit centromeric domains on holocentric C. elegans chromo-
somes. This, together with the chromosome segregation defect
observed in early C. elegans embryos, prompted us to investi-
gate how CSR-1 contributes to chromosome segregation. Using
high-resolution phenotyping in early embryos to compare the
effects of removing CSR-1 to selective ablation of its catalytic
slicing activity, we found that loss of slicing activity fully phe-
nocopied CSR-1 removal. In addition, while chromosome and
centromere organization were unaffected, CSR-1 inhibition re-
sulted in severe defects in the microtubule cytoskeleton caused
by elevated expression of a kinesin-13 microtubule depolymer-
ase prominently represented in the ensemble of CSR-1-22G
RNA complexes. Genome-wide analysis revealed widespread
22G RNA density-dependent tuning, but not silencing, of target
gene expression by CSR-1 slicing activity. Thus, CSR-1 slicing
activity, guided by bound 22G RNAs, tunes the expression of
a large number of germline-encoded transcripts to generate a
balanced maternal load that can support embryogenesis.
RESULTS
CSR-1 Inhibition ReducesMicrotubule Assembly inOne-Cell EmbryosTo dissect the role of CSR-1 in chromosome segregation, we
analyzed the consequences of removing CSR-1 on the first em-
bryonic cell division. As CSR-1 has been proposed to act with
CDL-1, which binds the 30 UTR of core histone mRNAs to pro-
mote their maturation and translation (Avgousti et al., 2012),
we also analyzed CDL-1 depletion in parallel. CSR-1 has a short
isoform b and a longer isoform a. CSR-1b is functionally critical in
embryos as depleting isoform a alone did not affect embryonic
viability, whereas depleting >95% of both isoforms led to pene-
trant embryonic lethality (Figures 1A and S1A–S1C).
Filming one-cell embryos co-expressing GFP::histone H2b
and GFP::g-tubulin, which label the chromosomes and spindle
poles, respectively, revealed a clear difference in the CSR-1
and CDL-1 depletion phenotypes (Figure 1B). CSR-1 depletion
led to phenotypes characteristic of defects in the microtubule
cytoskeleton, including unstable positioning of the mitotic spin-
dle along the A-P axis (Figures 1B and 1C) and randomization
of metaphase spindle angle relative to the A-P axis (Figures 1B
and 1D). These phenotypes were similar to those following
depletion of the tubulin chaperone TBCD-1 (Figures 1B–1D;
tubulin-specific cofactor D). CDL-1 depletions, which reduced
global histone levels (Figure S1D; Avgousti et al., 2012), did not
exhibit these phenotypes but instead exhibited defects in chro-
mosome condensation and structure (Figure 1B, �250 s; Fig-
ure 2A, below). Imaging in a strain expressing GFP::b-tubulin
(E) Representative images (left) and quantification (right) of metaphase spindle
integrated fluorescence intensity measurements were normalized to the control
(F) Immunoblot of a-tubulin in csr-1(RNAi) compared to a standard curve of N2 (co
kilodaltons) are indicated on the right.
See also Figure S1 and Tables S2, S3, and S5.
398 Cell 165, 396–409, April 7, 2016
and mCherry::H2b revealed greatly reduced microtubule as-
sembly in CSR-1 and TBCD-1, but not in CDL-1-depleted em-
bryos (Figure 1E and S1H). a-tubulin levels were not changed
by CSR-1 depletion (Figure 1F), suggesting that the reduction
in microtubule assembly is not due to reduced availability of
a/b-tubulin dimers.
CSR-1 binds 22G RNAs generated by the EGO-1/DRH-3/
EKL-1 complex (Gu et al., 2009). Imaging embryos depleted
of EGO-1, DRH-3, or EKL-1 revealed phenotypes similar to
CSR-1 depletion, indicating that the contribution of CSR-1 to
microtubule assembly depends on its association with 22G
RNAs (Figures S1E–S1G). We conclude that whereas CDL-1 in-
hibition results in defects in chromatin structure consistent with
its proposed role in histone production, inhibition of CSR-1 or
the factors that generate its bound 22G RNAs leads to a severe
defect in microtubule assembly.
CSR-1 Inhibition Does Not Affect ChromosomeStructure or Centromere/Kinetochore Assembly in One-Cell EmbryosCSR-1-22G RNA complexes have been proposed to control
chromosome architecture and centromere organization in the
early embryo, potentially by controlling histone mRNA process-
ing and/or by guiding deposition of the centromeric histone
variant CENP-A (Avgousti et al., 2012; Claycomb et al., 2009).
Our initial analysis suggested that CSR-1 depletion did not
cause visible defects in mitotic chromosome structure. Consis-
tent with this impression, closer analysis revealed that while
CDL-1 depletion caused chromosome condensation defects
during mitotic entry, chromosomes were normally condensed
in CSR-1-depleted embryos (Figure 2A). Both CSR-1 and
CDL-1 depletion led to lagging anaphase chromatin; however,
the morphology was distinct (Figure 2A). In CSR-1-depleted
embryos, condensed chromosomes were lagging, whereas in
CDL-1-depleted embryos, poorly condensed chromatin was
stretched between the separating chromosome masses. We
conclude that the segregation defects in CSR-1-depleted em-
bryos cannot be explained by action in the CDL-1-dependent
histone mRNA maturation pathway.
To test the proposal that CSR-1 patterns centromere/kineto-
chore architecture (Claycomb et al., 2009; Gassmann et al.,
2012), we analyzed a functional GFP fusion with the centromeric
histone variant CENP-AHCP-3, which forms the structural foun-
dation for kinetochore assembly (Figure 2B). GFP::CENP-
AHCP-3 was patterned into two stripes that ran along the length
of the holocentric chromosomes in early prometaphase em-
bryos (Figure 2C). Qualitative assessment and quantitative line
scans across individual chromosomes revealed essentially
identical localization in control and CSR-1-depleted embryos
(Figure 2D). In contrast, CDL-1-depleted embryos exhibited
abnormal GFP::CENP-AHCP-3 localization (Figure 2C), consis-
tent with defective chromosome condensation (Figure 2A).
GFP::b-tubulin signal for the indicated conditions. Background-subtracted
mean value. Scale bar, 10 mm.
ntrol) worms. b-actin serves as a loading control. Molecular weight markers (in

A
B
C
D E
F G
Figure 2. CSR-1 Inhibition Does Not Perturb Chromosome Structure or Centromere/Kinetochore Architecture in One-Cell Embryos
(A) Images from the nuclear region from time-lapse sequences of one-cell embryos expressing GFP:H2b and GFP:g-tubulin. Arrows highlight features of the
chromosome structure at different stages in control, csr-1(RNAi), and cdl-1(RNAi) that are discussed in the text. Scale bar, 10 mm.
(B) Schematic summary of C. elegans centromere/kinetochore assembly.
(C) Single-plane confocal images of GFP::CENP-AHCP-3 for the indicated conditions. Two examples are shown per condition. Scale bar, 5 mm.
(D) Line scan analysis of GFP::CENP-AHCP-3 fluorescence on condensed chromosomes. 5 pixel-wide individual line scans of single chromosomes were
normalized based on peak intensity, centered on the valley between the peaks of GFP signal, and averaged. Error bars represent SD. Control, n = 14 chro-
mosomes from six embryos. csr-1(RNAi), n = 11 chromosomes from nine embryos.
(E) Single-plane confocal image of GFP::CENP-AHCP-3 in a rare one-cell embryo derived from a csr-1(tm892) homozygous worm. Scale bar, 5 mm.
(F) Single-plane confocal images for the indicated GFP-fused kinetochore components. See also Figure S2B. Scale bar, 5 mm.
(G)Maximum intensity z stackprojectionsofprometaphaseandmetaphasestageone-cellcsr-1(tm892)embryos rescuedbyexpressionofGFP::CSR-1 fromasingle-
copy transgene (Figures S2C–S2E). The embryos also express mCherry::H2b. The magnified images of boxed regions are shown on the right. Scale bars, 5 mm.
See also Figure S2 and Tables S2 and S3.
These results were confirmed by analysis of rare one-cell em-
bryos from the csr-1(tm892) null mutant, which has severely
reduced fertility (Figures 2E and S2A), and by analysis of three
outer kinetochore components (Figure 2B; Cheeseman et al.,
2004): KNL-3, MIS-12, and KBP-4 (Figures 2F and S2B). Thus,
CSR-1 depletion does not lead to detectable alterations in
Cell 165, 396–409, April 7, 2016 399

centromere/kinetochore architecture at the resolution of light
microscopy.
In strains in which the sole source of CSR-1 was GFP::CSR-1
encoded by a functional single-copy transgene (Figures S2C and
S2D), we observed the previously described P-granule localiza-
tion (Figure S2E) but no detectable GFP signal on chromosomes
in oocytes (Figure S2E) or early mitotic embryos (Figure 2G).
Thus, there is not a substantial population of CSR-1-22G RNA
complexes enriched on mitotic chromatin. We conclude that
CSR-1 inhibition leads to greatly reducedmicrotubule assembly,
but not to detectable defects in chromosome or centromere/
kinetochore structure.
CSR-1 Slicing Activity Is Required for Its Function inEmbryos and in the GermlineTo investigate the function of CSR-1 slicing activity, we gener-
ated single-copy untagged RNAi-resistant transgenes encoding
WTCSR-1 and a Slicing Inactive (SIN) mutant in which the aspar-
tate active-site residues of slicing Argonautes (D606, D681 in
CSR-1b; Aoki et al., 2007; Yigit et al., 2006) were mutated to
alanines (Figures 3A and S3A). Whereas transgene-encoded
CSR-1WT rescued the lethality associated with depletion of
endogenous CSR-1, CSR-1SIN did not (Figure 3B). The same
result was obtained by crossing the transgenes into the csr-
1(tm892) mutant (data not shown). CSR-1WT, in a homozygous
csr-1(tm892) background, was expressed at a level similar to
endogenous CSR-1 in control N2 worms (Figure 3C). In contrast,
despite expression from a single copy targeted transgene with
an identical promoter and 50 and 30 UTR regions, CSR-1SIN
was overexpressed (Figures 3C and S3B), suggesting that
CSR-1 slicing autoregulates its own expression (see below).
The one-cell embryo phenotypes in the presence of CSR-1SIN,
including a severe reduction in microtubule assembly, were
essentially identical to those observed following CSR-1 deple-
tion (Figures 3D–3G and S3C). We conclude that the early em-
bryonic functions of CSR-1 depend on its slicing activity.
Mutational inactivation of csr-1 leads to a significant reduc-
tion in brood size (Figures 3H and S2D), and the germlines of
both csr-1(tm892) null and csr-1SIN;csr-1(tm892) slicing activity
mutant worms exhibited increased apoptotic figures and multi-
nucleation (Figure S3D). Interestingly, csr-1SIN;csr-1(tm892)
worms laid �2-fold more embryos than csr-1(tm892) worms,
suggesting a potential slicing activity-independent contribution
of CSR-1 to embryo production. Like CSR-1WT, a GFP fusion
with CSR-1SIN still localized to perinuclear P granules in the
germline of L4 larvae (Figure S3E); in adult worms, the overex-
pressed CSR-1SIN slicing mutant formed aggregates in addition
to perinuclear granules (data not shown). We conclude that
CSR-1 catalytic activity is important for embryonic divisions
and for normal germline function.
CSR-1 Slicing Activity Restricts Expression of theMicrotubule Depolymerase MCAKKLP-7
The embryonic phenotypes resulting from selective ablation
of CSR-1 slicing activity suggest that CSR-1 slicing activity
controls expression of a target or set of targets that regulate
microtubule assembly. Examination of prior sequencing data
(Claycomb et al., 2009) to identify genes encoding microtubule
400 Cell 165, 396–409, April 7, 2016
regulators with homology to CSR-1-bound 22G RNAs revealed
that klp-7, the gene encoding the sole MCAK-related kinesin-
13 in C. elegans, was ranked fifth out of 4,191 genes with >25
normalized reads; csr-1 itself was ranked 15th (Figure S4A).
MCAKKLP-7 is a non-motile kinesin that acts as a potent microtu-
bule-depolymerizing enzyme, triggering growing microtubules
to transition from polymerization to depolymerization (Figure 4A;
Desai et al., 1999). To determine whether increased MCAKKLP-7
expression was responsible for the reduced microtubule assem-
bly in embryos lacking CSR-1 slicing activity, we first measured
klp-7 and csr-1mRNA levels by RT-qPCR and followed that with
quantitative immunoblotting (performed as described in Fig-
ure S4B). Since levels of MCAKKLP-7 in N2 and csr-1WT;csr-
1(tm892) were equivalent (Figure S4C), as also shown for
CSR-1 (Figure 3C), we employed a balanced heterozygous
csr-1(tm892) mutant strain homozygous for the csr-1SIN trans-
gene, picked equal number of first generation homozygous
csr-1SIN;csr-1(tm892) or control N2 worms, and isolated RNA
or prepared extracts for immunoblotting. Both klp-7 and csr-1
mRNAs were significantly elevated in the csr-1SIN;csr-1(tm892)
mutant (Figure 4B), indicating that CSR-1 slicing activity sup-
presses their levels. Immunoblotting of whole-worm extracts
revealed consistent �3.5- and 3-fold elevation of MCAKKLP-7
and CSR-1SIN protein levels, respectively (Figures 4C and
S3B). Equivalent elevation of MCAKKLP-7 was also observed
following CSR-1 depletion (Figure 4C).
To determine if the 3.5-fold elevation of MCAKKLP-7 protein
accounted for the reduced microtubule assembly in CSR-1-
depleted embryos, we employed a 1:16 ratio of double-
stranded RNAs (dsRNAs) targeting MCAKKLP-7 and CSR-1 to
reduce MCAKKLP-7 to 0.35- to 0.5-fold of wild-type (WT) levels,
while maintaining CSR-1 depletion (Figure 4D). Eliminating
MCAKKLP-7 elevation rescued the microtubule assembly defect
in CSR-1-depleted one-cell embryos (Figure 4E), indicating that
MCAKKLP-7 elevation accounts for this prominent defect asso-
ciated with loss of CSR-1 function. However, reduction of
MCAKKLP-7 did not rescue the chromosome missegregation in
CSR-1-depleted embryos (Figure 4F) or restore embryonic
viability (data not shown), indicating it is not the sole CSR-1
target whose overexpression leads to embryonic division de-
fects. Examination of a strain expressing a functional fusion
with GFP integrated just before the stop codon at the endoge-
nous klp-7 locus revealed that CSR-1 depletion led to the
significant elevation of MCAKKLP-7::GFP fluorescence in the
germline (Figure 4G). This result suggests that excess mater-
nally loaded MCAKKLP-7 underlies the severe microtubule as-
sembly defect in CSR-1-depleted and CSR-1 slicing activity
mutant embryos.
CSR-1 Slicing Activity Controls Protein Levels of aNumber of Components Implicated in Embryonic CellDivisionsWhile elevated MCAKKLP-7 expression accounts for the microtu-
bule assembly defect in CSR-1-inhibited one-cell embryos,
other targets are also likely misregulated. To begin to assess
the scope of CSR-1 slicing activity-mediated regulation, we
employed 44 validated antibodies against C. elegans proteins
important for embryonic cell division and/or germline function

A B C
DE
F
HG
Figure 3. Selective Mutation of CSR-1 Slicing Activity Phenocopies CSR-1 Depletion in One-Cell Embryos
(A) Schematics ofWT and slicing-inactive (SIN) CSR-1 expressed from targeted single-copy RNAi-resistant transgene insertions (see Figure S3A). The amino acid
numbering is for the CSR-1b isoform, which is essential for embryogenesis.
(B) Analysis of embryo viability for the indicated conditions. n is the number of worms analyzed; >977 progeny embryos were scored per condition. Error bars
represent SD.
(C) Immunoblotting of CSR-1 in the indicated conditions. The numbers above the lanes indicate percent loading, based on number of worms. a-tubulin served as
a loading control.
(D) Images from time-lapse sequences of one-cell embryos expressing GFP:H2b and GFP::g-tubulin, for the indicated conditions. Time is in seconds relative to
anaphase. Scale bar, 10 mm.
(E) Spindle positioning relative to the embryo A-P axis, measured at metaphase as in Figure 1C, for the indicated conditions.
(F) Spindle angle relative to the embryo A-P axis at metaphase, measured as in Figure 1D, for the indicated conditions.
(G) Representative images (left) and quantification (right) of metaphase spindle GFP::b-tubulin signal for the indicated conditions, measured as in Figure 1E. Error
bars represent SD. Scale bar, 10 mm.
(H) Brood size per worm measured for first generation csr-1(tm892) homozygous worms, derived from balanced heterozygous mothers. When present, single-
copy insertion csr-1 transgenes were already homozygous in the balanced mothers.
See also Figure S3 and Tables S2, S3, and S25.
Cell 165, 396–409, April 7, 2016 401

A B C
D F
GE
Figure 4. MCAKKLP-7 Overexpression Under-
lies the Reduced Microtubule Assembly in
CSR-1-Inhibited One-Cell Embryos
(A) Schematic of MCAKKLP-7 activity. MCAKKLP-7
promotesmicrotubule disassembly by triggering the
transition from polymerization to depolymerization.
(B) Comparison of mRNA levels in csr-
1SIN;csr-1(tm892) worms to N2 wild-type worms for
the indicated genes; actin mRNA measured in par-
allel was used for normalization. Three replicates
were analyzed per gene; the SD of replicate values
was <1%, and their average is plotted from two
experiments (light red dots; the gray bar is the mean
of the two experiments). The red dashed line in-
dicates no change in mRNA levels.
(C) Immunoblot analysis of MCAKKLP-7 and CSR-1
for the indicated conditions. The graph on the right
plots the measurement of protein levels by immu-
noblotting normalized relative to b-actin. Each dot
represents an independent measurement. The red
dashed lined indicates no change in protein levels.
(D and E) Co-depletion of CSR-1 and MCAKKLP-7,
analyzed by immunoblotting (D) and imaging of
GFP::b-tubulin (E). A mixture with a 1:16 ratio of
dsRNAs targeting klp-7 and csr-1 was employed
in these experiments. Metaphase spindle GFP-
b-tubulin signal was measured as in Figure 1E. Error
bars represent SD. Scale bar, 10 mm.
(F) Images of an anaphase stage one-cell embryo
co-depleted for CSR-1 and MCAKKLP-7. Inset in the
mCh::H2b channel shows lagging chromatin; fre-
quency of lagging chromatin is indicated below the
images. Scale bar, 10 mm.
(G) Images and quantification of endogenous locus-
taggedMCAKKLP-7::GFP in the proximal region of the
germline. A region outside the worm was used for
backgroundsubtraction (boxmarked ‘‘bkgd’’).Afixed
sizebox (yellowoutline; 3603 70pixels)wasdrawn in
the proximal germline region of imaged worms to
measure MCAKKLP-7::GFP fluorescence. Back-
ground-subtracted fluorescence intensity values,
normalized to the control mean value, are plotted in
thegraphbelow.Theblue linesmark themeanvalues;
error bars represent SD. Scale bar, 10 mm.
See also Figure S4 and Tables S2, S3, S4, and S5.
(Figure 5A). The genes encoding all of these proteins have >25
normalized reads of homologous CSR-1-bound 22G RNAs
(Claycomb et al., 2009). As a control, we monitored PTRN-1 (pa-
tronin), a microtubule minus-end binding protein not expressed
in the germline (Wang et al., 2015) that does not have homolo-
gous CSR-1-bound 22G RNAs. Protein levels in homozygous
csr-1SIN;csr-1(tm892) worm extract were compared to a stan-
dard curve for wild-type N2 worm extract on the same gel
(Figure 5B); actin was used to normalize loading. Blots were
quantified when the intensity of the test protein and loading con-
trols in the csr-1SIN;csr-1(tm892) lane fell within the N2 standard
curve or required limited extrapolation (Figure S4B). The majority
of target blots were repeated 2–5 times; while the results were
consistent between repeats, the criteria for quantification were
only met in the subset of experiments that are plotted. This anal-
ysis revealed elevated expression of 25 of the 44 targets in the
402 Cell 165, 396–409, April 7, 2016
absence of CSR-1 slicing activity (Figures 5B and 5C; 19 [43%]
targets >1.5-fold and 25 [57%] targets > PTRN-1). For the
remaining targets, protein expression either did not change
significantly (12 targets = 27%) or was decreased (<0.8-fold;
7 targets = 16%). To assess if reduced protein levels of specific
targets reflected a positive role for CSR-1 slicing activity in tran-
scription, wemeasuredmRNA levels for six target genes—two of
which exhibit elevated protein levels (spdl-1 and spd-2) and four
of which exhibit reduced protein levels (sgo-1, ani-1, npp-12, and
gsp-1)—as well as for the control ptrn-1. We did not observe
reduced mRNA levels for any of the tested CSR-1 target genes
(Figure 5D). Thus, the reduction in protein levels for some targets
is not due to reduced transcript levels and may reflect a role
for CSR-1 slicing activity in translation of specific mRNAs or be
an indirect consequence of germline defects in csr-1SIN;csr-
1(tm892) worms (Figures 3H and S3D).

KLP-19
Actin
100 75 50 25 (50)
140
Actin
SPD-5100
140100 77 55 2240 (40)
Actin
PLK-1
100 77 55 2240 (30)
70
RGA-3
Actin
SPDL-1
100 77 55 2240 (50)
70
50
140
csr-1(tm892)+
csr-1SIN N2
kD
*
HCP-6
Actin
100 77 55 2240 (40)
140
260
C
E
BHC
P-6
KLP-
7CS
R-1CL
S-2SP
DL-1
KLP-1
9HC
P-1
ZEN-4
RGA-3
LET-5
02SP
D-5PL
K-1TA
C-1BU
B-1SP
D-2BM
K-1HC
P-2 ICP-1
KNL-1
UNC-6
0SA
S-4 AIR-2
LPIN-
1EC
T-2SM
C-4RA
B-7BU
B-3CY
K-1KN
L-2SC
C-3HC
P-3 ANI-1
UNC-5
9TB
G-1RA
B-1EE
A-1SP
D-1SG
O-1 IFY-1
KBP-3 ANI-2
NPP-1
2GS
P-1PT
RN-10
1
2
3
4
MDF-1
Fold change in protein level(csr-1SIN;csr-1(tm892) relative to N2)
A
D
012345678
1 2 3 4 5 6 7spd-2spdl-1 sgo-1 npp-12ani-2 gsp-1 ptrn-1
1 2 3 4 5 6 7
Fold change in mRNA(csr-1SIN;csr-1(tm892) relative to N2)
Centrosome(SPD-2, SDP-5, TBG-1, SAS-4, TAC-1, PLK-1*, KLP-7*)
Centromere/Kinetochore(HCP-1, HCP-2, HCP-3, KNL-1, KNL-2, KBP-3, BUB-1, BUB-3, MDF-1, SPDL-1, CLS-2, KLP-7*, PLK-1*, GSP-1*)
Furrow/Cortex(ANI-1, UNC-59, UNC-60, ECT-2,RGA-3, LET-502, CYK-1)
Chromosome(SMC-4, HCP-6, SCC-3, KLP-19*, SGO-1, GSP-1*, AIR-2*, ICP-1*)
Midzone(SPD-1, ZEN-4, AIR-2*,
ICP-1*, BMK-1, KLP-19*)
Other:RAB-1, RAB-7, EEA-1LPIN-1, NPP-12, IFY-1,
ANI-2, CSR-1
(*Dual Localization)
44 Antibody Targets
140260
100
(38)
HCP-1
MDF-1
Actin
100 84 56 38 19
r=0.73
Fold
chan
ge in
pro
tein
leve
l(cs
r-1SI
N ;csr-1
(tm89
2) re
lative
to N
2)
Number of 22G RNA Reads in CSR-1 IP (Normalized)
0 500 1000 1500 20000
1
2
3
4
Figure 5. CSR-1 Slicing Activity Modulates Expression of Multiple Targets that Participate in Embryonic Cell Division
(A) Schematic of 44 targets employed for analysis of CSR-1 slicing activity-dependent changes in protein levels.
(B) Representative immunoblots comparing protein levels in the absence of CSR-1 slicing activity to a N2 wild-type standard curve. Actin serves as a loading
control. The numbers above the lanes indicate percent loading, based on number of worms. The numbers above the test sample are shown in parentheses, as
loading was calculated based on the actin standard curve (Figure S4B). A red asterisk indicates a background band.
(C) Plot of protein-level measurements for all targets, comparing csr-1SIN;csr-1(tm892) worms to a standard curve of N2 wild-type. The light red dots represent
individual measurements. The dashed red line marks no change in protein level.
(D) RT-qPCR analysis, as in Figure 4B, comparing mRNA levels in csr-1SIN;csr-1(tm892) worms to N2 wild-type worms for the indicated genes (their corre-
sponding gene products are marked with circled numbers on Figure 5C).
(E) Correlation plot of the change in the level of a target protein to the normalized read count of CSR-1-bound 22GRNAs that are homologous to its encoding locus
(22G RNA read data are from Claycomb et al., 2009).
See also Figure S5 and Tables S2, S4, and S5.
The list of proteins whose expression was elevated �2-fold in
the absence of CSR-1 slicing activity included the centrosomal
proteins SPD-2 and SPD-5 (Figures 5B and 5C). SPD-2 is the
C. elegans homolog of the human pericentriolar material (PCM)
protein Cep192 and SPD-5 is the major PCM scaffold protein
in C. elegans (Hamill et al., 2002; Woodruff et al., 2015). Prior
work has shown that centrosome size is component limited,
with increased protein levels leading to increased centrosome
size (Decker et al., 2011). Consistent with this, we observed
�2-fold increase in centrosome size in csr-1SIN;csr-1(tm892)
mutant embryos (Figure S5), supporting the conclusion that an
imbalance in the maternal load caused by loss of CSR-1 slicing
activity has functional consequences in the early embryo.
Plotting the fold change in each target protein’s level against
the normalized reads of CSR-1-bound 22G RNAs homologous
to the gene encoding that protein (from Claycomb et al., 2009)
Cell 165, 396–409, April 7, 2016 403

revealed a correlation (r = 0.73) between the abundance of
CSR-1-bound 22G RNAs and the effect of loss of CSR-1 slicing
activity on target protein expression (Figure 5E). This correlation
suggests that transcripts with greater numbers of homologous
CSR-1-bound 22G RNAs are sliced to a greater extent by
CSR-1 than those with fewer homologous CSR-1-bound 22G
RNAs. Thus, analysis of protein levels suggests that CSR-1
slicing activity tunes down the expression of a significant pro-
portion of its target genes and that the magnitude of the tuning
correlates with the abundance of CSR-1-bound 22G RNAs.
CSR-1 Slicing Activity Tunes Target mRNAs in a GradedFashion Dictated by 22G RNA DensityThe phenotypic and immunoblotting analysis suggested that
CSR-1 slicing activity is critical to generate a balanced maternal
load capable of supporting early embryonic divisions. Since the
immunoblotting analysis was restricted to proteins for which we
had validated antibodies, we next performedmRNA Sequencing
(mRNA-Seq) analysis to obtain an unbiased genome-wide view
of the role of CSR-1 slicing activity in regulating target mRNA
levels. We isolated mRNA from first-generation adult worms ho-
mozygous for the csr-1 deletion and for transgenes encoding
CSR-1WT or CSR-1SIN. N2 wild-type worms were picked in par-
allel, and two biological duplicates were processed for the three
genotypes (Figures S6A and S6B). The CSR-1WT mapped read
profile was essentially identical to N2 (Figure S6B). With an
expression threshold of RPKM >1 in N2 (RPKM, reads per kilo-
base of transcript per million reads) and a transcript size (defined
as sum of annotated exons) >300 bp, we had 11,220 genes
available for comparison between the CSR-1SIN and CSR-1WT
datasets.
We were particularly interested in the effect of CSR-1 catalytic
activity on the expression of genes with homology to CSR-1-
bound 22G RNAs. 4,101 (97.9%) of the 4,191 genes with
homology to CSR-1-bound 22G RNAs in N2 hermaphrodites
(Claycomb et al., 2009) met the RPKM and transcript size thresh-
olds (Figure 6A); 3,866 of these 4,101 genes (94%) are in the
germline-expressed gene set defined by sequencing analysis
of dissected gonads (Ortiz et al., 2014). Based on the correlation
between the abundance of CSR-1-bound 22GRNAs and change
in protein levels by immunoblotting (Figure 5E), we hypothesized
that whenCSR-1’s catalytic activity is inhibited, the transcripts of
genes that are more highly represented in the ensemble of CSR-
1-22G RNA complexes increase to a greater degree than tran-
scripts of genes with fewer corresponding CSR-1 22G RNAs.
To test this prediction, we plotted the fold change in transcript
level (CSR-1SIN/CSR-1WT) versus the ‘‘density’’ of 22G RNAs,
which we defined as the ratio of CSR-1-bound 22G RNA reads
to transcript abundance (RPKM) in N2 wild-type worms, for all
4,101 genes (Figure 6A). This analysis revealed a clear correla-
tion between 22G RNA density and elevation of transcript levels
in CSR-1SIN versus CSR-1WT (Figure 6B; Pearson correlation co-
efficient = 0.59). To visualize the positive correlation between
increasing CSR-1 22GRNAdensity and the increase in transcript
levels in CSR-1SIN relative to CSR-1WT in a different manner, we
split the 4,101 gene set into five bins of increasing CSR-1 22G
RNA density and plotted the change in transcript abundance be-
tween CSR-1SIN and CSR-1WT for the genes in each bin (Figures
404 Cell 165, 396–409, April 7, 2016
6C and S6C). This analysis suggested graded tuning of transcript
levels by CSR-1 slicing activity from low to high 22G RNA den-
sities, rather than activity above a specific 22G RNA density
threshold. We conclude that CSR-1 catalytic activity broadly
tunes the transcript levels of genes with homologous CSR-1-
bound 22G RNAs, with the amplitude of its tuning being dictated
by 22G RNA density.
We noticed that the baseline when comparing transcript levels
of the 4,101 genes with CSR-1 22G RNA homology between
CSR-1SIN andCSR-1WTwas lower than1.0 (i.e., log2foldchange<
0.0 at low 22G RNA densities; Figures 6B and 6C). Consistent
with this, the distribution of fold change (CSR-1SIN/CSR-1WT) in
transcript levels for the 4,101 genes with homology to CSR-1-
bound 22G RNAs was slightly skewed to a negative value
(median �0.17; mean �0.09; Figures 6D, 6E, and S6D). Since
CSR-1-bound 22G RNAs are primarily homologous to germ-
line-expressed genes, we wondered whether this mild negative
skew reflected a direct effect or was an indirect consequence
of the effect of inhibiting CSR-1 activity on germline architecture
(Figures 3H and S3D). To distinguish between these possibilities,
we analyzed 2,101 germline-enriched genes, definedbymicroar-
ray-based comparison of a mutant that lacks a germline to con-
trol wild-type worms (Reinke et al., 2004). A majority (1,665/
2,101) of the germline-enriched genes have homologous CSR-
1 22G RNAs, while a small subset (436/2,101) lack CSR-1 22G
RNA homology (Figure 6D); 90% of the 436 genes in this subset
were confirmed to be germline expressed by RNA sequencing
of isolated gonads (Ortiz et al., 2014). The germline-enriched
gene subset without CSR-1 22G RNA homology also exhibited
a negatively skewed fold-change distribution (median –0.35;
mean –0.25; Figures 6E and S6D). Thus, the modest reduction
in transcript levels for germline genes (both with and without ho-
mologous CSR-1-bound 22G RNAs) is potentially an indirect
consequence of the effects of inhibiting CSR-1 slicing activity
on germline architecture (Figures 3H and S3D).
Finally, we identified genes whose transcript levels increased
most significantly between CSR-1SIN and CSR-1WT (>2-fold
with adjusted p value < 0.05; we note that the germline architec-
ture defects in CSR-1SIN may make this an underestimate). This
analysis revealed 344 genes, 133 of which were in the gene set
defined by homology to CSR-1-bound 22G RNAs and included
expected genes such as klp-7, csr-1, and spd-5 (Table S1).
Notably, 211 of the 344 genes whose transcript levels increased
>2-fold did not have reported CSR-1-bound 22G RNAs (Table
S1). A comparison of transcript abundance revealed that this
211 gene set is expressed at substantially lower levels compared
to the 133 genes with homology to CSR-1-bound 22G RNAs
(Figure S6E). Thus, it is possible that there are CSR-1-bound
22G RNAs homologous to these 211 genes that have not been
detected/did not meet thresholds due to low abundance. 194
of these 211 genes (92%) were not germline-enriched (as
defined by (Reinke et al., 2004) and 103 (49%) were absent
from the most comprehensive germline-expressed gene set (Or-
tiz et al., 2014). Thus, if these are indeed CSR-1 regulated genes,
a significant subset may be acting in non-germline contexts.
Additional work will be necessary to test whether these genes
are indeed CSR-1 catalytic activity-regulated and to assess the
functional significance of their regulation.

A
B
D
F
E
C
(legend on next page)
Cell 165, 396–409, April 7, 2016 405

DISCUSSION
CSR-1 is unique among the 27 C. elegans Argonautes in that its
inhibition leads to immediate and severe embryonic division
phenotypes. While prior studies have ascribed many potential
roles to CSR-1, they have discounted slicing activity-dependent
control of target expression. Here, by focusing on phenotypic
signatures in the one-cell embryo, we show that CSR-1 function
in embryonic cell division is entirely dependent on its slicing
activity. This is consistent with biochemical data showing that
CSR-1 provides the dominant slicing activity in C. elegans ex-
tracts (Aoki et al., 2007) and with increased mRNA levels for
genes such as klp-7 and csr-1 in ego-1 mutants, where 22G
RNA production is inhibited (Maniar and Fire, 2011). Notably,
many CSR-1 targets have essential functions; thus, CSR-1
slicing activity, guided by the small RNA biogenesis machinery,
tunes, rather than silences, target expression (Figure 7). Below,
we discuss the relationship of this finding to other proposed
roles for CSR-1, the relevance of the mechanism described
here to other species, and the potential reasons why small
RNA-catalytic Argonaute pathways may have evolved to pro-
vide a post-transcriptional layer of regulation in the female
germline.
Relationship of Tuning Activity to Previously ProposedRoles of CSR-1An important question emerging from our work is the relationship
of CSR-1 slicing activity-dependent target tuning to its other pro-
posed functions. Given the misregulation of a substantial num-
ber of targets, the assumption in prior studies that CSR-1 does
not significantly control target expression is not valid. The rea-
sons for this discrepancy are not clear but may involve technical
differences—in the initial study of csr-1 mutants, microarrays
were employed instead of sequencing (Claycomb et al., 2009);
in a recent study employing sequencing (Campbell and Updike,
2015), CSR-1 was depleted by feeding-based RNAi, which has
relatively low penetrance. Our analysis also focused on expres-
sion changes as a function of CSR-1 22GRNAdensity, instead of
treating the set of genes with homology to CSR-1 22GRNAs as a
single entity and imposing a fixed threshold. Regardless of the
precise reasons, our findings show that a substantial number
of targets are tuned by CSR-1 catalytic activity, with 133 highly
tuned targets (such as MCAKKLP-7, CSR-1, and SPD-5; Table
Figure 6. Genome-wide Analysis Reveals Tuning Down of mRNA Levels
(A) Venn diagram showing the 11,220 genes that meet the RPKM>1 in N2 and tran
1-bound 22G RNAs in N2 hermaphrodites (>25 normalized reads; Claycomb et a
(B) Plot of the change in mRNA levels between CSR-1SIN and CSR-1WT versus t
bound 22G RNAs. 22G RNA density was calculated as the ratio of normalized re
(C) Box-whiskers plot (5th–95th percentile) of the change in mRNA levels between C
median are indicated by red solid and black dashed lines, respectively. Each bin is
The same plot with outliers is shown in Figure S6C.
(D) Venn diagram of gene sets; 4,101 genes have homologous CSR-1-bound 22G
(Claycomb et al., 2009). 436 of the germline-enriched genes do not overlap with
(E) Box-whiskers plot (5th–95th percentile) of the change in mRNA levels between
indicated by black solid and black dashed lines, respectively. the indicated p va
(F) 344 genes exhibit >2-fold, significant (padj < 0.05) increase in mRNA levels in CS
RNA gene set (green); the genes that do not overlap (gray) are expressed at sign
See also Figure S6 and Tables S1 and S2.
406 Cell 165, 396–409, April 7, 2016
S1), and lower amplitude tuning of a large proportion of germ-
line-expressed targets. Tuning of major targets, such as
MCAKKLP-7, is essential, as elevated MCAKKLP-7 levels lead to
severe phenotypes; the net effect of lower amplitude tuning of
a large number of germline transcripts likely also contributes to
embryo fitness. The fact that CSR-1 activity autoregulates its
own expression is consistent with its role as a tissue-widemaster
regulator, by analogy with developmentally critical transcription
factors that often employ autoregulation to control of their own
levels (Crews and Pearson, 2009).
The fact that CSR-1-22G RNA complexes control target
expression complicates interpretation of other proposed roles
for the CSR-1-22G RNA pathway. We discuss a subset of these
roles below but, more broadly, highlight the need to re-evaluate
prior work in light of the results reported here.
Chromosome Organization and Segregation
Our initial motivation to study CSR-1 was based on its proposed
role in chromosome/centromere organization (Claycomb et al.,
2009). While our results confirm a centrally important role for
the CSR-1-22G RNA pathway in chromosome segregation,
they do not support a direct role for CSR-1-22G RNA complexes
in patterning holocentric chromosome structure. The phenotypic
differences between depletion of the histone mRNA stem-loop-
binding factor CDL-1 and CSR-1 inhibition also suggest that
a role in histonemRNAmaturation does not account for the chro-
mosome segregation defects associated with loss of CSR-1 ac-
tivity. Instead, CSR-1 controls chromosome segregation in part,
but not exclusively, via control of a key regulator of microtubule
dynamics—the microtubule depolymerase MCAKKLP-7.
P-Granule Assembly and Fertility
The CSR-1 slicing activity mutant exhibits the same phenotypic
profile as loss of CSR-1 with two exceptions: the slicing mutant
has a higher brood size than the null mutant and does not appear
to disrupt perinuclear P granules in the germline, as reported pre-
viously for a csr-1 mutant and csr-1(RNAi) (Campbell and Up-
dike, 2015; Claycomb et al., 2009). Recent work suggests that
knockdown of csr-1 or of P-granule components leads to inap-
propriate expression of spermatogenesis genes (Campbell and
Updike, 2015). In the CSR-1 catalytic activity mutant, there
was only a mild increase in mRNA levels of spermatogenesis
genes (2,641 genes defined by Ortiz et al., 2014; the mean
log2foldchange for this gene set in CSR-1SIN versus CSR-1WT
was 0.39 [1.3-fold]; the median was 0.32 [1.25-fold]; RPKM >1
by CSR-1 Catalytic Activity that Is Correlated with 22G RNA Density
script length >300 bp thresholds; 4,101 of these genes have homology to CSR-
l., 2009).
he density of CSR-1 22G RNAs for the 4,101 genes with homologous CSR-1-
ads to the transcript abundance (RPKM) in N2.
SR-1SIN and CSR-1WT for gene sets of increasing 22G RNA density. Mean and
significantly different from the prior bin; the indicated p values are from t tests.
RNAs. 2,101 genes are germline-enriched, based on prior microarray analysis
the 4,101 CSR-1 22G RNA homology gene set.
CSR-1SIN and CSR-1WT for the indicated gene sets. The mean and median are
lues are from t tests. See also Figure S6D.
R-1SIN relative to CSR-1WT. Of the 344 genes, 133 overlap with the CSR-1 22G
ificantly lower levels than the ones that do (see Figure S6E; Table S1).
Mitotic TipPachytene
Oocytes Sperm
TransitionZone
Embryos
GERMLINE
AAA
AAA
AAAAAAAAA
AAAAAAAAA
AAA
AAAAAAAAA
22G RNA Biogenesis(EGO-1/DRH-3/EKL-1)
CSR-1–22G RNA Complexes
Pachytene Nuclei in Germline(Transcriptionally Active)
Tuned Maternal Load in Oocytes
Embryogenesis
Output
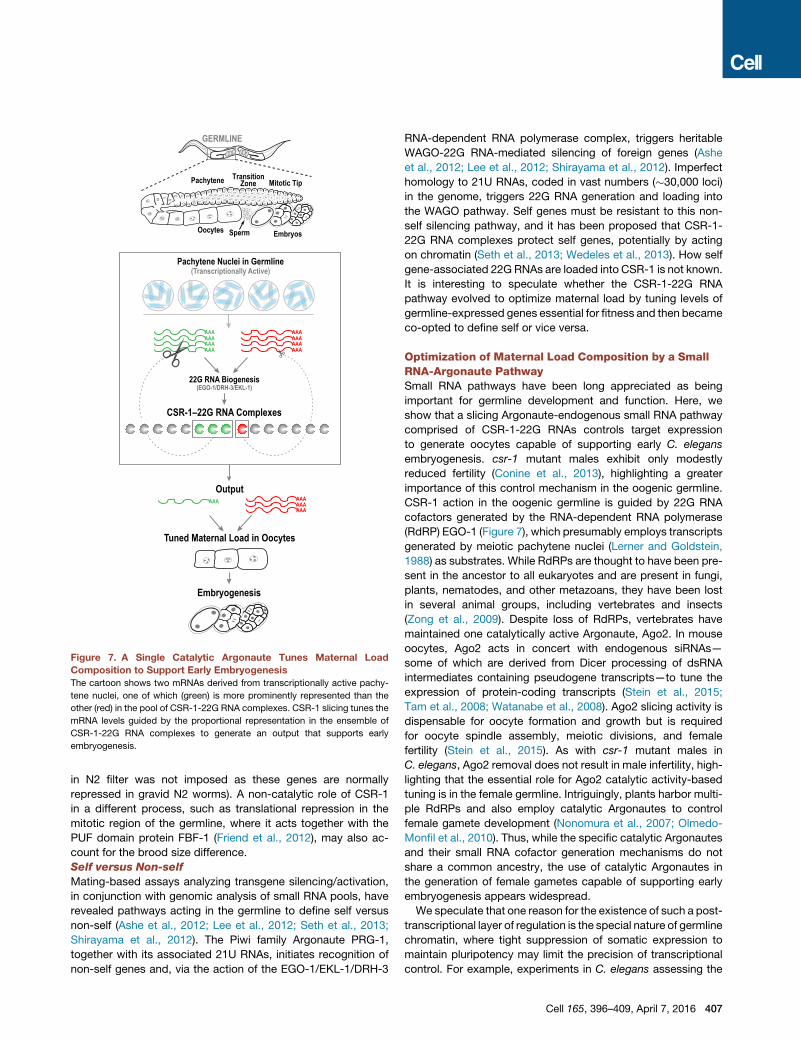
Figure 7. A Single Catalytic Argonaute Tunes Maternal Load
Composition to Support Early Embryogenesis
The cartoon shows two mRNAs derived from transcriptionally active pachy-
tene nuclei, one of which (green) is more prominently represented than the
other (red) in the pool of CSR-1-22G RNA complexes. CSR-1 slicing tunes the
mRNA levels guided by the proportional representation in the ensemble of
CSR-1-22G RNA complexes to generate an output that supports early
embryogenesis.
in N2 filter was not imposed as these genes are normally
repressed in gravid N2 worms). A non-catalytic role of CSR-1
in a different process, such as translational repression in the
mitotic region of the germline, where it acts together with the
PUF domain protein FBF-1 (Friend et al., 2012), may also ac-
count for the brood size difference.
Self versus Non-self
Mating-based assays analyzing transgene silencing/activation,
in conjunction with genomic analysis of small RNA pools, have
revealed pathways acting in the germline to define self versus
non-self (Ashe et al., 2012; Lee et al., 2012; Seth et al., 2013;
Shirayama et al., 2012). The Piwi family Argonaute PRG-1,
together with its associated 21U RNAs, initiates recognition of
non-self genes and, via the action of the EGO-1/EKL-1/DRH-3
RNA-dependent RNA polymerase complex, triggers heritable
WAGO-22G RNA-mediated silencing of foreign genes (Ashe
et al., 2012; Lee et al., 2012; Shirayama et al., 2012). Imperfect
homology to 21U RNAs, coded in vast numbers (�30,000 loci)
in the genome, triggers 22G RNA generation and loading into
the WAGO pathway. Self genes must be resistant to this non-
self silencing pathway, and it has been proposed that CSR-1-
22G RNA complexes protect self genes, potentially by acting
on chromatin (Seth et al., 2013; Wedeles et al., 2013). How self
gene-associated 22G RNAs are loaded into CSR-1 is not known.
It is interesting to speculate whether the CSR-1-22G RNA
pathway evolved to optimize maternal load by tuning levels of
germline-expressed genes essential for fitness and then became
co-opted to define self or vice versa.
Optimization of Maternal Load Composition by a SmallRNA-Argonaute PathwaySmall RNA pathways have been long appreciated as being
important for germline development and function. Here, we
show that a slicing Argonaute-endogenous small RNA pathway
comprised of CSR-1-22G RNAs controls target expression
to generate oocytes capable of supporting early C. elegans
embryogenesis. csr-1 mutant males exhibit only modestly
reduced fertility (Conine et al., 2013), highlighting a greater
importance of this control mechanism in the oogenic germline.
CSR-1 action in the oogenic germline is guided by 22G RNA
cofactors generated by the RNA-dependent RNA polymerase
(RdRP) EGO-1 (Figure 7), which presumably employs transcripts
generated by meiotic pachytene nuclei (Lerner and Goldstein,
1988) as substrates. While RdRPs are thought to have been pre-
sent in the ancestor to all eukaryotes and are present in fungi,
plants, nematodes, and other metazoans, they have been lost
in several animal groups, including vertebrates and insects
(Zong et al., 2009). Despite loss of RdRPs, vertebrates have
maintained one catalytically active Argonaute, Ago2. In mouse
oocytes, Ago2 acts in concert with endogenous siRNAs—
some of which are derived from Dicer processing of dsRNA
intermediates containing pseudogene transcripts—to tune the
expression of protein-coding transcripts (Stein et al., 2015;
Tam et al., 2008; Watanabe et al., 2008). Ago2 slicing activity is
dispensable for oocyte formation and growth but is required
for oocyte spindle assembly, meiotic divisions, and female
fertility (Stein et al., 2015). As with csr-1 mutant males in
C. elegans, Ago2 removal does not result in male infertility, high-
lighting that the essential role for Ago2 catalytic activity-based
tuning is in the female germline. Intriguingly, plants harbor multi-
ple RdRPs and also employ catalytic Argonautes to control
female gamete development (Nonomura et al., 2007; Olmedo-
Monfil et al., 2010). Thus, while the specific catalytic Argonautes
and their small RNA cofactor generation mechanisms do not
share a common ancestry, the use of catalytic Argonautes in
the generation of female gametes capable of supporting early
embryogenesis appears widespread.
We speculate that one reason for the existence of such a post-
transcriptional layer of regulation is the special nature of germline
chromatin, where tight suppression of somatic expression to
maintain pluripotency may limit the precision of transcriptional
control. For example, experiments in C. elegans assessing the
Cell 165, 396–409, April 7, 2016 407

effects of ectopic expression of neuronal type-specifying master
transcriptional regulators have shown that the germline is refrac-
tory to fate changes unless global chromatin states are altered
(Tursun et al., 2011). Thus, the female germline appears to
have adapted small RNA-catalytic Argonaute pathways to act
post-transcriptionally in order to optimize maternal load compo-
sition. A post-transcriptional layer of control in the germline may
also leave open promoter-based regulation of target genes in
differentiated cells, where the amount of the gene product
required may be different from what is needed in early embryo-
genesis. For example, MCAKKLP-7 controls dynamics of microtu-
bule arrays in rapidly dividing cells of the earlyC. elegans embryo
but also regulates microtubule dynamics in neurons (Ghosh-Roy
et al., 2012), where a different amount of MCAKKLP-7 activity may
be required.
As CSR-1 slicing is guided by 22G RNA density, nucleotide
changes in the transcript sequence that influence 22G RNA gen-
eration can be translated via CSR-1 slicing activity into changes
in expression level. Thus, we speculate that small RNA-catalytic
Argonaute-mediated post-transcriptional control enables evolu-
tionary optimization of the relative representation of the array of
proteins and RNAs in the maternal load by exerting selective
pressure on randomly occurring sequence changes that modu-
late small RNA generation and, consequently, stoichiometry in
the maternal load. The major question raised by our findings is
precisely how 22G RNA biogenesis by the EGO-1 RNA-depen-
dent RNA polymerase complex is controlled. Understanding
the rules that govern 22G RNA synthesis may be facilitated
by the development of reporters for CSR-1 targets, such as
MCAKKLP-7.
EXPERIMENTAL PROCEDURES
C. elegans strains (Table S2) were maintained using standard methods.
A transposon-based strategy (Frøkjaer-Jensen et al., 2008) was used to insert
csr-1 transgenes in single copy at a defined genomic location on chromosome
2. All csr-1 transgenes included 2,168 bp upstream of the start codon for iso-
form a and 1,048 bp downstream of the stop codon; a segment (Figure S3A)
was modified to preserve coding information but alter nucleotide sequence,
to make transgene-encoded products resistant to a dsRNA that depletes
endogenous CSR-1. RNAi (conducted by injection of dsRNAs; Table S3),
worm dissection, and embryo mounting for live imaging were performed as
previously described (Cheeseman et al., 2004). For the immunoblotting,
qPCR, and mRNA-Seq analysis, first-generation homozygotes for the un-
tagged csr-1 transgene insertion (either WT or SIN) and the csr-1(tm892) null
mutation (Figure S2A) were picked for analysis. Transgene insertions on chro-
mosome 2 were first homozygosed and maintained in balanced csr-1(tm892)
heterozygotes (the csr-1 locus is on chromosome 4; transgene insertions are
on chromosome 2). Homozygous csr-1(tm892) worms were isolated from
balanced heterozygous csr-1(tm892) mothers based on their differential
motility due to a balancer-associated uncmutation. For immunoblotting, equal
numbers of worms of indicated genotypes were picked, washed in buffer, and
boiled with intermittent sonication in sample buffer. For analysis of mRNA
levels of selected genes and mRNA-Seq, total RNA from equal number of
worms was extracted using Trizol. For analysis of mRNA levels, mRNA was
isolated from total RNA and reverse transcribed into cDNA, and qPCR analysis
was performed using the primers listed in Table S4. For mRNA-Seq, libraries
were generated using Illumina TruSeq StrandedmRNA Sample Prep Kit, multi-
plexed, and sequenced with 50-bp single-end reads to a depth of �40 million
reads per sample. Details on the imaging conditions used and on the quanti-
tative analysis of fluorescence, immunoblotting, qPCR, and mRNA-Seq data
are in the Supplemental Experimental Procedures.
408 Cell 165, 396–409, April 7, 2016
ACCESSION NUMBERS
The accession number for the mRNA-Seq data reported in this paper is
GEO:GSE75128.
SUPPLEMENTAL INFORMATION
Supplemental Information includes Supplemental Experimental Procedures,
six figures, and five tables and can be found with this article online at http://
dx.doi.org/10.1016/j.cell.2016.02.040.
AUTHOR CONTRIBUTIONS
A.G.-G. and A.D. initiated the project; A.G.-G. performed themajority of exper-
iments with help fromS.W., R.G., and K.O. on imaging-based phenotypic anal-
ysis and immunoblotting; S.W., S.S., and G.W.Y. performed analysis of
sequencing data with feedback from A.D.; and A.G.-G., S.W., A.D., and K.O.
prepared the manuscript, with input from all of the other authors.
ACKNOWLEDGMENTS
We thank Amy Pasquinelli, Andreas Rechtsteiner, James Broughton, and the
members of the A.D. and K.O. labs for helpful discussions and Kristen Jepsen
and the UCSD Institute for Genomic Medicine Genomics Center for help with
sequencing. This work was supported by an NIH grant (GM074215) (to A.D.).
A.G.-G. was supported by an EMBO Long-Term Fellowship (ALTF 251-
2012). G.W.Y. and S.S. are supported by grants from the NIH (HG004659,
MH107369, and NS075449). A.D. and K.O. receive salary and other support
from the Ludwig Institute for Cancer Research.
Received: November 17, 2015
Revised: January 20, 2016
Accepted: February 18, 2016
Published: March 24, 2016
REFERENCES
Aoki, K., Moriguchi, H., Yoshioka, T., Okawa, K., and Tabara, H. (2007). In vitro
analyses of the production and activity of secondary small interfering RNAs in
C. elegans. EMBO J. 26, 5007–5019.
Ashe, A., Sapetschnig, A., Weick, E.M., Mitchell, J., Bagijn, M.P., Cording,
A.C., Doebley, A.L., Goldstein, L.D., Lehrbach, N.J., Le Pen, J., et al. (2012).
piRNAs can trigger a multigenerational epigenetic memory in the germline of
C. elegans. Cell 150, 88–99.
Avgousti, D.C., Palani, S., Sherman, Y., and Grishok, A. (2012). CSR-1 RNAi
pathway positively regulates histone expression in C. elegans. EMBO J. 31,
3821–3832.
Batista, P.J., Ruby, J.G., Claycomb, J.M., Chiang, R., Fahlgren, N., Kasschau,
K.D., Chaves, D.A., Gu, W., Vasale, J.J., Duan, S., et al. (2008). PRG-1 and
21U-RNAs interact to form the piRNA complex required for fertility in C. ele-
gans. Mol. Cell 31, 67–78.
Billi, A.C., Fischer, S.E., and Kim, J.K. (2014). Endogenous RNAi pathways
in C. elegans. In WormBook, the C. elegans research community, eds. doi/
http://dx.doi.org/10.1895/wormbook.1.7.1, http://www.wormbook.org.
Buckley, B.A., Burkhart, K.B., Gu, S.G., Spracklin, G., Kershner, A., Fritz, H.,
Kimble, J., Fire, A., and Kennedy, S. (2012). A nuclear Argonaute promotes
multigenerational epigenetic inheritance and germline immortality. Nature
489, 447–451.
Campbell, A.C., and Updike, D.L. (2015). CSR-1 and P granules suppress
sperm-specific transcription in the C. elegans germline. Development 142,
1745–1755.
Carmell, M.A., Xuan, Z., Zhang, M.Q., and Hannon, G.J. (2002). The Argonaute
family: tentacles that reach into RNAi, developmental control, stem cell main-
tenance, and tumorigenesis. Genes Dev. 16, 2733–2742.

Cecere, G., Hoersch, S., O’Keeffe, S., Sachidanandam, R., and Grishok, A.
(2014). Global effects of the CSR-1 RNA interference pathway on the transcrip-
tional landscape. Nat. Struct. Mol. Biol. 21, 358–365.
Cheeseman, I.M., Niessen, S., Anderson, S., Hyndman, F., Yates, J.R., 3rd,
Oegema, K., and Desai, A. (2004). A conserved protein network controls as-
sembly of the outer kinetochore and its ability to sustain tension. Genes
Dev. 18, 2255–2268.
Claycomb, J.M., Batista, P.J., Pang, K.M., Gu, W., Vasale, J.J., van Wolfswin-
kel, J.C., Chaves, D.A., Shirayama, M., Mitani, S., Ketting, R.F., et al. (2009).
The Argonaute CSR-1 and its 22G-RNA cofactors are required for holocentric
chromosome segregation. Cell 139, 123–134.
Conine, C.C., Moresco, J.J., Gu, W., Shirayama,M., Conte, D., Jr., Yates, J.R.,
3rd, and Mello, C.C. (2013). Argonautes promote male fertility and provide a
paternal memory of germline gene expression in C. elegans. Cell 155, 1532–
1544.
Crews, S.T., and Pearson, J.C. (2009). Transcriptional autoregulation in devel-
opment. Curr. Biol. 19, R241–R246.
Das, P.P., Bagijn, M.P., Goldstein, L.D., Woolford, J.R., Lehrbach, N.J., Sa-
petschnig, A., Buhecha, H.R., Gilchrist, M.J., Howe, K.L., Stark, R., et al.
(2008). Piwi and piRNAs act upstream of an endogenous siRNA pathway to
suppress Tc3 transposon mobility in the Caenorhabditis elegans germline.
Mol. Cell 31, 79–90.
Decker, M., Jaensch, S., Pozniakovsky, A., Zinke, A., O’Connell, K.F., Zachar-
iae, W., Myers, E., and Hyman, A.A. (2011). Limiting amounts of centrosome
material set centrosome size in C. elegans embryos. Curr. Biol. 21, 1259–1267.
Desai, A., Verma, S., Mitchison, T.J., and Walczak, C.E. (1999). Kin I kinesins
are microtubule-destabilizing enzymes. Cell 96, 69–78.
Friend, K., Campbell, Z.T., Cooke, A., Kroll-Conner, P., Wickens, M.P., and
Kimble, J. (2012). A conserved PUF-Ago-eEF1A complex attenuates transla-
tion elongation. Nat. Struct. Mol. Biol. 19, 176–183.
Frøkjaer-Jensen, C., Davis, M.W., Hopkins, C.E., Newman, B.J., Thummel,
J.M., Olesen, S.P., Grunnet, M., and Jorgensen, E.M. (2008). Single-copy
insertion of transgenes in Caenorhabditis elegans. Nat. Genet. 40, 1375–1383.
Gassmann, R., Rechtsteiner, A., Yuen, K.W., Muroyama, A., Egelhofer, T.,
Gaydos, L., Barron, F., Maddox, P., Essex, A., Monen, J., et al. (2012). An
inverse relationship to germline transcription defines centromeric chromatin
in C. elegans. Nature 484, 534–537.
Ghosh-Roy, A., Goncharov, A., Jin, Y., and Chisholm, A.D. (2012). Kinesin-13
and tubulin posttranslational modifications regulate microtubule growth in
axon regeneration. Dev. Cell 23, 716–728.
Grishok, A. (2013). Biology and mechanisms of short RNAs in Caenorhabditis
elegans. Adv. Genet. 83, 1–69.
Gu,W., Shirayama,M., Conte, D., Jr., Vasale, J., Batista, P.J., Claycomb, J.M.,
Moresco, J.J., Youngman, E.M., Keys, J., Stoltz, M.J., et al. (2009). Distinct
argonaute-mediated 22G-RNA pathways direct genome surveillance in the
C. elegans germline. Mol. Cell 36, 231–244.
Hamill, D.R., Severson, A.F., Carter, J.C., and Bowerman, B. (2002). Centro-
some maturation and mitotic spindle assembly in C. elegans require SPD-5,
a protein with multiple coiled-coil domains. Dev. Cell 3, 673–684.
Kuhn, C.D., and Joshua-Tor, L. (2013). Eukaryotic Argonautes come into
focus. Trends Biochem. Sci. 38, 263–271.
Lee, H.C., Gu, W., Shirayama, M., Youngman, E., Conte, D., Jr., and Mello,
C.C. (2012). C. elegans piRNAs mediate the genome-wide surveillance of
germline transcripts. Cell 150, 78–87.
Lerner, K., and Goldstein, P. (1988). Electron microscopic autoradiographic
analysis: evidence of RNA transcription along pachytene chromosomes of
rad-4, him-4 and wild-type Caenorhabditis elegans. Cytobios 55, 51–61.
Maniar, J.M., and Fire, A.Z. (2011). EGO-1, a C. elegans RdRP, modulates
gene expression via production of mRNA-templated short antisense RNAs.
Curr. Biol. 21, 449–459.
Nonomura, K., Morohoshi, A., Nakano, M., Eiguchi, M., Miyao, A., Hirochika,
H., and Kurata, N. (2007). A germ cell specific gene of the ARGONAUTE family
is essential for the progression of premeioticmitosis andmeiosis during sporo-
genesis in rice. Plant Cell 19, 2583–2594.
Olmedo-Monfil, V., Duran-Figueroa, N., Arteaga-Vazquez, M., Demesa-Are-
valo, E., Autran, D., Grimanelli, D., Slotkin, R.K., Martienssen, R.A., and
Vielle-Calzada, J.P. (2010). Control of female gamete formation by a small
RNA pathway in Arabidopsis. Nature 464, 628–632.
Ortiz, M.A., Noble, D., Sorokin, E.P., and Kimble, J. (2014). A new dataset of
spermatogenic vs. oogenic transcriptomes in the nematode Caenorhabditis
elegans. G3 (Bethesda) 4, 1765–1772.
Reinke, V., Gil, I.S., Ward, S., and Kazmer, K. (2004). Genome-wide germline-
enriched and sex-biased expression profiles in Caenorhabditis elegans.
Development 131, 311–323.
Seth, M., Shirayama, M., Gu, W., Ishidate, T., Conte, D., Jr., and Mello, C.C.
(2013). The C. elegans CSR-1 argonaute pathway counteracts epigenetic
silencing to promote germline gene expression. Dev. Cell 27, 656–663.
Shirayama, M., Seth, M., Lee, H.C., Gu, W., Ishidate, T., Conte, D., Jr., and
Mello, C.C. (2012). piRNAs initiate an epigenetic memory of nonself RNA in
the C. elegans germline. Cell 150, 65–77.
Stein, P., Rozhkov, N.V., Li, F., Cardenas, F.L., Davydenko, O., Vandivier, L.E.,
Gregory, B.D., Hannon, G.J., and Schultz, R.M. (2015). Essential Role for
endogenous siRNAs during meiosis in mouse oocytes. PLoS Genet. 11,
e1005013.
Swarts, D.C., Makarova, K., Wang, Y., Nakanishi, K., Ketting, R.F., Koonin,
E.V., Patel, D.J., and van der Oost, J. (2014). The evolutionary journey of Argo-
naute proteins. Nat. Struct. Mol. Biol. 21, 743–753.
Tabara, H., Sarkissian, M., Kelly, W.G., Fleenor, J., Grishok, A., Timmons, L.,
Fire, A., and Mello, C.C. (1999). The rde-1 gene, RNA interference, and trans-
poson silencing in C. elegans. Cell 99, 123–132.
Tam, O.H., Aravin, A.A., Stein, P., Girard, A., Murchison, E.P., Cheloufi, S.,
Hodges, E., Anger, M., Sachidanandam, R., Schultz, R.M., and Hannon, G.J.
(2008). Pseudogene-derived small interfering RNAs regulate gene expression
in mouse oocytes. Nature 453, 534–538.
Tursun, B., Patel, T., Kratsios, P., and Hobert, O. (2011). Direct conversion of
C. elegans germ cells into specific neuron types. Science 331, 304–308.
Updike, D.L., and Strome, S. (2009). A genomewide RNAi screen for genes that
affect the stability, distribution and function of P granules in Caenorhabditis
elegans. Genetics 183, 1397–1419.
Wang, S., Wu, D., Quintin, S., Green, R.A., Cheerambathur, D.K., Ochoa, S.D.,
Desai, A., and Oegema, K. (2015). NOCA-1 functions with g-tubulin and in
parallel to Patronin to assemble non-centrosomal microtubule arrays in
C. elegans. eLife 4, e08649.
Watanabe, T., Totoki, Y., Toyoda, A., Kaneda, M., Kuramochi-Miyagawa, S.,
Obata, Y., Chiba, H., Kohara, Y., Kono, T., Nakano, T., et al. (2008). Endoge-
nous siRNAs from naturally formed dsRNAs regulate transcripts in mouse
oocytes. Nature 453, 539–543.
Wedeles, C.J., Wu, M.Z., and Claycomb, J.M. (2013). Protection of germline
gene expression by the C. elegans Argonaute CSR-1. Dev. Cell 27, 664–671.
Woodruff, J.B., Wueseke, O., Viscardi, V., Mahamid, J., Ochoa, S.D., Bunken-
borg, J., Widlund, P.O., Pozniakovsky, A., Zanin, E., Bahmanyar, S., et al.
(2015). Centrosomes. Regulated assembly of a supramolecular centrosome
scaffold in vitro. Science 348, 808–812.
Yigit, E., Batista, P.J., Bei, Y., Pang, K.M., Chen, C.C., Tolia, N.H., Joshua-Tor,
L., Mitani, S., Simard, M.J., and Mello, C.C. (2006). Analysis of the C. elegans
Argonaute family reveals that distinct Argonautes act sequentially during RNAi.
Cell 127, 747–757.
Zong, J., Yao, X., Yin, J., Zhang, D., and Ma, H. (2009). Evolution of the RNA-
dependent RNA polymerase (RdRP) genes: duplications and possible losses
before and after the divergence of major eukaryotic groups. Gene 447, 29–39.
Cell 165, 396–409, April 7, 2016 409

Supplemental Figures
(legend on next page)
Cell 165, 396–409, April 7, 2016 ª2016 Elsevier Inc. S1

Figure S1. CSR-1 Isoform Analysis, Validation of cdl-1(RNAi), Depletion Phenotypes of EGO-1, DRH-3, EKL-1, and CID-1, and Similarity of
CSR-1 Depletion to Depletion of Tubulin Chaperones, Related to Figure 1
(A) Structure of the csr-1 locus on Chr IV. Two isoforms, a and b, are expressed from this locus. Isoform a contains an extra 50 exon and can be targeted
specifically with a dsRNA homologous to that exon. Isoform b cannot be targeted independently from isoform a; thus a dsRNA targeting both isoforms was
compared to the isoform a only-targeting dsRNA.
(B) Embryo viability analysis employing dsRNAs shown in (A). N refers to number of worms and n to total embryos scored per condition. Error bars are the SD per
worm.
(C) (top) Schematic of CSR-1b protein, indicating functional domains and highlighting the region used to generate the anti-CSR-1 antibody (this region is identical
in both isoforms). (bottom) Immunoblot of worms injected with the two dsRNAs shown in (A); a standard curve of N2 is loaded alongside for comparison and
b-actin serves as a loading control. This blot is an extended version of the same blot that is shown in Figure 1A.
(D) Immunoblot of histone H2b in control (N2) and cdl-1(RNAi) worms. b-actin serves as a loading control. Histone H2b was detected using antibody ab1790
(Abcam).
(E) Images from time-lapse sequences of embryos expressing GFP::H2b (yellow arrow in Control�20 s panel) and GFP::g-tubulin (yellow arrowheads in Control
�20 s panel) for the indicated conditions; time is in seconds relative to early anaphase. CSR-1 is bound to 22G RNAs homologous to germline genes that are
generated by the EGO-1/DRH-3/EKL-1 complex (Gu et al., 2009), in which EGO-1 is the RNA-dependent RNA polymerase (Maniar and Fire, 2011; Smardon et al.,
2000). CSR-1-associated 22G RNAs are uridylated by the enzyme CID-1 (also known as CDE-1; van Wolfswinkel et al., 2009). Phenotypes associated with
depletion of EGO-1, DRH-3, EKL-1 and CID-1 are shown here. Depletions of EGO-1, DRH-3 or EKL-1 result in similar phenotypes as depletion of CSR-1.
However, CID-1 depletion did not exhibit defects comparable to the other depletions in one-cell embryos, which is consistent with less severe fertility and
embryonic lethality phenotypes of cid-1 mutants, relative to csr-1, ego-1, ekl-1, and drh-3 mutants. Scale bar, 10 mm.
(F) Plot of the position of the spindle midpoint (defined in maximal intensity projections as the midpoint between GFP::g-tubulin foci) projected onto the embryo
A-P axis at metaphase, for the indicated conditions.
(G) Plot of the distribution of the minimum angle between the spindle axis (defined in maximal intensity projections by a line connecting the GFP::g-tubulin foci)
and the embryo A-P axis at metaphase for the indicated conditions.
(H) Images in metaphase and anaphase from a time-lapse series of one-cell embryos for the indicated conditions; the strain analyzed co-expresses
GFP::b-tubulin and mCherry::H2b. As expected from prior work (Lundin et al., 2008), microtubule assembly was greatly reduced in embryos depleted of TBCD-1
and other tubulin chaperones. Scale bar, 10 mm.
S2 Cell 165, 396–409, April 7, 2016

Figure S2. The csr-1(tm892) Mutant, GFP::KBP-4 Localization in csr-1(RNAi), the gfp::csr-1 Transgene Insertion, and GFP::CSR-1 Locali-
zation in the Absence of Endogenous CSR-1, Related to Figure 2
(A) The csr-1(tm892) mutant. The 400 bp deletion in tm892 removes the indicated intronic and exonic sequences and introduces a frameshift mutation after
residue number 44 of CSR-1b (which is 847 aa long), resulting in encoding of 13 additional out-of-frame amino acids followed by a stop codon.
(B) Line scan analysis of GFP::KBP-4 in control and csr-1(RNAi). KBP-4 is a subunit of the microtubule-binding NDC-80 complex. n is the number of chromo-
somes analyzed. For representative images, see Figure 2F.
(C) Schematic of the gfp::csr-1 transgene inserted in single copy at a Mos transposon site on Chr II. The coding sequence for GFP was inserted at a position that
results in translation of GFP after aa 5 (encoded by exon 1) of CSR-1b and after aa 168 (encoded by exon 2) of CSR-1a. The transgene was also recoded for RNAi
resistance as described in Figure S3A.
(D) The gfp::csr-1 transgene rescues the embryonic lethality and sterility of csr-1(tm892). Embryo viability and brood size was measured for the indicated
conditions. For csr-1(tm892), first generation homozygous worms derived from balanced heterozygous mothers were analyzed. Error bars are the SD.
(E) Localization of GFP::CSR-1 in early embryos (left panel set) and in the larval and adult germline (right panel set). P-granule localization is highlighted by green
arrows in the embryo posterior (left panels) and in the perinuclear region in the germline (green arrows). The blowup of the L4 larva germline image (yellow box)
shows the clustered perinuclear signal. Blowups of two oocyte nuclei in the adult germline highlight the GFP::CSR-1 signal in the nuclear periphery and absence
of detectable chromosome enrichment. Scale bars 10 mm in all images except magnified region of L4 larva germline, where scale bar is 5 mm.
Cell 165, 396–409, April 7, 2016 S3

Figure S3. The RNAi-Resistant csr-1 Transgene, Analysis of CSR-1SIN Expression, Localization of GFP::CENP-AHCP-3 in CSR-1SIN, Germline
Defects in csr-1(tm892) and csr-1SIN;csr-1(tm892), and Localization of GFP::CSR-1SIN, Related to Figure 3
(A) Details on the recoding of the csr-1 transgene to maintain coding information but enable selective RNAi-mediated depletion of endogenous CSR-1. The
recoded gfp::csr-1 and untagged csr-1 transgenes rescue embryo viability and brood size of csr-1(tm892) worms (Figures 3B, 3H, and S2D).
(B) Immunoblot comparingCSR-1 expression in N2wild-typeworms to csr-1SIN;csr-1(tm892)worms—the latter were picked frombalanced csr-1SIN/csr-1SIN;csr-
1(tm892)/+ heterozygous mothers. Numbers above lanes indicate percent loading, based on number of worms. b-actin serves as a loading control.
(C) GFP::CENP-AHCP-3 localization in one-cell csr-1SIN;csr-1(tm892) embryos. Three examples are shown. Scale bar, 5 mm.
(D) Images of germlines labeled with mCherry::H2b for the indicated conditions. Images are of first generation homozygous csr-1(tm892) adult worms derived
from balanced heterozygotes (when present, csr-1 transgene insertions were already homozygous in the balanced heterozygote). Elevated multinucleation (red
arrows) and apoptotic figures (yellow asterisks), as well as overall germline defects are evident in the csr-1(tm892) and csr-1SIN;csr-1(tm892) mutants. A similar
spectrum of phenotypes was observed in 5-7 germlines imaged per condition. Scale bar, 10 mm.
(E) Localization of GFP::CSR-1SIN. Images of L4 larva germlines are shown for GFP::CSR-1WT and GFP::CSR-1SIN; endogenous CSR-1 is absent (GFP fusion
expressing transgenes were homozygosed in csr-1(tm892) balanced heterozygotes; first generation csr-1(tm892) homozygotes were analyzed). The top two
panels are equivalently scaled; the significantly higher signal observed for the slicing activity mutant highlights autoregulation of CSR-1 levels by its own slicing
activity. Bottom panel has scaling adjusted to highlight localization of GFP::CSR-1SIN to perinuclear granules. In adult worms, the perinuclear signal persists but
the overexpressed GFP::CSR-1SIN starts forming aggregates in the germline cytoplasm (data not shown).
S4 Cell 165, 396–409, April 7, 2016

Figure S4. Number of CSR-1-Bound 22G RNA Reads for Microtubule Regulators, List of the Top 25 Genes with Homologous CSR-1-Bound
22G RNAs, Method of Blot Quantification, and MCAKKLP-7 Expression in N2 versus CSR-1WT, Related to Figure 4
(A) (left) Number of CSR-1-bound 22G RNA reads homologous to genes encoding microtubule cytoskeleton regulators. The list shows the normalized read count
and the rank of each gene in the list of 4191 genes with > 25 normalized reads of CSR-1 bound 22G RNAs.
(right) The top 25 genes represented in the 22G RNAs bound to CSR-1; normalized 22G RNA reads homologous to each gene are indicated.
All data shown in (A) are from Claycomb et al. (2009).
(B) Example immunoblots and method employed to measure protein levels. The N2 standard curves for actin and each tested protein were used to measure the
number of ‘‘worm equivalents’’ in the test sample (prepared from csr-1SIN;csr-1(tm892)worms). The ratio of test protein to actin ‘‘worm equivalents’’ was used to
estimate the fold-change as indicated for HCP-1 and MDF-1 in this example.
(C) Comparison of MCAKKLP-7 expression between N2 and csr-1WT;csr-1(tm892) worms. a-tubulin was used as a loading control. Numbers above lanes indicate
percent loading, based on number of worms used to prepare the samples.
Cell 165, 396–409, April 7, 2016 S5

Figure S5. Centrosome Size Increases in One-Cell Embryos following Inhibition of CSR-1 Slicing Activity, Related to Figure 5
(A) Representative images and (B) quantification of background-corrected integrated fluorescence intensity of GFP::g-tubulin, a measure of centrosome size, for
the indicated conditions. 4 example centrosome images are shown below the embryo images. Error bars are the SD. Scale bar, 2 mm. n, number of centrosomes
measured.
S6 Cell 165, 396–409, April 7, 2016

Figure S6. mRNA-Seq Analysis, Related to Figure 6
(A) Summary of 6 mRNA-Seq datasets. Reads were mapped using the WBCel235.82 .gtf file, which has 46,748 annotated features. Relationship between the
datasets based on clustering analysis is depicted below and highlights the distinct nature of the SIN replicates.
(B) Comparison of entire mapped datasets, without any imposed thresholds. Genes increased/decreased by 2-fold with padj < 0.05 are marked in red and blue
circles, respectively.
(C) Box-whiskers plot (5%–95%) with outliers for the indicated bins of CSR-1 22G RNA density. p values are for comparisons between successive bins and are
derived from t tests.
(D) Box-whiskers plot (5-95 percentile) with outliers for the indicated gene classes (top panel). Histograms (middle and bottom panels) show two pairwise
comparisons highlighting negative skew of genes with homology to CSR-1-bound 22G RNAs and genes that are germline-enriched but do not have annotated
CSR-1 22G RNA homology. 1-99 percentile of the data were plotted; p values shown are from t tests.
(E) Expression level of 344 genes that exhibit significant > 2.0-fold increase in CSR-1SIN relative to CSR-1WT. The genes are segmented into two groups based on
homology (or not) to CSR-1 22G RNAs. The 211 genes without homology to CSR-1 22G RNAs are expressed at significantly lower levels than the 133 genes with
homology to CSR-1 22G RNAs. For example, 136/211 (64.5%) of the genes without homology to CSR-1 22G RNAs have RPKM values less than 5, in comparison
to only 1/133 (0.75%) of genes with homology to CSR-1 22GRNAs. p value shown is from a t test. (We note that 232 genes exhibited significant (padj < 0.05) > 2.0-
fold decreased expression in CSR-1SIN relative to CSR-1WT; however, only 25 (10.8%) of these 232 genes have homologous CSR-1 22G RNAs. As decreased
expression may reflect indirect consequences of germline/embryo production defects in CSR-1SIN, we did not focus further on this gene set.)
Cell 165, 396–409, April 7, 2016 S7

Cell, Volume 165
Supplemental Information
A Small RNA-Catalytic Argonaute Pathway
Tunes Germline Transcript Levels
to Ensure Embryonic Divisions
Adina Gerson-Gurwitz, Shaohe Wang, Shashank Sathe, Rebecca Green, Gene W.Yeo, Karen Oegema, and Arshad Desai

SUPPLEMENTAL EXPERIMENTAL PROCEDURES
C. elegans Strains
C. elegans strains (listed in Table S2) were maintained at 20°C on standard NGM plates seeded with OP50 E. coli.
A Mos transposon-based strategy was used to generate all transgene insertions (Frokjaer-Jensen et al., 2012;
Frokjaer-Jensen et al., 2008). For csr-1, 2168 bp upstream of the start codon for isoform a, and 1048 bp dowstream
of the stop codon were included as endogenous promoter and 3’ UTR sequences. Transgenes were cloned into
pCFJ151 (gfp::csr-1, csr-1WT
, csr-1SIN
, gfp::hcp-3) or pCFJ352 (gfp::hcp-3) and co-injected with a plasmid encoding
the Mos1 transposase (pJL43.1, Pglh-2::Mos1 transposase, 50 ng/µL) and three plasmids encoding fluorescent
markers for negative selection [pCFJ90 (Pmyo-2::mCherry, 2.5 ng/µL), pCFJ104 (Pmyo-3::mCherry, 5 ng/µL) and
pGH8 (Prab-3::mCherry, 10 ng/µL)] into strain EG6699 (csr-1 transgenes, gfp::hcp-3) or EG6701 (gfp::hcp-3).
After one week, moving worms without fluorescent markers were identified and transgene integration was
confirmed by PCR spanning both homology regions. In the gfp::csr-1 transgene (Fig. S2C), the coding sequence for
GFP was inserted between the 5th and 6th amino acids of isoform b, flanked by a six-Glycine linker on both N- and
C-terminal ends of GFP. To make the csr-1 transgenes RNAi resistant, a 420 bp region in exon 6 of csr-1b was re-
encoded by codon shuffling (Fig. S3A).
A CRISPR/Cas9 approach (Dickinson et al., 2013) was used to generate the endogenously tagged klp-
7::gfp strain. A repairing plasmid containing the Cb-unc-119 selection marker and appropriate homology arms
(1148 bp of the 3’-end of klp-7 coding sequence and 1520 bp of the klp-7 3’UTR; pOD2094, 50 ng/µL) was co-
injected with a plasmid modified from pDD162 by inserting the guide RNA sequence: 5’-
CTGCGACGTGCTTTGCCTA-3’ (pOD2093; this plasmid also encodes the Cas9 protein; 50 ng/µL) and three
plasmids encoding fluorescent markers for negative selection [pCFJ90 (Pmyo-2::mCherry, 2.5 ng/µL), pCFJ104
(Pmyo-3::mCherry, 5 ng/µL) and pGH8 (Prab-3::mCherry, 10 ng/µL)] into the strain HT1593. After one week,
moving worms without fluorescent markers were identified and insertion of the GFP coding sequence was
confirmed by PCR spanning both homology regions as well as by microscopy.
dsRNA-mediated interference (RNAi)
Double-stranded RNAs (dsRNAs) were synthesized from DNA templates generated by PCR from N2 genomic
DNA or cDNA using oligos listed in Table S3. Single-stranded RNAs (ssRNAs) were synthesized in T3 and T7
reactions (MEGAscript, Invitrogen, Carlsbad, CA) and cleaned using the MEGAclear kit (Invitrogen, Carlsbad,
CA). Equal volumes of the cleaned ssRNAs and 3x soaking buffer (32.7 mM Na2HPO4, 16.5 mM KH2PO4, 6.3 mM
KCl, 14.1 mM NH4Cl), were mixed, heated at 68°C for 10 min, and annealed at 37°C for 30 min. dsRNAs were
injected into L4 hermaphrodite worms 32-40 hours prior to imaging. csr-1a,b dsRNA targets the re-encoded region
of the csr-1 transgenes and was used to deplete endogenous CSR-1. For co-depletion of CSR-1 and MCAKKLP-7
,
dsRNAs were mixed at a 16:1 ratio (final dsRNA concentration: csr-1, 1.6 mg/ml; klp-7, 0.1 mg/ml).
CSR-1 antibody generation The region encoding amino acids 338-538 of CSR-1b was amplified from an N2 cDNA library and cloned into
pGEX6P-1. GST fusions were purified from bacteria and outsourced for injection into rabbits (Covance, Princeton,
NJ). CSR-1 antibodies were affinity purified using a MBP fusion of the same antigen region, as previously described
(Desai et al., 2003).
Light Microscopy
Images in Figs. 1B, 2A, 3D, S1E and S5A were acquired using a 60X 1.4 NA oil objective PlanApo (Olympus,
Tokyo, Japan) on a DeltaVision system (Applied Precision, Issaquah, WA) built on an Olympus microscope (IX70)
and equipped with a CoolSnap CCD camera (Roper Scientific). 10 z-sections at 2 μm steps were acquired with 2x2
binning and using Softworx software (Applied Precision).
Images in Figs. 2G, S2E and S3D were acquired using an Andor Revolution XD Confocal System (Andor
Technology, Belfast, United Kingdom) with a confocal scanner unit (CSU-10; Yokogawa, Tokyo, Japan) mounted
on an inverted microscope (TE2000-E; Nikon, Tokyo, Japan) equipped with solid-state 100-mW lasers, a 60X,1.4
NA Plan Apochromat lens, and an EMCCD camera (iXon DV887ECS-BV, Andor Technology).
Images in Figs. 1E, 3G, 4E-G, 2C-F, S1H and S3C, E were acquired on an inverted Zeiss Axio Observer
Z1 system with a Yokogawa spinning-disk confocal head (CSU-X1), a 63x 1.4 NA Plan Apochromat objective
(Zeiss,Oberkochen, Germany). For imaging of GFP::-tubulin; mCherry::H2b, GFP::CSR-1, or KLP-7::GFP (Figs.
1E, 3G, 4E-G, S1H and S3E), 8 z-sections at 1.5 μm steps were acquired with no binning on a QuantEM 512SC
EMCCD camera (Photometrics, Tucson, AZ) mounted on the Axio Observer system. For imaging of GFP::CENP-

AHCP-3
and kinetochore components (Figs. 2C-F, S3C), 15-20 z-sections at 1 μm steps were acquired without
binning on a Orca ER CCD camera (Hamamatsu photonics, Shizuoka, Japan) mounted on the same system.
Environmental temperature during all image acquisition was maintained at ~19°C. For live imaging of one-
cell embryos, gravid adult worms were dissected, early embryos isolated, and mounted on an agarose pad. For
imaging of germlines, worms were anesthetized by 20-25 min incubation in a mix of 1 mg/ml Tricane (ethyl 3-
aminobenzoate methanesulfonate salt, Sigma–Aldrich, St. Louis, MO) and 0.1 mg/ml of tetramisole hydrochloride
(Sigma–Aldrich) in M9 before mounting on an agarose pad.
All image z-stacks were processed and analyzed using ImageJ (Fiji). Fluorescence intensity was quantified
on maximum intensity projections. Background-corrected GFP::-tubulin intensity was measured for the spindle
area in metaphase one-cell embryos; a cytoplasmic region away from the spindle was used to estimate background.
Background-corrected KLP-7::GFP intensity in the germline was measured using a square drawn around individual
nuclei of proximal oocytes, with background defined using the same size square drawn outside the germline.
Immunoblotting and qRT-PCR
Different transgene insertions were homozygosed and maintained in balanced csr-1(tm892) heterozygotes; first
generation homozygotes for both the transgene and csr-1(tm892) were picked for immunoblotting and mRNA
analysis. Homozygous csr-1(tm892) worms were isolated from balanced heterozygous csr-1(tm892) mothers based
on their differential motility. The balancer chromosome has a dominant unc mutation; thus, balanced heterozygous
mothers are non-motile, while homozygous csr-1(tm892) worms are motile.
For mRNA analysis by qRT-PCR, total RNA was extracted using Trizol (Invitrogen, Carlsbad, CA, 15596-
026) from 100 adult worms. RNA was purified with MEGAclear kit (Ambion, Life Technologies, Carlsbad, CA;
AM1908). cDNA was generated using SuperScript II Reverse Transcriptase (18064-014, Invitrogen) and Oligo (dT)
12-18 primer (18418-012, Invitrogen). Oligos designed to generate 250 bp fragments (Table S4) were used to
perform the qPCR reactions with a AccuPower 2X Greenstar qPCR Master Mix (Bioneer, Daedeok District, South
Korea; K-6251) on a CFX96 Real Time PCR Detection machine (Bio-Rad Laboratories). In each experiment
comparing mRNA levels of selected genes in N2 versus csr-1SIN
;csr-1(tm892) worms, triplicate measurements were
performed. To determine PCR amplification efficiency, reactions with a serial dilution of N2 cDNA template were
carried out in duplicates for each primer pair. Efficiencies were then calculated from slope of dilution curves (Biorad
Software) according to the equation: E = 10 [–1/slope]
. Relative changes in mRNA expression levels of the genes tested
were normalized to that of act-1. Quantification of relative mRNA expression was determined using the Pffal
method (Pfaffl, 2001), calculated using the equation:
( Etarget ) ∆Cq
target ( mean control – mean sample )
/ ( Eref ) ∆Cq
ref ( mean control – mean sample )
E- efficiency; ref – act-1; target – csr-1, klp-7, spdl-1, spd-2, sgo-1, ani-2, npp-12, gsp-1 or ptrn-1; Control – N2;
sample - csr-1SIN
;csr-1(tm892) ; Cq – quantification cycle (calculated by Biorad Software).
For immunoblotting, age-matched adult worms (of indicated genotypes or RNAi perturbations) were
collected into a 1.5 mL tube and washed 3 times with M9 buffer. To reach a final concentration of 1 worm/μL in the
sample, excess of liquid was removed to a pre-marked line on the tube, and an equal volume of 2x sample buffer
was added. The sample was then boiled, sonicated in a 65°C water bath for 10 min, and boiled again. Samples were
run on a SDS-PAGE gel, transferred to PVDF membrane and probed with 1 µg/ml affinity-purified antibody (Table
S5), anti--tubulin (DM1-; Sigma-Aldrich, St. Louis, MO; T9026) or anti--actin (MAB1501, clone C4;
Millipore, Billerica, MA). For detection, an HRP-conjugated secondary antibody was used. Sample loading was
normalized using -actin or -tubulin.
mRNA-Seq
For mRNA-Seq, total RNA was extracted using Trizol (Invitrogen, Carlsbad, CA, 15596-026) from 100 adult
worms. csr-1(tm892) worms were picked from balanced heterozygotes as described above; strains OD1463 and
OD1175 (Table S2) were used for the WT versus SIN mutant comparison. Total RNA was assessed for quality
using an Agilent Tapestation; the RNA Integrity Number (RIN) for samples ranged from 7.9 to 8.9. RNA libraries
were generated using Illumina’s TruSeq Stranded mRNA Sample Prep Kit using 500 ng of total RNA following
manufacturer instructions. RNA libraries were multiplexed and sequenced with 50 basepair (bp) single end reads
(SR50) to a depth of approximately 40 million reads per sample on an Illumina HiSeq2500 using V4 chemistry. All
samples were run on the same lane.
Reads from the mRNA-Seq data were mapped to the C. elegans genome using the STAR aligner (Dobin et
al., 2013). A genome index was first generated using the Ensembl C. elegans genome WBcel235 and the Ensembl
gene annotation file (version WBcel235.82) by the command: “STAR --runThreadN 8 --runMode genomeGenerate -

-genomeDir <output folder> --genomeFastaFiles <path to genome fasta> --sjdbGTFfile <path to .gtf gene
annotation file> --sjdbOverhang 49 --genomeSAindexNbases 12”. Reads from all six samples were then mapped
onto the genome using: “STAR --runThreadN 8 --genomeDir <path to genome index> --readFilesIn <list of
sequence files> --outFileNamePrefix <Prefix for output files> --outFilterMismatchNmax 3 --
outFilterMultimapNmax 10”. Reads that uniquely mapped to annotated genes were counted by htseq-count using the
command: “htseq-count --stranded=no <.sam file> <.gtf gene annotation file> > <output file name>”.
DESeq2 (Love et al., 2014) was used to perform differential analysis of gene expression between different
groups. First, a DESeq2 data set was created by: “(dds <- DESeqDataSetFromMatrix(countData = countdata,
colData = coldata, design = ~ genotype))”. Second, the size factors (normalization for sequence depth) for each
group were estimated by: “dds <- estimateSizeFactors(dds)”. To globally compare biological replicates of three
genotypes, the Euclidean distances between all six samples were calculated using “sampleDists <- dist( t(
assay(rlog(dds)) ) )” and clustered as shown in Fig. S6A. Differential analysis was performed by calling “dds <-
DESeq(dds)” and pairwise comparison was performed at a false discovery rate of 0.05 by:
“res_group1_group2_alpha.05 <- results(dds, contrast=c("genotype", "group1", "group2"), alpha = .05)”.
Box and whiskers plots, Venn diagrams, scatter plots and histograms shown in the figures were generated
using customized Python scripts.

SUPPLEMENTAL TABLES
Table S2: C. elegans strains used in this study (Related to Figures 1-6, Figure S1-S6)
Strain
Number
Genotype
N2 wild type (ancestral)
OD868 ltSi220[pOD1249/pSW077; Pmex-5::GFP-tbb-2-operon-linker-mCherry-his-11; cb-unc-
119(+)]I
OD923
ltSi240[pOD1265/pAG29; Pcsr-1::csr-1(reencoded); cb-unc-119(+)]II; unc-119(ed3)III
OD925
ltSi242[pOD1267/pAG31; Pcsr-1::csr-1(reencoded; D606A, D681A: isoform b
numbering); cb-unc-119(+)]II; unc-119(ed3)III
OD1074
ltSi242[pOD1267/pAG31; Pcsr-1::csr-1(reencoded; D606A, D681A: isoform b
numbering); cb-unc-119(+)]II; unc-119(ed3)III?; ruIs32[pAZ132; Ppie-1::GFP::histone
H2B; cb-unc-119(+)]III; ddIs6[Ppie-1::GFP::tbg-1; cb-unc-119(+)]V
OD1124
ltSi240[pOD1265/pAG29; Pcsr-1::csr-1(reencoded); cb-unc-119(+)]II; unc-119(ed3)III?;
ruIs32[pAZ132; Ppie-1::GFP::histone H2B; cb-unc-119(+)]III; ddIs6[Ppie-1::GFP::tbg-
1; unc-119(+)]V
OD1125 ltSi240[pOD1265/pAG29; Pcsr-1::csr-1(reencoded); cb-unc-119(+)]II; unc-119(ed3)III?;
csr-1(tm892)IV
OD1463
ltSi240[pOD1265/pAG29; Pcsr-1::csr-1(reencoded), cb-unc-119(+)]II; unc-119(ed3)III?;
csr-1(tm892)IV/nT1[unc-?(n754)let-?](IV;V)
OD1174
ltSi386[pOD1344/pAG36; Phcp-3::GFP::hcp-3(reencoded); cb-unc-119(+)]I; unc-
119(ed3)III
OD1175 ltSi242[pOD1267/pAG31; Pcsr-1::csr-1(reencoded; D606A, D681A: isoform b
numbering); cb-unc-119(+)]II; unc-119(ed3)III?; csr-1(tm892) IV/nT1[unc-?(n754)let-
?](IV;V)
OD1231
ltSi386[pOD1344/pAG36; Phcp-3::GFP::hcp-3(reencoded); cb-unc-119(+)]I;
ltSi242[pOD1267/pAG31; Pcsr-1::csr-1(reencoded; D606A, D681A: isoform b
numbering), cb-unc-119(+)]II; unc-119(ed3)III?
OD1232
ltSi386[pOD1344/pAG36; Phcp-3::GFP::hcp-3(reencoded); cb-unc-119(+)]I;
ltSi240[pOD1265/pAG29; Pcsr-1::csr-1(reencoded); cb-unc-119(+)]II; unc-119(ed3)III?
OD1235 ltSi386[pOD1344/pAG36; Phcp-3::GFP::hcp-3(reencoded); cb-unc-119(+)]I;
ltSi240[pOD1265/pAG29; Pcsr-1::csr-1(reencoded); cb-unc-119(+)]II; unc-119(ed3)III?;
csr-1(tm892)IV/nT1[unc-?(n754)let-?](IV;V)
OD1236 ltSi386[pOD1344/pAG36; Phcp-3::GFP::hcp-3(reencoded); cb-unc-119(+)]I;
ltSi242[pOD1267/pAG31; Pcsr-1::csr-1(reencoded; D606A, D681A: isoform b
numbering); cb-unc-119(+)]II; unc-119(ed3)III?; csr-1(tm892)IV/nT1[unc-?(n754)let-
?](IV;V)
TH32 unc-119(ed3)III; ruIs32[pAZ132; Ppie-1::GFP::histone H2B; cb-unc-119(+)]III;
ddIs6[Ppie-1::GFP::tbg-1; unc-119(+)]V
OD1340
ltSi386[pOD1344/pAG36; Phcp-3::GFP::hcp-3(reencoded), cb-unc-119(+)]I; unc-
119(ed3)III?; csr-1(tm892)IV/nT1[unc-?(n754)let-?](IV;V)
WM182 csr-1(tm892)IV/nT1[unc-?(n754)let-?](IV;V)
OD1764
ltSi448[pOD1481/pAG42; Pcsr-1::gfp::csr-1(reencoded; GFP inserted after aa #5 of
isoform b), cb-unc-119(+)]II; unc-119(ed3)III?; ltIs37[pAA64; Ppie-1::mCherry::his-58;
unc-119 (+)]IV; csr-1(tm892)IV/nT1[unc-?(n754)let-?](IV;V)
OD11
ltIs7[pIC41; Ppie-1::GFP-TEV-STag::kbp-4; unc-119 (+)]/+; unc-119(ed3)III
OD86 ltIs1[pIC22; Ppie-1::GFP::knl-3; unc-119 (+)]; unc-119(ed3)III?; ltIs37[pAA64; Ppie-
1::mCherry::his-58; unc-119 (+)]IV

OD87 ltIs4[pIC32; Ppie-1::GFP-TEV-STag::mis-12; unc-119 (+)]; unc-119(ed3)III?;
ltIs37[pAA64; Ppie-1::mCherry::his-58; unc-119 (+)]IV
OD785 ltSi396[pOD1368; Phcp-3::GFP::hcp-3(reencoded); cb-unc-119(+)]II; unc-119(ed3)III?;
ltIs37[pAA64; Ppie-1::mCherry::his-58; unc-119 (+)]IV
OD2559 klp-7(lt22[klp-7::GFP]::loxp::cb-unc-119(+)::loxp)III
OD1525 ltSi448[pOD1481/pAG42; Pcsr-1::gfp::csr-1(reencoded; GFP inserted after aa #5 of
isoform b), cb-unc-119(+)]II; unc-119(ed3)III?; csr-1(tm892)IV/nT1[unc-?(n754)let-
?](IV;V)
OD1570 ltSi753[pOD2095/pAG43; csr-1(reencoded; D606A, D681A: isoform b numbering; GFP
inserted after aa #5 of isoform b); cb-unc-119(+)]II; unc-119(ed3)III?; csr-
1(tm892)IV/nT1[unc-?(n754)let-?](IV;V)

Table S3: Oligonucleotides & Templates Used For dsRNA Production (Related to Figures 1-4, S1-S5)
Gene Oligonucleotide 1
(5'-3')
Oligonucleotide 2
(5'-3') Template
mg/m
L
csr-1a
(F20D12.1a)
AATTAACCCTCACTAAAGGc
ggataatgtcggtcgtggc
TAATACGACTCACTATAGGtc
tcccgcgatagtttccgc cDNA 1.5
csr-1a,b
(F20D12.1a,b)
AATTAACCCTCACTAAAGGg
tagcaggttatactcgaact
TAATACGACTCACTATAGGc
cgcatttaatgttggcttt cDNA 1.6
cdl-1 TAATACGACTCACTATAGGg
cccagaacagtcaaaacaag
TAATACGACTCACTATAGGtt
caatacagcctcatcagtg cDNA 1.0
ekl-1 AATTAACCCTCACTAAAGGa
agttctggaacaattcttc
TAATACGACTCACTATAGGtg
aattcttggaaaaaagag cDNA 0.8
cid-1 AATTAACCCTCACTAAAGGt
gattacaatgtggcatata
TAATACGACTCACTATAGGa
ctcatttcttcaattttct cDNA 1.7
ego-1 AATTAACCCTCACTAAAGGt
gatttcgagaggagcagtg
TAATACGACTCACTATAGGg
attgacggttttttcaagc cDNA 2.0
drh-3 AATTAACCCTCACTAAAGGa
ctgggaagatcttcctgat
TAATACGACTCACTATAGGc
gattagctggatcattctt cDNA 1.0
txdc-9 TAATACGACTCACTATAGGc
ctagaagaagacgatcttga
TAATACGACTCACTATAGGg
cgatgcttggaatgacac cDNA 1.1
pfd-3 TAATACGACTCACTATAGGgt
catggctcacaaaggag
TAATACGACTCACTATAGGat
ttccagctatttttcttgaatttt cDNA 0.7
tbcd-1 TAATACGACTCACTATAGGc
accgactgctgtttttgc
TAATACGACTCACTATAGGa
catggaattcctctcatcc cDNA 1.0
klp-7 TAATACGACTCACTATAGGgt
gcttctgccaacaaacg
TAATACGACTCACTATAGGgt
gcttctgccaacaaacg N2 genomic 1.1

Table S4: Oligonucleotides Used For qPCR analysis of mRNA levels (Related to Figures 4B and 5D)
Gene Oligonucleotide 1
(5'-3')
Oligonucleotide 2
(5'-3')
Product
Size (bp)
act-1 ACGCCAACACTGTTCTTTCC TTAGAAGCACTTGCGGTGAA 248
ani-2 TCGACGAACACATACCAGGA GTAGCAAGAGCCGAAGGTTG 245
gsp-1 GAAACCACGAATGTGCTTCA CAAATCGCACAACAATCCAG 245
hcp-6 GAGCAGAAGTGGCTTACGG TGTGGATAAACGTGGCGATA 258
sgo-1 ATGGATGCAAAAACTGCACA TAGCTCAATTCGCTGCTCAA 252
spd-2 CCTGACAACGATTGAGGAGA CCCAGGAGTGATGCTTGTCT 254
spdl-1 TTCGCGATCTTCATGTTGAG GCGTTTCGTTCGTAAAGAGC 241
klp-7 CTCCATCAACCACAAACACG ATCGACGCATTCTGCTTCTT 242
npp-12 TAATTGTCAAGCAGCGTGGA TCTCCTGAAACATGCCATTG 250
ptrn-1 ACAAGGCAGGCGACAATAAC CGTCAATTGTGGCAGACAAG 250

Table S5: Affinity-Purified Antibodies Used for Immunoblotting (Related to Figures 1, 3, 4, 5, S1, S3 & S4)
Target OD Antibody# Reference PMID
AIR-2 23 Lewellyn et al. (2011) 21464231
ANI-1 11 Maddox et al. (2005) 15930113
ANI-2 196 Maddox et al. (2005) 15930113
BMK-1 20 A. Desai (unpublished)
BUB-1 31 Desai et al. (2003) 14522947
BUB-3 144 Essex et al. (2009) 19109417
CLS-2 36 Desai et al. (2003) 14522947
CSR-1 202 This Study
CYK-1 193 A. Carvalho & K. Oegema (unpublished)
ECT-2 84 E. Zanin & K. Oegema (unpublished)
EEA-1 95 A. Audhya & K. Oegema (unpublished)
GSP-1 180 J. Espeut & A. Desai (unpublished) 22331849
HCP-1 35 Desai et al. (2003) 14522947
HCP-2 37 Cheeseman et al. (2005) 15854912
HCP-3 79 Monen et al. (2005) 16273096
HCP-6 53 P. Maddox & A. Desai (unpublished)
ICP-1 19 Oegema et al. (2001) 11402065
IFY-1 175 M. Moyle & A. Desai (unpublished)
KBP-3 73 Cheeseman et al. (2004) 15371340
KLP-19 21 Dumont et al. (2010) 20729837
KLP-7 30 Oegema et al. (2001) 11402065
KNL-1 34 Desai et al. (2003) 14522947
KNL-2 42 Maddox et al. (2007) 17339379
LET-502 83 A. Maddox & K. Oegema (unpublished)
LPIN-1 203 Bahmanyar et al. (2013) 24449268
MDF-1 195 Moyle et al. (2014) 24567362
NPP-12 101 Gassmann et al. (2012) 22495302
PLK-1 148 J. Espeut & A. Desai (unpublished)
RAB-1 120 A. Audhya & K. Oegema (unpublished)
RAB-7 98 A. Audhya & K. Oegema (unpublished)
RGA-3 41 Zanin et al. (2013) 24012485
SAS-4 58 Kirkham et al. (2003) 12600319
SCC-3 60 A. Desai (unpublished)
SGO-1 143 Kim et al. (2015) 25987605
SMC-4 39 P. Maddox & A. Desai (unpublished)
SPD-1 200 K. Oegema (unpublished)
SPD-2 45 Pelletier et al. (2004) 15186742
SPD-5 46 Dammermann et al. (2004) 15572125

Table S5 (contd.): Affinity-Purified Antibodies Used for Immunoblotting
SPDL-1 164 Gassmann et al. (2008) 18765790
TAC-1 188 Srayko et al. (2003) 12956952
TBG-1 25 Hannak et al. (2002) 11748251
UNC-59 14 Maddox et al. (2005) 15930113
UNC-60 199 Maddox et al. (2005) 15930113
ZEN-4 18 Lewellyn et al. (2011) 21464231
PTRN-1 208 Wang et al. (2015) 26371552

SUPPLEMENTAL REFERENCES
Desai, A., Rybina, S., Muller-Reichert, T., Shevchenko, A., Shevchenko, A., Hyman, A., and Oegema, K. (2003).
KNL-1 directs assembly of the microtubule-binding interface of the kinetochore in C. elegans. Genes Dev 17, 2421-
2435.
Dickinson, D.J., Ward, J.D., Reiner, D.J., and Goldstein, B. (2013). Engineering the Caenorhabditis elegans genome
using Cas9-triggered homologous recombination. Nature methods 10, 1028-1034.
Dobin, A., Davis, C.A., Schlesinger, F., Drenkow, J., Zaleski, C., Jha, S., Batut, P., Chaisson, M., and Gingeras,
T.R. (2013). STAR: ultrafast universal RNA-seq aligner. Bioinformatics (Oxford, England) 29, 15-21.
Frokjaer-Jensen, C., Davis, M.W., Ailion, M., and Jorgensen, E.M. (2012). Improved Mos1-mediated transgenesis
in C. elegans. Nature methods 9, 117-118.
Frokjaer-Jensen, C., Davis, M.W., Hopkins, C.E., Newman, B.J., Thummel, J.M., Olesen, S.P., Grunnet, M., and
Jorgensen, E.M. (2008). Single-copy insertion of transgenes in Caenorhabditis elegans. Nature genetics 40, 1375-
1383.
Love, M.I., Huber, W., and Anders, S. (2014). Moderated estimation of fold change and dispersion for RNA-seq
data with DESeq2. Genome biology 15, 550.
Pfaffl, M.W. (2001). A new mathematical model for relative quantification in real-time RT-PCR. Nucleic Acids Res
29, e45.