A simple NMR methodology for evaluating filter cake ...
13
Vol.:(0123456789) 1 3 Journal of Petroleum Exploration and Production Technology https://doi.org/10.1007/s13202-019-00786-3 ORIGINAL PAPER - EXPLORATION ENGINEERING A simple NMR methodology for evaluating filter cake properties and drilling fluid‑induced formation damage Abdulrauf R. Adebayo 1 · Badr S. Bageri 2 Received: 26 May 2019 / Accepted: 21 September 2019 © The Author(s) 2019 Abstract An efficient drilling fluid will form a filter cake that will minimize the drilling fluid invasion into any drilled formation. Drilling fluid must therefore be adequately evaluated in the laboratory prior to field trial. Filter cake properties such as thick- ness, porosity, permeability, and pore structure are frequently evaluated using several techniques such as CT scan, SEM, and XRF. However, each of these techniques can evaluate only one or two filter cake properties. This paper presents a simple but novel NMR technique to evaluate filter cake properties such as thickness, pore volume, porosity, and possibly permeability. Furthermore, the amount and particle size distribution of solids that invaded a given rock sample can be obtained using the same technique. The full procedure was tested and verified using four identical rock samples. Drilling fluid invasion and filter cake deposition experiments were conducted on each of the samples, using the same drilling fluid but four different concentrations of fluid loss additive. NMR T 2 relaxation measurements were taken at three different stages of each rock sample: before filter cake deposition; after fluid invasion and filter cake deposition; and after filter cake removal. A material balance analysis of the probability density function and cumulative distribution function of the measured T 2 profile at the different stages of each sample yielded multiple filtration loss properties of the filter cake. The results obtained showed high accuracy of the NMR versus the current techniques. Moreover, this current method evaluated the majority of the filter cake properties at the same time and in situ hence eliminated the need of using multi-procedures that disturb the sample state. Finally, the presented method can also be used to evaluate secondary damage associated with filter cake removal process. Keywords Filter cake characterization · Drilling fluid · Formation damage · NMR · CT scan Introduction Formation damage impairs well deliverability, injectivity, drainage efficiency, and ultimately hydrocarbon recovery. Formation damage can be caused by many operational fac- tors such as clay swelling, fine migration and deposition, particle invasion, and plugging during drilling operations. Amaefule et al. (1988) classified frequently encountered formation damage mechanisms into two broad categories. The first category is the damage caused by fluid–fluid inter- actions (e.g., emulsion blocking and organic and inorganic deposition). The second category involves damage caused by rock–fluid interaction. Examples include mobilization and relocation of in situ rock fine particles, invasion and deposition of ex situ fine particles, alteration of rock proper- ties by surface processes like wettability change, swelling, adsorption, and desorption. Reservoir rocks are exposed to external fluids at different stages of their life via wells drilled through them. The source of such damaging particles can be from fluids used in different operations such as drilling, cementing, completion and workover, hydraulic fracturing. The mechanism of formation damage depends on the reser- voir conditions, the nature of the rock, and fluids involved. Drilling fluid invasion during well drilling is usually the first source of formation damage. Although minimal and shallow particle invasion is required for filter cake deposi- tion over the face of the drilled formation, uncontrolled and unrestricted invasion of these particles can have an adverse effect in the near-wellbore region. The formation permeabil- ity can be significantly reduced such that future or enhanced * Abdulrauf R. Adebayo [email protected] 1 Center for Integrative Petroleum Research, King Fahd University of Petroleum and Minerals, Dhahran, Saudi Arabia 2 Department of Petroleum Engineering, King Fahd University of Petroleum and Minerals, Dhahran, Saudi Arabia
-
Upload
khangminh22 -
Category
Documents
-
view
2 -
download
0
Transcript of A simple NMR methodology for evaluating filter cake ...
Vol.:(0123456789)1 3
Journal of Petroleum Exploration and Production Technology https://doi.org/10.1007/s13202-019-00786-3
ORIGINAL PAPER - EXPLORATION ENGINEERING
A simple NMR methodology for evaluating filter cake properties and drilling fluid‑induced formation damage
Abdulrauf R. Adebayo1 · Badr S. Bageri2
Received: 26 May 2019 / Accepted: 21 September 2019 © The Author(s) 2019
AbstractAn efficient drilling fluid will form a filter cake that will minimize the drilling fluid invasion into any drilled formation. Drilling fluid must therefore be adequately evaluated in the laboratory prior to field trial. Filter cake properties such as thick-ness, porosity, permeability, and pore structure are frequently evaluated using several techniques such as CT scan, SEM, and XRF. However, each of these techniques can evaluate only one or two filter cake properties. This paper presents a simple but novel NMR technique to evaluate filter cake properties such as thickness, pore volume, porosity, and possibly permeability. Furthermore, the amount and particle size distribution of solids that invaded a given rock sample can be obtained using the same technique. The full procedure was tested and verified using four identical rock samples. Drilling fluid invasion and filter cake deposition experiments were conducted on each of the samples, using the same drilling fluid but four different concentrations of fluid loss additive. NMR T2 relaxation measurements were taken at three different stages of each rock sample: before filter cake deposition; after fluid invasion and filter cake deposition; and after filter cake removal. A material balance analysis of the probability density function and cumulative distribution function of the measured T2 profile at the different stages of each sample yielded multiple filtration loss properties of the filter cake. The results obtained showed high accuracy of the NMR versus the current techniques. Moreover, this current method evaluated the majority of the filter cake properties at the same time and in situ hence eliminated the need of using multi-procedures that disturb the sample state. Finally, the presented method can also be used to evaluate secondary damage associated with filter cake removal process.
Keywords Filter cake characterization · Drilling fluid · Formation damage · NMR · CT scan
Introduction
Formation damage impairs well deliverability, injectivity, drainage efficiency, and ultimately hydrocarbon recovery. Formation damage can be caused by many operational fac-tors such as clay swelling, fine migration and deposition, particle invasion, and plugging during drilling operations. Amaefule et al. (1988) classified frequently encountered formation damage mechanisms into two broad categories. The first category is the damage caused by fluid–fluid inter-actions (e.g., emulsion blocking and organic and inorganic
deposition). The second category involves damage caused by rock–fluid interaction. Examples include mobilization and relocation of in situ rock fine particles, invasion and deposition of ex situ fine particles, alteration of rock proper-ties by surface processes like wettability change, swelling, adsorption, and desorption. Reservoir rocks are exposed to external fluids at different stages of their life via wells drilled through them. The source of such damaging particles can be from fluids used in different operations such as drilling, cementing, completion and workover, hydraulic fracturing. The mechanism of formation damage depends on the reser-voir conditions, the nature of the rock, and fluids involved.
Drilling fluid invasion during well drilling is usually the first source of formation damage. Although minimal and shallow particle invasion is required for filter cake deposi-tion over the face of the drilled formation, uncontrolled and unrestricted invasion of these particles can have an adverse effect in the near-wellbore region. The formation permeabil-ity can be significantly reduced such that future or enhanced
* Abdulrauf R. Adebayo [email protected]
1 Center for Integrative Petroleum Research, King Fahd University of Petroleum and Minerals, Dhahran, Saudi Arabia
2 Department of Petroleum Engineering, King Fahd University of Petroleum and Minerals, Dhahran, Saudi Arabia
Journal of Petroleum Exploration and Production Technology
1 3
hydrocarbon production processes may be impaired. The depth of particle invasion and deposition depend on the con-centration of the particle in the drilling fluid, particle size distribution, and the drilling fluid rheology (Offenbacher et al. 2013). In order to minimize the formation damage, laboratory experiments are used to optimize the composi-tion of external fluids that are intended to be injected into a formation. In addition, experiments are required to optimize the particle concentration and size distribution of the fluid.
Experimental studies should be able to provide meaning-ful and accurate data on formation damage. Such data can be used to either develop or validate mathematical mod-els, which can also be used to develop efficient mitigation strategies against formation damage (Civan 2007). Differ-ent approaches have been reported for evaluating formation damage. Formation damage can be evaluated by measuring the permeability of a representative rock sample at simulated reservoir conditions prior to and after formation damage, where damage is characterized by permeability reduction (Gabriel and Inamdar 1983; Civan 2016). X-ray computer tomography has also been used to evaluate formation dam-age (e.g., Krilov et al. 1991; Seright and Prodanovic 2006). Some researchers have also reported the use of scanning electron microscope (SEM) to study fines deposition at the nanometer or micrometer scale (e.g., Kandarpa and Spar-row 1981; Byrne et al. 2000; Green et al. 2013). All of these methods are indirect, and they neglect transient nature of formation damage. High-resolution imaging methods like SEM and X-ray CT are complex and time-consuming. They can also be intrusive because of the need to cut and polish the samples (Bageri et al. 2013). They are also not suitable to study fast processes (Godinho et al. 2019). Furthermore, frequent sample handling can cause changes in filter cake properties and hence introduce measurement errors. Few researchers reported the use of nuclear magnetic resonance to probe the changes in the pore sizes of rocks (e.g., Tran et al. 2010; Fischer et al. 2011; Al-Yaseri et al. 2015). The major advantage of NMR method is that formation damage can be investigated in situ and at pore-scale resolution. NMR measurements can be taken with minimal sample handling. Any developed NMR methodology can also be implemented downhole in the reservoir during the drilling process. This is crucial for in situ and real-time damage assessment and
for an effective appraisal of the mitigation strategy. So far, the reported NMR methodology in the literature only inves-tigated the changes in pore structure of the rocks, with insuf-ficient information about the filter cake and invaded mud particles.
In this paper, a simple and novel NMR procedure is pre-sented that can be implemented in the laboratory and in the field during drilling operations. In this analytical method, formation damage was evaluated in terms of pore size distri-bution, volume and particle size distribution of the invaded drilling fluid. The volume and particle size distribution of the filter cake are also determined. All these parameters can be obtained as a function of time. This study does not aim to investigate a specific subsurface reservoir or well. It only seeks to exploit an improved methodology, which can give a useful and meaningful data. Hence, some important factors were not considered in this proof-of-concept study such as heterogeneity of rock, wettability, need to use preserved rock samples (or samples with restored state), and other factors that affect the representativeness of actual reservoir condi-tion (as carefully noted by Bennion et al. 1991). In a specific field study, these factors need to be considered when imple-menting this methodology.
Methodology
The methodology covers the use of NMR measurements to evaluate filtration properties of drilling fluid and the forma-tion damage arising from filtration.
Rock samples
A 10-in. (25.4 cm) long by 1.5-in. (3.792 cm) cylindrical rock samples extracted from a carbonate outcrop was cut into four identical pieces as shown in Table 1. NMR analysis of the four samples shows that they are relatively homoge-neous with very similar pore structure as shown in Fig. 1.
Drilling fluids
The composition of drilling fluid is presented in Table 2. A barite-weighted water-based drilling fluid system was used
Table 1 Rock samples Sample ID Mineralogy Diameter (cm) Length (cm) Porosity (%) Helium permeability (mD)
Sample 1 Carbonate 3.792 5.08 17.5 84Sample 2 Carbonate 3.792 5.06 17.5 80Sample 3 Carbonate 3.792 5.03 15.8 70Sample 4 Carbonate 3.792 5.02 16.7 76
Journal of Petroleum Exploration and Production Technology
1 3
in this study. Four different samples of the drilling fluid were prepared in the laboratory based on the compositions shown in Table 2. The first formulation serves as the base or ref-erence fluid. The other three drilling fluids have the same composition as the base fluid except that each of them has varying concentrations of fluid loss additive (called silica). As shown in the table, drilling fluid #2 contains 1 wt% of the additive, drilling fluid #2 contains 2 wt%, and drilling fluid #3 contains 3 wt%. The added additives have been shown in the literature to be capable of improving the sealing charac-teristics of the filter cake layer and greatly prevent solid inva-sion into the rock formation. Since the rock samples under investigation are of the same type and are to a large extent homogeneous, comparison can be fairly made between the performance evaluation of the filter cake and formation inva-sion profiles.
Equipment and procedure
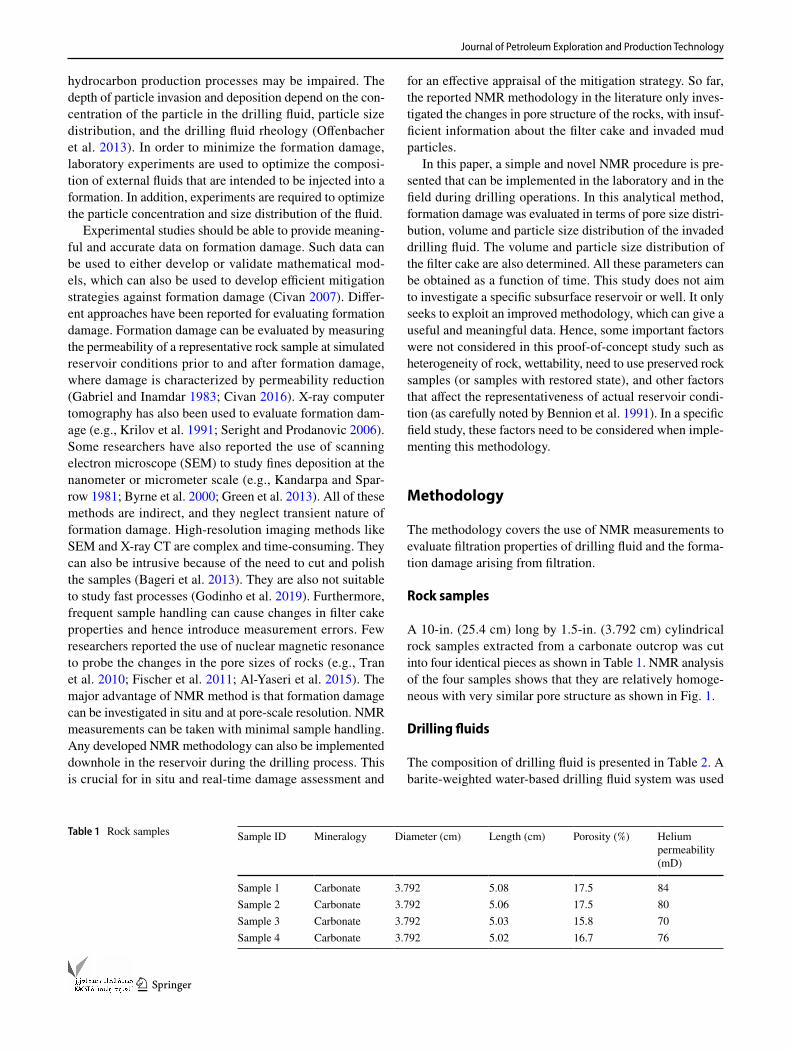
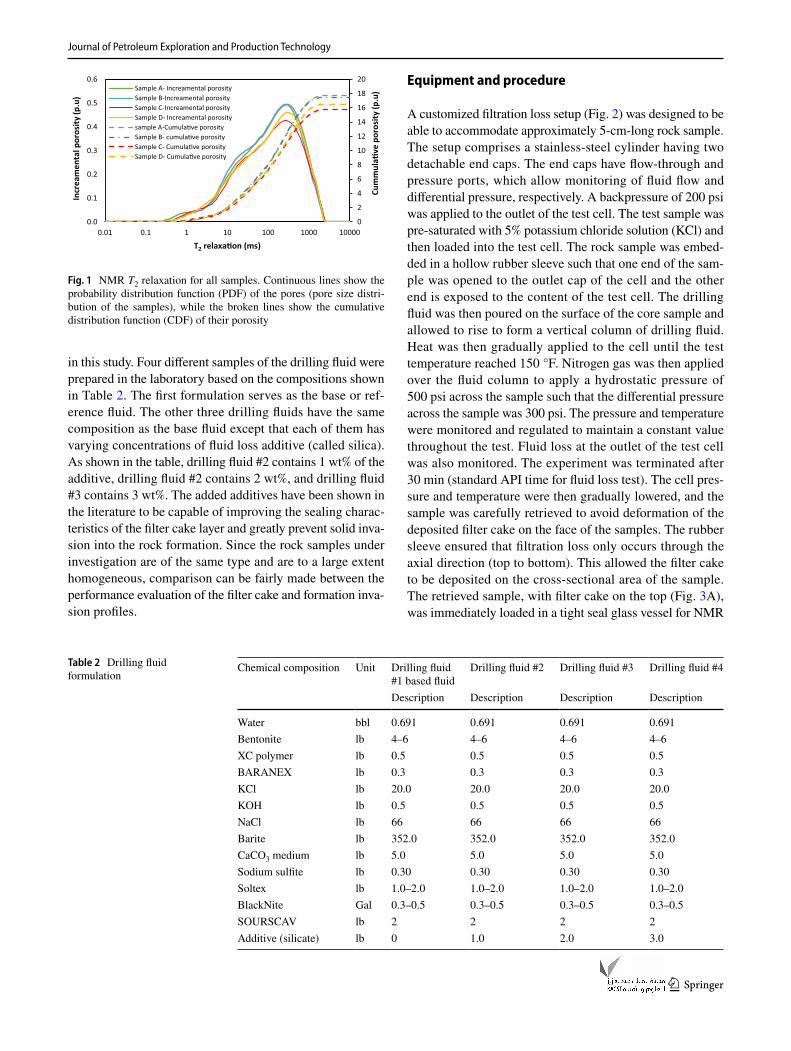
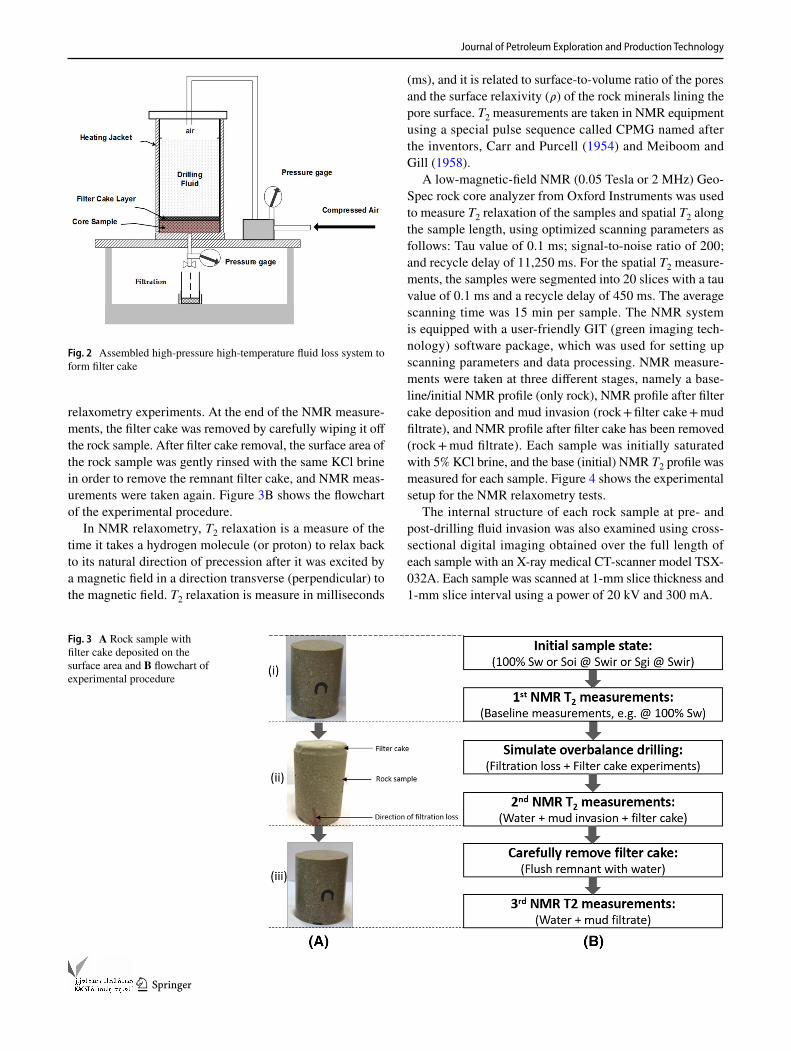
A customized filtration loss setup (Fig. 2) was designed to be able to accommodate approximately 5-cm-long rock sample. The setup comprises a stainless-steel cylinder having two detachable end caps. The end caps have flow-through and pressure ports, which allow monitoring of fluid flow and differential pressure, respectively. A backpressure of 200 psi was applied to the outlet of the test cell. The test sample was pre-saturated with 5% potassium chloride solution (KCl) and then loaded into the test cell. The rock sample was embed-ded in a hollow rubber sleeve such that one end of the sam-ple was opened to the outlet cap of the cell and the other end is exposed to the content of the test cell. The drilling fluid was then poured on the surface of the core sample and allowed to rise to form a vertical column of drilling fluid. Heat was then gradually applied to the cell until the test temperature reached 150 °F. Nitrogen gas was then applied over the fluid column to apply a hydrostatic pressure of 500 psi across the sample such that the differential pressure across the sample was 300 psi. The pressure and temperature were monitored and regulated to maintain a constant value throughout the test. Fluid loss at the outlet of the test cell was also monitored. The experiment was terminated after 30 min (standard API time for fluid loss test). The cell pres-sure and temperature were then gradually lowered, and the sample was carefully retrieved to avoid deformation of the deposited filter cake on the face of the samples. The rubber sleeve ensured that filtration loss only occurs through the axial direction (top to bottom). This allowed the filter cake to be deposited on the cross-sectional area of the sample. The retrieved sample, with filter cake on the top (Fig. 3A), was immediately loaded in a tight seal glass vessel for NMR
0
2
4
6
8
10
12
14
16
18
20
0.0
0.1
0.2
0.3
0.4
0.5
0.6
0.01 0.1 1 10 100 1000 10000
Cum
mul
a�ve
por
osity
(p.u
)
Incr
eam
enta
l por
osity
(p.u
)
T2 relaxa�on (ms)
Sample A- Increamental porositySample B-Increamental porositySample C-Increamental porositySample D- Increamental porositysample A-Cumula�ve porositySample B- cumula�ve porositySample C- Cumula�ve porositySample D- Cumula�ve porosity
Fig. 1 NMR T2 relaxation for all samples. Continuous lines show the probability distribution function (PDF) of the pores (pore size distri-bution of the samples), while the broken lines show the cumulative distribution function (CDF) of their porosity
Table 2 Drilling fluid formulation
Chemical composition Unit Drilling fluid #1 based fluid
Drilling fluid #2 Drilling fluid #3 Drilling fluid #4
Description Description Description Description
Water bbl 0.691 0.691 0.691 0.691Bentonite lb 4–6 4–6 4–6 4–6XC polymer lb 0.5 0.5 0.5 0.5BARANEX lb 0.3 0.3 0.3 0.3KCl lb 20.0 20.0 20.0 20.0KOH lb 0.5 0.5 0.5 0.5NaCl lb 66 66 66 66Barite lb 352.0 352.0 352.0 352.0CaCO3 medium lb 5.0 5.0 5.0 5.0Sodium sulfite lb 0.30 0.30 0.30 0.30Soltex lb 1.0–2.0 1.0–2.0 1.0–2.0 1.0–2.0BlackNite Gal 0.3–0.5 0.3–0.5 0.3–0.5 0.3–0.5SOURSCAV lb 2 2 2 2Additive (silicate) lb 0 1.0 2.0 3.0
Journal of Petroleum Exploration and Production Technology
1 3
relaxometry experiments. At the end of the NMR measure-ments, the filter cake was removed by carefully wiping it off the rock sample. After filter cake removal, the surface area of the rock sample was gently rinsed with the same KCl brine in order to remove the remnant filter cake, and NMR meas-urements were taken again. Figure 3B shows the flowchart of the experimental procedure.
In NMR relaxometry, T2 relaxation is a measure of the time it takes a hydrogen molecule (or proton) to relax back to its natural direction of precession after it was excited by a magnetic field in a direction transverse (perpendicular) to the magnetic field. T2 relaxation is measure in milliseconds
(ms), and it is related to surface-to-volume ratio of the pores and the surface relaxivity ( � ) of the rock minerals lining the pore surface. T2 measurements are taken in NMR equipment using a special pulse sequence called CPMG named after the inventors, Carr and Purcell (1954) and Meiboom and Gill (1958).
A low-magnetic-field NMR (0.05 Tesla or 2 MHz) Geo-Spec rock core analyzer from Oxford Instruments was used to measure T2 relaxation of the samples and spatial T2 along the sample length, using optimized scanning parameters as follows: Tau value of 0.1 ms; signal-to-noise ratio of 200; and recycle delay of 11,250 ms. For the spatial T2 measure-ments, the samples were segmented into 20 slices with a tau value of 0.1 ms and a recycle delay of 450 ms. The average scanning time was 15 min per sample. The NMR system is equipped with a user-friendly GIT (green imaging tech-nology) software package, which was used for setting up scanning parameters and data processing. NMR measure-ments were taken at three different stages, namely a base-line/initial NMR profile (only rock), NMR profile after filter cake deposition and mud invasion (rock + filter cake + mud filtrate), and NMR profile after filter cake has been removed (rock + mud filtrate). Each sample was initially saturated with 5% KCl brine, and the base (initial) NMR T2 profile was measured for each sample. Figure 4 shows the experimental setup for the NMR relaxometry tests.
The internal structure of each rock sample at pre- and post-drilling fluid invasion was also examined using cross-sectional digital imaging obtained over the full length of each sample with an X-ray medical CT-scanner model TSX-032A. Each sample was scanned at 1-mm slice thickness and 1-mm slice interval using a power of 20 kV and 300 mA.
Fig. 2 Assembled high-pressure high-temperature fluid loss system to form filter cake
Fig. 3 A Rock sample with filter cake deposited on the surface area and B flowchart of experimental procedure

Journal of Petroleum Exploration and Production Technology
1 3
Results and discussion
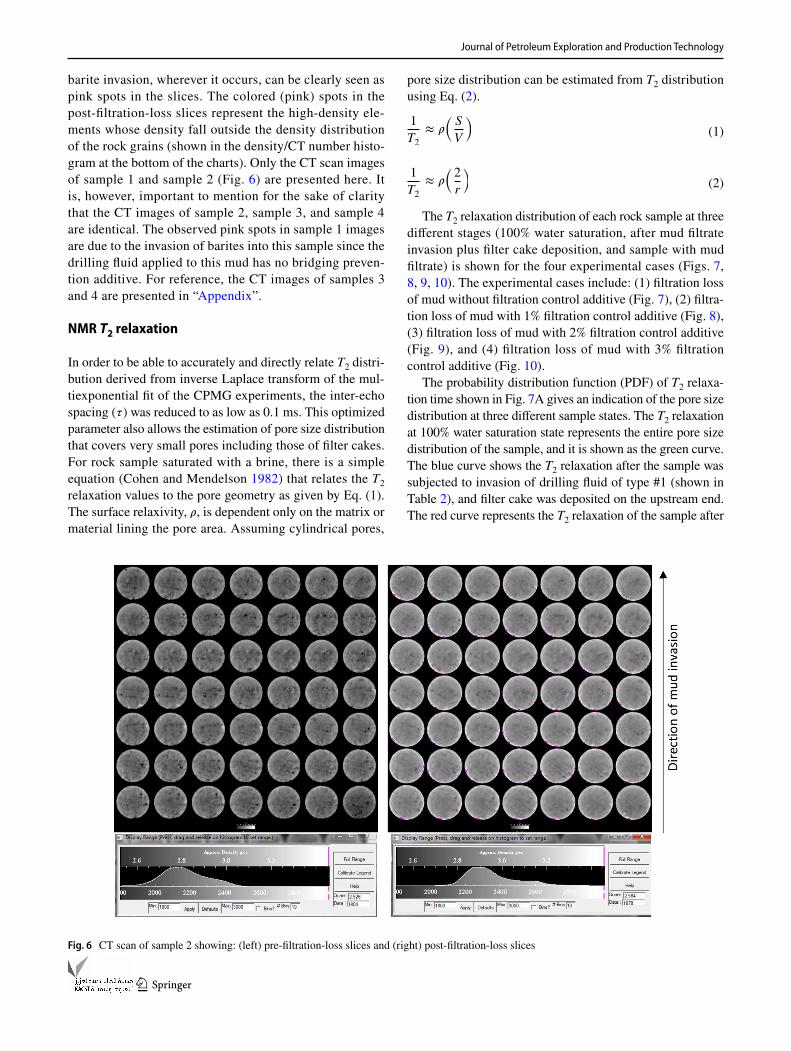
In the first experiment, which was conducted on the refer-ence sample-1, the additive (silica) was not added to the drilling fluid. The CT scan of slices prior to mud invasion is shown in Fig. 5 (left), while the CT scan of the same
sample after mud invasion is shown on the right of the same figure. The gray scale at the bottom of the figure represents the density and CT number distribution in the slices, with the gray becoming lighter as the CT number or density increases. A separate color (pink) was included to represent the density (4.48 g/cc) and CT number of barite and therefore was excluded from the histogram. Hence,
Fig. 4 NMR setup for rock sample with filter cake on it
Fig. 5 CT scan of sample 1 showing: (left) pre-filtration-loss slices and (right) post-filtration-loss slices
Journal of Petroleum Exploration and Production Technology
1 3
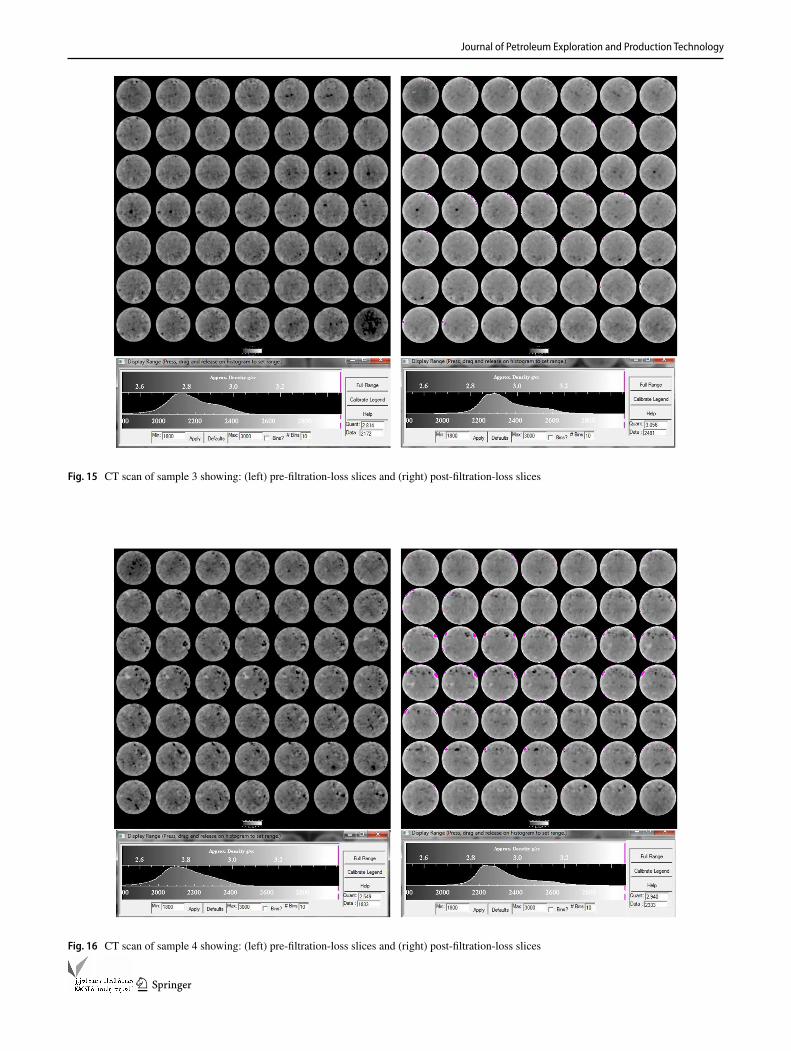
barite invasion, wherever it occurs, can be clearly seen as pink spots in the slices. The colored (pink) spots in the post-filtration-loss slices represent the high-density ele-ments whose density fall outside the density distribution of the rock grains (shown in the density/CT number histo-gram at the bottom of the charts). Only the CT scan images of sample 1 and sample 2 (Fig. 6) are presented here. It is, however, important to mention for the sake of clarity that the CT images of sample 2, sample 3, and sample 4 are identical. The observed pink spots in sample 1 images are due to the invasion of barites into this sample since the drilling fluid applied to this mud has no bridging preven-tion additive. For reference, the CT images of samples 3 and 4 are presented in “Appendix”.
NMR T2 relaxation
In order to be able to accurately and directly relate T2 distri-bution derived from inverse Laplace transform of the mul-tiexponential fit of the CPMG experiments, the inter-echo spacing ( � ) was reduced to as low as 0.1 ms. This optimized parameter also allows the estimation of pore size distribution that covers very small pores including those of filter cakes. For rock sample saturated with a brine, there is a simple equation (Cohen and Mendelson 1982) that relates the T2 relaxation values to the pore geometry as given by Eq. (1). The surface relaxivity, � , is dependent only on the matrix or material lining the pore area. Assuming cylindrical pores,
pore size distribution can be estimated from T2 distribution using Eq. (2).
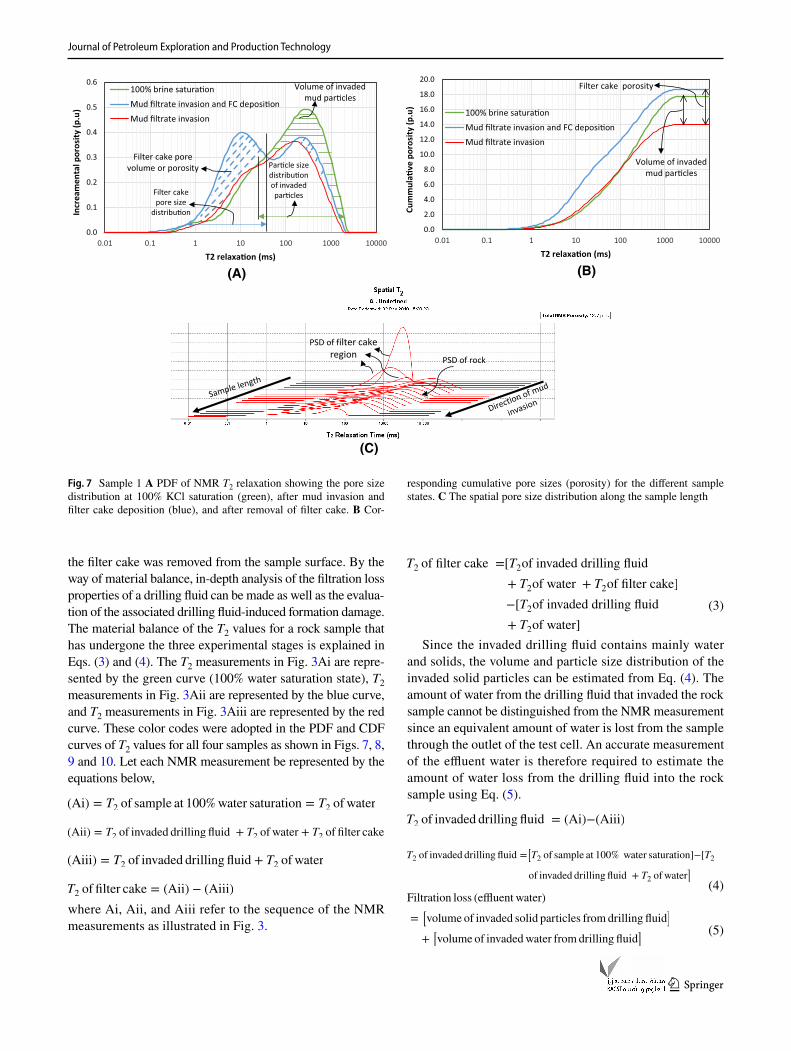
The T2 relaxation distribution of each rock sample at three different stages (100% water saturation, after mud filtrate invasion plus filter cake deposition, and sample with mud filtrate) is shown for the four experimental cases (Figs. 7, 8, 9, 10). The experimental cases include: (1) filtration loss of mud without filtration control additive (Fig. 7), (2) filtra-tion loss of mud with 1% filtration control additive (Fig. 8), (3) filtration loss of mud with 2% filtration control additive (Fig. 9), and (4) filtration loss of mud with 3% filtration control additive (Fig. 10).
The probability distribution function (PDF) of T2 relaxa-tion time shown in Fig. 7A gives an indication of the pore size distribution at three different sample states. The T2 relaxation at 100% water saturation state represents the entire pore size distribution of the sample, and it is shown as the green curve. The blue curve shows the T2 relaxation after the sample was subjected to invasion of drilling fluid of type #1 (shown in Table 2), and filter cake was deposited on the upstream end. The red curve represents the T2 relaxation of the sample after
(1)1
T2
≈ �
(
S
V
)
(2)1
T2
≈ �
(
2
r
)
Fig. 6 CT scan of sample 2 showing: (left) pre-filtration-loss slices and (right) post-filtration-loss slices
Journal of Petroleum Exploration and Production Technology
1 3
the filter cake was removed from the sample surface. By the way of material balance, in-depth analysis of the filtration loss properties of a drilling fluid can be made as well as the evalua-tion of the associated drilling fluid-induced formation damage. The material balance of the T2 values for a rock sample that has undergone the three experimental stages is explained in Eqs. (3) and (4). The T2 measurements in Fig. 3Ai are repre-sented by the green curve (100% water saturation state), T2 measurements in Fig. 3Aii are represented by the blue curve, and T2 measurements in Fig. 3Aiii are represented by the red curve. These color codes were adopted in the PDF and CDF curves of T2 values for all four samples as shown in Figs. 7, 8, 9 and 10. Let each NMR measurement be represented by the equations below,
where Ai, Aii, and Aiii refer to the sequence of the NMR measurements as illustrated in Fig. 3.
(Ai) = T2 of sample at 100%water saturation = T2 of water
(Aii) = T2 of invaded drilling fluid + T2 of water + T2 of filter cake
(Aiii) = T2 of invaded drilling fluid + T2 of water
T2 of filter cake = (Aii) − (Aiii)
Since the invaded drilling fluid contains mainly water and solids, the volume and particle size distribution of the invaded solid particles can be estimated from Eq. (4). The amount of water from the drilling fluid that invaded the rock sample cannot be distinguished from the NMR measurement since an equivalent amount of water is lost from the sample through the outlet of the test cell. An accurate measurement of the effluent water is therefore required to estimate the amount of water loss from the drilling fluid into the rock sample using Eq. (5).
(3)
T2 of filter cake =[T2of invaded drilling fluid
+ T2of water + T2of filter cake]
−[T2of invaded drilling fluid
+ T2of water]
T2 of invaded drilling fluid = (Ai)−(Aiii)
(4)
T2 of invaded drilling fluid =[
T2 of sample at 100% water saturation]−[T2
of invaded drilling fluid + T2 of water]
(5)
Filtration loss (effluent water)
=[
volume of invaded solid particles from drilling fluid]
+[
volume of invadedwater from drilling fluid]
0.0
2.0
4.0
6.0
8.0
10.0
12.0
14.0
16.0
18.0
20.0
0.01 0.1 1 10 100 1000 10000
Cum
mul
a�ve
por
osity
(p.u
)
T2 relaxa�on (ms)
100% brine satura�onMud filtrate invasion and FC deposi�onMud filtrate invasion
Volume of invaded mud par�cles
Filter cake porosity
0.0
0.1
0.2
0.3
0.4
0.5
0.6
0.01 0.1 1 10 100 1000 10000
Incr
eam
enta
l por
osity
(p.u
)
T2 relaxa�on (ms)
100% brine satura�onMud filtrate invasion and FC deposi�onMud filtrate invasion
Volume of invaded mud par�cles
Filter cake pore volume or porosity
Filter cake pore size
distribu�on
Par�cle size distribu�on of invadedpar�cles
PSD of filter cake region PSD of rock
(A) (B)
(C)
Fig. 7 Sample 1 A PDF of NMR T2 relaxation showing the pore size distribution at 100% KCl saturation (green), after mud invasion and filter cake deposition (blue), and after removal of filter cake. B Cor-
responding cumulative pore sizes (porosity) for the different sample states. C The spatial pore size distribution along the sample length
Journal of Petroleum Exploration and Production Technology
1 3
Since T2 is related to volume by Eq. (2) and also because a standard volume was used to calibrate the T2 values, multiple filtration loss properties of the filter cake can be estimated from the T2 profile of Eq. (3), such as pore size distribution, porosity, and pore volume of the deposited filter cake. Also, the volume and particle size distribution of the invaded mud particles can be estimated from the T2 profile of Eq. (4). The contribution of filter cake in the T2 values (blue curve) in the PDF curves is characterized by an increase in the intensity (vertical axis) of the T2 signals at lower values, since the filter cake is mostly clay material, which have large volume of tiny surface area. The higher T2 values (blue) show a reduction in intensity com-pared to the 100% values (green curve). This region (shaded green) corresponds to the pores drained by the invaded mud particles and filtrate. The mud particles are non-hydrogen based and will not give any signal, while the remaining rock water together with the water from invaded mud filtrate gives the NMR signal shown in this high T2 range. The net reduction in T2 values in this range can then be equated to a correspond-ing size and volume of the invaded particles.
The PDF curves (Fig. 7a) can be used to estimate size dis-tribution of the filter cake and invaded mud particles, while the CDF curve (Fig. 7b) can be used to estimate volume of the filter cake and invaded mud particles. Figure 7c shows the PDF curves of T2 spatially resolved in the direction of
filtration loss or mud invasion. It can be observed that the T2 curves at the filter cake region show a high intensity at the lower range (between 0.2 and 50 ms) of the T2 values, distinct from those inside the rock, which range between 0.3 and 2000 ms. It can also be observed that multiple layers exist at the filter cake region as seen by the three different curves in the filter cake region. Although each of these layers has similar T2 range, the intensity or peaks of the T2 vary, indicating that the porosity or pore volume of each layer of filter cake varies from the outermost layer to the innermost layer. The same line of analysis applies for the other experi-ments shown in Figs. 8, 9 and 10.
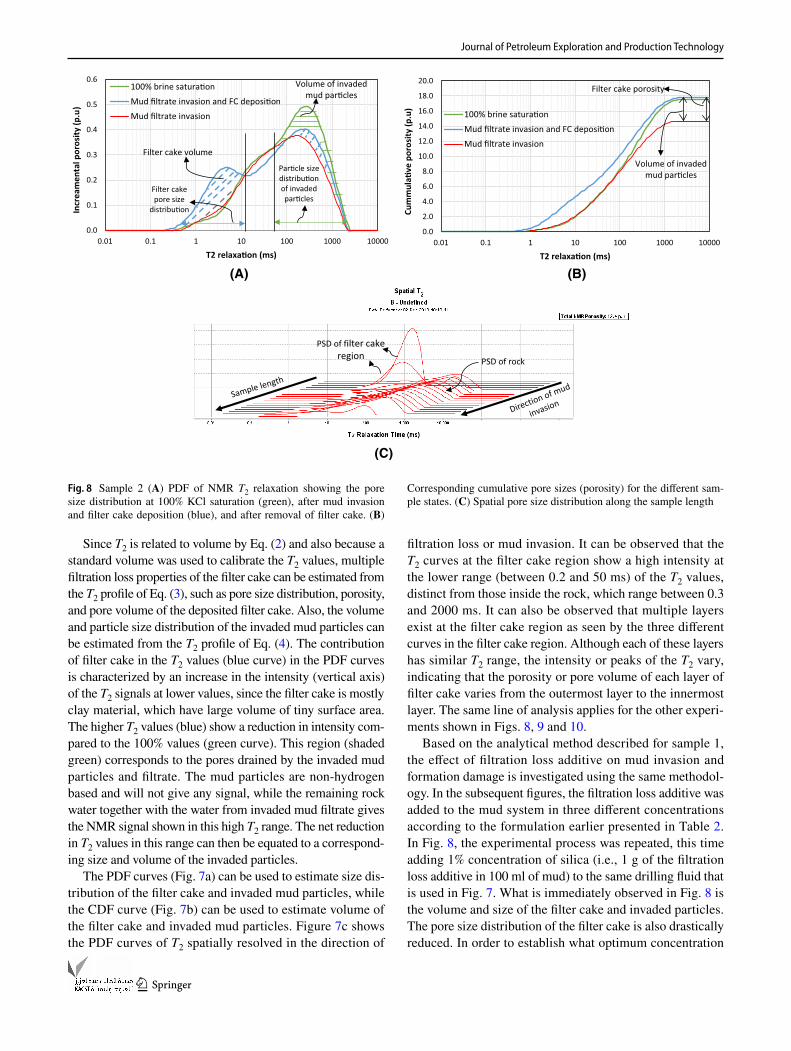
Based on the analytical method described for sample 1, the effect of filtration loss additive on mud invasion and formation damage is investigated using the same methodol-ogy. In the subsequent figures, the filtration loss additive was added to the mud system in three different concentrations according to the formulation earlier presented in Table 2. In Fig. 8, the experimental process was repeated, this time adding 1% concentration of silica (i.e., 1 g of the filtration loss additive in 100 ml of mud) to the same drilling fluid that is used in Fig. 7. What is immediately observed in Fig. 8 is the volume and size of the filter cake and invaded particles. The pore size distribution of the filter cake is also drastically reduced. In order to establish what optimum concentration
0.0
2.0
4.0
6.0
8.0
10.0
12.0
14.0
16.0
18.0
20.0
0.01 0.1 1 10 100 1000 10000
Cum
mul
a�ve
por
osity
(p.u
)
T2 relaxa�on (ms)
100% brine satura�onMud filtrate invasion and FC deposi�onMud filtrate invasion
Volume of invaded mud par�cles
Filter cake porosity
PSD of filter cake region PSD of rock
0.0
0.1
0.2
0.3
0.4
0.5
0.6
0.01 0.1 1 10 100 1000 10000
Incr
eam
enta
l por
osity
(p.u
)
T2 relaxa�on (ms)
100% brine satura�onMud filtrate invasion and FC deposi�onMud filtrate invasion
Volume of invaded mud par�cles
Filter cake volume
Filter cake pore size
distribu�on
Par�cle size distribu�on of invadedpar�cles
(A) (B)
(C)
Fig. 8 Sample 2 (A) PDF of NMR T2 relaxation showing the pore size distribution at 100% KCl saturation (green), after mud invasion and filter cake deposition (blue), and after removal of filter cake. (B)
Corresponding cumulative pore sizes (porosity) for the different sam-ple states. (C) Spatial pore size distribution along the sample length
Journal of Petroleum Exploration and Production Technology
1 3
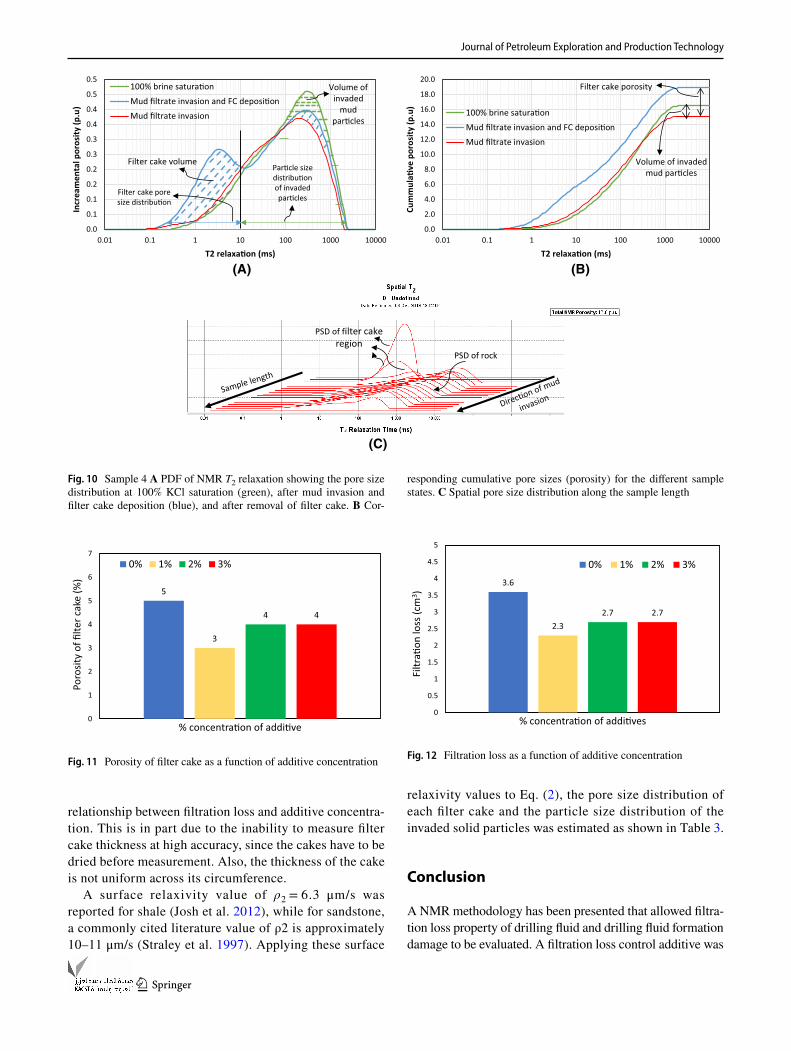
of the additive will be required to achieve an optimum filter cake property, the additive concentration was increased to 2% and then to 3% as shown in Figs. 9 and 10, respectively.
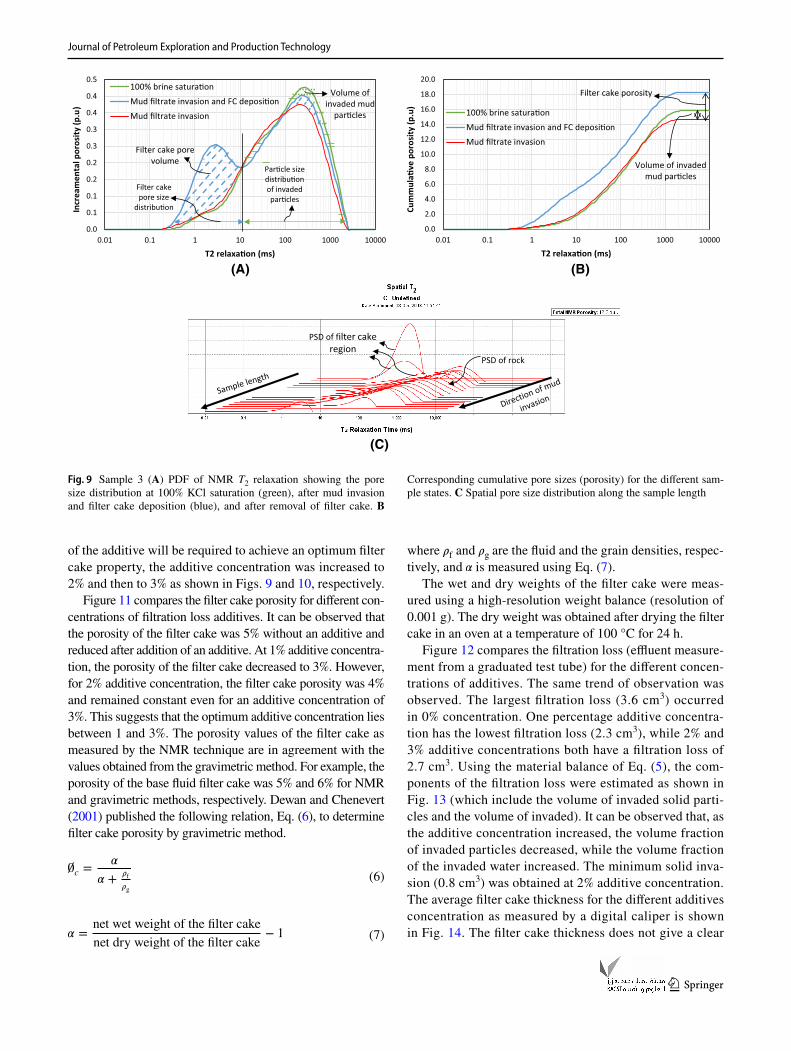
Figure 11 compares the filter cake porosity for different con-centrations of filtration loss additives. It can be observed that the porosity of the filter cake was 5% without an additive and reduced after addition of an additive. At 1% additive concentra-tion, the porosity of the filter cake decreased to 3%. However, for 2% additive concentration, the filter cake porosity was 4% and remained constant even for an additive concentration of 3%. This suggests that the optimum additive concentration lies between 1 and 3%. The porosity values of the filter cake as measured by the NMR technique are in agreement with the values obtained from the gravimetric method. For example, the porosity of the base fluid filter cake was 5% and 6% for NMR and gravimetric methods, respectively. Dewan and Chenevert (2001) published the following relation, Eq. (6), to determine filter cake porosity by gravimetric method.
(6)�c=
�
� +�f
�g
(7)� =net wet weight of the filter cake
net dry weight of the filter cake− 1
where �f and �g are the fluid and the grain densities, respec-tively, and � is measured using Eq. (7).
The wet and dry weights of the filter cake were meas-ured using a high-resolution weight balance (resolution of 0.001 g). The dry weight was obtained after drying the filter cake in an oven at a temperature of 100 °C for 24 h.
Figure 12 compares the filtration loss (effluent measure-ment from a graduated test tube) for the different concen-trations of additives. The same trend of observation was observed. The largest filtration loss (3.6 cm3) occurred in 0% concentration. One percentage additive concentra-tion has the lowest filtration loss (2.3 cm3), while 2% and 3% additive concentrations both have a filtration loss of 2.7 cm3. Using the material balance of Eq. (5), the com-ponents of the filtration loss were estimated as shown in Fig. 13 (which include the volume of invaded solid parti-cles and the volume of invaded). It can be observed that, as the additive concentration increased, the volume fraction of invaded particles decreased, while the volume fraction of the invaded water increased. The minimum solid inva-sion (0.8 cm3) was obtained at 2% additive concentration. The average filter cake thickness for the different additives concentration as measured by a digital caliper is shown in Fig. 14. The filter cake thickness does not give a clear
0.0
2.0
4.0
6.0
8.0
10.0
12.0
14.0
16.0
18.0
20.0
0.01 0.1 1 10 100 1000 10000
Cum
mul
a�ve
por
osity
(p.u
)
T2 relaxa�on (ms)
100% brine satura�onMud filtrate invasion and FC deposi�onMud filtrate invasion
Volume of invaded mud par�cles
Filter cake porosity
0.0
0.1
0.1
0.2
0.2
0.3
0.3
0.4
0.4
0.5
0.01 0.1 1 10 100 1000 10000
Incr
eam
enta
l por
osity
(p.u
)
T2 relaxa�on (ms)
100% brine satura�onMud filtrate invasion and FC deposi�onMud filtrate invasion
Volume of invaded mud
par�cles
Filter cake pore volume
Filter cake pore size
distribu�on
Par�cle size distribu�on of invadedpar�cles
PSD of filter cake region
PSD of rock
(A) (B)
(C)
Fig. 9 Sample 3 (A) PDF of NMR T2 relaxation showing the pore size distribution at 100% KCl saturation (green), after mud invasion and filter cake deposition (blue), and after removal of filter cake. B
Corresponding cumulative pore sizes (porosity) for the different sam-ple states. C Spatial pore size distribution along the sample length
Journal of Petroleum Exploration and Production Technology
1 3
relationship between filtration loss and additive concentra-tion. This is in part due to the inability to measure filter cake thickness at high accuracy, since the cakes have to be dried before measurement. Also, the thickness of the cake is not uniform across its circumference.
A surface relaxivity value of ρ2 = 6.3 μm/s was reported for shale (Josh et al. 2012), while for sandstone, a commonly cited literature value of ρ2 is approximately 10–11 μm/s (Straley et al. 1997). Applying these surface
relaxivity values to Eq. (2), the pore size distribution of each filter cake and the particle size distribution of the invaded solid particles was estimated as shown in Table 3.
Conclusion
A NMR methodology has been presented that allowed filtra-tion loss property of drilling fluid and drilling fluid formation damage to be evaluated. A filtration loss control additive was
0.0
2.0
4.0
6.0
8.0
10.0
12.0
14.0
16.0
18.0
20.0
0.01 0.1 1 10 100 1000 10000
Cum
mul
a�ve
por
osity
(p.u
)
T2 relaxa�on (ms)
100% brine satura�onMud filtrate invasion and FC deposi�onMud filtrate invasion
Volume of invaded mud par�cles
Filter cake porosity
PSD of filter cake region
PSD of rock
0.0
0.1
0.1
0.2
0.2
0.3
0.3
0.4
0.4
0.5
0.5
0.01 0.1 1 10 100 1000 10000
Incr
eam
enta
l por
osity
(p.u
)
T2 relaxa�on (ms)
100% brine satura�onMud filtrate invasion and FC deposi�onMud filtrate invasion
Volume of invaded
mud par�cles
Filter cake volume
Filter cake pore size distribu�on
Par�cle size distribu�on of invadedpar�cles
(A) (B)
(C)
Fig. 10 Sample 4 A PDF of NMR T2 relaxation showing the pore size distribution at 100% KCl saturation (green), after mud invasion and filter cake deposition (blue), and after removal of filter cake. B Cor-
responding cumulative pore sizes (porosity) for the different sample states. C Spatial pore size distribution along the sample length
5
3
4 4
0
1
2
3
4
5
6
7
Poro
sity
of fi
lter c
ake
(%)
% concentra�on of addi�ve
0% 1% 2% 3%
Fig. 11 Porosity of filter cake as a function of additive concentration
3.6
2.32.7 2.7
0
0.5
1
1.5
2
2.5
3
3.5
4
4.5
5
Filtr
a�on
loss
(cm
3 )
% concentra�on of addi�ves
0% 1% 2% 3%
Fig. 12 Filtration loss as a function of additive concentration
Journal of Petroleum Exploration and Production Technology
1 3
added in different concentrations to three different drilling fluids, while a reference drilling fluid has no filtration addi-tive added. The filtration loss behavior of the four drilling fluids was then evaluated using a new NMR methodology. A CT scan was also conducted to verify this methodology.
The NMR technique discussed in this paper is based on water-based drilling fluid. For an oil-based drilling fluid, a modified NMR procedure will be required to discern the T2 values of water from T2 values of oil. Furthermore, the meth-odology will be more complex when the rock samples are conditioned to a real reservoir subsurface condition such as oil or mixed wettability system containing oil at irreducible
water saturation. In such scenario, the drilling fluid will have to be doped with contrast agents such that they can be dif-ferentiated from the in situ rock fluid after filtration loss. It is not possible to identify barite or the identity of the invaded particles by using only NMR. However, CT scan allows the density of the invading solids to be evaluated, which made it possible to conclude whether barite invaded the rock samples or not. Nonetheless, the NMR method presented here has many advantages over other methods as summarized below.
1. The pore volume, pore size distribution, and porosity of filter cake can be estimated. The filter cake porosity values measured by NMR are in good agreement with the porosity values measured by gravimetric method.
2. The volume of invading particles and the particle size distribution of the invaded particles, which corresponds to the pore size distribution of the plugged pores, were measured.
3. The volume fraction of water and solids can be estimated from the mud filtrate or filtration loss.
4. The presented NMR method has the potential to mature for implementation in oil and gas wells such that in situ and real-time evaluation of drilling fluid performance and formation damage can be conducted.
Acknowledgements The authors are grateful to the College of Petro-leum Engineering and Geosciences at King Fahd University of Petro-leum and Minerals for the research support. Rahul Salin Babu and Syed Rizwanullah are acknowledged for their support in running the experi-ments. We thank the anonymous reviewers for their critical review, which without doubt improved the quality of this paper.
Open Access This article is distributed under the terms of the Crea-tive Commons Attribution 4.0 International License (http://creat iveco mmons .org/licen ses/by/4.0/), which permits unrestricted use, distribu-tion, and reproduction in any medium, provided you give appropriate credit to the original author(s) and the source, provide a link to the Creative Commons license, and indicate if changes were made.
Appendix
The CT images of sample 3 and sample 4 are shown in Figs. 15 and 16, respectively. As noted earlier, there are no observed pink spots (representing invading particles) in the
0
0.5
1
1.5
2
2.5
3
3.5
4
0% 1% 2% 3%
2.21.7
0.8 0.8
1.4
0.61.9 1.9
Volu
me
(cm
3 )
% concentraon of addive
Invaded parcles from drilling fluid
Invaded water from drilling fluid
Fig. 13 Volume of invaded solid particles and water as a function of additive concentration
5.2
4.1
5.15.5
0
1
2
3
4
5
6
7
8
Filte
r cak
e th
ickn
ess (
mm
)
% concentra�on of addi�ve
0% 1% 3% 3%
Fig. 14 Filter cake thickness as a function of additive concentration
Table 3 Pore size distribution (T2 relaxation time) of filter cake and particle size distribution of invaded solids
Sample ID Conc. of additive (%)
T2 distribution of FC (ms)
Pore size distribution of filter cake (µm)
T2 distribution of invaded particles (ms)
Particle size distribution of invaded particles (µm)
1 0 0.2–50 0.00252–0.63 51–2500 1.02–502 1 0.2–10 0.00252–0.126 11–2500 0.22–503 2 0.2–10 0.00252–0.126 11–2500 0.22–504 3 0.1–10 0.00126–0.126 11–2500 0.22–50
Journal of Petroleum Exploration and Production Technology
1 3
Fig. 15 CT scan of sample 3 showing: (left) pre-filtration-loss slices and (right) post-filtration-loss slices
Fig. 16 CT scan of sample 4 showing: (left) pre-filtration-loss slices and (right) post-filtration-loss slices
Journal of Petroleum Exploration and Production Technology
1 3
post-filtration-loss slices of samples 2, 3, and 4 as in sample 1 images. The additives added to the drilling fluid used in these samples prevented the invasion of barites into the rock matrix. Note that the pink patches around the circumferences of some of the post-filtration-loss slices are remnant of the mud particles around the samples during scanning. Invaded particles will appear inside the slides as in Fig. 5.
References
Al-Yaseri Ahmed Z, Lebedev Maxim, Vogt Sarah J, Johns Michael L, Barifcani Ahmed, Iglauer Stefan (2015) Pore-scale analysis of formation damage in Bentheimer sandstone with in situ NMR and micro-computed tomography experiments. J Petrol Sci Eng 129:48–57. https ://doi.org/10.1016/j.petro l.2015.01.018
Amaefule JO, Kersey DG, Norman DL, Shannon PM (1988) Advances in formation damage assessment and control strategies. In: CIM paper no. 88-39-65. Proceedings of the 39th annual technical meeting of petroleum society of CIM and Canadian Gas Proces-sors Association, Calgary, Alberta, 12–16 June 1988
Bageri BS, Al-Mutairi SH, Mahmoud MA (2013) Different techniques for characterizing the filter cake. Soc Pet Eng 1:1. https ://doi.org/10.2118/16396 0-MS
Bennion DB, Thomas FB, Bennion DW (1991) Effective laboratory coreflood tests to evaluate and minimize formation damage in horizontal wells. Presented at the 3rd international conference on horizontal well technology, Nov 1991, Houston, TX
Byrne MT, Spark ISC, Patey ITM, Twynam AJ (2000) A laboratory drilling mud overbalance formation damage study utilising cryo-genic SEM techniques. SPE 58738, Presented at the SPE interna-tional symposium on formation damage control held in Lafayette, Louisiana, 23–24 Feb 2000
Carr HY, Purcell EM (1954) Effects of diffusion on free precession in nuclear magnetic resonance experiments. Phys Rev 94:630–638. https ://doi.org/10.1103/PhysR ev.94.630
Civan F (2007) Reservoir formation damage fundamentals, modeling, assessment and mitigation, 2nd edn. Gulf Publishing Company, Houston, p 1114
Civan F (2016) Civan reservoir formation damage, 3rd edn. Elsevier, Oxford
Cohen MH, Mendelson KS (1982) Nuclear magnetic relaxation and the internal geometry of sedimentary rocks. J Appl Phys 53(2):1127. https ://doi.org/10.1063/1.33052 6
Dewan JT, Chenevert ME (2001) A model for filtration of water-base mud during drilling: determination of mudcake parameters. Soc Petrophys Well Log Anal 42(03):237–250
Fischer S, Zemke K, Liebscher A, Wandrey M (2011) Petrophysi-cal and petrochemical effects of long-term CO2-exposure
experiments on brine-saturated reservoir sandstone. Energy Pro-cedia 4:4487–4494
Gabriel GA, Inamdar GR (1983) An experimental investigation of fines migration in porous media. SPE-12168. Presented at the SPE annual technical conference and exhibition, San Francisco, California, 5–8 Oct (1983)
Godinho JRA, Chellappah K, Collins I, Ng P, Smith M, Withers PJ (2019) Time-lapse imaging of particle invasion and deposition in porous media using in situ X-ray radiography. J Petrol Sci Eng 177:384–391. https ://doi.org/10.1016/j.petro l.2019.02.061
Green J, Cameron R, Patey I, Nagassar V, Quine M (2013) Use of micro-CT scanning visualisations to improve interpretation of formation damage laboratory tests including a case study from the South Morecambe field. SPE 165110, Presented at the SPE European formation damage conference, Noordwijk, The Neth-erlands, 5–7 June 2013
Josh M, Esteban L, Delle Piane C, Sarout J, Dewhurst DN, Clennell MB (2012) Laboratory characterisation of shale properties. J Petrol Sci Eng 88–89:107–124. https ://doi.org/10.1016/j.petro l.2012.01.023
Kandarpa V, Sparrow JT (1981) A useful technique to study particle invasion in porous media by backscattered electron imaging. SPE 10134, Presented at the SPE 56th annual fall technical conference and exhibition, San Antonio, Texas, Oct 5–7, 1981
Krilov Z, Steiner I, Goricnik B, Wojtanowicz AJ, Cabrajac S (1991) Quantitative determination of solids invasion and formation dam-age using CAT scan and barite suspensions. SPE 23102, Presented at the SPE Offshore Europe Conference, UK, Aberdeen, 3–6 Sept 1991
Meiboom S, Gill D (1958) Modified spin-echo method for measuring nuclear relaxation times. Rev Sci Instrum 29:688–691. https ://doi.org/10.1063/1.17162 96
Offenbacher M, Luyster M, Gray L, He W, Leonard R, Stephens M (2013) Return permeability: when a single number can lead you astray in fluid selection. SPE-165106, Presented at the SPE Euro-pean formation damage conference, Noordwijk, The Netherlands, 5–7 June 2013
Seright RS, Prodanovic M (2006) Lindquist WB X-ray computed microtomography studies of fluid partitioning in drainage and imbibition before and after gel placement: disproportionate per-meability reduction. Soc Pet Eng J 11(2):159–170. https ://doi.org/10.2118/89393 -PA
Straley C, Rossini D, Vinegar HJM, Tutunjian PN, Morriss CE (1997) SCA paper 9494, Society of Core Analysts (1995), or The Log Analyst, 38, p 84
Tran TV, Civan F, Robb ID (2010) Effect of permeability impairment by suspended particles on invasion of drilling fluids. IADC/SPE 133724, Presented at the IADC/SPE Asia Pacific drilling tech-nology conference and exhibition, Vietnam, Ho Chi Minh, 1–3 Nov 2010
Publisher’s Note Springer Nature remains neutral with regard to jurisdictional claims in published maps and institutional affiliations.