A simple method for serving Web hypermaps with dynamic database drill-down
12
BioMed Central Page 1 of 12 (page number not for citation purposes) International Journal of Health Geographics Open Access International Journal of Health Geographics 2002, 1 x Methodology A simple method for serving Web hypermaps with dynamic database drill-down Maged N Kamel Boulos*, Abdul V Roudsari and Ewart R Carson Address: Centre for Measurement and Information in Medicine, School of Informatics, City University, London EC1V 0HB, UK E-mail: Maged Boulos* - [email protected]; Abdul V Roudsari - [email protected]; Ewart R Carson - [email protected] *Corresponding author Abstract Background: HealthCyberMap [http://healthcybermap.semanticweb.org] aims at mapping parts of health information cyberspace in novel ways to deliver a semantically superior user experience. This is achieved through "intelligent" categorisation and interactive hypermedia visualisation of health resources using metadata, clinical codes and GIS. HealthCyberMap is an ArcView 3.1 project. WebView, the Internet extension to ArcView, publishes HealthCyberMap ArcView Views as Web client-side imagemaps. The basic WebView set-up does not support any GIS database connection, and published Web maps become disconnected from the original project. A dedicated Internet map server would be the best way to serve HealthCyberMap database-driven interactive Web maps, but is an expensive and complex solution to acquire, run and maintain. This paper describes HealthCyberMap simple, low-cost method for "patching" WebView to serve hypermaps with dynamic database drill-down functionality on the Web. Results: The proposed solution is currently used for publishing HealthCyberMap GIS-generated navigational information maps on the Web while maintaining their links with the underlying resource metadata base. Conclusion: The authors believe their map serving approach as adopted in HealthCyberMap has been very successful, especially in cases when only map attribute data change without a corresponding effect on map appearance. It should be also possible to use the same solution to publish other interactive GIS-driven maps on the Web, e.g., maps of real world health problems. Background HealthCyberMap (HCM – [http://healthcybermap.se- manticweb.org]) is a Web-based service that aims at map- ping parts of medical/health information resources in cyberspace in novel semantic ways to improve their re- trieval and navigation. This is achieved through intelligent categorisation and interactive hypermedia visualisation of the medical/health information cyberspace using metada- ta (information about information resources), clinical codes (to describe resource topics) and GIS (Geographic Information Systems) technologies. HCM pilot currently provides six different interfaces to its metadata base, which has over 1600 resource records in it. Some of these interfaces are visual (maps – Figure 1), while others are textual (list of topical categories and a semantic subject search engine). Published: 9 August 2002 International Journal of Health Geographics 2002, 1:1 Received: 11 July 2002 Accepted: 9 August 2002 This article is available from: http://www.ij-healthgeographics.com/content/1/1/1 © 2002 Boulos et al; licensee BioMed Central Ltd. This article is published in Open Access: verbatim copying and redistribution of this article are permitted in all media for any non-commercial purpose, provided this notice is preserved along with the article's original URL.
Transcript of A simple method for serving Web hypermaps with dynamic database drill-down
BioMed Central
International Journal of Health Geographics
ss
Open AcceInternational Journal of Health Geographics 2002, 1 xMethodologyA simple method for serving Web hypermaps with dynamic database drill-downMaged N Kamel Boulos*, Abdul V Roudsari and Ewart R CarsonAddress: Centre for Measurement and Information in Medicine, School of Informatics, City University, London EC1V 0HB, UK
E-mail: Maged Boulos* - [email protected]; Abdul V Roudsari - [email protected]; Ewart R Carson - [email protected]
*Corresponding author
AbstractBackground: HealthCyberMap [http://healthcybermap.semanticweb.org] aims at mapping partsof health information cyberspace in novel ways to deliver a semantically superior user experience.This is achieved through "intelligent" categorisation and interactive hypermedia visualisation ofhealth resources using metadata, clinical codes and GIS. HealthCyberMap is an ArcView 3.1project. WebView, the Internet extension to ArcView, publishes HealthCyberMap ArcView Viewsas Web client-side imagemaps. The basic WebView set-up does not support any GIS databaseconnection, and published Web maps become disconnected from the original project. A dedicatedInternet map server would be the best way to serve HealthCyberMap database-driven interactiveWeb maps, but is an expensive and complex solution to acquire, run and maintain. This paperdescribes HealthCyberMap simple, low-cost method for "patching" WebView to serve hypermapswith dynamic database drill-down functionality on the Web.
Results: The proposed solution is currently used for publishing HealthCyberMap GIS-generatednavigational information maps on the Web while maintaining their links with the underlyingresource metadata base.
Conclusion: The authors believe their map serving approach as adopted in HealthCyberMap hasbeen very successful, especially in cases when only map attribute data change without acorresponding effect on map appearance. It should be also possible to use the same solution topublish other interactive GIS-driven maps on the Web, e.g., maps of real world health problems.
BackgroundHealthCyberMap (HCM – [http://healthcybermap.se-manticweb.org]) is a Web-based service that aims at map-ping parts of medical/health information resources incyberspace in novel semantic ways to improve their re-trieval and navigation. This is achieved through intelligentcategorisation and interactive hypermedia visualisation ofthe medical/health information cyberspace using metada-
ta (information about information resources), clinicalcodes (to describe resource topics) and GIS (GeographicInformation Systems) technologies. HCM pilot currentlyprovides six different interfaces to its metadata base,which has over 1600 resource records in it. Some of theseinterfaces are visual (maps – Figure 1), while others aretextual (list of topical categories and a semantic subjectsearch engine).
Published: 9 August 2002
International Journal of Health Geographics 2002, 1:1
Received: 11 July 2002Accepted: 9 August 2002
This article is available from: http://www.ij-healthgeographics.com/content/1/1/1
© 2002 Boulos et al; licensee BioMed Central Ltd. This article is published in Open Access: verbatim copying and redistribution of this article are permitted in all media for any non-commercial purpose, provided this notice is preserved along with the article's original URL.
Page 1 of 12(page number not for citation purposes)

International Journal of Health Geographics 2002, 1 http://www.ij-healthgeographics.com/content/1/1/1
HCM features a novel and unconventional use of GIS tomap conceptual spaces occupied by collections of medi-cal/health information resources. Besides mapping the ge-ographical provenance of these resources, HCM alsocollects and maps some non-geographical and semanticaspects of these resources (e.g., clinical subject or topic)using suitable metaphors like human body organs/sys-tems maps. The resultant maps are conceptual informa-tion space maps used as a visual navigational aid forbrowsing mapped resources.
From desktop GIS to the WebOld [1] describes two main steps when using GIS to mapconceptual information spaces (as in HCM):
- First, information in non-spatial data is spatialised, ana-lysed, browsed, and processed using (desktop) GIS andcartographic methods; then
- The resultant information maps and their connections tothe underlying data are shared on the Web as sensitiveclickable maps for Internet browsing and navigation ofmapped spaces.
Figure 1Screenshot of HCM World Map Web interface Screenshot of HCM World Map Web interface [http://healthcyber-map.semanticweb.org/world_map/]. Note the country name ToolTip ("United Kingdom") and the different map interface but-tons on the left. Also note the overview map with a red positional square on the right; this helps users know where they arewithin the larger world map which cannot be displayed in full detail in one screen. The overview map is also clickable and canbe used to select a different area for viewing. The world map is rendered as a chorochromatic map. Health informationresources are mapped to countries (of authors/publishers) rather than cities and listed in a separate pop-up text window(query result page) to avoid map clutter. The latter would have been unavoidable had we opted to represent each resourceusing a distinct point symbol on the map ( cf. Map.Net – [http://pubmed.antarcti.ca/start]. Note the "Find resources having thesame primary subject as this one from all over the world" link at the end of each resource bibliographic card in the resource listpop-up window to the right.
Page 2 of 12(page number not for citation purposes)

International Journal of Health Geographics 2002, 1 http://www.ij-healthgeographics.com/content/1/1/1
This paper focuses on the second step in this process. Twomain options exist to deliver this step:
- Dynamic publishing to the Web using a dedicated Inter-net map server that maintains a live connection with theunderlying GIS project/database; or
- Publishing a static snapshot of the project (representingthe project's maps and underlying data at time of publish-ing) as clickable client-side imagemaps using tools likeImageMapper from alta4, Germany [http://www.alta4.com/eng/products_e/im/im30/index_e.htm]and WebView from Zebris, Germany [http://www.ze-bris.com/english/main_webview.htm]. (HCM method isa modified version of this option to partially compensatefor its limitations as shall be described below.)
Dedicated internet map server solutions for serving maps with dynamic database drill-down functionalityAdvanced mapping applications running on the serverside can be linked to the server software, e.g., using CGI(Common Gateway Interface). These applications can beused to provide live database access (browsing/querying amap database on the server). Using a dedicated map serv-er, users could get a map depicting the latest figures froma database, which can come from another remote server,visualised with the colours and classification the user hasrequested (Figure 2) [2,3].
ESRI Internet Map Server solutions allow for an existingArcView project to be transparently ported to the Webwith minimal effort (updates carried on the originalproject in ArcView will also show automatically in realtime in the Web front-end). Almost all major GIS vendorshave already done this and although their approaches dif-fer in detail, most use a combination of server-side and cli-ent-side components. In one typical ESRI set-up, theArcView GIS program takes on a role "similar to conven-tional CGI applications" running on the server. AnArcView extension, called Internet Map Server (IMS), is in-stalled to receive commands from the Web browser via theWeb server. A command can be for example a map query.It will be passed to and processed by ArcView GIS and theresult (a map view) will be converted to a GIF (Graphic In-terchange Format) or JPEG (Joint Photographic ExpertsGroup Format) file and sent to the browser. A Java appletcalled MapCafe is used to implement in the Web browseran interface similar to the standard ArcView GIS interface(Figure 3). Users can for example click the zoom buttonand drag a rectangle on the map displayed by the applet.This would result in the applet building a command toimplement the required zoom action (IMS will receivethis command and hand it to ArcView). The last item inthis set-up is a plug-in to the Web server software called es-rimap.dll that enables the server to find the appropriateArcView GIS application to handle the request. ArcView
Figure 2Screenshot of the National Atlas of Canada onlineScreenshot of the National Atlas of Canada online [http://atlas.gc.ca/] which uses ESRI Map Server technologies [3]
Figure 3Screenshot from CDC Atlas of Heart Disease Screen-shot from CDC Atlas of Heart Disease [http://gis.cdc.gov/cvd] showing ESRI MapCafe Java applet in action. Users canselect map layers to be displayed, pan, zoom, and view theattributes of features clicked using the identification tool.
Page 3 of 12(page number not for citation purposes)
International Journal of Health Geographics 2002, 1 http://www.ij-healthgeographics.com/content/1/1/1
GIS can be run on another computer to decrease serverload and the server plug-in can even distribute requestsamong a multitude of computers running the sameArcView application. The Java applet can be customisedand the IMS can handle all functionality within ArcView,including its built-in scripting language. This makes thesystem very flexible but also expensive and more difficultto set-up and run [2,4].
ESRI Internet Map Server allows users to easily look upplaces on the map, e.g., by typing the names of the placesthey want to locate on the map. However, typing errorsand disagreement about correct spelling of map featurescan severely limit the usefulness of such feature [2].
Costs associated with dedicated internet map serversUnfortunately, all these excellent features of dedicated In-ternet map server solutions do come at a cost:
- Price (several thousands of US dollars);
- Expertise is required to install, customise and managethe Internet map server;
- Full access to the hosting Web server is required to installand manage software components (not always possiblewith mainstream (cheap) shared virtual hosting packagesoffered by most Web Hosting Providers; for example,HCM current Web hosting package does not allow full ac-cess to the hosting server to install extra software); and
- ESRI MapCafe Java applet might be slow to download(depending on speed of client's Internet connection).
This paper describes a simple, low-cost way that has beendeveloped for HCM to serve hypermaps with dynamic da-tabase drill-down functionality (dynamic database links)without the need for a dedicated Internet Map Server.
MethodsHCM has been developed as an ArcView GIS project andfeatures GIS-driven spatialisation based on an underlyingresource metadata base where ICD-9-CM codes (WHO In-ternational Classification of Diseases, ninth revision, USClinical Modification) describing the topics of mapped re-sources are stored alongside other useful informationabout theses resources, including their geographic prove-nance and Web addresses [5]. We used ESRI ArcView GISVersion 3.1 for Windows [http://www.esri.com]. Web-View 1.1, the Internet extension to ArcView GIS, was thenused to translate HCM Views (maps) from ArcView to theWeb in the form of client-side imagemaps in JPEG format.The authors also used another ArcView extension in HCMproject, namely BodyViewer v2.1 for ICD-9 codes from
GeoHealth, Inc. to generate HCM human body maps (seebelow).
WebView featuresWebView was developed by Thomas Zerweck at ZEBRIS inMunich, Germany ( [http://www.zebris.com/] – [6]). Itwas programmed in Avenue (an ArcView scripting lan-guage), HTML (HyperText Markup Language – for theWeb templates) and JavaScript (to add additional interac-tive functionality to its client-side Web maps). It is muchcheaper compared to a dedicated ESRI Internet Map Serv-er solution, though not as powerful as the latter.
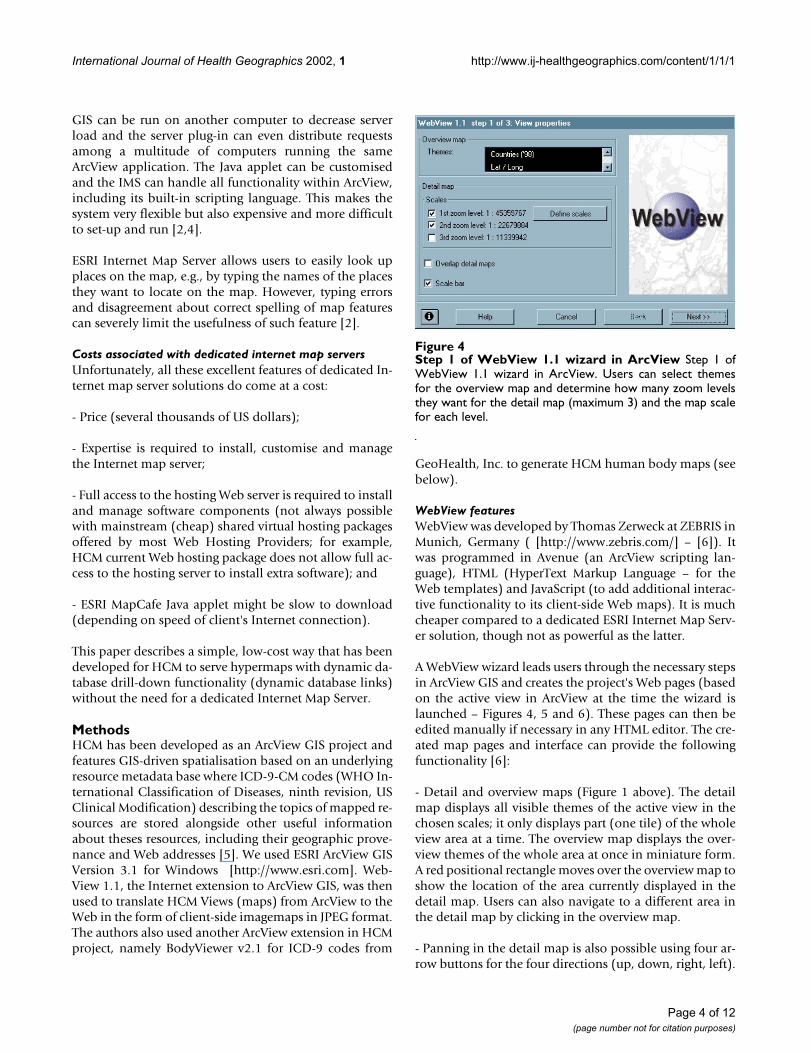
A WebView wizard leads users through the necessary stepsin ArcView GIS and creates the project's Web pages (basedon the active view in ArcView at the time the wizard islaunched – Figures 4, 5 and 6). These pages can then beedited manually if necessary in any HTML editor. The cre-ated map pages and interface can provide the followingfunctionality [6]:
- Detail and overview maps (Figure 1 above). The detailmap displays all visible themes of the active view in thechosen scales; it only displays part (one tile) of the wholeview area at a time. The overview map displays the over-view themes of the whole area at once in miniature form.A red positional rectangle moves over the overview map toshow the location of the area currently displayed in thedetail map. Users can also navigate to a different area inthe detail map by clicking in the overview map.
- Panning in the detail map is also possible using four ar-row buttons for the four directions (up, down, right, left).
Figure 4Step 1 of WebView 1.1 wizard in ArcView Step 1 ofWebView 1.1 wizard in ArcView. Users can select themesfor the overview map and determine how many zoom levelsthey want for the detail map (maximum 3) and the map scalefor each level.
Page 4 of 12(page number not for citation purposes)

International Journal of Health Geographics 2002, 1 http://www.ij-healthgeographics.com/content/1/1/1
- Legend for map contents.
- Scale bar.
- WebView offers three-way hotspots with two-way clicksdepending on which toolbar button (Identify button witha blue 'i' icon or HotLink button with a yellow spark icon)is selected when the user clicks a map object:
- attribute information can be displayed on mouse over(map feature ToolTip, e.g., in HCM maps, country nameor body organ/system name);
- other attribute information can be displayed on mouseclick while the Identify button is selected, e.g., to displaymore country information in a message box based on oneor more attribute fields (Figure 23 below); and
- mouse clicks while the HotLink button is selected can beassociated with an image, video, sound file, Web page oremail address. (In HCM, we associated them with data-base query pages to be executed on HCM Web server.)
- Zoom in and zoom out in the detail map (up to threezoom levels in WebView 1.1).
- Up to five themes can be selected as interactive layers foreach of the three zoom levels; attributes of these themescan be associated with the different mouse events out-lined above (Figure 5). Different themes (layers) can beassociated with the different zoom levels. This allows fordifferent map contents and detail at different zoom levels(scales). This zooming strategy is called static steppedzooming.
Version 2.1 of WebView provides additional features (notavailable in WebView v1.1). These include five zoom lev-els, transparent layers (users can switch layers visible/in-
Figure 5Step 2 of WebView 1.1 wizard in ArcView Step 2 ofWebView 1.1 wizard in ArcView. Up to five themes can beselected as interactive layers for each zoom level; attributesof these themes can be associated with the different mouseevents (on mouse move, on click/Identify, and on click/Hot-Link). Different themes can be associated with the differentzoom levels. The (red) arrow points to the HotLinkattribute, a field the authors added to the table of "Countries('98)" theme in ArcView (see later). It stores Web addressesof database query pages on HCM server.
Figure 6Step 3 of WebView 1.1 wizard Step 3 of WebView 1.1wizard, showing the Web Properties and Image Propertiesdialogue boxes. The user can control the size of the savedimage files by adjusting the size of the output images in pixels(individual tiles or detail maps and overview map) and theirJPEG quality (better quality is achieved on the expense oflower compression; a quality setting of 80 is WebViewdefault).
Page 5 of 12(page number not for citation purposes)

International Journal of Health Geographics 2002, 1 http://www.ij-healthgeographics.com/content/1/1/1
visible) and object layers (Figure 7). The latter provides aclient-side map feature lookup functionality "similar" to,though not as powerful or sophisticated as that providedby dedicated map servers. Developers select up to twothemes as object layers. An object layer is a theme, inwhich the user may search for certain attribute value. Theattribute values are listed in a combo box, e.g., a list ofcountry names as in the screenshot above. Selecting acountry from the list, will cause the detail map (on theleft) to zoom to that country and mark its exact positionon the map (Figure 7) [6].
WebView limitationsAlthough it saves users the trouble of setting-up and run-ning more complex Internet Map Server software while of-fering similar user interface features, the basic WebViewset-up does not support any real GIS database drill-down
functionality (the generated maps cannot communicatewith the corresponding underlying databases). Moreover,projects published by WebView on the Web are uncou-pled or disconnected from the original correspondingprojects in ArcView.
"Patching" the basic WebView set-upIn HCM, the authors developed their own (partial) work-arounds for these limitations of WebView (Figure 8). Thissolution makes use of WebView HotLink functionality toimplement a dynamic database drill-down that will al-ways reflect the latest updates to this database. By clickingdifferent hotspots on the client-side imagemaps in HCM,users are actually triggering server-side pre-formulatedSQL (Structured Query Language) queries against an un-derlying database of resource metadata. The database isregistered on HCM server (a Windows 2000/NT 5 IIS Serv-er – Microsoft Internet Information Server/Services) as anODBC (Open DataBase Connectivity) Data Source (Fig-ure 9) and is the same database we are connecting to inArcView. We coded the SQL queries in ASP (Active ServerPages) pages for execution on the server. The ASP pages re-turned to users in their browsers only contain query re-sults in the form of formatted HTML. The actual SQL andASP code as found in the ASP pages stored on the server isnever sent to the end user.
HCM metadata base (based on Dublin Core metadata set)Candidate Internet resources are hand-selected (to ensurequality). Their attributes, including Web address and ICD-9-CM codes representing their subjects, are compiled in
Figure 7Screenshot of WebView v2.1 Screenshot of WebViewv2.1.
Figure 8HCM (partial) workarounds for WebView limitationsHCM (partial) workarounds for WebView limitations. Web-View converts HCM Views in ArcView to client-side ima-gemaps. Clicking the different hotspots on these client-sideimagemaps will trigger server-side pre-formulated SQL que-ries against an underlying database of resource metadata onHCM server. The database is the same database we are con-necting to in ArcView. We coded the SQL queries in ASPpages for execution on the server.
Page 6 of 12(page number not for citation purposes)

International Journal of Health Geographics 2002, 1 http://www.ij-healthgeographics.com/content/1/1/1
HCM metadata base based on the Dublin Core (DC – [ht-tp://www.dublincore.org/]) metadata set scheme withHCM own extensions for resource quality and geographi-cal provenance.
HCM allows for three DC subject fields per resource recordpermitting up to three ICD-9-CM codes to be used to un-ambiguously describe the topic(s) of each selected re-source.
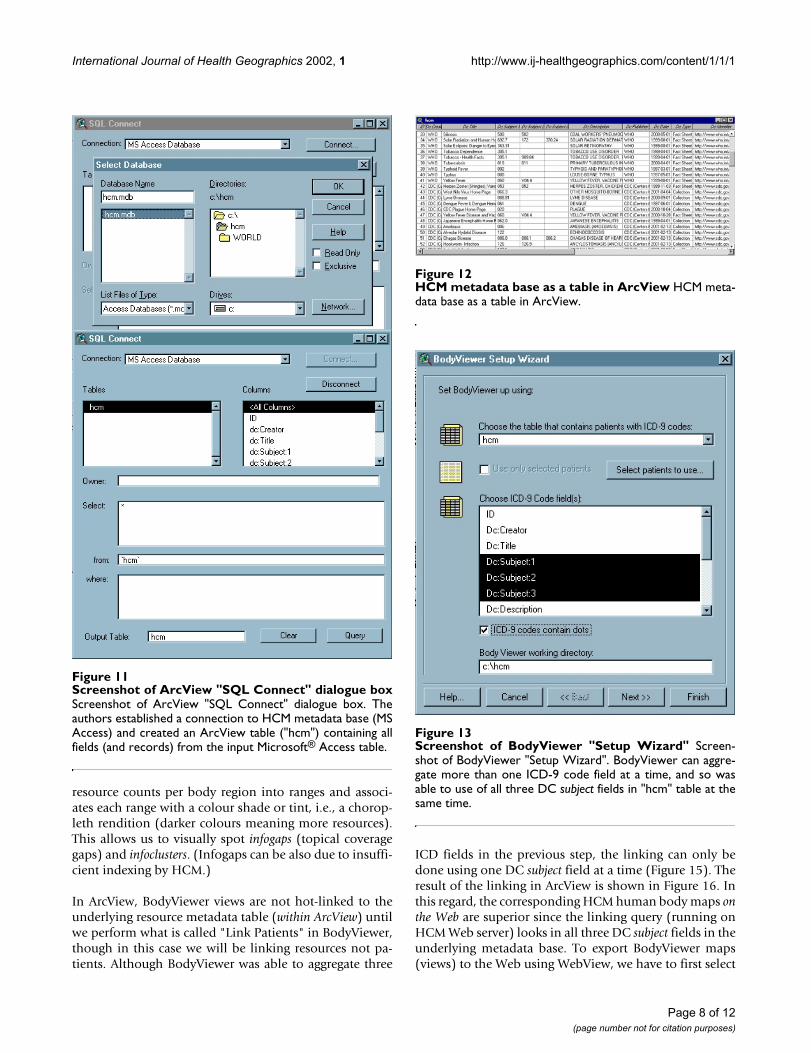
The resource metadata base was implemented in Micro-soft® Access (Figure 10). We used ArcView "SQL Connect"feature to connect to HCM metadata base and import allfields and records from it into an ArcView table that willrefresh each time the project is opened in ArcView (Fig-ures 11 and 12). This is the same database currently regis-tered on HCM server as an ODBC Data Source (Figure 9above), which users query by clicking the hypermaps.
Using ArcView's BodyViewer extensionBodyViewer is an ArcView GIS extension from GeoHealth,Inc. [http://www.geohealth.com/] that combines thepower of GIS with computerised body organ system dia-grams. It lets users see where their ICD-coded healthcaredata (medical/health Internet resources in our case) maponto the human body based on the body region(s) theycover [7].
We used this extension to generate the human body topi-cal maps in HCM. These maps allow the navigation of re-sources by body location/system according to ICD-9-CM.In BodyViewer human body maps, map symbols are min-iature simplified drawings or icons of the different bodyorgans and systems. They act as visual labels to the differentresource categories that have been classified and mappedaccording to their DC subject fields (ICD-9 codes). Theseicons (on the corresponding Web hypermaps) are linkedto respective ASP query pages that are executed on HCMWeb server to retrieve the appropriate resources based onthe ICD-9 codes represented by the clicked icon. For ex-ample, if the cardiovascular icon is clicked, a query will belaunched to retrieve resources with cardiovascular ICD-9codes. Our bibliographic/cybergraphic use of this exten-sion to map ICD-coded medical/health Internet resourcesis the first of its kind and was never suggested in Body-Viewer documentation by GeoHealth, Inc. (the manufac-turer of BodyViewer).
We used BodyViewer "Setup Wizard" to map the Internetresources listed in HCM onto the human body (Figures 13and 14). These resources have been indexed in the meta-data base that we imported into ArcView in the previousstep (see Figure 12 above). The mapping is based on thethree ICD-9 fields in the imported table. BodyViewer canaggregate more than one ICD-9 code field at a time, andso was able to use all three DC subject fields in HCM meta-data table combined to compute resource counts by clini-cal subject category/body region. BodyViewer classifies
Figure 9Screenshot of HCM Web Server Control PanelScreenshot of HCM Web Server Control Panel (only accessi-ble by server administrator). The same Microsoft® Accessdatabase we are connecting to in ArcView (HCM.MDB) isshown registered on HCM server (a Windows 2000/NT 5 IISServer) as an ODBC Data Source.
Figure 10HCM resource metadata entry form in Microsoft®
Access 97 HCM resource metadata entry form in Micro-soft® Access 97.
Page 7 of 12(page number not for citation purposes)
International Journal of Health Geographics 2002, 1 http://www.ij-healthgeographics.com/content/1/1/1
resource counts per body region into ranges and associ-ates each range with a colour shade or tint, i.e., a chorop-leth rendition (darker colours meaning more resources).This allows us to visually spot infogaps (topical coveragegaps) and infoclusters. (Infogaps can be also due to insuffi-cient indexing by HCM.)
In ArcView, BodyViewer views are not hot-linked to theunderlying resource metadata table (within ArcView) untilwe perform what is called "Link Patients" in BodyViewer,though in this case we will be linking resources not pa-tients. Although BodyViewer was able to aggregate three
ICD fields in the previous step, the linking can only bedone using one DC subject field at a time (Figure 15). Theresult of the linking in ArcView is shown in Figure 16. Inthis regard, the corresponding HCM human body maps onthe Web are superior since the linking query (running onHCM Web server) looks in all three DC subject fields in theunderlying metadata base. To export BodyViewer maps(views) to the Web using WebView, we have to first select
Figure 11Screenshot of ArcView "SQL Connect" dialogue boxScreenshot of ArcView "SQL Connect" dialogue box. Theauthors established a connection to HCM metadata base (MSAccess) and created an ArcView table ("hcm") containing allfields (and records) from the input Microsoft® Access table.
Figure 12HCM metadata base as a table in ArcView HCM meta-data base as a table in ArcView.
Figure 13Screenshot of BodyViewer "Setup Wizard" Screen-shot of BodyViewer "Setup Wizard". BodyViewer can aggre-gate more than one ICD-9 code field at a time, and so wasable to use of all three DC subject fields in "hcm" table at thesame time.
Page 8 of 12(page number not for citation purposes)

International Journal of Health Geographics 2002, 1 http://www.ij-healthgeographics.com/content/1/1/1
a Map Unit ("meters") for the view or else WebView willnot be able to determine a scale for rendering the detailmap and will abort the process (Figure 17). We inserted aHotLink field in BodyViewer map tables to store the Webaddresses of corresponding ASP query pages that will runon HCM Web server; this field is associated with the Hot-Link mouse event feature of WebView (Figure 18).
HCM World map in ArcViewThe authors used the basic World map dataset that shipswith ArcView GIS 3.1 as a project example (world.apr),and added a HotLink field to the "Countries ('98)" table(Figures 19 and 20). This field was associated with theHotLink mouse event in WebView wizard when the au-thors generated HCM World Map for the Web. Clicking acountry on HCM World Map (on the Web) will launch theappropriate country query to retrieve only those resourcesauthored in and/or published in the clicked country. Que-ry results will always reflect the latest updates carried onthe metadata base without the need to change any code.
It is also possible to join the resource metadata and WorldCountries tables (within ArcView) based on the values ofa common field (country names – Figure 21). This kind offunctionality is not possible with WebView.
Results and DiscussionHCM Web Interface(Only components generated using the "patched" Web-View method are described below.)
Figure 14Screenshot of the final step in BodyViewer "SetupWizard" Screenshot of the final step in BodyViewer "SetupWizard". Clicking the "Create Diagram" button will generatean "all systems" human body choropleth map showingresource counts in different organ systems. If "Show all sys-tems diagram" is unchecked, a more detailed human bodymap will be created for (only) the system or sub-systemwhose name is selected in one of the two list boxes on theleft.
Figure 15BodyViewer linking to resources within ArcView Bod-yViewer linking of its views to the underlying resource meta-data table within ArcView GIS can only be done using oneDC subject field at a time. In this regard, the correspondingHCM human body maps on the Web are superior since thelinking query looks in all three DC subject fields in the under-lying metadata base (see below).
Figure 16Screenshot of four BodyViewer views and tableunderlying one of them in ArcView Screenshot of fourBodyViewer Systems and Sub-systems close-up maps (views)and the table underlying one of them in ArcView GIS show-ing the "Link Patients (Resources)" feature of BodyViewer inaction. Notice the database drill-down (red line); clicking"Other-E codes" on BodyViewer E codes Map selects thecorresponding field(s) (in yellow) from HCM metadata table(in this case Exposure to Noise – ICD: E928.1). There aremany other BodyViewer close-up diagrams besides thoseshown here offering much more detail than the general "AllSystems" body map.
Page 9 of 12(page number not for citation purposes)

International Journal of Health Geographics 2002, 1 http://www.ij-healthgeographics.com/content/1/1/1
HCM BodyViewer maps are available on the Web at thefollowing address: [http://healthcybermap.seman-ticweb.org/bodyviewer] (Figure 22). These human bodytopical maps can be used to visually browse selected med-ical/health resources on the Web by clinical subject ac-cording to ICD-9-CM classification.
Clicking a human body icon on these maps triggers a serv-er-side dynamic query. This is for example the pre-formu-lated SQL query that currently runs on HCM server in real-time to retrieve resources having E codes (codes for Exter-nal Causes of Injury and Poisoning) in any of their DCsubject fields [http://healthcybermap.semanticweb.org/
Figure 17Selecting a Map Unit for a BodyViewer view inArcView Selecting a Map Unit ("meters" in this screenshot)for a BodyViewer view in ArcView. This is necessary for thesuccessful execution of WebView.
Figure 18The HotLink field in a BodyViewer table in ArcViewScreenshot showing the HotLink field that has been added tothe underlying table of a BodyViewer view in ArcView.
Figure 19Screenshot of ArcView "Field Definition" dialoguebox Screenshot of ArcView "Field Definition" dialogue boxwhich is used to add a new field to an existing table anddefine its properties. In this screenshot, the properties of theHotLink field are shown. The field is defined as "String." It canhold up to 255 character (the maximum allowed for this typein ArcView) and is used to store Internet addresses (URIs).
Figure 20The HotLink field in the "Countries ('98)" table inArcView Screenshot of the "Countries ('98)" table inArcView showing the inserted HotLink field that stores theaddresses of the "resources by country" ASP query pages onHCM server.
Figure 21Tables joining in ArcView Two Web resources from theUnited Kingdom (Birmingham and London) related to theNervous System (Parkinson's Disease – ICD: 332 and Multi-ple Sclerosis – ICD: 340) are selected (in yellow) at the sametime in all open maps (World Map and BodyViewer All Sys-tems body map) and tables ("Countries ('98)" and "hcm"). Toachieve this functionality, the authors first joined the twotables based on the values of a common field (countrynames). This kind of functionality is not possible with Web-View.
Page 10 of 12(page number not for citation purposes)

International Journal of Health Geographics 2002, 1 http://www.ij-healthgeographics.com/content/1/1/1
bodyviewer/e-codes.asp] – see Example ASP page fromHCM in "Additional file" for full code of this page):
sql = "SELECT hcm. [dc:Creator], hcm. [dc:Title],
hcm. [dc:Subject:1], hcm. [dc:Subject:2], hcm. [dc:Sub-ject:3],
hcm. [dc:Description], hcm. [dc:Publisher], hcm.[dc:Date],
hcm. [dc:Type], hcm. [dc:Identifier], hcm. [dc:Language],
hcm. [dc:Coverage], hcm. [hcm:Location:city],
hcm. [hcm:Location:country], hcm. [hcm:Quality], hcm.[hcm:Comment] FROM hcm WHERE (((hcm. [dc:Sub-ject:1]) Like 'E%')) OR (((hcm. [dc:Subject:2]) Like'E%')) OR (((hcm. [dc:Subject:3]) Like 'E%'))"
All three DC subject fields in each resource record aresearched for matching ICD-9-CM codes.
HCM World Map Web interface is available on the Web atthe following address: [http://healthcybermap.seman-ticweb.org/world_map/] (Figures 1 and 23). The mapscan be used to browse Web resources by country of prov-enance.
Online Help is available for both BodyViewer and WorldMap Web interfaces. Clicking the green question mark '?'button in Figures 22 and 23 above will display Help in-structions in a separate pop-up window (Figure 24).
Maintenance of HCM Web mapsSince WebView does not allow the dynamic generation ofWeb maps from ArcView, some of HCM Web maps willultimately need to be manually regenerated using Web-View when the underlying data change if this change hasimplications on the maps' appearance. In cases when onlymap attribute data change without a corresponding effecton map appearance, e.g., updating the address of a Webresource in the metadata base, nothing needs to be done;
Figure 22Screenshot of HCM BodyViewer Maps on the WebScreenshot of HCM BodyViewer Maps on the Web [http://healthcybermap.semanticweb.org/bodyviewer/]. These hier-archical human body topical maps with semantic zoom can beused to visually browse selected health resources on theWeb by clinical subject. The resources have been catego-rised and spatialised to the different human body organs onthe map according to a clinical coding scheme.
Figure 23Screenshot of HCM World Map on the Web showingthe Identify button function Screenshot of HCM WorldMap on the Web [http://healthcybermap.semanticweb.org/world_map/]. Note the depressed (selected) Identify buttonin the toolbar on the left and the pop-up message box dis-playing additional information on Canada after the latter wasclicked. Any other information, e.g., health related, couldhave been displayed instead or additionally depending onwhat is available in the underlying table in ArcView fromwhich these attributes are "pulled" and associated with thehypermaps when they are generated by WebView. Otherbuttons on the toolbar allow zooming in and out and panningthe map, and activating the HotLink function (instead of Iden-tify), so that clicking a country retrieves the bibliographiccards of resources associated with it in a separate pop-upwindow. Unlike the dynamic, always up-to-date information(database queries) associated with the HotLink button, infor-mation associated with the Identify button is static (exportedwith the maps from ArcView and detached from the latter)and can be only updated (if needed) by regenerating the mapsusing WebView.
Page 11 of 12(page number not for citation purposes)

International Journal of Health Geographics 2002, 1 http://www.ij-healthgeographics.com/content/1/1/1
the same ASP query pages (unmodified) will retrieve thelatest updates. HCM GIS-generated Web maps can begrouped into:
- Choropleth maps that need to be regenerated when theunderlying data are updated, e.g., the BodyViewer maps asthe colour shades of the various body organ systems inthese maps reflect the number of resources associatedwith them, and so will change whenever the database isupdated (resources added and/or deleted). In this case,the Web maps must recreated in ArcView using WebViewthen uploaded to the Web server to replace older ones. As-sociated query pages need not be changed.
- Chorochromatic maps that don't usually need to be up-dated, e.g., the world maps. Whenever new resources areadded (or existing ones updated/deleted), they will auto-matically appear (or disappear) in the query results whenthe corresponding countries on the map are clicked. Thereis no need to change the map as long as the addresses ofthe dynamic ASP query pages on HCM server don't change(e.g., [http://healthcybermap.semanticweb.org/cana-da.asp]). The only reason to regenerate these maps wouldbe if some of their underlying attribute values that areused with WebView Identify function change, or if the po-litical boundaries between some countries change (whichis not very frequent).
ConclusionsIn this paper, we have described in detail HCM cost-effec-tive method for serving Web hypermaps with dynamic da-tabase links/drill-down functionality on the Web. Theproposed solution is currently used for publishing HCMGIS-generated navigational information maps on the Webwhile maintaining their links with the underlying re-source metadata base. The authors believe their map serv-ing approach as adopted in HCM has been very successful,especially in cases when only map attribute data changewithout a corresponding effect on map appearance. How-ever, the main benefits of HCM solution are that it ismuch cheaper and simpler to deploy and maintain(doesn't need full access to the hosting Web server to in-stall and manage extra software components) comparedto a full-fledged Internet mapping server solution. Itshould be also possible to use the same solution to pub-lish other interactive GIS-driven maps on the Web, e.g.,maps of real world health problems.
Authors' contributionsAll authors contributed equally to this work.
AcknowledgementsThe authors would like to thank Dr. Christopher Austin president of Geo-Health, Inc., USA, who supplied BodyViewer v2.1 Extension Version (ICD-9) free of charge for the purpose of this research.
References1. Old LJ: Web Access to Non-spatial Data using Internet Map
Servers. In: Proceedings of the 21st Annual ESRI International User Con-ference San Diego, California 2001 [http://gis.esri.com/library/user-conf/proc01/professional/papers/pap237/p237.htm]
2. Kraak MJ, Brown A: Web Cartography: Developments andProspects. London, Taylor & Francis 2001
3. Frappier J, Williams D: An overview of the National Atlas ofCanada. In: Proceedings of the 19th International Cartographic Confer-ence ICC99 (Edited by: Keller CP) Ottawa, Canadian Institute of Geomatics1999, 261-267
4. Environmental Systems Research Institute, Inc. (USA): ArcView In-ternet Map Server Frequently Asked Questions. 2002 [http://www.esri.com/software/arcview/extensions/imsfaq.html]
5. Kamel Boulos MN, Roudsari AV, Carson ER: A Semantic VisualBrowser of Medical Internet Resources Based on ClinicalCodes and the Human Body Metaphor. Health Information andLibraries Journal 2002
6. ZEBRIS (München Germany): WebView – The Internet Exten-sion for ArcView GIS [http://www.zebris.com/english/main_webview.htm]11 July 2002
7. GeoHealth, Inc. (USA): BodyViewer Extension for ArcView GIS[http://www.geohealth.com/bodyviewer.html]11 July 2002
Figure 24HCM online Help Window HCM Help Window explain-ing the functions of the different map interface buttons.
Additional material
Additional fileExample ASP page from HCMClick here for file[http://www.biomedcentral.com/content/supplementary/1476-072X-1-1-S1.pdf]
Page 12 of 12(page number not for citation purposes)