A semi-formal approach to build the functional graph of an automated production system for...
14
A semi-formal approach to build the functional graph of an automated production system for supervision purposes MOHAMED GHAZEL*{, ARMAND TOGUYE ´ NI{ and MICHEL BIGAND{ {Laboratoire d’Automatique, Ge´nie Informatique et Signal (LAGIS), CNRS UMR 8021, Ecole Centrale de Lille, BP 48, 59651 Villeneuve d’Ascq, France {E ´ quipe de Recherche en Ge´nie Industriel, Ecole Centrale de Lille, BP 48, 59651 Villeneuve d’Ascq, France This paper presents a functional analysis approach, called an analytical approach, used to model automated production systems (APSs). In addition, Unified Modelling Language models taking into account the various business concepts (i.e. the concepts used in our interest field) involved in this approach are proposed. The final goal of this study is the automation of an analytical approach to enable an expert to obtain the functional graph of an existing APS. This graph has proved useful in developing fault detection and isolation, and fault-tolerant control techniques for flexible manufacturing systems (FMSs) and complex plants such as nuclear power plants or chemical plants. However, industrial applications have revealed difficulties in manually constructing functional graphs for complex systems, thus justifying automation for this modelling process. The originality of our approach lies in the fact that it is generic, i.e. it is not specific to a particular set of APSs. This property results both from the use of generic concepts such as the notion of function that is independent of the application context and from the adoption of an object-oriented approach for our analysis process. This study allows us to develop an efficient software tool. It also allows enrichment of an existing reference frame which regroups different models of an FMS from various points of view. Keywords: Supervision purposes; UML; Analytical approach; Functional graph; Automated production system 1. Introduction Automated production systems (APSs) are essentially complex systems given the interdependence of their components and the faults that can affect their functioning. These faults can degrade the system performance and can lead to dangerous consequences. A fault is the breakdown of a plant item, which may be serious or tolerable. Competitiveness induces companies to have productive, efficient, and dependable systems (Massotte 1996). Re- sponse to a fault comes from the dependability concept. This concept has been investigated, with the notion of fault tolerance, in automatic control systems (Frank 1996) and in the field of computer science (Dugan et al. 1992, Laprie 1993, Laprie et al. 1999). There are two types of fault-tolerance approaches: dysfunctional and functional. Dysfunctional approaches such as failure mode and effect analysis (FMEA) consist in modelling the faulty behaviour of the system. These attempt to establish cause–conse- quence relations between the faults and their consequences. Their main problem is the difficulty for the designer to ensure the completeness of this knowledge. On the other hand, functional approaches consist in modelling the normal behaviour of the system as defined by its require- ments. This category has not been investigated as much as the previous one in the dependability field. This paper introduces a functional approach called an analytical approach. It is based on a functional graph (Toguye´ni et al. 1993, Ghazel et al. 2003a, b), a modelling tool coming from graph theory. The functional graph (FG) has proved *Corresponding author. Email: [email protected] International Journal of Computer Integrated Manufacturing, Vol. 19, No. 3, April-May 2006, 234 – 247 International Journal of Computer Integrated Manufacturing ISSN 0951-192X print/ISSN 1362-3052 online ª 2006 Taylor & Francis http://www.tandf.co.uk/journals DOI: 10.1080/03081070500066021
Transcript of A semi-formal approach to build the functional graph of an automated production system for...
A semi-formal approach to build the functional graph of anautomated production system for supervision purposes
MOHAMED GHAZEL*{, ARMAND TOGUYENI{ and MICHEL BIGAND{
{Laboratoire d’Automatique, Genie Informatique et Signal (LAGIS), CNRS UMR 8021, Ecole Centrale deLille, BP 48, 59651 Villeneuve d’Ascq, France
{Equipe de Recherche en Genie Industriel, Ecole Centrale de Lille, BP 48, 59651 Villeneuve d’Ascq, France
This paper presents a functional analysis approach, called an analytical approach, used to
model automated production systems (APSs). In addition, Unified Modelling Language
models taking into account the various business concepts (i.e. the concepts used in our
interest field) involved in this approach are proposed. The final goal of this study is the
automation of an analytical approach to enable an expert to obtain the functional graph
of an existing APS. This graph has proved useful in developing fault detection and
isolation, and fault-tolerant control techniques for flexible manufacturing systems
(FMSs) and complex plants such as nuclear power plants or chemical plants. However,
industrial applications have revealed difficulties in manually constructing functional
graphs for complex systems, thus justifying automation for this modelling process. The
originality of our approach lies in the fact that it is generic, i.e. it is not specific to a
particular set of APSs. This property results both from the use of generic concepts such as
the notion of function that is independent of the application context and from the
adoption of an object-oriented approach for our analysis process. This study allows us to
develop an efficient software tool. It also allows enrichment of an existing reference frame
which regroups different models of an FMS from various points of view.
Keywords: Supervision purposes; UML; Analytical approach; Functional graph;
Automated production system
1. Introduction
Automated production systems (APSs) are essentially
complex systems given the interdependence of their
components and the faults that can affect their functioning.
These faults can degrade the system performance and can
lead to dangerous consequences. A fault is the breakdown
of a plant item, which may be serious or tolerable.
Competitiveness induces companies to have productive,
efficient, and dependable systems (Massotte 1996). Re-
sponse to a fault comes from the dependability concept.
This concept has been investigated, with the notion of
fault tolerance, in automatic control systems (Frank 1996)
and in the field of computer science (Dugan et al. 1992,
Laprie 1993, Laprie et al. 1999). There are two types of
fault-tolerance approaches: dysfunctional and functional.
Dysfunctional approaches such as failure mode and effect
analysis (FMEA) consist in modelling the faulty behaviour
of the system. These attempt to establish cause–conse-
quence relations between the faults and their consequences.
Their main problem is the difficulty for the designer to
ensure the completeness of this knowledge. On the other
hand, functional approaches consist in modelling the
normal behaviour of the system as defined by its require-
ments. This category has not been investigated as much as
the previous one in the dependability field. This paper
introduces a functional approach called an analytical
approach. It is based on a functional graph (Toguyeni et
al. 1993, Ghazel et al. 2003a, b), a modelling tool coming
from graph theory. The functional graph (FG) has proved
*Corresponding author. Email: [email protected]
International Journal of Computer Integrated Manufacturing, Vol. 19, No. 3, April-May 2006, 234 – 247
International Journal of Computer Integrated ManufacturingISSN 0951-192X print/ISSN 1362-3052 online ª 2006 Taylor & Francis
http://www.tandf.co.uk/journalsDOI: 10.1080/03081070500066021

to be useful both in allowing online diagnosis of the faults
of complex APSs such as flexible manufacturing systems
(Toguyeni et al. 2003) and for alarm filtering (Toguyeni and
Craye 2000, Ghariani et al. 2002). Our main interest in such
a model is its causality property (Sekhri et al. 2003). Our
experience from a European project called CHEM (‘Ad-
vanced Decision Support System for chemical and
petrochemical processes’, a project funded by the European
Community under the Competitive and Sustainable
Growth programme of the Fifth RTD Framework
Programme (1998–2002) under contract G1RD-CT-2001-
00466; see www.cordis.lu or www.chem-dss.org) has shown
that it is necessary to automate the construction of
functional graphs. In this paper, we present a semi-formal
specification of the business-package models that enables
the analytical approach to be implemented.
This paper is organized as follows. In section 2, a general
presentation of the analytical approach is presented. Section
3 describes the modelling method while following the
analytical approach stages. By structuring in packages, we
clarify the organization of the obtained models. Section 3.5
illustrates how an analyst can use the resulting tool to
construct a functional graph of a plant. Section 4 presents the
application of themethod to a case study. UnifiedModelling
Language (UML) object diagrams come to illustrate the
class diagram made. This allows experts in the monitoring/
supervision field to validate the business package.
2. Analytical approach: a functional modelling method to
extract the functional graph of an APS.
2.1. Introduction: main concepts
An FG is a functional model that describes functional
relations between the system’s functions and the functions
of its components. The main problem is that it is difficult to
obtain an FG for a system. Two situations for constructing
an FG must be identified: from the point of view of an
analyst, who extracts the functional graph for an existing
system; and from the point of view of a designer, who first
constructs a functional graph to define the structure of the
system they want to conceive.
The analytical approach is a type of functional model-
ling. Three types of models are generally identified when
considering a functional modelling approach: a structural
model, a functional model and a behavioural model
(Sembugamoorthy and Chandrasekaran 1986).
2.1.1. Structural model. This model is based on composi-
tion relations between the components of a system. It
enables an analyst to decompose a system according to the
classical concepts of system, subsystem, and component. In
an analytical approach, composition relations are estab-
lished from the point of view of a maintenance agent. The
resulting model called a structural graph (SG) is a tree. Its
leaves are the smallest components that can be replaced
when repairing the system: they are the elementary
components of the system.
2.1.2. Functional model and function concept. A functional
model is based on the concept of function. Let us first
introduce this concept in our context, since it has already
been investigated by several authors, with different mean-
ings. With regard to previous studies, one particularity of
the analytical approach is the distinction between two types
of functions: generic and contextual. Generic functions
result in the ‘No-function-in-structure principle’ defined by
De Kleer and Brown (1981). This principle states that:
Definition 1: No-function-in-structure principle (De
Kleer and Brown 1981). The rules for specifying the
behaviour of any constituent part of the overall
system can in no way refer, even implicitly, to how
the overall system works.
Considering this principle and the function definition
proposed by Dean (1991), let us define the concept of
generic function.
Definition 2: Generic function (Toguyeni 2001). A
generic function is the response of a system to a given
stimulus when it operates properly. The response is
independent of the system’s environment.
In fact, this principle is useful to define functions from the
point of view of the designer of the scrutinized system or
component, but not from the point of view of an analyst.
Indeed, sometimes the analyst must take into account the
global behaviour of the system to understand the role of
some of its components. This conclusion leads us to
propose the definition of a contextual function.
Definition 3: Contextual function (Toguyeni 2001).
Contextual functions are introduced by the designer
of a system to compose or to adapt the generic
functions of its components in order to obtain the
required behaviour.
To understand the difference between generic and con-
textual functions, let us consider the following examples.
The first example is the case of a hydraulic jack. In a
workshop, it can be used in various ways. For example, a
jack can be used to stop parts in a boring machine. In this
case, it is generally said that a jack has a stop function.
However, a jack can also be used to orient a switch on a
conveyor. In this case, it can be said that a jack has a
placement function. Thus, what really is the function of a
jack, or does it have many functions? When a manufacturer
Functional graph of an automated production system 235
makes a jack, they do not consider the application for
which the jack will be used. They only assume that a jack
implements a translate function: this is the generic function
of a jack because it is independent of its environment. In
the previous examples, the stop function and the placement
function are functions obtained by adapting the jack’s
translate function to the context of each system where the
jack is used. These functions are contextual functions. They
are defined depending on the analyst’s experience (Hatchuel
and Weil 1992) and their understanding of the normal
behaviour of the system in normal functioning.
The analytical approach handles three types of func-
tional models: functional tree, flow model and FG. A
functional tree is an intermediate model based on
composition relations between the functions of a system.
These composition relations are inherited from relations
between the components in the structural graph. The flow
model establishes flow relations between the functions of a
system.
2.1.3. Behavioural model. This model explains how a
function works to transform its inputs to its outputs
(Dangoumau et al. 2002). This is taken into account
through logical operators such as AND, OR, and
Exclusive-OR. The relations between the system’s functions
are dependency relations. According to this context, an
AND operator specifies that the availability of a mother
function depends on the availability of all its daughter
functions. The OR operator specifies the functional
redundancy between functions. By contrast, Exclusive-OR
means that some daughter functions must not be used at
the same time to implement a mother function.
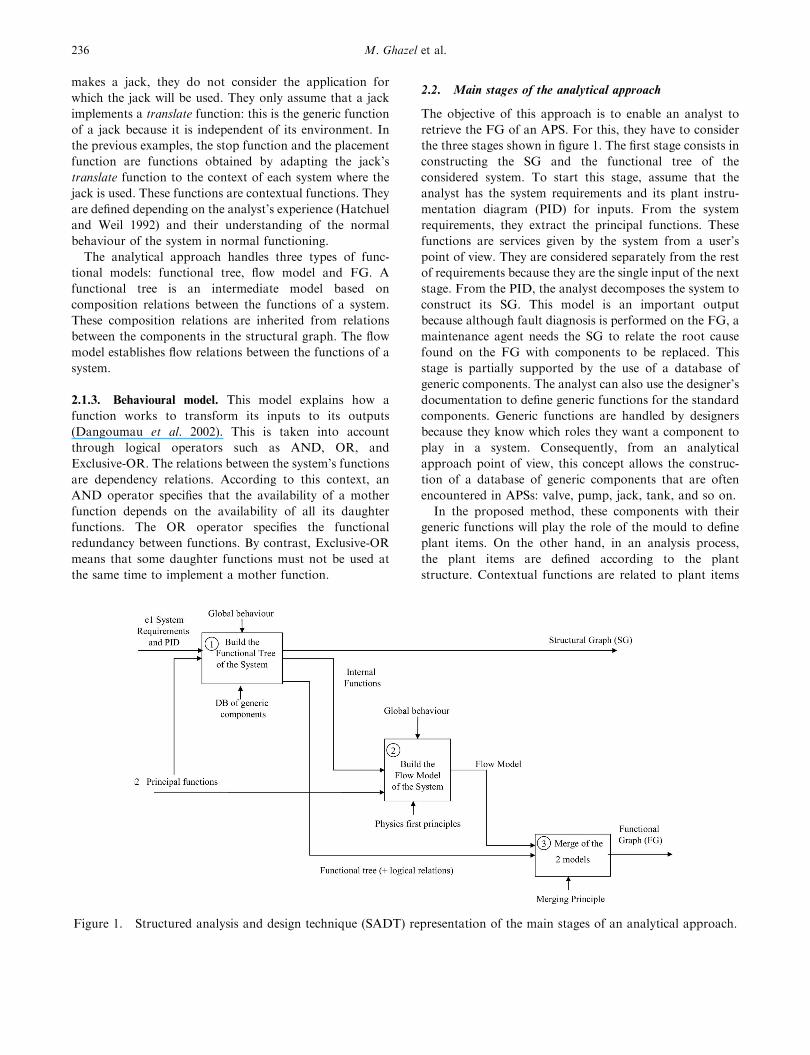
2.2. Main stages of the analytical approach
The objective of this approach is to enable an analyst to
retrieve the FG of an APS. For this, they have to consider
the three stages shown in figure 1. The first stage consists in
constructing the SG and the functional tree of the
considered system. To start this stage, assume that the
analyst has the system requirements and its plant instru-
mentation diagram (PID) for inputs. From the system
requirements, they extract the principal functions. These
functions are services given by the system from a user’s
point of view. They are considered separately from the rest
of requirements because they are the single input of the next
stage. From the PID, the analyst decomposes the system to
construct its SG. This model is an important output
because although fault diagnosis is performed on the FG, a
maintenance agent needs the SG to relate the root cause
found on the FG with components to be replaced. This
stage is partially supported by the use of a database of
generic components. The analyst can also use the designer’s
documentation to define generic functions for the standard
components. Generic functions are handled by designers
because they know which roles they want a component to
play in a system. Consequently, from an analytical
approach point of view, this concept allows the construc-
tion of a database of generic components that are often
encountered in APSs: valve, pump, jack, tank, and so on.
In the proposed method, these components with their
generic functions will play the role of the mould to define
plant items. On the other hand, in an analysis process,
the plant items are defined according to the plant
structure. Contextual functions are related to plant items
Figure 1. Structured analysis and design technique (SADT) representation of the main stages of an analytical approach.
236 M. Ghazel et al.
and are defined by the analyst. If the type of plant item
is referenced in the generic component database, the
analyst selects some of the generic functions of the
corresponding component to adapt them in order to
define its contextual functions. The analyst are not forced
to select all the generic functions proposed by a generic
component; they can just select those which are suitable
with regard to the role of the considered plant item. If
the type of plant item is not referenced in the database
or if the analyst does not find any suitable generic
functions, they must understand the role of the current
plant item in the system and then directly define
contextual functions without the support of any generic
function. During this stage, the analyst must also take
into account the functional redundancy in the system and
operating-mode requirements. This leads the analyst to
constrain the composition relations between the system’s
functions by logical operators. Consequently, in addition
to SG, the outputs of this stage are the internal functions
(contextual functions insured by the system components)
and the functional tree giving the composition relations
between the contextual functions and the specifications of
logical constraints between them.
The second stage of the approach enables the analyst to
construct the flow model of the system. This model is based
on flow relations between the contextual functions. Using
our tool, the analyst specifies flow relations considering
physics first principles such as flow conservation (De Kleer
and Brown 1981).
The third stage consists in merging the functional tree
and the flow model in order to take into account the two
types of relations that exist within these two models. This
merging is automatically done by our tool with respect to
the merging principle, which will be detailed in section 3.3.
3. Modelling approach
The analytical approach will be presented step by step while
explaining the various activities to be undertaken in each
stage. At the end of each stage, the part of the UML generic
model which takes into account the business concepts
involved will be proposed (OMG 2001 and Booch et al.
1999).
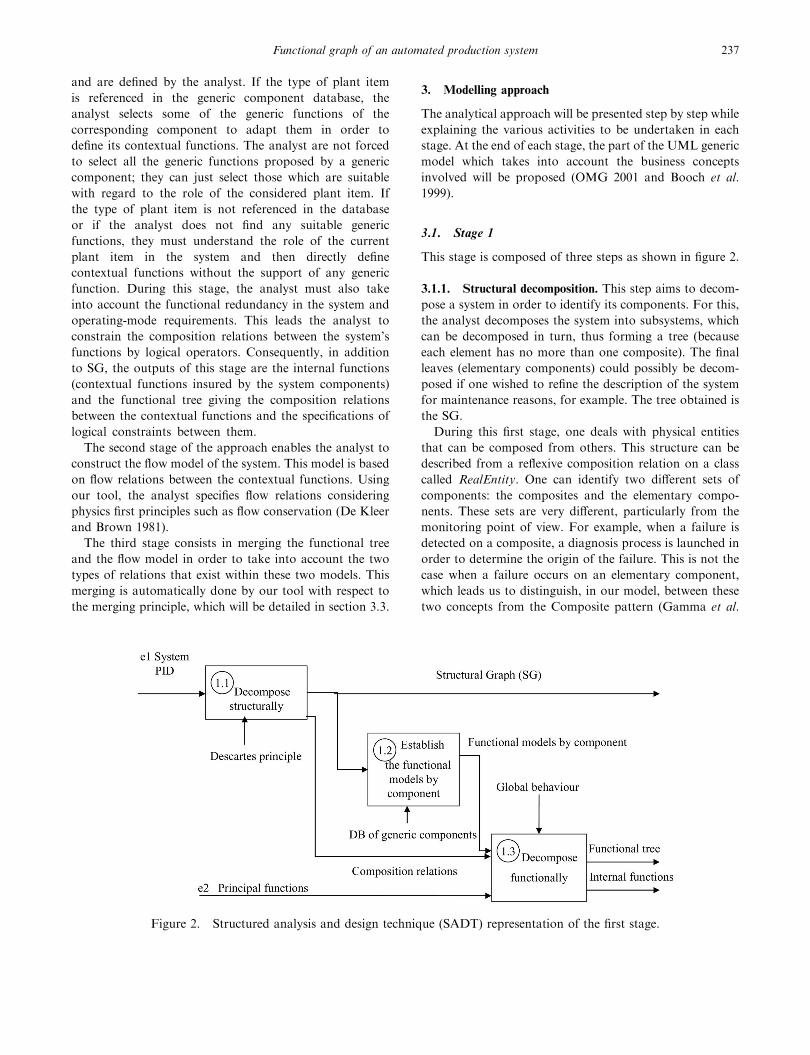
3.1. Stage 1
This stage is composed of three steps as shown in figure 2.
3.1.1. Structural decomposition. This step aims to decom-
pose a system in order to identify its components. For this,
the analyst decomposes the system into subsystems, which
can be decomposed in turn, thus forming a tree (because
each element has no more than one composite). The final
leaves (elementary components) could possibly be decom-
posed if one wished to refine the description of the system
for maintenance reasons, for example. The tree obtained is
the SG.
During this first stage, one deals with physical entities
that can be composed from others. This structure can be
described from a reflexive composition relation on a class
called RealEntity. One can identify two different sets of
components: the composites and the elementary compo-
nents. These sets are very different, particularly from the
monitoring point of view. For example, when a failure is
detected on a composite, a diagnosis process is launched in
order to determine the origin of the failure. This is not the
case when a failure occurs on an elementary component,
which leads us to distinguish, in our model, between these
two concepts from the Composite pattern (Gamma et al.
Figure 2. Structured analysis and design technique (SADT) representation of the first stage.
Functional graph of an automated production system 237

1995). Thus, the composites will be modelled by the
Composite class and the elementary components by the
EltComponent class. Also, in order to facilitate the
implementation of our final model, two types of composites
will be identified: the complete system, which will be
modelled by the GlobalSystem class, and the intermediate
components, which will be modelled by the InterComponent
class. Consequently, RealEntity and Composite classes
are chosen to be abstract to prohibit their instantiation
(figure 3). However, the model presented on figure 3 does
not respect certain business constraints that will be added
as object constraint language (OCL) constraints (Warmer
and Kleppe 1998):
. Among components and subcomponents of a given
real entity X, none can consist of X. This constraint
avoids having cycles in the composition of the
components. In order to guarantee this condition,
an attribute level, indicating the hierarchical level of
the entity in the Structural Graph, has been
introduced in the RealEntity class, considering that
the more the system is decomposed, and more the
level value increases.
. context Composite inv:
. self.level 5 self.component.level
. The level of the global system is zero.
. context GlobalSystem inv:
. self.level=0
. A real entity cannot belong to more than one
composite. This constraint guarantees a tree-like
structure for SG.
. context RealEntity inv:
. self.composite –4 size 5= 1
. A global system does not have a father (composite) in
the SG.
. context GlobalSystem inv:
. self.composite –4 size=0
. An inter-component has a father (composite) and
sub-components in the SG
. context InterComponent inv:
. self.composite –4 size=1
. self.component –4 size 4 1
3.1.2. Determination of the internal functions by compo-
nent. During this step, the analyst determines all the generic
functions held by each plant item identified during the
previous step. These functions are not systematically
rediscovered in each new study. Indeed, references of basic
components with their characteristics (generic functions,
etc.) can be filed in a DB. In certain cases, the analyst can
abstain from defining generic functions for a component,
particularly when this component is very specific, i.e. it is
not considered as a standard component (a standard
component is not necessarily an elementray component; it
is a component often used in APSs). The contextual
functions are then deduced from the role of these
components in the system and by adapting or composing
the obtained generic functions when these functions were
already defined.
The principal concepts used in this stage are ‘generic
function’ and ‘contextual function’. These concepts will be
represented by two classes: GenericFunction and ContFunc-
tion. To each real entity X encountered while analysing a
system (instance of the RealEntity non-abstract subclasses),
one can associate a generic entity which has the same
generic functions as X, and as mentioned previously, each
generic entity can be added to the DB. That will allow, inter
alia, the analysis process to be accelerated. Each generic
entity has one or more generic functions, and each real
entity has one or more contextual functions. Each
contextual function is operated by one and only one
component.
Figure 3. Part of the business class diagram modelling the first stage.
238 M. Ghazel et al.
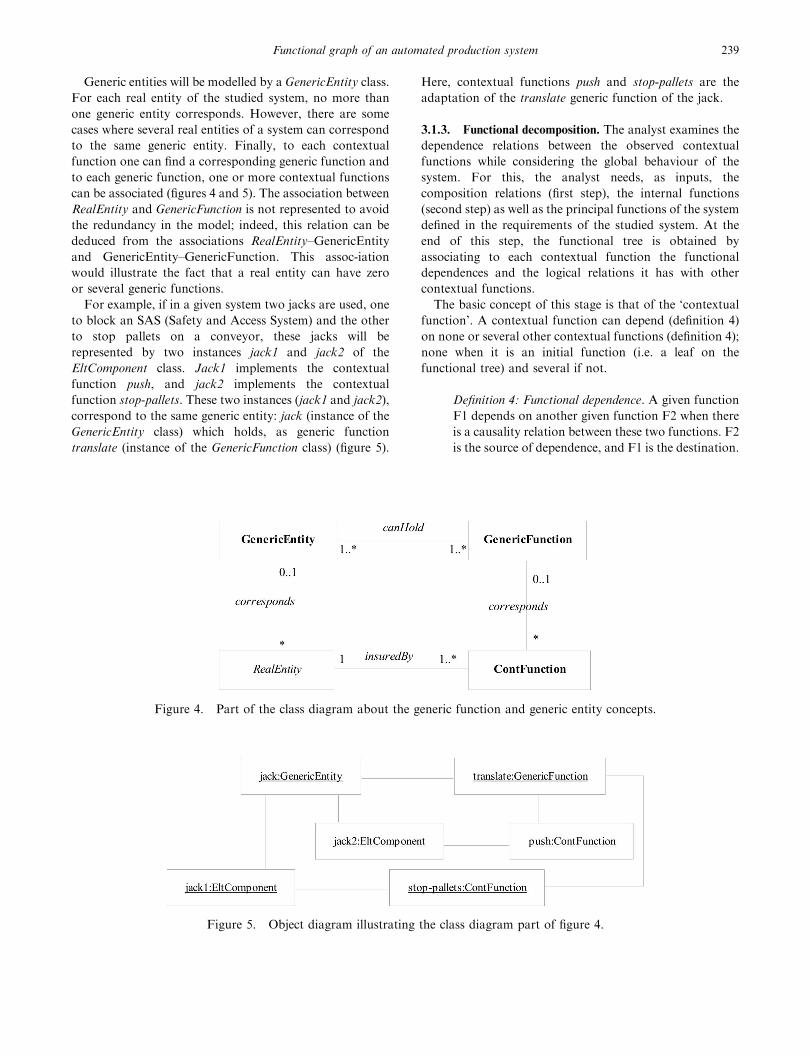
Generic entities will be modelled by a GenericEntity class.
For each real entity of the studied system, no more than
one generic entity corresponds. However, there are some
cases where several real entities of a system can correspond
to the same generic entity. Finally, to each contextual
function one can find a corresponding generic function and
to each generic function, one or more contextual functions
can be associated (figures 4 and 5). The association between
RealEntity and GenericFunction is not represented to avoid
the redundancy in the model; indeed, this relation can be
deduced from the associations RealEntity–GenericEntity
and GenericEntity–GenericFunction. This assoc-iation
would illustrate the fact that a real entity can have zero
or several generic functions.
For example, if in a given system two jacks are used, one
to block an SAS (Safety and Access System) and the other
to stop pallets on a conveyor, these jacks will be
represented by two instances jack1 and jack2 of the
EltComponent class. Jack1 implements the contextual
function push, and jack2 implements the contextual
function stop-pallets. These two instances (jack1 and jack2),
correspond to the same generic entity: jack (instance of the
GenericEntity class) which holds, as generic function
translate (instance of the GenericFunction class) (figure 5).
Here, contextual functions push and stop-pallets are the
adaptation of the translate generic function of the jack.
3.1.3. Functional decomposition. The analyst examines the
dependence relations between the observed contextual
functions while considering the global behaviour of the
system. For this, the analyst needs, as inputs, the
composition relations (first step), the internal functions
(second step) as well as the principal functions of the system
defined in the requirements of the studied system. At the
end of this step, the functional tree is obtained by
associating to each contextual function the functional
dependences and the logical relations it has with other
contextual functions.
The basic concept of this stage is that of the ‘contextual
function’. A contextual function can depend (definition 4)
on none or several other contextual functions (definition 4);
none when it is an initial function (i.e. a leaf on the
functional tree) and several if not.
Definition 4: Functional dependence. A given function
F1 depends on another given function F2 when there
is a causality relation between these two functions. F2
is the source of dependence, and F1 is the destination.
Figure 5. Object diagram illustrating the class diagram part of figure 4.
Figure 4. Part of the class diagram about the generic function and generic entity concepts.
Functional graph of an automated production system 239

In the class diagram, this dependence relation will be
modelled by a reflexive association dependsOf on the
ContFunction class. Graphically, in the functional tree,
such a relation is represented by a directed arc following the
causality direction: from the source toward the destination.
Two contextual functions f1 and f2 can cooperate to
fulfil another contextual function f3. Let us distinguish
between three types of cooperation: f1 and f2 are both used
to carry out f3. f1 and f2 can be used together to carry out
f3, but only one is sufficient. Also, f1 or f2 can be used to
carry out f3 but never together. Thus, it is clear that this
cooperation relation is more complex than the first
dependence relation. Hence, this cooperation will be
represented not by a simple reflexive association on the
ContFunction class but by a LogicalRelation class associa-
tion which will be derived in three subclasses: And, Or, and
XOr. These subclasses represent the three types of
cooperation between the contextual functions. The Logi-
calRelation class is chosen to be abstract to prohibit its
instantiation. It has an association attribute mother, a
reference on a contextual function, which indicates the
mother function f3 for which f1 and f2 cooperate. Thus,
following the analysis of this third phase, the part of the
business class diagram given by figure 6 is obtained:
Let us emphasize here that this model does not
comply with several business rules. Some OCL
constraints have to be added to guarantee the
coherence of this part.
. A contextual function cannot depend on itself.
. context ContFunction inv:
. self.mother –4 excludes(self) or self.daughter –4 ex-
cludes(self)
. A contextual function cannot have more than one
logical relation (and, or, xOr) with the same other
contextual function. This constraint is guaranteed by
the choice of an association class LogicalRelation;
indeed, the contextual functions that have a logical
relation with a given higher-level contextual function
represent a set in the mathematical sense of the term;
an element does not repeat.
3.2. Stage 2
The objective of the analyst in this phase is to obtain the
flow model. For this, the various flow relations between
the system components as well as their types are
identified. These relations will be modelled by a Flow-
Relation class. Three types of flow are identified: matter
flow, energy flow, and data flow. The last type is not
taken into account in this study. Thus, the FlowRelation
class becomes abstract, and two subclasses MaterialFlow
and EnergyFlow will derive from this class. To integrate
the various flow relations in the FG obtained at the end
of the analytical approach application, the flow relations
will be represented between the contextual functions. The
obtained part of the business class diagram is presented
in figure 7.
The model given by figure 7 must respect the following
constraint: a contextual function cannot be the source and
the destination of the same flow relation.
context FlowRelation inv:
self.source 54 self.destination
Figure 6. Part of the business class diagram modelling the
third stage.
Figure 7. Part of the business class diagram modelling the
second phase.
240 M. Ghazel et al.
3.3. Stage 3
The output of this stage supplies us the functional graph by
merging the functional tree (Stage 1) and the flow model
(stage 2). This merge is performed while respecting the
merging principle.
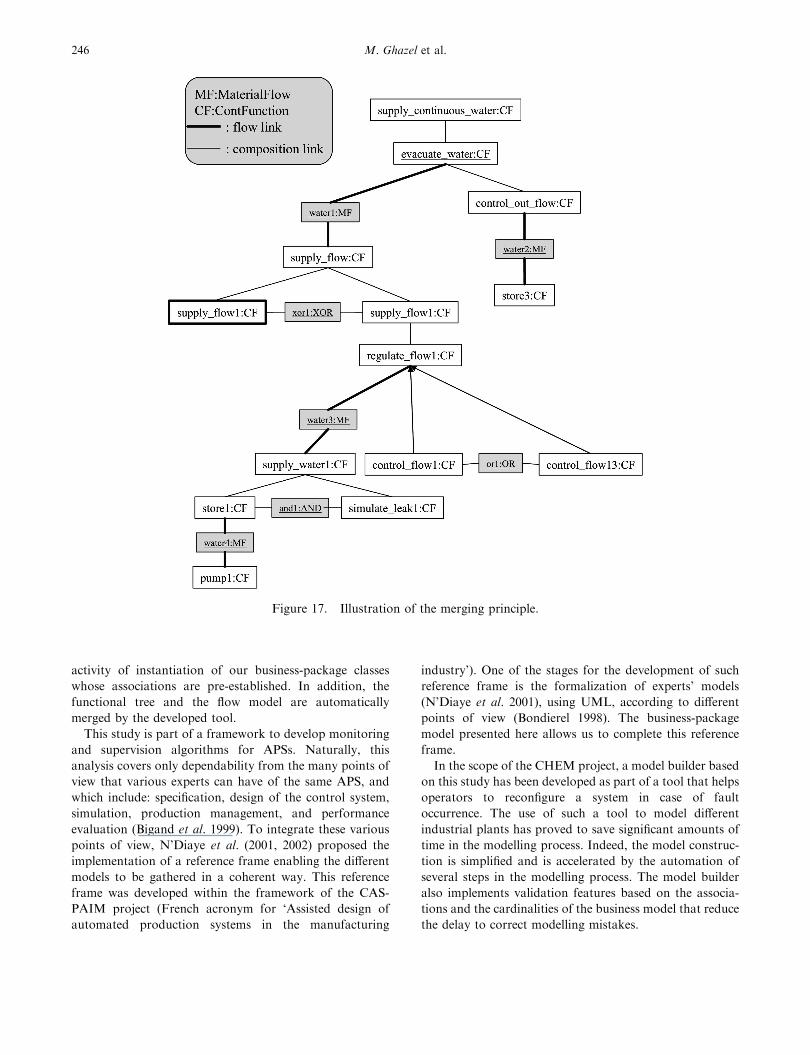
Merging principle (Toguyeni 2001). A flow relation
between two functions S (Source) and D (Destina-
tion) has priority with regard to a composition
relation between S and a higher-level function M,
which is a mother function (in the functional tree) of
D. This composition relation can be direct or
indirect.
This principle can be explained by the fact that a direct
consequence of any failure in the system is the disturbance
of the flow transmission from the faulty function
(producer) to the functions that consume this flow
(consumers).
This last stage is carried out by the IS (the Information
System implementing the final obtained model) which
provides the functional graph of the studied system
following the execution of a function merge().
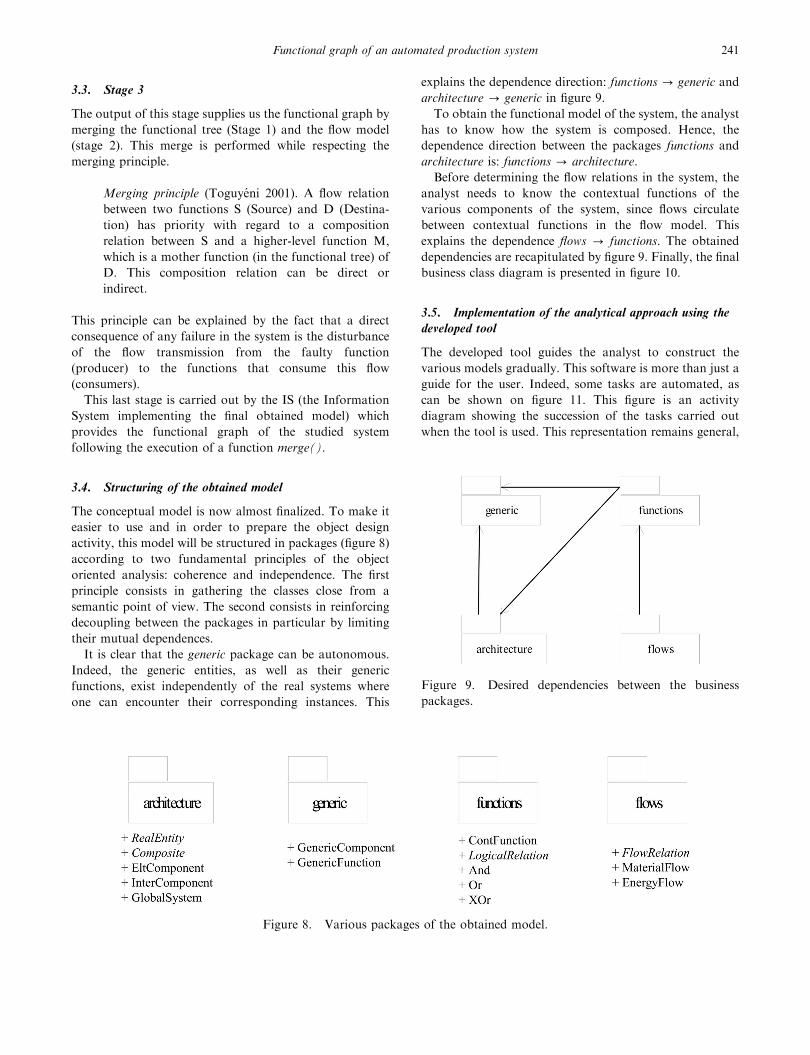
3.4. Structuring of the obtained model
The conceptual model is now almost finalized. To make it
easier to use and in order to prepare the object design
activity, this model will be structured in packages (figure 8)
according to two fundamental principles of the object
oriented analysis: coherence and independence. The first
principle consists in gathering the classes close from a
semantic point of view. The second consists in reinforcing
decoupling between the packages in particular by limiting
their mutual dependences.
It is clear that the generic package can be autonomous.
Indeed, the generic entities, as well as their generic
functions, exist independently of the real systems where
one can encounter their corresponding instances. This
explains the dependence direction: functions ? generic and
architecture ? generic in figure 9.
To obtain the functional model of the system, the analyst
has to know how the system is composed. Hence, the
dependence direction between the packages functions and
architecture is: functions ? architecture.
Before determining the flow relations in the system, the
analyst needs to know the contextual functions of the
various components of the system, since flows circulate
between contextual functions in the flow model. This
explains the dependence flows ? functions. The obtained
dependencies are recapitulated by figure 9. Finally, the final
business class diagram is presented in figure 10.
3.5. Implementation of the analytical approach using the
developed tool
The developed tool guides the analyst to construct the
various models gradually. This software is more than just a
guide for the user. Indeed, some tasks are automated, as
can be shown on figure 11. This figure is an activity
diagram showing the succession of the tasks carried out
when the tool is used. This representation remains general,
Figure 8. Various packages of the obtained model.
Figure 9. Desired dependencies between the business
packages.
Functional graph of an automated production system 241
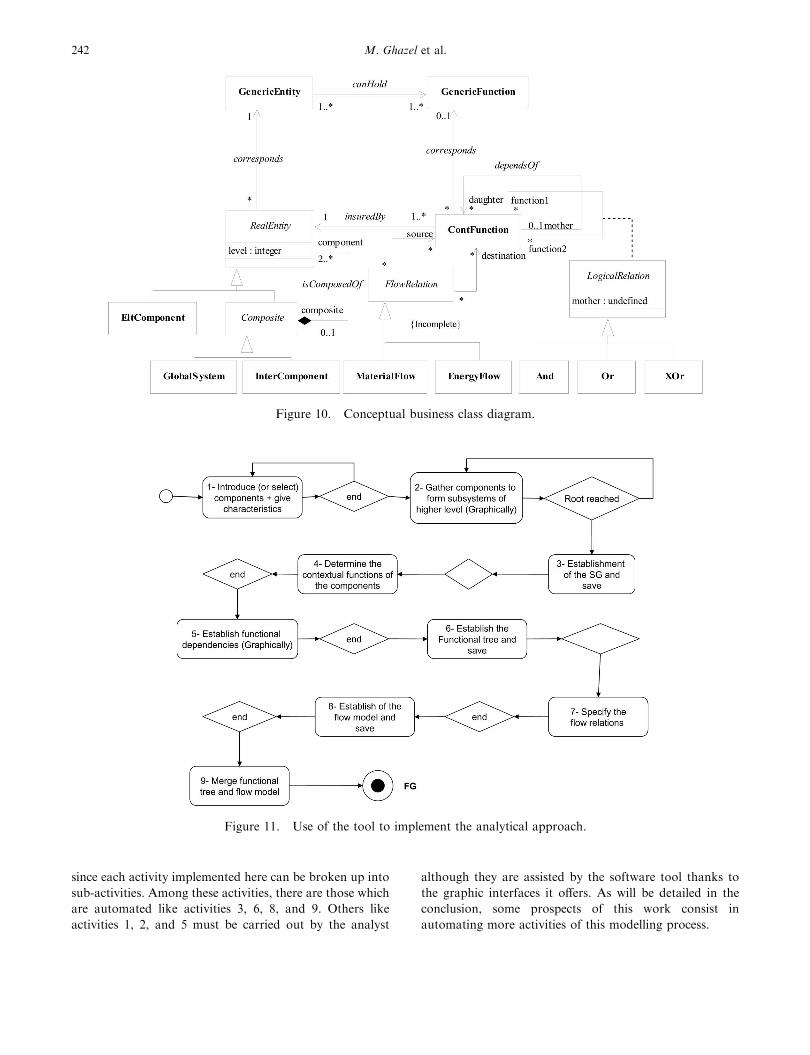
since each activity implemented here can be broken up into
sub-activities. Among these activities, there are those which
are automated like activities 3, 6, 8, and 9. Others like
activities 1, 2, and 5 must be carried out by the analyst
although they are assisted by the software tool thanks to
the graphic interfaces it offers. As will be detailed in the
conclusion, some prospects of this work consist in
automating more activities of this modelling process.
Figure 10. Conceptual business class diagram.
Figure 11. Use of the tool to implement the analytical approach.
242 M. Ghazel et al.

On a concrete application, by exploiting the causalities
implemented by the functional graph, it is possible to
determine the consequences of a given failure on the system
functions. This needs, of course, the use of suitable
algorithms. In addition, thanks to the logical relations
highlighted between the functions, adequate actions of
recovery can be undertaken following a failure occurrence.
For more information on the recovery procedures, the
reader can refer to Toguyeni et al. (1993) and Toguyeni
et al. (2003).
4. Application
The modelling approach detailed above has been used to
model a three-tank plant (Staroswiecki and Gehin 1999).
This plant is composed of three tanks, two pumps, several
valves, and pipes (figure 12). This plant is used to supply a
continuous stream fluid to a consumer at valve VC by
regulating the water level in each tank between two fixed
points. In normal working mode, only Tank1 and Tank3
are in production with their instrumentation. Tank1 and
Tank2 are redundant. Tank2 must be used only if Tank1
becomes faulty. V1, V2, V13, and V23 are four regulation
valves that can be completely opened or completely closed
(discrete functioning). Valves VA and VB are used to
simulate leaks in Tank1 and Tank2, respectively.
The first stage of the approach gives us the structural
model of figure 13. The result of applying the UML
information of our analytical approach is given in the form
of an object diagram.
The SG obtained shows three principal subsystems: ss1
(left subsystem), ss2 and ss3 (right subsystem). ss1 and ss3
subsystems supply flow for the central subsystem ss2 which
evacuates water towards the output of the system. For the
sake of simplicity, ss3 is not developed; this subsystem is
very similar to ss1. As explained in the system require-
ments, ss3 is used only if ss1 fails. More explicitly, these two
subsystems are redundant.
The analyst can then construct the functional models by
component (table 1). The functional tree model is thereafter
automatically derived (figure 14). As functions supply-flow1
and supply-flow2 are redundant, a new function supply-flow
Figure 12. Three-tank plant.
Figure 13. Object diagram implementing the structural graph of the three-tank plant.
Functional graph of an automated production system 243
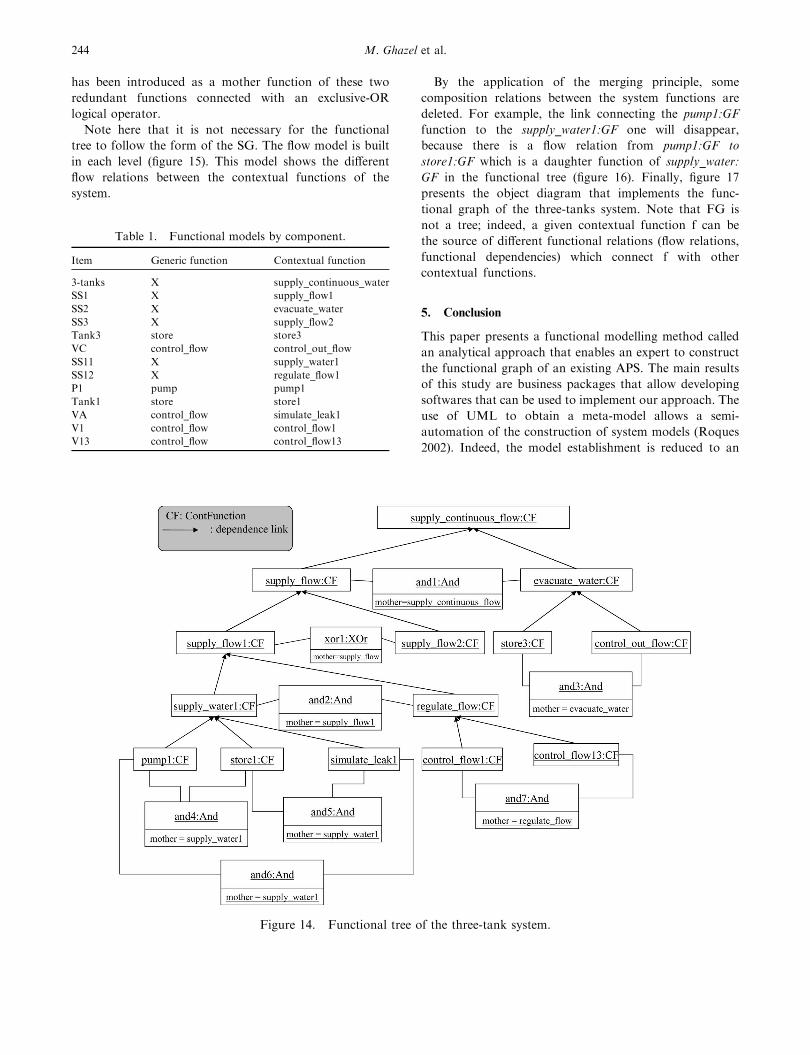
has been introduced as a mother function of these two
redundant functions connected with an exclusive-OR
logical operator.
Note here that it is not necessary for the functional
tree to follow the form of the SG. The flow model is built
in each level (figure 15). This model shows the different
flow relations between the contextual functions of the
system.
By the application of the merging principle, some
composition relations between the system functions are
deleted. For example, the link connecting the pump1:GF
function to the supply_water1:GF one will disappear,
because there is a flow relation from pump1:GF to
store1:GF which is a daughter function of supply_water:
GF in the functional tree (figure 16). Finally, figure 17
presents the object diagram that implements the func-
tional graph of the three-tanks system. Note that FG is
not a tree; indeed, a given contextual function f can be
the source of different functional relations (flow relations,
functional dependencies) which connect f with other
contextual functions.
5. Conclusion
This paper presents a functional modelling method called
an analytical approach that enables an expert to construct
the functional graph of an existing APS. The main results
of this study are business packages that allow developing
softwares that can be used to implement our approach. The
use of UML to obtain a meta-model allows a semi-
automation of the construction of system models (Roques
2002). Indeed, the model establishment is reduced to an
Figure 14. Functional tree of the three-tank system.
Table 1. Functional models by component.
Item Generic function Contextual function
3-tanks X supply_continuous_water
SS1 X supply_flow1
SS2 X evacuate_water
SS3 X supply_flow2
Tank3 store store3
VC control_flow control_out_flow
SS11 X supply_water1
SS12 X regulate_flow1
P1 pump pump1
Tank1 store store1
VA control_flow simulate_leak1
V1 control_flow control_flow1
V13 control_flow control_flow13
244 M. Ghazel et al.
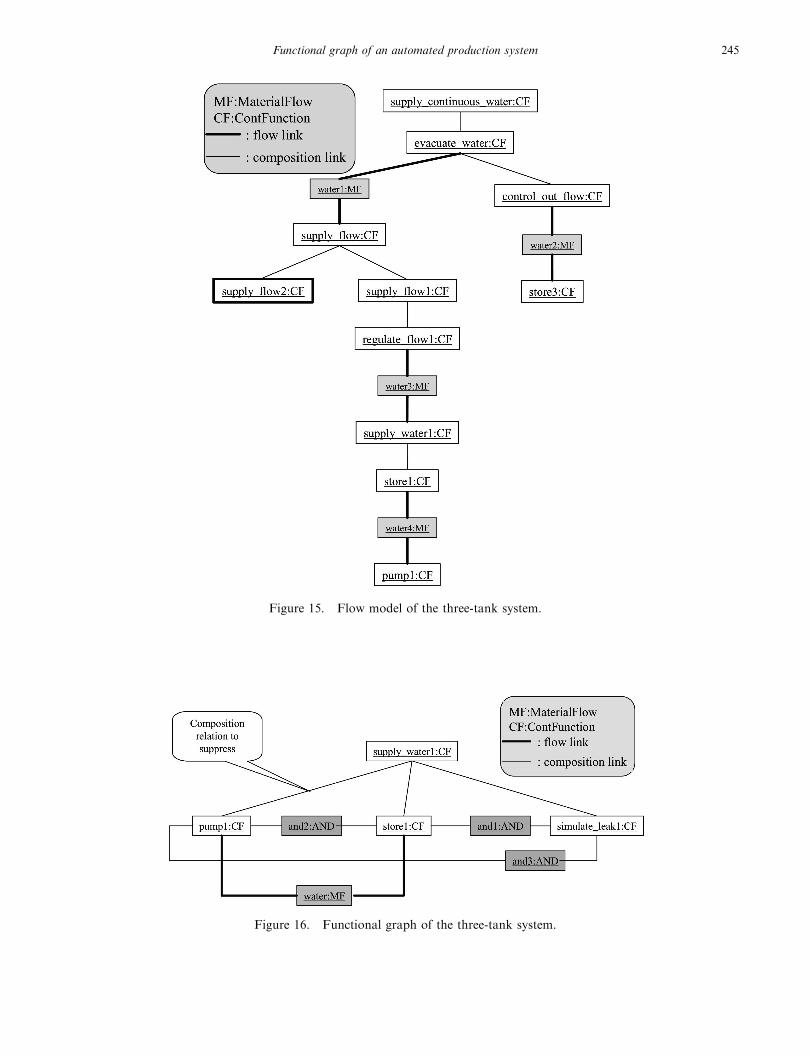
Figure 15. Flow model of the three-tank system.
Figure 16. Functional graph of the three-tank system.
Functional graph of an automated production system 245
activity of instantiation of our business-package classes
whose associations are pre-established. In addition, the
functional tree and the flow model are automatically
merged by the developed tool.
This study is part of a framework to develop monitoring
and supervision algorithms for APSs. Naturally, this
analysis covers only dependability from the many points of
view that various experts can have of the same APS, and
which include: specification, design of the control system,
simulation, production management, and performance
evaluation (Bigand et al. 1999). To integrate these various
points of view, N’Diaye et al. (2001, 2002) proposed the
implementation of a reference frame enabling the different
models to be gathered in a coherent way. This reference
frame was developed within the framework of the CAS-
PAIM project (French acronym for ‘Assisted design of
automated production systems in the manufacturing
industry’). One of the stages for the development of such
reference frame is the formalization of experts’ models
(N’Diaye et al. 2001), using UML, according to different
points of view (Bondierel 1998). The business-package
model presented here allows us to complete this reference
frame.
In the scope of the CHEM project, a model builder based
on this study has been developed as part of a tool that helps
operators to reconfigure a system in case of fault
occurrence. The use of such a tool to model different
industrial plants has proved to save significant amounts of
time in the modelling process. Indeed, the model construc-
tion is simplified and is accelerated by the automation of
several steps in the modelling process. The model builder
also implements validation features based on the associa-
tions and the cardinalities of the business model that reduce
the delay to correct modelling mistakes.
Figure 17. Illustration of the merging principle.
246 M. Ghazel et al.
The first perspective of this study concerns the construc-
tion of flow models. At the moment, this stage remains
overly manual. It may be possible to automate this task
using a more formal approach based on the exploitation of
formalism such as Bond Graphs.
A second perspective concerns the development of
behavioural models associated with each function of a
given FG. This will be useful for both diagnosis and fault
tolerance. For diagnosis, a behavioural model would enable
us to diagnose the amplitude of fault (complete or just
degraded) to give more accurate reconfiguration decisions.
Additionally, behavioural models may improve fault
tolerance by giving the possibility to evaluate the residual
time available to apply recovery actions before a significant
fault becomes critical.
Acknowledgements
Our special acknowledgements go to Professor Jean-Pierre
Bourey, for his assistance during this study.
References
Bigand, M., N’Diaye, D., Corbeel, D. and Bourey, J.P., Contribution to
viewpoint modelling using an object approach in an information system
for production engineering, in Actes of 2nd World Manufacturing
Congress ISMS, Durham, 1999, pp. 246–251.
Bondierel, E., Contribution a l’integration des modeles de systemes de
production manufacturiere par meta-modelisation. PhD thesis, Uni-
versite de Nancy 1, 1998.
Booch, G., Rumbaugh, J. and Jacobson, I., The Unified Modelling
Language User Guide (Addison-Wesley: Boston, MA), 1999.
Dangoumau, N., Toguyeni, A.K.A. and Craye, E., Functional and
behavioural modelling for dependability in automated production
systems. Journal of Engineering Manufacture, 2002, 16, 389–405.
Dean, A., Using functional models in automatic debugging. IEEE Expert,
1991, 6(6), 13–18.
De Kleer, J. and Brown, J.S., Cognitive skills and their acquisition. In
Mental Models of Physical Mechanisms and their Acquisition, edited by
J.R. Anderson, pp. 285–309, 1981 (Erlbaum: Hillsdale, NJ).
Dugan, J.B., Bavuso, S.J. and Boyd, M.A., Dynamic fault-tree models for
fault-tolerant computer systems. IEEE Transaction on Reliability, 1992,
41(3), 363–377.
Frank, P.M., Analytical and qualitative model-based fault diagnosis—a
survey and some new results. European Journal of Control, 1996, 2, 6–28.
Gamma, E., Helm, R., Johnson, R.E. and Vlissides, J., Design Patterns:
Elements of Reusable Object-Oriented Software, 1995 (Addison-Wesley:
Boston, MA).
Ghariani, A., Toguyeni, A.K.A. and Craye, E., A functional graph
approach for alarm filtering and fault recovery for automated produc-
tion systems, in Proceedings of WODES’02 Saragossa, 2002.
Ghazel, M., Bigand, M. and Toguyeni, A.K.A., UML modeling approach
to build an information system for automated production systems, in
Proceedings of the International Conference on Concurrent Engineering
CE’2003 Madeira, 2003a.
Ghazel, M., Toguyeni, A.K.A. and Bigand, M., An UML Meta-model for
the functional modelling of existing automated production systems by
analytical approach, in Proceedings of of the International Conference on
Industrial Engineering and Production Management IEPM’2003 Porto,
2003b.
Hatchuel, A. and Weil, B., L’expert et le systeme, 1992 (Paris: Economica).
Laprie, J.C., Dependability: from concepts to limits, in Proceedings of
Symposium on Safety of Computer Control Systems (SAFECOMP’93),
Poznan, 1993, pp. 157–168.
Laprie, J.C., Arlat, J., Blanquart, J.P., Costes, A., Crouzet, Y., Deswarte,
Y., Fabre, J.C., Guillermain, H., Kaaniche, M., Kanoun, K., Mazet, C.,
Powell, D., Rabejac, C. and Thevenod-Fosse, P., Guide de la surete de
fonctionnement (Cepadues: Toulouse), 1999.
Massotte, P., Self Organization: An approach to improve the flexibility and
reactivity of production systems, in Proceedings of CESA’96, Symposium
on Discrete Events and Manufacturing Systems, Lille, 1996, pp. 58–64.
N’Diaye, D., Bigand, M. and Bourey, J.P., Using patterns for the
integration of viewpoints in an information system: application to the
control modelling of production systems, in Proceedings of the
International Conference on Industrial Engineering and Production
Management IEPM’01 Quebec, 2001.
N’Diaye, D., Bigand, M., Corbel, D. and Bourey, J.P., Information system
for production engineering: contribution to maintaining consistency of
composite data using an object-oriented approach. J. Comput. Integr.
Manuf., 2002, 15(3), 233–241.
OMG, OMG Unified Modelling Language Specification, Version 1.3
(OMG), 2001.
Roques, P., UML par la pratique (Eyrolles: Paris), 2002.
Sekhri, L., Toguyeni, A.K.A. and Craye, E., Surveillability problem in
functional graphs: a formal analysis approach, in Proceedings of
CESA’2003 Lille, 2003.
Sembugamoorthy, V. and Chandrasekaran, B., Functional representation
of devices and compilation of diagnostic problem solving systems. In
Experience, Memory, and Reasoning, edited by J.L. Kolodner and C.K.
Riesbeck, 1986 (Erlbaum: Hillsdale, NJ).
Staroswiecki, M. and Gehin, A., Formal approach to reconfigurability
analysis: application to the three tank benchmark, in Proceedings of
ECC’99, 1999.
Toguyeni, A.K.A., Contribution a la tolerance aux fautes des systemes
flexibles de production manufacturiere. Habilitation a diriger des
recherches (HDR), EC-Lille, 2001, Lille, France.
Toguyeni, A.K.A., Berruet, P. and Craye, E., Models and algorithms for
failure diagnosis and recovery in FMSs. Int. J. Flexible Manufacturing
Systems, 15, 57–85, 2003.
Toguyeni, A.K.A. and Craye, E., Alarm processing and faults recovery
based on functional modeling, in Proceedings of World Automation
Congress Hawaii, 2000.
Toguyeni, A.K.A., Craye, E. and Gentina, J.C., An approach for the
placement of sensors for on-line diagnostic purposes, in Proceedings of
IFAC’93 Sydney, 1993.
Warmer, J. and Kleppe, A., The Object Constraint Language: Precise
Modelling with UML (Addison-Wesley: Boston, MA), 1998.
Functional graph of an automated production system 247