A second-generation anchored genetic linkage map of the tammar wallaby (Macropus eugenii)
16
RESEARCH ARTICLE Open Access A second-generation anchored genetic linkage map of the tammar wallaby (Macropus eugenii) Chenwei Wang 1,2* , Lee Webley 1,2 , Ke-jun Wei 2,3 , Matthew J Wakefield 2,4 , Hardip R Patel 2,3 , Janine E Deakin 2,3 , Amber Alsop 2,3 , Jennifer A Marshall Graves 2,3 , Desmond W Cooper 2,5 , Frank W Nicholas 1 and Kyall R Zenger 1,2,6 Abstract Background: The tammar wallaby, Macropus eugenii, a small kangaroo used for decades for studies of reproduction and metabolism, is the model Australian marsupial for genome sequencing and genetic investigations. The production of a more comprehensive cytogenetically-anchored genetic linkage map will significantly contribute to the deciphering of the tammar wallaby genome. It has great value as a resource to identify novel genes and for comparative studies, and is vital for the ongoing genome sequence assembly and gene ordering in this species. Results: A second-generation anchored tammar wallaby genetic linkage map has been constructed based on a total of 148 loci. The linkage map contains the original 64 loci included in the first-generation map, plus an additional 84 microsatellite loci that were chosen specifically to increase coverage and assist with the anchoring and orientation of linkage groups to chromosomes. These additional loci were derived from (a) sequenced BAC clones that had been previously mapped to tammar wallaby chromosomes by fluorescence in situ hybridization (FISH), (b) End sequence from BACs subsequently FISH-mapped to tammar wallaby chromosomes, and (c) tammar wallaby genes orthologous to opossum genes predicted to fill gaps in the tammar wallaby linkage map as well as three X-linked markers from a published study. Based on these 148 loci, eight linkage groups were formed. These linkage groups were assigned (via FISH-mapped markers) to all seven autosomes and the X chromosome. The sex- pooled map size is 1402.4 cM, which is estimated to provide 82.6% total coverage of the genome, with an average interval distance of 10.9 cM between adjacent markers. The overall ratio of female/male map length is 0.84, which is comparable to the ratio of 0.78 obtained for the first-generation map. Conclusions: Construction of this second-generation genetic linkage map is a significant step towards complete coverage of the tammar wallaby genome and considerably extends that of the first-generation map. It will be a valuable resource for ongoing tammar wallaby genetic research and assembling the genome sequence. The sex- pooled map is available online at http://compldb.angis.org.au/. Background There are about 270 marsupial species, which are dis- tributed throughout Australasia, and in the Americas. Marsupials are interesting not only because of their unique biology, but also because of their distinctive evo- lutionary position between birds and eutherian mam- mals, so that comparisons provide valuable insights into sex determination, lactation, immunology, cancer, geno- mics and evolution [1]. Two model marsupial species have been intensively studied both biologically and genetically, the South American grey short-tailed opos- sum (Monodelphis domestica) and the Australian tam- mar wallaby (Macropus eugenii). The genomes of both species have been sequenced, with the opossum genome sequenced at 7-fold coverage [2], and the tammar wal- laby genome sequenced at 2-fold coverage [3]. The tammar wallaby genome is divided into eight pairs of large chromosomes (seven pairs of autosomes and a pair of sex chromosomes: XX for female and XY for male). The 2n = 16 karyotype is readily comparable with the conserved marsupial ancestral karyotype of 2n = 14 [4]. Chromosome painting studies [5,6] have * Correspondence: [email protected] 1 Reprogen, Faculty of Veterinary Science, The University of Sydney, Sydney, NSW 2006, Australia Full list of author information is available at the end of the article Wang et al. BMC Genetics 2011, 12:72 http://www.biomedcentral.com/1471-2156/12/72 © 2011 Wang et al; licensee BioMed Central Ltd. This is an Open Access article distributed under the terms of the Creative Commons Attribution License (http://creativecommons.org/licenses/by/2.0), which permits unrestricted use, distribution, and reproduction in any medium, provided the original work is properly cited.
-
Upload
independent -
Category
Documents
-
view
0 -
download
0
Transcript of A second-generation anchored genetic linkage map of the tammar wallaby (Macropus eugenii)

RESEARCH ARTICLE Open Access
A second-generation anchored genetic linkagemap of the tammar wallaby (Macropus eugenii)Chenwei Wang1,2*, Lee Webley1,2, Ke-jun Wei2,3, Matthew J Wakefield2,4, Hardip R Patel2,3, Janine E Deakin2,3,Amber Alsop2,3, Jennifer A Marshall Graves2,3, Desmond W Cooper2,5, Frank W Nicholas1 and Kyall R Zenger1,2,6
Abstract
Background: The tammar wallaby, Macropus eugenii, a small kangaroo used for decades for studies ofreproduction and metabolism, is the model Australian marsupial for genome sequencing and geneticinvestigations. The production of a more comprehensive cytogenetically-anchored genetic linkage map willsignificantly contribute to the deciphering of the tammar wallaby genome. It has great value as a resource toidentify novel genes and for comparative studies, and is vital for the ongoing genome sequence assembly andgene ordering in this species.
Results: A second-generation anchored tammar wallaby genetic linkage map has been constructed based on atotal of 148 loci. The linkage map contains the original 64 loci included in the first-generation map, plus anadditional 84 microsatellite loci that were chosen specifically to increase coverage and assist with the anchoringand orientation of linkage groups to chromosomes. These additional loci were derived from (a) sequenced BACclones that had been previously mapped to tammar wallaby chromosomes by fluorescence in situ hybridization(FISH), (b) End sequence from BACs subsequently FISH-mapped to tammar wallaby chromosomes, and (c) tammarwallaby genes orthologous to opossum genes predicted to fill gaps in the tammar wallaby linkage map as well asthree X-linked markers from a published study. Based on these 148 loci, eight linkage groups were formed. Theselinkage groups were assigned (via FISH-mapped markers) to all seven autosomes and the X chromosome. The sex-pooled map size is 1402.4 cM, which is estimated to provide 82.6% total coverage of the genome, with an averageinterval distance of 10.9 cM between adjacent markers. The overall ratio of female/male map length is 0.84, whichis comparable to the ratio of 0.78 obtained for the first-generation map.
Conclusions: Construction of this second-generation genetic linkage map is a significant step towards completecoverage of the tammar wallaby genome and considerably extends that of the first-generation map. It will be avaluable resource for ongoing tammar wallaby genetic research and assembling the genome sequence. The sex-pooled map is available online at http://compldb.angis.org.au/.
BackgroundThere are about 270 marsupial species, which are dis-tributed throughout Australasia, and in the Americas.Marsupials are interesting not only because of theirunique biology, but also because of their distinctive evo-lutionary position between birds and eutherian mam-mals, so that comparisons provide valuable insights intosex determination, lactation, immunology, cancer, geno-mics and evolution [1]. Two model marsupial species
have been intensively studied both biologically andgenetically, the South American grey short-tailed opos-sum (Monodelphis domestica) and the Australian tam-mar wallaby (Macropus eugenii). The genomes of bothspecies have been sequenced, with the opossum genomesequenced at 7-fold coverage [2], and the tammar wal-laby genome sequenced at 2-fold coverage [3].The tammar wallaby genome is divided into eight
pairs of large chromosomes (seven pairs of autosomesand a pair of sex chromosomes: XX for female and XYfor male). The 2n = 16 karyotype is readily comparablewith the conserved marsupial ancestral karyotype of 2n= 14 [4]. Chromosome painting studies [5,6] have
* Correspondence: [email protected], Faculty of Veterinary Science, The University of Sydney, Sydney,NSW 2006, AustraliaFull list of author information is available at the end of the article
Wang et al. BMC Genetics 2011, 12:72http://www.biomedcentral.com/1471-2156/12/72
© 2011 Wang et al; licensee BioMed Central Ltd. This is an Open Access article distributed under the terms of the Creative CommonsAttribution License (http://creativecommons.org/licenses/by/2.0), which permits unrestricted use, distribution, and reproduction inany medium, provided the original work is properly cited.

revealed highly conserved chromosome regions amongstmany marsupial species, even between distantly relatedgroups. This conservation means that the genomeassembly of the tammar wallaby will accelerate studiesof other marsupial genomes.A genome-wide genetic linkage map with anchored
genetic markers corresponding to coding genes is animportant genomics tool, providing a valuable resourcefor gene/QTL localisations and comparative genomicinvestigations. Furthermore, it provides a major indepen-dent source of information for robust genome sequenceassembly. A first-generation tammar wallaby linkage mapwas constructed by Zenger et al. [7] with 64 markers cov-ering a total length of 828 cM, with average distancebetween adjacent markers of 16.2 cM. This first-genera-tion linkage map was based primarily on a small numberof unanchored type II genetic markers (e.g., anonymousloci with limited flanking sequence) and hence this maphas limited utility in comprehensive comparative geno-mics or sequence assembly investigations.Given the limited genome coverage and genetic mar-
ker type in the first-generation tammar wallaby linkagemap, there is an urgent need to extend this resource toinclude genome-wide anchored type I (i.e., codinggenes) genetic markers. Here, we present a second-gen-eration tammar wallaby linkage map containing morethan twice the number of genetic markers in the first-generation map. Importantly, particular care was takento include physically anchored and type I genetic mar-kers (chosen on the basis of FISH mapping) to providecoverage of most regions of all chromosomes, forincreased utility in direct comparative mapping investi-gations. It is anticipated that this resource will be highlyuseful in ongoing genome investigations and marsupialsequence assemblies.
MethodsLinkage mapping reference familiesInter-subspecies crosses between island populations oftammar wallabies contributed the majority of geneticvariation needed for constructing the map [8]. The useof sub-species in this experimental design increases thelikelihood of producing informative heterozygous geno-types in parental individuals. This study utilised thesame well-established and validated Garden Island (GI)and Kangaroo Island (KI) hybrid backcross pedigrees/DNA used to create the first-generation genetic linkagemap [7]. This research was performed purely onextracted DNA samples from previous studies whereappropriate animal ethics approval had been granted.All pedigrees are of a three-generational design (G0, G1and G2) allowing for the phasing of G2 genotypes. Allthree generations were genotyped and independentlycompared within each pedigree. Both G1 hybrid males
and G1 hybrid females were used as parents of G2 ani-mals, so that sex-specific maps could be produced. Intotal, there are 4 male pedigrees generating 104 G2 off-spring, and 21 female pedigrees producing 127 G2 off-spring [7]. Only those families with genotypic data fromall three generations were used in this study. Thus anadditional 121 offspring from phase-unknown males (noG0 grandparent genotypes available) used in the pre-vious study [7] were excluded from the present study.The informative meiosis numbers for the male andfemale pedigrees at each locus are presented in Tables1, 2 and 3.
BAC librariesMarkers were derived from two tammar wallaby BACclone libraries. The ME_VIA BAC library [9] was thefirst tammar wallaby BAC library, having 2.2× genomecoverage; and the ME_KBa BAC library has 11× genomecoverage (Arizona Genomics Institute, Tucson, AZ,USA, http://www.genome.arizona.edu/orders/ME_KBa_Clone).
Markers and their physical locationsIn order to achieve maximum coverage across the gen-ome (i.e., ends of chromosomes and gap filling), andphysically anchor and orient the linkage groups to chro-mosomes, three different approaches were used to iden-tify sets of microsatellite markers for inclusion in thelinkage map. The first approach identified 14 uniqueBAC-linked polymorphic microsatellites (set 1) discov-ered by screening 44 fluorescent in-situ hybridisation(FISH)-mapped tammar wallaby BACs, using an enrich-ment microsatellite screening technique according toEdwards et al. [10]. Since these BACs were alreadyFISH-mapped, the physical location of each marker wastaken as the location of its BAC. The second approach,yielding 47 polymorphic microsatellites (set 2), was tosearch BAC-end sequences for microsatellite repeat pat-terns using a custom Python script [11] as described byMacdonald et al. [12]. BAC-end sequences for theMeVIA library were generated by the Australian Gen-ome Resource Facility. Sequences for the Me_Kbalibrary were downloaded from Genbank [13,14]. Thechromosomal location of each of these markers wasdetermined by retrospectively FISH-mapping the corre-sponding BAC clones to tammar wallaby chromosomes[15]. The third approach produced 29 polymorphicmicrosatellites (set 3), which were chosen to fill gapsthat became evident during the construction of the sec-ond-generation map. These markers were discovered byfirst identifying FISH-mapped genes that flanked gapregions. Using these FISH-mapped loci as referencegenes, these gap regions were then aligned against theopossum genome sequence. Utilising the conserved
Wang et al. BMC Genetics 2011, 12:72http://www.biomedcentral.com/1471-2156/12/72
Page 2 of 16

genome relationship between the two species, genes thatwere predicted to fall within these gap regions in thetammar wallaby map were identified. These genes werethen screened against the wallaby trace sequence archive(from 2 × genome sequence coverage) using BLAST soft-ware [16] to identify any orthologous wallaby genesequence. All identified gene sequences were thenassembled using CAP3 [17] to form a consensus genecontig. Finally, from these consensus sequences, 33microsatellites were identified of which 29 were poly-morphic. Consequently, the putative physical positions ofthese set-3 loci were set as the position of their referencegenes. These set-3 markers were named after the geneswithin which the microsatellite sequences were found.The full list of the above 90 new markers is presented
in Tables 1, 2 and 3, together with related information.In addition, X-linked microsatellite markers (Mex34,Mex66 and Mex70) discovered by Macdonald et al. [18]were also included to supplement the X-chromosomelinkage group.
GenotypingAll 90 new microsatellite primers pairs were designedusing Primer3 software [19] with the following settings:optimal primer length 21 bp (range 16-28), optimal Tm:60°C (range 50-70°C), optimal GC content: 50% (range30-70%), and amplification length: 100-600 bp. All otherparameters were kept at default settings. Amplificationof loci was performed via PCR on both male and femalehybrid mapping pedigrees. The primer sequences andchromosomal positions for each of these loci are shownin Tables 1, 2 and 3. Each forward primer had an addi-tional 19 bp of M13 sequence (5’-CACGACGTTG-TAAAACGAC-3’) added to the end to facilitatefluorescent labeling of products [20]. PCR was run on aPTC-100 DNA thermal cycler (MJ Research, Waltham,MA, USA) using a “60-to-50 touchdown” protocolaccording to Zenger et al. [7] incorporating 1.5,2.0 or2.5 mM of MgCl2 (see Tables 1, 2 and 3) and 0.1 uM ofeach primer. Visualisation of PCR products was per-formed either using a LI-COR 4200 automated DNA
Table 1 Set 1 markers: BAC clone, chromosome location and primer sequences
Marker Namea BAC clone Chr Arm Band Informative meioses MgCl2 (mM) Primer sequences
M F
KJW105 MeVIA123J11 1 p 2 3d 64 1.5 F: TAAAAGCGCTGGGTGATTTCR: GGTTATCACATTTGGAAACAAAGC
KJW117 MeVIA72C1 X q 3 0 89 1.5 F: AAGAGGTGAGTTGGGACACGR: TGGCCTGGGATTAAAAGTCA
KJW122 MeVIA78K19 1 q 3 61 106 1.5 F: GCAGCTTCAGAAATGCAAACR: GGTTCTGCAAACTCCAGTGAG
KJW174b NAc NAc NAc NAc 97 89 2.5 F: ACGTGTATGTGTAAGTGTGTATGTR: CCTGGCACCTAGATAAAGCA
KJW175 MeVIAP6 7 p 3 94 122 1.5 F: CACAGAAACTTGGGGAAAGCR: TCTTCCTGATGGGATGAAGG
KJW186 MeVIA49J18 2 q 1 93 115 1.5 F: GCTTTTTCAAAGGGACATTTTCR: CGCACTCTTTCAAGGGACTG
KJW192 MeVIA142H21 5 q 2 45 94 1.5 F: ATGGGGAAACTGAGGCAGAGR: AGTTGGAACCACCTCCACTG
KJW208b NAc NAc NAc NAc 89 104 1.5 F: ACTGAGACAATGCCTTTCCR: TTCCTGCCTTCTTTACTCC
KJW220 MeVIA115N20 7 q 3 7d 58 1.5 F: TATCTCATGGGGAGGAGGTGR: CCAGGTCAAACACAGTGAGC
KJW221 MeVIAP6 7 p 3 94 125 1.5 F: CAGCAGAAGAGGGGAGACTGR: CACAGAAACTTGGGGAAAGC
KJW243 MeVIA35G12 X q 2 0 102 1.5 F: ATTGGTGAATGGCAAATGAGR: CCTTCTTCCTTTGTCCTGATG
KJW258 MeVIAE9 5 p 2 90 110 1.5 F: TGTGAGGCAAAGAAATTCCAGR: ATCAGCCCTGGGGATAGATG
KJW281 MeVIA15A6 X q 2 0 100 2.5 F: GACCAGGTTGTTGGGTCAAGR: CATTCAGGACAGGTAGGTAGGG
KJW285b NAc NAc NAc NAc 100 118 1.5 F: ATCCAAGATGATGGCCTGAGR: AGAGAGCTCGGTGGCATTAC
a Set 1 marker names comprise “KJW” followed by an identification number, e.g. KJW174.b These three markers could not be located on any of the 44 BACs. This may reflect failure to optimize the PCR to a working condition in the BAC, or an error inidentifying BAC clone during FISH-mapping BACs or screening for AC repeats.c NA = not availabled Meiosis number less than 19, and not included in the map construction.
Wang et al. BMC Genetics 2011, 12:72http://www.biomedcentral.com/1471-2156/12/72
Page 3 of 16

Table 2 Set 2 markers: chromosome location and primer sequences
Marker Namea Physical location (ChrArmBand) Informative meioses MgCl2 (mM) Primer sequences
M F
MeKba170K8-13193 2q2 77 102 2.5 F: CATACCTTCTCTTGTCTTGTGGCR: TTCATATTGGAGGAGGATTAGC
MeKba175L17-104075 3q2 93 121 1.5 F: CCATCACATACCACACACGCR: TTGGCTATAATTGTGGTCAGC
MeKba182A19-136367 3q2 95 81 1.5 F: TGTTAATGTATCATCATCACTCTCCR: GAAGGAACAATGACAGAACTTAGC
MeKba191O7-75495 1q3 82 85 2.5 F: TATGCATCGAGTGCCTGCR: AGCCTTCCTTGCCATTAACC
MeKba206L23-25864 2q3 84 111 1.5 F: GCCGTGAGCACTCTGTCCR: CCATCCTCAATCTCCTCTCC
MeKba273F23-57082 1q2.2 (1q5)b 80 88 2.5 F: GTGCCACTGTAGTCCACCTGR: CTGGTTCTGGTCTCTGGAGC
MeKba281G14-77691 6q3 (1q3-4)b 51 123 1.5 F: ATCGACAGCCTCTCCAACCR: GGCAATGAGATGAGATGTGC
MeKba282N22-44716 1q4-5 95 107 2.5 F: GGTCAGACACGCACAACCR: CAGAATTGGCACCTAGATATTCC
MeKba337B13-128470 2q3 68 75 1.5 F: TTAATGAATTCCAATGGCTACCR: GAGTACATTCCAGGCATAGTGG
MeKba389E8-21049 2q2 72 86 2.5 F: ATCTAATGATAGCCACCTCTGGR: TGACTGACAACTTAGCCTGCC
Mekba458L18-116052 2q3 81 117 1.5 F: CTCTGGCTCAGGTCCTTCCR: TCTATTCTCCTGTGATCCTATGC
MeKba472N21-102181 3q1 89 84 1.5 F: AGGAGGACTGGAGGAATTAGGR: GAGAAGTGAGCCTGGACAGC
MeKba494M2-50126 Xq3 0 91 2.5 F: GTCGCACAGCTGGTTAAGGR: GCATTCTTATTGGAACTGTGACC
MeKba510M2-126695 Xq2 0 71 2.5 F: ACCACACAGACACATGCACCR: GAATAGTCCACCACCACTCTAGG
MeKba510M2-pseudoc NAd 61 88 2.5 F: ACCACACAGACACATGCACCR: GAATAGTCCACCACCACTCTAGG
MeKba526C2-33878 1q5 85 125 1.5 F: GGTTGCATTCACTGGTCTAGGR: GGTTGCATTCACTGGTCTAGG
MeKba528O13-122762 3q2.3 0e 27 2.5 F: CACTGTGCTATCTGCTGAAGGR: GATGGCGTGGTCTTCTTAGG
MeKba598C23-22378 Xq2 0 99 1.5 F: CCATTGCTACTACCTTCAGCCR: GGTGAGGTGATATTCTGTCTTGG
MeKba60J17-8783 3q2.3 93 107 2.5 F: ACATTCTTGCCAGGCTCACCR: AGTGGAGGCATCTCAAGGC
MeVIA121C8-17366 Xq3 0 83 1.5 F: TTTCTCAGCCACACCTCTCCR: ATATGCCCCAAAAGGAGCAC
MeVIA1A16-106 2q5 1e 42 2.5 F: AGCTCATTGTGAGAACTCGGR: TGTAAGTTAGCATGGTGAAGAGC
MeVIA1B23-391 4q2.3 89 107 2.5 F: TGAAGGCTTGACTTCCTTCCR: TTCATCATGTCTGTAGCCTTAGC
MeVIA1B5-253 4p2.1 91 106 2.5 F: CAGTTACCTGGTGATGACTTGCR: GGAATTAGCTGTTCAGGAATAATTAGG
MeVIA1G15-185 5q1 97 105 2.5 F: CCGCCTATCCTCAATAACTGCR: GAATAACAACAGACACACACACG
MeVIA1G3-226 1q1 (7p3)b 61 100 2.5 F: TCTTCACATTAGAGAACAGAACAGGR: GACACCTCTGCTCCACACC
MeVIA125B16-39822 NAd 92 110 1.5 F: CTCTTCCCCACTCCCCTATCR: CCCATGGATTGGAGGATTAC
MeVIA1L6-488 1q3 99 123 1.5 F: ATTCATCCATCCATCCATCCR: AAGGTTGTTAAGTGGCAGAGC
MeVIA2C3-167 3q 56 91 2.5 F: CATGCCAACTCTCTATGTATTGGR: CAGATGAGGTATGGTCAACAGG
Wang et al. BMC Genetics 2011, 12:72http://www.biomedcentral.com/1471-2156/12/72
Page 4 of 16

sequencer or an ABI 3100 Genetic Analyzer (AppliedBiosystems, Foster City, CA, USA). Genotypes weremanually assigned and checked by two people indepen-dently to minimize genotyping scoring errors. Apartfrom between-run replicates (see below), all loci weregenotyped across all individuals (i.e., male and femalepedigrees) within the same genotyping run and platform(i.e. LICOR or ABI). If inconsistencies were observed inthe data, additional genotyping was performed to resolveany problems.
Data integrityTo ensure strict data integrity, two approaches describedby Zenger et al. [7] were employed. The first approachincorporated the inclusion of duplicate samples bothwithin and between each PCR/genotyping run for eachlocus. Within-run assessment was based on 9 replicatesamples (~3% per PCR plate), while between-run assess-ment was based on the evaluation of 16 samples geno-typed separately for each locus. Duplicate samplesincorporated individuals from different pedigrees/
Table 2 Set 2 markers: chromosome location and primer sequences (Continued)
MeVIA2J14-517 4p3.3 43 93 1.5 F: GAGGATGGTGATGAAGCAGGR: TTAAGAAGGAAGATAGGCTCAGG
MeVIA2J8-594 1p1 16e 19 2.5 F: AACTTGGATAACTGGAAGAATGCR: GATGCCAATTAATCTGTGTTCC
MeVIA2M13-303 3q2-3 (1q3)b 73 115 2.5 F: GCGTACTACACAAGAAGGTGCR: GGTGTTACAGAATGTGCATAGG
MeVIA2M6-313 3q3 (5q1-2)b 87 107 2 F: AATCAACATGGTTCTTATTGTTCCR: CTCAAGGCGATGCTTATTCC
MeVIA2O13-302 1q3 74 123 2.5 F: GCGTACTACACAAGAAGGTGCR: GGTGTTACAGAATGTGCATAGG
MeVIA2P1-275 6p3 51 61 2.5 F: CATATGATAGAATAGGATGATTGGCR: TGTGACCAATAAGACCAGATAGG
MeVIA3B3-434 4p2.1 71 85 1.5 F: TTCATACAATTCCTCCATGCCR: AGAAGTTCAAGGTCACACAGC
MeVIA3C10-475 1q5 77 89 2.5 F: AAGTTAACAGAAGCAGACCTTGGR: AGTTCCATTCCAGCTTCACG
MeVIA3F20-234_LOWER NAd 87 103 2.5 The same as MeVIA3F20-234_UPPER
MeVIA3F20-234_UPPER 2q2 90 92 2.5 F: CCTAGAAGAATCTGTTGCTGACCR: GCCTTATCTGTTGCAGAATCC
MeVIA3G11-104 7p3 75 117 2.5 F: TTAAGCATTAAGATTACATACATCTGCR: ATGGCGTGGTCTTCTTCC
MeVIA3G15-373 4q2 (1q2)b 63 67 1.5 F: TGAGAATGTCTCCTTCATGGCR: AATCCATAGTCTCTCTCTTGAGTCC
MeVIA3H17-399 3q2 79 80 2.5 F: CCATGTTATCTCCTGTCAATGCR: GTCACGAGCCAACTTCAGC
MeVIA3H22-576 1q4 63 63 2.5 F: GACCACATACAGAGAAGTACCTATGGR: CAGACTAAGTGCCATCTTCTGC
MeVIA3I8-498 4q1.1 94 122 1.5 F: GGCACATTCTCACCTCTACCR: TCTATGAGACCAAGAGCTTAATCC
MeVIA3L16-78 6q2-3 92 111 1.5 F: TAATCCATAAGGCCAGCTCCR: CATACAACTCATCAAGCTTCACC
MeVIA3M11-142 1q4-5 (2q3)b 91 99 1.5 F: TCTGATCACAGTGTCTCCTGCR: TTGTTGGTCATCGTATCTTCC
MeVIA3M4-293 3q3 89 87 2 F: ACATTCCAGCTTCTTCTGCCR: CCTCACACACACATATACATACACC
MeVIA3N11-345 2q1 93 118 2.5 F: TCGAGTCAGTATCACCAGCGR: TTAATACCTCCTCCATGCTCC
a Set 2 markers are named as “BACName-Location”, e.g. MeVIA3N11-344 is a marker within MeVIA BAC library clone 3N11, starting at base 344; whileMeKba389E8-21049 is a marker within MeKba BAC library clone 389E8, starting at base 21049. In one case (BAC MeVIA3F20-234), two groups of PCR productswere obtained from the single pair of primers, and each group was treated as a separate marker, named MeVIA3F20-234_UPPER and MeVIA3F20-234_LOWER.b The FISH-mapping locations of these markers are different from their linkage map locations (which are presented in brackets). Because of this conflict, thesemarkers were not included in the final linkage map.c Secondary anonymous microsatellite locus that is co-amplified using these primers, and possibly could be a HPRT pseudogene.d NA = not availablee Meiosis number less than 19, and not included in the map construction.
Wang et al. BMC Genetics 2011, 12:72http://www.biomedcentral.com/1471-2156/12/72
Page 5 of 16

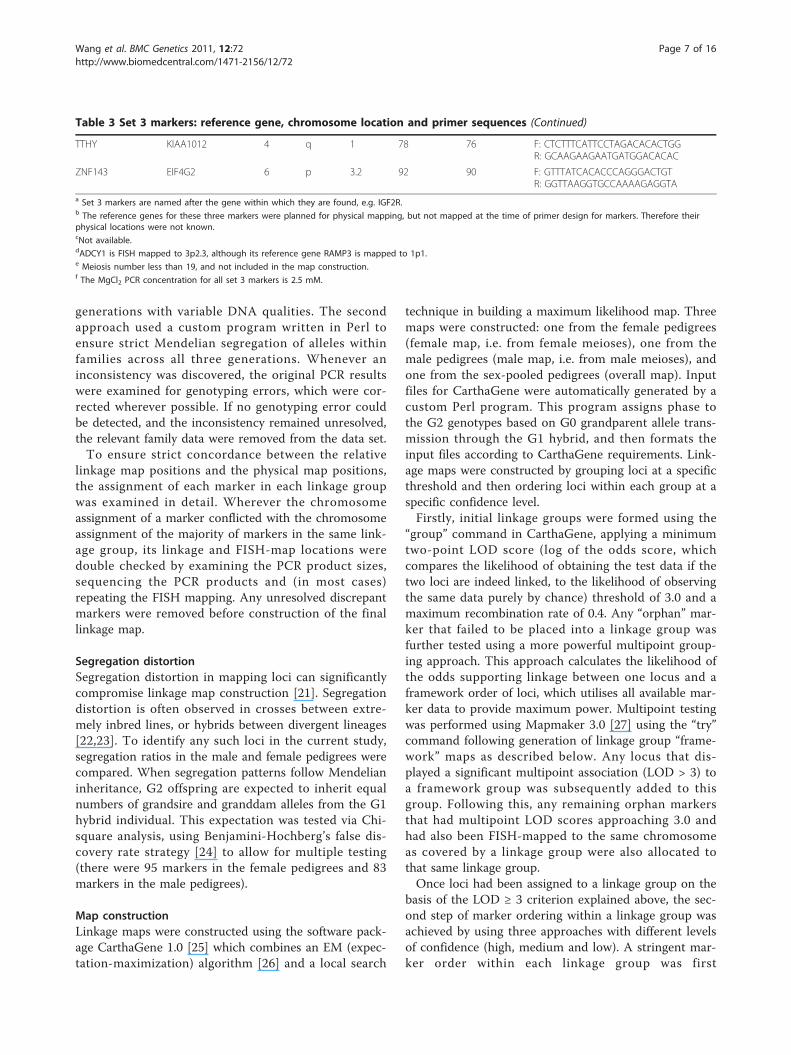
Table 3 Set 3 markers: reference gene, chromosome location and primer sequences
Marker Namea Reference Gene Chr Arm Band Informative meioses Primer sequencesf
M F
AM21 LFNG 3 p 2 90 84 F: TGCACTCCATGAAGACACTTGR: TCACTGGATTCAGATGGCTCT
ADCY1d RAMP3 3 p 2.3 79 97 F: ACACATAGTCACTCTCCTTTACCGR: CAGAGAAGGGAGCCTGTTTAG
ASB7 ASB7 1 q 1 85 94 F: GGTCAGAGGACAACTAGGTTGAAGR: CATACAGAGGCAAAAGCATAACTG
C2orf54 SNED 6 q 3 80 64 F: TCCTCCAAATCCTCTTCCAGTR: CACTGCAAGCACCACTGTCT
C4orf8 TNIP2 6 p 3.1 56 95 F: CATGTCACCTGGAACTTTTTCAR: GTGTTGTATAGCTCAGTTTCAGATAGC
CACNG3 AQP8 1 p 1 88 112 F: AACTTTGGTGTCTTGGTGGAAR: TTTCAGTCACTGGGCTGAAGT
CASZ1 BCL3 5 q 3 42 79 F: AATGAGGGACAAGCAAGCTCR: AGTTGACCTCAGGGCAGTGT
CDH12 CDH12 4 p 2 75 96 F: TGCTACTACCCCATCTCTCTCTCR: CTTTCCAAAAGAACCAGAGCA
CLDN18 FAIM 5 q 2 62 89 F: GCAGAGCTGGCATTAGATGAR: TTTGTTCAATGACCCCCAAT
COL4A2 ARHGEF7 6 q 2 91 58 F: GAGAGGTCAGGGAAGGGTATCTR: TAAACCAGGTACTCCTGGGAAA
DLL1 USF1 2 q 3 94 93 F: ATAGGGAATGCAGCAGGTTGR: ATCAGCTGTTCTAAGGCCACA
DNHD2 TBX20 3 p 3 16e 70 F: CTGTCAAGTCTGAAGTGGACAGAR: GAGTTAATACTGGCGTCTTGGAG
EEF2K KDELR2 3 p 2 83 76 F: AGGGCATCCCAAGATTCTTACTR: GCAGTGAAAATGACTAGGAGGAG
FIAM FIAM 5 q 2 94 91 F: GCAATGCAAAGATGCACACTR: TGCTCCAGTGATGCCACTAC
GABBR2 QPRT 3 p 2 85 108 F: CTCCCAAGCTAGGAAACAACCR: CAAGACCGTATCAGAGGCAAA
HPX CCKBR 5 q 2 86 69 F: GATCTCAGAAACATGGCCAGAR: CTGTACCCTCAAACCTTGTGC
IGF2Rb IGF2R NAc NA NA 103 113 F: TACCTAGGTGGTTGACGCTGTR: AGACCTCACAAATTTGCCTTTC
MYCBP2 SLAIN1 6 q 2 71 42 F: CAGAGATTTTTGCCAGCAGACR: CCCAACCTTTCAAGTAGAATGC
NOL14 NOL14 6 p 2 87 94 F: CCACCCCTCAGTGTTTCAGTATR: GGTTAATGGGGCTTAGGATAGG
NRXN3b NA NA NA NA 83 98 F: GTTAGGGGCACAGCAGTGTAGR: CCGCAAGTCTTTTTAGCAATC
ODZ2 NUDCD2 1 q 2 81 77 F: AGCCCATAGTCAGGCACATACR: GCACATAGAGGGAGTTGTCCA
PTCHD1 PTCHD1 5 p 2 94 111 F: TTTTTCTTCTCCCCCGTACCR: TGGCCTTGAAGCATACTTATTG
SFTPA1b NA NA NA NA 77 102 F: ACATGGGGGTAAAACTTGGACR: TGAACCATGTCCTCTGACTCC
TBX4 FCRL4 2 q 3 88 88 F: TCACTCTATATCGGTCAGAGGACAR: GGTCTGGGACAGTAAATTCTTCAC
TCERG1L TCERG1L 1 q 2 89 104 F: GACATATTAGCTGCTCTTCAGTGTTCR: GAGCTTGCTATGTCTGAAGGCTAC
TNFRSF11A KDSR 4 p 2 101 110 F: TCTGTGTTCATTATCCGTGACAR: CATTGTGAGAAAGAGCCATCTG
TSHR TSHR 7 q 1 97 97 F: TCTATGAGCCAAGAACTCCAGAR: GATGTTAGCAACAGAGATCATGGTA
Wang et al. BMC Genetics 2011, 12:72http://www.biomedcentral.com/1471-2156/12/72
Page 6 of 16
generations with variable DNA qualities. The secondapproach used a custom program written in Perl toensure strict Mendelian segregation of alleles withinfamilies across all three generations. Whenever aninconsistency was discovered, the original PCR resultswere examined for genotyping errors, which were cor-rected wherever possible. If no genotyping error couldbe detected, and the inconsistency remained unresolved,the relevant family data were removed from the data set.To ensure strict concordance between the relative
linkage map positions and the physical map positions,the assignment of each marker in each linkage groupwas examined in detail. Wherever the chromosomeassignment of a marker conflicted with the chromosomeassignment of the majority of markers in the same link-age group, its linkage and FISH-map locations weredouble checked by examining the PCR product sizes,sequencing the PCR products and (in most cases)repeating the FISH mapping. Any unresolved discrepantmarkers were removed before construction of the finallinkage map.
Segregation distortionSegregation distortion in mapping loci can significantlycompromise linkage map construction [21]. Segregationdistortion is often observed in crosses between extre-mely inbred lines, or hybrids between divergent lineages[22,23]. To identify any such loci in the current study,segregation ratios in the male and female pedigrees werecompared. When segregation patterns follow Mendelianinheritance, G2 offspring are expected to inherit equalnumbers of grandsire and granddam alleles from the G1hybrid individual. This expectation was tested via Chi-square analysis, using Benjamini-Hochberg’s false dis-covery rate strategy [24] to allow for multiple testing(there were 95 markers in the female pedigrees and 83markers in the male pedigrees).
Map constructionLinkage maps were constructed using the software pack-age CarthaGene 1.0 [25] which combines an EM (expec-tation-maximization) algorithm [26] and a local search
technique in building a maximum likelihood map. Threemaps were constructed: one from the female pedigrees(female map, i.e. from female meioses), one from themale pedigrees (male map, i.e. from male meioses), andone from the sex-pooled pedigrees (overall map). Inputfiles for CarthaGene were automatically generated by acustom Perl program. This program assigns phase tothe G2 genotypes based on G0 grandparent allele trans-mission through the G1 hybrid, and then formats theinput files according to CarthaGene requirements. Link-age maps were constructed by grouping loci at a specificthreshold and then ordering loci within each group at aspecific confidence level.Firstly, initial linkage groups were formed using the
“group” command in CarthaGene, applying a minimumtwo-point LOD score (log of the odds score, whichcompares the likelihood of obtaining the test data if thetwo loci are indeed linked, to the likelihood of observingthe same data purely by chance) threshold of 3.0 and amaximum recombination rate of 0.4. Any “orphan” mar-ker that failed to be placed into a linkage group wasfurther tested using a more powerful multipoint group-ing approach. This approach calculates the likelihood ofthe odds supporting linkage between one locus and aframework order of loci, which utilises all available mar-ker data to provide maximum power. Multipoint testingwas performed using Mapmaker 3.0 [27] using the “try”command following generation of linkage group “frame-work” maps as described below. Any locus that dis-played a significant multipoint association (LOD > 3) toa framework group was subsequently added to thisgroup. Following this, any remaining orphan markersthat had multipoint LOD scores approaching 3.0 andhad also been FISH-mapped to the same chromosomeas covered by a linkage group were also allocated tothat same linkage group.Once loci had been assigned to a linkage group on the
basis of the LOD ≥ 3 criterion explained above, the sec-ond step of marker ordering within a linkage group wasachieved by using three approaches with different levelsof confidence (high, medium and low). A stringent mar-ker order within each linkage group was first
Table 3 Set 3 markers: reference gene, chromosome location and primer sequences (Continued)
TTHY KIAA1012 4 q 1 78 76 F: CTCTTTCATTCCTAGACACACTGGR: GCAAGAAGAATGATGGACACAC
ZNF143 EIF4G2 6 p 3.2 92 90 F: GTTTATCACACCCAGGGACTGTR: GGTTAAGGTGCCAAAAGAGGTA
a Set 3 markers are named after the gene within which they are found, e.g. IGF2R.b The reference genes for these three markers were planned for physical mapping, but not mapped at the time of primer design for markers. Therefore theirphysical locations were not known.cNot available.dADCY1 is FISH mapped to 3p2.3, although its reference gene RAMP3 is mapped to 1p1.e Meiosis number less than 19, and not included in the map construction.f The MgCl2 PCR concentration for all set 3 markers is 2.5 mM.
Wang et al. BMC Genetics 2011, 12:72http://www.biomedcentral.com/1471-2156/12/72
Page 7 of 16

determined by constructing a framework linkage mapcontaining only those loci that remained within a groupafter applying a threshold of LOD score of 3.0 (i.e., mar-ker order fixed with log likelihood of next best maporder < 0.001 probability) using the “buildfw” commandin CarthaGene. The order of all the markers thatappeared in these framework maps were rigidly fixedthroughout the ordering processes of the remaining loci,and they were given the highest confidence level. Fol-lowing this, a threshold LOD score of 2.0 was applied,enabling the ordering of further markers (next best maporder < 0.01 probability), with a medium confidencelevel. Note that these markers had previously been allo-cated to this group on the basis of LOD ≥ 3. Once thesehad been positioned, they retained their order for thefinal assembly. The last step was to construct a maxi-mum likelihood map with all remaining markers (i.e.,not positioned in steps 1 and 2) within each linkagegroup, using the “build” command in CarthaGene,which constructs a comprehensive map, placing eachremaining marker in its maximum likelihood position,followed by “polish” and “flips”, which fine-tune themarker order. These markers, despite having been initi-ally allocated to the group on the basis of LOD ≥ 3,were allocated the lowest confidence. The key point isthat these low confidence markers were included with-out sacrificing the marker order in the framework map,which was fixed throughout the map-building process.
Sex-specific differencesTo evaluate sex-specific differences, a set of comparablemale, female and sex-pooled maps was independentlyconstructed using loci common to all three maps and inthe same order. Using these comparable maps (not pre-sented), sex-specific differences in recombination ratesacross pairwise marker intervals, chromosomes and theoverall map were examined using an M-test and Chi-square heterogeneity tests on the LOD scores, accordingto Ott [28] and Zenger et al. [7].
Genome CoverageTo indicate the extent of genome coverage, a FISH-mapped location was required for the first and the lastmarkers in each linkage group. Where the end markercould not be reliably FISH-mapped (e.g. marker PB15on chromosome MEU2p had insufficient sequencelength for probe design), the next available marker(MeVIA3N11-345) was FISH-mapped instead. Five end-markers and their respective clones (G31-1, G16-2, T31-1, Y14-8 and PA55) identified from the first-generationmap had insufficient sequence length required for FISH-mapping. Consequently, each of these loci had to belocated within a BAC to gain additional sequencelength. Each of these markers was first screened against
the tammar wallaby ME_KBa BAC library for BACscontaining these markers. Overgo probes for each mar-ker were designed from sequence flanking the microsa-tellite, using the Overgo Maker program downloadedfrom Washington University Genome Sequencing Cen-ter http://genome.wustl.edu/software/overgo_maker.Overgo probes were radioactively labelled [29] andpooled for hybridisation. BACs isolated from this pri-mary screen were subjected to a further round ofscreening via dot blots with individual probes, accordingto the protocol described by Deakin et al. [15].The chromosome coverage of each linkage group was
calculated as the average ratio of the length between therelevant pair of end markers to the total chromosomelength, measured from 5 different metaphase spreads(10 chromosomes). In order to accurately locate thelinkage map within each chromosome, the un-coveredregions of each chromosome at the p telomere end andthe q telomere end were also measured on the samespreads. Based on these results, the percentage of theuncovered p arm (named m%) and of the q arm (namedn%) in each chromosome were calculated.
Physical mapping by FISHBACs containing end microsatellite markers for eachlinkage group were labelled by nick translation withSpectrum Green dUTP or SpectrumOrange dUTP(Abbott Molecular Inc., Des Plaines, IL, USA) and hybri-dised onto metaphase chromosomes following the pro-tocol detailed by Alsop et al. [30]. Slides were washedfollowing overnight hybridisation in 0.4 × SSC with 0.3%(v/v) Tween 20 for 2 minutes at 60°C, followed by a 1minute wash at room temperature in 2 × SSC with 0.1%(v/v) Tween 20. Chromosomes were counterstained withDAPI (1.5 μg/ml) in Vectashield (Vector LaboratoriesInc., Burlingame, CA, USA). Metaphase spreads andfluorescent signals were viewed using a Zeiss Axioplan2epifluorescent microscope and captured on a SPOT RTMonochrome CCD camera (Diagnostic Instruments Inc,Sterling Heights, MI, USA) using IP Lab imaging soft-ware (Scanalytics Inc, Fairfax, VA, USA).
ResultsGenotyping and data integrityGenotyping of replicate individuals both within andbetween genotyping runs revealed a high level of con-cordance between samples (99.2% overall). The smallnumber of discrepancies was primarily due to failure orlow signal strength of poor quality replicate DNA.Inconsistency with Mendelian inheritance (i.e., offspringhaving an allele not present in either parent) wasobserved in 1.59% of animals in the female pedigreesand 0.71% of animals in the male pedigrees. Many ofthe observed Mendelian inconsistencies arise from a
Wang et al. BMC Genetics 2011, 12:72http://www.biomedcentral.com/1471-2156/12/72
Page 8 of 16

small number of loci in a select number of families. Forexample, three loci (KJW174, EEF2K & MeKba510M2-126695) in the female mapping pedigrees account for~50% of the observed errors. Genotyping data werechecked and corrected where possible; otherwise thedata were excluded from the analysis. This resulted inthe loss of 1.22% of the data overall.Ten markers (MeVIA2C3-167, MeVIA3G15-373,
MeKba510M2-pseudo, MeVIA2P1-275, ODZ2, C2orf54,MeVIA3L16-78, MYCBP2, MeVIA3H22-576 andNRXN3) in male pedigrees showed significant segrega-tion distortion after correcting for multiple testing fol-lowing Benjamini-Hochberg’s strategy [24], and weresubsequently removed from the male pedigrees data set(note: each locus is still retained in the female and sex-pooled maps, where available). No significant segrega-tion distortion was found for any of the female map loci.Seven markers (MeVIA3G15-373, MeKba281G14-
77691, MeVIA2M13-303, MeVIA3M11-142,MeVIA2M6-313, MeVIA1G3-226 and MeKba273F23-57082) were removed from all maps (i.e., male, femaleand sex-pooled maps) after preliminary linkage mapconstruction, because their FISH-mapped locations sig-nificantly deviated from their genetic linkage map posi-tion. This evaluation was based on the FISH locations ofthe vast majority of the markers in that linkage group.Also, one marker (CASZ1) presented irresolvable incon-sistent results in the male and female maps, and wastherefore also removed from the datasets for the finalanalyses. Finally, only those loci that had sufficientinformative meiosis (≥ 19 based on power calculations[28]) were included in map construction. There werefive autosomal markers in the male pedigree that didnot satisfy this criterion and were removed prior tomale map construction (see Tables 1, 2 and 3).It is noted that females generally have a small increase
in the numbers of informative meioses across loci. How-ever, this is not unexpected as there are generally moreG2 offspring available for this sex (i.e., 104 progenyfrom male pedigrees and 127 progeny from female pedi-grees) and as such, there should be slightly more infor-mative meiosis for female pedigrees when all thefamilies are informative. For those 13 loci in the femalepedigrees that display a slightly reduced number ofinformative meioses (see Tables 1, 2 and 3), this is adirect result of a small number of female families beingnon-informative (i.e., female G1 individual homozygous).Furthermore, it appears coincidental that 10 of these 13loci are from marker set 3 (Table 3).
Map constructionThe final sex-pooled (overall) linkage map consists of 148markers comprising 84 second-generation markers and64 first-generation markers (Figure 1). This map is
accessible online at http://compldb.angis.org.au/. Basedon both two-point and multipoint groupings at LODthreshold of 3.0, 146 loci formed eight linkage groups(one per chromosome, i.e. MEU1 to MEU7, and MEUX).In total, three orphan markers (MeVIA1A16-106,DNHD2 and PTCHD1) could not be placed into anylinkage groups based on the LOD threshold ≥ 3. How-ever, two of these orphan markers (DNHD2 andPTCHD1) were eventually placed in their respective link-age groups (at low confidence) based on FISH-mappedlocations and respective multipoint LOD scores of 2.32and 2.86, respectively. In the final stages of constructingthe overall map, there were 99 markers with high confi-dence, 12 with medium confidence and 37 with low con-fidence. With more than two-thirds of markers assigneda map position at the highest confidence level (i.e., frame-work linkage map) and average marker interval distanceof 10.9 cM, the number of informative loci and numberof individuals genotyped was appropriate for developinga suitable genome-wide framework linkage map.As shown in Additional File 1, the total sex-pooled
map size is 1402.4 cM, which extends the first-genera-tion map length by more than 40%. Within this map,there are 33 loci (including 15 loci from X chromo-some) based on female meiosis data only, and 12 basedon male meiosis data only. There are 136 and 115 lociin the female and male map respectively. The overalland sex-specific linkage maps including allele numberdata are presented in tabular format in Additional File 1.
Sex-specific differencesAs shown in Table 4, 11 of 96 (11%) intervals commonto male and female maps displayed significant difference(p < 0.05) in recombination rates. Five of these 11 inter-vals present higher female recombination rate while theother six intervals demonstrate higher male recombina-tion rate. At the chromosome level, three of seven chro-mosomes (MEU1, MEU3 and MEU6) exhibitedsignificant differences between sexes (p < 0.05), allshowing a higher male recombination rate. With theoverall comparable (i.e. built with the same set of mar-kers) female and male map sizes of 1066.5 cM and1272.2 cM respectively; the F/M ratio is 0.84, which issignificantly different (p < 0.001). In total, marker inter-val regions displaying significant sex-recombination dif-ferences are distributed on six chromosomes, covering8.8% of the entire comparable map length (i.e. thelength of the map built up with common markers inboth sexes), and the three chromosomes displayingoverall significant sex-recombination differences add upto 48.2% of the total comparable map length.There was no consistent pattern in either male or
female map intervals exhibiting sex-specific recombina-tion differences. On MEU6 the interval with larger male
Wang et al. BMC Genetics 2011, 12:72http://www.biomedcentral.com/1471-2156/12/72
Page 9 of 16

Figure 1 The second-generation sex-pooled tammar wallaby linkage map and corresponding cytogenetic map. For each chromosome,the cytogenetic map is presented on the left and linkage map on the right, with lines connecting markers mapped in both maps. All linkagemaps are presented with the p telomere end at the top and the q telomere end at the bottom. Centromere locations were estimated fromFISH-mapping data and are labelled in red, except for MEU2 and MEUX, where the linkage maps cover only the q arm of the chromosomes.Centimorgan distances between flanking markers are listed on the left side of each map.. Markers are shown in different colours to distinguishtheir location confidence levels: blue for high level of confidence where it is 1000:1 odds to next possible location; orange for medium level ofconfidence where it is 100:1 odds to next possible location; black for low level of confidence where it is the most likely location. All firstgeneration markers are labelled with a “*” mark.
Wang et al. BMC Genetics 2011, 12:72http://www.biomedcentral.com/1471-2156/12/72
Page 10 of 16

map sizes was located closer to the centromere than theinterval with larger female map size, whereas on MEU3the interval with larger female map length is closer tothe centromere. MEU4 contains two intervals both withlarger female map size close to the centromere, MEU7contains an interval with a larger female map size in amedial position, and MEU1 and MEU2 contain intervalswith larger male map size in the middle of a chromo-some arm.
Genome coverageThe genome coverage of the overall map is illustrated inFigure 2. The genome is well covered by the linkagemap, except for the short arms of MEU2 and MEUX,and a distal region of MEU2q. Details of the FISH-mapped end (or near-end) markers, their BAC clone
information and the coverage measurements are pre-sented in Table 5. The presence of a relatively largenucleolus organiser region (NOR) on the short arm ofchromosome X (Xp), which is differentially contractedon the inactive X of females [31], could bias the result[32], so Xp was excluded from the following estimates.As can be seen in Table 5, the estimated total genomesize (assuming uniform cM/physical distance and allow-ing for exclusion of Xp), is 1698.2 cM. Given that thetotal length of the second-generation linkage map is1402.4 cM, this gives an estimated genome coverage of82.6% without Xp being taken into account. The percen-tage of uncovered chromosome regions at the p telo-mere and q telomere ends (named m% and n%,respectively) in each chromosome was calculated and isshown in Table 5.
Table 4 Intervals exhibiting significantly different sex-specific recombination rates
Chr Interval Sig.a Co-informative meiosis F/M ratio Female (cM) Male (cM)
First marker Last marker F M
1 MeVIA1L6-488 ME17 ** 112 80 0.09 0.9 9.6
1 ME17 T28-1 * 72 71 0.39 22.6 58.5
1 T28-1 TCGER1 * 67 75 0.37 13.7 37
1 Whole chromosome ** 0.72 246.5 341.3
2 T15-1 PA595 ** 121 90 0 0 4.4
3 B123 MeKba472N21-102181 * 81 77 1.79 31.2 17.4
3 MeKba182A19-136367 ME2 * 81 91 0 0 4.9
3 Whole chromosome * 0.97 195.2 202.2
4 TTHY G26-4 * 76 75 3.36 9.4 2.8
4 MeVIA3I8-498 MeVIA1B5-253 * 101 82 2.02 21.6 10.7
6 NOL14 C4orf8 * 77 51 0.43 1.2 2.8
6 ZNF143 KJW174 * 74 89 NAb 3.4 0
6 Whole chromosome * 0.85 63.8 75.3
7 T10-1 KJW221 * 120 77 5.71 8 1.4
Overall *** 0.84 1066.5 1272.2aThere are three significant levels: *, 0.01 < p < 0.05; **, 0.001 < p < 0.01; ***, p < 0.001.b NA = data not available, as the divider is zero.
Figure 2 Linkage map coverage (two-colour FISH map of end-markers for each linkage group). Localisation of BAC clones containingmarkers for the ends of each linkage group on tammar wallaby metaphase chromosomes, with p arm at top and q arm at bottom; markernames labelled at two ends of each chromosome and for details of markers see Table 5.
Wang et al. BMC Genetics 2011, 12:72http://www.biomedcentral.com/1471-2156/12/72
Page 11 of 16

Table 5 Linkage map end-markers used in genome coverage estimation, their BAC clones and overgo sequences, probe colours, cM and percentage coverageof the chromosome.
Chr End marker BAC clone Overgo sequences Probe colour (Fig. 1) cM lengthcovered byend markersFISH-mapped
in Fig. 2
% of chr included chr length (cM) m%c n%d
KJW105 MeVIA_123J11 NAa Green 321.2 93.76 342.6 3.51 2.73
1 Y148 MeKba_448F6 a: CCAAACTGTAATGAAGGTTCAATGb: GCAGGTTACTTAGCTACATTGAAC
Red
2 MeVIA3N11-345 MeVIA_3N11 NA Green 138.9 56.24 247.0 18.21 25.55
MeKba206L23-25864 MeKba_206L23 NA Red
3 DNHD2 MeKba_175F3 NA Green 230.5 95.09 242.4 3.18 1.73
G16-2 MeKba_323D15 a: GAGTTCAAATCCAGTCTCTCTTACb: CAGGGTTGCATAGTGAGTAAGAGA
Red
4 MeVIA2J14-517 MeVIA_2J14 NA Green 165.2 88.93 185.8 9.89 1.18
PA55 MeKba_369C8 a: TCTACAAAATGAGGATAATACTCCb: GAACCCCTGTGAAGTAGGAGTATT
Red
5 PTCHD1 MeKba_555M23 NA Green 200.2 86.04 232.7 1.89 12.16
T31-1 MeKba_345M2 a: CTGGGATTCTAAGAGGGTGAGAAGb: TCCCCAAATCCTGGTTCTTCTCAC
Red
6 MeVIA2P1-275 MeVIA_2P1 NA Green 129.6 96.58 134.2 2.72 0.69
C2orf54 MeKba_307P14 Na Red
7 G31-1 MeKba_80D8 a: TATTTCCCTAGGGAGGGACATCTGb: AGGAAGATGGTGCTTGCAGATGTC
Green 107.9 87.17 123.8 1.38 11.45
KJW220 MeVIA_115N20 NA Red
X KJW281 MeVIA_15A6 NA Green 88.1 25.84 (46.43b) 189.7b 70.36 3.81
MeKba494M2-50126 MeKba_494M2 NA Red
TOTALS 1381.6 1698.2
The final column shows the estimated full chromosome lengths, calculated from the previous two columns.a NA = not available, as no overgo probes were designed for this marker.b The value 46.43 is the estimated % coverage of Xq and 189.7 is the estimated cM size of Xq, as the 25.84% physical size coverage of MEUX may not reflect the linkage length coverage because of a relative largenucleolus organiser region (NOR) on Xp.c m% = the percentage of the length of the p arm not covered by the linkage map, for a particular chromosome.d n% = the percentage of the length of the q arm not covered by the linkage map, for a particular chromosome.
Wang
etal.BM
CGenetics
2011,12:72http://w
ww.biom
edcentral.com/1471-2156/12/72
Page12
of16

DiscussionMarker selectionThe approaches of identifying novel microsatellite mar-kers within BAC clones, BAC-end sequences andthrough a comparative genomics approach for gap fillingwere extremely successful. The first approach delivered14 unique BAC-linked polymorphic markers from only44 BACs, the second approach yielded 47 unique BAC-linked polymorphic markers from partial BAC end-sequence data, while the third, comparative-genomics,approach revealed 29 polymorphic gene-specific micro-satellite loci. The identification and physical positioningof microsatellite markers using these differentapproaches was very productive.Interestingly, this mapping study has confirmed an
evolutionary breakpoint between two closely positionedmarkers ADCY1 and RAMP3 on MDO6 (Monodelphisdomestica chromosome 6, which is homologous toMEU1 and MEU3). ADCY1 failed to be positionedalongside RAMP3 on MEU1p1 according to its initialpredicted comparative position in M. domestica(ADCY1 and RAMP3 are also co-located together ineutherian genomes, e.g., human and bovine). Instead, itwas mapped to MEU3 by both linkage and FISH map-ping techniques. Based on physically mapped flankingloci, ADCY1 is in close proximity to an evolutionarybreakpoint (Wang et al., submitted). We believe thatADCY1 is separated from RAMP3 due to this evolution-ary breakpoint, which is also supported by the mappingdata of its flanking loci on MEU3.Our comparative approach to identifying loci and
developing markers to fill gap regions significantly accel-erated the mapping process in this study, and reducedthe total number of loci needed to achieve the samegenome coverage. Reliance on only anonymous randommarkers would have required at least 35% more markersto obtain the same level of genome coverage at 99%power [28].
Discrepant marker positions, Mendelian inconsistency andsegregation distortionOne of the main objectives of this study is to produce arobust anchored genetic linkage map incorporating bothphysical and genetic linkage mapping data. Conse-quently, seven markers were removed from the finallinkage map due to major discrepancies between thelinkage and BAC FISH locations. Neither the linkagemap nor the physical map position could be confirmedas the true map position for any of these loci. One pos-sible explanation is that the microsatellite primer pairsamplified a secondary product other than targetsequence from which they were derived (e.g., locusduplication). Alternatively, a BAC-clone identification
error could have occurred during the FISH mappingprocess, or the BAC-end sequences stored in GenBankcould be listed with incorrect BAC names. Afterremoval of these seven loci, there is excellent agreementbetween linkage and FISH maps (Figure 1). Only onelocus shows slight differences (EEF2K), but this is dueto a reduced confidence mapping position in the linkagemap rather than true differences.The overall level of Mendelian inconsistencies
observed in the genotype data (1.22%) is relatively lowconsidering that the loci used are novel without anyprior information. The majority of these inconsistenciesarise from a small number of loci in a select number offamilies. For example, three loci (KJW174, EEF2K &MeKba510M2-126695) in the female mapping pedigreesaccount for almost 50% of the observed female pedigreeerror rate (1.59%). It would appear that null-alleles and/or allelic drop-outs are present within these loci. Ignor-ing these three loci, the observed female pedigree errorrate reduces to 0.81%, which is comparable to that ofthe male pedigrees (0.71%). The remainder of observederrors can be attributed to poor quality DNA in a smallnumber of individuals, a few difficult-to-score loci andseveral de novo germ-line mutations. In all situations,non-Mendelian genotypes (i.e., specific family data) wereremoved from the dataset. We discount the possibilityof pedigree errors because this resource has been rigor-ously tested over a period of 20 years across multipleprojects; and there were no families in which the Men-delian inconsistency pattern was consistent across allinformative loci. All anomalies were individuallyinspected using our custom Perl script, and no animaldisplayed evidence of an aberrant error rate indicatingincorrect assignment. We concede that in many highly-studied organisms (e.g. human and mice) one might seesomewhat lower inconsistency rates, but this isexpected, given the level of information available forstandardized mapping loci sets in highly-studied species.Ten loci in the male pedigrees showed significant
transmission segregation distortions (p < 0.05). How-ever, after close inspection of genotypes, it was deter-mined that the distortion was caused by alleleassignment bias derived from non-informative genotypesrather than true biological segregation distortion (e.g.,post-zygotic selection). This effect was localised only tomale pedigrees (due to genotype and pedigree composi-tion) and as such these segregation distortions were notobserved for female pedigrees. Although the segregationdistortion was a result of non-informative pedigree indi-viduals, the inclusion of these markers in the male pedi-gree map construction could have still causedunpredictable problems in analysis, so these loci wereexcluded from the map constructions.
Wang et al. BMC Genetics 2011, 12:72http://www.biomedcentral.com/1471-2156/12/72
Page 13 of 16

In situations where a locus has been identified as apossible discordant marker and not totally excludedfrom both male and female pedigrees, these loci weretested in the remaining pedigree to determine if theyadversely affected linkage map length. For both thethree loci that displayed non-Mendelian inheritance inspecific families and the ten segregation-distorted loci,linkage map building was conducted with and withoutthese markers. In all situations, the inclusion of theseloci has no adverse effect on map length (0.25-3.7% dif-ference), and as such they were retained in the remain-ing pedigrees.
Linkage groupsLinkage map construction produced eight linkagegroups that correspond to and cover large portions ofthe eight chromosomes of the female tammar wallaby(autosomes MEU1 to MEU7, and the X chromosomeMEUX). Final orientation of linkage groups on chromo-somes was determined from both linkage group dataand physical FISH mapping information (Figure 1). Thenon-recombining Y chromosome (MEUY) is not repre-sented by linkage data so is not considered in this study.However, there have been ten microsatellite markersreported in MEUY [12], which could complement ourlinkage map once these Y chromosome loci have beenconfidently positioned using other methods.The second-generation linkage map is a substantial
improvement upon the first-generation map in terms ofnumber of loci mapped, genome coverage and physicalplacement of loci/linkage groups on the chromosomes.The number of loci in this current map (n = 148) morethan doubles the number from the first-generation map(n = 64). The coverage of the genome has also signifi-cantly improved, with the total map size increasing from828.4 cM to 1402.4 cM, and the predicted genome cov-erage from 42.8% to 82.6%. The average map distancebetween adjacent markers was decreased from 16.2 cMto 10.9 cM. A chromosome-by-chromosome comparisonof the two maps is presented in Additional File 2. Theassignment of linkage group 2 (LG2) to chromosome 1in the first-generation map has now been corrected byits relocation to chromosome 4. The assignment of thislinkage group was originally based on the physical posi-tion of a DBB-like clone, which has since been shown tobe a pseudogene, here renamed pDBB in this second-generation map.
Recombination Rate Female Vs. MaleThe overall sex-specific difference in recombinationrates in this study is relatively similar to that from thefirst-generation map (0.84 and 0.78, respectively). Thispattern was inconsistent across the genome (Table 4)and there is no evident bias in chromosome position of
intervals with higher male or female recombination. Ineutherian mammals, the heterogametic sex (i.e., males)typically shows lower recombination rates [33-36], butin marsupials the reverse pattern has been reported.The first reported linkage dataset of an Australian mar-supial species, Sminthopsis crassicaudata, revealed largedifferences between female and male recombination ratewith less recombination in female [37], and preferentialpositioning of chiasmata close to telomeres in femalemeioses and “interstitial” in male meioses. Similarresults were obtained from a study of chiasmata posi-tioning in the South American gray short-tailed opos-sum (Monodelphis domestica), and a severely reducedfemale recombination rate was later reported [38-41],suggesting that this sex difference in chiasmata distribu-tion might present in all marsupials [42]. Thereafter sexdifferences in chiasmata distribution and recombinationrate have been noted in several linkage studies in mar-supials with no simple pattern being established. Inanother Australian marsupial, the brush-tailed possum,Trichosurus vulpecula, chiasma number was lower infemale meiosis, though not so dramatically [43] and thechiasmata distribution was not significantly differentbetween the sexes. The western brushed-tail bettongBettongia penicillata, a species from a distantly relatedAustralian marsupial group, showed no obvious differ-ence in chiasma number and localisation between sexes[44].Inconsistent sex-recombination results have been
reported for the tammar wallaby (Macropus eugenii). Anearly study found higher female recombination rate fortwo pairs of markers [45], whereas the first comprehen-sive linkage mapping study revealed a reduced femalemap size similar to other marsupials [7]. These inconsis-tencies are accounted for by our present findings thatdifferent intervals on different chromosomes showgreater male or female recombination rates, and thatthere is no consistent pattern of bias over chromosomearms. A dense linkage map with smaller marker inter-vals will be needed to provide a more complete descrip-tion of the recombination rate difference between sexesin this species.
Applications and future directionThe microsatellite markers discovered in this study havethe potential of being applied in other macropod spe-cies, as marker transferability has been shown to be rela-tively high among macropodoid taxa (average ~65%)[12,46]. The anchored genetic linkage map of M. eugeniiprovides a valuable resource, not only for comparativemapping purposes and positional cloning, but also as abridging framework scaffold for assisting with assemblyof the tammar wallaby genome sequence assembly. Thisnew map has been used to create a virtual tammar
Wang et al. BMC Genetics 2011, 12:72http://www.biomedcentral.com/1471-2156/12/72
Page 14 of 16

wallaby genome map (Wang et al. submitted), which willserve as a backbone for the genome sequence assembly.This map and available mapping pedigree resources alsoprovide a solid foundation for future high-density map-ping studies, incorporating tens of thousands of gen-ome-wide SNP markers, and the complete physicalanchoring of these SNPs/genes to the tammar wallabygenome assembly using modern high-throughput geno-typing and mapping techniques.
ConclusionsA second-generation anchored tammar wallaby linkagemap with 82.6% genome coverage was constructed with148 markers, using both linkage and FISH-mapping data.This map will be a valuable tool for gene localization andcomparative studies. When combined with the fullcohort of available physical mapping data, sequence dataand comparative data, this mapping resource will signifi-cantly contribute to the better understanding of marsu-pial genome structure, function and evolution. It hasalready been instrumental in the construction of an inte-grated and virtual tammar wallaby genome map (Wanget al. submitted), which provides a backbone for the 2-fold tammar wallaby genome sequence assembly [3].
Additional material
Additional file 1: Linkage maps. The overall, female and male linkagemaps in tabular format, with additional information about the number ofinformative meioses and the number of alleles for each marker.
Additional file 2: Comparison with the first-generation linkage map.A chromosome-by-chromosome comparison with the first-generationlinkage map regarding the number of markers and map lengths.
AcknowledgementsWe thank ARC Centre of Excellence for Kangaroo Genomics and theCooperative Research Centre for Innovative Dairy Products for fundingsupport. We gratefully acknowledge Peter Thomson for advice on statisticalanalyses.
Author details1Reprogen, Faculty of Veterinary Science, The University of Sydney, Sydney,NSW 2006, Australia. 2Australian Research Council Centre of Excellence forKangaroo Genomics. 3Research School of Biology, The Australian NationalUniversity, Canberra, ACT 0200, Australia. 4Bioinformatics Division, The Walterand Eliza Hall Institute of Medical Research, Parkville, VIC 3052, Australia.5School of Biological, Earth and Environmental Sciences, The University ofNew South Wales, Sydney, NSW 2052, Australia. 6School of Marine & TropicalBiology, James Cook University, Townsville, QLD 4811, Australia.
Authors’ contributionsCW was primarily responsible for data compilation, data analysis andpreparation of the manuscript and was heavily involved in genotypingespecially on the LICOR system; KJW produced set-1 markers; MJWdiscovered set-2 markers; HRP discovered set-3 markers; LW generatedgenotype data; JED and AA FISH-mapped markers to the genome; JEDscreened the BAC libraries for end markers and assisted in the genomecoverage analysis; KRZ was responsible for project design, generatedgenotype data, assisted with analysis and revised the manuscript; FWN
worked closely with CW during the analysis and writing phases; DWCprovided the animal DNA resources; JAMG provided funding, devisedstrategies for set-1 and set-3 marker discovery, and revised the manuscript.All authors read and approved the final manuscript.
Received: 9 September 2010 Accepted: 19 August 2011Published: 19 August 2011
References1. Wakefield MJ, Graves JAM: The kangaroo genome-leaps and bounds in
comparative genomics. EMBO Rep 2003, 4:143-147.2. Mikkelsen TS, Wakefield MJ, Aken B, Amemiya CT, Chang JL, Duke S,
Garber M, Gentles AJ, Goodstadt L, Heger A, Jurka J, Kamal M, Mauceli E,Searle SMJ, Sharpe T, Baker ML, Batzer MA, Benos PV, Belov K, Clamp M,Cook A, Cuff J, Das R, Davidow L, Deakin JE, Fazzari MJ, Glass JL,Grabherr M, Greally JM, Gu WJ, et al: Genome of the marsupialMonodelphis domestica reveals innovation in non-coding sequences.Nature 2007, 447:167-177.
3. Graves JAM: Marsupial genome sequencing. In Marsupial genetics andgenomics. Edited by: Deakin JE, Waters PD, Graves JAM. Sydney, Berlin:Springer; 2010:117-119.
4. Hayman DL: Marsupial cytogenetics. Aust J Zool 1990, 37:331-349.5. Rens W, O’Brien PCM, Yang F, Graves JAM, Ferguson-Smith MA: Karyotype
relationships between four distantly related marsupials revealed byreciprocal chromosome painting. Chromosome Research 1999, 7:461-474.
6. Mohammadi A, Delbridge ML, Waters PD, Graves JAM: Conservation of achromosome arm in two distantly related marsupial species. CytogenetGenome Res 2009, 124:147-150.
7. Zenger KR, McKenzie LM, Cooper DW: The first comprehensive geneticlinkage map of a marsupial: the tammar wallaby (Macropus eugenii).Genetics 2002, 162:321-330.
8. McKenzie LM, Collet C, Cooper DW: Use of a subspecies cross for efficientdevelopment of a linkage map for a marsupial mammal, the tammarwallaby (Macropus eugenii). Cytogenet Cell Genet 1993, 64:264-267.
9. Sankovic N, Bawden W, Martyn J, Graves JAM, Zuelke K: Construction of amarsupial bacterial artificial chromosome library from the modelAustralian marsupial, the tammar wallaby (Macropus eugenii). Aust J Zool2006, 53:389-393.
10. Edwards KJ, Barker JHA, Daly A, Jones C, Karp A: Microsatellite librariesenriched for several microsatellite sequences in plants. BioTechniques(Euro Edition) 1996, 20(5):758-760.
11. Python. [http://www.python.org].12. MacDonald AJ, Sankovic N, Sarre SD, Fitzsimmons NN, Wakefield MJ,
Graves JAM, Zenger KR: Y chromosome microsatellite markers identifiedfrom the tammar wallaby (Macropus eugenii) and their amplification inthree other macropod species. Mol Ecol Notes 2006, 6:1202-1204.
13. Margulies EH, Cooper GM, Asimenos G, Thomas DJ, Dewey CN, Siepel A,Birney E, Keefe D, Schwartz AS, Hou MM, Taylor J, Nikolaev S, Montoya-Burgos JI, Loytynoja A, Whelan S, Pardi F, Massingham T, Brown JB, Bickel P,Holmes I, Mullikin JC, Ureta-Vidal A, Paten B, Stone EA, Rosenbloom KR,Kent WJ, Antonarakis SE, Batzoglou S, Goldman N, Hardison R, et al:Analyses of deep mammalian sequence alignments and constraintpredictions for 1% of the human genome. Genome Res 2007, 17:760-774.
14. Margulies EH, Maduro VVB, Thomas PJ, Tomkins JP, Amemiya CT, Luo MZ,Green ED: Comparative sequencing provides insights about the structureand conservation of marsupial and monotreme genomes. Proc Natl AcadSci USA 2005, 102:3354-3359.
15. Deakin J, Koina E, Waters P, Doherty R, Patel V, Delbridge M, Dobson B,Fong J, Hu Y, van den Hurk C, Pask A, Shaw G, Smith C, Thompson K,Wakefield M, Yu H, Renfree M, Marshall Graves J: Physical map of twotammar wallaby chromosomes: a strategy for mapping in non-modelmammals. Chromosome Research 2008, 16:1159-1175.
16. Altschul SF, Gish W, Miller W, Myers EW, Lipman DJ: Basic local alignmentsearch tool. J Mol Biol 1990, 215:403-410.
17. Huang XQ, Madan A: CAP3: A DNA sequence assembly program. GenomeRes 1999, 9:868-877.
18. Macdonald AJ, Sarre SD, Fitzsimmons NN, Graves JAM: Chromosome-specific microsatellites from the tammar wallaby X chromosome andchromosome 2. Mol Ecol Notes 2007, 7:1063-1066.
19. Rozen S, Skaletsky H: Primer3 on the WWW for general users and forbiologist programmers. Methods Mol Biol 2000, 132:365-386.
Wang et al. BMC Genetics 2011, 12:72http://www.biomedcentral.com/1471-2156/12/72
Page 15 of 16

20. Boutin-Ganache I, Raposo M, Raymond M, Deschepper CF: M13-tailedprimers improve the readability and usability of microsatellite analysesperformed with two different allele-sizing methods. BioTechniques 2001,31:24-28.
21. Vogl C, Xu SZ: Multipoint mapping of viability and segregation distortingloci using molecular markers. Genetics 2000, 155:1439-1447.
22. Whitkus R: Genetics of adaptive radiation in Hawaiian and Cook Islandsspecies of Tetramolopium (Asteraceae). II. Genetic linkage map and itsimplications for interspecific breeding barriers. Genetics 1998,150:1209-1216.
23. Chetelat RT, Meglic V, Cisneros P: A genetic map of tomato based on BC1Lycopersicon esculentum × Solanum lycopersicoides reveals overallsynteny but suppressed recombination between these homeologousgenomes. Genetics 2000, 154:857-867.
24. Benjamini Y, Hochberg Y: Controlling the false discovery rate-a practicaland powerful approach to multiple testing. J R Stat Soc Ser B-Methodol1995, 57:289-300.
25. de Givry S, Bouchez M, Chabrier P, Milan D, Schiex T: CAR(H)(T)AGene:multipopulation integrated genetic and radiation hybrid mapping.Bioinformatics 2005, 21:1703-1704.
26. Dempster AP, Laird NM, Rubin DB: Maximum likelihood from incompletedata via EM algorithm. J R Stat Soc Ser B-Methodol 1977, 39:1-38.
27. Lander E, Abrahamson J, Barlow A, Daly M, Lincoln S, Newburg L, Green P:MAPMAKER a computer package for constructing genetic-linkage maps.Cytogenet Cell Genet 1987, 1(2):174-181.
28. Ott J: Analysis of Human Genetic Linkage. 3 edition. Baltimore: JohnsHopkins University Press; 1999.
29. Deakin JE, Siddle HV, Cross JGR, Belov K, Graves JAM: Class I genes havesplit from the MHC in the tammar wallaby. Cytogenet Genome Res 2007,116:205-211.
30. Alsop AE, Miethke P, Rofe R, Koina E, Sankovic N, Deakin JE, Haines H,Rapkins RW, Graves JAM: Characterizing the chromosomes of theAustralian model marsupial Macropus eugenii (tammar wallaby).Chromosome Research 2005, 13:627-636.
31. Graves JAM: DNA synthesis in chromosomes of cultured leucocytes fromtwo marsupial species. Exp Cell Res 1967, 46:37-57.
32. de Almeida MC, Campaner C, Cella DM: Karyotype characterization,constitutive heterochromatin and nucleolus organizer regions ofParanaita opima (Coleoptera, Chrysomelidae, Alticinae). Genet Mol Biol2006, 29:475-481.
33. Dib C, Faure S, Fizames C, Samson D, Drouot N, Vignal A, Millasseau P,Marc S, Hazan J, Seboun E, Lathrop M, Gyapay G, Morissette J,Weissenbach J: A comprehensive genetic map of the human genomebased on 5,264 microsatellites. Nature 1996, 380:152-154.
34. Dietrich WF, Miller J, Steen R, Merchant MA, DamronBoles D, Husain Z,Dredge R, Daly MJ, Ingalls KA, Oconnor TJ, Evans CA, DeAngelis MM,Levinson DM, Kruglyak L, Goodman N, Copeland NG, Jenkins NA,Hawkins TL, Stein L, Page DC, Lander ES: A comprehensive genetic mapof the mouse genome. Nature 1996, 380:149-152.
35. Ihara N, Takasuga A, Mizoshita K, Takeda H, Sugimoto M, Mizoguchi Y,Hirano T, Itoh T, Watanabe T, Reed KM, Snelling WM, Kappes SM,Beattie CW, Bennett GL, Sugimoto Y: A comprehensive genetic map ofthe cattle genome based on 3802 microsatellites. Genome Res 2004,14:1987-1998.
36. Archibald AL: The PiGMaP consortium linkage map of the domestic pig(Sus scrofa). Anim Genet 1994, 25:44.
37. Bennett JH, Hayman DL, Hope RM: Novel sex-differences in linkage valuesand meiotic chromosome behavior in a marsupial. Nature 1986,323:59-60.
38. Samollow PB, Gouin N, Miethke P, Mahaney S, Kenney M, VandeBerg J,Graves JAM, Kammerer C: A microsatellite-based, physically anchoredlinkage map for the gray, short-tailed opossum (Monodelphis domestica).Chromosome Research 2007, 15:269-282.
39. Samollow PB, Kammerer CM, Mahaney SM, Schneider JL, Westenberger SJ,VandeBerg JL, Robinson ES: First-generation linkage map of the gray,short-tailed opossum, Monodelphis domestica, reveals genome-widereduction in female recombination rates. Genetics 2004, 166:307-329.
40. van Oorschot RAH, Porter PA, Kammerer CM, Vandeberg JL: Severelyreduced recombination in females of the south-American marsupialMonodelphis domestica. Cytogenet Cell Genet 1992, 60:64-67.
41. Samollow PB, Deakin JE, Waters PD, Graves JAM: Marsupial Linkage Maps.Marsupial genetics and genomics 2010, 75-99.
42. Hayman DL, Moore HDM, Evans EP: Further evidence of novel sex-differences in chiasma distribution in marsupials. Heredity 1988,61:455-458.
43. Hayman DL, Rodger JC: Meiosis in male and female Trichosurus vulpecula(marsupialia). Heredity 1990, 64:251-254.
44. Hayman DL, Smith MJ, Rodger JC: A comparative-study of chiasmata inmale and female Bettongia penicillata (marsupialia). Genetica 1990,83:45-49.
45. McKenzie LM, Poole WE, Collet C, Cooper DW: Higher female than malerecombination rates in a marsupial mammal, the tammar vallaby(Macropus eugenii). Cytogenet Cell Genet 1995, 68:64-66.
46. Cheng YY, Wakefield M, Siddle HV, Coggill PC, Herbert CA, Beck S, Belov K,Eldridge MDB: Isolation and characterization of 10 MHC Class I-associated microsatellite loci in tammar wallaby (Macropus eugenii). MolEcol Resour 2009, 9:346-349.
doi:10.1186/1471-2156-12-72Cite this article as: Wang et al.: A second-generation anchored geneticlinkage map of the tammar wallaby (Macropus eugenii). BMC Genetics2011 12:72.
Submit your next manuscript to BioMed Centraland take full advantage of:
• Convenient online submission
• Thorough peer review
• No space constraints or color figure charges
• Immediate publication on acceptance
• Inclusion in PubMed, CAS, Scopus and Google Scholar
• Research which is freely available for redistribution
Submit your manuscript at www.biomedcentral.com/submit
Wang et al. BMC Genetics 2011, 12:72http://www.biomedcentral.com/1471-2156/12/72
Page 16 of 16