A Search for Seismic Waves from the Impact of the SL/9 R Fragment
10
ICARUS 121, 341–350 (1996) ARTICLE NO. 0092 A Search for Seismic Waves from the Impact of the SL/9 R Fragment CHARLES M. WALTER AND MARK S. MARLEY Department of Astronomy, Box 30001/Department 4500, New Mexico State University, Las Cruces, New Mexico 88003 E-mail: [email protected] DONALD M. HUNTEN, 1 ANN L. SPRAGUE, 1 AND WILLIAM K. WELLS 1 Lunar and Planetary Laboratory, University of Arizona, Tucson, Arizona, 85721 ADITYA DAYAL, 1 WILLIAM F. HOFFMANN, 1 AND MARK V. SYKES Steward Observatory, University of Arizona, Tucson, Arizona 85721 LYNNE K. DEUTSCH 1 Five College Astronomy Department, University of Massachusetts, Amherst, Massachusetts 01003 GIOVANNI G. FAZIO 1 Optical and Infrared Astronomy Division, Smithsonian Astrophysical Observatory, Cambridge, Massachusetts 02138 AND JOSEPH L. HORA 1 Institute for Astronomy, University of Hawaii, Honolulu, Hawaii 96822-1839 Received August 1, 1995; revised February 9, 1996 has provided in situ measurements, but only of the outer- most veneer of Jupiter. Unfortunately, inversion of a plan- Jupiter was observed in the aftermath of its impact with frag- ment R of Comet Shoemaker–Levy/9 to search for seismic waves et’s gravitational harmonics does not result in a unique excited by the collision. Observations were made in the 7.8 mm interior model. As it has for Earth, only seismology offers methane emission band with the MIRAC2 camera at the IRTF the opportunity to uniquely probe the depths of the planet. in an attempt to detect the local perturbation to the equilibrium By detecting waves which have traversed the interior of stratospheric temperature profile induced by the wave. Detection the planet, seismology can unravel the structure of the of a jovian seismic wave would provide the tightest constraint to deep planetary interior. date on interior models of Jupiter. Seismic waves were detected A specialized and challenging application of seismology in neither direct images of the planet nor in a composite time– is to measure the normal mode ‘‘ringing’’ of a planet. distance diagram which utilizes all of the available imagery. This The frequencies of the normal modes can also be inverted, non-detection allows us to place an upper limit on the energy of the fragment R impact of 1 3 10 28 erg, assuming a seismic wave as is done in helioseismology, to reveal the interior excitation efficiency of 15%. 1996 Academic Press, Inc. structure. Despite some tantalizing observations, there has yet been no definitive detection of the oscillation modes of any jovian planet (see Deming et al. 1989, 1. INTRODUCTION Schmider et al. 1991, Mosser et al. 1993, Fisher 1994, and Lederer et al. 1995). To date our principal probe of the jovian planet interiors The predicted impact and explosion of Comet Shoe- has been their gravitational harmonics. The Galileo Probe maker–Levy/9 into Jupiter offered an unprecedented op- portunity to apply the techniques of ‘‘classical’’ geoseismol- 1 Visiting Astronomer at the Infrared Telescope Facility which is oper- ogy to the problem of the interior structure of Jupiter. The ated by the University of Hawaii under contract to the National Aeronau- tics and Space Administration. impact would launch acoustic (or P-) waves that would 341 0019-1035/96 $18.00 Copyright 1996 by Academic Press, Inc. All rights of reproduction in any form reserved.
-
Upload
independent -
Category
Documents
-
view
4 -
download
0
Transcript of A Search for Seismic Waves from the Impact of the SL/9 R Fragment

ICARUS 121, 341–350 (1996)ARTICLE NO. 0092
A Search for Seismic Waves from the Impact of the SL/9 R Fragment
CHARLES M. WALTER AND MARK S. MARLEY
Department of Astronomy, Box 30001/Department 4500, New Mexico State University, Las Cruces, New Mexico 88003E-mail: [email protected]
DONALD M. HUNTEN,1 ANN L. SPRAGUE,1 AND WILLIAM K. WELLS1
Lunar and Planetary Laboratory, University of Arizona, Tucson, Arizona, 85721
ADITYA DAYAL,1 WILLIAM F. HOFFMANN,1 AND MARK V. SYKES
Steward Observatory, University of Arizona, Tucson, Arizona 85721
LYNNE K. DEUTSCH1
Five College Astronomy Department, University of Massachusetts, Amherst, Massachusetts 01003
GIOVANNI G. FAZIO1
Optical and Infrared Astronomy Division, Smithsonian Astrophysical Observatory, Cambridge, Massachusetts 02138
AND
JOSEPH L. HORA1
Institute for Astronomy, University of Hawaii, Honolulu, Hawaii 96822-1839
Received August 1, 1995; revised February 9, 1996
has provided in situ measurements, but only of the outer-most veneer of Jupiter. Unfortunately, inversion of a plan-Jupiter was observed in the aftermath of its impact with frag-
ment R of Comet Shoemaker–Levy/9 to search for seismic waves et’s gravitational harmonics does not result in a uniqueexcited by the collision. Observations were made in the 7.8 mm interior model. As it has for Earth, only seismology offersmethane emission band with the MIRAC2 camera at the IRTF the opportunity to uniquely probe the depths of the planet.in an attempt to detect the local perturbation to the equilibrium By detecting waves which have traversed the interior ofstratospheric temperature profile inducedbythe wave.Detection the planet, seismology can unravel the structure of theof a jovian seismic wave would provide the tightest constraint to
deep planetary interior.date on interior models of Jupiter. Seismic waves were detectedA specialized and challenging application of seismologyin neither direct images of the planet nor in a composite time–
is to measure the normal mode ‘‘ringing’’ of a planet.distance diagram which utilizes all of the available imagery. ThisThe frequencies of the normal modes can also be inverted,non-detection allows us to place an upper limit on the energy of
the fragment R impact of 1 3 1028 erg, assuming a seismic wave as is done in helioseismology, to reveal the interiorexcitation efficiency of 15%. 1996 Academic Press, Inc. structure. Despite some tantalizing observations, there
has yet been no definitive detection of the oscillationmodes of any jovian planet (see Deming et al. 1989,
1. INTRODUCTION Schmider et al. 1991, Mosser et al. 1993, Fisher 1994,and Lederer et al. 1995).To date our principal probe of the jovian planet interiors
The predicted impact and explosion of Comet Shoe-has been their gravitational harmonics. The Galileo Probemaker–Levy/9 into Jupiter offered an unprecedented op-portunity to apply the techniques of ‘‘classical’’ geoseismol-1 Visiting Astronomer at the Infrared Telescope Facility which is oper-ogy to the problem of the interior structure of Jupiter. Theated by the University of Hawaii under contract to the National Aeronau-
tics and Space Administration. impact would launch acoustic (or P-) waves that would
3410019-1035/96 $18.00
Copyright 1996 by Academic Press, Inc.All rights of reproduction in any form reserved.

342 WALTER ET AL.
traverse the interior of the planet. If these waves could bedetected upon their return to the visible atmosphere, adirect and straightforward probe of the interior of Jupiterwould be at hand.
Here we report on our attempt to detect primary pres-sure waves arising from the Shoemaker–Levy/9 fragmentR impact from the Infrared Telescope Facility (IRTF). Noprimary pressure waves were observed, and we provideestimates of the upper limit for the energy of the R impact.
2. THEORY
A variety of waves were predicted to arise from theimpacts. Seismic waves were first discussed by Marley(1993, 1994). Deming et al. (1994), Gough (1994), Kana-mori (1993), Lee and Van Horn 1994, and Lognonne et al.(1994) also calculated various properties of impact-inducedseismic waves. Hunten et al. (1994) presented the observa-tional strategy which we ultimately employed and whichis described further below.
The excitation mechanism for the seismic wave isstraightforward. As each fragment of the comet enters the
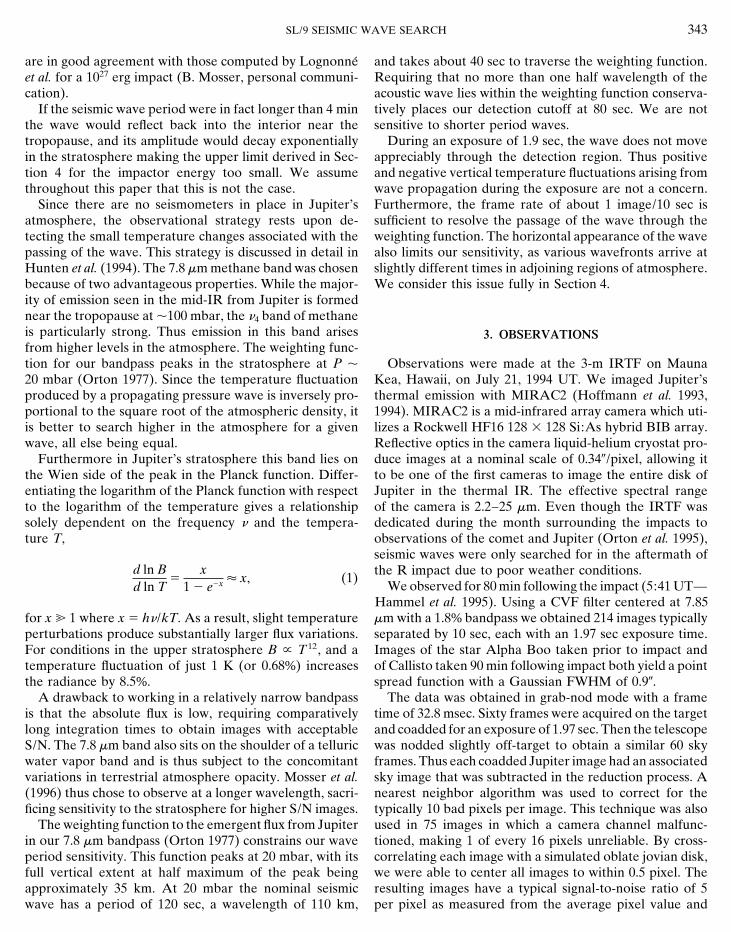
FIG. 1. Predicted angular distance of the seismic wave in degreesatmosphere at 60 km sec21, it is slowed by its interaction(D) from the impact site over the time observed. Calculations were donewith the atmosphere. Ultimately the comet releases a largeas in Marley (1994) using a Jupiter model of Chabrier et al. (1992). Thisfraction of its energy over a short distance, essentially re-model interpolates over the density discontinuity at the PPT (plasma
sulting in an explosion (Zahnle and MacLow 1994). From phase transition). See Lognonne et al. (1994) for a more detailed dis-analysis of numerical simulations, MacLow and Zahnle cussion.(personal communication) estimated that approximately15% of the impactor’s energy is carried away by a shockwave propagating downward into the planet. This wave traverses the planet very slowly, but after 60 min begins
to pick up speed and soon encompasses nearly the diameterdecays into an acoustic wave with increasing distance fromthe explosion. Here, as in Marley (1994), we assume that of the planet. For this plot the expected wave arrival times
were calculated from the Jupiter interior models of Cha-15% of the impactor energy is carried away by the wave,independent of the size of the impactor. Zahnle and brier et al. (1992), utilizing an equation of state which
interpolated over the likely density discontinuity at theMacLow (1994) compute a period of between 70 and 140sec for the wave. Lognonne et al. (1994) utilized a seismic molecular to metallic hydrogen interface. Models with a
density interface produce similar results except that a sec-moment approach to arrive at a value of 20% for the excita-tion efficiency and a wave period of 100 sec. ond wave, which reflects from the interface, is also pre-
dicted. While we ignore the reflected wave in our analysisThe increase in sound speed with depth in the planetrefracts downward-propagating waves back toward the sur- below, this has no bearing on the search strategy.
The wave period is almost certainly less than the acousticface. Because the gradient in sound speed with depth nearthe surface is quite large, the vast majority of the energy cutoff period at the tropopause—about 4 min (Mosser
et al. 1992). Thus the wave propagates past the tropopausein the wave is refracted back upward rapidly and returnsto the tropopause near the impact site. Only a small frac- and into the stratosphere. As it traverses the stratosphere
it produces the adiabatic temperature fluctuations whichtion of the energy probes quite deeply into the planetbefore refracting upward. Our challenge is to detect this we attempted to observe. Marley (1994) utilized a ray trac-
ing or eikonal approach to estimate the temperature ampli-modest fraction of the impactor energy, which carries asubstantial amount of information about Jupiter’s interior. tude as a function of distance for a given impactor energy.
A more sophisticated treatment of wave propagation wasMarley (1994) presents estimates of both the fraction ofthe wave energy reaching any given depth in the planet and presented by Lognonne et al. (1994). While such computa-
tions would be required to interpret a detected wave, theythe arrival times of the returning wave at the tropopause asa function of distance from the impact site. Figure 1 pre- are not necessary for the wave search and we thus utilize
a parameterization derived from the Marley (1994) resultssents the computed arrival times for the seismic wave as afunction of distance from the impact site. The wave initially below. Nevertheless our predicted temperature amplitudes
SL/9 SEISMIC WAVE SEARCH 343
are in good agreement with those computed by Lognonne and takes about 40 sec to traverse the weighting function.Requiring that no more than one half wavelength of theet al. for a 1027 erg impact (B. Mosser, personal communi-
cation). acoustic wave lies within the weighting function conserva-tively places our detection cutoff at 80 sec. We are notIf the seismic wave period were in fact longer than 4 min
the wave would reflect back into the interior near the sensitive to shorter period waves.During an exposure of 1.9 sec, the wave does not movetropopause, and its amplitude would decay exponentially
in the stratosphere making the upper limit derived in Sec- appreciably through the detection region. Thus positiveand negative vertical temperature fluctuations arising fromtion 4 for the impactor energy too small. We assume
throughout this paper that this is not the case. wave propagation during the exposure are not a concern.Furthermore, the frame rate of about 1 image/10 sec isSince there are no seismometers in place in Jupiter’s
atmosphere, the observational strategy rests upon de- sufficient to resolve the passage of the wave through theweighting function. The horizontal appearance of the wavetecting the small temperature changes associated with the
passing of the wave. This strategy is discussed in detail in also limits our sensitivity, as various wavefronts arrive atslightly different times in adjoining regions of atmosphere.Hunten et al. (1994). The 7.8 em methane band was chosen
because of two advantageous properties. While the major- We consider this issue fully in Section 4.ity of emission seen in the mid-IR from Jupiter is formednear the tropopause at p100 mbar, the n4 band of methaneis particularly strong. Thus emission in this band arises 3. OBSERVATIONSfrom higher levels in the atmosphere. The weighting func-tion for our bandpass peaks in the stratosphere at P p Observations were made at the 3-m IRTF on Mauna
Kea, Hawaii, on July 21, 1994 UT. We imaged Jupiter’s20 mbar (Orton 1977). Since the temperature fluctuationproduced by a propagating pressure wave is inversely pro- thermal emission with MIRAC2 (Hoffmann et al. 1993,
1994). MIRAC2 is a mid-infrared array camera which uti-portional to the square root of the atmospheric density, itis better to search higher in the atmosphere for a given lizes a Rockwell HF16 128 3 128 Si:As hybrid BIB array.
Reflective optics in the camera liquid-helium cryostat pro-wave, all else being equal.Furthermore in Jupiter’s stratosphere this band lies on duce images at a nominal scale of 0.340/pixel, allowing it
to be one of the first cameras to image the entire disk ofthe Wien side of the peak in the Planck function. Differ-entiating the logarithm of the Planck function with respect Jupiter in the thermal IR. The effective spectral range
of the camera is 2.2–25 em. Even though the IRTF wasto the logarithm of the temperature gives a relationshipsolely dependent on the frequency n and the tempera- dedicated during the month surrounding the impacts to
observations of the comet and Jupiter (Orton et al. 1995),ture T,seismic waves were only searched for in the aftermath ofthe R impact due to poor weather conditions.d ln B
d ln T5
x1 2 e2x P x, (1)
We observed for 80 min following the impact (5:41 UT—Hammel et al. 1995). Using a CVF filter centered at 7.85em with a 1.8% bandpass we obtained 214 images typicallyfor x @ 1 where x 5 hn/kT. As a result, slight temperature
perturbations produce substantially larger flux variations. separated by 10 sec, each with an 1.97 sec exposure time.Images of the star Alpha Boo taken prior to impact andFor conditions in the upper stratosphere B Y T 12, and a
temperature fluctuation of just 1 K (or 0.68%) increases of Callisto taken 90 min following impact both yield a pointspread function with a Gaussian FWHM of 0.90.the radiance by 8.5%.
A drawback to working in a relatively narrow bandpass The data was obtained in grab-nod mode with a frametime of 32.8 msec. Sixty frames were acquired on the targetis that the absolute flux is low, requiring comparatively
long integration times to obtain images with acceptable and coadded for an exposure of 1.97 sec. Then the telescopewas nodded slightly off-target to obtain a similar 60 skyS/N. The 7.8 em band also sits on the shoulder of a telluric
water vapor band and is thus subject to the concomitant frames. Thus each coadded Jupiter image had an associatedsky image that was subtracted in the reduction process. Avariations in terrestrial atmosphere opacity. Mosser et al.
(1996) thus chose to observe at a longer wavelength, sacri- nearest neighbor algorithm was used to correct for thetypically 10 bad pixels per image. This technique was alsoficing sensitivity to the stratosphere for higher S/N images.
The weighting function to the emergent flux from Jupiter used in 75 images in which a camera channel malfunc-tioned, making 1 of every 16 pixels unreliable. By cross-in our 7.8 em bandpass (Orton 1977) constrains our wave
period sensitivity. This function peaks at 20 mbar, with its correlating each image with a simulated oblate jovian disk,we were able to center all images to within 0.5 pixel. Thefull vertical extent at half maximum of the peak being
approximately 35 km. At 20 mbar the nominal seismic resulting images have a typical signal-to-noise ratio of 5per pixel as measured from the average pixel value andwave has a period of 120 sec, a wavelength of 110 km,
344 WALTER ET AL.
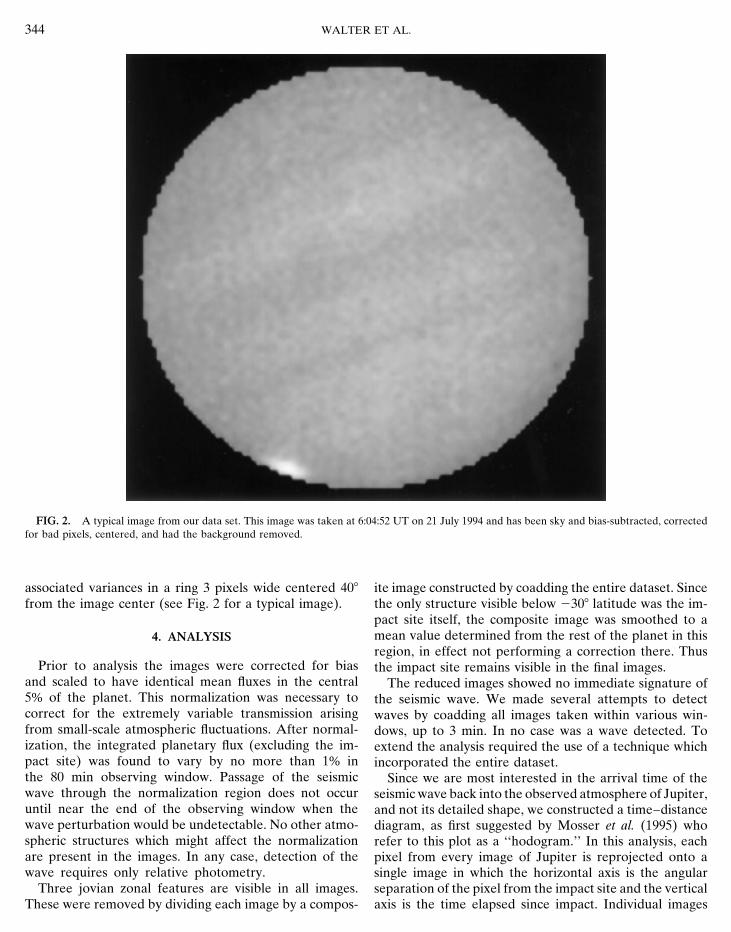
FIG. 2. A typical image from our data set. This image was taken at 6:04:52 UT on 21 July 1994 and has been sky and bias-subtracted, correctedfor bad pixels, centered, and had the background removed.
associated variances in a ring 3 pixels wide centered 408 ite image constructed by coadding the entire dataset. Sincethe only structure visible below 2308 latitude was the im-from the image center (see Fig. 2 for a typical image).pact site itself, the composite image was smoothed to amean value determined from the rest of the planet in this4. ANALYSISregion, in effect not performing a correction there. Thus
Prior to analysis the images were corrected for bias the impact site remains visible in the final images.and scaled to have identical mean fluxes in the central The reduced images showed no immediate signature of5% of the planet. This normalization was necessary to the seismic wave. We made several attempts to detectcorrect for the extremely variable transmission arising waves by coadding all images taken within various win-from small-scale atmospheric fluctuations. After normal- dows, up to 3 min. In no case was a wave detected. Toization, the integrated planetary flux (excluding the im- extend the analysis required the use of a technique whichpact site) was found to vary by no more than 1% in incorporated the entire dataset.the 80 min observing window. Passage of the seismic Since we are most interested in the arrival time of thewave through the normalization region does not occur seismic wave back into the observed atmosphere of Jupiter,until near the end of the observing window when the and not its detailed shape, we constructed a time–distancewave perturbation would be undetectable. No other atmo- diagram, as first suggested by Mosser et al. (1995) whospheric structures which might affect the normalization refer to this plot as a ‘‘hodogram.’’ In this analysis, eachare present in the images. In any case, detection of the pixel from every image of Jupiter is reprojected onto awave requires only relative photometry. single image in which the horizontal axis is the angular
Three jovian zonal features are visible in all images. separation of the pixel from the impact site and the verticalaxis is the time elapsed since impact. Individual imagesThese were removed by dividing each image by a compos-
SL/9 SEISMIC WAVE SEARCH 345
thus collapse into a single horizontal line in the plot where To test the sensitivity of our time–distance diagram, weadded a variety of simulated waves arising from varyingthe pixel brightness along the line denotes the average
brightness value of all pixels a given angular distance from impact energies. The predicted temperature amplitudesand wave locations were computed following Marleythe impact site. Images taken at different times fill out the
plot vertically. (1994). Note that the temperature amplitudes in the pub-lished version of his Fig. 3 are incorrect, although correctThe first step of this analysis was to map each pixel on
the disk to a planetocentric coordinate. We used algorithms values are derived in the text and used in our calculation.In those images taken from 30–80 min after impact, wemodified from the program AMIE (Hockey and Barnet
1994), which is an update of software developed at JPL to added an artificial wave feature computed at 10 sec inter-vals to the individual images before azimuthal averaging.navigate Voyager data (Jepsen et al. 1980). We modified
the code to allow for the reprojection of planetary images Utilizing Eq. (1), we converted temperature perturbationsto flux perturbations. The flux perturbation for each pixelfrom composite mosaics. This software takes the 6% ob-
lateness and camera scale into account when mapping each was computed by assuming a sinusoidal temperature varia-tion over the projected wavelength as computed by Huntenpixel, and then uses the relevant pixel and impact point
coordinates to determine the angular distance U using et al. (1994). They found thatspherical trigonometry with u representing the latitude andf the longitude,
W 5c Dt
sin u0, (3)
cos U 5 sin u1 sin u2 1 cos u1 cos u2 cos(f1 2 f2). (2)where W is the width of the wavefront, c the appropriatespeed of sound (0.89 km sec21 at 20 mbar), Dt the waveFor the location of the impact site we used the results
of Hammel et al. (1995). Assuming the expanding transient period (we assume 120 sec), and u0 the takeoff angle ofthe relevant portion of the wavefront. We then decom-ring feature observed in HST images originated at the
impact site they solved for the center of the ring, accounting posed the projected wavelength into 32 separate regions,each receiving the appropriate temperature perturbationfor the oblateness of the planet. Averaging the results of
three images yielded an impact point located at 244.17 6 as shown in Fig. 4. The contribution from both the wavecompression as well as from the following rarefaction are0.18 planetocentric latitude and 46.8 6 0.58 System III
longitude. This was then propagated throughout the analy- included. We assume the maximum temperature perturba-tion appears in the first wavelength and neglect subsequentsis assuming a System III rotational period of 9.92492 hr
(presumably appropriate for a wave traveling through the waves. The total flux variation was then projected ontoindividual pixels, accounting for the ratio of the wavefrontdeep interior).
This approach offers two advantages. By azimuthally width to the pixel size as in Fig. 4. The final artificial waveis then convolved with a Gaussian FWHM of 0.90 (2.4averaging over all pixels where the returning wave pro-
duces a signal at a given instant, we increase the S/N ratio pixels) and added to the image.The resulting relative flux ratios, dF/F, where F is theby approximately the square root of the number added.
This typically improved the S/N per pixel in the time– unperturbed pixel flux, are displayed in Fig. 5. In this figurethe wave is constructed and added to our dataset as above.distance diagram to p100. A seismic wave would appear
as a curve across the time–distance diagram since the wave The perturbation is then plotted as a percentage variancefrom the background level over the relevant portion ofmoves in both azimuth and time, while fixed features ap-
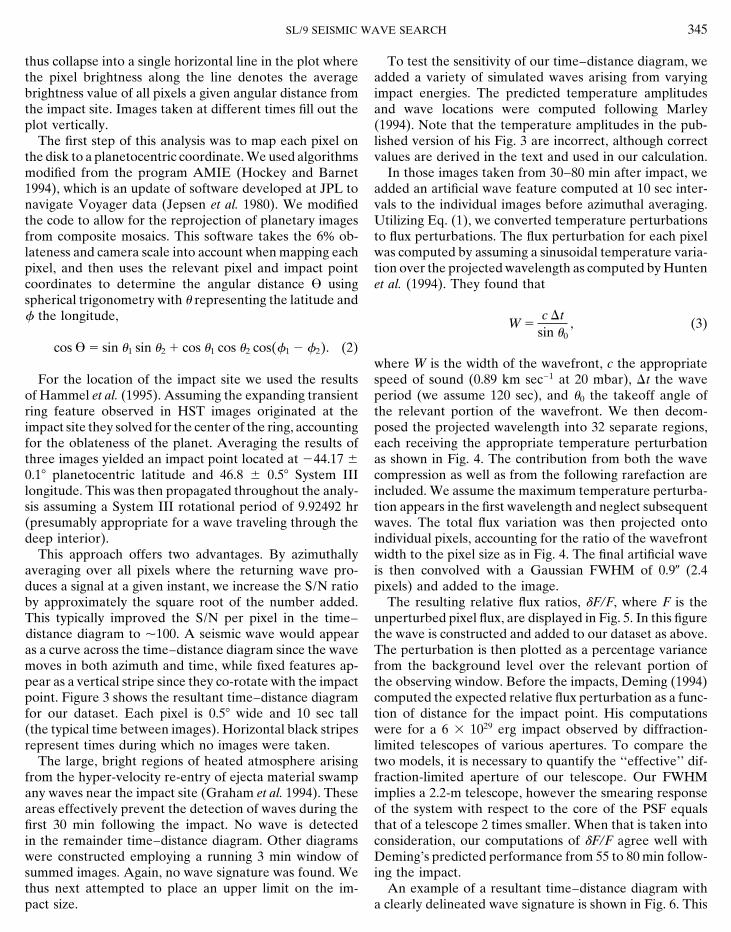
pear as a vertical stripe since they co-rotate with the impact the observing window. Before the impacts, Deming (1994)computed the expected relative flux perturbation as a func-point. Figure 3 shows the resultant time–distance diagram
for our dataset. Each pixel is 0.58 wide and 10 sec tall tion of distance for the impact point. His computationswere for a 6 3 1029 erg impact observed by diffraction-(the typical time between images). Horizontal black stripes
represent times during which no images were taken. limited telescopes of various apertures. To compare thetwo models, it is necessary to quantify the ‘‘effective’’ dif-The large, bright regions of heated atmosphere arising
from the hyper-velocity re-entry of ejecta material swamp fraction-limited aperture of our telescope. Our FWHMimplies a 2.2-m telescope, however the smearing responseany waves near the impact site (Graham et al. 1994). These
areas effectively prevent the detection of waves during the of the system with respect to the core of the PSF equalsthat of a telescope 2 times smaller. When that is taken intofirst 30 min following the impact. No wave is detected
in the remainder time–distance diagram. Other diagrams consideration, our computations of dF/F agree well withDeming’s predicted performance from 55 to 80 min follow-were constructed employing a running 3 min window of
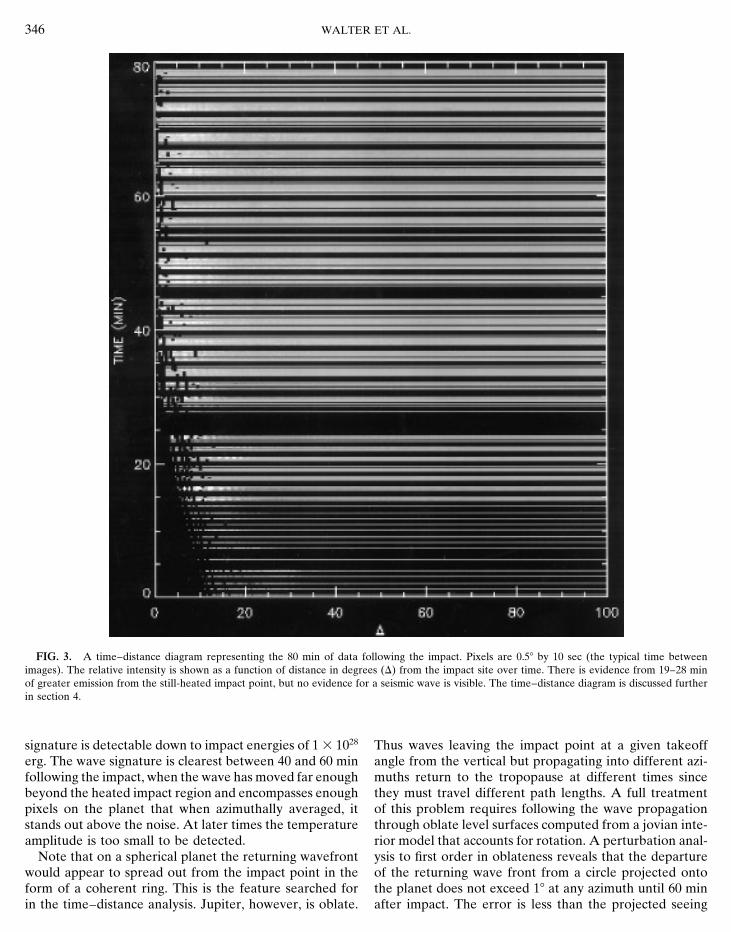
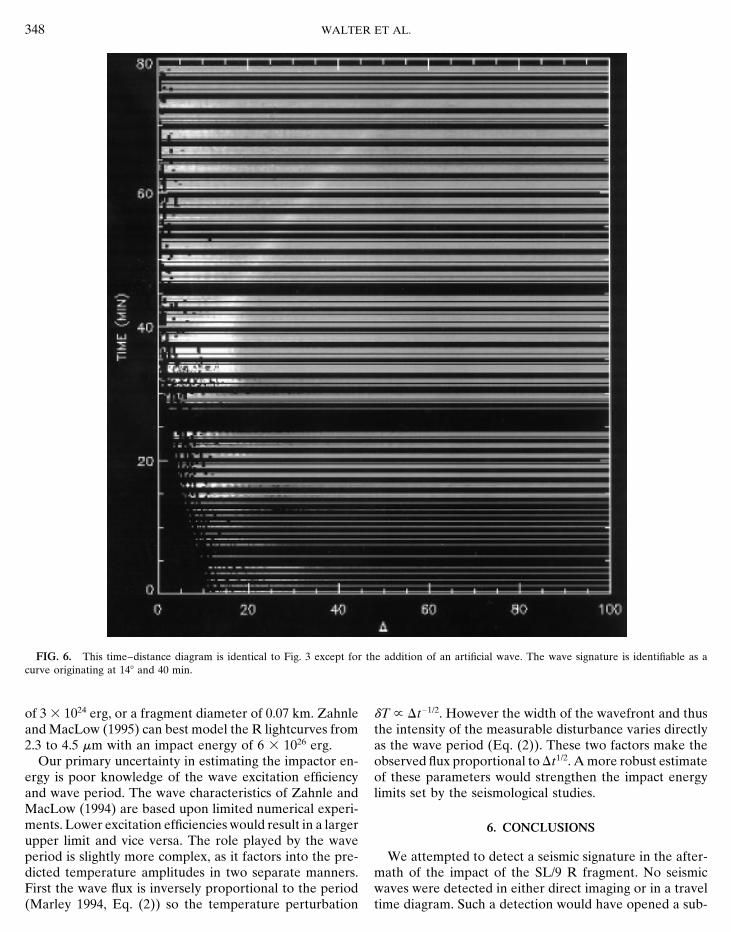
summed images. Again, no wave signature was found. We ing the impact.An example of a resultant time–distance diagram withthus next attempted to place an upper limit on the im-
pact size. a clearly delineated wave signature is shown in Fig. 6. This
346 WALTER ET AL.
FIG. 3. A time–distance diagram representing the 80 min of data following the impact. Pixels are 0.58 by 10 sec (the typical time betweenimages). The relative intensity is shown as a function of distance in degrees (D) from the impact site over time. There is evidence from 19–28 minof greater emission from the still-heated impact point, but no evidence for a seismic wave is visible. The time–distance diagram is discussed furtherin section 4.
signature is detectable down to impact energies of 1 3 1028 Thus waves leaving the impact point at a given takeoffangle from the vertical but propagating into different azi-erg. The wave signature is clearest between 40 and 60 min
following the impact, when the wave has moved far enough muths return to the tropopause at different times sincethey must travel different path lengths. A full treatmentbeyond the heated impact region and encompasses enough
pixels on the planet that when azimuthally averaged, it of this problem requires following the wave propagationthrough oblate level surfaces computed from a jovian inte-stands out above the noise. At later times the temperature
amplitude is too small to be detected. rior model that accounts for rotation. A perturbation anal-ysis to first order in oblateness reveals that the departureNote that on a spherical planet the returning wavefront
would appear to spread out from the impact point in the of the returning wave front from a circle projected ontothe planet does not exceed 18 at any azimuth until 60 minform of a coherent ring. This is the feature searched for
in the time–distance analysis. Jupiter, however, is oblate. after impact. The error is less than the projected seeing

SL/9 SEISMIC WAVE SEARCH 347
images with substantially better signal-to-noise (Mosser etal. 1996), emission at 10 em is formed much deeper in theatmosphere and is correspondingly less sensitive to waveperturbations. Their detection limit for the L impact (Mos-ser et al. 1995) is 5 3 1027 erg, or a fragment smaller than0.81 km in diameter, assuming 20% wave excitation effi-ciency.
Hammel et al. (1995) grouped the impact sites intoclasses based on the size of the dark ejecta and the numberof visible waves. Fragment L was considered to be one ofthe largest and was placed in class 1. Following behind inclass 2a were fragments A and H, and fragment R fell intoclass 2b. The seismic wave constraints on impact energiesare consistent with this classification. Given that the Limpact apparently produced some of the greatest effects,it is useful to consider the Mosser et al. result for the Limpact as an effective upper limit for the energy of allthe impacts.
From HST observations of the nucleus, Weaver et al.(1995) estimated a diameter for fragment R of 2.5 km.This exceeds our upper limit if the object is fully dense ice.Graham et al. observed the R splash at 2.3 em from theKeck Telescope on Mauna Kea. By integrating over thelightcurve they placed a lower limit for the impact energy
FIG. 4. Diagram illustrating how the artificial seismic wave was addedto the data to derive the impact energy upper limit. The wavefront locationand width are determined at the time corresponding to every image. Thewavefront, as seen from above (Hunten et al. 1994), is then dividedinto 32 partitions for which a temperature perturbation dT and a fluxperturbation is calculated. The total flux perturbations over the wave-length is then summed and scaled to the width of the pixel.
disk for all times less than 70 min after impact. Since thedetection limit is controlled by observations at times lessthan 50 min, neglect of the oblateness of the planet doesnot affect our derived impact energy limit. Were a wavedetected, a more complex analysis would be required tofollow the wave at t . 70 min.
5. DISCUSSION
It is interesting to compare the impact energy limit de-rived from the seismic wave analysis for the R impact withother impact energy estimates. Given a spherical cometfragment with a density of 1 g cm23 impacting the planetat 60 km sec21, a 1028 erg energy limit yields a maximumdiameter for the R fragment of 1.0 km.
FIG. 5. As in Deming (1994) the effect of a theoretical seismic waveA group led by Benoit Mosser (Mosser et al. 1996) alsofrom an impact of energy 6 3 1029 erg has been convolved with our PSF.searched for seismic waves in the aftermath of impacts A,The figure shows the result of adding this artificial wave to our data set.
H, and L. The largest impact observed by this group was of The corresponding ratio of the peak perturbation to the background isfragment L, which they observed from the Nordic Optical shown as a function of time. The jaggedness between 30 and 45 min
arises from poor wave resolution attributable to the heated impact region.Telescope at 10 em. While this group has many more
348 WALTER ET AL.
FIG. 6. This time–distance diagram is identical to Fig. 3 except for the addition of an artificial wave. The wave signature is identifiable as acurve originating at 148 and 40 min.
of 3 3 1024 erg, or a fragment diameter of 0.07 km. Zahnle dT Y Dt21/2. However the width of the wavefront and thusthe intensity of the measurable disturbance varies directlyand MacLow (1995) can best model the R lightcurves from
2.3 to 4.5 em with an impact energy of 6 3 1026 erg. as the wave period (Eq. (2)). These two factors make theobserved flux proportional to Dt1/2. A more robust estimateOur primary uncertainty in estimating the impactor en-
ergy is poor knowledge of the wave excitation efficiency of these parameters would strengthen the impact energylimits set by the seismological studies.and wave period. The wave characteristics of Zahnle and
MacLow (1994) are based upon limited numerical experi-ments. Lower excitation efficiencies would result in a larger 6. CONCLUSIONSupper limit and vice versa. The role played by the waveperiod is slightly more complex, as it factors into the pre- We attempted to detect a seismic signature in the after-
math of the impact of the SL/9 R fragment. No seismicdicted temperature amplitudes in two separate manners.First the wave flux is inversely proportional to the period waves were detected in either direct imaging or in a travel
time diagram. Such a detection would have opened a sub-(Marley 1994, Eq. (2)) so the temperature perturbation

SL/9 SEISMIC WAVE SEARCH 349
DEUTSCH 1994. Astronomical observations with the mid-infrared arraystantial new window into the interiors of the jovian planets.camera, MIRAC. Infrared Phys. Technol. 35, 175–194.Seismology has, however, allowed us to place an upper
HUNTEN, D. M., W. F. HOFFMANN, AND A. L. SPRAGUE 1994. Jovianlimit to the R impact energy of 1 3 1028 erg. This limit isseismic waves and their detection. Geophys. Res. Lett. 21, 1091–consistent with some other observations, but is smaller1094.
than that found by Weaver et al. (1995), if the comet isJEPSEN, A. L., J. A. MOSHER, G. M. YAGI, C. C. AVIS, J. J. LORRE,
fully dense ice. Assuming this composition, our upper limitAND G. W. GARNEAU 1980. Voyager image processing at the Image
to the fragment diameter is 1 km. Processing Laboratory. J. Br. Interplanet. Soc. 33, 315–322.These results also demonstrate the substantial promise KANAMORI, H. 1993. Excitation of jovian normal modes by an impact
for planetary seismology offered by the 7.8 em methane source. Geophys. Res. Lett. 20, 2921–2924.band and infrared array detectors capable of imaging the LEDERER, S. M., M. S. MARLEY, B. MOSSER, J. P. MAILLARD, N. J.entire planet. MIRAC2 was also employed after the impact CHANOVER, AND R. F. BEEBE 1995. Albedo features and jovian seismol-
ogy. Icarus 114, 269–277.period to search for global oscillation modes of JupiterLEE, U., AND H. M. VAN HORN 1994. Global oscillation amplitudes excitedexcited by the impacts. Results of this search will be re-
by the Jupiter–comet collision. Astrophys. J. 405, 359–374.ported elsewhere.LOGNONNE, P., B. MOSSER, AND F. DAHLEN 1994. Excitation of jovian
seismic waves by the Shoemaker–Levy/9 impact. Icarus 110, 180–195.ACKNOWLEDGMENTS
MARLEY, M. S. 1993. The seismological impact of Comet Shoemaker–Levy Bull. Am. Astron. Soc. 25, 1043.The authors thank Benoit Mosser and an anonymous referee for
insightful reviews. We also thank Mordecai Mark MacLow and Kevin MARLEY, M. S. 1994. Seismological consequences of the collision ofZahnle for helpful discussions and shocking results from their numerical Comet Shoemaker–Levy/9 with Jupiter. Astrophys. J. 427, L63–models. The MIRAC camera upgrade to the 128 3 128 array was L66.supported by Steward Observatory of the University of Arizona, the Mosser, B., D. Gautier, and T. Kostiuk 1992. On the detectability of jovianSmithsonian Astrophysical Observatory, the National Science Founda- oscillations with infrared heterodyne measurements. Icarus 96, 15–26.tion, and the National Aeronautics and Space Administration.
MOSSER, B., D. MEKARNIA, J. P. MAILLARD, J. GAY, D. GAUTIER, AND
P. DELACHE 1993. Seismological observations with a Fourier transformspectrometer: Detection of jovian oscillations. Astron. Astrophys.
REFERENCES 267, 604–622.
MOSSER, B., P. GALDEMARD, R. JOUAN, P. LAGAGE, E. PANTIN, M. SAU-CHABRIER, G., D. SAUMON, W. B. HUBBARD, AND J. I. LUNINE 1992. The VAGE, P. LOGNONNE, D. GAUTIER, P. DROSSART, P. MERLIN, F. SIBILLE,
molecular-metallic transition of hydrogen and the structure of Jupiter I. VAUGHLIN, F. BILLEBAUD, T. LIVENGOOD, H. U. KAUFL, M. MARLEY,and Saturn. Astrophys. J. 391, 817–826. M. HULTDGREN, L. NORDH, G. OLOFSSON, A. ULLA, J. A. BELMONTE,
DEMING, D., M. J. MUMMA, F. ESPENAK, D. E. JENNINGS, T. KOSTIUK, C. REGULO, T. ROCA-CORTES, M. SELBY, J. M. RODRIGUEZ ESPINOSA,G. WIEDEMANN, R. LOEWENSTEIN, AND J. PISCITELLI 1989. A search AND I. VIDAL 1995. Seismic studies of Jupiter at the time of the SL-9for p-mode oscillations of Jupiter; Serendipitous observations of non- impacts. In European SL-9/Jupiter Workshop, Garching, 13–15 Febru-acoustic thermal wave structure. Astrophys. J. 343, 456–467. ary 1995 (R. M. West and H. Boehnhardt, Eds.), European Southern
DEMING, D. 1994. Prospects for jovian seismological observations follow- Observatory Conference and Workshop Proceedings 52, pp. 397–402.ing the impact of Comet Shoemaker–Levy 9. Geophys. Res. Lett. 21, ESO, Garching.1095–1098. MOSSER, B., P. GALDEMARD, P. LAGAGE, E. PANTIN, M. SAUVAGE,
FISHER, B. 1994. High Time-Resolution Infrared Imaging Observations P. LOGNONNE, D. GAUTIER, F. BILLEBAUD, T. LIVENGOOD, AND H. U.of Jupiter. PhD. Thesis, University of California, San Diego. KAUFL 1996. Impact seismology: A search for primary pressure waves
following impacts A and H. Icarus 121, 331–340.GOUGH, D. O. 1994. Seismic consequences of the Shoemaker–Levy im-pact. Mon. Not. R. Astron. Soc. 269, L17–L20. ORTON, G. S. 1977. Recovery of the mean jovian temperature structure
from inversion of spectrally resolved thermal radiance data. IcarusGRAHAM, J. R., I. DE PATER, J. G. JERNIGAN, M. C. LIU, AND M. E. BROWN
1995. The fragment R collision: W. M. Keck Telescope observations of 32, 41–57.SL9. Science 267, 1320–1323. ORTON, G., M. A’HEARN, K. BAINES, D. DEMING, T. DOWLING,
HAMMEL, H. B., R. F. BEEBE, A. P. INGERSOLL, G. S. ORTON, J. R. MILLS, J. GOGUEN, C. GRIFFITH, H. HAMMEL, W. HOFFMANN, D. HUNTEN,A. A. SIMON, P. CHODAS, J. T. CLARKE, E. DE JONG, T. E. DOWLING, D. JEWITT, T. KOSTIUK, S. MILLER, K. NOLL, K. ZAHNLE, N. ACHILLEOS,J. HARRINGTON, L. F. HUBER, E. KARKOSCHKA, C. M. SANTORI, A. A. DAYAL, L. DEUTSCH, F. ESPENAK, P. ESTERLE, J. FRIEDSON, K. FAST,TOIGO, D. YEOMANS, AND R. A. WEST 1995. HST imaging of atmo- J. HARRINGTON, J. HORA, R. JOSEPH, D. KELLY, R. KNACKE, J. LACY,spheric phenomena created by the impact of Comet Shoemaker–Levy C. LISSE, J. RAYNER, A. SPRAGUE, M. SHURE, K. WELLS, P. YANA-9. Science 267, 1288–1295. MANDRA-FISHER, D. ZIPOY, G. BJORAKER, D. BUHL, W. GOLISCH,
HOCKEY, T. AND C. BARNET 1994. A DOS-based version of the VICAR D. GRIEP, C. KAMINSKI, C. ARDEN, A. CHAIKIN, J. GOLDSTEIN,image processing system for planetary image reduction, navigation, D. GILMORE, G. FAZIO, T. KANAMORI, H. LAM, T. LIVENGOOD,and measuring. Bull. Am. Astron. Soc. 26, 184. M.-M. MACLOW, M. MARLEY, T. MOMARY, D. ROBERTSON,
P. ROMANI, J. SPITALE, M. SYKES, J. TENNYSON, D. WELLNITZ, ANDHOFFMANN, W. F., G. G. FAZIO, K. SHIVANANDAN, J. L. HORA, AND L. K.DEUTSCH 1993. MIRAC, a mid infrared array camera for astronomy. S.-W. YING 1995. Collision of Comet Shoemaker–Levy 9 with JupiterProc. SPIE 1946, 449–460. observed by the NASA Infrared Telescope Facility. Science 267, 1277–
1282.HOFFMANN, W. F., G. G. FAZIO, K. SHIVANANDAN, J. L. HORA, AND L. K.

350 WALTER ET AL.
scope (HST) observing campaign on Comet Shoemaker–Levy 9.SCHMIDER, F.-X., B. MOSSER, AND E. FOSSAT 1991. A possible detectionof jovian global oscillations. Astron. Astrophys. 248, 281–291. Science 267, 1282–1287.
WEAVER, H. A., M. F. A’HEARN, C. ARPIGNY, D. C. BOICE, P. D. FELD- ZAHNLE, K. AND M.-M. MACLOW 1994. The collision of Jupiter andComet Shoemaker–Levy/9. Icarus 108, 1–18.MAN, S. M. LARSON, P. LAMY, D. H. LEVY, B. G. MARSDEN, K. J.
MEECH, K. S. NOLL, J. V. SCOTTI, Z. SEKANINA, C. S. SHOEMAKER, ZAHNLE, K., AND M.-M. MACLOW 1995. A simple model for the lightE. M. SHOEMAKER, T. E. SMITH, S. A. STERN, A. D. STORRS, J. T. curve generated by a Shoemaker–Levy 9 impact. J. Geophys. Res.
Planets 100, 16,885–16,894.TRAUGER, D. K. YEOMANS, B. ZELLNER 1995. The Hubble Space Tele-