Antenna Design for Angle of Arrival Measurement in Access ...
Upload
senavirtualCategory
view
2download
0
This content has been downloaded from IOPscience. Please scroll down to see the full text.
Download details:
IP Address: 200.128.81.2
This content was downloaded on 06/07/2015 at 20:20
Please note that terms and conditions apply.
A search for anisotropy in the arrival directions of ultra high energy cosmic rays recorded at
the Pierre Auger Observatory
View the table of contents for this issue, or go to the journal homepage for more
JCAP04(2012)040
(http://iopscience.iop.org/1475-7516/2012/04/040)
Home Search Collections Journals About Contact us My IOPscience
JCAP04(2012)040
ournal of Cosmology and Astroparticle PhysicsAn IOP and SISSA journalJ
A search for anisotropy in the arrival
directions of ultra high energy cosmic
rays recorded at the Pierre Auger
Observatory
The Pierre Auger collaboration
P. Abreu,75 M. Aglietta,58 M. Ahlers,110 E.J. Ahn,94
I.F.M. Albuquerque,20 D. Allard,34 I. Allekotte,1 J. Allen,98
P. Allison,100 A. Almela,13,9 J. Alvarez Castillo,68
J. Alvarez-Muniz,85 M. Ambrosio,51 A. Aminaei,69
L. Anchordoqui,111 S. Andringa,75 T. Antici’c,28 C. Aramo,51
E. Arganda,6,82 F. Arqueros,82 H. Asorey,1 P. Assis,75 J. Aublin,36
M. Ave,42 M. Avenier,37 G. Avila,12 T. Backer,46 A.M. Badescu,78
M. Balzer,41 K.B. Barber,14 A.F. Barbosa,17 R. Bardenet,35
S.L.C. Barroso,23 B. Baughman,100,f J. Bauml,40 J.J. Beatty,100
B.R. Becker,108 K.H. Becker,39 A. Belletoile,38 J.A. Bellido,14
S. BenZvi,110 C. Berat,37 X. Bertou,1 P.L. Biermann,43 P. Billoir,36
F. Blanco,82 M. Blanco,83 C. Bleve,39 H. Blumer,42,40
M. Bohacova,30 D. Boncioli,52 C. Bonifazi,26,36 R. Bonino,58
N. Borodai,73 J. Brack,92 I. Brancus,76 P. Brogueira,75
W.C. Brown,93 R. Bruijn,88,i P. Buchholz,46 A. Bueno,84
R.E. Burton,90 K.S. Caballero-Mora,101 B. Caccianiga,49
L. Caramete,43 R. Caruso,53 A. Castellina,58 O. Catalano,57
G. Cataldi,50 L. Cazon,75 R. Cester,54 J. Chauvin,37 S.H. Cheng,101
A. Chiavassa,58 J.A. Chinellato,21 J. Chirinos Diaz,97 J. Chudoba,30
M. Cilmo,51 R.W. Clay,14 M.R. Coluccia,50 R. Conceicao,75
F. Contreras,11 H. Cook,88 M.J. Cooper,14 J. Coppens,69,71
A. Cordier,35 S. Coutu,101 C.E. Covault,90 A. Creusot,34 A. Criss,101
J. Cronin,103 A. Curutiu,43 S. Dagoret-Campagne,35 R. Dallier,38
S. Dasso,7,3 K. Daumiller,40 B.R. Dawson,14 R.M. de Almeida,27
M. De Domenico,53 C. De Donato,68 S.J. de Jong,69,71 G. De LaVega,10 W.J.M. de Mello Junior,21 J.R.T. de Mello Neto,26 I. De
c© 2012 IOP Publishing Ltd and Sissa Medialab srl doi:10.1088/1475-7516/2012/04/040

JCAP04(2012)040
Mitri,50 V. de Souza,19 K.D. de Vries,70 L. del Peral,83 M. delRıo,52,11 O. Deligny,33 H. Dembinski,42 N. Dhital,97 C. Di Giulio,48
M.L. Dıaz Castro,18 P.N. Diep,112 F. Diogo,75 C. Dobrigkeit ,21
W. Docters,70 J.C. D’Olivo,68 P.N. Dong,112,33 A. Dorofeev,92
J.C. dos Anjos,17 M.T. Dova,6 D. D’Urso,51 I. Dutan,43 J. Ebr,30
R. Engel,40 M. Erdmann,44 C.O. Escobar,94,21 J. Espadanal,75
A. Etchegoyen,9,13 P. Facal San Luis,103 I. Fajardo Tapia,68
H. Falcke,69,72 G. Farrar,98 A.C. Fauth,21 N. Fazzini,94
A.P. Ferguson,90 B. Fick,97 A. Filevich,9 A. Filipcic,79,80
S. Fliescher,44 C.E. Fracchiolla,92 E.D. Fraenkel,70 O. Fratu,78
U. Frohlich,46 B. Fuchs,17 R. Gaior,36 R.F. Gamarra,9
S. Gambetta,47 B. Garcıa,10 S.T. Garcia Roca,85
D. Garcia-Gamez,35 D. Garcia-Pinto,82 A. Gascon,84
H. Gemmeke,41 P.L. Ghia,36 U. Giaccari,50 M. Giller,74 H. Glass,94
M.S. Gold,108 G. Golup,1 F. Gomez Albarracin,6 M. GomezBerisso,1 P.F. Gomez Vitale,12 P. Goncalves,75 D. Gonzalez,42
J.G. Gonzalez,40 B. Gookin,92 A. Gorgi,58 P. Gouffon,20
E. Grashorn,100 S. Grebe,69,71 N. Griffith,100 M. Grigat,44
A.F. Grillo,59 Y. Guardincerri,3 F. Guarino,51 G.P. Guedes,22
A. Guzman,68 J.D. Hague,108 P. Hansen,6 D. Harari,1
S. Harmsma,70,71 T.A. Harrison,14 J.L. Harton,92 A. Haungs,40
T. Hebbeker,44 D. Heck,40 A.E. Herve,14 C. Hojvat,94 N. Hollon,103
V.C. Holmes,14 P. Homola,73 J.R. Horandel,69 A. Horneffer,69
P. Horvath,31 M. Hrabovsky,31,30 T. Huege,40 A. Insolia,53
F. Ionita,103 A. Italiano,53 C. Jarne,6 S. Jiraskova,69
M. Josebachuili,9 K. Kadija,28 K.H. Kampert,39 P. Karhan,29
P. Kasper,94 B. Kegl,35 B. Keilhauer,40 A. Keivani,96 J.L. Kelley,69
E. Kemp,21 R.M. Kieckhafer,97 H.O. Klages,40 M. Kleifges,41
J. Kleinfeller,11,40 J. Knapp,88 D.-H. Koang,37 K. Kotera,103
N. Krohm,39 O. Kromer,41 D. Kruppke-Hansen,39 F. Kuehn,94
D. Kuempel,46,39 J.K. Kulbartz,45 N. Kunka,41 G. La Rosa,57
C. Lachaud,34 R. Lauer,108 P. Lautridou,38 S. Le Coz,37
M.S.A.B. Leao,25 D. Lebrun,37 P. Lebrun,94 M.A. Leigui deOliveira,25 A. Letessier-Selvon,36 I. Lhenry-Yvon,33 K. Link,42
R. Lopez,64 A. Lopez Aguera,85 K. Louedec,37,35 J. LozanoBahilo,84 L. Lu,88 A. Lucero,9 M. Ludwig,42 H. Lyberis,33
C. Macolino,36 S. Maldera,58 D. Mandat,30 P. Mantsch,94
A.G. Mariazzi,6 J. Marin,11,58 V. Marin,38 I.C. Maris,36
H.R. Marquez Falcon,67 G. Marsella,55 D. Martello,50 L. Martin,38
JCAP04(2012)040
H. Martinez,65 O. Martınez Bravo,64 H.J. Mathes,40
J. Matthews,96,102 J.A.J. Matthews,108 G. Matthiae,52 D. Maurel,40
D. Maurizio,54 P.O. Mazur,94 G. Medina-Tanco,68 M. Melissas,42
D. Melo,9 E. Menichetti,54 A. Menshikov,41 P. Mertsch,86
C. Meurer,44 S. Mi’canovi’c,28 M.I. Micheletti,8 I.A. Minaya,82
L. Miramonti,49 L. Molina-Bueno,84 S. Mollerach,1 M. Monasor,103
D. Monnier Ragaigne,35 F. Montanet,37 B. Morales,68 C. Morello,58
E. Moreno,64 J.C. Moreno,6 M. Mostafa,92 C.A. Moura,25
M.A. Muller,21 G. Muller,44 M. Munchmeyer,36 R. Mussa,54
G. Navarra,58,∗ J.L. Navarro,84 S. Navas,84 P. Necesal,30 L. Nellen,68
A. Nelles,69,71 J. Neuser,39 P.T. Nhung,112 M. Niechciol,46
L. Niemietz,39 N. Nierstenhoefer,39 D. Nitz,97 D. Nosek,29
L. Nozka,30 M. Nyklicek,30 J. Oehlschlager,40 A. Olinto,103
M. Ortiz,82 N. Pacheco,83 D. Pakk Selmi-Dei,21 M. Palatka,30
J. Pallotta,2 N. Palmieri,42 G. Parente,85 E. Parizot,34 A. Parra,85
S. Pastor,81 T. Paul,99 M. Pech,30 J. Pekala,73 R. Pelayo,64,85
I.M. Pepe,24 L. Perrone,55 R. Pesce,47 E. Petermann,107
S. Petrera,48 P. Petrinca,52 A. Petrolini,47 Y. Petrov,92
J. Petrovic,71 C. Pfendner,110 R. Piegaia,3 T. Pierog,40 P. Pieroni,3
M. Pimenta,75 V. Pirronello,53 M. Platino,9 V.H. Ponce,1
M. Pontz,46 A. Porcelli,40 P. Privitera,103 M. Prouza,30 E.J. Quel,2
S. Querchfeld,39 J. Rautenberg,39 O. Ravel,38 D. Ravignani,9
B. Revenu,38 J. Ridky,30 S. Riggi,85 M. Risse,46 P. Ristori,2
H. Rivera,49 V. Rizi,48 J. Roberts,98 W. Rodrigues de Carvalho,85
G. Rodriguez,85 J. Rodriguez Martino,11 J. Rodriguez Rojo,11
I. Rodriguez-Cabo,85 M.D. Rodrıguez-Frıas,83 G. Ros,83
J. Rosado,82 T. Rossler,31 M. Roth,40 B. Rouille-d’Orfeuil,103
E. Roulet,1 A.C. Rovero,7 C. Ruhle,41 A. Saftoiu,76 F. Salamida,33
H. Salazar,64 F. Salesa Greus,92 G. Salina,52 F. Sanchez,9
C.E. Santo,75 E. Santos,75 E.M. Santos,26 F. Sarazin,91 B. Sarkar,39
S. Sarkar,86 R. Sato,11 N. Scharf,44 V. Scherini,49 H. Schieler,40
P. Schiffer,45,44 A. Schmidt,41 O. Scholten,70 H. Schoorlemmer,69,71
J. Schovancova,30 P. Schovanek,30 F. Schroder,40 S. Schulte,44
D. Schuster,91 S.J. Sciutto,6 M. Scuderi,53 A. Segreto,57
M. Settimo,46 A. Shadkam,96 R.C. Shellard,17,18 I. Sidelnik,9
G. Sigl,45 H.H. Silva Lopez,68 O. Sima,77 A. ’Smia lkowski,74
R. Smıda,40 G.R. Snow,107 P. Sommers,101 J. Sorokin,14
H. Spinka,89,94 R. Squartini,11 Y.N. Srivastava,99 S. Stanic,80
J. Stapleton,100 J. Stasielak,73 M. Stephan,44 A. Stutz,37
JCAP04(2012)040
F. Suarez,9 T. Suomijarvi,33 A.D. Supanitsky,7 T. Susa,28
M.S. Sutherland,96 J. Swain,99 Z. Szadkowski,74 M. Szuba,40
A. Tapia,9 M. Tartare,37 O. Tascau,39 C.G. Tavera Ruiz,68
R. Tcaciuc,46 D. Tegolo,53 N.T. Thao,112 D. Thomas,92
J. Tiffenberg,3 C. Timmermans,71,69 W. Tkaczyk,74 C.J. ToderoPeixoto,19 G. Toma,76 B. Tome,75 A. Tonachini,54 P. Travnicek,30
D.B. Tridapalli,20 G. Tristram,34 E. Trovato,53 M. Tueros,85
R. Ulrich,40 M. Unger,40 M. Urban,35 J.F. Valdes Galicia,68
I. Valino,85 L. Valore,51 A.M. van den Berg,70 E. Varela,64
B. Vargas Cardenas,68 J.R. Vazquez,82 R.A. Vazquez,85
D. Veberic,80,79 V. Verzi,52 J. Vicha,30 M. Videla,10 L. Villasenor,67
H. Wahlberg,6 P. Wahrlich,14 O. Wainberg,9,13 D. Walz,44
A.A. Watson,88 M. Weber,41 K. Weidenhaupt,44 A. Weindl,40
F. Werner,42 S. Westerhoff,110 B.J. Whelan,14 A. Widom,99
G. Wieczorek,74 L. Wiencke,91 B. Wilczynska,73 H. Wilczynski,73
M. Will,40 C. Williams,103 T. Winchen,44 M. Wommer,40
B. Wundheiler,9 T. Yamamoto,103,a T. Yapici,97 P. Younk,46,95
G. Yuan,96 A. Yushkov,85 B. Zamorano,84 E. Zas,85
D. Zavrtanik,80,79 M. Zavrtanik,79,80 I. Zaw,98,h A. Zepeda,65
Y. Zhu,41 M. Zimbres Silva39,21 and M. Ziolkowski46
1Centro Atomico Bariloche and Instituto Balseiro (CNEA-UNCuyo-CONICET), San Carlosde Bariloche, Argentina
2Centro de Investigaciones en Laseres y Aplicaciones, CITEFA and CONICET, Argentina3Departamento de Fısica, FCEyN, Universidad de Buenos Aires y CONICET, Argentina6IFLP, Universidad Nacional de La Plata and CONICET, La Plata, Argentina7Instituto de Astronomıa y Fısica del Espacio (CONICET-UBA), Buenos Aires, Argentina8Instituto de Fısica de Rosario (IFIR) - CONICET/U.N.R. and Facultad de Ciencias Bioquımicasy Farmaceuticas U.N.R., Rosario, Argentina
9Instituto de Tecnologıas en Deteccion y Astropartıculas (CNEA, CONICET, UNSAM),Buenos Aires, Argentina
10National Technological University, Faculty Mendoza (CONICET/CNEA), Mendoza, Ar-gentina
11Observatorio Pierre Auger, Malargue, Argentina12Observatorio Pierre Auger and Comision Nacional de Energıa Atomica, Malargue, Ar-
gentina13Universidad Tecnologica Nacional - Facultad Regional Buenos Aires, Buenos Aires, Ar-
gentina14University of Adelaide, Adelaide, S.A., Australia17Centro Brasileiro de Pesquisas Fisicas, Rio de Janeiro, RJ, Brazil18Pontifıcia Universidade Catolica, Rio de Janeiro, RJ, Brazil19Universidade de Sao Paulo, Instituto de Fısica, Sao Carlos, SP, Brazil

JCAP04(2012)040
20Universidade de Sao Paulo, Instituto de Fısica, Sao Paulo, SP, Brazil21Universidade Estadual de Campinas, IFGW, Campinas, SP, Brazil22Universidade Estadual de Feira de Santana, Brazil23Universidade Estadual do Sudoeste da Bahia, Vitoria da Conquista, BA, Brazil24Universidade Federal da Bahia, Salvador, BA, Brazil25Universidade Federal do ABC, Santo Andre, SP, Brazil26Universidade Federal do Rio de Janeiro, Instituto de Fısica, Rio de Janeiro, RJ, Brazil27Universidade Federal Fluminense, EEIMVR, Volta Redonda, RJ, Brazil28Rudjer Boskovi’c Institute, 10000 Zagreb, Croatia29Charles University, Faculty of Mathematics and Physics, Institute of Particle and Nuclear
Physics, Prague, Czech Republic30Institute of Physics of the Academy of Sciences of the Czech Republic, Prague, Czech
Republic31Palacky University, RCPTM, Olomouc, Czech Republic33Institut de Physique Nucleaire d’Orsay (IPNO), Universite Paris 11, CNRS-IN2P3, Orsay,
France34Laboratoire AstroParticule et Cosmologie (APC), Universite Paris 7, CNRS-IN2P3, Paris,
France35Laboratoire de l’Accelerateur Lineaire (LAL), Universite Paris 11, CNRS-IN2P3, Orsay,
France36Laboratoire de Physique Nucleaire et de Hautes Energies (LPNHE), Universites Paris 6 et
Paris 7, CNRS-IN2P3, Paris, France37Laboratoire de Physique Subatomique et de Cosmologie (LPSC), Universite Joseph Fourier,
INPG, CNRS-IN2P3, Grenoble, France38SUBATECH, Ecole des Mines de Nantes, CNRS-IN2P3, Universite de Nantes, Nantes,
France39Bergische Universitat Wuppertal, Wuppertal, Germany40Karlsruhe Institute of Technology - Campus North - Institut fur Kernphysik, Karlsruhe,
Germany41Karlsruhe Institute of Technology - Campus North - Institut fur Prozessdatenverarbeitung
und Elektronik, Karlsruhe, Germany42Karlsruhe Institute of Technology - Campus South - Institut fur Experimentelle Kernphysik
(IEKP), Karlsruhe, Germany43Max-Planck-Institut fur Radioastronomie, Bonn, Germany44RWTH Aachen University, III. Physikalisches Institut A, Aachen, Germany45Universitat Hamburg, Hamburg, Germany46Universitat Siegen, Siegen, Germany47Dipartimento di Fisica dell’Universita and INFN, Genova, Italy48Universita dell’Aquila and INFN, L’Aquila, Italy49Universita di Milano and Sezione INFN, Milan, Italy50Dipartimento di Matematica e Fisica “E. De Giorgi” dell’Universita del Salento and Sezione
INFN, Lecce, Italy51Universita di Napoli ”Federico II” and Sezione INFN, Napoli, Italy52Universita di Roma II ”Tor Vergata” and Sezione INFN, Roma, Italy

JCAP04(2012)040
53Universita di Catania and Sezione INFN, Catania, Italy54Universita di Torino and Sezione INFN, Torino, Italy55Dipartimento di Ingegneria dell’Innovazione dell’Universita del Salento and Sezione INFN,
Lecce, Italy57Istituto di Astrofisica Spaziale e Fisica Cosmica di Palermo (INAF), Palermo, Italy58Istituto di Fisica dello Spazio Interplanetario (INAF), Universita di Torino and Sezione
INFN, Torino, Italy59INFN, Laboratori Nazionali del Gran Sasso, Assergi (L’Aquila), Italy64Benemerita Universidad Autonoma de Puebla, Puebla, Mexico65Centro de Investigacion y de Estudios Avanzados del IPN (CINVESTAV), Mexico, D.F.,
Mexico67Universidad Michoacana de San Nicolas de Hidalgo, Morelia, Michoacan, Mexico68Universidad Nacional Autonoma de Mexico, Mexico, D.F., Mexico69IMAPP, Radboud University Nijmegen, Netherlands70Kernfysisch Versneller Instituut, University of Groningen, Groningen, Netherlands71Nikhef, Science Park, Amsterdam, Netherlands72ASTRON, Dwingeloo, Netherlands73Institute of Nuclear Physics PAN, Krakow, Poland74University of Lodz, Lodz, Poland75LIP and Instituto Superior Tecnico, Technical University of Lisbon, Portugal76’Horia Hulubei’ National Institute for Physics and Nuclear Engineering, Bucharest-Magurele,
Romania77University of Bucharest, Physics Department, Romania78University Politehnica of Bucharest, Romania79J. Stefan Institute, Ljubljana, Slovenia80Laboratory for Astroparticle Physics, University of Nova Gorica, Slovenia81Instituto de Fısica Corpuscular, CSIC-Universitat de Valencia, Valencia, Spain82Universidad Complutense de Madrid, Madrid, Spain83Universidad de Alcala, Alcala de Henares (Madrid), Spain84Universidad de Granada & C.A.F.P.E., Granada, Spain85Universidad de Santiago de Compostela, Spain86Rudolf Peierls Centre for Theoretical Physics, University of Oxford, Oxford, United King-
dom88School of Physics and Astronomy, University of Leeds, United Kingdom89Argonne National Laboratory, Argonne, IL, U.S.A.90Case Western Reserve University, Cleveland, OH, U.S.A.91Colorado School of Mines, Golden, CO, U.S.A.92Colorado State University, Fort Collins, CO, U.S.A.93Colorado State University, Pueblo, CO, U.S.A.94Fermilab, Batavia, IL, U.S.A.95Los Alamos National Laboratory, Los Alamos, NM, U.S.A.96Louisiana State University, Baton Rouge, LA, U.S.A.97Michigan Technological University, Houghton, MI, U.S.A.

JCAP04(2012)040
98New York University, New York, NY, U.S.A.99Northeastern University, Boston, MA, U.S.A.
100Ohio State University, Columbus, OH, U.S.A.101Pennsylvania State University, University Park, PA, U.S.A.102Southern University, Baton Rouge, LA, U.S.A.103University of Chicago, Enrico Fermi Institute, Chicago, IL, U.S.A.107University of Nebraska, Lincoln, NE, U.S.A.108University of New Mexico, Albuquerque, NM, U.S.A.110University of Wisconsin, Madison, WI, U.S.A.111University of Wisconsin, Milwaukee, WI, U.S.A.112Institute for Nuclear Science and Technology (INST), Hanoi, Vietnam
∗Deceasedaat Konan University, Kobe, Japanfnow at University of Marylandhnow at NYU Abu Dhabiinow at Universite de Lausanne
E-mail: auger [email protected]
Received January 5, 2012Accepted March 12, 2012Published April 30, 2012
Abstract. Observations of cosmic ray arrival directions made with the Pierre Auger Obser-vatory have previously provided evidence of anisotropy at the 99% CL using the correlationof ultra high energy cosmic rays (UHECRs) with objects drawn from the Veron-Cetty Veroncatalog. In this paper we report on the use of three catalog independent methods to searchfor anisotropy. The 2pt–L, 2pt+ and 3pt methods, each giving a different measure of self-clustering in arrival directions, were tested on mock cosmic ray data sets to study the impactsof sample size and magnetic smearing on their results, accounting for both angular and en-ergy resolutions. If the sources of UHECRs follow the same large scale structure as ordinarygalaxies in the local Universe and if UHECRs are deflected no more than a few degrees, astudy of mock maps suggests that these three methods can efficiently respond to the resultinganisotropy with a P -value = 1.0% or smaller with data sets as few as 100 events. Using datataken from January 1, 2004 to July 31, 2010 we examined the 20, 30, . . . , 110 highest energyevents with a corresponding minimum energy threshold of about 49.3 EeV. The minimumP -values found were 13.5% using the 2pt-L method, 1.0% using the 2pt+ method and 1.1%using the 3pt method for the highest 100 energy events. In view of the multiple (correlated)scans performed on the data set, these catalog-independent methods do not yield strongevidence of anisotropy in the highest energy cosmic rays.
Keywords: ultra high energy cosmic rays, cosmic ray experiments
– 1 –

JCAP04(2012)040
Contents
1 Introduction 1
2 Analysis methods 2
2.1 The 2pt-L method 2
2.2 The 2pt+ method 2
2.3 The shape strength 3pt method 3
3 Application of methods to Monte-Carlo data sets 5
3.1 The toy model 5
3.2 Application of methods to Monte-Carlo data sets 6
4 Application of methods to data 10
5 Conclusion 12
1 Introduction
It is almost 50 years since cosmic rays with energies of the order of 100 EeV (1 EeV≡ 1018 eV)were first reported [1]. Soon after the initial observation of such cosmic rays it was realizedby Greisen [2], Zatsepin and Kuz’min [3] that their interactions with the cosmic microwavebackground would result in energy loss that would limit the distance which they could travel.This would suppress the particle flux and result in a steepening of the energy spectrum. Ifthe observed flux suppression [4, 5] is due to this mechanism, it is likely that the cosmicrays with energies in excess of ≃ 50 EeV could be anisotropic as they would originate inthe local Universe. Several searches for anisotropy in the arrival directions of UHECRs havebeen performed in the past, either aimed at correlating arrival directions with astrophysicalobjects [6, 7] or searching for anisotropic arrival directions [8–11]. No positive observationshave been confirmed by subsequent experiments [12–15].
In 2007, the Pierre Auger Observatory [16] provided evidence for anisotropy at the 99%CL (Confidence Level) by examining the correlation of UHECR (≥ 56 EeV) with nearbyobjects drawn from the Veron-Cetty Veron (VCV) catalog [17]. The correlation at a prede-fined 99% CL was established with new data after studies of an initial 15 event-set defineda likely increase in the UHECR flux in circles of ≃ 3◦ radius around Active Galactic Nuclei(AGNs) in the VCV catalog with redshift ≤ 0.018 [18, 19]. An updated measurement of thiscorrelation has recently been given, showing a reduced fraction of correlating events whencompared with the first report [20].
The determination of anisotropies in the UHECR sky distribution based on cross-correlations with catalogs may not constitute an ideal tool in the case of large magneticdeflections and/or transient sources. Also, some signal dilution may occur if the catalogdoes not trace in a fair way the selected class of astrophysical sites, due for instance to itsincompleteness. As an alternative, we report here on tests designed to answer the questionof whether or not the arrival directions of UHECRs observed at the Pierre Auger Obser-vatory are consistent with being drawn from an isotropic distribution, with no reference toextragalactic objects. The local Universe being distributed in-homogeneously and organized
– 1 –

JCAP04(2012)040
into clusters and superclusters, clustering of arrival directions may be expected in the case ofrelatively low source density. Hence, the methods used in this paper are based on searches forthe self-clustering of event directions at any scale. These may thus constitute an optimal toolfor detecting an anisotropy and meanwhile provide complementary information to searchesfor correlations between UHECR arrival directions and specific extragalactic objects.
The paper is organized in the following manner. The three methods we use in this paper,the 2pt-L, 2pt+ and 3pt methods, are explained in section 2. In section 3, we apply thesemethods to a toy model of anisotropy to address the importance of systematic uncertaintiesfrom both detector effects and unmeasured astrophysical parameters. In section 4, we applythe three methods to an updated set of the Pierre Auger Observatory data. We draw finalconclusions in section 5.
2 Analysis methods
At the highest energies, the steepening of the cosmic ray energy spectrum makes the currentstatistics so small that a measure of a statistically significant departure from isotropy ishard to establish, especially when using blind generic tests. This motivated us to developseveral methods by testing their efficiency for detecting anisotropy using simulated samplesof the Auger exposure with 60 data points drawn from different models of anisotropies bothon large and small scales. The choice of 60 events for the mock catalogs was based on thenumber of events expected for an exposure of two full years of Auger above the ≈ 50 EeVenergy threshold for anisotropy. We report in this paper on self-correlation analysis, usingdifferential approaches based on a 2pt-L function [21, 22], an extended 2pt function [23](“2pt+”) and a 3pt function [22] (“3pt”).
2.1 The 2pt-L method
The 2-point correlation function [21] is defined as the differential distribution over angularscale of the number of observed event pairs in the data set. There are different possibleimplementations of statistical measures based on the 2pt function. We adopt in this workthe one in [22] (named 2pt-L in the following), where the departure from isotropy is testedthrough a pseudo-log-likelihood as described below. The expected distribution of the 2pt-L correlation function values was built using a large number of simulated background setsdrawn from an isotropic distribution accounting for the exposure of the experiment. We useangular bins of 5 degrees to histogram the angle (λ) between event pairs over a range ofangular scales. The pseudo-log-likelihood is defined as L2pt−L:
Ldata2pt−L =
Nbins∑
i=1
lnP (niobs|n
iexp), (2.1)
where niobs and ni
exp are the observed and expected number of event pairs in bin i and P the
Poisson distribution. The resulting Ldata2pt−L is then compared to the distribution of L2pt−L
obtained from isotropic Monte-Carlo samples. The P -value P2pt for the data to come fromthe realization of an isotropic distribution is finally calculated as the fraction of sampleswhose L2pt−L is lower than Ldata
2pt−L.
2.2 The 2pt+ method
The 2pt-L method is sensitive to clusters of different sizes, but not to the relative orientationof pairs. To pick up filamentary structures or features such as excesses of pairs aligned along
– 2 –

JCAP04(2012)040
some preferential directions, an enhanced version of the classic 2pt-L test was devised: the2pt+ method [23]. In addition to the angular distance λ between event pairs, the 2pt+ testuses two extra variables related to the orientation of each vector connecting pairs. As eitherone of the points in the pair can be regarded as the vector origin, the point of origin is alwayschosen so that the z-axis component is positive. This point is translated to the center of asphere giving rise to the two new variables, cos(θ) which is the cosine of the vector’s polarangle, and φ, which is the vector’s azimuthal angle. It is worth noticing that, contrary tothe distance λ between event pairs, these two additional variables are not independent ofthe reference system in which they are calculated. All results presented hereafter have beenobtained with the z-axis pointing toward the Northern pole in equatorial coordinates. Fig. 1schematically depicts the definitions of the variables that are used in this method. The leftpanel shows the vector between two points on a sphere, subtending an angle λ, which weaim to describe using three independent variables. The vector between two events translatedto the origin of coordinates, can be described using the following 3 variables as in the rightpanel of figure 1:
1. cosλ, which is a measure of the length of the vector;
2. cos θ, which is the cosine of the vector’s polar angle; and
3. φ, which is the vector’s azimuthal angle.
To measure the departure from isotropy, the 2pt-L distribution and the two angulardistributions can be combined into one single estimator. First, in the same way as in the2pt-L test, a binned likelihood test is applied to the cos (λ) distribution (using a number ofbins such that the expected number of pairs in each bin is ni
exp = 5), and a P -value Pλ is
obtained as the fraction of samples whose pseudo-log-likelihood Lλ is lower than Ldataλ . Then,
making use of the cos θ and φ distributions, another pseudo-log-likelihood Lθ,φ is defined as:
Ldataθ,φ =
Nbins,θφ∑
j,k=0
lnP (nθφ,obsj,k , µ), (2.2)
where P (nθφ,obsj,k , µ) is the Poisson distribution with mean nθφ,exp
j,k = 5 and nθφ,obsj,k is the
observed number of pairs in the jthkth (cos θ, φ) bin. The P -value pθ,φ is obtained in thesame way as previously. Finally, the combined P -value is calculated using Fisher’s method:
Pcombined = Pλpθφ(1 − lnPλpθφ). (2.3)
However, Lλ and Lθ,φ are slightly correlated tests. Hence, Pcombined needs to be correctedfor these small correlations. The final P -value P2pt+ is consequently calculated by correctingPcombined using Monte-Carlo simulations.
2.3 The shape strength 3pt method
Event direction clustering can also be revealed by searching for excesses of triplets through,for instance, the use of a 3-pt correlation function. The 3pt method we use hereafter is avariation of the one presented in ref. [24, 25], involving an eigenvector decomposition of thearrival directions of all triplets found in the data set [22] . For each cosmic ray we convertthe arrival direction into a Cartesian vector ~rk={rx, ry, rz}. Then we compute an orientation
– 3 –

JCAP04(2012)040
Figure 1. Schematic depiction of the variables used in the 2pt+ test. Left panel: angular distance λbetween two events. Here, the drawn sphere corresponds to the observed celestial sphere. The blackvectors correspond to vectors extending from the origin (observer) to each of the two events. Theblue vectors represent the two choices for the definition of the vector between events. In this work,we always use the vector with a positive z−component (in the case depicted here, the vector pointingfrom right to left). λ is the angle subtended by the two event vectors. Right panel: angles θ andφ. Here, the vectors between events have been transported to the origin, and each of the two vectorscorresponds to a different pair between events. The length of each vector depends on λ, so the radiiof the two spheres drawn here quantify the angular distance between each pair of events. The anglesθ and φ for one of the pairs (the one represented by the blue vector) are shown in the figure. Figurefrom [23].
matrix Tij = 13
∑
k∈triplet (rirj)k for i, j ∈ {x, y, z} from which we calculate eigenvalues (τ)of each Tij and order them τ1 ≥ τ2 ≥ τ3 ≥ 0 (subject to the constraint τ1 + τ2 + τ3 = 1).The largest eigenvalue of T, τ1, results from a rotation of the triplet about the principal
axis ~u1. The middle and smallest eigenvalues correspond to the major ~u2 and minor ~u3 axisrespectively. The left panel of figure 2 shows a graphical illustration of these eigenvectors.The eigenvalues are transformed into two parameters, a “strength parameter”ζ and a “shapeparameter” γ defined as:
ζ = ln(τ1/τ3), (2.4)
γ = ln
{
ln(τ1/τ2)
ln(τ2/τ3)
}
. (2.5)
As ζ increases from 0 to ∞ the events in the triplet become more concentrated. Gen-erally, as γ increases from −∞ to +∞ the shape of the triplet transforms from elliptical,i.e. strings, to symmetric about ~u1, i.e. point source. See the right panel of figure 2 for aschematic representation.
After all triplets are transformed into the parameters γ and ζ, they are binned in a 2-dhistogram. As ζ increases from 0 to ∞, the events in the triplets become more concentrated,while, as γ increases from −∞ to +∞, the triplets transform from elongated elliptical to sym-metric shape. This distribution is then compared against the one obtained from all tripletson a large number of Monte-Carlo isotropic samples. The departure of the data from isotropyis then measured in the same way as before, through a pseudo-log-likelihood L3pt where we
– 4 –

JCAP04(2012)040
Figure 2. Left: The eigenvectors of a triplet of events on the sphere (S2) are the principal axis ~u1,the major axis ~u2 (pointing into the page) and the minor axis ~u3. The eigenvalues of these vectorsare used to compute this triplet’s shape and strength. Right: An intuitive interpretation of the shapeand strength parameters. As the strength parameter ζ increases from 0 to ∞, the events becomemore concentrated. As the shape parameter γ increases form −∞ to +∞, the events become morerotationally symmetric or less elongated. Figures from [22].
use the Poisson distribution to evaluate in each bin of (ζ, γ) the probability of observing niobs
counts while the expected number of counts obtained from isotropic samples is niexp.
3 Application of methods to Monte-Carlo data sets
The use of mock data sets built from the large scale structure of the Universe provides auseful tool to study the sensitivity of the three methods. The toy model we choose hereallows us to probe the efficiency of the methods by varying several parameters such as thetotal number of events, the dilution of the signal with the addition of isotropic events, thesource density, and the external smearing applied to mock data set arrival directions. Thisexternal smearing (non angular resolution) reflects the unknown deflections imposed by theintervening galactic and extragalactic magnetic fields upon charged particles whose masscomposition remains uncertain above ≃ 40 EeV. In addition, the impact of both the angularand energy resolutions of the experiment can be probed in individual realizations of theunderlying toy model.
Throughout this section, we present the performances of the three methods in termsof the power at different threshold values. The threshold α — or type-I error rate — is thefraction of isotropic simulations in which the null hypothesis is wrongly rejected (i.e., thetest gives evidence of anisotropy when there is no anisotropy). The power is 1 − β where βis the type-II error rate which is the fraction of simulations of anisotropy in which the testresult does not reject the null hypothesis of isotropy.
3.1 The toy model
The model we chose to use is the one described in ref. [26]. It relies on (realistic largescale structure) mock-catalogs of cosmic rays above 40 EeV, for a pure proton composition,assuming their sources are a random subset of ordinary galaxies in a simulated volume-limitedsurvey, for various choices of source density which are thought to be in the relevant range:
– 5 –

JCAP04(2012)040
10−3.5, 10−4.0 and 10−4.5 Mpc−3. The differential spectrum at the source is taken to beE−2.3, and energy losses through redshift, photo-pion production and pair production areincluded. To get a realistic treatment of UHECRs in the GZK transition region (above ∼50 EeV), a realistic volume-limited source galaxy catalog is needed to a much larger depththan is available in present-day ”all sky” galaxy surveys. In particular, the galaxy catalogfrom which the source catalog is built must be much denser than 10−3.5 Mpc−3 to simulatea source catalog with that particular density value. Therefore, ref. [26] made use of the”Las Damas” mock galaxy catalogs [27] which were created using ΛCDM simulations withparameters that are tuned to agree with Sloan Digital Sky Survey observations.1
The strength and distribution of intervening magnetic fields remain poorly known, andlarge deflections may be observed even for protons [28]. In the absence of a detailed knowledgeof both magnetic fields and mass composition of CRs above 40 EeV, we smear out eacharrival direction by adopting a Gaussian probability density function with a characteristicscale ranging from 1◦ to 8◦. This angle is treated as a free model parameter, and each mockdata set has a fixed smearing angle.
The use of a pure proton composition in this toy model is just aimed at providing arealistic shortening of the CR horizon in the simulations through the GZK effect. Similarbehavior would be obtained in the case of heavier nuclei, through photo-disintegration pro-cesses. The mock data sets produced with large smearing angles are intended to probe thelowering of the efficiencies of the methods for situations in which the magnetic deflectionsget larger, necessarily the case if the composition gets heavier. Smearing angles larger than8◦ would yield almost isotropic maps, lowering to a large extent the detection power of themethods.
Examples of sky maps produced from this toy model are shown in figure 3, 4. In figure 3,a high source density of 10−3.5 Mpc−3 is used with an intermediate smearing angle of 5◦.When the 3pt method is applied to the 60 highest energy events from these arrival directions,a P -value P3pt ≈ 0.5 is found and the 2pt+ method yelds the same value. On the other hand,in figure 4, a smaller source density is used, still with an intermediate smearing angle of 5◦.Much more clustering can be observed. When the 3pt method is applied to the 60 highestenergy events, a P -value P3pt ≈ 0.003 is found and the 2pt+ value is P2pt+ ≈ 0.004.
3.2 Application of methods to Monte-Carlo data sets
In the toy model, the shortening of the horizon at ultra high energies (UHE) implies thatCRs must come from relatively close sources (. 250 Mpc) above UHE thresholds. Whenthe energy threshold is reduced, the CR horizon is increased and the distribution of sourcesbecomes isotropic. This GZK effect induces a signal dilution as the energy threshold islowered, implying a loss of sensitivity of the three methods for detecting anisotropy [22, 23].Through this mechanism, the effects of dilution and sample size are interconnected. We studybelow the efficiencies of the methods by varying the sample size, the source density, and theexternal smearing. The powers of the methods applied to mock data sets built with a largeexternal smearing and a high source density of 10−3.5 Mpc−3 are expected to be low, whilean anisotropy in mock data sets built with a low external smearing and a low source densityof 10−4.5 Mpc−3 is expected to be observed with much higher powers.
1The particular mock CR catalogs used here, along with their source galaxies, are available for download-ing from http://cosmo.nyu.edu/mockUHECR.html. Analogous catalogs made subsequently, e.g., for mixedcomposition are also provided.
– 6 –

JCAP04(2012)040
-90
-60
-30
GC
30
60
90
60 120 180 180240 300
Figure 3. This map shows the Monte Carlo generated arrival directions of cosmic rays from a mapwith a 10−3.5 Mpc−3 source density and a 5◦ angular smearing for 150 events. This is an exampleof map which is consistent with isotropy. The upward triangles (in blue) are single events that comefrom different sources. The other symbols represent sets of events that came from the same source.
-90
-60
-30
GC
30
60
90
60 120 180 180240 300
Figure 4. This map shows the Monte Carlo generated arrival directions of cosmic rays from a mapwith an 10−4.5 Mpc−3 source density and a 5◦ angular smearing for 150 events. This is an exampleof a map which is not consistent with isotropy. The upward triangles (in blue) are single events thatcome from different sources. The other symbols represent sets of events that came from the samesource.
Finite angular and energy resolutions constitute an experimental source of signal di-lution. Finite angular resolution is expected to slightly smooth out any clustered pattern,while finite energy resolution is expected to allow low energy events to leak into higher energypopulations due to the combination of the steepening of the energy spectrum and of the sharp
– 7 –

JCAP04(2012)040
)°Angular scale of smearing (1 2 3 4 5 6 7 8
Fra
ctio
n of
map
s w
ith p
_val
ue <
0.0
1
0
0.1
0.2
0.3
0.4
0.5
0.6
0.7
0.8
0.9
1
Mock Maps2pt-L2pt+3pt
Figure 5. Powers of the 2pt-L, 2pt+ and 3pt methods for a threshold value α = 1%. The mocksets shown are for 60 events drawn from maps with a source density of 10−4.5 Mpc−3. The resultsare shown for external angular smearings ranging from 1 to 8◦. The 2pt+ and 3pt methods performbetter than the 2pt-L method and all three methods have decreased performances for larger angularsmearing.
energy threshold used in the analysis. Above 40 EeV, the angular resolution,2 defined as theangular aperture θ0 around the arrival directions of CRs within which 68% of the showersare reconstructed, is as good as θ0 ≃ 0.8◦ [29]. To probe the effect of this finite angularresolution, the arrival direction of each event from any mock data set is smeared out accord-ing to the Rayleigh distribution with parameter θ0/1.51, where the factor 1.51 is tuned togive the previously defined angular resolution. To model the uncorrelated energy resolution,the energy of each mock event is smeared out according to a Gaussian distribution centeredaround the original energy and with a R.M.S. σE such that σE/E = 10%. This uncorrelatedenergy resolution value, relative to the absolute energy scale, is a fair one, accounting forboth statistical and systematic uncertainties at the energies E > 49 EeV reported in thispaper. [30]. Results shown below have been obtained by applying both angular and energysmearings to each mock data set.
The results of the Monte-Carlo studies are shown in figure 5, 6 and 7. These three figuresshow the powers obtained with each method as a function of the external angular smearingranging from 1 to 8◦. For figure 5, 6 and 7 error bars represent the binomial uncertaintiesfrom the Monte Carlo sampling. A general feature is the large decrease of performancesfor larger angular smearings. In figure 5, the power of the three methods applied to mock
2The actual angular resolution is slightly more complicated, as in general it is a function of energy and thenumber of triggered tanks. However, for events with energies above 40 EeV, these effects are small so that weadopt here a unique value.
– 8 –

JCAP04(2012)040
)°Angular scale of smearing (1 2 3 4 5 6 7 8
Fra
ctio
n of
map
s w
ith p
_val
ue <
0.0
1
0
0.1
0.2
0.3
0.4
0.5
0.6
0.7
0.8
0.9
1
Mock Maps-3 Mpc-4.510-3 Mpc-4.010-3 Mpc-3.510
Figure 6. Power of the 2pt+ method for a threshold value α = 1%, for different source densityvalues. The mock data sets shown are for 60 events drawn from maps with source densities of 10−3.5,10−4.0 and 10−4.5 Mpc−3. The results are shown for external angular smearings ranging from 1 to8◦. The 2pt+ method is clearly more efficient at smaller densities (the same behavior is also observedwith the other two methods).
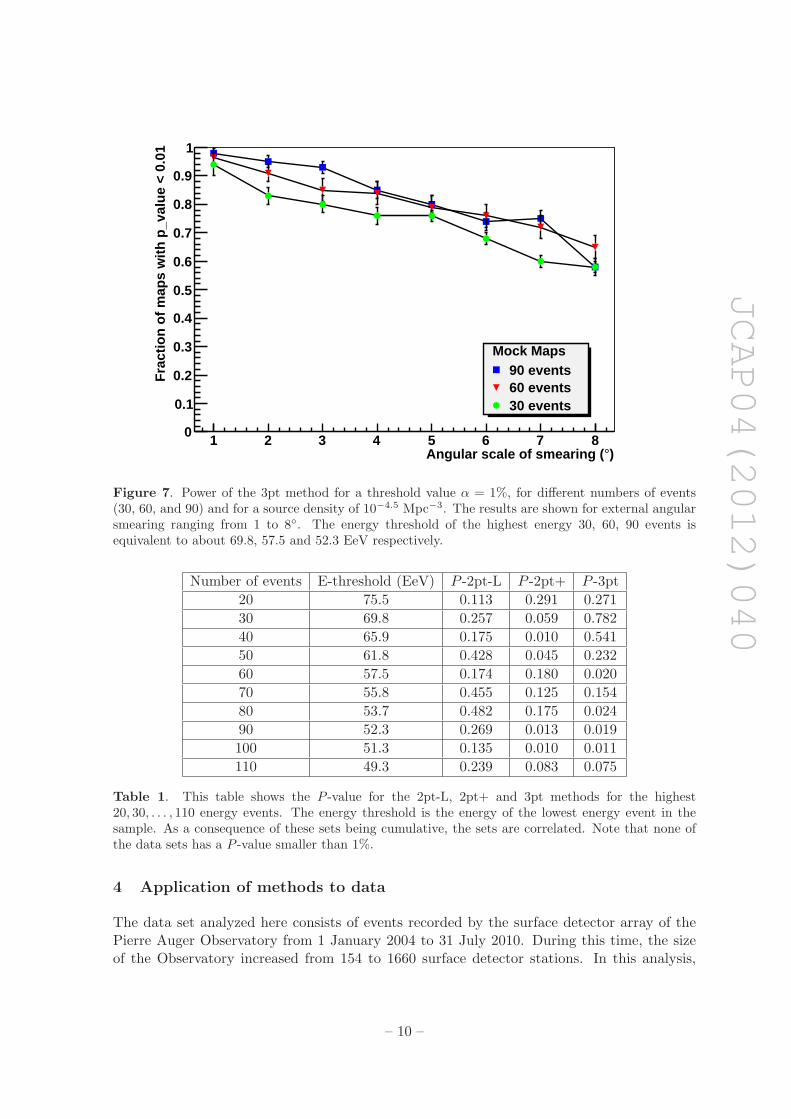
maps using the 60 highest energy events drawn from a source density of 10−4.5 Mpc−3 isshown. The better performances of both the 2pt+ and the 3pt methods with respect to the2pt-L method can be observed. In figure 6, the effect of changing the source density from10−3.5 Mpc−3 to 10−4.0 Mpc−3 and to 10−4.5 Mpc−3 is shown by means of the 2pt+ method,still using the 60 highest energy events. The 2pt+ method is clearly more efficient at smallerdensities (a similar effect is observed for the 2pt-L and 3pt methods). In figure 7 the effectof using the 30, 60 and 90 highest energy events with a low source density of 10−4.5 Mpc−3 isillustrated using the 3pt method. Provided that the number of events in the sky is between30 and 90 events, it appears that there is no strong variation in the power of the 3pt methodwhen using such a low density.
From these studies, it is apparent that searches for deviations from isotropic expectationsof self-clustering at any scale, using the 2pt+ and 3pt methods, provide powerful tools todetect (with a threshold of 1%) an anisotropy induced by the shortening of the CR horizon atUHE, even when dealing with less than 100 events. Accounting for both angular and energy
resolutions, in the case of source densities of the order of 10−4.5 Mpc−3, the power of bothmethods is higher than 80% as long as the external smearing is less than ≃ 3 − 4◦. On theother hand, for higher external smearing and/or higher source densities, the powers rapidlydecrease so that the methods may often miss a genuine signal in such conditions.
– 9 –
JCAP04(2012)040
)°Angular scale of smearing (1 2 3 4 5 6 7 8
Fra
ctio
n of
map
s w
ith p
_val
ue <
0.0
1
0
0.1
0.2
0.3
0.4
0.5
0.6
0.7
0.8
0.9
1
Mock Maps90 events60 events30 events
Figure 7. Power of the 3pt method for a threshold value α = 1%, for different numbers of events(30, 60, and 90) and for a source density of 10−4.5 Mpc−3. The results are shown for external angularsmearing ranging from 1 to 8◦. The energy threshold of the highest energy 30, 60, 90 events isequivalent to about 69.8, 57.5 and 52.3 EeV respectively.
Number of events E-threshold (EeV) P -2pt-L P -2pt+ P -3pt
20 75.5 0.113 0.291 0.271
30 69.8 0.257 0.059 0.782
40 65.9 0.175 0.010 0.541
50 61.8 0.428 0.045 0.232
60 57.5 0.174 0.180 0.020
70 55.8 0.455 0.125 0.154
80 53.7 0.482 0.175 0.024
90 52.3 0.269 0.013 0.019
100 51.3 0.135 0.010 0.011
110 49.3 0.239 0.083 0.075
Table 1. This table shows the P -value for the 2pt-L, 2pt+ and 3pt methods for the highest20, 30, . . . , 110 energy events. The energy threshold is the energy of the lowest energy event in thesample. As a consequence of these sets being cumulative, the sets are correlated. Note that none ofthe data sets has a P -value smaller than 1%.
4 Application of methods to data
The data set analyzed here consists of events recorded by the surface detector array of thePierre Auger Observatory from 1 January 2004 to 31 July 2010. During this time, the sizeof the Observatory increased from 154 to 1660 surface detector stations. In this analysis,
– 10 –

JCAP04(2012)040
Energy Threshold (EeV)50 55 60 65 70 75
Log1
0(p_
valu
e)
-3
-2.5
-2
-1.5
-1
-0.5
0
Data2pt-L2pt+3pt
Figure 8. This shows the P -values of the Auger data for the 2pt-L, 2pt+ and 3pt methods. Theminimum in P -value is at 100 events for the 2pt+ and 3pt methods and corresponds to an energy ofabout 51 EeV.
we consider events with reconstructed zenith angles smaller than 60◦, satisfying fiducial cutsrequiring that at least five active stations surround the station with the highest signal, andthat the reconstructed shower core is inside a triangle of active detectors when the event wasrecorded. At UHE, these requirements ensure both a good quality of event reconstructionand a robust estimation of the exposure of the surface detector array, which amounts to23,344 km2 sr yr for the time period used in this analysis. This exposure is 2.6 times largerthan that used in ref. [18].
The results of the three methods applied to the data from the 20 highest energy eventsto the highest 110 are presented in table 1 and shown in figure 8. The strongest deviationfrom isotropic expectations is found at 100 events, corresponding to an energy threshold of≃ 51 EeV. The minimum P -values are 13.5% using the 2pt-L method, 1.0% using the 2pt+method, and 1.1% using the 3pt method. In view of the multiple scans performed, thesetests do not provide strong evidence of anisotropy.
In case there is a true weak anisotropy in the data, the common minimum reached bythe two more powerful methods (3pt and 2pt+) around Ethreshold ≈ 51 EeV could indicatethe onset of this anisotropy, while the less powerful method (2pt-L) would not have detectedit. For higher energy thresholds the number of events decrease and the power of the methodsdiminish as expected. If there is no weak anisotropy in the data, the figure 8 shows onlyrandom values of Pvalue for all three methods and the common minimum mentioned beforewould be only a coincidence.
In our recent update on the correlation within 3.1◦ of UHECRs (≥ 56 EeV) with nearbyobjects drawn from the Veron-Cetty Veron (VCV) catalog, we reported a correlating fraction
– 11 –

JCAP04(2012)040
of (38+7−6)%, compared to 21% for isotropic cosmic rays. It is worth examining whether the
null result reported here is compatible with this correlating fraction or not. For this purpose,we generated mock data sets of 80 events drawn by imposing a correlating fraction of 38%and applied both the 2pt+ and the 3pt tests on each mock data set. The detection powerof the 2pt+ (3pt) test was found to be 10% (20%). These are rather low efficiencies, so thatresults of the correlating fraction approach and the one chosen in this study are found to becompatible.
5 Conclusion
In this paper, we have searched for self-clustering in the arrival directions of UHECRs de-tected at the Pierre Auger Observatory, independently of any astrophysical catalog of extra-galactic objects and magnetic field hypothesis. These methods have been shown, within somerange of parameters such as the magnetic deflections and the source density, to be sensitiveto anisotropy in data sets drawn from mock maps which account for clustering from the largescale structure of the local Universe and for energy loss from the GZK effect. When appliedto the highest energy 20, 30, . . . , 110 Auger events, it is found that for the 100 highest energyevents, corresponding to an energy threshold of ≃ 51 EeV, the P -values of 2pt+ and 3ptmethods are about 1%. There is no P -value smaller than 1% in any of the 30 (correlated)scanned values. There is thus no strong evidence of clustering in the data set which wasexamined.
Despite of the sensitivity improvement that the 2pt+ and 3pt tests bring with respect tothe 2pt-L test, they still show relatively low powers in the case of large magnetic deflectionsand/or relatively high source density. In such low event number scenarios, the search forself-clustering of UHECRs is most likely not the optimal tool to establish anisotropy usingthe blind generic tests we presented in this paper.
Acknowledgments
The successful installation, commissioning, and operation of the Pierre Auger Observatorywould not have been possible without the strong commitment and effort from the technicaland administrative staff in Malargue.
We are very grateful to the following agencies and organizations for financialsupport: Comision Nacional de Energıa Atomica, Fundacion Antorchas, Gobierno DeLa Provincia de Mendoza, Municipalidad de Malargue, NDM Holdings and Valle LasLenas, in gratitude for their continuing cooperation over land access, Argentina; theAustralian Research Council; Conselho Nacional de Desenvolvimento Cientıfico e Tec-nologico (CNPq), Financiadora de Estudos e Projetos (FINEP), Fundacao de Amparoa Pesquisa do Estado de Rio de Janeiro (FAPERJ), Fundacao de Amparo a Pesquisado Estado de Sao Paulo (FAPESP), Ministerio de Ciencia e Tecnologia (MCT), Brazil;AVCR AV0Z10100502 and AV0Z10100522, GAAV KJB100100904, MSMT-CR LA08016,LC527, 1M06002, MEB111003, and MSM0021620859, Czech Republic; Centre de CalculIN2P3/CNRS, Centre National de la Recherche Scientifique (CNRS), Conseil RegionalIle-de-France, Departement Physique Nucleaire et Corpusculaire (PNC-IN2P3/CNRS),Departement Sciences de l’Univers (SDU-INSU/CNRS), France; Bundesministerium fur Bil-dung und Forschung (BMBF), Deutsche Forschungsgemeinschaft (DFG), Finanzministerium
– 12 –

JCAP04(2012)040
Baden-Wurttemberg, Helmholtz-Gemeinschaft Deutscher Forschungszentren (HGF), Minis-terium fur Wissenschaft und Forschung, Nordrhein-Westfalen, Ministerium fur Wissenschaft,Forschung und Kunst, Baden-Wurttemberg, Germany; Istituto Nazionale di Fisica Nucleare(INFN), Ministero dell’Istruzione, dell’Universita e della Ricerca (MIUR), Italy; Consejo Na-cional de Ciencia y Tecnologıa (CONACYT), Mexico; Ministerie van Onderwijs, Cultuur enWetenschap, Nederlandse Organisatie voor Wetenschappelijk Onderzoek (NWO), Stichtingvoor Fundamenteel Onderzoek der Materie (FOM), Netherlands; Ministry of Science andHigher Education, Grant Nos. N N202 200239 and N N202 207238, Poland; Fundacao paraa Ciencia e a Tecnologia, Portugal; Ministry for Higher Education, Science, and Technology,Slovenian Research Agency, Slovenia; Comunidad de Madrid, Consejerıa de Educacion de laComunidad de Castilla La Mancha, FEDER funds, Ministerio de Ciencia e Innovacion andConsolider-Ingenio 2010 (CPAN), Xunta de Galicia, Spain; Science and Technology Facili-ties Council, United Kingdom; Department of Energy, Contract Nos. DE-AC02-07CH11359,DE-FR02-04ER41300, National Science Foundation, Grant No. 0450696, The Grainger Foun-dation USA; ALFA-EC / HELEN, European Union 6th Framework Program, Grant No.MEIF-CT-2005-025057, European Union 7th Framework Program, Grant No. PIEF-GA-2008-220240, and UNESCO.
References
[1] J. Linsley, Evidence for a primary cosmic-ray particle with energy 1020 eV,Phys. Rev. Lett. 10 (1963) 146 [INSPIRE].
[2] K. Greisen, End to the cosmic ray spectrum?, Phys. Rev. Lett. 16 (1966) 748 [INSPIRE].
[3] G. Zatsepin and V. Kuzmin, Upper limit of the spectrum of cosmic rays, JETP Lett. 4 (1966)78 [INSPIRE].
[4] HiRes collaboration, R. Abbasi et al., First observation of the Greisen-Zatsepin-Kuzmin
suppression, Phys. Rev. Lett. 100 (2008) 101101 [astro-ph/0703099] [INSPIRE].
[5] Pierre Auger collaboration, J. Abraham et al., Observation of the suppression of the flux of
cosmic rays above 4 × 10¹⁹eV, Phys. Rev. Lett. 101 (2008) 061101 [arXiv:0806.4302][INSPIRE].
[6] P. Tinyakov and I. Tkachev, BL Lacertae are sources of the observed ultrahigh-energy cosmic
rays, JETP Lett. 74 (2001) 445 [astro-ph/0102476] [INSPIRE].
[7] D. Gorbunov, P. Tinyakov, I. Tkachev and S.V. Troitsky, Evidence for a connection between
gamma-ray and highest energy cosmic ray emissions by BL Lacs, Astrophys. J. 577 (2002) L93[astro-ph/0204360] [INSPIRE].
[8] T. Stanev, P.L. Biermann, J. Lloyd-Evans, J.P. Rachen and A.A. Watson, The arrival
directions of the most energetic cosmic rays, Phys. Rev. Lett. 75 (1995) 3056[astro-ph/9505093] [INSPIRE].
[9] Y. Uchihori et al., Cluster analysis of extremely high-energy cosmic rays in the northern sky,Astropart. Phys. 13 (2000) 151 [astro-ph/9908193] [INSPIRE].
[10] P. Tinyakov and I. Tkachev, Correlation function of ultrahigh energy cosmic rays favors point
sources, JETP Lett. 74 (2001) 1 [astro-ph/0102101] [INSPIRE].
[11] M. Takeda et al., Small-scale anisotropy of cosmic rays above 1019 ev observed with the Akeno
giant air shower array, Astrophys. J. 522 (1999) 225 [astro-ph/9902239] [INSPIRE].
[12] HiRes collaboration, R. Abbasi et al., Search for Correlations between HiRes Stereo Events
and Active Galactic Nuclei, Astropart. Phys. 30 (2008) 175 [arXiv:0804.0382] [INSPIRE].
– 13 –

JCAP04(2012)040
[13] HiRes collaboration, R.U. Abbasi et al., Search for point-like sources of cosmic rays with
energies above 1018.5 eV in the HiRes. 1. Monocular data-set, Astropart. Phys. 27 (2007) 512[astro-ph/0507663] [INSPIRE].
[14] S. Westerhoff for the HiRes collaboration, Search for small-scale anisotropy of cosmic rays
above 1019 eV with HiRes stereo, Nucl. Phys. Proc. Suppl. 136C (2004) 46[astro-ph/0408343] [INSPIRE].
[15] R. Abbassi for the HiRes collaboration, A Search for Three and Four Point Correlation in
HiRes Stereo Data, arXiv:0901.3740 [INSPIRE].
[16] Pierre Auger collaboration, J. Abraham et al., Properties and performance of the prototype
instrument for the Pierre Auger Observatory, Nucl. Instrum. Meth. A 523 (2004) 50[INSPIRE].
[17] M.-P. Veron-Cetty and P. Veron, A catalogue of quasars and active nuclei: 12th edition,Astron. Astrophys. 455 (2006) 773 [INSPIRE].
[18] Pierre Auger collaboration, J. Abraham et al., Correlation of the highest energy cosmic rays
with nearby extragalactic objects, Science 318 (2007) 938 [arXiv:0711.2256] [INSPIRE].
[19] Pierre Auger collaboration, J. Abraham et al., Correlation of the highest-energy cosmic rays
with the positions of nearby active galactic nuclei, Astropart. Phys. 29 (2008) 188 [Erratumibid. 30 (2008) 45] [arXiv:0712.2843] [INSPIRE].
[20] Pierre Auger collaboration, P. Abreu et al., Update on the correlation of the highest energy
cosmic rays with nearby extragalactic matter, Astropart. Phys. 34 (2010) 314[arXiv:1009.1855] [INSPIRE].
[21] P.J.E. Peebles, The Large-Scale Structure of the Universe, Princeton University Press,Princeton U.S.A. (1980).
[22] J. Hague, B. Becker, M. Gold and J. Matthews, A Three-Point Cosmic Ray Anisotropy
Method, J. Phys. G 36 (2009) 115203 [arXiv:0905.4488] [INSPIRE].
[23] M. Ave, et al., The 2pt+: an enhanced 2 point correlation function, JCAP 07 (2009) 023[arXiv:0905.2192] [INSPIRE].
[24] N.H. Woodcock, Specification of fabric shapes using an eigenvalue method, Geol. Soc. Am.
Bull. 88 (1977) 1231.
[25] N.H. Woodcock and M.A. Naylor, Randomness testing in three-dimensional orientation data,J. Struct. Geol. 5 (1983) 539.
[26] A. Berlind, N. Busca, G. Farrar and J. Roberts, Mock Catalogs for UHECR Studies,arXiv:1112.4188 [INSPIRE].
[27] McBride et al., in preparation (2012), see http://lss.phy.vanderbilt.edu/lasdamas/ for fulldetails.
[28] D. Ryu, H. Kang, J. Cho and S. Das, Turbulence and Magnetic Fields in the Large Scale
Structure of the Universe, Science 320 (2008) 909 [arXiv:0805.2466] [INSPIRE].
[29] C. Bonifazi for the Pierre Auger collaboration, The angular resolution of the Pierre Auger
Observatory, Nucl. Phys. Proc. Suppl. 190 (2009) 20 [arXiv:0901.3138] [INSPIRE].
[30] Pierre Auger collaboration, P. Abreu et al., The Pierre Auger Observatory I: The Cosmic
Ray Energy Spectrum and Related Measurements, arXiv:1107.4809 [INSPIRE].
– 14 –
Copyright © 2022 FDOKUMEN