A Robust and Transparent Watermarking Method Against Block-Based Compression Attacks
10
A Robust and Transparent Watermarking Method against Block-based Compression Attacks Phi Bang Nguyen 1 , Azeddine Beghdadi 1 and Marie Luong 1 1 L2TI Laboratory, Galilee Institute. 99, Ave. J. B. Clement 93430 Villetaneuse, France {nguyen, beghdadi, marie.luong}@univ-paris13.fr Abstract. In this paper, we present a new transparent and robust watermarking method against block-based compression attacks based on two perceptual models. In order to resist to block-based compression, the main idea is to embed the watermark into regions that are not or less affected by blocking effect. These auspicious regions are selected based on a spatial prediction model of blocking effect. Then, the embedding strength is optimally determined using a JND model. The combination of these two models provides more gain in robustness and transparency. Experimental results demonstrate that our proposed method achieves a good invisibility and robustness against common “signal processing" attacks, especially to JPEG compression. Keywords: Watermarking, Pyramid Transform, Human Visual System, Blocking Effect Prediction, JND 1 Introduction One of the most challenging issues in watermarking is to solve the trade-off between robustness and transparency. Unfortunately, these criteria are conflicting. Indeed, to enhance robustness, we have to increase the watermark strength at the expense of loss in transparency and vice versa. Designing algorithms for such an optimizing problem is still a challenge for the watermarking community. We believe that one of the most promising solutions to this issue is to take into account HVS (Human Visual System)'s properties in the design of watermarking algorithms. By this way, we can maximize robustness by introducing a perceptual constraint on transparency. In the literature, most of existing approaches that resist to Jpeg compression are based on the selection of the frequency bands, i.e. embedding in low or middle frequencies prevent the signal from the quantization artifacts. Koch and Zhao [1] are among the first researchers who propose a method in DCT domain which is based on a JPEG compression model and pulse position modulation technique. The copyright code is first encrypted and then embedded into random quantized DCT coefficients selected in the middle-frequency band. In [2], Cox et al. proposed another non-blind DCT based technique which allows a better robustness to JPEG compression by embedding the watermark into low frequency components. However, embedding in the low frequency band often causes visible distortions and hence, decreases the watermark transparency. To overcome this problem, some authors have considered HVS in the
Transcript of A Robust and Transparent Watermarking Method Against Block-Based Compression Attacks
A Robust and Transparent Watermarking Method
against Block-based Compression Attacks
Phi Bang Nguyen1, Azeddine Beghdadi
1 and Marie Luong
1
1L2TI Laboratory, Galilee Institute. 99, Ave. J. B. Clement
93430 Villetaneuse, France
{nguyen, beghdadi, marie.luong}@univ-paris13.fr
Abstract. In this paper, we present a new transparent and robust watermarking
method against block-based compression attacks based on two perceptual
models. In order to resist to block-based compression, the main idea is to
embed the watermark into regions that are not or less affected by blocking
effect. These auspicious regions are selected based on a spatial prediction
model of blocking effect. Then, the embedding strength is optimally determined
using a JND model. The combination of these two models provides more gain
in robustness and transparency. Experimental results demonstrate that our
proposed method achieves a good invisibility and robustness against common
“signal processing" attacks, especially to JPEG compression.
Keywords: Watermarking, Pyramid Transform, Human Visual System,
Blocking Effect Prediction, JND
1 Introduction
One of the most challenging issues in watermarking is to solve the trade-off between
robustness and transparency. Unfortunately, these criteria are conflicting. Indeed, to
enhance robustness, we have to increase the watermark strength at the expense of loss
in transparency and vice versa. Designing algorithms for such an optimizing problem
is still a challenge for the watermarking community. We believe that one of the most
promising solutions to this issue is to take into account HVS (Human Visual
System)'s properties in the design of watermarking algorithms. By this way, we can
maximize robustness by introducing a perceptual constraint on transparency.
In the literature, most of existing approaches that resist to Jpeg compression are based
on the selection of the frequency bands, i.e. embedding in low or middle frequencies
prevent the signal from the quantization artifacts. Koch and Zhao [1] are among the
first researchers who propose a method in DCT domain which is based on a JPEG
compression model and pulse position modulation technique. The copyright code is
first encrypted and then embedded into random quantized DCT coefficients selected
in the middle-frequency band. In [2], Cox et al. proposed another non-blind DCT
based technique which allows a better robustness to JPEG compression by embedding
the watermark into low frequency components. However, embedding in the low
frequency band often causes visible distortions and hence, decreases the watermark
transparency. To overcome this problem, some authors have considered HVS in the
design of their watermarking algorithm. In [3], a watermark robust to a desired
compression quality level is constructed using the difference between the original and
the reconstructed image after compression. The used visual component is simply the
local average brightness. In [4], Seo et al. proposed to embed in the DC component of
the 8x8 DCT block due to the remark that this component contains most of image
energy and is the least affected by the quantization process. However, this strategy
risks a visible distortion. A JND (Just-Noticeable-Distortion) model is therefore
employed to guarantee the watermark imperceptibility. Finally, an important research
that should be considered is the study of Eggers and B. Girod [5] about the effects of
quantization on digital watermark. They proved that the robustness of an additive
watermarking scheme (via correlation based detector) after Jpeg compression can be
predicted with sufficient accuracy. Indeed, they propose a close form of the detection
output which is a function of the statistics of the host signal, the watermark and the
quantization step size.
Here, we propose an approach very different from the literature. The Jpeg
compression process is now regarded from an image quality point of view where its
impact is "blocking effect" rather than quantization effect. Firstly, the onset of
blocking effect (before compression) is predicted. The main idea is to predict how a
block-based compression procedure affects the image at a given bit rate. Then, the
watermark is selectively inserted into locations not or less affected by the blocking
effect and hence can survive compression. We present two perceptual models to
achieve gain in transparency and robustness (against Jpeg compression) at the same
time, that are the Blocking Effect Prediction (BEP) and the Pyramidal JND (PJND)
model. These models are proposed to control the imperceptibility of the watermark
and to improve its robustness against Jpeg compression. The idea of the BEP model is
to predict the onset of blocking effect (before compression) to selectively embed the
watermark into regions less affected by Jpeg compression (indicated by the BEP
map). The JND model is then used to control the watermark strength. This JND
allows hiding the watermark just beneath the detection threshold and therefore
guarantee the watermark transparency. An interesting remark is that although the BEP
model is used to improve the robustness to Jpeg compression, we can still have gain
in transparency. The same results are obtained with the JND model. A combination of
these two models is finally proposed which offers more gain in robustness and
transparency.
The paper is organized as follows: section 2 and 3 present the PJND and the BEP
models. Section 4 introduces three embedding schemes using these models. The
performance evaluation is reported in section 5 and finally, we give some conclusions
and perspectives in section 6.
2 JND Maps
In this section, we describe briefly our proposed JND model which has been designed
for the pyramid transform [6]. Such a model has been successfully exploited in
watermarking [7] [8]. For each level of the pyramid, a JND map is computed by
incorporating the most relevant HVS's properties such as contrast sensitivity function
(CSF), luminance masking and contrast masking.
2.1 Incorporating CSF and Luminance Adaptation
The CSF describes the variation of HVS’s sensitivity as a function of spatial
frequency and therefore has to be applied in frequency domain. To adapt this
phenomenon for spatial domain, we refer to the approach in [7]. For each level of the
Laplacian pyramid, the contrast threshold (CT) at the pixel (x,y) could be expressed as
the contrast threshold at the peak frequency of the channel ( )peakkCT f weighted by the
contribution of the level:
1
( , )( , ) ( )
( , )
peak kk k K
kk
L x yCT x y CT f
L x y
(1)
where ( , )kL x y is the kth
level Laplacian coefficient at the pixel (x,y), CT(fkpeak
) is the
contrast threshold at the peak frequency of the level, computed as its inverse CSF. To
this end, we use the Barten’s model [9] thanks to its flexibility and relative simplicity:
( , ) . .exp( . ). 1 .exp( . )CSF f L a f b f c b f (2)
where c is a constant, a and b are functions of the global luminance L (in cd/m2)
which is computed as follows:
0( , ) ( , )IL x y L L x y (3)
where L0 is the ambient luminance and LI is the local luminance computed, for each
pixel, from the corresponding Gaussian value in the (k+1)th
level, 1( , )kG x y ,
followed by a grayscale to luminance transformation:
1max min
( , )( , ) max( ( ) , )
255
kI
G x yL x y L L (4)
where Lmax and Lmin are respectively the maximum and minimum luminance of the
display, whereas is the exponential factor used in the gamma correction of the
display. The detection threshold T0k(x,y) which accounts for contrast sensitivity and
luminance adaptation is then computed by:
0 1( , ) ( , ). ( , )k k kT x y CT x y G x y (5)
2.2 Contrast Masking
The JND threshold is finally obtained by incorporating a contrast masking model
inspired from [10]:
0 0
0
0
( , ) ( , ) ( , )
( , ) ( , )( , ).
( , )
k k k
k k
k
k
T x y if L x y T x y
JND x y L x yT x y otherwise
T x y
(6)
where is a factor that describes the degree of masking, 0.6 1 [10].

3 BEP Map
Blocking effect is the consequence of partitioning image into blocks and processing
each block independently (with assumption that information contained in the image
are independent), as is generally the case with block-based compression methods. The
impact of blocking effect on an image region depends strongly on its local activity
(i.e. homogeneous, edge or texture). A number of local descriptors could be used to
characterize the region’s activity either in spatial domain or in frequency domain. In
order to make our approach independent of compression method, we use a descriptor
in the spatial domain, the local variance, thanks to its simplicity. Indeed, we assume
that a pixel is affected by blocking effect if its gradient (in the compressed image) is
null and its variance (in the original image) is not null. Based on this analysis, the
BEP map can be computed via a learning process described as follows [11].
3.1 Learning Process
The learning process is performed off-line on an image database. For each pixel (x,y)
of the kth
image in the database, we associate an influence factor defined as:
1, ( , , , , ) 0 ( , , ) 0
( , , , , )0,
if g x y k V q V x y kx y k V q
otherwise
(7)
where g is the pixel gradient computed in the compressed image, V is the local
variance computed in the original image, on a 3x3 window centered at the pixel, and q
is the quality factor of the compression process.
By compressing all images in the database at different quality factors, we can
construct an accumulation matrix, denoted as H. Each element of H represents the
influence factors accumulated over pixels and over images. For each pair of values (V,
q):
, ,
( , ) ( , , , , )
x y k
H V q x y k V q (8)
After a normalization step, we have ( , ) 0,1H V q
which represents the
probability represents the probability of being affected by blocking effect of a pixel
which has the variance v and is compressed at a quality factor q. Fig. 1 displays a part
of the accumulation matrix. For the sake of visibility, only variance values lower than
18 are illustrated. Indeed, one can see that the probability of being affected by
blocking effect is inversely proportional to the variance as well as the quality factor as
expected. The precision of the accumulation matrix depends on the size and the
content richness of the training database. Nevertheless, there is no guarantee that all
possible values of the local variance are present in the tested database, i.e. low
variance values are more often encountered than high variances since homogeneous
regions tend to be predominant in natural images. This leads to a lack of some
variance values in the voting matrix. To cope with this problem, a curve fitting is
applied on the experimental data to obtain an accumulation matrix for variance values
in the interval [0 255]. This selected interval does not theoretically cover all possible
variance values but practically sufficient since the variance values of 8x8 blocks
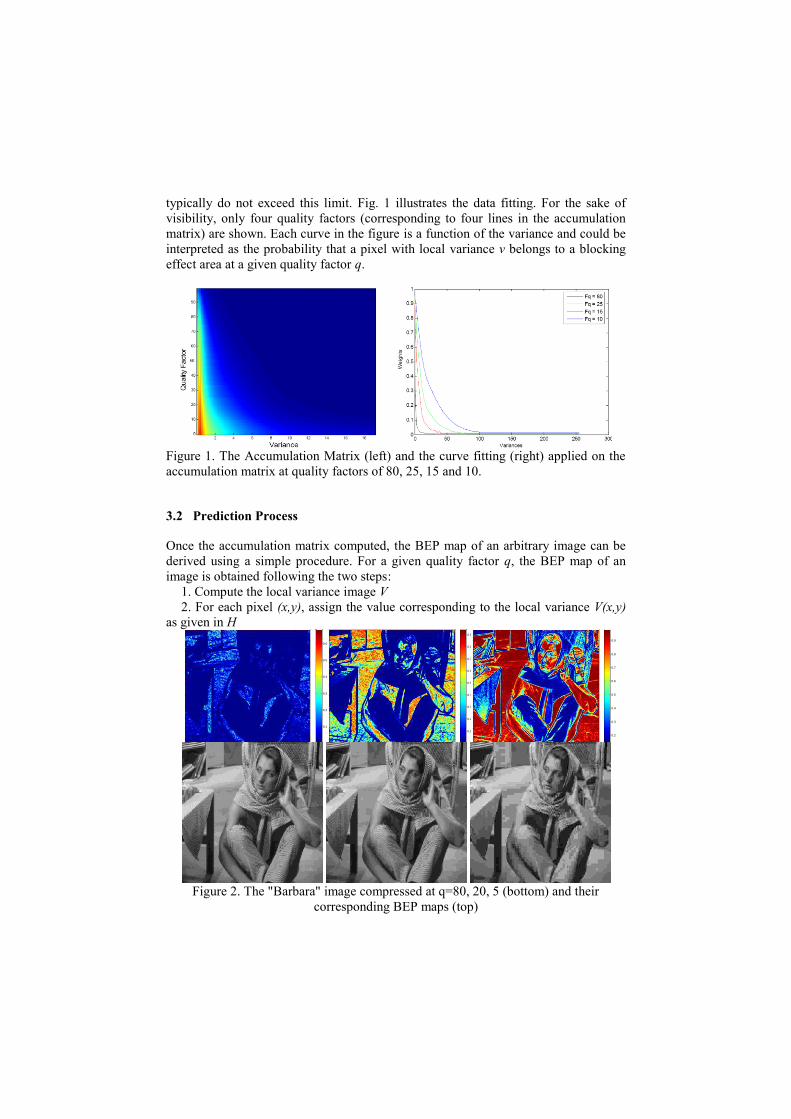
typically do not exceed this limit. Fig. 1 illustrates the data fitting. For the sake of
visibility, only four quality factors (corresponding to four lines in the accumulation
matrix) are shown. Each curve in the figure is a function of the variance and could be
interpreted as the probability that a pixel with local variance v belongs to a blocking
effect area at a given quality factor q.
Figure 1. The Accumulation Matrix (left) and the curve fitting (right) applied on the
accumulation matrix at quality factors of 80, 25, 15 and 10.
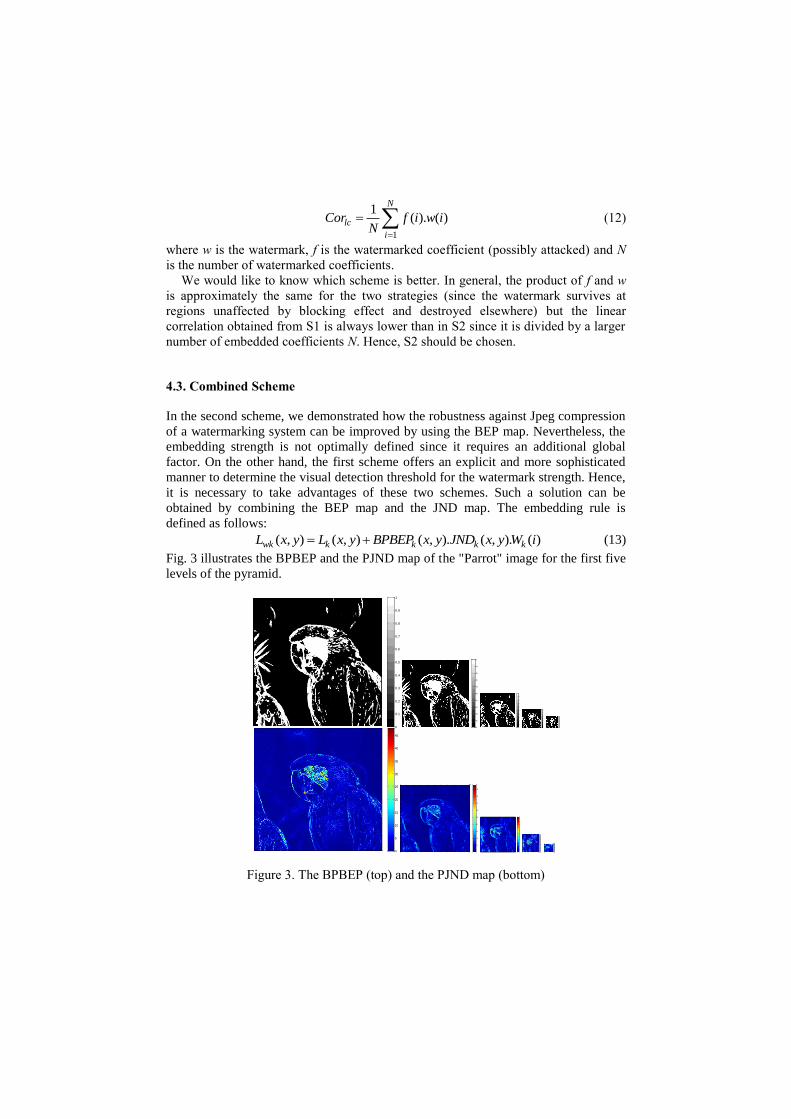
3.2 Prediction Process
Once the accumulation matrix computed, the BEP map of an arbitrary image can be
derived using a simple procedure. For a given quality factor q, the BEP map of an
image is obtained following the two steps:
1. Compute the local variance image V
2. For each pixel (x,y), assign the value corresponding to the local variance V(x,y)
as given in H
Figure 2. The "Barbara" image compressed at q=80, 20, 5 (bottom) and their
corresponding BEP maps (top)
50 100 150 200 250 300 350 400 450 500
50
100
150
200
250
300
350
400
450
500
0.1
0.2
0.3
0.4
0.5
0.6
50 100 150 200 250 300 350 400 450 500
50
100
150
200
250
300
350
400
450
500
0.1
0.2
0.3
0.4
0.5
0.6
0.7
0.8
0.9
50 100 150 200 250 300 350 400 450 500
50
100
150
200
250
300
350
400
450
500
0.2
0.3
0.4
0.5
0.6
0.7
0.8
0.9
Attacked Image Attacked Image Attacked Image

For an intuitive evaluation of the proposed method, Fig. 2 displays an image
compressed at different quality factors and its corresponding BEP map where red and
blue regions correspond to high and low probabilities of being affected by blocking
effect, respectively. It is clear that this probability increases with the decrease of
quality factor. Moreover, homogeneous regions are affected more quickly by blocking
effect than textured regions. As expected, there is a consistency between the
prediction and the actual compression. The same observations are also obtained for
different images.
4 Embedding using JND and BEP maps
For the sake of simplicity, we consider only the zero-bit additive scheme that embeds
a bipolar pseudo-random sequence { 1,1}kW into each level of the Laplacian
pyramid. Three embedding strategies are proposed as below.
4.1. Scheme 1
A straightforward strategy is to hide the watermark just beneath the detection
threshold using the following scheme:
( , ) ( , ) ( , ). ( , )wk k k kL x y L x y JND x y W x y (9)
By this way, the embedding strength is determined in an optimal way and hence,
achieves the trade-off between robustness and transparency.
4.2. Scheme 2
Two strategies can be considered. In the first strategy, the embedding strength is
adapted according to the BEP map while in the second one, the binary BEP map is
used to select “relevant regions” (image regions that are less vulnerable to blocking
effect) for embedding.
S1) ( , ) ( , ) (1 ( , )) ( , )wk k k kL x y L x y PBEP x y W x y (10)
S2) ( , ) . ( , ). ( , )wk k k kL L x y BPBEP x y W x y (11)
where is a global factor for controlling the watermark strength, PBEP and BPBEP
are the Pyramidal BEP map and its binary version, respectively.
The PBEP map is computed by applying a Gaussian pyramid transform on the BEP
map. Then, its binary version is obtained by thresholding this PBEP map. It is worth
to notice that a threshold of 0.5 means the selected regions are supposed affected by
blocking effect with a probability of 50%. So, we set this threshold to 0.3 to ensure
certainly that selected zones are the least affected.
Assuming that the BEP map works correctly, a linear correlation based detector is
used as follows:
1
1( ). ( )
N
lc
i
Cor f i w iN
(12)
where w is the watermark, f is the watermarked coefficient (possibly attacked) and N
is the number of watermarked coefficients.
We would like to know which scheme is better. In general, the product of f and w
is approximately the same for the two strategies (since the watermark survives at
regions unaffected by blocking effect and destroyed elsewhere) but the linear
correlation obtained from S1 is always lower than in S2 since it is divided by a larger
number of embedded coefficients N. Hence, S2 should be chosen.
4.3. Combined Scheme
In the second scheme, we demonstrated how the robustness against Jpeg compression
of a watermarking system can be improved by using the BEP map. Nevertheless, the
embedding strength is not optimally defined since it requires an additional global
factor. On the other hand, the first scheme offers an explicit and more sophisticated
manner to determine the visual detection threshold for the watermark strength. Hence,
it is necessary to take advantages of these two schemes. Such a solution can be
obtained by combining the BEP map and the JND map. The embedding rule is
defined as follows:
( , ) ( , ) ( , ). ( , ). ( )wk k k k kL x y L x y BPBEP x y JND x y W i (13)
Fig. 3 illustrates the BPBEP and the PJND map of the "Parrot" image for the first five
levels of the pyramid.
Figure 3. The BPBEP (top) and the PJND map (bottom)
0
0.1
0.2
0.3
0.4
0.5
0.6
0.7
0.8
0.9
1
0
0.1
0.2
0.3
0.4
0.5
0.6
0.7
0.8
0.9
1
0
0.1
0.2
0.3
0.4
0.5
0.6
0.7
0.8
0.9
1
0
0.1
0.2
0.3
0.4
0.5
0.6
0.7
0.8
0.9
1
0
0.1
0.2
0.3
0.4
0.5
0.6
0.7
0.8
0.9
1
50 100 150 200 250 300 350 400 450 500
50
100
150
200
250
300
350
400
450
5000
5
10
15
20
25
30
35
40
45
50 100 150 200 250 300 350 400 450 500
50
100
150
200
250
300
350
400
450
500
2
4
6
8
10
12
14
16
18
50 100 150 200 250 300 350 400 450 500
50
100
150
200
250
300
350
400
450
500
1
2
3
4
5
6
7
8
9
10
11
50 100 150 200 250 300 350 400 450 500
50
100
150
200
250
300
350
400
450
500
1
2
3
4
5
6
7
8
9
10
50 100 150 200 250 300 350 400 450 500
50
100
150
200
250
300
350
400
450
500
1
2
3
4
5
6
7
8
9
10
11

5 Performance Evaluation
Performances of the three proposed schemes are evaluated in terms of robustness and
transparency. For the first scheme, by using the BEP map, the watermark can survive
Jpeg compression at very low quality (q=6) but considerably fragile to other attacks
(see Table I). Furthermore, the watermark transparency is also improved due to the
fact that only a small portion of the image is chosen for embedding. Fig. 4 illustrates
watermarked images from schemes with and without using BEP map. For a fair
comparison, the same embedding rule (i.e. the same parameter ) is applied.
Figure 4. Zoom of a watermarked image with (left) and without (right) using BEP
map.
For the second scheme, the transparency is optimally achieved by using the JND map.
As shown in Figure 5, the original and the watermarked image are perceptually
undistinguishable (see [7] for a complete visual quality evaluation of the watermark).
The robustness is also significantly improved (see Table 1).
Now, the question is whether we have more gain in robustness and transparency when
combining the BEP and JND maps. Fig. 6 displays the detector output of the
combined scheme and the JND based scheme against Jpeg compression. It can be
seen that using both BEP and JND maps offers a significant gain in robustness to Jpeg
compression.
It is also necessary to know if the overall robustness (against other attacks)
decreases or increases with the combined schemes. Table I shows that for scheme 2
and the combined scheme, the watermark survives many severe attacks but there are
no significant difference in robustness between these two schemes to attacks exclude
Jpeg compression. Furthermore, robustness against some attacks “like Jpeg”
(Jpeg2000) is even slightly improved. This can be explained by interesting remark on
common characteristic of the two maps (see Fig. 3). The JND map also presents very
high values at regions “selected” by the BEP map so that most of watermark energy
concentrates at these common regions. This leads to the fact that embedding at other
regions does not help to increase much in terms of watermark energy.
Finally, it is clear that the transparency of the combined scheme is even better than
the second one (that uses only JND map) due to the fact that we embed in only a
small portion of the image and the embedding strength is controlled by the JND map.
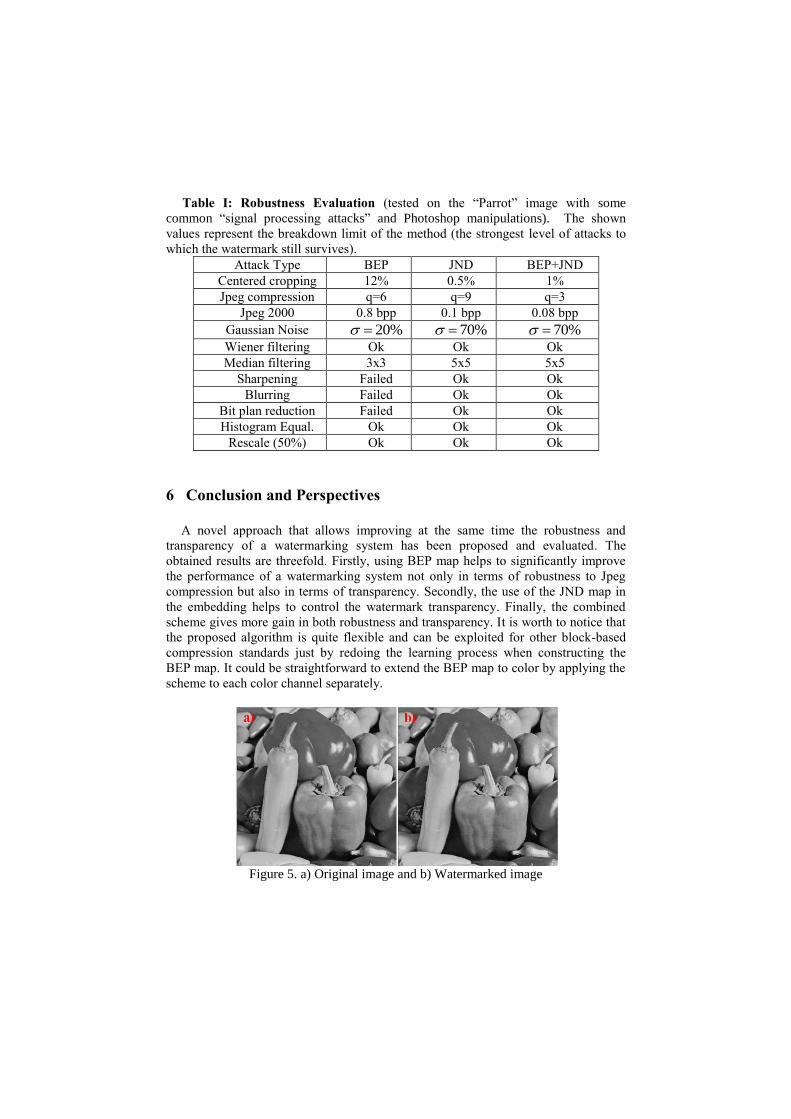
Table I: Robustness Evaluation (tested on the “Parrot” image with some
common “signal processing attacks” and Photoshop manipulations). The shown
values represent the breakdown limit of the method (the strongest level of attacks to
which the watermark still survives).
Attack Type BEP JND BEP+JND
Centered cropping 12% 0.5% 1%
Jpeg compression q=6 q=9 q=3
Jpeg 2000 0.8 bpp 0.1 bpp 0.08 bpp
Gaussian Noise 20%
70%
70%
Wiener filtering Ok Ok Ok
Median filtering 3x3 5x5 5x5
Sharpening Failed Ok Ok
Blurring Failed Ok Ok
Bit plan reduction Failed Ok Ok
Histogram Equal. Ok Ok Ok
Rescale (50%) Ok Ok Ok
6 Conclusion and Perspectives
A novel approach that allows improving at the same time the robustness and
transparency of a watermarking system has been proposed and evaluated. The
obtained results are threefold. Firstly, using BEP map helps to significantly improve
the performance of a watermarking system not only in terms of robustness to Jpeg
compression but also in terms of transparency. Secondly, the use of the JND map in
the embedding helps to control the watermark transparency. Finally, the combined
scheme gives more gain in both robustness and transparency. It is worth to notice that
the proposed algorithm is quite flexible and can be exploited for other block-based
compression standards just by redoing the learning process when constructing the
BEP map. It could be straightforward to extend the BEP map to color by applying the
scheme to each color channel separately.
Figure 5. a) Original image and b) Watermarked image
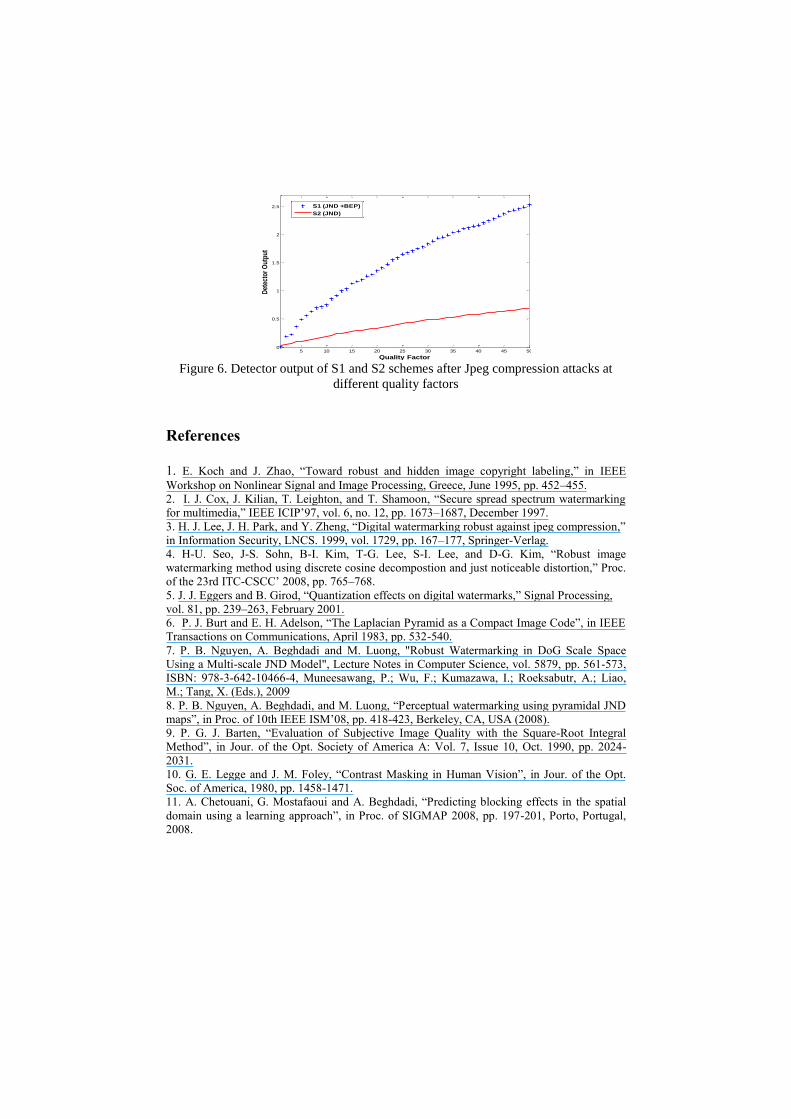
Figure 6. Detector output of S1 and S2 schemes after Jpeg compression attacks at
different quality factors
References
1. E. Koch and J. Zhao, “Toward robust and hidden image copyright labeling,” in IEEE
Workshop on Nonlinear Signal and Image Processing, Greece, June 1995, pp. 452–455.
2. I. J. Cox, J. Kilian, T. Leighton, and T. Shamoon, “Secure spread spectrum watermarking
for multimedia,” IEEE ICIP’97, vol. 6, no. 12, pp. 1673–1687, December 1997.
3. H. J. Lee, J. H. Park, and Y. Zheng, “Digital watermarking robust against jpeg compression,”
in Information Security, LNCS. 1999, vol. 1729, pp. 167–177, Springer-Verlag.
4. H-U. Seo, J-S. Sohn, B-I. Kim, T-G. Lee, S-I. Lee, and D-G. Kim, “Robust image
watermarking method using discrete cosine decompostion and just noticeable distortion,” Proc.
of the 23rd ITC-CSCC’ 2008, pp. 765–768.
5. J. J. Eggers and B. Girod, “Quantization effects on digital watermarks,” Signal Processing,
vol. 81, pp. 239–263, February 2001.
6. P. J. Burt and E. H. Adelson, “The Laplacian Pyramid as a Compact Image Code”, in IEEE
Transactions on Communications, April 1983, pp. 532-540.
7. P. B. Nguyen, A. Beghdadi and M. Luong, "Robust Watermarking in DoG Scale Space
Using a Multi-scale JND Model", Lecture Notes in Computer Science, vol. 5879, pp. 561-573,
ISBN: 978-3-642-10466-4, Muneesawang, P.; Wu, F.; Kumazawa, I.; Roeksabutr, A.; Liao,
M.; Tang, X. (Eds.), 2009
8. P. B. Nguyen, A. Beghdadi, and M. Luong, “Perceptual watermarking using pyramidal JND
maps”, in Proc. of 10th IEEE ISM’08, pp. 418-423, Berkeley, CA, USA (2008).
9. P. G. J. Barten, “Evaluation of Subjective Image Quality with the Square-Root Integral
Method”, in Jour. of the Opt. Society of America A: Vol. 7, Issue 10, Oct. 1990, pp. 2024-
2031.
10. G. E. Legge and J. M. Foley, “Contrast Masking in Human Vision”, in Jour. of the Opt.
Soc. of America, 1980, pp. 1458-1471.
11. A. Chetouani, G. Mostafaoui and A. Beghdadi, “Predicting blocking effects in the spatial
domain using a learning approach”, in Proc. of SIGMAP 2008, pp. 197-201, Porto, Portugal,
2008.
5 10 15 20 25 30 35 40 45 500
0.5
1
1.5
2
2.5
Quality Factor
Det
ecto
r O
utp
ut
S1 (JND +BEP)
S2 (JND)