Fatal Misconception: The Struggle to Control World Population
Upload
khangminh22Category
view
1download
0


1
1. INTRODUCTION
A road traffic injury is a fatal or non-fatal injury incurred as a result of
collision on a public road involving at least one moving vehicle 1. Road traffic safety
refers to methods and measures for reducing the risk of a person using the road
network being killed or seriously injured 2.
A road traffic accident (RTA) is any injury due to crashes originating from,
terminating with or involving a vehicle partially or fully on a public road. As per
Global status report on road safety, It is the eighth leading cause of death for all age
groups 3. Road traffic injuries are one of the leading cause of global deaths and
expected to go on to the third position. Road traffic injuries cause considerable
economic losses to victims, their families, and to the nation 4.
Road traffic injuries form alarming public health problem in India. Every day
thousands of people are injured and killed on the roads, usually affecting the
productive age groups of road users. Majority of the people killed in traffic injuries
are young adults between the age group of 15 and 44 years 5.
Low and middle-income countries having 82% of the global population and
56% of global vehicles but account for 90% of accidents. Mortality in low and
middle-income countries is 2.5 times higher than that in high-income countries 6.
1.1 GLOBAL SCENARIO
Globally, road traffic injuries (RTIs) are responsible for a significant
proportion of overall injury, morbidity and mortality. Globally 1.35 Million deaths
occur on roads all over the world each year due to road traffic injuries. In children and
young adults, road traffic injuries are the leading cause of death. More than 50% of

2
road traffic deaths occur among Pedestrians, Cyclists and Motorcyclists. Road traffic
injuries are the eighth leading cause of death in all age groups. Now Road traffic
injuries are the leading cause of death among children and young adults of age 5-29
years. Death rates due to road traffic injuries are three times higher in low income
countries. The majority of deaths from South East Asia are among two wheeler
riders3. Globally more than 3,400 people die daily on road. Every year 10 million
peoples are injured or disabled due to road traffic injuries 7. Traffic injuries are the
second leading cause of death among children of 5- 14 years of age 8.
Road traffic injuries ( RTIs ) account for 9% of global deaths, which is 1.7
times higher than the combined number of deaths from HIV/AIDS, Tuberculosis and
Malaria. Road Traffic Injuries are expected to be 7th leading cause of deaths in 2030.
RTIs are expected to rise to the 7th position in the list of causes of death by the year
2030 6.
1.2 SCENARIO IN INDIA
WHO published a Global Status Report on Road Safety 2018, based on the
road traffic accidents data 2016. India is one of the leading countries for higher
number of road traffic accidents. Road traffic injuries vary from state to state 3, 9
.
1.3 SCENARIO IN TAMILNADU
According to the Ministry of Road Transport and Highways, the state leading
in accidents in India is Tamilnadu during 2017. The maximum accidents in
Tamilnadu were caused by two-wheelers (43.94%) in January 2019. Maximum deaths
were due to two-wheelers (37.38%) out of which 47.28% of deaths were due to not
wearing a helmet. The Government has taken actions to reduce accidents through

3
departments of transport, police, and education and through proper highway
instructions. After this the number of deaths were reduced in 2018 compared to
previous years. Death rate in 2018 is 24% lower than 2017. 25% of total accidents
and 78.5 % deaths has been increased in January 2019 compared to that in January
2018 in Kanyakumari district 7.
Road traffic injuries (RTIs) and deaths have an impact on individuals,
communities, and countries. The individuals suffer from a massive cost of the health
care. The individuals occupy hospital beds and consume resources resulting in losses
of significant productivity with social and economic repercussions. Globally road
traffic injuries are three times more common among men. The risk factors for road
traffic injuries and deaths are drinking and driving, speeding and failing to use
helmets. 30 % of deaths due to speed in high-income countries, while more than 50%
of the deaths in low and middle-income countries. 40% of deaths and 70% risk of
severe injury may be reduced by wearing a standard motorcycle helmet. If the
Government fails to take action to reduce the road traffic deaths, it is to be predicted
to increase to 1.9 million deaths by 2030 and it becomes the seventh leading cause of
death 9.
The world‟s second-largest road network is in India. It has different shapes,
sizes, construction methods, safety criteria, and quality. Common risk factors
observed in India are faulty designing of road, poor maintenance of roads, absence of
segregation of vehicles with their speed, slippery roads, narrow roads, poor visibility
of road surface and roads that promote speeding beyond limits 6.

4
1.4 PROGRAMME RELATED TO ROAD TRAFFIC ACCIDENTS
In September 2015, the United Nations launched „the 2030 agenda for
Sustainable development goals‟ (SDG). Out of the seventeen Sustainable
development goals, two goals concentrate on road safety. The Goal 3.6 is targeted to
achieve halve the number of global deaths and injuries from road traffic accidents by
the year 2020. Goal 11.2 targets on provision of access to safe, affordable, accessible
and sustainable transport system for all by the year 2030, improving road safety,
notably by expanding public transport, with special attention to the needs of those in
vulnerable situations, women, children, persons with disabilities and older
persons 10
, 11
.
1.5 SCIENTIFIC JUSTIFICATION OF THE STUDY
Road Traffic Accidents (RTA) and deaths due to road traffic injuries are
preventable. In the modern world rapid growth of vehicle production and necessity for
the use of two-wheelers are increasing day by day. The most vulnerable age group for
the involvement of RTA is 15-29 years. The minimum age for getting a driving
license in our country is 18 years. So college students were chosen as study
participants in this study. Individuals of this younger age group will be the future
parents. If they have better knowledge about road traffic rules it will be helpful to
motivate their family members towards correct road traffic rules. Implementation of
effective road traffic rules in this age group will be helpful to bring changes in their
behavior towards healthy road traffic practices. Road traffic accidents and injuries are
a major but often neglected public health problem in India. So this study was planned
to be carried out among college students. Literature shows only very few studies on
this topic among students from Tamilnadu.

5
2. AIMS AND OBJECTIVES
1. To assess knowledge, attitude, and practice of road traffic rules among college
students who are using two-wheelers regularly in Kanyakumari district.
2. To study the prevalence of road traffic accidents and associated risk factors
among college students in Kanyakumari district.

6
3. REVIEW OF LITERATURE
3.1 INJURY
Injuries may result from traffic collisions, poisoning, drowning, burns, falls,
assault, self-inflicted violence, and an act of war. Globally injuries cause 9% of
mortality. For every death due to injuries, there are hundreds of emergencies and
hospitalizations. Many Peoples survive with temporary or permanent disabilities after
injury 12
.
Poor countries were severely affected by fatal injuries, and non fatal injuries.
Globally there is one death every six second due to injuries that is around 14000
deaths per day 13
.
In India, rapid industrialization and urbanization have to lead to an alarming
increase in accidental injuries, crime, and violence 14
.
India accounts for about 10% of road crash fatalities worldwide. In terms of
absolute numbers, more people die in road crashes in India than anywhere else in the
world, including the most populous country China 15
.

7
Figure no 1: Distribution of global injury mortality by the cause 16
.
3.2 ROAD TRAFFIC INJURIES (RTIs)
Road traffic crashes occur all over the world. Road traffic accidents (RTA) are
one of the major causes of injury, death, and disability all over the world including
developed and developing countries. There is a significant association between
income and risk of deaths due to the road traffic injuries. The average death rate due
to RTA in low income countries are three times higher (27.5 deaths / 100,000
population) than high-income countries (8.3 deaths/ 100,000 population). Road traffic
injuries are a major but neglected problem and the tragedy behind these attracts less
mass media attention than other less frequent types of tragedies. Considerable
economic losses occur to the affected individuals, their families and nation due to
road traffic injuries. Also losses arise from the treatment cost and lost productivity for
those killed or disabled by injuries. Family members need to take time for taking care
22.80%
16.90%
10.80%
3.40% 0.20%
6.70%
7.50%
6.20%
7.30%
18.10%
ROAD TRAFFIC INJURY
SUCIDE
VIOLENCE
WAR
OTHER INTENTIONAL INJURIES
POISONING
FALLS
FIRES
DROWNING
OTHER UNINTENTIONAL INJURIES

8
of an injured person. The cost of road traffic injuries in most countries is about 3% of
their gross domestic product 17
.
3.3 GLOBAL PREVALENCE OF ROAD TRAFFIC ACCIDENTS
Road traffic injury was first recorded by cyclist on 30th
May in 1896 in United
States (Newyork) 18
. The road traffic deaths rise steadily from year to year. In 2016
road traffic deaths reached 1.35 Million in number. These death rates were relative to
the size of the world's population. Due to the increasing population and rapid
motorization the global burden of road traffic accidents will keep on increasing 3. A
number of factors contribute to the risk of collision including; vehicle design, speed of
operation, road design, and driver impairment. Worldwide motor vehicle collisions
lead to significant death and disability as well as significant financial costs to both
society and the individual. Deaths due to RTA is predicted to be 1.9 million by the
year 2020, reported by WHO 18
.
Figure no 2: Distribution of global deaths among road users.

9
3.3.1 A LEADING KILLER OF CHILDREN AND ADOLESCENTS
The countries‟ future is on young people‟s hand. One child dies every minute
on road globally. These death rates are found to be higher than 500 deaths per day.
RTA forms the fourth cause of death among children of age group of 5-9 years, third
cause of death in the age group of 10-14years, and first leading cause death in the age
group of 15-17 years. Studies show that majority (95%) of road traffic deaths among
children occur in low and middle income countries. The occurrence of road traffic
injuries are twice in boys compared to girls 19
.
Figure no 3: According to WHO, RTA forms the topmost cause of death of age
between 15-29 years
Compared to the deaths due to infectious diseases, the relative contribution
from non-communicable diseases including injuries has increased. In general for all
age groups, the eighth leading cause of deaths is due to road traffic injuries. In the
current situation, it is the leading cause of death for children and young adults of the

10
age group of 5-29 years. The number of deaths from road traffic injuries are higher
than deaths due to communicable diseases like HIV/AIDS, Tuberculosis and
diarrhoeal diseases 3. The global burden of road traffic deaths is disproportionately
high in low and middle income countries with about the size of the population and the
total number of motor vehicles. 20
. In many developing countries the children are at
high risk for RTAs because they use road for playing. RTAs form one of the leading
causes for disabilities in younger age group 21
.

11
Figure no 4: Distribution based on Proportion of population, road traffic deaths,
and registered motor vehicles by country income category, 2016- (104 countries)
Income levels are based on 2017 World Bank classifications.
15%
76%
9%
Population
High income
Middle income
Low income
7%
80%
13%
Road Traffic Deaths
High Inome
Middle Income
Low Incom
40%
59%
1%
Vehicles
High Income
MiddleIncome

12
Road traffic death rate in global was 18.2 per 1 lakh population.
In Africa - 26.6 per 1 lakh population.
In South East-Asia - 20.7 deaths per 1 lakh population.
In Eastern Mediterranean – 18 deaths per 1 lakh population.
In Western Pacific regions - 16.9 deaths per 1 lakh population.
In America -15.6 deaths per 1 lakh population.
In Europe- 9.3 deaths per 1 lakh population.
3.3.2 VULNERABLE ROAD USER
Death rates from RTAs vary between regions and countries. The vulnerable
road users are cyclists, motorcyclists, and pedestrians. Those using motorized two-
wheeler and three-wheelers contribute to 28 % of deaths. In Africa, 44% of deaths
occurred from cyclists and pedestrians. Data shows that in South-East Asia, 43% of
deaths occur among motorized two and three-wheelers 3. Pedestrians contribute 22%
of all road traffic deaths globally. Millions of pedestrians are non fatally injured and
some of them with permanent disabilities 22
. Children are prone to limited physical
development, social development and cognitive development, as they are more
susceptible to involve in RTAs 19
.

13
Figure no 5: Distribution of deaths by road user type, by WHO Region
3.3.3 LEGISLATION AND ROAD USE BEHAVIOR
A regulation or rule is a policy statement or guidelines released by the
government. The factors influencing the legislation on road safety includes driving
force, political will, public pressure, tragedy among law-makers family, and changes
in social values. Global road safety was recommended by the International policy-
making and technical institution such as United Nations. Legislation is one of the road
safety strategies to reduce fatal and non-fatal injuries. Legislation is a useful measure
to achieve most of the road safety goals. International regulations give guidelines and
legal framework for regions and countries from evidence based practice 23
.
Enacting and enforcing legislation is important in reducing the risk factors of
RTA. Risk factors are over speeding of vehicle, drunken-driving, riding without
standard helmets, driving without seat belts, and child restraints. These are the
important components of an integrated strategy to prevent deaths from road traffic
16%
43%
2%
14%
25%
South-East Asia
driver 4 wheeled vehicle
Motorized 2-3wheeler
Cyclists
Pedistrians
Unspecified

14
injuries. Currently, 123 countries have laws that meet at least one of the five key
behavioral risk factors, nearly representing 6 billion people 3.
3.3.4 MANAGING SPEED
Riding Speed is one of the important factors directly proportional to the
severity of injury and likelihood of death. A national speed limit setting is an
important step to reduce accidents. The maximum speed limit in urban should be less
than or equal to 50 km/Hour. Local authorities should have the legislative power to
further reduce speed limits in such places like schools. Only 46 countries meet those
speed practice criteria. In India, the speed limit in the urban area is more than 50 km/
Hour 3.
3.3.5 REDUCING DRUNKEN–DRIVING
Among total road deaths 5- 35% have been reported as Alcohol-related deaths.
Drunken driving significantly increases the risk of road traffic injuries and severity.
There is a limitation on alcohol consumption for drivers. The blood alcohol
concentration (BAC) limit for drunk-driving is 0.05g/dl for the general population and
0.02 g/dl for young or novice drivers 3.
Drunken driving laws vary between country to country as well as Blood
Alcohol Concentration (BAC) level. BAC limit is 0.02% to 0.05% for central Asian
countries. In china, if BAC is 0.02%, there is a fine of 200-500 CNY and suspension
of license for 1-3 months 24
.

15
3.3.6 INCREASING HELMET- USE IN MOTORCYCLE USERS
The leading cause of death among two-wheeled and three-wheeled motor
users was head Injury. 42% of fatal injuries and 69% of head injuries can be reduced
by using helmet. So proper helmet use is one of the important measures for preventing
road traffic deaths. According to motorcycle helmet law on all roads, the drivers and
passengers should wear a helmet. The helmet should be of a reference to standard
quality 63 countries restrict child passengers on a motorcycle 3.
3.4 INDIAN SCENARIO Road traffic crashes are one of the world‟s largest public health and injury
prevention problems. The problem is all the more acute because the victims are
overwhelmingly healthy prior to their crashes. The population in India crosses
more than one billion. In the world, India is one of the fastest-growing countries in
economies. Economic growth leads to rapidly increasing vehicle production and
usage. In the world, India reports one of the highest mortality rates due to road traffic
injuries 25
.
India alone contributes 73% of RTA burden from South East Asian region 26
.
In India, 1,47,913 peoples died due to road traffic accidents during 2017 7. Top three
leading causes of deaths in 1990 were pneumonia, diarrhoea, and perinatal conditions.
These disease burdens will shift to heart diseases, depression and road traffic injuries
in 2020. India has 1% of the global motor vehicle population, but bears 6% of the
global road traffic accidents 14
. The motorcyclist have 35 times more risk of death than
car occupants 18
.
In India, one death occur every minute due to RTA. Every minute there is one
serious road traffic accident that happened in our country. The state with maximum
16
deaths was recorded in Uttar Pradesh. Two deaths occur in Uttar Pradesh every hour.
The state with maximum road crash injuries happened in Tamil Nadu 27
.
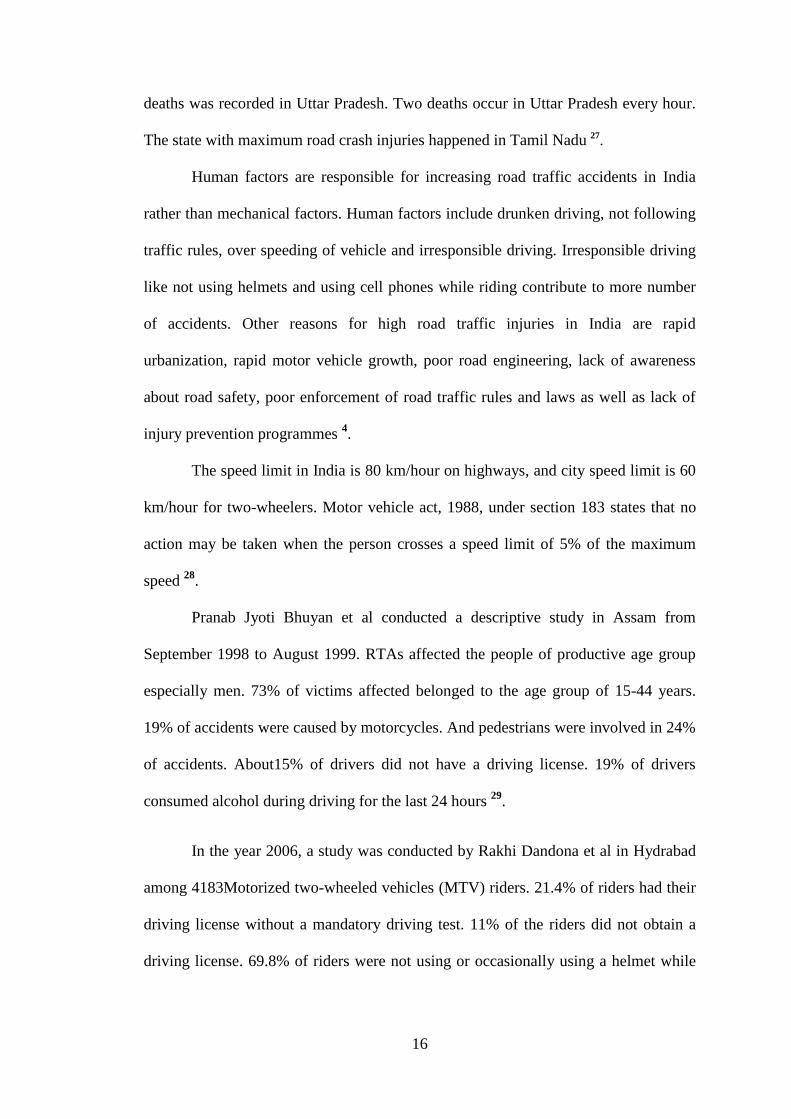
Human factors are responsible for increasing road traffic accidents in India
rather than mechanical factors. Human factors include drunken driving, not following
traffic rules, over speeding of vehicle and irresponsible driving. Irresponsible driving
like not using helmets and using cell phones while riding contribute to more number
of accidents. Other reasons for high road traffic injuries in India are rapid
urbanization, rapid motor vehicle growth, poor road engineering, lack of awareness
about road safety, poor enforcement of road traffic rules and laws as well as lack of
injury prevention programmes 4.
The speed limit in India is 80 km/hour on highways, and city speed limit is 60
km/hour for two-wheelers. Motor vehicle act, 1988, under section 183 states that no
action may be taken when the person crosses a speed limit of 5% of the maximum
speed 28
.
Pranab Jyoti Bhuyan et al conducted a descriptive study in Assam from
September 1998 to August 1999. RTAs affected the people of productive age group
especially men. 73% of victims affected belonged to the age group of 15-44 years.
19% of accidents were caused by motorcycles. And pedestrians were involved in 24%
of accidents. About15% of drivers did not have a driving license. 19% of drivers
consumed alcohol during driving for the last 24 hours 29
.
In the year 2006, a study was conducted by Rakhi Dandona et al in Hydrabad
among 4183Motorized two-wheeled vehicles (MTV) riders. 21.4% of riders had their
driving license without a mandatory driving test. 11% of the riders did not obtain a
driving license. 69.8% of riders were not using or occasionally using a helmet while

17
riding two-wheelers. 59.9% of the riders violated traffic rules at least one time in the
last three months 30
.
C K Priyanka Raj et al in the year 2011, conducted a study among 485(277
girls and 208 boys) government and private high school students in the Villupuram
district of Tamilnadu, India. 34.6% of students knew the legal age for driving. Boys
had better knowledge compared to girls. The majority of them (55%) were not able to
identify even one mandatory road sign out of the five signs given. 98.1% of students
were aware of drunken driving and its risk. 20.88% of students were wearing a helmet
while riding a two-wheeler. Nearly half of the students(48.45%) were able to explain
three traffic lights. 11.34% of students met with road-related accidents for the past
one year 31
.
In the year 2013, Humera Banu et al conducted a study among 457 (361 males
and 96 females) college students in Delhi. Undergraduate and postgraduate students
from Government and Private Colleges, professional and non-professional courses
were included. About 60% of students reported that they were riding at least a few
days every week. The average speed of riders was 48 km per hour while the speed
limit was 70 km per hour. About 50% of riders were always using a helmet (90-95 %
of times) while riding a two-wheeler. About 25% of the riders were using helmet most
of (75% of the events) the time. Men had aggressive riding behavior compare to
women 32
.
In the same year 2013, Nikumb VB et al conducted a cross-sectional study
among 200 (112 male students and 88 female students) college-going students in
Pune, India. The majority of the students knew road safety measures such as using
helmets and not using mobile phones while riding. Though the majority of them were
aware of road safety rules, only a few of them followed road traffic rules. A small

18
number of students (18.35% of males and 14.09% of females) were always wearing a
helmet while riding a two-wheeler 33
.
3.5 SCENARIO IN TAMIL NADU
According to the Ministry of Road Transport and Highways (MoRTH), among
all the Indian states the leading state of road traffic injuries is Tamil Nadu 7,27
. The
data were taken from State Crime Record Bureau (SCRB) compared with Road
Accident Data Base Management System (RADMS) as well as Vahan, and Saradhy.
Data were also collected from 108 Ambulance and Accident and emergency care
initiative from Tamilnadu 7.
Mortality rate from RTA has come down across Tamilnadu in 2017 compared
to death rates of the year 2016. (34) Due to vehicle growth, traffic on roads is
increasing 7 to 10 % annually. In Tamilnadu cause of accidents are due to fault of the
drivers (97%). The major faults are over speed, drunken driving, cell phone usage
while driving and aggressive driving. Cell phone usage while driving contributes to
36% of violation of law and it ranks one in Tamilnadu 35
.
District wise total accidents for the month of January 2019, Chennai city was
ranking the topmost and Kanyakumari district was on 14th
rank. Least accidents were
recorded in Nilgiris. District wise total number of deaths was recorded in January
2019. Chennai city was holding the first rank and Kanyakumari was on 17th
rank. No
deaths were reported in Nilgiris. Grievious injuries were recorded in January 2019.
Chennai city was on the top with 203 grievious injuries and Kanyakumari was on 7th
place with 18 grievious injuries. Total accidents were compared between month of
January 2018 and January 2019. 12.77% of total accidents were increased in Chennai
city, but 25% of accidents were increased in Kanyakumari district. Similarly 10.68%
of total deaths were increased in Chennai city but 78.57% of deaths were increased in

19
Kanyakumari district. Overall in Tamilnadu, 10.78% of accidents and 16.49% of
deaths decreased in 2019 when compared to 2018 7.
Figure no 6: Distribution based on comparison of total accidents and deaths
between January 2018 and January 2019
3.5.1 GROWTH OF VEHICLE IN TAMILNADU
In India, Tamilnadu takes second place in total vehicular population next to
Maharastra. Motor vehicles were classified into transport and non-transport vehicles.
Transport vehicle used for transportation of public or goods, like goods carrier, omni
buses, tourist cabs, Educational institute vehicle. Non-transport vehicles are mainly
used for personal purposes. Non-transport vehicles are two-wheelers, three-wheelers,
scooters, light motor vehicles. Transport vehicle constitute of 4.79%, and non-
transport vehicles constitute of 95.21 in Tamilnadu. Two-wheelers alone contribute
84.12% in contrast to total vehicular population 36
.
3.6 STUDIES RELATED TO KNOWLEDGE ABOUT ROAD TRAFFIC
RULES
Kulkarni v et al conducted a cross-sectional Study among 260 medical
students (2012) in coastal South India. Awareness on the road safety measure was

20
higher among females. All the participants had low level of awareness regarding the
drunken drive and use of mobile phones. Regarding traffic signs, all the participants
had better knowledge. More than 50% of the participants had identified all the traffic
signs 37
.
Taranga Reang et al conducted a cross-sectional study in 2013 from Agartala
Government Medical College among 310 medical students. A majority (98.7%) of the
students knew that driving after alcohol consumption was dangerous and 88.4% were
not familiar with traffic signs which were commonly used. 43% of students were
using their two-wheelers 38
.
A cross-sectional study conducted by Phanindra Det al in the year 2015 among
450 college students in Guntur city, Andhra Pradesh. 86% of students knew that
wearing Helmet was important, 85.33 % students were aware about mobile phone
usage during riding, 77.33% of students knew that they should follow speed limits.
64.22% of students checked their vehicle condition regularly, 24% students knew that
overtaking should be taken on the right side 39
.
Lalitha D et al conducted a cross-sectional study in the year 2015 among 150
college students in Visakhapatnam. More than 80% of students knew about the use of
wearing a helmet. 52.6% of male students and 35.4% of female students knew not to
drive after the consumption of alcohol. Only 5% male and 4% of female students
overtook on the right side, 30% of males and 67% of females were following the
speed limit. 30% of males and 33% of females did not use a mobile phone while
driving 40
.
In the year 2015 Shetty et al conducted a cross-sectional study in south
Mangaluru among 180 motorists. Most of the participants (97.2%) knew that
documents to be carried while driving. The majority of them knew that the minimum

21
age for obtaining a driving licence was 18 years. The majority of participants (67.2%)
had insufficient awareness about road traffic rules and 86.1% of them did not obey
traffic rules 41
.
A cross-sectional study conducted by Lakshmi R. Kalbandkeri in 2016 among
310 undergraduate medical students from M.R medical college, Kalaburagi. The
study showed that 91.1% of male students and 99.6% of female students had high
knowledge. The reasons for accidents were high speed (45.1%) and influence of
alcohol (22.9%) 42
.
Manjula R et al conducted a cross-sectional study in 2016 among 90
undergraduate medical students at Karnataka. The majority (91.1) of the students
knew the legal age for driving licence. 62.2 % of the participants knew the speed
limit. 81.1% of students knew that mobile phone usage while driving was punishable.
52.2% of participants did not know about the legal limit of alcohol consumption.
82.2% of the participants had good knowledge on road safety rules 43
.
Ramya M. S. et al conducted a cross-sectional study in 2017 among 540
undergraduate medical students at Bengaluru. Majority of students (99.2%) had
awareness about Traffic signal Rules. 98.8% of participants had awareness about
wearing a helmet while riding and 93.33 % gave way to an ambulance. 87.7% of the
students had known that alcohol consumption was dangerous while riding two-
wheelers. 86.2 % of riders had used hand signals while riding. 64.8 % of the students
knew that the hands-free use of mobiles was safe while riding 44
.
Mukhopadhyay conducted a cross-sectional study in 2017 among 200
undergraduate students in North India. Among the study participants, 71% had their
driving licence. The majority of the students (74%) were aware of the importance of
helmet use. More than 90% of girls were aware of the right way of overtaking and not
22
to use a mobile phone while riding vehicles compared to boys (72-80%). More than
90% of girls were aware of not to drive a vehicle while sick and after consumption of
alcohol, aware of common traffic signs, use spectacle while driving compared to boys
(72-74%) 45.
Din Prakash Ranjan et al conducted a cross-sectional study in the year 2017
among 372 pre-university college students in Raichur city, Karnataka. Among the
participants, 47.2% had inadequate knowledge about road traffic rules and
regulations. 55.4% of participants knew about the city speed limit. 33.8% of
participants had correct knowledge about traffic lights 46
.
3.7 STUDIES RELATED TO ATTITUDE TOWARDS ROAD
TRAFFIC RULES
Tanveer Kalantharakath and Ramya Iyer performed a cross-sectional study in
2013 from 22 Medical and 70 Dental college students of a University in Gujarat.
Among the participants, 75% of the riders opined that helmet use was important only
for long distance ride. 33.7% of the students strongly believed that persons were
likely to suffer from brain damage if happened to meet with an accident 47
.
Evangeline Mary et al conducted a cross sectional study in 2014 among 360
private and Government higher secondary school students in Chennai. Among the
study participants more than 50% of the students had positive attitude towards Road
safety and regulations 26
.
A cross-sectional study conducted in Trichy in the year 2015 by Karthikeyan
Kulothungan among 511 medical and engineering college students. 87.5% of the
students felt that the consumption of a minimal amount of alcohol was also not safe
while driving. 5% of participants told that there is no harm in consuming alcohol
23
before driving. While pedestrian crossing the road majority of the participants
(89.5%) either slow down their vehicle or horn or doing both 5.
A cross-sectional study conducted by Phanindra D et al in the year 2015
among 450 college students in Guntur city, Andhra Pradesh. 82 % of students did not
use mobile phones while riding. 55.11% of students thought that regular maintenance
of a vehicle was essential. 7.33% of students thought that there is no harm in listening
to music while riding 39
.
Manjula R et al conducted a cross-sectional study in 2016 among
undergraduate medical students at Karnataka. 88.9% of students had a good attitude
towards road traffic rules 43
.
Din Prakash Ranjan et al performed a cross-sectional study in the year 2017
among 372 pre-university college students in Raichur city, Karnataka. Among the
study participants more than 50% had a positive attitude towards road traffic rules and
regulations. 85.8% of participants thought that prime importance regarding road
safety must be given to the pedestrians. 62.1% of participants thought that following
traffic rules will reduce road traffic accidents 46
.
Suresh K. Sharma et al conducted a cross-sectional study in 2017 among 150
college students from medical and nursing sciences at All India Institute of Medical
Sciences, Uttarakhand. Among the study participants, 75.4% were good attitude
scores towards road safety practice 48
.
Bindhu Sharma et al conducted a descriptive study in 2018 among 250 vehicle
users in Chandigarh. The study participants were having a positive attitude towards
road traffic rules and regulations 49
.

24
Jacob and Rajeev conducted a descriptive study in a year 2018 among 100
college going students from selected college of Faridabad. Majority of the
participants(70%) had moderately favorable attitude toward road traffic rules 50
.
Amala shaji et al conducted descriptive study in 2019 among 100 teenagers in
Karnataka. Majority of the study participants (91%) had favorable attitude towards
road traffic rules 51
.
3.8 STUDIES ABOUT PRACTICE OF ROAD TRAFFIC RULES
Manoj Kumar et al conducted a cross-sectional study in the year 2011 among
students from the campus of Panjab university U.T. Chandigarh. Majority of male
students (45%) were using mobile phones while driving and habituated to violation of
traffic rules. Violation of traffic rules includes using mobile phones while riding two-
wheelers, not wearing a helmet while riding and crossing the roads at signal points at
the wrong time. The reason for accidents was over speeding and overtaking. Most of
the accidents happened in the evening hours between 5 PM to 7.30 PM 52
.
Kulkarni v et al conducted a cross-sectional study among 260 medical students
(2012) in coastal south India. In the previous year, 25% of participants were driving
after drinking. Only 20% of the participants were using mobile phones with hands-
free devices. 68% of the participants crossed speed limits on multiple occasions 37
.
Tanveer Kalantharakath and Ramya Iyer conducted a cross-sectional study in
2013 from 22 Medical and 70 Dental college students of a University in Gujarat.
More than half (57.6%) of the students were using their helmet daily. 21.7% of the
students used their bike commuting to college. 35.9 of students never wore a helmet,
30.4% of students always wore a helmet, 21.7% of students wearing a helmet only
when they ride on highways. 75% of students thought that helmets were important
only while riding long distances 47
.
25
Taranga Reang et al conducted a cross-sectional study in 2013 from Agartala
Government Medical College among 310 medical students. 3.3 % of students rode
after drinking, 8.2% of students used a mobile phone, 27.5 % of students exceeded the
speed limit, 83% of students were regularly maintaining their vehicle. 90.1% of
students used a helmet while riding, 18.7 % of students frequently overtook vehicle,
15.9% of students were frequently overtaking from left, 31.3% of students met with
an accident while riding 38
.
Lalitha D et al conducted a cross-sectional study in the year 2015 among 150
college students in Visakhapatnam. 66% of the students did not talk on mobile phones
while riding and 50% of them maintained a speed limit of 40-60 km/hour. (40)
Karthikeyan Kulothungan conducted a cross-sectional study in the year 2015
in Trichy among 511 medical and engineering college students. Among the study
participants, 37% had driving licence. The majority of the participants (65.6%) were
riding two-wheelers. 66.5% of the students drove their own vehicle. Vehicles were
insured by only 3.8% of students. One-third of the students (32.1%) said that they had
received information about first aid during their learning period. 48.3% of students
used to slow down their vehicles while seeing a yellow signal. 65.9 % of the students
were always using indicator before turning. Students were driving their vehicle with
maximum speed range of 61-80 km/hour. 67.1% of students never used a cell phone
while riding. (5)
A cross-sectional study was conducted by Phanindra Det al in the year 2015
among 450 college students in Guntur city, Andhra Pradesh. 79.11% of students had
their driving licence, 46% of students were wearing a helmet while riding. 52.44% of
students attended phone calls while riding, 51.33% of the students exceeded speed

26
limits. 20.44% of students were riding two-wheelers under the influence of alcohol.
49.77% of students drove the bike with more than two persons. (39)
In a cross-sectional study conducted by Manjula R et al in 2016 among
undergraduate medical students at Karnataka, 58.9% of students had good practice
towards road traffic rules and regulations 43
.
A cross-sectional study was conducted by Lakshmi R. Kalbandkeri in 2016
among 310 undergraduate medical students from M.R medical college, Kalaburagi.
Majority of the students (67.78%) said that the city speed limit range was 30-40
km/hour. Most of the students were overtaking on the right side while driving and
crossing the speed limit 42
.
J Mukhopadhyay conducted a cross-sectional study in 2017 among 200
undergraduate students in North India. About 32% of students did not use the helmet
as well as used to overtake incorrectly. About 64% of participants did not follow the
speed limit and lane discipline. 25% did not wear a helmet among those students
involved in accidents. The non-compliance of traffic rules was higher among boys 45
.
3.9 RISK FACTORS FOR RTA
In India, RTA results from various risk factors including the condition of the
road, the environmental factors, condition of the vehicle, the experience of the rider,
etc.
Age: Road traffic injuries are the leading cause of deaths among productive age
group which include children and young adults of 5- 29 years 17
. Mortalities due to
RTA are low among people above 60 years of age because of lesser mobility of the
people 18
.

27
Sex: Road traffic injuries are common among males. Literature shows that Road
traffic deaths had occurred among young males (under 25 years) about three quarters
(73%) 16
. Three out of four deaths due to RTA were among males 10
.
Socio-economic status: The majority of road traffic deaths had occurred in low
and middle-income countries. Even with high-income countries, road traffic injuries
are more likely among those from lower socioeconomic backgrounds 17
.
Climate: The extremes of weather influence the occurrence of RTAs. RTAs are
higher during May-June (temperature is extremely high) and December- January
(poor visibility on the road). Accidents are high during 9AM- 9PM and comparatively
low during midnight and early hours of the day 53
.
Human factors: Factors such as drunken driving, not using of helmets, not
following traffic rules, over speeding, reckless driving, low driving standards,
psychological factors (risk-taking), distraction while riding (mobile phones), defective
judgment and poor perception are contributing factors for road traffic accidents 54
.
Rider/ Pillion Rider: Most of the two wheeler riders are of younger age group.
Usually in the pillion occupants are children, females, and elderly persons. RTAs
occur due to lack of attention, slow reaction time, sudden heart attack, seizure
disorder, visual impairments of riders 18
.
Environmental factors: Factors such as defective roads, the defective layout of
crossroads, poor lighting, poor construction, low-quality roads, ditches, and potholes
are also contributing to road traffic accidents 54
.
Vehicle factors: the condition of the vehicle, excessive speed, a large number of
vehicles, and poorly maintained vehicles are contributing factors to road traffic
accidents 54
.

28
3.10 IMPACTS OF ROAD TRAFFIC ACCIDENTS
In the world, WHO estimated that about 1.3 million people die each year on
the roads. About 20 to 50 million people are injured and disabled due to RTA. Due to
rapid motorization, RTA burden in term of mortality and morbidity is very rapidly
increasing in developing countries. In India, with a population of more than one
billion is becoming the fastest economic growth in the world. This economic growth
leads to a rapid increase in vehicle production and sold every year. India has reported
one of the highest mortality rates in the world. For every death due to RTA, three
persons survived with permanent disability. Mild to severe injuries have a significant
social and economic impact on an individual level, family level, and community
level 25
.
In India, studies have shown that from 2003- 2013 (ten years) fatalities from
RTA had increased by 5 % per year while the population in our country has increased
only at 1.4% per year 53
.
India is growing economically. Road traffic accidents were also increasing
year by year. RTA creates hurdles in the nation's Economic growth. Every year
approximately 1.5 Million preventable deaths and disabilities happened in our
country. RTA affects all the peoples in the society irrespective of the socioeconomic
status, educational status and occupational status. The majority of them are involved
in the productive age group of 20-40 years and they are the earners of their family.
RTA is depleting the basic needs like health, nutrition, and education. RTA is not
only causing physical disability as well as causing economic disability also. Peoples
become poor after RTA. About Fifty percent of the families are selling their property
or borrowing money from others for the treatment of involved persons. In spite of
active treatment, one fourth to half of the RTA victims remain disabled either

29
temporarily or permanently. Due to RTA, India loses 3% of the GDP annually. In
India for the last ten years, road traffic accidents have doubled whereas in china RTA
have decreased one third 55
.
If the children involved in accidents, due to their softer heads leading to
produce severe head injuries compare to adults 19
. RTA can produce mental illness
such as post traumatic stress disorder. Non fatal injuries like fracture head injuries
also common among children 21
.
3.11 INDIA ROAD SAFETY PROJECT
The goal of Bloomberg Philanthropies Global Road Safety Programme in
India is to implement good road safety practices in India supported by the
Government of India along with national road safety strategy. The main focus of the
project is to promote helmet use and reduce drunken-drive. WHO conducted a review
of existing laws and regulations in the Government of India's Motor Vehicle Act, to
focus on drink-drive and wearing helmet. Two legislative amendments were proposed
in parliament. The amendment to the motor vehicle act which proposes for a road
traffic violation to increase fines, also address post-crash care and to set up an agency
for road safety 56
.
3.11.1 SOCIAL MARKETING
WHO produces mass media campaign after researching with the target
audience. The printed advertisements, radio spot has been developed and aired as of
this campaign 56
.

30
3.11.2 WORKING WITH MEDIA
Media is one of the important media for raising awareness among the public
and policymakers for policy changes 56
.
3.12 MOTOR VEHICLES ACT, 1988
The Motor Vehicles Act, 1988 is an act passed from parliament of India. This
act came into force from 1st July 1989. The Act regulates all the views of the vehicles
in road transport. The Motor Vehicles Act is the national law having authority of the
road safety. It covers issues like driving licence and behavior of users. It implements
regulations coming under the central motor vehicles rules of 1989. The act permits
state government s authority to follow own rules to set into practice. The Indian Penal
Code (IPC) criminalizes rash driving and dangerous driving according to the road
safety laws. So rash driving that endangers the life or safety of others or causes injury
can be prosecuted as homicide, murder, negligence if end in death. Under the road
safety law, individuals punishable for over speed, and drunken driving with blood
alcohol concentration above the permissible limits. The persons not following the
rules can be imprisoned for six months for first time making offence and three years
for second time making offence and fine. Under section 129 stats that while riding
two-wheeler in public must wear helmet. The Motor vehicle act under Section 112
states that a person should drive vehicle with in the permitted speed limit. The person
should not drive less than minimum speed and should not exceed maximum speed 23
.
3.13 DECADE OF ACTION ON ROAD SAFETY 2011-2020
The decade of action for road safety 2011-2020, was developed in March 2010
by the United Nations general assembly. The main pillars of activities are to build up
road safety management capacity, to enhance the road infrastructure safety and wider

31
transport network, vehicles safety, improving road safety behaviours, and improving
care of the victims. Decade of action provides a framework for Policy, Practice and
advocacy, guided by global plan to achieve the sustainable development goals 57
.
3.14 STATE ROAD SAFETY COUNCIL
State road safety council is a policy making body constituted under 215( 2) of
the motor vehicles act,1988. This is functioning under the chairmanship of honourable
transport minister and twenty members. Important function of this council is to review
all the programmes and policies related to road safety and also recommended to the
Government for implementation 36
.
3.15 ROAD SAFETY WEEK
In India the central government as well as state governments have been
implementing strategies to make safer roads. Road safety alone will not be sufficient
to reduce road traffic accidents. The society contribution in a larger extent can be
helpful to reduce RTA, So join hands together to make road safety a social movement.
Road safety week has been observed in India every year on date January 4.
Road safety is defined as type of safety or any type of security from the
accidents by which people should safely drive their vehicles on the road. Road safety
is important to protect people who drive and walk on the road from road accidents.
Road safety gives protection from unwanted accidents for everyone 58
.
The Ministry of Road transport and Highway(MORTH), Government of India,
observe road safety week every year. In 2019, 30th
road safety week was observed
from 4th
to 10th
February 2019. Theme for the year2018 as well as 2019 is „Sadak
Suraksha- Jeevan Raksha‟ 59
.

32
Road safety programmes are organized in various cities to make awareness
among people on road safety. This is observed for one week. During this one week
various campaigns are conducted; various banners regarding education, safety posters,
pamphlets, leaflets are distributed to the road travelers 60
.
3.16 VISION ZERO (VZ):
Vision zero is a multinational road traffic safety project. . The main aim of this
program is zero fatalities or serious injuries due to RTA. This policy was created in
Sweden and in 1997 which was adopted by the Swedish parliament. VZ redefines
road safety through Strategic principles.
The traffic system has to adapt to take better account of the needs, mistakes
and vulnerabilities of road users.
The level of violence that the human body can tolerate without being killed or
seriously injured forms the basic parameter in the design of the road transport system.
Vehicle speed is the most important regulating factor for safe road traffic. It
should be determined by the technical standard of both roads and vehicle so as not to
exceed the level of violence that the human body can tolerate 61
.
VZ redefines road safety by taking a public health approach to collisions, i.e.,
that they are a preventable health threat. As such, VZ explicitly states that
responsibility for road traffic collisions is shared between road users and system
designers.

33
4. MATERIALS AND METHODS
4.1 STUDY DESIGN
A Cross sectional study conducted among college students in Kanyakumari
district
4.2 STUDY SUBJECTS
Students were selected from various colleges in Kanyaumari district. The age
group of the study participants was between 18- 25 years. These students were
included from 1st year to final year of various courses. Both boys and girls were
enrolled in this study.
4.3 STUDY SETTING
All the colleges were selected from Kanyakumari district of Tamilnadu..
4.4 STUDY PERIOD
The study was done during the period of one and half year January 2018 to
June 2019.
4.5 INCLUSION CRITERIA
1. College going students of age group 18-25 years
2. College going students using two wheelers regularly (at least once a week)
3. Both boys and girls
4.6 EXCLUSION CRITERIA
1. Those college going students not willing to participate in this study
2. Those who are absent on the day of data collection
DEFINITIONS
Knowledge-Conceptual definition
“Knowledge is defined as expertise and skill acquired by a person through experience
or education; the theoretical or practical understanding of a subject.”

34
Operational definition of knowledge
Knowledge: “The term Knowledge in the study means the understanding of the
concept of road safety rules and regulations”, such as age of getting driver‟s license,
wearing helmets, identification of traffic signals, etc
Attitude-Conceptual definition
“Attitude is a way of thinking, a posture of the body ”.
Operational definition
Attitude is someone‟s opinion or feelings about road traffic rules and regulations.
Example: attitude towards using motorcycle helmet, listening music while riding, etc
Practice-Conceptual definition
“Practice is the action rather than theory of doing something”.
Operational definition
“The term practice in this study means the learning and acquiring experience to bring
about positive change in college students towards road safety rules and regulations”,
like putting a seatbelt, wearing a helmet etc.
4.7 SAMPLE SIZE
Sample size was calculated by using the formula n =
. where is taken
as 1.96, p is taken as 30 % based on a study on Knowledge Attitude and Practice of
road safety measures among college students in Visakhapatnam city by Lalitha.D et al
40.
n =
p=30%
q=100-p=100-30=70
d=20% of p =6
=233.33

35
Adding 5% to account for drop out if any and rounding off, hence the
final sample size is 250
4.8 SAMPLING TECHNIQUE
Multistage random sampling technique is used in this study
STAGE 1
List of all the colleges in the Kanyakumari district obtained from
Kanyakumari district statistical hand book 2016. (62) The list of the colleges from
Kanyakumari district, 5 colleges had been chosen using simple random sampling. The
selected colleges were Nesamony Memorial Christian College, Narayanaguru
Memorial Engineering College, Maria College of Engineering and Technology,
Lekshmipuram college of Arts and Science, Neyyoor, White Memorial Homeopathy
College.
STAGE 2
Permission had been obtained from the principal of each college chosen.
Using Attendance register as a baseline, list of the students regularly using two
wheelers had been obtained with the help of the college faculty. Using this list as the
sampling frame, 50 students had been chosen using simple random sampling from
each of the college, thus making a sample size of 250.
4.9 VARIABLES MEASURED
Socio-demographic characters
Knowledge of road traffic rules
Attitude of road traffic rules
Practice of road traffic rules
Prevalence of road traffic accident and associated factors

36
4.10 PROCEDURE IN DETAIL
250 college students were chosen from Kanyakumari district. From the
selected colleges, students regularly using two-wheelers were selected from
attendance register. From this list 50 students were selected for the study and obtained
the sample size of 250. Permission was obtained from the principal of the colleges.
After explaining the purpose of the study, informed written consent was obtained
from the study participants. Institutional Human Ethical Committee clearance was
obtained before starting the study. Semi structured question was administered to the
students after explaining about the study in detail.
The First part of the questionnaire consists of socio-demographic details of the
participants.
Socio-economic status was assessed by modified BG Prasad scale 2019.
Table no 1: Modified BG Prasad‟s socio-economic status scale
Per Capita Income (INR) Socio Economic Class
>7008 Upper class
3504-7007 Upper middle class
2102-3503 Middle class
1051-2101 Lower middle class
<1050 Lower class
4.10.1 SCORING OF KNOWLEDGE
Second part of the questionnaire consists of 11 questions to assess the
knowledge regarding road traffic rules and regulations. Scoring system was used to
score the participants‟ knowledge. Each correct response under the knowledge was
given one point whereas wrong response or not responding was given no mark. The
37
score of the individual participants was calculated. After that scoring, participants
were grouped into three categories. Those getting score 0-50% were classified into
those with inadequate knowledge, 51-70% classified into those with moderately
adequate knowledge, 71-100% classified into those with adequate knowledge.
4.10.2 SCORING OF ATTITUDE
Attitude was assessed by six questions related to helmet use, and hearing
music while riding. Scoring system was used to score the participants‟ attitude. Each
positive attitude towards road traffic rules was given one point whereas negative
attitude towards road traffic rules was given no mark. The individual participants‟
score was calculated. After that scoring, participants were classified into three
categories. Those getting score 0-50% classified into unfavorable Attitude, 51-70%
classified into moderately favorable Attitude, 71-100% classified into favorable
Attitude.
4.10.3 SCORING OF PRACTICE
Questions were asked to assess the practices with regards to using rear mirror,
practicing triples, response when seeing school sign, using helmet practice, racing
vehicle, response when blind person crossing the road, and time of indicator switch
on. Assessment of practice was done by scoring method. Each correct response under
practice was given one point whereas wrong response was given no mark. On the
basis of total score, participants were classified into three categories. Those getting
score 0-50% classified into poor practice, those getting 51-70% classified into good
practice, and those getting 71-100% were classified into best practice.

38
4.11 STATISTICAL METHODS OF ANALYSIS
i. Statistical tests used for data analysis:
Quantitative variables (mean, standard deviation, confidence interval): Age,
Sex, Socio-economic status, Occupation of father, Education of father,
Knowledge score.
Qualitative variables expressed in percentage
Chi square test used to find the association between dependent and
independent variables
Correlation used to find out association between variables
Software used for data entry: Study parameters were entered in Microsoft
Office Excel 2013
ii. Software used for statistical analysis: IBM Statistical Package for Social
Science Version 20.0

39
5. RESULTS
5.1 GENERAL INFORMATION
A cross sectional study was conducted among 250 college students in the age
group of 18- 25 years from Kanykumari district, Tamilnadu.
The results relevant to the objectives of the study are present under following
headings
1. Socio-demographic characteristics
2. Knowledge of road traffic rules
3. Attitude towards road traffic rules
4. Practice of road traffic rules
5. Prevalence of road traffic accidents
6. Factors associated with road traffic accidents
5.2 SOCIO-DEMOGRAPHIC CHARACTERISTICS
5.2.1 AGE DISTRIBUTION
Table no 2: Distribution of characteristics of Age
Age characteristics Value (years)
Mean age 19.9
Standard deviation 1.75
Minimum age 18
Maximum age 25
The age of the study group ranged from 18 to 25 years with mean age of 19.9
years with standard deviation of 1.75 years. Majority of the study participants
belonged to the age of 19years (27.2%) followed by 18 years (24.4%).

40
Figure no 7: Distribution of age
5.2.2 GENDER WISE DISTRIBUTION OF STUDY PARTICIPANTS
Among the 250 study participants 56.4 % (141) were boys and 43.6 % (109)
were girls.

41
Figure no 8: Shows sex distribution
5.2.3 AREA OF RESIDENCE
Among the 250 study participants 56% (140) of the students belonged to urban
area, 44% (110) of the students had come from rural area.
Figure no 9: Distribution of Study participants based on area of residence
56.40%
43.60% Boys
Girls
56%(140)
44%(110) Urban
Rural

42
5.2.4 RELIGION
Figure no 10: Distribution of the study participants based on religion
Majority of the study participants were Christians 51.2% (128), followed by
Hindus 44% (110), and Muslims 4.8% (12).
5.2.5 EDUCATION OF HEAD OF THE HOUSEHOLD
Table no 3: Distribution based on educational status of head of the household
Educational status Frequency Percentage
Profession 43 17.2
Graduate 69 27.6
Diploma 30 12
High school 57 22.8
Middle school 42 16.8
Primary school 5 2
Illiterate 4 1.6
Total 250 100
44%
51.20%
4.80%
Hindu
Christian
Muslim

43
Regarding educational status of the head of the household, 56.8% (142) were
above the high school education. 41.6% (104) were from high school, middle school
and primary school and 1.6% (4) were Illiterates.
5.2.6 OCCUPATION OF THE HEAD OF THE HOUSEHOLD
Table no 4: Distribution based on occupational status of the head of the
household.
Occupation Frequency Percentage
Legislator/ senior
officials 12 4.8
Professionals 67 26.8
Technician /Associate
professionals 57 22.8
Clerks 5 2
Skilled workers/ shop,
market sale worker 28 11.2
Skilled agricultural /
fishery worker 28 11.2
Graft related trade work 7 2.8
Plant /machine operator 15 6
Elementary occupation 17 6.8
Unemployment 14 5.6
Total 250 100
Regarding occupation of the head of the household, 26.8% (67) were
professionals followed by 22.8% (57) were technician/associate professionals.
Elementary occupations were 6.8% (17) and 5.6% (14) were unemployed.

44
5.2.7 SOCIO-ECONOMIC STATUS
Table no 5: Distribution of socio-economic status
Socio Economic Status Frequency Percentage
Upper class 118 47.2
Upper middle class 68 27.2
Middle class 31 12.4
Lower middle class 27 10.8
Lower class 6 2.4
Total 250 100
According to the BG Prasad‟s Socio-Economic status scale, 47.2% (118) of
the participants came from upper class, 27.2% belonged to the upper middle class,
12.4% to middle class, 10.8% (27) to lower middle class and 2.4% (6) of the
participants belonged to the lower socio-economic status.
5.2.8 TYPE OF FAMILY
Figure no 11: Shows type of family
89.20%(223)
10.80%(27)
Nuclear family
Joint family

45
Regarding type of the family 89.2% (223) belonged to nuclear family and
10.8% (27) belonged to joint family.
5.2.9 TOTAL FAMILY MEMBERS
Table no 6: Distribution according to total number of family members
Total family
members
Frequency Percent
4 4 1.6
34 34 13.6
147 147 58.8
48 48 19.2
12 12 4.8
3 3 1.2
2 2 0.8
250 250 100
Regarding the total family members, that was the range of minimum 2
members to maximum 8 members. 58.8% (147) of the family had four members and
0.8% (2) had 8 members in the family.

46
5.3 KNOWLEDGE ON ROAD TRAFFIC RULES
5.3.1 KNOWLEDGE ABOUT ONE WAY
Table 7: Distribution of knowledge regarding one way
Knowledge about one way Frequency Percentage
Parking is prohibited 82 32.8
Overtaking is prohibited 50 20
Should not drive in reverse gear 118 47.2
Total 250 100
Out of 250 college students 47.2% (118) knew that in a one way should not drive in
reverse gear.
5.3.2 KNOWLEDGE REGARDING FOOTPATH
Table no 8: Distribution of knowledge regarding pedestrian footpath
Knowledge regarding footpath Frequency Percentage
Should walk on the left side of the
road 145 58
Should walk on the right side of the
road 69 27.6
May walk on either side of the road 36 14.4
Total 250 100
Among 250 students only 27.6% (69) knew that in a road without footpath the
pedestrian should walk on right side of the road

47
5.3.3 KNOWLEDGE ABOUT FREE PASSAGE
Table 9: Distribution based on knowledge regarding free passage to the vehicles
Free passage should be
given to
Frequency Percentage
Police vehicle 9 3.6
Ambulance and fire
service vehicles 233 93.2
Super express buses 8 3.2
Total 250 100
Among 250 study participants 93.2% (233) students correctly knew that free
passage should be given to ambulance and fire service vehicles.
5.3.4 KNOWLEDGE ABOUT RESPONSE WHEN AMBULANCE
APPROACHES
Table 10: Distribution based on knowledge regarding response when ambulance
is approaching.
When ambulance is approaching Frequency Percentage
Allow passage if there are no
vehicle from front side 49 19.6
No preference need to be given 14 5.6
Allow free passage by drawing
vehicle to the side of the road 187 74.8
Total 250 100
Among the 250 study participants 74.8% (187) of the students knew that free
passage should be allowed by drawing the vehicle to the side of the road when an
ambulance approaches.

48
5.3.5 KNOWLEDGE REGARDING OVERTAKING A VEHICLE
Table no 11: Distribution based on knowledge about overtaking a vehicle
When overtaking is prohibited Frequency Percentage
When it likely to cause
inconvenience or danger to other
traffic
149 59.6
When the vehicle in front reducing
speed 53 21.2
During night 48 19.2
Total 250 100
Among the study participants 59.6% (149) knew overtaking was prohibited
when likely to cause inconvenience or danger to other traffic.
5.3.6 KNOWLEDGE REGARDING ACTION BEFORE OVERTAKING A
VEHICLE
Table no 12: Distribution based on knowledge regarding action before
overtaking a vehicle.
Before overtaking a vehicle to
ensure that
Frequency Percentage
No vehicle is approaching from
behind 49 19.6
See that the road is clearly visible
and it is safe to overtake 171 68.4
The vehicle in front turning left 30 12
Total 250 100
Among the participants 68.4% (171) knew that before overtaking a vehicle
should see that the road is clearly visible and it is safe to overtake.

49
5.3.7 KNOWLEDGE REGARDING TRIPLES IN A TWO-WHEELER
Table no 13: Distribution based on knowledge regarding triples in a two-wheeler
Triples in two wheelers Frequency Percentage
Allowed in unavoidable
circumstances 45 18
Violation of law 163 65.2
Allowed when the traffic is
less 42 16.8
Total 250 100
Among the study participants 65.2% (163) correctly knew that triples in a two-
wheelers was violation of law.
5.3.8 KNOWLEDGE REGARDING ACCIDENT REPORTING
Table no 14: Distribution based on knowledge regarding when a motor vehicle
involved in an accident
Time to report when vehicle
involved accident
Frequency Percentage
Report to the nearest police
station within 24 hours 85 34
Within 12 hours 151 60.4
Within 48 hours 14 5.6
Total 250 100
Among the study participants 34% reported to the police station within 24
hours following accident. 60.4% reported to the police station within 12 hours and
5.6% reported within 48hours following accident.

50
5.3.9 KNOWLEDGE REGARDING HAND SIGNAL
Among the 250 study participants 43.2% of the students knew hand signal
should be given only on right hand.
Table no 15: Distribution based on knowledge about hand signal
While riding two-
wheeler hand signal
given by
Frequency Percentage
Only left hand 49 19.6
Only right hand 108 43.2
Both hands 93 37.2
Total 250 100
5.3.10 KNOWLEDGE REGARDING PILLION RIDER AND ACCESSORIES
IN TWO WHEELER
Among the college students 88.4% knew to carry a pillion rider in a two-wheeler, the
two-wheeler must have foot rest, hand grip and sari guard.
Table no 16: Distribution based on knowledge regarding to carry a pillion rider,
motor cycle must provided
To carry pillion rider
motor cycle provided
with
Frequency Percentage
Foot rest alone 18 7.2
Hand grip alone 11 4.4
Foot rest, hand grip, sari
guard 221 88.4
Total 250 100

51
5.3.11 KNOWLEDGE REGARDING MINIMUM DISTANCE BETWEEN
VEHICLES
Among the study participants only 36% correctly answered that the minimum
distance to be kept from vehicle going in front was to keep safe distance according to
speed. Majority (52.8%) of them answered 10 meters.
Table no 17: Distribution based on knowledge regarding the minimum distance
to be kept from vehicle going in front
Minimum distance to be kept
from the vehicle in front
Frequency Percentage
10 meters 132 52.8
20 meters 21 8.4
30 meters 7 2.8
Safe distance according to speed 90 36
Total 250 100
5.3.12 KNOWLEDGE SCORE
On the basis of score, knowledge of the participants were divided into
inadequate knowledge, moderately adequate knowledge, and adequate knowledge.
Those scoring 0-50% labeled as inadequate knowledge, those scoring 51-70% labeled
as moderately adequate knowledge, and those scoring 71-100% were labeled as
adequate knowledge regarding road traffic rules.

52
Figure no 12: Knowledge Score
Among the study participants 52.4% (131) had moderately adequate
knowledge regarding road traffic rules. 21.6% (54) of participants had adequate
knowledge and 26% (65) of students had inadequate knowledge regarding road traffic
rules.
5.4 ATTITUDE TOWARDS ROAD TRAFFIC RULES
5.4.1 ATTITUDE TOWARDS WRONG DRIVE IN ONE WAY
Table no 18: Distribution of attitude towards wrong drive in one way
Whether driving in
wrong way in one way is
right
Frequency Percentage
Yes 53 21.2
No 197 78.8
Total 250 100
Among the 250 study participants, 78.8%(197) of students did not drive in
wrong way in one way signal even when there is no traffic in one way. Only 21.2%
(53) of the students told that it is safe to drive in wrong way in one way signal.
26.0%(65)
52.40%(131)
21.60%(54)
Inadequate
Moderately adequate
Adequate

53
5.4.2 ATTITUDE TOWARDS DRIVING SPEED WHEN ROAD IS CLEAR
Table no 19: Distribution based on attitude towards driving speed
Whether it is right to drive very
fast if the road is clear
Frequency Percentage
Yes 87 34.8
No 163 65.2
Total 250 100
Among the 250 study participants 65.2% (163) did not drive very fast even
when the road is clear. They were obeying speed limits. 34.2% (87) were driving very
fast if the road is clear.
5.4.3 ATTITUDE TOWARDS DRUNKEN-DRIVING
Table no 20: Distribution based on attitude towards drunken- diving
Is it right to drive after drinking
if hands and vision are steady
Frequency Percentage
Yes 46 18.4
No 204 81.6
Total 250 100
Among 250 college students, 81.6% (204) of the participants were not driving
after drinking even when their hand and vision steady. 18.4% (46) of the participants
told that they were driving after drinking if their hands and vision were steady.
54
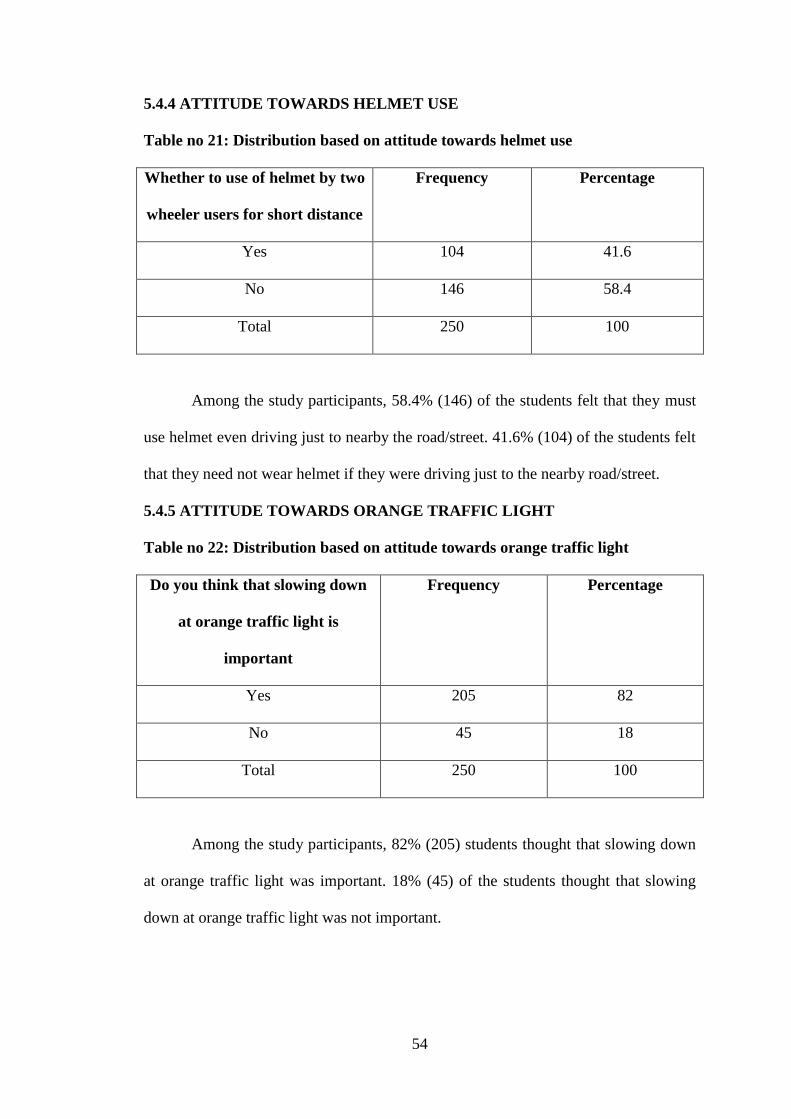
5.4.4 ATTITUDE TOWARDS HELMET USE
Table no 21: Distribution based on attitude towards helmet use
Whether to use of helmet by two
wheeler users for short distance
Frequency Percentage
Yes 104 41.6
No 146 58.4
Total 250 100
Among the study participants, 58.4% (146) of the students felt that they must
use helmet even driving just to nearby the road/street. 41.6% (104) of the students felt
that they need not wear helmet if they were driving just to the nearby road/street.
5.4.5 ATTITUDE TOWARDS ORANGE TRAFFIC LIGHT
Table no 22: Distribution based on attitude towards orange traffic light
Do you think that slowing down
at orange traffic light is
important
Frequency Percentage
Yes 205 82
No 45 18
Total 250 100
Among the study participants, 82% (205) students thought that slowing down
at orange traffic light was important. 18% (45) of the students thought that slowing
down at orange traffic light was not important.

55
5.4.6 ATTITUDE TOWARDS LISTENING TO MUSIC WITH EAR PHONE
WHEN RIDING TWO-WHEELER
Table no 23: Distribution based on attitude towards listening music with ear
phone while riding.
There is no harm in listening to
music with ear phone when riding
two-wheeler
Frequency Percentage
Yes 37 14.8
No 213 85.2
Total 250 100
Among the study participants, 85.2% (213) of the participants thought that it
was not safe to listen music using ear phone while riding two-wheeler. 14.8% (37) of
the participants thought that listening music with ear phone was safe while riding two-
wheeler.
5.4.7 ATTITUDE SCORE
Figure no 13: Attitude score
18.80%(47)
22.40%(56)
58.80%(147)
Unfavorable Attitude
Moderately favorable
Attitude
Favorable Attitude

56
Among the study participants, 18.8% (47) of the students had unfavorable
attitude towards road traffic rules. 22.4% (56) of the students had moderately
favorable attitude towards road traffic rules. 58.8% (147) students had favorable
attitude towards road traffic rules.
5.5 PRACTICES TOWARDS ROAD TRAFFIC RULES
5.5.1 PRACTICE REGARDING TRIPLES
Table no 24: Distribution based on practice regarding triples in two-wheeler
Practice of triples in two-
wheeler
Frequency Percentage
Yes 65 26
No 185 74
Total 250 100
Among the study participants, 74% (185) of the participants did not practice
triples in two-wheeler. 26% (65) of the participants practiced triples in two-wheeler.
5.5.2 PRACTICE REGARDING USE OF REAR MIRROR
Table no 25: Distribution of practice regarding use of rear mirror
Usage of rear mirror Frequency Percentage
Always 125 50
Occasionally 65 26
Rarely 34 13.6
Never 26 10.4
Total 250 100

57
Among the study participants, 50% (125) of the participant‟s always used rear
mirror while riding two- wheeler. 26% (65) of the participants were occasionally
using rear mirror, 13.6% (34) of the participants rarely were using rear mirror, and
10.4% (26) were never using rear mirror while riding two-wheeler.
5.5.3 PRACTICE REGARDING THE RESPONSE WHEN TO SEE THE
SCHOOL TRAFFIC SIGN.
Table no 26: Distribution based on response when to see the school traffic sign
Practice on when to look for a
school sign
Frequency Percentage
Stop the vehicle, sound horn and
proceed
57 22.8
Slow down and proceed with caution 165 66
Sound horn continuously and proceed 28 11.2
Total 250 100
Among the study participants, 66% (165) of the participants slowed down
when they saw a school sign and proceeded with caution. 22.8% (57) of the
participants practiced to stop the vehicle sound horn and proceeding. 11.2% (28) of
the participants practiced to sound horn continuously and proceeding.

58
5.5.4 PRACTICE REGARDING HELMET- WEARING
Table no 27: Distribution based on practice regarding helmet wearing
Practice on helmet wearing Frequency Percent
Always 125 50
Occasionally 61 24.4
Rarely 45 18
Never 19 7.6
Total 250 100
Among the study participants, 50% (125) always wore helmet while riding
two-wheeler. 24.4% (61) of the participants‟ occasionally wore helmet, 18% (45) of
the participants rarely wore helmet, and 7.6% (19) of the participants‟ never wore
helmet while riding two-wheeler.
5.5.5 PRACTICE REGARDING WHEN BLIND PERSON CROSSES THE
ROAD HOLDING WHITE CANE
Table no 28: Distribution based on practice when blind person crosses the road
Practice on when a blind person
crosses the road
Frequency Percent
Stop vehicle and let them cross 158 63.2
Blow the horn and proceed as usual 26 10.4
Slow down and proceed with caution 66 26.4
Total 250 100

59
When a blind person crosses the road holding white cane in his hand, 63.2%
(158) of the participants stopped the vehicle and allowed them to cross the road.
10.4% (26) of the participants blew the horn and proceeded as usual. 26.4% (66) of
the participants slowed down and proceeded with caution.
5.5.6 PRACTICE ON SEEING AN ORANGE SIGNAL
Table no 29: Distribution based on practice regarding seeing an orange signal
Practice on when to see a
orange light
Frequency Percentage
Cross as fast as possible 52 20.8
Cross normally if no vehicle is there 119 47.6
Cross normally 43 17.2
Stop 36 14.4
Total 250 100
Among the study participants when they see an orange signal, 20.8% (52)
practiced to cross as fast as possible. 47.6% (119) of the participants crossed normally
when there were no vehicle in signal. 17.2% (43) of the participants crossed the signal
normally. Only 14.4% (36) of the participants stopped their vehicle and correctly
obeyed traffic rules.
5.5.7 PRACTICE REGARDING VEHICLE RACING
Table no 30: Distribution based on practice regarding racing
Practice of racing vehicle Frequency Percentage
Yes 67 26.8
No 183 73.2
Total 250 100

60
Among the study participants, 26.8% (67) raced their vehicle while riding.
73.2% (183) of the study participants never raced their vehicle while riding two-
wheeler.
5.5.8 PRACTICE REGARDING OVERTAKING A VEHICLE ENSURING
OPPOSITE LANE IS CLEAR
Table no 31: Distribution based on practice while overtaking a vehicle
While overtaking to see
the opposite lane is clear
or not
Frequency Percentage
Always 146 58.4
Occasionally 44 17.6
Rarely 44 17.6
Never 16 6.4
Total 250 100
Among the study participants, 58.4% (146) of the students always ensured that
opposite lane was free while overtaking a vehicle. 17.6% (44) of the participants
ensured occasionally that opposite lane was free while overtaking. 6.4% (16) of the
students never ensured that opposite lane was free while overtaking vehicle.

61
5.5.9 PRACTICE REGARDING WHEN TO SWITCH ON THE INDICATOR
Table no 32: Distribution based on practice regarding when to switch on the
indicator
Practice of switch on the indicator Frequency Percentage
Always just before turning 98 39.2
Always at-least 30 meters before 125 50
Occasionally if I remembered 26 10.4
Never 1 0.4
Total 250 100
Among the study participants, 39.2% (98) of the students always switched on
the indicator just before turning. 50% (125) of the students switched on the indicator
always at-least 30 meters before turning. 10.4% (26) of the students were occasionally
switch on the indicator if they remember. 0.4% (1) students never switch on the
indicator before turning.
5.5.10 PRACTICE REGARDING OVERTAKING FROM LEFT SIDE
Table no 33: Distribution based on practice on overtaking the vehicle from left
side.
Practice on overtaking from left side
of the vehicle
Frequency Percent
Mostly 45 18
Occasionally 61 24.4
Rarely 56 22.4
Never 88 35.2
Total 250 100

62
Among the study participants, 18% (45) of the participants were mostly
overtaking vehicle from left side. 24.4% (61) of the participants were occasionally
overtaking the vehicle from left side. 22.4% (56) of the participants were rarely
overtaking the vehicle from left side. 35.2% (88) of the participants were never over
taking the vehicle from left side.
5.5.11 PRACTICE SCORE
Figure no 14: Distribution based on practice score
Among the study participants, 47.20% (118) of the participants had poor
practice towards road traffic rules, 34.80% (87) participants had good practice
towards road traffic rules , 18% (45) of the participants had best practice towards road
traffic rules.
47.20%(118)
34.80%(87)
18%(45)
Practice score
Poor practice
Good practice
Best practice

63
5.6 OWNER OF TWO-WHEELER AND USAGE
Table no 34: Distribution based on two-wheeler usage and the ownership of the
vehicle
Usage and ownership of the
vehicle
Frequency Percentage
Own 98 39.2
Family members 130 52
Friends/relatives 22 8.8
Total 250 100
Among the study participants, 39.2% (98) students used their own two-
wheeler for riding regularly. 52% (130) of the students were regularly using two-
wheelers of family members for riding. 8.8% (22) of the students were using two-
wheelers of friends/ relatives for riding regularly.
5.7 MAXIMUM SPEED DRIVEN
Table no 35: Distribution based on maximum speed rode by the participants
Speed (KM/ HOUR) Frequency Percentage
<40 40 16.0
41-60 120 48.0
61-80 47 18.8
81-100 24 9.6
>100 19 7.6
Total 250 100

64
Among the study participants, 16% (40) of the participants rode maximum
speed of less than 40 Kms/Hour. 48% (120) of the participants rode maximum speed
of 41-60 Kms/Hour. 18.8% (47) of the participants rode maximum speed of 61-80
Kms/Hour. 96% (24) of the participants rode maximum speed of 81-100 Kms/Hour.
7.6% (19) of the participants rode the vehicle with the speed more than 100
Kms/Hour.
5.8. PREVALENCE OF ROAD TRAFFIC ACCIDENT
5.8.1 PREVALENCE OF ACCIDENT
Table no 36: Distribution based on accident involved in the past two years
Accidents involved in the
past 2 years
Frequency Percentage
Yes 50 20
No 200 80
Total 250 100
Among 250 students, 20% (50) of the students were involved in accidents in
the past two years. 80% (200) of the students were never involved in any accident in
the past two years.
5.8.2 DRIVING DURING ACCIDENT
Table no 37: Distribution based on whether driving while involved in accident
Whether driving while
involving accident
Frequency Percentage
Yes 39 78
No 11 22
Total 50 100
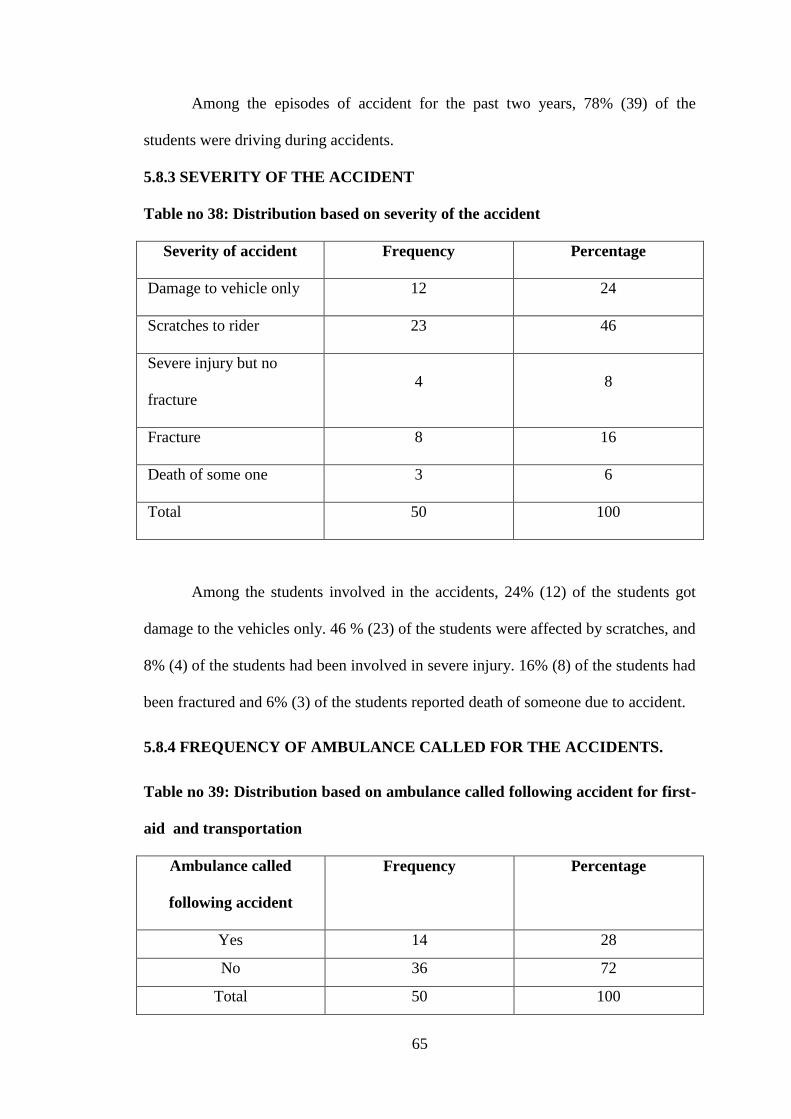
65
Among the episodes of accident for the past two years, 78% (39) of the
students were driving during accidents.
5.8.3 SEVERITY OF THE ACCIDENT
Table no 38: Distribution based on severity of the accident
Severity of accident Frequency Percentage
Damage to vehicle only 12 24
Scratches to rider 23 46
Severe injury but no
fracture
4 8
Fracture 8 16
Death of some one 3 6
Total 50 100
Among the students involved in the accidents, 24% (12) of the students got
damage to the vehicles only. 46 % (23) of the students were affected by scratches, and
8% (4) of the students had been involved in severe injury. 16% (8) of the students had
been fractured and 6% (3) of the students reported death of someone due to accident.
5.8.4 FREQUENCY OF AMBULANCE CALLED FOR THE ACCIDENTS.
Table no 39: Distribution based on ambulance called following accident for first-
aid and transportation
Ambulance called
following accident
Frequency Percentage
Yes 14 28
No 36 72
Total 50 100

66
Following accidents, 28% (14) of the participants called ambulance for first
aid and transportation.
5.8.5 FOLLOWING ACCIDENT TIME TAKEN FOR THE AMBULANCE TO
REACH THE SPOT
Table no 40: Time taken for the ambulance to reach the spot
Time taken to reach the spot Frequency Percentage
0 36 72
10 7 14
15 2 4
30 2 4
40 1 2
50 1 2
60 1 2
Total 50 100
Following accident 72% (36) did not call for the ambulance service. 28% (14)
called for the ambulance. The ambulance had reached the accident spot between 10
minutes to 60 minutes.

67
5.8.6 FOLLOWING ACCIDENT TIME TAKEN THE AMBULANCE TO
REACH THE HOSPITAL
Table no 41: Time taken for the ambulance to reach the hospital
Time taken to reach the
hospital
Frequency Percentage
0 36 72
10 7 14
15 2 4
30 2 4
40 1 2
50 1 2
60 1 2
Total 50 100
Following accident the time taken for the ambulance to reach the hospital from
accident spot varied. The time taken varied from one minute to 60 minutes to reach
the hospital depending upon the distance from the hospital.
5.8.7 HOSPITALIZED FOLLOWING ACCIDENT
Table no 42: Distribution based on need of hospitalization following accident
Following accident
whether hospitalized
Frequency Percentage
Yes 22 44
No 28 56
Total 50 100
Following accident, 44% (22) of the affected persons were hospitalized.

68
5.8.8 CONDITION OF THE ROAD AT THE SPOT
Table no 43: Distribution based on the condition of the road at the accident spot
Condition of the road Frequency Percentage
Good 21 42
Broken 27 54
No road 2 4
Total 50 100
Among the students involved in accident, the condition of the road at the
accident spot was evaluated. 42% (21) of the students involved in accident told that
the road was good at the time of accident. 54% (27) of the students reported that the
road was broken, and 4% (2) of the students told that there was no road at all.
5.8.9 TIME OF ACCIDENT
Table no 44: Distribution based on of time of the accident
Time of accident Frequency Percentage
Day 16 32
Night 17 34
Evening 11 22
Early morning 6 12
Total 50 100
Among the students involved in accident, 32% (16) of the students told that
accidents happened during day time. 34% (17) of the students told that accidents
happened during night time. 22% (11) of the students told that accidents happened
during evening and 12% (6) told that accidents were happened during early morning.

69
5.8.10 WEATHER CONDITION DURING ACCIDENT
Table no 45: Distribution based on weather condition during time of accident
Weather condition
during accident
Frequency Percentage
Raining 20 40
Wet 11 22
Dry 19 38
Total 50 100
Among the students involved in accidents, 40% (20) of the accidents happened
during raining hours. 22% (11) of the accidents happened on wet condition and 38%
(19) of the accidents were happened during dry condition.
5.8.11 TRAFFIC DURING ACCIDENT
Table no 46: Distribution based on traffic during accident
Traffic during accident Frequency Percentage
Heavy traffic 15 30
Slow traffic 23 46
No traffic 12 24
Total 50 100
Among the students involved in accident, 30% (15) of the students
experienced heavy traffic during accident time. 46% (23) of the students experienced
slow traffic during accident and 24% (12) experienced no traffic during accident.

70
5.8.12 FAULT IN VEHICLE
Table no 47: Distribution based on fault in vehicle
Fault in vehicle during
accident
Frequency Percentage
Yes 21 42
No 29 58
Total 50 100
Among the students involved in accidents, 42% (21) told that there was a fault
in vehicle during accident.
5.8.13 SPEED DURING ACCIDENT
Table no 48: Distribution based on speed during accident
Speed during accident Frequency Percentage
Within normal limit 26 52
High speed 24 48
Total 50 100
Among the students involved in accident, 52% (26) of the students rode their
vehicle within normal speed limits. Meanwhile 48% (24) of the students rode their
vehicle in high speed.

71
5.8.14 LIGHTING OF THE ROAD DURING ACCIDENT
Table no 49: Distribution based on lighting of the road during accident
Lighting of the road Frequency Percentage
Good 34 68
Poor 16 32
Total 50 100
Among the students were involved in accident, 68% (34) of the students told
that there was good lighting in the road during accident. 32% (16) of the students told
poor lighting in the road during accident.
5.8.15 USING MOBILE PHONE DURING ACCIDENT
Table no 50: Distribution based on using mobile phone at the time of accident
Using mobile phone
during accident
Frequency Percentage
Yes 12 24
No 38 76
Total 50 100
Among the students involved in accident, 24% (12) of the students were using
mobile phone at the time of accident. 76% (38) of the students did not use mobile
phone at the time of accident.

72
5.8.16 ALCOHOL CONSUMPTION DURING ACCIDENT
Table no 51: Distribution based on alcohol consumption just before accident
Alcohol consumption
during accident
Frequency Percentage
Yes 7 14
No 43 86
Total 50 100
Among the students involved in accident, majority (86%) did not consume
alcohol immediately before the accident. 14% (7) of the students consumed alcohol
just before accident.
5.8.17 HELMET USAGE AT THE TIME OF ACCIDENT
Table no 52: Distribution based on helmet usage at the time of accident
Helmet usage at the time
of accident
Frequency Percentage
Yes 20 40
No 30 60
Total 50 100
Among the students involved in accident, 40% (20) of the students used
helmet during accident. Majority (60%) of them did not wear helmet during accident.

73
5.8.18 ASSOCIATION BETWEEN KNOWLEDGE AND PREVALENCE OF
ACCIDENT
Table no 53: Association of knowledge and prevalence of accidents
Knowledge
Accident
Total Yes No
Inadequate 22 43 65
Moderately
adequate
21 110 131
Adequate 7 47 54
Total 50 200 250
χ2 =10.75 df=2 p=0.05
In this study it was found that knowledge score had a statistically significant
association with prevalence of accidents with χ2
value of 10.75 and p <0.05
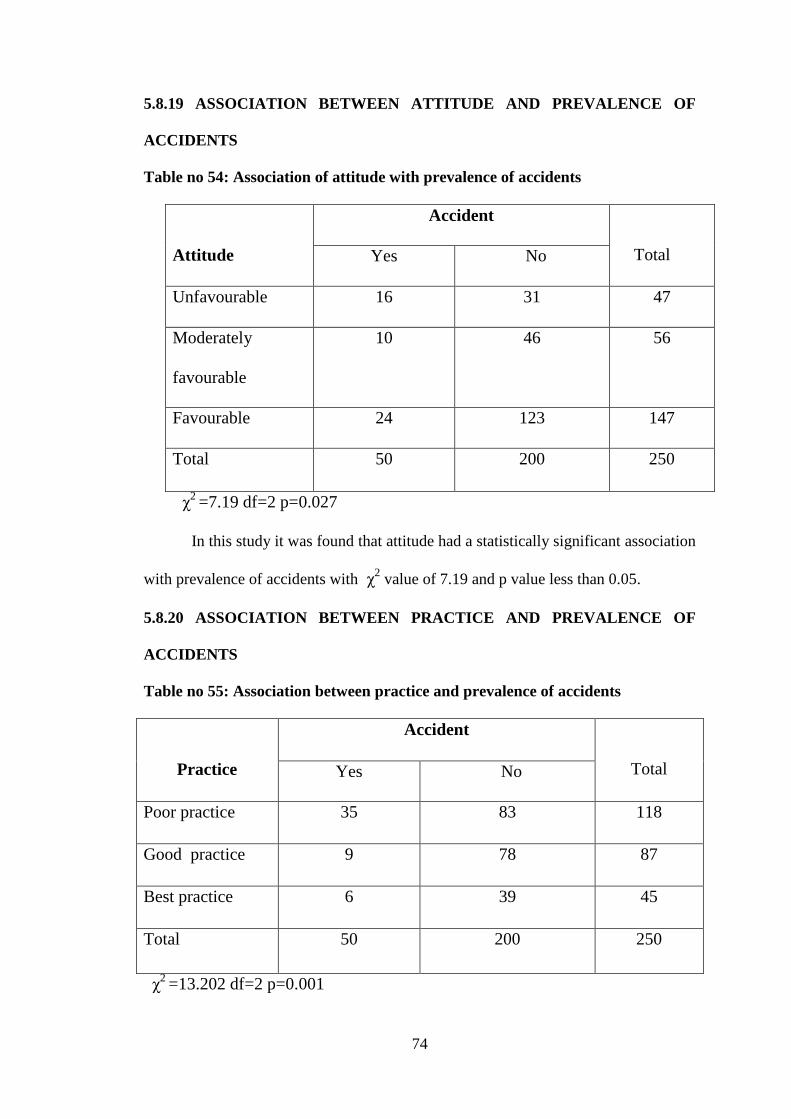
74
5.8.19 ASSOCIATION BETWEEN ATTITUDE AND PREVALENCE OF
ACCIDENTS
Table no 54: Association of attitude with prevalence of accidents
Attitude
Accident
Total Yes No
Unfavourable 16 31 47
Moderately
favourable
10 46 56
Favourable 24 123 147
Total 50 200 250
χ2 =7.19 df=2 p=0.027
In this study it was found that attitude had a statistically significant association
with prevalence of accidents with χ2 value of 7.19 and p value less than 0.05.
5.8.20 ASSOCIATION BETWEEN PRACTICE AND PREVALENCE OF
ACCIDENTS
Table no 55: Association between practice and prevalence of accidents
Practice
Accident
Total Yes No
Poor practice 35 83 118
Good practice 9 78 87
Best practice 6 39 45
Total 50 200 250
χ2 =13.202 df=2 p=0.001
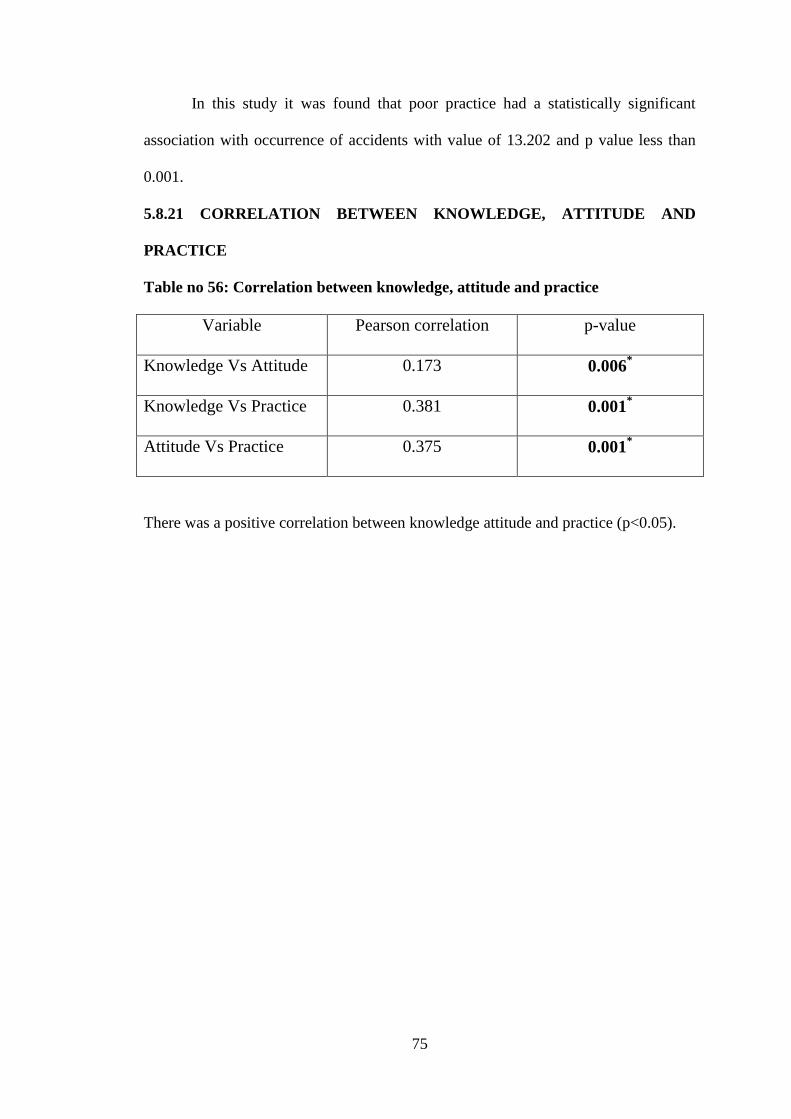
75
In this study it was found that poor practice had a statistically significant
association with occurrence of accidents with value of 13.202 and p value less than
0.001.
5.8.21 CORRELATION BETWEEN KNOWLEDGE, ATTITUDE AND
PRACTICE
Table no 56: Correlation between knowledge, attitude and practice
Variable Pearson correlation p-value
Knowledge Vs Attitude 0.173 0.006*
Knowledge Vs Practice 0.381 0.001*
Attitude Vs Practice 0.375 0.001*
There was a positive correlation between knowledge attitude and practice (p<0.05).

76
6. DISCUSSION
The present study was done to assess the knowledge, attitude, and practice of
road traffic rules among college students who were regularly using two wheelers in
Kanyakumari district of Tamil Nadu. The study was done among 250 college students
of age 18 – 25 years. Manjula et al had done a study in Karnataka reported majority of
the participants from age group of 18-22years 43
. Reang and Tripura had done a study
in Tripura reported that majority of the participants were of the age group of 18- 25
years 38
.
In the present study majority of the participants were boys (56.4%), than girls
(43.6%). Manjula et al had reported majority of the participants were male than
females.(43) Majority of the participants were males (51.8%) in a study conducted in
Trichy by Kulothungan et al 5.
In the present study majority of the participants belonged to urban area (56%).
Kulothungan et al reported majority of the participants were from rural
area (69.47%) 5. Reang and Tripura found that 53.2% of the males and 69% of females
belonged to urban area. 38
. Kalbandkeri et al had conducted a study in M R Medical
College, reported that majority of the study participants were from urban area 42
.
In the present study majority of the participants belonged to upper class
(class I) based on BG Prasad Socio economic status scale. A study conducted in
Visakapatinam by Lalitha had reported that majority of the participants belonged to
upper class (class I).
In the present study among all the participants, 52.4% had moderately
adequate knowledge, 21.6% had adequate knowledge and 26% had inadequate
knowledge regarding road traffic rules and regulations.

77
Kulkarni et al reported that more than 50% of the students had better
knowledge regarding road traffic signs. This finding was similar to present study 37
.
Nikumb et al found that more than 95% of the participants had adequate knowledge
regarding road safety measures 33
. Phanindra et al found that majority of the
participants had very poor knowledge in identifying traffic signs 39
. Emmily et al
reported 99% of the participants had heard about road traffic rules and regulations.
51.3% of the participants had average knowledge regarding road traffic accidents 63
.
These differences were due to lack of knowledge regarding road traffic rules and
regulations.
Ranjan et al reported 52.8% of the participants had adequate knowledge on
road safety rules and regulations. 99.4% of the participants knew that wearing helmet
is important while riding two-wheelers 46
. Kalbandkeri et al reported majority of the
participants (>90%) had high knowledge regarding road safety rules. Majority of the
students told that the reason for accidents was high speed 42
.
In the current study 74.8% of the participants reported that it is important to
give way to ambulance the ambulance was approaching. 88.1% of the participants
gave way to ambulance in the study conducted by Reang and Tripura. 81.8% of the
males and 71.7% females had better knowledge. This knowledge score was higher
than present study 38
. Redhwan et al reported that 78% of the students had moderate
knowledge regarding road traffic rules. This knowledge was also higher than present
study 64
.
In the current study 58.8% of the participants had favorable attitude, 22.4%
had moderately favorable attitude, and 18.8% had unfavourable attitude towards road
traffic rules. In the present study 34.8% of the participants had good practice, 18%
had best practice, and 47.2% had poor practice towards road traffic rules.

78
Manjula et al reported 88.9% of the participants had good attitude towards
RTA and 58.9% of the participants had good practice towards road traffic rules 43
.
Phanindra et al reported that majority of the study participants had appropriate attitude
towards road safety 39
. In the present study 58.8% of the participants had favorable
attitude towards road traffic rules. Ranjan et al reported that more than 50% of the
participants had positive attitude towards road traffic rules 46
. This result was similar
to the current study. Kalantharakath et al reported that 75% of the participants agreed
helmets were important for only those riding bike in a long distance. The participants
had positive attitude towards helmet use 47
.
In the current study 48% of the participants rode the vehicle with the
maximum speed between 41-60 kms /hour. Kulothungan et al reported that 15.7% of
the participants rode the vehicle between 41-60 kms/hour. The reason for this
difference was due to the fact that majority of them were obeying speed limit.
In the current study 14.4 % of the participants slow down/stop the vehicle
when yellow signal is on. Kulothungan et al reported that 48.3% of the participants
slow down the vehicle when yellow signal is on 5. The reason for this was due to
either lack of knowledge or not obeying traffic signals.
In the current study 50 % of the participants always switched on the indicator
at least 30 meters before turning. Kulothungan et al reported that 65.9% of the
participants always switched on the indicator before turning 5. The reason for this
difference was not obeying traffic signs in the present study.
In the current study 50% of the participants were always wearing helmet
while riding two-wheelers. Kulothungan et al reported that only 24.3% of the
participants always used helmet while riding 5. Sreedharan et al reported only 26.9 %

79
of the participants were using helmet while riding two-wheelers 65
. Ranjan et al
reported that 22.4% of the participants wore helmet while riding two-wheelers.
Phanindra et al reported 46% of the participants were wearing helmet while riding 39
.
In the current study prevalence of accident were 20%. Emmily et al found that
55% of the participants involved in road traffic accidents of which 60% of the
accidents were due to two-wheelers 63
. This prevalence of accidents was higher than
that of the present study. The reason was lack of awareness regarding road traffic
rules.
The causes of road traffic accidents were lack of awareness regarding road
traffic rules, drunken-driving, high speed and use of mobile phone while riding
vehicle. Mukhopadhyay reported the cause of road traffic accidents was wrong
overtaking, use of mobile phone while riding and high speed skids 45
. Manjula et al
reported the prevalence of accident was 13.3% 43
.
Ramya et al reported that jumping traffic signal and trying hands free riding as
the reasons for RTA. Majority ((90.92%) of the participants gave way to the
ambulance. This finding was higher than that of the present study. The reason for the
difference was the better knowledge of the participants regarding ambulance
services44
.
Pranab Jyoti Bhuyan reported that the reason for road traffic accidents was
drunken driving. The frequency of accidents was a little higher during December to
January 29
.
Seethalakshmi et al reported majority of the accidents happened during 6 PM
to 10 PM. 18
. This findings were similar to that of the present study.

80
7. SUMMARY
A cross sectional study was carried out among college students who were
regularly using two-wheelers in Kanyakumari district, Tamilnadu, India. The study
participants were of age group ranging from 18 years to 25 years. Majority of them
came from urban area (56%). Almost 50% of the students were from Christian
religion (51.2%) and (47.2%) of them belonged to upper class.
In the current study, majority of the study participants (52.4%) had moderately
adequate knowledge regarding road traffic rules and regulations. Majority of the
study participants had favorable attitude towards road traffic rules. (47.2%) of the
participants had poor practice towards road traffic rules.
In the present study, the prevalence of the accidents was 20%. The majority of
the participants (78%) were driving vehicles during accidents. 44% of the participants
were admitted in the hospital following accident. The factors associated with
accidents were broken roads (54%), night time (34%), raining (40%), slow traffic
(46%), fault in vehicle (42%), high speed (48%), poor street light (32%), using mobile
phone (24%) and not wearing helmet (60%).

81
8. CONCLUSION
The findings of the study led to conclusion that less than 25% of the study
participants had adequate knowledge about road traffic rules. Majority of the
participants had moderately adequate knowledge. Majority of the participants
belonged to upper class and literate family. Knowledge was associated with
prevalence of accidents.
More than half of the participants had favorable attitude towards road traffic
rules. Attitude of the participants showed significant association with prevalence of
accidents.
Nearly 50% of the study participants had poor practice towards road traffic
rules and regulations. Practice was significantly associated with prevalence of
accidents. There was a positive correlation between knowledge, attitude, and practice.

82
9. RECOMMENDATION
The road safety rules and regulations are aimed at reducing the Road Traffic
Accidents and deaths due to RTAs. The measures to decrease the road traffic
accidents are through engineering methods, enforcement, education and emergency
care. The most effective method was education regarding road safety rules and
regulations.
Parents should be educated about importance of road traffic rules at the
individual level. From the early childhood onwards the parents should teach their
children regarding safety way of walking and make them understand the benefits of
obeying the road traffic rules. Especially it becomes a responsibility of the parents to
protect their children from road traffic accidents.
In the community level health education regarding road traffic rules and
regulations should be started in the schools.The students should be educated regarding
road traffic rules and safety at schools including it as a part of curriculum. School
based education programs can improve pedestrian skills of children. The students
should make the habit of following road traffic rules from school days itself.
Proper training should be given during the period of getting driving license to
make them understand the consequences of road traffic injuries and the difficulties
faced by their families. Road safety weeks should be celebrated throughout the
country to create awareness regarding road safety. The college students should be
educated about the use of helmet and other safety measures. Strict legislative
measures should be followed throughout the country.
Government should enforce ban on drink and drive, and use of mobile phones
while driving. Should implement speed limits by proper legislation. The utilization of
public transport system may be encouraged to reduce road traffic accidents. Wearing

83
helmet should be made legally compulsory for those riding two-wheelers. Punishment
should be given to those not following speed limits. Strict legislation regarding road
traffic rules should be followed throughout the country. Those riding without a valid
driving license should be punished with fine and imprisonment.
Those travelling regularly, should try to reduce the length of the travel
distance. Special attention may be given to the high risk groups such as children and
elderly peoples. Public transport facilities may be improved so that use of two-
wheelers will be reduced.
Periodic health check up of the riders and periodic check up of vehicles should
be made mandatory. Quality of the roads should be ensured periodically. Two-
wheeler riding should be avoided during night time as well as raining time. Quality of
the helmets should be standardized. The riders should purchase a standardised helmet
of correct size.
The laws may be enforced effectively through the Departments of Police and
Department of Transport to reduce Road Traffic Accidents.
84
10. LIMITATIONS
As my research is limited to college students in Kanyakumari district it might
not reflect the entire population.
High literacy rate in the district can influence the knowledge, attitude, and
practice, which may differ in different parts of the state.

85
11. BIBLIOGRAPHY
1. World Health Organization, Road traffic injuries [Internet]. SEARO. [cited 2019
Jul 11]. Available from: http://www.searo.who.int/topics/road_traffic_injuries/en/
2. Road safety - Definition and synonyms of road safety in the English dictionary
[Internet]. [cited 2019 Jul 2]. Available from: https://educalingo.com/en/dic-
en/road-safety
3. World Health Organization 2018 geneva. Global status report on road safety
2018, summary. 2018.
4. Road Traffic Accidents | National Health Portal Of India [Internet]. Road Traffic
Accidents. [cited 2017 Oct 31]. Available from: https://www.nhp.gov.in/road-
traffic-accidents_pg
5. Kulothungan K. A cross sectional study on the knowledge, awareness & practice
of safety rules among the young college students in Trichy City, Tamil Nadu. Int J
Information Res Rev. 2015;2(09):1162–9.
6. Gururaj G, Gautham M S. Advancing road safety in India, Implementation is the
key. Health And Neuro Sciences,WHO Collaborating Centre for Injury
Prevention and Safety Promotion; 2017.
7. Government of Tamil Nadu, Home (Transport ) Department. Road accident
analysis in tamilnadu january 2019. Transport and road safety commissioner,
ezhilagam, chepauk, chennai-600 005; 2019.
8. Dr. Patanjali Dev Nayar. Improving Road Safety – Role of Media. world Health
Organization; 2018.
9. World Health Organisation. Road safety , basic facts [Internet]. Available from:
https://www.who.int/.../Road_safety_media_brief_full_document.pdf
10. The future of road safety: A worldwide perspective | Elsevier Enhanced Reader
[Internet]. [cited 2019 Jul 16]. Available from:
https://reader.elsevier.com/reader/sd/pii/S0386111216300103

86
11. World Health Organization. Global status report on road safety 2015 [Internet].
Geneva (Switzerland): World Health Organization; 2015 [cited 2017 Oct 30].
Available from: http://www.who.int/violence_injury_ prevention/road_safety_
status/2015/en/
12. WHO | Injuries [Internet]. WHO. 2019 [cited 2019 Jul 19]. Available from:
http://www.who.int/topics/injuries/en/
13. Organization WH. Injuries and violence: the facts 2014 [Internet]. World Health
Organization; 2014 [cited 2019 Sep 2]. Available from:
https://apps.who.int/iris/handle/10665/149798
14. J. Kishore. National health programs of india, National Policies & Legislations
Related to Health. 12th Edition. New Delhi: Century Publications; 2017.
15. World Health Organization, Road safety and injury prevention [Internet].
SEARO. [cited 2019 Jul 21]. Available from: http://www.searo.who.int/
india/topics/road_safety_and_injury_prevention/en/
16. World Health Organization. Magnitude and impact of road traffic injuries
[Internet]. Available from: https://www.who.int/...injury.../road_ traffic/...
/roadsafety_training_manual_unit_1.pdf
17. World Health Organisation. Road traffic injuries [Internet]. 2018 [cited 2019 Jul
21]. Available from: https://www.who.int/news-room/fact-sheets/detail/road-
traffic-injuries
18. Seethalakshmi1 M, Sudalaimuthu2 R, Mahendran3 J, Nagendrakumar4 A. Study
of injury pattern in human beings in road traffic accidents involving two wheelers.
Journal of evolution of medical and dental sciences. 2015 Sep 24;4(77):13436–58.
19. World Health Organization. Ten strategies for keeping children safe on the road.
2015.
20. dpavlou. WHO - 10 Facts on Global Road Safety 2018 [Internet]. NRSO. [cited
2019 Jul 9]. Available from: https://www.nrso.ntua.gr/who-10-facts-on-global-
road-safety-2018/

87
21. UNICEF,WHO. world report on child injury prevetion [Internet]. Available from:
http://www.who.int/violence_injury_prevention/child/en/
22. WHO | Pedestrian safety: a road safety manual for decision-makers and
practitioners [Internet]. WHO. [cited 2019 Aug 9]. Available from:
http://www.who.int/roadsafety/projects/manuals/pedestrian/en/
23. World Health Organistion. Strengthening road safety legislation: A practice and
resource manual for countries [Internet]. Geneva , Switzerland; 2013. Available
from: www.who.int
24. D S Bhullar. Drunken driving: Indian perspective in world scenario & the
solution. Journal of Punjab Academy of Forensic Med Toxicol. 2012 Jun
25;12(1):5–9.
25. Truong K. The impact of road traffic injury [Internet]. The George Institute for
Global Health. 2015 [cited 2019 Aug 9]. Available from:
https://www.georgeinstitute.org.in/projects/the-impact-of-road-traffic-injury
26. Evangeline Mary, Chitra, Arunmozhi, Sheila Doris. A cross sectional study to
assess the knowledge, attitude and practice towards road safety rules and
regulations among Higher Secondary school students in Chennai. Indian Journal
of Basic and Applied Medical Research. 2016 Sep;5(4):779–89.
27. NDTV ATAT. Road Accident Statistics in India [Internet]. NDTV-Diageo Road
To Safety. 2014 [cited 2017 Oct 30]. Available from:
http://sites.ndtv.com/roadsafety/important-feature-to-you-in-your-car-5/
28. Ministry of Road Transport and Highways Increases Expressway Speed to 120
Kmph [Internet]. News18. [cited 2019 Sep 3]. Available from:
https://www.news18.com/news/auto/ministry-of-road-transport-and-highways-
increases-expressway-speed-to-120-kmph-1721003.html
29. Bhuyan PJ, Ahmed F. Road Traffic Accident: An Emerging Public Health
Problem in Assam. Indian J Community Med. 2013;38(2):100–4.

88
30. Dandona R, Kumar GA, Dandona L. Risky behavior of drivers of motorized two
wheeled vehicles in India. Journal of Safety Research. 2006 Jan 1;37(2):149–58.
31. C K Priyanka Raj et al, Shib Sekhar Datta,Jayanthi Jayanthi Jayanthi VZile Singh,
Senthilvel V. (PDF) Study of knowledge and behavioral pattern with regard to
road safety among high school children in a rural community in Tamilnadu.
ResearchGate. 2011 Dec;Vol. 2, No.2:110–3.
32. Banu H, Chakrabarty N, Michael RJ, Kumar R, Sudhir PM, Sharma MK, et al.
Two-Wheeler Riding Patterns, Perceptions and Aggressive Riding Behaviour
among College Youth. International Journal of Innovative Research in Science,
Engineering and Technology. 2013;2(9).
33. Nikumb VB, Banerjee A, Singh SK. Behaviour related to safe driving among
college youth in an industrial township. Int J Crit Illn Inj Sci. 2013;3(1):96–7.
34. Road deaths dip in Tamil Nadu, up 10% in city | Chennai News - Times of India
[Internet]. 2018 Jan [cited 2019 Sep 2]. Available from:
https://timesofindia.indiatimes.com/city/chennai/road-deaths-dip-in-tamil-nadu-
up-10-in-city/articleshow/62344805.cms
35. S. Krishnan,. Road accidents and road safety measures in tamil nadu:-An Analysis
[Internet]. [cited 2019 Aug 11]. Available from:
https://www.researchgate.net/publication/333079455_road_accidents_and_road_s
afety_measures_in_tamil_nadu-an_analysis
36. Demand no.25, M.R.Vijayabhaskar. Home, prohibition and excise department
motor vehicles acts-administration policy note 2018-2019. Government of Tamil
Nadu;
37. Kulkarni V, Kanchan T, Palanivel C, Papanna MK, Kumar N, Unnikrishnan B.
Awareness and practice of road safety measures among undergraduate medical
students in a South Indian state. J Forensic Leg Med. 2013 May;20(4):226–9.
38. Reang T, Tripura A. Road Safety: Knowledge, practice and determinants among
undergraduate medical students of Agartala Government Medical College and

89
Govinda Ballabh Pant hospital. International Journal of Medical Science and
Public Health. 2014 Jan 1;3(8):911–5.
39. Dulipala P, Gujjarlapudi C. Awareness and practice of road safety measures
among college going students in Guntur City. Public Health Review: International
Journal of Public Health Research [Internet]. 2016 Apr 30 [cited 2017 Oct
30];3(02). Available from: http://medresearch.in/index.php/IJPHR/article/
view/1378
40. Lalitha D, Naidu SA, Madhavi BD. A study on knowledge attitude and practice of
road safety measures among college students in visakhapatnam city. Journal of
Evidence Based Medicine and Healthcare [Internet]. 2015 Oct 15 [cited 2017 Oct
30];(93473). Available from: https://www.jebmh.com/latest-articles.php?at_id
=93473
41. Shetty SK, D‟mello MK, Purushothama J, Rent PD, Monisha V. Awareness and
obeyance of road traffic rules among motorists in Mangaluru suburbs, India.
International Journal Of Community Medicine And Public Health. 2017 Sep
22;4(10):3796–801.
42. Kalbandkeri LR. A study to assess the knowledge and practice of road safety
measures among undergraduate medical students of M. R. Medical College,
Kalaburagi. International Journal of Community Medicine and Public Health.
2018 Apr;5(4):1596–601.
43. Manjula R., Vijaylaxmi B.H., Dorle AS. A study on knowledge and practice of
road safety among medical students of S.N. Medical College, Karnataka.
International Journal Of Community Medicine And Public Health. 2017 May
22;4(6):1993.
44. Ramya MS. A study to determine the awareness and behavioral patterns/practice
about road safety measures among undergraduate medical students, Bangalore,
India-cross sectional study. International Journal Of Community Medicine And
Public Health. 2017 Mar;4(3):825–30.
90
45. Mukhopadhyay. Road Safety Awareness among College Students in a North
Indian. Journal of medical science and clinical research. 2017 Sep 9;VL-5 DO-
10.18535/jmscr/v5i9.170 ER-:28375–82.
46. Ranjan DP. A cross sectional study to assess the knowledge, attitude and practice
towards road traffic safety among adolescent students of a selected Pre-University
college in Raichur city. International Journal of Community Medicine and Public
Health. 2018 Jun;5(6):2446–52.
47. Kalantharakath T, Iyer R. Helmet Attitudes and Practices among University
Students of Dental and Medical Professional Courses in Vadodara, India. JBR
Journal of Interdisciplinary Medicine and Dental Science [Internet]. 2015 Jun 18
[cited 2017 Nov 28];3(3). Available from: https://www.omicsonline.org/open-
access/helmet-attitudes-and-practices-among-university-students-of-dental-and-
medical-professional-courses-in-vadodara-india-2376-032X-
1000180.php?aid=54950
48. Suresh K. Sharma, Parul Sain. Knowledge, Attitude and Practices towards Road
Traffic Safety Regulations among Health Science Students in Uttarakhand: A
cross-sectional study. International Journal of Advanced Research. 2017
Mar;5(3):608–14.
49. Sharma B, Kaur J, Rana M, Priyanka, Bhandari S, Bamania S, et al. A Descriptive
Study on Assessment of Knowledge, Attitude and Practices Regarding Road
Safety Rules and Regulations among Vehicle Users in Selected Areas of
Chandigarh, U.T. OmniScience: A Multi-disciplinary Journal. 2019 Jan
10;8(3):69–76.
50. Jacob J, Rajeev. A study to assess the knowledge and attitude regarding road
safety measures among college going two wheeler rider students of Faridabad.
International Journal of Healthcare Sciences. 2018 Apr;6(1):207–10.
51. Amala Shaji, Amrutha PP, Tessy Joseph3, Safa S, Hezil Reema Barboza.
Knowledge and attitude of teenagers regarding traffic safety rules. IP
International Journal of Medical Paediatrics and Oncology. 2019 Jun;5(2):54–7.

91
52. Kumar M. Awareness and practices on road safety among students of panjab
university chandigarh, India. asian journal of multidisciplinary studies [Internet].
2014 Oct 28 [cited 2019 Jul 13];2(11). Available from:
http://www.ajms.co.in/sites/ajms2015/index.php/ajms/article/view/729
53. Singh S. Road Traffic Accidents in India: Issues and Challenges. Transportation
Research Procedia. 2017 Dec 31;25:4712–23.
54. Thokchom Shantajit, Chirom Ranjeev Kumar, Quazi Syed Zahiruddin. Road
traffic accidents in India: an overview. International Journal of Clinical and
Biomedical Research. 2018;4(4):36–8.
55. Dr BKS Sanjay. Impacts of Road Traffic Accidents in India [Internet]. The
Pioneer. 2018 [cited 2019 Aug 17]. Available from:
https://www.dailypioneer.com/2018/state-editions/impacts-of-road-traffic-
accidents-in-india.html
56. WHO | India [Internet]. WHO. [cited 2019 Jul 17]. Available from:
https://www.who.int/violence_injury_prevention/road_traffic/countrywork/ind/en/
57. WHO | Decade of Action for Road Safety 2011-2020: saving millions of lives
[Internet]. WHO. [cited 2019 Jul 19]. Available from: https://www.who.int/
violence_injury_prevention/publications/road_traffic/decade_booklet/en/
58. Road Safety Week 2019: 4th – 10th February 2019, Theme, Slogan, Activities
Idea [Internet]. [cited 2019 Sep 2]. Available from:
https://www.iaspaper.net/road-safety-week/,https://www.iaspaper.net/road-safety-
week/
59. Road Safety Week [Internet]. 2019 [cited 2019 Sep 2]. Available from:
http://www.nsc.org.in/index.php?option=com_content&view=article&id=77&Ite
mid=67
60. road safety week: Latest News, Videos and road safety week Photos | Times of
India [Internet]. The Times of India. [cited 2019 Sep 2]. Available from:
https://timesofindia.indiatimes.com/topic/road-safety-week

92
61. Kim E, Muennig P, Rosen Z. Vision zero: a toolkit for road safety in the modern
era. Inj Epidemiol [Internet]. 2017 Jan 9 [cited 2019 Sep 12];4. Available from:
https://www.ncbi.nlm.nih.gov/pmc/articles/PMC5219975/
62. Department of Economics and Statistics District Statistical Handbook – 2016.
deputy director of statistics Kanniyakumari district; 2016.
63. Emmily MK. Assessment of Knowledge and Practice Measures Regarding
Prevention of Road Traffic Accidents among Undergraduate Medical Students.
International Research Journal of Interdisciplinary & Multidisciplinary Studies
(IRJIMS). 2016 Oct;Volume-II(Issue-IX):Page No. 93-101.
64. Al-Naggar R, Al-Jashamy K. Knowledge, Attitude and Practice Towards Road
Traffi c Regulations Among University Students, Malaysia. The International
Medical Journal Malaysia. 2010 Sep 1;Volume 9 Number 2, December 2010.
65. Sreedharan J, Muttappillymyalil J, Divakaran B, C Haran J. Determinants of
safety helmet use among motorcyclists in Kerala, India. J Inj Violence Res. 2010
Jan;2(1):49–54.

93
ANNEXURE -1

94

95
ANNEXURE II
ABBREVIATIONS
SL.NO ACRONYM EXPANSION
1. BAC Blood Alcohol Concentration
2. CNY Chinese Yuan
3. GOI Government of India
4. INR Indian Rupee
5. IPC Indian Penal Code
6. MORTH Ministry of Road Transport and Highway
7. RTA Road Traffic Accident
8. RTI Road Traffic Injury
9. SCRB State Crime Record Bureau
10. SDG Sustainable Development Goal
11. UN United Nation
12. VZ Vision Zero
96
ANNEXURE III
PARTICIPANTS CONSENT FORM
The details of the study have been explained to me in writing and the details
have been fully explained to me. I am aware that the results of the study may not be
directly beneficial to me but will help in the advancement of medical sciences. I
confirm that I have understood the study and had the opportunity to ask questions. I
understand that my participation in the study is voluntary and that I am free to
withdraw at any time, without giving any reason, without the medical care that will
normally be provided by the hospital being affected. I agree not to restrict the use of
any data or results that arise from this study provided such a use is only for scientific
purpose(s). I have been given an information sheet giving details of the study. I fully
consent to participate in the study titled „A cross sectional study on knowledge,
attitude and practices of road traffic rules among college students who are
regularly using two wheelers in Kanyakumari district
Serial no/Reference no:
Name of the Participant:
Address of the Participant:
Signature of the participant
Witnesses:
1.
2.
Date:
Place:

97
ANNEXURE – IV
xg;Gjy; gbtk;.
,e;j Muha;r;rpapy; jfty;fs; midj;Jk; vd;dplk; njspthf vOj;J
%yk; tpsf;fg;gl;ls;sJ. ,e;j Muha;r;rpapd; KbTfs; vdf;F Neubahf
gad;ngwhtpl;lhYk; kUj;Jt Jiwapy; Kd;Ndw;wj;jpw;F gad;gLk; vd;gij
mwpNtd;. ,t; Muha;r;rpia gw;wp ehd; njspthf Ghpe;J nfhz;Nld;. kw;Wk;
,ij gw;wp vd; re;Njfq;fis njspTgALj;jpAs;Nsd;. ehd; ehdhf Kd;te;J
,jpy; gq;F ngWNtd;. ,jpypUe;J ve;NeuKk; vf;fhuzkk; ,d;wp vd;dhy;
ntsptu ,aYk; vd;gij mwpNtd;. mt;thW ehd; ntspte;jhYk; vdf;F
fpilf;Fk; kUj;Jt cjtpfs; vt;tpjj;jpYk; ghjpf;fg;glhJ vd;gij
mwpNtd;. ,e;j Muha;r;rpapd; %yk; tUk; KbTfs; kw;Wk; jfty;fis
mwptpay; Jiwapd; gad;ghLfSf;F cl;glj;jpf; nfhs;s rk;kjpf;fpNwd;. ,t;
Muha;r;rpia gw;wpa tphpthd jfty; mlq;fpa gbtk; jug;gl;Ls;sJ.
“fd;dpahFkhhp khtl;lj;jpy; fy;Y}hp khzth;fSf;F ,ilNa rhiy
Nghf;Ftuj;J tpjpfspd; mwpT kw;Wk; gapwrpapd; kPJ xU FWf;F gphpT
Ma;T”.
rPhpay; vz; / Fwpg;G vz;
gq;Nfw;ghsh; ngah;.:
gq;Nfw;ghsh; Kfthp:
gq;Nfw;ghsh; njhlh;G vz;:
gq;Nfw;ghsh; ifnahg;gk;:
rhl;rpfs;:
1.
2.
ehs;:
,lk;:

98
ANNEXURE – V
k½X]{Xw
Cu ]T\s¯¡pdn¨p Å hniZmwi§ÄFgp¯paqeambnFs¶ Adnbn¨p«pv. F\n¡vCu
]T\s¯¡pdn¨pÅ hniZmwi§ÄFs¶bpw Fsâ c£IÀ ¯mhns\bpw Fgp¯paqeambnAndbn¨p«pv.
Cu ]T\w sImv t\cn«pKpWw Csænepw CXv saUn¡Ä kb³kn\v hfscKpWIcambH¶mWv. F\n¡v
]T\w a\Ênembn F\n¡v tNmZy§Ä tNmZn¡m\mbn Ahkcw e`n¨n«pv. Rm³ kzbwCu ]T\¯nÂ
]¦ptNcpIbmWv. GXpkab¯pw F\n¡vCXn \n¶pw ]n³amdm\pÅ AhImiw DÅXmbpw F¶v
F\n¡v t_m[ys¸«ncn¡p¶p. AsXsâ NnInÕbn GXphIbnepw XSÊamIm³ ImcWamhpIbpanÃ.
Cu ]T\¯n \n¶papÅ ^e§ÄhnÚm\]cambn am{Xambn D]tbmKn¡p F¶pÅXpw
F\n¡pt_m[yambn. Cu ]T\¯ns\¡pdn¨pÅ apgph³ tcJIfpwAS§nb ]{Xw F\n¡pe`n¨p.
Rm³ “I\ymIpamcnPnÃbnsetImtfPv hn²ymÀ°nIfpsS CSbnÂCcpN{I hml\
D]t`màm¡fn tdmUn ]ment¡ \nba§sf¡pdn¨p Å AdnhptISv A]IShpw acWhpw Dm¡mw.
AXn\m tImtfPv hn²ymÀ°nIfpsS Adnhpw, \S¸em¡epw”F¶ At\zjW¯n Rm³ ]qÀ®ambpw
k½Xn¨psImv ]s¦Sp¡p¶p.
kocnb \¼À : H.]n.\¼À:
]s¦Sp¡p¶ Bfnsâ t]cv :
c£IÀ¯mhnsâ t]cv :
_Ôw :
taÂhnemkw :
_Ôs¸tS \¼À :
]s¦Sp¡p¶ BfnsâssIsbm¸v/hnceSbmfw c£IÀ¯mhnsâssIsbm¸v/hnceSbmfw
km£n : 1.
2.
Øew :IpeiJcw,
XobXn :

99
ANNEXURE – VI
QUESTIONAIRRE
1. Age :…………..in completed years
2. Sex : Male / Female
3. Area of residence: urban / rural
4. Religion: Hindu/ Christian/ Muslim
5. Education of Head of the family: profession/graduate/diploma/ high school/ middle
school/ primary school/illiterate
6. Occupation of head of the family: legislator, senior official& manager/
professional/ technician and associate professional/ clerks/shop and market sale
worker/ agricultural & fishery work/Graft related work/plant & machine operator/
elementary occupation/unemployed
7. Total family income per month……………………..
8. Total monthly income of the family range: Rupees 1. < 6323 2. 6327-18949
3. 18,953-31,589 4. 31,590-47,262 5. 47,266-63,178
6. 63,182-1,26,356 7. >1,26,360
9. Total number of members in the family :………..
10. Type of family: 1. Nuclear family 2. Joint family
11. On a road designated as one way
1. parking is prohibited 2. overtaking is prohibited
3. should not drive in reverse gear
12. In a road without footpath, the pedestrians
1. should walk on the left side of the road
2. should walk on the right side of the road
3. may walk on either side of the road

100
13. Free passage should be given to the following type of vehicle
1. police vehicle 2. ambulance and fire service vehicles 3. super express buses
14. When an ambulance is approaching
1. allow passage if there are no vehicles from front side
2. no preference need be given
3. allow free passage by drawing to the side of the road
15. Overtaking is prohibited in following circumstances
1. When it likely to cause inconvenience or danger to other traffic
2. When the vehicle in front is reducing speed 3. During night
16. Before overtaking a vehicle, it should be ensured that
1. no vehicle is approaching from behind 2. the road ahead is clearly visible
and it is safe to overtake 3. the vehicle in front is turning left
17. More than two persons on a two wheeler is
1. allowed in unavoidable circumstances 2. violation of law
3. allowed when the traffic is less
18. When a motor vehicle is involved in an accident
1.Report to the nearest police station within 24 hours
2. Within 12 hours
3. within 48 hours
19. While riding two wheeler hand signal should always be given by
1. only left hand 2. only right hand 3. both hand
20. To carry pillion rider, a motor cycle must be provided with
1. foot rest alone 2. hand grip alone 3. foot rest, hand grip, sari guard
21. Minimum distance to be kept from the vehicle going in front
1. 10 meters 2. 20 meters 3. 30 meters 4. safe distance according to speed

101
22. Is it ok to drive in the wrong way in a one way street/road if there is no/very little
traffic?
1. yes 2. no
23. Is it ok to drive very fast if the road is clear? 1. yes 2. no
24. Is it ok to drive after drinking if your hands & vision are steady? 1. yes 2. no
25. Is it ok not to wear helmet if you are driving just to the near by street / road ?
1. yes 2. no
26. Do you think that slowing down at orange traffic light is important?
1. yes 2. no
27. Is it ok to listen music with ear phone when driving two wheeler?
1. yes 2. no
28. Do you drive with more than 2 people (triples) usually ? 1. yes 2. no
29. Do you use rear mirror?
1. always 2. occasionally 3. Rarely 4. never
30. When you see the traffic sign of school, what do you usually do?
1. stop the vehicle, sound horn and proceed 2. slow down and proceed with caution
3. sound horn continuously and proceed
31. When do you wear helmet?
1. always 2. occasionally 3. rarely 4. never
32. When a blind person crosses the road holding white cane what do u usually do ?
1. stop vehicle let them cross 2. blow the horn and proceed as usual
3. slow down and proceed with caution
33. When you see a orange signal what do you usually do?
1. cross as fast as possible 2. cross normally if no vehicle is there
3. cross normally d. stop

102
34. Have you raced in your vehicle? 1. yes 2. no
35. What is the top speed you have driving the two wheeler ?
_____________KM/Hour_
36. While over taking do you ensure that the opposite lane is clear ?
1. always 2. occasionally 3. rarely 4. never
37. when will you Switch On the indicator
1. always just before turning 2. always at-least 30 meters before 3.
occasionally if I remembered 4. never
38. Have you ever over taken from the left side of the vehicle
1. mostly 2. occasionally 3. rarely 4. Never
39. Whose two wheeler do you use regularly? 1. Own 2. family members 3.
friends / relatives
40. Have you ever been involved in accident in the past 2 years
1. yes 2. no
(IF NO: ignore the following questions)
41. If YES: Were you driving : Yes / NO
42. How severe was the accident
1. damage to vehicle only 2. scratches to the rider 3. severe injury
but no fracture 4.fracture 5. death of some
one
43. Was ambulance called for the accident? 1. yes 2. no
44. If yes how long did it taken to reach the spot ……………………
45. How long did it taken to reach the hospital………………………
46. Follwing accident were you hospitalized 1. Yes 2. No

103
Factors involved in the accident
47. Condition of the road at the spot 1. good 2. broken 3. no road
48. Time of accident? 1. day 2. night 3.evening 4.early morning
49. Climatic condition: raining /wet / dry
50. Traffic : heavy / slow/ no traffic
51. Fault in vehicle 1. yes 2. no
52. Speed : with in normal limits / high speed
53. Lighting of road / street: good / poor
54. Were you using mobile phone at the time of accident ?1. yes 2. no
55. Had you consumed any alcohol/ medication immediately before accident?
1.yes 2. no
56. Were you wearing helmet at the time of accident? 1.yes 2. no

104
ANNEXURE – VII

Age
Sex
Res
iden
t
Rel
igio
n
Edu
cati
on
Occ
up
tio
n
Inco
me
Inco
meR
ange
Tota
lMem
ber
s
Fam
ilyTy
pe
On
eway
Foo
tpat
h
Free
Pas
sage
Am
bu
lan
ce
Ove
rtak
ing
Bef
ore
Ove
rtak
ing
Two
Pe
rso
n
Acc
iden
t
Han
dSi
gnal
Pill
ion
Rid
er
Dis
tan
ce
Dri
veW
ron
gWay
Ver
yFas
t
Dri
nkD
rive
Hel
met
Ora
nge
Ligh
t
Mu
sic
Trip
les
Rea
rMir
ror
Sch
oo
lSig
n
Wh
enH
elm
et
Blin
dP
erso
n
See
Ora
nge
sign
al
Rac
ed
Spee
d
Wh
ileO
verT
akin
g
Ind
icat
or
Left
Sid
eOve
rTak
en
Wh
ose
Two
wh
eele
r
Invo
lved
Acc
iden
t
Dri
vin
g
Seve
reA
ccid
en
t
Am
bu
lan
ce
Tim
eTo
Spo
t
Tim
eTo
Ho
spit
al
Ho
spit
aliz
ed
Co
nd
itio
nR
oad
Acc
iden
tTim
e
Clim
ate
Traf
fic
Fau
ltV
ehic
le
spee
dA
ccid
ent
Ligh
tin
gRo
ad
Ph
on
eUse
Co
nsu
meA
lco
ho
l
Hel
met
Use
18 1 2 1 3 10 6000 1 3 1 3 2 2 3 3 3 2 2 3 3 1 2 2 2 2 1 2 2 2 2 3 1 2 1 50 1 1 4 2 1 1 2 2 0 0 1 1 4 1 3 2 1 1 2 2 2
19 1 2 1 5 6 25000 3 4 1 1 3 2 1 3 2 1 2 2 2 4 1 2 1 1 2 1 1 3 2 2 2 1 1 50 3 1 1 1 1 1 2 1 50 50 1 1 3 1 2 1 1 2 1 1 1
19 1 2 1 5 6 31000 4 4 1 3 1 2 2 3 2 3 1 2 3 1 1 1 1 1 1 1 1 4 2 4 1 4 2 90 1 2 1 2 1 1 4 2 0 0 1 2 1 2 1 2 1 1 2 2 1
19 1 1 1 5 6 10000 3 4 1 2 1 2 1 2 2 3 3 3 3 1 1 1 2 2 1 2 1 3 1 3 1 2 2 60 2 1 4 3 1 1 4 2 0 0 2 2 2 3 2 1 1 1 1 2 1
19 1 1 1 2 6 10000 3 4 1 2 1 2 1 2 2 3 3 3 3 1 1 1 2 2 1 2 1 3 1 3 1 1 1 60 2 1 4 3 1 1 4 2 0 0 2 1 2 1 2 2 1 2 1 2 2
18 1 1 2 2 3 40000 3 3 1 1 1 2 1 1 2 3 2 2 3 1 1 2 2 1 1 2 2 2 2 2 1 2 2 60 3 2 2 2 1 1 4 1 40 40 1 1 1 1 2 2 1 1 2 2 1
19 2 1 2 3 3 15000 2 2 1 3 3 2 3 3 2 2 3 3 3 4 2 2 2 1 1 2 2 2 2 1 1 3 2 40 1 2 4 2 1 1 1 2 0 0 2 2 1 1 2 1 2 2 2 2 1
18 2 1 2 4 3 25000 3 4 1 3 1 2 3 1 2 1 2 2 3 4 2 2 2 2 1 2 2 2 2 2 1 4 2 60 2 2 3 2 1 1 4 1 15 15 1 2 1 3 1 1 2 2 1 2 2
20 2 2 2 2 2 40000 4 4 1 1 1 2 3 1 3 3 2 2 3 1 2 2 2 1 1 2 2 2 2 1 1 2 2 50 1 1 4 1 1 1 2 2 0 0 2 1 3 3 2 1 2 1 2 2 2
19 1 1 1 4 2 40000 4 4 1 1 1 2 3 1 3 3 1 2 3 4 2 1 2 1 1 2 2 1 1 1 1 3 2 50 1 1 4 1 1 1 3 2 0 0 2 1 1 3 1 2 1 2 2 2 2
18 1 1 2 5 9 15000 2 4 1 1 3 2 1 3 1 1 1 3 3 4 2 1 2 2 1 2 1 1 3 1 1 1 2 40 3 1 1 1 1 1 2 2 0 0 2 1 2 1 2 2 1 1 2 2 2
24 1 1 2 4 8 12000 2 4 1 1 2 2 3 3 3 1 1 3 3 4 1 1 2 2 1 2 1 1 2 2 1 1 1 80 1 1 4 3 1 1 3 2 0 0 1 2 1 2 2 2 1 2 1 2 2
25 1 1 2 2 3 15000 2 4 1 2 1 1 3 2 3 2 1 1 2 1 2 2 2 1 1 1 1 2 3 2 3 2 1 60 2 3 1 2 1 1 1 2 0 0 2 1 2 1 3 2 1 1 2 2 1
18 1 1 2 5 9 25000 2 4 1 3 1 2 3 1 2 3 2 3 3 1 2 1 2 2 1 2 2 1 2 2 3 3 3 90 2 3 2 4 1 1 2 1 30 30 1 1 3 2 2 2 2 1 2 2 2
19 1 1 1 5 9 16000 2 4 1 3 1 2 3 1 2 3 3 3 3 2 2 1 2 2 1 2 2 1 2 3 3 3 2 120 3 1 4 1 1 1 2 2 0 0 2 1 3 2 2 2 1 1 2 2 2
18 1 2 2 5 9 20000 2 6 1 1 1 2 1 2 1 2 1 2 3 1 1 1 2 1 2 1 1 2 2 2 3 3 1 90 3 1 3 3 1 1 2 2 0 0 2 2 1 2 1 2 2 1 2 2 1
21 1 2 1 2 3 24000 3 3 1 3 2 2 3 1 2 2 2 3 3 4 2 2 2 2 1 2 2 2 2 1 1 2 2 50 1 2 4 3 1 1 2 2 0 0 2 2 3 3 3 2 1 2 2 2 1
20 1 2 1 2 3 65000 6 5 1 3 3 2 3 1 2 2 2 1 3 1 2 1 1 2 1 2 1 1 2 2 1 2 1 120 1 2 3 1 1 1 2 2 0 0 2 2 1 3 2 2 1 1 2 2 2
20 2 1 1 1 2 70000 6 4 1 3 3 2 3 1 2 2 1 1 3 1 2 1 1 1 1 2 1 1 2 2 3 1 1 160 1 2 2 1 1 1 1 2 0 0 2 2 2 2 2 2 1 2 2 2 1
20 1 1 2 3 5 28000 3 6 2 2 2 2 3 2 1 2 1 3 2 4 1 1 1 2 1 2 2 2 1 2 1 4 2 50 2 2 1 2 1 1 1 2 0 0 2 2 3 2 2 2 1 1 1 2 1
22 1 1 2 2 2 50000 5 4 1 3 1 2 3 1 2 2 2 3 3 1 2 2 2 2 1 2 2 1 1 3 2 3 1 110 3 2 2 1 1 1 2 2 0 0 2 1 2 3 2 2 1 1 2 1 2
22 2 1 1 2 6 20000 3 4 1 1 3 2 3 1 1 2 2 2 3 2 2 1 1 1 1 2 2 1 2 1 3 2 1 70 1 2 2 2 1 1 2 2 0 0 1 3 2 1 1 1 2 1 2 1 2
21 1 2 1 5 6 48000 5 6 2 1 1 2 1 1 3 1 2 2 1 4 2 2 2 2 1 2 2 2 1 2 3 2 1 60 4 2 1 2 1 1 1 2 0 0 2 2 2 1 3 1 2 2 2 2 2
21 1 2 1 2 2 40000 4 3 1 2 1 2 3 1 2 3 2 2 2 2 1 1 1 1 1 2 1 3 2 2 2 2 1 80 2 2 2 2 1 1 2 2 0 0 2 2 2 1 1 1 2 1 1 1 2
23 1 1 1 5 6 3000 1 5 1 3 1 3 2 1 1 1 1 1 1 4 1 1 2 1 1 1 1 3 2 2 2 1 1 60 3 1 2 1 1 1 1 1 10 10 2 2 2 1 3 1 2 2 2 2 1
23 2 1 1 2 3 50000 5 4 2 3 1 2 3 1 2 2 2 2 3 2 2 2 2 2 1 2 1 1 1 3 1 2 1 80 3 1 1 1 1 1 1 1 60 60 2 2 1 3 1 1 2 1 1 1 2
21 1 1 1 2 3 50000 5 4 1 2 1 2 3 1 2 2 1 3 3 4 2 1 1 1 1 2 1 2 2 3 3 2 2 100 1 2 1 1 1 1 2 2 0 0 2 2 3 3 2 2 1 1 2 2 2
21 1 1 1 2 3 30000 3 3 1 1 2 2 3 1 2 2 2 2 3 4 2 2 2 2 1 2 2 1 2 1 3 4 2 90 1 2 3 2 1 1 2 2 0 0 2 1 3 1 3 1 2 1 2 2 2
25 1 1 3 4 5 75000 6 6 1 1 2 2 3 1 2 2 1 1 3 1 2 2 2 2 1 2 2 1 1 1 1 2 2 130 1 1 4 3 1 1 3 2 0 0 1 2 1 3 3 1 1 1 2 2 2
21 1 1 1 2 2 100000 6 4 1 2 2 2 1 2 1 2 2 3 3 1 2 2 1 1 2 2 2 3 2 3 2 4 1 120 3 1 2 2 1 1 4 2 0 0 1 2 2 1 1 1 2 1 2 2 2
22 1 1 2 2 2 75000 6 6 2 3 2 2 1 2 2 2 1 3 3 1 2 2 2 2 2 2 1 2 2 4 3 2 2 110 2 3 3 2 1 1 2 1 10 10 1 2 2 1 3 2 2 1 2 2 1
21 1 1 1 2 2 100000 6 4 1 2 2 2 1 2 1 2 2 3 3 1 2 2 1 1 2 2 2 3 2 3 2 4 1 120 3 1 2 2 1 1 4 2 0 0 1 2 2 1 1 1 2 1 2 2 2
22 1 1 2 2 2 75000 6 6 2 3 2 2 1 2 2 2 1 3 3 1 2 2 2 2 2 2 1 2 2 4 3 2 2 110 2 3 3 2 1 1 2 1 10 10 1 2 2 1 3 2 2 1 2 2 1
20 2 2 2 2 2 40000 4 4 1 1 1 2 3 1 3 3 2 2 3 1 2 2 2 1 1 2 2 2 2 1 1 2 2 50 1 1 4 1 1 1 2 2 0 0 2 1 3 3 2 1 2 1 2 2 2
19 1 1 1 4 2 40000 4 4 1 1 1 2 3 1 3 3 1 2 3 4 2 1 2 1 1 2 2 1 1 1 1 3 2 50 1 1 4 1 1 1 3 2 0 0 2 1 1 3 1 2 1 2 2 2 2
18 1 2 1 3 10 6000 1 3 1 3 2 2 3 3 3 2 2 3 3 1 2 2 2 2 1 2 2 2 2 3 1 2 1 50 1 1 4 2 1 1 2 2 0 0 1 1 4 1 3 2 1 1 2 2 2
22 1 2 2 2 2 50000 5 4 1 3 1 2 3 1 2 2 2 3 3 1 2 2 2 2 1 2 2 1 1 3 2 3 1 110 3 2 2 1 1 1 2 2 0 0 2 1 2 3 2 2 1 1 2 1 2
22 2 1 1 2 6 20000 3 4 1 1 3 2 3 1 1 2 2 2 3 2 2 1 1 1 1 2 2 1 2 1 3 2 1 70 1 2 2 2 1 1 2 2 0 0 1 3 2 1 1 1 2 1 2 1 2
22 1 1 2 2 3 75000 6 6 2 3 2 2 1 2 2 2 1 3 3 1 2 2 2 2 2 2 1 2 2 4 3 2 2 110 2 3 3 2 1 1 2 1 10 10 1 2 2 1 3 2 2 1 2 2 1
19 1 1 2 3 6 35000 3 3 1 2 1 2 3 2 3 3 2 2 3 1 1 2 2 1 1 1 1 1 3 2 2 2 2 50 3 1 1 3 1 2 1 2 0 0 2 1 4 3 3 2 1 2 2 2 1
19 1 1 1 4 2 30000 3 4 1 2 1 2 3 3 2 1 2 3 3 1 2 2 2 2 1 2 2 1 2 1 3 2 2 50 1 2 4 2 1 2 5 1 10 10 1 2 4 3 2 2 1 2 2 2 1
18 1 1 2 4 2 10000 3 4 1 3 3 2 3 3 2 1 2 3 3 1 2 2 2 2 1 2 2 1 2 1 3 2 2 50 1 2 4 2 1 2 4 1 30 30 1 2 4 3 2 2 1 2 2 2 1
19 1 2 1 4 2 29000 3 4 1 3 3 1 3 3 2 3 1 3 2 1 1 2 1 1 12 2 2 3 3 3 3 1 1 60 2 2 4 2 1 2 5 1 15 15 1 1 3 1 2 1 1 1 1 2 1
19 1 2 2 4 9 12000 2 4 1 1 1 2 3 1 1 2 1 2 3 1 1 1 2 1 1 1 1 2 2 4 2 3 1 70 3 2 2 2 1 2 2 1 10 10 1 2 3 2 1 1 2 2 2 2 1
22 2 1 1 4 5 20000 2 4 1 3 1 2 3 1 2 2 2 3 1 4 2 2 2 2 1 2 2 2 3 2 2 1 1 90 3 2 2 3 1 2 1 2 0 0 2 2 1 3 2 2 2 1 2 2 2
23 1 1 1 5 6 10000 2 4 1 2 1 3 2 3 1 1 1 2 3 3 2 2 1 2 1 1 1 3 2 3 1 3 2 70 3 1 1 1 1 2 1 2 0 0 2 1 1 2 1 1 2 1 1 2 2
22 1 2 1 4 6 40000 4 4 1 1 2 1 3 2 2 3 1 1 1 1 2 1 1 1 2 1 1 1 2 2 2 2 1 80 1 1 1 2 1 2 2 2 0 0 1 1 1 2 1 1 2 1 1 2 2
19 1 1 1 4 2 30000 3 4 1 2 1 2 3 3 2 1 2 3 3 1 2 2 2 2 1 2 2 1 2 1 3 2 2 50 1 2 4 2 1 2 5 1 10 10 1 2 4 3 2 2 1 2 2 2 1
22 2 1 1 4 5 20000 2 4 1 3 1 2 3 1 2 2 2 3 1 4 2 2 2 2 1 2 2 2 3 2 2 1 1 90 3 2 2 3 1 2 1 2 0 0 2 2 1 3 2 2 2 1 2 2 2
23 1 1 1 5 6 10000 2 4 1 2 1 3 2 3 1 1 1 2 3 3 2 2 1 2 1 1 1 3 2 3 1 3 2 70 3 1 1 1 1 2 1 2 0 0 2 1 1 2 1 1 2 1 1 2 2
18 1 1 1 3 7 13000 7 4 1 1 3 2 3 3 1 1 2 3 3 4 2 2 2 2 1 2 2 2 1 1 3 2 2 40 1 2 4 1 2
18 1 2 1 3 5 5000 1 4 1 3 1 2 3 1 2 3 2 1 3 2 2 1 2 1 1 2 1 1 2 2 3 3 2 55 1 2 4 2 2
19 1 2 1 3 6 50000 5 5 1 2 2 2 3 3 3 2 1 3 3 1 2 2 2 1 1 2 2 4 1 1 2 2 2 45 4 3 1 2 2
18 2 2 2 1 3 6500 2 4 1 2 1 2 3 2 1 2 2 1 3 4 2 2 2 2 1 2 2 1 2 4 3 2 2 50 4 3 4 2 2
19 1 2 2 1 2 16500 3 4 1 2 1 2 3 1 1 2 2 3 3 2 2 2 2 2 1 2 2 1 1 1 1 2 2 40 1 1 4 2 2
19 1 2 1 5 10 25000 3 5 1 3 1 1 1 3 2 1 2 2 2 1 2 1 2 1 1 2 1 4 1 2 1 2 2 50 2 2 1 3 2
20 1 1 2 5 10 20000 3 5 1 3 1 2 3 2 2 2 2 2 3 1 2 1 1 1 1 2 2 3 2 3 1 2 2 70 1 2 4 2 2
18 1 2 2 5 6 30000 1 5 1 3 1 2 3 1 2 2 2 3 3 4 1 1 2 2 1 2 2 1 2 1 1 2 2 50 4 1 4 2 2
20 1 2 2 7 6 6000 1 4 1 2 3 2 3 3 2 3 2 3 3 4 1 1 1 1 2 1 1 4 3 3 1 2 1 90 3 2 3 2 2
20 1 2 2 2 5 35000 4 1 1 3 1 2 3 2 2 1 2 3 3 4 2 1 2 2 1 2 1 2 2 2 1 2 1 120 1 2 3 1 2
20 1 2 2 5 3 15000 5 4 2 2 3 2 3 2 1 1 1 3 3 4 2 2 2 1 1 2 2 1 2 1 1 2 2 40 4 2 4 2 2
20 1 1 1 5 8 15000 2 8 2 3 3 2 1 2 2 2 2 1 3 4 2 1 2 1 1 2 2 1 1 1 1 2 2 60 4 2 4 2 2

21 1 2 1 1 7 15000 5 7 2 3 3 2 3 1 1 2 1 2 3 4 2 1 2 1 1 2 2 1 1 1 1 2 2 40 1 2 4 1 2
20 1 2 1 4 4 13000 5 5 1 2 1 2 3 2 2 1 2 3 3 4 2 2 2 2 1 2 1 2 1 2 1 2 2 90 2 2 3 1 2
18 1 2 2 7 10 5000 1 4 1 1 1 2 3 1 2 2 2 3 3 1 2 2 2 1 1 2 2 4 2 3 3 1 2 40 4 1 4 3 2
18 1 2 2 5 5 20000 3 4 1 1 1 2 3 1 2 2 2 3 3 1 2 2 2 1 1 1 2 4 2 3 3 1 2 60 1 1 4 3 2
18 1 2 2 5 10 5000 1 4 1 3 2 1 2 3 1 2 3 1 3 4 1 1 2 2 1 2 1 3 2 1 2 2 2 40 2 2 4 1 2
19 1 1 2 5 9 30000 4 5 1 3 1 2 3 2 2 2 2 3 3 4 2 1 2 2 1 2 2 1 2 1 1 2 2 60 3 1 4 1 2
19 1 2 1 4 10 2500 1 4 1 3 2 2 3 1 2 2 2 2 3 1 2 1 2 2 1 2 2 1 2 1 1 2 1 50 1 2 4 1 2
21 2 1 2 4 8 4000 1 5 1 3 1 2 3 2 3 2 2 2 3 1 2 2 2 2 1 2 2 2 2 1 1 3 2 50 2 2 4 1 2
21 1 2 2 6 6 7000 2 6 2 3 1 2 3 1 1 2 2 3 3 2 2 2 2 1 2 1 1 1 1 1 2 2 2 60 1 2 4 2 2
20 2 1 2 4 5 4000 1 3 1 3 1 2 3 2 3 2 2 2 3 1 2 2 2 2 1 2 2 2 2 1 1 3 2 50 2 2 4 1 2
18 1 2 2 2 3 20000 3 5 2 1 1 2 3 1 2 1 2 2 3 3 2 2 2 2 1 1 2 3 2 1 1 2 1 60 1 2 4 2 2
18 1 2 1 2 3 20000 3 4 2 1 2 2 3 1 3 1 2 2 3 4 2 1 2 2 1 2 2 1 2 1 1 2 1 85 1 2 4 2 2
19 2 1 2 3 2 10000 2 4 1 1 1 2 1 2 1 2 2 2 3 1 2 2 2 1 1 2 2 1 2 4 1 3 2 50 4 4 4 2 2
18 1 2 2 5 9 7000 2 4 1 3 1 2 3 1 1 1 2 3 1 1 1 2 2 2 2 2 2 4 1 1 1 2 2 60 3 1 2 1 2
19 2 2 2 4 2 25000 3 6 1 1 1 2 1 3 3 3 2 3 3 4 2 2 2 2 1 2 2 3 1 3 1 2 2 60 3 1 3 2 2
18 1 2 2 4 6 16000 2 5 2 3 2 2 3 2 2 2 2 2 3 1 2 2 2 2 1 2 2 1 1 1 1 3 2 50 1 2 4 1 2
19 2 1 2 1 2 50000 5 6 2 1 1 2 3 1 2 1 2 2 3 2 1 2 2 1 1 2 2 1 2 2 1 2 2 80 1 2 4 2 2
19 2 1 2 4 6 50000 5 4 1 2 2 2 3 1 2 2 2 2 3 1 2 2 2 1 1 2 2 1 2 1 3 1 2 20 2 1 4 1 2
19 2 1 2 1 2 60000 6 4 1 1 2 2 3 2 1 2 3 1 1 4 2 2 2 2 2 2 2 4 3 1 1 1 2 50 1 3 2 1 2
19 1 1 2 5 2 32000 6 4 1 1 1 2 3 1 2 2 2 3 3 1 2 2 2 1 1 2 2 3 2 2 3 3 1 60 2 1 3 2 2
19 1 1 2 1 3 30000 4 3 1 1 1 2 3 1 2 2 2 3 3 1 2 2 2 1 1 2 2 2 2 1 3 3 2 90 2 1 3 2 2
18 1 2 2 5 6 5000 1 4 1 3 1 2 1 1 1 1 2 3 1 1 1 2 2 2 2 2 2 4 1 1 1 2 2 60 3 1 2 1 2
21 1 1 2 4 3 10000 2 4 1 1 1 2 3 1 2 1 2 1 3 4 1 2 2 2 1 2 2 1 2 3 1 3 2 60 2 1 4 2 2
18 1 2 2 1 2 10000 2 4 1 1 1 2 1 1 2 1 1 3 3 4 2 2 2 2 1 2 2 1 2 1 3 2 2 70 1 2 4 2 2
18 1 2 1 4 10 25000 3 4 1 3 3 2 3 3 2 1 2 3 3 1 2 2 2 2 1 2 2 1 2 1 3 2 2 55 1 2 4 2 2
19 2 1 1 2 7 20000 3 4 1 1 2 2 2 3 1 2 1 1 2 2 2 2 2 2 1 2 2 4 2 1 1 4 1 60 1 1 2 1 2
18 2 1 2 4 5 80000 2 2 1 3 1 2 3 1 2 1 2 2 3 4 2 2 2 2 1 2 2 2 2 2 3 4 2 20 1 1 4 1 2
18 2 1 2 2 3 25000 3 3 1 1 1 2 1 1 2 2 2 2 3 2 2 2 2 1 1 2 2 3 2 3 1 2 2 60 1 1 4 1 2
18 2 1 2 2 2 80000 6 5 1 1 1 2 3 1 2 2 2 2 3 2 2 2 2 1 1 2 2 3 2 3 1 2 2 60 3 1 4 1 2
18 2 1 1 3 5 100000 3 4 1 1 1 2 3 1 2 2 2 2 3 4 1 2 2 2 1 2 2 1 2 1 1 3 2 60 1 3 2 2 2
18 2 2 1 4 2 40000 4 4 1 2 1 2 1 3 2 2 2 2 3 4 1 2 2 2 1 2 2 3 1 1 1 2 2 70 1 1 1 1 2
18 2 2 2 4 2 40000 4 5 1 2 1 2 1 3 2 3 2 2 3 4 1 2 2 1 1 2 2 3 1 2 3 1 2 60 4 3 2 1 2
18 2 2 2 4 2 40000 4 5 1 1 1 2 3 1 3 3 2 2 3 1 2 2 2 2 1 2 2 2 2 1 1 2 2 40 1 1 4 1 2
18 2 2 2 4 2 10000 2 3 1 1 1 2 3 1 3 2 2 2 3 1 2 2 2 1 1 2 1 2 2 2 1 1 2 50 2 2 2 2 2
18 2 2 2 4 3 30000 3 4 1 1 1 2 3 1 3 3 2 2 3 1 2 2 2 1 1 2 2 2 2 1 1 2 2 40 1 1 4 1 2
22 1 1 3 2 3 30000 3 5 2 2 3 2 1 2 2 2 1 3 3 1 2 2 2 2 2 2 2 3 1 3 1 3 2 60 3 2 4 1 2
19 1 1 1 5 3 45000 5 4 2 2 3 2 3 2 1 1 1 3 3 4 2 1 2 1 2 2 1 4 2 3 3 2 1 98 3 1 3 2 2
20 1 2 2 1 2 52000 5 4 1 3 3 2 3 2 2 1 1 3 3 1 2 2 2 2 1 2 2 1 2 2 3 2 2 90 2 1 2 3 2
20 1 2 2 5 8 5000 1 5 1 3 1 2 1 1 2 2 1 2 3 1 2 1 2 2 1 2 1 1 2 2 1 2 2 112 2 2 3 1 2
18 1 2 2 3 4 15000 2 3 1 1 1 2 3 1 2 2 2 2 1 4 2 2 2 2 1 2 2 1 1 2 1 3 2 40 1 1 3 1 2
19 2 1 2 2 3 27000 3 4 1 3 1 2 3 1 2 2 1 2 3 3 2 2 2 1 1 2 1 1 3 1 1 3 2 50 1 2 1 1 2
20 2 1 1 2 8 50000 4 5 2 1 2 2 3 1 2 2 2 2 3 1 2 2 1 2 2 2 2 2 1 1 1 2 2 60 1 2 4 1 2
19 2 1 1 1 2 25000 3 5 1 3 1 2 3 1 1 1 1 1 3 2 2 1 2 2 2 2 2 1 2 1 1 2 2 60 1 2 4 1 2
19 2 1 1 1 2 24000 3 3 1 3 2 2 3 1 2 2 2 3 3 1 2 2 2 2 1 2 2 4 3 4 3 3 2 60 1 3 4 2 2
20 1 1 1 1 1 100000 6 4 1 3 1 2 3 1 2 1 2 2 3 1 2 2 2 2 1 2 2 1 2 1 1 2 2 100 1 2 4 1 2
20 2 1 3 1 10 60000 5 5 1 1 1 2 3 1 2 2 1 2 3 1 2 2 1 1 1 2 2 1 2 1 1 1 2 70 2 2 3 1 2
19 2 2 1 4 2 38000 4 4 1 3 1 2 3 1 1 2 1 2 3 1 2 2 2 2 1 2 2 1 2 1 1 4 2 80 1 2 4 3 2
20 1 1 1 5 2 40000 5 4 1 3 2 3 3 1 2 2 2 2 3 1 2 2 1 1 1 2 2 2 2 3 1 3 2 75 1 3 3 1 2
20 1 2 1 2 2 22000 3 4 1 3 2 2 3 1 2 2 2 2 3 1 2 1 2 2 1 2 2 1 2 3 1 2 1 80 1 2 3 2 2
19 2 1 1 1 2 200000 7 4 1 3 1 2 1 1 2 2 1 2 3 4 2 2 1 2 1 2 2 2 1 1 1 4 2 40 1 2 4 2 2
20 2 2 2 2 3 36000 4 4 1 3 1 2 3 1 1 2 1 1 2 4 1 2 2 1 1 2 1 4 3 3 3 3 1 60 3 1 3 1 2
20 2 2 1 1 3 50000 5 4 1 3 2 2 3 1 2 2 2 2 3 4 2 1 1 2 1 2 2 1 2 1 1 1 2 70 1 1 4 2 2
19 2 2 1 3 5 10000 2 5 1 2 1 2 3 1 2 2 1 1 3 1 2 2 2 2 1 2 2 1 2 1 3 4 2 70 1 2 4 2 2
18 2 2 2 3 4 25000 3 4 1 3 1 2 1 1 2 2 2 3 3 4 2 2 2 2 1 2 2 2 2 1 3 4 2 60 1 1 3 2 2
20 2 2 1 2 3 30000 3 3 1 3 3 2 3 1 2 2 2 3 3 1 2 2 2 2 1 2 2 1 2 1 1 4 2 60 1 1 4 2 2
19 2 1 1 2 4 17000 2 4 1 3 1 2 3 2 3 2 1 2 3 1 2 1 1 2 1 2 1 2 2 1 1 2 2 50 1 3 4 2 2
21 1 1 2 1 2 80000 6 4 1 1 1 2 3 1 2 2 1 2 3 4 2 2 2 2 3 2 2 1 2 1 3 2 2 50 2 2 2 2 2
18 2 1 1 1 2 140000 7 4 1 3 1 2 3 1 2 2 1 2 3 1 2 1 1 2 1 2 2 1 2 2 1 2 2 70 1 2 3 1 2
20 2 2 2 1 2 20000 3 5 1 1 1 2 3 2 1 1 2 2 3 1 2 1 2 2 1 2 2 2 2 2 1 1 1 60 1 1 1 1 2
20 2 1 1 1 2 150000 7 4 1 3 1 2 2 1 2 2 2 1 3 4 2 2 2 2 1 2 2 2 2 1 3 2 2 60 1 1 4 1 2
19 1 2 2 3 6 15000 2 7 1 2 2 2 3 1 3 2 2 1 3 4 2 2 1 2 1 2 2 1 2 1 1 2 1 50 1 2 4 2 2
20 2 2 1 2 5 20000 3 3 1 3 1 2 3 2 1 2 1 2 3 4 2 1 2 1 1 2 2 1 3 1 3 4 2 60 1 1 3 2 2
20 2 1 2 6 9 7000 2 4 1 2 2 2 3 1 2 2 3 2 3 4 2 1 2 2 1 2 2 1 2 1 1 1 2 80 1 1 3 2 2
19 2 2 1 1 2 50000 5 4 1 3 1 2 3 1 2 2 2 2 3 4 2 2 1 2 1 2 2 3 2 1 1 2 2 50 1 2 4 1 2
21 1 2 1 3 3 52000 5 3 1 2 1 2 3 1 1 2 1 3 3 1 2 2 2 1 1 2 2 2 2 1 1 2 2 50 1 1 4 2 2
19 2 1 1 2 3 40000 1 4 1 1 1 2 3 1 2 2 2 2 1 1 2 2 1 1 1 2 2 2 2 1 1 3 2 70 1 2 3 2 2

20 2 1 1 2 3 30000 3 5 1 1 1 2 3 1 2 2 2 3 1 1 2 2 1 1 1 2 2 2 2 1 1 4 2 80 1 2 3 2 2
23 1 1 2 4 2 20000 2 3 1 1 3 2 3 1 2 2 1 3 1 1 1 1 2 1 1 2 2 2 2 1 1 4 2 50 2 2 2 2 2
18 1 2 2 5 9 12000 2 4 1 2 1 2 3 3 2 2 2 2 3 4 1 1 1 1 2 1 2 2 1 2 1 1 1 50 2 2 1 2 2
20 1 2 2 4 8 18000 2 4 1 3 1 2 1 1 2 2 1 2 3 1 1 1 2 1 1 2 1 2 2 1 1 1 2 40 2 2 1 2 2
20 1 1 2 5 9 8000 1 4 1 3 1 2 1 1 2 2 1 2 3 1 1 1 1 2 2 1 1 2 2 2 1 4 2 40 2 2 2 2 2
21 1 1 1 5 2 30000 3 4 1 3 3 1 3 2 2 3 3 2 3 1 1 1 2 2 1 1 1 2 1 1 1 4 2 50 2 2 1 2 2
22 1 1 1 1 1 100000 7 4 1 1 3 1 1 1 1 3 1 2 3 2 1 1 1 1 2 1 1 1 2 2 2 2 1 84 1 1 2 1 2
19 2 2 1 4 9 12000 6 4 1 1 2 2 3 2 2 2 1 3 3 4 2 2 2 1 2 2 3 1 1 1 4 2 1 60 1 2 1 1 2
18 2 2 2 4 9 5000 1 5 1 1 2 2 3 1 2 2 1 3 3 4 2 2 2 2 1 2 2 4 2 4 1 1 2 50 1 2 1 2 2
18 2 2 1 2 5 15000 2 3 1 2 2 2 3 1 2 3 2 2 3 4 2 2 2 2 1 2 2 1 2 1 1 3 2 50 1 2 1 2 2
18 2 2 2 6 8 24000 3 6 1 1 2 2 3 1 2 3 2 2 3 1 2 2 2 1 1 2 2 1 1 1 1 1 2 50 1 1 2 2 2
18 2 2 2 5 8 15000 2 5 1 2 1 2 3 3 2 3 2 2 3 4 2 1 2 2 1 2 2 1 2 1 1 4 2 50 1 2 1 2 2
19 2 1 1 2 3 28000 3 5 1 2 1 2 3 1 2 2 1 2 3 1 2 1 2 2 1 2 2 1 2 1 1 4 2 40 1 1 1 2 2
18 2 1 2 4 8 15000 2 4 1 1 1 2 3 2 2 2 2 2 3 4 2 2 2 2 2 2 2 4 2 1 1 4 2 40 1 2 4 2 2
18 2 1 2 3 2 10000 2 5 1 1 1 2 1 2 1 1 2 2 3 1 2 1 2 2 1 2 2 4 1 4 1 2 2 50 1 1 2 1 2
18 1 2 2 5 3 8000 2 5 1 3 1 2 1 3 2 1 2 3 3 4 1 2 2 1 1 1 1 1 3 1 3 2 1 80 2 1 1 1 2
19 1 2 2 2 7 5000 1 3 2 3 1 2 1 1 2 3 1 2 1 1 1 1 2 1 2 2 2 1 3 1 1 2 2 50 1 2 2 3 2
18 1 2 2 6 8 5600 1 4 1 3 2 2 3 3 2 2 2 3 2 4 1 2 2 2 1 2 1 1 1 2 3 1 1 80 3 2 2 1 2
19 1 1 2 2 3 25000 5 4 1 1 1 2 3 1 2 3 2 2 3 1 2 2 1 1 2 2 2 2 3 3 1 2 1 80 2 1 3 2 2
19 2 1 1 2 3 18000 3 4 1 1 1 2 3 1 2 2 2 1 1 4 2 1 1 1 1 2 2 1 2 1 1 2 1 60 1 2 3 1 2
21 1 1 1 2 3 100000 6 4 1 3 1 2 3 2 2 2 1 1 1 1 2 2 2 1 2 2 2 2 2 2 2 1 2 80 2 2 2 2 2
24 2 1 2 2 2 80000 5 2 2 3 2 2 2 3 2 3 1 2 3 3 1 2 2 1 1 2 2 1 3 2 2 2 2 60 3 1 2 1 2
19 1 2 2 4 3 50000 4 4 1 3 3 2 3 1 1 3 2 3 3 1 2 2 2 2 2 2 2 2 3 2 3 1 1 70 3 3 2 2 2
20 2 2 1 3 1 60000 5 4 1 2 3 2 1 3 2 2 1 3 3 1 2 2 1 2 2 2 2 3 1 2 2 3 1 80 3 3 3 3 2
19 1 2 2 1 2 150000 7 5 1 3 3 2 3 1 2 2 1 3 3 4 2 2 2 2 1 2 2 1 2 2 1 4 2 70 1 2 1 2 2
21 2 2 2 2 3 30000 3 5 1 3 2 2 3 1 1 2 2 2 3 4 2 1 2 1 1 2 2 2 2 3 1 1 2 80 1 1 3 1 2
23 1 1 1 4 3 30000 3 4 1 2 1 2 3 1 2 2 1 3 3 1 2 2 2 2 1 2 2 1 2 1 1 3 2 100 1 2 2 2 2
22 2 1 3 1 2 50000 5 4 1 1 1 2 3 1 2 2 1 1 3 1 2 2 2 1 1 2 2 1 2 4 1 3 2 80 1 1 4 2 2
22 1 1 3 2 3 75000 6 5 2 1 1 2 3 1 2 2 2 3 3 1 1 1 1 1 2 1 2 1 3 4 3 1 2 80 1 3 1 1 2
22 2 1 3 4 3 20000 3 4 1 3 2 2 3 1 1 2 2 2 3 4 2 2 2 1 2 2 1 1 2 2 3 1 2 60 2 2 2 2 2
20 2 1 1 1 3 150000 7 3 1 1 3 2 3 1 2 2 2 1 3 4 2 1 2 2 1 2 1 1 2 1 1 3 2 60 1 1 3 2 2
21 2 1 2 3 8 80000 6 4 1 3 2 2 1 1 2 2 2 2 3 1 2 2 2 1 2 2 2 1 2 3 3 1 2 50 1 2 2 2 2
24 1 1 1 4 8 25000 2 5 1 3 1 2 3 1 2 2 2 1 3 1 2 1 2 2 1 2 1 2 2 2 1 4 1 100 1 3 3 3 2
21 1 1 2 1 2 30000 3 4 2 3 2 2 3 1 2 2 2 3 3 1 2 2 2 2 1 2 2 1 2 1 1 4 2 80 1 2 4 1 2
23 1 1 1 2 3 40000 4 4 1 2 3 3 2 2 1 3 2 2 3 1 1 1 1 1 1 1 1 4 1 3 1 1 1 60 3 1 1 1 2
22 1 1 1 1 3 41000 4 4 1 3 1 2 3 2 2 2 1 2 3 1 1 1 1 1 1 1 1 4 1 3 1 1 1 90 3 1 1 1 2
21 1 1 1 2 2 80000 6 4 1 2 2 2 1 1 2 1 1 3 3 1 2 1 1 2 1 2 2 1 1 1 1 2 2 80 1 2 3 1 2
23 1 1 1 2 3 54000 4 5 1 1 2 2 3 3 2 2 2 2 3 1 2 1 2 2 1 2 2 1 2 1 1 2 2 60 1 2 3 2 2
22 1 1 1 2 2 70000 6 4 1 2 2 2 3 1 2 1 2 3 3 1 2 2 2 2 1 2 2 1 2 1 1 2 1 120 1 2 2 2 2
22 1 1 1 4 2 45000 4 4 1 3 3 2 3 1 2 1 2 3 3 1 2 1 2 2 1 2 2 1 2 1 1 3 2 120 1 2 2 2 2
23 1 1 1 2 2 25000 3 4 1 3 2 2 3 1 2 1 2 3 3 1 2 1 2 2 1 2 2 1 2 1 1 2 2 90 1 2 2 1 2
21 1 1 1 2 2 45000 4 4 1 3 1 2 3 1 2 1 1 3 3 4 2 1 2 2 1 1 2 1 1 1 1 2 1 120 1 1 3 2 2
21 1 1 1 1 2 100000 6 4 1 1 2 2 1 1 2 2 2 1 3 1 2 2 2 2 1 2 2 1 2 1 1 1 1 80 1 1 4 3 2
21 1 1 1 1 1 40000 4 3 1 3 3 2 3 1 1 2 2 3 3 4 2 1 2 2 1 2 2 1 2 1 1 2 1 48 1 2 1 1 2
22 1 2 1 4 6 30000 3 6 2 3 2 2 3 1 2 2 1 2 3 1 2 2 2 1 1 2 2 1 2 2 1 2 2 60 1 2 4 2 2
22 2 1 3 1 2 15000 2 3 1 3 3 2 3 1 2 2 1 2 3 1 2 2 2 2 1 2 2 1 1 1 1 3 2 60 1 2 3 1 2
22 2 1 3 1 2 30000 3 3 1 3 2 2 3 2 2 2 2 1 3 1 2 2 2 2 1 2 2 1 2 1 1 2 2 40 1 2 4 2 2
21 2 2 2 2 3 30000 4 4 1 3 2 2 3 2 2 2 2 1 3 1 2 2 2 2 1 2 2 1 2 1 1 2 2 40 1 2 4 2 2
23 2 1 1 2 3 40000 4 4 1 1 1 2 1 1 2 2 1 2 3 1 2 2 2 2 1 2 2 2 2 2 1 2 2 40 2 3 3 2 2
25 2 1 2 4 1 70000 6 4 1 3 2 2 3 1 2 2 2 3 3 2 2 1 2 1 1 2 1 1 2 2 1 3 2 60 1 1 4 1 2
23 1 1 3 5 9 15000 2 4 1 1 1 2 3 3 2 2 2 3 3 1 2 2 2 1 1 2 2 1 2 2 3 1 1 110 1 2 3 1 2
22 1 1 1 1 1 200000 7 3 1 1 1 2 3 1 2 2 2 3 3 1 2 2 2 2 1 2 2 1 2 2 1 2 1 70 1 1 3 2 2
21 1 2 2 4 6 10000 2 3 1 2 1 2 3 1 2 1 2 3 3 3 2 2 2 2 2 2 2 2 1 3 3 1 2 40 1 2 1 1 2
23 1 1 2 2 2 40000 4 4 1 3 1 2 3 1 2 2 1 2 3 1 1 1 1 1 1 1 1 3 1 1 3 1 2 110 1 1 1 1 2
21 1 1 2 1 2 50000 5 4 1 1 2 2 3 1 2 2 2 3 3 1 2 2 2 2 1 2 2 1 2 2 3 4 2 80 1 2 3 2 2
19 2 1 1 4 8 24000 3 5 1 2 2 2 3 1 2 2 2 1 3 4 1 2 2 1 1 2 2 1 2 1 3 1 2 45 1 1 1 2 2
19 2 2 2 2 3 16000 2 3 1 3 1 2 3 1 2 2 1 2 3 1 2 2 2 2 1 2 2 1 2 4 3 1 2 60 1 2 1 2 2
19 2 2 2 4 9 15000 2 4 1 3 1 2 3 2 2 2 2 2 3 1 1 2 2 1 2 2 2 1 2 1 3 1 2 40 1 2 2 2 2
19 2 1 2 3 5 30000 3 4 1 3 1 2 3 1 3 2 2 1 3 4 2 2 2 1 1 1 1 1 2 1 1 4 2 45 1 2 2 2 2
19 2 1 2 5 6 15000 2 5 1 1 2 2 1 2 2 2 1 1 3 1 2 2 2 2 1 2 2 4 2 1 1 4 2 50 1 1 2 1 2
20 2 1 2 3 5 50000 5 4 1 1 2 2 3 1 3 3 1 1 3 4 2 2 2 1 1 2 1 2 2 2 1 4 2 60 1 2 1 2 2
25 1 1 3 1 3 35000 4 4 1 3 1 2 1 1 1 2 1 1 3 1 1 1 2 2 1 1 1 1 1 1 1 1 1 40 1 1 1 1 2
23 2 1 1 2 3 20000 3 4 1 3 1 2 3 3 2 1 2 2 3 1 2 2 2 2 1 2 2 2 2 1 1 4 2 60 1 2 2 2 2
19 2 2 2 3 5 16000 2 3 1 1 1 2 3 1 2 2 3 1 3 4 2 1 2 2 1 2 2 1 3 1 1 2 2 30 1 1 3 1 2
18 2 1 1 2 5 16000 2 5 1 1 1 2 3 1 2 2 3 1 3 4 2 1 2 2 1 2 2 1 3 1 1 2 2 40 1 1 3 1 2
20 2 2 1 1 1 100000 6 4 1 3 2 2 3 1 1 2 2 3 3 1 2 2 2 2 2 2 2 3 2 3 3 2 2 90 2 3 3 2 2

23 2 1 1 4 2 75000 6 4 1 3 2 2 1 3 2 2 1 3 3 2 2 2 2 2 1 1 2 3 2 3 2 3 2 60 3 1 2 2 2
21 1 1 2 1 1 100000 6 4 1 2 2 3 2 3 2 2 1 2 3 1 2 2 1 2 2 1 2 1 1 4 1 3 1 70 3 1 3 2 2
19 2 2 2 2 3 16000 2 3 1 3 1 2 3 1 2 2 1 2 3 1 2 2 2 2 1 2 2 1 2 4 3 1 2 60 1 2 1 2 2
19 2 2 2 4 9 15000 2 4 1 3 1 2 3 2 2 2 2 2 3 1 1 2 2 1 2 2 2 1 2 1 3 1 2 40 1 2 2 2 2
19 2 1 2 3 5 30000 3 4 1 3 1 2 3 1 3 2 2 1 3 4 2 2 2 1 1 1 1 1 2 1 1 4 2 45 1 2 2 2 2
19 2 1 2 5 6 15000 2 5 1 1 2 2 1 2 2 2 1 1 3 1 2 2 2 2 1 2 2 4 2 1 1 4 2 50 1 1 2 1 2
20 2 1 2 3 5 50000 5 4 1 1 2 2 3 1 3 3 1 1 3 4 2 2 2 1 1 2 1 2 2 2 1 4 2 60 1 2 1 2 2
25 1 1 3 1 3 35000 4 4 1 3 1 2 1 1 1 2 1 1 3 1 1 1 2 2 1 1 1 1 1 1 1 1 1 40 1 1 1 1 2
23 2 1 1 2 3 20000 3 4 1 3 1 2 3 3 2 1 2 2 3 1 2 2 2 2 1 2 2 2 2 1 1 4 2 60 1 2 2 2 2
19 2 2 2 3 5 16000 2 3 1 1 1 2 3 1 2 2 3 1 3 4 2 1 2 2 1 2 2 1 3 1 1 2 2 30 1 1 3 1 2
18 2 1 1 2 5 16000 2 5 1 1 1 2 3 1 2 2 3 1 3 4 2 1 2 2 1 2 2 1 3 1 1 2 2 40 1 1 3 1 2
20 2 2 1 1 1 100000 6 4 1 3 2 2 3 1 1 2 2 3 3 1 2 2 2 2 2 2 2 3 2 3 3 2 2 90 2 3 3 2 2
23 2 1 1 4 2 75000 6 4 1 3 2 2 1 3 2 2 1 3 3 2 2 2 2 2 1 1 2 3 2 3 2 3 2 60 3 1 2 2 2
21 1 1 2 1 1 100000 6 4 1 2 2 3 2 3 2 2 1 2 3 1 2 2 1 2 2 1 2 1 1 4 1 3 1 70 3 1 3 2 2
18 2 1 2 2 2 80000 6 5 1 1 1 2 3 1 2 2 2 2 3 2 2 2 2 1 1 2 2 3 2 3 1 2 2 60 3 1 4 1 2
18 2 1 1 3 5 100000 3 4 1 1 1 2 3 1 2 2 2 2 3 4 1 2 2 2 1 2 2 1 2 1 1 3 2 60 1 3 2 2 2
18 2 2 1 4 2 40000 4 4 1 2 1 2 1 3 2 2 2 2 3 4 1 2 2 2 1 2 2 3 1 1 1 2 2 70 1 1 1 1 2
18 2 2 2 4 2 40000 4 5 1 2 1 2 1 3 2 3 2 2 3 4 1 2 2 1 1 2 2 3 1 2 3 1 2 60 4 3 2 1 2
18 2 2 2 4 2 40000 4 5 1 1 1 2 3 1 3 3 2 2 3 1 2 2 2 2 1 2 2 2 2 1 1 2 2 40 1 1 4 1 2
18 2 2 2 4 2 10000 2 3 1 1 1 2 3 1 3 2 2 2 3 1 2 2 2 1 1 2 1 2 2 2 1 1 2 50 2 2 2 2 2
18 2 2 2 4 3 30000 3 4 1 1 1 2 3 1 3 3 2 2 3 1 2 2 2 1 1 2 2 2 2 1 1 2 2 40 1 1 4 1 2
18 1 1 1 3 7 13000 7 4 1 1 3 2 3 3 1 1 2 3 3 4 2 2 2 2 1 2 2 2 1 1 3 2 2 40 1 2 4 1 2
18 1 2 1 3 5 5000 1 4 1 3 1 2 3 1 2 3 2 1 3 2 2 1 2 1 1 2 1 1 2 2 3 3 2 55 1 2 4 2 2
19 1 2 1 3 6 50000 5 5 1 2 2 2 3 3 3 2 1 3 3 1 2 2 2 1 1 2 2 4 1 1 2 2 2 45 4 3 1 2 2
18 2 2 2 1 3 6500 2 4 1 2 1 2 3 2 1 2 2 1 3 4 2 2 2 2 1 2 2 1 2 4 3 2 2 50 4 3 4 2 2
19 1 2 2 1 2 16500 3 4 1 2 1 2 3 1 1 2 2 3 3 2 2 2 2 2 1 2 2 1 1 1 1 2 2 40 1 1 4 2 2
19 1 2 2 5 10 25000 3 5 1 3 1 1 1 3 2 1 2 2 2 1 2 1 2 1 1 2 1 4 1 2 1 2 2 50 2 2 1 3 2
20 1 1 2 5 10 20000 3 5 1 3 1 2 3 2 2 2 2 2 3 1 2 1 1 1 1 2 2 3 2 3 1 2 2 70 1 2 4 2 2
18 1 2 2 5 6 30000 1 5 1 3 1 2 3 1 2 2 2 3 3 4 1 1 2 2 1 2 2 1 2 1 1 2 2 50 4 1 4 2 2
20 1 2 2 7 6 6000 1 4 1 2 3 2 3 3 2 3 2 3 3 4 1 1 1 1 2 1 1 4 3 3 1 2 1 90 3 2 3 2 2
20 1 2 2 2 5 35000 4 1 1 3 1 2 3 2 2 1 2 3 3 4 2 1 2 2 1 2 1 2 2 2 1 2 1 120 1 2 3 1 2
20 1 2 2 5 3 15000 5 4 2 2 3 2 3 2 1 1 1 3 3 4 2 2 2 1 1 2 2 1 2 1 1 2 2 40 4 2 4 2 2
20 1 1 1 5 8 15000 2 8 2 3 3 2 1 2 2 2 2 1 3 4 2 1 2 1 1 2 2 1 1 1 1 2 2 60 4 2 4 2 2
21 1 2 1 1 7 15000 5 7 2 3 3 2 3 1 1 2 1 2 3 4 2 1 2 1 1 2 2 1 1 1 1 2 2 40 1 2 4 1 2
20 1 2 1 4 4 13000 5 5 1 2 1 2 3 2 2 1 2 3 3 4 2 2 2 2 1 2 1 2 1 2 1 2 2 90 2 2 3 1 2
18 1 2 3 7 10 5000 1 4 1 1 1 2 3 1 2 2 2 3 3 1 2 2 2 1 1 2 2 4 2 3 3 1 2 40 4 1 4 3 2
18 1 2 2 5 5 20000 3 4 1 1 1 2 3 1 2 2 2 3 3 1 2 2 2 1 1 1 2 4 2 3 3 1 2 60 1 1 4 3 2
18 1 2 2 5 10 5000 1 4 1 3 2 1 2 3 1 2 3 1 3 4 1 1 2 2 1 2 1 3 2 1 2 2 2 40 2 2 4 1 2
19 1 1 2 5 9 30000 4 5 1 3 1 2 3 2 2 2 2 3 3 4 2 1 2 2 1 2 2 1 2 1 1 2 2 60 3 1 4 1 2
19 1 2 1 4 10 2500 1 4 1 3 2 2 3 1 2 2 2 2 3 1 2 1 2 2 1 2 2 1 2 1 1 2 1 50 1 2 4 1 2
19 1 2 2 2 7 5000 1 3 2 3 1 2 1 1 2 3 1 2 1 1 1 1 2 1 2 2 2 1 3 1 1 2 2 50 1 2 2 3 2
18 1 2 2 6 8 5600 1 4 1 3 2 2 3 3 2 2 2 3 2 4 1 2 2 2 1 2 1 1 1 2 3 1 1 80 3 2 2 1 2
19 1 1 2 2 3 25000 5 4 1 1 1 2 3 1 2 3 2 2 3 1 2 2 1 1 2 2 2 2 3 3 1 2 1 80 2 1 3 2 2
19 2 1 1 2 3 18000 3 4 1 1 1 2 3 1 2 2 2 1 1 4 2 1 1 1 1 2 2 1 2 1 1 2 1 60 1 2 3 1 2
21 1 1 1 2 3 100000 6 4 1 3 1 2 3 2 2 2 1 1 1 1 2 2 2 1 2 2 2 2 2 2 2 1 2 80 2 2 2 2 2
24 2 1 2 2 2 80000 5 2 2 3 2 2 2 3 2 3 1 2 3 3 1 2 2 1 1 2 2 1 3 2 2 2 2 60 3 1 2 1 2
19 1 2 2 4 3 50000 4 4 1 3 3 2 3 1 1 3 2 3 3 1 2 2 2 2 2 2 2 2 3 2 3 1 1 70 3 3 2 2 2
18 2 1 1 2 5 16000 2 5 1 1 1 2 3 1 2 2 3 1 3 4 2 1 2 2 1 2 2 1 3 1 1 2 2 40 1 1 3 1 2
20 2 2 1 1 1 100000 6 4 1 3 2 2 3 1 1 2 2 3 3 1 2 2 2 2 2 2 2 3 2 3 3 2 2 90 2 3 3 2 2
23 2 1 1 4 2 75000 6 4 1 3 2 2 1 3 2 2 1 3 3 2 2 2 2 2 1 1 2 3 2 3 2 3 2 60 3 1 2 2 2
21 1 1 2 1 1 100000 6 4 1 2 2 3 2 3 2 2 1 2 3 1 2 2 1 2 2 1 2 1 1 4 1 3 1 70 3 1 3 2 2
19 2 2 2 2 3 16000 2 3 1 3 1 2 3 1 2 2 1 2 3 1 2 2 2 2 1 2 2 1 2 4 3 1 2 60 1 2 1 2 2
19 2 2 2 4 9 15000 2 4 1 3 1 2 3 2 2 2 2 2 3 1 1 2 2 1 2 2 2 1 2 1 3 1 2 40 1 2 2 2 2
19 2 1 2 3 5 30000 3 4 1 3 1 2 3 1 3 2 2 1 3 4 2 2 2 1 1 1 1 1 2 1 1 4 2 45 1 2 2 2 2
19 2 1 2 5 6 15000 2 5 1 1 2 2 1 2 2 2 1 1 3 1 2 2 2 2 1 2 2 4 2 1 1 4 2 50 1 1 2 1 2
20 2 1 2 3 5 50000 5 4 1 1 2 2 3 1 3 3 1 1 3 4 2 2 2 1 1 2 1 2 2 2 1 4 2 60 1 2 1 2 2
Copyright © 2022 FDOKUMEN