A Revised Systematic Layout Planning to Fit Disabled ... - MDPI
25
sustainability Article A Revised Systematic Layout Planning to Fit Disabled Workers Contexts Guido J. L. Micheli 1, * , Annamaria Rampoldi 1 and Fabrizio Baccanti 2 Citation: Micheli, G.J.L.; Rampoldi, A.; Baccanti, F. A Revised Systematic Layout Planning to Fit Disabled Workers Contexts. Sustainability 2021, 13, 6850. https://doi.org/10.3390/ su13126850 Academic Editor: Lucian-Ionel Cioca Received: 30 March 2021 Accepted: 12 June 2021 Published: 17 June 2021 Publisher’s Note: MDPI stays neutral with regard to jurisdictional claims in published maps and institutional affil- iations. Copyright: © 2021 by the authors. Licensee MDPI, Basel, Switzerland. This article is an open access article distributed under the terms and conditions of the Creative Commons Attribution (CC BY) license (https:// creativecommons.org/licenses/by/ 4.0/). 1 Department of Management, Economics and Industrial Engineering, Politecnico di Milano, 20133 Milano, Italy; [email protected] 2 Head of Operation and Company Founder, FARE, 20900 Monza, Italy; [email protected] * Correspondence: [email protected]; Tel.: +39-02-2399-4056 Abstract: Some people may be disadvantaged on the labor market because of their lower productivity; still, they have the same right to be employed as any other citizen. Social cooperatives employ disabled workers who are trained and supported in developing their abilities through individualized paths and targeted techniques. For the cooperatives to survive on the labor market, an improvement of management procedures and internal organization is required. To achieve this result, an optimal arrangement of activities must be determined to streamline the production processes, which is why Systematic Layout Planning (SLP) has been modified and adapted to fit disabled workers contexts. The factors of social cooperatives influencing the layout study have been determined and introduced into the classic SLP; the new methodology has been applied at L’Iride, a social cooperative developed through the years. The new layout has shown an improvement in space saturation of 219.2% and 197.5% considering the years 2019 and 2020. This paper provides social cooperatives with a revised SLP, including social factors, to enhance the disabled workers situation. Keywords: layout study; systematic layout planning; social cooperative; disabled workers; produc- tion process optimization; reconfigurability 1. Introduction and Objective of the Study Work must be protected, promoted, and granted to all citizens. Disabled workers are disadvantaged on the labor market, as they encounter difficulty or cannot carry out work processes due to their deficit [1], but they have the same right to be employed as any other citizen. The main barriers lie in the reluctance of employers to hire them and the small number of protected workplaces [2]. Over the years, regulations have been introduced to recognize the disadvantaged status and guarantee facilities to favor access to the labor market [3]. By favoring their employment, many people previously excluded from the labor market now have the opportunity to be included in a production process. To this end, Italian legislation has established “type B” (as in Law 381/1991) social cooperatives that deal with carrying out different activities, such as agricultural, industrial, and commercial, or services with the aim of promoting work placement for disadvantaged people; they are the ones this work refers to [4]. Social cooperatives have understood the necessity to adapt the production cycle to people instead of adapting people to the production cycle [5]. Through customized paths and targeted techniques, the disabled are trained and supported in developing their abilities, by encouraging the acquisition of the technical skills necessary to perform the required tasks [6]. Type B social cooperatives meet the needs of employers who must hire disabled workers, as stated by Law 68/99. The agreement can concern up to 30% of disabled workers of the enterprise, and employers undertake to entrust work orders to the social cooperative [7]. Overall, this means a potential need for the social cooperatives to grow in number, in volume, and in competitiveness in the near future, which is further Sustainability 2021, 13, 6850. https://doi.org/10.3390/su13126850 https://www.mdpi.com/journal/sustainability
-
Upload
khangminh22 -
Category
Documents
-
view
0 -
download
0
Transcript of A Revised Systematic Layout Planning to Fit Disabled ... - MDPI

sustainability
Article
A Revised Systematic Layout Planning to Fit DisabledWorkers Contexts
Guido J. L. Micheli 1,* , Annamaria Rampoldi 1 and Fabrizio Baccanti 2
�����������������
Citation: Micheli, G.J.L.; Rampoldi,
A.; Baccanti, F. A Revised Systematic
Layout Planning to Fit Disabled
Workers Contexts. Sustainability 2021,
13, 6850. https://doi.org/10.3390/
su13126850
Academic Editor: Lucian-Ionel Cioca
Received: 30 March 2021
Accepted: 12 June 2021
Published: 17 June 2021
Publisher’s Note: MDPI stays neutral
with regard to jurisdictional claims in
published maps and institutional affil-
iations.
Copyright: © 2021 by the authors.
Licensee MDPI, Basel, Switzerland.
This article is an open access article
distributed under the terms and
conditions of the Creative Commons
Attribution (CC BY) license (https://
creativecommons.org/licenses/by/
4.0/).
1 Department of Management, Economics and Industrial Engineering, Politecnico di Milano,20133 Milano, Italy; [email protected]
2 Head of Operation and Company Founder, FARE, 20900 Monza, Italy; [email protected]* Correspondence: [email protected]; Tel.: +39-02-2399-4056
Abstract: Some people may be disadvantaged on the labor market because of their lower productivity;still, they have the same right to be employed as any other citizen. Social cooperatives employdisabled workers who are trained and supported in developing their abilities through individualizedpaths and targeted techniques. For the cooperatives to survive on the labor market, an improvementof management procedures and internal organization is required. To achieve this result, an optimalarrangement of activities must be determined to streamline the production processes, which is whySystematic Layout Planning (SLP) has been modified and adapted to fit disabled workers contexts.The factors of social cooperatives influencing the layout study have been determined and introducedinto the classic SLP; the new methodology has been applied at L’Iride, a social cooperative developedthrough the years. The new layout has shown an improvement in space saturation of 219.2% and197.5% considering the years 2019 and 2020. This paper provides social cooperatives with a revisedSLP, including social factors, to enhance the disabled workers situation.
Keywords: layout study; systematic layout planning; social cooperative; disabled workers; produc-tion process optimization; reconfigurability
1. Introduction and Objective of the Study
Work must be protected, promoted, and granted to all citizens. Disabled workers aredisadvantaged on the labor market, as they encounter difficulty or cannot carry out workprocesses due to their deficit [1], but they have the same right to be employed as any othercitizen. The main barriers lie in the reluctance of employers to hire them and the smallnumber of protected workplaces [2].
Over the years, regulations have been introduced to recognize the disadvantagedstatus and guarantee facilities to favor access to the labor market [3]. By favoring theiremployment, many people previously excluded from the labor market now have theopportunity to be included in a production process. To this end, Italian legislation hasestablished “type B” (as in Law 381/1991) social cooperatives that deal with carrying outdifferent activities, such as agricultural, industrial, and commercial, or services with theaim of promoting work placement for disadvantaged people; they are the ones this workrefers to [4]. Social cooperatives have understood the necessity to adapt the productioncycle to people instead of adapting people to the production cycle [5]. Through customizedpaths and targeted techniques, the disabled are trained and supported in developing theirabilities, by encouraging the acquisition of the technical skills necessary to perform therequired tasks [6]. Type B social cooperatives meet the needs of employers who musthire disabled workers, as stated by Law 68/99. The agreement can concern up to 30% ofdisabled workers of the enterprise, and employers undertake to entrust work orders to thesocial cooperative [7]. Overall, this means a potential need for the social cooperatives togrow in number, in volume, and in competitiveness in the near future, which is further
Sustainability 2021, 13, 6850. https://doi.org/10.3390/su13126850 https://www.mdpi.com/journal/sustainability

Sustainability 2021, 13, 6850 2 of 25
corroborated by the rise of companies, such as FARE srl (http://www.fareinnovazione.com(accessed on 15 June 2021)), that explicitly aim at helping social cooperatives to grow.
In fact, when it comes to social cooperatives, all of them can be observed to have beendeveloped through the years without a clear business objective and consistency, with theonly aim to employ disabled workers. To describe this problem, the social cooperativeL’Iride has been taken as an example. It started as a small mechanical assembly workshopthat employed three disabled people. The activity was met with a great interest, and to fulfilthe growing demand from companies, an increasing number of disabled workers werehired. Whenever there was a need to increase the production capacity, new workstationswere installed without accounting for productivity, lead time, throughput, and otherparameters important for a cost-effective management. This led to the development ofmany but small production cells. This segmentation, inefficient from a business point ofview, made the cooperative unable to be competitive on the market.
Garcia-Sabater et al. noted that the survival of a company employing disabled workersis not easy in a market driven by costs and flexibility. Clients select the cooperative only ifit can offer prices and flexibility as good as their competitors [8]. To favor competitiveness,it is essential to reorganize the cooperative to resemble a traditional company. The im-provement of throughput, productivity, and efficiency can be reached through the layoutstudy, with the aim of determining the optimal arrangement of each production element [9].In social cooperatives, however, the optimization will have to be reached while also con-sidering the peculiar social factors (not included at all in traditional layout optimizationtechniques/approaches), while, as a matter of fact, no previous study has focused on it.This causes the need to revise traditional techniques used in the layout study to fit disabledworkers contexts. In the layout study adapted to social cooperatives, profit and socialobjectives must coexist, and both must be respected at the same time. “What is an objectivefor the ordinary enterprise becomes a constraint for the social enterprise, while vice versa,a constraint is transformed into an objective” [5]. The optimal spatial arrangement ofproduction elements must be combined with the identification of the ability of the disabledand with the breakdown of the production process into elementary operations to cope withthe ability of the disabled to perform only a single type of task. Knowing the characteristicsof the operators, it is possible to match the ability of the worker to the most adequate task.These actions help to avoid the placement of the disabled in an unsuitable process [10],supporting the diverse skills and abilities of the disabled workforce [8]. Only through thecombination of these improvement efforts is it possible to turn a social cooperative into amore and more competitive enterprise; in a few words, the status quo is a situation wherethe large majority of social cooperatives are actually not very competitive enterprises: theycould not survive without the fiscal incentives they benefit from and without the needfor disabled work and workers that large companies have due to the legislation. Thus, ofcourse a social cooperative is an enterprise, yet not a very competitive one. Thus, the overallaim of our study was to transform social cooperatives into more competitive enterprises,without losing their identity.
More specifically, the objective of this study was to perform a layout study for thefirst time in a social cooperative to optimize the business result. An engineering technique,widely used in ordinary companies, with the aim of determining the optimal arrangementof each production element, has been adjusted to include the social factor, i.e., the needs ofdisabled workers.
Section 2 reviews the literature of papers concerning the layout study in ordinarycompanies. In Section 3, the influencing factors of social cooperatives have been identifiedand matched with the classic ones to develop the revised methodology, then a metric forthe evaluation of the layouts has been provided. Section 4 describes the re-layout. Theresults and conclusion close the paper.

Sustainability 2021, 13, 6850 3 of 25
2. Literature Review
A facility layout is the physical disposition and interconnection of production ac-tivities within a company [11,12]. The term facility refers to elements of the plant, suchas equipment, workstations, and departments. The process which defines the optimalarrangement of these facilities takes the name of “facility layout problem” [9,13]. Investingtime, resources, and money in creating a good layout is cheaper than making a non-optimallayout that needs later adjustments [14].
A layout study is a multi-objective problem that takes into consideration many criteriaduring the optimization of the facility layout [15].
A good layout allows to:
• Minimize material handling;• Ensure flexibility of arrangement;• Provide high turnover of work-in-progress;• Hold down investment in equipment;• Make economical use of floor space;• Promote effective utilization of labor;• Provide safety, comfort, and convenience for labor [14].
2.1. Algorithms for the Layout Study
The plant layout used to be determined with a trial-and-error approach, by arrangingeach department manually at random [16]. A heuristic approach has to be applied tofacilitate the research of a quasi-optimal layout [15]. This approach is an algorithm thatcan find a good solution for the problem but does not guarantee finding an optimalsolution [17]. Often, the optimal layout cannot be found due to the complexity of theproblem and the number of requirements with which to be complied, which, in many cases,are conflicting [15].
A literature review of articles or theses that deal with algorithms for the facility layoutproblem has been performed. The papers are reported in Table 1.
Table 1. Reviewed papers describing algorithms for the facility layout problem.
Title Authors Discussion Elements
[18] Efficient and flexible algorithm for plant layout generation Weng L. CORELAP, ALDEP,CRAFT, BLOCPLAN
[19] An application of the CORELAP algorithm to improve theutilization of the classroom Sembiring A. C., et al. CORELAP
[20] Plant Layout Optimization in the Steel Forging Industry bythe CORELAP Algorithm
Binoy B.George B. K. CORELAP
[21] Evaluation of Existing Layout Improvement and CreationAlgorithms for Use in the Offsite Construction Industry Ritter C., et al. CORELAP, ALDEP,
CRAFT
[22]Redesigning Furniture Production Floors Using Systematic
Layout Planning and the ALDEP Method to MinimizeMaterial Handling Costs
Budianto F., et al. ALDEP
[23] Development of a Suitable Plant Layout using ComputerizedRelative Allocation of Facility Techniques Mallick P., et al. CRAFT
[24]Design and improvement layout of a production floor using
an automated layout design program (ALDEP) andCRAFT algorithm
Suhardini D.Rahmawati S. D. ALDEP, CRAFT
[25] Redesigning a facility layout with quantitative and qualitativemethod in the printing industry Hidayat T. P., et al. CORELAP, CRAFT,
BLOCPLAN

Sustainability 2021, 13, 6850 4 of 25
Table 1. Cont.
Title Authors Discussion Elements
[26] Production facility layout design using theBLOCPLAN algorithm Puspita I. A., et al. BLOCPLAN
[27] A method of industrial plant layout and material flowanalysis in AutoCAD Sly D. P. CORELAP, CRAFT,
BLOCPLAN
[28] Plant Layout Optimization using CRAFT andALDEP Methodology Deshpande V. A. ALDEP, CRAFT
Many algorithms can be used, and they can be classified into three groups:
• Construction algorithms: they generate a layout by taking into consideration therelationship between the departments [29]. Examples are CORELAP and ALDEP [30];
• Improvement algorithms: they require an initial feasible layout [11]. Their aim isthe reduction of internal transport costs by a pair-wise exchange position of depart-ments [29]. An example is CRAFT [30];
• Hybrid algorithms: they can be used like both construction and improvement algo-rithms [26]. An example is BLOCPLAN [30].
The algorithms can be further classified in quantitative and qualitative methods [31],as reported in Table 2.
Table 2. Object, principle, and limits of quantitative and qualitative methods.
Quantitative Methods Qualitative Methods
Object Minimizing material handling cost [27,31] Maximizing closeness of departments [31]
Algorithms CRAFT [25] CORELAP, BLOCPLAN, ALDEP [25]
PrincipleDepartments with high material handling costs
are placed close together, and those with lowcosts tend to be further apart [27]
The user subjectively determines the intensity of therelationship between two departments, analyzing somequalitative factors. The parameters considered are, for
example, noise, heat, dust, flow of materials [31]
LimitsThey take into consideration only parameters
that can be quantified (cannot take into accountnoise, safety, pollutants, or vibration) [24]
Their evaluation is subjective and they do not describe thedependency between the departments appropriately [31]
The problems of manufacturing facilities are becoming more and more complex. Theinformation to be considered is varied and from multiple sources; therefore, the methodto be chosen has to fulfil more objectives, such as flexibility for future modifications,expandability together with optimization of utilization, efficiency, and total costs [15].This complexity is even more amplified in a social cooperative where business and socialobjectives must be combined. The analysis of the papers listed in Table 1 has highlightedthat each algorithm has some limits, as reported in Table 2. The complex problems may besolved by applying a method that combines qualitative and quantitative information, thusuniting the strength of both methods and, at the same time, minimizing their respectivedrawbacks [13]. An algorithm that considers both those factors is the Systematic LayoutPlanning [15]; therefore, it is the one that was chosen for this research.
2.2. Systematic Layout Planning
This is a procedure used to design a facility layout by considering the relationshipbetween workplaces and placing the ones with a high frequency close together [32]. TheSystematic Layout Planning is “an organized way to conduct layout planning. It consistsof a framework of phases, a pattern of procedures, and a set of conventions for identifying,rating, and visualizing the elements and areas involved in planning a layout” [14]. Themethodology, shown in Figure 1, is composed of 10 phases. For an explanation of this

Sustainability 2021, 13, 6850 5 of 25
technique and details about the procedure, readers are suggested to refer to SystematicLayout Planning—4th edition [14].
Sustainability 2021, 13, x FOR PEER REVIEW 5 of 25
Figure 1. Systematic Layout Planning procedure, adapted from [32].
3. Data and Methodology The interaction with the Start Up Innovativa a Vocazione Sociale FARE srl
(http://www.fareinnovazione.com (accessed on 15/6/2021), an intermediary between for-profit manufacturing enterprises and social cooperatives, resulted in an enhanced oppor-tunity to actively involve a social cooperative, so as to enable both a Focus Group and, later, an implementation of the proposed revised approach. Specifically, FARE srl was created with the aim of “transforming the hiring of people with disabilities from a legal obligation into an opportunity for companies, promoting the persons regardless of their disability”, [10] and it focuses on the management and regulations, the persons, and, cru-cial for this research, on the industrialization relating to the growth of skills and the ad-justment of methodologies and processes to the characteristics of the worker [10].
Even though already clear conceptually (as stated in the introduction), a preliminary talk with experts in the layout study and FARE srl made it even clearer that Systematic Layout Planning meets the requirements of the business goal, but it cannot be applied, as it is, to social cooperatives where the social factor is relevant; thus, a revised methodology is required to fit disabled workers contexts. The Systematic Layout Planning adapted to a social cooperative must consider the specific needs of the disabled and, at the same time, continue to pursue cost-effectiveness management. It will allow plant optimization so as to transform a social cooperative into a competitive enterprise in which production pro-cesses, workplaces, and procedures generate profit and meet the needs of the disabled.
3.1. Focus Group The influencing factors of social cooperatives on the layout study must be deter-
mined. These parameters were matched with classic ones to work out how they affected the methodology and how the layout study may have been modified. To this end, a Focus Group was used, i.e., a small group of people gathered to evaluate concepts or identify issues.
The Focus Group adopted for this research was performed in one session of two and a half hours on the platform Microsoft Teams, due to the COVID-19 pandemic regulations
Figure 1. Systematic Layout Planning procedure, adapted from [32].
3. Data and Methodology
The interaction with the Start Up Innovativa a Vocazione Sociale FARE srl (http://www.fareinnovazione.com (accessed on 15 June 2021), an intermediary between for-profitmanufacturing enterprises and social cooperatives, resulted in an enhanced opportunityto actively involve a social cooperative, so as to enable both a Focus Group and, later, animplementation of the proposed revised approach. Specifically, FARE srl was created withthe aim of “transforming the hiring of people with disabilities from a legal obligation into anopportunity for companies, promoting the persons regardless of their disability”, [10] andit focuses on the management and regulations, the persons, and, crucial for this research, onthe industrialization relating to the growth of skills and the adjustment of methodologiesand processes to the characteristics of the worker [10].
Even though already clear conceptually (as stated in the introduction), a preliminarytalk with experts in the layout study and FARE srl made it even clearer that SystematicLayout Planning meets the requirements of the business goal, but it cannot be applied, as itis, to social cooperatives where the social factor is relevant; thus, a revised methodology isrequired to fit disabled workers contexts. The Systematic Layout Planning adapted to asocial cooperative must consider the specific needs of the disabled and, at the same time,continue to pursue cost-effectiveness management. It will allow plant optimization so as totransform a social cooperative into a competitive enterprise in which production processes,workplaces, and procedures generate profit and meet the needs of the disabled.
3.1. Focus Group
The influencing factors of social cooperatives on the layout study must be deter-mined. These parameters were matched with classic ones to work out how they affectedthe methodology and how the layout study may have been modified. To this end, aFocus Group was used, i.e., a small group of people gathered to evaluate concepts oridentify issues.

Sustainability 2021, 13, 6850 6 of 25
The Focus Group adopted for this research was performed in one session of two and ahalf hours on the platform Microsoft Teams, due to the COVID-19 pandemic regulationsthat did not allow personal meetings. The moderator was the paper author. The partici-pants were selected to represent the social cooperatives and the industrial environment.The managing director, operation manager, product manager, microswitch departmentmanager, and electromechanical assembly department manager of L’Iride (five participantsout of 30 workers) acted for the social cooperatives’ environment. For the industrial field,two layout planners were selected: one worked on an industrial plant and dealt with thesafety and health in workplaces, while the second one worked in an academic environmentand had a more theoretical vision of the problem. The issues that emerged are described inthe ensuing lines.
Local companies entrust work orders to social cooperatives, that are subcontractors,to comply with the legal obligation of Law 68/99. This requires the cooperative to managemany and diversified products, making job-shop the only feasible layout to be implemented.This layout, by grouping technologically homogeneous machines in the same place, favorsoperator specialization and flexibility, i.e., the ability to produce different parts by usingthe in-depth knowledge of technology [33]. In a social cooperative with an industrialvocation, the optimization of the plant and of the industrial parameters, such as lead time,throughput, work-in-progress, and the ability to change the production type in a veryshort time by reshaping the workplace to answer the variable demand, must be matched.This last need is very important to make the social cooperative competitive. Thus, theattention must go to flexibility and to standardization of the production processes attainedby workplaces with similar modules and similar procedures, to enable the change fromproduction of item A to production of item B in a short time by reconfiguring the work area.
The quantities required are not constant over the year, because subcontractors arefrequently used for peak demands. This results in unfavorable working conditions for thedisabled that tend to easily forget production practices when not used continuously. Thismeans a misuse of the disabled workforce that must be retrained. The breaking of a job intoelements with different levels of difficulty is essential, because a disabled worker can onlyperform one or few simple tasks that must be standardized and suitable to most productionprocesses. In this way, the disabled worker remembers the production practices, becomesspecialized in a specific operation, and his/her ability is enhanced.
To design a layout to meet the requirements of each worker is not feasible, becauseit would mean redesigning whenever the disabled worker changes. The workplace isadapted to both workers and products, avoiding a layout completely oriented to peopleand inefficient as to the production process, or vice versa.
By implementing all the necessary changes to transform a social cooperative intoa competitive enterprise, the cooperative may require customers to comply with someconditions, such as quantities of raw materials delivered or fixed days for shipping, tosimplify and improve the internal organization and spaces. The storage areas and thestorage organization are critical points for social cooperatives, because as subcontractors,they manage small quantities of highly diversified products. Ideally, stock should be zero,but today, raw materials delivered are usually in a large quantity to satisfy the demandfor months, thus occupying large storage areas. Disability does not allow the workers topick up the required material in such a vast area; it is the department head that picks upraw materials. For this reason, it is always preferable to place stocks near workstations,avoiding a messy central warehouse far from production areas, which would lead tospending a lot of time in retrieving materials.
SLP must not all be renovated, as it would lose the aim to define the optimal arrange-ment of activities. Only some phases must be modified to be adapted to the new context.Having broken the process into elementary operations, we are dealing with single tasks.The need to place some activities close together may arise because they are part of thesame production process or because they can be carried out by the same operator. Eyecontact can be another need which requires activities to be placed close together. It should

Sustainability 2021, 13, 6850 7 of 25
be guaranteed, mainly, where the handicap degree has a relevant impact on the productionprocess, because the worker may interrupt the execution of its task without asking for help.
A common method used by companies to find the equivalent space, when the availableis not sufficient, is working in shifts. With disabled workers, this is not feasible. The solutionto increment production capacity lies once again in the use of flexible workstations thatcan be reconfigured easily and quickly when work orders change.
The Systematic Layout Planning for social cooperatives has been realized for the firsttime; therefore, there is no previous experience in this field. An additional phase can behelpful to verify whether the designed layouts are adequate to the disabled workforce.Then, an evaluation of the alternative layouts must be made, examining both quantitativeand qualitative parameters to consider both social and industrial factors.
3.2. Revised Systematic Layout Planning
Systematic Layout Planning has been modified according to the suggestions thatemerged from the Focus Group. The new procedure (Figure 2) was named “SystematicLayout Planning adapted to Social Cooperatives”.
Sustainability 2021, 13, x FOR PEER REVIEW 7 of 25
be guaranteed, mainly, where the handicap degree has a relevant impact on the produc-tion process, because the worker may interrupt the execution of its task without asking for help.
A common method used by companies to find the equivalent space, when the avail-able is not sufficient, is working in shifts. With disabled workers, this is not feasible. The solution to increment production capacity lies once again in the use of flexible work-stations that can be reconfigured easily and quickly when work orders change.
The Systematic Layout Planning for social cooperatives has been realized for the first time; therefore, there is no previous experience in this field. An additional phase can be helpful to verify whether the designed layouts are adequate to the disabled workforce. Then, an evaluation of the alternative layouts must be made, examining both quantitative and qualitative parameters to consider both social and industrial factors.
3.2. Revised Systematic Layout Planning Systematic Layout Planning has been modified according to the suggestions that
emerged from the Focus Group. The new procedure (Figure 2) was named “Systematic Layout Planning adapted to Social Cooperatives”.
Only the parts differing from the SLP were taken account of. For the remaining parts, it is suggested to refer to Systematic Layout Planning—4th edition [12].
Figure 2. Systematic Layout Planning adapted to Social Cooperatives. Figure 2. Systematic Layout Planning adapted to Social Cooperatives.
Only the parts differing from the SLP were taken account of. For the remaining parts,it is suggested to refer to Systematic Layout Planning—4th edition [12].
The annual production time is the most appropriate datum to be used as the di-mensioning parameter for SLP adapted to Social Cooperatives; since they manage manydifferent products, the number of items as a parameter could be misleading. Their pro-

Sustainability 2021, 13, 6850 8 of 25
duction processes, volumes, shape, and other intrinsic characteristics differ and cannot becompared. Besides, production time outlines the goal of a social cooperative: to maximizethe use of a disabled workforce; the higher the production time, the higher the use of adisabled workforce.
The layout type to be implemented is the job-shop. Cellular layout can be planned fora repetitive and constant demand of little diversified products over the years. Thus, themachining of morph-technological products improves the production planning processesand saturation rate.
3.2.1. Breaking the Process into Elementary Operations
The first phase of “Systematic Layout Planning adapted to Social Cooperatives” con-sists in five steps.
Phase 1: ABC analysisMain products must be identified, which is done through ABC analysis, which is a
technique for prioritizing the management of inventories. It divides inventories into threeclasses, A, B and C, using the total revenues as the segmentation element as for examplein [34,35].
ABC analysis has been modified, by considering production time instead of revenues,as stated earlier:
• Class A: 20% of products that require 80% of total production time;• Class B: 30% of products that require 15% of total production time;• Class C: 50% of products that require less than 5% of total production time.
Class A products require the largest amount of total production time and are the mostimportant job-generating opportunities for the disabled.
Phase 2: Determining elementary operationsOne or more subsequent tasks executed by the same operator in the same workstation
form an elementary operation.The production processes of all the products must be broken into elementary opera-
tions, each characterized by some key elements. They are reported below but may changeaccording to the products worked by the social cooperative:
• Annual production time;• Mean working time;• Product dimension or product volume;• Degree of difficulty of the operation;• Requirement of department head supervision;• Minimum ability of the worker;• Equipment and possible installation requirement;• Other technical information, such as repetitive task, necessity for assembly kit, stan-
dard operation, etc.
Phase 3: Analysis of demand uniformity and workstation saturationThe demand of each elementary operation, considering the annual production time,
must be evaluated to determine whether it is uniform over time. To assess whether thedemand is uniform, the regularity index (IRE, the demand variation coefficient) is used.The regularity index (1) is the ratio between standard deviation and mean value of a samplefrom historical demand data.
IRE =
√∑T
i=1(xi − x)2
(T − 1)x2 (1)
T is the number of periods through which the reference horizon has been discretized,xi is the value of the demand for the i-th period, and x is the mean value of the sample.
The more uniform the demand, the closer the regularity index value is to zero [36]. Ithas been suggested to define a demand as not uniform if IRE > 0.65.

Sustainability 2021, 13, 6850 9 of 25
A workstation is said to be saturated when the production hours performed equal1727 h/year or multiples, i.e., the theoretical annual production hours for the metal-mechanical industry [37].
Phase 4: Determining the elementary area typeThere are three different types of elementary areas:
• Reconfigurable area: a workstation that does not involve installed equipment and canbe reconfigured in a short time, according to demand;
• Not reconfigurable area: a workstation that involves installed equipment to performthe same operation for different products;
• Dedicated manufacturing cell: area where the same products needing the same pro-duction operations are realized, belonging to class A customers. Inside the cell, therecan be both a reconfigurable and a not reconfigurable area.
The most appropriate type of elementary area for each elementary operation is deter-mined through the diagrams in Appendix A (Figures A1–A3).
Phase 5: Determining work areas and their dimensioningElementary operations must be gathered in work areas where products with similar
characteristics can be worked. They are grouped considering the elementary area type andkey parameters, such as equipment type, product volume, supervision requirements, andoperator position (standing or sitting).
A work area helps to deal with the problem of an irregular demand, because pro-duction peaks of one product can be compensated by a lower request for another one.Thus, the workstation can be saturated. Each work area is dimensioned and characterizedby determining production capacity, products volume, products to be worked, operationtypes, equipment to be used, degree of difficulty of the task to be performed, and minimumability required from the disabled. The work area must be properly defined through thesecharacteristics to facilitate the production schedule. This also favors the attribution of themost fit workplace to each operator.
3.2.2. Flow of Materials and Activity Relationships
Before analyzing the flow of materials, warehouses are to be planned. A warehouseshould not be central but dedicated to one or a few work areas, and a distinction betweenthe raw materials and finished products areas is recommended to simplify the managementand monitor stored quantities and waiting times.
Since social cooperatives deal with many products requiring different productionflows and processes, the most adequate method to analyze the flow of materials is theFrom-To Chart.
The procedure of the Activity Relationships remains unaffected, while both supervi-sion by a department head and resource sharing are recommended to be included amongthe reasons describing the closeness degree. Thus, work areas sharing equipment, or anoperator can be placed close together.
3.2.3. Space Requirements
Space requirements can be calculated by following the methods described in theMuther procedure [14]. Some guidelines are provided here for reconfigurable workstations.A reconfigurable production system has an adjustable structure to enable workstationadaptability to a repeated change in production, as a response to the customer’s de-mand [38]. The adjustment is accomplished by changing manufacturing methods, materialflows, and logistic functions over the mid-term [39]. This can be achieved by implementingworkstations that can be reconfigured for the products to be assembled.
The workbench must be ergonomically designed to minimize operator physical strainand enable efficient execution of the tasks. The optimal workbench dimension is deter-mined by referring to operator movement classes:
• Class 1: finger movement with a stationary hand;• Class 2: finger and hand movement with a stationary forearm;
Sustainability 2021, 13, 6850 10 of 25
• Class 3: finger, hand, and forearm movement;• Class 4: finger, hand, and complete arm movement with a nearly stationary up-
per body;• Class 5: whole body movement with no walking.
Movements from class 1 to class 4 are needed to perform a manual assembly task by anoperator sitting at the workbench. When standing, all movement classes are allowed, but ano-stop performance of class 5 should be avoided, because it is tiring for the operator. Theproducts to be assembled should be placed in the central area within class 3. Componentsshould be placed in bins: the most frequently used ones are inside class 3, while the lessfrequently used are inside class 4 [40].
The components of the assembled products have different volumes and need to bestored in bins of different sizes; therefore, larger workbenches are required to provide addi-tional space for bulky components. A workbench for bulky products is not optimized forsmall ones, and vice versa; in this way, reconfigurability and flexibility are not maximized.To avoid excessively large workbenches and favor the replenishment of raw materials, binsare placed on a rack system with wheels.
3.2.4. Space Available
When space available does not fulfil the needs, the equivalent space can only befound by facilitating the reconfigurability and the flexibility of workstations. The faster thechangeover, the less production time is lost [41], avoiding idle time and earning time to beexploited in satisfying products demand, thus increasing production capacity.
3.2.5. Verification
The verification phase is needed to check whether the layouts may be implemented inthe workplace under analysis to comply with the needs of the disabled.
Considerations, constraints, or requirements which could make it difficult or unfeasi-ble to work in the new layout can be neglected. The real applicability of the layouts mustbe verified by experts from the production area of the cooperative. Should any problemarise, an evaluation must be made on whether to discard the layout or go back to any stageof the SLP and make the necessary modifications or adjustments.
3.2.6. Evaluation
The final evaluation is made through the three methods used for the traditional SLP.It is important to consider both quantitative and qualitative parameters together. Thequantitative parameters evaluate the social cooperative as an ordinary company while qual-itative factors help to consider the special needs of social cooperatives employing disabledworkers. Parameters to be included are flexibility, reconfigurability, and standardization.
3.3. Space Saturation3.3.1. Definition and Method
Since the most important parameter for a social cooperative is production hours, asin paragraph 3.2, this has emerged as necessary in the assessment of the value of a layout.A new metric, space saturation, has been defined as the ratio between production hoursand square meters. The maximum value of space saturation is when the space requiredto perform a production task is minimized, obtaining, at the same time, the maximumpossible number of production hours.
To assess space saturation, it is necessary to define:
• Production hours: hours spent at workstations by operators performing their tasks.Setup time, training time, and all other non-productive hours are not included;
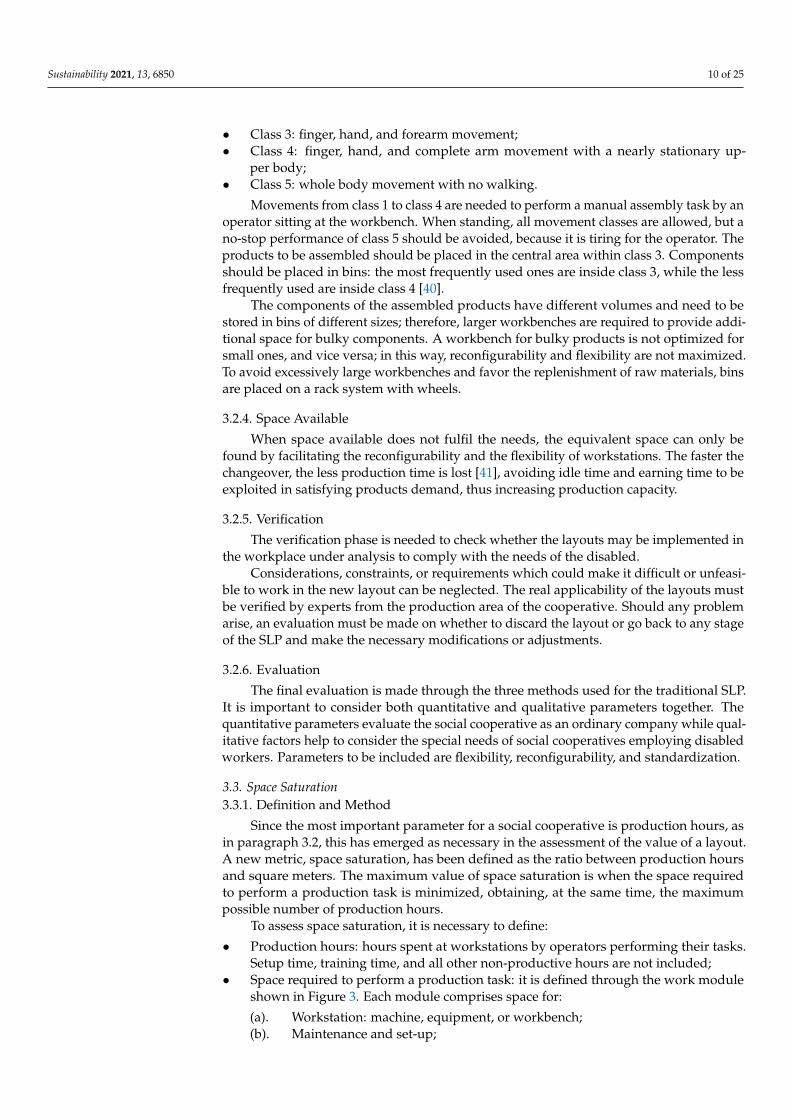
• Space required to perform a production task: it is defined through the work moduleshown in Figure 3. Each module comprises space for:
(a). Workstation: machine, equipment, or workbench;(b). Maintenance and set-up;

Sustainability 2021, 13, 6850 11 of 25
(c). Operator;(d). Aisles: space for movement of personnel and material.
Figure 3. Work module.
The total area of each module (Am) is defined by Equation (2):
Work module area = a + b + c + d (2)
Space saturation can be assessed at three levels:
• Work module space saturation (Sm), considering the work module area and theproduction hours that can be performed. It is calculated by Equation (3):
Work module space saturation =workstations numbers ∗ production hours
Am(3)
• Department space saturation (Sd), considering the whole department. If the workmodules of the department are similar, Sd corresponds to the work module spacesaturation. Otherwise, it is calculated using Equation (4), where m is the number ofwork modules in the department.
Department space saturation =∑m Sm ∗ Am
∑m Am(4)
• Plant space saturation, considering all the n work modules of the plant. It is possibleto consider only the production area (Spp), as in Equation (5), or the overall plant (Sop)with warehouse and circulation aisles, as in Equation (6)
Production plant space saturation =∑n Sn ∗ An
∑n An(5)
Overall plant space saturation =∑n Sn ∗ An
∑n An + non productive area(6)
3.3.2. Optimum Space Saturation
Optimum space saturation can be evaluated as a ratio between theoretical annualproduction hours and the minimum work module area. The space needed for the workmodule is calculated by considering ergonomic guidelines, standards, or catalogues and ismostly influenced by products and equipment size. Two work modules have been defined:one for the assembly department and one for the mechanical machining department.
Standard Work Module for the Assembly Department
A work module in an assembly department has a workbench fit for a single operator.The worker can carry out manual assembly tasks with small bench machines.

Sustainability 2021, 13, 6850 12 of 25
The workbench dimension is determined according to the reachable area withoutinducing physical strain (class 4). By referring to south-eastern Europe’s population [42],its dimensions are 158 × 48 cm.
The area of a work module is strongly influenced not only by the workbench, but alsoby aisles for personnel and material circulations. Their dimension is defined accordingto Legislative Decree 626/94 [43]. A minimum of 100 cm for personnel movement and of120 cm for movement of material, when handled manually, are required. The standardwork module is shown in Figure 4, a. Its area is 4.87 m2; therefore, space saturation is354.62 h/m2.
Sustainability 2021, 13, x FOR PEER REVIEW 12 of 25
3.3.2. Optimum Space Saturation Optimum space saturation can be evaluated as a ratio between theoretical annual
production hours and the minimum work module area. The space needed for the work module is calculated by considering ergonomic guidelines, standards, or catalogues and is mostly influenced by products and equipment size. Two work modules have been de-fined: one for the assembly department and one for the mechanical machining depart-ment.
Standard Work Module for the Assembly Department A work module in an assembly department has a workbench fit for a single operator.
The worker can carry out manual assembly tasks with small bench machines. The workbench dimension is determined according to the reachable area without in-
ducing physical strain (class 4). By referring to south-eastern Europe’s population [42], its dimensions are 158 × 48 cm.
The area of a work module is strongly influenced not only by the workbench, but also by aisles for personnel and material circulations. Their dimension is defined accord-ing to Legislative Decree 626/94 [43]. A minimum of 100 cm for personnel movement and of 120 cm for movement of material, when handled manually, are required. The standard work module is shown in Figure 4, a. Its area is 4.87 m2; therefore, space saturation is 354.62 h/m2.
(a) (b)
Figure 4. Standard work module: (a) Standard work module for assembly operations; (b) Standard work module for mechanical machining operations.
Standard Work Module for the Mechanical Machining Department The standard work module for a mechanical machining department is determined
by the medium dimensions of machining tools. On average, a machining tool is not greater than 2 m in length and 0.8 m in width. These dimensions are reference values for the workstation area. The aisle for personnel and material movement is in front of the machine tool and has a 150 cm width. The maintenance aisle is at the rear and has a 100 cm width. On both sides, a space of 20 cm is needed to avoid contact between machines.
The standard work module for mechanical machining operations (Figure 4b) has an area of 8.88 m2, and the space saturation is 194.48 h/m2.
4. Re-Layout of the Social Cooperative L’Iride The social cooperative L’Iride has been undergoing a re-layout, with the aim to opti-
mize the arrangement of activities to streamline production processes and work order
Figure 4. Standard work module: (a) Standard work module for assembly operations; (b) Standardwork module for mechanical machining operations.
Standard Work Module for the Mechanical Machining Department
The standard work module for a mechanical machining department is determined bythe medium dimensions of machining tools. On average, a machining tool is not greaterthan 2 m in length and 0.8 m in width. These dimensions are reference values for theworkstation area. The aisle for personnel and material movement is in front of the machinetool and has a 150 cm width. The maintenance aisle is at the rear and has a 100 cm width.On both sides, a space of 20 cm is needed to avoid contact between machines.
The standard work module for mechanical machining operations (Figure 4b) has anarea of 8.88 m2, and the space saturation is 194.48 h/m2.
4. Re-Layout of the Social Cooperative L’Iride
The social cooperative L’Iride has been undergoing a re-layout, with the aim tooptimize the arrangement of activities to streamline production processes and work ordermanagement procedures. There is also the need to find free space to be allocated to newcustomers, considering that at the moment, there is no available space.
Currently, the production processes can be divided in three macro-categories: assem-bly, mechanical machining, and aids repairing. The last area is not affected by the re-layout,because it will be analyzed separately. The electromechanical assembly department isfurther divided into four areas: three are reserved for main customers (CST 1, CST 7, andCST 12), while the fourth one is used to produce items for other customers. The actualdisposition of departments, offices, warehouses, and utility are highlighted on the plan inFigure 5.

Sustainability 2021, 13, 6850 13 of 25
Sustainability 2021, 13, x FOR PEER REVIEW 13 of 25
management procedures. There is also the need to find free space to be allocated to new customers, considering that at the moment, there is no available space.
Currently, the production processes can be divided in three macro-categories: assem-bly, mechanical machining, and aids repairing. The last area is not affected by the re-lay-out, because it will be analyzed separately. The electromechanical assembly department is further divided into four areas: three are reserved for main customers (CST 1, CST 7, and CST 12), while the fourth one is used to produce items for other customers. The actual disposition of departments, offices, warehouses, and utility are highlighted on the plan in Figure 5.
Products required by each customer are morph-technologically homogeneous; there-fore, the differentiation element is customers and not the several articles handled by the cooperative, resulting in a simpler analysis.
Figure 5. L’Iride’s initial plan–overall view.
The future demand (Table 3) is predicted by looking at the trend of the existing data about production hours, starting from year 2019 and through the managers’ in-depth knowledge about the demand trend of the previous years, for which there were no data.
Table 3. 2019′s, 2020′s, and expected production time.
Production Time [h/year] Customer 2019 2020 Expected
CST 1 1467.37 1464.00 1640.00 CST 2 0.00 370.02 1700.00 CST 3 0.00 63.44 1600.00 CST 4 323.30 258.73 210.00 CST 5 1069.17 972.00 920.00 CST 6 441.53 257.24 340.00 CST 7 658.05 2526.47 2500.00 CST 8 39.23 28.76 - CST 9 341.92 0.00 -
Figure 5. L’Iride’s initial plan–overall view.
Products required by each customer are morph-technologically homogeneous; there-fore, the differentiation element is customers and not the several articles handled by thecooperative, resulting in a simpler analysis.
The future demand (Table 3) is predicted by looking at the trend of the existing dataabout production hours, starting from year 2019 and through the managers’ in-depthknowledge about the demand trend of the previous years, for which there were no data.
Table 3. 2019’s, 2020’s, and expected production time.
Production Time [h/year]
Customer 2019 2020 Expected
CST 1 1467.37 1464.00 1640.00CST 2 0.00 370.02 1700.00CST 3 0.00 63.44 1600.00CST 4 323.30 258.73 210.00CST 5 1069.17 972.00 920.00CST 6 441.53 257.24 340.00CST 7 658.05 2526.47 2500.00CST 8 39.23 28.76 -CST 9 341.92 0.00 -CST 10 0.00 0.00 -CST 11 220.30 306.29 263.29CST 12 1613.77 1104.93 660.00CST 13 12,600.00 12,600.00 12,600.00CST 14 1500.00 1500.00 3475.00
The main customers were identified with ABC analysis (Figure 6). Each process wasthen divided into elementary operations, determining the identification letter, operationtype, annual production time, need for a workbench, equipment for the task and necessityfor installation, difficulty degree of the operation, product dimension, and requirementabout supervisions. Details are reported in Appendix B, Table A1.

Sustainability 2021, 13, 6850 14 of 25
Sustainability 2021, 13, x FOR PEER REVIEW 14 of 25
CST 10 0.00 0.00 - CST 11 220.30 306.29 263.29 CST 12 1613.77 1104.93 660.00 CST 13 12,600.00 12,600.00 12,600.00 CST 14 1500.00 1500.00 3475.00
The main customers were identified with ABC analysis (Figure 6). Each process was then divided into elementary operations, determining the identification letter, operation type, annual production time, need for a workbench, equipment for the task and necessity for installation, difficulty degree of the operation, product dimension, and requirement about supervisions. Details are reported in Appendix B, Table B1.
Figure 6. Pareto chart.
The regulatory index was calculated per each customer (1) for the years 2019 and 2020. The IRE for the expected situation was set to the mean value of the previous years; L’Iride managers’ opinions were taken into consideration for customers whose demand was growing or decreasing when data were insufficient or when the demand was affected by more than one elementary operation. Subsequently, the saturation of the workstation was verified. Data of IRE and workstation saturation are reported in Table 4.
Table 4. IRE calculated for the years 2019 and 2020, and the expected situation; in the last column assessment of work-station saturation.
IRE Customer Operation 2019 2020 Expected Workstation Saturation
CST 1 A
0.61 0.55 0.58 1 workstation
B 1.10 No
CST 2 C
- 0.39 0.90 No
D 0.40 1 workstation CST 3 E - - 0.65 1 workstation CST 4 F 0.97 1.48 1.23 No
CST 5 G
0.38 0.63 0.50 No
H 1.50 No CST 6 I 0.80 1.05 0.93 No
A
AA
A B BB C C C C
0
10
20
30
40
50
60
70
80
90
100
0
10
20
30
40
50
60
CST
13
CST
14
CST
7
CST
2
CST
1
CST
3
CST
5
CST
12
CST
6
CST
11
CST
4
Cum
ulat
ive
prod
uctio
n tim
e [%
]
Prod
uctio
n tim
e [%
]
Pareto chart
Production time Cumulative production time
Figure 6. Pareto chart.
The regulatory index was calculated per each customer (1) for the years 2019 and2020. The IRE for the expected situation was set to the mean value of the previous years;L’Iride managers’ opinions were taken into consideration for customers whose demandwas growing or decreasing when data were insufficient or when the demand was affectedby more than one elementary operation. Subsequently, the saturation of the workstationwas verified. Data of IRE and workstation saturation are reported in Table 4.
Table 4. IRE calculated for the years 2019 and 2020, and the expected situation; in the last column assessment of worksta-tion saturation.
IRE
Customer Operation 2019 2020 Expected Workstation Saturation
CST 1A
0.61 0.550.58 1 workstation
B 1.10 No
CST 2C - 0.39
0.90 NoD 0.40 1 workstation
CST 3 E - - 0.65 1 workstation
CST 4 F 0.97 1.48 1.23 No
CST 5G
0.38 0.630.50 No
H 1.50 No
CST 6 I 0.80 1.05 0.93 No
CST 7 J 0.72 0.75 0.73 1 workstation + 773 h
CST 11 K 1.03 1.64 1.34 No
CST 12 L 0.90 0.67 0.79 No
CST 13M - - 0.60 3 workstations + 419 hN - - 0.60 No
CST 14
O 1 1 0.65 1 workstationP 1 1 0.65 NoQ 1 1 0.65 NoR 1 1 0.65 No

Sustainability 2021, 13, 6850 15 of 25
With these data, an elementary area type for each elementary operation was deter-mined using the diagrams in Appendix A (Figures A1–A3). Elementary operations weregrouped into work areas (Table 5), according to elementary area and equipment type,product volume, and supervision.
Table 5. Grouping elementary operations into work area.
Work AreaName Operation Equipment Product
VolumeProduction
Hour RequestRequired
WorkstationsReserved
Workstations
AvailableProduction
Hours
Reconfigurablearea
Assemblyworkbench 1
F - Medium large 1066.50 0.62 1 1727
LSpecial-purposetooling
Assemblyworkbench 2
A Screwdriver,templet
Medium 4685.90 2.71 3 5181I Screwdriver,
templetJ Screwdriver
Assemblyworkbench 3
G ScrewdriverSmall 1311.46 0.76 1 1727
K Crimpingtools
Dedicated cell
Dedicatedcell 1 D Screwdriver,
templet Small 1606.50 0.93 1 1727
Dedicatedcell 2 E Screwdriver Medium 1840.00 1.07 2 3454
Dedicatedcell 3 M1, M2 - Small 5880.00 3.40 4 6908
Not-reconfigurablearea
10 machines N 10 machines Small 7350.00 4.26 10 17,270
Testingmachine H Testing
machine Small 115.00 0.07 1 1727
Pillar drill 1 C Pillar drill 1 Small 178.50 0.10 1 1727
Pillar drill 2 B Pillar drill 2 Medium 86.10 0.05 1 1727
Lathe O Lathe Medium 1998.13 1.16 2 3454
Millingmachine P Milling
machine Medium 799.25 0.46 1 1727
Sawingmachine Q Sawing
machine Medium 799.25 0.46 3 5181
Surfacegrinder R Surface
grinder Medium 399.63 0.23 1 1727
From this stage, the application of SLP proceeded without noteworthy differencesfrom the traditional methodology. In addition to work areas, warehouses were plannedand designed for work areas groups. The Flow of Materials phase determined functionalareas with in-between flows. The From-To Chart was filled with the intensity of flows,considering differences in size, weight, and the risk factor of the items being moved. TheActivity Relationships analysis considered other-than-flow requirements. The relationshipsbetween activities were divided into classes, identified by vowel-letters (A, E, I, O, U, andX), to simplify the reading of data. Flow and other-than-flow requirements were combined,and the result was the input data to design the Relationship Diagram. The space neededfor each activity was determined by referring to the considerations explained in chapter0. The area of not reconfigurable modules was the sum of space needed by equipment,plus additional space for maintenance, while the reconfigurable modules consisted of aworkbench and a rack system. In both cases, space was reserved for the operator andaisles. Space reserved for the warehouse was determined, too. L’Iride, besides doingthe re-layout, has been trying to reduce the amount of stocked material. For this reason,two layouts for each alternative were designed. The transitional layout was to store allthe materials already present in the cooperative; these would be progressively reducedto reach the definitive layout, with small changes in the arrangement of the activities.Needed space did not exceed the existing area; thus, the Space Relationship Diagramwas drawn with squares or rectangles of dimensions proportional to the area required

Sustainability 2021, 13, 6850 16 of 25
by each activity. Handling methods were set in the Modifying Consideration phase, andsubsequent practical limitations were highlighted. The constraints were the aisle-widthand not-to-be changed location of some activities, such as the office, entrances, aids repairdepartments, and utilities.
Five alternative layouts were developed; two of them were rejected in the verificationphase, because the implementation was too binding and either caused the stoppage ofproduction for too long, or storage capacity was insufficient. It has been requested todesign an additional layout by modifying one of the alternatives. The layouts that passedthe verification phase were evaluated with quantitative and qualitative factors, togetherwith advantages and disadvantages, and the best was selected.
5. Results
The transitional layout for the assembly department is shown in Figure 7 and thedefinitive selected layout in Figure 8. In the plan of the selected layout, the square andrectangle for each activity correspond to the functional area, i.e., workstation and operatorspace. Each is colored and has an identification number according to Figure 9.
Sustainability 2021, 13, x FOR PEER REVIEW 16 of 25
by equipment, plus additional space for maintenance, while the reconfigurable modules consisted of a workbench and a rack system. In both cases, space was reserved for the operator and aisles. Space reserved for the warehouse was determined, too. L’Iride, be-sides doing the re-layout, has been trying to reduce the amount of stocked material. For this reason, two layouts for each alternative were designed. The transitional layout was to store all the materials already present in the cooperative; these would be progressively reduced to reach the definitive layout, with small changes in the arrangement of the ac-tivities. Needed space did not exceed the existing area; thus, the Space Relationship Dia-gram was drawn with squares or rectangles of dimensions proportional to the area re-quired by each activity. Handling methods were set in the Modifying Consideration phase, and subsequent practical limitations were highlighted. The constraints were the aisle-width and not-to-be changed location of some activities, such as the office, entrances, aids repair departments, and utilities.
Five alternative layouts were developed; two of them were rejected in the verification phase, because the implementation was too binding and either caused the stoppage of production for too long, or storage capacity was insufficient. It has been requested to de-sign an additional layout by modifying one of the alternatives. The layouts that passed the verification phase were evaluated with quantitative and qualitative factors, together with advantages and disadvantages, and the best was selected.
5. Results The transitional layout for the assembly department is shown in Figure 7 and the
definitive selected layout in Figure 8. In the plan of the selected layout, the square and rectangle for each activity correspond to the functional area, i.e., workstation and operator space. Each is colored and has an identification number according to Figure 9.
Figure 7. Transitional layout of assembly department (that is, a portion of the overall layout). Figure 7. Transitional layout of assembly department (that is, a portion of the overall layout).

Sustainability 2021, 13, 6850 17 of 25Sustainability 2021, 13, x FOR PEER REVIEW 17 of 25
Figure 8. Definitive layout. Figure 8. Definitive layout.
5.1. Space Saturation Assessment
At L’Iride, production hours are allocated to customers, not to workstations, makingthe assessment of work module space saturation impossible.
To assess space saturation, daily production was monitored to determine productionhours, corresponding to the time spent by an operator to carry out assigned tasks.
The expected department and production plant space saturation of the definitivelayout was assessed, and the data are reported in Table 6, together with the values of theyears 2019 and 2020.
Table 6. Department and production plant space saturation.
2019 2020 Expected
electromechanical assembly 47.20 56.19 170.66
microswitch assembly 110.69 110.69 366.89
assembly 70.68 76.35 241.51
mechanical machining 11.25 11.25 46.57
production plant 47.44 50.89 151.42

Sustainability 2021, 13, 6850 18 of 25Sustainability 2021, 13, x FOR PEER REVIEW 18 of 25
Figure 9. Legend of layout plans.
5.1. Space Saturation Assessment At L’Iride, production hours are allocated to customers, not to workstations, making
the assessment of work module space saturation impossible. To assess space saturation, daily production was monitored to determine production
hours, corresponding to the time spent by an operator to carry out assigned tasks. The expected department and production plant space saturation of the definitive lay-
out was assessed, and the data are reported in Table 6, together with the values of the years 2019 and 2020.
Table 6. Department and production plant space saturation.
2019 2020 Expected electromechanical assembly 47.20 56.19 170.66
microswitch assembly 110.69 110.69 366.89 assembly 70.68 76.35 241.51
mechanical machining 11.25 11.25 46.57 production plant 47.44 50.89 151.42
5.2. Conclusions The application of Systematic Layout Planning, adapted to social cooperatives, has
greatly improved the present situation at L’Iride. The re-layout of the social cooperative was done mainly to allocate the new custom-
ers’ activities and to find the space needed for the introduction of a new department. Both goals were achieved with the new implemented layout, by arranging workstations, which left 82.11 m2 available area.
Newly arranged activities helped to streamline material flows, and, together with the new warehouse, the replenishment of workstations was simplified. Idle time due to ab-sence of orders has been avoided through the removal of many small, dedicated areas.
Figure 9. Legend of layout plans.
5.2. Conclusions
The application of Systematic Layout Planning, adapted to social cooperatives, hasgreatly improved the present situation at L’Iride.
The re-layout of the social cooperative was done mainly to allocate the new customers’activities and to find the space needed for the introduction of a new department. Bothgoals were achieved with the new implemented layout, by arranging workstations, whichleft 82.11 m2 available area.
Newly arranged activities helped to streamline material flows, and, together withthe new warehouse, the replenishment of workstations was simplified. Idle time due toabsence of orders has been avoided through the removal of many small, dedicated areas.
To assess the improvement achieved with the new layout, the present space saturationwas compared with the expected values to check the amount of the improvement. Thedata reported in Table 6 for space saturation were compared for the assembly departmentin Figure 10 and for the mechanical machining department in Figure 11. The values ofthe assembly operation departments showed a great improvement as compared to theyears 2019 and 2020. The increment of space saturation of the assembly departmentwas 241.7%, compared to the year 2019, and 216.3%, compared to the year 2020. Themicroswitch assembly exceeded the optimum value, because workbenches were smallerthan standard, but this was a particular situation, and the improvement was of 231.4% forboth years. However, the electromechanical assembly, which requires standard dimensionworkbenches, achieved a good improvement. The division of the assembly departmentinto dedicated areas reduced space saturation. Removing the dedicated areas and workingon products of different customers in the same area, made reaching workstation saturationeasier. The lack of demand from a customer could be compensated by the demand ofanother, thus reducing idle time. With the changes, the improvement obtained in this

Sustainability 2021, 13, 6850 19 of 25
department was of 261.6%, compared to the year 2019, and of 203.7%, compared to theyear 2020.
Sustainability 2021, 13, x FOR PEER REVIEW 19 of 25
To assess the improvement achieved with the new layout, the present space satura-tion was compared with the expected values to check the amount of the improvement. The data reported in Table 6 for space saturation were compared for the assembly depart-ment in Figure 10 and for the mechanical machining department in Figure 11. The values of the assembly operation departments showed a great improvement as compared to the years 2019 and 2020. The increment of space saturation of the assembly department was 241.7%, compared to the year 2019, and 216.3%, compared to the year 2020. The micro-switch assembly exceeded the optimum value, because workbenches were smaller than standard, but this was a particular situation, and the improvement was of 231.4% for both years. However, the electromechanical assembly, which requires standard dimension workbenches, achieved a good improvement. The division of the assembly department into dedicated areas reduced space saturation. Removing the dedicated areas and work-ing on products of different customers in the same area, made reaching workstation satu-ration easier. The lack of demand from a customer could be compensated by the demand of another, thus reducing idle time. With the changes, the improvement obtained in this department was of 261.6%, compared to the year 2019, and of 203.7%, compared to the year 2020.
The mechanical machining department reached an improvement of 314% in space saturation. The gap between the optimum and the expected value was very large, because some resources were duplicated (sawing machines and lathe) and not fully exploited. Some equipment in the assembly department, such as the testing machine and pillar drill, were also undersaturated, as in Figure 12. A more specific demand for an operation or more customers requiring the use of the same equipment could partially overcome the problem, facilitating the saturation of the machines. Anyhow, it was difficult to accom-plish because social cooperatives are subcontractors.
Figure 10. Department space saturation obtained for assembly.
050
100150200250300350400
2019 2020 Selected layout
h/m
2
Department space saturation (assembly)
Electromechanical assembly Microswitch assembly
Assembly Optimum
Figure 10. Department space saturation obtained for assembly.
Sustainability 2021, 13, x FOR PEER REVIEW 20 of 25
Figure 11. Department space saturation obtained for mechanical machining.
Figure 12. Work module space saturation obtained.
Looking at the overall production area, the improvement obtained was 219.2% and 197.5%, considering the years 2019 and 2020, respectively.
The increase in space saturation obtained in all the departments showed that L’Iride could be optimized, and the new methodology was effective.
Space saturation was the only method that could be used to assess the improvements, because at L’Iride, the standard industrial parameters used to monitor the production process have never been measured. Values in space saturation should be monitored over the next few years to validate the estimated improvement.
Since the methodology has been applied for the first time to L’Iride, there is no bench-mark. Applying this evaluation system to other social cooperatives, and to enterprises,
0255075
100125150175200225
2019 2020 Selected layout
h/m
2
Department space saturation (mechanical machining)
Mechanical machining Optimum
0
50
100
150
200
250
300
350
400
450
500
Ass
embl
y…
Ass
embl
y…
Ass
embl
y…
Ded
icat
ed c
ell 1
Ded
icat
ed c
ell 2
Test
ing
mac
hine
Ded
icat
ed c
ell 3
10 m
achi
nes
Lath
e
Mill
ing
mac
hine
Saw
ing
mac
hine
Pilla
r dri
ll 1
Pilla
r dri
ll 2
Surf
ace
grin
der
h/m
2
Work module space saturation
Obtained
Optimum
Figure 11. Department space saturation obtained for mechanical machining.
The mechanical machining department reached an improvement of 314% in spacesaturation. The gap between the optimum and the expected value was very large, becausesome resources were duplicated (sawing machines and lathe) and not fully exploited. Someequipment in the assembly department, such as the testing machine and pillar drill, werealso undersaturated, as in Figure 12. A more specific demand for an operation or morecustomers requiring the use of the same equipment could partially overcome the problem,facilitating the saturation of the machines. Anyhow, it was difficult to accomplish becausesocial cooperatives are subcontractors.

Sustainability 2021, 13, 6850 20 of 25
Sustainability 2021, 13, x FOR PEER REVIEW 20 of 25
Figure 11. Department space saturation obtained for mechanical machining.
Figure 12. Work module space saturation obtained.
Looking at the overall production area, the improvement obtained was 219.2% and 197.5%, considering the years 2019 and 2020, respectively.
The increase in space saturation obtained in all the departments showed that L’Iride could be optimized, and the new methodology was effective.
Space saturation was the only method that could be used to assess the improvements, because at L’Iride, the standard industrial parameters used to monitor the production process have never been measured. Values in space saturation should be monitored over the next few years to validate the estimated improvement.
Since the methodology has been applied for the first time to L’Iride, there is no bench-mark. Applying this evaluation system to other social cooperatives, and to enterprises,
0255075
100125150175200225
2019 2020 Selected layout
h/m
2
Department space saturation (mechanical machining)
Mechanical machining Optimum
0
50
100
150
200
250
300
350
400
450
500
Ass
embl
y…
Ass
embl
y…
Ass
embl
y…
Ded
icat
ed c
ell 1
Ded
icat
ed c
ell 2
Test
ing
mac
hine
Ded
icat
ed c
ell 3
10 m
achi
nes
Lath
e
Mill
ing
mac
hine
Saw
ing
mac
hine
Pilla
r dri
ll 1
Pilla
r dri
ll 2
Surf
ace
grin
der
h/m
2
Work module space saturation
Obtained
Optimum
Figure 12. Work module space saturation obtained.
Looking at the overall production area, the improvement obtained was 219.2% and197.5%, considering the years 2019 and 2020, respectively.
The increase in space saturation obtained in all the departments showed that L’Iridecould be optimized, and the new methodology was effective.
Space saturation was the only method that could be used to assess the improvements,because at L’Iride, the standard industrial parameters used to monitor the productionprocess have never been measured. Values in space saturation should be monitored overthe next few years to validate the estimated improvement.
Since the methodology has been applied for the first time to L’Iride, there is no bench-mark. Applying this evaluation system to other social cooperatives, and to enterprises, willallow for the assessment of the accuracy of the defined optimum space saturation and tovalue both the efficiency at L’Iride and the possibility of further improvements.
The Systematic Layout Planning, adapted to social cooperatives, will eventually beapplied to other enterprises employing a disabled workforce. This will make it possibleto evaluate whether the methodology is complete or requires further adjustments. Thegoal of the new SLP is to transform a social cooperative into a competitive enterprise.Spreading the methodology by applying it to other cooperatives could enhance this trans-formation process.
This work was only part of a larger project of FARE srl, aimed at favoring job op-portunities for disabled workers and their inclusion into the labor market. What wasinvestigated was only the internal improvement of the cooperative, which, however, is thefirst step to reach that goal.
Author Contributions: All authors were involved in choosing the research methodology, in dataanalysis, as well as in the results analysis and discussion. A.R. and G.J.L.M. were involved in writing—review and editing. All authors have read and agreed to the published version of the manuscript.
Funding: This research received no external funding.
Acknowledgments: The authors wish to thank all the people involved in the study.
Conflicts of Interest: The authors declare no conflict of interest.

Sustainability 2021, 13, 6850 21 of 25
Appendix A
Sustainability 2021, 13, x FOR PEER REVIEW 21 of 25
will allow for the assessment of the accuracy of the defined optimum space saturation and to value both the efficiency at L’Iride and the possibility of further improvements.
The Systematic Layout Planning, adapted to social cooperatives, will eventually be applied to other enterprises employing a disabled workforce. This will make it possible to evaluate whether the methodology is complete or requires further adjustments. The goal of the new SLP is to transform a social cooperative into a competitive enterprise. Spread-ing the methodology by applying it to other cooperatives could enhance this transfor-mation process.
This work was only part of a larger project of FARE srl, aimed at favoring job oppor-tunities for disabled workers and their inclusion into the labor market. What was investi-gated was only the internal improvement of the cooperative, which, however, is the first step to reach that goal.
Author Contributions: All authors were involved in choosing the research methodology, in data analysis, as well as in the results analysis and discussion. A.R. and G.J.L.M. were involved in writ-ing—review and editing. All authors have read and agreed to the published version of the manu-script.
Funding: This research received no external funding.
Acknowledgments: The authors wish to thank all the people involved in the study.
Conflicts of Interest: The authors declare no conflicts of interest.
Appendix A
Figure A1. Graph to determine the elementary area type—part 1. Figure A1. Graph to determine the elementary area type—part 1.
Sustainability 2021, 13, x FOR PEER REVIEW 22 of 25
Figure A2. Graph to determine the elementary area type—part 2.
Figure A3. Graph to determine the elementary area type—part 3.
Figure A2. Graph to determine the elementary area type—part 2.

Sustainability 2021, 13, 6850 22 of 25
Sustainability 2021, 13, x FOR PEER REVIEW 22 of 25
Figure A2. Graph to determine the elementary area type—part 2.
Figure A3. Graph to determine the elementary area type—part 3.
Figure A3. Graph to determine the elementary area type—part 3.

Sustainability 2021, 13, 6850 23 of 25
Appendix B
Table A1. Elementary operations.
Customer IdentificationLetter Operation Type Annual Production
Hours Workbench Equipment Installation DifficultyDegree
ProductDimensions Supervisions *
CST 1 A Assembly 15,558.00 YesScrewdriver No
Medium Medium 1Template NoB Drilling 82.00 No Pillar drill 2 Yes Medium Medium 1
CST 2C Drilling 170.00 No Pillar drill 1 Yes Medium Small 1
D Assembly 1530.00 YesScrewdriver No
Medium Small 1Template No
CST 3 E Assembly 1600.00 Yes Screwdriver No Medium Medium 1
CST 4 F Assembly 210.00 Yes - No Medium Medium 1
CST 5G Assembly 828.00 Yes Screwdriver No Medium Small 1H Testing 92.00 No Testing machine Yes Medium Small 1
CST 6 I Assembly 340.00 YesScrewdriver No
Medium Medium 1Template No
CST 7 J Assembly 2500.00 Yes Screwdriver No Medium Medium 1
CST 11 K Assembly 263.29 Yes Crimping tools No Medium Small 1
CST 12 L Assembly 660.00 Yes Special-purposetooling No Medium Medium /large 1
CST 13M Assembly 5600.00 Yes - No Low Small 2
N Variousmachining
7000.00(700 per workstation) No 10 machines Yes Low Small 2
CST 14
O Turning 1737.50 No 2 lathes Yes High Medium 3P Milling 695.00 No Milling machine Yes High Medium 3
Q Saw 695.00 No 3 sawingmachines Yes High Medium 3
R Lapping 347.50 No Surface grinder Yes High Medium 3
* 1 stand for electromechanical assembly, 2 for microswitch assembly and 3 for mechanical machining department head.

Sustainability 2021, 13, 6850 24 of 25
References1. Mark, B.G.; Hofmayer, S.; Rauch, E.; Matt, D.T. Inclusion of workers with disabilities in production 4.0: Legal foundations in
Europe and potentials through worker assistance systems. Sustainability 2019, 11, 5978. [CrossRef]2. Birau, F.R.; Dănăcică, D.E.; Spulbar, C.M. Social exclusion and labor market integration of people with disabilities. A case study
for Romania. Sustainability 2019, 11, 5014. [CrossRef]3. Coluccia, M. Le Cooperative Sociali di tio B: Dalla Nasciata Alle Criticità Attuali; Università di Pisa: Pisa, Italy, 2017.4. Sataloff, R.T.; Johns, M.M.; Kost, K.M. Legge 8 Novembre 1991, n. 381 “Disciplina delle Cooperative Sociali”. Available online:
http://adapt.it/adapt-indice-a-z/wp-content/uploads/2018/02/8.pdf (accessed on 15 June 2021).5. Amartya, K.S.; Scalvini, F.; Caroleo, F.E.; Garofalo, M.R.; Davister, C.; Defourny, J.; Gregoire, O.; Loss, M.; Lemaitre, A.;
Nyssens, M.; et al. Impresa Sociale; ISSAN Edizioni: Trento, Italy, 2006.6. Zappella, E. Formazione & Insegnamento. Riv. Internazionale Di Sci. Dell’educazione E Della Form. 2014, 167–176.7. Legge 12 Marzo 1999, n. 68 “Norme per il Diritto al Lavoro dei Disabili”. Available online: https://www.un.org/development/
desa/disabilities/wp-content/uploads/sites/15/2019/11/Italy_Norms-for-the-right-to-work-of-the-disabled.pdf (accessed on15 June 2021).
8. Garcia-Sabater, J.P.J.J.; Maheut, J.; Ruiz, A.; Garcia-Sabater, J.P.J.J. A framework for capacity and operations planning in servicesorganizations employing workers with intellectual disabilities. Sustainability 2020, 12, 9713. [CrossRef]
9. Hosseini-Nasab, H.; Fereidouni, S.; Fatemi Ghomi, S.M.T.; Fakhrzad, M.B. Classification of facility layout problems: A reviewstudy. Int. J. Adv. Manuf. Technol. 2018, 94, 957–977. [CrossRef]
10. FARE srl Strategy FARE srl. Available online: http://www.fareinnovazione.com (accessed on 15 June 2021).11. Pareschi, A. Impianti Industriali; Esculapio: Bologna, Italy, 2007.12. Moran, S. Process Plant Layout; Butterworth-Heineman: Oxford, UK, 2012.13. Nåfors, D. On Brownfield Factory Layout Planning; Chalmers University of Technology: Gothenburg, Sweden, 2019.14. Muther, R.; Hales, L. Systematic Layout Planning; Management & Industrial Research Publications: Marietta, GA, USA, 2015.15. Malakooti, B. Operations and Production Systems with Multiple Objectives; Wiley: New York, NY, USA, 2014.16. Urban, T.L. Combining qualitative and quantitative analyses in facility layout. Prod. Invent. Manag. J. 1989, 30, 73–77.17. Università di Pisa. Algoritmi Euristici. In Appunti di Ricerca Operativa; 2015; pp. 207–265. Available online: http://www.ing.
unisannio.it/boccia/files/ricerca_operativa.pdf (accessed on 15 June 2021).18. Weng, L. Efficient and Flexible Algorithm for Plant Layout Generation; West Virginia University: Morgantown, WV, USA, 1999.19. Sembiring, A.C.; Budiman, I.; Mardhatillah, A.; Tarigan, U.P.; Jawira, A. An application of corelap algoritm to improve the
utilization space of the classroom. J. Phys. Conf. Ser. 2018, 1007. [CrossRef]20. Bibin, B.; Boby, K.G. Plant Layout Optimization in Steel Forging Industry by CORELAP Algorithm. Indian J. Sci. Technol. 2018, 11,
1–8. [CrossRef]21. Ritter, C.; Barkokebas, B.; Al-Hussein, M. Evaluation of Existing Layout Improvement and Creation Algorithms for Use in the
Offsite Construction Industry. In Proceedings of the Modular and Offsite Construction (MOC) Summit Proceedings, Hollywood,FL, USA, 22–25 March 2018; pp. 93–100. [CrossRef]
22. Budianto, F.; Halim, J.; Christine Sembiring, A. Redesigning Furniture Production Floors Using Systematic Layout Planningand ALDEP Method to Minimize Material Handling Costs. In Proceedings of the MECnIT 2020—International Conference onMechanical, Electronics, Computer, and Industrial Technology, Medan, Indonesia, 25–26 June 2020; pp. 84–90. [CrossRef]
23. Mallick, P.; Muduli, K.; Biswal, J.N.; Pumwa, J.; Oyekola, P. Development of a suitable plant layout using computerised relativeallocation of facility techniques. Int. J. Recent Technol. Eng. 2019, 8, 4956–4961. [CrossRef]
24. Suhardini, D.; Rahmawati, S.D. Design and improvement layout of a production floor using automated layout design program(ALDEP) and CRAFT algorithm at CV. Aji Jaya Mandiri. IOP Conf. Ser. Mater. Sci. Eng. 2019, 528. [CrossRef]
25. Hidayat, T.P.; Sugioko, A.; Widiastuti, G.R. Redesign facility layout with quantitative and qualitative method on printing industry.J. Ilm. Widya Tek. 2016, 15, 62–66.
26. Puspita, I.A.; Iqbal, M.; Pratami, D.; Pratomo, A. Production facility layout design using blocplan algorithm. Adv. Sci. Lett. 2017,23, 3917–3920. [CrossRef]
27. Sly, D.P. A Method of Industrial Plant Layout and Material Flow Analysis in AutoCAD; Iowa State University: Ames, IA, USA, 1990.28. Deshpande, V.A.; Patil, N.D.; Baviskar, V.; Gandhi, J. Plant Layout Optimization using CRAFT and ALDEP Methodology. Product.
J. Natl. Product. Counc. 2016, 57, 32–42.29. Mulugeta, A.; Beshah, B.; Kitaw, D. Computerized facilities layout design. J. EEA 2013, 30, 28–32.30. Hamamoto, S.; Yih, Y.; Salvendy, G. Development and validation of genetic algorithm-based facility layout a case study in the
pharmaceutical industry. Int. J. Prod. Res. 1999, 37, 749–768. [CrossRef]31. Sahoo, N.; Shekhar, T.; Sahu, S. An Approach to multi objective Facility Layout Planning. Ind. Eng. J. 2002, 31, 20–25.32. Suhardini, D.; Septiani, W.; Fauziah, S. Design and Simulation Plant Layout Using Systematic Layout Planning. IOP Conf. Ser.
Mater. Sci. Eng. 2017, 277. [CrossRef]33. Garetti, M. Design of Production Systems; Franco Angeli: Milano, Italy, 2015; ISBN 978-88-917-1030-7.34. Ravinder, H.; Misra, R.B. ABC analysis for inventory management: Bridging the gap between research and classroom. Am. J. Bus.
Educ. Third Quart. 2014, 7, 257–264. [CrossRef]

Sustainability 2021, 13, 6850 25 of 25
35. Millstein, M.A.; Yang, L.; Li, H. Optimizing ABC inventory grouping decisions. Int. J. Prod. Econ. 2014, 148, 71–80. [CrossRef]36. Sianesi, A. La Gestione del Sistema di Produzione; ETAS: Milano, Italy, 2016; ISBN 978-88-17-06806-2.37. Confsal; Cifa Contratto Collettivo Nazionale di Lavoro—Per i Dipendenti Delle Piccole e Medie Imprese Metalmeccaniche e di
Installazione Impianti. 2020. Available online: https://www.cifaitalia.it/images/239/2020/CCNL_METALMECCANICA_PMI_CIFA-CONFSAL_TESTO.pdf (accessed on 15 June 2021).
38. Vladimír, R.; Andrea, L.; Norbert, S. Reconfiguring of Manual Workstations Designated for Customized Production. Am. J. Mech.Eng. 2015, 3, 257–260. [CrossRef]
39. Wiendahl, H.P.; Reichardt, J.; Nyhuis, P. Handbook Factory Planning and Design; Springer: Berlin, Germany, 2015; ISBN 9783662463918.[CrossRef]
40. Lien, T.K. Manual assembly. CIRP Encycl. Prod. Eng. 2018. [CrossRef]41. Lešková, A. Principles of lean production to designing manual assembly workstations. Int. J. Eng. 2013, 11, 31–36.42. Engineering, D.D.I. Design in Ergonomics Guidelines; 2017; pp. 24–27. Available online: https://www.delphisuppliers.com/
vendor_documents/delphi-h/BlueBook/07%20Environmentatl-Health-Safety-Ergonomics-Industrial%20Hygiene/7B%20Ergonomics/Design%20in%20Ergonomics%20Guideline.pdf (accessed on 15 June 2021).
43. Bronzato, R.; Formici, C.; Piz, C. Guida Alla Sicurezza Della Viabilità Nelle Imprese—Guida Pratica All’Applicazione del D.Lgs.2002. Available online: https://www.sirsrer.com/teca/wp-content/uploads/2019/03/X_1383.pdf (accessed on 15 June 2021).