Urban mosquitoes, situational publics, and the pursuit of interspecies separation in Dar es Salaam
A Review of Interspecies Toxicity Extrapolation in Birds and Mammals
and a Proposal for Long-term Toxicity Data
R. LUTTIK,1,* P. MINEAU,2 AND W. ROELOFS3
1National Institute Public Health and the Environment, P.O. Box 1, 3720, Bilthoven, BA, The Netherlands2Canadian Wildlife Service, Environment Canada, National Wildlife Research Centre, Carleton
University Campus (Raven Road), K1A 0H3, Ottawa, Canada3Central Science Laboratory, YO41 1LZ, York, Sand Hutton, UK
Accepted 25 March 2005/Published online 16 November 2005
Abstract. Terrestrial risk assessments for pesticide exposure is generally based on a limited number oftoxicity data. The protection target for these assessments requires an extrapolation from species forwhich toxicity data are available to other species with unknown sensitivity to be able to protect these aswell. Our ability to extrapolate toxicity endpoints between species is a major source of uncertainty in riskassessment. Most analyses of interspecies extrapolation in avian risk assessments have dealt with acutetoxicity data. It was suggested that, in the absence of a strong rationale to the contrary, we shouldassume that reproductive data is at least as variable as acute data and that strategies developed for acutedata could be applied to long term toxicity data as well. Considering only the two main bird test speciesfor which reproduction data are available (Mallard and Northern Bobwhite), a comparison of theinterspecies standard deviation for both acute and reproduction data suggests that the two are equallyvariable. Analysis of a very limited data set also suggests that this conclusion holds regardless of whichendpoint is triggered in the reproduction study. However, the relative sensitivity of the two speciesestablished from acute test data appears to be reversed in the case of reproductive data. In addition thereseems to be no reason to believe that bodyweight is a factor in helping birds cope with the rigours ofchronic dosing, which is in contrast with the acute dosing situation. This suggests that the bestextrapolation technique for reproduction test data should be independent of phylogeny and independentof bodyweight scaling. The simplest such method is the one that was proposed by Luttik and Aldenberg(1995, 1997) for both birds and mammals.
Keywords: toxicity data; extrapolation; birds; mammals; SSD
Introduction
This paper is one in a series produced in responseto a charge from the British Department of Envi-ronment, Food and Rural Affairs (DEFRA) to
provide guidance to British and other EU regula-tors on the assessment of long-term risks to wildbirds and mammals from their exposure to pesti-cides. Differences in acute toxicity between speciescan often exceed two orders of magnitude, and thisis widely recognised to be a major source ofuncertainty in avian and mammalian risk assess-ment (Traas et al., 1996; Hart et al., 2001; Hart,
*To whom correspondence should be addressed:
Tel.: +31-30-2742795; Fax: +31-30-2744401;
E-mail: [email protected]
Ecotoxicology, 14, 817–832, 2005
� 2005 Springer Science+Business Media, Inc. Printed in The U.S.A.
DOI: 10.1007/s10646-005-0030-8
2001). Current regulatory practice in Europe is touse the result of the most sensitive tested speciesand to divide this value by a factor of 10 in acuterisk assessments or by a factor of 5 for the chronicsituation. Subsequently, the extrapolated toxicityvalue is used to estimate the risk of pesticideexposure using the toxicity exposure ratio (TER).In other words, pesticides are considered to be safeif the estimated TER is larger than 10 (5) in theacute (chronic) assessment. Recently, it has beensuggested that these assessment factors of 5 and 10can be regarded to account for between-speciesdifferences in toxicity (EU, 2001), though it isunknown whether the particular figures areappropriate for this purpose (EC, 2002). First ofall, it seems unlikely that no other extrapolationsteps are required when using laboratory data toestimate effects in the field. Additionally, there isno scientific justification for using these values forinterspecies extrapolation. More objectiveapproaches have been developed to quantify be-tween-species variation in acute toxicity but notfor chronic (long-term) toxicity. These approachesare based on species sensitivity distributions(SSDs) and although they have been described intechnical guidelines and reports in the past, theyhave not been reviewed in the open literature. Themain reason why these methods have been appliedto acute toxicity data only is that chronic data,unlike acute toxicity endpoints, are not availablefor large numbers of species. One of the work-groups at the Woudschoten workshop (Mineauet al., 2001b in Hart et al., 2001) considered thatavian reproductive toxicity would be at least asvariable as acute toxicity. They therefore proposedto apply existing acute toxicity extrapolation fac-tors (those of Luttik and Aldenberg, 1997 or thoseof Mineau et al., 2001a) to the reproductiveNOEC.
In this paper a review of existing extrapolationmethods based on species sensitivity distributionsof acute data will be given. We will attempt toassess whether the predictions of the Woudschotenworking group are tenable and whetherapproaches developed for acute toxicity data canbe applied to chronic or reproductive effects data.For this assessment, we focus primarily on aviantoxicity data. However, similar approaches can beadopted for risk assessments based on mammaliandata.
Overview of existing extrapolation methods based
on SSDs
The ECOFRAM report on risk assessment for ter-restrial systems has been extensively used for thisreview (http://www.epa.gov/oppefed1/ecorisk/terr-report.pdf). All proposed methods apply ap-proaches based on species sensitivity distributions(Posthuma et al., 2002). Although these methodshave been criticised for lacking ecological relevance(Forbes and Calow, 2002), they offer specific qual-ities (e.g., unlike many extrapolation methods theyare scientifically-based, they offer options to includeuncertainty and they are relatively easy to use, etc.)which resulted in the fact that they have beenwidely(and successfully) applied in risk assessments. Fur-thermore, initial validation exercises have shownthat SSD-based techniques can be used to achieve alevel of protection that is comparable to resultsfrommesocosm studies (Van denBrink et al., 2002).
Method developed by Baril et al. (1994)
This approach recognised that although phyloge-netic patterns in species sensitivities do exist, thereare many exceptions that prevent the developmentof a predictive approach based on phylogenyalone. Nevertheless, when deriving extrapolationfactors (EFs) from historical databases, one needsto recognise that standard test species are used fortesting products. Therefore species-specific extr-apolation factors are derived for use with LD50sfor commonly tested species.
Based on a toxicity data set for pesticidesheavily biased to cholinesterase-inhibiting com-pounds, species-specific EFs were calculated toextrapolate the LD50 of each of the eight species tothe overall HD5 computed with 95% confidenceaccording to the method of Aldenberg and Slob(1993). For each substance i for which the selectedspecies j was tested, an EF could be estimated. Theaverage EF for species j can be calculated using thefollowing equation:
EFj ¼1
nj
Xnj
i¼1
LDi;j50
HDi5
where nj is the number of substances for whichspecies j was tested. The resulting mean EFvalues for each species are presented in Table 1
818 Luttik et al.
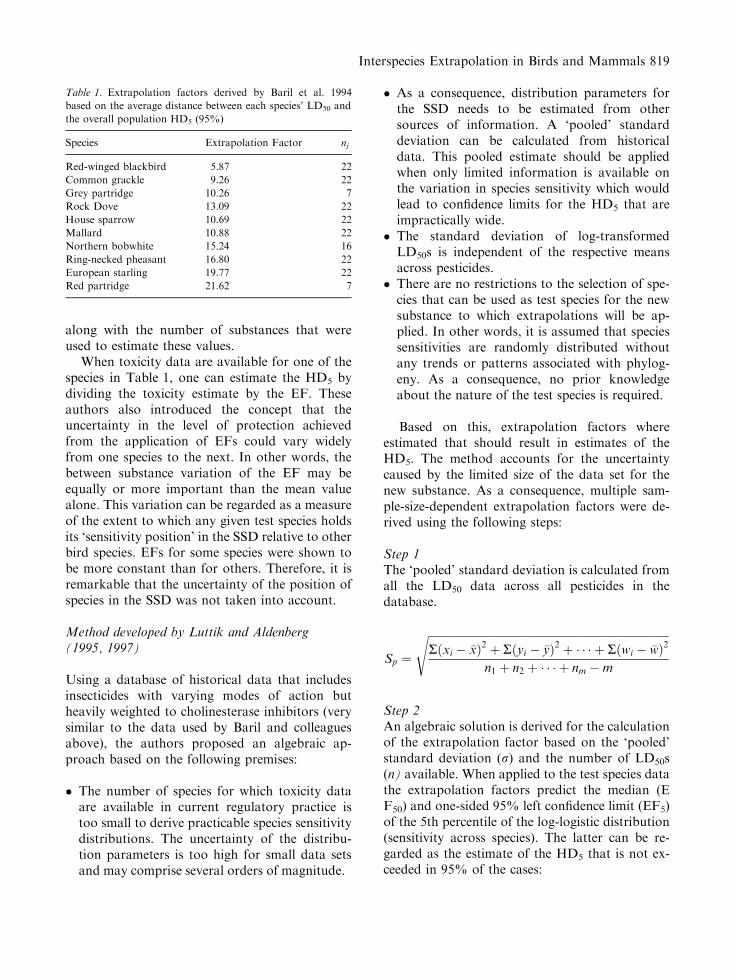
along with the number of substances that wereused to estimate these values.
When toxicity data are available for one of thespecies in Table 1, one can estimate the HD5 bydividing the toxicity estimate by the EF. Theseauthors also introduced the concept that theuncertainty in the level of protection achievedfrom the application of EFs could vary widelyfrom one species to the next. In other words, thebetween substance variation of the EF may beequally or more important than the mean valuealone. This variation can be regarded as a measureof the extent to which any given test species holdsits ‘sensitivity position’ in the SSD relative to otherbird species. EFs for some species were shown tobe more constant than for others. Therefore, it isremarkable that the uncertainty of the position ofspecies in the SSD was not taken into account.
Method developed by Luttik and Aldenberg(1995, 1997)
Using a database of historical data that includesinsecticides with varying modes of action butheavily weighted to cholinesterase inhibitors (verysimilar to the data used by Baril and colleaguesabove), the authors proposed an algebraic ap-proach based on the following premises:
� The number of species for which toxicity dataare available in current regulatory practice istoo small to derive practicable species sensitivitydistributions. The uncertainty of the distribu-tion parameters is too high for small data setsand may comprise several orders of magnitude.
� As a consequence, distribution parameters forthe SSD needs to be estimated from othersources of information. A ‘pooled’ standarddeviation can be calculated from historicaldata. This pooled estimate should be appliedwhen only limited information is available onthe variation in species sensitivity which wouldlead to confidence limits for the HD5 that areimpractically wide.
� The standard deviation of log-transformedLD50s is independent of the respective meansacross pesticides.
� There are no restrictions to the selection of spe-cies that can be used as test species for the newsubstance to which extrapolations will be ap-plied. In other words, it is assumed that speciessensitivities are randomly distributed withoutany trends or patterns associated with phylog-eny. As a consequence, no prior knowledgeabout the nature of the test species is required.
Based on this, extrapolation factors whereestimated that should result in estimates of theHD5. The method accounts for the uncertaintycaused by the limited size of the data set for thenew substance. As a consequence, multiple sam-ple-size-dependent extrapolation factors were de-rived using the following steps:
Step 1The ‘pooled’ standard deviation is calculated fromall the LD50 data across all pesticides in thedatabase.
Sp ¼
ffiffiffiffiffiffiffiffiffiffiffiffiffiffiffiffiffiffiffiffiffiffiffiffiffiffiffiffiffiffiffiffiffiffiffiffiffiffiffiffiffiffiffiffiffiffiffiffiffiffiffiffiffiffiffiffiffiffiffiffiffiffiffiffiffiffiffiffiffiffiffiffiffiffiffiffiffiffiffiffiffiffiffiffiffiffiffiRðxi � �xÞ2 þ Rðyi � �yÞ2 þ � � � þ Rðwi � �wÞ2
n1 þ n2 þ � � � þ nm �m
s
Step 2An algebraic solution is derived for the calculationof the extrapolation factor based on the ‘pooled’standard deviation (r) and the number of LD50s(n) available. When applied to the test species datathe extrapolation factors predict the median (EF50) and one-sided 95% left confidence limit (EF5)of the 5th percentile of the log-logistic distribution(sensitivity across species). The latter can be re-garded as the estimate of the HD5 that is not ex-ceeded in 95% of the cases:
Table 1. Extrapolation factors derived by Baril et al. 1994
based on the average distance between each species’ LD50 and
the overall population HD5 (95%)
Species Extrapolation Factor nj
Red-winged blackbird 5.87 22
Common grackle 9.26 22
Grey partridge 10.26 7
Rock Dove 13.09 22
House sparrow 10.69 22
Mallard 10.88 22
Northern bobwhite 15.24 16
Ring-necked pheasant 16.80 22
European starling 19.77 22
Red partridge 21.62 7
Interspecies Extrapolation in Birds and Mammals 819

EF50 ¼ e1:62�r and EF5 ¼ e 1:62þ1:64=
ffiffinp
ð Þ�r
The calculations resulted in a constant extrapola-tion factor for the median estimate of the HD5 anda series of extrapolation factors, decreasing forincreasing number of LD50 values, for the one-sided 95% confidence limit of the HD5
(Table 2).When the geometric mean of the toxicitydata is divided by the appropriate EF, the HD5
with the selected confidence limit is obtained.It was suggested that for sample sizes of 4 and
more the Aldenberg and Slob (1993) method shouldbe used because the information provided by datasets of size 4 and higher is sufficient to estimate thestandard deviation from the data set itself. Thesame method was also applied to mammalian LD50
values and the calculated extrapolation factors arepresented in Table 3.
In 2002 this study was repeated by Aldenbergand Luttik for a log-normal distribution and inaddition also the lower confidence limits werecalculated. The extrapolation factors are providedin Table 7. These extrapolation factors are nearlyidentical to those reported by Luttik and Alden-berg (1995 , 1997).
The main drawback of this approach is that theuncertainty of the pooled standard deviation esti-mate is ignored. Using the historical database, a
weighted point estimate of the standard deviationis derived without accounting for variations be-tween substances. In addition, the method favourssubstances for which many toxicity data areavailable. When applying this approach, one hasto know how the number of tested species persubstance was distributed in the database becauseit may be that the pooled standard deviation isdetermined by a very limited number of substances(which may share the same mode of action).
Method of Baril (in Ecofram, 1999) after Mineauet al. 1996
The standard species sensitivity approaches silentlyassume that the sensitivities of species as they arefitted are independent of any phylogenetic charac-teristics. Generally, LD50s are expressed in mg/kgbody weight (BW) when they are used to fit a SSD.This implies that rescaling the lethal doses bydividing them by the body weight of the speciesadequately describes the relation between BW andlethal dose. In fact, were this relation to be perfect,BW could be used to describe all differences inacute toxicity between species and one could esti-mate the HD5 by selecting the species with the 5thpercentile BW. If the relation between dose andBW were less than perfect, BW would not accountfor all variability in toxicity between species andone would still require an SSD to describe theremaining variability. Both methods above assumethat rescaling by dividing the dose by BW isappropriate, which implies that it is assumed that:
LD50 ¼Dose
BW
Mineau, Collins and Baril (1996) have fitted linearequations between log BW and log Dose for a widerange of substances to parameterise the followingexpression:
log(Dose) ¼ a � log(BW) þ b
Rearranging the terms results in:
b ¼ log(Dose)� logðBWaÞ
¼ logDose
BWa
� �) ExpðbÞ ¼ Dose
BWa
where a and b are the slope and intercept of thefitted line. For the substances in their data set,
Table 2. Extrapolation factors developed by Luttik and Alden-
berg (1995) which aim to predict the 5th percentile of the spe-
cies sensitivity distribution of birds from one or more test
species LD50s
Number of
test species
Median
estimate
95% one-sided
left confidence limit
1 5.7 32.9
2 5.7 19.6
3 5.7 15.6
Table 3. Extrapolation factors developed by Luttik and Alden-
berg (1995) which aim to predict the 5th percentile of the spe-
cies sensitivity distribution of mammals from one or more test
species LD50s
Number of
test species
Median
estimate
95% one-sided
left confidence limit
1 3.8 14.9
2 3.8 10.0
3 3.8 8.4
820 Luttik et al.
they have demonstrated that there was a relationbetween dose (expressed in mg) and body weight.However, they showed that the value for theslope a was often unequal to 1 and usually great-er than one. Because the correlation was imper-fect (R2<1) in all cases, some variability wasunexplained by BW and SSD’s were still requiredto describe the remaining variability. The valueof the intercept b is a measure of relative toxicity(lower values indicate higher baseline toxicity),but they cannot easily be compared between sub-stances because it does not include informationon the quality of the fit (and hence the remainingbetween-species variability).
The proposed method comprises the followingsteps:
Step 1Retrieve an empirical slope, either from the dataset itself or from a historical data set, that can beapplied as a scaling factor.
Step 2For each LD50 (in mg/kg BW) or Dose (inmg/bird), calculate:
LD0
50 ¼Dose
BWa ¼LD50
BWa�1
Step 3Calculate an HD
0
5 using the standard SSDapproach. The unit in which the HD
0
5 is expressedis mg/kg BWa)1.
Step 4As mentioned above, the HD
0
5 is the 5th percen-tile of the SSD that described the interspeciesvariability that could not be explained by differ-ences in BW. A side-effect of this was that theHD
0
5 is expressed in a unit that has no practical
meaning. Therefore, in the last step the HD0
5
needs to be rescaled to standard units (mg/kg BW) again. This can be done by using thefollowing equation:
HD5 ¼ HD0
5 � BWa�1
where BW is the BW of the focus species. With-out this rescaling approach, if for a certain sub-stance, the value of a is lower than 1, using aSSD with LD50s expressed in mg/kg BW wouldunderestimate the risk for larger birds. In con-trast, values of a higher than 1 can lead to un-der-protection of small-bodied birds. The maindrawback of this rescaling approach is, however,that it requires that the resulting HD5 needs tobe rescaled to the body weight of the focal spe-cies. The method effectively estimates the 5thpercentile of an SSD for which all toxicity valueshave been rescaled as if they were all measuredfor species that have the BW of the focal species.
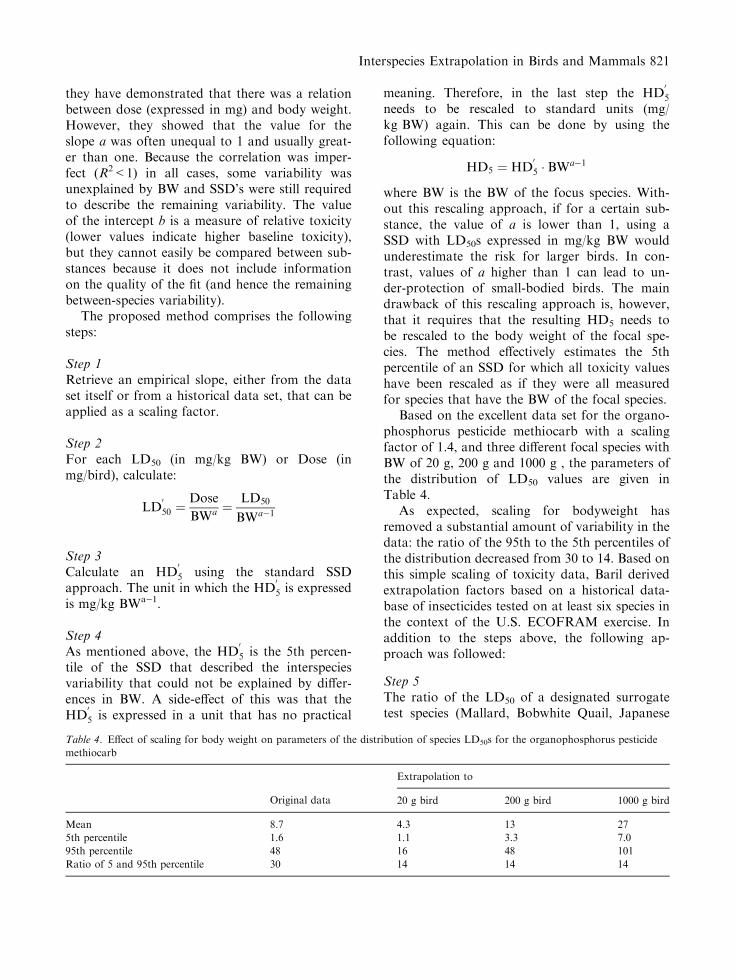
Based on the excellent data set for the organo-phosphorus pesticide methiocarb with a scalingfactor of 1.4, and three different focal species withBW of 20 g, 200 g and 1000 g , the parameters ofthe distribution of LD50 values are given inTable 4.
As expected, scaling for bodyweight hasremoved a substantial amount of variability in thedata: the ratio of the 95th to the 5th percentiles ofthe distribution decreased from 30 to 14. Based onthis simple scaling of toxicity data, Baril derivedextrapolation factors based on a historical data-base of insecticides tested on at least six species inthe context of the U.S. ECOFRAM exercise. Inaddition to the steps above, the following ap-proach was followed:
Step 5The ratio of the LD50 of a designated surrogatetest species (Mallard, Bobwhite Quail, Japanese
Table 4. Effect of scaling for body weight on parameters of the distribution of species LD50s for the organophosphorus pesticide
methiocarb
Original data
Extrapolation to
20 g bird 200 g bird 1000 g bird
Mean 8.7 4.3 13 27
5th percentile 1.6 1.1 3.3 7.0
95th percentile 48 16 48 101
Ratio of 5 and 95th percentile 30 14 14 14
Interspecies Extrapolation in Birds and Mammals 821
Quail, House Sparrow or Rock Dove, or thegeometric mean of a combination thereof) to the5th percentiles of the fitted log-logistic distribu-tion, calculated in step 4, was determined for eachcompound.
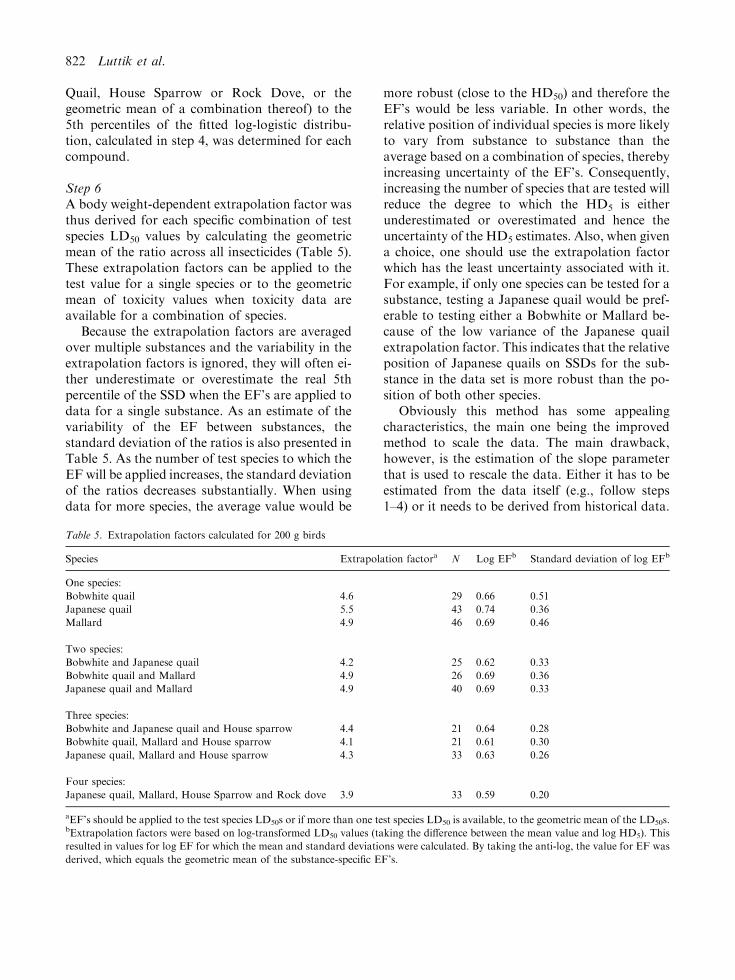
Step 6A body weight-dependent extrapolation factor wasthus derived for each specific combination of testspecies LD50 values by calculating the geometricmean of the ratio across all insecticides (Table 5).These extrapolation factors can be applied to thetest value for a single species or to the geometricmean of toxicity values when toxicity data areavailable for a combination of species.
Because the extrapolation factors are averagedover multiple substances and the variability in theextrapolation factors is ignored, they will often ei-ther underestimate or overestimate the real 5thpercentile of the SSD when the EF’s are applied todata for a single substance. As an estimate of thevariability of the EF between substances, thestandard deviation of the ratios is also presented inTable 5. As the number of test species to which theEF will be applied increases, the standard deviationof the ratios decreases substantially. When usingdata for more species, the average value would be
more robust (close to the HD50) and therefore theEF’s would be less variable. In other words, therelative position of individual species is more likelyto vary from substance to substance than theaverage based on a combination of species, therebyincreasing uncertainty of the EF’s. Consequently,increasing the number of species that are tested willreduce the degree to which the HD5 is eitherunderestimated or overestimated and hence theuncertainty of the HD5 estimates. Also, when givena choice, one should use the extrapolation factorwhich has the least uncertainty associated with it.For example, if only one species can be tested for asubstance, testing a Japanese quail would be pref-erable to testing either a Bobwhite or Mallard be-cause of the low variance of the Japanese quailextrapolation factor. This indicates that the relativeposition of Japanese quails on SSDs for the sub-stance in the data set is more robust than the po-sition of both other species.
Obviously this method has some appealingcharacteristics, the main one being the improvedmethod to scale the data. The main drawback,however, is the estimation of the slope parameterthat is used to rescale the data. Either it has to beestimated from the data itself (e.g., follow steps1–4) or it needs to be derived from historical data.
Table 5. Extrapolation factors calculated for 200 g birds
Species Extrapolation factora N Log EFb Standard deviation of log EFb
One species:
Bobwhite quail 4.6 29 0.66 0.51
Japanese quail 5.5 43 0.74 0.36
Mallard 4.9 46 0.69 0.46
Two species:
Bobwhite and Japanese quail 4.2 25 0.62 0.33
Bobwhite quail and Mallard 4.9 26 0.69 0.36
Japanese quail and Mallard 4.9 40 0.69 0.33
Three species:
Bobwhite and Japanese quail and House sparrow 4.4 21 0.64 0.28
Bobwhite quail, Mallard and House sparrow 4.1 21 0.61 0.30
Japanese quail, Mallard and House sparrow 4.3 33 0.63 0.26
Four species:
Japanese quail, Mallard, House Sparrow and Rock dove 3.9 33 0.59 0.20
aEF’s should be applied to the test species LD50s or if more than one test species LD50 is available, to the geometric mean of the LD50s.bExtrapolation factors were based on log-transformed LD50 values (taking the difference between the mean value and log HD5). This
resulted in values for log EF for which the mean and standard deviations were calculated. By taking the anti-log, the value for EF was
derived, which equals the geometric mean of the substance-specific EF’s.
822 Luttik et al.
For most substances insufficient data are availableto fit an SSD and/or to derive the scaling param-eter so the use of standard EF’s that are based onhistorical data is probably the only option.
As indicated byTable 5, theremay be substantialvariability between the EF’s, which is currently ig-nored, just as the uncertainty in the HD5 estimate isignored. As mentioned above, the default extrapo-lation factors may underestimate the risk for a largefraction of the substances, so it would have beenbetter if the uncertainty in the extrapolation factorswas included in the method.
One option that has not been explored is whe-ther other factors are able to explain fractions ofthe variability in species sensitivity. Another dr-awback is that the method is more complex thanthe previous methods, particularly because theresults can only be interpreted when a body weightis assigned to a focus species. When estimating anHD5, the aim is to determine the dose at which95% of the species is unaffected, rather than 95%of the species of a selected BW. The non-standardway of how the output should be interpreted mayaffect the usability of the method.
In addition, the method is mathematically ca-pable of providing HD5 estimations of species of allweights of equal precision, regardless of the bodyweights of species for which toxicity data wereavailable. Obviously, if toxicity data were availablefor species between 10 and 40 g, the precision ofestimating an HD5 for a 1000 g species would belower than for a species of 20 g. The last issue isthat the SSD-approaches assume that the toxicitydata are independent. Rescaling the data with re-spect to body weight will introduce a dependencybetween the data which should have been includedin the method. These last two other disadvantagesof the method have resulted to the development ofa fourth method for interspecies extrapolationwhich will be discussed below.
No method has been developed for incorpo-rating body weight scaling in mammals. There areindications that scaling is less useful for this groupof organisms. Sample and Arenal (1999) obtainedan average scaling factor of 1.19 for birds, verysimilar to the 1.15 average reported by Mineauet al. (1996) and 1.24 for an enlarged sample ofpesticides (Mineau et al. 2001a). By contrast, Sa-mple and Arenal (1999) computed a ratio of 0.94for mammal species.
Method developed by B. Collins and used in thecompilation of Mineau et al. 2001a
The approach described above (i.e., Method ofBaril (in Ecofram 1999) after Mineau et al., 1996)is appealing in its simplicity. Unfortunately, it isnot strictly correct from a mathematical point ofview. The method of Aldenberg and Slob (1993)consisted of deriving extrapolation constants Kn
which account for the uncertainty in the estimatesof the distribution parameters when dealing withsmall sets of toxicity data. The extrapolationconstants are determined such that a one-sidedleft confidence limit L for log(HD5) (for Haz-ardous Dose at the 5% tail of the distribution) isgiven by:
L ¼ �yn � Kn � Sn
where �yn and Sn are mean and standard devia-tion, respectively of a sample of log-transformedLD50 data of size n. In the paper by Aldenbergand Slob, Kn was derived for the log-logisticdistribution through Monte Carlo simulationassuming that the n sample values are indepen-dent. This assumption is violated when the dataare scaled to the same bodyweight with the con-comitant loss of a degree of freedom.
The distributional method as described by Al-denberg and Slob (1993) does not incorporate abody weight covariate and requires an estimate ofthe mean and the standard deviation or variance.The equivalent terms can be defined for a modelwith a covariate but in this case one must choose avalue specific for the weight of the bird which onewants to protect (see Appendix 1 in Mineau et al.,2001a for the mathematical expressions for themean and standard deviation with covariate). Forthe Aldenberg and Slob approach, the precision ofthe estimates only depends on n while for the co-variate approach it depends on n and another termwhich reflects the precision of the predicted LD50
at the designated weight. The predicted LD50 be-comes less precise as one moves away from theaverage weight of birds tested. In order to com-pensate for this, a value for the extrapolationconstant K must be developed separately for eachdata set and designated weight of bird to be pro-tected. This is done through a simulation in themanner of Aldenberg and Slob (1993).
Interspecies Extrapolation in Birds and Mammals 823
For the derivation of their extrapolation fac-tors, Mineau et al. (2001a) used a new compilationof data (updated, enlarged and corrected from theone used in previous publications) from which allpesticides with n ‡ 6 species were chosen. Initially,factors were computed separately for cholinester-ase inhibiting pesticides and non-cholinesteraseinhibiting pesticides but differences were found tobe slight and non significant. All pesticides weretherefore pooled. For each pesticide, and forpredicted bird weights ranging from 20 to 1000 g,the ratio between the individual species’ LD50 andthe mean estimate of the 5th percentile of thedistribution (HD5 (50%)) were computed andaveraged. In order to ensure protection of anyspecies within the 20–1000 g weight range (thebulk of species that died in pesticide trials in NorthAmerica), the ratios were computed for the birdweight showing the highest sensitivity (usually thelower end of the weight range).
These extrapolation factors are presented inTable 6 below (Table 1 in Mineau et al. 2001a). Itis obvious that these factors are more conservative(higher) than the ones calculated in (i.e., Methodof Baril (in Ecofram 1999) after Mineau et al.,1996) above for a 200 g bird. This is because theseEFs are meant to be sufficiently protective of theentire realistic range of bird weights regardless ofthe scaling factor.
In comparison with method i.e., Method ofBaril (in Ecofram 1999) after Mineau et al.,1996, some technical issues have been solved.This has been achieved at the cost of addingextra complexity to the method. In addition, theuncertainty in the extrapolation factors has beenignored, although one may select the 95th per-centile EF instead of the average value. Inaddition, the interpretation issue has beensolved, enhancing the usability of the method aswell.
How to extrapolate long-term toxicity data
between species
Because the interspecies variability of reproduc-tion NOECs cannot be measured at present due tothe small sample sizes of the data sets, one of thecase study groups in Woudschoten (Mineau et al.,2001b) proposed that to establish a benchmark ofreproductive toxicity, the single study NOEC (oralternatively, the geometric mean of the availableNOEC values) should be extrapolated to accountfor interspecies variability in sensitivity using anEF obtained from acute data. The case studygroup did, however, not specify which of theavailable methods should be used for the acutedata set.
Table 6. Extrapolation factors ordered by increasing coefficients of variation (CV)
Species N
Extrapolation
Factor
Approximate
CV 95th percentile 5th percentile
Red-Winged Blackbird 67 3.95 2.32 10.62 1.47
Red-billed Quelea 22 3.63 2.68 10.92 1.20
Bobwhite Quail and Japanese quail 36 8.05 3.18 27.97 2.32
Bobwhite Quail, Japanese Quail and Mallard Duck 3 8.94 3.64 34.85 2.29
Japanese Quail 61 10.36 4.11 44.96 2.39
Japanese Quail, Mallard Duck and House Sparrow 46 8.37 4.26 37.51 1.87
Japanese Quail and Mallard Duck 56 10.41 5.48 58.93 1.84
European starling and Red-Winged Blackbird 57 5.63 5.57 32.37 0.98
Bobwhite Quail and mallard Duck 40 9.61 6.10 60.12 1.54
Bobwhite Quail 42 8.61 7.19 63.08 1.17
Ring Necked Pheasant 66 9.41 7.42 71.05 1.25
European Starling 59 11.82 7.60 91.32 1.53
Mallard Duck 67 10.38 10.80 114 0.95
Chicken 37 19.75 13.82 274.31 1.42
Approx. CV=(95th percentile–5th percentile)/Extrapolation factor.
95th percentile=Extrapolation factor+1.645*SD.
5th percentile=Extrapolation factor – 1.645*SD.
824 Luttik et al.
The case study group believed that it is rea-sonable to assume that, given the multiplicity ofendpoints in a reproduction study, the estimatedNOEC will be at least as variable among species asthe measure of acute lethality.
Although an extensive database with 4 or morespecies-specific NOECs for each compound is notavailable and will probably never become availableas well, another approach may be applied to re-trieve some information on the interspecies varia-tion. Very often the same two standard species areused for assessing the possible impact of a com-pound on the reproductive capacity of birds (i.e.the Mallard duck and the Bobwhite quail). Bycomparing the interspecies variation of both spe-cies for the acute toxicity tests (LD50 values) withthe interspecies variation for the chronic toxicitytests (either NOEC values or MATCs (geometricmeans between NOEL and LOEL)) one mayestimate whether or not the magnitude of thevariation for both data sets will agree.
For this exercise three different avian toxicitydatabases were used, two with acute LD50 valuesand one with data from reproduction studies. Thefirst databases of acute LD50 values was developedfor the terrestrial indicator workgroup of theOECD and the second was constructed from a2004 update of the database used in Mineau et al.(2001a). All values including limit values were usedin this first database (second analysis, see below fordetails). In the latter case, we used only thosecompounds for which Bobwhite andMallards weretested in the same laboratory, excluding approxi-mate LD50 values such as those of Schafer et al.(1983) and greater than values (e.g. >2000 mg/kg,first analysis). The third database contained avianreproduction studies tabulated by the German Bi-ologische Bundesanstalt (BBA) and made availablefor the WEBFRAM research project (project fun-ded by the department for Environment, Food andRural Affairs (DEFRA) of the UK). That databasewas used either without (first analysis) or with(second analysis) limit values. Typically, the data-base contained reproductive data on both theMallard and Bobwhite from the same laboratory.
First analysis: Excluding limit values
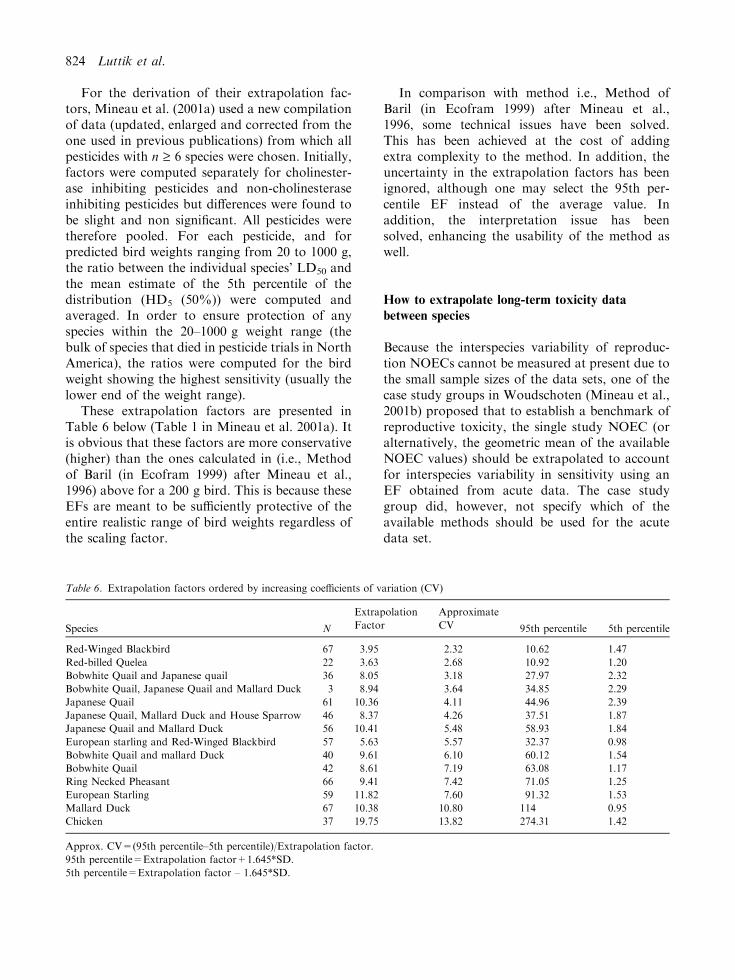
For the reproduction data, only those compoundsfor which both a NOEL and LOEL were identified
in the two species were retained. This provided asample of 28 compounds for which the MATC(geometric mean of both values) was computed.After LOG transformation of the MATCs, themean and standard deviations were calculated forthe 28 pesticides and are plotted in Fig. 1. Theaverage standard deviation for this sample ofchemicals was 0.25 (SD=0.28).
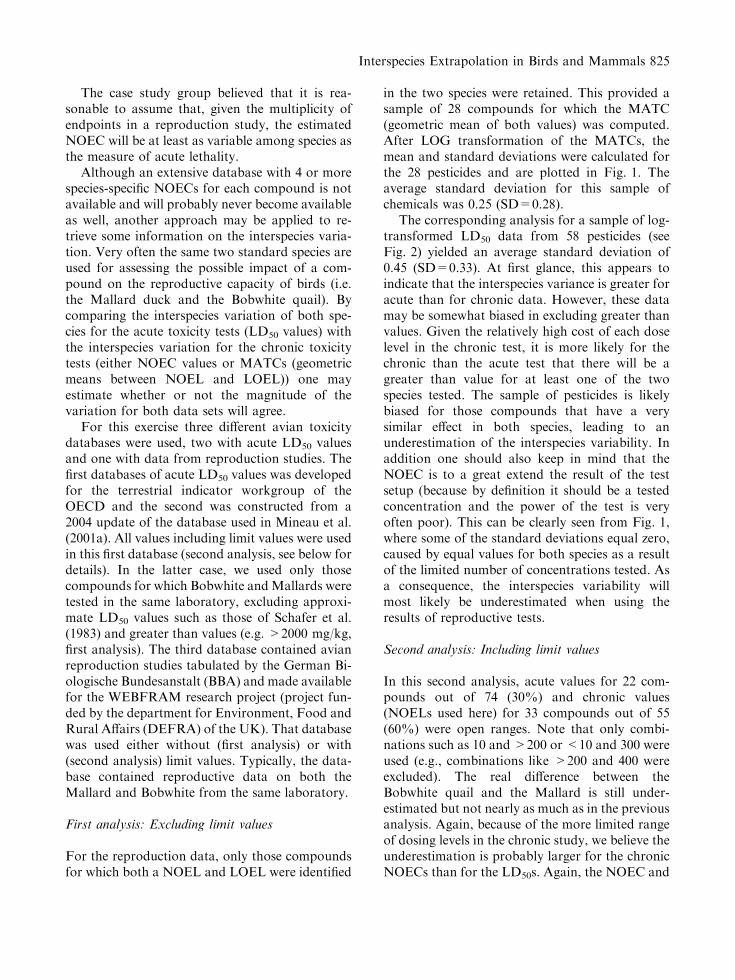
The corresponding analysis for a sample of log-transformed LD50 data from 58 pesticides (seeFig. 2) yielded an average standard deviation of0.45 (SD=0.33). At first glance, this appears toindicate that the interspecies variance is greater foracute than for chronic data. However, these datamay be somewhat biased in excluding greater thanvalues. Given the relatively high cost of each doselevel in the chronic test, it is more likely for thechronic than the acute test that there will be agreater than value for at least one of the twospecies tested. The sample of pesticides is likelybiased for those compounds that have a verysimilar effect in both species, leading to anunderestimation of the interspecies variability. Inaddition one should also keep in mind that theNOEC is to a great extend the result of the testsetup (because by definition it should be a testedconcentration and the power of the test is veryoften poor). This can be clearly seen from Fig. 1,where some of the standard deviations equal zero,caused by equal values for both species as a resultof the limited number of concentrations tested. Asa consequence, the interspecies variability willmost likely be underestimated when using theresults of reproductive tests.
Second analysis: Including limit values
In this second analysis, acute values for 22 com-pounds out of 74 (30%) and chronic values(NOELs used here) for 33 compounds out of 55(60%) were open ranges. Note that only combi-nations such as 10 and >200 or <10 and 300 wereused (e.g., combinations like >200 and 400 wereexcluded). The real difference between theBobwhite quail and the Mallard is still under-estimated but not nearly as much as in the previousanalysis. Again, because of the more limited rangeof dosing levels in the chronic study, we believe theunderestimation is probably larger for the chronicNOECs than for the LD50s. Again, the NOEC and
Interspecies Extrapolation in Birds and Mammals 825
LD50 values were log transformed before mean andstandard deviation values were computed.
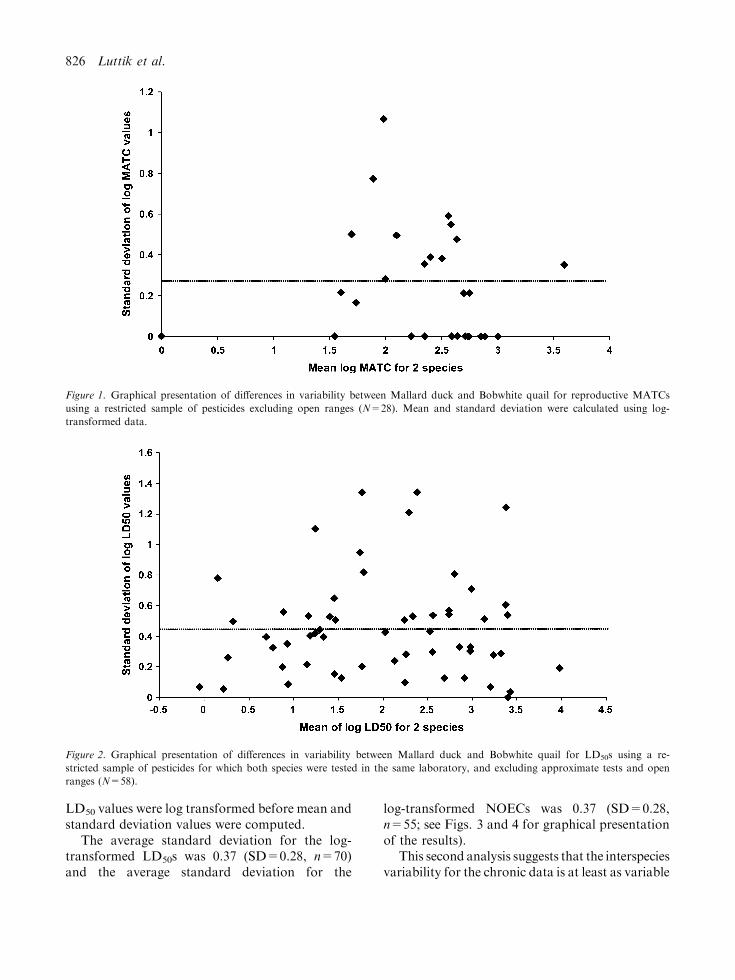
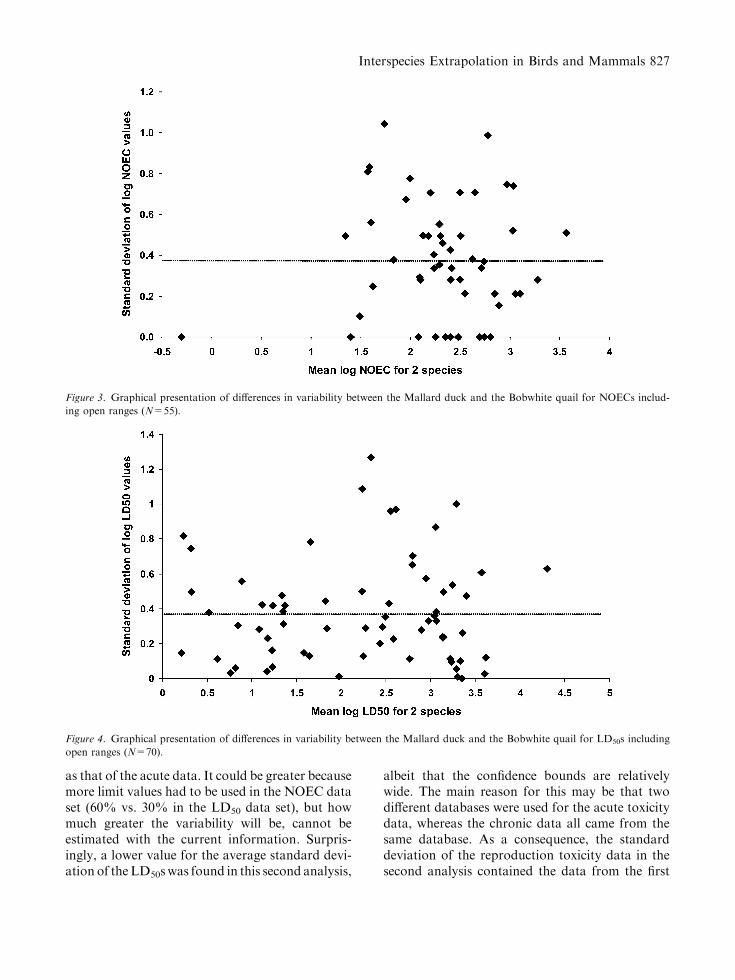
The average standard deviation for the log-transformed LD50s was 0.37 (SD=0.28, n=70)and the average standard deviation for the
log-transformed NOECs was 0.37 (SD=0.28,n=55; see Figs. 3 and 4 for graphical presentationof the results).
This second analysis suggests that the interspeciesvariability for the chronic data is at least as variable
Figure 1. Graphical presentation of differences in variability between Mallard duck and Bobwhite quail for reproductive MATCs
using a restricted sample of pesticides excluding open ranges (N=28). Mean and standard deviation were calculated using log-
transformed data.
Figure 2. Graphical presentation of differences in variability between Mallard duck and Bobwhite quail for LD50s using a re-
stricted sample of pesticides for which both species were tested in the same laboratory, and excluding approximate tests and open
ranges (N=58).
826 Luttik et al.
as that of the acute data. It could be greater becausemore limit values had to be used in the NOEC dataset (60% vs. 30% in the LD50 data set), but howmuch greater the variability will be, cannot beestimated with the current information. Surpris-ingly, a lower value for the average standard devi-ation of theLD50swas found in this second analysis,
albeit that the confidence bounds are relativelywide. The main reason for this may be that twodifferent databases were used for the acute toxicitydata, whereas the chronic data all came from thesame database. As a consequence, the standarddeviation of the reproduction toxicity data in thesecond analysis contained the data from the first
Figure 3. Graphical presentation of differences in variability between the Mallard duck and the Bobwhite quail for NOECs includ-
ing open ranges (N=55).
Figure 4. Graphical presentation of differences in variability between the Mallard duck and the Bobwhite quail for LD50s including
open ranges (N=70).
Interspecies Extrapolation in Birds and Mammals 827
analyses, whereas in the acute case a different set ofsubstances have been used. This supports the viewthat the interspecies variance in acute testing couldbe used as a first approximation of interspeciesvariance for chronic and reproduction endpoints. Italso suggests that the current EU practice ofapplying a smaller factor (e.g., 5) for the chronicdata than for the acute data (typically 10) needs tobe reassessed, particularly if the current factors alsoneed to account for other extrapolations (e.g., lab-to-field) as well.
Which of the available extrapolation factors should
be used for reproductive data?
The analysis above shows that given the availabledata, we are not able to demonstrate differencesbetween interspecies differences in toxicity betweenshort-term and long-term toxicity data. One pointto consider when interpreting the results of theanalysis below is that the substances for whichtoxicity data from reproduction studies are avail-able may be different from the ones for which wehad acute data. In addition, acute data may beavailable for more species than the two selectedones. As a consequence, the estimate of thestandard deviation based on these two species maybe different from the standard deviation estimatewhen all acute data were used. Nevertheless, for thetime being, it may be appropriate to deriveextrapolation factors from acute toxicity. In prin-ciple four sets of extrapolation factors are availablefor the long term risk assessment: the set developedby Baril et al. (1994) which recognizes species-specific average susceptibility but which is notcorrected for bodyweight scaling, the set by Luttikand Aldenberg (1995) which is not species specificand does not correct for body weight scaling, themethod developed by Baril for Ecofram (1999)following Mineau et al. (1996) which uses a simplescaling followed by the standard Aldenberg andSlob procedure and the last by Collins in Mineauet al. (2001a) which provides the most conservativefactors for birds within a broad (20–1000 g) rangeof body weights encountered in field studies.
The main questions to answer are:
1. Do we expect the patterns of species sensitiv-ity shown in acute studies to carry over in
the case of long term effects (lethality,growth and reproduction)?
2. Is there likely to be scaling to body weight inthe case of long term effects?
If the answer is no to both of these questions,the set of Luttik and Aldenberg could be used forthe chronic situation because no phylogeneticpatterns are included in this method and it istherefore applicable to any randomly availablespecies.
If phylogenetic relationships are expected butwe do not believe that bodyweight scaling operatesin the case of long-term toxicity, then we may wantto adopt the method proposed by Baril et al.(1994).
If we believe that both scaling and phylogenyare applicable, then the factors proposed inMineau et al. (2001a) are probably the better onesto use. Alternatively, we need to redo the simula-tions of Aldenberg and Slob to account for theweight co-variate.
Mineau et al. (2001a) suggested that the reasonfor small birds being more sensitive may be thatsmall birds are less able to withstand the rigoursof acute dosing. A small bird is much more likelyto perish than a larger one given that both aresimilarly indisposed and ‘thrown off’ their food, acommon observation in acute tests. This expla-nation is in contradiction with the suggestion ofFischer and Hancock (1997) that the positivescaling is due to a phylogenetically based differ-ence in pesticide susceptibility between (smaller)passerines and (larger) non-passerines. If theexplanation of Mineau et al. (2001b) is correct, itsuggests that long-term toxicity is not likely to besubject to the same scaling as acute toxicity. Also,there would be a great deal of uncertainty inassuming that the scaling factor derived fromacute data is the same for chronic data. Thechoice would then be between the methods ofBaril et al. (1994) and Luttik and Aldenberg(1995). In either case, the factors should berecomputed with the newer enlarged database. Inaddition, the method of Baril et al. (1994) willrequire modifications to include the between sub-stance variability. Without it, a large fraction ofthe extrapolations will lead to non-protective HD5
levels and high potential risks to avian species inthe field.
828 Luttik et al.

A simple approach for looking at the importanceof phylogeny is to see whether the same species isalways more sensitive than the other species. In thecase of the database with LD50 values used in the1995 research by Luttik and Aldenberg, the Bob-white quail was more sensitive than the Mallardduck in 70% of the cases. This may be because themallard is known for its higher propensity toregurgitate following gavages. In any case, thisrelative sensitivity is in contrast to the database ofreproduction NOEC values where, in 60% of thecases, theMallard duck was more sensitive than theBobwhite quail.
This result suggests that susceptibilities basedon phylogeny may differ between acute andchronic dosing. In addition, the high variability ofthe EF’s based on the weight-adjusted LD50s inTable 5 also indicates that the position of speciesin relation to the HD5 may vary to a great extentbetween substances and that this variability needsto be included to prevent extrapolations to dosesat which more than 5% of the species are at risk.Pending further research, we suggest that it may beinappropriate to use species specific extrapolationfactors such as those devised by Baril et al. (1994)in long term risk assessments for birds, unless thevariability of the EF’s is included.
Discussion
The study of Luttik and Aldenberg was carried outin 1995 with a database of 55 compounds. Cur-rently, a database of 137 compounds with data for
4 or more avian species is available. The pooledstandard deviation (log transformed) based on thislarger database is 0.46496. This value is almostidentical to the value calculated by Luttik andAldenberg (1995, 1997) with the smaller database(i.e., 0.46513). Because of this minor difference it isnot necessary to replace the older extrapolationfactors by new ones and therefore the values pre-sented in Table 7 can be used. Note that theextrapolation factor is used in combination withthe geometric mean of the available data and notthe lowest toxicity value as is common practice inregulatory procedures.
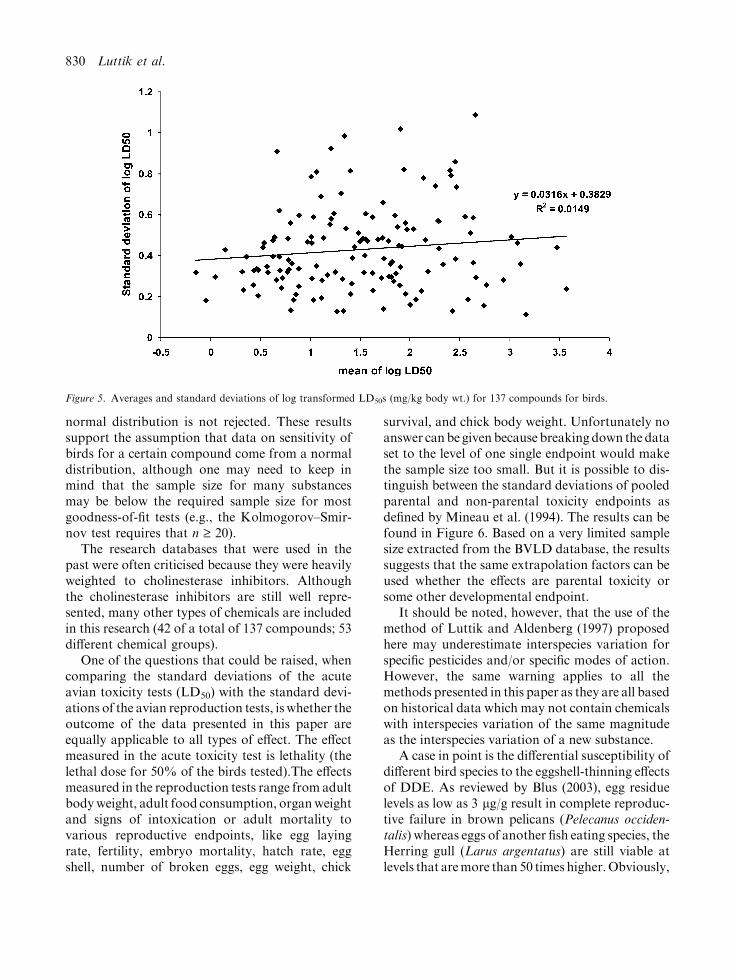
One of the assumptions that is made in theLuttik and Aldenberg method is that the standarddeviation of the logarithm of the LD50s is inde-pendent of the respective means across pesticides.That the standard deviation is independent fromthe mean is graphically shown in Fig. 5. The cor-relation between the means and the standarddeviations that were calculated using the log-transformed data is not significant (correlationcoefficient=0.122, n=137, two sided at the 5%significance level).
By calculating the pooled standard deviation itis assumed that the log-transformated data arenormally distributed. This was tested with thegoodness-of-fit test of the EtX program ofAldenberg (1993) which is based on the Kolmo-gornov–Smirnov test statistics according toD’Agostino and Stephens (1986). The results ofthese goodness-of-fit tests show that at the 5%significance level in 88% of the cases (n=137) thehypothesis that the data are derived from the
Table 7. Extrapolation factors to be used in case of small sample sizes for log logistic (Luttik and Aldenberg, 1997) and log nor-
mal distribution (Aldenberg and Luttik, 2002)
Number of
test species
Log logistic distribution Log normal distribution
Median
estimate
Upper
confidence limit (95%)
Lower
confidence limit (5%)
Median
estimate
Upper
confidence limit (95%)
1 5.7 32.9 1.0 5.8 33.9
2 5.7 19.6 1.7 5.8 20.2
3 5.7 15.6 2.1 5.8 16.1
4 5.7 13.7 2.4 5.8 14.0
5 5.7 12.4 2.6 5.8 12.8
6 5.7 11.6 2.8 5.8 11.9
7 5.7 11.0 3.0 5.8 11.3
8 5.7 10.6 3.1 5.8 10.8
9 5.7 10.2 3.2 5.8 10.5
10 5.7 9.9 3.3 5.8 10.2
Interspecies Extrapolation in Birds and Mammals 829
normal distribution is not rejected. These resultssupport the assumption that data on sensitivity ofbirds for a certain compound come from a normaldistribution, although one may need to keep inmind that the sample size for many substancesmay be below the required sample size for mostgoodness-of-fit tests (e.g., the Kolmogorov–Smir-nov test requires that n ‡ 20).
The research databases that were used in thepast were often criticised because they were heavilyweighted to cholinesterase inhibitors. Althoughthe cholinesterase inhibitors are still well repre-sented, many other types of chemicals are includedin this research (42 of a total of 137 compounds; 53different chemical groups).
One of the questions that could be raised, whencomparing the standard deviations of the acuteavian toxicity tests (LD50) with the standard devi-ations of the avian reproduction tests, is whether theoutcome of the data presented in this paper areequally applicable to all types of effect. The effectmeasured in the acute toxicity test is lethality (thelethal dose for 50% of the birds tested).The effectsmeasured in the reproduction tests range from adultbodyweight, adult food consumption, organweightand signs of intoxication or adult mortality tovarious reproductive endpoints, like egg layingrate, fertility, embryo mortality, hatch rate, eggshell, number of broken eggs, egg weight, chick
survival, and chick body weight. Unfortunately noanswer canbe given because breaking down the dataset to the level of one single endpoint would makethe sample size too small. But it is possible to dis-tinguish between the standard deviations of pooledparental and non-parental toxicity endpoints asdefined by Mineau et al. (1994). The results can befound in Figure 6. Based on a very limited samplesize extracted from the BVLD database, the resultssuggests that the same extrapolation factors can beused whether the effects are parental toxicity orsome other developmental endpoint.
It should be noted, however, that the use of themethod of Luttik and Aldenberg (1997) proposedhere may underestimate interspecies variation forspecific pesticides and/or specific modes of action.However, the same warning applies to all themethods presented in this paper as they are all basedon historical data which may not contain chemicalswith interspecies variation of the same magnitudeas the interspecies variation of a new substance.
A case in point is the differential susceptibility ofdifferent bird species to the eggshell-thinning effectsof DDE. As reviewed by Blus (2003), egg residuelevels as low as 3 lg/g result in complete reproduc-tive failure in brown pelicans (Pelecanus occiden-talis) whereas eggs of another fish eating species, theHerring gull (Larus argentatus) are still viable atlevels that aremore than 50 times higher.Obviously,
Figure 5. Averages and standard deviations of log transformed LD50s (mg/kg body wt.) for 137 compounds for birds.
830 Luttik et al.

the estimationof anHD5will leave 5%of the speciesunprotected so it may well be that brown pelicansare one of these species. One needs to be aware thatSSDmethods are not suitable to provide protectionof a selected focal species. If that is the purpose ofconducting a risk assessment, other techniquesshould be applied or one may consider conductingtoxicity tests on the selected species.
A final question is whether the approach takenfor birds is also applicable to mammals. Althoughthere are in principle no reasons to believe that theoutcome would be different, there is no possibilityof comparing the interspecies variance betweenacute and reproduction tests given current datalimitations – i.e., the absence of two species testedboth for acute and chronic toxicity. This is notlikely to change in the future. Given the completeabsence of information, we suggest the adoption ofa strategy analogous to that proposed for birdsusing the extrapolation factors calculated for acutemammal toxicity by Luttik and Aldenberg (1995).
Acknowledgments
We would like to acknowledge Andy Hart forsuggesting our participation in this workshop forwhich this background paper was prepared and
the Pesticides Safety Directorate, Department forEnvironment, Food and Rural Affairs, UK forfunding the workshop. Useful comments werereceived from A. Hart, M. Hooper and WilbertSlooff.
References
Aldenberg, T. (1993). ETX 1.3a, A program to calculate con-
fidence limits for hazardous concentrations based on small
samples of toxicity data. RIVM report 719102015. National
Institute of Public health and Environment, Bilthoven, The
Netherlands.
Aldenberg, T. and Slob, W. (1993). Confidence limits for haz-
ardous concentrations based on logistically distributed
NOEC toxicity data. Ecotoxicol. Environ. Saf. 25, 48–63.
Aldenberg, T. and Luttik, R. (2002). Extrapolation factors for
tiny toxicity data sets from species sensitivity distributions
with known standard deviation. In L. Posthuma, G.W.
Suter II and T.P. Traas (eds). Species Sensitivity Distribu-
tions in Ecotoxicology, pp. 103–118. New York, USA: Lewis
Publishers.
Baril, A., Jobin, B., Mineau, P. and Collins, B.T. (1994). A
consideration of inter-species variability in the use of the
median lethal dose (LD50) in avian risk assessment. Tech-
nical Report Series No. 216, Canadian Wildlife Service,
Ottawa, Canada.
Blus, L.J. (2003). Organochlorine pesticides. In D.J. Hoffman,
B.A. Rattner, G.A. Jr. Burton and J.C. Carlisle (eds).
Handbook of Ecotoxicology, pp. 313–339. Boca Raton:
Lewis Publishers.
Figure 6. Comparison of standard deviations (SD) of parental and non parental toxicological endpoints (after Mineau et al., 1994)
for Mallard duck and Bobwhite quail (open squares=parental effects in both species, black squares=LOEL based on effect other
than parental in at least one species).
Interspecies Extrapolation in Birds and Mammals 831
D’Agostino, R.B. and Stephens, M.A. (1986). Goodness-of-fit
Techniques. Statistics: Textbooks and Monographs. vol. 68
Marcel Dekker Inc, New York, United States.
Ecofram (Ecological Committee on FIFRA Risk Assessment
Methods) (1999). Ecofram terrestrial draft report. http://
www.epa.gov/oppefed1/ecorisk/terrreport.pdf.
European Union (EU) (2001). Guidance document on Risk
Assessment for Birds and Mammals SANCO4145/2000)
November 2001, DG Health & Consumer Protection,
Brussels, 16 November 2001.
European Commission (EC) (2002). Opinion of the Scientific
Committee on Plants on the Draft Guidance Document on
risk assessment for birds and mammals under Directive 91/
414/EEC. SCP/GUIDEB&M/002-Final, Health and Con-
sumer Protection Directorate, Brussels.
Fischer, D.L. and Hancock, G.A. (1997). Interspecies extrap-
olation of acute toxicity in birds: body size scaling vs.
phylogeny (abstract) 18th Annual SETAC. San Francisco,
CA, USA.
Forbes, V.E. and Calow, P. (2002). Species sensitivity distri-
butions revisited: a critical appraisal. Hum. Ecol. Risk
Assessment 8, 473–492.
Hart, A., Balluff, D., Barfknecht, R., Chapman, P.F., Hawkes,
T., Joermann, G., Leopold, A. and Luttik, R. (2001). Avian
Effects Assessment: A Framework for Contaminants Studies.
Society of Environmental Toxicology and Chemistry (SE-
TAC), Pensacola, FL, 193 pp.
Hart, A. (ed.) (2001). Probabilistic Risk Assessment for Pesti-
cides in Europe: Implementation and Research Needs.
Report of the European workshop on Probabilistic Risk
Assessment for the Environmental Impacts of Plant Pro-
tection Products (EUPRA). Central Science Laboratory,
Sand Hutton, UK. 109 pp.
Luttik, R. and Aldenberg, T. (1995). Extrapolation factors to
be used in case of small samples of toxicity data (with a
special focus on LD50 values for birds and mammals).
Report No. 679102029. National Institute of Public Health
and Environmental Protection, Bilthoven, The Netherlands.
Luttik, R. and Aldenberg, T. (1997). Extrapolation factors for
small samples of pesticide toxicity data: special focus on
LD50 values for birds and mammals. Environ. Toxicol.
Chem. 16, 1785–88.
Mineau, P., Boersma, D.C. and Collins, B. (1994). An analysis
of avian reproduction studies submitted for pesticide regis-
tration. Ecotox. Environ. Safe. 29, 304–29.
Mineau, P., Collins, B.T. and Baril, A. (1996). On the use of
scaling factors to improve interspecies extrapolation of
acute toxicity in birds. Regul. Toxicol. Pharm. 24, 24–9.
Mineau, P., Baril, A., Collins, B.T., Duffe, J.A., Joermann, G.
and Luttik, R. (2001a). Pesticide acute toxicity reference
values for birds. Rev. Env. Contam. Toxicol. 170, 13–74.
Mineau, P., Hooper, M., Elmegaard, N., Grau, R., Luttik,
R. and Ringer, R. (2001b). Case Study 5: Foliar Insecti-
cide II, Chapter 8. In A. Hart, D. Balluff, R. Barfknecht,
P. Chapman, A. Hawkes, G. Joermann, A. Leopold and
R. Luttik (eds). Avian Effects Assessment: A Framework
for Contaminant Studies, pp. 111–136. Pensacola, Florida:
SETAC Press.
Posthuma, L., Suter II, G.W. and Traas, T.P. (eds) (2002).
Species Sensitivity Distributions in Ecotoxicology. New
York, USA: Lewis Publishers.
Sample, B.E. and Arenal, C.A. (1999). Allometric models for
interspecies extrapolation of wildlife toxicity data. Bull.
Environ. Contam. Toxicol. 62, 653–63.
Schafer, E.W., Bowles, W.A. and Hurlbut, J. (1983). The acute
oral toxicity, repellency and hazard potential of 998 chem-
icals to one or more species of wild and domestic birds.
Arch. Environ. Contam. Toxicol. 12, 355–382.
Traas, T.P., Luttik, R. and Jongbloed, R.H. (1996). A proba-
bilistic model for deriving soil quality criteria based on
secondary poisoning of top predators. I. Model description
and uncertainty analysis. Ecotox. Environ. Safe. 34, 264–78.
Van den Brink, P.J., Brock, T.C.M. and Posthuma, L. (2002).
The value of the species sensitivity distribution concept for
predicting field effects: (non-)confirmation of the concept
using semifield experiments. In L. Posthuma, G.W. Suter II
and T.P. Traas (eds). Species Sensitivity Distributions in
Ecotoxicology, pp. 103–118. New York, USA: Lewis
Publishers.
832 Luttik et al.
Copyright © 2022 FDOKUMEN