A Review of Drill-Stem Testing Techniques and Analysis
10
FEATURE ARTICLE A REVIEW of DRILL-STEM TESTING TECHNIQUES and ANALYSIS W. MARSHALL BLACK JUNIOR MEMBER AIME HUMBLE OIL & REFINING CO. HOUSTON, TEX. Abstract The present techniques of using the drill-stem test as a formation evaluation tool are discussed. The basic drill-stem test operation is di- vided for discussion into three phases: planning the test, performing the test, and interpretation, both qualitative and quantitative. The use of small bottom chokes and large top chokes is suggested in order to permit quan- titative interpretation for gas-oil ratio, productivity, and permeability. The importance of measuring chloride content on a suite of samples taken from a recovered column of salt wa- ter is illustrated. Introduction A drill-stem test is a temporary completion of the well. Drill-stem tests are usually made for one or both of the following reasons: ( 1) to determine the producible fluid content of a formation, and (2) to determine the ability of a formation to produce. Drill-Stem Testing Methods The drill-stem test, or temporary completion, . can be made either in open hole or inside casing through perforations. A drill-stem testing pro- gram can be planned for a well so that the tests will be made in accord- ance with one of three general meth- ods: 1. Test possibly productive inter- vals in open hole as the zones are penetrated; normally, this method is used in conjunction with coring and Original manuscript received in Petroleum Branch office on Sept. 15. 1955. Revised man- uscript received May 1'6. 1956. Paper pre- sented at Formation Evaluation Symposium. Oct. 27-28. 1955. Houston. Teo<. JUNE,1956 SPE 589-G ether-cuts may be used to detect hy- drocarbon shows. 2. Test possibly productive inter- vals in open hole after drilling deep- er or reaching total depth; normally, this method requires that a cement plug be set for each test, unless strad- dle packer testing is employed. Side- wall cores and logs are commonly used to detect the shows. 3. Test possibly productive inter- vals through perforations after casing has been set; log and core data may be used in selecting the intervals. Drill-stem testing is widely used to confirm or prove the presence and! or the producibility of oil and gas that is detected by the other services. The testing program in a well can follow anyone of the methods of drill-stem testing outlined in the preceding sec- tion; however, the method of testing cored shows as the prospective pays are penetrated is probably most wide- ly used at present. Under this meth- od, a test will usually be made after penetrating a few feet into the pros- pective zone, and if the results are favorable, subsequent tests may be made in search for fluid contacts. Testing programs during the early phases of field development are as important as the coring and logging programs for delineation of the res- ervoirs and for establishing or con- firming the gas-oil and oil-water con- tacts. Trends in Drill-Stem Testing Since the early days about three- fourths of all drill-stem tests have been performed in open hole prior to setting oil string casing. This pre- dominance of open-hole testing defi- nitely places drill-stem testing in the category of exploratory forma- tion evaluation. Presently, tests in- side casing are about 91 per cent mechanically successful as compared with 81 per cent 10 years ago, and conventional open-hole, wall packer testing is mechanically successful about 87 per cent of the time as compared with 72 per cent 10 years ago. The Drill-Stem Testing Tool Modern drill-stem testing tools are highly versatile and consequently are complex. The various components may be assembled in innumerable combinations, either to provide spe- cial information or to provide for emergencies that may develop. The following paragraphs briefly outline the functions of the more common tool components. The three basic mechanisms or components of a drill-stem test tool are as follows: (1) the tester valve, (2) the by-pass valve, and (3) the packer. These three component mechanisms will be found in some form in any good drill-stem test tool. The functions of each of the basic components in the assembly are as shown below. FUNCTIONS OF BASIC COMPONENTS OF TOOL 1. The Tester or Retaining Valve o. To prevent drilling mud from entering empty drill pipe while funning in. b. To aid in preventing drilling mud from enter- ing drill pipe while pulling out and, conversely, to aid in retaining formation liquid recovery in the drill pipe. c. To open the tool, permitting passage of forma· tion fluids into the empty drill pipe after the packer is set. 2. The By·Pass or Equalizing Valve o. To permit mud under hydrostatic pressure to flow downward throug h the packer mandrel at the conclusion of the test into the hole below the packer. This action equalizes the pressure above and below the packer, making it easier to pull loose. b. To provide additional area through which the drilling mud can pass around the packer while running in and pulling out of the hole. Note: The new "hydraulic testers" ore unitized teater valves and by·pass valves; the respective functions of these are unchanged. 21 Downloaded from http://onepetro.org/JPT/article-pdf/8/06/21/2237729/spe-589-g.pdf/1 by guest on 27 May 2022
-
Upload
khangminh22 -
Category
Documents
-
view
1 -
download
0
Transcript of A Review of Drill-Stem Testing Techniques and Analysis
FEATURE ARTICLE
A REVIEW of DRILL-STEM TESTING TECHNIQUES and ANALYSIS
W. MARSHALL BLACK
JUNIOR MEMBER AIME
HUMBLE OIL & REFINING CO. HOUSTON, TEX.
Abstract
The present techniques of using the drill-stem test as a formation evaluation tool are discussed. The basic drill-stem test operation is divided for discussion into three phases: planning the test, performing the test, and interpretation, both qualitative and quantitative. The use of small bottom chokes and large top chokes is suggested in order to permit quantitative interpretation for gas-oil ratio, productivity, and permeability. The importance of measuring chloride content on a suite of samples taken from a recovered column of salt water is illustrated.
Introduction
A drill-stem test is a temporary completion of the well. Drill-stem tests are usually made for one or both of the following reasons: ( 1) to determine the producible fluid content of a formation, and (2) to determine the ability of a formation to produce.
Drill-Stem Testing Methods The drill-stem test, or temporary
completion, . can be made either in open hole or inside casing through perforations. A drill-stem testing program can be planned for a well so that the tests will be made in accordance with one of three general methods:
1. Test possibly productive intervals in open hole as the zones are penetrated; normally, this method is used in conjunction with coring and
Original manuscript received in Petroleum Branch office on Sept. 15. 1955. Revised manuscript received May 1'6. 1956. Paper presented at Formation Evaluation Symposium. Oct. 27-28. 1955. Houston. Teo<.
JUNE,1956 SPE 589-G
ether-cuts may be used to detect hydrocarbon shows.
2. Test possibly productive intervals in open hole after drilling deeper or reaching total depth; normally, this method requires that a cement plug be set for each test, unless straddle packer testing is employed. Sidewall cores and logs are commonly used to detect the shows.
3. Test possibly productive intervals through perforations after casing has been set; log and core data may be used in selecting the intervals.
Drill-stem testing is widely used to confirm or prove the presence and! or the producibility of oil and gas that is detected by the other services. The testing program in a well can follow anyone of the methods of drill-stem testing outlined in the preceding section; however, the method of testing cored shows as the prospective pays are penetrated is probably most widely used at present. Under this method, a test will usually be made after penetrating a few feet into the prospective zone, and if the results are favorable, subsequent tests may be made in search for fluid contacts.
Testing programs during the early phases of field development are as important as the coring and logging programs for delineation of the reservoirs and for establishing or confirming the gas-oil and oil-water contacts.
Trends in Drill-Stem Testing Since the early days about three
fourths of all drill-stem tests have been performed in open hole prior to setting oil string casing. This predominance of open-hole testing definitely places drill-stem testing in the category of exploratory forma-
tion evaluation. Presently, tests inside casing are about 91 per cent mechanically successful as compared with 81 per cent 10 years ago, and conventional open-hole, wall packer testing is mechanically successful about 87 per cent of the time as compared with 72 per cent 10 years ago.
The Drill-Stem Testing Tool Modern drill-stem testing tools are
highly versatile and consequently are complex. The various components may be assembled in innumerable combinations, either to provide special information or to provide for emergencies that may develop. The following paragraphs briefly outline the functions of the more common tool components.
The three basic mechanisms or components of a drill-stem test tool are as follows: (1) the tester valve, (2) the by-pass valve, and (3) the packer. These three component mechanisms will be found in some form in any good drill-stem test tool. The functions of each of the basic components in the assembly are as shown below.
FUNCTIONS OF BASIC COMPONENTS OF TOOL 1. The Tester or Retaining Valve
o. To prevent drilling mud from entering empty drill pipe while funning in. b. To aid in preventing drilling mud from entering drill pipe while pulling out and, conversely, to aid in retaining formation liquid recovery with~ in the drill pipe. c. To open the tool, permitting passage of forma· tion fluids into the empty drill pipe after the packer is set.
2. The By·Pass or Equalizing Valve o. To permit mud under hydrostatic pressure to flow downward throug h the packer mandrel at the conclusion of the test into the hole below the packer. This action equalizes the pressure above and below the packer, making it easier to pull loose. b. To provide additional area through which the drilling mud can pass around the packer while running in and pulling out of the hole. Note: The new "hydraulic testers" ore unitized teater valves and by·pass valves; the respective functions of these are unchanged.
21
Dow
nloaded from http://onepetro.org/JPT/article-pdf/8/06/21/2237729/spe-589-g.pdf/1 by guest on 27 M
ay 2022
3. The Packer o. To bridge the hole at Q point immediately above (and also below on straddle tests) the zon,e to be tested, thus permitting this zone to be relleve~ of hydrostatic mud pressure when the tool IS
opened and isolating the zone from other formations.
Important auxiliary components of the drill-stem test tool are as follows: the disk valve, the shut-in pressure valve or tool, the formation or bottom choke, the anchor pipe, and the pressure recorders. In addition to these, a circulating valve, a safety joint, and sometimes a set of jars may be included in the test tool or in the drill pipe or tubing string.
FUNCTIONS OF AUXILIARY COMPONENTS IN TYPICAL TEST TOOL STRING
1. The Disk Valve o. To aid in preventing drilling mud from entering the drill pipe while running in. b. To permit the packer to be set firmly and tester valve opened before the tool is finally opened by dropping a go-devil to rupture the disk valve (as used with certain tool assemblies).
2. The Shut-In Pressure Valve or Tool o. To permit the test tool to be closed at the conclusion of the flow period with reduced likelihood of unseating the packer or letting pressure equalize around the packer through the by-pass. b. To aid in preventing drilling mud from entering the drill pipe while pulling out and, conversely, to aid in retaining the formation liquids recov· ered within the pipe.
3. The Formaton or Bottom Choke a. To restrict the volume of formation fluids that flow through the drill pipe to the surface. b. To hold some backpressure under the packer, which reduces the hydrostatic load on the packer, and to reduce the amount of pressure drawdown in the formation. c. To allow quantitative drill-stem test interpretation.
4. The Anchor Pipe a. To support the open-hole wall packer at the desired place in the bore hole. b. To aid in screening out cuttings or junk that might plug the choke or foul other tool components.
5. The Pressure Recorders a. To provide measurements of hydrostatic mud pressure, formation flowing pressures upstrea!," from the formation choke, and formation shut-In or bottom-hole pressure. These pressure measurements are necessary for complete test interpretation and formation evaluation; therefore, the pressure recorders are, in a sense, among the most important components of the tool. b. To provide a graphic record of the proper or improper functioning of the test tool.
6. The Circulating Valve a. To permit test recoveries to be pumped out of the drill pipe by reverse circulation into a pit or tank. b. To provide a means of conditioning the mud in the annul us and thus make testing a safer operation.
7. The Safety Joint a. To provide a means of releasing the drill pipe and tool from a stuck packer or anchor.
8. The Jar a. To increase the possibil ity of freeing (] stuck tool. (The jar used for this purpose is usually a special hydraulic tool designed to deliver impact blows.) b. To facilitate setting the tool for measuring for. motion shut-in pressure when a rotating shut-in pressure valve is not used. (The jar used for this purpose is a simple telescoping slip joint arrangement.)
9. The Surface Control Head a. To permit control of fluid flow from the drill pipe at the surface through means of valves and chokes.
Planning the Test
The Basic Decisions
Detailed consideration must be given to a number of factors in planning a drill-stem test in order to insure that the desired information will be obtained and to increase the probability of a mechanically successful test. Decisions must be made beforehand on the following: ( 1) service company to be employed; (2)
22
amount of hole to test; (3) packer size or sizes; (4) location of packer seat; (5) top and bottom choke sizes; (6) probable length of flowing and shut-in period and use of dual shut-in periods; (7) type of pressure gauges, manner of placement in the tool, and optimum pressure capacity and clock speed; (8) use of, type, and location of circulating sub, safety joint, and jar; (9) use of water cushion and amount; (10) method of handling test production at the surface; and (11) special packer arrangements.
Amount of Hole to Test In most instances, a more conclu
sive test can be obtained by testing the shortest section practical. In thin sands, where it is desired to locate the gas-oil and oil-water contacts, a test zone of 2 to 5 or 10 ft is often used in open hole. Where producing zones of greater thickness are encountered, it may then be feasible to test more hole per test. This is particularly true in long limestone sections where the location of the porous zones may not be known, and it is usually desired to determine the overall fluid content and productivity of a certain interval. If the volume of the hole below the packer is too great, the drilling fluid may fill the pipe to such an extent that a low formation pressure will be insufficient to cause entry of any appreciable quantity of formation fluids against the backpressure. Also, the source of water produced from a long interval is indefinite.
Selection of Packer Size
W'all Packers
The open-hole wall packer does not enjoy the controlled conditions of usage of the hookwall packer; it is frequently required to seal off in plastic formations and in a hole whose diameter is known only approximately. Successful use of rubber in wall packers requires that the stresses be kept low enough that the rubber will act entirely in the elastic or solid phase; that is, it must return to its original shape when the load is taken off. This must be done by keeping the clearance between the packer and the wall of the hole as small as practical, by keeping the axis of the packer parallel to and coincident with the axis of the hole, and by choosing the packer seat in the least plastic formation possible. It is important to have a straight true-to-gauge hole and a sufficiently heavy, rigid anchor pipe.
Rathole testing is employed wh.::re
a core hole, or hole of reduced diameter, is drilled ahead for exploratory purposes. Successful use of conventional double-end wall packers requires a very close fit to the hole size. Because· of this, a reduction in hole size or rathole for the last 300 to 500 ft of hole, including the test zone, permits greater packer clearance while running in and out in the full hole. Ratholing is largely confined to soft formation areas.
It has been found that the ratio of hole size to packer size largely governs the amount of packer compression that will occur at pressure differentials up to 5,000 psi and that leakage or rupture of the rubber element will occur if the ratio of hole size to packer size is such that complete mandrel travel is attained. A differential pressure of 5,000 psi will produce complete compression when ratio of hole size to packer size approaches 1.25; 5,000 psi differential pressure will cause about 50 per cent compression when ratio of hole size to packer size is about 1.08 or 1.10. In the commonly drilled hole sizes, the 1.08 ratio provides a reasonable balance between clearance in true-to-gauge sections of hole and the excess expansion available should the packer seat yield or be washed out.
Somewhat larger clearances can be used with the new "expanding shoe" packers, and in areas where a reduced size hole or rathole need not be used, this type of wall packer has excellent application. These packers were developed in part to facilitate full hole testing by permitting a smaller packer diameter to be used than is feasible with conventional packers.
Selection of Wall Packer Seats Open-hole packer seats should be
chosen in true-gauged sections of hard nonplastic formations. Examination of cores will provide the best basis for selection of packer seats; in the absence of visual core examination, a caliper log will be helpful. Electric logs and sidewall cores may also be of use. When setting packers in the top of sand bodies overlain by soft shale, at least 2 ft of sand should be allowed for the packer seat. If possible, wall packers should not be reset in the same seat on succeeding tests. In fractured formations, use of dual packers (two wall packers run next to each other) is often advisable.
Selection of Choke Size The choice of the bore diameter
of the bottom choke depends upon a
JOURNAL OF PETROLEUM TECHNOLO(;Y
Dow
nloaded from http://onepetro.org/JPT/article-pdf/8/06/21/2237729/spe-589-g.pdf/1 by guest on 27 M
ay 2022

number of variables, the primary considerations being safety, test interpretation, and the possibility of the choke becoming plugged. Generally, the size of the bottom choke should govern the size of the choke used in the control head at the surface; the bottom choke should control the amount of flow and should be small enough in relation to the top choke size that, barring difficulties, excessive pressures will not develop in the drill pipe or tubing at the surface.
If the bottom choke is to be used as a meter in interpreting for gas-oil ratio and productivity, the top choke should not restrict the flow to the extent that the backpressure plus the head due to the recovered liquid on the bottom choke is greater than about 40 to 50 per cent of the upstream pressure on the bottom choke. Under these conditions, the flow is said to be "critical" and is independent of the downstream pressure. When pressure downstream of the bottom choke exceeds about 50 per cent of the upstream pressure, the flow rate will progressively diminish as the drill pipe fills. Under these conditions, the flow is termed "noncritical," and an accurate average rate cannot be determined.
Bottom choke bores ranging from 3/16 to % in. used with top chokes ranging from SIs to I in. are satisfactory for the nonflowing type of test in moderately to highly productive zones and where the top choke exhausts only air or gas. Bottom chokes smaller than 3/16 in. are usually undesirable due to the ease with which they will plug. For the flowing type of test through tubing where the bottom choke is not used as a flowmeter, a 3/16- or %-in. bore bottom choke used with a top choke of about the same bore may prove more feasible. Gas zone tests are sometimes made with bottom chokes ranging from % - to ¥s -in. bore in order to obtain a measurable pressure drawdown. Zones of very low permeability which have very low flowing pressures are frequently tested without chokes; however, this practice is not recommended unless there is sufficient prior experience to indicate that nonrestricted flow is safe.
In some areas drill-stem testing is made very difficult due to the choke or choke screen becoming plugged with sand grains or pieces of shale, no matter how thoroughly the hole is conditioned before the test. One technique of testing under such conditions, where a subsurface adjust-
JUNE, 1956
able choke is not available, is to place the position choke up in the drill pipe string above a suitable amount of water cushion. This slightly reduces the pressure differential across the face of the well bore when the tool is opened and assures that a volume of formation fluid at least equal to the volume of the water cushion will be recovered before the choke plugs.
Length of Test
Flow Period
Generally, it is better practice to test moderately to highly productive zones for a long period with a small bottom choke (3/16 to % in.) and relatively small pressure drawdown than to test for a short period with a large choke (¥s to 1/2 in) and more severe drawdown.
Two factors are of significance in deciding the duration of the flow period: ( 1 ) the length of time for which it is safe to leave the drill pipe undisturbed without danger of sticking, and (2) whether the bottom choke is to be used as a meter in interpreting GOR and productivity, or whether the test is to be flowed to surface tankage and interpretations made by means of surface metering equipment.
The common use in many areas of 20Vz - or 25Vz -minute flow periods for 41h - and 5-in. drill pipe, respectively, is purely an aid toward simplified quantitative test interpretation. For these sizes of drill pipe, the number of feet of liquid recovered during flow periods of these lengths happens also to be the number of barrels per day that the test would produce during 24 hours through the particular size of choke under critical flow conditions. This amount of time, which might be termed as the standard flow period, can be computed for any size of pipe by Eq. 1. Standard flow periods are suited to moderately to highly productive areas where it is not desired to flow the well, large drill pipe is in use, and the several thousand feet of oil or water that can be recovered in the standard time generally will not exert a backpressure on the bottom choke in excess of 50 per cent of the upstream pressure. For such testing, a I-in. bore top choke is often used so as to hold backpressure to a minimum.
Computed pressure profiles indicate that when testing sands of moderate to high permeability, the length of the flow periods ordinarily used,
30 minutes to one hour, has small effect on the amount of pressure drawdown in the sand around the well; and it is truly important only in controlling the amount of recovery at the particular flow rate. The rate of production, as governed by the choice of choke size, has a large effect on the amount of drawdown. Pressure drawdown should be kept moderate in order to reduce the packer load, permit pressure buildup in shorter shut-in periods, and reduce coning and fingering of gas or water.
Shut-In Period
At the conclusion of the flowing period, it is customary to close the test tool on bottom using a rotating shut-in tool. It is highly desirable to obtain a complete buildup of pressure in the test zone to the native formation pressure for the following reasons:
1. The shape of the pressure buildup curve reveals information regarding formation permeability.
2. The formation pressure is required for estimates of productivity and to ascertain whether an adequate (or perhaps excessive) mud weight is being maintained.
The length of the shut-in period required to obtain a complete buildup is primarily dependent upon the formation permeability and secondarily upon the degree of drawdown caused by the flow period. The feasibility of waiting for a complete buildup depends largely upon hole conditions.
If experience has proved that the tool cannot be left shut in long enough, plans may be made to observe a partial buildup both before and after the flow period. This is referred to as a "dual shut-in" test and is described below.
PROCEDURE FOR DUAL SHUT·IN TEST
1. The volume of the hole below the packer is calculated and the displacement of the anchor is subtracted. This gives the volume of the mud only.
2. The test fool assembly, using a hydraulic tester valve, is made up with sufficient drill pipe or tubing placed above the hydraulic tester to accommodate 10 to 15 per cent of the mud volume below the packer. A disk valve is placed in the string at this point.
3. The tool is set and the hydraulic tester opened in the usual manner, but the disk valve go-devil is not dropped until the initial shut-in time has elapsed and a flow period is desired. At the conclusion of the flow period, the rotating shut-in tool is closed and the normal shut-in buildup is taken.
When on bottom and the hydraulic tester opens, the mud pressure below the packer is relieved into the empty drill pipe below the disk valve and the formation is free to produce; however, the presence of the disk valve restricts the amount that the formation can produce and more complete shut-in buildup may be obtained in an equivalent time than can be obtained after the flow period.
Selection of Pressure Recorders No drill-stem test should be run
without two subsurface pressure
23
Dow
nloaded from http://onepetro.org/JPT/article-pdf/8/06/21/2237729/spe-589-g.pdf/1 by guest on 27 M
ay 2022
gauges; if possible, one gauge should measure the pressures upstream or below the bottom choke inside the perforated anchor, and the other should be blanked-off so as to measure pressures outside the perforated anchor. Under this arrangement, the two pressure records should agree exactly unless the holes in the perforated anchor become plugged, in which case the ~lanked-off gauge will trend toward the formation shutin pressure while the inner gauge will reflect the pressure inside the anchor, either atmospheric pressure or that due to the head of fluid recovered before the plugging occurred. If the choke becomes plugged but the anchor pipe does not plug, both gauges should trend toward formation shutin pressure. The backwashing that occurs when the by-pass is opened will usually clear the plugging matter from the perforations and may clear the choke if run under the equalizing valve; proof that plugging occurred cannot always be obtained solely by examining the tool.
The pressure recorders are built in a number of pressure capacities as well as clock speeds. The service company should be informed of the maximum expected pressure and the expected period of time that the tool will be on bottom. The pressure recorder may then be selected, if available, so that the maximum recorded pressure will be approximately twothirds to three-fourths of the maximum pressure capacity of the gauge, and the chart travel during the time on bottom will not cause excessive overlapping of the stylus traces. If the test recovery is to be reversed out with pumps, the pressure capacity of the gauge should be sufficient to record the mud pressure plus circulation pressure.
Location of Auxiliary Tool Components
The circulation tool is frequently run one to three stands of pipe above the tester valve. This permits retention of an uncontaminated sample of formation liquids, if the recovery is reversed out. The jar is placed above and as close to the packer as possible.
Water Cushions With the opening of the test tool,
the pressure on the formation is reduced almost instantaneously from mud pressure of several thousand psi to the initial flowing pressure or sometimes to atmospheric pressure. This flash release of pressure is undesirable for the following reasons: (1) it may cause caving of the for-
24
mation and stick the anchor; (2) it may cause plugging of anchor perforations or the bottom choke, and (3) it contributes to packer failures.
Flui~ cushions or water blankets can be placed in the drill pipe above the test tool to reduce the pressure differential that occurs across the wall of the bore hole and packer as the tool is opened; however, this procedure may make test interpretation difficult, particularly when the recovery is small, because the formation liquids may mix with the water cushion.
It is sometimes advisable to use fluid cushions when testing highpressure gas sands for reasons of safety. The cushion will effect lower surface pressures until it has been produced out of the pipe. Occasionally, water blankets are a necessity on deep tests in order to prevent the drill pipe or tubing from collapsing due to high external mud pressures.
Gas Cushions Natural gas or bottled nitrogen
have been used instead of water to provide an initial reduction in the pressure differential applied to the formation when the tool opens. This is accomplished by pressuring the tubing to the desired amount through the control head just prior to opening the tool. This backpressure is then bled off slowly after opening the tool. Gas cushions have been used to good advantage for drillstem testing during workovers where high-pressure gas is available from a gas-lift system.
Method of Handling Test Production at the Surface
The fluids recovered should be disposed of in the manner which involves least hazard to the drilling rig, surroundings, and to the further progress of the well. Consideration should also be given to the degree of accuracy required in measuring the volume of recovery. If at all possible, the recovered liquids should be reversed out into a tank or pit.
Special Packer Arraugements
Dual Wall Packer Testing
Two wall packers of the same or slightly different size can be run one above the other to give added assurance of obtaining a satisfactory seat. The practice is widely used where there is doubt as to the condition of the packer seat, particularly in fractured formations. To be effective, both packers should be set in sand or hard formations. When set in a hard, competent formation, the lower
pacKel carries the larger load. If the lower packer fails, the upper packer assumes the load.
Straddle Packer Testing
Open-hole straddle testing involves testing a productive interval which may be as much as several thousand feet from bottom. A wall packer is set in a competent seat above and below the interval to be tested so that a selected zone may be isolated for testing through means of a perforated nipple which is placed between the two packers; conventionally, the blank anchor extends to total depth. Use of a straddle packer by-pass tool will permit mud pressure to be equalized above the top packer and below the bottom packer at all times. This arrangement permits leakage of either packer to be detected by watching the mud level in the annulus. It also provides for easier release of the bottom packer. Both packers must withstand approximately the same pressure differen·tial. The blank anchor below the lower packer is not severely loaded as in a conventional test unless the straddle packer by-pass tube is not used and the formation breaks down or filtration processes reduce the volume of mud trapped in the hole under the lower packer. A new development is a sub having dogs that can be caused to wedge into the wall of the bore hole to support the straddle tool.
Three pressure recorders should be used-two for the test zone in the usual fashion and one below the lower packer arranged so as to measure pressure in the zone under the lower packer.
Straddle testing is being applied extensively in the multi-sand formations of Southwest Texas, where usual interval tested is about 30 ft or less and the average distance off bottom is about 200 ft and ranges up to over 1,000 ft. It is being used in drilled rather than cored rathole intervals in wells where logs are run every 500 to 1,000 ft; possibly productive zones for testing are chosen by log and sidewall core interpretation. There has also been extensive application in the East Texas area to permit complete 50- to 90-ft diamond cores to be cut prior to pulling out to test.
Straddle hookwall packer testing inside casing may be employed where there are several perforated intervals and it is desired to test each selectively without setting bridge plugs or squeeze cementing.
JOURNAL OF PETROLEUM TECHNOI.OG\
Dow
nloaded from http://onepetro.org/JPT/article-pdf/8/06/21/2237729/spe-589-g.pdf/1 by guest on 27 M
ay 2022
Performing the Test
Preparing the Hole The hole may have to be reamed
down to reduce the amount of rathole. Generally, 300 to 500 ft of rathole is the maximum that is customarily carried. After reaming, the hole should be washed clean to bottom of the remaining rathole and should then be circulated at least one cycle. In circulating the hole clean, the bit should be positioned at a point above the packer seat; pipe should be lowered occasionally to clear and condition the rathole in the test interval. The trip out to test should not be begun until such time as the tool can be made up, run to bottom, and opened with a minimum of delay or waiting time. Periodic tests of mud weight should be made while circulating so that a reliable value of the hydrostatic pressure can be calculated to check the accuracy of the pressure recorders.
Making Up the Tool After assembly of the open-hole
tool, measurements should be taken to check the packer spacing and to permit the last joint of pipe added to be marked at the point where it should be flush with the rotary when the tool is just touching bottom. This procedure permits the tool to be eased into contact with the bottom of the hole and provides a check on the weight indicator; weight indicator readings alone may lead to difficulties if true bottom has not been reached. A similar procedure should be used for testing inside casing, and the mark should be placed so that the lowest part of the test tool will be the necessary distance above the top perforation so as to permit the surface control head to be conveniently accessible from the derrick floor.
Running In The speed at which the tool can be
run to bottom should be at least 25 per cent slower than usual; a moderate amount of spudding is possible. From time to time while running in, the drill pipe should be checked for leaks by observing whether or not air is flowing from the pipe and by observing the amount of spill-over that occurs as each stand is lowered into the hole. If it becomes necessary to shut down with the tool only part way to bottom, close watch should be kept on the annulus mud level to determine that mud is not entering the pipe through a leaking tool or tool joint.
JUNE, 195()
Opening the Tool Short duration, nonflowing, open
hole tests should not be permitted to exhaust gas or air to atmosphere within the derroick unless it is certain that surface pFessUlles will be negligible; this applies particularly to power rigs. Flow lines should be rigged to the reserve pit and sufficient flexible pipe should be connected to the control head to permit the pipe to be picked up with a minimum of delay to close the tester valve in the event of an emergency. Care should be taken to see that a tool joint will not foul the blowout preventers. Since it may be desired to pump through the drill pipe or tubing in case an open-hole test gets out of control and since the control head may be as much as 30 ft up in the derrick, a surface control head to which the kelly can be connected throughout the test will permit hoisting or pumping to begin with a minimum of difficulty and loss of time. The same precautions apply to tests made inside casing, although the control head is usually accessible for making connections.
All safety rules regarding smoking or open fires should be rigidly enforced dwring the drill-stem test. Explosion-proof safety lights should be dimmed or turned off, while unprotected light bulbs should always be turned off. Power rig engines might best be idled in order that hoisting power will be available without delay, provided the test flow is directed to a pit or tank off the rig floor. .Tust before opening the tool, the annulus should be filled if necessary. Close watch on the annulus mud level should be maintained when the tool is opened; a sudden drop in fluid level indicates that the packer is not sealing. A very slow loss of fluid is not serious since it is usually caused by a loss of mud or filtrate to a fractured or porous zone; however, constant vigil should be maintained throughout the test and the mud level kept in sight at all times.
Before opening the tool, the highpressure rubber hose provided by the service company should be connected from the control head to the gauge manifold on the rig floor; the end of the hose may be held in a bucket of water to allow the increased hlow that will occur when the tool is opened to be detected immediately.
Shut-In Period At the conclusion of the flow pe
riod, the tool is closed by means of the rotating shut-in pressure valve. On gas tests, if the flowing pressure
has been high, it may be desirable to bleed pressure on a small choke while rotating; after rotation has clo&.ed the tool, the flow line may be reconnected and the pressure blown down to the pit or tank,s. During the shut-in period, the formation pressure builds up to its static or maximum value under the packer. Unless the formation is very permeable, this may require an excessive amount of time.
Pulling Out At the conclusion of the shut-in
period, the drill pipe is raised a foot or so while observing the mud level in the annulus. The level may drop sIlghtly when the equalizing valve opens and mud flows into the zone under the packer. After pressure has equalized across the packer, strain may be taken to unseat the packer and start slowly out of the rathole. Once the packer is clear of the rathole, the tool may be pulled out more rapidly. Care should be taken to see that the well is not swabbed in while pulling out; a torn wall packer may bridge even the larger diameter main hole. The annulus should be filled after pulling each thribble of pipe until it is clear that no swabbing is occurring and then at least after each three thribbles or more often, depending on drill pipe size, last casing size, mud weight, and the mud overload pressure being carried. Should the annulus be filled and overflowing continuously, it may not be possible to determine whether the overflow is from the pumps or due to swabbing action. The permissibility of rotating out of the hole depends upon what components are included in the tool string.
Reversing Out Test Recovery When the recovery is oil, removal
by pulling wet stands involves a definite fire hazard since the oil is dumped from each stand onto the floor and cellar as the stands are broken out. In addition, gas pockets within the column of oil may cause heading of the oil from the top of a st-and high up in the derrick. The resulting cold spray can be ignited by causing hot light bulbs to explode, or by blowing onto magnetos and hot exhaust manifolds on power rig engines, or the boilers on steam rigs.
The inclusion in the string of a reverse circulating sub which can be opened to the annulus at the conclusion of the test will permit the oil to be flowed or pumped by reverse circulation to a pit or tank with relative safety, even at night. This is particularly desirable in the case of hook-
Dow
nloaded from http://onepetro.org/JPT/article-pdf/8/06/21/2237729/spe-589-g.pdf/1 by guest on 27 M
ay 2022
wall packer testing inside casing since this type of test is usually conducted for a long enough period to permit the pipe to be entirely filled with formation liquids, and pump pressure can be applied to the annulus while the packer is set with minimum danger of breaking down the formation. Reverse circulation in open hole is less attractive because of this danger, hazard of sticking the pipe, and difficulty in accurate measurement of small-volume recoveries.
When fluid recovery is believed to be large, a suggested procedure for open-hole reversing is indicated below.
PROCEDURE FOR OPEN HOLE REVERSING
1. At conclusion of flowing period, place 500 to 1,000 ft of fresh water of known chloride in the drill pipe.
2. Pull pipe until water is encountered. Check that pump is primed and ready.
3. Open circulation sub and reverse out fresh water and formation liquids by letting mud "U· tube" into pipe; keep the annulus filled. Control flow from pipe with a suitable choke. If blowout preventer must be closed, use as little pump pressure as is necessary, and count pump strokes while formation Iiquid~ are flowing to assist in determining volume; if may be desired to rotate pipe while reversing, if a swivel-type surface control head is available.
4. Pull remaining pipe and remove circulation sub; place a solid-type thread protector or plug in each of the remaining two to five thribbles, as each is pulled, and use a sealed mud saver when breaking out. The purpose of the plugs is to prevent heading of oil from a thribble that has been raised into the derrick.
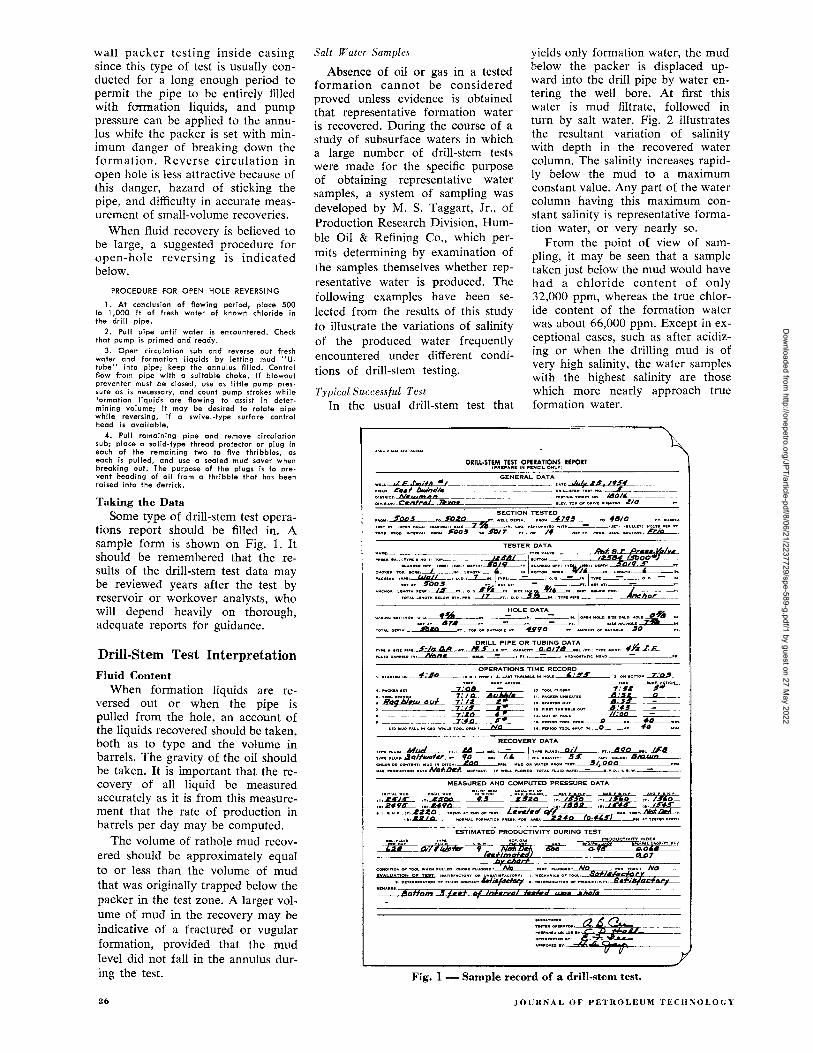
Taking the Data
Some type of drill-stem test operations report should be filled in. A sample form is 5hown on Fig. 1. It should be remembered that the results of the drill-stem test data may be reviewed years after the test by reservoir or workover analysts, who will depend heavily on thorough, adequate reports for guidance.
Drill-Stem Test Interpretation
Fluid Content
When formation liquids are reversed out or when the pipe is pulled from the hole, an account of the liquids recovered should be taken, both as to type and the volume in barrels. The gravity of the oil should be taken. It is important that the recovery of all liquid be measured accurately as it is from this measurement that the rate of production in barrels per day may be computed.
The volume of rathole mud recovered should be approximately equal to or less than the volume of mud that was originally trapped below the packer in the test zone. A larger volume of mud in the recovery may be indicative of a fractured or vugular formation, provided that the mud level did not fall in the annulus during the test.
26
Salt Water Samples
Absence of oil or gas in a tested formation cannot be considered proved unless evidence is obtained that representative formation water is recovered. During the course of a study of subsurface waters in which a large number of drill-stem tests were made for the specific purpose of obtaining representative water samples, a system of sampling was developed by M. S. Taggart, Jr., of Production Research Division, Humble Oil & Refining Co., which permits determining by examination of the samples themselves whether representative water is produced. The following examples have been selected from the results of this study to illustrate the variations of salinity of the produced water frequently encountered under different conditions of drill-stem testing.
Typical Su.ccessfu.l Test In the usual drill-stem test that
yields only formation water, the mud below the packer is displaced upward into the drill pipe by water entering the well bore. At first this water is mud filtrate, followed in turn by salt water. Fig. 2 illustrates the resultant variation of salinity with depth in the recovered water column. The salinity increases rapidly below the mud to a maximum constant value. Any part of the water column having this maximum constant salinity is representative formation water, or very nearly so.
From the point of view of sampling, it may be seen that a sample taken just below the mud would have had a chloride content of only 32,000 ppm, whereas the true chloride content of the formation water was about 66,000 ppm. Except in exceptional cases, such as after acidizing or when the drilling mud is of very high salinity, the water samples with the highest salinity are those which more nearly approach true formation water.
<: .... ' .. 0 .nv' .. o., o. D 9% _IN __ .!'OL~ ... DATA_ ' ... 10 ..... NOI..Il, .,n D"LD HOLC ~," .1lT ... , II.,. ~. - ~. - n .Lin ,,"'THOLC ~'''.
TOT .. L oc..... . A#o n_. ,o~ 0" ""'''OLC''V .990 n., .... O""'T D' ""V .. O\.C $D n
OPERATIONS TIME RECORD -,4~·~So~_,,,.,,.,_.,:t L .... 'V .. "' •• LC'''' .. O\..· "S'8 'o"~rro"~"_
7 :''6z 'O"p""'_" ~~ ~----
.,,,",,,""' .. "00. ~ _-__ '''. OUTD' .. OLI: ~ _-__
..... "'oo.=o~"~"" .. ~.'"
... ~"'~ro~ •• o.'"~".~ ....
MEASURED AND COMPUTED PRESSURE DATA
ESTIMATED PRODUCTIVITY DURING TEST o P~OOUCTIVITY INDEX
uN~ ~~+~. ~ -m~---:i!fjli!"~~{
p"cltqr+ _
;;~~:;':N 7. ;;;;".:::::,:;:": ~.:::~~: :;::;.:~::~:~.;;;,r:;q.~ "' ..... " •• ~. DllTl" .. '''' ... VIO" 0 .. "L"'D <:OH,.",.&"'SfIlCMl::f ~. on'[I,,,,,,,,,,,,o .. _ ~00U<:V1VIVV '/ii+JlijiiCb";t
Bottom -' fcct of 10re ,.",,/ mile' u.ty .. hpJ«
n.,-eIlONII ... VOII, ..... ~m ~ ~.~"'''CO OH.~. = I IHftIl",OCO.V:
Fig. I - Sample record of a drill-stem test.
JOIJRNAL OF PETROLEUM TECID,OLO(;Y
Dow
nloaded from http://onepetro.org/JPT/article-pdf/8/06/21/2237729/spe-589-g.pdf/1 by guest on 27 M
ay 2022
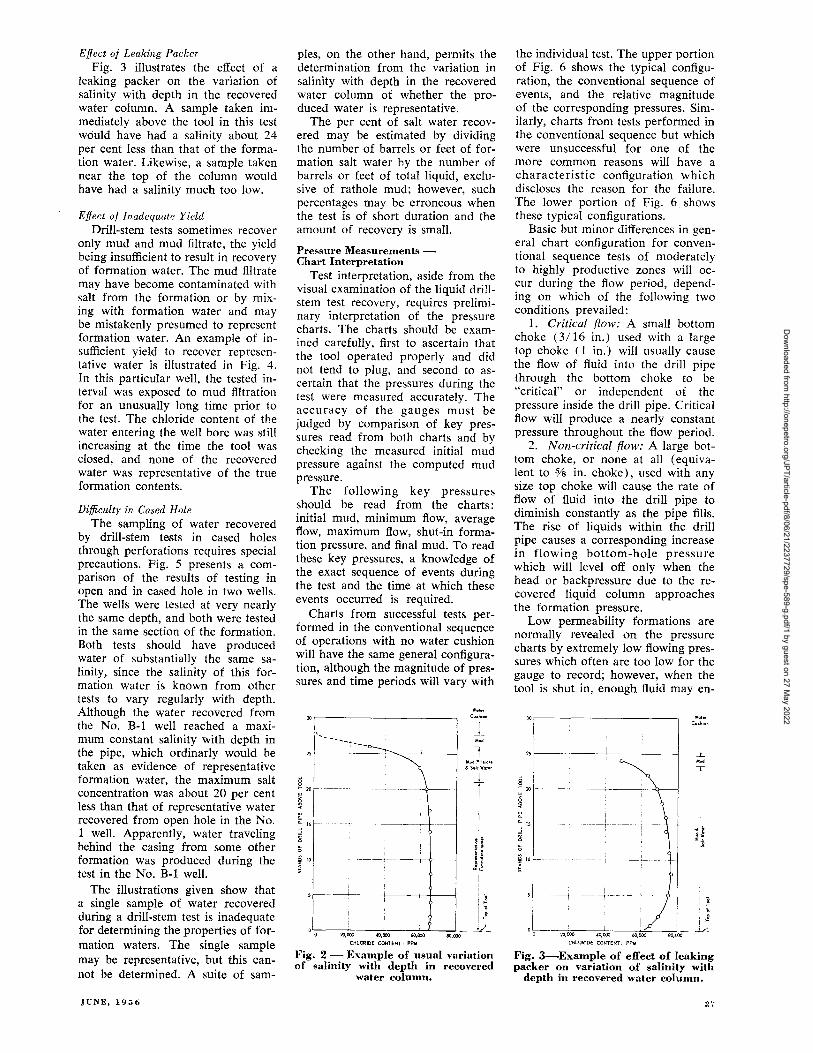
Effect 0/ Leaking Packer Fig. 3 illustrates the effect of a
leaking packer on the variation of salinity with depth in the recovered water column. A sample taken immediately above the tool in this test would have had a salinity about 24 per cent less than that of the formation water. Likewise, a sample taken near the top of the column would have had a salinity much too low.
Effect of Inadequate Yield
Drill-stem tests sometimes recover only mud and mud filtrate, the yield being insufficient to result in recovery of formation water. The mud flltrate may have become contaminated with salt from the formation or by mixing with formation water and m<l.y be mistakenly presumed to represent formation water. An example of insufficient yield to recover representative water is illustrated in Fig. 4. In this particular well, the tested interval was exposed to mud flltration for an unusually long time prior to the test. The chloride content of the water entering the well bore was still increasing at the time the tool was closed, and none of the recovered water was representative of the true formation contents.
Difficulty in Cased Hole
The sampling of water recovered by drill-stem te<;ts in cased holes through perforations requires special precautions. Fig. 5 presents a comparison of the results of testing in open and in cased hole in two wells. The wells were tested at very nearly the same depth, and both were tested in the same section of the formation. Both tests should have produced water of substantially the same salinity, since the salinity of this formation water is known from other tests to vary regularly with depth. Although the water recovered from the No. B-1 well reached a maximum constant salinity with depth in the pipe, which ordinarly would he taken as evidence of representative formation water, the maximum saIt concentration was about 20 per cent less than that of representative water recovered from open hole in the No. 1 well. Apparently, water traveling behind the casing from some other formation was produced during the test in the No. B-1 well.
The illustrations given show that a single sample of water recovered during a drill-stem test is inadequate for determining the properties of formation waters. The single sample may be representative, but this cannot be determined. A suite of sam-
JUNE, 1956
pIes, on the other hand, permits the determination from the variation in salinity with depth in the recovered water column of whether the produced water is representative.
The per cent of salt water recovered may be estimated by dividing the number of barrels or feet of formation salt water by the number of barrels or feet of total liquid, exclusive of rathole mud; however, such percentages may be erroneous when the test is of short duration and the amount of recovery is small.
Pressure Measurements -Chart Interpretation
Test interpretation, aside from the visual examination of the liquid drillstem test recovery, requires preliminary interpretation of the pressure charts. The charts should be examined carefully, first to ascertain that the tool operated properly and did not tend to plug, and second to ascertain that the pressures during the test were measured accurately. The accuracy of the gauges must be judged by comparison of key pressures read from both charts and by checking the measured initial mud pressure against the computed mud pressure.
The following key pressures should be read from the charts: initial mud, minimum flow, average flow, maximum flow, shut-in formation pressure, and final mud. To read these key pressures, a knowledge of the exact sequence of events during the test and the time at which these events occurred is required.
Charts from successful tests performed in the conventional sequence of operations with no water cushion will have the same general configuration, although the magnitude of pressures and time periods will vary with
'11'", ••
"r----,---------------, c .... "'on i
-1_
25 - --.------~- T Mud Fdt''''e & Soh w"' ••
-+-! I
8 "":xl ----------~--"---___'_<}_--__j
~ I
a:: 15 I I
~ ~ g .. i! 11 i
~ I' ~ ~---=-=-____::_l_:c_____,,_L_L--------' _ 17_
",000 CHLORIDE CONTENT: PPM
Fig. 2 -- Example of usual variation of salinity with depth in recovered
water column.
the individual test. The upper portion of Fig. 6 shows the typical configuration, the conventional sequence of events, and the relative magnitude of the corresponding pressures. Similarly, charts from tests performed in the conventional sequence but which were unsuccessful for one of the more common reasons will have a characteristic configuration which discloses the reason for the failure. The lower portion of Fig. 6 shows these typical configurations.
Basic but minor differences in general chart configuration for conventional sequence tests of moderately to highly productive zones will occur during the flow period, depending on which of the following two conditions prevailed:
1. Critical flow: A small bottom choke (3/ 16 in.) used with a large top choke (1 in.) will usually cause the flow of fluid into the drill pipe through the bottom choke to be "critical" or independent of the pressure inside the drill pipe. Critical flow will produce a nearly constant pressure throughout the flow period.
2. Non-critical flow: A large bottom choke, or none at all (equivalent to % in. choke), used with any size top choke will cause the rate of flow of fluid into the drill pipe to diminish constantly as the pipe fills. The rise of liquids within the drill pipe causes a corresponding increase in flowing bottom-hole pressure which will level off only when the head or backpressure due to the recovered liquid column approaches the formation pressure.
Low permeability formations are normally revealed on the pressure charts by extremely low flowing pressures which often are too low for the gauge to record; however, when the tool is shut in, enough fluid may en-
30
" 8 ~20
~ ~
~ 15 --
iii ~
~ 10 -
00
CHLORIDE CONTENT, PPM
Fig. 3--Example of effect of leaking packer on variation of salinity with
depth in recovered water column:.
Dow
nloaded from http://onepetro.org/JPT/article-pdf/8/06/21/2237729/spe-589-g.pdf/1 by guest on 27 M
ay 2022
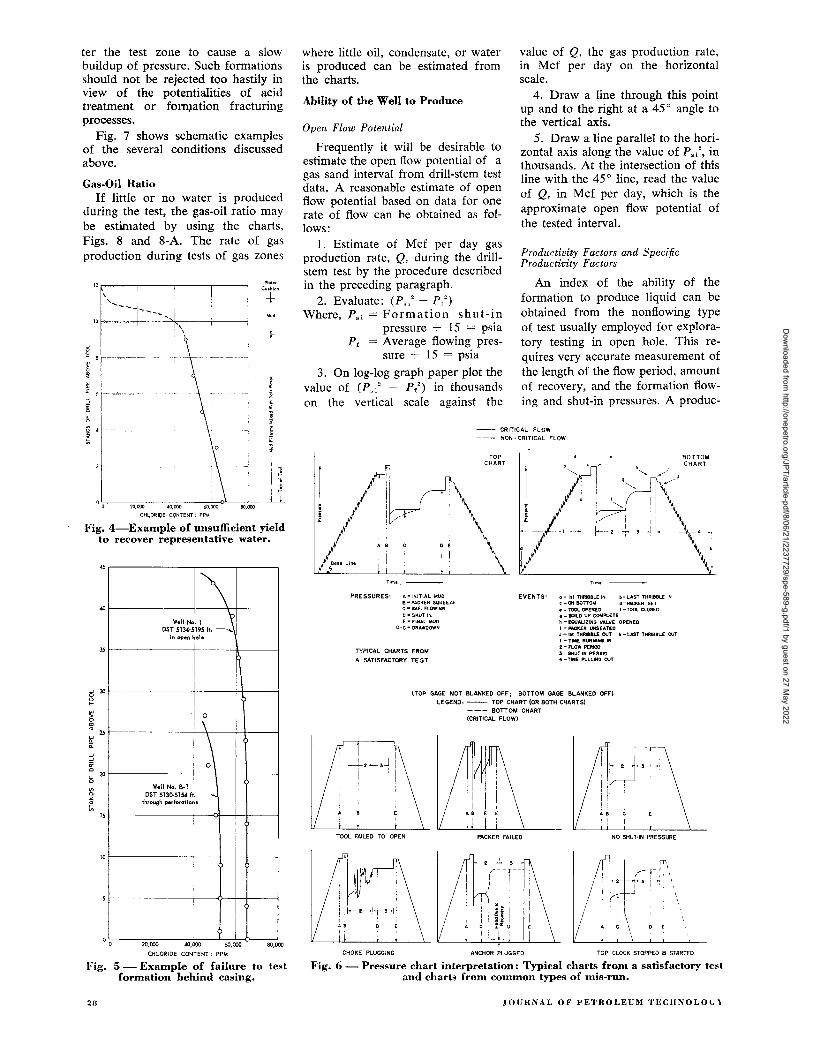
ter the test zone to cause a slow buildup of pressure. Such formations should not be rejected too hastily in view of the potentialities of acid treatment or fo~ation fracturing processes.
Fig. 7 shows schematic examples of the several conditions discussed above.
Gas-Oil Ratio If little or no water is produced
during the test, the gas-oil ratio may be estimated by using the charts, Figs. 8 and 8-A. The rate of gas production during tests of gas zones
12r----,-------r-------,-------, e ... n,on \
' ..... ---i-___: . 10 -- -",-.. c-=-t-- --+--+---
, ,
+
+
CHLORIDE CONTENT: PPM
Fig. 4-Example of unsufficient yield to recover representative water.
45
'" I j\ I
Well No. 1 ~ DST 5134·5195 ft. --...
35
in open ~ol.
I <5 JO
g ~ g '" 2S ~ a: -' -' ii' 0
I 0 !
\
~ 20 "-
0 I
l'i z
~ 15
Well No. B-1 DST 513()'5154 ft. - .....
thrjugh perforct,oi'
! I
!
! 10
,
i
I i i
I j I
20,000 40,000 60,000 so,ooo OILORIDE CONTENT: PPM
Fig. 5 - Example of failure to test formation behind casing.
28
where little oil, condensate, or water is produced can be estimated from the charts.
Ability of the Well to Produce
Open Flow Potential
Frequently it will be desirable to estimate the open flow potential of a gas sand interval from drill-stem test data. A reasonable estimate of open flow potential based on data for one rate of flow can be obtained as follows:
1. Estimate of Mcf per day gas production rate, Q, during the drillstem test by the procedure described in the preceding paragraph.
2. Evaluate: (Psi2
- P/) Where, Psi = Formation shut-in
pressure + 15 = psia P r = Average flowing pres
sure + 15 = psia
3. On log-log graph paper plot the value of (P'i 2
- P/) in thousands on the vertical scale against the
value of Q, the gas production rate, in Mcf per day on the horizontal scale,
4. Draw a line through this point up and to the right at a 45° angle to the vertical axis.
5. Draw a line parallel to the horizontal axis along the value of Ps," in thousands. At the intersection of this line with the 45° line, read the value of Q, in Mcf per day, which is the approximate open flow potential of the tested interval.
Productivity Factors and Specific Productivity Factors
An index of the ability of the formation to produce liquid can be obtained from the nonflowing type of test usually employed for exploratory testing in open hole. This requires very accurate measurement of the length of the flow period, amount of recovery, and the formation flowing and shut-in pressures. A produc-
-- CRITICAL FLOW
TIm.
PRESSURES: A-tNlTlAL MUD 8 • PACKER SQUEEZE C - AVE. FLOWING O-SHUlIN E- FINAL MUD
O-c - ORAWOOWN
TYPICAL CHARTS FROM
A SATISFACTORY TE ST
- -- NON· CRITICAL FLOW
EVENTS' 0 -I.t THRl88LE IN b-LAST THRI88LE IN e -ON BOTTOM d-PJI,CI(£R SET • - TOOL OPfNEO f -TOOl CLOSEO 1- BUlLO UP COMPUTE tI - EQUALIZING VAL.VE OPENED I - MQ(ER UNSEATED J - 1st THRUL.E OUT k - LAST THAl88LE OVT I - nWE RUNNINe IN 2- FLOW PERIOD 5 - SHUT IN PfRIOO 4 - TIME PULLING OUT
(TOP GAGE NOT BLANKED OFF. BOTTOM GAGE BLANKED OFF)
LEGEND: -- TOP CHART (OR 80TH CHARTS)
--- BOTTOM CHART (CRITICAL FLOW)
PACKER FAIL£D
CHOKE PLUGGING ANCHOR PLUGGED
NO SHUT-IN PRESSURE
1rt. ,/_TJI\
" i'+-! \ I ~ \ . , ,
i ' I \
. ' \ A C \ 0 E
\
TOP CLOCK STOPPED I} STARTED
Fig. 6 - Pressure chart interpretation: Typical charts from a satisfactory test and charts from common types of mis-run.
JOURNAL OF PETROLEUM TECIlNOLOt;)
Dow
nloaded from http://onepetro.org/JPT/article-pdf/8/06/21/2237729/spe-589-g.pdf/1 by guest on 27 M
ay 2022
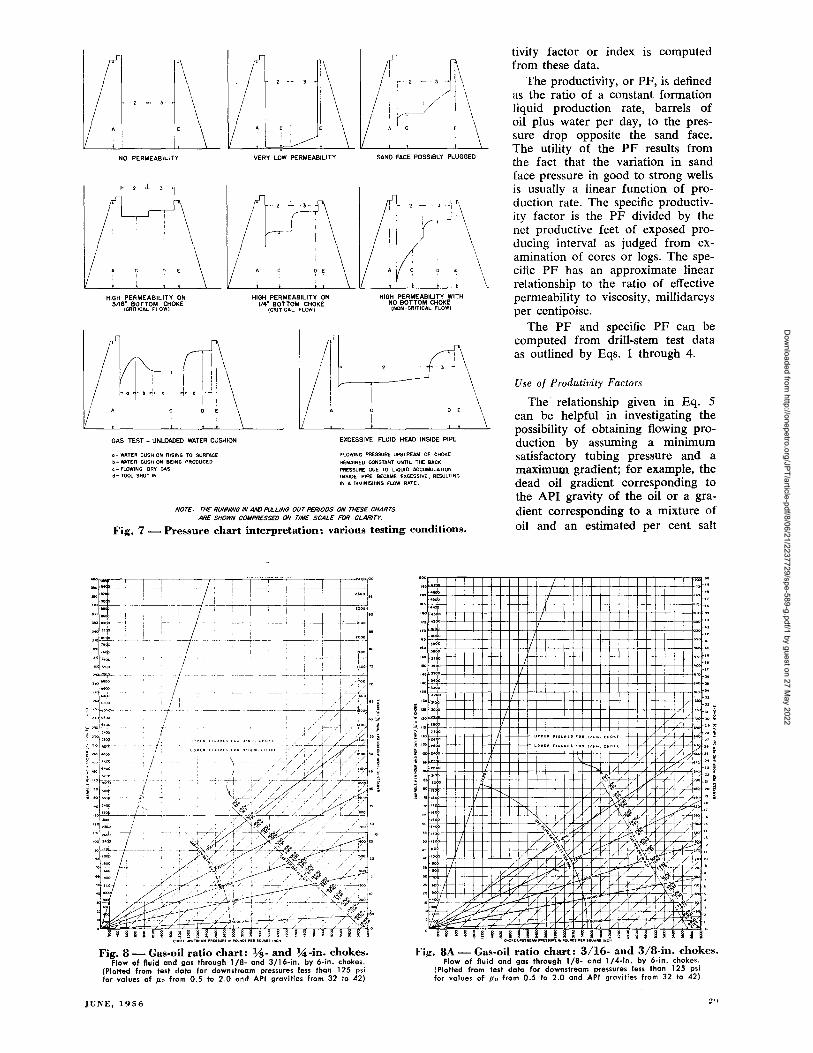
2- - 3
NO PERMEABILITY
HI-GH PERMEABILITY ON 3116- BOTTOM CHOKE
(CRtlICAL FLOW)
GAS TEST - UNLOADED WATER CUSHION
0- WATER CUSHION RISING TO SURFACE b- WATER CUSHION BEING PROOUCED
c- FLOWING DRY GAS d- TOOL SHUT IN
VERY LOW PERMEABILITY
HIGH PERMEABILITY ON 1/4- BOtTOM CHOKE
(CRITICAL FLOW)
SAND FACE POSSIBLY PLUGGED
HIGH PERMEABILIty WITH NO BOTTOM CHOKE
(NON-CRITICAL FLOW)
- 2 , -
DE
EXCESSIVE FLUID HEAD INSIDE PIPE
FLOWING PRESSURE UPSTREAM OF CHOKE
REMAINED CONSTANT UNTIL THE BACK
PRESSURE DUE TO LIQUID ACCUMULATION INSIDE PIPE BECAME EXCESSIVE, RESULTING IN A DIMINISHING FLOW RATE.
Nor€: rH€ RUNNING IN AAO PULLING our PERIODS ON rH€SE CHARrS ARE SHOWN COMPRESSED ON riME SCALE FOR CLARlrr.
Fig. 7 - Pressure chart interpretation: various testing conditions.
tivity factor or index is computed from these data.
The productivity, or PF, is defined as the ratio of a constant formation liquid production rate, barrels of oil plus water per day, to the pressure drop opposite the sand face. The utility of the PF results from the fact that the variation in sand face pressure in good to strong wells is usually a linear function of production rate. The specific productivity factor is the PF divided by the net productive feet of exposed producing interval as judged from examination of cores or logs. The specific PF has an approximate linear relationship to the ratio of effective permeability to viscosity, millidarcys per centipoise.
The PF and specific PF can be computed from drill-stem test data as outlined by Eqs. 1 through 4.
Use of Produtivity Factors
The relationship given in Eq_ 5 can be helpful in investigating the possibility of obtaining flowing production by assuming a minimum satisfactory tubing pressure and a maximum gradient; for example, the dead oil gradient corresponding to the API gravity of the oil or a gradient corresponding to a mixture of oil and an estimated per cent salt
,= ~ ,,~
.. ," .. 'O~ .. .. . > .. ' ,~ .. I" "
" Ift.o "
'" " .' '" ",+H++-H--f1-H+f-1H--+H++-H--+H+---frH
Fig. 8 - Gas-oil ratio chart: ¥s- and *-in. chokes. Flow of fluid and gas through 1/8- and 3/16-in. by 6-in. chokes.
(Plotted from test data for downstream pressures less than 125 psi for values of /10 from 0.5 to 2.0 and API gravities from 32 to 42)
JUNE, 1956
~
, r'~ " "
" I .. 0
,.
:~: .~.Jo "oF'~'I;-' +-H+++-A--+++UP~E. FI(lUR{S FOR 1I4'~, CHOkE
:: :+++~t~f=-1-~t+~t+'=-t---t"-'t-'"-1'-""+'-"H'-+O'-'t-"---t"'-,"+O-"H4/+·l--rH4J< V
Fig. 8A - Gas-oil ratio chart: 3/16- and 3/8·in. chokes. Flow of fluid and gao through 1/8- and 1/4-in. by 6-in. chokes.
(Plotted from fest data for downstream pressures less than 125 psi for values of /Lo from 0.5 to 2.0 and API gravities from 32 to 42)
Dow
nloaded from http://onepetro.org/JPT/article-pdf/8/06/21/2237729/spe-589-g.pdf/1 by guest on 27 M
ay 2022
water. If substantial production is indicated by this method, flowing production is probable since the actual flowing gradient will be reduced by dissolved or free gas.
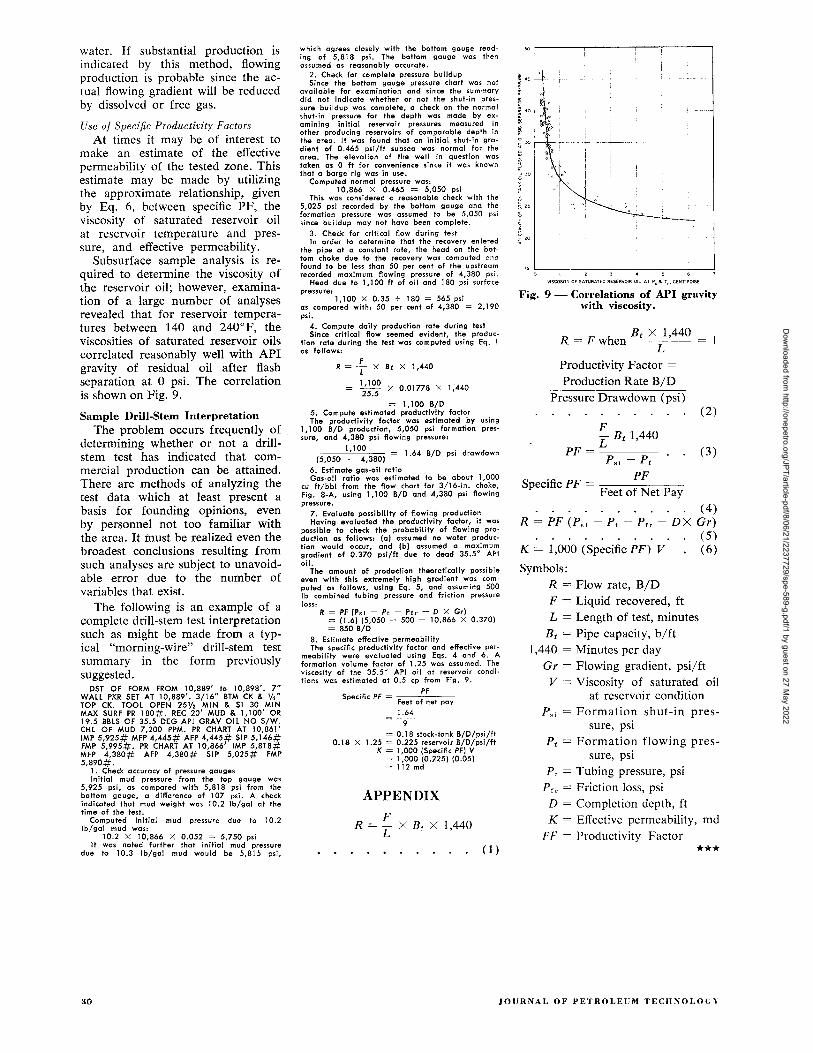
Use of Specific Productivity Factors At times it may be of interest to
make an estimate of the effective permeability of the tested zone. This estimate may be made by utilizing the approximate relationship, given by Eq. 6, between specific PF, the viscosity of saturated reservoir oil at reservoir temperature and pressure, and effective permeability.
Subsurface sample analysis is required to determine the viscosity of the reservoir oil; however, examination of a large number of analyses revealed that for reservoir temperatures between 140 and 240°F, the viscosities of saturated reservoir oils correlated reasonably well with API gravity of residual oil after flash separation at 0 psi. The correlation is shown on Fig. 9.
Sample Drill-Stem Interpretation The problem occurs frequently of
determining whether or not a drillstem test has indicated that commercial production can be attained. There are methods of analyzing the test data which at least present a basis for founding opinions, even by personnel not too familiar with the area. It must be realized even the broadest conclusions resulting from such analyses are subject to unavoidable error due to the number of variables that exist.
The following is an example of a complete drill-stem test interpretation such as might be made from a typical "morning-wire" drill-stem test summary in the form previously suggested.
DST OF FORM FROM 10,889' 10 10,898'. 7" WAll PKR SET AT 10,889'. 3/16" BTM CK & '/" TOP CK. TOOL OPEN 25V, MIN & SI 30 MIN MAX SURF PR 180#. REC 20' MUD & 1,100' OR 19.5 BBlS OF 35.5 DEG API GRAY OIL NO S/W. CHl OF MUD 7,200 PPM. PR CHART AT 10,861' IMP 5,925# MFP 4,445# AFP 4,445# SIP 5,146# FMP 5,995#. PR CHART AT 10,866' IMP 5,818# MFP 4,380# AFP 4,380# SI P 5,025# FMP 5,890#.
1. Check accuracy of pressure gauges Initial mud pressure from the top gauge WQS
5,925 psi, as compared with 5,818 psi from the bottom gauge, a difference of 107 psi. A check indicated that mud weight was 10.2 Ib/gal at the time of the test.
Computed initial mud pressure due to 10.2 Ib/gol mud was:
10.2 X 10,866 X 0.052 = 5,750 psi It was noted further that initial mud pressure
due 10 10.3 Ib/gal mud would be 5,815 psi,
30
which agrees closely with the bottom gauge reading of 5,818 psi. The bottom gauge was then assumed as reasonably accurate.
2. Check for complete pr~ssure buildup Since the bottom gauge pressure chart was nof
available for examination and since the summary did not indicate whether or not the shut-in pressure buildup was complete, a check on the normal shut-in pressure for the depth was made by examining initial reservoir pressures measured in other producing reservoirs of comparable depth in the area. It was found that an initial shut-in gradient of 0.465 psi/ft subsea was normal for the area. The elevation of the well in question was taken as 0 ft for convenience since it was known that a borge rig was in use.
Computed normal pressure was: 10,866 X 0.465 = 5,050 psi
This was considered a reasonable check with the 5,025 psi recorded by the bottom gauge and the formation pressure was assumed to be 5,050 psi since buildup may not have been complete.
3. Check for critical flow during test In order to determine that the recovery entered
the pipe at a constant rate, the head on the bottom choke due to the recovery was computed and found to be less than 50 per cent of the upstream recorded maximum flowing pressure of 4,380 psi.
Head due to 1,100 ft of oil and 180 psi surface pressure:
1,100 X 0.35 + 180 = 565 psi as compared with: 50 per cent of 4,380 = 2,190 psi.
4. Compute daily production rate during test Since critical flow seemed evident, the produc
tion rate during the test was computed using Eq. 1 0$ follows:
F R = T X 8f X 1,440
= 1,100 X 0.01778 X 1;440 25.5
= 1,100 B/D 5. Compute estimated productivity factor The productivity factor was estimated by using
1,100 BID production, 5,050 psi formation pressure, and 4,380 psi flowing pressure:
1,100 4 /D . d d (5,050 _ 4,380) = 1.6 B pSI raw own
6. Estimate gas-oil ratio Gas-oil ratio was estimated to be about 1,000
cu II/bbl Irom Ihe flow chari lor 3/16·in. choke, Fig. 8·A, using 1,100 B/D and 4,380 psi flowing pressure.
7. Evaluate possibility of flowi.ng production Having evaluated the productivity factor, it was
possible to check the probability of flowing production as follows: {a} assumed no water production would occur, and (b) assumed a maximum gradienl 01 0.370 psi/It due 10 dead 35.5° API oil.
The amount of production theoretically possible even with this extremely high gradient was ,omputed as follows, using Eq. 5, and assuming 500 Ib combined tubing pressure and friction pressure loss:
R = PF (P" - p, - PfT - D X Gr) = (1.6) (5,050 - 500 - 10,866 X 0.370) = 850 B/D
8. Estimate effective permeability The specific productivity factor and effective per
meability were evaluated using Eqs. 4 and 6. A formation volume factor of 1.25 was assumed. The viscosity of the 35.5° API oil at reservoir conditions was estimated at 0.5 cp from Fig. 9.
PF Speci fie PF = Feet of net pay
1.64 9
= 0.18 slock·lank B/D/psi/It 0.18 X 1.25 = 0.225 reservoir B/D/psi/It
K = 1,000 (Specific PF) V
R
= 1,000 (0.225) (0.05) = 112 md
APPENDIX
F X Bf X 1,440
L (1)
--- -+ -_.-
VISCOSITY OF SATURATEO RESERVOIR OIL AT Po&. T,. CENTIPOISE
Fig. 9 - Correlations of API gravity with viscosity.
R = F when Bf X 1,440 L
Productivity Factor =
Production Rate BID Pressure Drawdown (psi)
F (2)
L Bf 1,440 PF = (3)
P,j - P f
S 'fi PF pecl c PF = ------Feet of Net Pay
(4) R PF (P" - P t - P f ,. - DX Gr)
(5) K = 1,000 (Specific PF) V (6)
Symbols: R = Flow rate, BID F = Liquid recovered, ft L = Length of test, minutes
Bf = Pipe capacity, blft 1,440 = Minutes per day
Gr = Flowing gradient, psi/ft V
P"
Viscosity of saturated oil at reservoir condition
Formation shut-in pres-sure, psi
Pf Formation flowing pres-sure, psi
P t = Tubing pressure, psi P fr = Friction loss, psi D = Completion depth, ft K Effective permeability, md
PF Productivity Factor
***
JOURNAL OF PETROLEUM TECHNOLO(;\
Dow
nloaded from http://onepetro.org/JPT/article-pdf/8/06/21/2237729/spe-589-g.pdf/1 by guest on 27 M
ay 2022