A Restocking Tour Model for the Estimation of OD Freight Vehicle in Urban Areas
10
Available online at www.sciencedirect.com 1877–0428 © 2011 Published by Elsevier Ltd. Selection and/or peer-review under responsibility of the Organizing Committee doi:10.1016/j.sbspro.2011.08.019 Procedia Social and Behavioral Sciences 20 (2011) 140–149 14 th EWGT Meeting & 26 th MEC & 1 st RH A Restocking Tour Model for the Estimation of O-D Freight Vehicle in Urban Areas Agostino Nuzzolo a , Umberto Crisalli a and Antonio Comi a,* a “Tor Vergata” University of Rome, viale del Politecnico 1, 00133 Rome, Italy Abstract This paper presents some calibration developments of a system of models for the simulation of freight restocking journeys within urban areas. The model system allows us to define freight vehicle Origin-Destination (O-D) matrices. The journeys for restocking urban retail activities are modelled through the definition of the trip-chain order and the choice of the delivery location. The modelling system has been calibrated and validated on a dataset of more than 500 truck driver interviews carried out in the city centre of Rome. © 2011 Published by Elsevier Ltd. Selection and/or peer-review under responsibility of the Organizing Committee. Keywords: urban freight transport, freight demand, restocking, trip-chain order, delivery location 1. Introduction In recent years, there is a growing interest in the concepts of sustainable development and, then, on sustainable transport. Urban activities are accompanied by large movements of freight characterised by delivery trucks moving among distribution centres, warehouses, and retailer activities. The increasing traffic in town and city centres has a strong impact on sustainable development. Congestion as well as air and noise pollution is getting worse year by year. Urban traffic is responsible for 40% of CO 2 emissions and 70% of other pollutants arising from road transport. The significance of urban freight on these unsustainable impacts compared to passenger transport is growing. Although freight transport operations in cities represent ranges from 10 to 18% of road traffic, it accounts for 40% of air pollution and noise emissions. This is a common problem for all European cities even though they are different regarding geographical, historical and cultural circumstances (Lindholm and Behrends, 2010). Traditionally, the planner interest in urban planning is related to the estimation of future transportation demand which, together with network (supply) analyses, provide the basis for decisions pertaining future transportation investments. For this reason, the mathematical models for urban freight transport play a key-role as they allow us to estimate and evaluate performances and impacts generated by urban freight measures that can be implemented in * corresponding author: Antonio Comi, Tel.: +39 06 7259 7059; fax: +39 06 7259 7053. e-mail address: [email protected].
Transcript of A Restocking Tour Model for the Estimation of OD Freight Vehicle in Urban Areas

Available online at www.sciencedirect.com
1877–0428 © 2011 Published by Elsevier Ltd. Selection and/or peer-review under responsibility of the Organizing Committeedoi:10.1016/j.sbspro.2011.08.019
Procedia Social and Behavioral Sciences 20 (2011) 140–149
14th EWGT Meeting & 26th MEC & 1st RH
A Restocking Tour Model for the Estimation of O-D Freight Vehicle in Urban Areas
Agostino Nuzzoloa, Umberto Crisallia and Antonio Comia,* a “Tor Vergata” University of Rome, viale del Politecnico 1, 00133 Rome, Italy
Abstract
This paper presents some calibration developments of a system of models for the simulation of freight restocking journeys within urban areas. The model system allows us to define freight vehicle Origin-Destination (O-D) matrices. The journeys for restocking urban retail activities are modelled through the definition of the trip-chain order and the choice of the delivery location. The modelling system has been calibrated and validated on a dataset of more than 500 truck driver interviews carried out in the city centre of Rome. © 2011 Published by Elsevier Ltd. Selection and/or peer-review under responsibility of the Organizing Committee.
Keywords: urban freight transport, freight demand, restocking, trip-chain order, delivery location
1. Introduction
In recent years, there is a growing interest in the concepts of sustainable development and, then, on sustainable transport. Urban activities are accompanied by large movements of freight characterised by delivery trucks moving among distribution centres, warehouses, and retailer activities. The increasing traffic in town and city centres has a strong impact on sustainable development. Congestion as well as air and noise pollution is getting worse year by year. Urban traffic is responsible for 40% of CO2 emissions and 70% of other pollutants arising from road transport. The significance of urban freight on these unsustainable impacts compared to passenger transport is growing. Although freight transport operations in cities represent ranges from 10 to 18% of road traffic, it accounts for 40% of air pollution and noise emissions. This is a common problem for all European cities even though they are different regarding geographical, historical and cultural circumstances (Lindholm and Behrends, 2010).
Traditionally, the planner interest in urban planning is related to the estimation of future transportation demand which, together with network (supply) analyses, provide the basis for decisions pertaining future transportation investments. For this reason, the mathematical models for urban freight transport play a key-role as they allow us to estimate and evaluate performances and impacts generated by urban freight measures that can be implemented in
* corresponding author: Antonio Comi, Tel.: +39 06 7259 7059; fax: +39 06 7259 7053. e-mail address: [email protected].

Agostino Nuzzolo et al. / Procedia Social and Behavioral Sciences 20 (2011) 140–149 141
order to make city more sustainable. The literature reports models for the definition of Origin-Destination (O-D) flows in terms of quantity or deliveries or vehicles (Holguin-Veras and Patil, 2008; Nuzzolo et al., 2009; Russo and Comi, 2010). All the proposed approaches present some advantages but also some limits if they want to be used within an ex-ante assessment methodology (Russo and Comi, 2011). For example, the models developed to obtain the O-D quantity flows allows us to capture the mechanisms underlying the generation of freight transport demand, but they fail in the simulation of the restocking process; those related to O-D delivery flows allow us to easily identify the movements to each economic activity (origin and/or destination) within a study area, as well as allowing us to have a direct connection between producer and transport operator (i.e. to follow the decisional and logistic process of restocking), but they do not consider the demand generation mechanism and they fail in the definition of delivery journey (i.e. tour/trip-chain or round trip). Finally, the models that allow to obtain the O-D vehicle/truck flows have the advantage of directly giving the input for traffic assignment models and ease of data gathering (e.g. automatic traffic counts), which facilitates the calibration and validation, but they are not able to account properly for changes underlying demand generation and in the definition of delivery journey.
In order to solve these limits, Nuzzolo et al. (2009) have proposed a general modelling architecture that allows us to simulate freight transport demand at urban scale combining the advantages of all previous recalled approaches. The model architecture is made of different steps approaching problems related to: quantity O-D flows, service-type O-D flows, delivery O-D flows, delivery O-D flows per time slice, delivery O-D flows per vehicle type. Thus, this model allows us to estimate the O-D delivery flows considering the dimension choices that can be influenced by the implementation of city logistics measures. Consequently, once obtained these flows, the next step is the estimation of vehicle O-D flows to be assigned to the urban network in order to obtain link flows. For this scope, the restocking journey definition is detailed.
Aiming at reproducing the restocking process, the modeller should consider that the restocker knows the total number of deliveries for each destination, as well as that the deliveries subjected to some constraints, such as the number and the type of available vehicles and the time windows for each customer to be restocked. Thus, the decision-maker organizes the restocking journey for each available vehicle optimizing the total perceived costs. This disaggregate process is generally approached through operative research methods that are suitable to be used for operative optimization of “single” restockers. The planner point of view is quite different as he/she looks for the “system” optimization by simulating the behaviour of decision-makers (e.g. retailer, wholesaler and producer) in an aggregate way, aiming at capturing the underlying decision-making process which generates vehicle operations and, hence, freight tours in urban and metropolitan areas.
Given the complexity of representing the restocking process, the estimation of vehicle O-D matrices from given quantity/delivery O-D matrices is quite complex, and the literature only reports some applications to test cases (Raothanachonkun et al., 2007; Hunt and Stefan, 2007; Wang and Holguin-Veras, 2008) or to real cases under strong assumptions (Nuzzolo et al., 2010). The former studies propose to obtain the number of stops or deliveries per journey by an incremental growth for which, at each stop, the option to come back home (warehouse) is evaluated. This approach implies relevant approximations in some real cases, especially when restockers behave planning journeys with a pre-fixed number of stops. Referring to the real case experiences, Nuzzolo et al. (2010) propose to obtain the vehicle O-D matrices by using a particular zoning of the study area for which, when a zone is served by a tour, all deliveries are done in the same traffic zone (average quantity approach). This assumption is based on some survey results that pointed out the restocking strategy for which decision-makers organize tours trying to serve all customers located in the nearby (e.g. in Italy the zip code is used).
In order to overcome these assumptions and to take into account the pre-trip definition (i.e. before starting the journey) of the number of stops or deliveries for restocking journeys, this paper proposes a class of tour-based models, which allow us to obtain the vehicle O-D matrices from given delivery O-D matrices. The tour-based approach aims at reproducing the choice structure of freight transport by the simulation of the dependences among successive trips of the same journey, which implies that each destination is chosen depending on the previous and the next destinations. For this reason, aiming at simulating the restocking journeys, the proposed class of models investigates the definition of the trip-chain order and the choice of the delivery location. In the following, the model specified for estimating the O-D matrices in vehicles is detailed (section 2). The section 3 presents the calibration results on the basis of more than 500 truck driver interviews, carried out in the city of Rome. Finally, in the section 4 some conclusions are given.
142 Agostino Nuzzolo et al. / Procedia Social and Behavioral Sciences 20 (2011) 140–149
2. Model specification
The reader should consider that restocking deliveries are usually planned by journeys made of multiple trips among stops (i.e. where deliveries are delivered), and trips of a given journey are defined according to logistic decisions. In order to simulate the existing dependences among successive trips (of the same journey) according to a spatial-temporal connection among activities of different trips (e.g. with respect to time constraints), the tour-based approach has to be used. This approach is relatively new; it has been mainly developed to simulate passenger mobility (Hunt and Stefan, 2007) and only few examples have been implemented for freight mobility in extra-urban (Russo and Cartenì, 2006) and urban areas (Nuzzolo et al., 2011). This paper presents some developments on the simulation of restocking journeys within urban and metropolitan areas. Different models referring to different identified decision-makers and freight types have been specified and calibrated.
Given the delivery O-D matrices per restocking type, delivery time and vehicle type, the vehicle O-D matrices have to be estimated. In fact, in order to obtain the link flows on the road network, the estimation of vehicle O-D matrices and the relative paths used for each od pair are required. The vehicle O-D matrices are made of elements
[ , , , ]shodVC r v n
, which represents the average vehicle flow in time period h (e.g. working day) on the O-D pair od for
transport service type r and vehicle type v moving freight type s in time slice (e.g. 10:00 – 10:15 a.m.). In the following, for simplicity of notation, the class indexes s (freight type) and h (time period) will be omitted unless otherwise stated.
Given the flows of deliveries performed by journeys of order n (i.e. n deliveries per journey) departing from origin zone o operated by transport service r and vehicle type v in time slice , the number of vehicles on each
,i jd d pair, [ , , , ]i jd dVC r v n , can be calculated solving the following system of linear equations:
1 2 1
1 1
.
.
2 1
[ , , , ] [ , , , ] , , , , , [ / ]
[ , , , ] [ , , , ] , , ,
[ , , , ] [ , , , ]
...
[ , , , ] [ , , , ]
j j j
j j j
j i j j
i
k
o o d o d o dd d d
d d d o dd
d d o d
d d o d
VC r v n VC r v n ND r v n n ND r v p n v ro n
VC r v n VC r v n ND r v n
VC r v n VC r v n p d /d nvro
VC r v n VC r v n p d
1 1
1
1
...
[ , , , ] [ , , , ]k k k k
k
k k
d d d d
/d nvro
VC r v n VC r v n p d /d nvro
where .[ , , , ]oVC r v n is the number of vehicles departing from origin zone o (wholesaler zone);
. [ , , , ]jdVC r v n is the number of vehicles arriving to deliver in zone dj;
[ , , , ]jod
ND r v n is the number of deliveries performed in zone jd by journeys of order n departing from zone o;
[ , , ]jod
ND r v is the number of deliveries performed on odj pair;
[ / ]p n v ro is the probability that deliveries are performed by a journey departing from zone o with n deliveries;
it can be obtained by a trip chain order model;
1k kp d / d nvro is the probability to perform the delivery (k+1) in the zone 1kd , conditioned to a previous
delivery in zone kd within a journey with n deliveries by transport service r departing from zone o; it can be
obtained by a delivery location choice model. Behavioural models for the simulation of the trip-chain order choice and the delivery location one have been
specified and calibrated in relation to category of stakeholders (i.e. retailer, wholesaler, carrier) considering also different aggregation levels of freight (i.e. freight types). The results of the calibration are reported in the following section. The models have been calibrated using the Maximum Likelihood (LM) estimator within the classic theory
Agostino Nuzzolo et al. / Procedia Social and Behavioral Sciences 20 (2011) 140–149 143
of statistical inference implemented inside Alogit software. The proposed model is the result of several specifications and calibrations based on different combinations of possible attributes.
3. Model calibration
3.1. The dataset
The calibration has been carried out using a dataset of more than 500 interviews to truck drivers. These interviews are part of a survey campaign in the city of Rome consisting of traffic counts and interviews to retailers and truck drivers (Comi et al., 2011).
The analysis focused on the restocking process of the retailers within the study area (inner area of city). According to the current regulation of the city centre, the access and parking of freight vehicles is subject to time windows in the inner area. Heavy vehicles (more than 3.5 tonnes of gross laden weight) are granted to access and parking from 8 pm to 7 am. Other vehicles (less than 3.5 tonnes) are granted to access and parking in the time windows 8 pm to 10 am and 2 pm to 4 pm. Exemptions from time windows with around-the-clock access and parking are granted to third party vehicles, vehicles transporting perishable food, valuables, pharmaceuticals, newspapers, and vehicles carrying out maintenance activities. Regulation is therefore designed essentially to create incentives for third account also in an attempt to discourage long parking of own account vehicles, given the shortage of on-street space in the area. In addition there is an around-the-clock ban for pre-Euro vehicles.
A charging scheme exists in the portion of the inner area covering the historic centre. This is the previously mentioned LTZ (Limited Traffic Zone). It is subject to electronic access control since 2001. Access is restricted between 6.30 am and 6 pm. Certain categories of vehicles are allowed to access. There are vehicles belonging to residents and vehicles which carry out delivery/collection and maintenance activities. For more details refer to Comi et al. (2011).
The 502 truck drivers have been interviewed. The questionnaire consists of 6 sections: general information; in this section data on socio-economic characteristics of interviewee and transport firm have
been collected; characteristics of used vehicle; this section allowed to reveal the technical characteristics of vehicle, e.g., fuel,
weight, equipment, emission standards; characteristics of transport; this section allowed to investigate the type of operation (own or third account) and
the scope of transport (loading or unloading), and other characteristics of transport as well as frequency; delivery journey; this section allowed to know the origin of journey, type of sender and receiver, and to
characterise each stop in terms of delivered/collected freight quantity, freight type, and time spent; type of stop; this section allowed to investigate the types of stop for loading and unloading operations and has had
the aim to evaluate the percentage of use of space dedicated to loading/unloading and, in case, why this dedicated space is not used;
suggestions to improve freight distribution within the study area. This survey also allowed us to characterise the freight quantity moved within the study area. The composition of
freight flows in tonnes has been estimated on the basis of counts and data from the truck-driver survey. The study area is a trading area which is mainly interested by attraction freight flows. The analysis highlights freight movements in the study area for about 15,000 tonnes per day, the 30% consist of foodstuffs (about 16% are directed to restaurants and bars, and 14% to retailer) and the remaining 70% are made of other end-consumer products (e.g. household and health products).
This survey allowed us to assess traffic flows impacting the study as follows: commodity flows: 14,499 tonnes/day; delivery flows: 34,246 deliveries/day; vehicle flows: 15,773 trucks/day.
The collected data allowed us to identify three different types of transport services for restocking: directly by himself (retailer/receiver) in own account; by the wholesaler or distributor (restocking centre/sender) in own account; by a carrier operating as third party service provider.

144 Agostino Nuzzolo et al. / Procedia Social and Behavioral Sciences 20 (2011) 140–149
By analysing results of Table 1 it is possible to point out that the restocking in own account by a restocking centre is about the 49%; this percentage increases to up to 61% and 65% for foodstuffs and stationery, respectively. The absolute value of the average standard deviation for each revealed share is less than 15%.
Table 1. Restocking transport services: revealed shares.
Retailer in own account
Restocking
centre in own account Third account
Foodstuffs 15% 61% 24%
Home Accessories 31% 46% 23%
Stationery 11% 65% 24%
Clothing 11% 42% 47%
Building Materials 6% 40% 54%
Household and personal hygiene 9% 22% 69%
Other 28% 21% 51%
Total (average share) 20% 49% 31%
Table 2 shows the different delivery size (shipment size) for the considered freight types. The average quantity
varies from about 0.5 tonnes for retailer in own account to 0.35 tonnes for third party carriers; this result is justified by the fact that retailers in own account are characterised by a lower number of stops/deliveries. The last column of Table 2 reports the average number of deliveries per day for each freight type. The high values are relative to foodstuffs and household and personal hygiene products (daily consumption products). The standard deviation is also reported. It demonstrates that the numbers of deliveries per journey are pretty close to average values.
Table 2. Delivery size: revealed average quantity [tonnes/delivery] and number of deliveries per journey.
Retailer in own account
Restocking
centre in own account
Third account
Total
(average quantity)
Average no. of delivery per journey
(standard deviation)
Foodstuffs 0.39 0.37 0.23 0.32 2.4 (1.03)
Home Accessories 1.20 0.98 0.61 0.90 1.9 (0.73)
Stationery 0.567 0.63 0.41 0.55 2.1 (0.87)
Clothing 0.24 0.31 0.28 0.28 2.1 (0.96)
Building Materials 0.14 0.40 0.79 0.42 1.8 (0.59)
Household and personal hygiene 0.30 0.13 0.20 0.18 2.0 (0.79)
Other 0.42 0.39 0.50 0.32 1.9 (0.86)
Total (average) 0.51 0.48 0.35 0.43 2.1 (0.93)
The survey carried out on truck drivers has allowed us to identify origins and destinations of journeys, as well as
their features (e.g. vehicle type, restocking type and average load). Data analysis reports that about 60% of the whole transport pertains to LGV (Light Goods Vehicles), which move an average load of about 0.76 tonnes per vehicle (load factor near 50%). MGV (Medium Goods Vehicles) represent about 40% of the whole but their average transported quantity is about twice more (1.44 tonnes) than that of LGV. Analysing the results in terms of restocking types, it is possible to highlight that more than 60% of retailers and carriers use LGV, while restocking centres use LGV and MGV nearly in equal percentage. About 93% are diesel vehicles, and more than 59% comply with the
Agostino Nuzzolo et al. / Procedia Social and Behavioral Sciences 20 (2011) 140–149 145
Euro 3 standards. Although pre-Euro vehicles are not allowed in the study area, it is revealed that about 6% are pre-Euro vehicles.
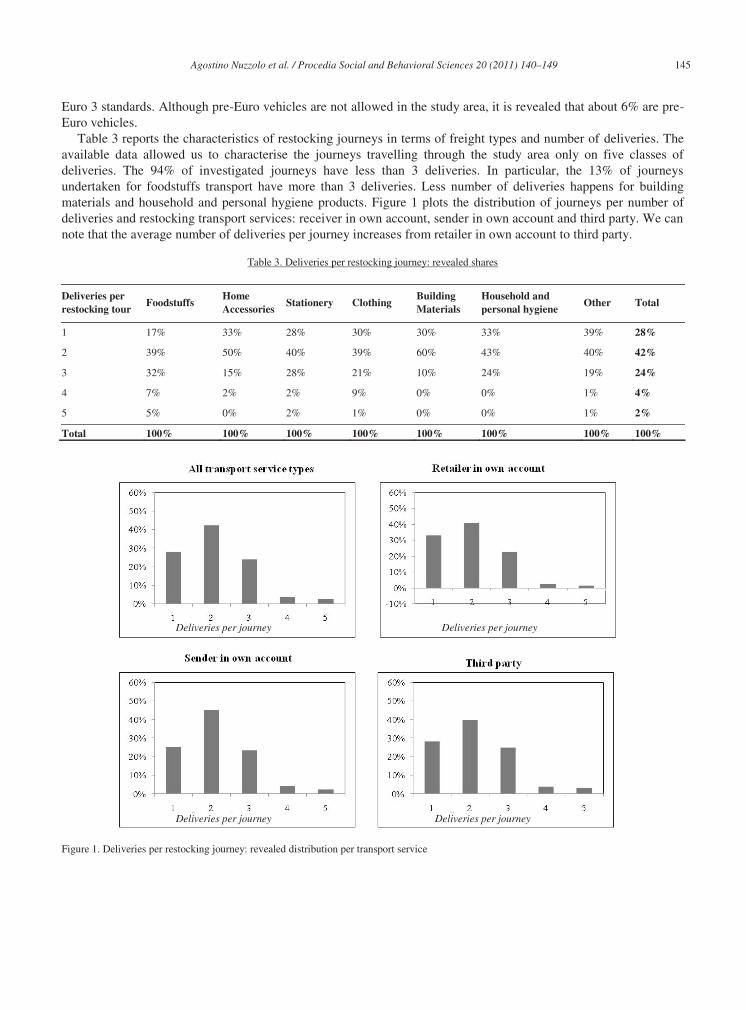
Table 3 reports the characteristics of restocking journeys in terms of freight types and number of deliveries. The available data allowed us to characterise the journeys travelling through the study area only on five classes of deliveries. The 94% of investigated journeys have less than 3 deliveries. In particular, the 13% of journeys undertaken for foodstuffs transport have more than 3 deliveries. Less number of deliveries happens for building materials and household and personal hygiene products. Figure 1 plots the distribution of journeys per number of deliveries and restocking transport services: receiver in own account, sender in own account and third party. We can note that the average number of deliveries per journey increases from retailer in own account to third party.
Table 3. Deliveries per restocking journey: revealed shares
Deliveries per restocking tour
Foodstuffs Home Accessories
Stationery Clothing Building Materials
Household and personal hygiene
Other Total
1 17% 33% 28% 30% 30% 33% 39% 28%
2 39% 50% 40% 39% 60% 43% 40% 42%
3 32% 15% 28% 21% 10% 24% 19% 24%
4 7% 2% 2% 9% 0% 0% 1% 4%
5 5% 0% 2% 1% 0% 0% 1% 2%
Total 100% 100% 100% 100% 100% 100% 100% 100%
Figure 1. Deliveries per restocking journey: revealed distribution per transport service
Deliveries per journey Deliveries per journey
Deliveries per journey Deliveries per journey

146 Agostino Nuzzolo et al. / Procedia Social and Behavioral Sciences 20 (2011) 140–149
3.2. Trip chain order model
The trip chain order model allows us to define the average number of deliveries that characterize the undertaken journey. It allows us to obtain the delivery O-D matrices per n-order trip chain order by disaggregate the flow of deliveries , ,odND r v . Let be [ / ]p n v ro the probability that deliveries are performed by a journey departing from
zone o with n stops. In the sphere of the Random Utility Theory, the trip chain order model can be specified assuming that the random residuals are i.i.d. as Gumbel variables. Under this hypothesis, the probability [ / ]p n v ro
can be calculated as:
''
exp expn nn
p n / v ro V V
where nV is the systematic utility for a journey with n deliveries departing from zone o.
This model allows us to assess the city logistics measures impacting on Level-of-Service attributes, and thus the number of deliveries per journey. In fact, as emerged by survey (Comi et al., 2011), the number of stops per trip chain could be modified by the implementation of city logistics solutions pushing towards more efficient transport services in terms of transported load and generalised travel cost. The impact on the number of deliveries is due to equipment measures, too. Implementation of measures affecting types of allowed vehicle could influence the transported load and, thus, the number of deliveries on the delivery journey.
Three different models have been calibrated according to three identified transport service types: receiver in own account, sender in own account and third party. The systemic utility has been specified as linear combination of three classes of attributes: location of origins, freight characteristics (i.e. freight types) and socio-economic characteristics of decision-makers (i.e. receiver, sender and transport operator). The used attributes are: IAAo, retailer accessibility index of zone o, from which the journey departs (e.g. warehouse location); q, average quantity of freight delivered at each stop (i.e. delivery point) along the journey, expressed in tons; FGT, dummy variable equal to 1 if the delivered freight belongs to the foodstuffs class, 0 otherwise; VEH, dummy variable equal to 1 if the used vehicle is a Light Goods Vehicle, 0 otherwise.
The retailer accessibility index oIAA is calculated as:
min max mino o z z zz zzIAA AA AA AA AA
where xAA is the accessibility of zone x estimated as: 1
2expx j xjj
AA UL dist
with jUL the number of retail establishments of zone j to be restocked,
xjdist the distance between zone x and j, calculated on the road network according the path of minimum
generalised travel cost, 1 and 2 calibration parameters.
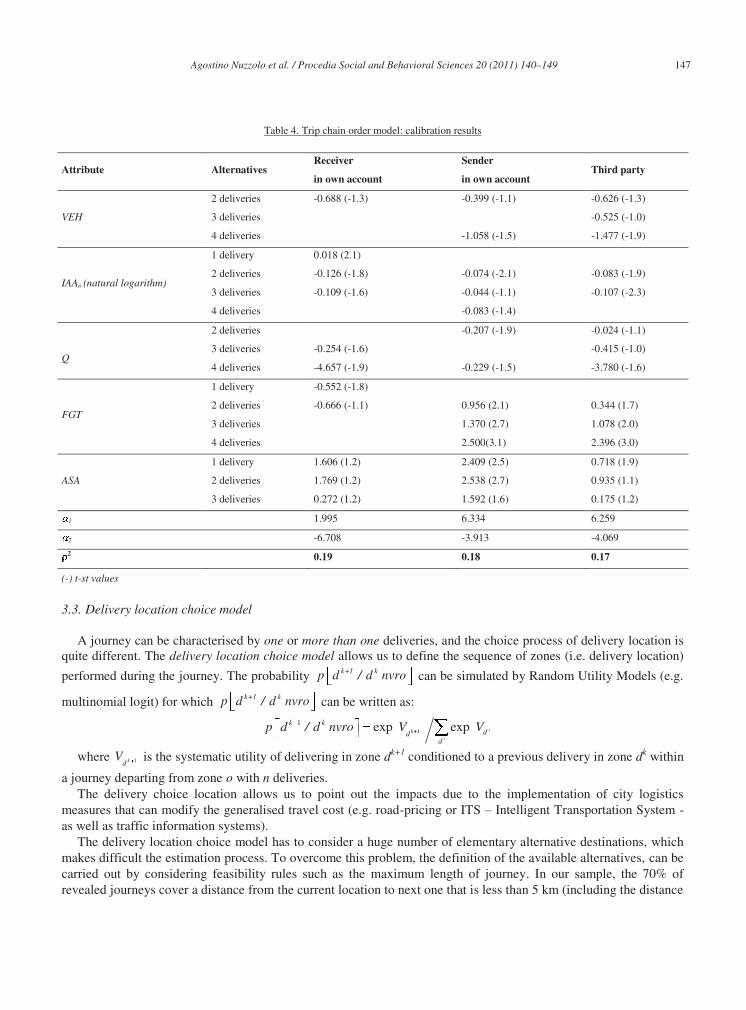
The results of the calibration are reported in Table 4. We can see that all parameters have the expected signs and
most of them are statistically significant (see t-st values in brackets). Parameter analysis shows the important role of the accessibility; in fact, we can see that increasing the accessibility, the number of deliveries per journey decreases. It confirms that the restocker prefers to do round trips if warehouse is located in a zone with a high accessibility as it allows them to reduce the operation complexity of journey management. The probability of having journeys with more than 2 stops increases for foodstuffs. Finally, as expected, the positive sign of vehicle type parameters confirm that the probability of having round trips increases for Light Goods Vehicles and small delivered quantities. Even though they are the first results of the calibration of the trip chain order model, the values of 2 are similar to those present in the literature for these types of probabilistic-behavioural models.
Agostino Nuzzolo et al. / Procedia Social and Behavioral Sciences 20 (2011) 140–149 147
Table 4. Trip chain order model: calibration results
Attribute Alternatives Receiver
in own account
Sender
in own account Third party
VEH
2 deliveries -0.688 (-1.3) -0.399 (-1.1) -0.626 (-1.3)
3 deliveries -0.525 (-1.0)
4 deliveries -1.058 (-1.5) -1.477 (-1.9)
IAAo (natural logarithm)
1 delivery 0.018 (2.1)
2 deliveries -0.126 (-1.8) -0.074 (-2.1) -0.083 (-1.9)
3 deliveries -0.109 (-1.6) -0.044 (-1.1) -0.107 (-2.3)
4 deliveries -0.083 (-1.4)
2 deliveries -0.207 (-1.9) -0.024 (-1.1)
Q 3 deliveries -0.254 (-1.6) -0.415 (-1.0)
4 deliveries -4.657 (-1.9) -0.229 (-1.5) -3.780 (-1.6)
FGT
1 delivery -0.552 (-1.8)
2 deliveries -0.666 (-1.1) 0.956 (2.1) 0.344 (1.7)
3 deliveries 1.370 (2.7) 1.078 (2.0)
4 deliveries 2.500(3.1) 2.396 (3.0)
ASA
1 delivery 1.606 (1.2) 2.409 (2.5) 0.718 (1.9)
2 deliveries 1.769 (1.2) 2.538 (2.7) 0.935 (1.1)
3 deliveries 0.272 (1.2) 1.592 (1.6) 0.175 (1.2)
1 1.995 6.334 6.259
2 -6.708 -3.913 -4.069 2 0.19 0.18 0.17
(-) t-st values
3.3. Delivery location choice model
A journey can be characterised by one or more than one deliveries, and the choice process of delivery location is quite different. The delivery location choice model allows us to define the sequence of zones (i.e. delivery location)
performed during the journey. The probability k+1 kp d / d nvro can be simulated by Random Utility Models (e.g.
multinomial logit) for which k+1 kp d / d nvro can be written as:
1
1'
'
exp expk
k kdd
d
p d / d nvro V V
where 1kdV is the systematic utility of delivering in zone dk+1 conditioned to a previous delivery in zone dk within
a journey departing from zone o with n deliveries. The delivery choice location allows us to point out the impacts due to the implementation of city logistics
measures that can modify the generalised travel cost (e.g. road-pricing or ITS – Intelligent Transportation System - as well as traffic information systems).
The delivery location choice model has to consider a huge number of elementary alternative destinations, which makes difficult the estimation process. To overcome this problem, the definition of the available alternatives, can be carried out by considering feasibility rules such as the maximum length of journey. In our sample, the 70% of revealed journeys cover a distance from the current location to next one that is less than 5 km (including the distance
148 Agostino Nuzzolo et al. / Procedia Social and Behavioral Sciences 20 (2011) 140–149
from the warehouse to the first stop). This analysis has allowed us to characterise in such way the choice set, even if a further analysis is in progress in order to specify and calibrate a specific model for the choice set generation.
The systemic utility includes two groups of attributes: the first considers all variables associated with an alternative destination such as retailer or warehouse accessibility; the second includes the memory variables representing the history of a tour, such as the cumulative distance covered up to the current location. For this reason, the systemic utility has been expressed as linear function of the following attributes: IAAd, retailer accessibility index of zone d, which is the next stop along the undertaken journey; IAPd, warehouse accessibility index of zone d, which is the next stop along the undertaken journey; HTd, is 0 for the first stop, while represent the natural logarithm of the ratio between the covered distance up to
the current location and the distance from the current location to the next stop; ASAsz, dummy variable equal to 1 if the next stop is within the same current zone, 0 otherwise.
The warehouse accessibility index, dIAP , has been calculated as follows:
min max mind d z z zz zzIAP AP AP AP AP
where xAP is the warehouse accessibility of zone x estimated as: 3
4expx i ixi
AP WH dist
with iWH the number of warehouses of zone i,
ixdist the distance between zone i and x,
3 and 3 parameters to be calibrated.
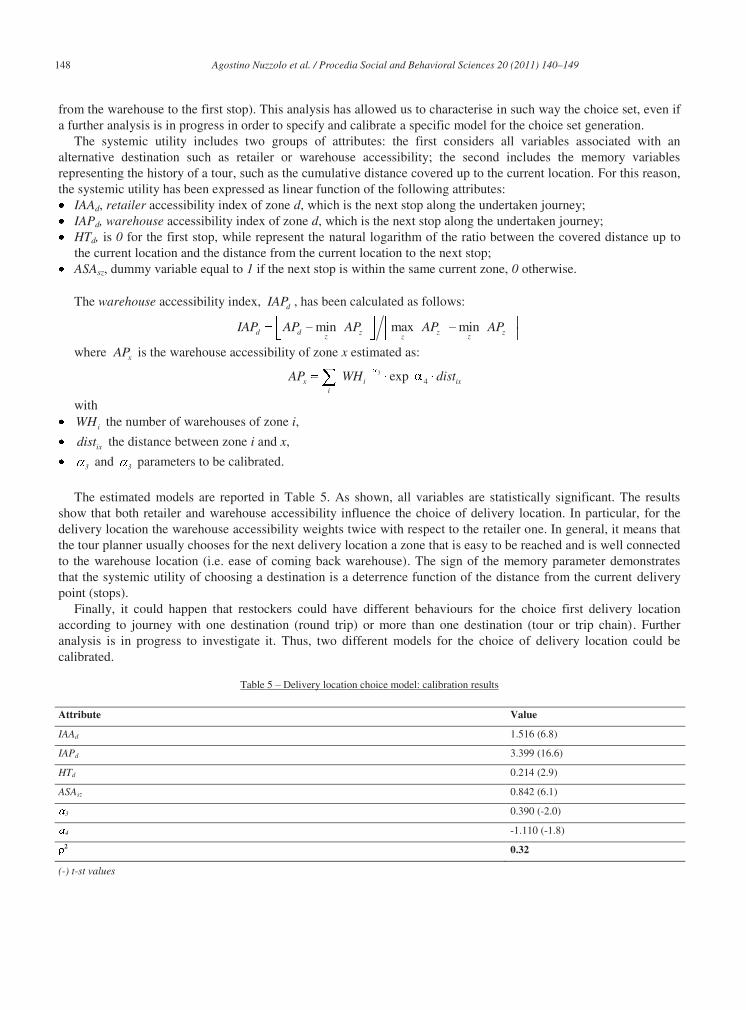
The estimated models are reported in Table 5. As shown, all variables are statistically significant. The results
show that both retailer and warehouse accessibility influence the choice of delivery location. In particular, for the delivery location the warehouse accessibility weights twice with respect to the retailer one. In general, it means that the tour planner usually chooses for the next delivery location a zone that is easy to be reached and is well connected to the warehouse location (i.e. ease of coming back warehouse). The sign of the memory parameter demonstrates that the systemic utility of choosing a destination is a deterrence function of the distance from the current delivery point (stops).
Finally, it could happen that restockers could have different behaviours for the choice first delivery location according to journey with one destination (round trip) or more than one destination (tour or trip chain). Further analysis is in progress to investigate it. Thus, two different models for the choice of delivery location could be calibrated.
Table 5 – Delivery location choice model: calibration results
Attribute Value
IAAd 1.516 (6.8)
IAPd 3.399 (16.6)
HTd 0.214 (2.9)
ASAsz 0.842 (6.1)
3 0.390 (-2.0)
4 -1.110 (-1.8) 2 0.32
(-) t-st values
Agostino Nuzzolo et al. / Procedia Social and Behavioral Sciences 20 (2011) 140–149 149
4. Conclusions and further developments
Congestion in urban areas, restrictions applied to vehicle movements for sustainability issues, as well as the reduction of accessibility of particular urban centres, have been forwarded researchers to investigate solutions to define city logistics measures in order to reduce the negative effects of freight transport. For this reason, it is important to have methods and models capable to simulate effects of measures before their implementation in the “what if” framework of an ex-ante assessment of possible impacts.
This paper presented some calibration results of a modelling system developed in order to support the estimation of vehicle origin-destination matrices in urban areas. The freight modelling system has been specified and calibrated on the basis of a real test case (the city of Rome). The calibration of the trip chain order model pointed out the key-role of the warehouse location, for which round trips are preferred from highly accessible zones. The delivery choice location highlights the importance of retailer and warehouse accessibility of zones to be served.
Further developments of this research mainly regard two main topics: trip-chain order, through ○ the investigation of more sophisticated probabilistic and/or behavioural models for the simulation of the
choice of number of deliveries per journeys (i.e. order logit model) and to simulate the joint choice of number of deliveries and delivered quantity;
○ the investigation of the influence of the dimension of retailers in the served zone in the definition of the order trip chain;
delivery location, through ○ the development of probabilistic and/or behavioural models for round trips and tours; ○ the development of models for the simulation of the choice set generation. Finally, other developments could aim to develop this modelling system within a Decision Support System which
could be a useful tool for appraising impacts of urban freight transport measures and policies.
References
Comi, A., Delle Site, P., Filippi, F. and Nuzzolo, A. (2011). Ex-post assessment of city logistics measures: the case of Rome. In Transport management and land-use effects in presence of unusual demand, L. Mussone and U. Crisalli (eds.), Franco Angeli, Milan, Italy, 235-252.
Holguin-Veras, J. and Patil, G. (2008). A Multicommodity Integrated Freight Origin–destination Synthesis Model. In Networks and Spatial Economy 8 (2), 309-326.
Hunt, J. D. and Stefan, K. J. (2007). Tour-based microsimulation of urban commercial movements. In Transportation Research Part B 4, Elsevier, 981-1013.
Lindholm, M. and Behrends, S. (2010). A holistic approach to challenges in urban freight transport planning. In Selected Proceedings of 12th World Conference on Transportation Research-WCTR 2010, Viegas, J. M. and Macario, R. (eds.), Lisbon, Portugal.
Nuzzolo, A., Crisalli, U. and Comi, A. (2009). A delivery approach modeling for urban freight restocking. In Proceedings of the 12th International conference on Travel Behaviour Research (IATBR), Jaipur, India.
Nuzzolo, A., Crisalli, U. and Comi, A. (2011). A trip chain order model for simulating urban freight restocking. In European Transport, Special issue on: Freight transport analysis: new trends and methodologies; Trieste, Italy.
Nuzzolo, A., Crisalli, U., Comi, A. and Galuppi, S. (2010). Demand models for the estimation of urban goods movements: an application to the city of Rome. In Selected Proceedings of 12th World Conference on Transportation Research-WCTR 2010, Viegas, J. M. and Macario, R. (eds.), Lisbon, Portugal
Raothanachonkun, P., Sano, K., Wisetjindawat, W. and Matsumoto, S. (2007). Truck trips origin destination using commodity based model combined with an empty trip model. In Proceedings of the 86th Transportation Research Board Annual Meeting, Washington DC, U.S.A..
Russo, F. and Cartenì, A. (2006). Application of a tour-based model to simulate freight distribution in a large urbanized area. In Recent advances in city logistics, R. G. Thompson and E. Taniguchi (eds.), Elsevier Ltd., United Kingdom, 31-46.
Russo, F. and Comi, A. (2010). A modelling system to simulate goods movements at an urban scale. In Transportation 37 (6), DOI 10.1007/s11116-010-9276-y, Springer Science+Business Media, LLC, 987-1009.
Russo, F. and Comi, A. (2011). A model System for the ex-ante assessment of city logistics measures. In Research in Transportation Economics 31 (1), DOI: 10.1016/j.retrec.2010.11.011, Elsevier Ltd., 81-87.
Wang, Q. and Holguin-Veras, J. (2008). An investigation on the attributes determining trip chaining behavior in hybrid micro-simulation urban freight models. In Proceedings of the 87th Transportation Research Board Annual Meeting, Washington DC, U.S.A..