A REPORT ON ASSESSSMENT OF REASONS OF HIGH AGE INVENTORY BY AMIT VERMA 13BSP0079 TATA STEEL...
49
A REPORT ON ASSESSSMENT OF REASONS OF HIGH AGE INVENTORY BY AMIT VERMA 13BSP0079 TATA STEEL PROCESSING AND DISTRIBUTION LIMITED 1
Transcript of A REPORT ON ASSESSSMENT OF REASONS OF HIGH AGE INVENTORY BY AMIT VERMA 13BSP0079 TATA STEEL...

A REPORT
ON
ASSESSSMENT OF REASONS OF HIGH AGEINVENTORY
BY
AMIT VERMA
13BSP0079
TATA STEEL PROCESSING ANDDISTRIBUTION LIMITED
1

A REPORT
ON
ASSESSMENT OF REASONS OF HIGH AGEINVENTORY
BY
AMIT VERMA
13BSP0079
TATA STEEL PROCESSING ANDDISTRIBUTION LIMITED
A report submitted in partialfulfilment of the requirements of
PGPM Program ofIBS Kolkata
Company Guide:Mr. Sunil Vats
2

Faculty Guide:Prof. DP Ghosh
DECLARATIONI, Amit Verma, of ICFAI Business School (IBS) Kolkata herebydeclare that I have completed my summer internship project,titled “Assessment of Reasons for High Age Inventory” fromTata Steel Processing And Distribution Limited in the session2013-2015. The project report submitted herein is prepared by me. It istrue and original to the best of my knowledge and has not beenpreviously submitted or used by anyone for the award of anydegree or diploma to any institution.
______
_________________
Sign
ature of the student
(
Amit Verma)
3

ACKNOWLEDGMENTI take this opportunity to express a deep sense of gratitudeto IBS kolkata for arranging the summer training in goodschedule. I also extend my gratitude to my project guide Prof.DP Ghosh, who assisted me in compiling the project.
I am really thankful to Tata Steel Processing And DistributionLimited for giving me this opportunity to work with them andassigning this project to me and providing me all necessaryresources for the completion of this project.
At this juncture I feel deeply honored in expressing mysincere thanks to Mr. Sunil Vats and Mr. Biplab Dutta fortheir constant guidance and making the resources available at
4

right time and providing valuable insights leading to thesuccessful completion of my project.
I am also thankful to Mr. Shamik Sen Gupta, Mr. Subrata Rayand Mr. Arindam Choudhary for their continuous support as andwhen required.
EXECUTIVE SUMMARYThe purpose of this project is to identify the materials whichare likely to be present in stock for more than 180 days bythe quarter end which can be classified as high ageinventories and find the possible reasons for materials lyingin stock for long time.The organization TSPDL is facing the problem in terms ofmanaging their inventories, it is losing its market share,
5

contribution levels and profit margins are going down yearafter year due to intense competition from the otherorganizations globally in the steel service sector which isactually a big cause of worry and so necessary steps has to betaken in order to retain customers. So the output of thisproject is definitely going to help them in better inventorymanagement.The entire project is based on the analysis of the primarydata like stock details and sales record of all the locationsof TSPDL.There could be several possible reasons due to which materialslie in the stock for long time. These reasons were collectedfrom different locations and analyzed. Top reasons wereidentified and accordingly solutions were suggested so thatTSPDL can perform well in terms of management of theirinventory.
6

TABLE OF CONTENTSDeclarationiAcknowledgementsiiExecutive Summaryiii1. Introduction7
1.1 About the Steel Service Sector7
1.2 About the Company8-9
1.3 About the Project10
2. Literature Survey11-12
3. Problem Statement13
4. Objective13
5. Research Methodology13
6. Data Collection14
7. Analysis15-27
8. Findings28
7

9. Recommendation29
ANNEXURESAnnexure-1 (Sales Trend) 30-32Annexure-2 (Reasons Of greater than 180 daysmaterials) 33Annexure-3 (Location wise detail of greaterthan 180 materials) 34Annexure-4 (Relationship between 90-180 &greater than 180 days materials)35-36 Annexure-5 (Days Inventory Outstanding)37 Annexure-6 (Relationship between DIO, Sales &Purchase) 38-40
1. INTRODUCTION
1.1 ABOUT THE STEEL SERVICE SECTORA Steel service center is a company that deals withthe service related activities of the steel industry. In a
8

typical scenario, a steel manufacturer produces steel in bulkand then sells it to the customer. The customer then uses thissteel according to its respective business. But small andmedium enterprise businesses (SME) often have a problem inbuying good quality steel from a big manufacturer. This is forvarious reasons, such as, the minimum amount of steel whichthe manufacturer sells is more than the SME requires. Hence,this leads to maintaining a huge warehouse, adding to thetotal cost. A steel service center buys steel from amanufacturer, stores it, and sells it to SMEs as required.This saves the SME from the trouble of buying extra steel oreven maintaining an inventory. The steel service center mayalso process the steel, e.g. by cutting to a size or shapespecified by the customer, before sale. The quantity and themethods of processing of steel vary from center to center. Itmostly depends on the product mix and the customer mix of thecenter. Steel service centers specialize in the processing of steelfor the purpose of fabricating, plating, or molding muchneeded parts such as steel bars, balls, tubing, gates,walkways, beams, coils, sheets, and strips. In essence, steelservice centers manipulate and treat steel to create itemsuseful by almost every industry by providing specializedfinishing and processing services.
Numerous every day, common household products, such as bakingpans, cookie sheets, silverware, ovens, furnaces, and waterheaters, are created with aluminized steel which has passedthrough one or more steel service centers.
Steel service centers adhere to strict standards set by ASTM,an open forum for setting the standards and quality ofinternational measurements around the globe. Meeting, orexceeding, these standards, insures the safety, purity,structure, and integrity of materials that pass though allsteel service centers, eventually working their way into oureveryday life.
Steel service centers are often asked to preprocess the steelbefore shipping to the manufacturer. This preprocessinginvolves manipulation of the steel before it is shipped suchas sawing, cutting, shearing, or shaping the steel to specificdimensions before transport. Steel service centers are alsoresponsible for insuring proper packaging and shipping to themanufacturer. Correctly preprocessed, package, and shipped
9

steel allows for easier use at the manufacturer by saving timeand money.
1.2 ABOUT THE COMPANY
Tata steel formed a 50:50 joint venture in 1997 with RyersonInc.,USA, (North America’s largest metals processor anddistributor with more than 100 service centers in USA, Canada& Mexico), to promote a steel service company, christened TataRyerson Limited. Between 1997 and 2013, the company grew froma turnover of Rs 1.8 crores to Rs 1645 crores, firmlyestablishing itself as the dominant steel service centercompany in the country.The company became a wholly owned subsidiary of Tata Steel in2009 and acquired a new name from January, 2010. The objectiveof the promoters is that TSPDL become their main “last mileconnect” and its front end. TSPDL is seen as a value-adding
10
To be thetrustedand
irreplaceable bridgebetween
SteelSupplier
Customer
Steel Suppliers (PrimarilyMills)Wish to focus on their core activity of making steel and outsource supplychain activitiesCustomersWant customized steel in
Core CompetencyManaging the steel supplychain for customersDelivering the high quality, custom-processed
MISSSION

entity and a strategic partner. For TSPDL, Tata Steel is thelargest customer as well as the largest supplier.TSPDL’s revenue comes from two markets i.e. Tolling andProduct sales (Distribution), where most of the business comesfrom the automotive industry where TSPDL excels in OEMServicing. In tolling, TSPDL sells its processing services(like slitting, cutting-to-length, Corrugation, Fabrication,etc) where the customers own the material and TSPDL processesas per customer specifications as job work.In Product sales, TSPDL sells processed steel to end users asper the agreed specification, delivery schedule and commercialterms. The raw materials (mother coils) are procured by thecompany, processed to customized shapes and sizes in its ownfacilities or through External Processing Agents (EPA), andshipped to customers.In product sales, the ownership of material lies with TSPDL.The business is thus expected to price fluctuations, henceriskier and working capital intensive. This business alsobrings higher margin. TSPDL excels in Working CapitalManagement in this market.
11
TSPDL Product Offerings
Products
HR/HRPO & CR Slit Coils, HR/HRPO & CR Sheets,GC Sheets, C&B Rebar, CRF component, BTS plates.
Services
Slitting, Cutting-to-length, Corrugation, P&O, Rebar Cut & Bend, Roll Forming, Stretch
Market
Tolling Product sales(Distribution)
Market Segments

1.3 ABOUT THE PROJECTThis Project is a part of inventory management in TSPDL,specifically aiming at high age inventories. Work assigned inthe project needs to find out the possible reasons for theinventories lying in the stock for long time, so that it canbe resolved.If we look at the current status of TSPDL, it is losing itsmarket share, contribution levels and profit margins are goingdown year after year due to intense competition from the otherorganizations globally in the steel service sector which isactually a big cause of worry and so necessary steps has to betaken in order to retain customers.So the main purpose of doing this project is to analyze theproblems in terms of managing the high age inventory and tofind the best possible ways for eliminating such problems andassuring it may not happen in future also. By this TSPDL wouldbe able to increase its profitability and give best possibleservice to its customers. This project requires analyzing the primary data andidentifying the inventories which would be more than 180 daysby the quarter end. Primary data that is required to be
12

analyzed here is the list of materials and their total amountlying in the stock and of 8 different plants of TSPDL for last5-6 months and also the sales trend of all the materials.The eight locations from where the data is generated areBangalore, Chennai, Ludhiana, Faridabad, Jamshedpur, Howrah,Pantnagar and Pune. Data from every individual plant has to betaken and analyzed.There could be several possible reasons due to which materialsremain in stock for long time which is not desirable. Thisproject requires collecting all such reasons from differentlocations of TSPDL for the materials lying in their respectivestocks. Then analysis is to be done and top reasons need to beidentified and thereafter possible solution is to besuggested.
2. LITERATURE SURVEY
INVENTORYInventory or stock refers to the goods and materials that abusiness holds for the ultimate purpose of resale.Inventory management is a science primarily about specifyingthe shape and percentage of stocked goods. It is required atdifferent locations within a facility or within many locationsof a supply network to precede the regular and planned courseof production and stock of materials.The scope of inventory management concerns the fine linesbetween replenishment lead time, carrying costs of inventory,asset management, inventory forecasting, inventory valuation,inventory visibility, future inventory price forecasting,
13

physical inventory, available physical space for inventory,quality management, replenishment, returns and defectivegoods, and demand forecasting. Balancing these competingrequirements leads to optimal inventory levels, which is anon-going process as the business needs shift and react to thewider environment.Reasons for Keeping StockThere are many reasons that motivate companies to have stock.The five basic reasons are:-
1. A firm can realize economies of scale in manufacturing,purchasing and transportation by holding inventory. Ifthe business buys large amounts, it gets quantitydiscounts. In turn, transportation can move largervolumes and get economies of scale through betterequipment utilization. Manufacturing can have longerproduction runs if more material is inventoried, allowingper unit fixed cost reductions.
2. Balancing supply and demand: Some firms accumulateinventory in advantage of seasonal demand. A toymanufacturer sees some demand year-round, but 60 percentor more of sales will come in the Christmas season. Bymanufacturing to stock, production can be kept levelthroughout the year. This reduces idle plant capacity andmaintains a relatively stable workforce, keeping costsdown. If demand is relatively constant but inputmaterials are seasonal, such as in the production ofcanned fruits, then finished inventory helps meet demandwhen the materials are no longer available.
3. Specialization: Inventory allows firms with subsidiariesto specialize. Instead of manufacturing a variety ofproducts, each plant can manufacture a product and thenship the finished products directly to customers or to awarehouse for storage. By specializing, each plant cangain economies of scale through long production runs.
4. Protection from uncertainties. A primary reason to holdinventory i.e. to offset uncertainties in demand. Ifdemand increases and raw material stocks run out, theproduction line shuts down until more material isdelivered. Likewise, a shortage of work in process meansthe product cannot be finished. Finally, if customerorders outstrip finished goods supply, the resultingstock outs could lead to lost customers.
14

Costs of Holding InventoryThere are many costs associated with holding (or not holding)stock. Some of these are:
1. Warehouse costs2. Money tied up in stock (interest charges)3. Damage while in storage4. Obsolescence5. Ordering costs6. Delivery costs7. Costs of any ‘stock-outs’.
Warehouse costs include things like rental charges, heatingand wages. Money that is tied up in stock could be earningmoney (or reducing overdraft charges). A certain proportion ofgoods will be damaged while in the warehouse or may be stolenand certain products deteriorate, while other items may becomeobsolete if stored too long. In addition to the costs directlyassociated with the holding of stock, there is also the costof ordering and delivery. Most large companies have a buying department and this meansthat there must be a cost associated with ordering. Even ifonly telephone and postage cost were included, each orderwould still cost a finite amount. Finally there is a cost of a‘stock-out’; that is, the cost of not having sufficient stockto meet demand. For each sale not made as a result of a stock-out the company will lose the profit on this sale, but inaddition they may lose future sales if customers find a morereliable supplier.
15

3. PROBLEM STATEMENTThe ability to successfully manage inventory is highlydesirable for every organization if they want to improve ontheir profitability and satisfy their customers but TSPDL isfacing problem in terms of managing its high age inventory forwhich the reasons need to be assessed and best possiblesolution is to be suggested.
4. OBJECTIVE Finding out the reasons of high age inventory. Suggesting the remedial measures for minimizing the
inventory holding period and Process to minimize high ageinventory.
5. RESEARCH METHODOLOGYFor this project only primary data was needed to be collected for analysis.All the needed primary data were collected from different locations of TSPDL through mail.
16

6. DATA COLLECTIONAll the required data that were collected for this projectwere primary data which were generated at different locationsof TSPDL.Different locations from where data was collected are:-
Jamshedpur Faridabad Pune Pantnagar Bangalore Chennai Howrah
Different primary data collected are:- Stock details of all the locations consisting of list of
the materials with their material code, batch number,coil number, coil age and quantity in tons.
Sales details of all the locations consisting of list ofthe materials with the date of sale, material code, salescode, and quantity sold in tons.
Procurement details of all locations for one completefinancial year.
Stock details of greater than 180 days materials with thereasons.
17

7. ANALYSIS
Average greater than 180 days materials per month for last six months 0f financial year 2013-2014
LOCATIONS QUANTITY (in tons)
TOTAL STOCK PER MONTH
Faridabad 119 10105Jamshedpur 74 8258Pune 47 4101Chennai 44 2680Pantnagar 21 7472Howrah 17 976Bangalore 11 1247Table-1
Above table shows the total amount of greater than 180 days materials per month and total stock of all the locations. These details were collected from the stock details of the materials which are likely to be present in the stock for more
18

than 180 days by the quarter end. These details were obtained from management for last 6 months of financial year 2013-2014.As TSPDL is facing problem with managing its high age inventory, above table shows the total quantity of the undesirable materials which remain in stock of all locations per month.Now to know the actual sales of these materials sales details was obtained from the management and further analysis was done.
Categories as per the average monthly salesCategories Description
cat-1Very high sales: above 100 tons
cat-2 High sales: 51-100 tonscat-3 Medium sales: 20-50 tonscat-4 low sales: 10-20 tons
cat-5Very low sales: below 10 tons
cat-6 No salesTable-2.1
19

Sub Categories DescriptionA Uniform salesB Non-uniform sales
CConsecutive 2 months no sale
Table-2.2
CategoriesFast moving materials 1-A, 1-B
2-A, 2-B3-A, 3-B4-A
Slow Moving Materials 1-C2-C3-C4-B, 4-C5-A, 5-B
Non Moving Materials 5-C6
Table-2.3
The above table shows the categories in which the materials are divided as per their monthly average sales. They are divided into 6 broad categories which are further divided into3 sub categories.Table 2.3 show which categories of materials are assigned to fast moving, slow moving or Non-moving type.
Sales trend: Jamshedpur
HR MaterialsDescription
AVG SALECategories FSN
stock ason 24-
20

marchE34/5.0/ HR unpickled Plates 178.051 1-B FM 6.74E46 SS4012A/5.0MM/ >=600MM /HR sheet 168.904 1-B FM 0.635TSCR12/4.00MM>600MM HR SHEET 124.500 1-B FM 3.43E38/5mm/HR UNPICKLED PLATES 59.364 2-B FM 0.815IS2062GRA/12.0/ HR UNPICKLED PLATES 57.920 2-B FM 0.61IS2062A/8.0/ HR unpickled Plates 57.185 2-B FM 0.49Fe410/2.5/ HR unpickled 47.779 3-B FM 0.815DIN17100 ST52.3/5.00MM/HR UNPICKLEDSHEET 39.462 3-B FM 11.595DIN E34 THIN 2.0 MM / >600MM/HR SHEETS 38.580 3-B FM 0.45DIN17100 ST52.3M-SH/3.00MM>600MM HR UP 37.312 3-B FM 5.13DIN17100AST52.3/8.00mm>600mm HR UPSHEET 35.960 3-B FM 1.43IS1079DD/3.5mm/>600/HR UNPICKLED SHEETS 11.914 4-B SM 1.11BSK E46/ 6.00MM<=600MM HR UP COIL 9.082 5-C NM 1.414DIN17100AST52.3/8.00mm<=600mm HR UP COIL 7.706 5-C NM 3.74BSK46 AL/12.00MM>600MM HR COIL 6.350 5-C NM 22.22SAIL FE 330/2.00 MM/>=600 MMHRSHEET(UP) 0.000 6 NM 0.41Table-3
Above table shows the sales details of Jamshedpur of the materials which are likely to be greater than 180 days by the quarter end i.e. 31st March 2014. For other locations sales trend refer to Annexure-1.Materials are divided into categories to identify the fast moving and slow moving materials.From the above table it can be seen that there are certain materials which are in fast moving category even then they arepresent in stock for so long, so the possible reason for such materials has to be found.Also there are materials which are in non-moving category having very low sales or even no sales at all these materialsneed to be eliminated from the system.
21

COLLECTION OF REASONS AND ITS ANALYSISReasons were collected from different locations for the greater than 180 days materials lying in the stock for at least 5-6 months.Different reasons that were collected from all the locationsare:-NO SCHEDULE: - It means there is no order for the materialsbut they were purchased in anticipation of future sales butwere not sold. Possible causes could be the change in thespecification for those particular materials or may be becausecustomer has shut down its business or may be customer hasstarted purchasing from some other company.CUSTOMER REJECTION: - There are certain materials which arerejected from the customer end. For example during transit ifdue to accident materials gets dismantled customer will notaccept it and return. There could also be the case whensuppose during transit of the GP (Galvanized product) materialif materials are not covered and rain happens then whereverwater comes in contact with the material it will form whiterust and then customer will not accept the same.SCRAP: - There are certain materials which are present instock in very small quantity which cannot be sold in theordinary course of business. These materials need to bedisposed of from the system.PAYMENT DELAY: - This could also be one possible case wherecustomer delays payment or exceeds the credit limit. In suchsituation materials that were procured for that customer isblocked and thus it remains in the stock for long time.MISPLACED: - There could be the possibility that sometimeswhile handling such a large volume of materials few materialsget misplaced.QUALITY ISSUE: - There could be several possible qualityissues associated with the materials due to which they are notpossible to be sold and thus remains in stock for long time.Few quality defects could be rust, dent, pitted mark, scratches, edge bend, black spot etc.Below are the few examples of quality defects with images: -
22

This figure shows the rusted coil received from Tata Steel. Itmay be possible that it is discovered at the time ofprocessing after a long time gap from when it was procured.Now it remains in the stock till the time Tata Steel takes itback and by that time it may exceed 180 days.
Fig-1
This figure shows the whiterust formed over the surfaceof a GP (galvanized product)coil.
Fig-2
This figure shows the yellowpatches that have formedover the surface of pickledcoil.
Fig-3
This figure shows a coil receivedfrom Tata Steel whose edges arebent (Telescopic view).
23

Fig-4
This figure shows a coil on whose surface black spots has formed.
Fig-5
Reasons Faridabad
Pune
Chennai
Jamshedpur
Bangalore
Total
No schedule 45 8 44 16 13 125Sales return/rejection
8 7 1 16 0 31
Quality issue 27 4 0 6 10 47
Scrap 29 6 4 0 2 42Total 109 23 49 38 25 245
Reasons for Greater than 180 days Materials Table-4The above table shows the major reasons of greater than 180days materials for all locations. For complete details ofreasons for all locations refer to Annexure-2.Faridabad is the main culprit location which is holding thelarge quantity of greater than 180 days materials in itsstock.After analysis as it can be seen from the above table the topreason that came out is “No schedule from the customers”.
24

This means more materials were procured in anticipation of future sales but were not sold and thus they stayed in stock for so long.Materials with quality issues and materials in small quantity being classified as scrap are also present in large quantity in the stock. This means there is the absence of an efficient disposal mechanism in the system for such materials.
ANALYSIS OF DATA FOR ONE COMPLETE FINANCIAL YEAR 2013-2014
25

Fig-6Trend in Greater than 180 Days MaterialsThe above figure shows the movement in total quantity ofgreater than 180 days materials in TSPDL. For location wisecomplete detail refer to the Annexure-3. The values marked inred shows that at the start of the quarter total quantity ofgreater than 180 days materials increases which is due to thelarge volume of 90-180 days materials of previous quartergetting added up.TSPDL is holding large quantity of 90-180 days because ofwhich they are not able to clear their greater than 180 daysstock.
26
Apr-13
May-13
Jun-13
Jul-13
Aug-13
Sep-13
Oct-13
Nov-13
Dec-13
Jan-14
Feb-14
Mar-14
0
100
200
300
400
500
600
700Greater than 180 days Materials
Trend
TOTALQuantity in tons

90-180 Days MaterialsLocations Percentage /
month90-180 days tons/ month
Total Stock / month
Jamshedpur 7 516 8258Faridabad 8 762.58 10105Chennai 8 208.75 2680Pune 12 477.33 4101Bangalore 13 146.25 1247Pantnagar 7 493.25 7472Howrah 15 150.16 976Table-5The above table shows total quantity of 90-180 days materialsand the percentage of total stock that locations are holdingon average per month.
These materials when not cleared even after being in 90-180days bracket goes into greater than 180 days bracket.
Relationship between 90-180 and Greater than 180 daysMaterials
27
Quarter-1 Quarter-2 Quarter-3 Quarter-40
100
200
300
400
500
600
700
800
900
1000
0
20
40
60
80
100
120
140
160
180
200
91-180 days>180 days

Fig-7 : Chennai
Fig-8 : Pune
Both the above figure fig-6 and fig-7 shows the trend in 90-180 days materials and greater than 180 days materials ofChennai and pune respectively. For other locations figurerefer to Annexure-4.It can be seen from the figure that 90-180 days materials arecontinuously increasing till the 3rd quarter. Only in the lastquarter it is decreasing to some extent.It can be seen that greater than 180 days materials areincreasing with the increase in quantity of 90-180 daysmaterials till the 3rd quarter.In the 4th quarter there is decrease in the greater than 180days materials with the decrease in the quantity of 90-180days materials.So it can be said that if we want to minimize our greater than180 days stock then we have to focus on minimizing 90-180 daysstock because there is direct relationship between both.
28
Quarter-1 Quarter-2 Quarter-3 Quarter-40
200
400
600
800
1000
1200
1400
1600
1800
2000
0
20
40
60
80
100
120
140
160
91-180 days>180 days

Materials enter into 90-180 days bracket when the procuredmaterials are not sold within the estimated time of sale dueto any reason.Company procures the materials in estimation of selling itwithin the targeted DIO (Days Inventory Outstanding).
DAYS INVENTORY OUTSTANDING (DIO)Days inventory outstanding (DIO), defined also as days salesof inventory, indicates how many days on average a companyturns its inventory into sales. Value of DIO varies fromindustry and company.DIO ratio, explained as an indicator of inventory turns, is animportant financial ratio for any company with inventory. Itshows how quickly management can turn inventories into cash.In general a decrease in days inventory outstanding (DIO) isan improvement to working capital and an increase isdeterioration.FORMULADays inventory outstanding = (Average Stock / Averagesales)*30
ABP fy-14 DIO Actual DIOJamshedpur 24 31Faridabad 35 42Pantnagar 35 50Chennai 21 36Bangalore 31 40Pune 30 43Howrah 32 34Table-6The above table shows the budgeted DIO as ABP (Annual BusinessPlan) fy-14 DIO and Actual DIO for all the locations. Fordetail DIO list month wise of all locations refer to Annexure-5.
29

It can be seen from the table that except for Howrah for allother locations actual DIO is much larger than the budgetedDIO. This means either our average monthly stock is large oraverage monthly sale is very low.To bring down the actual DIO to the desired level there shouldbe the right balance between average stock and average sales.Sales depend on the market situation but it is possible tomaintain the stock by purchasing the optimal quantity.
DETERMINING THE OPTIMAL PURCHASE QUANTITY
LOCATIONSOptimal Quantity (in tons permonth)
Actual Quantity (in tons per month)
Jamshedpur 8431 9052Faridabad 7105 7658Pantnagar 2775 4330Chennai 1335 2197Bangalore 879 985Pune 2147 2802Table-7
The above table shows the comparison between the actual purchase quantity per month and optimal purchase quantity per month required to achieve the desired DIO level.CALCULATION (For Faridabad as an example)Step-1: Desired DIO = ((Actual stock – X)/Average sales)*30Where X = Possible reduction from the stock.Actual stock = 10105 tonsAverage sales = 7390 tons
30

Desired DIO = 35 So on calculation possible reduction i.e. X = 1483 tonsStep-2: Possible reduction from purchase = X – YWhere Y = Total 90-180 & greater than 180 days stock.Y = 930 tonsPossible reduction from purchase = 553 tonsStep-3: Optimal purchase quantity = Actual Purchase – Possiblereduction from purchaseActual purchase = 7658 tonsSo, Optimal purchase quantity = 7105 tonsSimilarly it is calculated for other locations which can be seen in table-8.
RELATIONSHIP BETWEEN DIO, SALES & PURCHASEDIO: JAMSHEDPUR
31
Ap Ma Ju Ju Au Se Oc No De Ja Fe Ma0
2000
4000
6000
8000
10000
12000
14000
16000
18000
20000
0
10
20
30
40
50
60
PurchaseSales
Sales is very less and procurement is more.
Sales is much less than the average sales relative to the purchase.
Sales is very less .

Fig-9The above figure shows the relationship between Budgeted DIO,Actual DIO, Average purchase and Average sales of Jamshedpur.Flat horizontal dotted red line shows the budgeted DIO and theuneven thick red line shows the trend in actual DIO. First peak in the actual DIO line shows its big differencefrom the budgeted DIO at the end of the first quarter which isbecause sales is very less procurement is much more than theoptimal purchase specified.In September 2013 again actual DIO is more than the desiredlevel. Though purchase was less than the optimal level butsale was very low.Again in the month of December 2013 actual DIO increased dueto very low sales and also procurement was still more than theoptimal level.
FARIDABAD
32

Fig-10Similarly for Faridabad trend in actual DIO can be seen fromthe above figure. In July 2013 a large difference can be seenin the actual DIO and the desired DIO level which is due tothe more procurement than the optimal level and low sales. Forother locations refer to Annexure-6.In the 3rd and 4th quarter actual DIO is continuously more thanthe desired level because procurement is more than the idealaverage procurement.It is clear from both the figures fig-8 and fig-9 that inorder to keep the actual DIO near to the budgeted DIO or thedesired level, quantity of the procurement needs to at theoptimal level. If the procurement will take place at theoptimal quantity then the company would be able to minimizeits 90-180 days stock and thereafter it would be possible toavoid the greater than 180 days stock.
33
0100020003000400050006000700080009000
10000
0
10
20
30
40
50
60
PurchaseSalesActual DIO
Sales is very less and procurement is more.
Procurement was more than the ideal average procurement in 3rd & 4th quarter.

8. FINDINGS After collecting the reasons for greater than 180 days
stock analysis was done and it was found that the majorreason that came out was “No schedule from the customer”.
This means in anticipation of the future sales morequantity of materials were procured than the requiredquantity of the customers. It means indent planning ofthe materials is not aligned with the sales which shouldbe avoided.
From the trend in greater than 180 days stock of all thelocation (Fig-6) it was observed that at the start of thequarter its total quantity increases which is due to the90-180 days materials of previous quarter getting addedup.
It was seen that movement of greater than 180 days stockis directly related to the movement of 90-180 days stock.
Because of the large quantity of 90-180 days materialslocations are not able to clear their greater than 180days stock. So more focus should be placed on minimizing90-180 days materials.
Materials procured when not sold within the estimatedtime are likely to be present in the stock for more than90 days and thus entering the 90-180 days bracket.
All locations have their target DIO which determines howeasily they are able to convert their inventory intocash. Lower the DIO better it is for the company. Butafter analyzing the stock details and sales details itwas found that except for one or two location all othersare exceeding their target DIO.
In order to achieve the target DIO the procurement shouldbe brought down to the optimal level.
If the company manages to achieve the optimal level ofprocurement quantity then the company would be able tominimize its 90-180 days stock and thereafter it would bepossible to avoid the greater than 180 days stock.
34

9. RECOMMENDATIONThere has to be a proper disposal mechanism for avoiding the stock getting over age, for which the following steps can be taken:
Materials are kept in stock for long in hope that theywould be sold in future which should be avoided insteadmaterials should be kept only up to a limited number ofdays, for example suppose for 60 days, after that thosematerials could be sold on discount.
If at any location it is not possible to sell thematerial within the fixed time frame then other optionsshould be explored for selling of materials which can belike identifying the other locations of TSPDL where thereis the demand of that material and thus can be sold fromthere.
There should be the review of all finished goods and raw materials at the end of every month.
All the scrap materials has to be posted in the right time frame, for example take it to be within 4 days afteridentifying scrap through review process.
All the materials with quality issues have to be posted in the right time frame similar to scrap materials and ifpossible to eliminate the issues by reprocessing then it has to be done as soon as possible.
After the posting of scrap materials and materials with quality issues, those materials have to be disposed from the system within the fixed time frame.
35
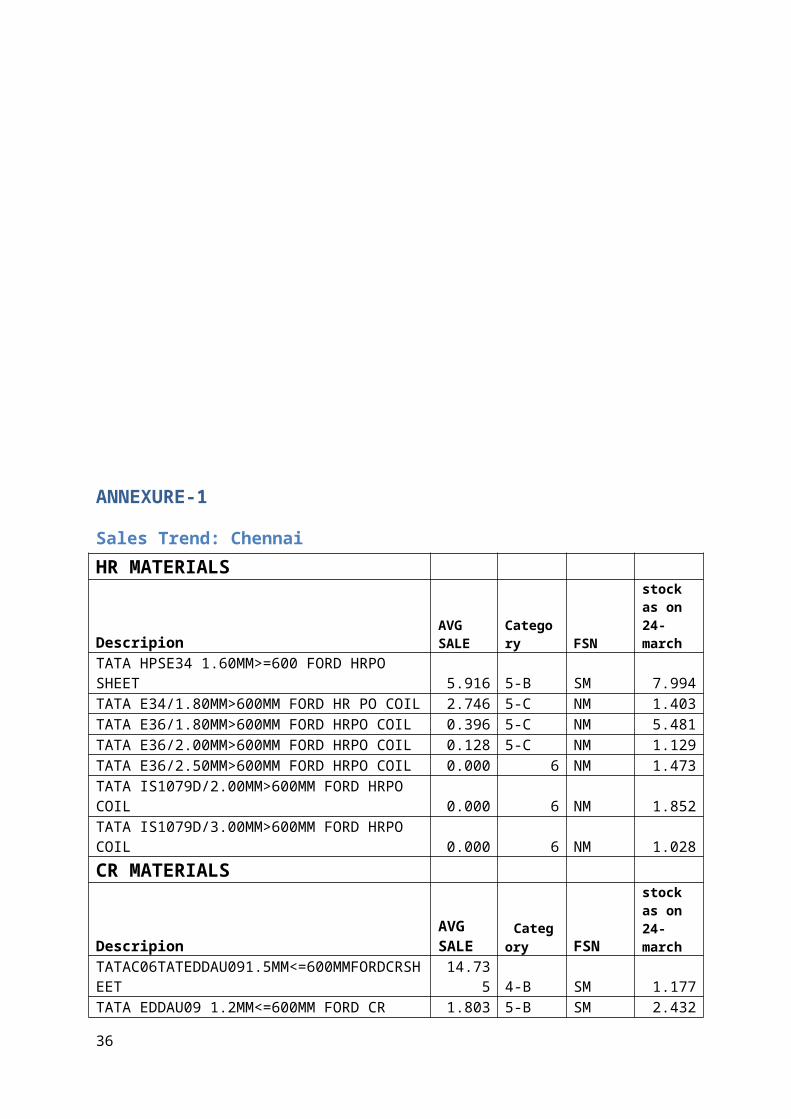
ANNEXURE-1
Sales Trend: ChennaiHR MATERIALS
DescripionAVG SALE
Category FSN
stock as on 24-march
TATA HPSE34 1.60MM>=600 FORD HRPO SHEET 5.916 5-B SM 7.994TATA E34/1.80MM>600MM FORD HR PO COIL 2.746 5-C NM 1.403TATA E36/1.80MM>600MM FORD HRPO COIL 0.396 5-C NM 5.481TATA E36/2.00MM>600MM FORD HRPO COIL 0.128 5-C NM 1.129TATA E36/2.50MM>600MM FORD HRPO COIL 0.000 6 NM 1.473TATA IS1079D/2.00MM>600MM FORD HRPO COIL 0.000 6 NM 1.852TATA IS1079D/3.00MM>600MM FORD HRPO COIL 0.000 6 NM 1.028CR MATERIALS
DescripionAVG SALE
Category FSN
stock as on 24-march
TATAC06TATEDDAU091.5MM<=600MMFORDCRSHEET
14.735 4-B SM 1.177
TATA EDDAU09 1.2MM<=600MM FORD CR 1.803 5-B SM 2.432
36

SHEETTATA AU14 3.0MM> = 600 TVS CR COIL 1.056 5-C NM 1.196TATAC06 EALTATEDDAU091.0<=600MMFORDCRST 0.513 5-C NM 2.008TATA TATEDD AU09/ 0.75MM<=600MM FORD CR 0.281 5-C NM 1.359
Sales Trend: PantnagarCR Materials
DescriptionAVG SALE
Category FSN
stock as on 24-march
EIF TATPFC HS01 0.7MM/>=600MM/CR Sheet
170.648 1-B FM 5.522
IFHS 350 HS02/0.80MM/<600MM/CR SHEET38.90
9 3-B FM 9.068TATXXD DQ AU14/1.20MM/<=600/CR Sheet 9.691 5-B SM 0.45DQ AU14/1.00MM/>=600MM/CR COIL 3.214 5-C NM 1.138DQ AU03/ 1.80MM<=600MM CR SHEET 2.737 5-C NM 2.7CRSHEET-ICF DQ AU03/1.80mm/>=600mm/COIL 0.000 6 NM 7.543EIF TATPFC HS01/0.80MM/>=600MM/CR COIL 0.000 6 NM 16.774HR Materials
DescriptionAVG SALE
Category FSN
stock as on 24-march
DD1079/2.00MM/<600MM/HR PICKLED SHEET42.46
5 3-B FM 0.33
Sales Trend: FaridabadHR Materials
DescriptionAVG SALE
Categories FSN
Stock as on 24-march
37

1079EDD/3.60MM<=600MM aSTRUM HRPO SHEET
128.499 1-B FM 0.412
FE360/1.80MM<=600MM aSTRUM HR PO SHEET
53.266 2-B FM 1.538
IS2062GRAFE410/5.00MM<=600MM aSTRUM HRPO
46.734 3-B FM 0.835
IS2062GRA/7.60MM<=600MM aSTRUM HRUPSHEET
42.949 3-B FM 2.15
IS2062A/5.50MM<=600MM aSTRUM HRPO SHEET
24.447 3-B FM 0.326
2062 GRA/6.00MM<=600MM aSTRUM HRPO SHEET
22.035 3-B FM 0.5
IS 2062 GR A /5.0/>600 MM HR Sheet15.79
4 4-C SM 0.98
SAPH440/2.60MM<=600MM HRPO SHEET12.42
2 4-C SM 2.03IS2062GRA/5.80MM<=600MM aSTRUM HRUPSHEET 7.308 5-B SM 0.58HR SHEET IS:1079D / 4.00 / < 600MM 6.827 5-B SM 1.1772062E250AFE410/5.50MM>600MM aSTRUM HR PO 4.699 5-C NM 1.04710748GR1/5.90MM<=600MM aSTRUM HRUP SHEET 4.199 5-C NM 11.1HR SHEET 2062 GR A /3.0/ < 600 MM(UP) 4.101 5-C NM 1.97IS:2062 A /<600MM/8.0 MM/ HR SHEETS (PO) 3.847 5-C NM 1.02HR SHEET 10748 GR1 /2.50/ < 600 MM P& O 3.704 5-C NM 1.471HPS79DTY15/2.20MM<=600MM MARUTI HRSPOSHT 3.561 5-C NM 3.40311513 EDD/6.30MM>600MM HRPO SHEET 3.114 5-C NM 1.4951079 DD/6.00MM<=600MM HR PO SHEET 2.571 5-C NM 9.71079 D/2.3 MM/>600/HR SHEETS (PO) 2.187 5-B SM 0.275HPS79D/2.50MM<=600MM MARUTI HRSPO COIL 2.158 5-C NM 1.007IS2062GRA/5.00MM<=600MM HR UP SHEET 2.106 5-C NM 0.77HR SHEET IS:1079D / 2.5 / <=600MM(UP) 2.079 5-C NM 1.391079D/6.00MM<=600MM aSTRUM HR UP SHEET 1.713 5-C NM 1.05IS:1079 D /<600MM/3.5 MM/ HR SHEETS (PO) 1.350 5-C NM 1.31510748 GR1/4.90MM<=600MM HR UP SHEET 0.854 5-C NM 1.3910748GR1/3.55MM<=600MM aSTRUM HRPO 0.000 6 NM 2.624
38

SHEET1079DD/2.60MM<=600 MMKVHS HRPO SLITCOIL 0.000 6 NM 1.441079DD/3.50MM<=600MM aSTRUM HR PO SHEET 0.000 6 NM 0.651079EDD/6.00MM>600MM HR PO COIL 0.000 6 NM 5.628C20MN120/ 1.90MM>600MM HR PO COIL 0.000 6 NM 1.784FE360/2.00MM<=600MM aSTRUM HR PO SHEET 0.000 6 NM 0.62IS1079D(A)/6.0/>600MM/HR COIL 0.000 6 NM 1.368IS2062GRAFe410/4.50MM>600MM HR UP COIL 0.000 6 NM 1.096SAPH 370/<600MM/2.3 MM/ HR SHEETS (PO) 0.000 6 NM 1.18GP Materials
DescriptionAVG SALE
Categories FSN
Stock as on 24-march
GP SHEET GLG-2 / 1.00 / > 600 MM27.28
2 3-B FM 0.815
GP SHEET GLG2 / 1.20 / > 600 MM26.47
4 3-B FM 0.49
GP SHEET GLG2 / 0.80 / < 600MM24.41
5 3-B FM 16.313
GP SHEET GLP-3 / 1.50 / > 600 MM20.50
8 3-C SM 0.54GP SHEET GLA1 / 1.50 / > 600 MM 5.806 5-C NM 0.755GP COIL GLG2 / 0.80MM>600 MM 3.510 5-B SM 3.672GP COIL GLB1 / 0.90 / > 600 MM 2.966 5-C NM 1.15GP COIL GLG2 / 1.50 / > 600 MM 2.369 5-C NM 1.6GP SHEET GLA-1 / 1.00 / > 600 MM 1.907 5-B SM 1.86GAS1/1.60MM>600MM GP SHEET 1.399 5-C NM 1.162GP SHEET CE10 / 0.80 / >600 MM 0.000 6 NM 3.685
Sales Trend: PuneHR Materials
DescriptionAVG SALE
Categories FSN
stock as on 24-march
2062E250AFE410/5.00MM>600MM HR UP SHEET
70.842 2-B FM 0.502
IS 2062E250AFE410W/10.00MM/ HR UP 58.92 2-B FM 0.706
39

Plate 1
IS2062E/8.00MM>600MM KVHS HR UP SHEET37.70
3 3-B FM 0.565
TAT79D YH03/2.00MM>600MM HR PO SHEET31.63
2 3-B FM 1.065IS1079DYH03/2.40MM>600MM KVHS HRPO SHEET
17.144 4-B SM 1.488
IS2062E250A(PL)ECA/7.00MM>600MM KVHSHRUP 3.482 5-C NM 32.04FE410/6.00MM/HR UNPICKLED SHEETS 1.976 5-C NM 2.3ST52AT/8.00MM>600MM HR UP SHEET 0.573 5-C NM 4.213IS1079DD/2.50MM>600MM KVHS HR PO COIL 0.043 5-C NM 1.3452062E250FE410WASME/3.00MM>600MMKVHS HRUP 0.000 6 NM 1.565CR Materials
DescriptionAVG SALE
Categories FSN
stock as on 24-march
XA37/1.6MM/=> 6000 CR SHEETS52.46
5 2-B FM 1.46XA09/1.50MM>600MM CR SHEET 4.328 5-C NM 2.905XA14/1.20MM>600MM CR SHEET 3.153 5-C NM 2.89 AU03/3.0MM=<600MM CR Sheet 0.000 6 NM 10.165
ANNEXURE-2
Bangalore ReasonsREASONS QUANTITY
40

No schedule 13 tons per monthQuality issue 10 tons per monthScrap 2 tons per month
Jamshedpur ReasonsRESONS QUANTITYNo schedule 16 tons per monthSales return/rejection 16 tons per monthQuality issue 6 tons per monthScrap 0.4 tons per monthcoil repeat 14 tons per monthMisplaced 14 tons per month
Faridabad ReasonsReasons Quantity (in tons)No Schedule 45 tons/monthSales return/ Rejection 8 tons/monthQuality issues 27 tons /monthScrap 35 tons/monthOffcuts 6 tons/monthSpecification mismatch 18 ton in Feb-2014
Pune ReasonsReasons Quantity (in tons)
No schedule 8 tons/monthReturn/ Rejection 7 tons/monthQuality issues 4 tons/monthScrap 6 tons/monthPayment Delay 6 tons in Dec 2013
Chennai ReasonsREASONS QUANTITYNo schedule 44 tons/monthScrap 4 tons/monthCustomer rejection 3 ton in Dec 2013
41

ANNEXURE-3
Location wise Detail of Greater than 180 days Materials Jamshedpur
Faridabad
Pantnagar Chennai
Bangalore Pune Howrah Total
13-Apr 308 209 0 2 1 34 6 56013-May 69 268 0 7 16 44 9 41313-Jun 38 440 0 26 13 49 21 58713-Jul 0 224 3 42 59 69 14 41113-Aug 9 305 9 30 50 63 23 48913-Sep 2 39 0 13 17 14 22 10713-Oct 17 115 0 53 24 29 21 25913-Nov 11 116 0 76 39 88 45 37513-Dec 0 47 1 53 3 2 3 10914-Jan 34 98 0 41 23 13 4 21314-Feb 61 134 25 14 1 69 15 31914-Mar 0 15 0 5 0 0 0 20Average 46 168 3 30 21 40 15
42

ANNEXURE-4
Relationship between 90-180 and Greater than 180 days Materials
43
Quarter-1 Quarter-2 Quarter-3 Quarter-40
500
1000
1500
2000
2500
3000
050100150200250300350400450JAMSHEDPUR
91-180 days>180 days
QuantityIn tons

Quarter-1 Quarter-2 Quarter-3 Quarter-40
500
1000
1500
2000
2500
0
5
10
15
20
25
30PANTNAGAR
91-180 days>180 daysQuantity
in tons
44
Quarter-1 Quarter-2 Quarter-3 Quarter-40
500
1000
1500
2000
2500
3000
0
100
200
300
400
500
600
700
800
900
1000FARIDABAD
91-180 days>180 daysQuantity
in tons

ANNEXURE-5
Days Inventory OutstandingJamshedpur
Faridabad
Pantnagar
Chennai
Bangalore Pune Howrah
Apr-13 18 34 46 31 29 37 40May-13 19 43 51 31 38 45 44Jun-13 53 54 77 39 39 37 38Jul-13 33 48 56 41 58 60 33Aug-13 35 42 51 36 62 45 26Sep-13 56 29 32 39 31 47 35Oct-13 29 32 33 39 32 45 46Nov-13 23 40 52 43 32 51 37Dec-13 43 43 56 38 35 38 32Jan-14 21 43 56 39 37 39 30Feb-14 15 45 43 36 44 43 28Mar-14 22 45 42 20 46 27 22Average 31 42 50 36 40 43 34ABP 24 35 35 21 31 30 32
45
Quarter-1
Quarter-2
Quarter-3
Quarter-4
0
100
200
300
400
500
600
0
20
40
60
80
100
120
140BANGALORE
91-180 days>180 daysQuantity
in tons

fy-14
ANNEXURE-6
RELATIONSHIP BETWEEN DIO, SALES & PURCHASE
Apr-13
May-13
Jun-13
Jul-13
Aug-13
Sep-13
Oct-13
Nov-13
Dec-13
Jan-14
Feb-14
Mar-14
0
1000
2000
3000
4000
5000
6000
7000
0102030405060708090
Pantnagar
PurchaseSalesActual DIOABP DIO
Quanttityin tons
46

Apr-13
May-13
Jun-13
Jul-13
Aug-13
Sep-13
Oct-13
Nov-13
Dec-13
Jan-14
Feb-14
Mar-14
05001000150020002500300035004000
0
10
20
30
40
50
60
70Pune
PurchaseSalesActual DIOABP DIO
Quantityin tons
47
Apr-13
May-13
Jun-13
Jul-13
Aug-13
Sep-13
Oct-13
Nov-13
Dec-13
Jan-14
Feb-14
Mar-14
0
200
400
600
800
1000
1200
1400
1600
0
10
20
30
40
50
60
70Bangalore
PurchaseSalesActual DIOABP DIO
Quantityin tons

Apr-13
May-13
Jun-13
Jul-13
Aug-13
Sep-13
Oct-13
Nov-13
Dec-13
Jan-14
Feb-14
Mar-14
0
500
1000
1500
2000
2500
3000
3500
05101520253035404550
Chennai
PurchaseSalesActual DIOABP DIO
Quantityin tons
Apr-13
May-13
Jun-13
Jul-13
Aug-13
Sep-13
Oct-13
Nov-13
Dec-13
Jan-14
Feb-14
Mar-14
0
200
400
600
800
1000
1200
1400
1600
05101520253035404550
Howrah
PurchaseSalesActual DIOABP DIO
Quantityin tons
48

49