The epidemiology of ALS and the role of population-based registries
Upload
khangminh22Category
view
3download
0

Clinicopathological Profile of Cancers in India:
A Report of the Hospital Based Cancer Registries,
2021

This report was prepared by the Indian Council of Medical Research - National Centre for Disease
Informatics and Research, Bengaluru.
Published by:
Director,
ICMR-National Centre for Disease Informatics and Research, Bengaluru - 562 110.
Website: https://www.ncdirindia.org
Updated Version dated 24th September 2021
ISBN: 978-93-5526-6965
©Indian Council of Medical Research - National Centre for Disease Informatics and Research
The contents of this publication may be reproduced and redistributed in whole or in part, provided
the contents are not altered and full acknowledgment is given to ICMR-NCDIR as per Citation.
Suggested citation: ICMR-NCDIR, Clinicopathological Profile of Cancers in India: A Report of the
Hospital Based Cancer Registries, 2021, Bengaluru, India

Table of Contents
Contents Page No.
Preface 2
Foreword 3
Message 4
Acknowledgement 5
Reviewers 6
Executive Summary 8
Introduction 10
Section I A. Number and Relative Proportion of New Cases Reported in
Hospital Based Cancer Registries
13
B. Cancers in Childhood 17
C. Cancer in Sites Associated with Tobacco Use 32
Section II 1. Cancers of the Head and Neck (C01-C14, C32 except C07-C08)
35
2. Gastrointestinal Tract Cancers (C15 – C25) 50
3. Lung Cancer (C33 –C34) 69
4. Gynaecological Cancers including Breast Cancer (C50-C58) 75
5. Prostate Cancer (C61) 86
6. Cancers of Kidney (C64) and Urinary Bladder (C67) 92
7. Cancers of Brain and Nervous System (C70-C72) 103
8. Thyroid Cancer (C73) 109
Annexure 1 - Terminologies 115
Annexure 2 - Snapshot of Registries 116
References 146

2

3

4

5

6
Reviewers
Research Area Panel on Cancer
1 Dr. G.K. Rath Head, National Cancer Institute (2nd Campus AIIMS, Jhajjar, Haryana) & Chief, Dr. B R Ambedkar Institute Rotary Cancer Hospital Professor, Department of Radiation Oncology All India Institute of Medical Sciences New Delhi – 110 029
2 Dr. A. C. Kataki Director Dr. B. Borooah Cancer Institute (Regional Institute for Treatment & Research) Gopinath Nagar, Guwahati -781016
3 Dr. P.P. Bapsy 19, GA Palm groove Tower Palm groove Road Bengaluru 560047
4 Dr. P.C .Gupta Director Healis 501, Technocity, Plot X-4/5A, MIDC, T.T.C. Industrial area, Mahape, Navi Mumbai 400701.
5 Dr. R Sankaranarayanan Senior Visiting Scientist, WHO-IARC, Lyon, France Senior Medical Advisor, RTI International Visiting Expert for Cancer Programs, 3/161, Bharathy Avenue, Vellanaipatti post, Coimbatore-641048
6 Dr. Rekha V. Kumar Former Professor & Head of Pathology, Kidwai Memorial Institute of Oncology, Senior Consultant (Histopathology) & Head, Department of Pathology, Sri Shankara Cancer Hospital and Research Centre, Bangalore-560004
7 Prof. Sandeep Kumar
Consultant Surgeon, Scientist & Epidemiologist Professor & Founder Director AIIMS Bhopal Editor-in-Chief Indian Journal of Surgery` B 52, J Park, Mahanagar Lucknow - 226006, UP
8 Dr. Yogesh Verma Professor, Department of Pathology Sikkim Manipal Institute of Medical Sciences Gangtok 737101

7
NCRP Reviewers
1 Dr. Punita Lal Professor & Head Dept. of Radiotherapy Sanjay Gandhi Post Graduate Institute of Medical Sciences, Lucknow
2 Dr. Aleyamma Mathew Professor & Head Dept. of Epidemiology & Biostatistics, Regional Cancer Centre, Thiruvananthapuram
3 Dr. Nitin Gangane Dean, Professor & Head Dept of Pathology Mahatma Gandhi Institute of Medical Sciences
4 Dr. Gautam Majumdar Medical Superintendent Regional Cancer Centre, Agartala
5 Dr. Paul Thaliath Addl. Director Medical & Head Dept. of Radiation Oncology Regional Cancer Centre Kamala Nehru Memorial Hospital, Allahabad
6 Dr. Sunil Kumar Additional Professor Dept. of Surgical Oncology Dr. B.R. Ambedkar Institute Rotary Cancer Hospital, New Delhi
7 Dr. Gauri Kapoor
Director Pediatric Hematology & Oncology Rajiv Gandhi Cancer Institute & Research Centre
8 Dr. Swaminathan Associate Director & Head Dept. of Epidemiology, Biostatistics and Cancer registry Cancer Institute (WIA), Chennai
9 Dr. Sadashivudu
Additional Professor and Head Dept. of Medical Oncology, Nizams Institute of Medical Sciences, Hyderabad
10 Dr. Gunaseelan Additional Professor & Head Dept. of Radiation Oncology JIPMER, Regional Cancer Centre, Puducherry
11 Dr. Anand Shah
Assistant Professor Dept. of Community Oncology and Medical Records The Gujarat Cancer & Research Institute, Ahmedabad
12 Dr. Ganesh B Former Prof. & Head Dept of Medical records, Biostatistics & Epidemiology Tata Memorial Hospital, Mumbai
13 Mr. Vijay C R Assistant Professor Dept. of Epidemiology and Biostatistics Kidwai Memorial Institute of Oncology, Bengaluru
14 Dr. R. Ravi Kannan Director Cachar Cancer Hospital and Research Centre, Silchar


8
Executive Summary
Cancer is rapidly emerging as a matter of public health concern in India. In 2020, there
were an estimated 1.39 million cancers in India. Cancer surveillance is an essential part
of cancer prevention and control efforts. The Indian Council of Medical Research (ICMR)
started the National Cancer Registry Programme (NCRP) in 1981, through a network of
Population and Hospital Based Cancer Registries (PBCRs and HBCRs). Cancer registries
systematically collect, store, analyze, interpret and generate meaningful data on
cancer, which helps develop plans and implement effective evidence-based strategies.
HBCRs contribute to providing robust data on clinical, pathological and treatment-
related details of cancer patients availing of care at designated cancer care facilities.
This report, "Clinicopathological Profile of Cancers in India: A Report of Hospital Based
Cancer Registries, 2021", is based on eight-year data of cancer cases from 96 HBCRs'
under the NCRP. The data pertains to all diagnosed and treated patients of confirmed
malignancies reported to these centres across the country. The report presents a
general overview of the proportion of cancer sites relative to all sites, cancers in sites
associated with tobacco use, childhood cancers and detailed chapters for cancers in
various organs sites, which include head and neck, gastrointestinal tract, lung, prostate,
central nervous system, thyroid, kidney, bladder, childhood and gynaecological cancers
including breast.
A total of 1332207 cancer cases were registered from 96 hospitals under the NCRP
during 2012-19. Of these, 610084 cases, were included for analysis, based on the
completeness and quality of data.
Key Findings
• Out of 610084 cancers, 319098 (52.4%) cancers were reported in males, and
290986 (47.6%) in females.
• Childhood cancers (0-14 years) comprised 4.0% of all cancers.
• Cancers in sites associated with tobacco use comprised 48.7% of cancers among
males and 16.5% among females.

9
• Cancers of the head and neck region accounted for nearly one third (31.2%) of
the cancers among males. Gynaecologic cancers, including breast cancer (51%),
accounted for over half of all cancers in females.
• The relative proportion of site-specific cancers was higher in males than
females except for thyroid cancer (2.5 % in females versus 1% in males) and
gall bladder cancer (3.7% in females versus 2.2 % in males)
• The highest proportion of cancer from all sites were reported in the age group
45 to 64 years, except for prostate cancer, which was higher in those over 65.
• Over 90% of the cancers in different organ sites got diagnosed by microscopic
examination.
• Among all the cancers, the highest proportion of distant metastasis at
presentation was seen in patients with lung cancer (49.2% males and 55.5%
females), followed by gall bladder cancer (40.9% males and 45.7% females) and
prostate cancer (42.9%).
• Over one-third of patients with cancers of the tongue, larynx, thyroid, corpus
uteri, kidney (including children), bladder and retinoblastoma had localized
disease at the time of presentation.
• Chemotherapy was the most typical treatment modality for many cancers
regardless of the clinical extent of disease at presentation, including cancers of
the liver, gall bladder, stomach, lung and childhood cancers.
• Regardless of the organ site and clinical extent, most cancer patients, were
initiated on cancer-directed treatment within 8 to 30 days of diagnosis.
• Over half of the patients with cancer of the brain and nervous system and about
one-third of the patients of lung, prostate, bladder and thyroid cancer with
localized disease, diagnosed at the reporting institution were initiated on cancer-
directed treatment on the same day.

10
Introduction
In India, the number of new cases of cancer was estimated to be 1.39 million in 2020 [1].
Globally, cancer is among the leading causes of death, contributing to about 10 million deaths
during 2020[2]. India exhibits a wide heterogeneity in the geographic incidence of cancer.
According to the recent report of the National Cancer Registry Programme of 2020, the cancer
incidence rates in Aizawl district were about seven times higher than the rates in Osmanabad
district [1].
The rising cancer incidence is bound to exert a tremendous strain on people and the health
systems, which may be least prepared to manage this burden. Cancer registries play a crucial
role in cancer prevention and control by generating systematic and timely information on new
cases of cancer, which enable health system preparedness and framing of programmes and
policies.
Cancer has a unique course, and control can be achieved through providing information to the
general population on trends in the occurrence, profile and distribution of cancer cases. The
Ministry of Health and Family Welfare (MoHFW) has developed several legislations, policies
and programmes to enable and strengthen cancer prevention and control.
Present Status/policies/Programmes
The National Health Policy (NHP) 2017 focuses and commits itself to prevention, early
diagnosis and treatment for all Noncommunicable Diseases (NCDs'), including cancer [3].
The cancer component under the National Programme for Prevention and Control of Cancer,
Diabetes, Cardiovascular diseases and Stroke (NPCDCS) focuses on [4]
1. Primary prevention through information, education and communication (IEC) and
Behavioural Change Communication (BCC)
2. Secondary prevention, through early detection and diagnosis of common cancers like
cervix, oral cancers and breast cancers.
3. Tertiary prevention by means of strengthening of provision of cancer care, including
palliative care at the existing institutions and setting up of new institutions.
Strengthening existing regional cancer centres, oncology wings with the availability of cancer
treatment facilities, and assistance to NGOs working in cancer are some of the initiatives that
are part of this scheme.
The National Cancer Registry Programme
Cancer Registry aims for systematic collection, storage, analysis, interpretation and reporting
of patients diagnosed with cancer. They provide an opportunity to adequately assess the
extent and nature of the cancer burden in society. The ability to distinguish individuals by
events (e.g., hospital admissions) is a vital feature of a cancer registry. The records of cancer
patients are appropriately identified in a registry so that case abstraction can be performed.
The National Cancer Registry Programme (NCRP) under the Indian Council of Medical Research
(ICMR) has successfully collected cancer data since 1981. NCRP is coordinated by the
ICMR-National Centre for Disease Informatics and Research, Bengaluru. The NCRP collects the

11
data on cancer incidence, mortality, pattern, trend and geo-pathological distribution of
cancers. It also helps to formulate and implement policies and programmes, monitor and
evaluate the cancer control activities. NCRP started with a network of three PBCRs in
Bengaluru, Chennai and Mumbai and three HBCRs at Chandigarh, Dibrugarh and
Thiruvananthapuram. The registries have expanded into a vibrant network of 38 PBCRs and
269 HBCRs registered under NCRP. There are two types of cancer registry: hospital-based and
population based.
The Hospital Based Cancer Registries (HBCRs) record information on cancer patients attending a particular hospital, focusing on clinical care, treatment and outcome. Their primary purpose is to contribute to patient care and administrative management, although they may be helpful to a certain extent for epidemiological purposes. Population Based Cancer Registries (PBCRs) record all the new cancer cases occurring in a defined population within a geographic area. Cancer Atlas approaches have also been used for specific short-term purposes.
Functioning of Hospital Based Cancer Registry A Hospital Based Cancer Registry scientifically collates data on all confirmed malignancy cases from all departments and units where any cancer is diagnosed or treated in the hospital. Interdepartmental cooperation is a predominant feature of such a registry, as shown in Fig 1.
Fig 1 – Key departments providing information to HBCR
The information collected on a standardised core form is entered into a software-based
computer for transmission to ICMR- NCDIR, Bengaluru. Over the years, the registries and the
office of the NCRP have employed advanced electronic information technology for data entry,
data checks and verification for duplicates. . The software applications have advanced over the
years to provide robust support for data submission.The data quality is assessed for different
dimensions like validity, comparability, timeliness and completeness. Frequent training and

12
refresher programs are conducted for cancer registry investigators and staff to enhance
sustain the quality of registry work (Fig. 2).
The information collected on a standardised core form is entered into a software for
transmission to ICMR- NCDIR, Bengaluru. Over the years, the registries and the office of the
NCRP have used modern advances in electronic information technology to enter the data,
check the data, and verify duplicates. The software applications developed by ICMR-NCDIR
have further evolved, and so has the data submission methodology and overall support. Data
quality is assessed at the coordinating unit under different dimensions like comparability,
validity, timeliness and completeness. Frequent training and re-training programs are
conducted for cancer registry investigators and staff to maintain quality of work (Fig. 2).
Figure 2 - Features of a Hospital Based Cancer Registry
About this Report
This report " Clinicopathological Profile of Cancers in India: A Report of the Hospital Based Cancer Registries, 2021" consolidates the data collected during the period 2012-19 across 96 Hospital Based Cancer Registries under National Cancer Registry Programme. The data pertains to all diagnosed and treated cases of confirmed malignancies reported to these centres across the country. Registries whose data sets were complete and finalised have been included for the referenced period. These HBCRs are usually located in specialised oncology centres / general or multi-speciality hospitals (public & private) of the respective urban/ rural population. This report addresses the needs of clinicians, researchers, health professionals, policymakers, and those who would like to obtain and use cancer statistics. The aim is to give an idea regarding types of treatment administered to cancer patients in various stages of cancer, emphasising which organ site is the origin of the disease (primary site of cancer). The hospitals/centres which have contributed data to this report have been divided into groups and given zone-wise categorisation. The hospital-based data collected has been divided into six zones depending on the hospital's geographical location, which has contributed to the data. This is done for the ease of locating the hospital in the zone. Key findings of each chapter are mentioned at the end of each chapter. A total of 1332207 cancer cases were recorded from the 96 hospitals during the period 2012-19. The data of 610084 cases, for which complete details are available, were included for analysis
INTERDEPARTMENTAL
COOPERATION
Information that is obtained by
collaboration of all
departments within the
hospital
SEAMLESS DATA ENTRY
SOFTWARE Indigenously
developed software by ICMR-
NCDIR with real time data
entry
TRAINED REGISTRY STAFF
Periodic training of registry
staff to keep them updated
with registry abstraction
procedures


13
Section I A. Number and Relative Proportion of New Cases reported in Hospital Based Cancer Registries
Hospital Based Cancer Registries (HBCRs) are mainly involved in collecting, compiling and organizing
information on cancer patients diagnosed and/or treated in a medical institution. They serve the
needs of the hospital administration, the hospital's cancer programme, and above all, the individual
patient. Furthermore, HBCR data register information of cancer patients irrespective of their
residential status and give vital information to the individual hospital administration of all the patients
that visit the concerned hospital running the Hospital Based Cancer Registry.
Out of 269 HBCR centres registered under the NCRP, 96 HBCRs were selected which had completed
data transmission and quality checks for one or more years during the period 2012-2019 for inclusion
in the report. All the new cancer cases registered from government hospitals, private hospitals,
medical colleges and multi-speciality hospitals which mainly cater to cancer patients, were used for
analysis. The 96 HBCRs’ were distributed according to their location according to six regions of the
country- North, South, East, West, Central and North East.
Table A: Number (n) and Relative Proportion (%) of New Cases reported in 96 HBCRs under NCRP
Sl No
Registry (Period) Males Females Total
n % n % N
North
1 Dr. B.R. Ambedkar Institute Rotary Cancer Hospital, New Delhi (2012,2014-2017)
25600 55.6 20437 44.4 46037
2 PGIMER, Chandigarh (2012-2018) 24397 55.5 19568 44.5 43965
3 Mahavir Cancer Sansthan and Research Centre, Patna (2015-2018)
17658 46.5 20304 53.5 37962
4 Regional Cancer Centre Kamala Nehru Memorial Hospital, Prayagraj (2014-2019)
14619 51.6 13706 48.4 28325
5 Sher-I-Kashmir Institute of Medical Sciences, Srinagar (2012-2018)
13721 57.8 10014 42.2 23735
6 Rajiv Gandhi Cancer Institute and Research Centre, New Delhi (2012-2013,2017)
12887 56.4 9966 43.6 22853
7 Indira Gandhi Institute of Medical Sciences, Patna (2014-2018)
9586 51.9 8899 48.1 18485
8 Max Super Speciality Hospital, New Delhi (2013-2019) 9163 50.3 9056 49.7 18219
9 Fortis Memorial Research Institute, Gurugram (2014-2018) 9837 55.0 8035 45.0 17872
10 Medanta Cancer Centre, Gurugram (2012-2019) 7688 57.5 5684 42.5 13372
11 Sanjay Gandhi Post Graduate Institute of Medical Sciences, Lucknow (2014-2019)
7159 55.3 5786 44.7 12945

14
Sl No
Registry (Period) Males Females Total
n % n % N
12 Acharya Tulsi Regional Cancer Treatment and Research Institute, Bikaner (2018-2019)
6258 60.7 4055 39.3 10313
13 Government Medical College, Jammu (2014-2019) 5645 56.0 4440 44.0 10085
14 King George Medical University, Lucknow (2018-2019) 5796 59.1 4007 40.9 9803
15 Regional Cancer Centre Indira Gandhi Medical College, Shimla (2014-2018)
5133 53.4 4482 46.6 9615
16 J K Cancer Institute, Kanpur (2018-2019) 5801 62.9 3423 37.1 9224
17 Bhagwan Mahaveer Cancer Hospital and Research Centre, Jaipur (2018)
3819 58.8 2680 41.2 6499
18 Max Super Speciality Hospital, PPG, New Delhi (2015-2018)
2752 47.4 3052 52.6 5804
19 J.N. Medical College & Hospital, Aligarh (2018-2019) 3297 57.7 2416 42.3 5713
20 All India Institute of Medical Sciences, Rishikesh (2018-2019)
2989 59.8 2012 40.2 5001
21 Asian Institute of Medical Sciences, Faridabad (2016-2018) 2091 55.3 1688 44.7 3779
22 Max Super Speciality Hospital, Vaishali (2018-2019) 1523 48.1 1643 51.9 3166
23 Government Medical College and Hospital, Chandigarh (2017-2018)
1467 51.4 1386 48.6 2853
24 Institute of Liver and Biliary Sciences, New Delhi (2017-2018)
1178 70.5 493 29.5 1671
25 Cancer Research Institute - Himalayan Institute Hospital Trust, Dehradun (2016-2018)
1348 55.6 1076 44.4 2424
26 Max Super Speciality Hospital, Shalimar Bagh, New Delhi (2015,2017-2018)
705 44.9 865 55.1 1570
27 Guru Gobind Singh Medical College, Faridkot (2018) 459 40.2 682 59.8 1141
28 Jhalawar Medical College and SRG hospital, Jhalawar (2019)
139 54.1 118 45.9 257
29 Nayathi Health Care, Mathura (2018) 163 65.7 85 34.3 248
East
30 Acharya Harihar Regional Cancer Centre, Cuttack (2015-2019)
9550 45.7 11361 54.3 20911
31 Chittaranjan National Cancer Institute, Kolkata (2016-2018)
8113 52.4 7381 47.6 15494
32 Tata Medical Center, Kolkata (2015-2017) 7460 52.8 6663 47.2 14123
33 All India Institute of Medical Sciences, Bhubaneswar (2018-2019)
2979 56.1 2331 43.9 5310
34 Meherbai Tata Memorial Hospital, East Singhbhum (2017-2018)
2017 45.5 2419 54.5 4436
35 Apollo Hospital, Bhubaneswar (2012-2019) 1159 61.3 731 38.7 1890
36 Peerless Hospitex Hospital and Research Center Limited, Kolkata (2017-2018)
599 57.1 450 42.9 1049
West
37 Tata Memorial Hospital, Mumbai (2012-2014,2017,2018) 81588 57.0 61597 43.0 143185
38 The Gujarat Cancer & Research Institute, Ahmedabad (2014-2019)
68365 61.0 43652 39.0 112017
39 Kolhapur Cancer Centre, Kolhapur (2014,2017-2019) 4870 49.6 4948 50.4 9818
40 Apollo CBCC Cancer Care, Gandhinagar (2017-2019) 4614 63.6 2636 36.4 7250

15
Sl No
Registry (Period) Males Females Total
n % n % N
41 Pravara Rural Hospital & Rural Medical College, Loni (2012,2016-2019)
1725 43.4 2246 56.6 3971
42 Vivekananda Cancer Hospital, Latur (2018-2019) 642 53.6 555 46.4 1197
43 Kokilaben Dhirubhai Ambani Hospital & Medical Research Institute, Mumbai (2018)
422 48.0 457 52.0 879
South
44 Regional Cancer Centre, Thiruvananthapuram (2012-2019)
48245 49.1 49979 50.9 98224
45 Cancer Institute (WIA), Chennai (2012-2018) 29428 47.4 32599 52.6 62027
46 Kidwai Memorial Institute of Oncology, Bengaluru (2012-2017)
22913 44.8 28189 55.2 51102
47 Indo-American Cancer Institute & Research Centre, Hyderabad (2012,2017-2018)
11683 42.8 15630 57.2 27313
48 Amrita Institute of Medical Sciences & Research Centre, Kochi (2012-2018)
15057 55.8 11921 44.2 26978
49 Malabar Cancer Centre, Kannur (2012-2018) 12566 53.8 10804 46.2 23370
50 JIPMER, Regional Cancer Centre, Puducherry (2014-2017) 7681 43.5 9957 56.5 17638
51 Vydehi Institute of Medical Sciences, Bengaluru (2012-2018)
6623 53.6 5727 46.4 12350
52 Govt Arignar Anna Memorial Cancer Hospital & Research Institute, RCC, Kanchipuram (2014-2019)
3646 37.5 6065 62.5 9711
53 Government Medical College, Thrissur (2014,2017-2018) 5312 55.5 4263 44.5 9575
54 Narayana Hrudayalaya Health City, Bengaluru (2016-2019) 3988 55.7 3176 44.3 7164
55 St. Johns Medical Hospital, Bengaluru (2013-2019) 3629 51.1 3476 48.9 7105
56 MNJ Institute of Oncology and Regional Cancer Centre, Hyderabad (2017)
3032 47.1 3412 52.9 6444
57 Caritas Cancer Institute - Caritas Hospital, Kottayam (2013-2015)
2178 46.9 2470 53.1 4648
58 Lakeshore Hospital and Research Centre Ltd., Kochi (2012,2015-2017)
2257 49.8 2272 50.2 4529
59 Father Muller Medical College Hospital, Mangaluru (2016-2019)
1819 44.2 2294 55.8 4113
60 International Cancer Centre, Neyyoor (2012-2018) 1832 46.7 2093 53.3 3925
61 KMC Hospital, Mangaluru (2015-2018) 2022 52.0 1868 48.0 3890
62 Madras Cancer Care Foundation, Chennai (2013-2019) 1334 38.0 2175 62.0 3509
63 Government Royapettah Hospital, Chennai (2017-2018) 1503 43.9 1923 56.1 3426
64 Kovai Medical Centre and Hospital, Coimbatore (2017-2018)
1591 47.7 1741 52.3 3332
65 Nizams Institute of Medical Sciences, Hyderabad (2017) 1816 56.4 1402 43.6 3218
66 General Hospital, Ernakulam (2017-2018) 1598 51.7 1494 48.3 3092
67 MVR Cancer Center and Research Institute, Kozhikode (2018)
1567 51.4 1480 48.6 3047
68 Baby Memorial Hospital Ltd., Kozhikode (2017-2019) 1558 51.1 1488 48.9 3046
69 Government Stanley Medical College, Chennai (2017-2019)
1619 53.4 1410 46.6 3029
70 Rural Development Trust, Bathalapalle (2012-2019) 709 24.4 2194 75.6 2903

16
Sl No
Registry (Period) Males Females Total
n % n % N
71 Madras Medical College, Chennai (2017) 1493 56.1 1168 43.9 2661
72 Erode Cancer Centre, Thindal, Erode (2012,2017-2018) 973 43.2 1279 56.8 2252
73 Cytecare Hospitals PVT LTD, Bengaluru (2017-2018) 854 45.3 1033 54.7 1887
74 Amala Institute of Medical Sciences, Amalanagar, Thrissur (2018)
882 47.3 983 52.7 1865
75 MES Medical College & Hospital, Perinthalmanna (2012,2015-2019)
929 50.5 910 49.5 1839
76 G Kuppuswamy Naidu Memorial Hospital, Coimbatore (2018)
695 40.5 1022 59.5 1717
77 Institute of Obstetrics and Gynaecology, Chennai (2017-2018)
154 12.7 1056 87.3 1210
78 Tirunelveli Medical College, Tirunelveli (2018-2019) 552 46.3 640 53.7 1192
79 Aster Medcity, Kochi (2017-2018) 608 52.2 556 47.8 1164
80 Mandya Institute of Medical Sciences, Mandya (2015-2019)
485 44.9 594 55.1 1079
81 Monsignor Joseph Kandathil Memorial Cancer Research Centre, Alappuzha (2018-2019)
447 47.1 502 52.9 949
82 Pushpagiri Institute of Medical Sciences & Research Centre, Tiruvalla (2016-2018)
440 47.5 486 52.5 926
83 ESIC Medical College Hospital and Super Speciality Hospital, Hyderabad (2017-2019)
200 38.9 314 61.1 514
Central
84 Regional Cancer Centre, Raipur (2012-2019) 9639 43.9 12314 56.1 21953
85 RST Regional Cancer Hospital, Cancer Relief Society, Nagpur (2012-2018)
9667 51.6 9057 48.4 18724
86 Cancer Hospital & Research Institute, Gwalior (2014-2017) 7772 60.4 5105 39.6 12877
87 Gandhi Medical College, Bhopal (2012-2019) 5692 51.6 5341 48.4 11033
North East
88 Dr. B. Borooah Cancer Institute, Guwahati (2012-2019) 39678 57.3 29523 42.7 69201
89 Cachar Cancer Hospital and Research Centre, Silchar (2012-2018)
6823 57.8 4983 42.2 11806
90 Regional Cancer Centre, Agartala (2014-2019) 6408 56.5 4936 43.5 11344
91 Assam Medical College, Dibrugarh (2012-2019) 4076 46.1 4769 53.9 8794
92 North East Cancer Hospital & Research Institute, Guwahati (2014-2018)
4002 61.4 2514 38.6 6516
93 Mizoram State Cancer Institute (Civil Hospital), Aizawl (2014-2019)
3169 52.3 2885 47.7 6054
94 Regional Institute of Medical Sciences, Imphal (2014-2019) 2656 44.5 3308 55.5 5964
95 State Cancer Institute, Guwahati (2018-2019) 2724 52.6 2455 47.4 5179
96 Naga Hospital Authority, Kohima (2019) 191 67.5 92 32.5 283
Total 705395 52.9 626812 47.1 1332207
The total number of cancer patients that were registered from 96 HBCRs from 2012 – 2019 were 1332207 cases, and final analysis was done using data of 610084 cases (319098 males; 290986 females) which had passed the quality checks.


17
Section 1 B: Cancers in Childhood
Childhood cancers rank ninth as a leading cause of childhood diseases at the global level,
accounting for 11·5 million (10·6–12·3 95% CI) of the Disability Adjusted Life Years (DALYs') [5]. In
India, according to a recent report of the National Cancer Registry Programme, the proportion of
childhood cancers (0-19 years) relative to cancers in all age groups was found to range from 1% to
4.9% [1]. Delhi PBCR reported the highest Age-Adjusted Incidence Rate (AAR) of 203.1 per million
in boys and 125.4 per million in girls. Leukaemia accounted for nearly half of all the childhood
cancers in both genders in the 0-14 years age group (46.4% in boys and 44.3% in girls). The other
common childhood cancer in boys was lymphoma (16.4%), while in girls, it was a malignant bone
tumour (8.9%). Childhood cancers are presented for two age groups: 0-14 years and 0-19 years to
enable national and international comparison. Childhood cancers have been classified according
to the International Classification of Childhood Cancer [6].
B1.1 Number (n) and relative proportion (%) of childhood cancers
Table B1.1.1: Number (n) and relative proportion (%) of childhood cancers (0-14 years)
relative to all cancers
Sex Childhood Cancers
n %
Boys 15549 4.9
Girls 8719 3.0
Total 24268 4.0
Table B1.1.2: Number (n) and relative proportion (%) of childhood cancers (0-19 years) relative to all cancers
Sex Childhood Cancers
n %
Boys 21845 6.8
Girls 12013 4.1
Total 33858 5.5

18
B1.2 Distribution of childhood cancers according to five-year age groups
Table B1.2: Number (n) and proportion (%) of childhood cancers according to five-year age groups
Age Group Boys Girls
n % n %
00-04 5262 24.1 3240 27.0
05-09 5212 23.9 2646 22.0
10-14 5075 23.2 2833 23.6
15-19 6296 28.8 3294 27.4
Total 21845 100.0 12013 100.0
B1.3 Distribution of childhood cancers according to type
Table B1.3.1: Number (n) and proportion (%) of specific types of cancers in childhood (0-14 years)
Specific types of cancers in childhood Boys Girls
n % n %
LEUKAEMIAS 7369 47.4 3932 45.1
Lymphoid leukaemia 5607 36.1 2961 34.0
Acute non-lymphocytic leukaemia 1141 7.3 642 7.4
Chronic myeloid leukaemia 180 1.2 114 1.3
Other specified leukaemia 59 0.4 33 0.3
Unspecified leukaemia 382 2.4 182 2.1
MALIGNANT BONE TUMOURS 1104 7.1 827 9.5
Osteosarcoma 565 3.6 407 4.7
Chondrosarcoma 16 0.1 7 0.1
Ewings sarcoma 470 3.0 361 4.1
Other specified malignant bone tumours 26 0.2 30 0.3
Unspecified malignant bone tumours 27 0.2 22 0.3
LYMPHOMAS & RETICULOENDOTHELIAL NEOP. 2581 16.6 679 7.8
Hodgkin’s disease 1246 8.0 286 3.3
Non-Hodgkin’s disease 895 5.8 279 3.2
Burkitt’s lymphoma 300 1.9 54 0.6
Miscellaneous lymphoreticular neoplasm 66 0.4 40 0.5
Unspecified lymphomas 74 0.5 20 0.2

19
C.N.S. & MISC. INTRACRANIAL & INTRASPINAL NEOP. 963 6.2 638 7.3
Ependymoma 141 0.9 81 0.9
Astrocytoma 188 1.2 130 1.5
Primitive neuroectodermal tumours 373 2.4 198 2.3
Other gliomas 182 1.2 155 1.8
Other specified intracranial and intraspinal neoplasms 38 0.2 29 0.3
Unspecified intracranial and intraspinal neoplasms 41 0.3 45 0.5
SOFT-TISSUE(S-T) SARCOMAS(S) 923 5.9 607 6.9
Rhabdomyosarcoma and embryonal sarcoma 418 2.7 262 3.0
Fibrosarcoma, neurofibrosarcoma and other fibromatous neoplasms
31 0.2 37 0.4
Kaposi’s sarcoma 1 <0.1 2 <0.1
Other specified soft tissue sarcoma 361 2.3 234 2.7
Unspecified soft tissue sarcoma 112 0.7 72 0.8
RENAL TUMOURS 571 3.7 410 4.7
Wilms tumour, rhabdoid and clear cell sarcoma 552 3.6 388 4.5
Renal carcinoma 19 0.1 22 0.2
GERM-CELL TROPHOBLASTIC & OTH. GONADAL NEOP. 208 1.3 350 4.0
Intracranial and intraspinal germ cell tumours 25 0.2 22 0.2
Other and unspecified non-gonadal germ cell tumours 67 0.4 83 0.9
Gonadal germ cell tumours 109 0.7 232 2.7
Gonadal carcinomas 4 <0.1 8 0.1
Other and unspecified gonadal tumours 3 <0.1 5 0.1
SYMPATHETIC NERVOUS SYSTEM TUMOURS 524 3.4 337 3.9
Neuroblastoma and ganglioneuroblastoma 510 3.3 336 3.9
Other sympathetic nervous system tumours 14 0.1 1 <0.1
RETINOBLASTOMA 458 3.0 342 3.9
CARCINOMA & OTHER MALIGNANT EPITHELIAL NEOP. 418 2.7 332 3.8
Adrenocortical carcinoma 10 0.1 7 0.1
Thyroid carcinoma 9 0.1 14 0.2
Nasopharyngeal carcinoma 116 0.7 23 0.3
Malignant melanoma 7 <0.1 4 <0.1
Skin carcinoma 19 0.1 9 0.1
Other and unspecified carcinoma 257 1.7 275 3.1
HEPATIC TUMOURS 226 1.5 138 1.6
Hepatoblastoma 196 1.3 119 1.4
hepatic carcinoma 27 0.2 12 0.1
Unspecified malignant hepatic tumours 3 <0.1 7 0.1
OTHER & UNSPECIFIED MALIGNANT NEOPLASMS 191 1.2 122 1.4
Other specified malignant tumours 16 0.1 11 0.1
Other unspecified malignant tumours 175 1.1 111 1.3
Others (not classified) 13 0.1 5 0.1
TOTAL 15549 100.0 8719 100.0

20
Table B1.3.2: Number (n) and proportion (%) of specific types of cancers in childhood (0-19 years)
Specific types of cancers in childhood Boys Girls
n % n %
LEUKAEMIAS 9603 44.0 4763 39.7
Lymphoid leukaemia 6976 31.9 3346 27.8
Acute non-lymphocytic leukaemia 1603 7.3 901 7.5
Chronic myeloid leukaemia 414 2.0 238 2.0
Other specified leukaemia 79 0.4 43 0.4
Unspecified leukaemia 531 2.4 235 2.0
MALIGNANT BONE TUMOURS 2389 10.9 1382 11.5
Osteosarcoma 1452 6.6 744 6.2
Chondrosarcoma 39 0.2 21 0.2
Ewings sarcoma 783 3.6 518 4.3
Other specified malignant bone tumours 66 0.3 61 0.5
Unspecified malignant bone tumours 49 0.2 38 0.3
LYMPHOMAS & RETICULOENDOTHELIAL NEOP. 3665 16.8 1120 9.3
Hodgkin’s disease 1795 8.2 524 4.3
Non-hodgkin’s disease 1363 6.2 454 3.8
Burkitt’s lymphoma 329 1.5 63 0.5
Miscellaneous lymphoreticular neoplasms 78 0.4 45 0.4
Unspecified lymphomas 100 0.5 34 0.3
CARCINOMA & OTH. MALIGNANT EPITHELIAL NEOP. 1042 4.9 991 8.2
Adrenocortical carcinoma 12 0.1 9 0.1
Thyroid carcinoma 22 0.1 52 0.4
Nasopharyngeal carcinoma 279 1.3 76 0.6
Malignant melanoma 12 0.1 7 <0.1
Skin carcinoma 37 0.2 22 0.2
Other and unspecified carcinoma 680 3.1 825 6.9
SOFT-TISSUE(S-T) SARCOMAS(S) 1344 6.1 892 7.4
Rhabdomyosarcoma and embryonal sarcoma 487 2.2 315 2.6
Fibrosarcoma, neurofibrosarcoma and other fibromatous neoplasms
63 0.3 67 0.6
Kaposi’s sarcoma 1 <0.1 2 <0.1
other specified soft tissue sarcoma 597 2.7 385 3.2
Unspecified soft tissue sarcoma 196 0.9 123 1.0

21
C.N.S. & MISC. INTRACRANIAL & INTRASPINAL NEOP. 1259 5.7 780 6.5
Ependymoma 161 0.7 101 0.8
Astrocytoma 286 1.3 182 1.5
Primitive neuroectodermal tumours 453 2.1 235 2.0
Other gliomas 253 1.2 177 1.5
Other specified intracranial and intraspinal neoplasms 53 0.2 37 0.3
Unspecified intracranial and intraspinal neoplasms 53 0.2 48 0.4
GERM-CELL TROPHOBLASTIC & OTH. GONADAL NEOP. 416 1.9 636 5.3
Intracranial and intraspinal germ cell tumours 46 0.2 30 0.2
Other and unspecified non-gonadal germ cell tumours 113 0.5 107 0.9
Gonadal germ cell tumours 236 1.1 451 3.8
Gonadal carcinomas 12 0.1 33 0.3
Other and unspecified gonadal tumours 9 <0.1 15 0.1
RENAL TUMOURS 587 2.7 428 3.6
Wilms tumour, rhabdoid and clear cell sarcoma 556 2.6 392 3.3
Renal carcinoma 31 0.1 36 0.3
SYMPATHETIC NERVOUS SYSTEM TUMOURS 546 2.5 351 2.9
Neuroblastoma and Ganglioneuroblastoma 524 2.4 344 2.8
Other sympathetic nervous system tumours 22 0.1 7 0.1
RETINOBLASTOMA 458 2.1 342 2.8
OTHER & UNSP. MALIGNANT NEOPLASMS 267 1.2 164 1.4
Other specified malignant tumours 21 0.1 25 0.2
Other unspecified malignant tumours 246 1.1 139 1.2
HEPATIC TUMOURS 249 1.1 151 1.3
Hepatoblastoma 196 0.9 119 1.0
Hepatic carcinoma 49 0.2 23 0.2
Unspecified malignant hepatic tumours 4 <0.1 9 0.1
OTHERS (NOT CLASSIFIED) 20 0.1 13 0.1
TOTAL 21845 100.0 12013 100.0

22
II. Renal tumours
B2.1 Distribution according to age groups
Table B2.1: Number (n) and proportion (%) of renal tumours according to five-year age groups
Age group Boys Girls Total
n Col % Row % n Col % Row % n Col % Row %
00 - 04 442 70.8 60.7 286 63.3 39.3 728 67.7 100.0
05 - 09 123 19.7 52.6 111 24.6 47.4 234 21.7 100.0
10 - 14 36 5.8 54.5 30 6.6 45.5 66 6.1 100.0
15 - 19 23 3.7 47.9 25 5.5 52.1 48 4.5 100.0
Total 624 100.0 58.0 452 100.0 42.0 1076 100.0 100.0
B2.2 Major histological types
Table B2.2: Number (n) and proportion (%) of renal tumours according to broad histological classification
(0-19 years)
* Excludes data with ‘unknown values’
Broad histological classification Boys Girls Total
n % n % n %
Nephroblastoma 525 87.4 367 83.8 892 85.9
Renal Cell Carcinoma (RCC), NOS 26 4.3 33 7.5 59 5.7
Clear Cell Sarcoma of Kidney 18 3.0 7 1.6 25 2.4
Neuroendocrine Tumours 5 0.8 8 1.8 13 1.3
Mesenchymal Tumours 12 2.0 6 1.4 18 1.7
Rhabdoid Tumour 3 0.5 4 0.9 7 0.7
Germ Cell Tumour 5 0.8 2 0.5 7 0.7
Papillary Renal Cell Carcinoma 2 0.3 3 0.7 5 0.5
Carcinoma, NOS 1 0.2 2 0.5 3 0.3
Sarcomatoid RCC 1 0.2 1 0.2 2 0.2
Clear Cell RCC 1 0.2 1 0.2 2 0.2
Renal Cell Carcinoma, Chromophobe Type 0 0.0 1 0.2 1 0.1
Others 2 0.3 3 0.7 5 0.5
Total* 601 100.0 438 100.0 1039 100.0

23
B2.3 Clinical Extent of Disease
Figure B2.3: Clinical extent of disease of of renal tumours (%) (0-19 years)
B2.4 Treatment modalities according to clinical extent of disease
Figure B2.4: Treatment modalities according to the clinical extent of disease (%) - renal tumours
(%) (0-19 years)
24
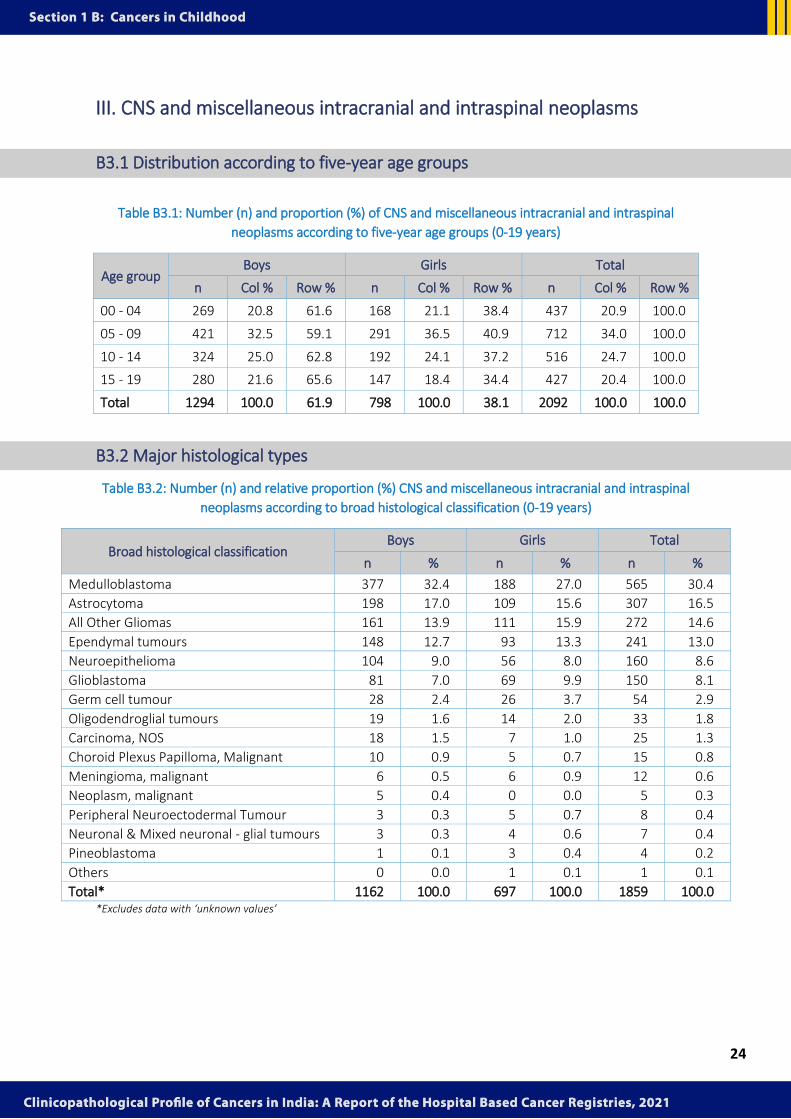
III. CNS and miscellaneous intracranial and intraspinal neoplasms
B3.1 Distribution according to five-year age groups
Table B3.1: Number (n) and proportion (%) of CNS and miscellaneous intracranial and intraspinal
neoplasms according to five-year age groups (0-19 years)
Age group Boys Girls Total
n Col % Row % n Col % Row % n Col % Row %
00 - 04 269 20.8 61.6 168 21.1 38.4 437 20.9 100.0
05 - 09 421 32.5 59.1 291 36.5 40.9 712 34.0 100.0
10 - 14 324 25.0 62.8 192 24.1 37.2 516 24.7 100.0
15 - 19 280 21.6 65.6 147 18.4 34.4 427 20.4 100.0
Total 1294 100.0 61.9 798 100.0 38.1 2092 100.0 100.0
B3.2 Major histological types
Table B3.2: Number (n) and relative proportion (%) CNS and miscellaneous intracranial and intraspinal
neoplasms according to broad histological classification (0-19 years)
Broad histological classification Boys Girls Total
n % n % n %
Medulloblastoma 377 32.4 188 27.0 565 30.4
Astrocytoma 198 17.0 109 15.6 307 16.5
All Other Gliomas 161 13.9 111 15.9 272 14.6
Ependymal tumours 148 12.7 93 13.3 241 13.0
Neuroepithelioma 104 9.0 56 8.0 160 8.6
Glioblastoma 81 7.0 69 9.9 150 8.1
Germ cell tumour 28 2.4 26 3.7 54 2.9
Oligodendroglial tumours 19 1.6 14 2.0 33 1.8
Carcinoma, NOS 18 1.5 7 1.0 25 1.3
Choroid Plexus Papilloma, Malignant 10 0.9 5 0.7 15 0.8
Meningioma, malignant 6 0.5 6 0.9 12 0.6
Neoplasm, malignant 5 0.4 0 0.0 5 0.3
Peripheral Neuroectodermal Tumour 3 0.3 5 0.7 8 0.4
Neuronal & Mixed neuronal - glial tumours 3 0.3 4 0.6 7 0.4
Pineoblastoma 1 0.1 3 0.4 4 0.2
Others 0 0.0 1 0.1 1 0.1
Total* 1162 100.0 697 100.0 1859 100.0 *Excludes data with ‘unknown values’

25
B3.3 Clinical Extent of Disease
Figure B3.1: Clinical extent of disease (%) - CNS and miscellaneous intracranial and intraspinal
neoplasms (0-19 years)
B3.4 Treatment modalities according to clinical extent of disease
Figure B3.2: Type of treatment according to the clinical extent of disease - CNS and miscellaneous intracranial and intraspinal neoplasms (0-19 years)

26
IV: Other solid tumours: Clinical extent of disease and treatment
B4.1 Retinoblastoma
B4.1.1 Clinical extent of disease
Figure B4.1.1: Clinical extent of disease (%) – Retinoblastoma (0-19 years)
B4.1.2 Treatment according to clinical extent of disease
Figure B4.1.2: Type of treatment according to the clinical extent of disease (%) –Retinoblastoma (0-19 years)

27
B4.2 Hepatic Tumours
B4.2.1 Clinical Extent of Disease
Figure B4.2.1: Clinical extent of disease (%) – Hepatic tumours (0-19 years)
B4.2.2 Treatment according to clinical extent of disease
Figure B4.2.2: Type of treatment according to the clinical extent of disease (%) – Hepatic Tumours (0-19 years)

28
B4.3 Malignant Bone Tumours
B4.3.1 Clinical Extent of Disease
Figure B4.3.1: Clinical extent of disease (%) – Malignant bone tumours (0-19 years)
B4.3.2 Treatment according to clinical extent of disease
Figure B4.3.2: Type of treatment according to the clinical extent of disease (%) – Malignant bone tumours (0-19 years)

29
B4.4 Soft Tissue Sarcomas
B4.4.1 Clinical Extent of Disease
Figure B4.4.1: Clinical extent of disease (%) – Soft Tissue Sarcomas (0-19 years)
B4.4.2 Treatment according to clinical extent of disease
Figure B4.4.2: Type of treatment according to the clinical extent of disease (%) – Soft Tissue Sarcomas
(0-19 years)

30
B4.5 Germ-cell trophoblastic & other gonadal neoplasms
B4.5.1 Clinical extent of disease
Figure B4.5.1: Clinical extent of disease (%) – Germ-cell trophoblastic & other gonadal neoplasms
(0-19 years)
B4.5.2 Treatment according to clinical extent of disease
Figure B4.5.2: Type of treatment according to the clinical extent of disease (%) – Germ-cell
trophoblastic & other gonadal neoplasms (0-19 years)

31
Key Findings
• Childhood cancers accounted for 4.0% of the total cancers.
• The proportion of reported childhood cancer cases is higher among boys
compared to girls.
• Leukaemia was the predominant form of childhood cancer in both boys and girls
in both age groups (0-14 and 0-19 years), of which lymphoid leukaemia was the
predominant type.
• Close to 70% of the childhood kidney cancer cases were reported in the age group
of 0-4 years. Nephroblastoma (Wilm's tumour) accounted for most kidney cancer
cases (males 87.4%, females 83.8%).
• Over one-third of cancers of the brain and nervous system (32.5% in males and
36.5% in females) were recorded in the age group of 5-9 years. The most common
type reported was Medulloblastoma.
• Among the solid tumours, the highest proportion of presentation with distant
metastasis was observed for germ cell trophoblastic and gonadal neoplasms,
followed by malignant bone tumours.
• More than half of the patients with retinoblastoma and hepatic tumours were
treated with chemotherapy.
• Most of the patients with renal tumours, hepatic tumours, malignant bone
tumours, and germ cell trophoblastic tumours were treated by a combination of
surgery and chemotherapy or chemotherapy only.


32
Section I C. Cancer in Sites Associated with Tobacco Use
Tobacco use is associated with cancers of several anatomical sites, and due to its adverse
impact and carcinogenicity, it has become a global threat including India. According to the
recent report on cancer in sites associated with tobacco use of 2021, the projected number
of cancers in the sites associated with tobacco use in 2025 would be 427273 (313646 in males;
113627 in females) [8]. These cancers would contribute to 27.2% of India's total projected
cancer cases.
The National Noncommunicable Disease Monitoring Survey (NNMS) 2017-2018 reported that
32.8% of adults between 18-69 years used either smoked or smokeless forms of tobacco, and
28% used tobacco daily [9]. The average age of initiation of tobacco use was 21 years, which is
a contributory factor to the increased burden of cancers associated with tobacco use in India.
Tobacco contains at least 69 carcinogenic agents, including various kinds of hydrocarbons,
amines, aldehydes, organic, inorganic and phenolic compounds[10].
The NCRP has been using the classification provided by the International Agency for Research
on Cancer (IARC) for identifying the anatomical sites associated with tobacco usage [11].
Although the recent updates of IARC reports have added more anatomical sites, we continue
to use the original classification in our reports for comparison purposes with our earlier
data[12].
Number and proportion of cancers associated with use of tobacco according to geographic
region
Cancers associated with tobacco use comprised of 48.7% of all cancers among males and 16.5%
among females, respectively. Of all the cancers reported in the hospital-based cancer registry,
irrespective of gender, such cancers associated with tobacco use constituted 33.3% of all
cancers (Table C.1).

33
Table C.1 Number (n) and relative proportion (%) of cancers associated with use of tobacco
according to geographic region
Region Males Females Total
All Cases n % All Cases n % All Cases n %
Central 13963 8895 63.7 13342 2577 19.3 27305 11472 42.0
East 27036 10314 38.1 27198 3402 12.5 54234 13716 25.3
North 74700 35215 47.1 60512 9274 15.3 135212 44489 32.9
North East 28677 18972 66.2 21274 6228 29.3 49951 25200 50.4
South 102641 45210 44.0 114205 16719 14.6 216846 61929 28.6
West 72081 36699 50.9 54455 9937 18.2 126536 46636 36.9
Total 319098 155305 48.7 290986 48137 16.5 610084 203442 33.3
Distribution of cancers in sites associated with tobacco use:
The sites of cancer used along with their ICD-10 codes for our reports are given in Table C 2.
Among cancers associated with tobacco use which was reported from all HBCRs, the highest
among males was mouth cancer (24.4%) followed by lung cancer (22.4%) and tongue cancer
(16.6%). The highest among females was mouth cancer (26.4%) followed by lung cancer (22.9%)
and oesophageal cancer (20.8%) (Table C.2).
Table C.2 Number (n) and proportion (%) of specific sites of cancer associated with tobacco use
Site of Cancer (ICD-10 codes) Males Females
n % n %
Lip (C00) 1723 1.1 688 1.4
Tongue (C01-C02) 25721 16.6 7149 14.9
Mouth (C03-C06) 37972 24.4 12722 26.4
Oropharynx (C10) 5122 3.3 654 1.4
Hypopharynx (C12-C13) 12856 8.3 3092 6.4
Pharynx Unspecified (C14) 1019 0.7 243 0.5
Oesophagus (C15) 16853 10.9 10029 20.8
Larynx (C32) 14466 9.3 1507 3.1
Lung etc. (C33-C34) 34832 22.4 11026 22.9
Urinary Bladder (C67) 4741 3.1 1027 2.1
Total 155305 100.0 48137 100.0

34
Age distribution of cancers in sites associated with tobacco use
According to the age group, the highest number of new cases of cancers in sites associated
with tobacco use were seen in 60-64 years among both males (16.3%) and females (15.3%).
Close to a half of such cancers occur after 60 years among males (44.6%) and females (42.7%)
(Table C.3).
Table C.3 Number (n) and proportion (%) of cancers in sites associated with tobacco use by
five-year age groups
Age Groups Males Females
n % n %
<20 230 0.1 122 0.2
20-24 536 0.3 226 0.5
25-29 1946 1.3 594 1.2
30-34 4870 3.1 1258 2.6
35-39 8313 5.4 2502 5.2
40-44 11501 7.4 3792 7.9
45-49 15988 10.3 5864 12.2
50-54 20179 13.0 6546 13.6
55-59 22608 14.6 6671 13.9
60-64 25291 16.3 7343 15.3
65-69 19967 12.9 5936 12.3
70-74 13321 8.6 3894 8.1
75+ 10540 6.8 3386 7.0
All ages* 155305 100.0 48137 100.0 *Includes cases with Unknown Age


35
CHAPTER 1
CANCERS OF THE HEAD AND NECK
Table 1.0: Site classification according to ICD-10
The sites included here are Tongue (C02), Mouth (C03-C04 & C06), Oropharynx (C01, C05, C09,
C10 & C14), Nasopharynx (C11), Hypopharynx (C12-C13) and Larynx (C32).
The grouping has been done for the following reasons:
1. Oropharynx has been regrouped for analysis of HBCR data as this data focusses more on
the treatment patterns followed in hospitals.
2. Also, the regrouping follows embryological development pattern where cancers of
anterior two thirds of tongue (2/3) are grouped as tongue (C02). Cancers of posterior
one third (1/3) of tongue (C01) while anatomically being part of tongue, histologically
resemble cancers of oropharynx and hence are grouped along with them.
Site of Cancer ICD-10 Code
Tongue C02
Mouth C03 - C04 & C06
Oropharynx C01, C05, C09, C10 & C14
Nasopharynx C11
Hypopharynx C12-C13
Larynx C32

36
1.1 Number (n) and relative proportion (%) by sites of cancers of the head and neck
Table 1.1: Number (n) and relative proportion (%) of sites of cancers of head and neck relative to all sites of cancer
Site of Cancer (ICD-10 code) Males Females Total
n % (all sites) n % (all sites) n % (all sites)
Tongue (C02) 18420 5.8 6065 2.1 24485 4.0
Mouth (C03, C04, C06) 34547 10.8 11761 4.1 46308 7.6
Gum (C03) 7799 2.4 3282 1.1 11081 1.8
Floor of mouth (C04) 1599 0.5 201 0.1 1800 0.3
Other and unspecified parts of mouth (C06) 25149 7.9 8278 2.9 33427 5.5
Oropharynx (C01, C05, C09, C10, C14) 20627 6.5 3327 1.1 23954 3.9
Base of tongue (C01) 7039 2.2 993 0.3 8032 1.3
Palate (C05) 3017 0.9 731 0.3 3748 0.6
Tonsil (C09) 4503 1.4 722 0.2 5225 0.9
Oropharynx (C10) 1006 0.3 236 0.1 1242 0.2
Other and ill-defined sites in lip, oral cavity and pharynx (C14) 5062 1.6 645 0.2 5707 0.9
Nasopharynx (C11) 2494 0.8 983 0.3 3477 0.6
Hypopharynx (C12-C13) 12765 4.0 3072 1.1 15837 2.6
Pyriform sinus (C12) 8551 2.7 1075 0.4 9626 1.6
Hypopharynx (C13) 4214 1.3 1997 0.7 6211 1.0
Larynx (C32) 14377 4.5 1484 0.5 15861 2.6
Cancers of Head and Neck 103230 32.4 26692 9.2 129922 21.3

37
1.2 Distribution of Head and Neck Cancers according to Five-year Age Groups
Table 1.2.1: Number (n) and proportion (%) of cancers of head and neck according to five-year age group: Males
Age group
Tongue Mouth Oropharynx Nasopharynx Hypopharynx Larynx Cancers of Head and Neck
n Row % Col % n Row % Col % n Row % Col % n Row % Col % n Row % Col % n Row % Col % n Row % Col %
< 20 26 5.6 0.1 41 8.9 0.1 28 6.1 0.1 339 73.3 13.6 11 2.4 0.1 17 3.7 0.1 462 100.0 0.5
20-24 131 24.4 0.7 190 35.5 0.5 42 7.8 0.2 135 25.2 5.4 18 3.4 0.1 20 3.7 0.1 536 100.0 0.5
25-29 654 37.7 3.6 834 48.0 2.4 85 4.9 0.4 87 5.0 3.5 39 2.2 0.3 38 2.2 0.3 1737 100.0 1.7
30-34 1445 32.7 7.9 2357 53.3 6.8 285 6.5 1.4 120 2.7 4.8 101 2.3 0.8 110 2.5 0.8 4418 100.0 4.3
35-39 2230 30.3 12.1 3753 51.0 10.9 699 9.5 3.4 159 2.2 6.4 281 3.8 2.2 240 3.2 1.7 7362 100.0 7.1
40-44 2451 25.7 13.3 4410 46.2 12.8 1278 13.4 6.2 221 2.3 8.9 609 6.4 4.8 573 6.0 4.0 9542 100.0 9.2
45-49 2551 21.0 13.9 4916 40.4 14.2 2152 17.7 10.4 270 2.2 10.8 1141 9.4 8.9 1126 9.3 7.8 12156 100.0 11.8
50-54 2268 16.2 12.3 4703 33.6 13.6 3049 21.8 14.8 290 2.1 11.6 1763 12.6 13.8 1919 13.7 13.4 13992 100.0 13.6
55-59 2049 14.2 11.1 4079 28.2 11.8 3463 23.9 16.8 279 1.9 11.2 2179 15.0 17.1 2429 16.8 16.9 14478 100.0 14.0
60-64 1864 12.6 10.1 3790 25.6 11.0 3757 25.4 18.2 248 1.7 9.9 2266 15.3 17.8 2867 19.4 19.9 14792 100.0 14.3
65-69 1384 12.6 7.5 2597 23.6 7.5 2738 24.9 13.3 164 1.5 6.6 1860 16.9 14.6 2272 20.5 15.8 11015 100.0 10.7
70-74 738 10.5 4.0 1584 22.4 4.6 1757 24.9 8.5 104 1.5 4.2 1359 19.3 10.7 1511 21.4 10.5 7053 100.0 6.8
75-79 356 10.5 1.9 749 22.1 2.2 759 22.4 3.7 46 1.4 1.8 707 20.9 5.5 765 22.6 5.3 3382 100.0 3.3
80-84 176 11.2 1.0 351 22.4 1.0 369 23.5 1.8 17 1.1 0.7 295 18.8 2.3 360 23.0 2.5 1568 100.0 1.5
85+ 97 13.3 0.5 189 26.0 0.6 163 22.4 0.8 15 2.1 0.6 134 18.4 1.0 129 17.8 0.9 727 100.0 0.7
All ages* 18420 17.8 100.0 34547 33.5 100.0 20627 20.0 100.0 2494 2.4 100.0 12765 12.4 100.0 14377 13.9 100.0 103230 100.0 100.0
Mean (SD) Years 50 (13) 51 (13) 57 (11) 45(18) 59(11) 60 (11) 54 (13)
* Includes cases with unknown age

38
Table 1.2.2: Number (n) and proportion (%) of cancers of head and neck according to five-year age group: Females
Age group
Tongue Mouth Oropharynx Nasopharynx Hypopharynx Larynx Cancers of Head and Neck
n Row % Col % n Row % Col % n Row % Col % n Row % Col % n Row % Col % n Row % Col % N Row % Col %
< 20 14 8.4 0.2 30 18.1 0.3 14 8.4 0.4 94 56.6 9.6 8 4.8 0.3 6 3.7 0.4 166 100.0 0.6
20-24 38 17.4 0.6 45 20.6 0.4 21 9.6 0.6 75 34.4 7.6 24 11.0 0.8 15 7.0 1.0 218 100.0 0.8
25-29 119 28.5 2.0 135 32.4 1.2 32 7.7 1.0 49 11.8 5.0 61 14.6 2.0 21 5.0 1.4 417 100.0 1.6
30-34 208 24.7 3.4 339 40.3 2.9 68 8.1 2.0 66 7.9 6.7 127 15.1 4.1 33 3.9 2.2 841 100.0 3.2
35-39 435 26.3 7.2 708 42.8 6.0 148 8.9 4.5 78 4.7 7.9 230 14.0 7.5 55 3.3 3.7 1654 100.0 6.2
40-44 558 24.3 9.2 1001 43.7 8.5 233 10.2 7.0 97 4.2 9.9 322 14.1 10.5 81 3.5 5.5 2292 100.0 8.6
45-49 841 24.2 13.9 1503 43.3 12.8 395 11.4 11.9 117 3.4 11.9 459 13.2 14.9 158 4.5 10.7 3473 100.0 13.0
50-54 911 25.2 15.0 1531 42.4 13.0 414 11.5 12.4 119 3.3 12.1 461 12.7 15.0 177 4.9 11.9 3613 100.0 13.5
55-59 797 22.5 13.1 1527 43.1 13.0 474 13.4 14.3 95 2.7 9.7 395 11.2 12.8 252 7.1 17.0 3540 100.0 13.3
60-64 775 20.4 12.8 1721 45.3 14.6 559 14.7 16.8 94 2.5 9.6 389 10.3 12.7 258 6.8 17.4 3796 100.0 14.2
65-69 653 22.0 10.8 1359 45.9 11.6 420 14.2 12.6 45 1.5 4.6 290 9.8 9.4 195 6.6 13.1 2961 100.0 11.1
70-74 378 19.9 6.2 911 47.8 7.7 307 16.1 9.2 27 1.4 2.7 162 8.5 5.3 119 6.3 8.0 1904 100.0 7.1
75-79 187 18.7 3.1 521 52.2 4.4 132 13.2 4.0 15 1.5 1.5 77 7.7 2.5 67 6.7 4.5 999 100.0 3.8
80-84 96 18.6 1.6 259 50.3 2.2 73 14.2 2.2 6 1.2 0.6 49 9.5 1.6 32 6.2 2.2 515 100.0 1.9
85+ 55 18.3 0.9 169 56.1 1.4 37 12.3 1.1 6 2.0 0.6 19 6.3 0.6 15 5.0 1.0 301 100.0 1.1
All ages*
6065 22.7 100.0 11761 44.1 100.0 3327 12.5 100.0 983 3.7 100.0 3072 11.5 100.0 1484 5.5 100.0 26692 100.0 100.0
Mean (SD) Years 54 (13) 55 (13) 56 (13) 44(17) 52(13) 57 (13) 54 (13)
* Includes cases with unknown age

39
1.3 Broad methods of diagnosis
Table 1.3: Number (n) and proportion (%) of head and neck cancers by most valid method of diagnosis
Method of diagnosis
Tongue Mouth Oropharynx Nasopharynx Hypopharynx Larynx Cancers of Head
and Neck
n % n % n % n % n % n % n %
Males
Microscopic 18351 99.6 34377 99.5 20540 99.6 2465 98.9 12701 99.5 14297 99.4 102731 99.5
Imaging Techniques
25 0.1 65 0.2 38 0.2 25 1.0 30 0.2 39 0.3 222 0.2
Clinical Only
29 0.2 90 0.3 32 0.2 4 0.1 23 0.2 27 0.2 205 0.2
Total* 18420 100.0 34547 100.0 20627 100.0 2494 100.0 12765 100.0 14377 100.0 103230 100.0
Females
Microscopic 6031 99.4 11678 99.3 3314 99.6 966 98.3 3061 99.6 1471 99.1 26521 99.4
Imaging Techniques
8 0.1 28 0.2 5 0.1 14 1.4 3 0.1 8 0.5 66 0.2
Clinical Only
24 0.4 48 0.4 8 0.2 0 0.0 7 0.2 2 0.1 89 0.3
Total* 6065 100.0 11761 100.0 3327 100.0 983 100.0 3072 100.0 1484 100.0 26692 100.0
*Cases with unknown and other methods of diagnosis are included.
1.4 Types of microscopic diagnosis
Table 1.4: Number (n) and proportion (%) of head and neck cancers according to specific type of
microscopic diagnosis
Type of microscopic
diagnosis
Tongue Mouth Oropharynx Nasopharynx Hypopharynx Larynx Cancers of Head
and Neck
n % n % n % n % n % n % n %
Males
Primary Histology
17714 96.5 33097 96.3 18523 90.2 2121 86.0 11581 91.2 13398 93.7 96434 93.9
Histology of metastasis
76 0.4 132 0.4 271 1.3 141 5.7 167 1.3 124 0.9 911 0.9
Cytology of Primary
432 2.4 974 2.8 838 4.1 90 3.7 380 3.0 397 2.8 3111 3.0
Cytology of Metastasis
129 0.7 174 0.5 908 4.4 113 4.6 573 4.5 378 2.6 2275 2.2
All microscopic
18351 100.0 34377 100.0 20540 100.0 2465 100.0 12701 100.0 14297 100.0 102731 100.0
Females
Primary Histology
5842 96.9 11246 96.3 3006 90.7 814 84.2 2910 95.1 1380 93.8 25198 95.0
Histology of metastasis
14 0.2 29 0.2 34 1.0 48 5.0 25 0.8 10 0.7 160 0.6
Cytology of Primary
141 2.3 317 2.7 153 4.6 48 5.0 57 1.9 43 2.9 759 2.9
Cytology of Metastasis
34 0.6 86 0.8 121 3.7 56 5.8 69 2.2 38 2.6 404 1.5
All microscopic
6031 100.0 11678 100.0 3314 100.0 966 100.0 3061 100.0 1471 100.0 26521 100.0

40
1.5 Major histological types
1.5.1 Tongue (C02)
Table 1.5.1: Number (n) and proportion (%) according to broad histological classification- Cancer of Tongue
Broad histological classification Males Females Total
n % n % n %
Epithelial cell tumours
Squamous Cell Carcinoma, NOS 17018 92.7 5593 92.7 22611 92.7
Squamous Cell Carcinoma, Keratinizing 705 3.8 227 3.8 932 3.8
Squamous Cell Carcinoma, Non-Keratinizing 82 0.4 16 0.3 98 0.4
Verrucous carcinoma 100 0.5 33 0.5 133 0.5
All other Squamous Cell Carcinomas 75 0.4 30 0.5 105 0.4
Adenocarcinoma 41 0.2 20 0.3 61 0.3
Carcinoma, NOS 229 1.2 82 1.4 311 1.3
Mesenchymal tumours
Sarcoma 4 <0.1 1 <0.1 5 <0.1
Others 97 0.5 29 0.5 126 0.5
Total 18351 100.0 6031 100.0 24382 100.0
1.5.2 Mouth (C03 - C04 & C06)
Table 1.5.2: Number (n) and proportion (%) according to broad histological classification- Cancer of Mouth
Broad histological classification Males Females Total
n % n % n %
Epithelial cell tumours
Squamous Cell Carcinoma, NOS 30840 89.7 10602 90.8 41442 90.0
Squamous Cell Carcinoma, Keratinizing 1837 5.3 423 3.6 2260 4.9
Squamous Cell Carcinoma, Non -Keratinizing 164 0.5 37 0.3 201 0.4
Verrucous carcinoma 614 1.8 235 2.0 849 1.8
All other Squamous Cell Carcinomas 165 0.5 79 0.7 244 0.5
Adenocarcinoma 138 0.4 77 0.7 215 0.5
Carcinoma, NOS 424 1.2 144 1.2 568 1.2
Mesenchymal tumours
Sarcoma 34 0.1 17 0.1 51 0.1
Others 161 0.5 64 0.5 225 0.5
Total 34377 100.0 11678 100.0 46055 100.0

41
1.5.3 Oropharynx (C01, C05, C09, C10 & C14)
Table 1.5.3: Number (n) and proportion (%) according to broad histological classification- Cancer of Oropharynx
Broad histological classification Males Females Total
n % n % n %
Epithelial cell tumours
Squamous Cell Carcinoma, NOS 17941 87.3 2711 81.8 20652 86.6
Squamous Cell Carcinoma, Keratinizing 582 2.8 115 3.5 697 2.9
Squamous Cell Carcinoma, Non-Keratinizing 268 1.3 80 2.4 348 1.5
Verrucous carcinoma 47 0.2 14 0.4 61 0.3
All other Squamous Cell Carcinomas 81 0.4 14 0.4 95 0.4
Adenocarcinoma 181 0.9 116 3.5 297 1.2
Carcinoma, NOS 737 3.6 152 4.6 889 3.7
Mesenchymal tumours
Sarcoma 21 0.1 9 0.3 30 0.1
Others 682 3.3 103 3.1 785 3.3
Total 20540 100.0 3314 100.0 23854 100.0
1.5.4 Nasopharynx (C11)
Table 1.5.4: Number (n) and proportion (%) according to broad histological classification- Cancer of Nasopharynx
Broad histological classification Males Females Total
n % n % n %
Epithelial cell tumours
Squamous Cell Carcinoma, NOS 784 31.8 296 30.6 1080 31.5
Squamous Cell Carcinoma, Keratinizing 43 1.7 17 1.8 60 1.7
Squamous Cell Carcinoma, Non-Keratinizing 229 9.3 92 9.5 321 9.4
Undifferentiated 1112 45.1 426 44.1 1538 44.8
All other Squamous Cell Carcinomas 23 0.9 8 0.8 31 0.9
Adenocarcinoma 47 1.9 27 2.8 74 2.2
Mesenchymal tumours
Sarcoma 29 1.2 18 1.9 47 1.4
Others 198 8.0 82 8.5 280 8.2
Total 2465 100.0 966 100.0 3431 100.0

42
1.5.5 Hypopharynx (C12-C13)
Table 1.5.5: Number (n) and proportion (%) according to broad histological classification- Cancer of Hypopharynx
Broad histological classification Males Females Total
n % n % n %
Epithelial cell tumours
Squamous Cell Carcinoma, NOS 11189 88.1 2767 90.4 13956 88.5
Squamous Cell Carcinoma, Keratinizing 240 1.9 88 2.9 328 2.1
Squamous Cell Carcinoma, Non-Keratinizing 263 2.1 40 1.3 303 1.9
Verrucous carcinoma 0 0.0 2 0.1 2 0.0
All other Squamous Cell Carcinomas 37 0.3 5 0.2 42 0.3
Adenocarcinoma 62 0.5 17 0.6 79 0.5
Carcinoma, NOS 374 2.9 78 2.5 452 2.9
Mesenchymal tumours
Sarcoma 6 <0.1 1 <0.1 7 <0.1
Others 530 4.2 63 2.1 593 3.8
Total 12701 100.0 3061 100.0 15762 100.0
1.5.6 Larynx (C32)
Table 1.5.6: Number (n) and proportion (%) according to broad histological classification- Cancer of Larynx
Broad histological classification Males Females Total
n % n % n %
Epithelial cell tumours
Squamous Cell Carcinoma, NOS 12644 88.4 1271 86.4 13915 88.2
Squamous Cell Carcinoma, Keratinizing 466 3.3 50 3.4 516 3.3
Squamous Cell Carcinoma, Non-Keratinizing 194 1.4 33 2.2 227 1.4
Verrucous carcinoma 10 0.1 1 0.1 11 0.1
All other Squamous Cell Carcinomas 166 1.2 19 1.3 185 1.2
Adenocarcinoma 85 0.6 16 1.1 101 0.6
Carcinoma, NOS 453 3.2 61 4.1 514 3.3
Mesenchymal tumours
Sarcoma 10 0.1 1 0.1 11 0.1
Others 269 1.9 19 1.3 288 1.8
Total 14297 100.0 1471 100.0 15768 100.0

43
1.6 Clinical extent of disease
Figure 1.6.1 - Clinical extent of disease (%) – all sites of cancers of the head and neck in males and females
Figure 1.6.2 - Clinical extent of disease (%) – Site wise cancers of head and neck– Males
Figure 1.6.3 - Clinical extent of disease (%) – Site wise cancers of head and neck – Females

44
1.7 Intention to treat
Figure 1.7 - Intention to treat according to clinical extent of disease – cancers of head and neck in both sexes

45
1.8 Treatment modalities according to clinical extent of disease
*no. of cases ≤15
Figure 1.8.1: Type of treatment according to clinical extent of disease – cancers of head and neck - Males

46
*no. of cases ≤1
Figure 1.8.2: Type of treatment according to clinical extent of disease – cancers of head and neck – Females

47
1.9 Waiting time between registration and commencement of cancer directed treatment
1.9.1 Patients of head and neck cancers earlier diagnosed at another health facility and referred for
cancer directed treatment to the reporting institution
(a) Time between diagnosis and first attendance at the reporting institution
Figure 1.9.1a: Time between diagnosis and first attendance at reporting institution
(b) Time between first attendance and commencement of cancer directed treatment at reporting
institution
Figure 1.9.1b: Time between first attendance and commencement of cancer directed treatment at
reporting institution

48
(c) Time between first diagnosis and commencement of cancer directed treatment at reporting
institution
Figure 1.9.1c: Time between first diagnosis and commencement of cancer directed treatment at
Reporting Institution
1.9.2 Patients of head and neck cancers diagnosed and treated for cancer at the reporting institution
Time between first diagnosis and commencement of cancer directed treatment at reporting institution
Figure 1.9.2: Time between first diagnosis and commencement of cancer directed treatment at reporting
institution

49
Key Findings
• Cancers of the head and neck accounted for nearly one-fifth (21.3%) of cancers in
all the anatomic sites, constituting almost a third (32.4%) of all cancers in males.
• Over half of the cancers were reported in the 45-64 years age group in males
(53.7%) and females (54%).
• Squamous cell carcinoma, NOS was the major histological type for all head and
neck cancer sites, except for cancer of the nasopharynx, where undifferentiated
epithelial cell cancer comprised close to half of the histological type.
• A higher proportion of patients with nasopharyngeal cancer had distal metastasis
at the time of presentation, compared to cancer in other head and neck sites.
• A combination of radiotherapy and chemotherapy was the mainstay of treatment
for most cancers of the oropharynx, nasopharynx and hypopharynx.
• The time between first diagnosis and commencement of cancer directed treatment
at reporting institution for over one third of the patients with different stages
disease extent ranged from 8 days to 30 days.


50
CHAPTER 2
GASTROINTESTINAL TRACT CANCERS
Table 2.0: Site classification according to ICD-10
2.1 Number and relative proportion by sites of GI tract cancers
Table 2.1: Number (n) and relative proportion (%) by sites of GI tract cancers relative to all sites of
cancer
Site of cancer Males Females Total
n % n % n %
Oesophagus 16758 5.3 9978 3.4 26736 4.4
Stomach 14170 4.4 6548 2.3 20718 3.4
Colon 6610 2.1 4382 1.5 10992 1.8
Rectum 9565 3.0 6323 2.2 15888 2.6
Liver And Intrahepatic Bile Ducts 6374 2.0 1912 0.7 8286 1.4
Gall Bladder 6883 2.2 10873 3.7 17756 2.9
Other GI tract 5776 1.8 3615 1.2 9391 1.5
Total GI tract cancer 66136 20.7 43631 15.0 109767 18.0
All sites 319098 100.0 290986 100.0 610084 100.0
Site of Cancer ICD-10 Code
Oesophagus C15
Stomach C16
Liver C22
Gall Bladder & other unspecified parts of the biliary tract C23 - C24
Colon C18
Rectum C19 – C20
Other GI tract sites such as Small intestine, Anus, Pancreas C17, C21, C25

51
2.2 Distribution of GI tract cancers according to five-year age groups
Table 2.2.1: Number (n) and proportion (%) of GI tract cancers according to five-year age groups: Males
Age group
Oesophagus Stomach Colon Rectum Liver Gall Bladder Other GI tract cancers Total GI Cancers
n Row % Col % n Row % Col % N Row % Col % n Row % Col % n Row % Col % n Row % Col % n Row % Col % n Row % Col %
<20 10 2.1 0.1 35 7.4 0.2 43 9.0 0.7 97 20.4 1.0 246 51.7 3.9 12 2.5 0.2 33 6.9 0.6 476 100.0 0.7
20-24 30 5.1 0.2 64 10.8 0.5 94 15.9 1.4 255 43.1 2.7 37 6.3 0.6 38 6.4 0.6 74 12.4 1.3 592 100.0 0.9
25-29 58 5.5 0.3 170 16.2 1.2 145 13.8 2.2 417 39.8 4.4 51 4.9 0.8 91 8.7 1.3 115 11.1 2.0 1047 100.0 1.6
30-34 164 9.0 1.0 341 18.7 2.4 261 14.3 3.9 556 30.6 5.8 109 6.0 1.7 204 11.2 3.0 184 10.2 3.2 1819 100.0 2.8
35-39 384 14.1 2.3 505 18.6 3.6 383 14.1 5.8 634 23.3 6.6 147 5.4 2.3 354 13.0 5.1 309 11.5 5.3 2716 100.0 4.1
40-44 803 19.3 4.8 832 20.0 5.9 520 12.5 7.9 724 17.4 7.6 296 7.1 4.6 572 13.7 8.3 416 10.0 7.2 4163 100.0 6.3
45-49 1545 24.4 9.2 1402 22.1 9.9 690 10.9 10.4 876 13.8 9.2 457 7.2 7.2 756 11.9 11.0 608 9.7 10.5 6334 100.0 9.6
50-54 2273 27.6 13.6 1733 21.0 12.2 790 9.6 12 1059 12.8 11.1 710 8.6 11.1 927 11.2 13.5 751 9.2 13.0 8243 100.0 12.5
55-59 2738 28.0 16.3 2173 22.3 15.3 847 8.7 12.8 1156 11.8 12.1 944 9.7 14.8 1056 10.8 15.3 852 8.7 14.8 9766 100.0 14.8
60-64 3135 28.8 18.7 2426 22.3 17.1 955 8.8 14.4 1246 11.5 13.0 1161 10.7 18.2 1077 9.9 15.6 870 8.0 15.1 10870 100.0 16.4
65-69 2486 27.2 14.8 2052 22.5 14.5 806 8.8 12.2 1087 11.9 11.4 1032 11.3 16.2 883 9.7 12.8 787 8.6 13.6 9133 100.0 13.8
70-74 1704 28.0 10.2 1396 23.0 9.9 559 9.2 8.5 764 12.6 8.0 697 11.5 10.9 517 8.5 7.5 443 7.2 7.7 6080 100.0 9.2
75-79 873 28.0 5.2 679 21.8 4.8 335 10.8 5.1 422 13.6 4.4 334 10.7 5.2 243 7.8 3.5 228 7.3 3.9 3114 100.0 4.7
80-84 398 30.5 2.4 269 20.6 1.9 130 10.0 2.0 197 15.1 2.0 118 9.0 1.9 118 9.0 1.7 75 5.8 1.3 1305 100.0 2.0
85+ 156 33.3 0.9 91 19.4 0.6 49 10.5 0.7 73 15.6 0.7 33 7.1 0.6 35 7.5 0.6 31 6.6 0.5 468 100.0 0.6
All ages* 16758 25.3 100.0 14170 21.4 100.0 6610 10.0 100.0 9565 14.5 100.0 6374 9.6 100.0 6883 10.4 100.0 5776 8.8 100.0 66136 100.0 100.0
Mean (SD)
Years 59(11) 58 (12) 55(14) 53(15) 57(16) 55(12) 57(13) 57(13)
* Includes cases with unknown age

52
Table 2.2.2: Number (n) and proportion (%) of GI tract Cancers according to five-year age groups: Females
Age group Oesophagus Stomach Colon Rectum Liver Gall Bladder Other GI tract cancers Total GI Cancers
n Row % Col % n Row % Col % n Row % Col % n Row % Col % n Row % Col % n Row
% Col % n Row % Col % n Row % Col %
<20 1 0.3 <0.1 31 10.5 0.5 29 9.9 0.7 51 17.3 0.8 150 51.0 7.8 4 1.4 <0.1 28 9.6 0.8 294 100.0 0.7
20-24 20 4.0 0.2 82 16.4 1.3 69 13.8 1.6 208 41.7 3.3 20 4.0 1.00 52 10.4 0.5 48 9.7 1.3 499 100.0 1.1
25-29 78 8.2 0.8 222 23.4 3.4 111 11.7 2.5 258 27.2 4.1 42 4.4 2.2 150 15.8 1.4 87 9.3 2.4 948 100.0 2.2
30-34 194 12.0 1.9 342 21.2 5.2 173 10.7 3.9 385 23.8 6.1 64 4.0 3.3 328 20.3 3.0 129 8.0 3.6 1615 100.0 3.7
35-39 391 14.4 3.9 512 18.9 7.8 265 9.8 6.0 493 18.2 7.8 117 4.3 6.1 703 25.9 6.5 230 8.5 6.4 2711 100.0 6.2
40-44 712 18.7 7.1 668 17.5 10.2 357 9.4 8.1 538 14.1 8.5 145 3.8 7.6 1137 29.8 10.5 260 6.7 7.2 3817 100.0 8.7
45-49 1179 21.7 11.8 813 15.0 12.4 463 8.5 10.6 670 12.3 10.6 196 3.6 10.3 1721 31.7 15.8 393 7.2 10.9 5435 100.0 12.5
50-54 1378 22.7 13.8 904 14.9 13.8 561 9.2 12.8 776 12.8 12.3 240 4.0 12.6 1707 28.1 15.7 507 8.3 14.0 6073 100.0 13.9
55-59 1428 23.5 14.3 881 14.5 13.5 585 9.6 13.4 769 12.7 12.2 251 4.1 13.1 1621 26.7 14.9 529 8.9 14.6 6064 100.0 13.9
60-64 1601 25.5 16.0 856 13.6 13.1 629 10.0 14.4 772 12.3 12.2 289 4.6 15.1 1560 24.9 14.3 567 9.1 15.7 6274 100.0 14.4
65-69 1356 28.1 13.6 636 13.2 9.7 543 11.2 12.4 667 13.8 10.5 193 4.0 10.1 986 20.4 9.1 450 9.3 12.4 4831 100.0 11.1
70-74 919 32.0 9.2 357 12.4 5.5 334 11.6 7.6 368 12.8 5.8 123 4.3 6.4 543 18.9 5.0 224 8.0 6.2 2868 100.0 6.6
75-79 439 31.8 4.4 168 12.2 2.6 153 11.1 3.5 230 16.7 3.6 50 3.6 2.6 246 17.8 2.3 95 6.8 2.6 1381 100.0 3.2
80-84 193 34.8 2.0 58 10.5 0.8 80 14.4 1.8 91 16.4 1.4 18 3.2 1.0 70 12.6 0.6 44 8.1 1.2 554 100.0 1.3
85+ 89 33.8 1.0 17 6.5 0.2 30 11.4 0.7 47 17.9 0.8 12 4.6 0.7 44 16.7 0.4 24 9.1 0.7 263 100.0 0.5
All ages* 9978 22.9 100.0 6548 15.0 100.0 4382 10.0 100.0 6323 14.5 100.0 1912 4.4 100.0 10873 24.9 100.0 3615 8.3 100.0 43631 100.0 100.0
Mean (SD) Years 57 (12) 52 (13) 54 (14) 52 (15) 50 (18) 53 (12) 54 (13) 54 (13)
* Includes cases with unknown age

53
2.3 Broad methods of diagnosis
Table 2.3: Number (n) and proportion (%) of GI tract cancers by most valid method of diagnosis – GI Cancers
Method of diagnosis
Oesophagus Stomach Colon Rectum Liver Gall Bladder Other GI tract
cancers Total GI cancers
n % n % n % n % n % n % n % n %
Males
Microscopic 16654 99.4 14020 98.9 6536 98.9 9505 99.4 4492 70.5 6429 93.4 5643 97.7 63279 95.7
Imaging Techniques
65 0.4 111 0.8 53 0.8 46 0.5 1701 26.7 220 3.2 111 1.9 2307 3.5
Clinical Only 11 0.1 19 0.1 11 0.2 6 0.1 12 0.2 209 3.0 6 0.1 274 0.4
Total* 16758 100.0 14170 100.0 6610 100.0 9565 100.0 6374 100.0 6883 100.0 5776 100.0 66136 100.0
Females
Microscopic 9921 99.4 6457 98.6 4335 98.9 6276 99.3 1638 85.7 9967 91.7 3512 97.2 42106 96.5
Imaging Techniques
32 0.3 61 0.9 32 0.7 36 0.6 239 12.5 447 4.1 91 2.5 938 2.1
Clinical Only 5 0.1 11 0.2 8 0.2 3 <0.1 4 0.2 435 4.0 6 0.2 472 1.1
Total* 9978 100.0 6548 100.0 4382 100.0 6323 100.0 1912 100.0 10873 100.0 3615 100.0 43631 100.0
*Including others and unknown cases of method of diagnosis

54
2.4 Types of microscopic diagnosis
Table 2.4: Number (n) and proportion (%) of GI tract cancers according to specific type of microscopic diagnosis
Type of microscopic
diagnosis
Oesophagus Stomach Colon Rectum Liver Gall Bladder Other GI tract
cancers Total GI cancers
n % n % n % n % n % n % n % n %
Males
Primary Histology 16273 97.7 13521 96.4 6203 94.9 9350 98.4 2925 65.1 4002 62.2 4418 78.3 56692 89.6
Histology of metastasis
88 0.5 146 1.0 136 2.1 68 0.7 125 2.8 270 4.2 256 4.5 1089 1.7
Cytology of Primary
181 1.1 232 1.7 115 1.8 52 0.5 1330 29.6 1619 25.2 711 12.6 4240 6.7
Cytology of Metastasis
112 0.7 121 0.9 82 1.3 35 0.4 112 2.5 538 8.4 258 4.5 1258 2.0
All microscopic 16654 100.0 14020 100.0 6536 100.0 9505 100.0 4492 100.0 6429 100.0 5643 100.0 63279 100.0
Females
Primary Histology 9739 98.2 6161 95.4 4108 94.8 6167 98.3 1017 62.1 5435 54.5 2765 78.7 35392 84.1
Histology of metastasis
36 0.4 93 1.4 89 2.1 38 0.6 46 2.8 398 4.0 137 3.9 837 2.0
Cytology of Primary
101 1.0 144 2.2 79 1.8 47 0.7 520 31.7 3153 31.6 449 12.8 4493 10.7
Cytology of Metastasis
45 0.5 59 0.9 59 1.4 24 0.4 55 3.4 981 9.8 161 4.6 1384 3.3
All microscopic 9921 100.0 6457 100.0 4335 100.0 6276 100.0 1638 100.0 9967 100.0 3512 100.0 42106 100.0

55
2.5 Major histological types
2.5.1 Oesophagus (C15)
Table 2.5.1: Number (n) and proportion (%) according to broad histological classification- Cancer of Oesophagus
Broad histological classification Males Females Total
n % n % n %
Squamous cell carcinoma
Squamous cell carcinoma NOS 13218 79.4 8507 85.7 21725 81.7
Squamous cell carcinoma, keratinizing 296 1.8 217 2.2 513 1.9
Squamous cell carcinoma, non-keratinizing 261 1.6 195 2.0 456 1.7
All Other squamous cell carcinomas 78 0.5 79 0.8 157 0.6
Adenocarcinoma
Adenocarcinoma NOS 1913 11.5 523 5.3 2436 9.2
Papillary adenocarcinoma 19 0.1 3 < 0.1 22 0.1
Signet ring cell carcinoma 92 0.6 24 0.2 116 0.4
All other adenocarcinoma 60 0.4 11 0.1 71 0.3
Carcinoma, NOS 441 2.6 235 2.4 676 2.5
Neuroendocrine tumours
Neuroendocrine carcinoma 105 0.6 53 0.5 158 0.6
Other neuroendocrine tumours 2 < 0.1 0 0.0 2 < 0.1
Adenosquamous carcinoma
Adenosquamous Carcinoma 57 0.3 25 0.3 82 0.3
Mesenchymal tumours
Gastrointestinal stromal tumour 1 < 0.1 3 < 0.1 4 < 0.1
Other mesenchymal tumours 6 <0.1 2 < 0.1 8 < 0.1
Others 106 0.6 44 0.4 150 0.6
Total 16655 100.0 9921 100.0 26576 100.0

56
2.5.2 Stomach (C16)
Table 2.5.2: Number (n) and proportion (%) according to broad histological classification- Cancer of Stomach
Broad histological classification Males Females Total
n % n % n %
Adenocarcinoma
Adenocarcinoma NOS 10681 76.2 4452 68.9 15133 73.9
Papillary adenocarcinoma 49 0.3 14 0.2 63 0.3
Signet ring cell carcinoma 1230 8.8 914 14.2 2144 10.5
Linitus plastica 1 < 0.1 3 < 0.1 4 < 0.1
Adenocarcinoma, intestinal type 137 1.0 34 0.5 171 0.8
Adenocarcinoma, diffuse type 108 0.8 77 1.2 185 0.9
All other adenocarcinomas 313 2.2 107 1.7 420 2.1
Carcinoma NOS 526 3.8 242 3.7 768 3.7
Squamous cell carcinoma
Squamous cell carcinoma NOS 418 3.0 271 4.2 689 3.4
Neuroendocrine tumours
Neuroendocrine Carcinoma 127 0.9 49 0.8 176 0.9
Typical carcinoid 4 < 0.1 4 0.1 8 < 0.1
Goblet cell carcinoid 1 < 0.1 0 0.0 1 < 0.1
Mesenchymal tumours 7 < 0.1 8 0.1 15 0.1
Gastrointestinal stromal sarcoma 236 1.7 160 2.5 396 2.0
Other mesenchymal tumours 15 0.1 14 0.2 29 0.1
Adenosquamous carcinoma 31 0.2 18 0.3 49 0.2
Others 140 1.0 92 1.4 232 1.1
Total 14024 100.0 6459 100.0 20483 100.0

57
2.5.3 Liver (C22)
Table 2.5.3: Number (n) and proportion (%) according to broad histological classification- Cancer of Liver
Broad histological classification Males Females Total
n % n % n %
Malignant hepatocellular tumours
Hepatocellular carcinoma 3055 67.9 739 45.1 3794 61.8
Hepatoblastoma 187 4.2 118 7.2 305 5.0
Malignant biliary tumours
Cholangiocarcinoma 354 7.9 279 17.0 633 10.3
Combined Hepatocellular carcinoma & Cholangiocarcinoma
29 0.6 10 0.6 39 0.6
Neuroendocrine carcinoma 57 1.3 36 2.2 93 1.5
Carcinoma, NOS 147 3.3 56 3.4 203 3.3
Other adenocarcinomas 508 11.3 319 19.5 827 13.5
Squamous cell carcinoma
Squamous cell carcinoma 20 0.4 16 1.0 36 0.6
Others 142 3.2 66 4.0 208 3.4
Total 4499 100.0 1639 100.0 6138 100.0
2.5.4 Gall Bladder (C23- C24)
Table 2.5.4: Number (n) and proportion (%) according to broad histological classification- Cancer of Gall Bladder
Broad histological classification Males Females Total
n % n % n %
Malignant epithelial tumours
Adenocarcinoma, NOS 5065 78.8 8169 81.9 13234 80.7
Cholangiocarcinoma 224 3.5 200 2.0 424 2.6
Squamous Cell Carcinoma 104 1.6 126 1.3 230 1.4
All other Adenocarcinoma 96 1.5 113 1.1 209 1.3
Mucinous Adenocarcinoma 68 1.1 89 0.9 157 1.0
Neuroendocrine Tumour 72 1.1 79 0.8 151 0.9
Adenosquamous carcinoma 41 0.6 80 0.8 121 0.7
Mixed Adenocarcinoma 3 < 0.1 8 0.1 11 0.1
Carcinoma NOS 408 6.3 577 5.8 985 6.0
Mesenchymal tumours
Gastrointestinal stromal sarcoma 2 < 0.1 0 0.0 2 < 0.1
Others 347 5.4 528 5.3 875 5.3
Total 6430 100.0 9969 100.0 16399 100.0

58
2.5.5 Pancreas (C25)
Table 2.5.5: Number (n) and proportion (%) according to broad histological classification- Cancer of Pancreas
Broad Histological Classification Males Females Total
n % n % n %
Adenocarcinoma
Adenocarcinoma, NOS 2177 69.0 1312 67.6 3489 68.5
Mucinous adenocarcinoma 45 1.4 34 1.8 79 1.6
Signet ring cell carcinoma 1 < 0.1 0 0.0 1 < 0.1
Papillary adenocarcinoma 7 0.2 17 0.9 24 0.5
All other adenocarcinomas 29 0.9 25 1.3 54 1.1
Carcinoma, NOS 339 10.7 181 9.3 520 10.2
Neuroendocrine tumours
Neuroendocrine carcinoma 172 5.5 150 7.7 322 6.3
Squamous cell carcinoma
Squamous cell carcinoma 53 1.7 30 1.5 83 1.6
Other Malignant epithelial tumours
Solid pseudopapillary carcinoma 4 0.1 13 0.7 17 0.3
Pancreatoblastoma 6 0.2 3 0.2 9 0.2
Mixed acinar-endocrine carcinoma 4 0.1 2 0.1 6 0.1
Mesenchymal tumours
Gastrointestinal stromal sarcoma 1 < 0.1 3 0.2 4 0.1
All other sarcomas 8 0.3 5 0.3 13 0.3
Others 308 9.8 165 8.5 473 9.3
Total 3154 100.0 1940 100.0 5094 100.0

59
2.5.6 Small Intestine (C17)
Table 2.5.6: Number (n) and proportion (%) according to broad histological classification- Cancer of Small Intestine
Broad Histological Classification Males Females Total
n % n % n %
Adenocarcinoma
Adenocarcinoma, NOS 375 56.0 235 53.9 610 55.2
Mucinous adenocarcinoma 9 1.3 11 2.5 20 1.8
Signet ring cell carcinoma 8 1.2 4 0.9 12 1.1
Papillary adenocarcinoma 3 0.4 3 0.7 6 0.5
All other adenocarcinomas 1 0.1 1 0.2 2 0.2
Neuroendocrine tumours
Neuroendocrine carcinoma 114 17.0 71 16.3 185 16.7
Mesenchymal tumours
Gastrointestinal stromal sarcoma 97 14.5 61 14.0 158 14.3
Carcinoma, NOS 28 4.2 16 3.7 44 4.0
Squamous cell carcinoma
Squamous cell carcinoma, NOS 3 0.4 7 1.6 10 0.9
All other squamous cell carcinomas 9 1.3 9 2.1 18 1.6
All other sarcomas 2 0.3 4 0.9 6 0.5
Others 21 3.1 14 3.2 35 3.2
Total 670 100.0 436 100.0 1106 100.0

60
2.5.7 Colon (C18)
Table 2.5.7: Number (n) and proportion (%) according to broad histological classification- Cancer of Colon
Broad histological classification Males Females Total
n % n % n %
Adenocarcinoma
Adenocarcinoma NOS 5320 81.4 3545 81.7 8865 81.5
Papillary adenocarcinoma 35 0.5 35 0.8 70 0.6
Signet ring cell carcinoma 205 3.1 102 2.4 307 2.8
Mucinous adenocarcinoma 344 5.3 226 5.2 570 5.2
Mucin-producing adenocarcinoma 131 2.0 86 2.0 217 2.0
All other adenocarcinomas 40 0.6 16 0.4 56 0.5
Carcinoma, NOS 208 3.2 146 3.4 354 3.3
Squamous cell carcinoma
Squamous cell carcinoma 54 0.8 35 0.8 89 0.8
Neuroendocrine tumours
Neuroendocrine carcinoma 39 0.6 26 0.6 65 0.6
Other neuroendocrine tumours 4 0.1 10 0.2 14 0.1
Mesenchymal tumours
Gastrointestinal stromal sarcoma 17 0.3 9 0.2 26 0.2
Other mesenchymal tumours 6 0.1 11 0.3 17 0.2
Others 133 2.0 90 2.1 223 2.1
Total 6536 100.0 4337 100.0 10873 100.0

61
2.5.8 Rectum (C19 – C20)
Table 2.5.8: Number (n) and Relative proportion (%) according to broad histological classification- Cancer of Rectum
Broad histological classification Males Females Total
n % n % n %
Adenocarcinoma
Adenocarcinoma NOS 7940 83.5 5366 85.5 13306 84.3
Papillary adenocarcinoma 110 1.2 71 1.1 181 1.1
Signet ring cell carcinoma 425 4.5 222 3.5 647 4.1
Mucinous adenocarcinoma 256 2.7 128 2.0 384 2.4
Mucin-producing adenocarcinoma 172 1.8 93 1.5 265 1.7
All other adenocarcinomas 54 0.6 42 0.7 96 0.6
Carcinoma, NOS 235 2.5 135 2.2 370 2.3
Squamous cell carcinoma
Squamous cell carcinoma 158 1.7 130 2.1 288 1.8
Neuroendocrine tumours
Neuroendocrine carcinoma 53 0.6 33 0.5 86 0.5
Other neuroendocrine tumours 2 < 0.1 2 < 0.1 4 < 0.1
Mesenchymal tumours
Gastrointestinal stromal sarcoma 29 0.3 9 0.1 38 0.2
Other mesenchymal tumour 4 < 0.1 4 0.1 8 0.1
Others 68 0.7 41 0.7 109 0.7
Total 9506 100.0 6276 100.0 15782 100.0

62
2.5.9 Anus and Anal Canal (C21)
Table 2.5.9: Number (n) and proportion (%) according to broad histological classification - Cancer of Anus and Anal Canal
Broad Histological Classification Males Females Total
n % n % n %
Squamous cell carcinoma
Squamous cell carcinoma, NOS 796 43.7 483 42.5 1279 43.3
All other squamous cell carcinomas 45 2.5 28.0 2.5 73 2.5
Adenocarcinoma
Adenocarcinoma, NOS 713 39.2 474 41.7 1187 40.2
Mucinous adenocarcinoma 91 5.0 33 2.9 124 4.2
Signet ring cell carcinoma 73 4.0 30 2.6 103 3.5
Papillary adenocarcinoma 13 0.7 13 1.1 26 0.9
All other adenocarcinomas 10 0.5 11 1.0 21 0.7
Carcinoma, NOS 62 3.4 48.0 4.2 110 3.7
Neuroendocrine tumours
Neuroendocrine carcinoma 6 0.3 4 0.4 10 0.3
Other Neuroendocrine tumour 1 0.1 0 0.0 1 < 0.1
Mesenchymal tumours
Gastrointestinal stromal sarcoma 2 0.1 0 0.0 2 0.1
All other sarcomas 3 0.2 6 0.5 9 0.3
Others 5 0.3 6 0.5 11 0.4
Total 1820 100.0 1136 100.0 2956 100.0
2.6 Clinical Extent of Disease
Figure 2.6.1: Clinical extent of disease (%) for all sites of GI tract cancers in males and females

63
Figure 2.6.2: Clinical extent of disease (%): Site wise GI tract cancers – Males
Figure 2.6.3: Clinical extent of disease (%): Site wise GI tract cancers - Females
2.7 Intention to treat
Figure 2.7: Intention to treat according to clinical extent of disease (%) – GI tract cancers in
both sexes

64
2.8 Treatment modalities according to clinical extent of disease
Figure 2.8.1: Type of treatment according to clinical extent of disease- GI tract cancers - Males

65
Figure 2.8.2: Type of treatment according to clinical extent of disease – GI tract cancers – Females

66
2.9 Waiting time between registration and commencement of cancer directed treatment
2.9.1 Patients of GI tract cancers earlier diagnosed at another health facility and referred for
cancer directed treatment to the reporting institution
(a) Time between diagnosis and first attendance at the reporting institution
Figure 2.9.1a: Time between diagnosis and first attendance at reporting institution
(b) Time between first attendance and commencement of cancer directed treatment at reporting
institution
Figure 2.9.1b: Time between first attendance and commencement of cancer directed treatment at
reporting institution

67
(c) Time between first diagnosis and commencement of cancer directed treatment at reporting
institution
Figure 2.9.1c: Time between first diagnosis and commencement of cancer directed treatment at
reporting institution
2.9.2 Patients of GI tract cancers diagnosed and treated for cancer at the reporting
institution
Time between first diagnosis and commencement of cancer directed treatment at reporting institution
Figure 2.9.2: Time between first diagnosis and commencement of cancer directed treatment at
reporting institution

68
Key Findings
• The proportion of gall bladder cancer relative to all sites was higher in females
(3.7%) than males (2.2%), in comparison to other gastrointestinal sites.
• Over one-tenth of GI cancers were reported in the age group of 60-64 years among
males.
• Gall bladder cancer was reported in a higher proportion at a younger age (45-49
years) in women compared to other cancers.
• Liver cancers comprised over half the cancers in the less than 20 years age group in
both sexes.
• Rectal cancers comprised over a quarter of the cancers in the younger age groups
(20 to 34 years) in both sexes.
• Squamous Cell Carcinoma (SCC) constituted the majority of the oesophageal cancer
cases.
• Adenocarcinoma was the major histological type for all gastrointestinal cancer sites
except oesophagus and anus where squamous cell carcinoma was the commonest.
• A higher proportion of patients with gall bladder and liver cancers had distal
metastasis at the time of presentation.
• Chemotherapy was the primary single treatment modality for most stomach, liver
and gall bladder cancers, irrespective of the disease stage.
• The time between first diagnosis and commencement of cancer directed treatment
at reporting institution for over one-third of the patients ranged from 8 days to 30
days.


69
CHAPTER 3
LUNG CANCER
Table 3.0: Site classification according to ICD-10
3.1 Number and relative proportion of lung cancer
Table 3.1: Number (n) and relative proportion (%) of luncg cancer relative to all sites of cancer
Site of Cancer Males Females Total
n % n % n %
Lung Cancer 34395 10.8 10833 3.7 45228 7.4
3.2 Distribution of lung cancer according to five-year age groups
Table 3.2: Number (n) and proportion (%) of lung cancer according to five-year age groups
Age Groups Males Females
n Col % Row % n Col % Row %
<20 47 0.1 62.7 28 0.3 37.3
20-24 77 0.2 58.3 55 0.5 41.7
25-29 182 0.5 59.5 124 1.1 40.5
30-34 319 0.9 55.4 257 2.4 44.6
35-39 590 1.7 55.8 468 4.3 44.2
40-44 1203 3.5 61.0 768 7.1 39.0
45-49 2387 6.9 67.0 1174 10.8 33.0
50-54 4021 11.7 73.0 1485 13.7 27.0
55-59 5420 15.8 77.1 1610 14.9 22.9
60-64 7059 20.5 79.8 1783 16.5 20.2
65-69 6021 17.5 80.5 1458 13.5 19.5
70-74 4105 11.9 81.4 937 8.6 18.6
75-79 1952 5.7 82.6 411 3.8 17.4
80-84 748 2.2 79.0 199 1.8 21.0
85+ 261 0.9 77.4 76 0.7 22.6
All ages* 34395 100.0 76.0 10833 100.0 24.0 Mean (SD)
Years 60 (11) 56 (12)
*Includes cases with unknown age
Site of Cancer ICD-10 Code
Trachea C33
Bronchus and Lung C34

70
3.3 Broad methods of diagnosis
Table 3.3: Number (n) and proportion (%) of lung cancer according to most valid method of diagnosis
Method of Diagnosis Males Females
n % n %
Microscopic 33624 97.8 10594 97.8
Imaging Techniques 680 2.0 205 1.9
Clinical Only 36 0.1 17 0.2
Total* 34395 100.0 10833 100.0
*Cases with unknown and other methods of diagnosis are included.
3.4 Types of microscopic diagnosis
Table 3.4: Number (n) and proportion (%) of lung cancer according to specific type of microscopic diagnosis
Type of microscopic diagnosis Males Females
n % n %
Primary Histology 23489 69.9 7168 67.7
Histology of metastasis 2245 6.7 828 7.8
Cytology of Primary 5458 16.2 1888 17.8
Cytology of Metastasis 2432 7.2 710 6.7
All microscopic 33624 100.0 10594 100.0
3.5 Major histological types
Table 3.5: Number (n) and proportion (%) of lung cancer according to broad histological classification
Broad histological classification Males Females Total
n % n % n %
Epithelial tumours
Adenocarcinomas 11801 35.1 5745 54.2 17546 39.7
Squamous cell carcinoma 7844 23.3 1192 11.3 9036 20.4
Non-small cell carcinoma, NOS 5280 15.7 1229 11.6 6509 14.7
Small cell carcinoma 3342 9.9 618 5.8 3960 9.0
Other neuroendocrine tumours 434 1.3 171 1.6 605 1.4
Carcinoma, NOS 1848 5.5 530 5.0 2378 5.4
Mesenchymal Tumours 91 0.3 58 0.6 149 0.3
Tumours of ectopic origin
Germ cell tumours 5 <0.1 1 <0.1 6 <0.1
Others 2979 8.9 1050 9.9 4029 9.1
Total 33624 100.0 10594 100.0 44218 100.0
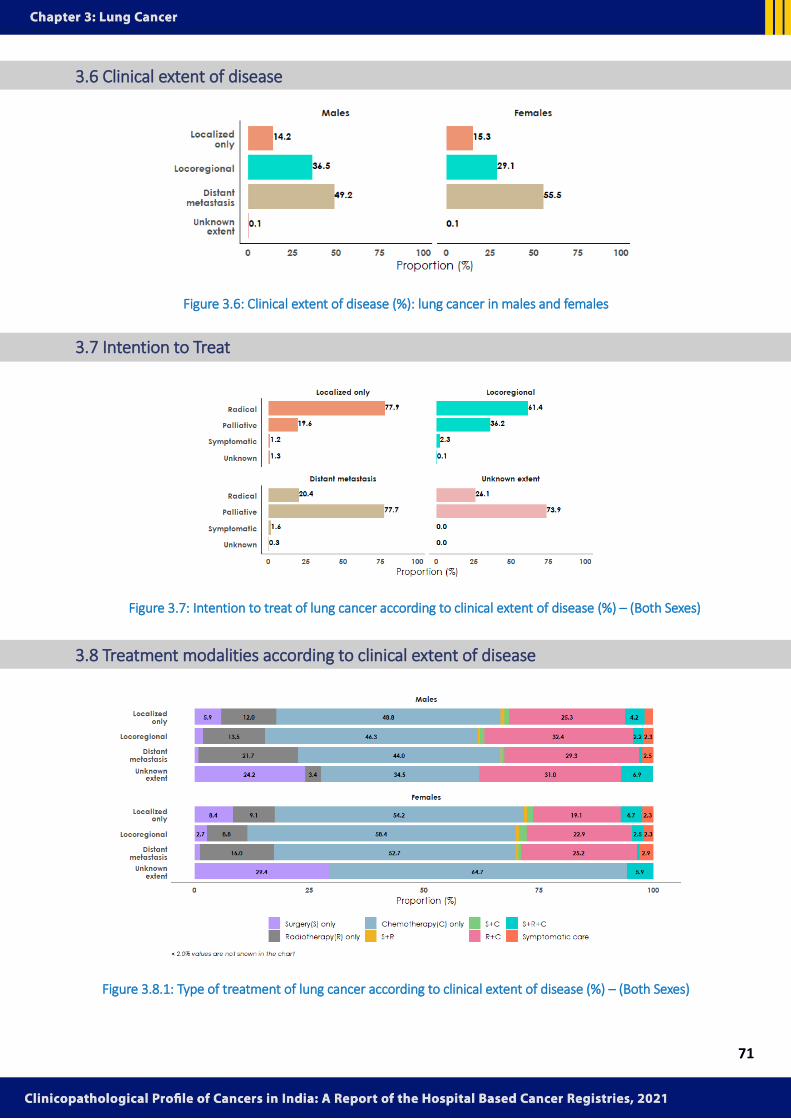
71
3.6 Clinical extent of disease
Figure 3.6: Clinical extent of disease (%): lung cancer in males and females
3.7 Intention to Treat
Figure 3.7: Intention to treat of lung cancer according to clinical extent of disease (%) – (Both Sexes)
3.8 Treatment modalities according to clinical extent of disease
Figure 3.8.1: Type of treatment of lung cancer according to clinical extent of disease (%) – (Both Sexes)

72
3.9 Waiting time between registration and commencement of cancer directed treatment
3.9.1 Patients of lung cancer earlier diagnosed at another health facility and referred for cancer
directed treatment to the reporting institution
(a) Time between diagnosis and first attendance at the reporting institution
Figure 3.9.1a: Time between diagnosis and first attendance at reporting institution
(b) Time between first attendance and commencement of cancer directed treatment at reporting
institution
Figure 3.9.1b: Time between first attendance and commencement of cancer directed treatment at reporting institution

73
Time between first diagnosis and commencement of cancer directed treatment at reporting
institution
Figure 3.9.1c: Time between first diagnosis and commencement of cancer directed treatment at reporting institution
3.9.2 Patients of lung cancer diagnosed and treated for cancer at the reporting institution
Time between first diagnosis and commencement of cancer directed treatment at reporting institution
Figure 3.9.2: Time between first diagnosis and commencement of cancer directed treatment at reporting institution

74
Key Findings
• Cancer of the lung accounted for over 10 % of the cancers among males.
• Nearly a fifth ( 20.5%) of lung cancers were reported in the age group of 60-64 years
among males.
• Adenocarcinoma was the most common histological type of lung cancer in males and
females, accounting for 35.1% and 54.2 % of the histological types.
• Nearly half of the lung cancer cases (49.2% among males and 55.5% among females)
were diagnosed with distant metastasis.
• Chemotherapy only was the most commonly used treatment modality for most cases,
irrespective of the clinical extent of disease.
• Close to one-third of patients with localized disease diagnosed at the reporting
institutions were initiated on treatment on the same day.


75
CHAPTER 4
GYNAECOLOGICAL CANCERS INCLUDING BREAST CANCER
Table 4.0: Site classification according to ICD-10
4.1 Number and relative proportion of gynaecological cancers including breast cancer
Table 4.1: Number (n) and relative proportion (%) of gynaecological cancers including breast cancer relative to all sites of cancer among women
Site of cancer (ICD-10 Code) n %
Breast (C50) 73998 25.4
Cervix Uteri (C53) 44300 15.2
Corpus Uteri (C54) 7648 2.6
Ovary (C56) 18411 6.3
Other Gynaecological Cancers (C51, C52, C55, C57, C58)
3981 1.4
C51(Vulva) 1112 0.4
C52(Vagina) 1749 0.6
C55 (Uterus part unspecified) 691 0.2
C57 (Fallopian tube) 216 0.1
C58 (Placenta) 213 0.1
Gynaecological cancers including breast cancer 148338 51.0
All sites of cancer in women 290986 100.0
Site of Cancer ICD-10 Code
Breast C50
Vulva C51
Vagina C52
Cervix Uteri C53
Corpus Uteri C54
Uterus part unspecified C55
Ovary C56
Fallopian Tube C57

76
4.2 Distribution of gynaecological cancers including breast cancer according to five-year age groups
Table 4.2: Number (n) and proportion (%) of gynaecological cancers including breast cancer according to five-year age groups
Age group Breast Cervix Uteri Corpus Uteri Ovary
Other Gynaecological Cancers
Total
n Row % Col % n Row % Col % n Row % Col % n Row % Col % n Row % Col % n Row % Col %
< 20 26 2.6 <0.1 9 1.0 <0.1 6 0.4 0.1 624 82.0 3.4 62 14.0 1.6 727 100.0 0.5
20-24 302 32.4 0.4 68 7.3 0.1 24 2.6 0.3 442 47.4 2.4 96 10.3 2.4 932 100.0 0.6
25-29 1330 56.2 1.8 309 13.0 0.7 53 2.2 0.7 535 22.6 2.9 141 6.0 3.5 2368 100.0 1.6
30-34 3512 64.0 4.7 1025 18.7 2.3 105 1.9 1.4 690 12.6 3.8 156 2.8 3.9 5488 100.0 3.7
35-39 6716 59.3 9.1 2919 25.8 6.6 214 1.9 2.8 1270 11.2 6.9 208 1.8 5.2 11327 100.0 7.7
40-44 9778 55.7 13.2 5215 29.7 11.8 334 1.9 4.3 1942 11.0 10.6 297 1.7 7.5 17566 100.0 11.8
45-49 12465 52.4 16.8 7423 31.2 16.8 651 2.7 8.5 2784 11.7 15.1 472 2.0 11.9 23795 100.0 16.0
50-54 11239 48.8 15.2 7320 31.8 16.5 1213 5.2 15.9 2759 12.0 15.0 515 2.2 12.9 23046 100.0 15.6
55-59 9764 46.9 13.2 6647 31.9 15.0 1469 7.0 19.2 2433 11.7 13.2 520 2.5 13.1 20833 100.0 14.0
60-64 8116 44.1 11.0 5994 32.6 13.5 1565 8.5 20.5 2195 11.9 11.9 522 2.9 13.1 18392 100.0 12.4
65-69 5479 44.2 7.4 3949 31.8 8.9 1093 8.8 14.3 1460 11.8 7.9 419 3.4 10.5 12400 100.0 8.4
70-74 2916 44.4 3.9 2021 30.8 4.6 570 8.7 7.4 771 11.8 4.2 285 4.3 7.2 6563 100.0 4.4
75-79 1424 47.7 1.9 832 27.9 1.9 227 7.6 3.0 332 11.1 1.8 171 5.7 4.3 2986 100.0 2.0
80-84 649 48.9 0.9 381 28.7 0.9 86 6.5 1.1 126 9.5 0.7 85 6.4 2.1 1327 100.0 0.9
85+ 281 48.3 0.4 184 31.7 0.4 38 6.5 0.5 46 7.9 0.2 32 5.5 0.8 581 100.0 0.4
All ages* 73998 49.9 100.0 44300 29.9 100.0 7648 5.1 100.0 18411 12.4 100.0 3981 2.7 100.0 148338 100.0 100.0
Mean (SD) (Years)
51 (12) 53 (11) 58 (11) 50 (14) 53 (15) 52 (12)
* Includes cases with unknown age

77
4.3 Broad methods of diagnosis
Table 4.3: Number (n) and proportion (%) of cancer sites by most valid method of diagnosis –
gynaecological cancers including breast cancer
Method of diagnosis
Breast Cervix Uteri Corpus Uteri Ovary Other
Gynaecological Cancers
Total
n % n % n % n % n % N %
Microscopic 73766 99.7 44102 99.6 7595 99.3 17887 97.2 3877 97.4 147227 99.3
Imaging Techniques
123 0.2 107 0.2 40 0.5 389 2.1 44 1.1 703 0.5
Clinical Only 69 0.1 71 0.2 7 0.1 44 0.2 13 0.3 204 0.1
Total* 73998 100.0 44300 100.0 7648 100.0 18411 100.0 3981 100.0 148338 100.0
*Cases with unknown and other methods of diagnosis are included.
4.4 Types of microscopic diagnosis
Table 4.4: Number (n) and proportion (%) according to specific type of microscopic diagnosis –
gynaecological cancers including breast cancer
Type of microscopic
diagnosis
Breast Cervix Uteri Corpus Uteri Ovary Other
Gynaecological Cancers
Total
n % n % n % n % n % n %
Primary Histology
68651 93.1 42920 97.3 7375 97.1 14517 81.2 3694 95.3 137157 93.2
Histology of metastasis
513 0.7 96 0.2 35 0.5 601 3.4 18 0.4 1263 0.8
Cytology of Primary
4054 5.5 1038 2.4 169 2.2 2136 11.9 138 3.6 7535 5.1
Cytology of Metastasis
548 0.7 48 0.1 16 0.2 633 3.5 27 0.7 1272 0.9
All microscopic 73766 100.0 44102 100.0 7595 100.0 17887 100.0 3877 100.0 147227 100.0

78
4.5 Major histological types
4.5.1 Breast (C50)
Table 4.5.1: Number (n) and proportion (%) according to broad histological classification – Breast Cancer
Broad histological classification n %
Epithelial tumours
Infiltrating duct carcinoma 66160 89.7
Lobular carcinoma 1341 1.8
Papillary carcinoma 398 0.5
Carcinoma, NOS 3025 4.1
Fibroepithelial tumours
Phyllodes tumour 414 0.6
Mesenchymal tumours
Sarcoma 122 0.2
Others 2306 3.1
Total 73766 100.0
4.5.2 Cervix Uteri (C53)
Table 4.5.2: Number (n) and proportion (%) according to broad histological classification- Cancer of Cervix Uteri
Broad histological classification n %
Squamous cell carcinoma
Squamous cell carcinoma, NOS 26524 60.1
Squamous cell carcinoma, non-keratinising 8314 18.9
Squamous cell carcinoma, keratinising 4184 9.5
All other squamous cell carcinomas 430 1.0
Adenocarcinoma
Adenocarcinoma, NOS 2215 5.0
All other adenocarcinomas 687 1.6
Carcinoma, NOS 1150 2.6
Adenosquamous carcinoma
Adenosquamous carcinoma 426 1.0
Mesenchymal tumours
Sarcoma 52 0.1
Others 120 0.3
Total 44102 100.0

79
4.5.3 Corpus Uteri (C54)
Table 4.5.3: Number (n) and proportion (%) according to broad histological Classification-Cancer of Corpus Uteri
Broad histological classification n %
Endometrial epithelial tumours
Endometrioid adenocarcinoma 4133 54.4
Adenocarcinoma, NOS 1779 23.4
Serous carcinoma 204 2.7
Clear cell adenocarcinoma 146 1.9
Papillary adenocarcinoma 129 1.7
All other adenocarcinomas 69 0.9
Carcinoma, NOS 363 4.8
Mixed epithelial mesenchymal tumours
Mullerian mixed tumour 134 1.8
Carcinosarcoma 94 1.2
Mesenchymal tumours
Sarcoma 63 0.8
Endometrial stromal sarcoma 60 0.8
Neuroendocrine tumours
Neuroendocrine carcinoma 16 0.2
Others 280 3.7
Total 7595 100.0

80
4.5.4 Ovary (C56)
Table 4.5.4: Number (n) and proportion (%) according to broad histological classification- Cancer of Ovary
4.6 Clinical Extent of Disease
Figure 4.6: Clinical extent of disease (%) for all sites of different type of gynaecological cancers
including breast cancer
Broad histological classification n %
Epithelial cell tumours
Adenocarcinoma, NOS 5850 32.7
Serous Adenocarcinoma 5529 30.9
Mucinous Adenocarcinoma 895 5.0
Papillary Carcinoma, NOS 863 4.8
Endometrioid Adenocarcinoma 318 1.8
Clear Cell Adenocarcinoma 252 1.4
All Other Adenocarcinomas 68 0.4
Other Endometrioid tumours 7 <0.1
Granular cell carcinoma 6 <0.1
Metaplastic carcinoma 7 <0.1
Carcinoma, NOS 1299 7.3
Malignant Neoplasms - ovary 966 5.4
Germ cell tumours
Germ Cell Neoplasms 863 4.8
Sex-cord stromal tumours
Granulosa Cell Tumour 205 1.1
Mesenchymal tumours
Sarcoma 117 0.7
Others 642 3.6
Total 17887 100.0

81
4.7 Intention to Treat
Figure 4.7: Intention to treat according to clinical extent of disease (%) –
gynaecological cancers including breast cancer
4.8 Treatment modalities according to clinical extent of disease
Figure 4.8.1: Type of treatment according to clinical extent of disease (%) –
Breast Cancer

82
Figure 4.8.2: Type of treatment according to clinical extent of disease (%) – Cancer of cervix uteri, corpus
uteri and ovary

83
4.9 Waiting time between registration and commencement of cancer directed treatment
4.9.1 Patients of gynaecological cancers including breast cancer earlier diagnosed at
another health facility and referred for cancer directed treatment to the reporting
institution
(a) Time between diagnosis and first attendance at the reporting institution
Figure 4.9.1a: Time between diagnosis and first attendance at reporting institution
(b) Time between first attendance and commencement of cancer directed treatment at reporting
institution
Figure 4.9.1b: Time between first attendance and commencement of cancer directed treatment at
reporting institution

84
(c) Time between first diagnosis and commencement of cancer directed treatment at reporting
institution
Figure 4.9.1c: Time between first diagnosis and commencement of cancer directed treatment at
reporting institution
4.9.2 Patients of gynaecological cancers including breast cancer who had been diagnosed
and treated for cancer at reporting institution
Time between first diagnosis and commencement of cancer directed treatment at reporting institution
Figure 4.9.2: Time between first diagnosis and commencement of cancer directed treatment at Reporting
Institution

85
Key findings
• Gynaecological cancers, including breast cancer, account for over half of all
cancers in women. Over a quarter of the cases were breast cancer (25.4%)
followed by cervical cancer (15.2%).
• In the younger age group (below 25 years), ovarian cancers were the commonest cancer types. From 25 years and up, breast cancer was the major cancer type in all age groups.
• Cancers of breast, cervix-uteri and ovary were recorded in higher proportion in
the younger age group of 45-49 years than other gynaecological cancers.
• Epithelial tumours (infiltrating duct carcinoma-89.7%) was the most common
histology of breast cancer, and squamous cell carcinoma (60.1 %) was the most
common histology of cancer of cervix-uteri. Among corpus uteri cancer,
endometroid adenocarcinoma (54.4%) was the most common histology observed.
• Over half of the patients with corpus uterine cancer presented with localised
disease.
• Among all the gynaecological cancers, the proportion of patients presenting with
distant spread was highest (nearly one-third) for ovarian cancer.
• The broadest used treatment modality for cervical cancer was a combination of
radiotherapy and chemotherapy. A larger number of ovarian cancers were treated
by surgery and chemotherapy combination.
• About a quarter of the patients with localised disease diagnosed at the reporting
institution were initiated on cancer directed treatment on the same day.


86
CHAPTER 5
PROSTATE CANCER
Table 5.0: Site classification according to ICD-10
5.1 Number and relative proportion of prostate cancer
Table 5.1: Number (n) and relative proportion (%) of prostate cancer relative to all sites of cancer
All sites Prostate cancer
N n %
319098 9547 3.0
5.2 Distribution of prostate cancers according to five-year age groups
Table 5.2: Number (n) and proportion (%) of prostate cancer according to five-year age groups
Age groups n %
< 20 16 0.2
20-24 5 0.1
25-29 2 <0.1
30-34 5 0.1
35-39 10 0.1
40-44 49 0.5
45-49 168 1.8
50-54 415 4.3
55-59 934 9.8
60-64 1762 18.5
65-69 2128 22.3
70-74 2026 21.2
75-79 1296 13.6
80-84 509 5.3
85+ 221 2.2
All ages* 9547 100.0
Mean (SD) Years
67 (9)
* Includes cases with unknown age
Site of Cancer ICD-10 Code
Prostate C61

87
5.3 Broad methods of diagnosis
Table 5.3: Number (n) and proportion (%) of prostate cancer by most valid method of diagnosis
Method of Diagnosis n %
Microscopic 9367 98.1
Imaging Techniques 123 1.3
Clinical Only 27 0.3
Total* 9547 100.0
*Cases with unknown and other methods of diagnosis are included.
5.4 Types of microscopic diagnosis
Table 5.4: Number (n) and proportion (%) of prostate cancer by type of microscopic diagnosis
Type of microscopic diagnosis n %
Primary Histology 8881 94.8
Histology of metastasis 175 1.9
Cytology of Primary 230 2.4
Cytology of Metastasis 81 0.9
All microscopic 9367 100.0
5.5 Major histological types
Table 5.5: Number (n) and proportion (%) of prostate cancer according to broad histological classification
Broad histological classification n %
Epithelial tumours
Adenocarcinoma,NOS 7207 77.0
Acinar cell carcinoma 1416 15.1
Transitional cell carcinoma 31 0.3
Squamous cell carcinoma 48 0.5
Carcinoma, NOS 434 4.6
Neuroendocrine tumours
Neuroendocrine tumours 52 0.6
Mesenchymal tumours
Mesenchymal tumours 31 0.3
Others 148 1.6
Total 9367 100

88
5.6 Clinical extent of disease
Figure 5.6: Clinical extent of disease (%): prostate cancer
5.7 Intention to treat
Figure 5.7: Intention to treat according to the clinical extent of disease (%) - prostate cancer

89
5.8 Treatment modalities according to clinical extent of disease
Figure 5.8: Type of treatment according to clinical extent of disease (%) - prostate cancer
5.9 Waiting time between registration and commencement of cancer directed treatment
5.9.1 Patients of prostate cancer earlier diagnosed at another health facility and referred for cancer directed
treatment to the reporting institution
(a) Time between diagnosis and first attendance at the reporting institution
Figure 5.9.1a: Time between diagnosis and first attendance at reporting institution

90
(b) Time between first attendance and commencement of cancer directed treatment at reporting institution
Figure 5.9.1b: Time between first attendance and commencement of cancer directed treatment at reporting
institution
(c) Time between first diagnosis and commencement of cancer directed treatment at reporting institution
Figure 5.9.1c: Time between first diagnosis and commencement of cancer directed treatment at reporting institution
5.9.2 Patients of prostate cancer diagnosed and treated for cancer at the reporting institution

91
Time between first diagnosis and commencement of cancer directed treatment at reporting institution
Figure 5.9.2: Time between first diagnosis and commencement of cancer directed treatment at reporting institution
Key findings
• Over 80% of the cases were reported in patients above the age of 60 years.
• Adenocarcinoma, NOS constituted the majority of the prostate cancer cases (77%).
• Nearly 42.9% of the patients were diagnosed with distant metastasis.
• Systemic therapy was the most frequently used treatment modality for patients
with distant metastasis.
• Close to half of the patients who had been diagnosed in another institution sought
treatment at the reporting hospital within 8 to 30 days.
• About one-third of patients with localised disease diagnosed at the reporting
institution initiated cancer directed treatment on the same day. .


92
CHAPTER 6
CANCERS OF KIDNEY AND URINARY BLADDER
Table 6.0: Site classification according to ICD-10
6.1 Number and relative proportion of cancers of kidney and bladder
Table 6.1: Number (n) and relative proportion (%) of cancers of kidney and bladder relative to all sites of cancer
Site of Cancer Males Females Total
n % n % n %
Kidney 4582 1.4 1944 0.7 6526 2.1
Bladder 4706 1.5 1020 0.4 5726 1.9
6.2 Distribution of cancers of kidney and bladder according to five-year age groups
Table 6.2.1: Number (n) and proportion (%) of cancers of kidney and bladder according to five-year age groups - Males
Age groups Kidney Bladder
n % n %
< 20 624 13.6 36 0.8
20-24 35 0.8 16 0.3
25-29 63 1.4 27 0.6
30-34 82 1.8 46 1.0
35-39 152 3.3 97 2.1
40-44 282 6.2 207 4.4
45-49 430 9.4 342 7.3
50-54 559 12.2 495 10.5
55-59 621 13.6 577 12.3
60-64 675 14.7 863 18.3
65-69 544 11.9 750 15.9
70-74 321 7.0 623 13.2
75-79 138 3.0 381 8.1
80-84 36 0.8 146 3.1
85+ 20 0.4 99 2.1
All ages* 4582 100.0 4706 100.0
Mean (SD) Years 49 (21) 61 (13) * Includes cases with unknown age
Site of Cancer ICD-10 Code
Kidney C64
Urinary Bladder C67

93
Table 6.2.2: Number (n) and proportion (%) of cancers of kidney and bladder according to five-year age groups – Females
Age groups Kidney Bladder
n % n %
< 20 452 23.3 15 1.5
20-24 27 1.4 3 0.3
25-29 53 2.7 11 1.1
30-34 63 3.2 12 1.2
35-39 73 3.8 30 2.9
40-44 133 6.8 65 6.4
45-49 205 10.5 86 8.4
50-54 173 8.9 114 11.2
55-59 235 12.1 130 12.7
60-64 207 10.6 160 15.7
65-69 162 8.3 153 15.0
70-74 98 5.0 127 12.5
75-79 36 1.9 65 6.4
80-84 22 1.1 32 3.1
85+ 4 0.2 17 1.7
All ages* 1944 100.0 1020 100.0
Mean (SD) Years 42 (24) 59 (14) * Includes cases with unknown age
6.3 Broad methods of diagnosis
Table 6.3: Number (n) and proportion (%) of cancers of kidney and bladder by most valid method of diagnosis
Method of diagnosis Kidney Bladder
n % n %
Males
Microscopic 4479 97.8 4651 98.8
Imaging Techniques 89 1.9 43 0.9
Clinical Only 5 0.1 3 0.1
Total* 4582 100.0 4706 100.0
Females
Microscopic 1910 98.3 1011 99.1
Imaging Techniques 32 1.6 7 0.7
Clinical Only 2 0.1 1 0.1
Total* 1944 100.0 1020 100.0 *Cases with unknown and other methods of diagnosis are included.

94
6.4 Types of microscopic diagnosis
Table 6.4: Number (n) and proportion (%) of cancers of kidney and bladder according to specific type of
microscopic diagnosis
Type of microscopic diagnosis Kidney Bladder
n % n %
Males
Primary Histology 4030 90.0 4489 96.5
Histology of metastasis 91 2.0 24 0.5
Cytology of Primary 312 7.0 113 2.4
Cytology of Metastasis 46 1.0 25 0.5
All microscopic 4479 100.0 4651 100.0
Females
Primary Histology 1720 90.1 967 95.6
Histology of metastasis 22 1.2 5 0.5
Cytology of Primary 145 7.6 29 2.9
Cytology of Metastasis 23 1.2 10 1.0
All microscopic 1910 100.0 1011 100.0
6.5 Major histological types
6.5.1 Kidney (C64)
Table 6.5.1: Number (n) and proportion (%) according to broad histological classification- Cancer of kidney
Broad histological classification Males Females Total
n % n % n %
Renal cell tumours
Renal Cell Carcinoma,NOS 2921 65.2 1140 59.7 4061 63.6
Clear cell renal cell carcinoma 357 8.0 113 5.9 470 7.4
Papillary renal cell carcinoma 231 5.2 60 3.1 291 4.6
Renal cell carcinoma, chromophobe type 58 1.3 48 2.5 106 1.7
Transitional Cell Carcinoma 52 1.2 26 1.4 78 1.2
Sarcomatoid renal cell carcinoma 45 1.0 15 0.8 60 0.9
Renal carcinoma, collecting duct type 9 0.2 3 0.2 12 0.2
Nephroblastic and cystic tumours occurring mainly in children
Nephroblastoma 535 11.9 371 19.4 906 14.2
Mesenchymal tumours
Clear Cell Sarcoma of Kidney 23 0.5 9 0.5 32 0.5
Rhabdoid tumour 5 0.1 4 0.2 9 0.1
Other mesenchymal tumours 48 1.1 37 1.9 85 1.3
Neuroendocrine tumours
Neuroendocrine tumours 23 0.5 20 1.0 43 0.7
Squamous cell carcinoma 19 0.4 12 0.6 31 0.5
Carcinoma,NOS 55 1.2 24 1.3 79 1.2
Miscellaneous
Germ Cell Tumours 6 0.1 3 0.2 9 0.1
Others 92 2.1 25 1.3 117 1.8
Total 4479 100.0 1910 100.0 6389 100.0

95
6.5.2 Bladder (C67)
Table 6.5.2: Number (n) and proportion (%) according to broad histological classification- Cancer of bladder
Broad histological classification Males Females Total
n % n % N %
Urothelial carcinoma
Transitional Cell Carcinoma 2496 53.7 498 49.3 2994 52.9
Papillary Carcinoma 1433 30.8 298 29.5 1731 30.6
Carcinoma, NOS 276 5.9 57 5.6 333 5.9
Glandular neoplasms
Adenocarcinoma 229 4.9 81 8.0 310 5.5
Squamous cell neoplasms
Squamous Cell Carcinoma 134 2.9 53 5.2 187 3.3
Mesenchymal tumours
Sarcoma 46 1.0 16 1.6 62 1.1
Neuroendocrine tumours
Neuroendocrine Carcinoma, NOS 14 0.3 0 0.0 14 0.2
Others 23 0.5 8 0.8 31 0.5
Total 4651 100.0 1011 100.0 5662 100.0
6.6 Clinical extent of disease
Figure 6.6.1: Clinical extent of disease (%): Cancer of kidney in males and females
Figure 6.6.2: Clinical extent of disease (%): Cancer of bladder in males and females

96
6.7 Intention to treat
Figure 6.7.1: Intention to treat according to clinical extent of disease (%) - Cancer of kidney (Both Sexes)
Figure 6.7.2: Intention to treat according to clinical extent of disease (%) - Cancer of bladder (Both Sexes)

97
6.8 Treatment modalities according to clinical extent of disease
Figure 6.8.1: Type of treatment according to clinical extent of disease (%) - Cancer of kidney (Both Sexes)
Figure 6.8.2: Type of treatment according to clinical extent of disease (%) - Cancer of bladder (Both Sexes)

98
6.9: Waiting time between registration and commencement of cancer directed treatment
6.9.1 Patients of cancers of kidney and bladder earlier diagnosed at another health facility and
referred for cancer directed treatment to the reporting institution
(a) Time between diagnosis and first attendance at reporting institution
Figure 6.9.1a: Time between diagnosis and first attendance at reporting institution – kidney cancer
(b) Time between first attendance and commencement of cancer directed treatment at reporting
institution
Figure 6.9.1b: Time between first attendance and commencement of cancer directed treatment at
reporting institution – kidney cancer

99
(c) Time between first diagnosis and commencement of cancer directed treatment at reporting
institution
Figure 6.9.1c: Time between first diagnosis and commencement of cancer directed treatment at
reporting institution – kidney cancer
(d) Time between diagnosis and first attendance at reporting institution
Figure 6.9.1d: Time between diagnosis and first attendance at reporting institution – bladder cancer

100
(e) Time between first attendance and commencement of cancer directed treatment at reporting
institution
Figure 6.9.1e: Time between first attendance and commencement of cancer directed treatment at
reporting institution – bladder cancer
(f) Time between first diagnosis and commencement of cancer directed treatment at reporting
institution
Figure 6.9.1f: Time between first diagnosis and commencement of cancer directed treatment at reporting
institution - bladder cancer
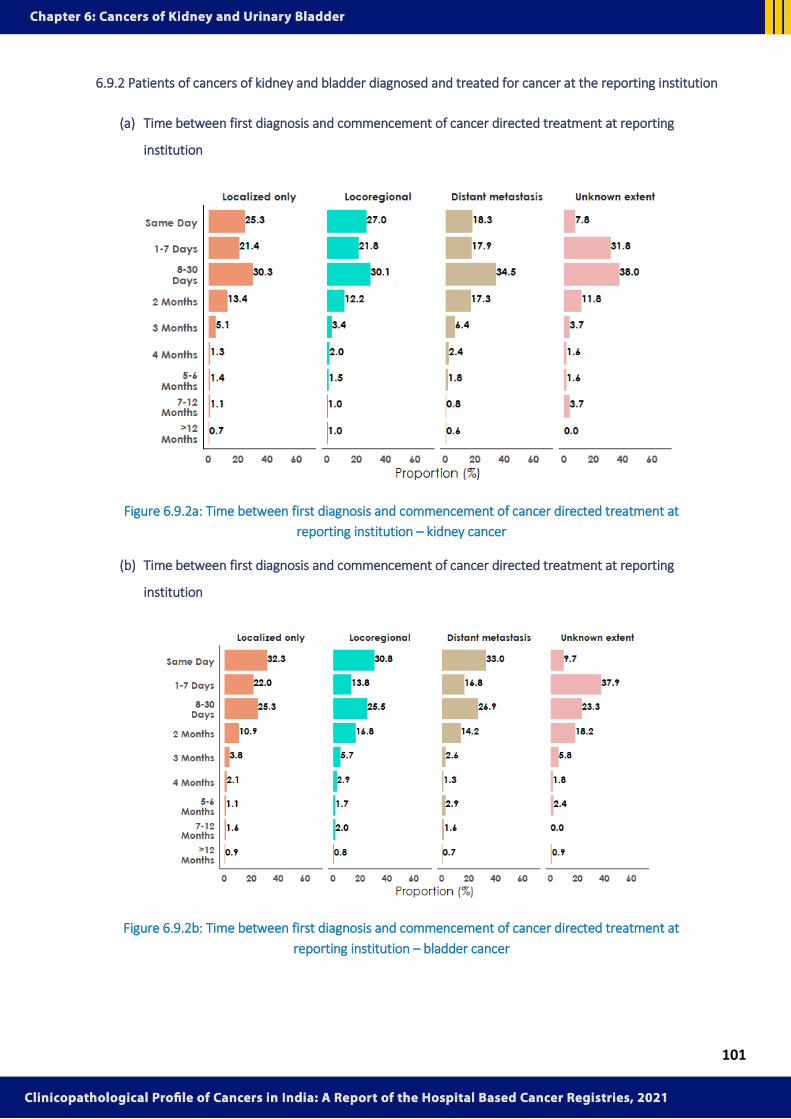
101
6.9.2 Patients of cancers of kidney and bladder diagnosed and treated for cancer at the reporting institution
(a) Time between first diagnosis and commencement of cancer directed treatment at reporting
institution
Figure 6.9.2a: Time between first diagnosis and commencement of cancer directed treatment at
reporting institution – kidney cancer
(b) Time between first diagnosis and commencement of cancer directed treatment at reporting
institution
Figure 6.9.2b: Time between first diagnosis and commencement of cancer directed treatment at
reporting institution – bladder cancer

102
Key findings
• Close to a quarter (23.3%) of kidney cancers were reported in the age group of <20
years.
• Among kidney cancers, Renal Cell Carcinoma (RCC), NOS constituted the majority of
the renal cancer cases (males -65.2%, females-59.7%).
• Among the urinary bladder cancers, about half the cancers reported (males-53.7%,
females-49.3%) were transitional cell carcinoma.
• Over a quarter of the male kidney cancer patients presented with distant metastasis.
• Surgery was the most frequently used treatment modality for localised, locoregional
and unknown disease stages of kidney and bladder cancer.
• Close to one- third patients with bladder cancer regardless of clinical extent, who
had been diagnosed at the reporting institutions, commenced cancer directed
treatment on the same day.


103
CHAPTER 7
CANCERS OF BRAIN AND NERVOUS SYSTEM (NS)
Table 7.0: Site classification according to ICD-10
The sites included here are Meninges (C70), Brain (C71) and Spinal Cord, Cranial Nerves and Other parts
of Central Nervous System (C72).
7.1 Number and relative proportion of cancers of the brain and nervous system
Table 7.1: Number (n) and relative proportion (%) of cancers of brain and nervous system relative to all sites of cancer
Sex All sites
Cancers of Brain and Nervous System
N n %
Males 319098 6372 2.0
Females 290986 3670 1.3
Total 610084 10042 1.6
7.2 Distribution of cancers of brain and nervous system according to five-year age groups
Table 7.2: Number (n) and proportion (%) of cancers of brain and nervous system according to five year age group
Age groups Males Females
n Col % Row % n Col % Row %
00-04 269 4.2 61.6 168 4.6 38.4
05-09 421 6.6 59.1 291 7.9 40.9
10-14 324 5.1 62.8 192 5.2 37.2
15-19 280 4.4 65.6 147 4.0 34.4
20-24 325 5.1 67.4 157 4.3 32.6
25-29 413 6.5 63.8 234 6.4 36.2
30-34 504 7.9 63.0 296 8.1 37.0
35-39 543 8.5 63.4 314 8.6 36.6
40-44 530 8.3 60.4 347 9.5 39.6
45-49 558 8.8 61.2 354 9.6 38.8
50-54 601 9.4 64.1 337 9.2 35.9
Site of Cancer ICD-10 Code
Meninges (Cerebral Meninges,Spinal meninges, Meninges,NOS) C70
Brain C71
Spinal Cord, Cranial Nerves and Other parts of Central Nervous System C72

104
Age groups Males Females
n Col % Row % n Col % Row %
55-59 527 8.3 61.5 330 9.0 38.5
60-64 505 7.9 67.2 246 6.7 32.8
65-69 322 5.1 68.1 151 4.1 31.9
70-74 153 2.4 72.2 59 1.6 27.8
75-79 68 1.1 66.0 35 0.9 34.0
80-84 22 0.3 73.3 8 0.2 26.7
85+ 6 0.1 60.0 4 0.1 40.0
All ages* 6372 100.0 63.5 3670 100.0 36.5
Mean (SD) Years 39 (20) 38 (19) * Includes cases with unknown age
7.3 Broad methods of diagnosis
Table 7.3: Number (n) and proportion (%) for cancers of the brain and nervous system by most valid
methods of diagnosis
Method of Diagnosis Males Females
n % n %
Microscopic 6048 94.9 3472 94.6
Imaging Techniques 307 4.8 191 5.2
Clinical Only 5 0.1 4 0.1
Total* 6372 100.0 3670 100.0
*Cases with unknown and other methods of diagnosis are included.
7.4 Types of microscopic diagnosis
Table 7.4: Number (n) and proportion (%) according to specific type of microscopic diagnosis for
cancers of brain and nervous system
Type of microscopic diagnosis Males Females
n % n %
Primary Histology 5947 98.3 3422 98.6
Histology of metastasis 25 0.4 10 0.3
Cytology of Primary 68 1.2 36 1.0
Cytology of Metastasis 9 0.1 5 0.1
All microscopic 6048 100.0 3472 100.0

105
7.5 Major histological types
Table 7.5: Number (n) and proportion (%) according to broad histological classification - cancers of brain
and nervous system
Broad histological classification Males Females Total
n % n % N %
Glioblastoma 1898 31.4 963 27.7 2861 30.0
Astrocytoma 1497 24.8 780 22.5 2277 23.9
Oligodendroglial tumors 611 10.1 391 11.3 1002 10.5
Glioma, NOS 494 8.2 274 7.9 768 8.1
Medulloblastoma 501 8.3 257 7.4 758 8.0
Ependymal tumors 300 5.0 202 5.8 502 5.3
Meningioma, malignant 193 3.2 265 7.6 458 4.8
All Other Gliomas 195 3.2 120 3.5 315 3.3
Carcinoma, NOS 134 2.2 81 2.3 215 2.2
Embryonal tumors 118 1.9 69 2.0 187 2.0
Germ cell tumor 38 0.6 30 0.9 68 0.7
Neoplasm, malignant 30 0.5 7 0.2 37 0.4
Peripheral Neuroectodermal Tumour 10 0.2 10 0.3 20 0.2
Neuronal & Mixed neuronal - glial tumours 8 0.1 10 0.3 18 0.2
Choroid Plexus Papilloma, Malignant 12 0.2 5 0.1 17 0.2
Pineoblastoma 3 <0.1 3 0.1 6 0.1
Others 6 0.1 5 0.1 11 0.1
Total 6048 100.0 3472 100.0 9520 100.0
7.6 Intention to treat
Figure 7.6: Intention to treat (%) – cancers of brain and nervous system (both sexes)

106
7.7 Treatment modalities according to clinical extent of the disease
Figure 7.7: Type of treatment according to clinical extent of disease- cancers of brain and nervous
system (both sexes)
7.8. Waiting time between registration and commencement of cancer directed treatment
7.8.1 Patients of cancers of brain and nervous system earlier diagnosed at another health facility
and referred for cancer directed treatment to the reporting institution
(a) Time between diagnosis and first attendance at the reporting institution
Figure 7.8.1a: Time between diagnosis and first attendance at reporting institution

107
(b) Time between first attendance and commencement of cancer directed treatment at reporting
institution
Figure 7.7.1b: Time between first attendance and commencement of cancer directed treatment at
reporting institution
(c) Time between first diagnosis and commencement of cancer directed treatment at reporting
institution
Figure 7. 7.1c: Time between first diagnosis and commencement of cancer directed treatment at
reporting institution

108
7.7.2 Patients of cancers of brain and nervous system diagnosed and treated for cancer at the reporting institution
Time between first diagnosis and commencement of cancer directed treatment at reporting institution
Figure 7.7.2: Time between first diagnosis and commencement of cancer directed treatment at
reporting institution
Key Findings
• Cancers of the brain and nervous system accounted for less than 2% of the
cancers.
• Close to one-tenth of the cases were in the 50-54 years age group in males,
and 40-44 and 45-49 years age group in females.
• Glioblastoma (males-31.4%, females-27.7%) and Astrocytoma (males-24.8%,
females-22.5%) were the commonest histologies seen.
• Over half of the patients who sought diagnosis and treatment at the reporting
institutions were started on cancer directed treatment on the same day.


109
CHAPTER 8
THYROID CANCER
Table 8.0: Site classification according to ICD-10
8.1 Number and relative proportion by sites of thyroid cancer
Table 8.1: Number (n) and relative proportion (%) of thyroid cancer relative to all sites of cancer
Sex All sites Thyroid Cancer
N n %
Males 319098 3340 1.0
Females 290986 7181 2.5
Total 610084 10521 1.7
8.2 Distribution of thyroid cancer according to five-year age groups
Table 8.2: Number (n) and proportion (%) of thyroid cancer according to five-year age groups
Age groups Males Females
n Col % Row % n Col % Row %
< 20 126 3.8 29.0 308 4.3 71.0
20-24 162 4.9 26.7 445 6.2 73.3
25-29 249 7.5 25.3 734 10.2 74.7
30-34 274 8.2 26.0 779 10.8 74.0
35-39 322 9.6 26.6 888 12.4 73.4
40-44 338 10.1 28.9 831 11.6 71.1
45-49 370 11.1 32.0 786 10.9 68.0
50-54 353 10.6 33.8 692 9.6 66.2
55-59 322 9.6 38.4 517 7.2 61.6
60-64 314 9.4 38.7 498 6.9 61.3
65-69 257 7.7 42.3 350 4.9 57.7
70-74 138 4.1 42.7 185 2.6 57.3
75-79 83 2.5 45.6 99 1.4 54.4
80-84 17 0.5 27.9 44 0.6 72.1
85+ 15 0.4 38.5 24 0.4 61.5
All ages* 3340 100.0 31.7 7181 100.0 68.3
Mean (SD) Years
47 (16) 43 (15)
*Includes cases with unknown age
Site of Cancer ICD-10 Code
Thyroid C73

110
8.3 Broad methods of diagnosis
Table 8.3: Number (n) and proportion (%) of thyroid cancer by most valid method of diagnosis
Method of Diagnosis Males Females
n % n %
Microscopic 3316 99.3 7135 99.4
Imaging Techniques 19 0.6 27 0.4
Clinical Only 3 0.1 12 0.2
Total* 3340 100.0 7181 100.0
*Cases with unknown and other methods of diagnosis are included.
8.4 Types of microscopic diagnosis
Table 8.4: Number (n) and proportion (%) of thyroid cancer according to specific type of microscopic diagnosis
Type of microscopic diagnosis Males Females
n % n %
Primary Histology 2817 85.0 6215 87.1
Histology of metastasis 40 1.2 85 1.2
Cytology of Primary 366 11.0 686 9.6
Cytology of Metastasis 93 2.8 149 2.1
All microscopic 3316 100.0 7135 100.0
8.5 Major histological type
Table 8.5: Number (n) and proportion (%) of thyroid cancer according to broad histological classification
Broad histological classification Males Females
n % n %
Papillary Carcinoma 2544 76.7 5830 81.7
Follicular Carcinoma 168 5.1 437 6.1
Medullary Carcinoma 234 7.0 233 3.3
Carcinoma, NOS 131 3.9 231 3.2
Anaplastic Carcinoma 105 3.2 163 2.3
Squamous Cell Carcinoma 80 2.4 113 1.6
Others 54 1.7 128 1.8
Total 3316 100.0 7135 100.0

111
8.6 Clinical extent of disease
Figure 8.6: Clinical extent of disease (%): thyroid cancer (males and females)
8.7 Intention to treat
Figure 8.7: Intention to treat according to clinical extent of disease (%) – thyroid cancer (both sexes)

112
8.8 Treatment modalities according to clinical extent of disease
Figure 8.8: Type of treatment according to clinical extent of disease (%) – thyroid cancer in males and females
8.9 Waiting time between registration and commencement of cancer directed treatment
8.9.1 Patients of thyroid cancer earlier diagnosed at another health facility and referred for cancer directed
treatment to the reporting institution
(a) Time between diagnosis and first attendance at the reporting institution
Figure 8.9.1a: Time between diagnosis and first attendance at reporting institution

113
(b) Time between first attendance and commencement of cancer directed treatment at reporting institution
Figure 8.9.1b: Time between first attendance and commencement of cancer directed treatment at reporting institution
(c) Time between first diagnosis and commencement of cancer directed treatment at reporting
institution
Figure 8.9.1c: Time between first diagnosis and commencement of cancer directed treatment at reporting institution

114
8.9.2 Patients of thyroid cancer diagnosed and treated for cancer at the reporting institution
Time between first diagnosis and commencement of cancer directed treatment at reporting institution
Figure 8.9.2: Time between first diagnosis and commencement of cancer directed treatment at
reporting institution
Key Findings
• The proportion of thyroid cancers relative to all sites was higher in females
(2.5%) than in males (1.0%).
• Over half (51.2%) of the cases among female patients were reported in the 20
to 45 years age group.
• Papillary Thyroid Carcinoma constituted the majority of the thyroid cancer
cases (males-76.7%, females-81.7%).
• Over 40 % of the female patients presented with localised disease.
• Surgery was the most frequently used treatment modality for most patients,
regardless of the clinical extent of disease.
• Around one third of the patients with localised disease, who had been
diagnosed at the reporting institutions, were initiated on cancer directed
treatment on the same day.


115
Annexure 1 - Terminologies
Terms frequently used in the report
Cancer Registration: The process of continuing, systematic collection of data on the occurrence
and characteristics of reportable neoplasms to help assess and control the impact of cancer.
Cancer Case: All neoplasms with a behaviour code of '3' as defined by the International
Classification of Diseases - Oncology (Third edition) are considered reportable and are
registered in NCRP.
Cancer site: The organ/anatomic site of cancer occurrence, classified according to the
International Classification of Diseases (ICD-10)
Cancer Directed Treatment: The treatments offered to cancer patients are either
surgery/systemic therapy/radiotherapy and combinations therein. Hormone therapy and
immunotherapy are also common treatments for some types of cancers.
Cancer Registry: Office at the institution which collects, store, analyse and interpret data on persons with cancer.
Data Processing: Hospital Based Cancer Registry Database Management (HBCRDM) software allows online entry of the data by the hospitals. The quality of the data is monitored. For double registrations, duplicates are prompted. Clarification is sought from each registry, and the data is finalised for further analysis. Auto coding (ICDO-3 and ICD-10) is a feature of this software. A conversion facility from ICD-O3 to ICD-10 is also available.
Clinical extent of disease at presentation: For all anatomical sites, extent of disease prior to initial treatment which is decided by the treating clinician, is recorded.
Histological Classification: All cases received for specific anatomical cancer sites have been
classified according to WHO Classification of Tumours, 5th Edition, Volume. These are
classified as per number and proportions in the report.
Reporting institution: Major cancer hospital where the registry is located and where the patient
avails of cancer directed treatment

116
Annexure 2 - Snapshots of Registries
1. Acharya Harihar Regional Cancer Centre, Cuttack
Year of Establishment: 2014
2. Acharya Tulsi Regional Cancer Treatment and Research Institute, Bikaner
Year of Establishment: 2012
3. All India Institute of Medical Sciences, Bhubaneswar
Year of Establishment: 2013
Principal Investigator & Co-Principal Investigator Staff Details
Principal Investigator 1. Dr. Pramod Chandra Pathy,
Professor & Head, Dept. of Head & Neck Oncology
Co-Principal Investigator 1. Dr. Ashutosh Hota,
Head & Neck Oncology 2. Dr. Ashok Ku. Padhya,
Gyneaoncology 3. Dr. Bharat B
Satapathy Surgical Oncology 4. Dr. Durga P Sahoo
Radiation Oncology 5. Dr. Kusumbali Bisro,
Pathology
1. Mr. Sapan Jena 2. Ms. Sarmista Sahoo 3. Mr. Shakti Prasad Das 4. Ms. Subhashree Priyadarshini Sethi 5. Mr. Ramakanta Das
Principal Investigator & Co-Principal Investigator Staff Details
Principal Investigator 1. Dr. M R Bardia, Director
Co-Principal Investigator 1. Dr. Rajesh Kumar, MO
1. Ms. Bharti Maru 2. Mr. Manish Maru 3. Mr. Parveen Soni
Principal Investigator & Co-Principal Investigator Staff Details
Principal Investigator 1. Dr. Saroj Kumar Das Majumdar,
Additional Professor, Dept. of Radiation Oncology
Co-Principal Investigator
1. Dr. Mukund N Sable, Associate Professor 2. Dr. Dillip Kumar Muduly,
Additional Professor 3. Dr. Ashutosh Panigrahi, Associate Professor 4. Dr. Somanath Padhi, Associate Professor
1. Ms. Diana Padhi 2. Mr. Hemanta Kumar Bhuyan

117
4. All India Institute of Medical Sciences, Rishikesh
Year of Establishment: 2017
5. Amala Institute of Medical Sciences, Amalanagar, Trichur
Year of Establishment: 2011
6. Amrita Institute of Medical Sciences & Research Centre, Kochi (2012-2018)
Year of Establishment: 2011
Principal Investigator & Co-Principal Investigator Staff Details
Principal Investigator 1. Dr. Sanjeev Kishore, Professor & Head,
Dept. of Pathology & lab Medicine Co-Principal Investigator
1. Dr. Prashant Durgapal, Associate Professor, Dept. of Pathology & lab Medicine
2. Dr. Manoj Gupta, Professor & Head, Dept. of Radiation Oncology
1. Dr. Kamini Kiran 2. Mr. Rajendar Chauhan
Principal Investigator & Co-Principal Investigator Staff Details
Principal Investigator 1. Dr. Sunu Lazar Cyriac, Assistant Professor,
Dept. of Medical Oncology & Haematology Co-Principal Investigator
1. Dr. Savithri M C, Professor, Dept. of Pathology
2. Dr. Jomon Raphael, Professor, Dept. of Radiation Oncology
3. Dr. Praveen Ravishankaran, Assistant Professor, Dept. of Surgical Oncology
1. Mr. Feby K L
Principal Investigator & Co-Principal Investigator Staff Details
Principal Investigator 1. Dr. Prem Nair, Medical Director, Professor,
Dept. of Gastroenterology Co-Principal Investigator
1. Dr. K Pavithran, Head, Dept. of Medical Oncology
2. Dr. D K Vijaykumar, Head, Dept. of Breast and Gynaec Oncology
3. Dr. Debnarayan Dutta, Head, Dept. of Radiation Oncology
1. Mr. P Gangadharan (Late) 2. Ms. Thanuja Gopakumar 3. Ms. Suma M S 4. Ms. Mini A P 5. Mr. Ajil Shaji 6. Ms. Navya C S

118
7. Apollo CBCC Cancer Care, Gandhinagar
Year of Establishment: 2016
8. Apollo Hospital, Bhubaneswar
Year of Establishment: 2012
9. Asian Institute of Medical Sciences, Faridabad
Year of Establishment: 2015
10. Assam Medical College, Dibrugarh
Year of Establishment: 1984
Principal Investigator & Co-Principal Investigator Staff Details
Principal Investigator 1. Dr. Naveen Keswani,
CEO & Deputy Medical Director Co-Principal Investigator
1. Dr. Samarendra Dash, Consultant
1. Dr. Anjana Raval 2. Ms. Manzil Kaurani
Principal Investigator & Co-Principal Investigator Staff Details
Principal Investigator 1. Dr. Manas Baisakh, Senior consultant,
Dept. of Histopathology 2. Dr. Sarala Das, Dept. of Pathology
(2012 to September 2018) Co-Principal Investigator
1. Dr. Manas Baisakh (2012 to September 2018)
1. Mr. Suresh Samal (November 2017 to October 2018)
2. Mr. Prasant Kumar Moharana (November 2017 to January 2020)
3. Mr. Premkumar Lazar (from February 2019 to till date)
Principal Investigator & Co-Principal Investigator Staff Details
Principal Investigator 1. Dr. Neetu Singhal, Head,
Dept. of Radiation oncology
1. Mr. Dayachand Kaushik
Principal Investigator & Co-Principal Investigator Staff Details
Principal Investigator 1. Prof.(Dr.) Sanjeeb Kakati
Principal and Project Chief 2. Prof.(Dr.) Pranab Baruah,
Principal and Project Chief (January 2012 to November 2012)
3. Prof.(Dr.) A K Adliikari, Principal and Project Chief (01-02-2012 to 30-01-2016)
4. Prof.(Dr.) R K Kotoky, Principal and Project Chief (06-02-20 l6 to 30-01-2017)
5. Prof.(Dr.) H K Goswami, Principal and Project Chief (11-09-2017 to 24-11-2020)
1. Dr. R. Akhthar 2. Mr. S R Nath 3. Ms. J Sonowal 4. Ms. Rabia Ara Rahman

119
11. Aster Medicity, Kochi
Year of Establishment: 2014
12. Baby Memorial Hospital Ltd., Kozhikode
Year of Establishment: 2012
13. Bhagwan Mahaveer Cancer Hospital and Research Centre, Jaipur
Year of Establishment: 2013
14. Cachar Cancer Hospital and Research Centre, Silchar
Year of Establishment: 2011
15. Cancer Hospital & Research Institute, Gwalior
Year of Establishment: 2014
Principal Investigator & Co-Principal Investigator Staff Details
Principal Investigator 1. Dr Arun R Warrier, Sr. Consultant,
Dept. of Medical Oncology
1. Ms. Meera George
Principal Investigator & Co-Principal Investigator Staff Details
Principal Investigator 1. Prof.(Dr.) P R Sasindran, Sr. Consultant ,
Dept. of Radiation Oncology Co-Principal Investigator
1. Dr.Vishnu Rajan Nambiar, Consultant, Radiation Oncologist
2. Dr. K S Dhanya, Consultant, Radiation Oncologist
1. Ms. Sruthy A K 2. Ms. Nithya C V
Principal Investigator & Co-Principal Investigator Staff Details Principal Investigator
1. Dr. Anjali Sharma, Lab Director & Head, Dept. of Pathology
Co-Principal Investigator
1. Dr. Naresh Jakhotia, Sr. Consultant, Dept. of Radiation Oncology
1. Mr. Ashish Kumar Gurjar 2. Mr. Mohit Ajmera
Principal Investigator & Co-Principal Investigator Staff Details
Principal Investigator 1. Dr. R Ravi Kannan, Director
Co-Principal Investigator
1. Dr. Ritesh Tapkire, Asst. Director
1. Ms. Gayatree Roy 2. Ms. Premjit Kurmi
Principal Investigator & Co-Principal Investigator Staff Details
Principal Investigator 1. Dr. B R Shrivastav, Director
Co-Principal Investigator
1. Dr. G S Rajpoot, Medical Superintendent
1. Mrs. Kalpana Sharma 2. Mrs. Neelam Pathak

120
16. Cancer Institute (WIA), Chennai
Year of Establishment: 1984
17. Cancer Research Institute - Himalayan Institute Hospital Trust, Dehradun
Year of Establishment: 2013
18. Caritas Cancer Institute - Caritas Hospital, Kottayam
Year of Establishment: 2014
Principal Investigator & Co-Principal Investigator Staff Details
Principal Investigator 1. Dr. Swaminathan R, Associate Director &
Head, Dept. of Epidemiology, Biostatistics and Cancer registry
Co-Principal Investigator
1. Dr. Rama R, Assistant Professor & Senior Bio-Statistician
2. Ms. Shanthi P, Section In-Charge (Training & Data Quality)
3. Ms. Kalyani M S, Data Manager (HBCR & Projects)
4. Ms. Joan of Arc A, Senior Medical Record Technician
1. Ms. Vidhya J 2. Mr. Sivakumar P 3. Mr. Thiagarajan K 4. Ms. Bhuvaneshwari S 5. Ms. Sahaya Delma C 6. Ms. Anu R 7. Ms. Devi N 8. Ms. Divya S 9. Ms. Swetha R 10. Ms. Malar U 11. Ms. Deepa E 12. Ms. Bagyalakshmi P 13. Ms. Deepa Ramani
Principal Investigator & Co-Principal Investigator Staff Details
Principal Investigator 1. Dr. Sunil Saini, Professor & Director,
Department of Surgical Oncology Co-Principal Investigator
1. Dr. Mushtaq Ahmad, Principal HIMS, Prof. Radiation Oncology
2. Dr. Sanjeev Kumar Verma, Professor, Medical Oncology
3. Dr. Neena Chauhan, Professor, Pathology
1. Mr. Kanak Prabha Rauthan 2. Mr. Pradeep Rawat 3. Mr. Dronacharaya 4. Ms. Usha Rani 5. Mr. Rajat Sharma
Principal Investigator & Co-Principal Investigator
Principal Investigator 1. Dr. Jose Tom, Senior consultant, Dept. of Radiation Oncology
Co-Principal Investigator
1. Dr. Bindu T G, Pathology 2. Dr. Boben Thomas, Medical Oncology
Dr. Jenny Joseph, Radiation Oncology

121
19. Chittaranjan National Cancer Institute, Kolkata (2016-2018)
Year of Establishment: 2015
20. Cytecare Hospitals PVT LTD, Bangalore
Year of Establishment: 2018
21. Dr. B.R. Ambedkar Institute Rotary Cancer Hospital, New Delhi
Year of Establishment: 2012
Principal Investigator & Co-Principal Investigator Staff Details
Principal Investigator 1. Dr. Syamsundar Mandal, HOD,
Dept. of Epidemiology and Biostatistics Co-Principal Investigator
1. Dr. Partha Nath 2. Mr. Ganesh Gorai
1. Dr. Sushmita Roy 2. Ms. Soumi Sinha 3. Ms. Rinki Chitrakar 4. Ms. Kaberi Biswas 5. Ms. Sudeshna Ghosh 6. Ms. Julekha Mondal 7. Ms. Susmita Patra 8. Ms. Priya Kumari Singh 9. Mr. Dipanjan Mazumdar
Principal Investigator & Co-Principal Investigator Staff Details
Principal Investigator 1. Dr. Prasad Narayanan,
Senior Consultant, Dept. of Medical Oncology
Co-Principal Investigator 1. Dr. Harish P,
Medical Oncology
1. Mr. Lokesh 2. Chaitanya
Principal Investigator & Co-Principal Investigator Staff Details
Principal Investigator 1. Dr. S V S Deo, Prof & Head,
Dept. of Surgical Oncology & Head, Delhi Cancer Registry
Co-Principal Investigator
1. Mr. N Manoharan, Scientist – IV, Delhi Cancer Registry
2. Dr. G K Rath, Professor and Chief, Dept. of Radiation Oncology
3. Dr. Sunil Kumar, Additional Professor, Dept. of Surgical Oncology
4. Dr. Ajay Gogia, Associate Professor, Dept. of Medical Oncology
1. Mr. Ankit 2. Mr. Raman 3. Ms. Anshika 4. Ms. Isha Goswami 5. Ms. Ranjana 6. Mr. Pradeep Kumar 7. Ms. Kanika Behl 8. Ms. Shikha Sharma

122
22. Dr. B. Borooah Cancer Institute, Guwahati
Year of Establishment: 2010
23. Erode Cancer Centre, Thindal, Erode
Year of Establishment: 2013
24. ESIC Medical College Hospital and Super Speciality Hospital, Hyderabad
Year of Establishment: 2012
Principal Investigator & Co-Principal Investigator Staff Details
Principal Investigator 1. Dr. Manigreeva Krishnatreya, Scientific
Officer ‘D’, Dept. of Cancer Registry & Epidemiology
2. Dr. Jagannath Dev Sharma, Prof Dept. of Pathology (October 2010 to November 2020)
Co-Principal Investigator
1. Dr. Ashok Kumar Das, Professor, Dept. of Head & Neck Oncology (October 2010 to November 2020)
2. Dr. B J Saikia, Professor, Dept. of Medical Oncology (October 2010 to November 2020)
3. Dr. M Bhattacharyya, Professor. Dept. of Radiation Oncology (October 2010 to November 2020)
4. Dr. A Talukdar, Associate Professor, Dept. of Surgical Oncology (01/01/2015 to 15/11/2020)
5. Dr. P P Medhi, Assistant Professor, Dept. of Radiation Oncology
6. Dr. Asif Iqbal, Assistant Professor, Dept. of Medical Oncology
7. Dr. Kiran Kamalasanan, Assistant Professor, Dept. of Surgical Oncology
8. Dr. Upasana Baruah, Assistant Professor, Dept. of Surgical Oncology
1. Dr. Nizara Baishya 2. Dr. Chandi Ram Kalita 3. Mr. Md. Nazmul Haque 4. Mrs. Binita Das 5. Ms. Tapti Kumari 6. Mrs. Himadri Hazarika 7. Mr. Chandan Barman
Principal Investigator & Co-Principal Investigator Staff Details Principal Investigator
1. Dr. K Velavan, Dept. of Radiation Oncology Co-Principal Investigator
1. Dr. R Suresh Kumar
1. Ms. M Gayathri 2. Mr. G Saravanan
Principal Investigator & Co-Principal Investigator
Principal Investigator 1. Dr. Ratna Gosain, Sr. Consultant, Dept. of Pathology
Co-Principal Investigator
1. Dr. Suhasini Gazula, Pediatric Surgeon

123
25. Father Muller Medical College Hospital, Mangaluru
Year of Establishment: 2013
26. Fortis Memorial Research Institute, Gurugram
Year of Establishment: 2015
27. G Kuppuswamy Naidu Memorial Hospital, Coimbatore
Year of Establishment: 2018
Principal Investigator & Co-Principal Investigator Staff Details
Principal Investigator 1. Dr. Dinesh Shet, Associate Professor,
Dept. of Medical Oncology Co-Principal Investigator
1. Dr. Scharaschandra, Associate Professor, Dept. of Medical Oncology
2. Dr. Nisha Marla, Associate Professor, Dept. of Pathology
1. Mrs. Poornima 2. Mrs. Arpitha
Principal Investigator & Co-Principal Investigator Staff Details
Principal Investigator 1. Dr Vinod Raina, Chairman Oncosciences,
Executive Director & Head of Medical Oncology & Haematology & Head- Cancer Registry
2. Dr B K Mohanti, Executive Director & Head, Dept of of Radiation Oncology
Co-Principal Investigator
1. Dr B B Tyagi, Sr. Manager- Cancer Registry
1. Mr. Sujeet Kumar Singh 2. Ms. Manisha
Principal Investigator & Co-Principal Investigator Staff Details
Principal Investigators 1. Dr. Latha Balasubramani, Consultant,
Gynaecological Oncologist, Dept of Oncology Co-Principal Investigator
1. Dr. M Nagarajan, Director for Research & Development - VNCC & HOD - Radiation Oncology
2. Dr. Piyush Joshi, Junior Consultant
1. Ms. M Kalaiselvi

124
28. Gandhi Medical College, Bhopal
Year of Establishment: 2012
29. General Hospital, Ernakulam
Year of Establishment: 2011
30. Government Medical College and Hospital, Chandigarh
Year of Establishment: 2017
Principal Investigator & Co-Principal Investigator Staff Details
Principal Investigator 1. Mr. Atul Shrivastava, Research Officer,
Dept of Pathology Co-Principal Investigator
1. Dr. Reeni Malik, Professor & Head, Dept. of Pathology
2. Mrs. Sushma Shrivastava, Field Officer, Dept. of Pathology
3. Dr. O P Singh, Professor & Head, Dept. of Radiotherapy
1. Dr. AseeraJabeen 2. Mr. Anas Ahmed
Principal Investigator & Co-Principal Investigator Staff Details
Principal Investigator 1. Dr. Balamurali Krishna
Consultant, Dept. of Radiation Oncology Co-Principal Investigator
1. Dr. Nibin Bose, Radiation Oncology 2. Dr. Jiss Joy, Radiation Oncology 3. Dr. Abilash, Radiation Oncology
1. Ms. Veena K J 2. Mr. Krishna P S
Principal Investigator & Co-Principal Investigator Staff Details
Principal Investigator 1. Dr. Awadhesh Kumar Pandey, Prof & Head,
Dept. of Radiation Oncology Co-Principal Investigator
1. Dr. Arjun Das, Former Prof & Head, Dept. of ENT (Retired)
2. Dr. Deepak Aggarwal, Professor, Dept. of Pulmonary Medicine
3. Dr. Bharti Goel, Professor, Dept. of Obstetrics & Gynaecology
4. Dr. Sonia Puri, Associate Professor, Dept. of Community Medicine
1. Mr. Suraj 2. Mrs. Kamini

125
31. Government Medical College, Jammu
Year of Establishment: 2014
32. Government Medical College, Thrissur
Year of Establishment: 2015
Principal Investigator & Co-Principal Investigator Staff Details
Principal Investigator 1. Dr. Ashutosh Gupta, Professor & Head,
Dept. of Radiation Oncology 2. Dr. Dinesh Kumar, Professor,
Dept. of Community Medicine Co-Principal Investigator
1. Dr. Pramod Kalsotra, Professor & Head, Dept. of ENT
2. Dr. Subhash Bhardwaj, Professor & Head, Dept. of Pathology
3. Dr. Sanjay Bhasin, Professor & Head, Dept. of Surgery
4. Dr. Rahul Sharma, Associate Professor, Dept. of Radiation Oncology
5. Dr. Kiran Bala, Associate Professor, Post Graduate Dept. of Community Medicine
6. Dr. Rajat Gupta, Lecturer, Dept. of Pathology
1. Ms. Pooja Devi 2. Mr. Shiv Dutt Sharma 3. Ms. Mamta Devi 4. Mr. Raman Kumar 5. Ms. Kavita Sharma 6. Ms. Shivani Bhagat 7. Mr. Purshotam Kumar
Principal Investigator & Co-Principal Investigator Staff Details
Principal Investigator 1. Dr. Suresh Kumar K, Professor & Head,
Dept. of Radiation Oncology (July 2021) 2. Dr. Shehna A Khader, Associate Professor,
Dept. of Radiotherapy (May 2020 to July 2021)
3. Dr. K L Jayakumar, Professor & HOD, Dept. of Radiotherapy (July 2018 to May 2020)
4. Dr. R Mahadevan, Professor & HOD, Dept. of Radiotherapy (March 2017 to July 2018)
Co-Principal Investigator 1. Dr. Shehna A Khader, Associate Professor
(CAP), Dept. of Radiation Oncology (March 2017 to May 2020 and August 2021 onwards)
2. Dr. Ajithkumar, Associate Professor (CAP) (March 2017 onwards)
3. Dr. Jayaraman M B, Associate Professor (CAP) (March 2017)
1. Ms. Shijeena Mathew 2. Mr. Lijo Lazar V 3. Ms. Praseeja K

126
33. Government Royapettah Hospital, Chennai
Year of Establishment: 2017
34. Government Stanley Medical College, Chennai
Year of Establishment: 2017
35. Govt Arignar Anna Memorial Cancer Hospital & Research Institute, RCC, Kanchipuram
Year of Establishment: 2012
36. Nayathi Health Care, Mathura
Year of Establishment: 2018
Principal Investigator & Co-Principal Investigator Staff Details
Principal Investigator 1. Dr. J Kannan, Professor & HOD,
Dept. of Medical oncology 2. Dr. S G D Gangadaran, Prof & Head
Dept. of Medical Oncology (till March 2021) Co-Principal Investigator
1. Dr. B Ramkumar, Associate Professor of Medical Oncology
2. Dr. S Subbaiah, Associate Professor of Medical Oncology
3. Dr. S Saravanan, Professor& Head Dept. of Radiation Oncology
1. Ms. V Padmapriya 2. Ms. G Revathy
Principal Investigator & Co-Principal Investigator Staff Details
Principal Investigator 1. Dr. Naveen Ravel, Head,
Dept. of Medical Oncology Co-Principal Investigator
1. Dr. P N Sathiyamoorthy, Associate Professor, Medical Oncology
1. Ms. Nitya A 2. Mr. Anand
Principal Investigator & Co-Principal Investigator Staff Details
Principal Investigator 1. Dr. Sakthi Usha Devi,
Dept. of Surgical Oncology Co-Principal Investigator
1. Dr. Srinivasan, Dept. of Radiation Oncology 2. Dr. Salini, Dept. of Radiation Oncology 3. Dr. Mudassar Sharief,
Dept. of Oral Pathology
1. Dr. Ṛ Nirmal Prasath 2. Mr. C Shanthakumar 3. Ms. C Jemima 4. Mr. M Carolin 5. Ms. G Jayashri 6. Mr. K S Surya 7. Mr. L Dinesh Kumar 8. Ms. S Aishwarya 9. Mr. R Avinash
Principal Investigator & Co-Principal Investigator
Principal Investigator 1. Dr. Santanu Chaudhuri, Chairman and Senior Consultant, Dept. of Radiation Oncology
Co-Principal Investigator
1. Dr. Neeraj Kumar, Attending Consultant Dept. of Clinical Oncology

127
37. Indira Gandhi Institute of Medical Sciences, Patna
Year of Establishment: 2013
38. Indo-American Cancer Institute & Research Centre, Hyderabad
Year of Establishment: 2011
39. Institute of Liver and Biliary Sciences, New Delhi
Year of Establishment: 2016
40. Institute of Obstetrics and Gynaecology, Chennai
Year of Establishment: 2017
Principal Investigator & Co-Principal Investigator Staff Details
Principal Investigator 1. Dr. Dinesh Kumar Sinha,
Additional Professor, Department of Radiation Oncology
2. Dr. Prof. Rajesh Kumar Singh, HOD Radiation Oncology (till March 2021)
Co-Principal Investigator
1. Dr. Prof. Sangeeta Pankaj, HOD Gynecological Oncology
1. Dr. Laloo Kumar 2. Mr. Aman Prakash 3. Mr. Yaswant Kumar Singh 4. Mr. Shahab Hussain
Principal Investigator & Co-Principal Investigator Staff Details
Principal Investigator 1. Dr. K Kalpana Raghunath,
Associate Director, Dept. of Academics Co-Principal Investigator
1. Dr. Anjanasurath 2. Dr. A Santha 3. Dr. G Dileep Kumar
1. Mrs. K. Nirmala 2. Mr. Y. Krishnaiah
Principal Investigator & Co-Principal Investigator Staff Details
Principal Investigator 1. Dr. Puja Sahai, Associate Professor,
Dept. of Radiation Oncology Co-Principal Investigator
1. Dr. Hanuman Prasad Yadav, Prof and Head, Radiation Oncology
2. Dr. Archana Rastogi, Professor, Pathology 3. Dr. Vinod Arora, Assistant Professor,
Hepatology
1. Ms. Aastha Dawar (2017 to April 2019) 2. Ms. Jyoti (2017 to June 2019) 3. Ms. Prerna Arora 4. Ms. Gulfasha
Principal Investigator & Co-Principal Investigator Staff Details
Principal Investigator 1. Dr. S Vijaya, Director & Professor,
Dept. of Obstetrics & Gynaecology Co-Principal Investigator
1. Dr. Rajkumar, Civil Surgeon 2. Dr. Kavitha Sukumar, Associate Professor
1. Ms. Joe Shalini S 2. Ms. S Saraswathi

128
41. International Cancer Centre, Neyyoor
Year of Establishment: 2012
42. J K Cancer Institute, Kanpur
Year of Establishment: 2017
43. J.N. Medical College & Hospital, Aligarh
Year of Establishment: 2017
44. Jhalawar Medical College and SRG hospital, Jhalawar
Year of Establishment: 2020
Principal Investigator & Co-Principal Investigator Staff Details
Principal Investigator 1. Dr. V G Sudhakaran, Prof. HoD,
Dept. of Oncology Co-Principal Investigator
1. Dr. Prarthana Roselil, Oncology 2. Dr. Jashree T S, Pathology
1. Mr. Robert Nickelson T 2. Mr. Jaya Raj C
Principal Investigator & Co-Principal Investigator Staff Details
Principal Investigator 1. Dr. S N Prasad, Director
Co-Principal Investigator
1. Dr. Mohd W Raza, Assistant Professor
1. Mr. Ajay Diwakar 2. Mr. Tanay Pathak
Principal Investigator & Co-Principal Investigator Staff Details
Principal Investigator 1. Prof. Shahid Ali Siddiqui, Principal, Professor,
Dept. of Radiotherapy and Clinical Oncology Co-Principal Investigator
1. Prof. Sayeedul Hasan Arif, Chairman and Professor, Dept. of Pathology
2. Prof. Kafil Akhtar, Professor, Dept. of Pathology
1. Dr. Syed Amaan Ali 2. Ms. Sameer Sherwani 3. Ms. Bilal Baig 4. Mr. Rahil Khan 5. Mr. Mohd Adil 6. Mr. Syed Mohd Osama 7. Mr. TariqueWali 8. Mr. Irfan Ali
Principal Investigator & Co-Principal Investigator Staff Details
Principal Investigator 1. Dr. Rishi Diwan, Sr. Professor,
Dept. of Pathology Co-Principal Investigator
1. Dr. Arun Kumar Patel, Sr. Professor, ENT
1. Dr. Monika Shekhawat

129
45. JIPMER, Regional Cancer Centre, Puducherry
Year of Establishment: 2013
Principal Investigator & Co-Principal Investigator Staff Details
Principal Investigator 1. Dr. Gunaseelan K, Additional Professor &
Head, Dept. of Radiation Oncology (2012 to March 2019)
Co-Principal Investigator
1. Dr. Kadambari D, Professor & Head, Dept. of Surgery (2012 to March 2019)
2. Dr. Sunil Kumar Saxena, Professor & Head, Dept. of Ent (2012 to March 2019)
3. Dr. Latha Chaturvedula, Professor & Head, Dept. of Obstetrics & Gynaecology (2012 to March 2019)
4. Dr. Sunu Lazar Cyriac, Assistant Professor, Dept. of Medical Oncology (2012 to March 2019)
5. Dr. Biswajit Dubashi, Additional Professor, Dept. of Medical Oncology
6. Dr. Debasis Gochhait, Additional Professor, Dept. of Pathology (2012 to March 2019)
7. Dr. Pampa Ch. Toi, Additional Professor, Dept. of Pathology (2012 to March 2019)
8. Dr. Srinivas B H, Additional Professor, Dept. of Pathology (2012 to March 2019)
9. Dr. G S Sreenath, Additional Professor, Dept. of General Surgery (2012 to March 2019)
10. Dr. Prasanth Penumadu, Associate Professor, Dept. of Surgical Oncology (2012 to March 2019)
11. Mr. Harichandrakumar K.T, Assistant Professor, Dept. of Biostatistics (2012 to March 2019)
12. Dr.Vivekanandam, Professor & Head (Retd.), Dept. of Radiation Oncology (2012 to March 2019)
13. Dr. Pooja Sethi, Assistant Professor, Dept. of Radiation Oncology
1. Dr. Aswiny P 2. Ms. Benisha RM 3. Mrs. Anchala Mary A 4. Mr. Boominathan R 5. Mr. Saranraj G 6. Ms. Anupama A.P 7. Mrs. Akila T 8. Mr. Nagaraj K 9. Mr. Vigneshwaran K

130
46. Kasturba Medical College Hospital, Mangaluru
Year of Establishment: 2014
47. Kidwai Memorial Institute of Oncology, Bengaluru
Year of Establishment: 1984
48. King George Medical University, Lucknow
Year of Establishment: 2017
Principal Investigator & Co-Principal Investigator Staff Details
Principal Investigator 1. Dr. B Unnikrishnan, Additional Dean &
Professor, Dept. of Community Medicine Co-Principal Investigator
1. Dr. P U Prakash Saxena, Professor & Head Dept. of Radiation Oncology
2. Dr. B Reshmi, Associate Professor & Head Dept. of Health Information Management, MCHP
3. Dr. Priya Rathi, Associate Professor of Community Medicine
1. Ms. Mamatha 2. Ms. Shrikirthi K
Principal Investigator & Co-Principal Investigator Staff Details
Principal Investigator 1. Dr. C Ramachandra, Director,
Professor & Unit IHead, Dept. of Surgical Oncology
Co-Principal Investigator
1. Dr. C Ramesh, Professor and Head, Dept. of Epidemiology and Biostatistics
2. Mr. C R Vijay, Assistant Professor, Dept. of Epidemiology and Biostatistics
1. Mr. D J Jayaram 2. Mr. T Venkatesh 3. Mr. M K M Gowda 4. Mrs. B J Kumudhini 5. Mr. P Manjunath 6. Mr. C S Dayananda 7. Mr. K Venkatesh 8. Mr. A Subramani 9. Mr. C Kumar
Principal Investigator & Co-Principal Investigator Staff Details
Principal Investigator 1. Dr. Kirti Srivastava, Professor,
Dept. of Radiotherapy 2. Dr. Arun Chaturvedi, Prof & Head,
Dept. of Surgical Oncology (till July 2021) Co-Principal Investigator
1. Dr. Sumaira Qayoom, Associate Professor Dept. of Pathology
2. Dr. Shiv Rajan, Assistant Professor Dept. of Surgical Oncology
3. Dr. Mrinalini, Assistant Professor, Dept. of Radiotherapy
4. Dr. Puneet Prakash, Assistant Professor, Dept. of Surgical Oncology
1. Dr. Parimal Dubey 2. Ms. Jyotima Shrivastava

131
49. Kokilaben Dhirubhai Ambani Hospital & Medical Research Institute, Mumbai
Year of Establishment: 2017
50. Kolhapur Cancer Centre, Kolhapur
Year of Establishment: 2014
51. Kovai Medical Centre and Hospital, Coimbatore
Year of Establishment: 2013
52. Lakeshore Hospital and Research Centre Ltd., Kochi
Year of Establishment: 2011
Principal Investigator & Co-Principal Investigator Staff Details
Principal Investigator 1. Dr. Rajesh Mistry, Director,
Dept. of Surgical Oncology Co-Principal Investigator
1. Dr. Imran Shaikh, Consultant, Medical Oncology
1. Dr. Sonali Satam 2. Ms. Priyanka Jansi Rani
Principal Investigator & Co-Principal Investigator
Principal Investigator 1. Dr. Reshma Pawar, Executive Director, Dept. of Surgical Oncology
Co-Principal Investigator
1. Dr. Yogesh Anap
Principal Investigator & Co-Principal Investigator Staff Details
Principal Investigator 1. Dr. Madhu Sairam R, Consultant,
Dept. of Radiation Oncology Co-Principal Investigator
1. Dr Subramaniam R
1. Ms Stephy Sebastian 2. Ms Akshara K R
Principal Investigator & Co-Principal Investigator Staff Details
Principal Investigator 1. Dr. V P Gangadharan, HOD,
Dept. of Medical and Pediatric oncology Co-Principal Investigator
1. Dr. Anupama G, Senior Consultant 2. Dr. Annu Susan George, Consultant
1. Remya D Das

132
53. Madras Cancer Care Foundation, Chennai
Year of Establishment: 2017
54. Madras Medical College, Chennai
Year of Establishment: 2017
55. Mahavir Cancer Sansthan and Research Centre, Patna
Year of Establishment: 2015
Principal Investigator & Co-Principal Investigator Staff Details
Principal Investigator 1. Dr. S G Ramanan, Director,
Dept. of Medical Oncology Co-Principal Investigator
1. Dr. Vikash Mahajan, Surgical Oncologist 2. Dr. Lakshmi Narayana, Surgical Oncologist
Head & Neck Surgeon 3. Dr. M Janarthinakani, Clinical Oncologist
1. Dr. Kanimozhi 2. Mrs. S Mahalakshmi
Principal Investigator & Co-Principal Investigator Staff Details
Principal Investigator 1. Dr. S G D Gangadharan,
Dept. of Medical Oncology 2. Prof. Dr. K V S Latha,
Dept. of Medical Oncology (till March 2021) Co-Principal Investigator
1. Prof.(Dr.) T N Vijaya Sree 2. Dr. S Suresh Kumar 3. Dr. E Senthil Kumar
1. Mrs. S Gayathri 2. Mr. A Periyadurai
Principal Investigator & Co-Principal Investigator Staff Details
Principal Investigator 1. Dr. Rita Rani, Sr. Consultant
Radiation Oncologist, Department of Radiation Oncology
Co-Principal Investigator
1. Dr. Vinita Trivedi, Head & Sr. Consultant Radiation Oncologist
2. Dr. Santosh Shubham, Senior Medical Officer
3. Dr. Vasudha Singh, Senior Medical Officer 4. Dr. Sucheta, Senior Resident 5. Dr Hariharnath Tiwari, Senior Resident
1. Ms. Sweta Kumari 2. Mr. Jitendra Kumar 3. Ms. Anshu Kumara

133
56. Malabar Cancer Centre, Kannur
Year of Establishment: 2011
57. Mandya Institute of Medical Sciences, Mandya
Year of Establishment: 2015
58. Max Super Speciality Hospital, PPG, Delhi
Year of Establishment: 2015
59. Max Super Speciality Hospital, Saket, New Delhi
Year of Establishment: 2013
Principal Investigator & Co-Principal Investigator Staff Details
Principal Investigator 1. Dr. Saina Sunilkumar, Lecturer/HOD, Dept. of
Cancer Registry & Epidemiology Co-Principal Investigator
1. Ms. Bindu T, Lecturer – Biostatistics 2. Mr. Ratheesan K, Lecturer – Biostatistics 3. Dr. Satheesan B, Director , MCC
1. Mr. Nijin P 2. Ms. Subina K
Principal Investigator & Co-Principal Investigator Staff Details
Principal Investigator 1. Dr. Venkatesh N, Associate Professor &
Dept. of Surgical Oncologist, TCCC Co-Principal Investigator
1. Dr. Ranganathan T, Associate Professor & Dept. of Radiation Oncologist
2. Dr. Shivakumar, Professor, Dept. of Pathology
1. Ms. Sadhana H S, Project Assistant & D.E.O
Principal Investigator & Co-Principal Investigator Staff Details
Principal Investigator 1. Dr. Geeta Kadayaprath, Director,
Dept. of Surgical Oncology Co-Principal Investigator
1. Dr. Meenu Walia, Senior Director, Dept. of Medical Oncology
1. Mr. Farhan Siddiqui 2. Ms. Poonam
Principal Investigator & Co-Principal Investigator Staff Details
Principal Investigator 1. Dr. Anil Kumar Anand, Principal Director,
Dept. of Radiation Oncology (till Sept. 2021) Co-Principal Investigator
1. Dr. Ramandeep Singh Arora, Sr. Consultant, Dept. of Paediatric Oncology
2. Dr. Charu Garg, Associate Director, Dept. of Radiation Oncology
3. Dr. Deepak Mittal, Consultant, Dept. of Radiation Oncology
4. Dr. Urmi Mukherjee, Director & Head of Histopathology Institute of Surgical & Anatomical Pathology & Transfusion Services
1. Mr. Naseem Khan 2. Mr. Ankit Kumar 3. Mr. Shailender Rathore 4. Mr. Arun Adhana 5. Mrs. Kamlesh Kumari

134
60. Max Super Speciality Hospital, Shalimar Bagh, New Delhi
Year of Establishment: 2013
61. Max Super Speciality Hospital, Vaishali
Year of Establishment: 2018
62. Medanta Cancer Centre, Gurugram
Year of Establishment: 2013
63. Meherbai Tata Memorial Hospital, East Singhbhum
Year of Establishment: 2017
Principal Investigator & Co-Principal Investigator Staff Details
Principal Investigator 1. Dr. Vineeta Goel, Associate Director,
Dept. of Radiation Oncology 2. Dr. Ranga Rao, Director,
Dept. of Medical Oncology Co-Principal Investigator
1. Dr. Waseem Abbas, Consultant, Medical Oncology
1. Mr. Shailender Rathore
Principal Investigator & Co-Principal Investigator Staff Details
Principal Investigator 1. Dr. Vaishali Zamre, Sr. Consultant,
Dept. of Radiation Oncology 2. Dr. Shubham Garg, Consultant,
Dept. of Surgical Oncology Co-Principal Investigator
1. Dr. Vikas Goswami, Consultant, Dept. of Medical Oncology
1. Mr. Arif 2. Mr. Shailender Rathore
Principal Investigator & Co-Principal Investigator Staff Details
Principal Investigator 1. Dr. Tejinder Kataria, Chairperson,
Dept. of Radiation Oncology Co-Principal Investigator
1. Dr. Ashok Vaid 2. Dr. Deepak Gupta
1. Mr. Joseph John
Principal Investigator & Co-Principal Investigator Staff Details
Principal Investigator 1. Dr. Moujhuri Nandi, Head,
Dept. of Radiation Oncology Co-Principal Investigator
1. Dr.Vanita Pandey, Head, Dept. of Pathology
1. Mr. Inamur Rahman 2. Ms Mahima Hembram

135
64. MES Medical College & Hospital, Perinthalmanna
Year of Establishment: 2013
65. Mizoram State Cancer Institute (Civil Hospital), Aizawl
Year of Establishment: 2012
66. MNJ Institute of Oncology and Regional Cancer Centre, Hyderabad
Year of Establishment: 2012
67. Monsignor Joseph Kandathil Memorial Cancer Research Centre, Alappuzha
Year of Establishment: 2019
Principal Investigator & Co-Principal Investigator Staff Details
Principal Investigator 2. Dr. Muhammed Sajid,
Medical superintendent Co-Principal Investigator
1. Dr. Shoufeej P M, Medical oncologist
1. Ms. Rajani.K
Principal Investigator & Co-Principal Investigator Staff Details
Principal Investigator 1. Dr. B Zothankima, HOD,
Dept. of Radiation Oncology Co-Principal Investigator
1. Dr. Jeremy L Pautu, HOD, Medical Oncology (from August 2014 to till date)
2. Dr. K Lalfakzuala, Radiation Oncologist 3. Dr. Lalhlupuii, Radiation Oncologist 4. Dr. Cindy Lalthanpuii, Radiation Oncologist 5. Dr. Doris Lallawmzuali, Pathologist
1. Dr. C Hmingthansanga (August 2014 to August 2015)
2. Dr. Lalremruati Renthlei (April 2018 to May 2019)
3. Dr. Vanlalremsangpuii (June 2019 to February 2020)
4. Dr. Vanlalchhuanga 5. Mr. Robert Rokhamliana 6. Ms. Rebecca V L Renthlei 7. Lalmalsawmi Hnamte
(August 2014 to August 2015) 8. Gospel Laldinpuii
(April 2018 to August 2020) 9. Lalruatpuii 10. K Lalhruaitluanga 11. Lalthianghlima (August 2014 to August 2015) 12. Lalhriatchhungi (August 2014 to May 2015) 13. LalrindikaHmar (April 2018 to Sept 2020) 14. Lalhmingsangi 15. Lalrinthanga Chhakchhuak
Principal Investigator & Co-Principal Investigator Staff Details
Principal Investigator 1. Dr. S Sai Mallikarjun, Principal Investigator,
Dept. of Pathology
1. Mr. C Shivaiah 2. Mr. S Srinivas Goud 3. Mr. M Sinde Raju 4. Ms. Nirmala Devi
Principal Investigator & Co-Principal Investigator Staff Details
Principal Investigator 1. Dr. Surij Salih, Senior consultant, Dept. of
Surgical Oncology Co-Principal Investigator
1. Dr. K Somarajan 2. Dr. C S Madhu
1. Ms. Parvathy Sreekumar

136
68. MVR Cancer Center and Research Institute, Kozhikode
Year of Establishment: 2018
69. Naga Hospital Authority, Kohima
Year of Establishment: 2019
70. Narayana Hrudayalaya Health City, Bengaluru
Year of Establishment: 2011
71. Nayathi Health Care, Mathura
Year of Establishment: 2018
Principal Investigator & Co-Principal Investigator Staff Details
Principal Investigator 1. Dr. Nirmal C, Consultant,
Dept. of Community Oncology Co-Principal Investigator
1. Dr. Narayanan Kutty Warrier, Medical Director
1. Mr. Shan P M 2. Ms. Anju Mathew 3. Mr. Shaji M G
Principal Investigator & Co-Principal Investigator Staff Details
Principal Investigator 1. Dr. Vinotsole Khamo, Dept of Pathology &
Healthcare Laboratory & Research Centre Co-Principal Investigator
1. Dr. C. Wathsutho Nyuthe 2. Dr. Zuchamo Patton
1. Dr. Vetsolu Hiese 2. Kevezo 3. Mr. Neithovilie Keyho 4. Mezikholu Zango 5. Sierhevi Nyuwi
Principal Investigator & Co-Principal Investigator Staff Details
Principal Investigator 1. Dr. Pragnya Coca, Senior Consultant,
Dept. of Medical Oncology 2. Dr. Alben Sigamani, Group Head,
Dept. of Clinical Research (till May 2021) Co-Principal Investigator
1. Dr. Moni Kuriakose, Head, Head & Neck Surgery
2. Dr. Rohit Ragunathranade, Head, Oncology Gynaec
3. Dr.Vikneswaran G, Associate Consultant
1. Ms. Genel Dsouza 2. Ms. Veena 3. Ms. Roopa B 4. Ms. Lavanya R 5. Ms. Mamatha H 6. Ms. Bharathi
Principal Investigator & Co-Principal Investigator
Principal Investigator 1. Dr. Santanu Chaudhuri, Chairman and Senior Consultant, Dept. of Radiation Oncology
Co-Principal Investigator
1. Dr. Neeraj Kumar, Attending Consultant Dept. of Clinical Oncology

137
72. Nizams Institute of Medical Sciences, Hyderabad
Year of Establishment: 2013
73. North East Cancer Hospital& Research Institute, Guwahati
Year of Establishment: 2015
74. Peerless Hospitex Hospital and Research Center Limited, Kolkata
Year of Establishment: 2014
Principal Investigator & Co-Principal Investigator Staff Details
Principal Investigator 1. Dr. Sadashivudu Gundeti,
Additional Professor and Head, Dept. of Medical Oncology
Co-Principal Investigator
1. Dr. Bala Stalin Chowdary, Assistant Professor 2. Dr. Srihari Uppalapati, Research Officer
Dept. of Medical Oncology
1. Mr. Doli Mahesh 2. Mr. Srikanth Vemula
Principal Investigator & Co-Principal Investigator Staff Details
Principal Investigator 1. Dr. Gazi Naseem Ahmed, Histopathologist &
Cytologist Co- Principal Investigator
1. Dr. Dherin Nath, Head and Neck Oncologist 2. Dr. Imliwati Longkumer, Biochemist
1. Mr. Bedanta Deka 2. Ms. Parbati Sharma
Principal Investigator & Co-Principal Investigator Staff Details
Principal Investigator 1. Dr. Madhuchanda Kar, Senior consultant &
Clinical director, Dept. of Oncology
Co-Principal Investigator 1. Dr. Digbijoy Choudhury,
Senior Registrar Medicine (2017 to march 2019)
2. Dr. Sanjoy Sen, Onco-Surgeon
1. Dr. Avishek Halder (June2017 to May 2019) 2. Mr. Kingshuk Goswami (2019 June 2020) 3. Mr. Puja Bhattacharya 4. Mr. Baishakhi Chatterjee

138
75. PGIMER, Chandigarh
Year of Establishment: 2011
76. Pravara Rural Hospital& Rural Medical College, Loni
Year of Establishment: 2014
77. Pushpagiri Institute of Medical Sciences & Research Centre, Tiruvalla
Year of Establishment: 2015
Principal Investigator & Co-Principal Investigator Staff Details
Principal Investigator 1. Dr. Sushmita Ghoshal, Professor & Head,
Dept. of Radiotherapy 2. Dr. S.C. Sharma, Professor & Former Head,
Dept of Radiotherapy (2011 to 2014) Co-Principal Investigator
1. Dr. Sushmita Ghoshal, Professor (2011 to 2014)
2. Dr Rakesh Kapoor, Professor (2011 to 2020) 3. Dr. Narender Kumar, Professor
(2011 to 2018)
1. Ms. Neeru Moudgil 2. Mr. Vikas Kapoor 3. Ms. Anita Rani 4. Mr. Anup Verma 5. Ms. Pooja Rawat 6. Mr. Amit Kumar 7. Ms. Tanvi Jindia 8. Mr. Sanjay
(September 2016 to September 2018) 9. Mr. Anil Kumar (March 2011 to May 2016) 10. Ms. Jyoti Thakur
(November 2012 to May 2017) 11. Mr. Milan Kumar (May 2013 to March 2016) 12. Mr. Jagmeet Bajwa
(May 2011 to November 2012) 13. Dr. Nagarjun Ballari
(February 2017 to June 2017) 14. Dr. D. Niharika (April 2015 to May 2016) 15. Dr. Deepak Kumar
(September 2016 to December 2016)
Principal Investigator & Co-Principal Investigator Staff Details
Principal Investigator 1. Dr. Vandana Jain, Professor,
Dept. of Radiation Oncology 2. Late Dr. K. K. Singh, Professor &
Former Head, Dept. of Oncology (2008 to 2015)
Co-Principal Investigator
1. Dr. Chaitali Waghmare 2. Dr. Nayana Jagtap (2016 to 2017) 3. Dr. Tejal Kadaskar (2017 to 2018)
1. Mr. Jadhav Sachin (2008 to 2016) 2. Mr. Kakade Sunil (2017 to 2018) 3. Mr. Pawar Vijay (2018 to 2019) 4. Mr. Bhaskar Datir 5. Mr. Maghade Rohit 6. Mrs. Sangita Pandit 7. Dr. Padmini Nirmal
Principal Investigator & Co-Principal Investigator
Principal Investigator 1. Dr V U Thankamma, Professor & Head, Dept. of Radiation Oncology
Co-Principal Investigator
1. Dr Jessy M M, Professor & Head

139
78. Rajiv Gandhi Cancer Institute and Research Centre, New Delhi
Year of Establishment: 2012
79. Regional Cancer Centre Indira Gandhi Medical College, Shimla
Year of Establishment: 2014
80. Regional Cancer Centre Kamala Nehru Memorial Hospital, Prayagraj
Year of Establishment: 2014
Principal Investigator & Co-Principal Investigator Staff Details
Principal Investigator 1. Dr Col. (Retired) Anurag Mehta, Director -
Dept. of Lab. & Transfusion Services and Director Research
2. Dr Sudhir Rawal, Medical Director and Chief of GenitoUro - Oncology Services, Dept of Urogenital Oncology (2016 to 2018)
3. Dr A.K. Dewan, Director, Dept. of Head and Neck Surgical Oncology (2012 to 2016)
Co-Principal Investigator
1. Dr. Swarupa Mitra, Sr. Consultant, Dept. of Radiation Oncology
2. Ms. Swarnima Jaitley, Head of Philanthropic Services
1. Ms. Priyanka Gupta 2. Ms. Deepika Paliwal 3. Ms. Khusboo 4. Ms. Garima Dhirayan 5. Ms. Shweta 6. Ms. Suman 7. Mr. Deepak Negi 8. Mr. Karan Kumar 9. Mr. Janit Giri
Principal Investigator & Co-Principal Investigator Staff Details
Principal Investigator 1. Dr. Manish Gupta, Prof. & Head,
Dept. of Radiotherapy 2. Dr. Rajeev Seam, Prof. & Head,
Dept. of Radiotherapy (2012 to June 2018) Co-Principal Investigator
1. Dr. Sudarshan Sharma, Prof. & Head Dept. of Pathology
1. Dr. Siddharth Vats 2. Ms. Neha Sharma 3. Ms. Anamika 4. Ms. Kumari Lucky 5. Mr. Pawan Kumar 6. Mr. Nishanth Sharma 7. Ms. Neha Gautam 8. Mr. Suman Verma
Principal Investigator & Co-Principal Investigator Staff Details
Principal Investigator 1. Dr. B Paul Thaliath, Addl. Director Medical &
Head, Dept. of Radiation Oncology Co-Principal Investigator
1. Dr. Radha Ghosh, Sr. Consultant, Radiation Oncology
1. Dr. Sadhana Dwivedi 2. Mr. Alok Kumar Mishra 3. Ms. Bushra Firdous 4. Ms. Helen Dass 5. Mr. Ekta Sivastava 6. Ms. RenuPuspaker 7. Ms. NabiyaKausar 8. Mr. Krishna Kumar 9. Ms. Roshani Mishra

140
81. Regional Cancer Centre, Agartala
Year of Establishment: 2012
82. Regional Cancer Centre, Raipur
Year of Establishment: 2013
83. Regional Cancer Centre, Thiruvananthapuram
Year of Establishment: 1984
Principal Investigator & Co-Principal Investigator Staff Details
Principal Investigator 1. Dr. Gautam Majumdar,
Medical Superintendent Co-Principal Investigator
1. Dr. Partha Sarathi Sutradhar 2. Dr. Biswajit Debbarma 3. Dr. Dhritiman Datta
1. Dr. Ramkrishna Banik 2. Mr. Gopal Sarkar 3. Smt. Lakhi Roy Dhar 4. Mr. Litan Banik 5. Smt. Rupa Deb 6. Mr. Mithan Datta 7. Mr. Dhiman Debbarma 8. Ms. Sudesna Bhattacharjee 9. Mr. Nirmal Dey
Principal Investigator & Co-Principal Investigator Staff Details
Principal Investigator 1. Dr. Vivek Choudhary, Dean cum Director
RCC, Dept. of Radiation Oncology Co-Principal Investigator
1. Dr. Pradeep Kumar Chandrakar, Associate Professor, Dept. of Radiation Oncology
1. Ms. Madhuri Shukla 2. Ms. Sudha Shrivastava 3. Mr. Chandrabhan Marawi 4. Mr. Yogesh Sahu 5. Mr. Dharmraju
Principal Investigator & Co-Principal Investigator Staff Details
Principal Investigator 1. Dr. Aleyamma Mathew, Professor & Head,
Dept. of Epidemiology & Biostatistics 2. Dr. Paul Sebastian, Director & Professor,
Dept. of Surgical Oncology (till August 2018) Co-Principal Investigator
1. Dr. Preethi Sara George, Additional Professor 2. Dr. Aleyamma Mathew, Professor
(till September 2018) 3. Dr. Beela Sarah Mathew, Professor 4. Dr. Francis V James, Professor 5. Dr. Kainikkal CT, Additional Professor
1. Dr. Nirmal KB 2. Ms. Sreekala S 3. Ms. Sreelatha D 4. Ms. Sreekala S 5. Ms. Sunitha Kumari CS 6. Mr. Accamma Mathew 7. Mr. Ashok Kumar BS 8. Mr. Shiji Abraham 9. Mr. Nanda KL

141
84. Regional Institute of Medical Sciences, Imphal
Year of Establishment: 2014
85. RST Regional Cancer Hospital, Cancer Relief Society, Nagpur
Year of Establishment: 2012
86. Rural Development Trust, Bathalapalle
Year of Establishment: 2013
Principal Investigator & Co-Principal Investigator Staff Details
Principal Investigator 1. Dr. Sushma Khuraijam, Professor & Head,
Dept. of Pathology 2. Dr. Ph. Madhubala Dev, Professor & Head,
Dept. of Pathology (2017 to 2020) 3. Dr. Kaushik Debnath, Professor & Head
Dept. of Pathology (2015 to 2017) Co-Principal Investigator
1. Dr. Punyabati P, Professor, Dept. of Pathology (2015 to 2019)
2. Dr. Y. Indibor, Professor & Head, Dept. of Pathology
3. Dr. L. Rajesh Singh, Associate Professor, Dept. of Pathology
4. Dr. Sushma Khuraijam, Associate Professor, Dept. of Pathology (2019 to 2020)
5. Dr. Sorokhaibam Babina, Associate Professor, Dept. of Pathology (2019 to 2020)
1. Dr. Huining shumbam Bankim Singh 2. Mr. Yaikhom Rabindrakumar 3. Mr. Leingakpa Ningthoujam 4. Mr. Steffi Nongmeikapam 5. Ms. Khumukcham Monica 6. Mr. Reberio Meinam 7. Ms. Laishram Thoujal Heiba
Principal Investigator & Co-Principal Investigator Staff Details
Principal Investigator 1. Dr. Anjali Kolhe, Sr. Consultant,
Dept. of Anesthesia & Pain Clinic 2. Dr. B K Sharma, Honorary Consultant,
Dept. of Head and Neck (till Sept. 2020) Co-Principal Investigator
1. Dr. Amol Hedaw, Dental Oncosurgeon
1. Dr. R B Randiwe 2. Ms. Dipti Yadav 3. Ms. Nanda Kolhe 4. Ms. Snehal Chauhan 5. Mr. Vishnudas Sharnagat 6. Mr. Dinesh Lokhande 7. Ms. Mamta Rewatkar 8. Mrs. Sarika Dhote 9. Mr. Mayur Sarode
Principal Investigator & Co-Principal Investigator Staff Details
Principal Investigator 1. DR. N Hariharanadha Sarma, Consultant,
Dept. of Pathology Co-Principal Investigator
1. Dr. S M Kannan, Consultant Anaesthetist 2. Dr. K Sudheer Kumar, Consultant Surgeon
1. Mrs. Bhavani

142
87. Sanjay Gandhi Post Graduate Institute of Medical Sciences, Lucknow
Year of Establishment: 2014
88. Sher-I-Kashmir Institute of Medical Sciences, Srinagar
Year of Establishment: 2012
89. St. Johns Medical Hospital, Bengaluru
Year of Establishment: 2012
Principal Investigator & Co-Principal Investigator Staff Details
Principal Investigator 1. Dr. Punita Lal, Professor & Head,
Department of Radiotherapy Co-Principal Investigator
1. Dr. R Harshvardhan, Professor 2. Dr. K J Maria Das, Additional Professor 3. Dr. Rakesh Pandey, Professor 4. Dr. Uttam Singh, Professor
1. Dr. TapasiBarai 2. Mrs. Kirti Bajpai 3. Ms. Jyoti Verma 4. Mr. Amit Verma 5. Ms. Sidra Qidwai 6. Ms. Akshla Singh 7. Ms. Anamika Awasthi 8. Mr. Vibhu Chaturvedi 9. Mr. Kuldeep Gupta
Principal Investigator & Co-Principal Investigator Staff Details Principal Investigator
1. Prof. Fir Afroz, Professor & Head, Dept. of Radiation Oncology
2. Dr. Mohammad Maqbool Lone, Professor & Former Head, Dept. of Radiation Oncology
Co-Principal Investigator
1. Dr. Nazir Ahmad Khan, Professor, Dept. of Radiation oncology
1. Dr. Shandana Farooq Bhat 2. Ms. Foziya Zargar 3. Ms. ShaistaSidiq Pandit 4. Ms. Muneera Akhter 5. Ms. Bisma Showkat 6. Ms. Nahida Rashid 7. Ms. Aaliya Amir 8. Mr. Mohammad Asif Sheikh 9. Mr. Naveed Ahmad Bhat
Principal Investigator & Co-Principal Investigator Staff Details Principal Investigator
1. Dr. Rakesh S Ramesh, Associate Professor & Head, Dept. of Surgical Oncology
2. Dr Elizabeth Vallikad, Prof & Head, Dept. of Gynaecologic Oncology (till March 2018)
Co-Principal Investigator
1. Ms. Kalpana V, Co-Investigator & Cancer Registrar
1. Ms. Mallika Devi R 2. Ms. Pooja H.E 3. Ms. Lavanya A.S

143
90. State Cancer Institute, Guwahati
Year of Establishment: 2018
91. Tata Medical Center, Kolkata
Year of Establishment: 2014
92. Tata Memorial Hosptial, Mumbai
Year of Establishment: 1984
Principal Investigator & Co-Principal Investigator Staff Details Principal Investigator
1. Prof. Dr. Kanakeswar Bhuyan, Superintendent
Co-Principal Investigator
1. Dr. Neelakshi Mahanta, Associate Professor
2. Dr. Barasha Sarma Bhardwaj, Assistant Professor & Consultant (Pathology)
3. Mr. Ridip Talukdar, MRT (Medical Record Department)
1. Dr. Abhinav Agarwal 2. Mr. Bhaskarjyoti Talukdar 3. Ms. Jhilam Gautam 4. Ms. Pompi Roy 5. Mrs. Rumi Das Nath 6. Ms. Kiron Rajkumari 7. Mr. Soumen Banerjee 8. Mr. Dhrubajyoti Talukdar 9. Mr. Aminul Alom Ahmed
Principal Investigator & Co-Principal Investigator Staff Details Principal Investigator
1. Dr. Indranil Mallick, Senior Consultant, Dept. of Radiation Oncology
Co-Principal Investigator
1. Dr. Sanjit Agarwal, Associate Consultant 2. Dr. Jaydip Bhaumik, Senior Consultant 3. Ms. Antara Dey
1. Mrs. Sarita Kumari 2. Mrs. Sreyashi Samanta 3. Mr. Mayukh Biswas 4. Ms. Ruma Sarkar 5. Ms. Sayani Dey 6. Ms. Tandra Manna
Principal Investigator & Co-Principal Investigator Staff Details
Principal Investigator 1. Dr. R A Badwe, Director, Dept. of Surgery
Co-Principal Investigator
1. Dr. Rajesh Dikshit, Director, Centre for Cancer Epidemiology
2. Dr. Ganesh B, Former Prof. & Head, Dept. of Medical Records, Biostatistics and Epidemiology. (till June 2021)
1. Mrs. Sapna Kothare 2. Ms. Sushama L. Saoba 3. Mrs. Sandhya A Cheulkar 4. Mrs. Ashwini R Patil 5. Mrs. Monika Sarade 6. Mrs. Amruta A Mhatre 7. Mrs. Deepali N Lokhande 8. Mrs. Suvarna Kolekar 9. Mrs. Esha Dashmukhe 10. Ms. Prachi Joshi 11. Mr. Narpat Padvi 12. Mr. Mahadev Bhise 13. Dr. Rajshree Gaidhani 14. Ms. Kirtee Pardhi 15. Mrs. MitaliSapkal

144
93. The Gujarat Cancer & Research Institute, Ahmedabad
Year of Establishment: 2013
94. Tirunelveli Medical College, Tirunelveli
Year of Establishment: 2017
Principal Investigator & Co-Principal Investigator Staff Details
Principal Investigator 1. Dr. Shashank Pandya, Director,
Dept. of Surgical Oncolgy 2. Dr. Rakesh Vyas, Former Director,
Dept. Radiation Oncology (till February 2018)
3. Dr. Shilin Shukla, Former Director, Dept. of Medical Oncology (till September 2013)
Co-Principal Investigator
1. Dr. Anand Shah, Assistant Professor, Dept. of Community Oncology and Medical Records
2. Dr. Janmesh Shah, Assistant Professor, Dept. of Community Oncology and Medical Records (August 2016 to November 2019)
3. Dr. Geeta Joshi, Deputy Director (till July 2017)
4. Dr. Parimal Jivarajani, Associate Professor, Dept. of Community Oncology and Medical Records (till August 2014)
1. Dr. Dhruv Patel 2. Ms. Vaishali Ravani 3. Mr. Vishal Patel 4. Mr. Viral Parmar 5. Mr. Vahidhusain Mathakiya 6. Mr. Ravikant Parmar 7. Ms. Vaishakhi D Soni 8. Ms. Geeta Parmar 9. Ms. Hiral Chauhan
Principal Investigator & Co-Principal Investigator Staff Details
Principal Investigator 1. Dr. K Shantaraman MD,
Vice Principal & Professor & Head, Dept of Pathology
Co-Principal Investigator 1. Dr. S S Sundaram MS MCH,
Professor & Head 2. Dr. J Devivanayagam MD DM,
Professor & Head 3. Dr. J Suresh Durai MD, Professor 4. Dr. V Arumugam MD DM,
Professor & Head
1. Mr. J Solomon Jenifer Raj 2. Mrs. Shankari

145
95. Vivekananda Cancer Hospital, Latur
Year of Establishment: 2017
96. Vydehi Institute of Medical Sciences, Bengaluru
Year of Establishment: 2012
Principal Investigator & Co-Principal Investigator Staff Details
Principal Investigator 1. Dr. Ashok L Kukade, Founder Trustee
Co-Principal Investigator
1. Dr. Brij mohan Zanwar, Surgical Oncologist
1. Dr. Sadhana Kaname 2. Dr. Devendra Tandale 3. Mr. Shrikant Pawar 4. Mr. Abhijeet Sonavane 5. Ms. Smita Kukade 6. Mr. Ajay Jadhav 7. Ms. Ashwini Inamdar 8. Mr. Shrinivas Salunke 9. Mr. Manoj Deshpande
Principal Investigator & Co-Principal Investigator Staff Details
Principal Investigator 1. Dr. M S Ganesh, Prof. & Head,
Dept. of Oncology Principal Investigator Co-Principal Investigator
1. Dr. Aruna E Prasad, In-charge, Preventive Oncology (till Dec 2020)
2. Dr. Manjunath N, Associate Professor, Dept. of Medical Oncology
1. Ms. Jahnavi Hatti 2. Mr. Raja J 3. Mrs. Mythreyi O

146
References
1. Report of National Cancer Registry Programme (ICMR-NCDIR), Bengaluru, India, 2020.
2. Ferlay J, Ervik M, Lam F, Colombet M, Mery L, Piñeros M, et al. Global Cancer Observatory:
Cancer Today. Lyon: International Agency for Research on Cancer; 2020
(https://gco.iarc.fr/today, accessed September 2021).
3. Ministry of Health and Family Welfare. National Health Policy, Government of India 2017.
4. National Programme for Prevention and Control of Cancer,Diabetes, Cardiovascular diseases
and Stroke. Operational Guidelines 2013-17. Directorate General of Health Services,Ministry
of Health & Family welfare. Government Of India
5. GBD 2017 Childhood Cancer Collaborators. The global burden of childhood and adolescent
cancer in 2017: an analysis of the Global Burden of Disease Study 2017. Lancet Oncol 2019;
20: 1211–25
6. Bhakta N, Force LM, Allemani C, et al. Childhood cancer burden: a review of global estimates.
Lancet Oncol 2019; 20: e42–53.
7. Kramárová E, Stiller CA, Ferlay J, Parkin DM, Draper GJ, Michaelis J,Neglia J, Qureshi S (1996)
International Classification of Childhood Cancer1996. IARC Technical Report No.29,
International Agency for Research of Cancer, Lyon
8. ICMR-NCDIR, Report on Sites of Cancer Associated with Tobacco use in India - Findings from
the National Cancer Registry Programme, 2021, Bengaluru, India.
9. ICMR-NCDIR, National Noncommunicable Disease Monitoring Survey (NNMS) 2017–18,
Bengaluru, India.
10. WHO. World Health Organization international agency for research on cancer IARC.
Monographs on the Evaluation of Carcinogenic Risks to Humans VOLUME 83 Tobacco Smoke
and Involuntary Smoking. Tob Smoke Involunary Smok. 2004;83:Volume 83.
11. IARC Monographs – Supplement 7 Overall evaluations of carcinogenicity: An updating of IARC
monographs Volume 1-42: IARC monographs on the evaluation of the carcinogenic risks to
humans. IARC Lyon 1987, 357-61
12. IARC (2004a). Tobacco smoke and involuntary smoking. IARC Monogr Eval Carcinog Risks
Hum, 83: 1–1438.

Ways for Cancer Prevention and Control

Copyright © 2022 FDOKUMEN