A relevance-extended multi-dimensional model for a data warehouse contextualized with documents
10
A Relevance-Extended Multi-dimensional Model for a Data Warehouse Contextualized with Documents Juan Manuel Pérez, Rafael Berlanga, María José Aramburu Universitat Jaume I {martinej,berlanga,aramburu}@uji.es Torben Bach Pedersen Aalborg University [email protected] ABSTRACT Current data warehouse and OLAP technologies can be ap- plied to analyze the structured data that companies store in their databases. The circumstances that describe the con- text associated with these data can be found in other inter- nal and external sources of documents. In this paper we pro- pose to combine the traditional corporate data warehouse with a document warehouse, resulting in a contextualized warehouse. Thus, contextualized warehouses keep a histor- ical record of the facts and their contexts as described by the documents. In this framework, the user selects an anal- ysis context which is represented as a novel type of OLAP cube, here called R-cube. R-cubes are characterized by two special dimensions, namely: the relevance and the context dimensions. The first dimension measures the relevance of each fact in the selected analysis context, whereas the sec- ond one relates each fact with the documents that explain their circumstances. In this work we extend an existing multi-dimensional data model and algebra for representing the R-cubes. Categories and Subject Descriptors H.4.2 [Information Systems Applications]: Types of Systems—decision support General Terms Design Keywords OLAP, text-rich XML documents 1. INTRODUCTION Current data warehouse [8] and OLAP [3] technologies can be efficiently applied to analyze the huge amounts of structured data that companies produce. These organiza- tions also produce many documents and use the Web as Permission to make digital or hard copies of all or part of this work for personal or classroom use is granted without fee provided that copies are not made or distributed for profit or commercial advantage and that copies bear this notice and the full citation on the first page. To copy otherwise, to republish, to post on servers or to redistribute to lists, requires prior specific permission and/or a fee. DOLAP’05, November 4–5, 2005, Bremen, Germany. Copyright 2005 ACM 1-59593-162-7/05/0011 ...$5.00. their largest source of external information. Examples of internal and external sources of information include the fol- lowing: purchase-trends and market-research reports, de- mographic and credit reports, popular business journals, in- dustry newsletters, technology reports, etc. Although these documents cannot be analyzed by current OLAP technolo- gies mainly because they are unstructured and contain a large amount of text, they include highly valuable informa- tion that should also be exploited by companies. The cur- rent trend is to find these documents available in XML-like formats [21]. Our proposal is to build XML document warehouses that can be used by companies to store unstructured information coming from their internal and external sources. In [16] we outlined a multi-dimensional implementation of a document model [15] for the analysis of the information stored in a warehouse of text-rich XML documents. In this paper we present an architecture for the integration of a corporate warehouse of structured data with a warehouse of unstruc- tured documents. We call the resulting warehouse a con- textualized warehouse. Thus, a contextualized warehouse is a new kind of decision support system that allows users to obtain strategic information by combining all their sources of structured data and unstructured documents, and by an- alyzing the integrated data under different contexts. For example, if we have a document warehouse with business news articles, we can analyze the evolution of the sales mea- sures stored in our corporate warehouse in the context of a period of crisis as described by the relevant news. Thus, we could detect which products have been more affected. The same set of facts could be less revealing under a different context (e.g. regions in economical development). Further- more, for those facts that are not available in the corporate warehouse, some kind of alternative approximate informa- tion about them could be extracted from past economical re- ports (e.g. aggregated measures of historical export-import rates of some countries), and then included in the contex- tualized warehouse. We note that some important char- acteristics make different typical OLAP facts from factual information extracted from documents: the extracted facts may be incomplete (since not all the dimensions may be quoted in the documents contents) and/or imprecise (if the dimension values found belong to non-base levels). The applications described above require both the avail- ability of a document warehouse and its cooperation with the corporate data warehouse. The circumstances of the original facts are understood by analyzing their contexts, that is, the information available in the documents related 19
-
Upload
independent -
Category
Documents
-
view
1 -
download
0
Transcript of A relevance-extended multi-dimensional model for a data warehouse contextualized with documents
A Relevance-Extended Multi-dimensional Model for a DataWarehouse Contextualized with Documents
Juan Manuel Pérez, Rafael Berlanga,María José Aramburu
Universitat Jaume I
{martinej,berlanga,aramburu}@uji.es
Torben Bach PedersenAalborg University
ABSTRACTCurrent data warehouse and OLAP technologies can be ap-plied to analyze the structured data that companies store intheir databases. The circumstances that describe the con-text associated with these data can be found in other inter-nal and external sources of documents. In this paper we pro-pose to combine the traditional corporate data warehousewith a document warehouse, resulting in a contextualizedwarehouse. Thus, contextualized warehouses keep a histor-ical record of the facts and their contexts as described bythe documents. In this framework, the user selects an anal-ysis context which is represented as a novel type of OLAPcube, here called R-cube. R-cubes are characterized by twospecial dimensions, namely: the relevance and the contextdimensions. The first dimension measures the relevance ofeach fact in the selected analysis context, whereas the sec-ond one relates each fact with the documents that explaintheir circumstances. In this work we extend an existingmulti-dimensional data model and algebra for representingthe R-cubes.
Categories and Subject DescriptorsH.4.2 [Information Systems Applications]: Types ofSystems—decision support
General TermsDesign
KeywordsOLAP, text-rich XML documents
1. INTRODUCTIONCurrent data warehouse [8] and OLAP [3] technologies
can be efficiently applied to analyze the huge amounts ofstructured data that companies produce. These organiza-tions also produce many documents and use the Web as
Permission to make digital or hard copies of all or part of this work forpersonal or classroom use is granted without fee provided that copies arenot made or distributed for profit or commercial advantage and that copiesbear this notice and the full citation on the first page. To copy otherwise, torepublish, to post on servers or to redistribute to lists, requires prior specificpermission and/or a fee.DOLAP’05, November 4–5, 2005, Bremen, Germany.Copyright 2005 ACM 1-59593-162-7/05/0011 ...$5.00.
their largest source of external information. Examples ofinternal and external sources of information include the fol-lowing: purchase-trends and market-research reports, de-mographic and credit reports, popular business journals, in-dustry newsletters, technology reports, etc. Although thesedocuments cannot be analyzed by current OLAP technolo-gies mainly because they are unstructured and contain alarge amount of text, they include highly valuable informa-tion that should also be exploited by companies. The cur-rent trend is to find these documents available in XML-likeformats [21].
Our proposal is to build XML document warehouses thatcan be used by companies to store unstructured informationcoming from their internal and external sources. In [16] weoutlined a multi-dimensional implementation of a documentmodel [15] for the analysis of the information stored in awarehouse of text-rich XML documents. In this paper wepresent an architecture for the integration of a corporatewarehouse of structured data with a warehouse of unstruc-tured documents. We call the resulting warehouse a con-textualized warehouse. Thus, a contextualized warehouse isa new kind of decision support system that allows users toobtain strategic information by combining all their sourcesof structured data and unstructured documents, and by an-alyzing the integrated data under different contexts. Forexample, if we have a document warehouse with businessnews articles, we can analyze the evolution of the sales mea-sures stored in our corporate warehouse in the context of aperiod of crisis as described by the relevant news. Thus, wecould detect which products have been more affected. Thesame set of facts could be less revealing under a differentcontext (e.g. regions in economical development). Further-more, for those facts that are not available in the corporatewarehouse, some kind of alternative approximate informa-tion about them could be extracted from past economical re-ports (e.g. aggregated measures of historical export-importrates of some countries), and then included in the contex-tualized warehouse. We note that some important char-acteristics make different typical OLAP facts from factualinformation extracted from documents: the extracted factsmay be incomplete (since not all the dimensions may bequoted in the documents contents) and/or imprecise (if thedimension values found belong to non-base levels).
The applications described above require both the avail-ability of a document warehouse and its cooperation withthe corporate data warehouse. The circumstances of theoriginal facts are understood by analyzing their contexts,that is, the information available in the documents related
19
with the facts. In this paper, a context is defined as a setof textual fragments that can provide analysts with strategicinformation important for decision-making tasks. Contextsare thus unstructured, and cannot be managed by the well-structured corporate warehouse. Since the document ware-house may contain documents about many different topics,we apply well-known Information Retrieval (IR) [1] tech-niques to select the context of analysis from the documentwarehouse. Thus, in order to build a contextualized OLAPcube, the analyst will specify the context under analysis bysupplying a sequence of keywords. Each fact in the resultingcube will have a numerical value representing its relevancewith respect to the specified context, thereby its name, R-cube (Relevance cube). Moreover, each fact in the R-cubewill be related to its context (i.e. the set of the relevantdocuments that describe the context of the fact). In thispaper we extend an existing multi-dimensional data modelto represent these two new dimensions (relevance and con-text), and we study how the traditional OLAP operationsaffect them.
The relevance and context dimensions provide us furtherinformation about facts that can be very useful for analysistasks. From the user point of view, the relevance dimen-sion can be used to explore the most relevant portions ofan R-cube. For example, it can be used to identify the pe-riod of a political crisis, or the regions under economicaldevelopment. The usefulness of the context dimension istwofold. First, it can be used in the selection operations torestrict the analysis to the facts described in a given subsetof the documents (e.g. the most relevant documents). Andsecond, the user will be able to gain insight into the circum-stances of a fact by retrieving its related documents. Thegraphs, charts, and other binary files possibly linked in thedocuments would also be presented to the user, easing theunderstanding of the analysis context.
The main contributions of this paper are both, (1) anarchitecture for the integration of a traditional structuredcorporate warehouse with a document warehouse, resultingin a contextualized warehouse; and (2) the formal multi-dimensional data model and the algebra unary operationsto manage R-cubes.
The rest of the paper is organized as follows. Section 2discusses the related work. In Section 3 we present the ar-chitecture of a contextualized warehouse. Section 4 showshow the analysis cubes (R-cubes) are built. The multidi-mensional data model for R-cubes is presented in Section5. In Section 6 we propose an algebra for R-cubes. Finally,Section 7 addresses conclusions and future work.
2. RELATED WORKIn [7] the importance of external contextual information
to understand the results of historical analysis was empha-sized. Some works like [21] are focused on the constructionof repositories of XML documents gathered from the Inter-net, but they do not provide on-line analysis tools.
In [13], OLAP operations are extended to involve dimen-sion and/or measures contained in external XML data. Froma different point of view, [2] propose to extend XQuery [20]with grouping constructs to evaluate OLAP-style aggrega-tion queries on XML documents. However, the cited papersonly deal with highly structured XML data (e.g. on-lineXML products pricing lists), since the measures and dimen-sions should be selected by using XPath expressions [20].
These approaches are not suitable for analyzing text-richXML documents where the measure and dimension valuesare found in the documents textual contents.
A recent paper [12] provides mechanisms to perform spe-cial text aggregations on the contents of XML documents,e.g., getting the number of words of a document section, itsmost frequent keywords, a summary, etc. Although thesetext-mining operations are very useful to explore an XMLdocument collection, these techniques cannot be applied toevaluate OLAP operations on the factual information de-scribed by the textual contents of the documents. Our ap-proach differs from [12] in the sense that we do not analyzethe documents textual contents themselves, we extract thedimension values from the documents contents and relatethe documents with those corporate facts characterized bythe same dimension values. Afterwards, we analyze the cor-porate data by using the documents as their context.
Information Retrieval (IR) [1] is playing an important roleon the Web, since it has enabled the development of usefuldiscovery tools (e.g. web search engines) and digital libraryservices. These applications deal with huge amounts of text-rich documents and have successfully applied IR techniquesto query this type of repositories. In an IR system the usersdescribe their information needs by supplying a sequence ofkeywords. The result is a set of documents ranked by rel-evance. The relevance is a numerical value which measureshow well the document fits the user information needs. Tra-ditional IR models (e.g. the vector space model [18]) calcu-late this relevance value by considering the local and globalfrequency (tf-idf) of the query keywords in the documentand the collection, respectively. Intuitively, a document willbe relevant to the query if the specified keywords appear fre-quently in its textual contents and they are not frequent inthe collection. Newer proposals in the field of IR include lan-guage modeling [17] and relevance modeling [9] techniques.The works on language modeling consider each documentas a language model. Thus, documents are ranked accord-ing to the probability of obtaining the query keywords whenrandomly sampling from the respective language model. Anextension of the language modeling approach is relevancemodeling [9] which estimates the probability of observing aquery keyword in the set of documents relevant to a query.The language and relevance modeling approaches still inter-nally apply the keyword frequency to estimate probabilities,and they have been shown to outperform baseline tf-idf mod-els in many cases [17, 9]. As discussed below, our approachrelies on relevance modeling techniques. Unlike traditionalIR models, language and relevance models provide a formalbackground based on probability theory which is suitable tobe included in the formalization of OLAP operations.
In [15] we presented a document model for text-rich XMLdocuments where information extraction techniques [10, 5,6] are applied to identify the facts described by the tex-tual contents of the documents. Particularly, [10] and [5]were proven to work to extract time and location references.Given an IR condition, in [15] we showed how relevancemodeling techniques [9] can be applied to estimate the rel-evance of a fact by the probability of observing this factin a document which contains the keywords stated in theIR condition. By following this research line, in a shortpaper [16] we outlined a multi-dimensional implementationof the relevance model discussed in [15]. The focus of thepresent paper is contextualized warehouses. Here we relate
20
the facts of a traditional corporate warehouse with the doc-uments that describe their circumstances. IR conditions areused for establishing an analysis context, and the relevancemodel of [15] is applied to calculate the relevance of thefacts in the resulting analysis cube (R-cube). The relevancevalue of a fact measures how well the fact fits into the se-lected context. At any moment, it is possible to retrievethe documents related to a fact, and to gain insight into theexplanation of its circumstances. The architecture of a con-textualized warehouse, and the extended multi-dimensionaldata model and algebra for R-cubes proposed in the currentpaper are novel.
In [11] a probabilistic multi-dimensional model was pre-sented, but it does not clearly discuss how the probabilitiesof the facts are re-calculated after an aggregation. More-over, the selection operation does not modify the probabil-ities of the facts in the resulting cube. We consider thatthe conditions established in a selection operation are also arestriction on the context under analysis and therefore therelevance of facts must be updated accordingly.
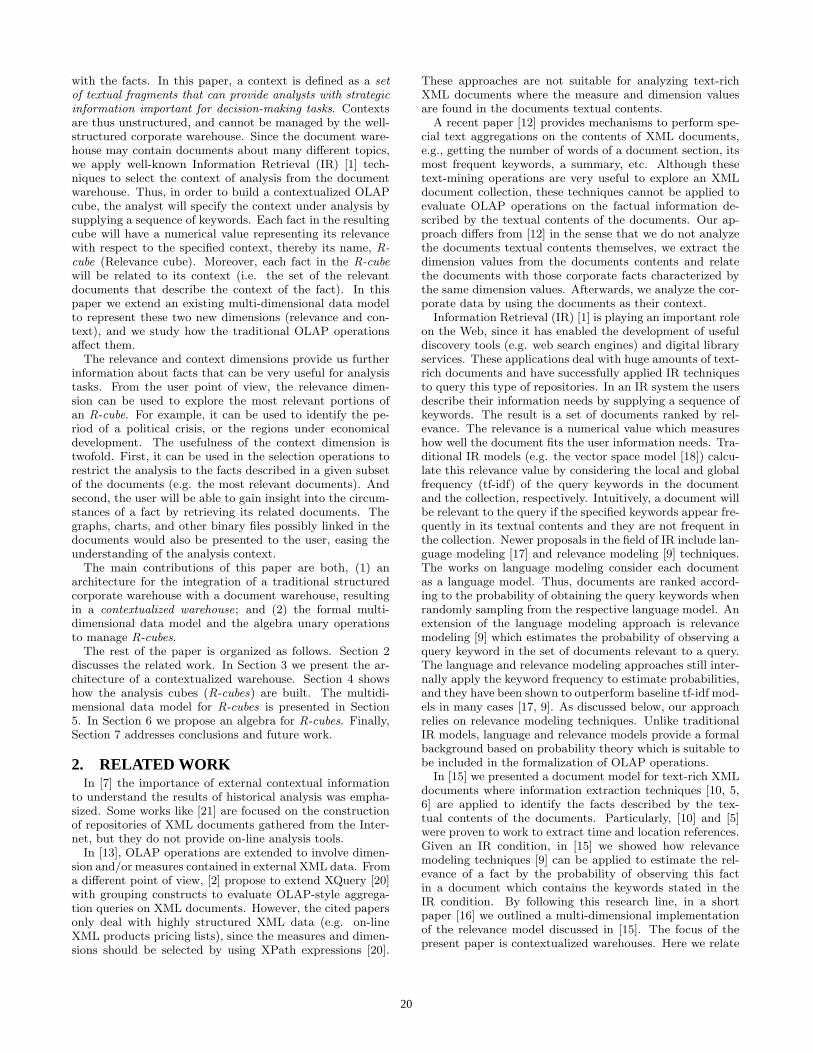
3. CONTEXTUALIZED WAREHOUSESFigure 1 shows the proposed architecture for the contex-
tualized warehouse. Its main components are a traditionalstructured corporate warehouse [8], a document warehouseable to evaluate IR conditions [15], and a fact extractor mod-ule. Building a contextualized warehouse mainly means re-lating each fact of the corporate warehouse with its context.For this purpose, the fact extractor tool uses the dimensionsdefined in the corporate warehouse to detect and build thefacts described in the documents. Next, we describe thisprocess in detail by means of an example.
Q, XPath
Document
WarehouseCorporate
Warehouse
Document
Analysts
Contexts &
Facts
OLAP
Cube
Corp.
Facts
R-cube
Dimensions
Contextualized
Facts
Analysts
Contexts
&
Facts
Fact Extractor
Q, XPath
Document
WarehouseCorporate
Warehouse
Document
Analysts
Contexts &
Facts
OLAP
Cube
Corp.
Facts
R-cube
Dimensions
Contextualized
Facts
Analysts
Contexts
&
Facts
Fact Extractor
Figure 1: Contextualized warehouse architecture
Let us consider the corporate warehouse of an interna-tional provider of vegetable oil by-products. The main prod-ucts of this company include: fo1, fo2 (used as preserva-tives in the food sector), and he1 and he2 (used in theelaboration of healthcare products). The company keepsin its corporate warehouse a historical record of its sales,the quantity sold (Quantity measure) and its cost (Amountmeasure), per product and customer. Thus, the dimen-sions of the corporate warehouse are T ime, Products andCustomers. The Products are classified into Sectors (foodand healthcare). Finally, Customers are organized intoCountries andRegions (e.g. Southeast Asia, Central Amer-ica, etc.).
Our example company also maintains a document ware-house of business newspapers gathered from the Internet inXML format. Figure 2 shows a fragment of an exampledocument of this warehouse that depicts a context for thesales of food sector products to customers of the SoutheastAsian region, made during the second half of 1998. Noticethat contexts are very useful for analysis tasks, since theycan give us detailed information about the facts of the cor-porate warehouse. For example, the document in Figure 2would help to understand a sales drop.
<article date=‘‘Dec.1,1998’’><paragraph>The financial crisis in Southeast Asian countries,has mainly affected companies in the food marketsector. Particularly, Chicken SPC Inc. has reducedtotal exports to $1.3 million during this half of theyear from $10.1 million in 1997.</paragraph> ...</article>
Figure 2: Example fragment of a business journal
By applying information extraction techniques [10, 5, 6],and considering the predefined analysis dimensions of the ex-ample corporate warehouse, the dimension values SoutheastAsia, food, and 1998/2nd half can be identified in the doc-ument fragment. The fact extractor tool builds all the validfacts with them, in this case, (Products.Sector = food,Customers.Region = Southeast Asia, T ime.Half year =1998/2nd half). As it can be noticed, some of these dimen-sion values are not precise enough and belong to non-base di-mension categories, for example, the SoutheastAsia dimen-sion value belongs to the category Region of the Customersdimension. We may also find documents where some dimen-sions are not mentioned, resulting in incomplete facts. Foreach fact, the fact extraction tool also keeps the numberof times that its dimension values occur in the documentfragment (i.e. the fact dimension values frequency). Thisfrequency determines the importance of the fact in the doc-ument, and later will be used to estimate the relevance of afact in a given context.
Let us now consider the second sentence of the exampledocument of Figure 2. It depicts two facts: (Company =Chicken SPC, T ime.Y ear = 1997, Export = $10, 100, 000),(Company = Chicken SPC, T ime.Half year = 1998/2ndhalf, Export = $1, 300, 000). Chicken SPC Inc. could be apotential customer or competitor of our example oil providercompany. In this way, the document warehouse also provideshighly valuable strategic information about some facts thatare not available in the corporate warehouse nor in externaldatabases. We note that sometimes it is relatively easy toobtain these facts, for example, when they are presented astables in the documents. However, most times documentscontain already aggregated measure values (total exports inthe facts of the previous example). The main problem hereis to automatically infer the implicit aggregation functionthat was applied (i.e. average, sum, etc.) Alternatively, thesystem could ask the user to guess the aggregation functionby showing him/her the document contents. In this work wemainly focus on the fact dimensions, leaving for future workthe management of measures extracted from texts. Noticethat documents extracted measure values are not essentialto construct a contextualized warehouse, since the dimen-sion values found in a document are sufficient to relate it
21
F Products.ProductId Customers.Country Time.Month Amount R Ctxtf1 fo1 Cuba 1998/03 4, 300, 000$ 0.05 d0.005
3 , d0.0057
f2 fo2 Japan 1998/02 3, 200, 000$ 0.1 d0.025
f3 fo2 Korea 1998/05 900, 000$ 0.2 d0.044
f4 fo1 Japan 1998/10 300, 000$ 0.4 d0.041 , d0.08
2f5 fo2 Korea 1998/11 400, 000$ 0.25 d0.08
2 , d0.016
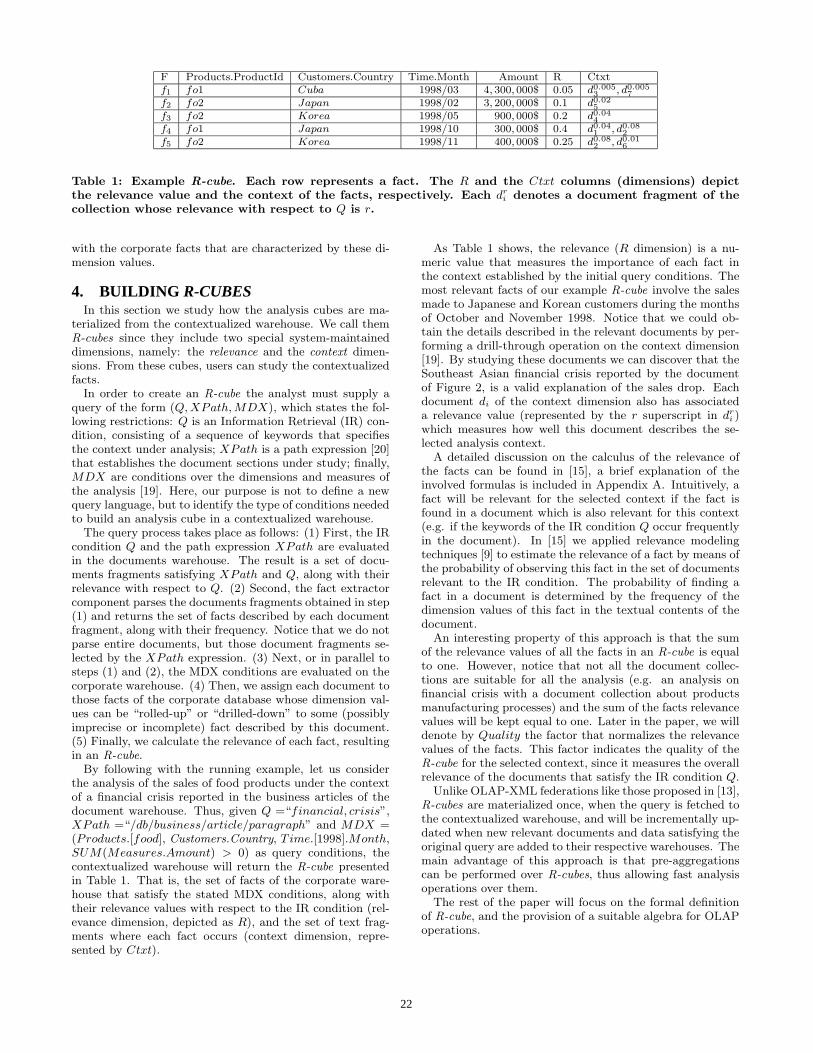
Table 1: Example R-cube. Each row represents a fact. The R and the Ctxt columns (dimensions) depictthe relevance value and the context of the facts, respectively. Each dr
i denotes a document fragment of thecollection whose relevance with respect to Q is r.
with the corporate facts that are characterized by these di-mension values.
4. BUILDING R-CUBESIn this section we study how the analysis cubes are ma-
terialized from the contextualized warehouse. We call themR-cubes since they include two special system-maintaineddimensions, namely: the relevance and the context dimen-sions. From these cubes, users can study the contextualizedfacts.
In order to create an R-cube the analyst must supply aquery of the form (Q,XPath,MDX), which states the fol-lowing restrictions: Q is an Information Retrieval (IR) con-dition, consisting of a sequence of keywords that specifiesthe context under analysis; XPath is a path expression [20]that establishes the document sections under study; finally,MDX are conditions over the dimensions and measures ofthe analysis [19]. Here, our purpose is not to define a newquery language, but to identify the type of conditions neededto build an analysis cube in a contextualized warehouse.
The query process takes place as follows: (1) First, the IRcondition Q and the path expression XPath are evaluatedin the documents warehouse. The result is a set of docu-ments fragments satisfying XPath and Q, along with theirrelevance with respect to Q. (2) Second, the fact extractorcomponent parses the documents fragments obtained in step(1) and returns the set of facts described by each documentfragment, along with their frequency. Notice that we do notparse entire documents, but those document fragments se-lected by the XPath expression. (3) Next, or in parallel tosteps (1) and (2), the MDX conditions are evaluated on thecorporate warehouse. (4) Then, we assign each document tothose facts of the corporate database whose dimension val-ues can be “rolled-up” or “drilled-down” to some (possiblyimprecise or incomplete) fact described by this document.(5) Finally, we calculate the relevance of each fact, resultingin an R-cube.
By following with the running example, let us considerthe analysis of the sales of food products under the contextof a financial crisis reported in the business articles of thedocument warehouse. Thus, given Q =“financial, crisis”,XPath =“/db/business/article/paragraph” and MDX =(Products.[food], Customers.Country, T ime.[1998].Month,SUM(Measures.Amount) > 0) as query conditions, thecontextualized warehouse will return the R-cube presentedin Table 1. That is, the set of facts of the corporate ware-house that satisfy the stated MDX conditions, along withtheir relevance values with respect to the IR condition (rel-evance dimension, depicted as R), and the set of text frag-ments where each fact occurs (context dimension, repre-sented by Ctxt).
As Table 1 shows, the relevance (R dimension) is a nu-meric value that measures the importance of each fact inthe context established by the initial query conditions. Themost relevant facts of our example R-cube involve the salesmade to Japanese and Korean customers during the monthsof October and November 1998. Notice that we could ob-tain the details described in the relevant documents by per-forming a drill-through operation on the context dimension[19]. By studying these documents we can discover that theSoutheast Asian financial crisis reported by the documentof Figure 2, is a valid explanation of the sales drop. Eachdocument di of the context dimension also has associateda relevance value (represented by the r superscript in dr
i )which measures how well this document describes the se-lected analysis context.
A detailed discussion on the calculus of the relevance ofthe facts can be found in [15], a brief explanation of theinvolved formulas is included in Appendix A. Intuitively, afact will be relevant for the selected context if the fact isfound in a document which is also relevant for this context(e.g. if the keywords of the IR condition Q occur frequentlyin the document). In [15] we applied relevance modelingtechniques [9] to estimate the relevance of a fact by means ofthe probability of observing this fact in the set of documentsrelevant to the IR condition. The probability of finding afact in a document is determined by the frequency of thedimension values of this fact in the textual contents of thedocument.
An interesting property of this approach is that the sumof the relevance values of all the facts in an R-cube is equalto one. However, notice that not all the document collec-tions are suitable for all the analysis (e.g. an analysis onfinancial crisis with a document collection about productsmanufacturing processes) and the sum of the facts relevancevalues will be kept equal to one. Later in the paper, we willdenote by Quality the factor that normalizes the relevancevalues of the facts. This factor indicates the quality of theR-cube for the selected context, since it measures the overallrelevance of the documents that satisfy the IR condition Q.
Unlike OLAP-XML federations like those proposed in [13],R-cubes are materialized once, when the query is fetched tothe contextualized warehouse, and will be incrementally up-dated when new relevant documents and data satisfying theoriginal query are added to their respective warehouses. Themain advantage of this approach is that pre-aggregationscan be performed over R-cubes, thus allowing fast analysisoperations over them.
The rest of the paper will focus on the formal definitionof R-cube, and the provision of a suitable algebra for OLAPoperations.
22
5. A MULTIDIMENSIONAL DATA MODELFOR R-CUBES
In this section we define a data model for the R-cubes.We extend an existing multidimensional model [14] with twonew special dimensions to represent both, the relevance ofthe facts and their context. For each component of the ex-tended data model, we show its definition and give someexamples.
5.1 DimensionsA dimension D is a two-tupleD = (CD,�D), where CD =
{Cj} is a set of categories Cj .
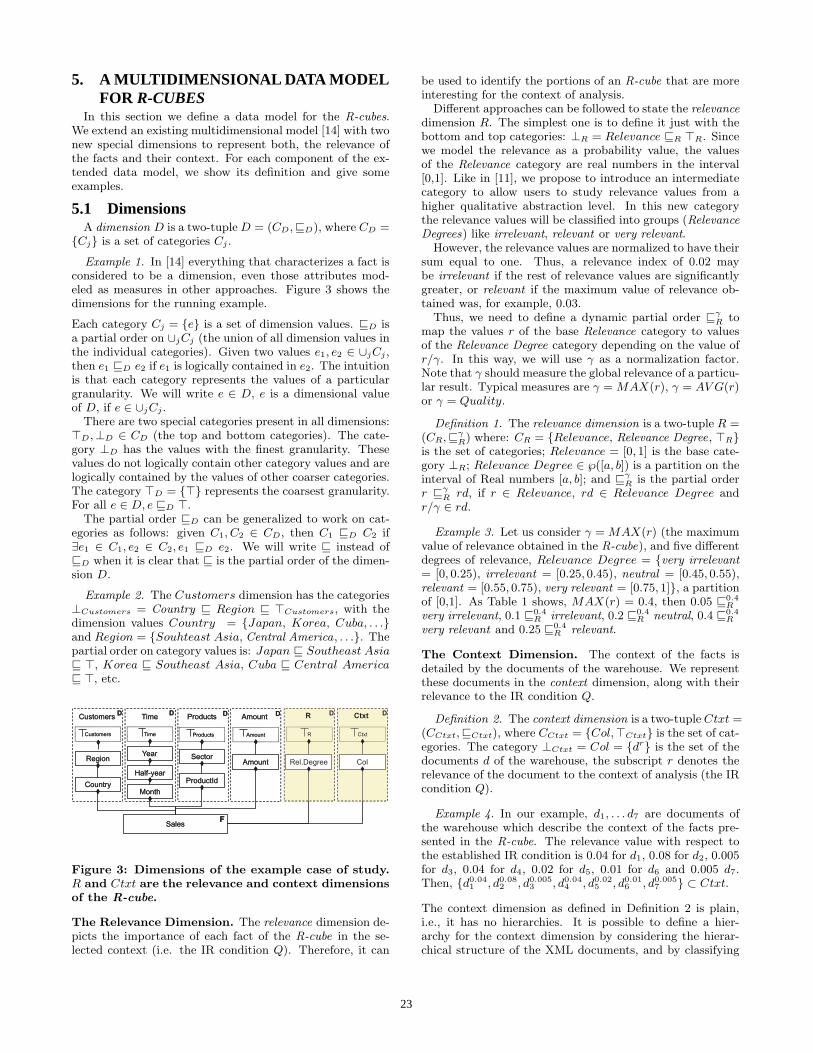
Example 1. In [14] everything that characterizes a fact isconsidered to be a dimension, even those attributes mod-eled as measures in other approaches. Figure 3 shows thedimensions for the running example.
Each category Cj = {e} is a set of dimension values. �D isa partial order on ∪jCj (the union of all dimension values inthe individual categories). Given two values e1, e2 ∈ ∪jCj ,then e1 �D e2 if e1 is logically contained in e2. The intuitionis that each category represents the values of a particulargranularity. We will write e ∈ D, e is a dimensional valueof D, if e ∈ ∪jCj .
There are two special categories present in all dimensions:�D,⊥D ∈ CD (the top and bottom categories). The cate-gory ⊥D has the values with the finest granularity. Thesevalues do not logically contain other category values and arelogically contained by the values of other coarser categories.The category �D = {�} represents the coarsest granularity.For all e ∈ D, e �D �.
The partial order �D can be generalized to work on cat-egories as follows: given C1, C2 ∈ CD, then C1 �D C2 if∃e1 ∈ C1, e2 ∈ C2, e1 �D e2. We will write � instead of�D when it is clear that � is the partial order of the dimen-sion D.
Example 2. The Customers dimension has the categories⊥Customers = Country � Region � �Customers, with thedimension values Country = {Japan, Korea, Cuba, . . .}and Region = {Souhteast Asia, Central America, . . .}. Thepartial order on category values is: Japan � Southeast Asia� �, Korea � Southeast Asia, Cuba � Central America� �, etc.
Customers Time Products Amount
Customers Time Products Amount
Region
Country
Year
Half-year
Month
Sector
ProductId
SalesF
DDDD
Amount
R
DR
Ctxt
DCtxt
Rel.Degree Col
Customers Time Products Amount
Customers Time Products Amount
Region
Country
Year
Half-year
Month
Sector
ProductId
SalesF
DDDD
Amount
R
DR
Ctxt
DCtxt
Rel.Degree Col
Figure 3: Dimensions of the example case of study.R and Ctxt are the relevance and context dimensionsof the R-cube.
The Relevance Dimension. The relevance dimension de-picts the importance of each fact of the R-cube in the se-lected context (i.e. the IR condition Q). Therefore, it can
be used to identify the portions of an R-cube that are moreinteresting for the context of analysis.
Different approaches can be followed to state the relevancedimension R. The simplest one is to define it just with thebottom and top categories: ⊥R = Relevance �R �R. Sincewe model the relevance as a probability value, the valuesof the Relevance category are real numbers in the interval[0,1]. Like in [11], we propose to introduce an intermediatecategory to allow users to study relevance values from ahigher qualitative abstraction level. In this new categorythe relevance values will be classified into groups (RelevanceDegrees) like irrelevant, relevant or very relevant.
However, the relevance values are normalized to have theirsum equal to one. Thus, a relevance index of 0.02 maybe irrelevant if the rest of relevance values are significantlygreater, or relevant if the maximum value of relevance ob-tained was, for example, 0.03.
Thus, we need to define a dynamic partial order �γR to
map the values r of the base Relevance category to valuesof the Relevance Degree category depending on the value ofr/γ. In this way, we will use γ as a normalization factor.Note that γ should measure the global relevance of a particu-lar result. Typical measures are γ = MAX(r), γ = AV G(r)or γ = Quality.
Definition 1. The relevance dimension is a two-tuple R =(CR,�γ
R) where: CR = {Relevance, Relevance Degree, �R}is the set of categories; Relevance = [0, 1] is the base cate-gory ⊥R; Relevance Degree ∈ ℘([a, b]) is a partition on theinterval of Real numbers [a, b]; and �γ
R is the partial orderr �γ
R rd, if r ∈ Relevance, rd ∈ Relevance Degree andr/γ ∈ rd.
Example 3. Let us consider γ = MAX(r) (the maximumvalue of relevance obtained in the R-cube), and five differentdegrees of relevance, Relevance Degree = {very irrelevant= [0, 0.25), irrelevant = [0.25, 0.45), neutral = [0.45, 0.55),relevant = [0.55, 0.75), very relevant = [0.75, 1]}, a partitionof [0,1]. As Table 1 shows, MAX(r) = 0.4, then 0.05 �0.4
R
very irrelevant, 0.1 �0.4R irrelevant, 0.2 �0.4
R neutral, 0.4 �0.4R
very relevant and 0.25 �0.4R relevant.
The Context Dimension. The context of the facts isdetailed by the documents of the warehouse. We representthese documents in the context dimension, along with theirrelevance to the IR condition Q.
Definition 2. The context dimension is a two-tuple Ctxt =(CCtxt,�Ctxt), where CCtxt = {Col,�Ctxt} is the set of cat-egories. The category ⊥Ctxt = Col = {dr} is the set of thedocuments d of the warehouse, the subscript r denotes therelevance of the document to the context of analysis (the IRcondition Q).
Example 4. In our example, d1, . . . d7 are documents ofthe warehouse which describe the context of the facts pre-sented in the R-cube. The relevance value with respect tothe established IR condition is 0.04 for d1, 0.08 for d2, 0.005for d3, 0.04 for d4, 0.02 for d5, 0.01 for d6 and 0.005 d7.Then, {d0.04
1 , d0.082 , d0.005
3 , d0.044 , d0.02
5 , d0.016 , d0.005
7 } ⊂ Ctxt.
The context dimension as defined in Definition 2 is plain,i.e., it has no hierarchies. It is possible to define a hier-archy for the context dimension by considering the hierar-chical structure of the XML documents, and by classifying
23
the different documents fragments into the category whichrepresents their element type (i.e. tag name). This hier-archy would allow the user to navigate on the structure ofthe XML documents in the OLAP operations. However, forsimplicity reasons we do not include such a hierarchy in thepaper.
5.2 Fact-Dimension RelationsThe fact-dimension relations link facts with dimension val-
ues. By following [14], given a set of facts F = {f} and adimension D, the fact-dimension relation between F and Dis the set FD = {(f, e)}, where f ∈ F and e ∈ D.
A fact f is characterized by the dimension value e, writtenf ❀D e, if ∃ e′ ∈ D, (f, e′) ∈ FD∧e′ �D e. In order to avoidmissing values it is required that ∀f ∈ F, ∃ e ∈ D, (f, e) ∈FD. If the dimension value that characterizes a fact is notknown, the pair (f,�) is added to FD.
Example 5. In the example of Table 1 we have the factsF = {f1, f2, f3, f4, f5}. FDCustomers is the fact-dimensionrelation that links each fact with its value in the dimen-sion Customers. Thus, FDCustomers = {(f1, Cuba), (f2,Japan), (f3, Korea), (f4, Japan), (f5, Korea)}, and forexample f3 ❀Customers Southeast Asia.
Example 6. The fact-dimension relation FDAmount linkseach fact with is value in the dimension Amount, FDAmount
= {(f1, 4, 300, 000$), (f2, 3, 200, 000$), (f3, 900, 000$), (f4,300, 000$), (f5, 400, 000$)}.
The Relevance Fact-Dimension Relation. The rele-vance fact-dimension relation links each fact with its rele-vance value.
Definition 3. The relevance fact-dimension relation is theset FR = {(f, r)} where f ∈ F is a fact and r ∈ R its rele-vance. We require each fact to have a unique relevance value,∀f ∈ F, ∃! r ∈ R, (f, r) ∈ FR. The sum of the relevance val-ues of all the facts in F is equal to one,
P(f,r)∈FR r = 1.
Let rd ∈ RelevanceDegree and γ, we will write f ❀γR rd,
meaning that the relevance degree of the fact f is rd whenglobal relevance measure γ is applied, if ∃r ∈ R, (f, r) ∈ FRand r �γ
R rd.
Example 7. For the running example we have FR = {(f1,0.05), (f2, 0.1), (f3, 0.2), (f4, 0.4), (f5, 0.25)}, and by takingγ = MAX(r) = 0.4, f1 ❀0.4
R very irrelevant, f2 ❀0.4R
irrelevant, f3 ❀0.4R neutral, f4 ❀0.4
R very relevant andf5 ❀0.4
R relevant. That is, f5 is relevant, but f2 may beirrelevant for the selected context.
The Context Fact-Dimension Relation. The contextfact-dimension relation links each fact with the documentsthat describe its context.
Definition 4. We define the context fact-dimension rela-tion as the set FCtxt = {(f, dr)} where f ∈ F is a factdescribed by the document d, also written f ❀Ctxt d, andr is the relevance value of d, dr ∈ Ctxt.
Example 8. In the example, FCtxt = {(f1, d0.0053 ), (f1,
d0.0057 ), (f2, d
0.025 ), (f3, d
0.044 ), (f4, d
0.041 ), (f1, d
0.082 ), (f5,
d0.082 ), (f5, d
0.016 )}. The documents d1, d2 depict the context
of the fact f4, then f4 ❀Ctxt d1 and f4 ❀Ctxt d2.
5.3 R-cubes: Relevance-Extended Multidimen-sional Objects
We extend the definition of multidimensional object [14]to include the relevance and context dimensions discussedbefore.
Definition 5. A relevance-extended multidimensional ob-ject or R-cube is a four-tuple RM = (F,D, FD,Q), where:F = {f} is a set of facts; D = {Di, i = 1, . . . , n}∪{R,Ctxt}is a set of dimensions, R,Ctxt ∈ D are the relevance andcontext dimensions previously defined; FD = {FDi, i =1, ..., n} ∪ {FR, FCtxt} is a set of fact-dimension relations,one for each dimension Di ∈ D; FR, FCtxt ∈ FD arethe relevance and context fact-dimension relations discussedabove; and Q is an IR condition. In the model, we representthe relevance of each fact to the context established by theIR condition Q.
We measure the analysis quality of an R-cube RM for theselected context by Quality =
P(f,dr)∈FCtxt r. That is, the
overall relevance to the IR condition Q of the documentsthat describe the facts of the R-cube.
Example 9. The sales shown in Table 1 constitute theset of facts F of the R-cube. The set of dimensions isD = {Products, Customers, Time, Amount} ∪ {R,Ctxt}.In the previous examples we have shown the definition ofsome of these dimensions along with their correspondingfact-dimension relations. The IR condition used for statingthe context of analysis was Q =“financial, crisis”. Thequality of the R-cube is Quality = 0.2.
6. R-CUBES ALGEBRAIn this section we present an algebra for the R-cubes by
extending the definition of the unary operators presentedin [14] to regard the relevance and context of the facts. Foreach operator, we show its definition, and discuss how therelevance and context are updated in the result by givingsome examples.
6.1 Selection OperatorThe selection operator restricts the facts in the cube to
the subset of facts that satisfy some given conditions.
Definition 6. Let p : D1 × . . .×Dn ×R× Ctxt→ {true,false} be a predicate on the dimensions D. The relevance-extended selection operator, Rσ, is defined as: Rσ[p](RM) =(F ′,D′, FD′, Q′), where F ′ = {f ∈ F | ∃(e1, . . . , en, r, d) ∈D1 × . . .×Dn ×R×Ctxt, p(e1, . . . , en, r, d)∧f ❀1 e1 ∧ . . .∧f ❀n en ∧ f ❀R r ∧ f ❀Ctxt d}, D′ = D and FD′ ={FD′
i, i = 1 . . . n} ∪ {FR′, FCtxt′}. FD′i = {(f ′, e) ∈ FDi|
f ′ ∈ F ′}, FCtxt′ = {(f ′, dr) ∈ FCtxt|f ′ ∈ F ′} and FR′ ={(f ′, rβ)|(f ′, r) ∈ FR∧f ′ ∈ F ′}, β = Quality/Quality′ ≥ 1,Quality′ =
P(f,dr)∈FCtxt′ r and Q′ = Q.
The set of facts in the resulting R-cube is restricted to thosefacts characterized by the dimension values where p is true.The fact-dimension relations are restricted accordingly too.Notice that the quality of the R-cube will be decreased whenany relevant document is discarded by the selection oper-ation. As formally discussed in the theorem (1) of Ap-pendix B, the relevance values are increased by a factor of β.Thus, it is ensured that the sum of the relevance values ofthe facts in the resulting R-cube remains equal to one.
24
F’ Products.ProductId Customers.Country Time.Month Amount R Ctxtf4 fo1 Japan 1998/10 300, 000$ 0.62 d0.04
1 , d0.082
f5 fo2 Korea 1998/11 400, 000$ 0.38 d0.082 , d0.01
6
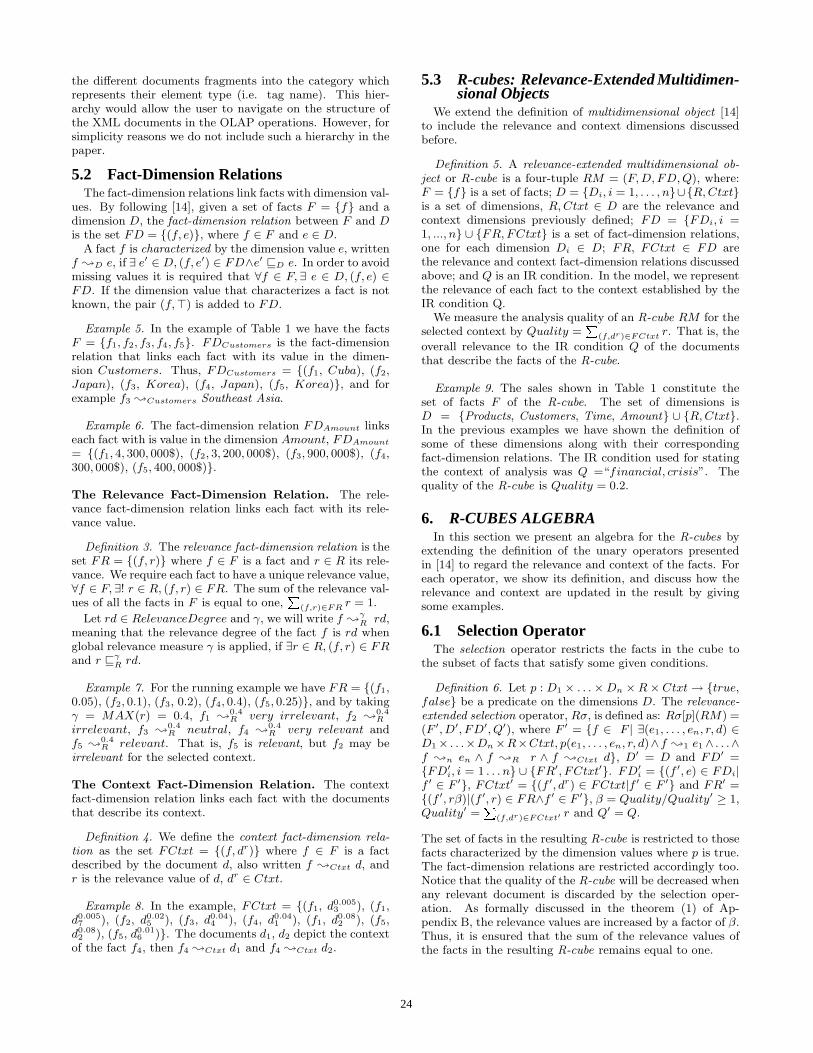
Table 2: Result of applying Rσ on the example R-cube of Table 1, p = (Customers.Region = Southeast Asia,R.Relevance Degree = very relevant or relevant). Quality’ = 1.54.
Example 10. We can apply the relevance-extended selec-tion operator to dice the R-cube and study the sales madeto Southeast Asian customers. Since conditions on therelevance dimension are supported, we could also restrictthe analysis to those facts considered as relevant or veryrelevant. Thus, p= (Customers.Region= Southeast Asia,R.Relevance Degree = very relevant or relevant). Table 2shows the resulting R-cube. The set of facts is restrictedto F ′ = {f4, f5}. The resulting fact-dimension relationsare: FProducts′ = {(f4, fo1), (f5, fo2)}, FCustomers′ ={(f4, Japan), (f5,Korea)}, FTime′ = {(f4, 1998/10), (f5,1998/11)}, FAmount′ = {(f4, 300, 000$), (f5, 400, 000$)}.Notice that the stated restriction also affects the set of docu-ments that describe the facts of the R-cube, FCtxt′ = {(f4,d0.041 ), (f4, d
0.082 ), (f5, d
0.082 ), (f5, d
0.016 )}, FCxt′ ⊂ FCtxt.
Since some relevant documents for the analysis context arediscarded, the quality of the resulting R-cube decreases toQuality′ = 0.13 < Quality = 0.2. Consequently, the rele-vance value of the facts in the result is also affected, sincethese values will be now normalized by Quality′. Thus, rele-vance of facts is increased in a β factor, β = Quality/Quality′
= 1.54. The resulting relevance fact-dimension relation isFR′ = {(f1, 0.62), (f2, 0.38)}.
The β factor measures the quality lost in the resulting R-cube. Good restrictions will result in low β values, since theypreserve the relevant facts of the R-cube and discard the non-relevant ones. However, sometimes, we may be interestedin a particular region of the cube. A high β value (a lowQuality′) will warn the user of a meaningless result.
Example 11. When the selection operator is applied tothe example R-cube of Table 1, with the predicate p =(Customers.Region = Central America), the set of factsin the resulting R-cube is restricted to F ′ = {f1}, and thecontext fact-dimension relation becomes FCtxt′ = {d0.005
3 ,d0.0057 }. Consequently, the quality is reduced to Quality′ =
0.01, resulting β = 0.2/0.01 = 20. The high β value pointsto a considerable quality lost, meaning that the analysis re-sult is not significant in the selected context (e.g the financialcrisis mainly affected the Southeast Asian countries).
6.2 Aggregate Formation OperatorThe aggregate formation operator evaluates an aggrega-
tion function on the R-cube. By following [14], we assumethe existence of a family of functions g : 2F → Dn+1 that re-ceive a set of facts and compute an aggregation by taking thedata from the requested fact-dimension relation (e.g. SUMi
takes the data from FDi, and performs the sum).The Group operator defined in [14] groups the facts char-
acterized by the same dimension values. Given the dimen-sion values (e1, . . . , en) ∈ D1×. . .×Dn, Group(e1, . . . , en) ={f ∈ F |f ❀1 e1 ∧ . . . ∧ f ❀n en}.
Example 12. In the example R-cube of Table 1, we cangroup those sales made to Southeast Asian customers dur-ing the second half of 1998 as follows: given the dimension
values (�, Southeast Asia, 1998/2nd half,�) ∈ �Products×Region×Half year×�Amount, Group(�, Southeast Asia,1998/2nd half,�) = {f4, f5}.
Definition 7. Given a new dimension Dn+1, an aggre-gation function g : 2F → Dn+1, and a set of groupingcategories {Ci ∈ CDi , i = 1 . . . n,CDi �= CR, CCtxt}, therelevance-extended aggregate formation operator, Rα, is de-fined as Rα[Dn+1, g, C1, . . . , Cn](RM) = (F ′, D′, FD′, Q′),where:
F ′ = {Group(e1, . . . , en)|(e1, . . . , en) ∈ C1 × . . .× Cn
∧Group(e1, . . . , en) �= ∅},D′ = {D′
i, i = 1 . . . n} ∪ {Dn+1} ∪ {R,Ctxt},D′
i = (C ′Di,�′
Di), C ′
Di= {Cij ∈ CDi |Ci �Di Cij},
�′Di
=�Di|C′Di
,
FD′ = {FD′i, i = 1 . . . n} ∪ {FDn+1} ∪ {FR′, FCtxt′},
FD′i = {(f ′, e′i)|∃(e1, . . . , en) ∈ C1 × . . .× Cn,
f ′ = Group(e1, . . . , en) ∈ F ′ ∧ ei = e′i},FDn+1 =
[(e1,...,en)∈C1×...×Cn
{(Group(e1, . . . , en),
g(Group(e1, . . . , en)))|Group(e1, . . . , en) �= ∅},FR′ = {(f ′, r′)|∃(e1, . . . , en) ∈ C1 × . . .× Cn
∧ f ′ = Group(e1, . . . , en) ∈ F ′
∧ r′ =X
(f,r)∈FR,f∈Group(e1,...,en)
r},
FCtxt′ = {(f ′, dr′)|∃(e1, . . . , en) ∈ C1 × . . .× Cn
∧ f ′ = Group(e1, . . . , en) ∈ F ′
∧ dr′ ∈[
(f,dr)∈FCtxt,f∈Group(e1,...,en)
{dr}},
Q′ = Q
Each fact in the resulting R-cube represents a group of factsof the original R-cube (those characterized by the same val-ues in the grouping category). The aggregation function isevaluated over each group of facts and the result is storedin the new dimension Dn+1. The dimensions Di, . . .Dn arerestricted to the ancestor categories of the correspondinggrouping category. The FCtxt fact-dimension relation nowrelates each new fact with the documents that were associ-ated to any of the original facts of the corresponding group.As discussed in [15], we estimate the relevance of the factsby the frequency of their dimension values in the relevantdocuments. Consequently, the relevance of each group isthe sum of the relevance values of the original facts in thegroup (see theorem (2) in Appendix B). We update the FRfact-dimension relation accordingly. Thus, the sum of therelevance values of the facts in the resulting R-cube remains
25
F ′ �Products Customers′.Region T ime′.Half year �Amount Total R Ctxt{f1} � Central America 1998/1st half � 4, 300, 000$ 0.05 d0.005
3 , d0.0057
{f2, f3} � Southeast Asia 1998/1st half � 4, 100, 000$ 0.3 d0.025 , d0.04
4{f4, f5} � Southeast Asia 1998/2nd half � 700, 000$ 0.65 d0.04
1 , d0.082 , d0.01
6
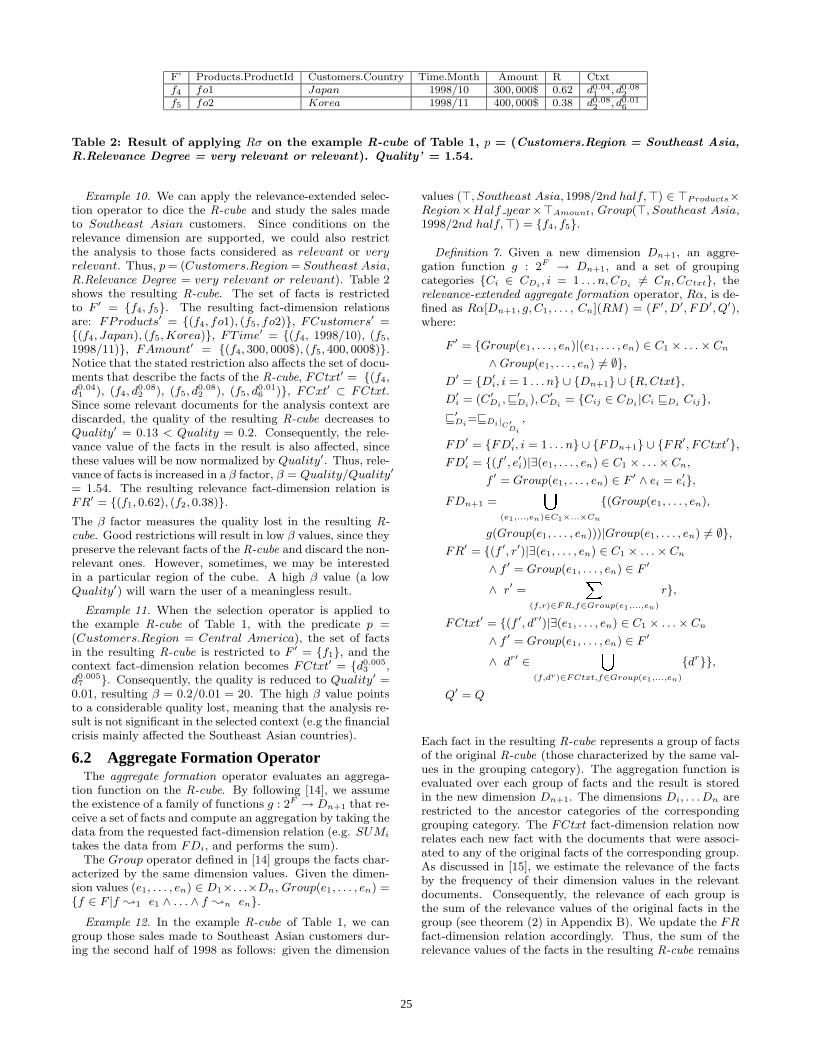
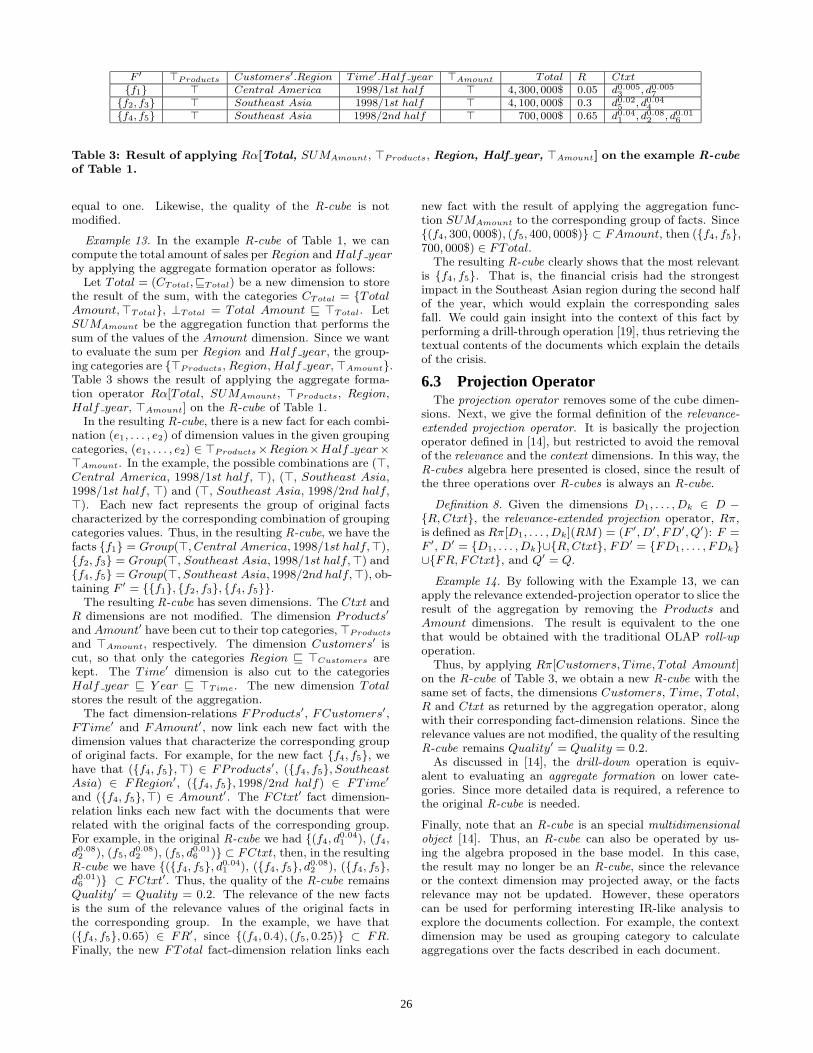
Table 3: Result of applying Rα[Total, SUMAmount, �Products, Region, Half year, �Amount] on the example R-cubeof Table 1.
equal to one. Likewise, the quality of the R-cube is notmodified.
Example 13. In the example R-cube of Table 1, we cancompute the total amount of sales per Region andHalf yearby applying the aggregate formation operator as follows:
Let Total = (CTotal,�Total) be a new dimension to storethe result of the sum, with the categories CTotal = {TotalAmount,�Total}, ⊥Total = Total Amount � �Total. LetSUMAmount be the aggregation function that performs thesum of the values of the Amount dimension. Since we wantto evaluate the sum per Region and Half year, the group-ing categories are {�Products, Region, Half year,�Amount}.Table 3 shows the result of applying the aggregate forma-tion operator Rα[Total, SUMAmount, �Products, Region,Half year, �Amount] on the R-cube of Table 1.
In the resulting R-cube, there is a new fact for each combi-nation (e1, . . . , e2) of dimension values in the given groupingcategories, (e1, . . . , e2) ∈ �Products ×Region×Half year×�Amount. In the example, the possible combinations are (�,Central America, 1998/1st half, �), (�, Southeast Asia,1998/1st half, �) and (�, Southeast Asia, 1998/2nd half,�). Each new fact represents the group of original factscharacterized by the corresponding combination of groupingcategories values. Thus, in the resulting R-cube, we have thefacts {f1} = Group(�, Central America, 1998/1st half,�),{f2, f3} = Group(�, Southeast Asia, 1998/1st half,�) and{f4, f5} = Group(�, Southeast Asia, 1998/2nd half,�), ob-taining F ′ = {{f1}, {f2, f3}, {f4, f5}}.
The resulting R-cube has seven dimensions. The Ctxt andR dimensions are not modified. The dimension Products′
andAmount′ have been cut to their top categories, �Products
and �Amount, respectively. The dimension Customers′ iscut, so that only the categories Region � �Customers arekept. The T ime′ dimension is also cut to the categoriesHalf year � Y ear � �Time. The new dimension Totalstores the result of the aggregation.
The fact dimension-relations FProducts′, FCustomers′,FTime′ and FAmount′, now link each new fact with thedimension values that characterize the corresponding groupof original facts. For example, for the new fact {f4, f5}, wehave that ({f4, f5},�) ∈ FProducts′, ({f4, f5}, SoutheastAsia) ∈ FRegion′, ({f4, f5}, 1998/2nd half) ∈ FTime′
and ({f4, f5},�) ∈ Amount′. The FCtxt′ fact dimension-relation links each new fact with the documents that wererelated with the original facts of the corresponding group.For example, in the original R-cube we had {(f4, d
0.041 ), (f4,
d0.082 ), (f5, d
0.082 ), (f5, d
0.016 )} ⊂ FCtxt, then, in the resulting
R-cube we have {({f4, f5}, d0.041 ), ({f4, f5}, d0.08
2 ), ({f4, f5},d0.016 )} ⊂ FCtxt′. Thus, the quality of the R-cube remainsQuality′ = Quality = 0.2. The relevance of the new factsis the sum of the relevance values of the original facts inthe corresponding group. In the example, we have that({f4, f5}, 0.65) ∈ FR′, since {(f4, 0.4), (f5, 0.25)} ⊂ FR.Finally, the new FTotal fact-dimension relation links each
new fact with the result of applying the aggregation func-tion SUMAmount to the corresponding group of facts. Since{(f4, 300, 000$), (f5, 400, 000$)} ⊂ FAmount, then ({f4, f5},700, 000$) ∈ FTotal.
The resulting R-cube clearly shows that the most relevantis {f4, f5}. That is, the financial crisis had the strongestimpact in the Southeast Asian region during the second halfof the year, which would explain the corresponding salesfall. We could gain insight into the context of this fact byperforming a drill-through operation [19], thus retrieving thetextual contents of the documents which explain the detailsof the crisis.
6.3 Projection OperatorThe projection operator removes some of the cube dimen-
sions. Next, we give the formal definition of the relevance-extended projection operator. It is basically the projectionoperator defined in [14], but restricted to avoid the removalof the relevance and the context dimensions. In this way, theR-cubes algebra here presented is closed, since the result ofthe three operations over R-cubes is always an R-cube.
Definition 8. Given the dimensions D1, . . . ,Dk ∈ D −{R,Ctxt}, the relevance-extended projection operator, Rπ,is defined as Rπ[D1, . . . ,Dk](RM) = (F ′, D′, FD′, Q′): F =F ′, D′ = {D1, . . . ,Dk}∪{R,Ctxt}, FD′ = {FD1, . . . , FDk}∪{FR, FCtxt}, and Q′ = Q.
Example 14. By following with the Example 13, we canapply the relevance extended-projection operator to slice theresult of the aggregation by removing the Products andAmount dimensions. The result is equivalent to the onethat would be obtained with the traditional OLAP roll-upoperation.
Thus, by applying Rπ[Customers, T ime, Total Amount]on the R-cube of Table 3, we obtain a new R-cube with thesame set of facts, the dimensions Customers, T ime, Total,R and Ctxt as returned by the aggregation operator, alongwith their corresponding fact-dimension relations. Since therelevance values are not modified, the quality of the resultingR-cube remains Quality′ = Quality = 0.2.
As discussed in [14], the drill-down operation is equiv-alent to evaluating an aggregate formation on lower cate-gories. Since more detailed data is required, a reference tothe original R-cube is needed.
Finally, note that an R-cube is an special multidimensionalobject [14]. Thus, an R-cube can also be operated by us-ing the algebra proposed in the base model. In this case,the result may no longer be an R-cube, since the relevanceor the context dimension may projected away, or the factsrelevance may not be updated. However, these operatorscan be used for performing interesting IR-like analysis toexplore the documents collection. For example, the contextdimension may be used as grouping category to calculateaggregations over the facts described in each document.
26
7. CONCLUSIONS AND FUTURE WORKIn this paper we have presented an architecture for the
construction of contextualized warehouses. A contextual-ized warehouse is a new decision support system that allowsusers to obtain strategic information by combining all theirsources of structured data and unstructured documents, andby analyzing the integrated data under different contexts.In a contextualized warehouse, the user specifies an analysiscontext by supplying a sequence of keywords (IR condition).The analysis is performed in an R-cube which is material-ized by retrieving the documents and facts related to theselected context. R-cubes, are characterized by two spe-cial system-maintained dimensions, namely: the relevanceand the context dimensions. Relevance is a numeric valuethat measures the importance of each fact in the establishedcontext of analysis. The context dimension relates each factwith the documents that explain its circumstances (i.e thecontext of the fact). We have extended an existing multi-dimensional data model for the R-cubes and studied howthe relevance and context dimensions should be addressedby the unary algebra operators.
In order to validate the usefulness and performance of ourapproach, a prototype system is currently being built. Inthis prototype a structured warehouse of historical financialdata is contextualized with the digital version of some popu-lar business journals. The goal is to analyze companies stockmarket values and determine the causes of the increases anddecreases of their stock prices. We base the implementa-tion of the prototype on a commercial multi-dimensionaldatabase. The relevance and the context dimensions aresupported by two special measures whose implicit aggrega-tion functions are the sum and the union, respectively.
In future work, the R-cubes algebra should be completedwith binary operators. For this purpose, data fusion mech-anisms [4] can be applied to combine the relevance of theinvolved facts. The R-cubes base model supports incom-pleteness and imprecision [14]. We plan to exploit theseproperties in the future to analyze the facts described in thedocuments which are not available in the corporate ware-house. Another possible extension of the present work is toreflect the hierarchical structure of the XML documents inthe context dimension of the R-cubes, so that users will beable to navigate on the structure of the XML documentsin the OLAP operations. Pre-aggregation strategies for R-cubes also remain to be studied.
8. ACKNOWLEDGEMENTSThis work was started during a stay performed by the
first author at the Database and Programming Technologiesresearch group at the Department of Computer Science atAalborg University.
This project has been partially funded by the SpanishNational Research Project TIC2002-04586-C04-03 and theFundacion Bancaixa Castello.
9. REFERENCES[1] R. A. Baeza-Yates and B. A. Ribeiro-Neto. Modern
Information Retrieval. ACM Press / Addison-Wesley, 1999.
[2] K. Beyer, D. Chamberlin, L. S. Colby, F. Ozcan,H. Pirahesh, and Y. Xu. Extending XQuery for analytics.In Proc. of SIGMOD, pages 503–514, 2005.
[3] E. F. Codd. Providing OLAP to user-analysts: An ITmandate, 1993.
[4] W. B. Croft. Combining approaches to informationretrieval. In Advances in Information Retrieval, pages1–36. Kluwer, 2000.
[5] R. Danger, R. Berlanga, and J. Ruiz-Shulcloper. CRISOL:An Approach for Automatically Populating Semantic Webfrom Unstructured Text Collections. In Proc. of DEXA,pages 243–252, 2004.
[6] R. Grishman. Information Extraction: Techniques andChallenges. In Proc. of SCIE, pages 10–27, 1997.
[7] W. H. Inmon. Building the Data Warehouse. John Wiley &Sons, 1996.
[8] R. Kimball. The Data Warehouse Toolkit. John Wiley &Sons, 2002.
[9] V. Lavrenko and W. B. Croft. Relevance-Based LanguageModels. In Proc. of SIGIR, pages 120–127, 2001.
[10] D. M. Llido, R. Berlanga, and M. J. Aramburu. ExtractingTemporal References to Assign Document Event-TimePeriods. In Proc. of DEXA, pages 62–71, 2001.
[11] B. R. Moole. A Probabilistic Multidimensional Data Modeland Algebra for OLAP in Decision Support Systems. InProc. of IEEE SoutheastCon, 2003.
[12] B.-K. Park, H. Han, and I.-Y. Song. XML-OLAP: AMultidimensional Analysis Framework for XMLWarehouses. In Proc. of DaWaK, 2005.
[13] D. Pedersen, K. Riis, and T. B. Pedersen. XML-ExtendedOLAP Querying. In Proc. of SSDBM, pages 195–206, 2002.
[14] T. B. Pedersen, C. S. Jensen, and C. E. Dyreson. Afoundation for capturing and querying complexmultidimensional data. Inf. Syst., 26(5):383–423, 2001.
[15] J. M. Perez, R. Berlanga, and M. J. Aramburu. ADocument Model Based on Relevance Modeling Techniquesfor Semi-structured Information. In Proc. of DEXA, pages318–327, 2004.
[16] J. M. Perez, T. B. Pedersen, R. Berlanga, and M. J.Aramburu. IR and OLAP in XML Document Warehouses.In Proc. of ECIR, pages 536 – 539, 2005.
[17] J. M. Ponte and W. B. Croft. A language modelingapproach to information retrieval. In Research andDevelopment in Information Retrieval, pages 275–281,1998.
[18] G. Salton, A. Wong, and C. S. Yang. A vector space modelfor automatic indexing. Commun. ACM, 18(11):613–620,1975.
[19] G. Spofford. MDX Solutions with Microsft SQL ServerAnalysis Services. John Wiley & Sons, 2001.
[20] W3C. Extensible Markup Language (XML) 1.0.http://www.w3.org/TR/REC-xml, February 2004.
[21] L. Xyleme. A dynamic warehouse for XML data of theWeb. IEEE Data Engineering Bulleting, 24(2):40 – 47,2001.
APPENDIX
A. FACT RELEVANCE CALCULUSThis appendix summarizes the approach proposed in [15]
to calculate the relevance of a fact to an IR condition. Givenan IR condition Q = q1q2 . . . qn, where each qi is a querykeyword, we estimate the relevance of a fact f by calculatingthe probability of observing this fact in the set of documentsRQ relevant to Q:
P (f |RQ) =
Pd∈RQ P (f |d)P (Q|d)P
d′∈RQ P (Q|d′) (1)
In formula (1), P (f |d) is the probability of finding thefact f in a relevant document d ∈ RQ. This probabilityis estimated by formula (2). P (Q|d) is the probability ofobserving the query keywords in this document. By follow-
27
ing [9], we assume that the query keywords qi are indepen-dent and use formulas (3) and (4) for estimating P (Q|d).
P (f |d) = FF (f, d)/|d|f (2)
P (Q|d) =Y
qi∈Q
P (qi|d) (3)
P (qi|d) = λTF (qi, d)
|d|t + (1 − λ)ctfqi
coll sizet(4)
In formula (2), FF (f, d) returns the frequency of the fact fdimension values in the document d. That is, the numberof times that the fact f dimension values occur in the docu-ment d. |d|f is the total number of dimension values foundin the document d. Finally, in formula (4), TF (qi, d) returnsthe frequency of the query keywords qi in the document d(the number of occurrences of qi in d), |d|t is the total num-ber of words in the document d, ctfqi is the number of timesthat qi occurs in all the documents of the warehouse, andcoll sizet is the total number of words in all the documentsof the warehouse. The λ factor is called the smoothing pa-rameter [9], since it avoids probabilities equal to zero whena document does not contain all the query keywords.
Intuitively, the denominator of formula (1) measures howgood the set of relevant documents RQ is, since it computesthe sum of the probabilities of observing the query keywordsin each document of RQ. We propose formula (5) as a mea-sure of the quality of an R-cube:
Quality =X
d∈RQ
P (Q|d) (5)
B. THEOREMS AND PROOFSThis appendix presents the theorems referenced along the
paper.
Theorem 1. Let F = {f} be a set of facts and RQ theset of documents which describe these facts. Let F ′ ⊆ F ,and RQ′ ⊆ RQ the documents which describe the facts inF ′. The relevance P (f |RQ′) of the facts f ∈ F ′ can becalculated as follows:
P (f |RQ′) = P (f |RQ)β, β =
Pd∈RQ P (Q|d)Pd∈RQ′ P (Q|d) ≥ 1
Proof. Let f ∈ F ′, as discussed in Appendix A we esti-mate its relevance P (f |RQ′) by:
P (f |RQ′) =
Pd∈RQ′ P (f |d)P (Q|d)P
d′∈RQ′ P (Q|d′)Since the documents d ∈ RQ − RQ′ do not describe any
fact of F ′, the probability of observing a fact f ∈ F ′ in anode d ∈ RQ−RQ′ is P (f |d) = 0. Thus, we can write:
P (f |RQ′) =
Pd∈RQ P (f |d)P (Q|d)P
d′∈RQ′ P (Q|d′)The relevance P (Q|d) of the documents d ∈ RQ ⊇ RQ′ do
not change since the IR condition Q is mantained. In this
way, β =P
d∈RQ P (Q|d)P
d∈RQ′ P (Q|d)≥ 1 (notice that |RQ| ≥ |RQ′|).
Finally, the previous formula can be expressed as:
P (f |RQ′) =
Pd∈RQ P (f |d)P (Q|d)P
d′∈RQ P (Q|d)
Pd′∈RQ P (Q|d)Pd′∈RQ′ P (Q|d)
= P (f |RQ)β
Theorem 2. Let {Ci ∈ CDi , i = 1 . . . n} be a set of group-ing categories, and let Group(e1, . . . , en) be the group offacts of the cube characterized by the category values (e1, . . . ,en) ∈ C1 × . . . × Cn. The relevance value of the groupP (Group(e1, . . . , en)|RQ) is determined by the following for-mula:
P (Group(e1, . . . , en)|RQ) =X
fi∈Group(e1,...,en)
P (fi|RQ)
Proof. Consider the fact f characterized by the dimen-sion values (e1, . . . , e2). By applying the formula (2), theprobability P (f |d) of finding the fact f in the document dcan be estimated as follows:
P (f |d) =FF (f, d)
|d|f =X
fi∈Group(e1,...,en)
FF (fi, d)
|d|f
=X
fi∈Group(e1,...,en)
P (fi|d)
That is, P (f |d) can be calculated by adding the dimensionvalues frequency of each fact of Group(e1, . . . , en) in thedocument d. Notice that ∀fi ∈ Group(e1, . . . , en), fi ❀1
e1 ∧ . . . ∧ fi ❀n en.Finally, with the previous result, the fact relevance calcu-
lus formula (1) can be expressed as:
P (f |RQ) =
Pd∈RQ P (f |d)P (Q|d)P
d′∈RQ P (Q|d′)
=X
d∈RQ
�Pfi∈Group(e1,...,en) P (fi|d)
�P (Q|d)P
d′∈RQ P (Q|d′)
=X
fi∈Group(e1,...,en)
Pd∈RQ P (fi|d)P (Q|d)P
d′∈RQ P (Q|d′)
!
=X
fi∈Group(e1,...,en)
P (fi|RQ)
28