A REGION ON THE MOVE - ReliefWeb
43
2020 Mobility Overview in the East and Horn of Africa and the Arabian Peninsula IOM Regional Office for the East and Horn of Africa A REGION ON THE MOVE
-
Upload
khangminh22 -
Category
Documents
-
view
3 -
download
0
Transcript of A REGION ON THE MOVE - ReliefWeb
2020 Mobility Overview in the East and Horn of Africa and the Arabian Peninsula
IOM Regional Office for the East and Horn of Africa
A REGION ON THE MOVE

List of Abbreviations � � � � � � � � � � � � � � � � � � � � � � � � � � � � � � � � � � � � � � � � � � � � � � � � � � � � � � � � � � � � � � � � � � � � � � iii
List of Figures � � � � � � � � � � � � � � � � � � � � � � � � � � � � � � � � � � � � � � � � � � � � � � � � � � � � � � � � � � � � � � � � � � � � � � � � � � � � iv
I� HIGHLIGHTS � � � � � � � � � � � � � � � � � � � � � � � � � � � � � � � � � � � � � � � � � � � � � � � � � � � � � � � � � � � � � � � � � � � � � � � 1
II� INTRODUCTION � � � � � � � � � � � � � � � � � � � � � � � � � � � � � � � � � � � � � � � � � � � � � � � � � � � � � � � � � � � � � � � � � � 5
III� HOW HAS COVID-19 IMPACTED THE EAST AND HORN OF AFRICA REGION? � � � � � � � � �11
IV� FORCED DISPLACEMENT � � � � � � � � � � � � � � � � � � � � � � � � � � � � � � � � � � � � � � � � � � � � � � � � � � � � � � � � � � �17
OVERVIEW � � � � � � � � � � � � � � � � � � � � � � � � � � � � � � � � � � � � � � � � � � � � � � � � � � � � � � � � � � � � � � � � � � � � � � � � � � � � � � � � � � � � � � � � � � � � � � � � � 17
THE ADVERSE EFFECTS OF RECURRENT CLIMATE SHOCKS IN BURUNDI � � � � � � � � � � � � � � � � � � � � � � � � � � � � � � � � � � � � 19
A NEW COMPLEX HUMANITARIAN CRISIS IN ETHIOPIA � � � � � � � � � � � � � � � � � � � � � � � � � � � � � � � � � � � � � � � � � � � � � � � � � � � � 21
THE CHALLENGED PURSUIT OF DURABLE SOLUTIONS IN SOMALIA � � � � � � � � � � � � � � � � � � � � � � � � � � � � � � � � � � � � � � � � 23
SOUTH SUDAN: BETWEEN CONFLICT AND FAMINE � � � � � � � � � � � � � � � � � � � � � � � � � � � � � � � � � � � � � � � � � � � � � � � � � � � � � � � 25
V� REGIONAL MIXED MIGRATION TRENDS � � � � � � � � � � � � � � � � � � � � � � � � � � � � � � � � � � � � � � � � � � � � �29
OVERVIEW � � � � � � � � � � � � � � � � � � � � � � � � � � � � � � � � � � � � � � � � � � � � � � � � � � � � � � � � � � � � � � � � � � � � � � � � � � � � � � � � � � � � � � � � � � � � � � � � � 29
MIGRATION ROUTES NETWORK � � � � � � � � � � � � � � � � � � � � � � � � � � � � � � � � � � � � � � � � � � � � � � � � � � � � � � � � � � � � � � � � � � � � � � � � � � � 30
Stranded Migrant Populations � � � � � � � � � � � � � � � � � � � � � � � � � � � � � � � � � � � � � � � � � � � � � � � � � � � � � � � � � � � � 35
EASTERN ROUTE � � � � � � � � � � � � � � � � � � � � � � � � � � � � � � � � � � � � � � � � � � � � � � � � � � � � � � � � � � � � � � � � � � � � � � � � � � � � � � � � � � � � � � � � � � � 36
Migration Trends from the Horn of Africa to Yemen and the Arabian Peninsula � � � � � � � � � � � � � � � � � � � � � � 36
Migration Profiles - Yemen Arrivals � � � � � � � � � � � � � � � � � � � � � � � � � � � � � � � � � � � � � � � � � � � � � � � � � � � � � � � � � 38
Return Migration Dynamics from the Horn of Africa to Yemen and the Arabian Peninsula � � � � � � � � � � � � � 39
Increased Challenges During Migration: Spontaneous Returns to the Horn of Africa � � � � � � � � � � � � � � � � � � 41
Returns from the Kingdom of Saudi Arabia � � � � � � � � � � � � � � � � � � � � � � � � � � � � � � � � � � � � � � � � � � � � � � � � � � 42
Humanitarian Evacuations from Yemen � � � � � � � � � � � � � � � � � � � � � � � � � � � � � � � � � � � � � � � � � � � � � � � � � � � � � 44
Missing Migrant Project � � � � � � � � � � � � � � � � � � � � � � � � � � � � � � � � � � � � � � � � � � � � � � � � � � � � � � � � � � � � � � � � � 44
Box: Female Migration on the Eastern Route � � � � � � � � � � � � � � � � � � � � � � � � � � � � � � � � � � � � � � � � � � � � � � � � 45
NORTHERN ROUTE � � � � � � � � � � � � � � � � � � � � � � � � � � � � � � � � � � � � � � � � � � � � � � � � � � � � � � � � � � � � � � � � � � � � � � � � � � � � � � � � � � � � � � � � 47
Migrants from the East and Horn of Africa in Europe � � � � � � � � � � � � � � � � � � � � � � � � � � � � � � � � � � � � � � � � � � 47
SOUTHERN ROUTE � � � � � � � � � � � � � � � � � � � � � � � � � � � � � � � � � � � � � � � � � � � � � � � � � � � � � � � � � � � � � � � � � � � � � � � � � � � � � � � � � � � � � � � � 51
MIGRANT PROFILES � � � � � � � � � � � � � � � � � � � � � � � � � � � � � � � � � � � � � � � � � � � � � � � � � � � � � � � � � � � � � � � � � � � � � � � � � � � � � � � � � � � � � � � � 53
Nationalities � � � � � � � � � � � � � � � � � � � � � � � � � � � � � � � � � � � � � � � � � � � � � � � � � � � � � � � � � � � � � � � � � � � � � � � � � � 53
Sex and Age � � � � � � � � � � � � � � � � � � � � � � � � � � � � � � � � � � � � � � � � � � � � � � � � � � � � � � � � � � � � � � � � � � � � � � � � � � 53
Vulnerabilities � � � � � � � � � � � � � � � � � � � � � � � � � � � � � � � � � � � � � � � � � � � � � � � � � � � � � � � � � � � � � � � � � � � � � � � � � 54
Box: A Study on Child Migrants from Ethiopia � � � � � � � � � � � � � � � � � � � � � � � � � � � � � � � � � � � � � � � � � � � � � � � � 55
Education and Employment � � � � � � � � � � � � � � � � � � � � � � � � � � � � � � � � � � � � � � � � � � � � � � � � � � � � � � � � � � � � � � 56
Previous Displacement and Migration Attempts � � � � � � � � � � � � � � � � � � � � � � � � � � � � � � � � � � � � � � � � � � � � � � 57
Difficulties Faced � � � � � � � � � � � � � � � � � � � � � � � � � � � � � � � � � � � � � � � � � � � � � � � � � � � � � � � � � � � � � � � � � � � � � � 58
Reasons for Migration � � � � � � � � � � � � � � � � � � � � � � � � � � � � � � � � � � � � � � � � � � � � � � � � � � � � � � � � � � � � � � � � � � 58
MIGRATION RESPONSE CENTRES � � � � � � � � � � � � � � � � � � � � � � � � � � � � � � � � � � � � � � � � � � � � � � � � � � � � � � � � � � � � � � � � � � � � � � � � � � � 60
VI� 2021 MIGRATION OUTLOOK � � � � � � � � � � � � � � � � � � � � � � � � � � � � � � � � � � � � � � � � � � � � � � � � � � � � � � �61
Methodology � � � � � � � � � � � � � � � � � � � � � � � � � � � � � � � � � � � � � � � � � � � � � � � � � � � � � � � � � � � � � � � � � � � � � � � � � � � �63
References � � � � � � � � � � � � � � � � � � � � � � � � � � � � � � � � � � � � � � � � � � � � � � � � � � � � � � � � � � � � � � � � � � � � � � � � � � � � � �67
Annexes � � � � � � � � � � � � � � � � � � � � � � � � � � � � � � � � � � � � � � � � � � � � � � � � � � � � � � � � � � � � � � � � � � � � � � � � � � � � � � � �72
The opinions expressed in the report are those of the authors, and do not necessarily reflect the views of the International Organization for Migration (IOM). The designations employed, and the presentation of material throughout the report do not imply the expression of any opinion whatsoever on the part of IOM concerning the legal status of any country, territory, city or area, or of its authorities, or concerning its frontiers or boundaries.
IOM is committed to the principle that humane and orderly migration benefits migrants and society. As an intergovernmental organization, IOM acts with its partners in the international community to assist in meeting the operational challenges of migration, advance understanding of migration issues, encourage social and economic development through migration, and uphold the human dignity and well-being of migrants.
This publication was made possible through support provided by the European Union. The opinions expressed herein are those of the author and do not necessarily reflect the views of the European Union.
Publisher: International Organization for Migration Regional Data Hub for the East and Horn of Africa Sri Aurobindo Avenue off Mzima Spring Road, Lavington P.O. Box 55040-00200 Nairobi Kenya Tel.: +254 020 422 1000 Email: rdhronairobi@iom�int; dtmronairobi@iom�int Website: ronairobi�iom�int/regional-data-hub-rdh
© 2021 International Organization for Migration (IOM)
All rights reserved. Licensed to the European Union under conditions.
Permission is required to reproduce any part of this publication. Permission to be freely granted to educational or non-profit organizations.
Cover photo: Migrants are walking in the desert from Alat Ela to Fantahero. Photo: © IOM / Alexander Bee
TABLE OF CONTENTS
AfCFTA: African Continental Free Trade AreaAFDB: African Development BankASR: Assisted Spontaneous ReturnAVR: Assisted Voluntary ReturnAU: African UnionBTI: Bertelsmann Transformation IndexCOVID-19: Coronavirus Disease 2019COVAX: COVID-19 Vaccines Global AccessDRC: Danish Refugee CouncilDSI: Durable Solutions Initiative (Somalia)DTM: Displacement Tracking MatrixDWG: Drought Working Group (Ethiopia)EAC: East Africa CommunityEHoA: East and Horn of AfricaEU: European UnionEVD: Ebola Virus DiseaseFAO: Food and Agriculture Organization – UN FEWS NET: Famine Early Warning Systems NetworkFM: Flow MonitoringFMP: Flow Monitoring PointFMR: Flow Monitoring RegistryFMS: Flow Monitoring SurveyFSNAU: Food Security and Nutrition Analysis UnitFSNMS: Food Security and Nutrition Monitoring SystemGDP: Gross Domestic ProductGPAA: Greater Pibor Administrative Area (South Sudan)HoA: Horn of AfricaIASC: Inter-Agency Standing CommitteeIATA: International Air Transport AssociationICCG: Inter-Cluster Coordination GroupIDMC: Internal Displacement Monitoring CentreIDP: Internally Displaced PersonIPC: Integrated Food Security Phase ClassificationIOM: International Organization for Migration – UNMENA: Middle East and North AfricaMMC: Mixed Migration CentreMMP: Missing Migrants Project
MRC: Migration Response CentreMSF: Médecins Sans FrontièresMT: Mobility TrackingNDRMC: National Disaster Risk Management Commission (Ethiopia)NFI: Non-Food ItemOCHA: Office for the Coordination of Humanitarian Affairs – UNOHCHR: Office of the United Nations High Commissioner for Human Rights – UN PoC: Protection of CiviliansPoC: Point of ControlPoE: Point of EntryPME: Participatory Mapping ExercisePMM: Population Mobility MappingR-ARCSS: Revitalization Agreement of the Resolution of the Conflict in the Republic of South SudanRDH: Regional Data HubRMMS: Regional Mixed Migration SecretariatSNNP: Southern Nations, Nationalities, and Peoples (Ethiopia)TGoNU: Transitional Government of National Unity (South Sudan)UMC: Unaccompanied Migrant ChildrenUN: United NationsUNDESA: United Nations Department of Economic and Social AffairsUNDP: United Nations Development ProgrammeUNHCR: United Nations High Commission for RefugeesUNICEF: United Nations Children’s FundUNMISS: United Nations Mission in South SudanUSD: United States DollarVHR: Voluntary Humanitarian ReturnWASH: Water, Sanitation and HygieneWFP: World Food Programme – UN WHO: World Health Organization
Figure 1: Incidence trend of confirmed COVID-19 cases in the EHoA (31 December 2020) . . . . . . . . 11
Figure 2: Operational status of PoEs (April - December 2020) . . . . . . . . . . . . . . . . . . . . . . . . . . . . . . . . . . 12
Figure 3: Status of PoEs in the EHoA region (31 December 2020) . . . . . . . . . . . . . . . . . . . . . . . . . . . . . . 13
Figure 4: COVID-19 awareness over time . . . . . . . . . . . . . . . . . . . . . . . . . . . . . . . . . . . . . . . . . . . . . . . . . . . 14
Figure 5: Overview of IDPs, refugees and asylum-seekers in the EHoA (December 2020) . . . . . . . . . . 18
Figure 6: Burundi’s returns, refugee and IDP presence by commune (December 2020) . . . . . . . . . . . . . 20
Figure 7: IDP presence in Ethiopia by woreda (December 2020) . . . . . . . . . . . . . . . . . . . . . . . . . . . . . . . . 22
Figure 8: Somalia’s food insecurity and IDP presence by region (December 2020) . . . . . . . . . . . . . . . . . 24
Figure 9: IDP presence in South Sudan by county (December 2020) . . . . . . . . . . . . . . . . . . . . . . . . . . . . 27
Figure 10: Returnee presence in South Sudan by county (December 2020) . . . . . . . . . . . . . . . . . . . . . . 28
Figure 11: FM networks tracked in the EHoA (December 2020) . . . . . . . . . . . . . . . . . . . . . . . . . . . . . . . . 29
Figure 12: Main migration routes in the EHoA (December 2020) . . . . . . . . . . . . . . . . . . . . . . . . . . . . . . . 31
Figure 13: Movements tracked along the four routes in 2019 and 2020 . . . . . . . . . . . . . . . . . . . . . . . . . . 31
Figure 14: Main areas of departure in 2020 . . . . . . . . . . . . . . . . . . . . . . . . . . . . . . . . . . . . . . . . . . . . . . . . . . 33
Figure 15: Main areas of intended destination in 2020 . . . . . . . . . . . . . . . . . . . . . . . . . . . . . . . . . . . . . . . . . 34
Figure 16: Entries into Yemen from the HoA in 2019 and 2020 . . . . . . . . . . . . . . . . . . . . . . . . . . . . . . . . . 36
Figure 17: Yemen arrivals from the HoA in 2020 . . . . . . . . . . . . . . . . . . . . . . . . . . . . . . . . . . . . . . . . . . . . . 38
Figure 18: Impact of COVID-19 on migration trends and routes in 2020 . . . . . . . . . . . . . . . . . . . . . . . . . 40
Figure 19: Spontaneous returns from Yemen in 2020 . . . . . . . . . . . . . . . . . . . . . . . . . . . . . . . . . . . . . . . . . . 41
Figure 20: Returns from Saudi Arabia by areas of departure and of intended destinations in 2020 . . . 42
Figure 21: Returns from Saudi Arabia to Ethiopia and Yemen in 2019 and 2020 . . . . . . . . . . . . . . . . . . . 43
Figure 22: Top six reasons for migration . . . . . . . . . . . . . . . . . . . . . . . . . . . . . . . . . . . . . . . . . . . . . . . . . . . . . 48
Figure 23: First-instance asylum applications lodged by EHoA migrants in Europe in 2020 . . . . . . . . . . 49
Figure 24: History of migration by sex and route in 2020 . . . . . . . . . . . . . . . . . . . . . . . . . . . . . . . . . . . . . . 57
Figure 25: History of displacement by sex and route in 2020 . . . . . . . . . . . . . . . . . . . . . . . . . . . . . . . . . . . 57
Figure 26: Migrant registrations by sex and MRC in 2020 . . . . . . . . . . . . . . . . . . . . . . . . . . . . . . . . . . . . . . 60
Figure 27: MRC registrations in 2019 and 2020 . . . . . . . . . . . . . . . . . . . . . . . . . . . . . . . . . . . . . . . . . . . . . . . 60
iii 2020 MOBILITY OVERVIEW IN THE EAST AND HORN OF AFRICA AND THE ARABIAN PENINSULA iv2020 MOBILITY OVERVIEW IN THE EAST AND HORN OF AFRICA AND THE ARABIAN PENINSULA
LIST OF ABBREVIATIONS LIST OF FIGURES
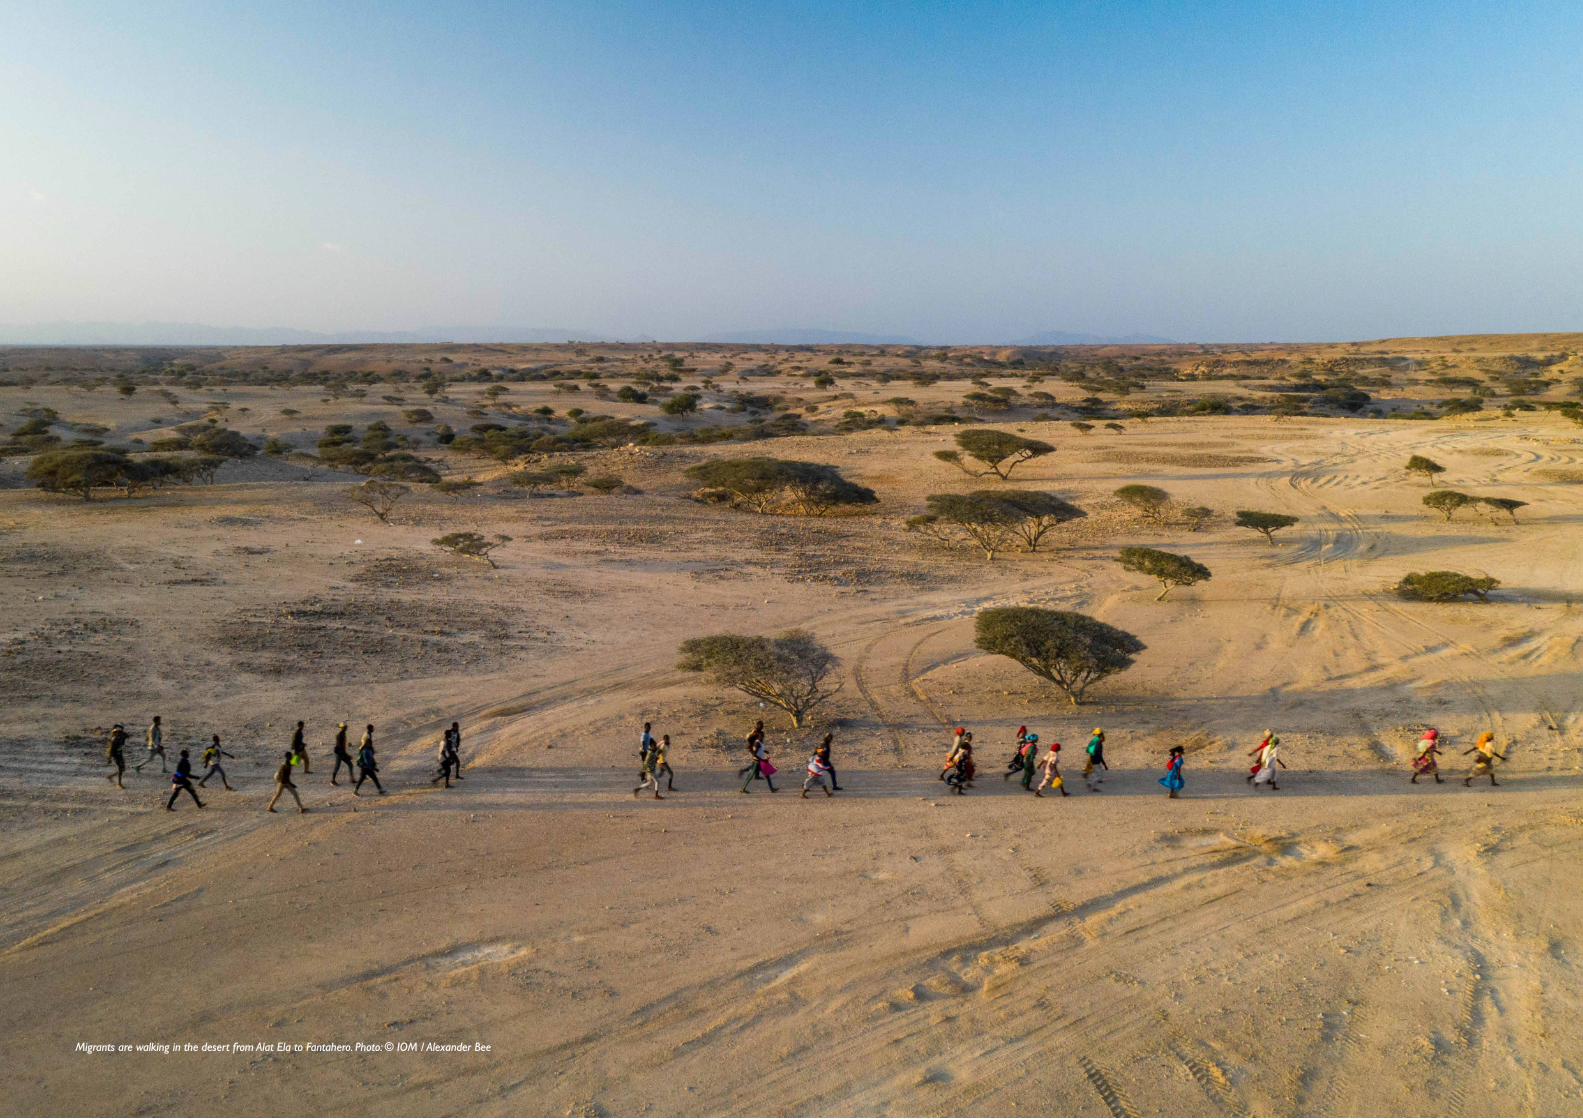
Migrants are walking in the desert from Alat Ela to Fantahero. Photo: © IOM / Alexander Bee
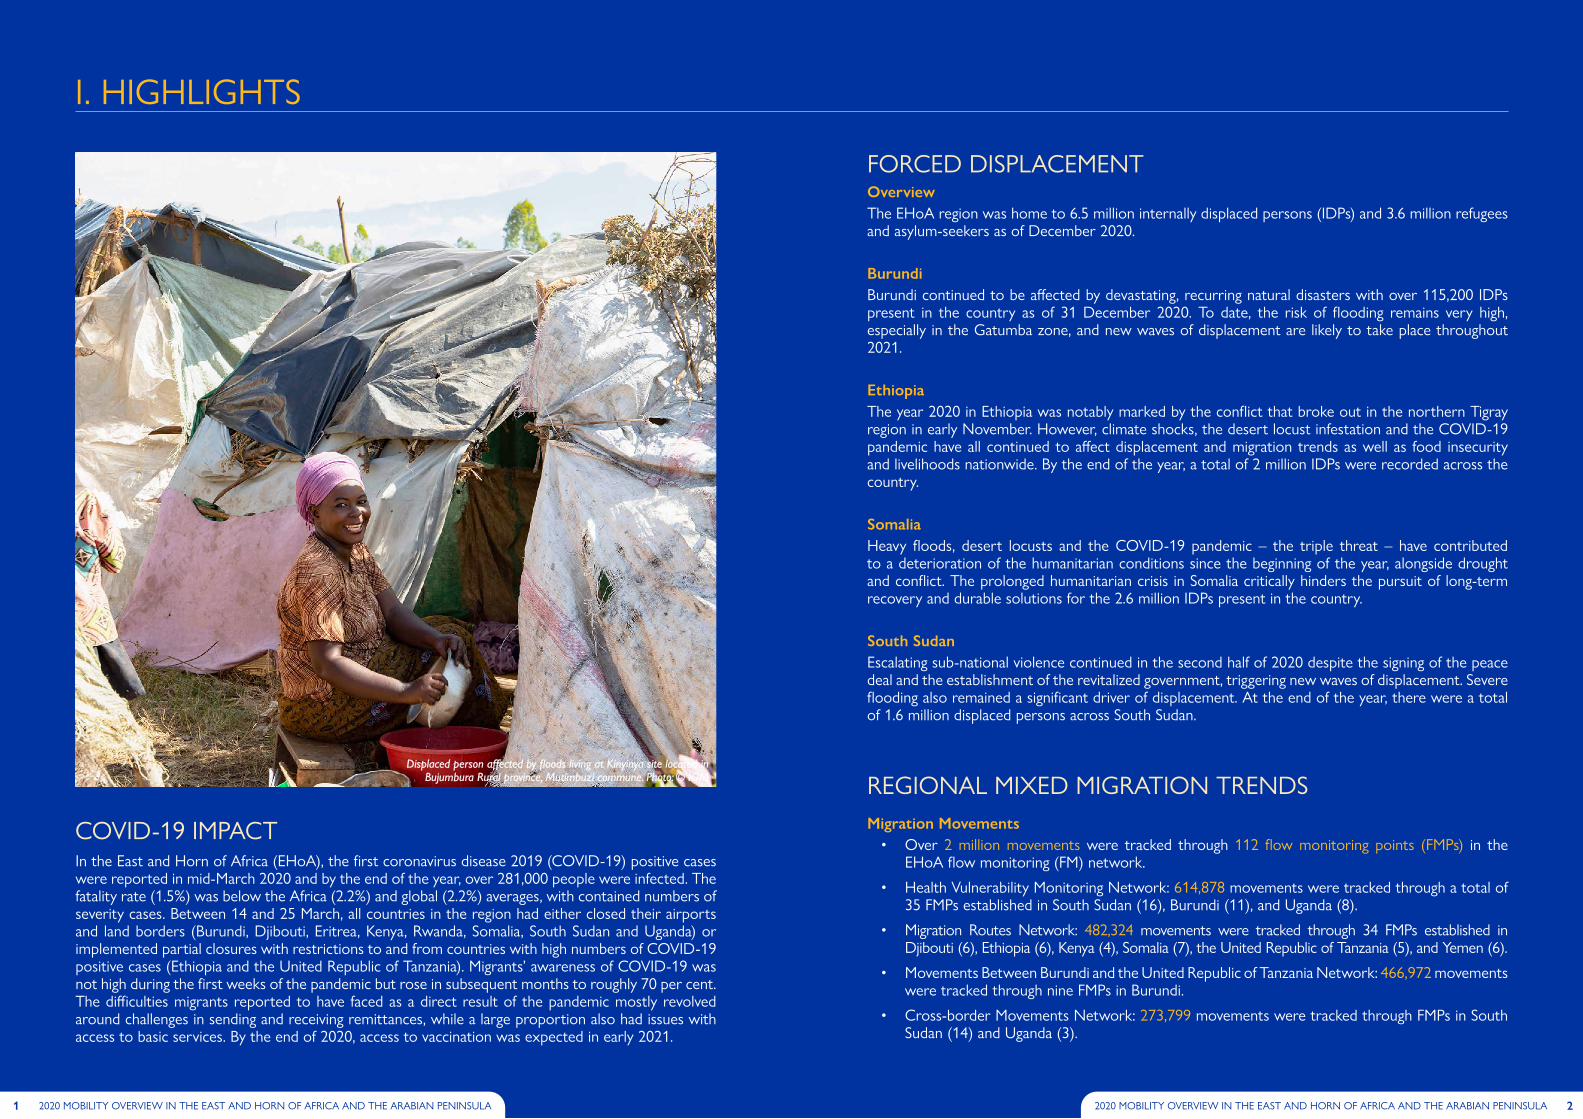
OverviewThe EHoA region was home to 6�5 million internally displaced persons (IDPs) and 3�6 million refugees and asylum-seekers as of December 2020�
BurundiBurundi continued to be affected by devastating, recurring natural disasters with over 115,200 IDPs present in the country as of 31 December 2020� To date, the risk of flooding remains very high, especially in the Gatumba zone, and new waves of displacement are likely to take place throughout 2021�
EthiopiaThe year 2020 in Ethiopia was notably marked by the conflict that broke out in the northern Tigray region in early November� However, climate shocks, the desert locust infestation and the COVID-19 pandemic have all continued to affect displacement and migration trends as well as food insecurity and livelihoods nationwide� By the end of the year, a total of 2 million IDPs were recorded across the country�
SomaliaHeavy floods, desert locusts and the COVID-19 pandemic – the triple threat – have contributed to a deterioration of the humanitarian conditions since the beginning of the year, alongside drought and conflict� The prolonged humanitarian crisis in Somalia critically hinders the pursuit of long-term recovery and durable solutions for the 2�6 million IDPs present in the country�
South SudanEscalating sub-national violence continued in the second half of 2020 despite the signing of the peace deal and the establishment of the revitalized government, triggering new waves of displacement� Severe flooding also remained a significant driver of displacement� At the end of the year, there were a total of 1�6 million displaced persons across South Sudan�
In the East and Horn of Africa (EHoA), the first coronavirus disease 2019 (COVID-19) positive cases were reported in mid-March 2020 and by the end of the year, over 281,000 people were infected� The fatality rate (1�5%) was below the Africa (2�2%) and global (2�2%) averages, with contained numbers of severity cases� Between 14 and 25 March, all countries in the region had either closed their airports and land borders (Burundi, Djibouti, Eritrea, Kenya, Rwanda, Somalia, South Sudan and Uganda) or implemented partial closures with restrictions to and from countries with high numbers of COVID-19 positive cases (Ethiopia and the United Republic of Tanzania)� Migrants’ awareness of COVID-19 was not high during the first weeks of the pandemic but rose in subsequent months to roughly 70 per cent� The difficulties migrants reported to have faced as a direct result of the pandemic mostly revolved around challenges in sending and receiving remittances, while a large proportion also had issues with access to basic services� By the end of 2020, access to vaccination was expected in early 2021�
Migration Movements • Over 2 million movements were tracked through 112 flow monitoring points (FMPs) in the
EHoA flow monitoring (FM) network�
• Health Vulnerability Monitoring Network: 614,878 movements were tracked through a total of 35 FMPs established in South Sudan (16), Burundi (11), and Uganda (8)�
• Migration Routes Network: 482,324 movements were tracked through 34 FMPs established in Djibouti (6), Ethiopia (6), Kenya (4), Somalia (7), the United Republic of Tanzania (5), and Yemen (6)�
• Movements Between Burundi and the United Republic of Tanzania Network: 466,972 movements were tracked through nine FMPs in Burundi�
• Cross-border Movements Network: 273,799 movements were tracked through FMPs in South Sudan (14) and Uganda (3)�
REGIONAL MIXED MIGRATION TRENDS
FORCED DISPLACEMENT
I� HIGHLIGHTS
COVID-19 IMPACT
Displaced person affected by floods living at Kinyinya site located in Bujumbura Rural province, Mutimbuzi commune. Photo: © IOM
1 2020 MOBILITY OVERVIEW IN THE EAST AND HORN OF AFRICA AND THE ARABIAN PENINSULA 22020 MOBILITY OVERVIEW IN THE EAST AND HORN OF AFRICA AND THE ARABIAN PENINSULA
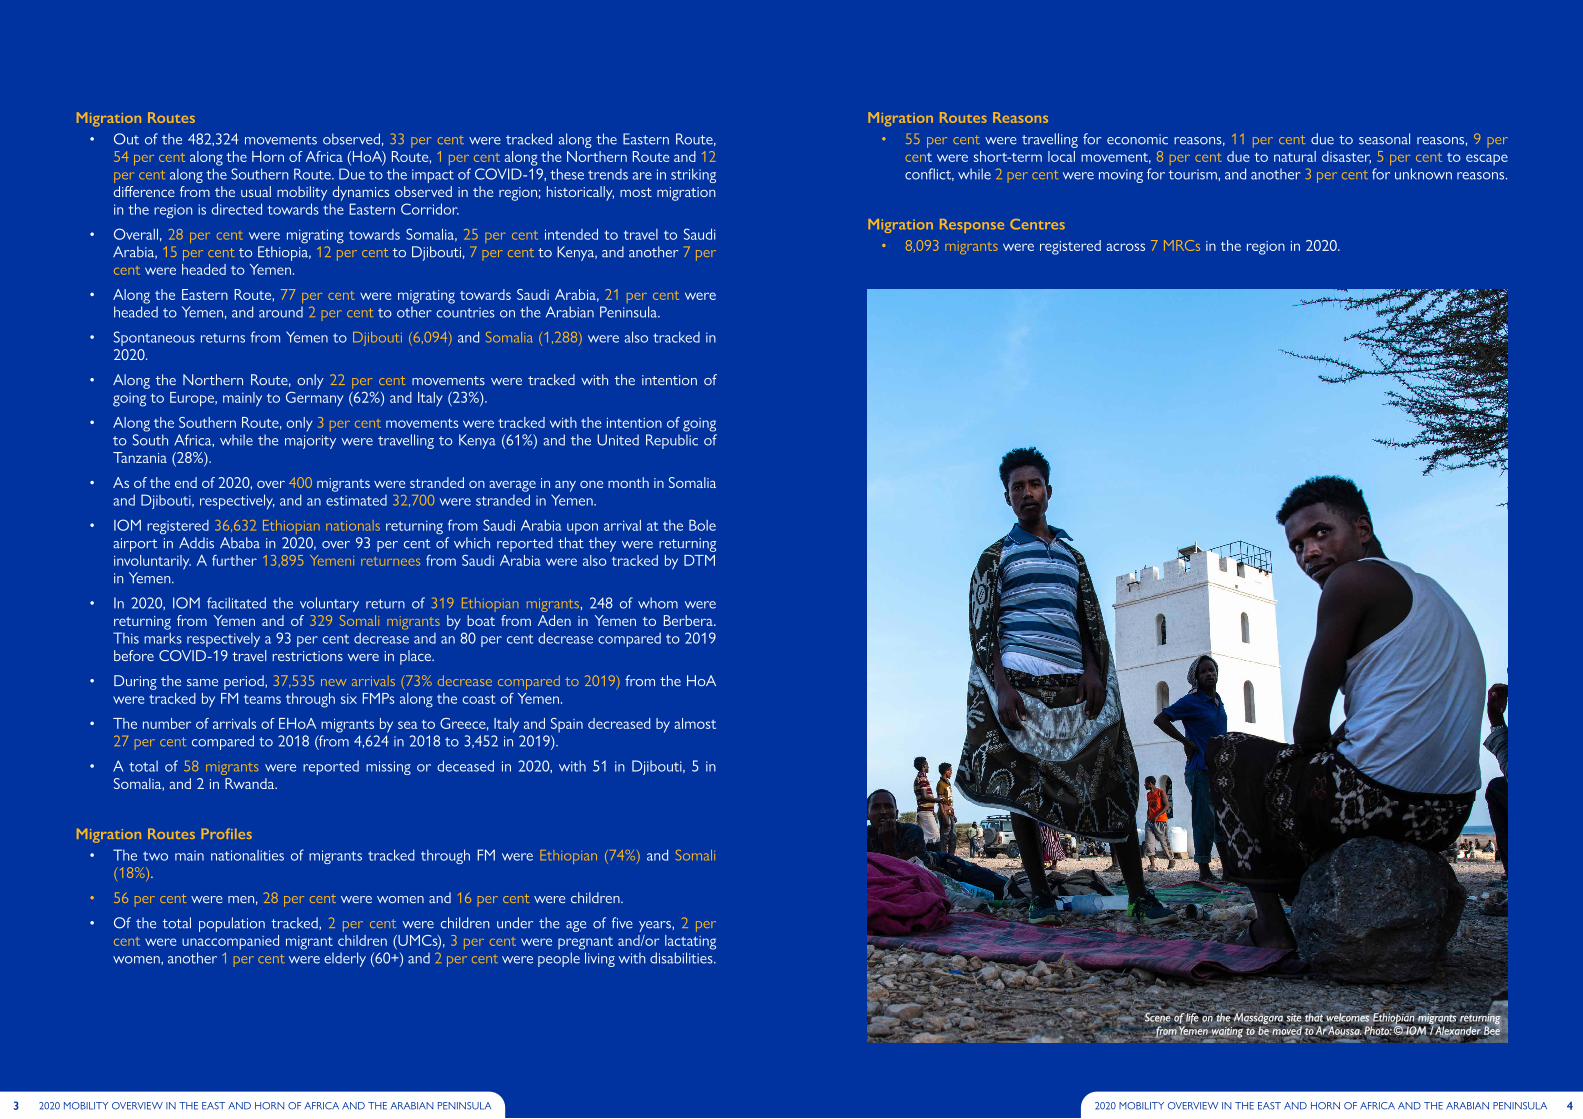
Migration Routes• Out of the 482,324 movements observed, 33 per cent were tracked along the Eastern Route,
54 per cent along the Horn of Africa (HoA) Route, 1 per cent along the Northern Route and 12 per cent along the Southern Route� Due to the impact of COVID-19, these trends are in striking difference from the usual mobility dynamics observed in the region; historically, most migration in the region is directed towards the Eastern Corridor�
• Overall, 28 per cent were migrating towards Somalia, 25 per cent intended to travel to Saudi Arabia, 15 per cent to Ethiopia, 12 per cent to Djibouti, 7 per cent to Kenya, and another 7 per cent were headed to Yemen�
• Along the Eastern Route, 77 per cent were migrating towards Saudi Arabia, 21 per cent were headed to Yemen, and around 2 per cent to other countries on the Arabian Peninsula�
• Spontaneous returns from Yemen to Djibouti (6,094) and Somalia (1,288) were also tracked in 2020�
• Along the Northern Route, only 22 per cent movements were tracked with the intention of going to Europe, mainly to Germany (62%) and Italy (23%)�
• Along the Southern Route, only 3 per cent movements were tracked with the intention of going to South Africa, while the majority were travelling to Kenya (61%) and the United Republic of Tanzania (28%)�
• As of the end of 2020, over 400 migrants were stranded on average in any one month in Somalia and Djibouti, respectively, and an estimated 32,700 were stranded in Yemen�
• IOM registered 36,632 Ethiopian nationals returning from Saudi Arabia upon arrival at the Bole airport in Addis Ababa in 2020, over 93 per cent of which reported that they were returning involuntarily� A further 13,895 Yemeni returnees from Saudi Arabia were also tracked by DTM in Yemen�
• In 2020, IOM facilitated the voluntary return of 319 Ethiopian migrants, 248 of whom were returning from Yemen and of 329 Somali migrants by boat from Aden in Yemen to Berbera� This marks respectively a 93 per cent decrease and an 80 per cent decrease compared to 2019 before COVID-19 travel restrictions were in place�
• During the same period, 37,535 new arrivals (73% decrease compared to 2019) from the HoA were tracked by FM teams through six FMPs along the coast of Yemen�
• The number of arrivals of EHoA migrants by sea to Greece, Italy and Spain decreased by almost 27 per cent compared to 2018 (from 4,624 in 2018 to 3,452 in 2019)�
• A total of 58 migrants were reported missing or deceased in 2020, with 51 in Djibouti, 5 in Somalia, and 2 in Rwanda�
Migration Routes Profiles• The two main nationalities of migrants tracked through FM were Ethiopian (74%) and Somali
(18%)�
• 56 per cent were men, 28 per cent were women and 16 per cent were children�
• Of the total population tracked, 2 per cent were children under the age of five years, 2 per cent were unaccompanied migrant children (UMCs), 3 per cent were pregnant and/or lactating women, another 1 per cent were elderly (60+) and 2 per cent were people living with disabilities�
Migration Routes Reasons• 55 per cent were travelling for economic reasons, 11 per cent due to seasonal reasons, 9 per
cent were short-term local movement, 8 per cent due to natural disaster, 5 per cent to escape conflict, while 2 per cent were moving for tourism, and another 3 per cent for unknown reasons�
Migration Response Centres• 8,093 migrants were registered across 7 MRCs in the region in 2020�
Scene of life on the Massagara site that welcomes Ethiopian migrants returning from Yemen waiting to be moved to Ar Aoussa. Photo: © IOM / Alexander Bee
3 2020 MOBILITY OVERVIEW IN THE EAST AND HORN OF AFRICA AND THE ARABIAN PENINSULA 42020 MOBILITY OVERVIEW IN THE EAST AND HORN OF AFRICA AND THE ARABIAN PENINSULA
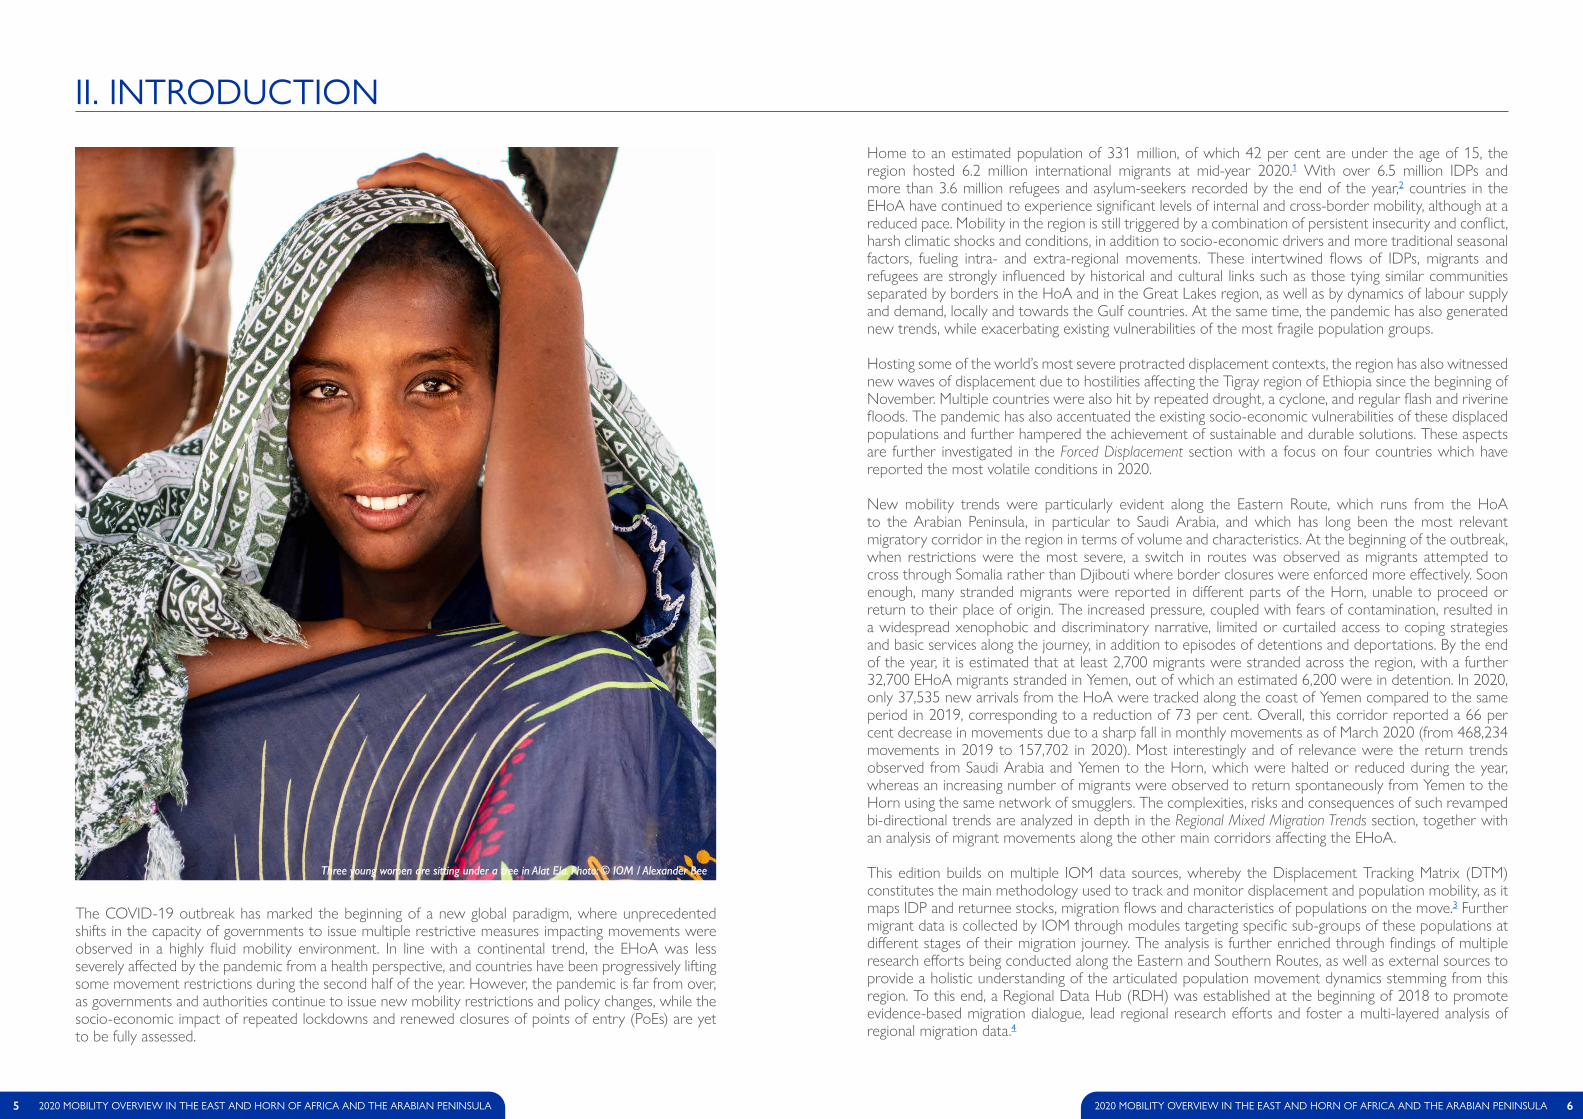
Three young women are sitting under a tree in Alat Ela. Photo: © IOM / Alexander Bee
The COVID-19 outbreak has marked the beginning of a new global paradigm, where unprecedented shifts in the capacity of governments to issue multiple restrictive measures impacting movements were observed in a highly fluid mobility environment. In line with a continental trend, the EHoA was less severely affected by the pandemic from a health perspective, and countries have been progressively lifting some movement restrictions during the second half of the year. However, the pandemic is far from over, as governments and authorities continue to issue new mobility restrictions and policy changes, while the socio-economic impact of repeated lockdowns and renewed closures of points of entry (PoEs) are yet to be fully assessed.
Home to an estimated population of 331 million, of which 42 per cent are under the age of 15, the region hosted 6.2 million international migrants at mid-year 2020.1 With over 6.5 million IDPs and more than 3.6 million refugees and asylum-seekers recorded by the end of the year,2 countries in the EHoA have continued to experience significant levels of internal and cross-border mobility, although at a reduced pace. Mobility in the region is still triggered by a combination of persistent insecurity and conflict, harsh climatic shocks and conditions, in addition to socio-economic drivers and more traditional seasonal factors, fueling intra- and extra-regional movements. These intertwined flows of IDPs, migrants and refugees are strongly influenced by historical and cultural links such as those tying similar communities separated by borders in the HoA and in the Great Lakes region, as well as by dynamics of labour supply and demand, locally and towards the Gulf countries. At the same time, the pandemic has also generated new trends, while exacerbating existing vulnerabilities of the most fragile population groups.
Hosting some of the world’s most severe protracted displacement contexts, the region has also witnessed new waves of displacement due to hostilities affecting the Tigray region of Ethiopia since the beginning of November. Multiple countries were also hit by repeated drought, a cyclone, and regular flash and riverine floods. The pandemic has also accentuated the existing socio-economic vulnerabilities of these displaced populations and further hampered the achievement of sustainable and durable solutions. These aspects are further investigated in the Forced Displacement section with a focus on four countries which have reported the most volatile conditions in 2020.
New mobility trends were particularly evident along the Eastern Route, which runs from the HoA to the Arabian Peninsula, in particular to Saudi Arabia, and which has long been the most relevant migratory corridor in the region in terms of volume and characteristics. At the beginning of the outbreak, when restrictions were the most severe, a switch in routes was observed as migrants attempted to cross through Somalia rather than Djibouti where border closures were enforced more effectively. Soon enough, many stranded migrants were reported in different parts of the Horn, unable to proceed or return to their place of origin. The increased pressure, coupled with fears of contamination, resulted in a widespread xenophobic and discriminatory narrative, limited or curtailed access to coping strategies and basic services along the journey, in addition to episodes of detentions and deportations. By the end of the year, it is estimated that at least 2,700 migrants were stranded across the region, with a further 32,700 EHoA migrants stranded in Yemen, out of which an estimated 6,200 were in detention. In 2020, only 37,535 new arrivals from the HoA were tracked along the coast of Yemen compared to the same period in 2019, corresponding to a reduction of 73 per cent. Overall, this corridor reported a 66 per cent decrease in movements due to a sharp fall in monthly movements as of March 2020 (from 468,234 movements in 2019 to 157,702 in 2020). Most interestingly and of relevance were the return trends observed from Saudi Arabia and Yemen to the Horn, which were halted or reduced during the year, whereas an increasing number of migrants were observed to return spontaneously from Yemen to the Horn using the same network of smugglers. The complexities, risks and consequences of such revamped bi-directional trends are analyzed in depth in the Regional Mixed Migration Trends section, together with an analysis of migrant movements along the other main corridors affecting the EHoA.
This edition builds on multiple IOM data sources, whereby the Displacement Tracking Matrix (DTM) constitutes the main methodology used to track and monitor displacement and population mobility, as it maps IDP and returnee stocks, migration flows and characteristics of populations on the move.3 Further migrant data is collected by IOM through modules targeting specific sub-groups of these populations at different stages of their migration journey. The analysis is further enriched through findings of multiple research efforts being conducted along the Eastern and Southern Routes, as well as external sources to provide a holistic understanding of the articulated population movement dynamics stemming from this region. To this end, a Regional Data Hub (RDH) was established at the beginning of 2018 to promote evidence-based migration dialogue, lead regional research efforts and foster a multi-layered analysis of regional migration data.4
5 2020 MOBILITY OVERVIEW IN THE EAST AND HORN OF AFRICA AND THE ARABIAN PENINSULA 62020 MOBILITY OVERVIEW IN THE EAST AND HORN OF AFRICA AND THE ARABIAN PENINSULA
II� INTRODUCTION
SOUTH SUDAN
BURUNDI
EAST AND HORN OF AFRICA
SOMALIASOMALIA
ETHIOPIA ETHIOPIASOMALIA
EAST AND HORNOF AFRICA
JANUARY FEBRUARY MARCH APRIL
AFRICAN UNION (AU)
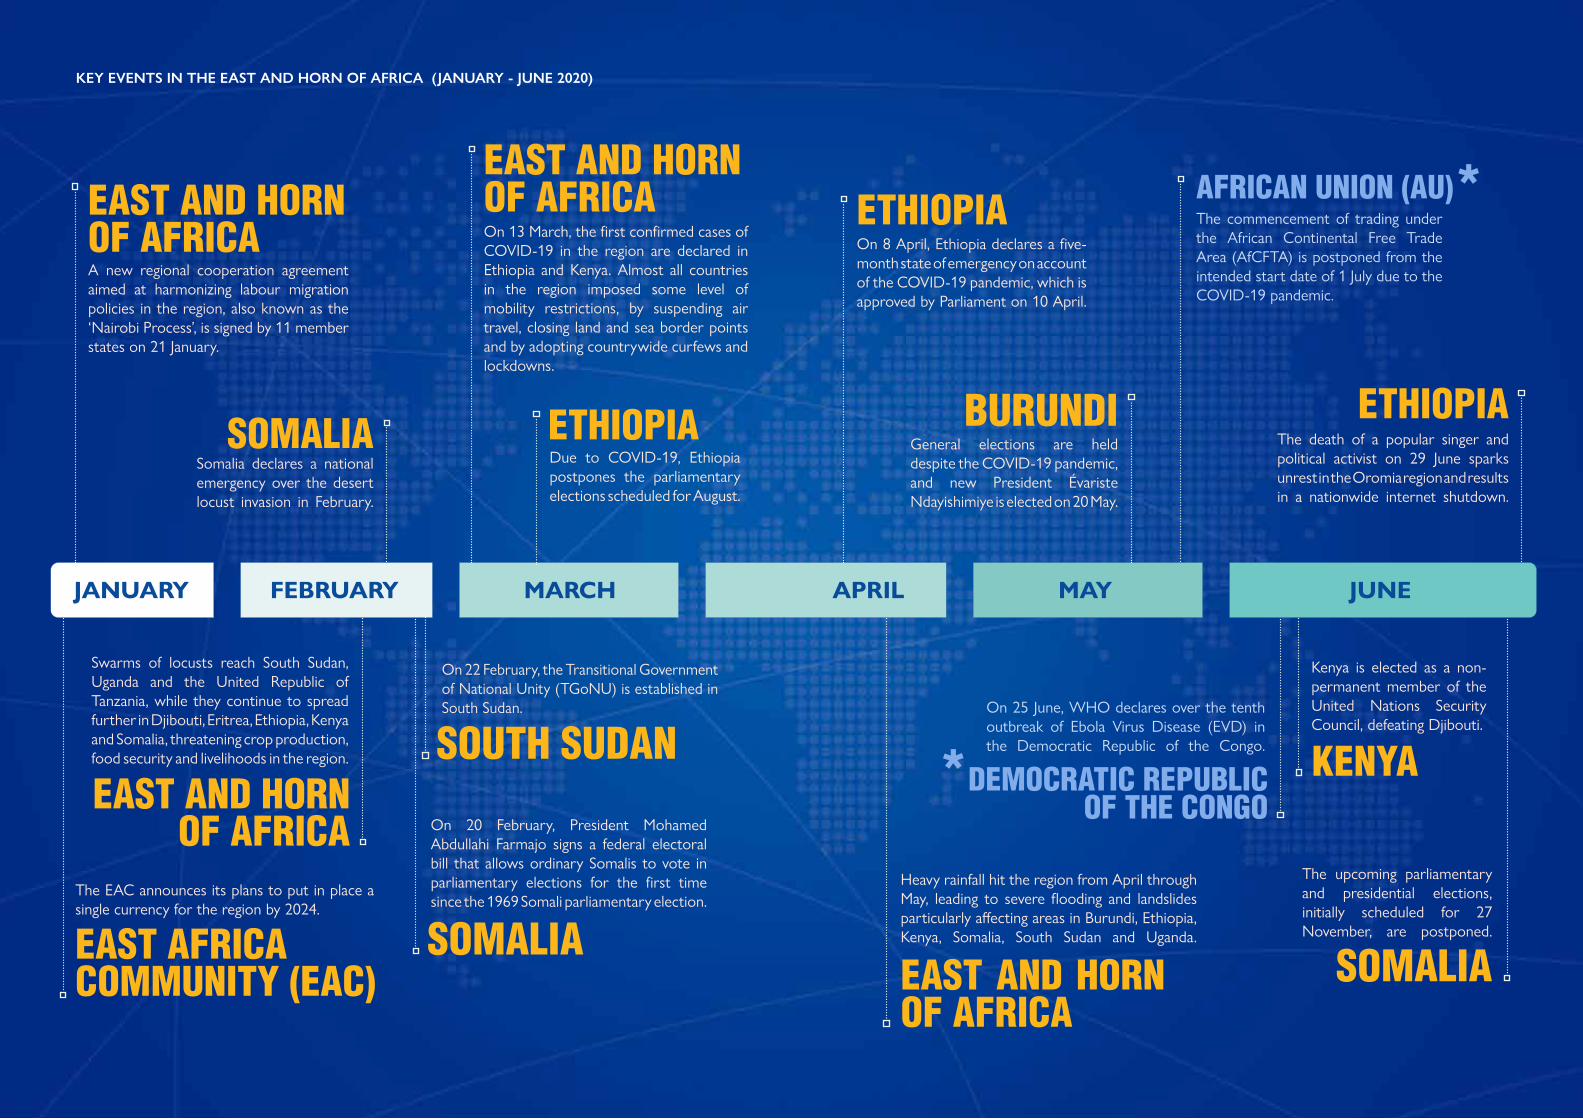
The EAC announces its plans to put in place a single currency for the region by 2024�
Swarms of locusts reach South Sudan, Uganda and the United Republic of Tanzania, while they continue to spread further in Djibouti, Eritrea, Ethiopia, Kenya and Somalia, threatening crop production, food security and livelihoods in the region�
EAST AFRICA COMMUNITY (EAC)
*
*DEMOCRATIC REPUBLIC OF THE CONGO
Due to COVID-19, Ethiopia postpones the parliamentary elections scheduled for August�
On 22 February, the Transitional Government of National Unity (TGoNU) is established in South Sudan�
KEY EVENTS IN THE EAST AND HORN OF AFRICA (JANUARY - JUNE 2020)
On 8 April, Ethiopia declares a five-month state of emergency on account of the COVID-19 pandemic, which is approved by Parliament on 10 April�
On 13 March, the first confirmed cases of COVID-19 in the region are declared in Ethiopia and Kenya� Almost all countries in the region imposed some level of mobility restrictions, by suspending air travel, closing land and sea border points and by adopting countrywide curfews and lockdowns�
On 20 February, President Mohamed Abdullahi Farmajo signs a federal electoral bill that allows ordinary Somalis to vote in parliamentary elections for the first time since the 1969 Somali parliamentary election�
Somalia declares a national emergency over the desert locust invasion in February�
A new regional cooperation agreement aimed at harmonizing labour migration policies in the region, also known as the ‘Nairobi Process’, is signed by 11 member states on 21 January�
The commencement of trading under the African Continental Free Trade Area (AfCFTA) is postponed from the intended start date of 1 July due to the COVID-19 pandemic�
The death of a popular singer and political activist on 29 June sparks unrest in the Oromia region and results in a nationwide internet shutdown�
General elections are held despite the COVID-19 pandemic, and new President Évariste Ndayishimiye is elected on 20 May�
On 25 June, WHO declares over the tenth outbreak of Ebola Virus Disease (EVD) in the Democratic Republic of the Congo�
The upcoming parliamentary and presidential elections, initially scheduled for 27 November, are postponed�
JUNEMAY
EAST AND HORN OF AFRICA
Heavy rainfall hit the region from April through May, leading to severe flooding and landslides particularly affecting areas in Burundi, Ethiopia, Kenya, Somalia, South Sudan and Uganda�
EAST AND HORN OF AFRICA
KENYA
Kenya is elected as a non-permanent member of the United Nations Security Council, defeating Djibouti�
ETHIOPIA
SOUTH SUDANSOUTH SUDAN / UGANDA
ETHIOPIA
SOUTH SUDAN
SOUTH SUDAN / SUDAN
JULY
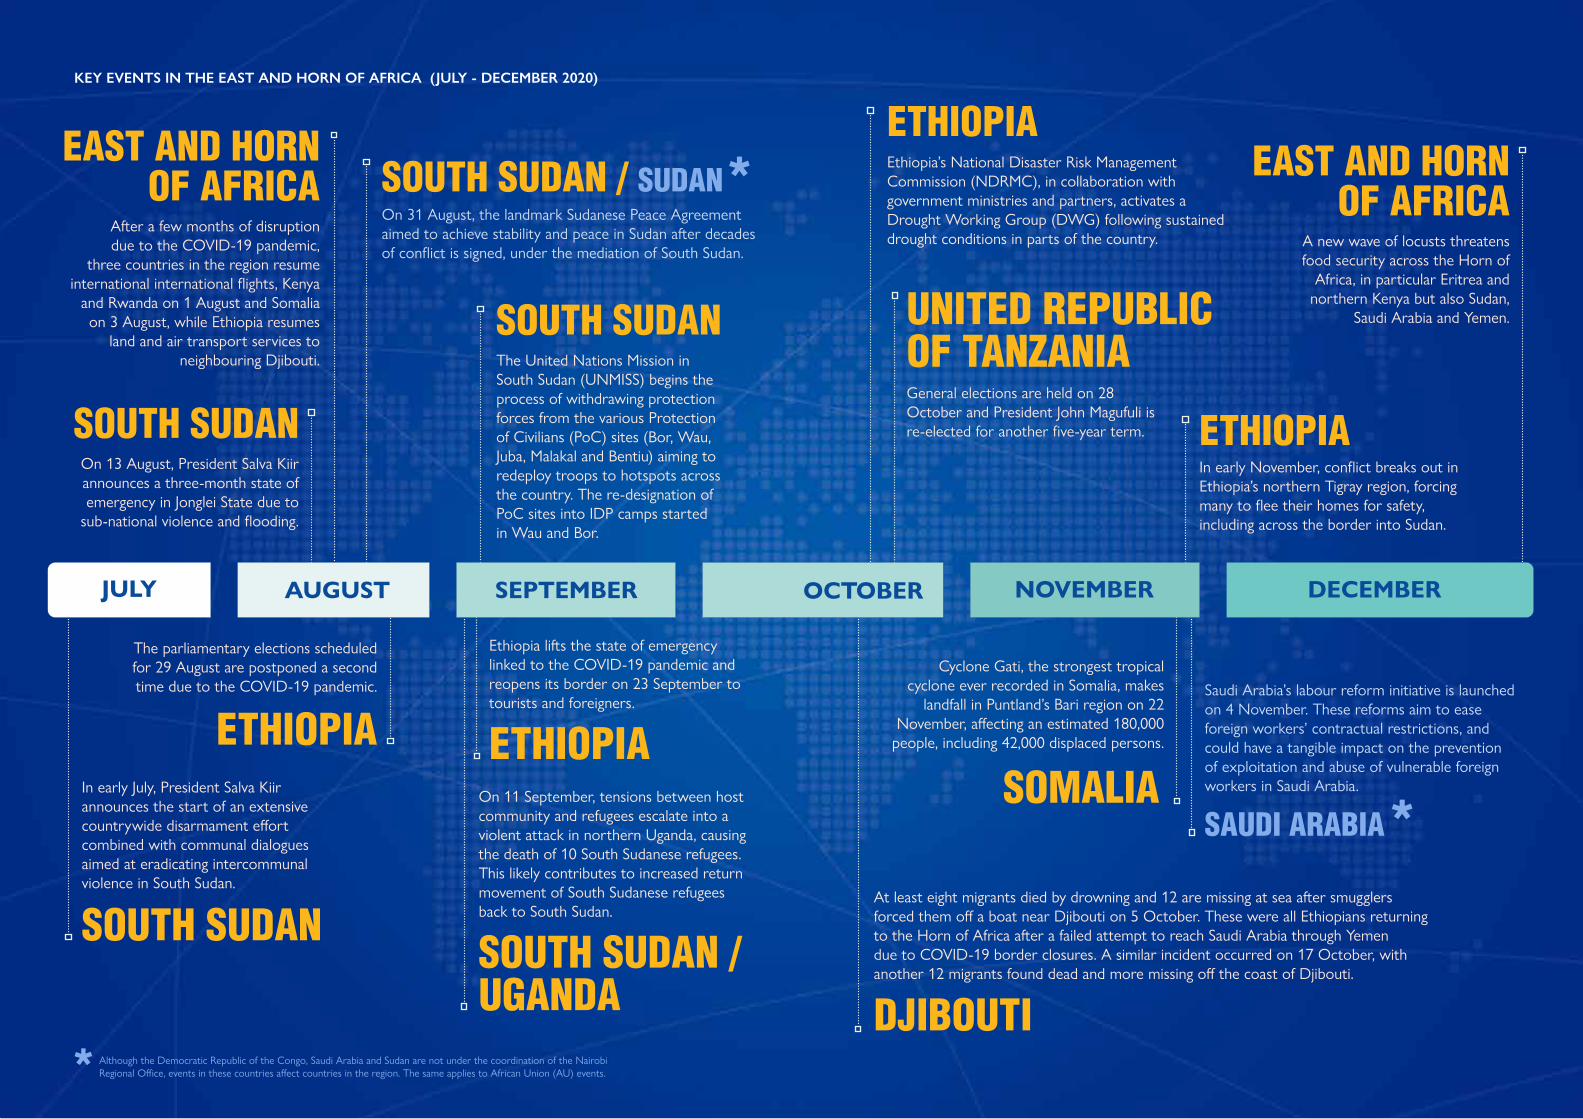
After a few months of disruption due to the COVID-19 pandemic,
three countries in the region resume international international flights, Kenya
and Rwanda on 1 August and Somalia on 3 August, while Ethiopia resumes
land and air transport services to neighbouring Djibouti�
In early July, President Salva Kiir announces the start of an extensive countrywide disarmament effort combined with communal dialogues aimed at eradicating intercommunal violence in South Sudan�
Ethiopia lifts the state of emergency linked to the COVID-19 pandemic and reopens its border on 23 September to tourists and foreigners�
KEY EVENTS IN THE EAST AND HORN OF AFRICA (JULY - DECEMBER 2020)
On 13 August, President Salva Kiir announces a three-month state of emergency in Jonglei State due to
sub-national violence and flooding�
On 31 August, the landmark Sudanese Peace Agreement aimed to achieve stability and peace in Sudan after decades of conflict is signed, under the mediation of South Sudan�
Saudi Arabia’s labour reform initiative is launched on 4 November� These reforms aim to ease foreign workers’ contractual restrictions, and could have a tangible impact on the prevention of exploitation and abuse of vulnerable foreign workers in Saudi Arabia�
Ethiopia’s National Disaster Risk Management Commission (NDRMC), in collaboration with government ministries and partners, activates a Drought Working Group (DWG) following sustained drought conditions in parts of the country�
EAST AND HORN OF AFRICA
SAUDI ARABIA*ETHIOPIA
On 11 September, tensions between host community and refugees escalate into a violent attack in northern Uganda, causing the death of 10 South Sudanese refugees� This likely contributes to increased return movement of South Sudanese refugees back to South Sudan�
ETHIOPIAIn early November, conflict breaks out in Ethiopia’s northern Tigray region, forcing many to flee their homes for safety, including across the border into Sudan�
* Although the Democratic Republic of the Congo, Saudi Arabia and Sudan are not under the coordination of the Nairobi Regional Office, events in these countries affect countries in the region� The same applies to African Union (AU) events�
ETHIOPIA
The parliamentary elections scheduled for 29 August are postponed a second time due to the COVID-19 pandemic�
*
SOUTH SUDANThe United Nations Mission in South Sudan (UNMISS) begins the process of withdrawing protection forces from the various Protection of Civilians (PoC) sites (Bor, Wau, Juba, Malakal and Bentiu) aiming to redeploy troops to hotspots across the country� The re-designation of PoC sites into IDP camps started in Wau and Bor�
DJIBOUTI
At least eight migrants died by drowning and 12 are missing at sea after smugglers forced them off a boat near Djibouti on 5 October� These were all Ethiopians returning to the Horn of Africa after a failed attempt to reach Saudi Arabia through Yemen due to COVID-19 border closures� A similar incident occurred on 17 October, with another 12 migrants found dead and more missing off the coast of Djibouti�
UNITED REPUBLIC OF TANZANIAGeneral elections are held on 28 October and President John Magufuli is re-elected for another five-year term�
SOMALIA
Cyclone Gati, the strongest tropical cyclone ever recorded in Somalia, makes
landfall in Puntland’s Bari region on 22 November, affecting an estimated 180,000
people, including 42,000 displaced persons�
AUGUST SEPTEMBER OCTOBER NOVEMBER DECEMBER
A new wave of locusts threatens food security across the Horn of
Africa, in particular Eritrea and northern Kenya but also Sudan,
Saudi Arabia and Yemen�
EAST AND HORN OF AFRICA

Governments worldwide had enforced a number of mobility restrictions in an attempt to curve the infection rates, and the EHoA was no exception. Evidence shows that African countries with more stringent lockdown restrictions experienced fewer COVID-19 cases than those with less restrictive policies, however, lockdown measures in Africa have been less effective than in other parts of the world, possibly because of challenges in enforcing such measures.7 The closure of most international and national airports was among the first measures adopted, closely followed by restrictions on land and water borders. Between 14 and 25 March, all countries in the region had either closed their airports and land borders (Burundi, Djibouti, Eritrea, Kenya, Rwanda, Somalia, South Sudan and Uganda) or implemented partial closures with restrictions to and from countries with high numbers of confirmed cases (Ethiopia and the United Republic of Tanzania).8
At the onset of the pandemic, IOM’s DTM set up a system to monitor restrictions at PoEs on a weekly basis looking at the type of PoE (air, land, blue), the operational status (open, closed or partially open), the type of restrictions in place (new immigration requirements and health measures) and the most affected populations. DTM expanded the regional coverage of the assessment from 272 PoEs in April to 344 in December 2020. At the beginning of this exercise, most PoEs were partially closed (28%), while a fairly large proportion (27%) had some sort of restrictions on movements. Others were either completely closed (20%) or had unknown operational status (25%). However, as the geographical coverage expanded and governments became more proactive in their efforts to curb the spread of the virus, more PoEs adopted measures to restrict movements, and in June, as COVID-19 cases spiked in the region, 51 per cent of PoEs were partially closed, including those that were open for commercial traffic only (26%), or for returning nationals and residents only (22%). In addition, 34 per cent were closed for all kinds of movements, and only 11 per cent were open. In contrast, as restrictions were eased with the stabilization of COVID-19 cases by the end of the year, 59 per cent were fully operational, 22 per cent were fully closed, 19 per cent were partially operational, and none had unknown operational status.
The effect of travel restrictions reverberated across all social, economic and political aspects of life, affecting disproportionally those depending on mobility for their survival and livelihoods, and those depending on informal employment or living on daily wages for which “work from home” modalities were not an option. The absence of social welfare benefits such as free medical care or unemployment benefits, the closure of schools and living in densely populated settings rendered protecting against the pandemic and navigating the numerous restrictions particularly cumbersome to some.
COVID-19, which has affected the health of millions globally, is first and foremost a public health crisis. By the end of the year, almost 84 million people were reported to have been infected by the virus, and 1.8 million had died globally.5 Healthcare systems worldwide have been severely tested, highlighting the importance of universal health coverage and the need to recruit, retain, and protect well-trained health workers. Beyond public health, the pandemic changed human mobility, social interactions, the economy, food security, access to education, and nearly every aspect of development worldwide.
In the EHoA, the first positive cases were recorded in Ethiopia and Kenya (13 March), followed by Rwanda (14 March), Somalia and the United Republic of Tanzania (16 March), Djibouti (18 March), Eritrea (21 March), Uganda (22 March), Burundi (31 March), and South Sudan (5 April). By December 2020, the number of confirmed COVID-19 cases in the region exceeded 281,000, representing 14.8 per cent of the total Africa COVID-19 cases. Across the region, most cases were asymptomatic and developed through community transmission. As of 31 December 2020, the number of COVID-19 related deaths in the region stood at 4,230. The fatality rate (1.5%) was still below the Africa (2.2%) and global (2.2%) averages, showing contained numbers of severity cases in the region. The number of cumulative recovered cases was 223,270 (79.4% of cases in the region).6
PartialClosure
Closed forentry and
exit
Open forentry and
exit
Unknown PartialClosure
Closed forentry and
exit
Open forentry and
exit
Unknown PartialClosure
Closed forentry and
exit
Open forentry and
exit
Unknown
End April 2020 End June 2020 End December 2020
Open for entry and exit
UnknownPartial closure
End of April 2020
Closed for entry and exit
Open for entry and exit
UnknownPartial closure
End of June 2020
Closed for entry and exit
Open for entry and exit
UnknownPartial closure
End of December 2020
Closed for entry and exit
6%
17%
3%
7%
16%
2%2%
4%
10%
13% 16%18%
6%2%
29%
15%
6%
4%
25%3%4%5% 3% 2%
2%1%
1%1%
21%
20%
20%
19%
Figure 1: Incidence trend of confirmed COVID-19 cases in the EHoA (31 December 2020)
Figure 2: Operational status of PoEs (April - December 2020)
11 2020 MOBILITY OVERVIEW IN THE EAST AND HORN OF AFRICA AND THE ARABIAN PENINSULA 122020 MOBILITY OVERVIEW IN THE EAST AND HORN OF AFRICA AND THE ARABIAN PENINSULA
III� HOW HAS COVID-19 IMPACTED THE EAST AND HORN OF AFRICA REGION?
Blue border crossing pointAirport
Land border crossing point
Djibouti
South Sudan
Kenya
Somalia
Ethiopia
Uganda
Tanzania (United Republic of)
Rwanda
EritreaBurundi
0
140,000
120,000
100,000
80,000
60,000
40,000
20,000
Jun Jul Aug Sep Oct Nov DecMar Apr May0
20000
40000
60000
80000
100000
120000
140000
12-M
ar17
-Mar
22-M
ar27
-Mar
01-A
pr06
-Apr
11-A
pr16
-Apr
21-A
pr26
-Apr
01-M
ay06
-May
11-M
ay16
-May
21-M
ay26
-May
31-M
ay05
-Jun
10-Ju
n15
-Jun
20-Ju
n25
-Jun
30-Ju
n05
-Jul
10-Ju
l15
-Jul
20-Ju
l25
-Jul
30-Ju
l04
-Aug
09-A
ug14
-Aug
19-A
ug24
-Aug
29-A
ug03
-Sep
08-S
ep13
-Sep
18-S
ep23
-Sep
28-S
ep03
-Oct
08-O
ct13
-Oct
18-O
ct23
-Oct
28-O
ct02
-Nov
07-N
ov12
-Nov
17-N
ov22
-Nov
27-N
ov02
-Dec
07-D
ec12
-Dec
17-D
ec22
-Dec
27-D
ec
Mar Apr May Jun Jul Aug Sep Oct Nov Dec
2020
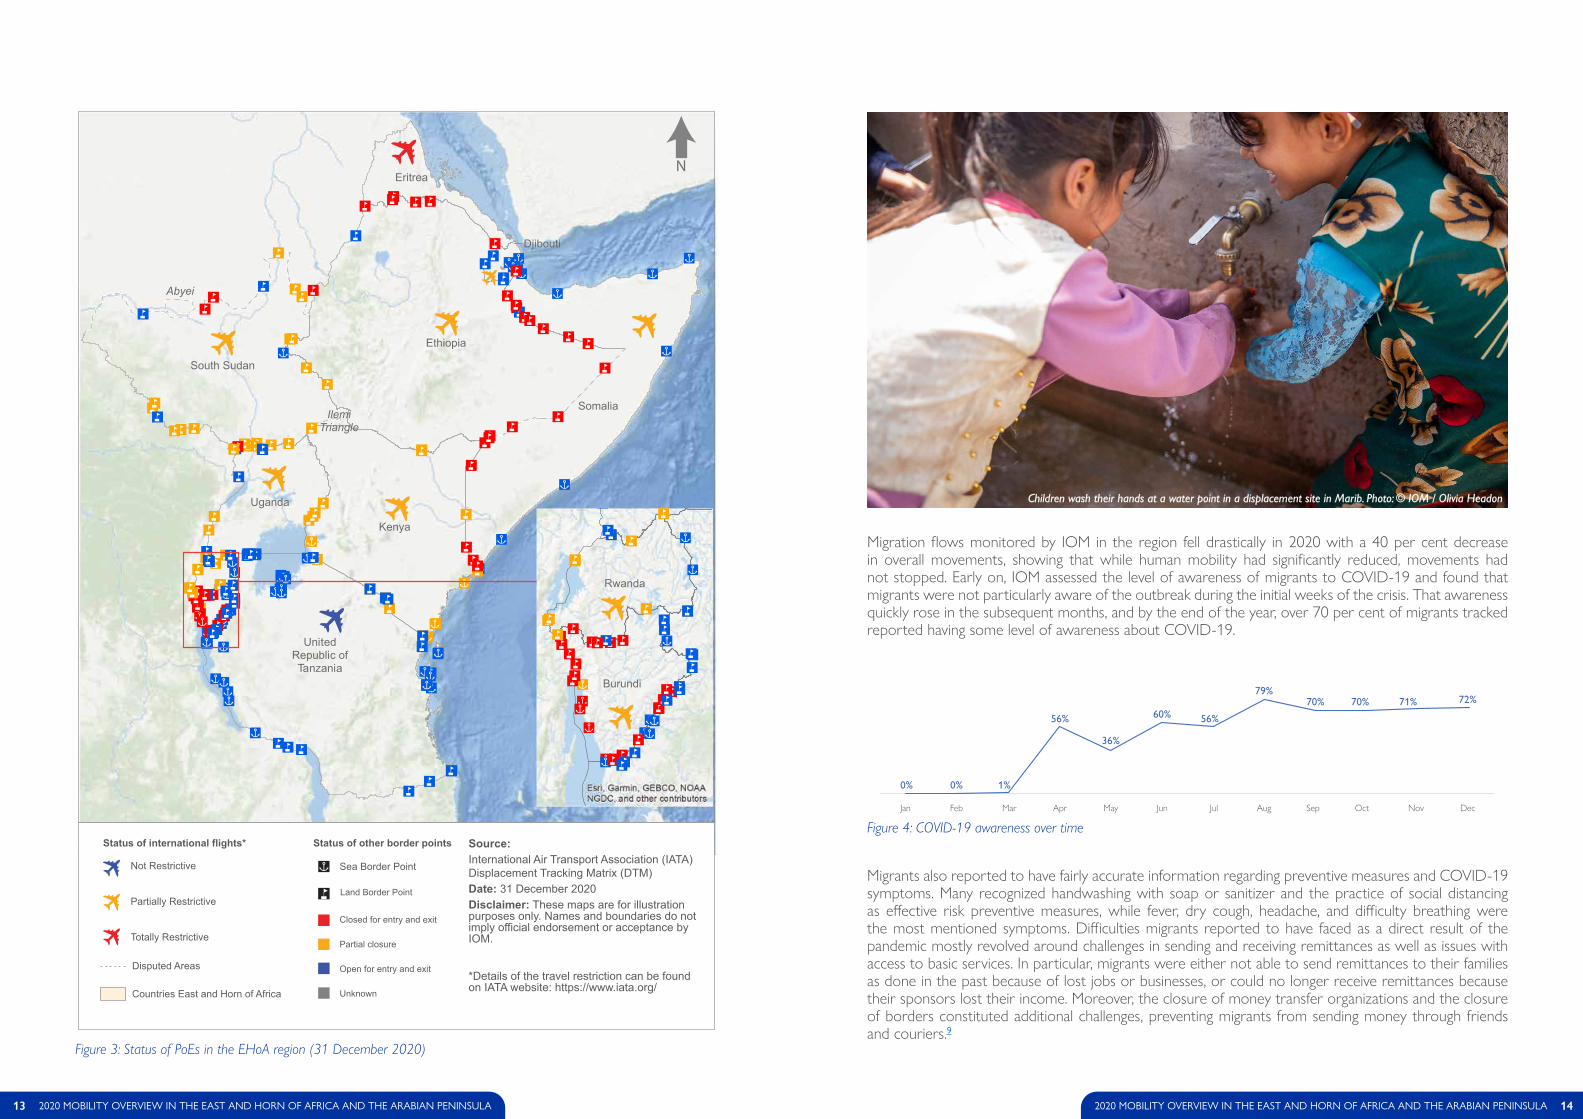
Migration flows monitored by IOM in the region fell drastically in 2020 with a 40 per cent decrease in overall movements, showing that while human mobility had significantly reduced, movements had not stopped. Early on, IOM assessed the level of awareness of migrants to COVID-19 and found that migrants were not particularly aware of the outbreak during the initial weeks of the crisis. That awareness quickly rose in the subsequent months, and by the end of the year, over 70 per cent of migrants tracked reported having some level of awareness about COVID-19.
Migrants also reported to have fairly accurate information regarding preventive measures and COVID-19 symptoms. Many recognized handwashing with soap or sanitizer and the practice of social distancing as effective risk preventive measures, while fever, dry cough, headache, and difficulty breathing were the most mentioned symptoms. Difficulties migrants reported to have faced as a direct result of the pandemic mostly revolved around challenges in sending and receiving remittances as well as issues with access to basic services. In particular, migrants were either not able to send remittances to their families as done in the past because of lost jobs or businesses, or could no longer receive remittances because their sponsors lost their income. Moreover, the closure of money transfer organizations and the closure of borders constituted additional challenges, preventing migrants from sending money through friends and couriers.9
"|"|"|
"|"|"|"|
"|"|"|"|"|"|
"|"|"|"|
"|
"|
"|
"|
"|
"|
"|
"|
"|
"|
"|
"|
"|
"|
"|
"|"|"|
"|"|"|"|"|"|"|"|"|"|
"|"|
"|
"|
"|"|"|"|
"|"|
"|
"|"|
"|"|
"|
"|"|
"|
"|"|
"|"|"|"|"| "|
"|
"|
"|"|
"n"n
"n
"n
"n"n"n"n"n"n"n"n
"n"n"n"n
"n
"n"n"n
"n"n"n"n
"n"n"n
"n"n
"n
"n"n
"n
"n
"n"n"n
"n
"n
"n
"n
"n
"n"n
"n
"n
"n
"n
"n
"n
"n
"n
"n"n"n
"n"n
"n"n
"n"n"n
"n
"n
"n
"n
"n"n
"n"n
"n
"n"n
"n
"n
"n
"n"n
"n
"n
"n"n"n"n "n"n"n "n"n
"n"n
"n"n
"n"n
"n"n
"n "n"n
"n"n"n
"n"n
"n"n
"n
"n
"n"n "n
"n
"n"n
"n"n
"n"n"n
"n
"n
"n"n
"n"n
"n
"n
"n
"n
"n"n"n
"n
"n
"n
"n
"n
"n"n"n
"n
"n
"n
"n
Somalia
Kenya
South Sudan
UnitedRepublic ofTanzania
Uganda
Ethiopia
Eritrea
Djibouti
Abyei
IlemiTriangle
"|
"|"|
"|
"|"|
"|
"|
"|
"|
"|
"|"|
"|
"n"n
"n
"n
"n
"n"n
"n"n"n
"n"n
"n
"n"n "n
"n
"n"n"n
"n"n
"n
"n
"n"n
"n
"n"n
"n"n
"n "n
"n
"n"n
"n
"n"n
"n
"n
"n
"n
"n
"n
"n
"n
Rwanda
Burundi
N
Status of other border points Status of international flights*
Not Restrictive
Partially Restrictive
Totally Restrictive" Partial closure
" Closed for entry and exit
" Unknown
" Open for entry and exit
"| Sea Border Point
"n Land Border Point
Disputed Areas
Countries East and Horn of Africa
Source: International Air Transport Association (IATA)Displacement Tracking Matrix (DTM)Date: 31 December 2020Disclaimer: These maps are for illustration purposes only. Names and boundaries do not imply official endorsement or acceptance by IOM.
*Details of the travel restriction can be found on IATA website: https://www.iata.org/
Figure 3: Status of PoEs in the EHoA region (31 December 2020)
13 2020 MOBILITY OVERVIEW IN THE EAST AND HORN OF AFRICA AND THE ARABIAN PENINSULA 142020 MOBILITY OVERVIEW IN THE EAST AND HORN OF AFRICA AND THE ARABIAN PENINSULA
Figure 4: COVID-19 awareness over time
Jan Feb Mar Apr May Jun Jul Aug Sep Oct Nov Dec
56% 56%
36%
60%
79%70% 70% 71% 72%
0%
Jun Jul Aug Sep Oct Nov DecJan Feb Mar Apr May
0% 1%
Children wash their hands at a water point in a displacement site in Marib. Photo: © IOM / Olivia Headon
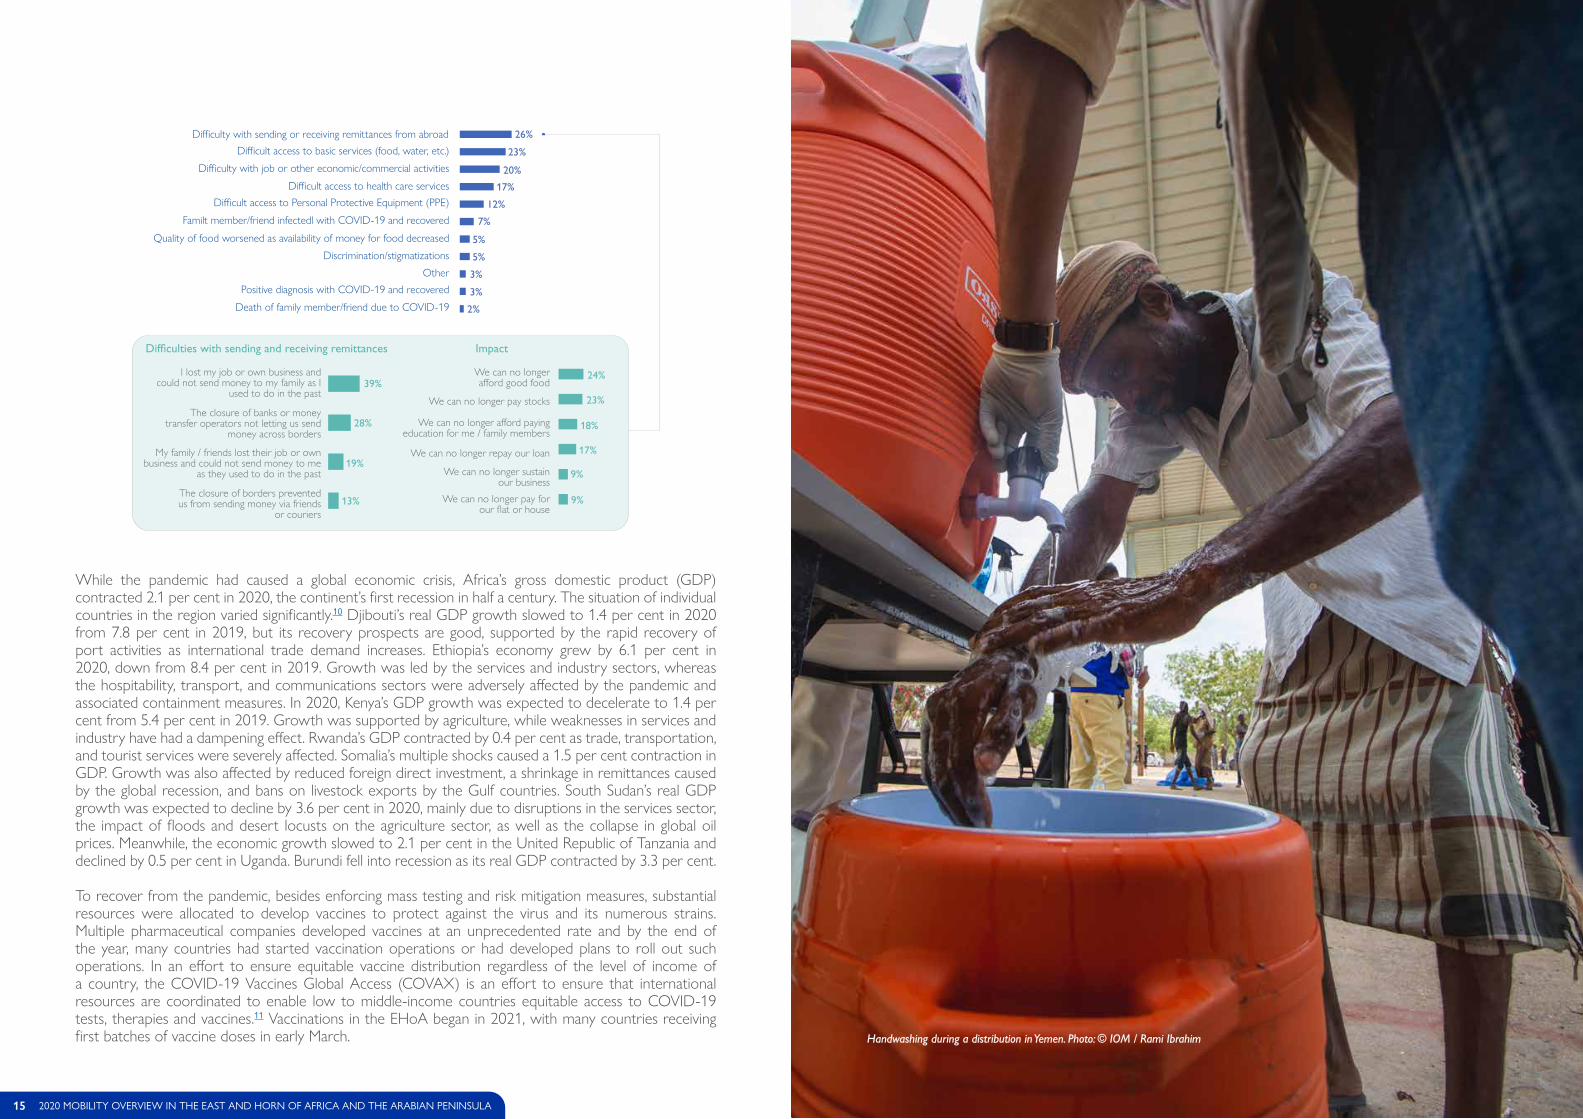
While the pandemic had caused a global economic crisis, Africa’s gross domestic product (GDP) contracted 2.1 per cent in 2020, the continent’s first recession in half a century. The situation of individual countries in the region varied significantly.10 Djibouti’s real GDP growth slowed to 1.4 per cent in 2020 from 7.8 per cent in 2019, but its recovery prospects are good, supported by the rapid recovery of port activities as international trade demand increases. Ethiopia’s economy grew by 6.1 per cent in 2020, down from 8.4 per cent in 2019. Growth was led by the services and industry sectors, whereas the hospitability, transport, and communications sectors were adversely affected by the pandemic and associated containment measures. In 2020, Kenya’s GDP growth was expected to decelerate to 1.4 per cent from 5.4 per cent in 2019. Growth was supported by agriculture, while weaknesses in services and industry have had a dampening effect. Rwanda’s GDP contracted by 0.4 per cent as trade, transportation, and tourist services were severely affected. Somalia’s multiple shocks caused a 1.5 per cent contraction in GDP. Growth was also affected by reduced foreign direct investment, a shrinkage in remittances caused by the global recession, and bans on livestock exports by the Gulf countries. South Sudan’s real GDP growth was expected to decline by 3.6 per cent in 2020, mainly due to disruptions in the services sector, the impact of floods and desert locusts on the agriculture sector, as well as the collapse in global oil prices. Meanwhile, the economic growth slowed to 2.1 per cent in the United Republic of Tanzania and declined by 0.5 per cent in Uganda. Burundi fell into recession as its real GDP contracted by 3.3 per cent.
To recover from the pandemic, besides enforcing mass testing and risk mitigation measures, substantial resources were allocated to develop vaccines to protect against the virus and its numerous strains. Multiple pharmaceutical companies developed vaccines at an unprecedented rate and by the end of the year, many countries had started vaccination operations or had developed plans to roll out such operations. In an effort to ensure equitable vaccine distribution regardless of the level of income of a country, the COVID-19 Vaccines Global Access (COVAX) is an effort to ensure that international resources are coordinated to enable low to middle-income countries equitable access to COVID-19 tests, therapies and vaccines.11 Vaccinations in the EHoA began in 2021, with many countries receiving first batches of vaccine doses in early March. Handwashing during a distribution in Yemen. Photo: © IOM / Rami Ibrahim
26+23+20+17+12+7+5+5+3+3+2Difficult access to basic services (food, water, etc.)
Familt member/friend infectedl with COVID-19 and recovered
Difficult access to health care services
Quality of food worsened as availability of money for food decreased
Difficult access to Personal Protective Equipment (PPE)
Difficulty with job or other economic/commercial activities
Positive diagnosis with COVID-19 and recovered
Death of family member/friend due to COVID-19
3%
5%
26%
23%
17%
12%
20%
5%
7%
Discrimination/stigmatizations
3%
Difficulties with sending and receiving remittances39+28+19+13
39%
19%
13%
28%
I lost my job or own business and could not send money to my family as I
used to do in the past
My family / friends lost their job or own business and could not send money to me
as they used to do in the past
The closure of borders prevented us from sending money via friends
or couriers
The closure of banks or money transfer operators not letting us send
money across borders
2%
Other
Difficulty with sending or receiving remittances from abroad
Impact
We can no longer afford good food
We can no longer afford paying education for me / family members
We can no longer pay stocks
We can no longer sustain our business
We can no longer repay our loan
We can no longer pay for our flat or house
24%
23%
18%
17%
9%
24+23+18+17+9+9 9%
15 2020 MOBILITY OVERVIEW IN THE EAST AND HORN OF AFRICA AND THE ARABIAN PENINSULA
MO
ZA
MBI
QU
EM
ALA
WI
RWA
ND
A
SOM
ALI
A
ZA
MBI
A
KEN
YA
SOU
TH
SUD
AN
UN
ITED
REP
UBL
ICO
F TA
NZ
AN
IA
UG
AN
DA
ETH
IOPI
A
ERIT
REA
DJIB
OU
TI
BURU
ND
I
CH
AD
CO
NG
O
DEM
OC
RAT
IC R
EPU
BLIC
OF
TH
E C
ON
GO
CEN
TR
AL
AFR
ICA
NR
EPU
BLIC
AN
GO
LA
LIBY
A
SUD
AN
NIG
ER
KIN
GD
OM
OF
SAU
DI
AR
ABI
A
YEM
EN
Red
Sea
Indi
an O
cean
Gul
f of A
den
FORC
ED M
OVEM
ENTS
IN T
HE E
AST
AND
HORN
OF
AFRI
CA
6.5M
Estim
ated
IDPs
3.6M
Estim
ated
ref
ugee
san
d as
ylum
-see
kers
*Alth
ough
the
Dem
ocra
tic R
epub
lic o
f the
Con
go, S
udan
and
Yem
enar
e no
t und
er th
e co
ordi
natio
n of
the
Nai
robi
Reg
iona
l Offi
ce fo
r EH
oA, c
rises
in th
ese
coun
tries
affe
ct c
ount
ries
in th
e re
gion
.
DIS
CLA
IMER
: Thi
s m
ap is
for i
llust
ratio
n pu
rpos
es o
nly.
Nam
es a
ndbo
unda
ries
on th
is m
ap d
o no
t im
ply
offic
ial e
ndor
sem
ent o
r acc
epta
nce
by IO
M.
2.0M
803K
2.6M24
K
1.4M
163K
1.1M
2.4M 1.6
M318K
5.5M
492K
287K
115K
201
505K
80K
3.7M
145K
201K
33K
32K
Refu
gees
1.4M
Refu
gees
(Sou
rce:
UN
HCR
)ID
Ps (S
ourc
e: O
CHA
and
IOM
DTM
)
East
and
Hor
n of
Afr
ica
Lege
nd:
Cou
ntry
IDP
sD
ate
Ref
ugee
sD
ate
Bur
undi
115,
221
Dec-
2080
,364
Dec-
20D
jibou
ti31
,986
Dec-
20D
emoc
ratic
Rep
ublic
of
the
Con
go*
5,50
0,00
0Fe
b-20
491,7
27De
c-20
Eritr
ea20
1De
c-20
Ethi
opia
1,959
,797
Dec-
2080
2,82
1De
c-20
Ken
ya16
3,40
0De
c-19
504,
854
Dec-
20R
wan
da14
4,66
2De
c-20
Som
alia
2,64
8,00
0Fe
b-18
24,4
53De
c-20
Sou
th S
udan
1,615
,765
Dec-
2031
8,21
2De
c-20
Sud
an*
2,39
9,43
3Ja
n-20
1,060
,000
Dec-
20U
gand
a33
,100
Dec-
191,4
46,3
78De
c-20
Uni
ted
Rep
ublic
of
Tanz
ania
287,
331
Dec-
20
Yem
en*
3,65
0,00
0M
ar-1
920
0,74
4De
c-20
No
IDPs
rep
orte
d
No
IDPs
rep
orte
d
No
IDPs
rep
orte
d
No
IDPs
rep
orte
d
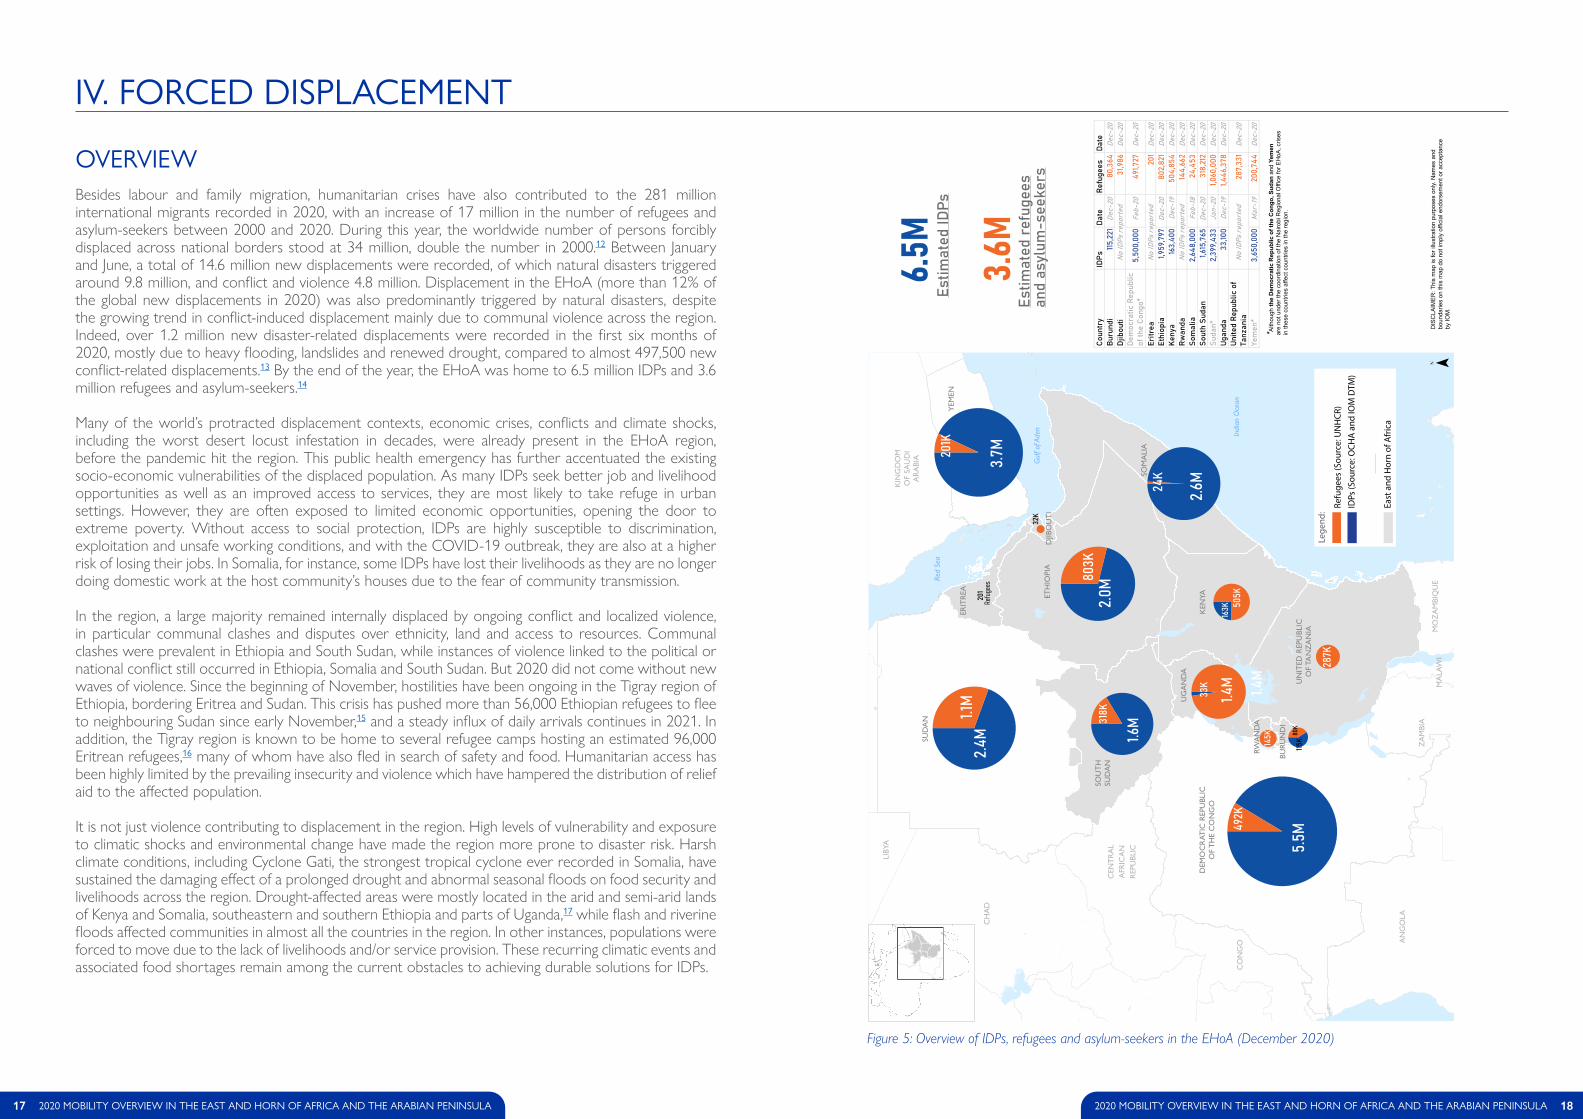
OVERVIEWBesides labour and family migration, humanitarian crises have also contributed to the 281 million international migrants recorded in 2020, with an increase of 17 million in the number of refugees and asylum-seekers between 2000 and 2020. During this year, the worldwide number of persons forcibly displaced across national borders stood at 34 million, double the number in 2000.12 Between January and June, a total of 14.6 million new displacements were recorded, of which natural disasters triggered around 9.8 million, and conflict and violence 4.8 million. Displacement in the EHoA (more than 12% of the global new displacements in 2020) was also predominantly triggered by natural disasters, despite the growing trend in conflict-induced displacement mainly due to communal violence across the region. Indeed, over 1.2 million new disaster-related displacements were recorded in the first six months of 2020, mostly due to heavy flooding, landslides and renewed drought, compared to almost 497,500 new conflict-related displacements.13 By the end of the year, the EHoA was home to 6.5 million IDPs and 3.6 million refugees and asylum-seekers.14
Many of the world’s protracted displacement contexts, economic crises, conflicts and climate shocks, including the worst desert locust infestation in decades, were already present in the EHoA region, before the pandemic hit the region. This public health emergency has further accentuated the existing socio-economic vulnerabilities of the displaced population. As many IDPs seek better job and livelihood opportunities as well as an improved access to services, they are most likely to take refuge in urban settings. However, they are often exposed to limited economic opportunities, opening the door to extreme poverty. Without access to social protection, IDPs are highly susceptible to discrimination, exploitation and unsafe working conditions, and with the COVID-19 outbreak, they are also at a higher risk of losing their jobs. In Somalia, for instance, some IDPs have lost their livelihoods as they are no longer doing domestic work at the host community’s houses due to the fear of community transmission.
In the region, a large majority remained internally displaced by ongoing conflict and localized violence, in particular communal clashes and disputes over ethnicity, land and access to resources. Communal clashes were prevalent in Ethiopia and South Sudan, while instances of violence linked to the political or national conflict still occurred in Ethiopia, Somalia and South Sudan. But 2020 did not come without new waves of violence. Since the beginning of November, hostilities have been ongoing in the Tigray region of Ethiopia, bordering Eritrea and Sudan. This crisis has pushed more than 56,000 Ethiopian refugees to flee to neighbouring Sudan since early November,15 and a steady influx of daily arrivals continues in 2021. In addition, the Tigray region is known to be home to several refugee camps hosting an estimated 96,000 Eritrean refugees,16 many of whom have also fled in search of safety and food. Humanitarian access has been highly limited by the prevailing insecurity and violence which have hampered the distribution of relief aid to the affected population.
It is not just violence contributing to displacement in the region. High levels of vulnerability and exposure to climatic shocks and environmental change have made the region more prone to disaster risk. Harsh climate conditions, including Cyclone Gati, the strongest tropical cyclone ever recorded in Somalia, have sustained the damaging effect of a prolonged drought and abnormal seasonal floods on food security and livelihoods across the region. Drought-affected areas were mostly located in the arid and semi-arid lands of Kenya and Somalia, southeastern and southern Ethiopia and parts of Uganda,17 while flash and riverine floods affected communities in almost all the countries in the region. In other instances, populations were forced to move due to the lack of livelihoods and/or service provision. These recurring climatic events and associated food shortages remain among the current obstacles to achieving durable solutions for IDPs.
Figure 5: Overview of IDPs, refugees and asylum-seekers in the EHoA (December 2020)
17 2020 MOBILITY OVERVIEW IN THE EAST AND HORN OF AFRICA AND THE ARABIAN PENINSULA 182020 MOBILITY OVERVIEW IN THE EAST AND HORN OF AFRICA AND THE ARABIAN PENINSULA
IV� FORCED DISPLACEMENT
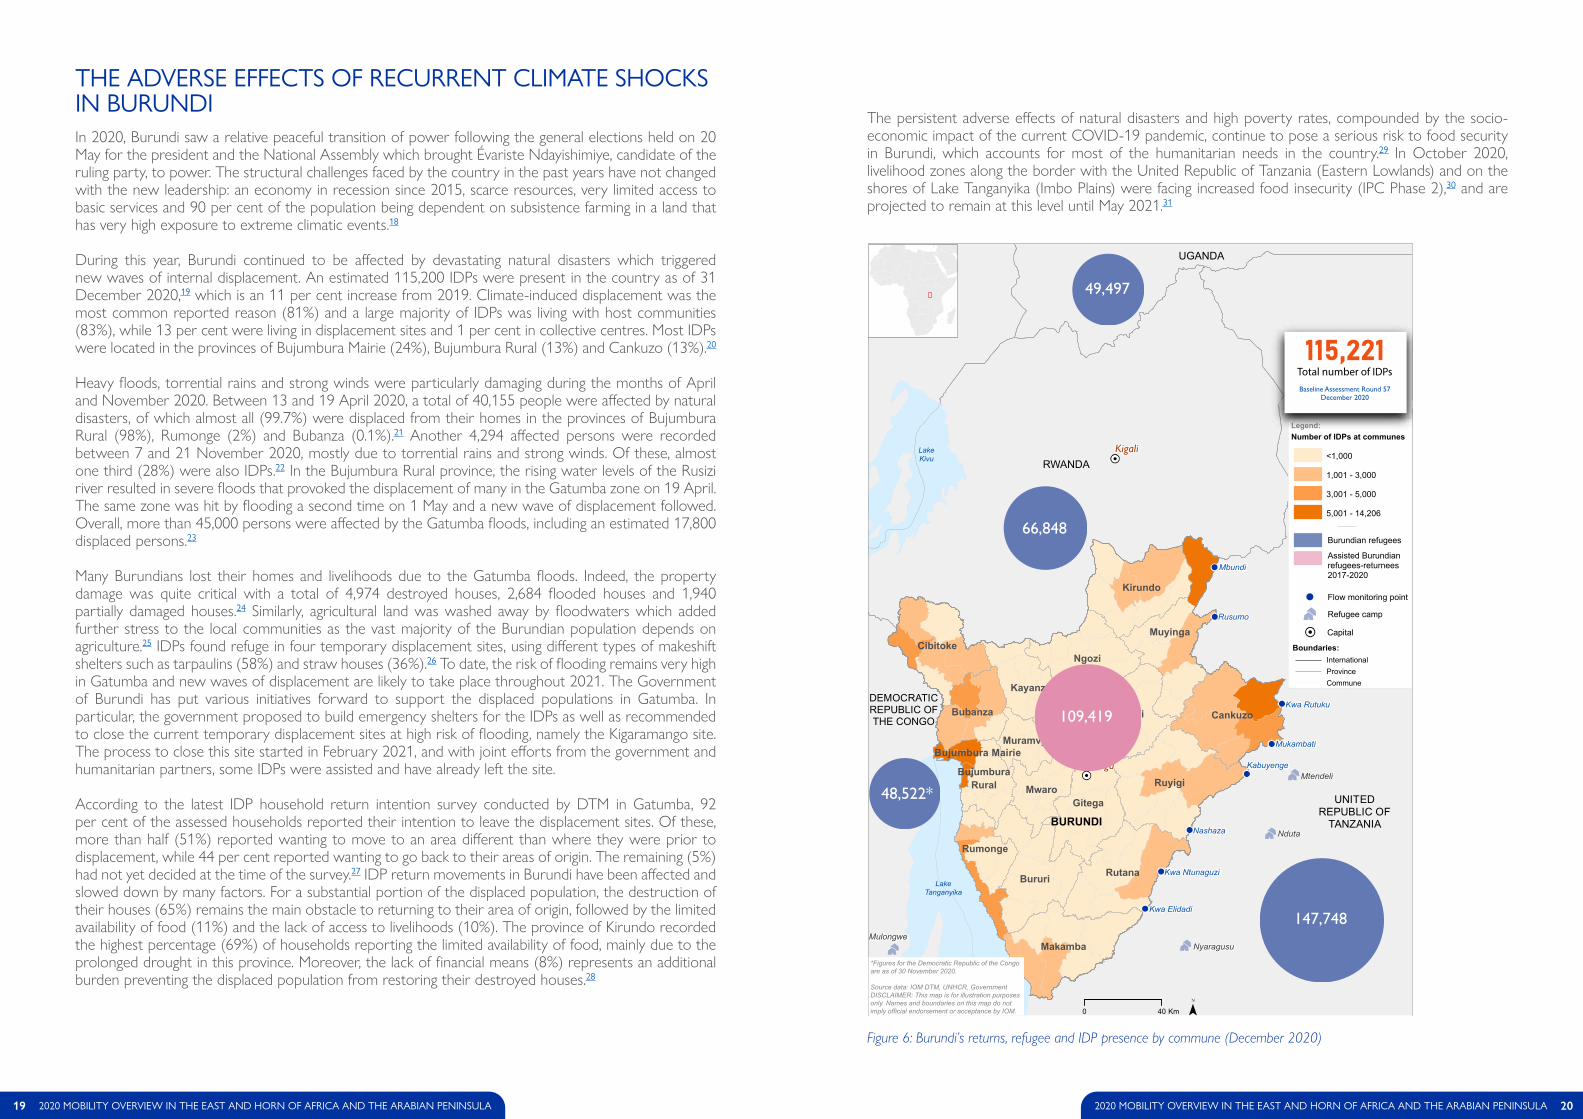
THE ADVERSE EFFECTS OF RECURRENT CLIMATE SHOCKS IN BURUNDIIn 2020, Burundi saw a relative peaceful transition of power following the general elections held on 20 May for the president and the National Assembly which brought Évariste Ndayishimiye, candidate of the ruling party, to power. The structural challenges faced by the country in the past years have not changed with the new leadership: an economy in recession since 2015, scarce resources, very limited access to basic services and 90 per cent of the population being dependent on subsistence farming in a land that has very high exposure to extreme climatic events.18
During this year, Burundi continued to be affected by devastating natural disasters which triggered new waves of internal displacement. An estimated 115,200 IDPs were present in the country as of 31 December 2020,19 which is an 11 per cent increase from 2019. Climate-induced displacement was the most common reported reason (81%) and a large majority of IDPs was living with host communities (83%), while 13 per cent were living in displacement sites and 1 per cent in collective centres. Most IDPs were located in the provinces of Bujumbura Mairie (24%), Bujumbura Rural (13%) and Cankuzo (13%).20
Heavy floods, torrential rains and strong winds were particularly damaging during the months of April and November 2020. Between 13 and 19 April 2020, a total of 40,155 people were affected by natural disasters, of which almost all (99.7%) were displaced from their homes in the provinces of Bujumbura Rural (98%), Rumonge (2%) and Bubanza (0.1%).21 Another 4,294 affected persons were recorded between 7 and 21 November 2020, mostly due to torrential rains and strong winds. Of these, almost one third (28%) were also IDPs.22 In the Bujumbura Rural province, the rising water levels of the Rusizi river resulted in severe floods that provoked the displacement of many in the Gatumba zone on 19 April. The same zone was hit by flooding a second time on 1 May and a new wave of displacement followed. Overall, more than 45,000 persons were affected by the Gatumba floods, including an estimated 17,800 displaced persons.23
Many Burundians lost their homes and livelihoods due to the Gatumba floods. Indeed, the property damage was quite critical with a total of 4,974 destroyed houses, 2,684 flooded houses and 1,940 partially damaged houses.24 Similarly, agricultural land was washed away by floodwaters which added further stress to the local communities as the vast majority of the Burundian population depends on agriculture.25 IDPs found refuge in four temporary displacement sites, using different types of makeshift shelters such as tarpaulins (58%) and straw houses (36%).26 To date, the risk of flooding remains very high in Gatumba and new waves of displacement are likely to take place throughout 2021. The Government of Burundi has put various initiatives forward to support the displaced populations in Gatumba. In particular, the government proposed to build emergency shelters for the IDPs as well as recommended to close the current temporary displacement sites at high risk of flooding, namely the Kigaramango site. The process to close this site started in February 2021, and with joint efforts from the government and humanitarian partners, some IDPs were assisted and have already left the site.
According to the latest IDP household return intention survey conducted by DTM in Gatumba, 92 per cent of the assessed households reported their intention to leave the displacement sites. Of these, more than half (51%) reported wanting to move to an area different than where they were prior to displacement, while 44 per cent reported wanting to go back to their areas of origin. The remaining (5%) had not yet decided at the time of the survey.27 IDP return movements in Burundi have been affected and slowed down by many factors. For a substantial portion of the displaced population, the destruction of their houses (65%) remains the main obstacle to returning to their area of origin, followed by the limited availability of food (11%) and the lack of access to livelihoods (10%). The province of Kirundo recorded the highest percentage (69%) of households reporting the limited availability of food, mainly due to the prolonged drought in this province. Moreover, the lack of financial means (8%) represents an additional burden preventing the displaced population from restoring their destroyed houses.28
The persistent adverse effects of natural disasters and high poverty rates, compounded by the socio-economic impact of the current COVID-19 pandemic, continue to pose a serious risk to food security in Burundi, which accounts for most of the humanitarian needs in the country.29 In October 2020, livelihood zones along the border with the United Republic of Tanzania (Eastern Lowlands) and on the shores of Lake Tanganyika (Imbo Plains) were facing increased food insecurity (IPC Phase 2),30 and are projected to remain at this level until May 2021.31
BURUNDI
MulongweNyaragusu
Nduta
Mtendeli
RWANDA
UNITEDREPUBLIC OF
TANZANIA
UGANDA
DEMOCRATICREPUBLIC OFTHE CONGO
Kabuyenge
Kwa Elidadi
Kwa Ntunaguzi
Mbundi
Mukambati
Nashaza
Kwa Rutuku
Rusumo
Mwaro
Muramvya
Gitega
Karusi Cankuzo
Ruyigi
Muyinga
Kirundo
Ngozi
Kayanza
Cibitoke
Bubanza
Rutana
Makamba
Bujumbura Mairie
Rumonge
Bururi
BujumburaRural
Gitega
Kigali
*Figures for the Democratic Republic of the Congoare as of 30 November 2020.
Source data: IOM DTM, UNHCR, GovernmentDISCLAIMER: This map is for illustration purposesonly. Names and boundaries on this map do notimply official endorsement or acceptance by IOM.
LakeTanganyika
0 40 Km
LakeKivu
Legend:Number of IDPs at communes
<1,000
1,001 - 3,000
3,001 - 5,000
5,001 - 14,206
Boundaries:InternationalProvinceCommune
Flow monitoring point
Refugee camp
Burundian refugees
Assisted Burundianrefugees-returnees2017-2020
Capital
UGADRCRWATZA
147,748
49,497
66,848
48,522*
109,419
Total number of IDPs115,221
Baseline Assessment Round 57December 2020
Figure 6: Burundi’s returns, refugee and IDP presence by commune (December 2020)
19 2020 MOBILITY OVERVIEW IN THE EAST AND HORN OF AFRICA AND THE ARABIAN PENINSULA 202020 MOBILITY OVERVIEW IN THE EAST AND HORN OF AFRICA AND THE ARABIAN PENINSULA
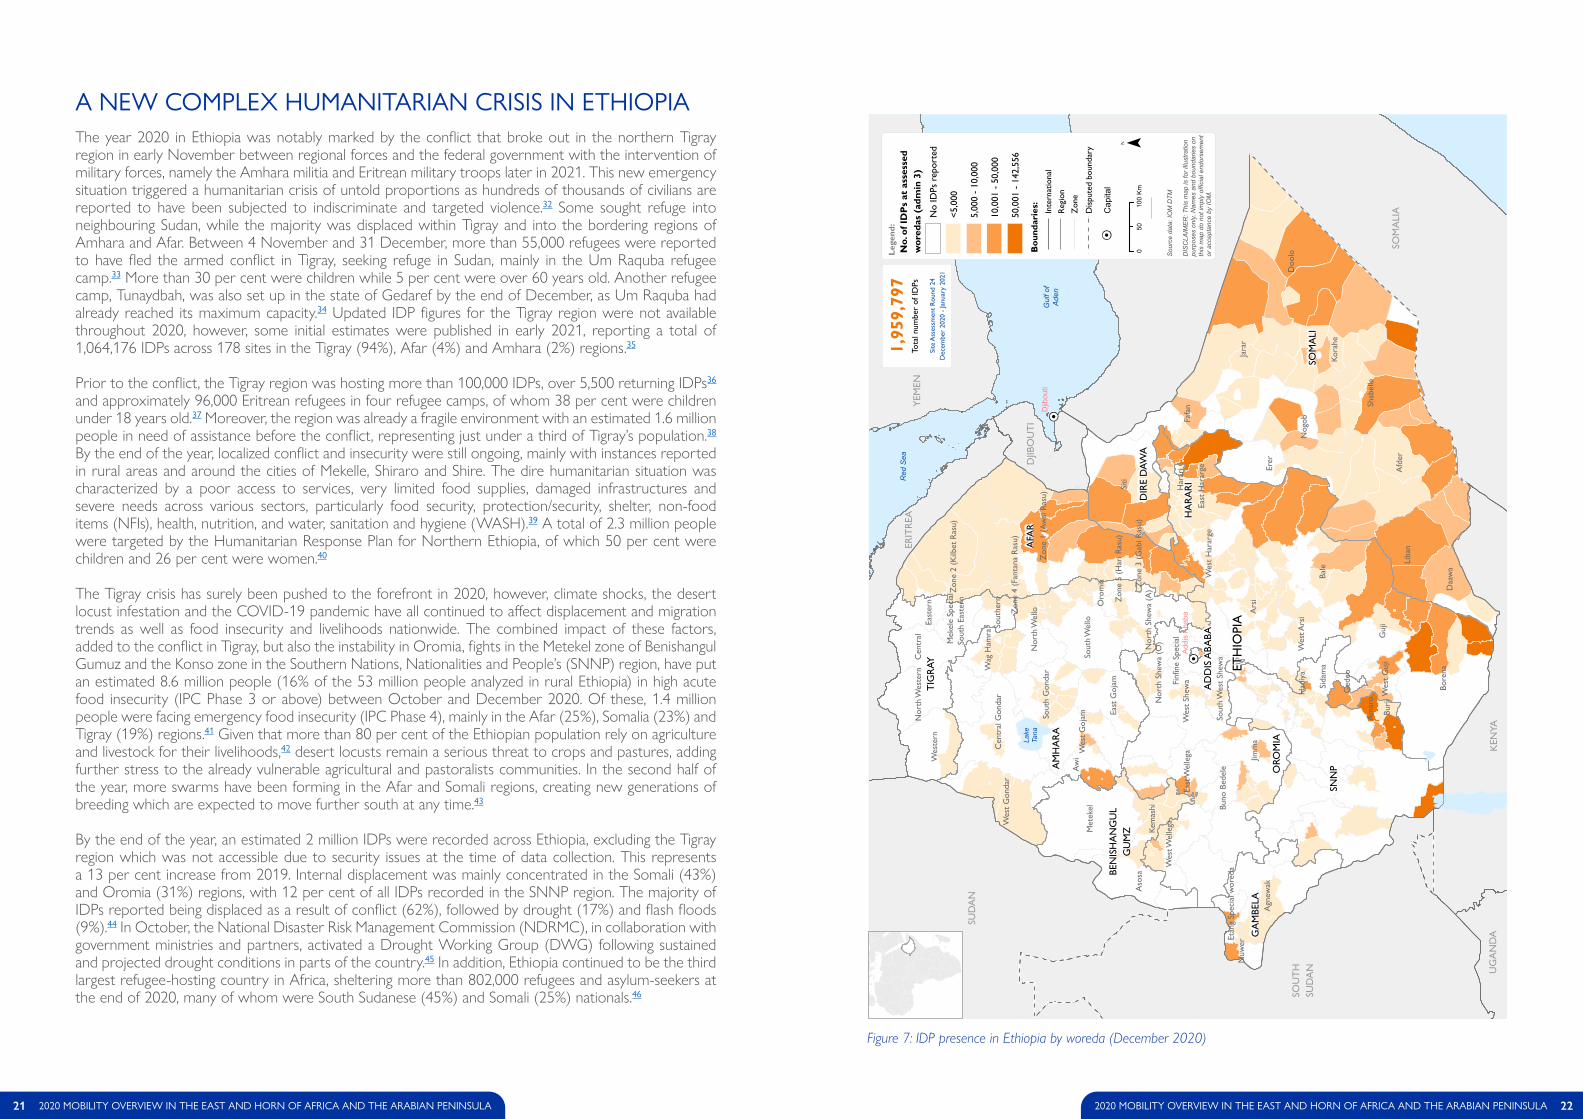
A NEW COMPLEX HUMANITARIAN CRISIS IN ETHIOPIAThe year 2020 in Ethiopia was notably marked by the conflict that broke out in the northern Tigray region in early November between regional forces and the federal government with the intervention of military forces, namely the Amhara militia and Eritrean military troops later in 2021. This new emergency situation triggered a humanitarian crisis of untold proportions as hundreds of thousands of civilians are reported to have been subjected to indiscriminate and targeted violence.32 Some sought refuge into neighbouring Sudan, while the majority was displaced within Tigray and into the bordering regions of Amhara and Afar. Between 4 November and 31 December, more than 55,000 refugees were reported to have fled the armed conflict in Tigray, seeking refuge in Sudan, mainly in the Um Raquba refugee camp.33 More than 30 per cent were children while 5 per cent were over 60 years old. Another refugee camp, Tunaydbah, was also set up in the state of Gedaref by the end of December, as Um Raquba had already reached its maximum capacity.34 Updated IDP figures for the Tigray region were not available throughout 2020, however, some initial estimates were published in early 2021, reporting a total of 1,064,176 IDPs across 178 sites in the Tigray (94%), Afar (4%) and Amhara (2%) regions.35
Prior to the conflict, the Tigray region was hosting more than 100,000 IDPs, over 5,500 returning IDPs36 and approximately 96,000 Eritrean refugees in four refugee camps, of whom 38 per cent were children under 18 years old.37 Moreover, the region was already a fragile environment with an estimated 1.6 million people in need of assistance before the conflict, representing just under a third of Tigray’s population.38 By the end of the year, localized conflict and insecurity were still ongoing, mainly with instances reported in rural areas and around the cities of Mekelle, Shiraro and Shire. The dire humanitarian situation was characterized by a poor access to services, very limited food supplies, damaged infrastructures and severe needs across various sectors, particularly food security, protection/security, shelter, non-food items (NFIs), health, nutrition, and water, sanitation and hygiene (WASH).39 A total of 2.3 million people were targeted by the Humanitarian Response Plan for Northern Ethiopia, of which 50 per cent were children and 26 per cent were women.40
The Tigray crisis has surely been pushed to the forefront in 2020, however, climate shocks, the desert locust infestation and the COVID-19 pandemic have all continued to affect displacement and migration trends as well as food insecurity and livelihoods nationwide. The combined impact of these factors, added to the conflict in Tigray, but also the instability in Oromia, fights in the Metekel zone of Benishangul Gumuz and the Konso zone in the Southern Nations, Nationalities and People’s (SNNP) region, have put an estimated 8.6 million people (16% of the 53 million people analyzed in rural Ethiopia) in high acute food insecurity (IPC Phase 3 or above) between October and December 2020. Of these, 1.4 million people were facing emergency food insecurity (IPC Phase 4), mainly in the Afar (25%), Somalia (23%) and Tigray (19%) regions.41 Given that more than 80 per cent of the Ethiopian population rely on agriculture and livestock for their livelihoods,42 desert locusts remain a serious threat to crops and pastures, adding further stress to the already vulnerable agricultural and pastoralists communities. In the second half of the year, more swarms have been forming in the Afar and Somali regions, creating new generations of breeding which are expected to move further south at any time.43
By the end of the year, an estimated 2 million IDPs were recorded across Ethiopia, excluding the Tigray region which was not accessible due to security issues at the time of data collection. This represents a 13 per cent increase from 2019. Internal displacement was mainly concentrated in the Somali (43%) and Oromia (31%) regions, with 12 per cent of all IDPs recorded in the SNNP region. The majority of IDPs reported being displaced as a result of conflict (62%), followed by drought (17%) and flash floods (9%).44 In October, the National Disaster Risk Management Commission (NDRMC), in collaboration with government ministries and partners, activated a Drought Working Group (DWG) following sustained and projected drought conditions in parts of the country.45 In addition, Ethiopia continued to be the third largest refugee-hosting country in Africa, sheltering more than 802,000 refugees and asylum-seekers at the end of 2020, many of whom were South Sudanese (45%) and Somali (25%) nationals.46
ETH
IOPI
A
SOM
ALI
A
SUD
AN
YEM
EN
SOU
TH
SUD
AN
KEN
YA
ERIT
REA
DJIB
OU
TI
UG
AN
DA
SOM
ALI
ORO
MIA
SNN
P
AFA
R
AM
HA
RA
TIG
RAY
GA
MBE
LA
BEN
ISH
AN
GU
LG
UM
Z
AD
DIS
ABA
BA
HA
RA
RI
DIR
E D
AWA
Bale
Siti
Jara
r
Afd
er
Doo
lo
Bore
na
Liba
n
Ars
i
Kora
he
Shab
elle
Guj
i
Met
ekel
Fafa
n
Jimm
a
Agn
ewak
Aw
i
Nog
ob
Erer
East
Har
arge
Aso
sa
Daa
wa
Zon
e 1
(Aw
si R
asu)
Wes
tern
Sout
h W
ello
Zon
e 2
(Kilb
et R
asu)
Cen
tral
Gon
dar
Wes
t Ars
i
Cen
tral
Wes
t H
arar
ge
East
Goj
am
Kem
ashi
Wes
t Sh
ewa
Wes
t G
onda
r
East
Wel
lega
Sout
h G
onda
r
Sida
ma
Wes
t G
uji
Nor
th S
hew
a (A
)
Nor
th W
ello
East
ern
Wag
Ham
ra
Wes
t G
ojam
Wes
t Wel
lega
Nor
th W
este
rn
Zon
e 3
(Gab
i Ras
u)
Nuw
er
Sout
hern
Nor
th S
hew
a (O
)
Zon
e 4
(Fan
tana
Ras
u)
Oro
mia
Buno
Bed
ele
Sout
h Ea
ster
n
Finf
ine
Spec
ial
Sout
h W
est
Shew
a
Burj
i
Zon
e 5
(Har
i Ras
u)
Am
aro
Ged
eo
Etan
g Sp
ecia
l wor
eda
Had
iya
Har
ari
Mek
ele
Spec
ial
Djib
outi
Addi
s Ab
aba
Lege
nd:
No.
of I
DP
s at
ass
esse
dw
ored
as (
adm
in 3
)
Bou
ndar
ies: Inte
rnat
iona
l
Reg
ion
Zon
e
Dis
pute
d bo
unda
ry
Cap
ital
Red
Sea
Gul
f of
Ade
n
Lake
Tana
<5,0
00
5,00
0 -
10,0
00
10,0
01 -
50,
000
50,0
01 -
142
,556
010
050
Km
Sou
rce
data
: IO
M D
TM
DIS
CLA
IME
R: T
his
map
is fo
r illu
stra
tion
purp
oses
onl
y. N
ames
and
bou
ndar
ies
onth
is m
ap d
o no
t im
ply
offic
ial e
ndor
sem
ent
or a
ccep
tanc
e by
IOM
.
Tota
l num
ber
of ID
Ps
Site
Ass
essm
ent
Rou
nd 2
4D
ecem
ber
2020
- Ja
nuar
y 20
21
1,95
9,79
7
No
IDPs
rep
orte
d
Figure 7: IDP presence in Ethiopia by woreda (December 2020)
21 2020 MOBILITY OVERVIEW IN THE EAST AND HORN OF AFRICA AND THE ARABIAN PENINSULA 222020 MOBILITY OVERVIEW IN THE EAST AND HORN OF AFRICA AND THE ARABIAN PENINSULA
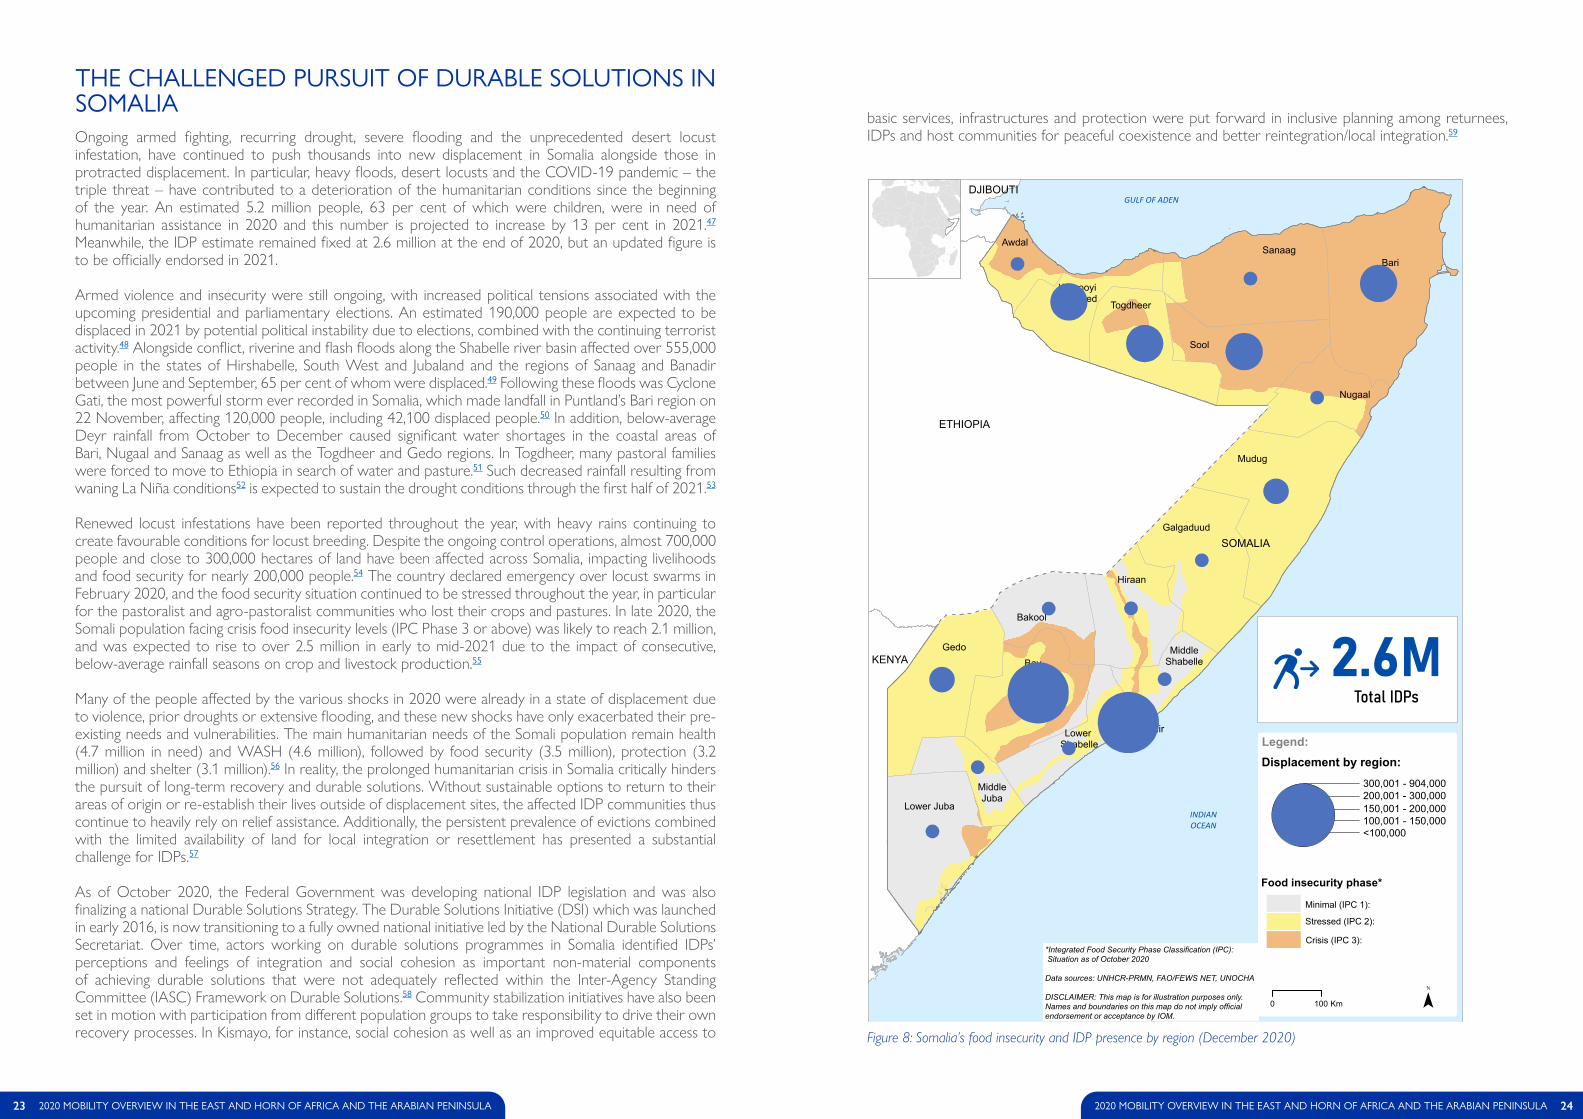
THE CHALLENGED PURSUIT OF DURABLE SOLUTIONS IN SOMALIAOngoing armed fighting, recurring drought, severe flooding and the unprecedented desert locust infestation, have continued to push thousands into new displacement in Somalia alongside those in protracted displacement. In particular, heavy floods, desert locusts and the COVID-19 pandemic – the triple threat – have contributed to a deterioration of the humanitarian conditions since the beginning of the year. An estimated 5.2 million people, 63 per cent of which were children, were in need of humanitarian assistance in 2020 and this number is projected to increase by 13 per cent in 2021.47 Meanwhile, the IDP estimate remained fixed at 2.6 million at the end of 2020, but an updated figure is to be officially endorsed in 2021.
Armed violence and insecurity were still ongoing, with increased political tensions associated with the upcoming presidential and parliamentary elections. An estimated 190,000 people are expected to be displaced in 2021 by potential political instability due to elections, combined with the continuing terrorist activity.48 Alongside conflict, riverine and flash floods along the Shabelle river basin affected over 555,000 people in the states of Hirshabelle, South West and Jubaland and the regions of Sanaag and Banadir between June and September, 65 per cent of whom were displaced.49 Following these floods was Cyclone Gati, the most powerful storm ever recorded in Somalia, which made landfall in Puntland’s Bari region on 22 November, affecting 120,000 people, including 42,100 displaced people.50 In addition, below-average Deyr rainfall from October to December caused significant water shortages in the coastal areas of Bari, Nugaal and Sanaag as well as the Togdheer and Gedo regions. In Togdheer, many pastoral families were forced to move to Ethiopia in search of water and pasture.51 Such decreased rainfall resulting from waning La Niña conditions52 is expected to sustain the drought conditions through the first half of 2021.53
Renewed locust infestations have been reported throughout the year, with heavy rains continuing to create favourable conditions for locust breeding. Despite the ongoing control operations, almost 700,000 people and close to 300,000 hectares of land have been affected across Somalia, impacting livelihoods and food security for nearly 200,000 people.54 The country declared emergency over locust swarms in February 2020, and the food security situation continued to be stressed throughout the year, in particular for the pastoralist and agro-pastoralist communities who lost their crops and pastures. In late 2020, the Somali population facing crisis food insecurity levels (IPC Phase 3 or above) was likely to reach 2.1 million, and was expected to rise to over 2.5 million in early to mid-2021 due to the impact of consecutive, below-average rainfall seasons on crop and livestock production.55
Many of the people affected by the various shocks in 2020 were already in a state of displacement due to violence, prior droughts or extensive flooding, and these new shocks have only exacerbated their pre-existing needs and vulnerabilities. The main humanitarian needs of the Somali population remain health (4.7 million in need) and WASH (4.6 million), followed by food security (3.5 million), protection (3.2 million) and shelter (3.1 million).56 In reality, the prolonged humanitarian crisis in Somalia critically hinders the pursuit of long-term recovery and durable solutions. Without sustainable options to return to their areas of origin or re-establish their lives outside of displacement sites, the affected IDP communities thus continue to heavily rely on relief assistance. Additionally, the persistent prevalence of evictions combined with the limited availability of land for local integration or resettlement has presented a substantial challenge for IDPs.57
As of October 2020, the Federal Government was developing national IDP legislation and was also finalizing a national Durable Solutions Strategy. The Durable Solutions Initiative (DSI) which was launched in early 2016, is now transitioning to a fully owned national initiative led by the National Durable Solutions Secretariat. Over time, actors working on durable solutions programmes in Somalia identified IDPs’ perceptions and feelings of integration and social cohesion as important non-material components of achieving durable solutions that were not adequately reflected within the Inter-Agency Standing Committee (IASC) Framework on Durable Solutions.58 Community stabilization initiatives have also been set in motion with participation from different population groups to take responsibility to drive their own recovery processes. In Kismayo, for instance, social cohesion as well as an improved equitable access to
basic services, infrastructures and protection were put forward in inclusive planning among returnees, IDPs and host communities for peaceful coexistence and better reintegration/local integration.59
INDIANOCEAN
GULF OF ADEN
Banadir
Bari
Bay
Mudug
Sool
Gedo
Sanaag
Hiraan
Galgaduud
Lower Juba
Nugaal
Bakool
Togdheer
Awdal
Woqooyi Galbeed
MiddleJuba
MiddleShabelle
Lower Shabelle
SOMALIA
ETHIOPIA
KENYA
DJIBOUTI
*Integrated Food Security Phase Classification (IPC): Situation as of October 2020
Data sources: UNHCR-PRMN, FAO/FEWS NET, UNOCHA
DISCLAIMER: This map is for illustration purposes only.Names and boundaries on this map do not imply officialendorsement or acceptance by IOM.
Legend:Displacement by region:
<100,000100,001 - 150,000150,001 - 200,000200,001 - 300,000300,001 - 904,000
0 100 Km ¯
Food insecurity phase*
Stressed (IPC 2):
Crisis (IPC 3):
Minimal (IPC 1):
(((((!
Total IDPs2.6M
Figure 8: Somalia’s food insecurity and IDP presence by region (December 2020)
23 2020 MOBILITY OVERVIEW IN THE EAST AND HORN OF AFRICA AND THE ARABIAN PENINSULA 242020 MOBILITY OVERVIEW IN THE EAST AND HORN OF AFRICA AND THE ARABIAN PENINSULA

SOUTH SUDAN: BETWEEN CONFLICT AND FAMINEDespite being the world’s youngest nation, South Sudan already has a long history of conflict and internal displacement alongside a critical food security situation. By the end of the year, there were 1.6 million displaced persons across the country, who got displaced between 2014 and September 2020. Around 95 per cent of the displaced population tracked were displaced within the country and 5 per cent were previously displaced abroad. Higher IDP concentrations were found in the states of Warrap (18%), Jonglei (15%), Central Equatoria (15%) and Upper Nile (14%).60 According to DTM’s more rapid and localized event tracking assessment, over 700,000 new individual displacements related to conflict and natural disasters were recorded in 2020, the majority of which were short-term displacement caused by flooding and sub-national violence as opposed to protracted displacement.61
Following the formation of the Transitional Government of National Unity (TGoNU) in February 2020, which was a major achievement in the implementation of the Revitalized Agreement on the Resolution of Conflict in South Sudan (R-ARCSS, September 2018), the country witnessed a decline in political conflict at the national level, and expected a significant increase in returns. However, these two milestones have not brought long-lasting peace to South Sudan as demonstrated by the growing trend in localized, sub-national violence, mainly related to inter and intracommunal clashes. In the second half of 2020, escalating violence in the states of Central Equatoria, Jonglei, Lakes, Unity, Western Bahr el Ghazal and Warrap resulted in the killing and injury of hundreds of civilians and caused the displacement of more than 80,000 people, of which women, children and the elderly were particularly targeted by the heightened levels of violence and suffering.62 The central and southern parts of Jonglei State as well as the Greater Pibor Administrative Area (GPAA) were amongst the key hotspots for such violence, especially from June to August, with tensions spilling over into neighbouring parts of the country.63 With the start of the dry season (from October to April), violent clashes have intensified, mainly in the states of Warrap and Central Equatoria, and are expected to persist and worsen throughout the season, particularly against the backdrop of economic downturns, food insecurity and administrative appointments,64 including the impact of COVID-19.65
Severe flooding also continued to be a significant driver of displacement, especially in the second half of the year. Overall, more than 1 million individuals were impacted by floods from July to December, including an estimated 480,000 flood-displaced people. Jonglei State and GPAA were amongst the most impacted areas with 495,000 people affected, followed by the states of Lakes (147,000) and Unity (126,000).66 Areas along the White Nile have been particularly affected by floods since mid-June, and many populations have moved from lowland to highland areas in search of a temporary place to settle until floodwaters recede. One such area is Mangala in the state of Central Equatoria, which, by the end of the year, hosted more than 24,500 IDPs.67
The current crisis in South Sudan has further exacerbated the number of food insecure people. In fact, the country is currently facing a major hunger crisis and experiencing record levels of food insecurity. The situation in Pibor County has been extremely concerning with many in famine-like conditions (IPC Phase 5). By the end of the year, 6.3 million people – over half of the country’s population (53%) – were severely food insecure (IPC Phase 3 or above). This number is expected to increase to 7.2 million in the April-July 2021 period with 108,000 people facing catastrophic food security levels (IPC Phase 5),68 which is more than double the number of people projected to endure the same food insecurity levels in Yemen (47,000).69
With all its persisting domestic challenges, return movements of the South Sudanese population have not been systematic nor as high as expected following the signing of the peace deal and the establishment of the revitalized government. An estimated 1.7 million returnees were recorded at the end of the year, of which 32 per cent were previously displaced abroad.70 Even though the number of returnees has increased over the past year, there are still 1,6 million IDPs across the country and numbers are likely to increase throughout 2021 due to multiple incidents which cause short-term displacement, namely sub-national violence and flooding. Furthermore, the instability across South Sudan hinders the sustainability
of returns, as some 86,404 individuals who returned from abroad remain displaced within the country, unable to return to their areas of habitual residence.71 Many IDPs living in Protection of Civilian (PoC) sites/IDP camps72 and collective centres continue to report insecurity at their preferred destination as the main reason for non-return, with only 36 per cent of respondents per site reporting an intention to leave.73 Moreover, these returns are not always a direct result of the betterment of the peace situation within the country. In some instances, they are forced on account of push factors in the places of displacement abroad, such as tensions with the host communities and increasing food insecurity in Uganda in September 2020.74
A woman poses with her two children outside of a square building in Bentiu Town, South Sudan.. Photo: © IOM / Muse Mohammed
25 2020 MOBILITY OVERVIEW IN THE EAST AND HORN OF AFRICA AND THE ARABIAN PENINSULA 262020 MOBILITY OVERVIEW IN THE EAST AND HORN OF AFRICA AND THE ARABIAN PENINSULA
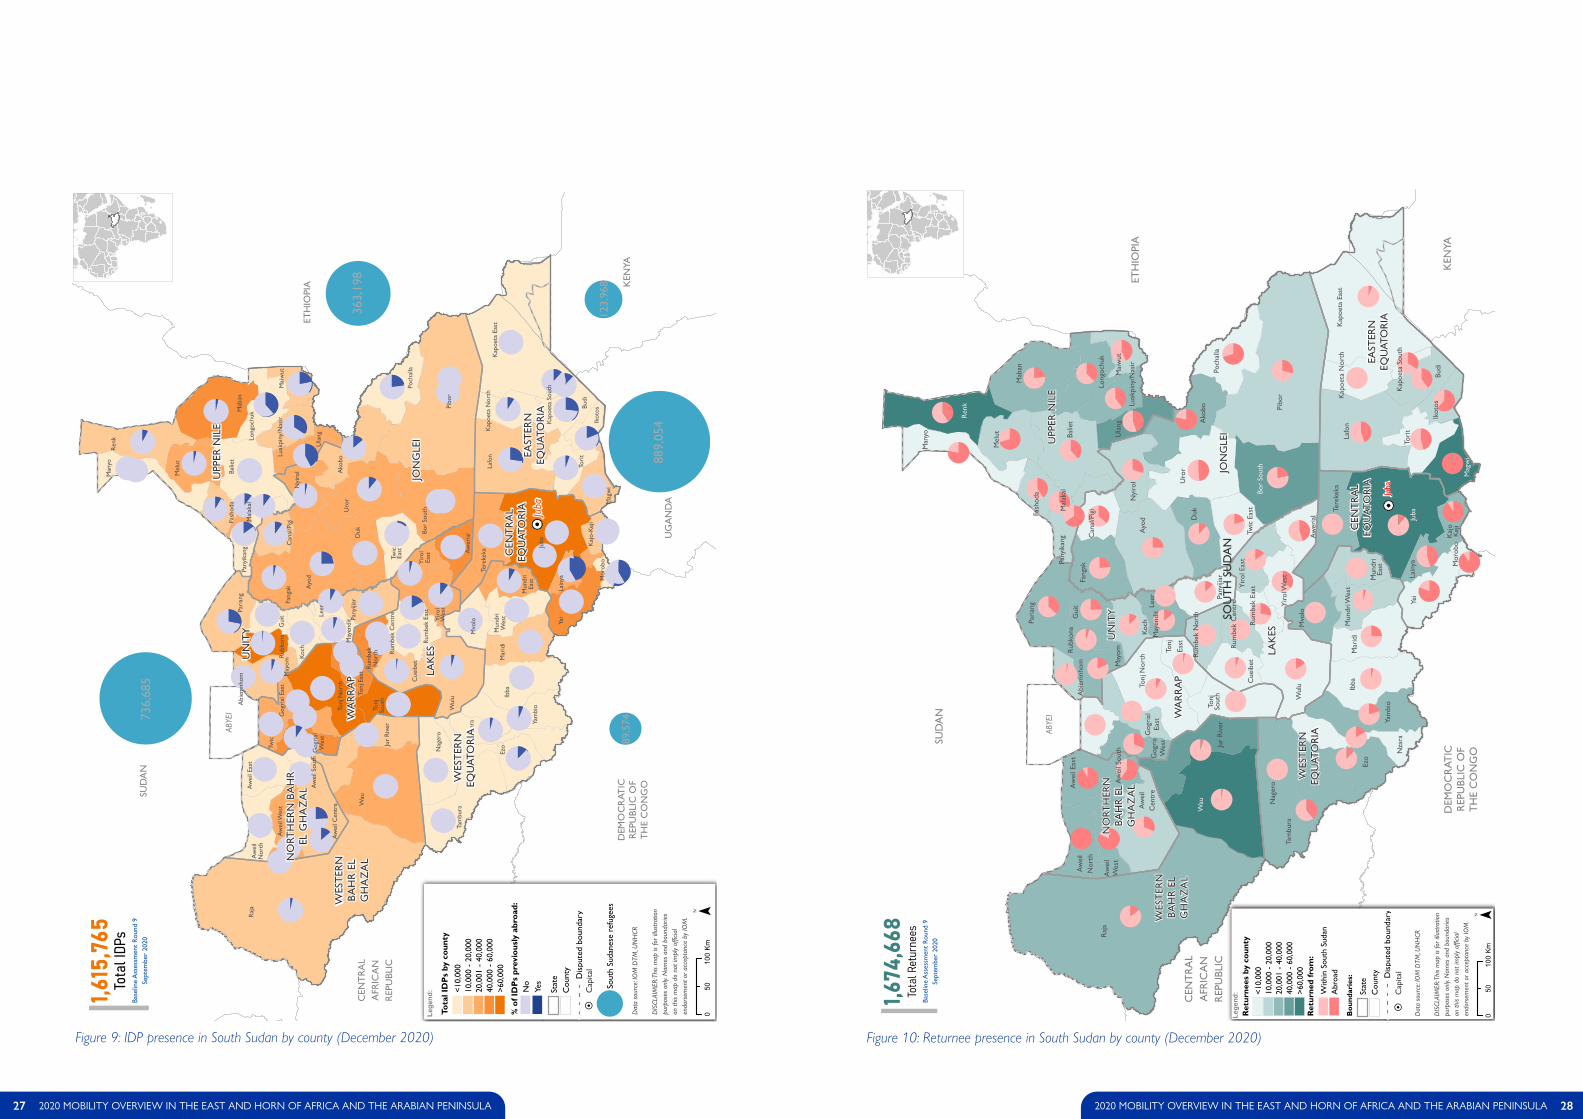
ABYE
I
KEN
YA
UG
AN
DA
ETH
IOPI
A
DEM
OC
RAT
ICR
EPU
BLIC
OF
TH
E C
ON
GO
CEN
TR
AL
AFR
ICA
NR
EPU
BLIC
SUD
AN
Juba
¯0
100
50Km
Dat
a so
urce
: IO
M D
TM, U
NH
CR
DIS
CLAI
MER
: Thi
s m
ap is
for i
llust
ratio
npu
rpos
es o
nly.
Nam
es a
nd b
ound
arie
son
this
map
do
not i
mpl
y of
ficia
len
dors
emen
t or a
ccep
tanc
e by
IOM
.
Lege
nd: N
oYe
s
<10,
000
10,0
00 -
20,
000
20,0
01 -
40,
000
40,0
00 -
60,
000
>60,
000
Stat
e
Cap
ital
! H
% o
f ID
Ps
prev
ious
ly a
broa
d:
Tota
l ID
Ps
by c
ount
y
Sout
h Su
dane
se r
efug
ees
Cou
nty
Dis
pute
d bo
unda
ry
Rub
kona
Mal
akal
Gog
rial
Wes
t
May
endi
t
Luak
piny
/Nas
irG
ogri
al E
ast
Juba Kaj
o-Ke
ji
Lain
ya Mor
obo
Tere
keka
Yei
Budi
Ikot
os
Kap
oeta
Eas
tK
apoe
ta N
orth
Kap
oeta
Sou
th
Lafo
n
Mag
wi
Tori
t
Ako
bo
Bor
Sout
h
Can
al/P
igi
Duk
Fang
ak
Pibo
r
Poch
alla
Twic
East Aw
eria
l
Cue
ibet
Rum
bek
Cen
tre
Rum
bek
East
Rum
bek
Nor
th
Wul
u
Yiro
lEa
stY
irol
Wes
t
Aw
eil C
entr
e
Aw
eil E
ast
Aw
eil
Nor
th
Aw
eil S
outh
Aw
eil W
est
Abi
emnh
om
Gui
t
Koch
Leer
May
om
Pari
ang
Balie
tFa
shod
aM
aban
Man
yo
Mel
ut
Pany
ikan
g
Ren
k
Tonj
Eas
t
Tonj
Nor
th
Tonj
Sout
h
Twic
Jur
Riv
er
Raj
a
Wau
Ezo
Ibba
Mar
idi
Mun
dri
East
Mun
dri
Wes
t
Mvo
lo
Nag
ero N
zara
Tam
bura
Yam
bio
Ayo
d
Nyi
rol
Uro
rPa
nyiji
ar
Long
ochu
k
Mai
wut
Ula
ng
CEN
TR
AL
EAST
ERN
JON
GLE
ILA
KES
NO
RTH
ERN
BA
HR
EL G
HA
ZA
L
UN
ITY
UPP
ER N
ILE
WA
RR
AP
WES
TER
NBA
HR
EL
GH
AZ
AL
WES
TER
NEQ
UAT
OR
IA
EQU
ATO
RIA
EQU
ATO
RIA
Tota
l IDP
s1,6
15,7
65
736,
685
363,
198
889,
054
89,5
74
123,
968
Base
line
Ass
essm
ent
Rou
nd 9
Sept
embe
r 20
20
Gog
ria
Wes
t
Luak
piny
/Nas
ir
Juba
Kaj
oKe
ji
Lain
ya Mor
obo
Tere
keka
Yei
Budi
Ikot
os
Kap
oeta
Eas
tK
apoe
ta N
orth
Kap
oeta
Sou
th
Lafo
n
Mag
wi
Tori
t
Ako
bo
Bor
Sout
h
Can
al/P
igi
Duk
Fang
ak
Pibo
r
Poch
alla
Twic
Eas
t
Aw
eria
l
Cue
ibet
Rum
bek
Cen
tre
Rum
bek
East
Rum
bek
Nor
th
Wul
u
Yiro
l Eas
t
Yiro
l Wes
t
Aw
eil
Cen
tre
Aw
eil E
ast
Aw
eil
Nor
th
Aw
eil S
outh
Aw
eil
Wes
t
Abi
emnh
omG
uit
Koch
Leer
May
om
Pari
ang
Rub
kona
Balie
t
Fash
oda
Mab
an
Mal
akal
Man
yo
Mel
ut
Pany
ikan
g
Ren
k
Tonj
East
Tonj
Nor
th
Tonj
Sout
hJu
r R
iver
Raj
a
Wau
Ezo
Ibba
Mar
idi
Mun
dri
East
Mun
dri W
est
Mvo
lo
Nag
ero
Nza
ra
Tam
bura
Yam
bio
Ayo
dN
yiro
l Uro
r
May
endi
t
Pany
ijiar
Long
ochu
k
Mai
wut
Ula
ng
Gog
rial
East
KEN
YA
ETH
IOPI
A
DEM
OC
RAT
ICR
EPU
BLIC
OF
TH
E C
ON
GO
CEN
TR
AL
AFR
ICA
NR
EPU
BLIC
SUD
AN
SOU
TH
SU
DA
N
ABYE
I
¯0
100
50Km
Dat
a so
urce
: IO
M D
TM, U
NH
CR
DIS
CLAI
MER
: Thi
s m
ap is
for i
llust
ratio
npu
rpos
es o
nly.
Nam
es a
nd b
ound
arie
son
this
map
do
not i
mpl
y of
ficia
len
dors
emen
t or a
ccep
tanc
e by
IOM
.
Lege
nd: W
ithin
Sou
th S
udan
Abr
oad
<10,
000
10,0
00 -
20,
000
20,0
01 -
40,
000
40,0
00 -
60,
000
>60,
000
Stat
e
Cap
ital
! H
Ret
urne
d fr
om:
Ret
urne
es b
y co
unty
Cou
nty Dis
pute
d bo
unda
ry
Bou
ndar
ies:
Juba
Tota
l Ret
urne
es1,6
74,6
68
EQU
ATO
RIA
EAST
ERN
JON
GLE
I
LAK
ESUN
ITY
UPP
ER N
ILE
WA
RR
AP
GH
AZ
AL
BAH
R E
LN
ORT
HER
N
GH
AZ
AL
BAH
R E
LW
EST
ERN
WES
TER
N
CEN
TR
AL
EQU
ATO
RIA
EQU
ATO
RIA
Base
line
Ass
essm
ent
Rou
nd 9
Sept
embe
r 20
20
Figure 9: IDP presence in South Sudan by county (December 2020) Figure 10: Returnee presence in South Sudan by county (December 2020)
27 2020 MOBILITY OVERVIEW IN THE EAST AND HORN OF AFRICA AND THE ARABIAN PENINSULA 282020 MOBILITY OVERVIEW IN THE EAST AND HORN OF AFRICA AND THE ARABIAN PENINSULA
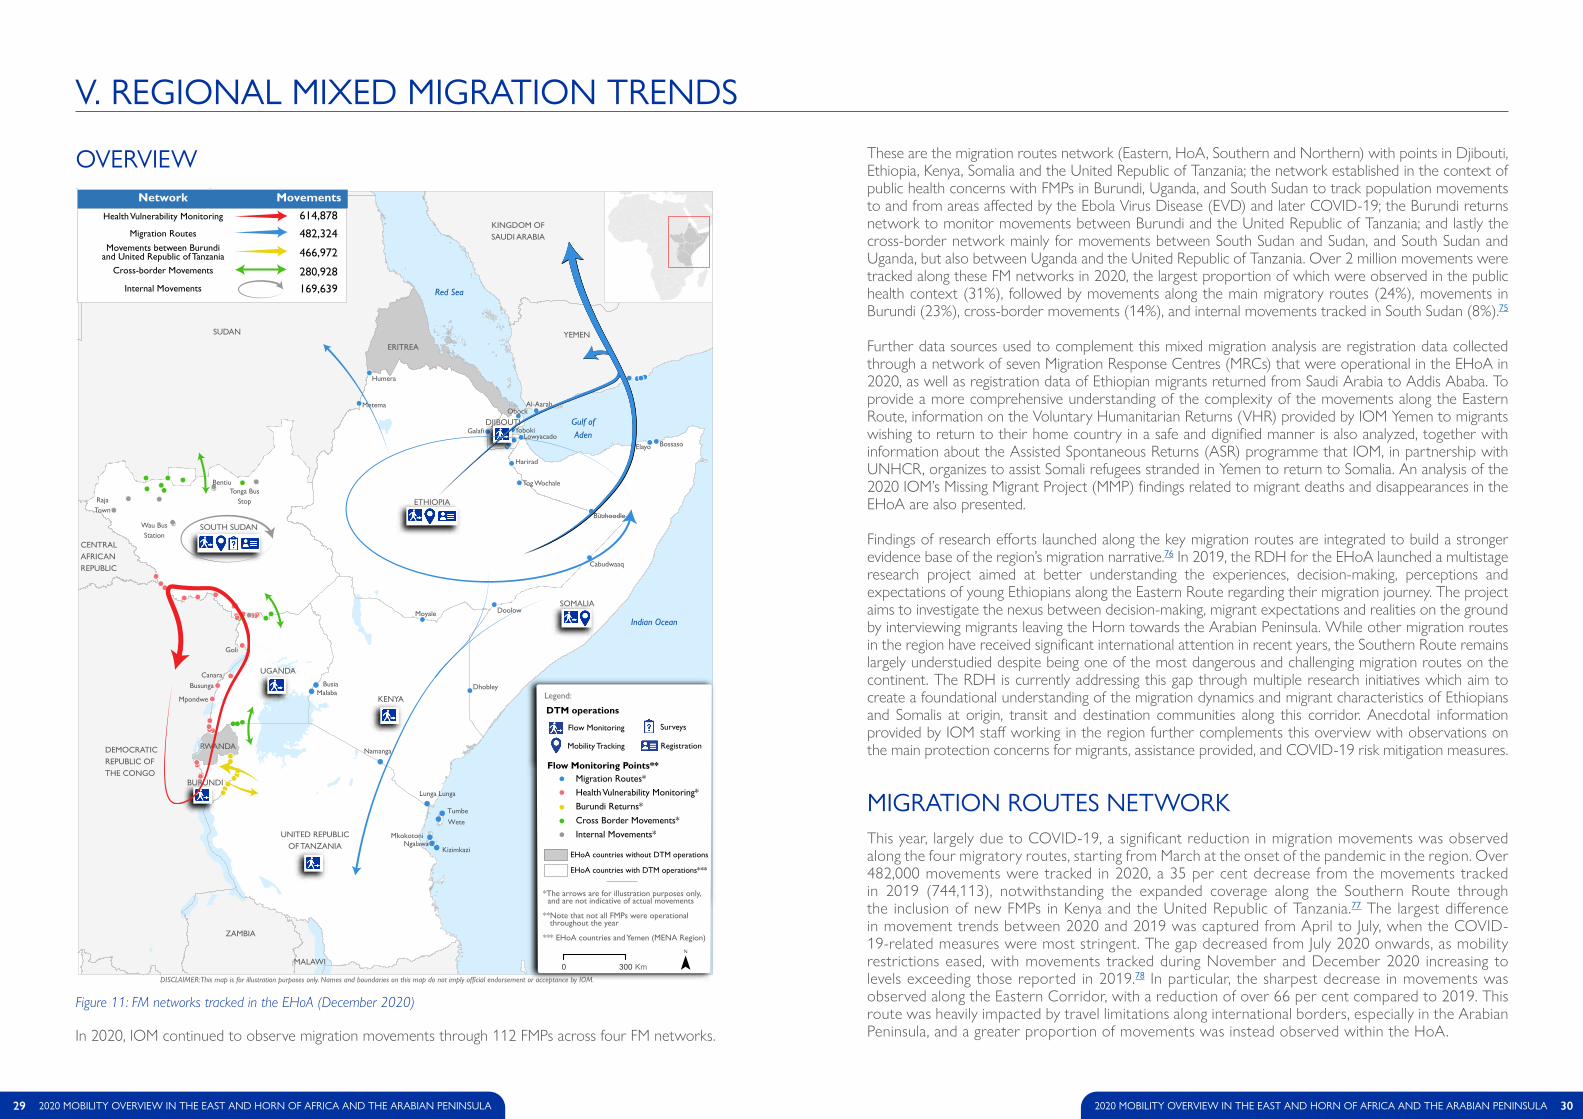
OVERVIEW
V� REGIONAL MIXED MIGRATION TRENDS
These are the migration routes network (Eastern, HoA, Southern and Northern) with points in Djibouti, Ethiopia, Kenya, Somalia and the United Republic of Tanzania; the network established in the context of public health concerns with FMPs in Burundi, Uganda, and South Sudan to track population movements to and from areas affected by the Ebola Virus Disease (EVD) and later COVID-19; the Burundi returns network to monitor movements between Burundi and the United Republic of Tanzania; and lastly the cross-border network mainly for movements between South Sudan and Sudan, and South Sudan and Uganda, but also between Uganda and the United Republic of Tanzania. Over 2 million movements were tracked along these FM networks in 2020, the largest proportion of which were observed in the public health context (31%), followed by movements along the main migratory routes (24%), movements in Burundi (23%), cross-border movements (14%), and internal movements tracked in South Sudan (8%).75
Further data sources used to complement this mixed migration analysis are registration data collected through a network of seven Migration Response Centres (MRCs) that were operational in the EHoA in 2020, as well as registration data of Ethiopian migrants returned from Saudi Arabia to Addis Ababa. To provide a more comprehensive understanding of the complexity of the movements along the Eastern Route, information on the Voluntary Humanitarian Returns (VHR) provided by IOM Yemen to migrants wishing to return to their home country in a safe and dignified manner is also analyzed, together with information about the Assisted Spontaneous Returns (ASR) programme that IOM, in partnership with UNHCR, organizes to assist Somali refugees stranded in Yemen to return to Somalia. An analysis of the 2020 IOM’s Missing Migrant Project (MMP) findings related to migrant deaths and disappearances in the EHoA are also presented.
Findings of research efforts launched along the key migration routes are integrated to build a stronger evidence base of the region’s migration narrative.76 In 2019, the RDH for the EHoA launched a multistage research project aimed at better understanding the experiences, decision-making, perceptions and expectations of young Ethiopians along the Eastern Route regarding their migration journey. The project aims to investigate the nexus between decision-making, migrant expectations and realities on the ground by interviewing migrants leaving the Horn towards the Arabian Peninsula. While other migration routes in the region have received significant international attention in recent years, the Southern Route remains largely understudied despite being one of the most dangerous and challenging migration routes on the continent. The RDH is currently addressing this gap through multiple research initiatives which aim to create a foundational understanding of the migration dynamics and migrant characteristics of Ethiopians and Somalis at origin, transit and destination communities along this corridor. Anecdotal information provided by IOM staff working in the region further complements this overview with observations on the main protection concerns for migrants, assistance provided, and COVID-19 risk mitigation measures.
MIGRATION ROUTES NETWORKThis year, largely due to COVID-19, a significant reduction in migration movements was observed along the four migratory routes, starting from March at the onset of the pandemic in the region. Over 482,000 movements were tracked in 2020, a 35 per cent decrease from the movements tracked in 2019 (744,113), notwithstanding the expanded coverage along the Southern Route through the inclusion of new FMPs in Kenya and the United Republic of Tanzania.77 The largest difference in movement trends between 2020 and 2019 was captured from April to July, when the COVID-19-related measures were most stringent. The gap decreased from July 2020 onwards, as mobility restrictions eased, with movements tracked during November and December 2020 increasing to levels exceeding those reported in 2019.78 In particular, the sharpest decrease in movements was observed along the Eastern Corridor, with a reduction of over 66 per cent compared to 2019. This route was heavily impacted by travel limitations along international borders, especially in the Arabian Peninsula, and a greater proportion of movements was instead observed within the HoA.In 2020, IOM continued to observe migration movements through 112 FMPs across four FM networks.
Figure 11: FM networks tracked in the EHoA (December 2020)
!
!
!
!
!
!
!
!
!
!!
!
!
!
!
!
!
!
!
!!
!
!
!
!
!
!
!!
!
!
!
!
!!
!
!
!
!
!
!
!
!
!
!
!!
!
!
!
!
!
!
!
!
!
!
!
! !
!
!
!
!
!
!
!
!
!
!
!
!
!
!
!
!
!
!
!
!!
Goli
Obock
Elayo
Doolow
Metema
Yoboki
Humera
Galafi
Canara
Mpondwe
Busunga
Bossaso
Dhobley
Harirad
Al-Aarah
Buuhoodle
Cabudwaaq
RajaTown
Lowyacado
Tog WochaleTonga Bus
Stop
Bentiu
Wau BusStation
DISCLAIMER: This map is for illustration purposes only. Names and boundaries on this map do not imply official endorsement or acceptance by IOM.
Red Sea
Indian Ocean
Gulf ofAden
Moyale
Lunga Lunga
Namanga
BusiaMalaba
Tumbe
Wete
Kizimkazi
MkokotoniNgalawa
SUDAN
ETHIOPIA
KENYA
SOMALIA
YEMEN
SOUTH SUDAN
UNITED REPUBLICOF TANZANIA
DEMOCRATICREPUBLIC OFTHE CONGO
UGANDA
ZAMBIA
KINGDOM OFSAUDI ARABIA
ERITREA
RWANDA
MALAWI
CENTRALAFRICANREPUBLIC
BURUNDI
DJIBOUTI
Legend:
Flow Monitoring Points**
EHoA countries without DTM operations
Flow Monitoring
Mobility Tracking Registration
Surveys
DTM operations
Burundi Returns*Cross Border Movements*
Health Vulnerability Monitoring*Migration Routes*
Internal Movements*
0 300 Km ¯
EHoA countries with DTM operations***
Network MovementsHealth Vulnerability Monitoring 614,878
Migration Routes 482,324
and United Republic of Tanzania 466,972Cross-border Movements 280,928
Internal Movements 169,639
Movements between Burundi
*The arrows are for illustration purposes only, and are not indicative of actual movements
**Note that not all FMPs were operational throughout the year
*** EHoA countries and Yemen (MENA Region)
29 2020 MOBILITY OVERVIEW IN THE EAST AND HORN OF AFRICA AND THE ARABIAN PENINSULA 302020 MOBILITY OVERVIEW IN THE EAST AND HORN OF AFRICA AND THE ARABIAN PENINSULA

Equatorial Guinea
GambiaGuinea-Bissau
Eswatini
Djibouti
RwandaBurundi
Lesotho
Sierra Leone Togo
Liberia
Malawi
Eritrea
Western Sahara
Benin
Burkina Faso
Senegal
Central African Republic
Côte d'Ivoire
Tunisia
United Republic of Tanzania
Madagascar
Mozambique
Democratic Republic of the Congo
Uganda
Guinea
Ghana
Gabon
Zimbabwe
CameroonSouth Sudan
Congo
Morocco
Botswana
Yemen
Somalia
Kenya
Zambia
Mauritania
Namibia
Nigeria
South Africa
Ethiopia
Kingdom of Saudi Arabia
Angola
Egypt
Niger
ChadSudan
Mali
LibyaAlgeria
llllllllllllllllll
The Eastern Route refers to the movement between the Horn of Africa and the Arab Peninsula, in par�cular the Kingdom of Saudi Arabia, but also other countries in the Peninsula
The Horn of Africa Route refers to the movement towards countries within the Horn of Africa
The Northern Route refers to movements origi-nated from East and the Horn of Africa, through Sudan and Libya across the Central Mediterranean towards Europe, in par�cular Italy
The Southern Route runs from the Horn of Africa, through Eastern Africa towards Southern Africa
*Movements tracked in Djibouti, Ethiopia, Kenya, Somalia, the United Republic of Tanzania and Yemen only – 0.1% movements were tracked along other routes as well.
33%
54%
1%
12%
Disclaimer: This map is for illustra�on purposes only. Names and boundaries on this map do not imply official endorsement or acceptance by IOM.
482,324Movements tracked in 2020*
Figure 12: Main migration routes in the EHoA (December 2020)
Figure 13: Movements tracked along the four routes in 2019 and 2020
31 2020 MOBILITY OVERVIEW IN THE EAST AND HORN OF AFRICA AND THE ARABIAN PENINSULA
In Adogolo, migrants gather for a prayer while waiting for pickups to take them to the boats. Photo: © IOM / Alexander Bee
January February March April May June July August September October November December
COVID-19 outbreak and movement restrictions
40,543
66,891
54,951
25,563
28,80025,082
18,612
30,692 35,224
50,710 50,320
54,936
63,251
44,730
59,183
71,224
78,647
73,00871,885
56,681
75,811 76,108
33,359
40,226
2020 2019 *Difference between 2020 and 2019
Jan(-36%)*
Feb(+50%)*
Mar(-7%)*
Apr(-64%)*
May(-63%)*
Jun(-66%)*
Jul(-74%)*
Aug(-46%)*
Sep(-54%)*
Oct(-33%)*
Nov(+51%)*
Dec(+37%)*
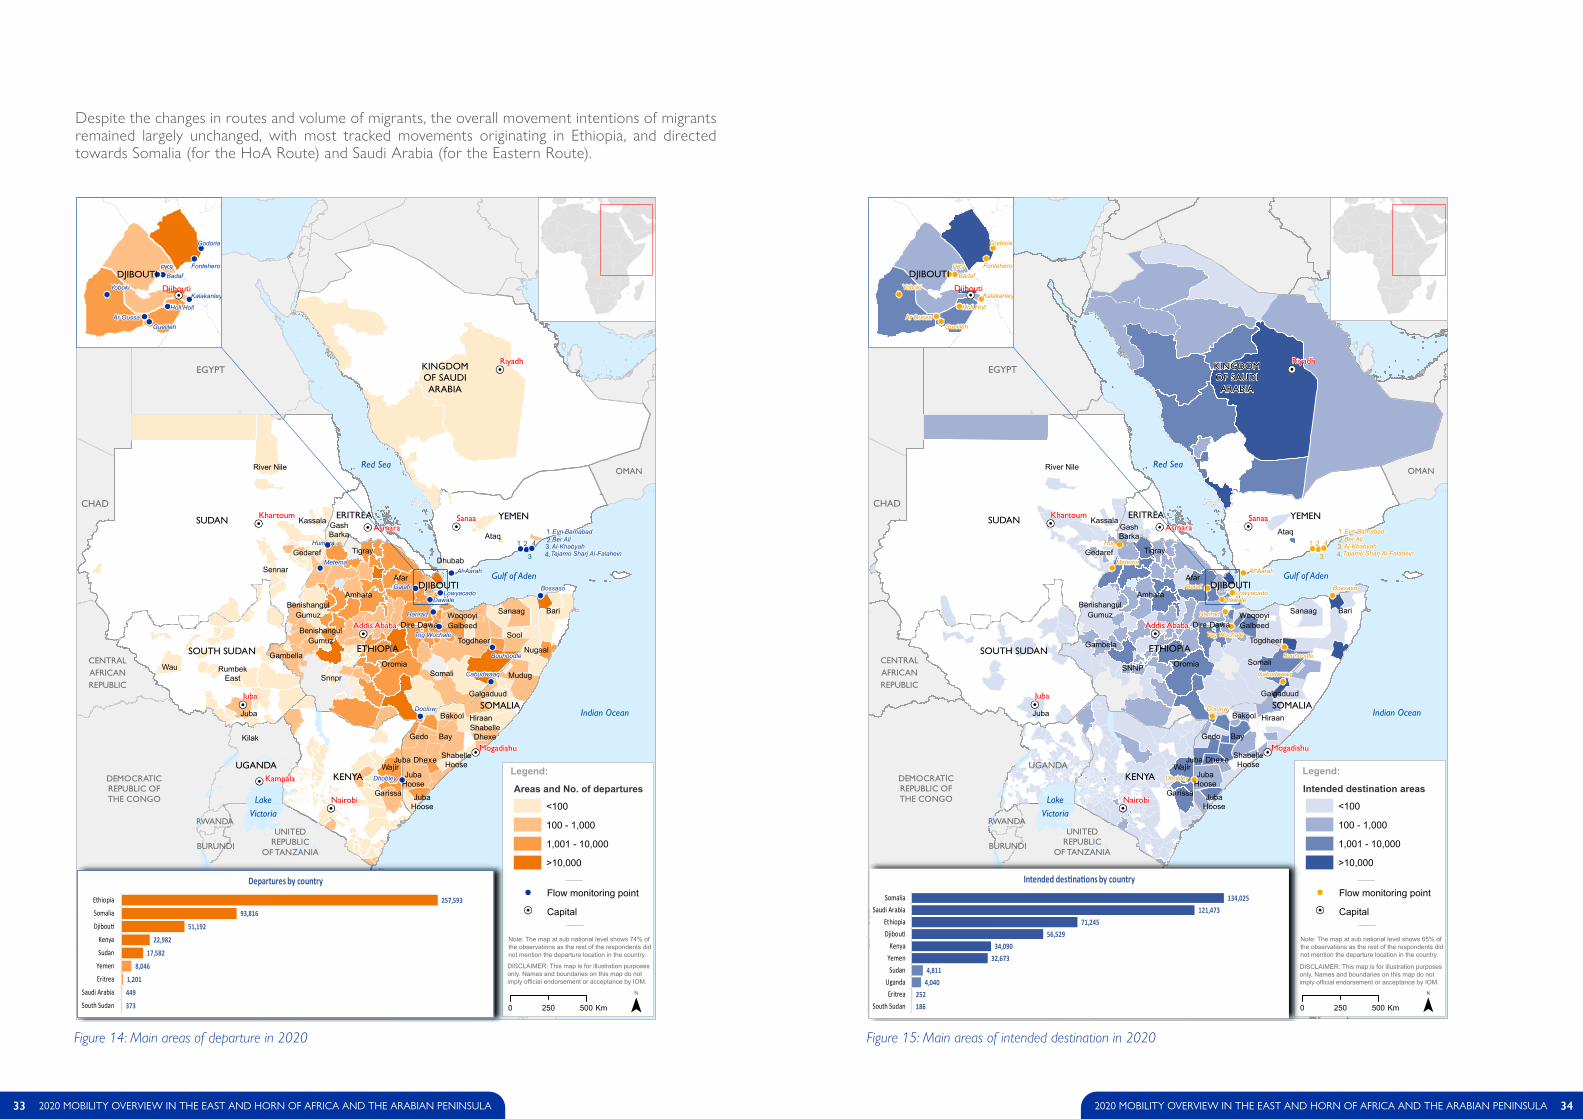
GashBarka
Juba
RumbekEast
Wau
Gedaref
Kassala
River Nile
Kilak
Sennar
Garissa
Wajir
Ataq
Dhubab
1 4
3
2
1.
4.3.2.
RWANDA
SOMALIA
KENYA
SOUTH SUDAN
UNITEDREPUBLIC
OF TANZANIA
UGANDA
ETHIOPIA
ERITREA
DJIBOUTI
BURUNDI
CHAD
DEMOCRATICREPUBLIC OFTHE CONGO
CENTRALAFRICANREPUBLIC
LIBYA
SUDAN
EGYPT
IRAN (ISLAMICREPUBLIC OF)
OMAN
KINGDOMOF SAUDIARABIA
YEMEN
Tigray
Afar
Amhara
OromiaSomali
BenishangulGumuz
BenishangulGumuz
Snnpr
Gambella
Dire DawaWoqooyiGalbeed
TogdheerSool
Sanaag Bari
Nugaal
Mudug
Galgaduud
HiraanShabelleDhexe
ShabelleHoose
Bay
Bakool
Gedo
Juba Dhexe
JubaHoose
JubaHooseKampala
KhartoumAsmara
Sanaa
Addis Ababa
Mogadishu
Riyadh
Nairobi
Juba
Galafi
Humera
Metema
Tog Wochale
Bossaso
Buuhoodle
Cabudwaaq
Dhobley
Doolow
Harirad
Al-Aarah
Al-KhabyahBer AliEyn Bamabad
Tajamo Sharj Al-Falahein
LowyacadoDawale
PK9Badaf
Yoboki
Godoria
GueliléhAr Oussa
Holl Holl
Fontehero
KalakanleyDjibouti
Red Sea
Indian Ocean
Gulf of Aden
LakeVictoria
DJIBOUTI
Note: The map at sub national level shows 74% ofthe observations as the rest of the respondents didnot mention the departure location in the country.
DISCLAIMER: This map is for illustration purposesonly. Names and boundaries on this map do notimply official endorsement or acceptance by IOM.
Legend:
Areas and No. of departures
<100
100 - 1,000
1,001 - 10,000
>10,000
Flow monitoring point
Capital
0 500250 Km34
140
353
1,030
6,127
9,491
31,417
55,386
137,367
South Sudan
Kingdom of Saudi Arabia
Yemen
Eritrea
Kenya
Sudan
Djibou�
Somalia
Ethiopia
Departures by country
373
449
1,201
8,046
17,582
22,982
51,192
93,816
257,593
South Sudan
Saudi Arabia
Eritrea
Yemen
Sudan
Kenya
Djibou�
Somalia
Ethiopia
Departures by country
GashBarka
Juba
Gedaref
Kassala
River Nile
Garissa
Wajir
Ataq1 4
3
2
1.
4.3.2.
Gambela
RWANDA
SOMALIA
KENYA
SOUTH SUDAN
UNITEDREPUBLIC
OF TANZANIA
UGANDA
ETHIOPIA
ERITREA
DJIBOUTI
BURUNDI
CHAD
DEMOCRATICREPUBLIC OFTHE CONGO
CENTRALAFRICANREPUBLIC
LIBYA
SUDAN
EGYPT
IRAN (ISLAMICREPUBLIC OF)
OMAN
KINGDOMOF SAUDIARABIA
YEMEN
Tigray
Afar
Amhara
Oromia Somali
BenishangulGumuz
SNNP
Dire DawaWoqooyiGalbeed
Togdheer
Sanaag Bari
Galgaduud
Hiraan
ShabelleHoose
Bay
Bakool
Gedo
Juba Dhexe
JubaHoose
JubaHoose
KhartoumAsmara
Sanaa
Addis Ababa
Mogadishu
Riyadh
Nairobi
Juba
Galafi
Humera
Metema
Tog Wochale
Bossaso
Buuhoodle
Cabudwaaq
Dhobley
Doolow
Harirad
Al-Aarah
Al-KhabyahBer AliEyn Bamabad
Tajamo Sharj Al-Falahein
LowyacadoDawale
PK9Badaf
Yoboki
Godoria
GueliléhAr Oussa
Holl Holl
Fontehero
KalakanleyDjibouti
Red Sea
Indian Ocean
Gulf of Aden
LakeVictoria
DJIBOUTI
Note: The map at sub national level shows 65% ofthe observations as the rest of the respondents didnot mention the departure location in the country.
DISCLAIMER: This map is for illustration purposesonly. Names and boundaries on this map do notimply official endorsement or acceptance by IOM.
Legend:
Intended destination areas
<100
100 - 1,000
1,001 - 10,000
>10,000
Flow monitoring point
Capital
0 500250 Km40 42 172
3,109 6,553
15,196 28,245
37,356 56,889
91,527
UgandaSouth Sudan
EritreaSudanKenya
YemenDjibou�EthiopiaSomalia
Kingdom of Saudi Arabia
Intended des�na�ons by country
186 252
4,040 4,811
32,673 34,090
56,529 71,245
121,473 134,025
South SudanEritrea
UgandaSudan
YemenKenya
Djibou�Ethiopia
Saudi ArabiaSomalia
Intended des�na�ons by country
Despite the changes in routes and volume of migrants, the overall movement intentions of migrants remained largely unchanged, with most tracked movements originating in Ethiopia, and directed towards Somalia (for the HoA Route) and Saudi Arabia (for the Eastern Route).
Figure 14: Main areas of departure in 2020 Figure 15: Main areas of intended destination in 2020
33 2020 MOBILITY OVERVIEW IN THE EAST AND HORN OF AFRICA AND THE ARABIAN PENINSULA 342020 MOBILITY OVERVIEW IN THE EAST AND HORN OF AFRICA AND THE ARABIAN PENINSULA
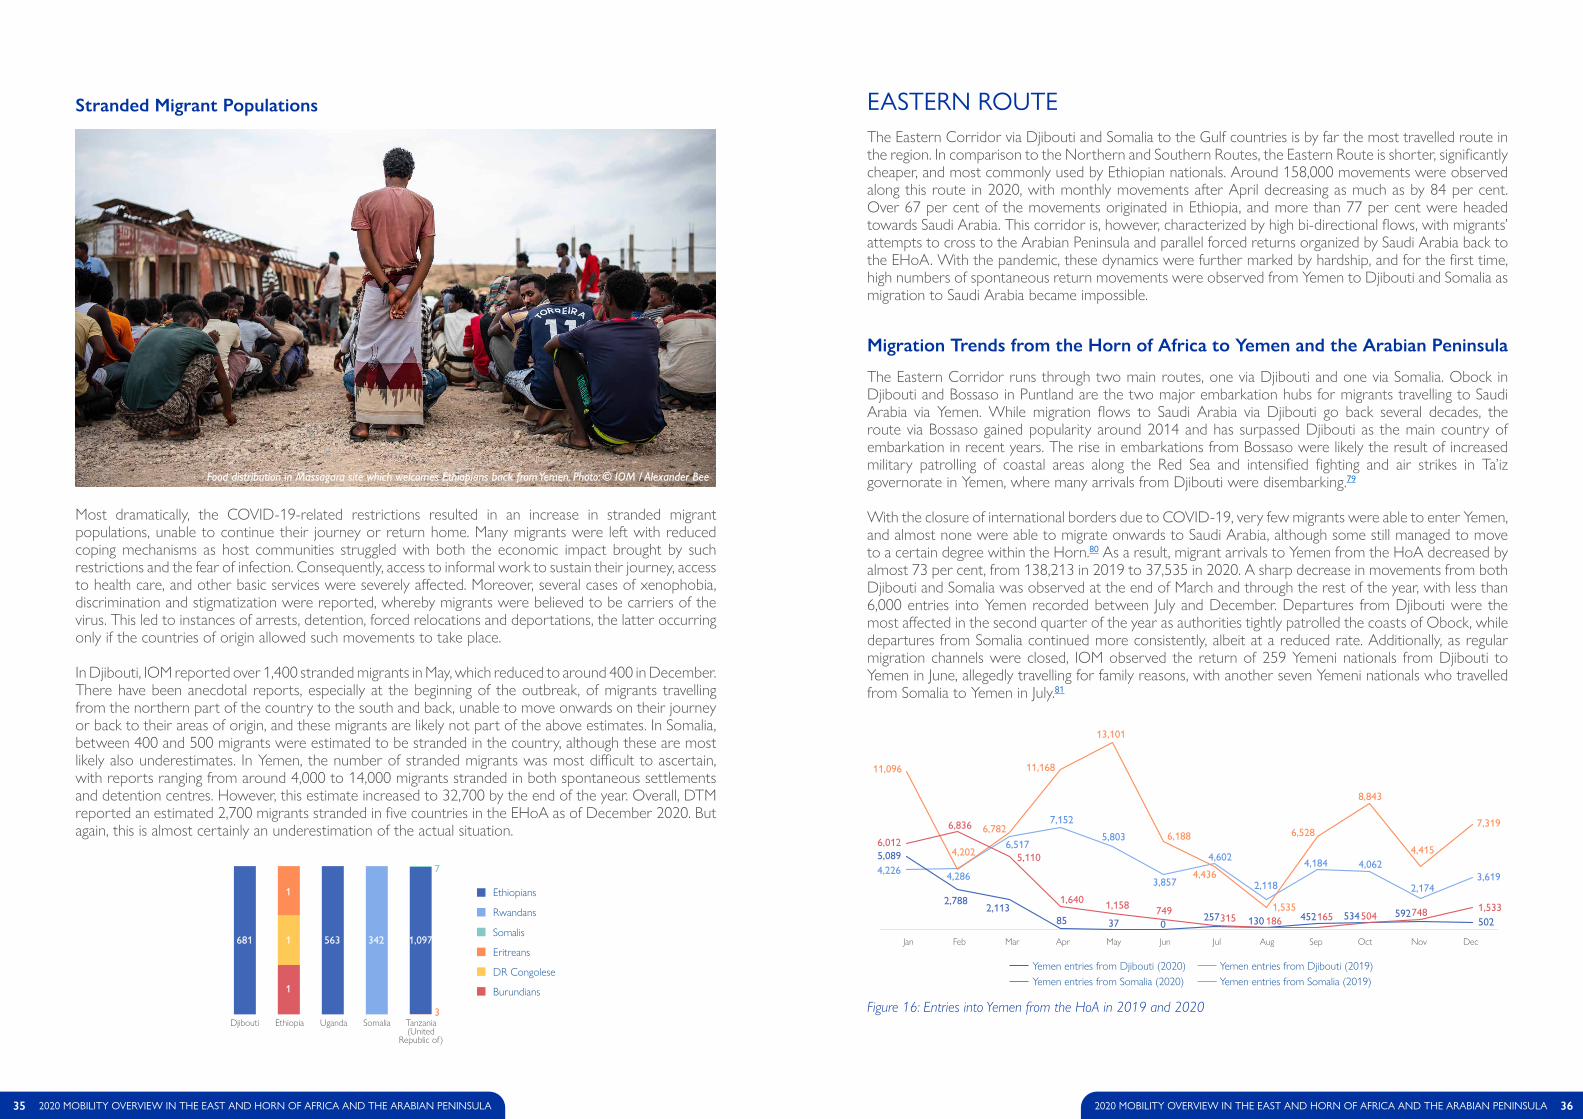
Most dramatically, the COVID-19-related restrictions resulted in an increase in stranded migrant populations, unable to continue their journey or return home. Many migrants were left with reduced coping mechanisms as host communities struggled with both the economic impact brought by such restrictions and the fear of infection. Consequently, access to informal work to sustain their journey, access to health care, and other basic services were severely affected. Moreover, several cases of xenophobia, discrimination and stigmatization were reported, whereby migrants were believed to be carriers of the virus. This led to instances of arrests, detention, forced relocations and deportations, the latter occurring only if the countries of origin allowed such movements to take place.
In Djibouti, IOM reported over 1,400 stranded migrants in May, which reduced to around 400 in December. There have been anecdotal reports, especially at the beginning of the outbreak, of migrants travelling from the northern part of the country to the south and back, unable to move onwards on their journey or back to their areas of origin, and these migrants are likely not part of the above estimates. In Somalia, between 400 and 500 migrants were estimated to be stranded in the country, although these are most likely also underestimates. In Yemen, the number of stranded migrants was most difficult to ascertain, with reports ranging from around 4,000 to 14,000 migrants stranded in both spontaneous settlements and detention centres. However, this estimate increased to 32,700 by the end of the year. Overall, DTM reported an estimated 2,700 migrants stranded in five countries in the EHoA as of December 2020. But again, this is almost certainly an underestimation of the actual situation.
EASTERN ROUTEThe Eastern Corridor via Djibouti and Somalia to the Gulf countries is by far the most travelled route in the region. In comparison to the Northern and Southern Routes, the Eastern Route is shorter, significantly cheaper, and most commonly used by Ethiopian nationals. Around 158,000 movements were observed along this route in 2020, with monthly movements after April decreasing as much as by 84 per cent. Over 67 per cent of the movements originated in Ethiopia, and more than 77 per cent were headed towards Saudi Arabia. This corridor is, however, characterized by high bi-directional flows, with migrants’ attempts to cross to the Arabian Peninsula and parallel forced returns organized by Saudi Arabia back to the EHoA. With the pandemic, these dynamics were further marked by hardship, and for the first time, high numbers of spontaneous return movements were observed from Yemen to Djibouti and Somalia as migration to Saudi Arabia became impossible.
The Eastern Corridor runs through two main routes, one via Djibouti and one via Somalia. Obock in Djibouti and Bossaso in Puntland are the two major embarkation hubs for migrants travelling to Saudi Arabia via Yemen. While migration flows to Saudi Arabia via Djibouti go back several decades, the route via Bossaso gained popularity around 2014 and has surpassed Djibouti as the main country of embarkation in recent years. The rise in embarkations from Bossaso were likely the result of increased military patrolling of coastal areas along the Red Sea and intensified fighting and air strikes in Ta’iz governorate in Yemen, where many arrivals from Djibouti were disembarking.79
With the closure of international borders due to COVID-19, very few migrants were able to enter Yemen, and almost none were able to migrate onwards to Saudi Arabia, although some still managed to move to a certain degree within the Horn.80 As a result, migrant arrivals to Yemen from the HoA decreased by almost 73 per cent, from 138,213 in 2019 to 37,535 in 2020. A sharp decrease in movements from both Djibouti and Somalia was observed at the end of March and through the rest of the year, with less than 6,000 entries into Yemen recorded between July and December. Departures from Djibouti were the most affected in the second quarter of the year as authorities tightly patrolled the coasts of Obock, while departures from Somalia continued more consistently, albeit at a reduced rate. Additionally, as regular migration channels were closed, IOM observed the return of 259 Yemeni nationals from Djibouti to Yemen in June, allegedly travelling for family reasons, with another seven Yemeni nationals who travelled from Somalia to Yemen in July.81
Figure 16: Entries into Yemen from the HoA in 2019 and 2020
35 2020 MOBILITY OVERVIEW IN THE EAST AND HORN OF AFRICA AND THE ARABIAN PENINSULA 362020 MOBILITY OVERVIEW IN THE EAST AND HORN OF AFRICA AND THE ARABIAN PENINSULA
Stranded Migrant Populations
Rwandans
Somalis
Ethiopians
Eritreans
DR Congolese
Burundians
Djibouti Ethiopia SomaliaUganda Tanzania (United
Republic of)
1,0973425631
1
1
681
7
3
Food distribution in Massagara site which welcomes Ethiopians back from Yemen. Photo: © IOM / Alexander Bee
Migration Trends from the Horn of Africa to Yemen and the Arabian Peninsula
Jan Feb Mar Apr May Jun Jul Aug Sep Oct Nov DecJun Jul Aug Sep Oct Nov DecJan Feb Mar Apr May
5,089
2,7882,113
85 37 0257 130 452 534 592
502
4,226 4,286
6,517
7,152
5,803
3,857
4,602
2,118
4,184 4,062
2,1743,619
11,096
4,202
6,782
11,168
13,101
6,188
4,436
1,535
6,528
8,843
4,415
7,319
6,012
6,836
5,110
1,640 1,158 749315 186 165 504 748 1,533
Yemen entries from Djibouti (2020) Yemen entries from Djibouti (2019)Yemen entries from Somalia (2020) Yemen entries from Somalia (2019)
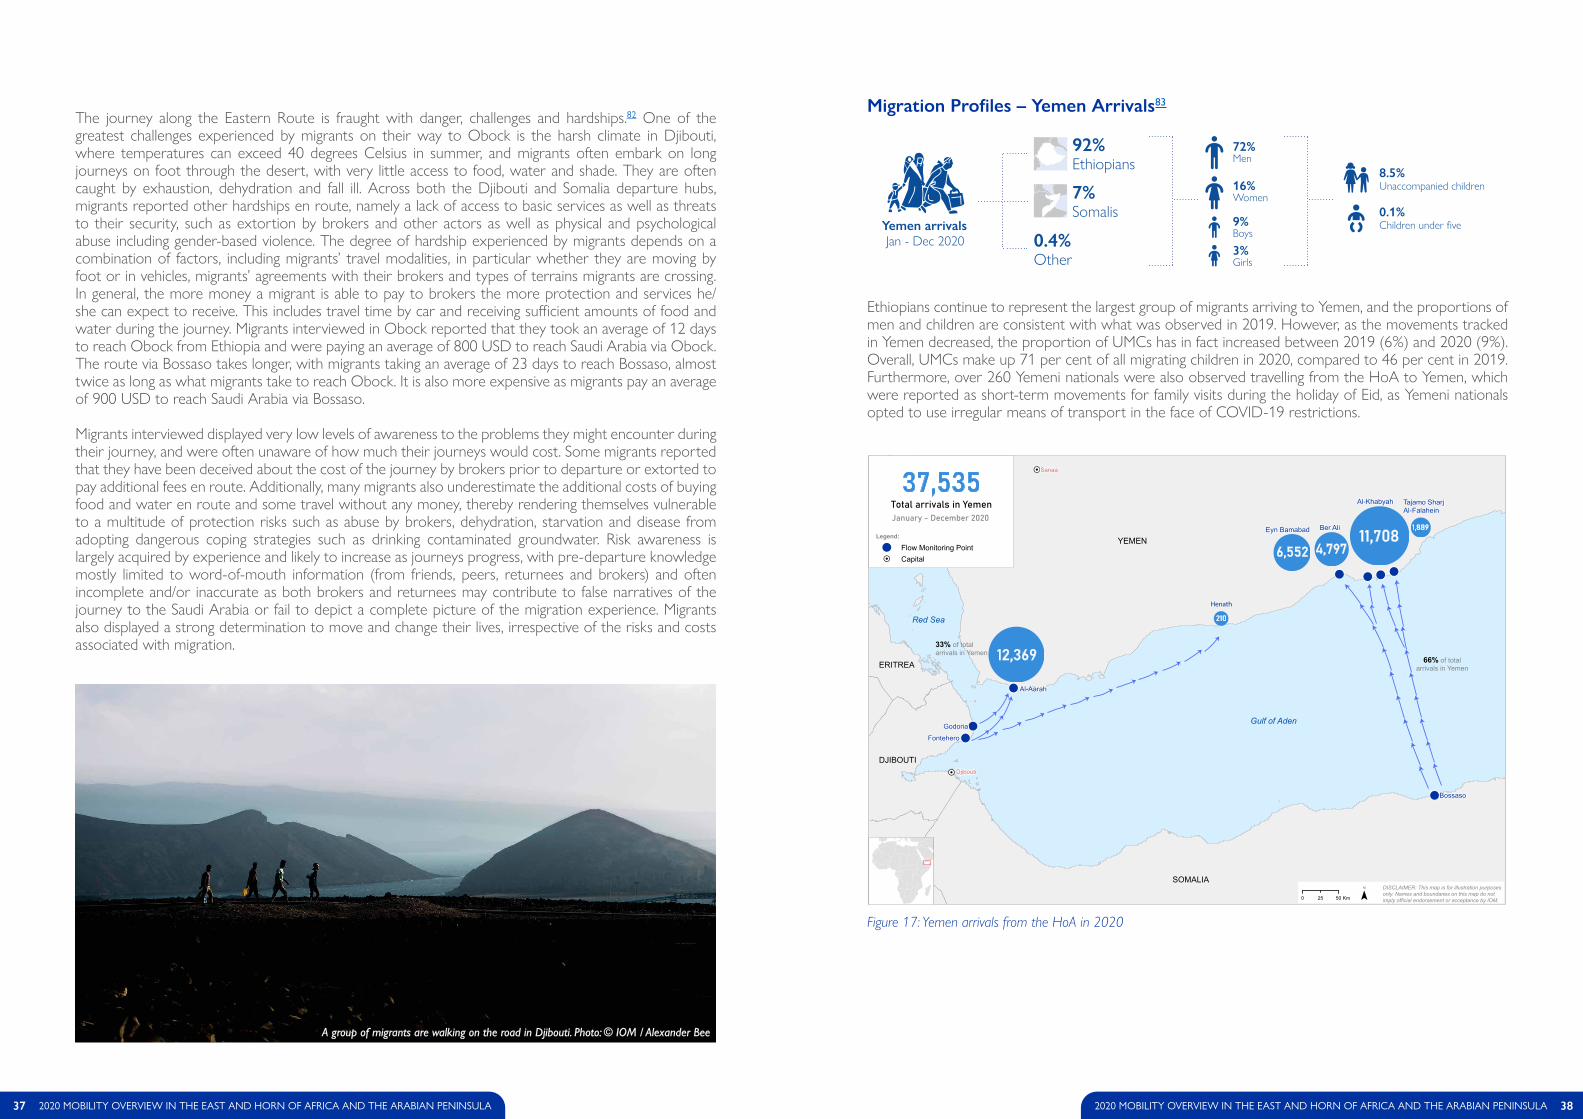
The journey along the Eastern Route is fraught with danger, challenges and hardships.82 One of the greatest challenges experienced by migrants on their way to Obock is the harsh climate in Djibouti, where temperatures can exceed 40 degrees Celsius in summer, and migrants often embark on long journeys on foot through the desert, with very little access to food, water and shade. They are often caught by exhaustion, dehydration and fall ill. Across both the Djibouti and Somalia departure hubs, migrants reported other hardships en route, namely a lack of access to basic services as well as threats to their security, such as extortion by brokers and other actors as well as physical and psychological abuse including gender-based violence. The degree of hardship experienced by migrants depends on a combination of factors, including migrants’ travel modalities, in particular whether they are moving by foot or in vehicles, migrants’ agreements with their brokers and types of terrains migrants are crossing. In general, the more money a migrant is able to pay to brokers the more protection and services he/she can expect to receive. This includes travel time by car and receiving sufficient amounts of food and water during the journey. Migrants interviewed in Obock reported that they took an average of 12 days to reach Obock from Ethiopia and were paying an average of 800 USD to reach Saudi Arabia via Obock. The route via Bossaso takes longer, with migrants taking an average of 23 days to reach Bossaso, almost twice as long as what migrants take to reach Obock. It is also more expensive as migrants pay an average of 900 USD to reach Saudi Arabia via Bossaso.
Migrants interviewed displayed very low levels of awareness to the problems they might encounter during their journey, and were often unaware of how much their journeys would cost. Some migrants reported that they have been deceived about the cost of the journey by brokers prior to departure or extorted to pay additional fees en route. Additionally, many migrants also underestimate the additional costs of buying food and water en route and some travel without any money, thereby rendering themselves vulnerable to a multitude of protection risks such as abuse by brokers, dehydration, starvation and disease from adopting dangerous coping strategies such as drinking contaminated groundwater. Risk awareness is largely acquired by experience and likely to increase as journeys progress, with pre-departure knowledge mostly limited to word-of-mouth information (from friends, peers, returnees and brokers) and often incomplete and/or inaccurate as both brokers and returnees may contribute to false narratives of the journey to the Saudi Arabia or fail to depict a complete picture of the migration experience. Migrants also displayed a strong determination to move and change their lives, irrespective of the risks and costs associated with migration.
Figure 17: Yemen arrivals from the HoA in 2020
!H
!H
!!
!
!
!!! !
FonteheroGodoria
Bossaso
Al-Aarah
Sanaa
Djibouti
YEMEN
SOMALIA
DJIBOUTI
ETHIOPIA
ERITREA
Gulf of Aden
Red Sea
!
DISCLAIMER: This map is for illustration purposesonly. Names and boundaries on this map do notimply official endorsement or acceptance by IOM. 0 mK52 05 ¯
Al-Khabyah
Ber AliEyn Bamabad
Tajamo SharjAl-Falahein
12,369
Total arrivals in Yemen
33% of total arrivals in Yemen
66% of total arrivals in Yemen
January - December 2020
Henath
37,535
6,552 4,79711,708
1,889
210
Legend:
! Flow Monitoring PointH Capital
37 2020 MOBILITY OVERVIEW IN THE EAST AND HORN OF AFRICA AND THE ARABIAN PENINSULA 382020 MOBILITY OVERVIEW IN THE EAST AND HORN OF AFRICA AND THE ARABIAN PENINSULA
A group of migrants are walking on the road in Djibouti. Photo: © IOM / Alexander Bee
Yemen arrivalsJan - Dec 2020
92%Ethiopians
0.4%Other
3%Girls
9%Boys
72%Men
16%Women
8.5%Unaccompanied children
0.1%Children under five
7%Somalis
Ethiopians continue to represent the largest group of migrants arriving to Yemen, and the proportions of men and children are consistent with what was observed in 2019. However, as the movements tracked in Yemen decreased, the proportion of UMCs has in fact increased between 2019 (6%) and 2020 (9%). Overall, UMCs make up 71 per cent of all migrating children in 2020, compared to 46 per cent in 2019. Furthermore, over 260 Yemeni nationals were also observed travelling from the HoA to Yemen, which were reported as short-term movements for family visits during the holiday of Eid, as Yemeni nationals opted to use irregular means of transport in the face of COVID-19 restrictions.
Migration Profiles – Yemen Arrivals83
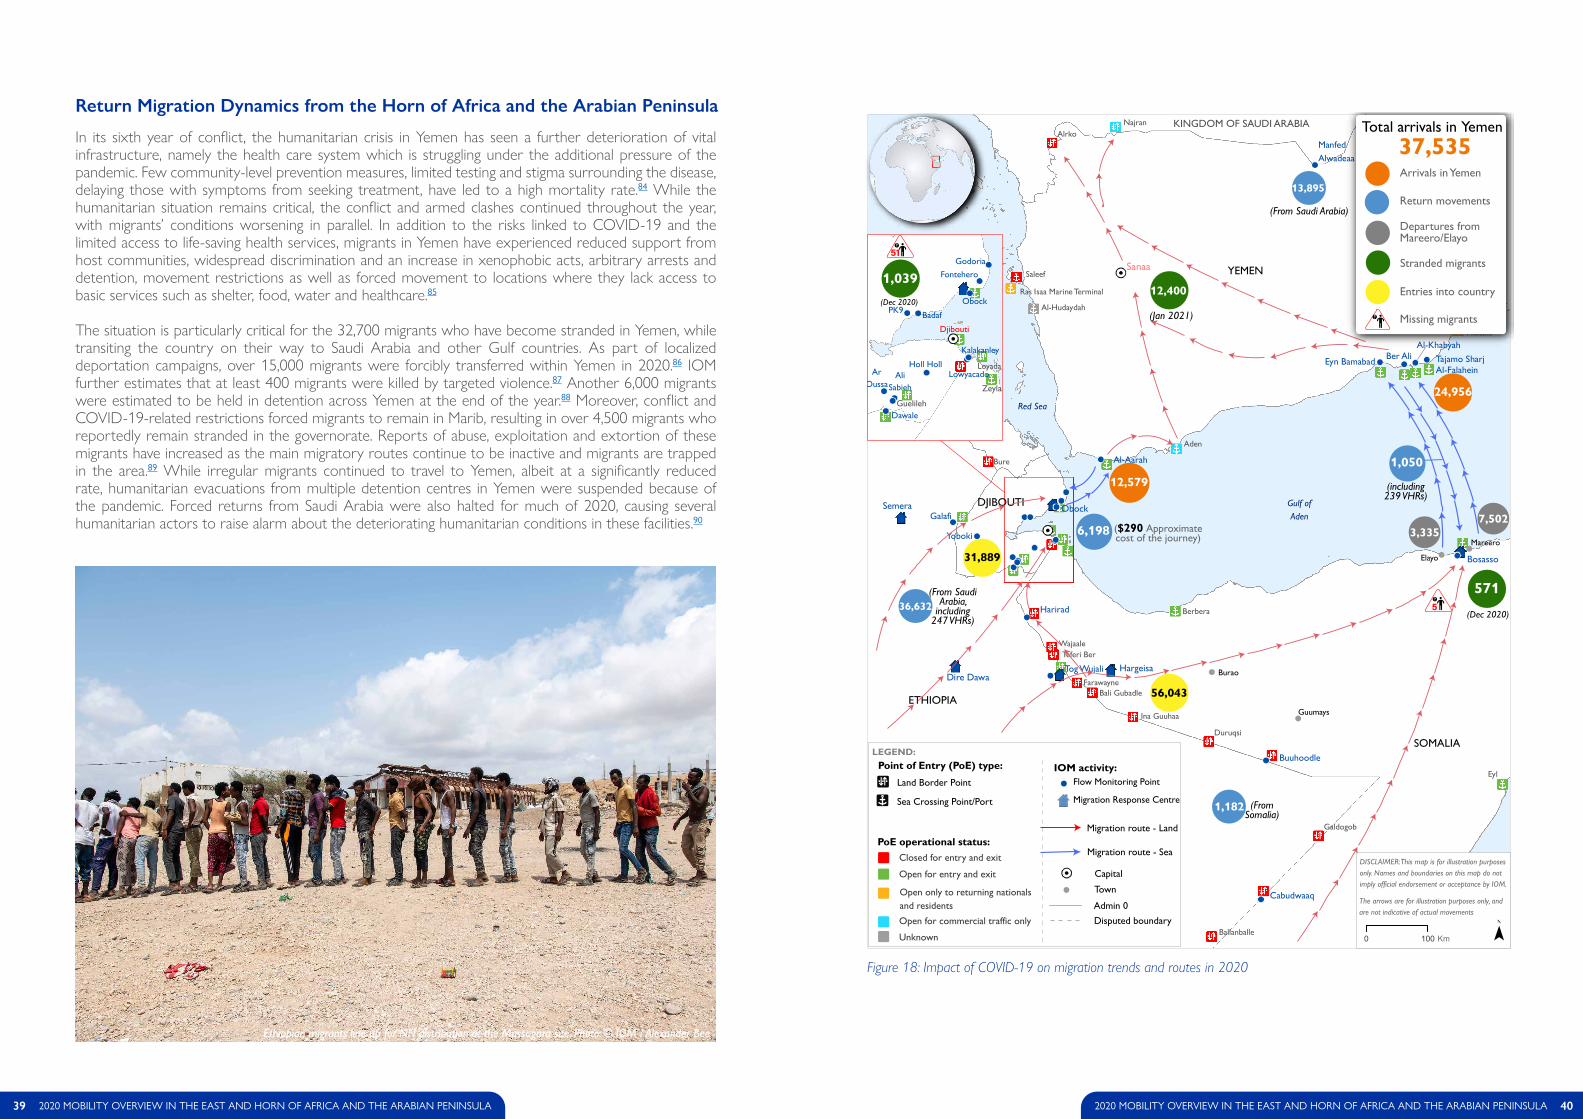
In its sixth year of conflict, the humanitarian crisis in Yemen has seen a further deterioration of vital infrastructure, namely the health care system which is struggling under the additional pressure of the pandemic. Few community-level prevention measures, limited testing and stigma surrounding the disease, delaying those with symptoms from seeking treatment, have led to a high mortality rate.84 While the humanitarian situation remains critical, the conflict and armed clashes continued throughout the year, with migrants’ conditions worsening in parallel. In addition to the risks linked to COVID-19 and the limited access to life-saving health services, migrants in Yemen have experienced reduced support from host communities, widespread discrimination and an increase in xenophobic acts, arbitrary arrests and detention, movement restrictions as well as forced movement to locations where they lack access to basic services such as shelter, food, water and healthcare.85
The situation is particularly critical for the 32,700 migrants who have become stranded in Yemen, while transiting the country on their way to Saudi Arabia and other Gulf countries. As part of localized deportation campaigns, over 15,000 migrants were forcibly transferred within Yemen in 2020.86 IOM further estimates that at least 400 migrants were killed by targeted violence.87 Another 6,000 migrants were estimated to be held in detention across Yemen at the end of the year.88 Moreover, conflict and COVID-19-related restrictions forced migrants to remain in Marib, resulting in over 4,500 migrants who reportedly remain stranded in the governorate. Reports of abuse, exploitation and extortion of these migrants have increased as the main migratory routes continue to be inactive and migrants are trapped in the area.89 While irregular migrants continued to travel to Yemen, albeit at a significantly reduced rate, humanitarian evacuations from multiple detention centres in Yemen were suspended because of the pandemic. Forced returns from Saudi Arabia were also halted for much of 2020, causing several humanitarian actors to raise alarm about the deteriorating humanitarian conditions in these facilities.90
Return Migration Dynamics from the Horn of Africa and the Arabian Peninsula
Figure 18: Impact of COVID-19 on migration trends and routes in 2020
39 2020 MOBILITY OVERVIEW IN THE EAST AND HORN OF AFRICA AND THE ARABIAN PENINSULA 402020 MOBILITY OVERVIEW IN THE EAST AND HORN OF AFRICA AND THE ARABIAN PENINSULA
KINGDOM OF SAUDI ARABIA
Tog Wujali
Wajaale
SOMALIA
ETHIOPIA
ERITREA
DJIBOUTI
YEMEN
Bosasso
Hargeisa
ObockSemera
Dire Dawa
Sanaa
Al-Aarah
Al-KhabyahBer Ali
Buuhoodle
Cabudwaaq
Eyn Bamabad
Galafi
Harirad
Tajamo SharjAl-Falahein
Yoboki
ManfedAlwadeaa
Eyl
Galdogob
Ballanballe
Duruqsi
Berbera
Ina Guuhaa
Bali GubadleFarawayne
Teferi Ber
Bure
AlrkoNajran
Aden
Ras Isaa Marine Terminal
Saleef
Al-Hudaydah Ash Shihr
Mukalla
Burao
Elayo
Guumays
Mareero
Red Sea
IndianOcean
Gulf ofAden
DISCLAIMER: This map is for illustration purposesonly. Names and boundaries on this map do notimply official endorsement or acceptance by IOM.
The arrows are for illustration purposes only, andare not indicative of actual movements
LEGEND:
FMP
MRC
Migration route - Land
Migration route - SeaClosed for entry and exit
Open for commercial traffic only
Open for entry and exit
Open only to returning nationalsand residents
Unknown
Land Border Point
Sea Crossing Point/Port
PoE operational status:
Point of Entry (PoE) type: IOM activity:
0 100 Km
Kalakanley
AliSabieh
PK9Obock
Badaf
Dawale
Godoria
ArOussa
LowyacadoHoll Holl
Fontehero
Loyada
Guelileh
Djibouti
Zeylac
Admin 0
Capital
Disputed boundary
Town
Missing migrants
�
��
Total arrivals in Yemen
Arrivals in Yemen
Return movements
Departures fromMareero/Elayo
($290 Approximatecost of the journey)
Stranded migrants
Entries into country
(From SaudiArabia,
including247 VHRs)
(From Saudi Arabia)
(FromSomalia)
(Dec 2020)
(Jan 2021)
(Dec 2020)
(including239 VHRs)
Flow Monitoring Point
Migration Response Centre
37,535
24,956
12,579
571
1,039
56,043
31,889
12,400
36,632
13,895
1,182
1,050
6,1987,502
3,335
Ethiopian migrants line up for NFI distribution at the Massagara site. Photo: © IOM / Alexander Bee
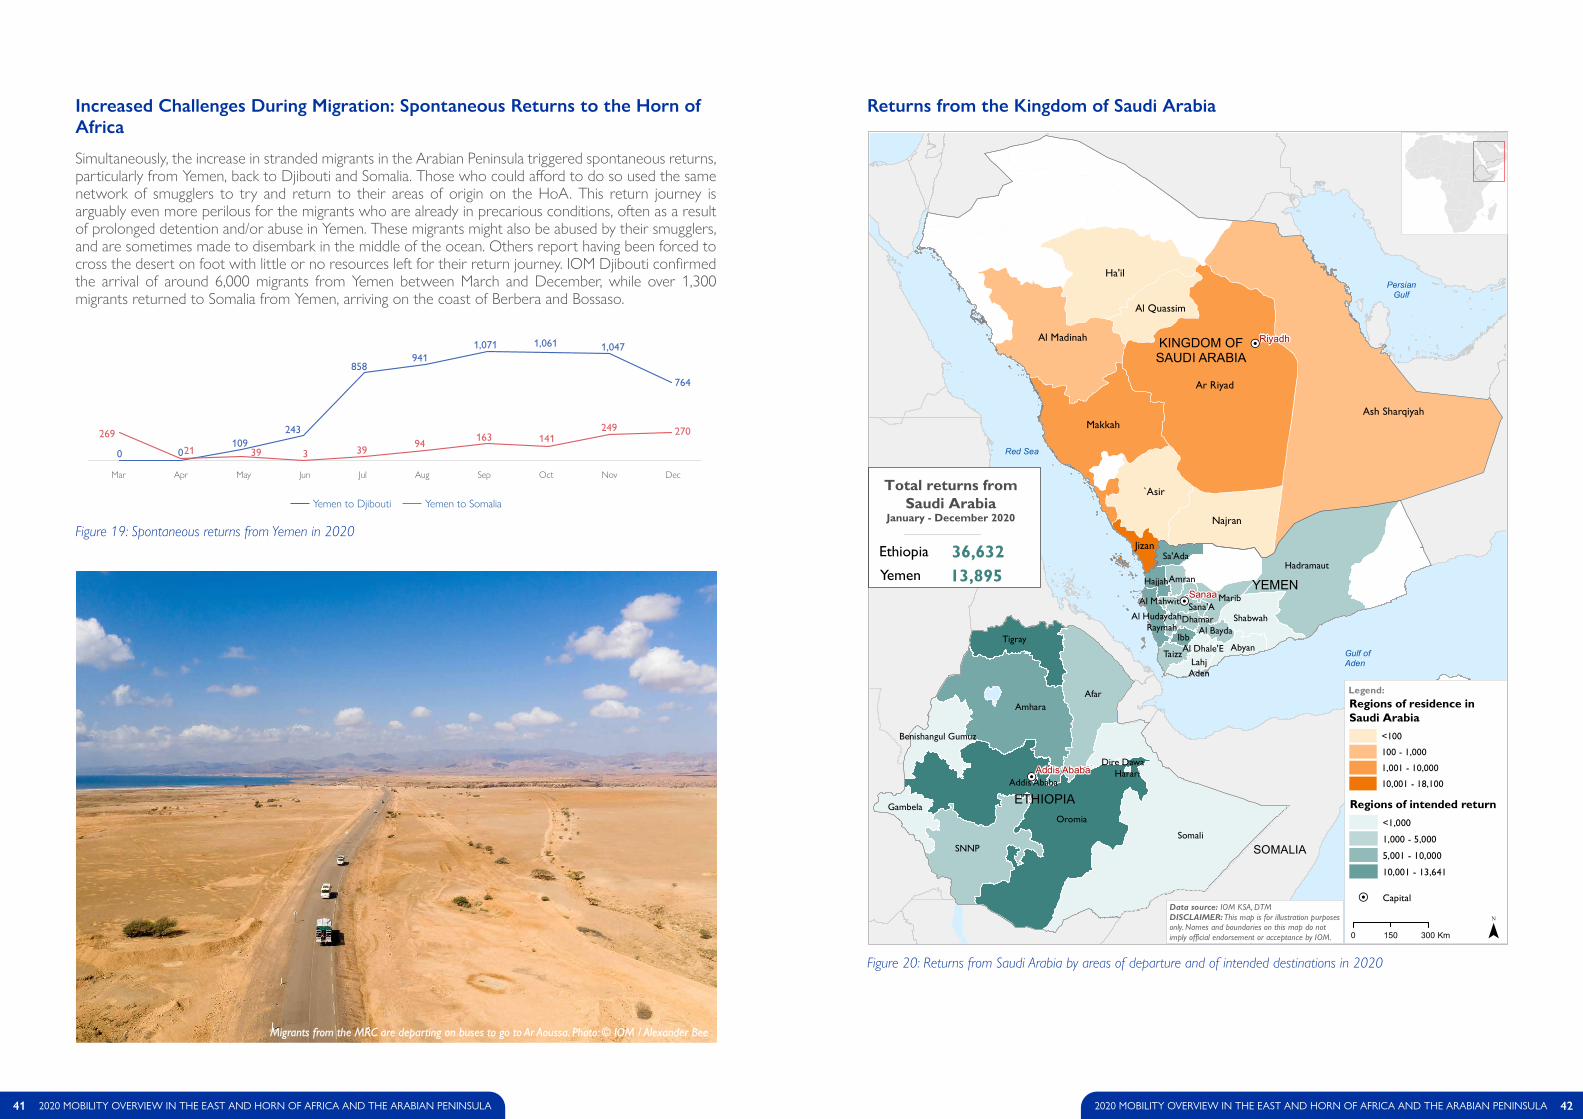
Simultaneously, the increase in stranded migrants in the Arabian Peninsula triggered spontaneous returns, particularly from Yemen, back to Djibouti and Somalia. Those who could afford to do so used the same network of smugglers to try and return to their areas of origin on the HoA. This return journey is arguably even more perilous for the migrants who are already in precarious conditions, often as a result of prolonged detention and/or abuse in Yemen. These migrants might also be abused by their smugglers, and are sometimes made to disembark in the middle of the ocean. Others report having been forced to cross the desert on foot with little or no resources left for their return journey. IOM Djibouti confirmed the arrival of around 6,000 migrants from Yemen between March and December, while over 1,300 migrants returned to Somalia from Yemen, arriving on the coast of Berbera and Bossaso.
Increased Challenges During Migration: Spontaneous Returns to the Horn of Africa
Figure 19: Spontaneous returns from Yemen in 2020
Figure 20: Returns from Saudi Arabia by areas of departure and of intended destinations in 2020
!H
!H
!H
ETHIOPIA
KINGDOM OFSAUDI ARABIA
YEMEN
SOMALIA
Sanaa
Riyadh
Addis Ababa
Ar Riyad
Ash Sharqiyah
Ha'il
Makkah
`Asir
Al Madinah
Najran
Al Quassim
Jizan
Somali
Oromia
AfarAmhara
Hadramaut
SNNP
Tigray
Shabwah
Gambela
Lahj
AbyanTaizz
Ibb
Marib
Benishangul Gumuz
Sa'Ada
Sana'A
HajjahAmran
Al BaydaAl HudaydahDhamar
Al Dhale'E
Raymah
Al Mahwit
Aden
Dire DawaHarari
Addis Ababa
Gulf ofAden
Red Sea
PersianGulf
Total returns fromSaudi Arabia
January - December 2020
Ethiopia
Yemen 13,895
Legend:Regions of residence inSaudi Arabia
<100
100 - 1,000
1,001 - 10,000
10,001 - 18,100
¯0 300150 Km
Capital
Regions of intended return<1,000
1,000 - 5,000
5,001 - 10,000
10,001 - 13,641
Data source: IOM KSA, DTMDISCLAIMER: This map is for illustration purposesonly. Names and boundaries on this map do notimply official endorsement or acceptance by IOM.
36,632
!H
41 2020 MOBILITY OVERVIEW IN THE EAST AND HORN OF AFRICA AND THE ARABIAN PENINSULA 422020 MOBILITY OVERVIEW IN THE EAST AND HORN OF AFRICA AND THE ARABIAN PENINSULA
Mar Apr May Jun Jul Aug Sep Oct Nov Dec
Migrants from the MRC are departing on buses to go to Ar Aoussa. Photo: © IOM / Alexander Bee
Returns from the Kingdom of Saudi Arabia
Jun Jul Aug Sep Oct Nov DecMar Apr May
0
270
Yemen to Djibouti Yemen to Somalia
0109
243
858941
1,071 1,061 1,047
764
269
21 39 3 3994
163 141249
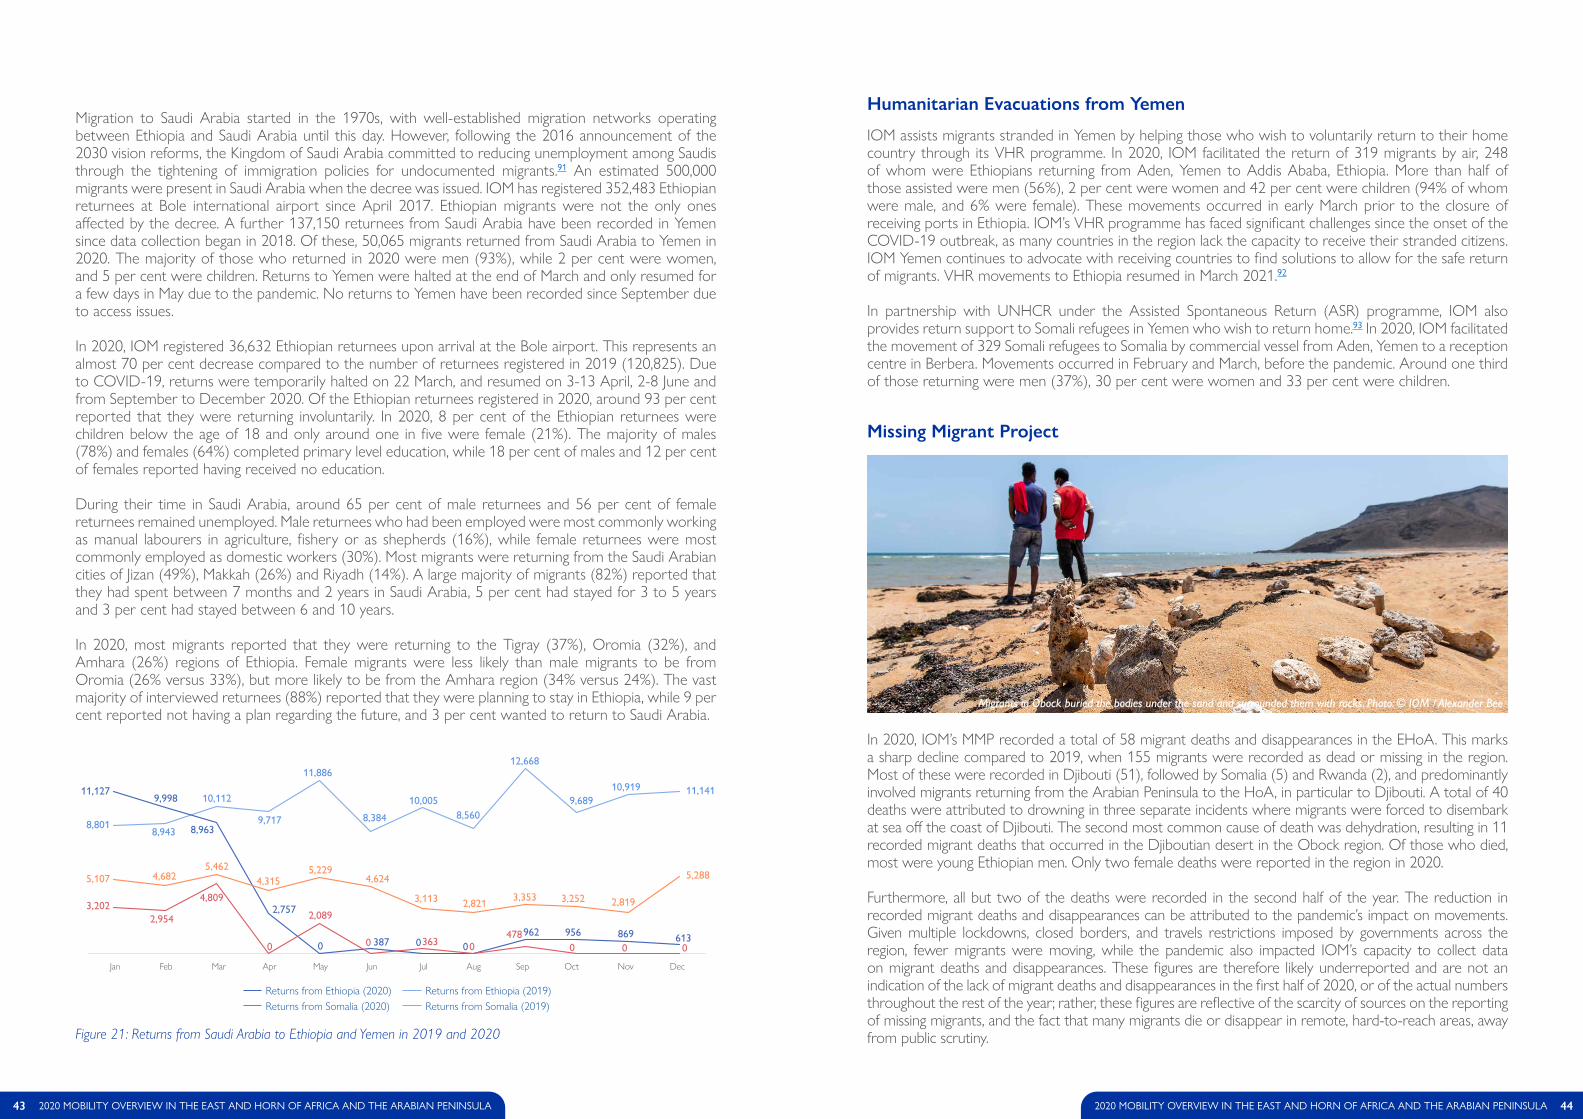
Migration to Saudi Arabia started in the 1970s, with well-established migration networks operating between Ethiopia and Saudi Arabia until this day. However, following the 2016 announcement of the 2030 vision reforms, the Kingdom of Saudi Arabia committed to reducing unemployment among Saudis through the tightening of immigration policies for undocumented migrants.91 An estimated 500,000 migrants were present in Saudi Arabia when the decree was issued. IOM has registered 352,483 Ethiopian returnees at Bole international airport since April 2017. Ethiopian migrants were not the only ones affected by the decree. A further 137,150 returnees from Saudi Arabia have been recorded in Yemen since data collection began in 2018. Of these, 50,065 migrants returned from Saudi Arabia to Yemen in 2020. The majority of those who returned in 2020 were men (93%), while 2 per cent were women, and 5 per cent were children. Returns to Yemen were halted at the end of March and only resumed for a few days in May due to the pandemic. No returns to Yemen have been recorded since September due to access issues.
In 2020, IOM registered 36,632 Ethiopian returnees upon arrival at the Bole airport. This represents an almost 70 per cent decrease compared to the number of returnees registered in 2019 (120,825). Due to COVID-19, returns were temporarily halted on 22 March, and resumed on 3-13 April, 2-8 June and from September to December 2020. Of the Ethiopian returnees registered in 2020, around 93 per cent reported that they were returning involuntarily. In 2020, 8 per cent of the Ethiopian returnees were children below the age of 18 and only around one in five were female (21%). The majority of males (78%) and females (64%) completed primary level education, while 18 per cent of males and 12 per cent of females reported having received no education.
During their time in Saudi Arabia, around 65 per cent of male returnees and 56 per cent of female returnees remained unemployed. Male returnees who had been employed were most commonly working as manual labourers in agriculture, fishery or as shepherds (16%), while female returnees were most commonly employed as domestic workers (30%). Most migrants were returning from the Saudi Arabian cities of Jizan (49%), Makkah (26%) and Riyadh (14%). A large majority of migrants (82%) reported that they had spent between 7 months and 2 years in Saudi Arabia, 5 per cent had stayed for 3 to 5 years and 3 per cent had stayed between 6 and 10 years.
In 2020, most migrants reported that they were returning to the Tigray (37%), Oromia (32%), and Amhara (26%) regions of Ethiopia. Female migrants were less likely than male migrants to be from Oromia (26% versus 33%), but more likely to be from the Amhara region (34% versus 24%). The vast majority of interviewed returnees (88%) reported that they were planning to stay in Ethiopia, while 9 per cent reported not having a plan regarding the future, and 3 per cent wanted to return to Saudi Arabia.
Figure 21: Returns from Saudi Arabia to Ethiopia and Yemen in 2019 and 2020
IOM assists migrants stranded in Yemen by helping those who wish to voluntarily return to their home country through its VHR programme. In 2020, IOM facilitated the return of 319 migrants by air, 248 of whom were Ethiopians returning from Aden, Yemen to Addis Ababa, Ethiopia. More than half of those assisted were men (56%), 2 per cent were women and 42 per cent were children (94% of whom were male, and 6% were female). These movements occurred in early March prior to the closure of receiving ports in Ethiopia. IOM’s VHR programme has faced significant challenges since the onset of the COVID-19 outbreak, as many countries in the region lack the capacity to receive their stranded citizens. IOM Yemen continues to advocate with receiving countries to find solutions to allow for the safe return of migrants. VHR movements to Ethiopia resumed in March 2021.92
In partnership with UNHCR under the Assisted Spontaneous Return (ASR) programme, IOM also provides return support to Somali refugees in Yemen who wish to return home.93 In 2020, IOM facilitated the movement of 329 Somali refugees to Somalia by commercial vessel from Aden, Yemen to a reception centre in Berbera. Movements occurred in February and March, before the pandemic. Around one third of those returning were men (37%), 30 per cent were women and 33 per cent were children.
Humanitarian Evacuations from Yemen
In 2020, IOM’s MMP recorded a total of 58 migrant deaths and disappearances in the EHoA. This marks a sharp decline compared to 2019, when 155 migrants were recorded as dead or missing in the region. Most of these were recorded in Djibouti (51), followed by Somalia (5) and Rwanda (2), and predominantly involved migrants returning from the Arabian Peninsula to the HoA, in particular to Djibouti. A total of 40 deaths were attributed to drowning in three separate incidents where migrants were forced to disembark at sea off the coast of Djibouti. The second most common cause of death was dehydration, resulting in 11 recorded migrant deaths that occurred in the Djiboutian desert in the Obock region. Of those who died, most were young Ethiopian men. Only two female deaths were reported in the region in 2020.
Furthermore, all but two of the deaths were recorded in the second half of the year. The reduction in recorded migrant deaths and disappearances can be attributed to the pandemic’s impact on movements. Given multiple lockdowns, closed borders, and travels restrictions imposed by governments across the region, fewer migrants were moving, while the pandemic also impacted IOM’s capacity to collect data on migrant deaths and disappearances. These figures are therefore likely underreported and are not an indication of the lack of migrant deaths and disappearances in the first half of 2020, or of the actual numbers throughout the rest of the year; rather, these figures are reflective of the scarcity of sources on the reporting of missing migrants, and the fact that many migrants die or disappear in remote, hard-to-reach areas, away from public scrutiny.
Missing Migrant Project
43 2020 MOBILITY OVERVIEW IN THE EAST AND HORN OF AFRICA AND THE ARABIAN PENINSULA 442020 MOBILITY OVERVIEW IN THE EAST AND HORN OF AFRICA AND THE ARABIAN PENINSULA
Migrants in Obock buried the bodies under the sand and surrounded them with rocks. Photo: © IOM / Alexander Bee
Jan Feb Mar Apr May Jun Jul Aug Sep Oct Nov DecJun Jul Aug Sep Oct Nov DecJan Feb Mar Apr May
11,127
8,801
5,107
3,202
Returns from Ethiopia (2020)Returns from Somalia (2020)
Returns from Ethiopia (2019)Returns from Somalia (2019)
8,943
10,112
9,717
11,886
8,384
10,0058,560
12,668
9,68910,919 11,141
9,998
8,963
2,757
0 0 0387962 956 869 613
4,6825,462
4,3155,229
4,624
3,113 2,8213,353 3,252 2,819
5,288
2,954
4,809
0
2,089
0 0363478
0 0 0
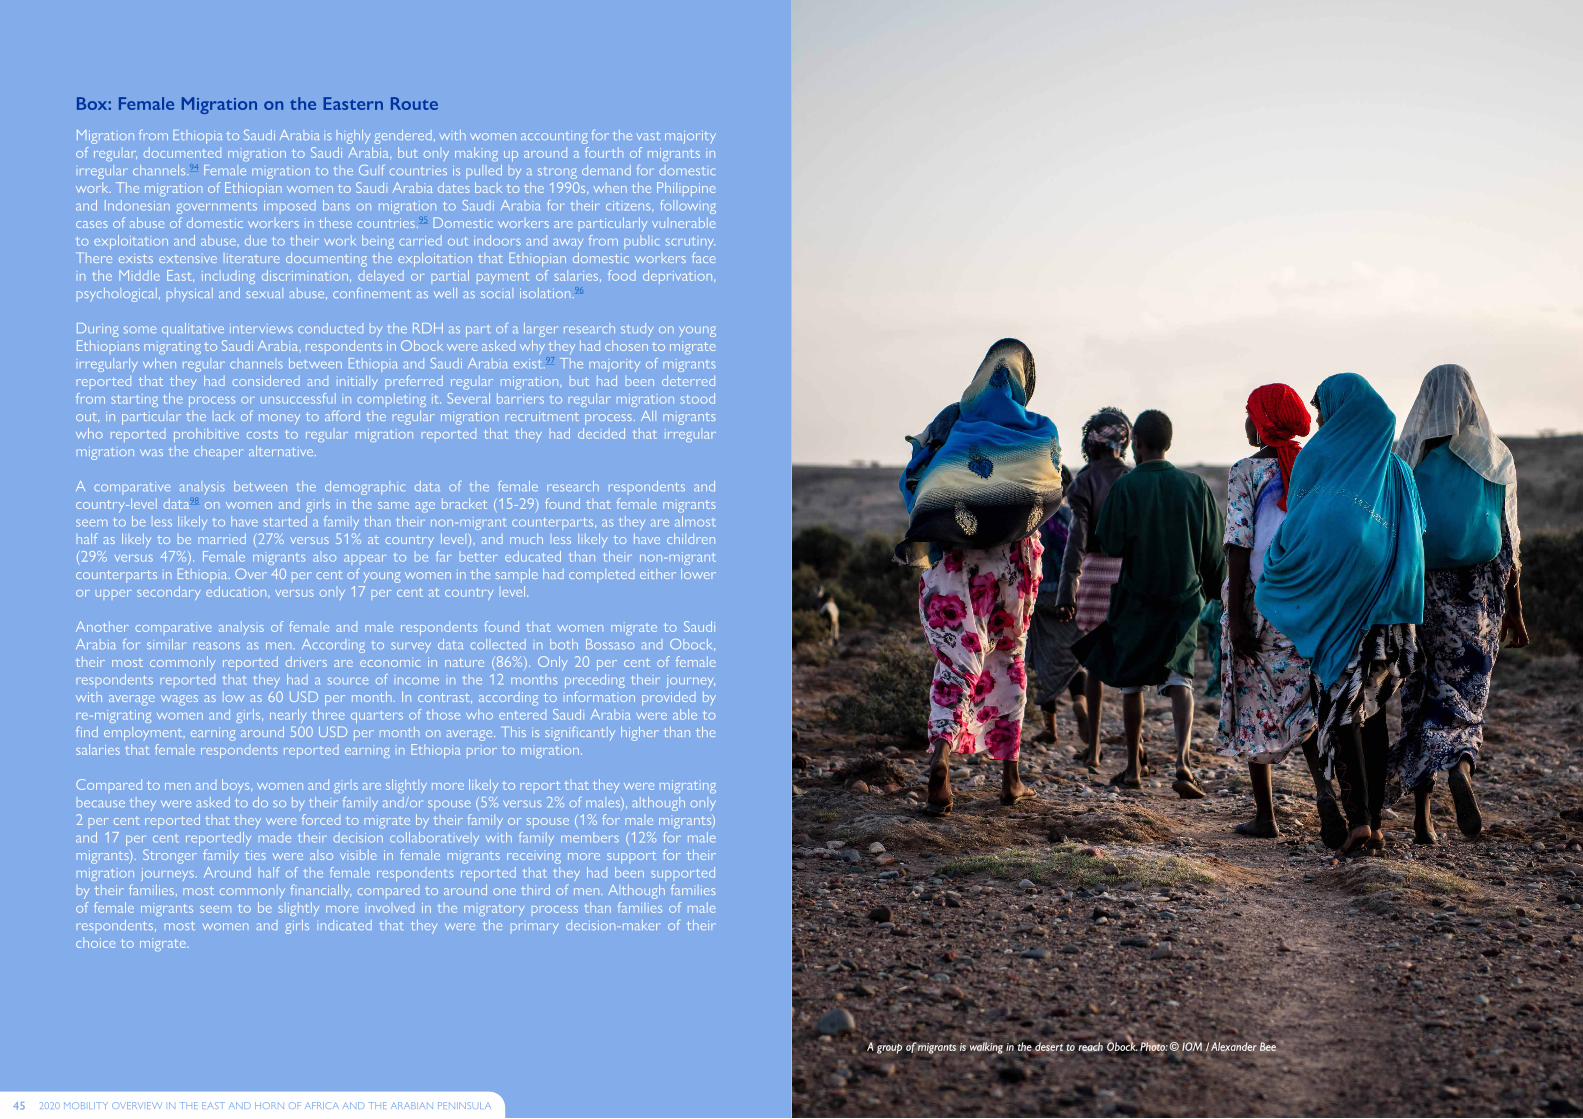
Migration from Ethiopia to Saudi Arabia is highly gendered, with women accounting for the vast majority of regular, documented migration to Saudi Arabia, but only making up around a fourth of migrants in irregular channels�94 Female migration to the Gulf countries is pulled by a strong demand for domestic work� The migration of Ethiopian women to Saudi Arabia dates back to the 1990s, when the Philippine and Indonesian governments imposed bans on migration to Saudi Arabia for their citizens, following cases of abuse of domestic workers in these countries�95 Domestic workers are particularly vulnerable to exploitation and abuse, due to their work being carried out indoors and away from public scrutiny� There exists extensive literature documenting the exploitation that Ethiopian domestic workers face in the Middle East, including discrimination, delayed or partial payment of salaries, food deprivation, psychological, physical and sexual abuse, confinement as well as social isolation�96
During some qualitative interviews conducted by the RDH as part of a larger research study on young Ethiopians migrating to Saudi Arabia, respondents in Obock were asked why they had chosen to migrate irregularly when regular channels between Ethiopia and Saudi Arabia exist�97 The majority of migrants reported that they had considered and initially preferred regular migration, but had been deterred from starting the process or unsuccessful in completing it� Several barriers to regular migration stood out, in particular the lack of money to afford the regular migration recruitment process� All migrants who reported prohibitive costs to regular migration reported that they had decided that irregular migration was the cheaper alternative�
A comparative analysis between the demographic data of the female research respondents and country-level data98 on women and girls in the same age bracket (15-29) found that female migrants seem to be less likely to have started a family than their non-migrant counterparts, as they are almost half as likely to be married (27% versus 51% at country level), and much less likely to have children (29% versus 47%)� Female migrants also appear to be far better educated than their non-migrant counterparts in Ethiopia� Over 40 per cent of young women in the sample had completed either lower or upper secondary education, versus only 17 per cent at country level�
Another comparative analysis of female and male respondents found that women migrate to Saudi Arabia for similar reasons as men� According to survey data collected in both Bossaso and Obock, their most commonly reported drivers are economic in nature (86%)� Only 20 per cent of female respondents reported that they had a source of income in the 12 months preceding their journey, with average wages as low as 60 USD per month� In contrast, according to information provided by re-migrating women and girls, nearly three quarters of those who entered Saudi Arabia were able to find employment, earning around 500 USD per month on average� This is significantly higher than the salaries that female respondents reported earning in Ethiopia prior to migration�
Compared to men and boys, women and girls are slightly more likely to report that they were migrating because they were asked to do so by their family and/or spouse (5% versus 2% of males), although only 2 per cent reported that they were forced to migrate by their family or spouse (1% for male migrants) and 17 per cent reportedly made their decision collaboratively with family members (12% for male migrants)� Stronger family ties were also visible in female migrants receiving more support for their migration journeys� Around half of the female respondents reported that they had been supported by their families, most commonly financially, compared to around one third of men� Although families of female migrants seem to be slightly more involved in the migratory process than families of male respondents, most women and girls indicated that they were the primary decision-maker of their choice to migrate�
Box: Female Migration on the Eastern Route
45 2020 MOBILITY OVERVIEW IN THE EAST AND HORN OF AFRICA AND THE ARABIAN PENINSULA
A group of migrants is walking in the desert to reach Obock. Photo: © IOM / Alexander Bee
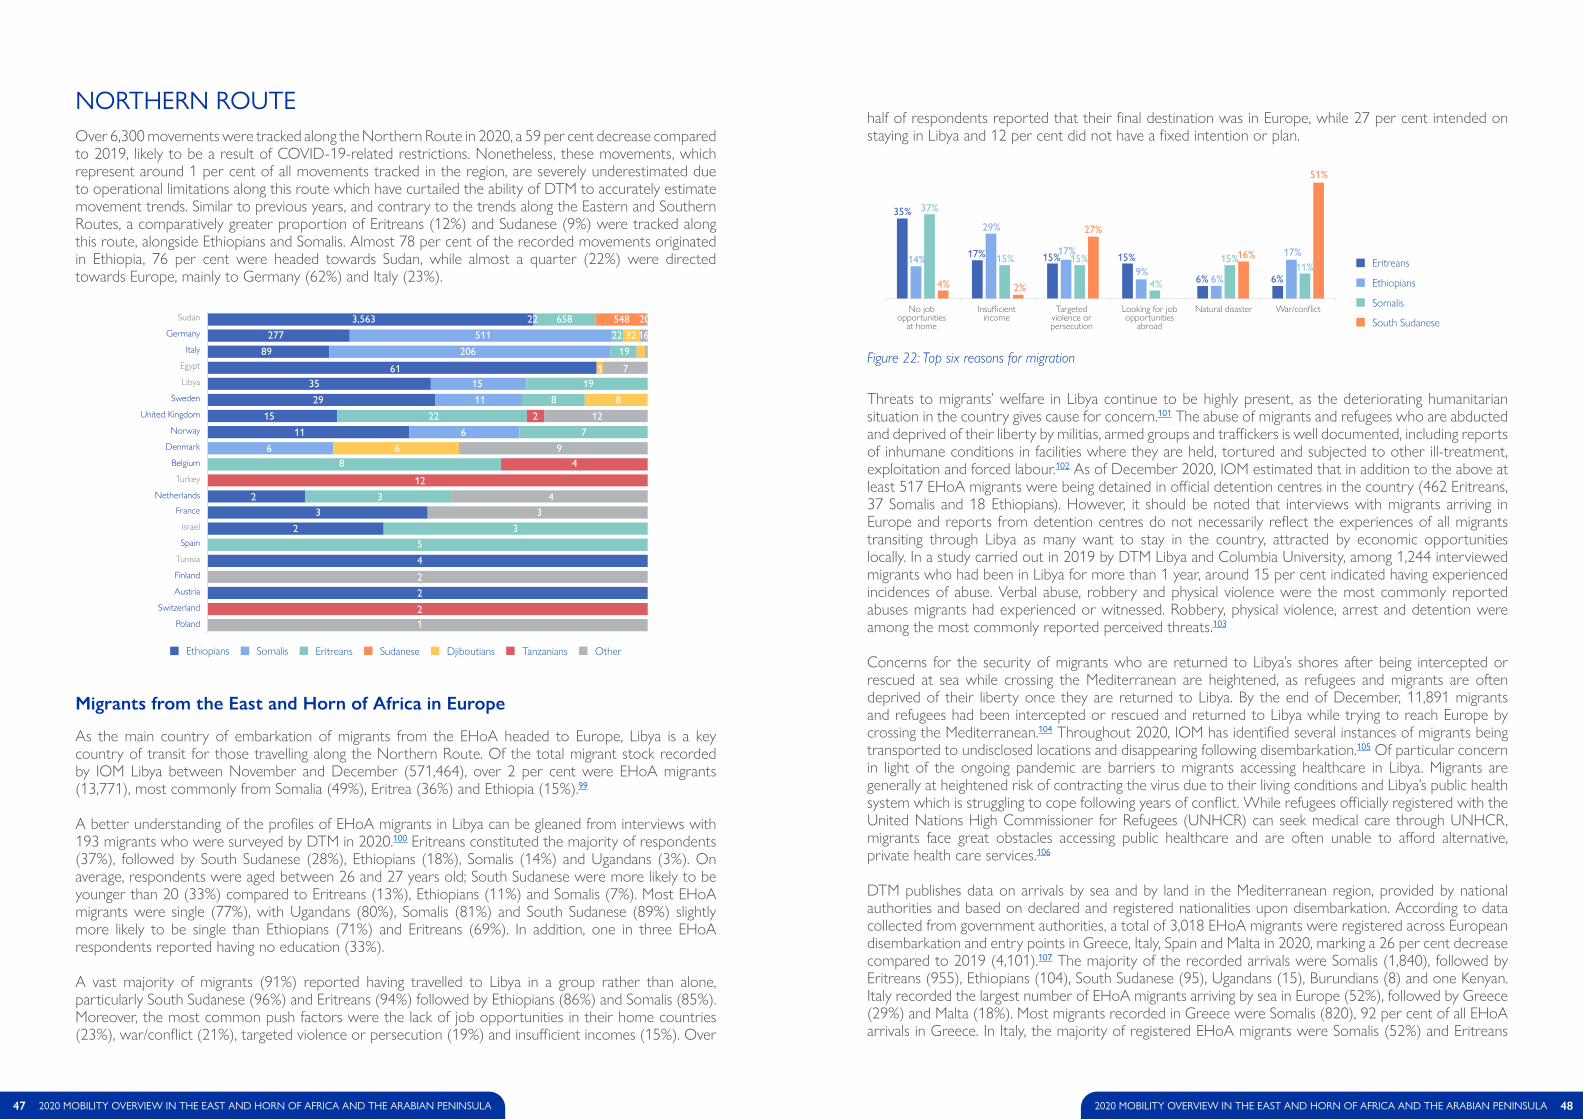
half of respondents reported that their final destination was in Europe, while 27 per cent intended on staying in Libya and 12 per cent did not have a fixed intention or plan.
Threats to migrants’ welfare in Libya continue to be highly present, as the deteriorating humanitarian situation in the country gives cause for concern.101 The abuse of migrants and refugees who are abducted and deprived of their liberty by militias, armed groups and traffickers is well documented, including reports of inhumane conditions in facilities where they are held, tortured and subjected to other ill-treatment, exploitation and forced labour.102 As of December 2020, IOM estimated that in addition to the above at least 517 EHoA migrants were being detained in official detention centres in the country (462 Eritreans, 37 Somalis and 18 Ethiopians). However, it should be noted that interviews with migrants arriving in Europe and reports from detention centres do not necessarily reflect the experiences of all migrants transiting through Libya as many want to stay in the country, attracted by economic opportunities locally. In a study carried out in 2019 by DTM Libya and Columbia University, among 1,244 interviewed migrants who had been in Libya for more than 1 year, around 15 per cent indicated having experienced incidences of abuse. Verbal abuse, robbery and physical violence were the most commonly reported abuses migrants had experienced or witnessed. Robbery, physical violence, arrest and detention were among the most commonly reported perceived threats.103
Concerns for the security of migrants who are returned to Libya’s shores after being intercepted or rescued at sea while crossing the Mediterranean are heightened, as refugees and migrants are often deprived of their liberty once they are returned to Libya. By the end of December, 11,891 migrants and refugees had been intercepted or rescued and returned to Libya while trying to reach Europe by crossing the Mediterranean.104 Throughout 2020, IOM has identified several instances of migrants being transported to undisclosed locations and disappearing following disembarkation.105 Of particular concern in light of the ongoing pandemic are barriers to migrants accessing healthcare in Libya. Migrants are generally at heightened risk of contracting the virus due to their living conditions and Libya’s public health system which is struggling to cope following years of conflict. While refugees officially registered with the United Nations High Commissioner for Refugees (UNHCR) can seek medical care through UNHCR, migrants face great obstacles accessing public healthcare and are often unable to afford alternative, private health care services.106
DTM publishes data on arrivals by sea and by land in the Mediterranean region, provided by national authorities and based on declared and registered nationalities upon disembarkation. According to data collected from government authorities, a total of 3,018 EHoA migrants were registered across European disembarkation and entry points in Greece, Italy, Spain and Malta in 2020, marking a 26 per cent decrease compared to 2019 (4,101).107 The majority of the recorded arrivals were Somalis (1,840), followed by Eritreans (955), Ethiopians (104), South Sudanese (95), Ugandans (15), Burundians (8) and one Kenyan. Italy recorded the largest number of EHoA migrants arriving by sea in Europe (52%), followed by Greece (29%) and Malta (18%). Most migrants recorded in Greece were Somalis (820), 92 per cent of all EHoA arrivals in Greece. In Italy, the majority of registered EHoA migrants were Somalis (52%) and Eritreans
NORTHERN ROUTEOver 6,300 movements were tracked along the Northern Route in 2020, a 59 per cent decrease compared to 2019, likely to be a result of COVID-19-related restrictions. Nonetheless, these movements, which represent around 1 per cent of all movements tracked in the region, are severely underestimated due to operational limitations along this route which have curtailed the ability of DTM to accurately estimate movement trends. Similar to previous years, and contrary to the trends along the Eastern and Southern Routes, a comparatively greater proportion of Eritreans (12%) and Sudanese (9%) were tracked along this route, alongside Ethiopians and Somalis. Almost 78 per cent of the recorded movements originated in Ethiopia, 76 per cent were headed towards Sudan, while almost a quarter (22%) were directed towards Europe, mainly to Germany (62%) and Italy (23%).
As the main country of embarkation of migrants from the EHoA headed to Europe, Libya is a key country of transit for those travelling along the Northern Route. Of the total migrant stock recorded by IOM Libya between November and December (571,464), over 2 per cent were EHoA migrants (13,771), most commonly from Somalia (49%), Eritrea (36%) and Ethiopia (15%).99
A better understanding of the profiles of EHoA migrants in Libya can be gleaned from interviews with 193 migrants who were surveyed by DTM in 2020.100 Eritreans constituted the majority of respondents (37%), followed by South Sudanese (28%), Ethiopians (18%), Somalis (14%) and Ugandans (3%). On average, respondents were aged between 26 and 27 years old; South Sudanese were more likely to be younger than 20 (33%) compared to Eritreans (13%), Ethiopians (11%) and Somalis (7%). Most EHoA migrants were single (77%), with Ugandans (80%), Somalis (81%) and South Sudanese (89%) slightly more likely to be single than Ethiopians (71%) and Eritreans (69%). In addition, one in three EHoA respondents reported having no education (33%).
A vast majority of migrants (91%) reported having travelled to Libya in a group rather than alone, particularly South Sudanese (96%) and Eritreans (94%) followed by Ethiopians (86%) and Somalis (85%). Moreover, the most common push factors were the lack of job opportunities in their home countries (23%), war/conflict (21%), targeted violence or persecution (19%) and insufficient incomes (15%). Over
Migrants from the East and Horn of Africa in Europe
SudanGermany
ItalyEgyptLibya
SwedenUnited Kingdom
NorwayDenmark
BelgiumTurkey
NetherlandsFrance
IsraelSpain
TunisiaFinlandAustria
SwitzerlandPoland
Figure 22: Top six reasons for migration
Sudan
Germany
Italy
Egypt
Netherlands
Turkey
Belgium
Denmark
Norway
Sweden
United Kingdom
Libya
France
Israel
Spain
Tunisia
Poland
Austria
Switzerland
Finland
47 2020 MOBILITY OVERVIEW IN THE EAST AND HORN OF AFRICA AND THE ARABIAN PENINSULA 482020 MOBILITY OVERVIEW IN THE EAST AND HORN OF AFRICA AND THE ARABIAN PENINSULA
1
Somalis EritreansEthiopians OtherSudanese Djiboutians Tanzanians
2
2
2
4
5
2 3
3 332 4
12
4866 9
6 711
15 22 122
29 11 8 8
35 15 1961 71
89 206 19
277 511 22 32 16
3,563 22 658 548 20
Ethiopians
Somalis
Eritreans
South SudaneseNo job opportunities Insufficient income Targeted violence or
persecutionLooking for job
opportunities abroadNatural Disaster War/conflictLooking for job
opportunities abroad
Natural disaster War/conflictNo job opportunities
at home
Insufficient income
Targeted violence or persecution
35%
17% 15% 15%
6% 6%
14%
29%
17%
9%
17%
6%
37%
15%15% 15%
4%
11%
2%4%
51%
27%
16%
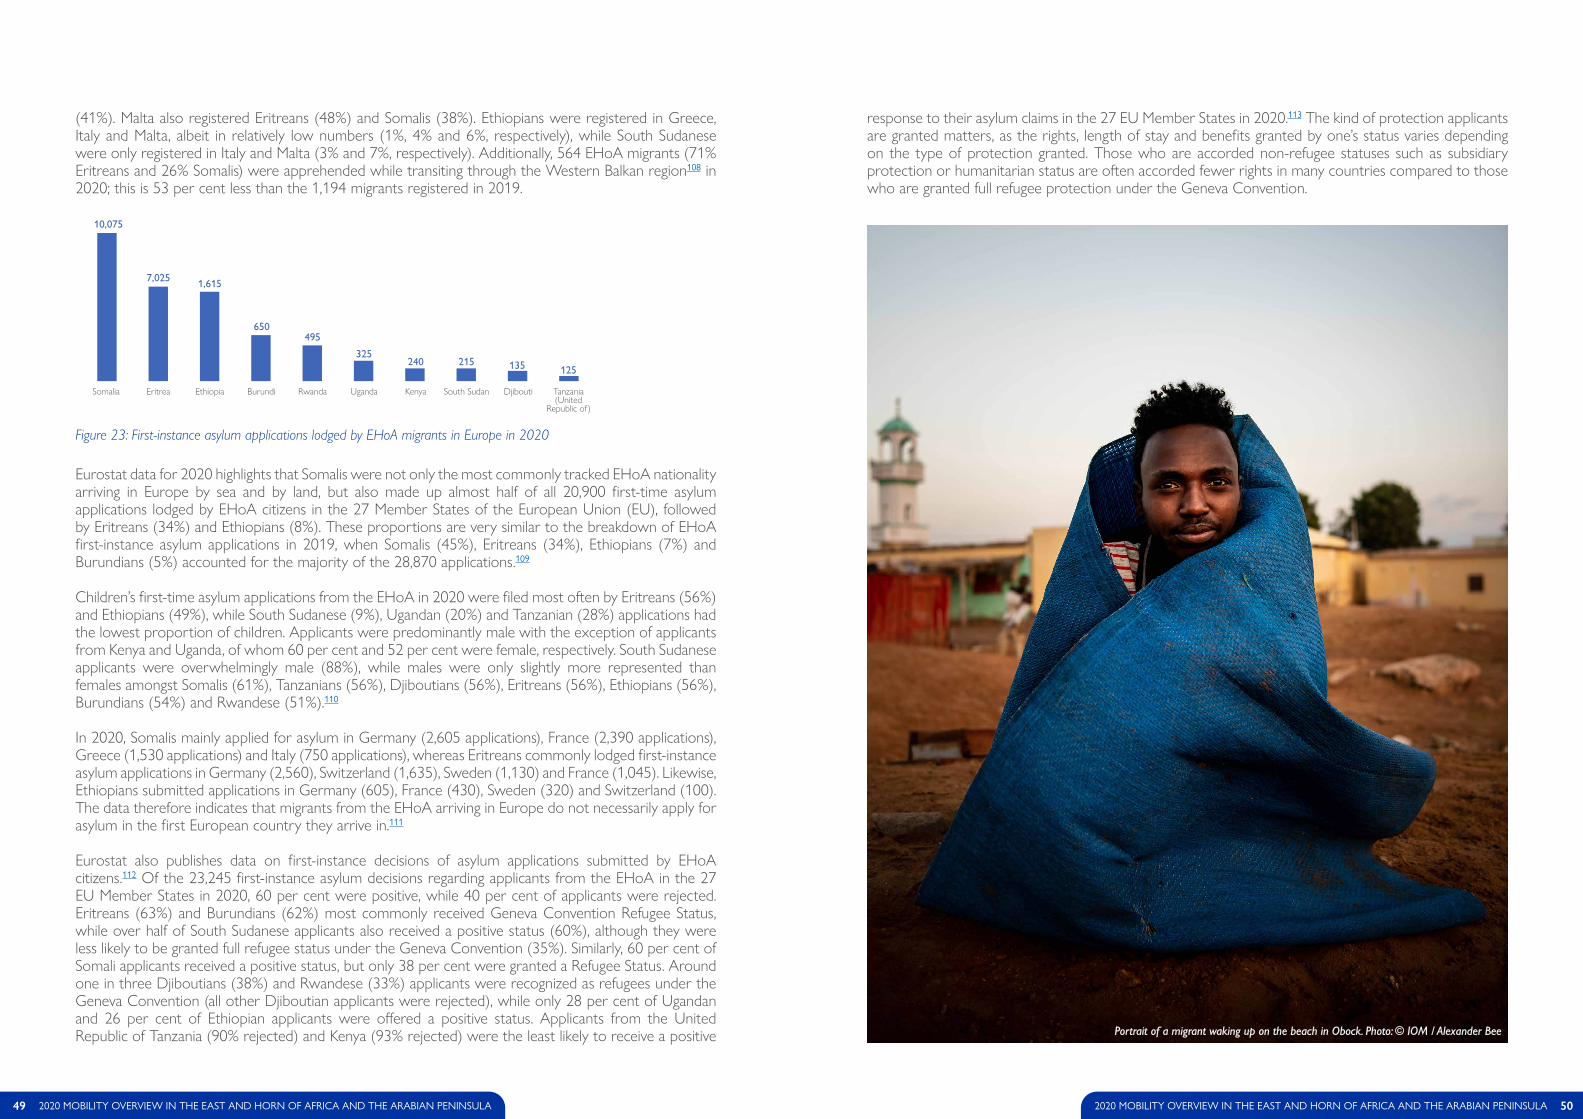
(41%). Malta also registered Eritreans (48%) and Somalis (38%). Ethiopians were registered in Greece, Italy and Malta, albeit in relatively low numbers (1%, 4% and 6%, respectively), while South Sudanese were only registered in Italy and Malta (3% and 7%, respectively). Additionally, 564 EHoA migrants (71% Eritreans and 26% Somalis) were apprehended while transiting through the Western Balkan region108 in 2020; this is 53 per cent less than the 1,194 migrants registered in 2019.
Figure 23: First-instance asylum applications lodged by EHoA migrants in Europe in 2020
Eurostat data for 2020 highlights that Somalis were not only the most commonly tracked EHoA nationality arriving in Europe by sea and by land, but also made up almost half of all 20,900 first-time asylum applications lodged by EHoA citizens in the 27 Member States of the European Union (EU), followed by Eritreans (34%) and Ethiopians (8%). These proportions are very similar to the breakdown of EHoA first-instance asylum applications in 2019, when Somalis (45%), Eritreans (34%), Ethiopians (7%) and Burundians (5%) accounted for the majority of the 28,870 applications.109
Children’s first-time asylum applications from the EHoA in 2020 were filed most often by Eritreans (56%) and Ethiopians (49%), while South Sudanese (9%), Ugandan (20%) and Tanzanian (28%) applications had the lowest proportion of children. Applicants were predominantly male with the exception of applicants from Kenya and Uganda, of whom 60 per cent and 52 per cent were female, respectively. South Sudanese applicants were overwhelmingly male (88%), while males were only slightly more represented than females amongst Somalis (61%), Tanzanians (56%), Djiboutians (56%), Eritreans (56%), Ethiopians (56%), Burundians (54%) and Rwandese (51%).110
In 2020, Somalis mainly applied for asylum in Germany (2,605 applications), France (2,390 applications), Greece (1,530 applications) and Italy (750 applications), whereas Eritreans commonly lodged first-instance asylum applications in Germany (2,560), Switzerland (1,635), Sweden (1,130) and France (1,045). Likewise, Ethiopians submitted applications in Germany (605), France (430), Sweden (320) and Switzerland (100). The data therefore indicates that migrants from the EHoA arriving in Europe do not necessarily apply for asylum in the first European country they arrive in.111
Eurostat also publishes data on first-instance decisions of asylum applications submitted by EHoA citizens.112 Of the 23,245 first-instance asylum decisions regarding applicants from the EHoA in the 27 EU Member States in 2020, 60 per cent were positive, while 40 per cent of applicants were rejected. Eritreans (63%) and Burundians (62%) most commonly received Geneva Convention Refugee Status, while over half of South Sudanese applicants also received a positive status (60%), although they were less likely to be granted full refugee status under the Geneva Convention (35%). Similarly, 60 per cent of Somali applicants received a positive status, but only 38 per cent were granted a Refugee Status. Around one in three Djiboutians (38%) and Rwandese (33%) applicants were recognized as refugees under the Geneva Convention (all other Djiboutian applicants were rejected), while only 28 per cent of Ugandan and 26 per cent of Ethiopian applicants were offered a positive status. Applicants from the United Republic of Tanzania (90% rejected) and Kenya (93% rejected) were the least likely to receive a positive
response to their asylum claims in the 27 EU Member States in 2020.113 The kind of protection applicants are granted matters, as the rights, length of stay and benefits granted by one’s status varies depending on the type of protection granted. Those who are accorded non-refugee statuses such as subsidiary protection or humanitarian status are often accorded fewer rights in many countries compared to those who are granted full refugee protection under the Geneva Convention.
49 2020 MOBILITY OVERVIEW IN THE EAST AND HORN OF AFRICA AND THE ARABIAN PENINSULA 502020 MOBILITY OVERVIEW IN THE EAST AND HORN OF AFRICA AND THE ARABIAN PENINSULA
Portrait of a migrant waking up on the beach in Obock. Photo: © IOM / Alexander Bee
58+37+35+18+14+8+5+5+4+2Somalia Tanzania
(United Republic of)
Eritrea Ethiopia Burundi Rwanda Uganda Kenya South Sudan Djibouti
10,075
7,025 1,615
650495
325240 215 135 125
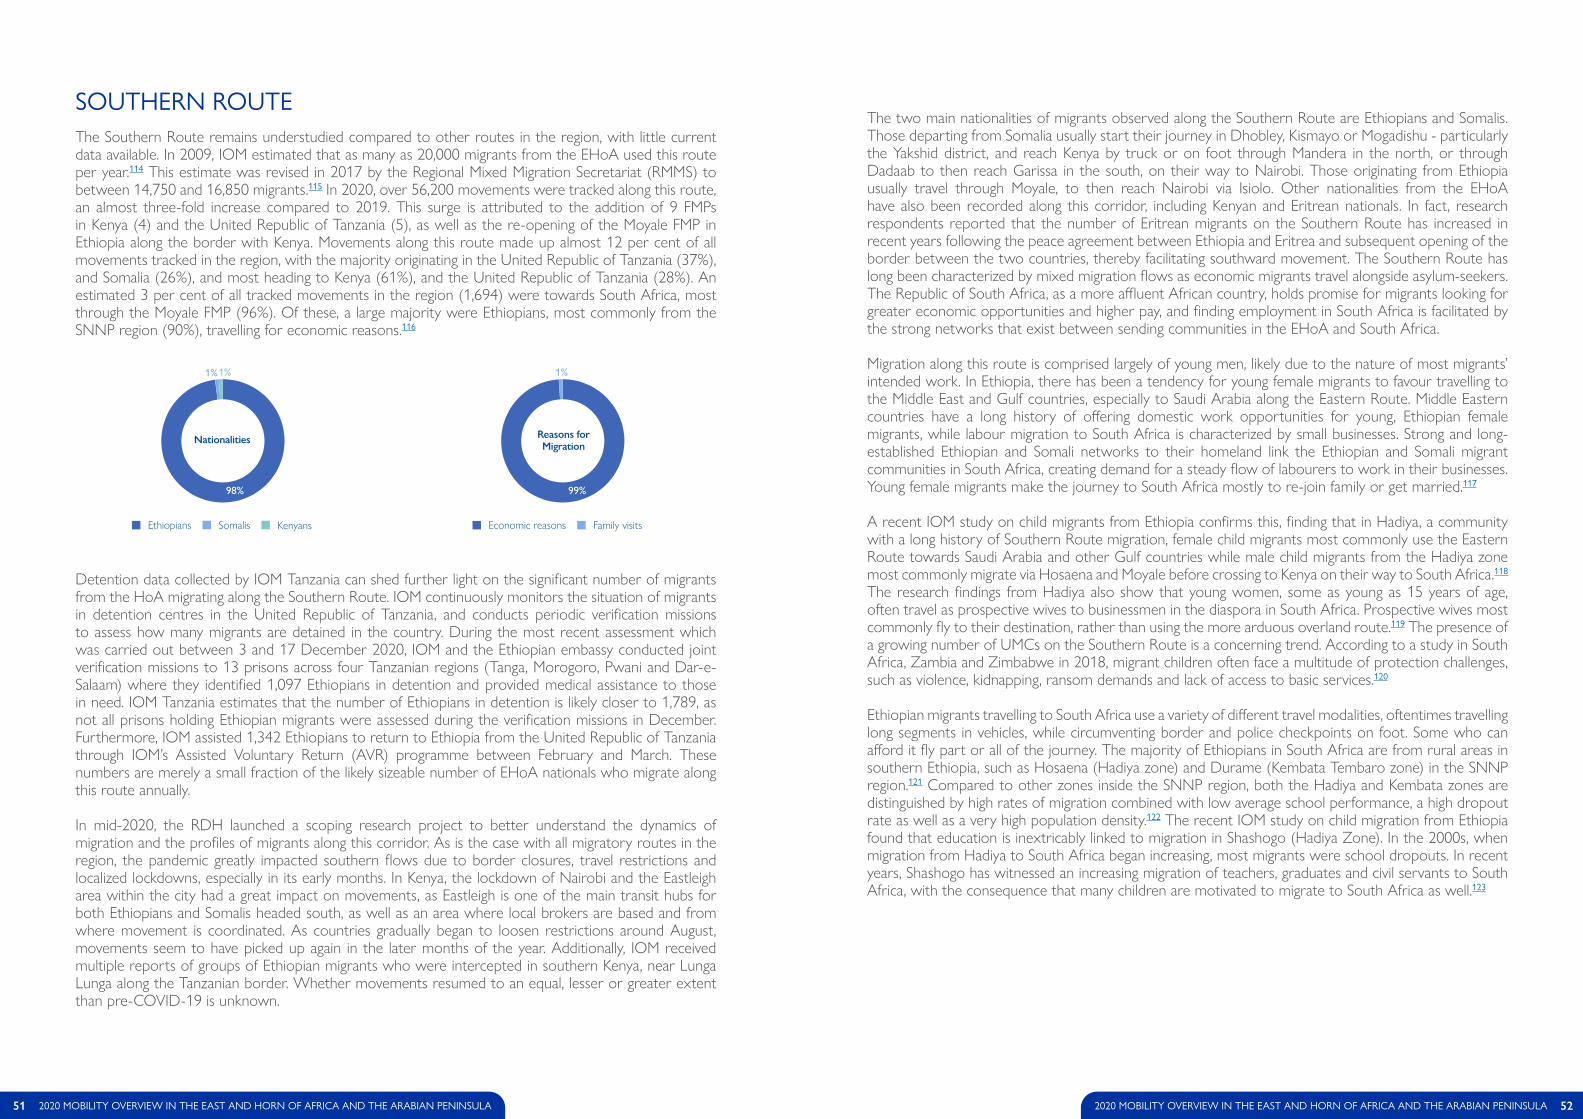
SOUTHERN ROUTEThe Southern Route remains understudied compared to other routes in the region, with little current data available. In 2009, IOM estimated that as many as 20,000 migrants from the EHoA used this route per year.114 This estimate was revised in 2017 by the Regional Mixed Migration Secretariat (RMMS) to between 14,750 and 16,850 migrants.115 In 2020, over 56,200 movements were tracked along this route, an almost three-fold increase compared to 2019. This surge is attributed to the addition of 9 FMPs in Kenya (4) and the United Republic of Tanzania (5), as well as the re-opening of the Moyale FMP in Ethiopia along the border with Kenya. Movements along this route made up almost 12 per cent of all movements tracked in the region, with the majority originating in the United Republic of Tanzania (37%), and Somalia (26%), and most heading to Kenya (61%), and the United Republic of Tanzania (28%). An estimated 3 per cent of all tracked movements in the region (1,694) were towards South Africa, most through the Moyale FMP (96%). Of these, a large majority were Ethiopians, most commonly from the SNNP region (90%), travelling for economic reasons.116
Detention data collected by IOM Tanzania can shed further light on the significant number of migrants from the HoA migrating along the Southern Route. IOM continuously monitors the situation of migrants in detention centres in the United Republic of Tanzania, and conducts periodic verification missions to assess how many migrants are detained in the country. During the most recent assessment which was carried out between 3 and 17 December 2020, IOM and the Ethiopian embassy conducted joint verification missions to 13 prisons across four Tanzanian regions (Tanga, Morogoro, Pwani and Dar-e-Salaam) where they identified 1,097 Ethiopians in detention and provided medical assistance to those in need. IOM Tanzania estimates that the number of Ethiopians in detention is likely closer to 1,789, as not all prisons holding Ethiopian migrants were assessed during the verification missions in December. Furthermore, IOM assisted 1,342 Ethiopians to return to Ethiopia from the United Republic of Tanzania through IOM’s Assisted Voluntary Return (AVR) programme between February and March. These numbers are merely a small fraction of the likely sizeable number of EHoA nationals who migrate along this route annually.
In mid-2020, the RDH launched a scoping research project to better understand the dynamics of migration and the profiles of migrants along this corridor. As is the case with all migratory routes in the region, the pandemic greatly impacted southern flows due to border closures, travel restrictions and localized lockdowns, especially in its early months. In Kenya, the lockdown of Nairobi and the Eastleigh area within the city had a great impact on movements, as Eastleigh is one of the main transit hubs for both Ethiopians and Somalis headed south, as well as an area where local brokers are based and from where movement is coordinated. As countries gradually began to loosen restrictions around August, movements seem to have picked up again in the later months of the year. Additionally, IOM received multiple reports of groups of Ethiopian migrants who were intercepted in southern Kenya, near Lunga Lunga along the Tanzanian border. Whether movements resumed to an equal, lesser or greater extent than pre-COVID-19 is unknown.
The two main nationalities of migrants observed along the Southern Route are Ethiopians and Somalis. Those departing from Somalia usually start their journey in Dhobley, Kismayo or Mogadishu - particularly the Yakshid district, and reach Kenya by truck or on foot through Mandera in the north, or through Dadaab to then reach Garissa in the south, on their way to Nairobi. Those originating from Ethiopia usually travel through Moyale, to then reach Nairobi via Isiolo. Other nationalities from the EHoA have also been recorded along this corridor, including Kenyan and Eritrean nationals. In fact, research respondents reported that the number of Eritrean migrants on the Southern Route has increased in recent years following the peace agreement between Ethiopia and Eritrea and subsequent opening of the border between the two countries, thereby facilitating southward movement. The Southern Route has long been characterized by mixed migration flows as economic migrants travel alongside asylum-seekers. The Republic of South Africa, as a more affluent African country, holds promise for migrants looking for greater economic opportunities and higher pay, and finding employment in South Africa is facilitated by the strong networks that exist between sending communities in the EHoA and South Africa.
Migration along this route is comprised largely of young men, likely due to the nature of most migrants’ intended work. In Ethiopia, there has been a tendency for young female migrants to favour travelling to the Middle East and Gulf countries, especially to Saudi Arabia along the Eastern Route. Middle Eastern countries have a long history of offering domestic work opportunities for young, Ethiopian female migrants, while labour migration to South Africa is characterized by small businesses. Strong and long-established Ethiopian and Somali networks to their homeland link the Ethiopian and Somali migrant communities in South Africa, creating demand for a steady flow of labourers to work in their businesses. Young female migrants make the journey to South Africa mostly to re-join family or get married.117
A recent IOM study on child migrants from Ethiopia confirms this, finding that in Hadiya, a community with a long history of Southern Route migration, female child migrants most commonly use the Eastern Route towards Saudi Arabia and other Gulf countries while male child migrants from the Hadiya zone most commonly migrate via Hosaena and Moyale before crossing to Kenya on their way to South Africa.118 The research findings from Hadiya also show that young women, some as young as 15 years of age, often travel as prospective wives to businessmen in the diaspora in South Africa. Prospective wives most commonly fly to their destination, rather than using the more arduous overland route.119 The presence of a growing number of UMCs on the Southern Route is a concerning trend. According to a study in South Africa, Zambia and Zimbabwe in 2018, migrant children often face a multitude of protection challenges, such as violence, kidnapping, ransom demands and lack of access to basic services.120
Ethiopian migrants travelling to South Africa use a variety of different travel modalities, oftentimes travelling long segments in vehicles, while circumventing border and police checkpoints on foot. Some who can afford it fly part or all of the journey. The majority of Ethiopians in South Africa are from rural areas in southern Ethiopia, such as Hosaena (Hadiya zone) and Durame (Kembata Tembaro zone) in the SNNP region.121 Compared to other zones inside the SNNP region, both the Hadiya and Kembata zones are distinguished by high rates of migration combined with low average school performance, a high dropout rate as well as a very high population density.122 The recent IOM study on child migration from Ethiopia found that education is inextricably linked to migration in Shashogo (Hadiya Zone). In the 2000s, when migration from Hadiya to South Africa began increasing, most migrants were school dropouts. In recent years, Shashogo has witnessed an increasing migration of teachers, graduates and civil servants to South Africa, with the consequence that many children are motivated to migrate to South Africa as well.123
51 2020 MOBILITY OVERVIEW IN THE EAST AND HORN OF AFRICA AND THE ARABIAN PENINSULA 522020 MOBILITY OVERVIEW IN THE EAST AND HORN OF AFRICA AND THE ARABIAN PENINSULA
98+1+1+I98% 99+1+I99%
Nationalities Reasons for Migration
1%1%
Somalis KenyansEthiopians Family visitsEconomic reasons
1%
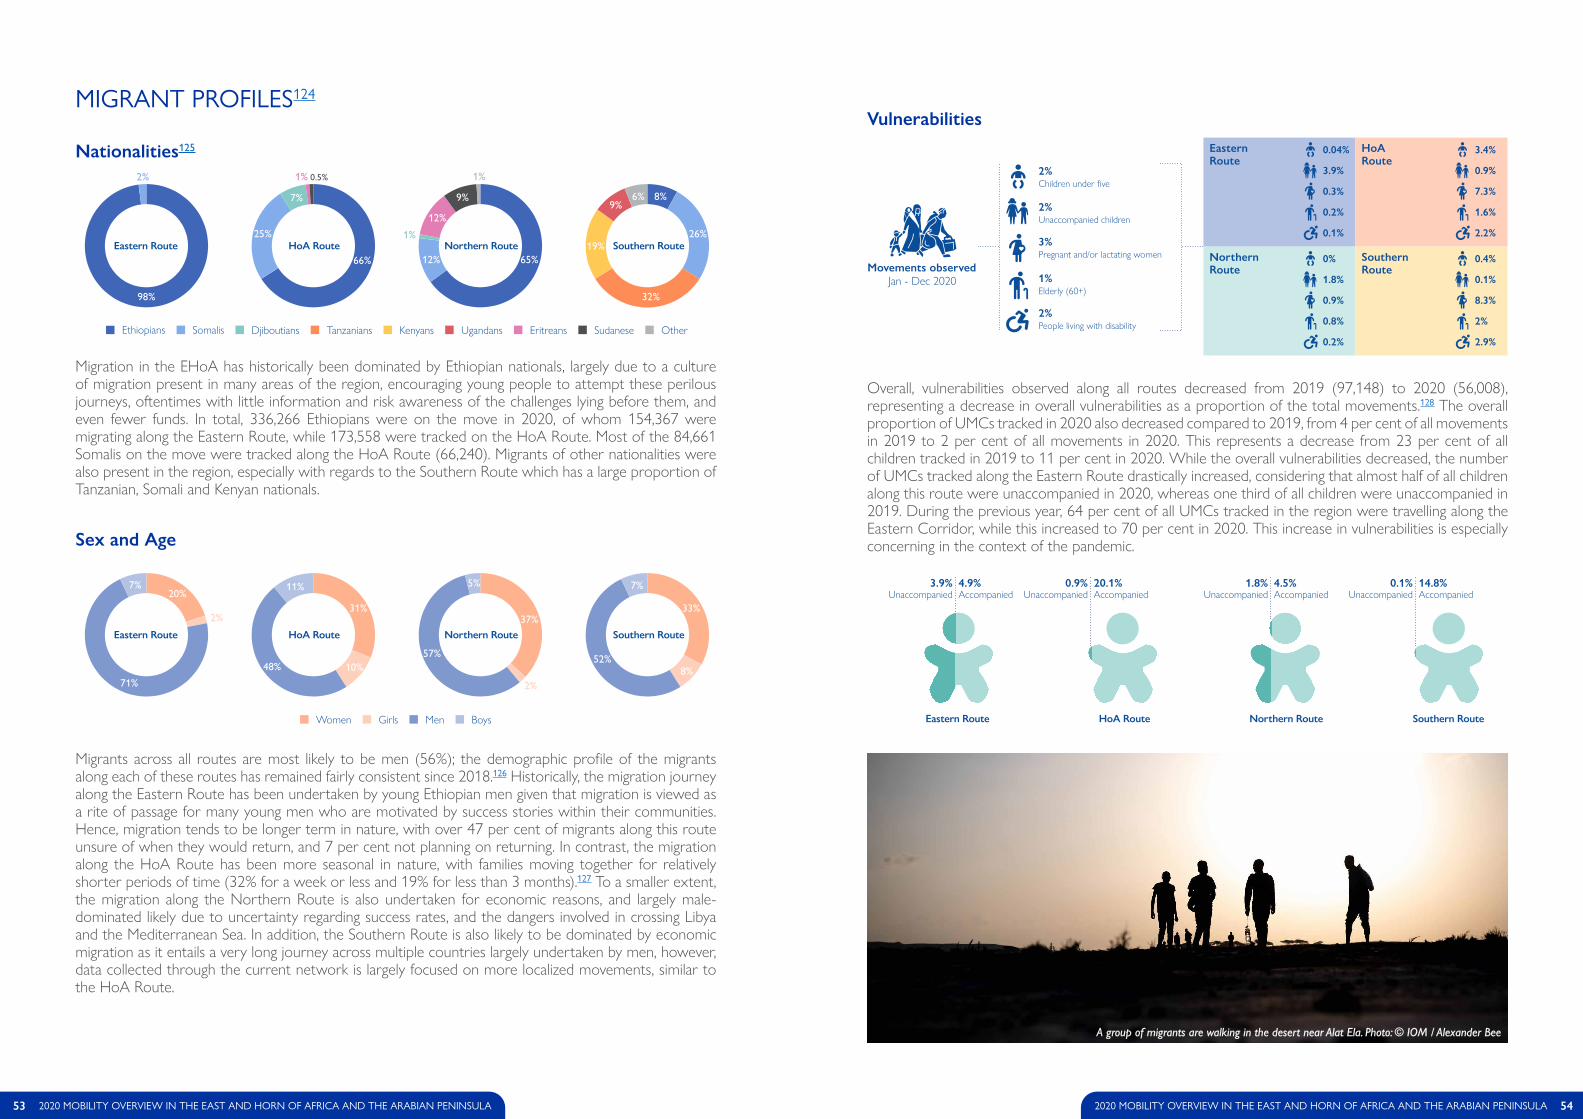
MIGRANT PROFILES124
Migration in the EHoA has historically been dominated by Ethiopian nationals, largely due to a culture of migration present in many areas of the region, encouraging young people to attempt these perilous journeys, oftentimes with little information and risk awareness of the challenges lying before them, and even fewer funds. In total, 336,266 Ethiopians were on the move in 2020, of whom 154,367 were migrating along the Eastern Route, while 173,558 were tracked on the HoA Route. Most of the 84,661 Somalis on the move were tracked along the HoA Route (66,240). Migrants of other nationalities were also present in the region, especially with regards to the Southern Route which has a large proportion of Tanzanian, Somali and Kenyan nationals.
Migrants across all routes are most likely to be men (56%); the demographic profile of the migrants along each of these routes has remained fairly consistent since 2018.126 Historically, the migration journey along the Eastern Route has been undertaken by young Ethiopian men given that migration is viewed as a rite of passage for many young men who are motivated by success stories within their communities. Hence, migration tends to be longer term in nature, with over 47 per cent of migrants along this route unsure of when they would return, and 7 per cent not planning on returning. In contrast, the migration along the HoA Route has been more seasonal in nature, with families moving together for relatively shorter periods of time (32% for a week or less and 19% for less than 3 months).127 To a smaller extent, the migration along the Northern Route is also undertaken for economic reasons, and largely male-dominated likely due to uncertainty regarding success rates, and the dangers involved in crossing Libya and the Mediterranean Sea. In addition, the Southern Route is also likely to be dominated by economic migration as it entails a very long journey across multiple countries largely undertaken by men, however, data collected through the current network is largely focused on more localized movements, similar to the HoA Route.
Overall, vulnerabilities observed along all routes decreased from 2019 (97,148) to 2020 (56,008), representing a decrease in overall vulnerabilities as a proportion of the total movements.128 The overall proportion of UMCs tracked in 2020 also decreased compared to 2019, from 4 per cent of all movements in 2019 to 2 per cent of all movements in 2020. This represents a decrease from 23 per cent of all children tracked in 2019 to 11 per cent in 2020. While the overall vulnerabilities decreased, the number of UMCs tracked along the Eastern Route drastically increased, considering that almost half of all children along this route were unaccompanied in 2020, whereas one third of all children were unaccompanied in 2019. During the previous year, 64 per cent of all UMCs tracked in the region were travelling along the Eastern Corridor, while this increased to 70 per cent in 2020. This increase in vulnerabilities is especially concerning in the context of the pandemic.
53 2020 MOBILITY OVERVIEW IN THE EAST AND HORN OF AFRICA AND THE ARABIAN PENINSULA 542020 MOBILITY OVERVIEW IN THE EAST AND HORN OF AFRICA AND THE ARABIAN PENINSULA
Vulnerabilities
Movements observedJan - Dec 2020
3%Pregnant and/or lactating women
2%Unaccompanied children
2%Children under five
1%Elderly (60+)
2%People living with disability
Eastern Route
0.3%
3.9%
0.2%
0.1%
0.04% HoA Route
7.3%
0.9%
1.6%
2.2%
3.4%
Northern Route
0.9%
1.8%
0.8%
0.2%
0% Southern Route
8.3%
0.1%
2%
2.9%
0.4%
Nationalities125
98+2+I98% 66+25+7+1+1+I 65+12+1+12+9+1+I 8+26+32+19+9+6+I66%
25%
7%
1% 0.5%2%
Eastern Route HoA Route Northern Route Southern Route65%12%
12%
9%
1%
1%
8%6%
26%
32%
19%
9%
Somalis EritreansDjiboutiansEthiopians OtherSudaneseTanzanians Kenyans Ugandans
Sex and Age
20+2+71+7+I71% 31+10+48+11+I 37+2+57+4+I 33+8+52+7+I31%
48%
11%
2%
Eastern Route HoA Route Northern Route Southern Route37%
57%
5% 7%
33%
8%52%
20%7%
10%
2%
Girls BoysMenWomen Eastern Route HoA Route Northern Route Southern Route
3.9% Unaccompanied
4.9% Accompanied
1.8% Unaccompanied
4.5% Accompanied
0.9% Unaccompanied
20.1% Accompanied
0.1% Unaccompanied
14.8% Accompanied
A group of migrants are walking in the desert near Alat Ela. Photo: © IOM / Alexander Bee
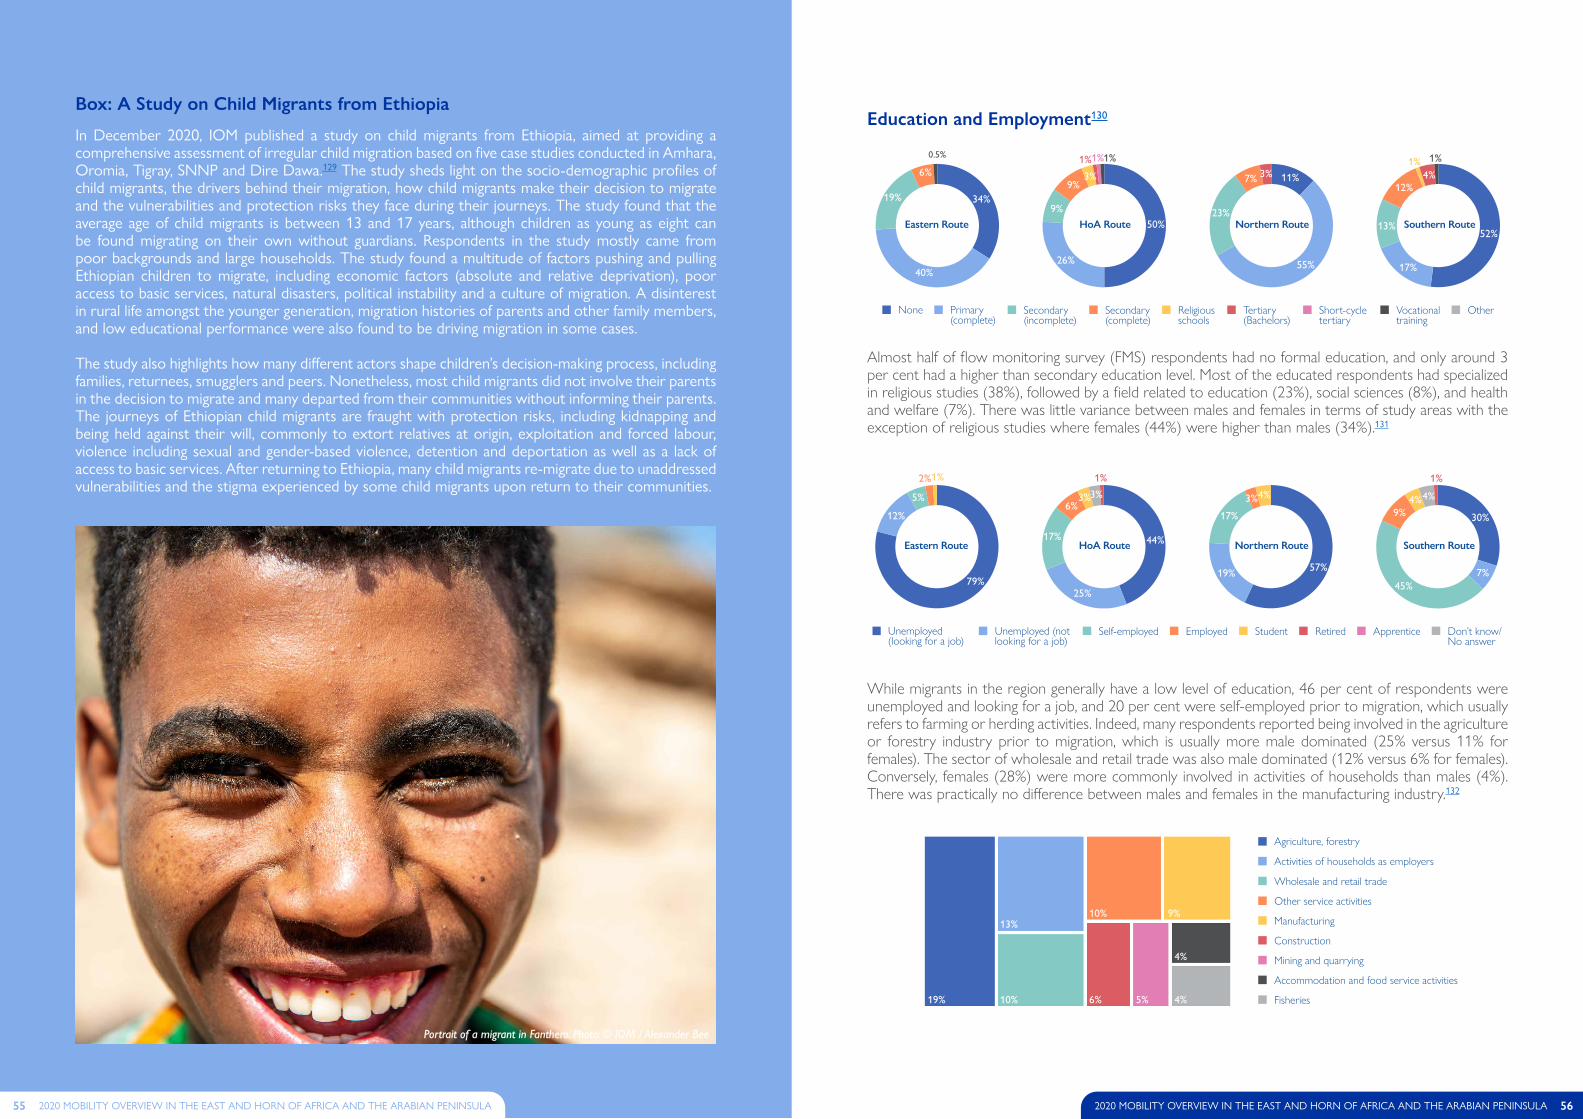
Education and Employment130
In December 2020, IOM published a study on child migrants from Ethiopia, aimed at providing a comprehensive assessment of irregular child migration based on five case studies conducted in Amhara, Oromia, Tigray, SNNP and Dire Dawa�129 The study sheds light on the socio-demographic profiles of child migrants, the drivers behind their migration, how child migrants make their decision to migrate and the vulnerabilities and protection risks they face during their journeys� The study found that the average age of child migrants is between 13 and 17 years, although children as young as eight can be found migrating on their own without guardians� Respondents in the study mostly came from poor backgrounds and large households� The study found a multitude of factors pushing and pulling Ethiopian children to migrate, including economic factors (absolute and relative deprivation), poor access to basic services, natural disasters, political instability and a culture of migration� A disinterest in rural life amongst the younger generation, migration histories of parents and other family members, and low educational performance were also found to be driving migration in some cases�
The study also highlights how many different actors shape children’s decision-making process, including families, returnees, smugglers and peers� Nonetheless, most child migrants did not involve their parents in the decision to migrate and many departed from their communities without informing their parents� The journeys of Ethiopian child migrants are fraught with protection risks, including kidnapping and being held against their will, commonly to extort relatives at origin, exploitation and forced labour, violence including sexual and gender-based violence, detention and deportation as well as a lack of access to basic services� After returning to Ethiopia, many child migrants re-migrate due to unaddressed vulnerabilities and the stigma experienced by some child migrants upon return to their communities�
Box: A Study on Child Migrants from Ethiopia
562020 MOBILITY OVERVIEW IN THE EAST AND HORN OF AFRICA AND THE ARABIAN PENINSULA55 2020 MOBILITY OVERVIEW IN THE EAST AND HORN OF AFRICA AND THE ARABIAN PENINSULA
Portrait of a migrant in Fanthero. Photo: © IOM / Alexander Bee
34+40+19+6+1+I40% 50+26+9+9+3+1+1+1+I 12+55+23+7+3+I 52+17+13+12+1+4+1+I50%
26%
9%
1%1%0.5%
Eastern Route HoA Route Northern Route Southern Route
55%
23%
11%7% 3% 4%
52%
17%
13%
12%34%19%
6%9%
3%
1% 1%1%
Primary (complete)
Short-cycle tertiary
Secondary (incomplete)
None OtherVocational training
Secondary (complete)
Religious schools
Tertiary (Bachelors)
79+13+5+2+1+I 44+25+17+7+3+3+1+I 57+19+17+3+4+I 30+7+45+9+4+4+1+I44%
25%
17%Eastern Route HoA Route Northern Route Southern Route
57%19%
17%
3%4% 4%
30%
7%45%
9%
79%
12%
5%6%
3%
1%
Unemployed (not looking for a job)
ApprenticeSelf-employedUnemployed (looking for a job)
Don’t know/ No answer
Employed Student Retired
1%2%
3%
1%
4%
Activities of households as employers
Mining and quarrying
Wholesale and retail trade
Agriculture, forestry
Fisheries
Accommodation and food service activities
Other service activities
Manufacturing
Construction
19%
13%
10%
10% 9%
6% 5%
4%
4%
Almost half of flow monitoring survey (FMS) respondents had no formal education, and only around 3 per cent had a higher than secondary education level. Most of the educated respondents had specialized in religious studies (38%), followed by a field related to education (23%), social sciences (8%), and health and welfare (7%). There was little variance between males and females in terms of study areas with the exception of religious studies where females (44%) were higher than males (34%).131
While migrants in the region generally have a low level of education, 46 per cent of respondents were unemployed and looking for a job, and 20 per cent were self-employed prior to migration, which usually refers to farming or herding activities. Indeed, many respondents reported being involved in the agriculture or forestry industry prior to migration, which is usually more male dominated (25% versus 11% for females). The sector of wholesale and retail trade was also male dominated (12% versus 6% for females). Conversely, females (28%) were more commonly involved in activities of households than males (4%). There was practically no difference between males and females in the manufacturing industry.132

Reasons for Migration
The history of migration is a key indicator to explore the nexus between decision-making, perceptions, and reintegration challenges back home, as well as to get a better understanding of the environment in which migration is taking place. An estimated 60 per cent of migrants stated that they had not attempted migration in the past versus 40 per cent who had. Compared to other routes, migrants along the Southern and HoA Routes were more likely to have attempted migration in the past. This might be an illustration of the nature of migration movements along these routes that tend to be shorter-term133 and cyclical in nature,134 hence more migrants are likely to have attempted it and returned back to their areas of origin.135 Overall, more migrants were likely to not have attempted migration in the past (60%) compared to the ones who did (40%), although of those who did attempt to migrate in the past, a higher proportion were female (55%) versus male (45%). This higher likelihood of females is also found along the HoA Route. However, along the Eastern Route, which had the greatest disparity between the sexes, males were almost three times more likely to have attempted migration compared to females. Both sexes were equally likely to have attempted migration along the Southern Route.
Previous Displacement and Migration Attempts
Figure 24: History of migration by sex and route in 2020
Furthermore, most respondents reported to have not been displaced in their country prior to migration (67%) versus 33 per cent who had. The gender dynamics of this indicator illustrate the higher likelihood of males of having been displaced previously (78%) compared to females (54%). Migrants along the HoA and Southern Routes are more likely to have been displaced; this might be correlated to the fact that countries along these routes are more prone to both natural and man-made disasters, such as Ethiopia and Somalia.
Overall, only around a quarter of those surveyed responded to the question regarding difficulties faced during the migrant journey.136 Of these, 77 per cent of respondents said they have been facing difficulties during their journey. The main challenges reported en route were related to access to food and water, lack of financial resources, and access to shelter.
In the region, migration tends to be largely driven by economic factors (55%), with the largest majority captured along the Eastern Route. Movements along the Eastern and Northern Routes are generally longer term in nature (for 6 months or longer), while movements along the HoA Route are usually shorter and more localized. Almost 23 per cent of all movements along the Eastern Route were for a duration of more than 3 months at the intended destination, 7 per cent were not planning on leaving once they reached their destination, and over 47 per cent were unaware of when they would return to their areas of origin. By contrast, 32 per cent of the movements along the HoA Route were for a duration of a week or less, 20 per cent were for a duration of less than 3 months, and only 19 per cent were for 3 months to 1 year with 17 per cent for unknown duration. Additionally, 19 per cent of overall movements were shorter term in nature, including seasonal migration (11%), with 46 per cent movements tracked along the HoA Route reported to have been driven by shorter-term drivers, and most shorter-term movements lasting for a week or less (41%).
Forced movements due to various reasons made up 13 per cent of all movements, and most of these were tracked along the HoA Route (82%). The highest proportion of movements driven by economic reasons were headed towards Saudi Arabia (46%), followed by Somalia (17%), while the highest proportion of movements for health care were headed towards Kenya (56%); the highest proportion of movements driven by economic reasons were originating in Ethiopia (64%) and Somalia (18%). Of all forced movements, most originated in Ethiopia as well, followed by Somalia.
Figure 25: History of displacement by sex and route in 2020
57 2020 MOBILITY OVERVIEW IN THE EAST AND HORN OF AFRICA AND THE ARABIAN PENINSULA 582020 MOBILITY OVERVIEW IN THE EAST AND HORN OF AFRICA AND THE ARABIAN PENINSULA
58+37+35+18+14+8+5+5+4+2+2+1+1+158%
37%
35%18%
14%
8%
5%5%
4%
2%
2%
1%
1%
<1%
Hunger/thirstFinancial issues
No shelter/nowhere to sleepSickness
Lack of informationInjuries
Arrest/detention by authoritiesDeportation
Attacks/assaultIdentity document issues
Troubles at seaMental issues
Held against will by non-government authoritiesPrefer not to answer
Difficulties Faced
91+4+1+4+I91% 38+16+8+12+8+4+2+12+I 73+6+3+1+4+1+12+I 33+4+1+14+34+5+5+4+I38%
16%8%
Eastern Route HoA Route Northern Route Southern Route
72%
6%
12%
3%
4%
33%
14%
34%
5%4% 4%
12%
12% 1%
1%
8%
2%4% 4%1%
1%
5%4%
Seasonal migration
Forced movement due to conflict
Economic reasons
OtherUnknownForced movement due to natural disaster
Short-term local movement
Tourism
Not attemptedmigration before
Attemptedmigration before
Not attemptedmigration before
Attemptedmigration before
Not attemptedmigration before
Attemptedmigration before
Not attemptedmigration before
Attemptedmigration before
Eastern Route HOA Northern-Route Southern Route
17%
67%
11%
4%34%
25%
17%
24%49%
21%
12%
18%
13%
41%
23%
23%
Male
Female
Not attempted migation before
Eastern Route
Attempted migation before
Not attempted migation before
HoA Route
Attempted migation before
Not attempted migation before
Northern Route
Attempted migation before
Not attempted migation before
Southern Route
Attempted migation before
Not beenpreviously displaced
Previously beendisplaced
Not beenpreviously displaced
Previously beendisplaced
Not beenpreviously displaced
Previously beendisplaced
Not beenpreviously displaced
Previously beendisplaced
Eastern Route HOA Northern-Route Southern Route
21%
75%
1%3%
36%
23%
15%
26%63%
30%
3%4%
29%
58%
7%7%
Male
Female
Not been previously displaced
Eastern Route
Previously been displaced
Not been previously displaced
HoA Route
Previously been displaced
Not been previously displaced
Northern Route
Previously been displaced
Not been previously displaced
Southern Route
Previously been displaced
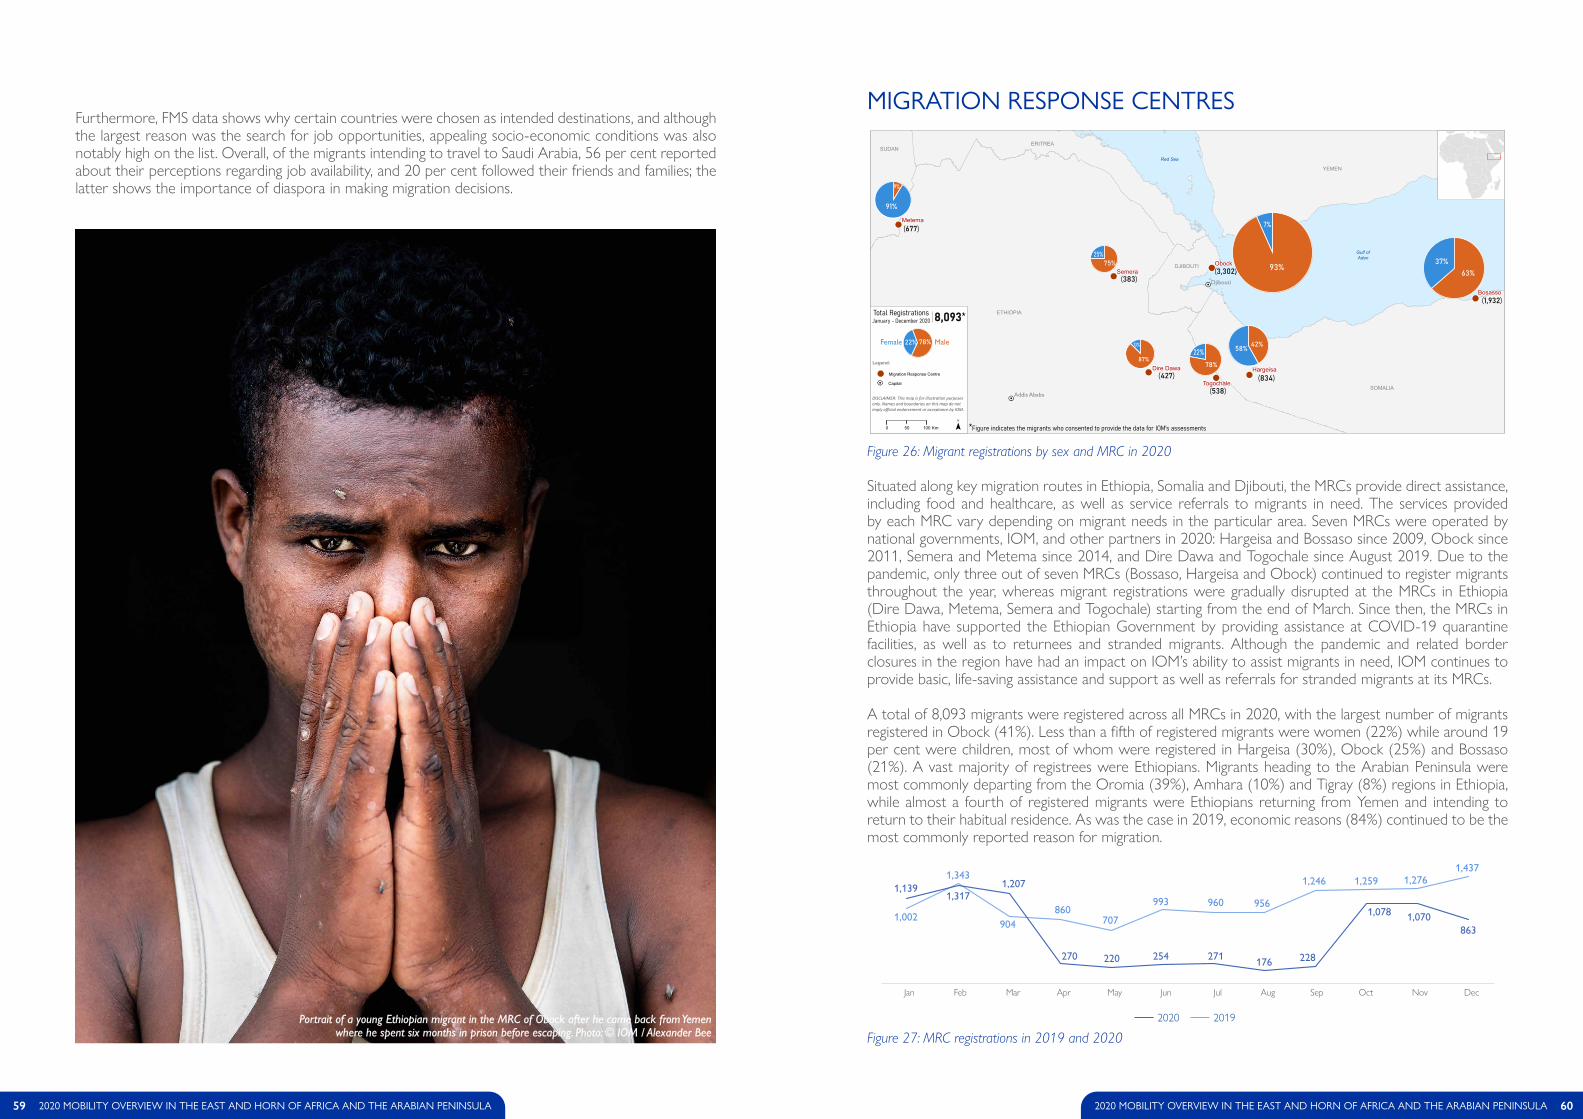
MIGRATION RESPONSE CENTRES
Situated along key migration routes in Ethiopia, Somalia and Djibouti, the MRCs provide direct assistance, including food and healthcare, as well as service referrals to migrants in need. The services provided by each MRC vary depending on migrant needs in the particular area. Seven MRCs were operated by national governments, IOM, and other partners in 2020: Hargeisa and Bossaso since 2009, Obock since 2011, Semera and Metema since 2014, and Dire Dawa and Togochale since August 2019. Due to the pandemic, only three out of seven MRCs (Bossaso, Hargeisa and Obock) continued to register migrants throughout the year, whereas migrant registrations were gradually disrupted at the MRCs in Ethiopia (Dire Dawa, Metema, Semera and Togochale) starting from the end of March. Since then, the MRCs in Ethiopia have supported the Ethiopian Government by providing assistance at COVID-19 quarantine facilities, as well as to returnees and stranded migrants. Although the pandemic and related border closures in the region have had an impact on IOM’s ability to assist migrants in need, IOM continues to provide basic, life-saving assistance and support as well as referrals for stranded migrants at its MRCs.
A total of 8,093 migrants were registered across all MRCs in 2020, with the largest number of migrants registered in Obock (41%). Less than a fifth of registered migrants were women (22%) while around 19 per cent were children, most of whom were registered in Hargeisa (30%), Obock (25%) and Bossaso (21%). A vast majority of registrees were Ethiopians. Migrants heading to the Arabian Peninsula were most commonly departing from the Oromia (39%), Amhara (10%) and Tigray (8%) regions in Ethiopia, while almost a fourth of registered migrants were Ethiopians returning from Yemen and intending to return to their habitual residence. As was the case in 2019, economic reasons (84%) continued to be the most commonly reported reason for migration.
Figure 27: MRC registrations in 2019 and 2020
ObockSemera
Metema
Bosasso
HargeisaDire Dawa
Togochale
ETHIOPIA
SOMALIA
YEMEN
ERITREASUDAN
DJIBOUTI
Djibouti
Addis Ababa
Gulf ofAden
Red Sea
Legend:
0 10050 Km
Migration Response Centre
Capital
(677)
88,,009933*
(834)
(538)
(3,302)
(427)
(383)
(1,932)
*Figure indicates the migrants who consented to provide the data for IOM's assessments
Total RegistrationsJanuary - December 2020
Female Male
93%
7%
91%
9%
87%
75%25%
78%
22%42%58%
63%37%
13%78%22%
Furthermore, FMS data shows why certain countries were chosen as intended destinations, and although the largest reason was the search for job opportunities, appealing socio-economic conditions was also notably high on the list. Overall, of the migrants intending to travel to Saudi Arabia, 56 per cent reported about their perceptions regarding job availability, and 20 per cent followed their friends and families; the latter shows the importance of diaspora in making migration decisions.
Figure 26: Migrant registrations by sex and MRC in 2020
59 2020 MOBILITY OVERVIEW IN THE EAST AND HORN OF AFRICA AND THE ARABIAN PENINSULA 602020 MOBILITY OVERVIEW IN THE EAST AND HORN OF AFRICA AND THE ARABIAN PENINSULA
Portrait of a young Ethiopian migrant in the MRC of Obock after he came back from Yemen where he spent six months in prison before escaping. Photo: © IOM / Alexander Bee
Jan Feb Mar Apr May Jun Jul Aug Sep Oct Nov DecJun Jul Aug Sep Oct Nov DecJan Feb Mar Apr May
1,246 1,259 1,2761,437
1,139
1,002
1,343
904860
707
993 960 9561,317
1,207
270 220 254 271 176 228
1,078 1,070863
2020 2019

Portrait of a migrant sitting under a tree in Fantahero while waiting to board a boat to Yemen. Photo: © IOM / Alexander Bee
In addition to being a public health emergency, COVID-19 has severely affected local economies, people’s livelihoods and almost every aspect of daily life for over a year now. The impact of the pandemic has not only been felt by people on the move, but by both the host communities and communities of origin, especially those who are reliant on remittances. Remittance flows to low- and middle-income countries are projected to decline by around 14 per cent in 2021 compared to pre-COVID-19 levels.137 The likely reduction of these flows is expected to have a considerable financial and social impact, such as increased poverty and reduced access to basic services including healthcare and education.138 Hence, while the core drivers of migration, namely poverty, conflict and environmental events persist, the economic drivers have been exacerbated further, and at the same time, migration as a livelihood strategy has become even more risky as smugglers try to circumvent restrictions and maximise profits over the fewer migrants that undertake the journey. Consequently, as mobility restrictions are eased, both intra- and extra-regional migration from the EHoA are likely to increase in 2021. However, unpredictable and prolonged movement restrictions may push more migrants towards irregular channels of migration and increasingly risky smuggling routes.
Despite an increase in recorded movements towards the end of 2020, with overall movements increasing by an average of 17 per cent per month between October and December, the impact COVID-19 will have on the migration landscape in the region is far from over. While many countries worldwide have begun mass vaccination campaigns, vaccine availability in the EHoA remains severely limited, with few prospects of vaccinating a significant percentage of the population before the end of 2022. The region will therefore likely suffer further waves of infection, resulting in additional lockdowns and other measures to prevent the spread of the disease, which will in turn exacerbate and prolong the impact of COVID-19 on the EHoA. A recent study found that the long-term socio-economic impact of the pandemic is set to widen the poverty gap between countries as an estimated 41 million people in low and medium development countries could be pushed into poverty by 2030, with the heaviest burden falling on Africa.139
Aside from the pandemic, the region’s political landscape has undergone important changes in 2020, and more developments and transitions are expected in 2021. General elections were held in Burundi in May 2020, electing new President Évariste Ndayishimiye, as well as in the United Republic of Tanzania at the end of October 2020 during which President Magufuli was re-elected for another five-year term. However, after Magufuli’s sudden death in March 2021, the country sworn in its first female head of state, President Samia Suluhu Hassan, marking a new chapter in the country’s history. Moreover, Uganda’s general elections were held in January 2021, while both the Ethiopian parliamentary elections and the Somali presidential elections have been delayed due to the pandemic and are planned for mid-2021. These delays have subsequently sparked tensions, and the political turmoil is still ongoing. In addition, the Kenyan general elections, which are scheduled for 2022, also come with a level of uncertainty considering that a significant number of people were displaced due to post-election violence in 2017.140
The security situation in the EHoA will remain complex and unpredictable in the second half of 2021 as long as conflict, violence and other shocks are persisting. In South Sudan, the establishment of a unity government in February 2020, as stipulated in the peace deal, has initially brought hopes of peace and stability, and the same applies to the recent, awaited dissolution of parliament announced by President Salva Kiir on 8 May 2021. However, intercommunal clashes are still on the rise, at a time when the country is also tackling famine. In Somalia, violence is escalating at an alarming pace due to the simmering political crisis, with intensified fighting in Mogadishu at the end of April 2021. Meanwhile, the Tigray crisis entered its sixth month with no clear end in sight. Hostilities are ongoing, communication channels are constrained, and humanitarian access remains obstructed as of early May 2021. The number of IDPs is expected to drastically increase from the current 1 million estimate, when at the same time, a famine is emerging with an estimated 4.5 million food insecure people across Tigray.141
VI� 2021 MIGRATION OUTLOOK
61 2020 MOBILITY OVERVIEW IN THE EAST AND HORN OF AFRICA AND THE ARABIAN PENINSULA 622020 MOBILITY OVERVIEW IN THE EAST AND HORN OF AFRICA AND THE ARABIAN PENINSULA
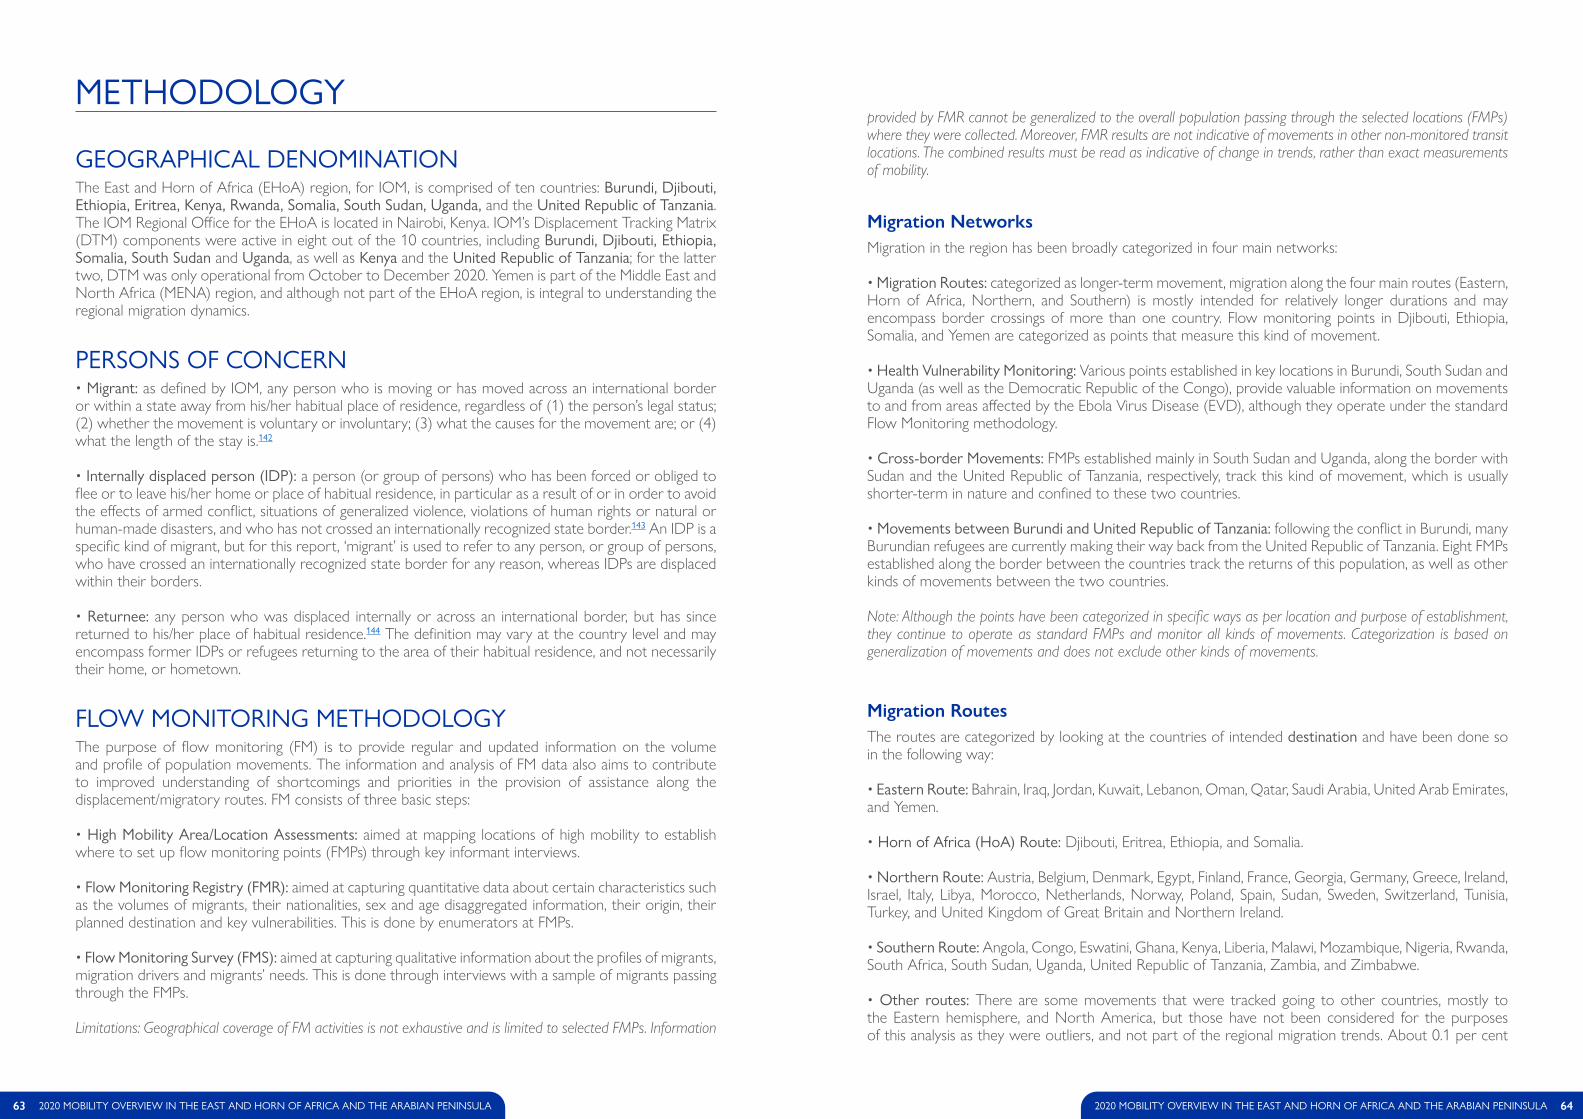
63 2020 MOBILITY OVERVIEW IN THE EAST AND HORN OF AFRICA AND THE ARABIAN PENINSULA 642020 MOBILITY OVERVIEW IN THE EAST AND HORN OF AFRICA AND THE ARABIAN PENINSULA
GEOGRAPHICAL DENOMINATIONThe East and Horn of Africa (EHoA) region, for IOM, is comprised of ten countries: Burundi, Djibouti, Ethiopia, Eritrea, Kenya, Rwanda, Somalia, South Sudan, Uganda, and the United Republic of Tanzania. The IOM Regional Office for the EHoA is located in Nairobi, Kenya. IOM’s Displacement Tracking Matrix (DTM) components were active in eight out of the 10 countries, including Burundi, Djibouti, Ethiopia, Somalia, South Sudan and Uganda, as well as Kenya and the United Republic of Tanzania; for the latter two, DTM was only operational from October to December 2020. Yemen is part of the Middle East and North Africa (MENA) region, and although not part of the EHoA region, is integral to understanding the regional migration dynamics.
PERSONS OF CONCERN• Migrant: as defined by IOM, any person who is moving or has moved across an international border or within a state away from his/her habitual place of residence, regardless of (1) the person’s legal status; (2) whether the movement is voluntary or involuntary; (3) what the causes for the movement are; or (4) what the length of the stay is.142
• Internally displaced person (IDP): a person (or group of persons) who has been forced or obliged to flee or to leave his/her home or place of habitual residence, in particular as a result of or in order to avoid the effects of armed conflict, situations of generalized violence, violations of human rights or natural or human-made disasters, and who has not crossed an internationally recognized state border.143 An IDP is a specific kind of migrant, but for this report, ‘migrant’ is used to refer to any person, or group of persons, who have crossed an internationally recognized state border for any reason, whereas IDPs are displaced within their borders.
• Returnee: any person who was displaced internally or across an international border, but has since returned to his/her place of habitual residence.144 The definition may vary at the country level and may encompass former IDPs or refugees returning to the area of their habitual residence, and not necessarily their home, or hometown.
FLOW MONITORING METHODOLOGYThe purpose of flow monitoring (FM) is to provide regular and updated information on the volume and profile of population movements. The information and analysis of FM data also aims to contribute to improved understanding of shortcomings and priorities in the provision of assistance along the displacement/migratory routes. FM consists of three basic steps:
• High Mobility Area/Location Assessments: aimed at mapping locations of high mobility to establish where to set up flow monitoring points (FMPs) through key informant interviews.
• Flow Monitoring Registry (FMR): aimed at capturing quantitative data about certain characteristics such as the volumes of migrants, their nationalities, sex and age disaggregated information, their origin, their planned destination and key vulnerabilities. This is done by enumerators at FMPs.
• Flow Monitoring Survey (FMS): aimed at capturing qualitative information about the profiles of migrants, migration drivers and migrants’ needs. This is done through interviews with a sample of migrants passing through the FMPs.
Limitations: Geographical coverage of FM activities is not exhaustive and is limited to selected FMPs. Information
METHODOLOGYprovided by FMR cannot be generalized to the overall population passing through the selected locations (FMPs) where they were collected. Moreover, FMR results are not indicative of movements in other non-monitored transit locations. The combined results must be read as indicative of change in trends, rather than exact measurements of mobility.
Migration NetworksMigration in the region has been broadly categorized in four main networks:
• Migration Routes: categorized as longer-term movement, migration along the four main routes (Eastern, Horn of Africa, Northern, and Southern) is mostly intended for relatively longer durations and may encompass border crossings of more than one country. Flow monitoring points in Djibouti, Ethiopia, Somalia, and Yemen are categorized as points that measure this kind of movement.
• Health Vulnerability Monitoring: Various points established in key locations in Burundi, South Sudan and Uganda (as well as the Democratic Republic of the Congo), provide valuable information on movements to and from areas affected by the Ebola Virus Disease (EVD), although they operate under the standard Flow Monitoring methodology.
• Cross-border Movements: FMPs established mainly in South Sudan and Uganda, along the border with Sudan and the United Republic of Tanzania, respectively, track this kind of movement, which is usually shorter-term in nature and confined to these two countries.
• Movements between Burundi and United Republic of Tanzania: following the conflict in Burundi, many Burundian refugees are currently making their way back from the United Republic of Tanzania. Eight FMPs established along the border between the countries track the returns of this population, as well as other kinds of movements between the two countries.
Note: Although the points have been categorized in specific ways as per location and purpose of establishment, they continue to operate as standard FMPs and monitor all kinds of movements. Categorization is based on generalization of movements and does not exclude other kinds of movements.
Migration RoutesThe routes are categorized by looking at the countries of intended destination and have been done so in the following way:
• Eastern Route: Bahrain, Iraq, Jordan, Kuwait, Lebanon, Oman, Qatar, Saudi Arabia, United Arab Emirates, and Yemen.
• Horn of Africa (HoA) Route: Djibouti, Eritrea, Ethiopia, and Somalia.
• Northern Route: Austria, Belgium, Denmark, Egypt, Finland, France, Georgia, Germany, Greece, Ireland, Israel, Italy, Libya, Morocco, Netherlands, Norway, Poland, Spain, Sudan, Sweden, Switzerland, Tunisia, Turkey, and United Kingdom of Great Britain and Northern Ireland.
• Southern Route: Angola, Congo, Eswatini, Ghana, Kenya, Liberia, Malawi, Mozambique, Nigeria, Rwanda, South Africa, South Sudan, Uganda, United Republic of Tanzania, Zambia, and Zimbabwe.
• Other routes: There are some movements that were tracked going to other countries, mostly to the Eastern hemisphere, and North America, but those have not been considered for the purposes of this analysis as they were outliers, and not part of the regional migration trends. About 0.1 per cent
65 2020 MOBILITY OVERVIEW IN THE EAST AND HORN OF AFRICA AND THE ARABIAN PENINSULA 662020 MOBILITY OVERVIEW IN THE EAST AND HORN OF AFRICA AND THE ARABIAN PENINSULA
observations were observed of these ‘other’ destinations; thus they did not have a substantial impact on the analysis.
Note: The FMR and FMS data are likely to be biased, or incomplete, due to lack of operational coverage along some of these routes – particularly the Northern and Southern Routes.
Yemen ArrivalsDTM teams in Djibouti, Ethiopia, Somalia and Yemen track movements along the Eastern Route. Yemen, through a network of five FMPs, covers the southern coast of Yemen only, which tracks new arrivals reaching the Peninsula from the HoA across the Gulf of Aden. Due to the ongoing conflict in the region, DTM teams do not have access to the western coast of Yemen which borders the Red Sea. For this reason, it is likely that the figures on new arrivals to Yemen are under-estimating actual arrivals, and a large proportion of movements originating from Obock in Djibouti, likely headed across the Red Sea, are not captured through FM.145
Change in IndicatorsDuring February and March 2020, the FMR tool was updated to include a wider range of options for relevant indicators. The various missions adapted the new tool at varying paces, hence the data collected during this period is not directly comparable. The likely impact on findings can be indicated through the following:
• Flow Type: additional options included another option related to economic reasons (forced movement due to food insecurity), additional options for short-term movements (travel to collect aid, health care, market visits), and additional options for other kinds of movements (family visits, return visits, education related travel). A proportion of the change in reasons for movements, especially with relevance to economic, may be attributed to the addition of these new options, and should be interpreted in the same light.
• Sex and Age Disaggregation: additional age brackets were added.
• Vulnerabilities: additional options were added, including sex breakdown for unaccompanied migrant children (UMCs), and for mental disability, and the categories of pregnant and lactating women were separated.
• Chronic Diseases/COVID-19: later in the year, additional questions were added regarding health condition of the migrants, and if they suffered from any chronic diseases like heart disease, diabetes, etc. A question was also added about their knowledge of the coronavirus disease 2019 (COVID-19) outbreak.
POPULATION MOBILITY MAPPING METHODOLOGYPopulation Mobility Mapping (PMM) has been developed through an adaptation of the DTM model. PMM involves analyzing the characteristics and dynamics of population mobility to facilitate informed decision-making in public health interventions. More broadly, it aims to improve prevention, detection and response to the spread of infectious diseases through an improved understanding of spaces of vulnerability and prevailing human mobility patterns. PMM is comprised of three separate but related stages that combine qualitative and quantitative methods:
• Participatory Mapping Exercise (PME): aimed at identifying and prioritizing strategic transit points (e.g. Points of Entry (PoE), Points of Control (PoCs), etc.). PME is conducted to rapidly collect information on human mobility profiles and patterns in order to inform effective, more targeted resource allocation at a time of a public health risk. This is done through group discussion, using basemaps prepared ahead of time as basis for discussion.
• Site Observation: aimed at assessing spaces of vulnerability that were identified and prioritized through PME (e.g. Priority Sites Assessment, Priority Health Facilities Assessment, Priority Markets Assessment, Priority Traditional Healers Assessment).
• Flow Monitoring: aimed at profiling the volume and dynamics of human mobility at selected strategic transit points connecting spaces of vulnerability, which are formal or informal PoEs/PoCs covering land, water and air transportation.
COVID-19 MOBILITY RESTRICTIONS METHODOLOGYThe current outbreak of COVID-19 has affected global mobility in the form of various travel disruptions and restrictions. To better understand how COVID-19 affects global mobility, IOM developed a global mobility database to map and gather data on the locations, status and different restrictions at PoEs.146 In the EHoA region, DTM teams in nine of the ten countries covered by IOM Nairobi Regional Office are actively collecting information on various PoEs, internal transit locations, as well as other areas of interest in an effort to better understand the extent of these restrictions, as well as the impact on different types of population groups.147
Data is collected about the following locations:
• Airports: currently or recently functioning airport with a designated International Air Transport Association (IATA) code.
• Blue Border Crossing Points: international border crossing point on sea, river or lake.
• Land Border Crossing Points: international border crossing point on land.
• Internal Transit Points: internal transit point inside a given country, territory or area.
• Areas of interest: region, town, city or sub-administrative unit in a given country, territory or area with specific restrictions.
• Sites with a population of interest particularly affected by or at risk of COVID-19: stranded, repatriated and returning migrants, IDPs, nationals, asylum-seekers and regular travellers.
67 2020 MOBILITY OVERVIEW IN THE EAST AND HORN OF AFRICA AND THE ARABIAN PENINSULA 682020 MOBILITY OVERVIEW IN THE EAST AND HORN OF AFRICA AND THE ARABIAN PENINSULA
1. UNDESA. 2020. International Migrant Stock.2. IOM. 2020. IDP and refugee tracking matrix for the East and Horn of Africa: data collected from the IOM’s DTM, OCHA, UNHCR and IDMC. Unpublished data.3. See: Displacement Tracking Matrix. 4. See: Regional Data Hub.5. Worldometers. 2021. Coronavirus Worldwide Graphs.6. IOM. 2020. COVID-19 tracking matrix for the East and Horn of Africa: data collected from WHO and Ministries of Health. Unpublished data.7. AFDB. 2021. African Economic Outlook 2021.8. IOM. 2020. DTM COVID-19 Regional Overview on Mobility Restrictions as of 14 May 2020.9. COVID-19 indicators are compiled using an FMS sample of 7,441 surveys conducted in Djibouti, Ethiopia, and Somalia between October and December 2020.10. AFDB. 2021. African Economic Outlook 2021.11. GAVI, The Vaccine Alliance. 2020. COVAX explained.12. UNDESA. 2020. International Migration 2020 Highlights.13. IDMC. 2020. Internal Displacement 2020: Mid-year update.14. IOM. 2020. IDP and refugee tracking matrix for the East and Horn of Africa: data collected from the IOM’s DTM, OCHA, UNHCR and IDMC. Unpublished data.15. UNHCR. 2021. UNHCR relocates first Ethiopian refugees to a new site in Sudan.16. UNHCR. 2021. Ethiopia Tigray Emergency.17. FEWS NET. 2020. East Africa Food Security Outlook July 2020.18. BTI Transformation Index. 2021. Burundi Country Report 2020.19. IOM. 2021. Burundi Internal Displacement Dashboard (December 2020).20. IOM. 2021. Burundi Internal Displacement Dashboard (December 2020).21. IOM. 2020. Burundi Suivi des Urgences (13-19 Avril 2020).22. IOM. 2020. Burundi Suivi des Urgences (7-21 Novembre 2020).23. IOM. 2020. Burundi Flash Info Gatumba Floods (May 2020).24. IOM. 2020. Burundi Flash Info Gatumba Floods (May 2020).25. BTI Transformation Index. 2021. Burundi Country Report 2020.26. IOM. 2020. Burundi Flash Info Gatumba Floods (May 2020).27. IOM. 2021. Burundi Rapport de l’Enquête de Profilage de Gatumba (Mars 2021).28. IOM. 2021. Burundi Rapport de Déplacement (Novembre 2020).29. FAO. 2021. Burundi FAO in the 2021 humanitarian appeals.30. The Integrated Food Security Phase Classification (IPC) is an innovative multi-partner initiative for improving food security and nutrition analysis and decision-making. There are three IPC classifications that distinguish Acute Food Insecurity, Chronic Food Insecurity and Acute Malnutrition. 31. FEWS NET. 2020. Burundi Food Security Outlook October 2020 to May 2021. 32. The New York Times. 2021. Fear and Hostility Simmer as Ethiopia’s Military Keeps Hold on Tigray.33. OCHA. 2021. Ethiopia Tigray Region Humanitarian Update Situation Report 6 January 2021.34. UNHCR. 2021. UNHCR relocates first Ethiopian refugees to a new site in Sudan.35. IOM. 2021. Ethiopia Emergency Site Assessment 4 (2-23 March 2021).36. IOM. 2021. Ethiopia National Displacement Report 5 (June-July 2020).37. UNHCR. 2020. Ethiopia situation Eritrean refugees in Tigray region dashboard.38. MMC. 2021. Mixed migration consequences of the Tigrayan crisis.39. OCHA. 2021. Ethiopia Tigray Region Humanitarian Update Situation Report 6 January 2021.40. ICCG. 2020. Updated Humanitarian Response Plan for Northern Ethiopia November 2020 to
REFERENCESJanuary 2021.41. IPC. 2020. Ethiopia Acute Food Insecurity October 2020 to September 2021 Snapshot.42. FAO. 2021. Ethiopia.43. FAO. 2020. Desert Locust situation update 26 October 2020; FAO. 2020. Desert Locust situation update 19 December 2020.44. IOM. 2021. Ethiopia National Displacement Report 7 (December 2020 – January 2021).45. IDMC. 2021. From basic needs to the recovery of livelihoods: Local integration of people displaced by drought in Ethiopia.46. UNHCR. 2021. Ethiopia Fact Sheet December 2020.47. OCHA. 2021. Humanitarian Needs Overview Somalia.48. OCHA. 2021. Humanitarian Needs Overview Somalia.49. OCHA. 2020. Somalia Hagaa Floods Response Status 22 November 2020.50. OCHA. 2020. Somalia Cyclone Gati 13 December 2020.51. OCHA. 2021. Somalia Humanitarian Dashboard December 2020.52. International Research Institute for Climate and Society Columbia University. 2021. IRI ENSO Forecast.53. OCHA. 2021. Humanitarian Needs Overview Somalia.54. OCHA. 2021. Somalia Humanitarian Dashboard December 2020.55. FEWS NET, FSNAU. 2020. Somalia Food Security Outlook October 2020 to May 2021.56. OCHA. 2021. Humanitarian Needs Overview Somalia.57. OCHA. 2021. Humanitarian Needs Overview Somalia.58. IOM. 2020. Working Together Better to Prevent, Address and Find Durable Solutions to Internal Displacement: GP20 Compilation of National Practices.59. IOM. 2020. Migration Research Series 66: Community Stabilization - An approach for facilitating progress towards durable solutions and operationalizing the Humanitarian-Development-Peace Nexus: Lessons from Zimbabwe, Ethiopia and Somalia.60. IOM. 2020. South Sudan Baseline Locations Round 9.61. IOM DTM employs Event Tracking as a more rapid and localized assessment tool complementing the overall efforts to report on IDP and returnee figures nationally. The data collected is used for the validation of quarterly Mobility Tracking (MT) rounds which provide updates to the national IDP and returnee baseline. See: 2020 summary dataset.62. OHCHR. 2020. Renewed violence and delayed implementation of the peace agreement severely threaten peace and stability in South Sudan, UN experts note.63. IOM. 2020. South Sudan Pibor UNMISS AA Site Flow Monitoring Summary (7-18 August 2020).64. IOM. 2021. South Sudan Event Tracking (October-December 2020).65. IOM. 2021. South Sudan Urban Multi-Sector Needs, Vulnerabilities and COVID-19 Impact Survey (FSNMS+) Juba Town (August-September 2020).66. OCHA. 2020. South Sudan Flooding Situation Report 18 December 2020.67. IOM. 2021. South Sudan Mangala Rapid Flow Monitoring (November-December 2020).68. IPC. 2021. South Sudan IPC Results October 2020 to July 2021.69. IPC. 2021. Yemen Acute Food Insecurity Situation October-December 2020 and Projection for January-June 2021.70. IOM. 2020. South Sudan Mobility Tracking Round 9 Initial Findings.71. IOM. 2020. South Sudan Baseline Locations Round 9.72. In September 2020, UNMISS initiated process of withdrawal of protection forces from the various PoC sites (Bor, Wau, Juba, Malakal and Bentiu) aiming to redeploy troops to hotspots across the country. The re-designation of PoC sites into IDP camps started in Wau and Bor, and by April 2021, only Malakal retained its PoC status.73. IOM. 2020. South Sudan Intentions And Perception Survey Wau Displacement Sites (January
https://displacement.iom.int/reports/burundi-%E2%80%94-flash-info-gatumba-floods-may-2020?close=true
https://displacement.iom.int/reports/burundi-%E2%80%94-flash-info-gatumba-floods-may-2020?close=true

69 2020 MOBILITY OVERVIEW IN THE EAST AND HORN OF AFRICA AND THE ARABIAN PENINSULA 702020 MOBILITY OVERVIEW IN THE EAST AND HORN OF AFRICA AND THE ARABIAN PENINSULA
2020).74. IOM. 2021. South Sudan Flow Monitoring Registry: Trends in Cross-Border Return Flows and Impact of COVID-19 Restrictions (February-December 2020).75. See: Displacement Tracking Matrix.76. See: Research and Analysis.77. The decrease in movements tracked through the migration routes network compared to 2019 (when only the common FMP countries - Djibouti, Ethiopia, Somalia and Yemen - are considered) is 40 per cent. The addition of FMPs in Kenya and the United Republic of Tanzania in late 2020 has reduced the difference to 35 per cent.78. Figures for November-December 2019 and January 2020 are much lower due to operational issues as Somalia halted FM operations during these months, which then resumed in February 2020.79. Expertise France. 2017. Expertise France. (2017). Yemen Country Statement: Addressing Migrant Smuggling and Human Trafficking in East Africa.80. Data on actual entries into Saudi Arabia is not available, but this information was gleaned from the number of stranded migrants present in Yemen which was estimated to be around 32,700 by the end of 2020.81. Yemeni nationals are not part of the regular FMR reporting as they are considered to be ‘returnees’. See: Yemen for more information on Yemeni nationals entering Yemen.82. See: Comparative Eastern Corridor Route Analysis: Obock, Djibouti and Bossaso, Puntland.83. Other nationalities include Eritreans and Bangladeshis. Other vulnerabilities (0.01%) include pregnant and/or lactating women and elderly.84. IOM. 2020. Yemen Quarterly Update April-June 2020.85. IOM. 2020. Yemen Situation Report June 2020.86. IOM. 2021. Impact of COVID-19 Movement Restrictions on Migrants Along the Eastern Corridor 10 (December 2020).87. IOM. 2021. Impact of COVID-19 Movement Restrictions on Migrants Along the Eastern Corridor 10 (December 2020).88. IOM. 2021. Impact of COVID-19 Movement Restrictions on Migrants Along the Eastern Corridor 10 (February 2021).89. IOM. 2021. Impact of COVID-19 Movement Restrictions on Migrants Along the Eastern Corridor 10 (February 2021).90. See: Ethiopian migrants describe “hell” of detention.91. Al-Awlaqi, W., Al-Hada, S., Al-Shawthabi, Y. 2019. Yemen’s Expatriate Workforce Under Threat: The Essential Role of Remittances in Mitigating Economic Collapse.92. IOM. 2021. Impact of COVID-19 Movement Restrictions on Migrants Along the Eastern Corridor 10 (March 2021).93. ASR from Yemen include those migrants that opt to return to Somalia on a voluntary basis. Migrants are provided with assistance by IOM and passage home by UNHCR due to their prima facie refugee status in Yemen.94. See: Gendered Patterns of Women and Girls’ Migration along the Eastern Corridor.95. Fernandez, B. 2017. Irregular Migration from Ethiopia to the Gulf States.96. Ayalew, M., Aklessa, G. and Laiboni, N. 2019. Women’s Labour Migration on the African-Middle East Corridor: Experiences of Migrant Domestic Workers from Ethiopia; De Regt, M. and Tafesse, M. 2016. Deported before experiencing the good sides of migration: Ethiopians returning from Saudi Arabia; Dessiye, M., and Emirie, G. 2018. Living and working as a domestic worker in the Middle East: the experience of migrant returnees in Girana town, North Wollo, Ethiopia.97. IOM. 2021. To change my life: Risk perception, expectations and migration experiences of young Ethiopians migrating along the Eastern Route toward the Arabian Peninsula.
98. Central Statistical Agency. 2016. Ethiopia: Demographic and Health Survey 2016.99. IOM. 2021. Libya Migrants Baseline Assessment Round 34.100. IOM. 2020. DTM Libya Flow Monitoring Survey (January-December 2020). Unpublished data.101. IOM. 2020. Migrants Missing in Libya a Matter of Gravest Concern.102. Amnesty International. 2020. ‘Between Life and Death’ Refugees and Migrants Trapped in Libya’s Cycle of Abuse; MSF. 2019. Trading in suffering: detention, exploitation and abuse in Libya.103. IOM. 2020. Living and Working in the Midst of Conflict: The Status of Long-term Migrants in Libya.104. IOM. 2020. IOM Libya Monthly Update December 2020.105. IOM. 2020. Migrants Missing in Libya a Matter of Gravest Concern; The Wall Street Journal. 2020. Migrants in Libya Suffer Torture, Abuse in Off-the-Grid Detention, Aid Groups Say.106. Amnesty International. 2020. ‘Between Life and Death’ Refugees and Migrants Trapped in Libya’s Cycle of Abuse.107. For Spain, no data on nationality at arrival is available for October-December 2020. For Cyprus, no data on nationalities at arrivals is available for 2020. For Spain and Greece, the nationality breakdown is based on available information for registered migrants and refugees. For Italy and Malta, the information on nationality is based on the nationality declared by migrants as reported by the national authorities. See: Flow Monitoring Europe for updated figures on arrivals to Europe.108. Albania, Bosnia and Herzegovina, Croatia, Montenegro, North Macedonia, Serbia, Slovenia, Kosovo (SCR 1244).109. Eurostat. 2021. Asylum and first-time asylum applicants by citizenship, age and sex - annual aggregated data (rounded) [migr_asyappctza]. Accessed 4 April 2021.110. Eurostat. 2021. Asylum and first-time asylum applicants by citizenship, age and sex - annual aggregated data (rounded) [migr_asyappctza]. Accessed 4 April 2021.111. Eurostat. 2021. Asylum and first-time asylum applicants by citizenship, age and sex - annual aggregated data (rounded) [migr_asyappctza]. Accessed 4 April 2021.112. It is important to note that asylum decisions are not necessarily made the same year an applicant applies and migrants do not always apply for asylum as soon as they reach Europe.113. Eurostat. 2021. Asylum and first-time asylum applicants by citizenship, age and sex - annual aggregated data (rounded) [migr_asyappctza]. Accessed 4 April 2021.114. IOM. 2009. In Pursuit of the Southern Dream: Victims of Necessity Assessment of the Irregular Movement of Men from East Africa and the Horn to South Africa.115. RMMS, DRC. 2017. Smuggled South: An updated overview of mixed migration from the Horn of Africa to southern Africa with specific focus on protections risks, human smuggling and trafficking.116. Smaller values are not represented: nationalities (0.5% Other), reasons for migration (0.1% Education, 0.1% Return to habitual reasons).117. Semela, T. and Cochrane, L. 2019. Education - Migration Nexus: Understanding Youth Migration in Southern Ethiopia.118. IOM. 2020. A Study on Child Migrants from Ethiopia.119. IOM. 2020. A Study on Child Migrants from Ethiopia.120. IOM. 2019. Fatal Journeys Volume 4: Missing Migrant Children.121. Estifanos, Y.S. 2017. Social Networks, Dreams and Risks: Ethiopian Irregular Migrants into South Africa.122. Semela, T. and Cochrane, L. 2019. Education - Migration Nexus: Understanding Youth Migration in Southern Ethiopia.123. IOM. 2020. A Study on Child Migrants from Ethiopia.124. Indicators on nationalities, sex and age, vulnerabilities, and reasons for migration are compiled using an FMR sample of 482,324 tracked movements in 2020: Eastern Route (157,711), HoA Route (262,051),
71 2020 MOBILITY OVERVIEW IN THE EAST AND HORN OF AFRICA AND THE ARABIAN PENINSULA 722020 MOBILITY OVERVIEW IN THE EAST AND HORN OF AFRICA AND THE ARABIAN PENINSULA
Northern Route (6,341), and Southern Route (56,221). Indicators on education and employment are based on an FMS sample of 30,300 respondents interviewed in Djibouti, Ethiopia and Somalia in 2020.125. Smaller values are not represented: Eastern Route (0.2% Djiboutians, 0.1% Eritreans, 0.1% Other), HoA Route (0.4% Other), Northern Route (0.3% Tanzanians), Southern Route (0.2% Eritreans, 0.1% Sudanese).126. FM operations under IOM’s DTM were initiated under the global approach in the region in 2017-2018.127. Indicators on duration of stay at intended destination were introduced later in the year, hence these figures are based on partial data only.128. Vulnerabilities cannot be depicted as an exact proportion of movements because they are potentially overlapping, meaning that one person can have more than one vulnerability.129. IOM. 2020. A Study on Child Migrants from Ethiopia.130. Other includes postgraduate (Masters/PhD), primary (incomplete) and dugsi (traditional schoolhouse).131. The question was introduced as an extension of the employment question in the FMS during the last quarter of 2020. Results are thus based on a sample of 880 respondents (those who had some level of education).132. Indicators on employment sectors are compiled using an FMS sample of 1,670 respondents from data collected between October and December 2020.133. Southern Route migration is generally longer term, however, the sample collected by DTM is biased due to limited coverage and capturing localized movements primarily.134. Northern Route in the current sample mainly captures localized movements between Ethiopia and Sudan. With expanded coverage in the future, more longer-term movements may eventually become part of this sample.135. Indicators on previous migration and displacement attempts are compiled using an FMS sample of 18,801 respondents (those who responded to this question).136. Indicators on difficulties faced are compiled using an FMS sample of 13,187 respondents. Respondents are free to not answer any question that they might find sensitive. Up to three responses were possible for this question.137. World Bank. 2020. COVID-19: Remittance Flows to Shrink 14% by 2021.138. UNDESA. 2020. International Migration 2020 Highlights.139. UNDP. 2021. How can countries at risk of being left behind build forward from COVID-19?.140. IDMC. 2019. Kenya: Figure Analysis - Displacement Related to Conflict and Violence. 141. OCHA. 2021. Ethiopia Tigray Region Humanitarian Update Situation Report 6 May 2021.142. IOM. 2019. Who is a migrant?.143. OHCHR. 1998. Guiding Principles on Internal Displacement (E/CN� 4/1998/53/Add� 2).144. IOM. 2004. International Migration Law: Glossary on Migration.145. See: Yemen Flow Monitoring Points: Migrant Arrivals and Yemeni Returns in 2020.146. See: COVID-19 Mobility Impacts.147. See: Methodology for IOM COVID-19 Impact on Points of Entry and Other Key Locations of Internal Mobility.
1� February 2021 – Regional Data Hub Snapshot 2020At the regional level, the Regional Data Hub (RDH) aims to enhance technical coordination, harmonize the different data collection activities and foster a multi-layered analysis of mixed migration movements, trends and characteristics across the region. Progressively, the RDH has become a technical hub able to provide information management services to countries in the region for programming, analysis and data management support. Through a combination of IOM data collection methodologies, research initiatives, and continuous and active engagement with National Statistical Offices (NSOs), key line Ministries and Regional Economic Communities (RECs), the RDH aims to fill in the existing gaps in strengthening the regional evidence base on migration. This contribution will, in turn, help improve policy-making programming and coordination between all the stakeholders involved.
2� April 2020 – Displacement Tracking Matrix East and Horn of Africa Info Sheet 2020The Regional Displacement Tracking Matrix (DTM) Support Team is based in Nairobi, working closely with DTM coordinators in country and with the DTM Global Support Team in headquarters. Composed of experts with various technical and operational backgrounds, the team strives to provide support services for DTM implementation in the region. Support includes strategy, methodology and tools design, deployment of technical expertise, capacity building support, quality control, analysis and development of information products, coordination of cross-border activities as well as intra-regional coordination.
3� March 2021 – Displacement Tracking Matrix East and Horn of Africa: Monthly Regional Snapshot (December 2020)The Displacement Tracking Matrix (DTM) in the East and Horn of Africa (EHoA) region is currently active in eight countries (Burundi, Djibouti, Ethiopia, Kenya, Somalia, South Sudan, Uganda, and the United Republic of Tanzania), and its methodology includes four main components (mobility tracking, flow monitoring, registrations, and surveys). As of December 2020, DTM in the region tracked 6.4M Internally Displaced Persons (IDPs) and 2.7M Returnees, as reported during the last round of DTM assessments for each country, or through secondary data sources. A total of 65 Flow Monitoring Points (FMPs) were operational in the regional network with the main aim of tracking cross-border movements trends in the region.
ANNEXES

Fromthe People of Japan