A Randomized Controlled Trial of Ivermectin Monotherapy ...
27
Page 1/27 A Randomized Controlled Trial of Ivermectin Monotherapy Versus Hydroxychloroquine, Ivermectin, and Azithromycin Combination Therapy in Covid-19 Patients in Nigeria Olufemi Emmanuel Babalola ( [email protected] ) Bingham University, Karu https://orcid.org/0000-0001-7737-3831 Ndanusa Yahaya Al Ummah Foundation, Abuja https://orcid.org/0000-0002-3708-2033 A. Adesuyi Ajayi Baylor College of Medicine, Texas https://orcid.org/0000-0003-2036-7929 John Onimisi Ogedengbe University of Abuja https://orcid.org/0000-0002-1559-1750 Yunusa Thairu University of Abuja https://orcid.org/0000-0003-1941-8151 Ogu Omede Federal Ministry of Health, Abuja https://orcid.org/0000-0001-6695-1405 Research Article Keywords: COVID-19, ivermectin, hydroxychloroquine, azithromycin, Nigeria Posted Date: October 1st, 2021 DOI: https://doi.org/10.21203/rs.3.rs-950352/v1 License: This work is licensed under a Creative Commons Attribution 4.0 International License. Read Full License Version of Record: A version of this preprint was published at Journal of Infectious Diseases and Epidemiology on October 31st, 2021. See the published version at https://doi.org/10.23937/2474- 3658/1510233.
-
Upload
khangminh22 -
Category
Documents
-
view
1 -
download
0
Transcript of A Randomized Controlled Trial of Ivermectin Monotherapy ...
Page 1/27
A Randomized Controlled Trial of IvermectinMonotherapy Versus Hydroxychloroquine,Ivermectin, and Azithromycin Combination Therapyin Covid-19 Patients in NigeriaOlufemi Emmanuel Babalola ( [email protected] )
Bingham University, Karu https://orcid.org/0000-0001-7737-3831Ndanusa Yahaya
Al Ummah Foundation, Abuja https://orcid.org/0000-0002-3708-2033A. Adesuyi Ajayi
Baylor College of Medicine, Texas https://orcid.org/0000-0003-2036-7929John Onimisi Ogedengbe
University of Abuja https://orcid.org/0000-0002-1559-1750Yunusa Thairu
University of Abuja https://orcid.org/0000-0003-1941-8151Ogu Omede
Federal Ministry of Health, Abuja https://orcid.org/0000-0001-6695-1405
Research Article
Keywords: COVID-19, ivermectin, hydroxychloroquine, azithromycin, Nigeria
Posted Date: October 1st, 2021
DOI: https://doi.org/10.21203/rs.3.rs-950352/v1
License: This work is licensed under a Creative Commons Attribution 4.0 International License. Read Full License
Version of Record: A version of this preprint was published at Journal of Infectious Diseases andEpidemiology on October 31st, 2021. See the published version at https://doi.org/10.23937/2474-3658/1510233.

Page 2/27
AbstractThe e�cacy of ivermectin (IVM) against SARS-CoV-2 has been demonstrated in vitro, while severalclinical studies suggest that it is e�cacious and safe in reducing morbidity and mortality.Hydroxychloroquine HCQ, IVM and azithromycin AZM (HIA therapy) are being used in several low- andmiddle-income countries (LMICs) where more expensive medications such as remdesivir are out of reach.In this study, we set out to compare the e�cacy of IVM monotherapy with HIA combination therapy.
Methods: This was a single-blind, randomized control trial of 2 parallel groups of COVID-19-positiveNigerians. Thirty patients received ivermectin 200 mcg/kg daily for �ve days, while 31 patients receivedHIA triple therapy. The viral cycle threshold (Ct) at pretreatment baseline and days 2, 5 14 and 21 weremeasured for the E- and N-genes. SPO2 was assessed on a daily basis, while in�ammatory markerserythrocyte sedimentation rate (ESR), C-reactive protein, and D-dimer and neutrophil/lymphocyte ratios(NLRs) were assessed at baseline and day 7. Clinical status was self-assessed daily on a Likert scale.
Results: Two-way repeated measures analysis of variance (RAMOVA) did not show any differencebetween the two groups. However, there was a signi�cant time effect (improvement over time) for SPO2,Ct N-gene, Ct E-gene and clinical status in both groups and signi�cant reductions in in�ammatorymarkers by day 7. (P<0.0001).
Conclusions: AZT + HCQ may be a redundant adjuvant in COVID-19 therapy. Improvements noted arelikely due in large part to ivermectin virucidal and anti-in�ammatory actions.
IntroductionThe WHO declared a COVID-19 pandemic caused by the SARS-CoV-2 virus on March 11, 2020,1. Sincethen, there have been global and massive disruptions in economic, transportation, social interaction,political, and health care delivery that have been unprecedented and unparalleled in recent human history.As of September 2021, more than 223 million people have been infected with more than 4.6 millionmortality2. Robust measures, including vaccinations2, have become available to stem communitytransmission of the SARS-CoV-2 virus and especially the more contagious delta variant of SARS-CoV23.Recovery from the pandemic has, however, been slower than anticipated, owing to a combination ofvaccine hesitancy in high-income countries and by resource limitation and vaccine insu�ciency for theeligible population in low- and middle-income countries (LMICs). Other measures, in addition to publichealth modalities, including chemoprophylaxis and continued treatment of COVID 19 with a variety ofrepurposed drugs or their combinations, have therefore been employed. We have previously reported thebene�cial effects of ivermectin in mild to moderate COVID-19 patients in a randomized controlled double-blind, dose-response study4. We have also hypothesized the putative utility of an additive combination ofivermectin with a novel antiviral drug, molnupiravir5. After the publication of Gautret et al 6 and Raoult etal 7, among others, doctors in many LMICs, including in Nigeria, prescribed a cocktail of ivermectin (IVM)combined with hydroxychloroquine (HCQ) and azithromycin (AZT) to treat early or mild COVID-19

Page 3/27
patients. Other studies have, however, suggested that HCQ is not as useful as postexposure prophylaxisand may be associated with ECG anomalies in a proportion of patients 8,9.
Ivermectin has an in vitro IC50 for SARS-CoV-2 in Vero-SLAM cells of 2.4 µM10 and exerts inhibitory SARS-CoV-2 effects by multifarious mechanisms, including blocking viral entry, inhibiting viral nuclear transportby importin alpha and beta, and inhibiting RNA-dependent RNA polymerase (RdRp).11
Chloroquine (CQ) and HCQ have IC50 values for the inhibition of SARS-CoV-2 in vitro of 42-56.8 µM and9.2-11.2 µM, respectively12, but CQ does not inhibit SARS-CoV-2 infection in human lung cells13. Themechanisms of SARS-CoV-2 replication inhibition by CQ/HCQ include blockade of viral cell invasion vialipid rafts, interference with viral endocytosis, binding to ACE2 and viral spike protein, blockade ofendosomal acidi�cation, and sequestration of zinc ions that block SARS-CoV-2 RdRp.14
Azithromycin (AZT) is a macrolide antibiotic that has been reported to inhibit SARS-CoV-2 in vitro in Verocells and in Caco-2 cells15. AZT has an IC50 of 2.1 µM, which is not dissimilar from the molar value forIVM16. It is a weak base and thus inhibits the acidic-dependent uncoating and endocytosis of the SARS-CoV-2 virus. AZT binds the spike protein S, thereby reducing binding to the ACE2 receptor and limitingviral entry. The drug ampli�es host antiviral defence through an increase in interferon (IFN) and inhibitionof IL-6 production.17
There are reports of the additive or synergistic combination of AZT + HCQ in clinical trials in COVID 19,18,
even as other clinical trials, such as the RECOVERY Collaborative Group, showed no e�cacy of HCQ inhospitalized COVID 19 patients.19 These disparate �ndings make it imperative to assess the additive orsynergistic actions, if any, of the combinations of repurposed drugs used in COVID 19 treatment.
The purpose of the present study was to examine and compare the clinical, virological and anti-in�ammatory effects of ivermectin alone compared to ivermectin + HCQ + AZT triple therapy (HIA tripletherapy or IVM+) in RT-PCR and SARS-CoV-2-positive patients with COVID-19 in a randomized controlledtrial.
Hypothesis
Null hypothesis (H0): A combination of ivermectin and HCQ+A is not more e�cacious in the treatment ofpatients with virology-proven COVID-19 disease than ivermectin alone.
Alternative Hypothesis (Ha): A combination of ivermectin and HCQ is more e�cacious in the treatment ofpatients with virology-proven COVID-19 disease.
Materials And MethodsApproval to carry out the research was obtained from the University of Abuja Health Research EthicsCommittee. The study adhered to the tenets of the Declaration of Helsinki.
Page 4/27
(https://www.wma.net/policies-post/wma-declaration-of-helsinki-ethical-principles-for-medical-research-involving-human-subjects/)
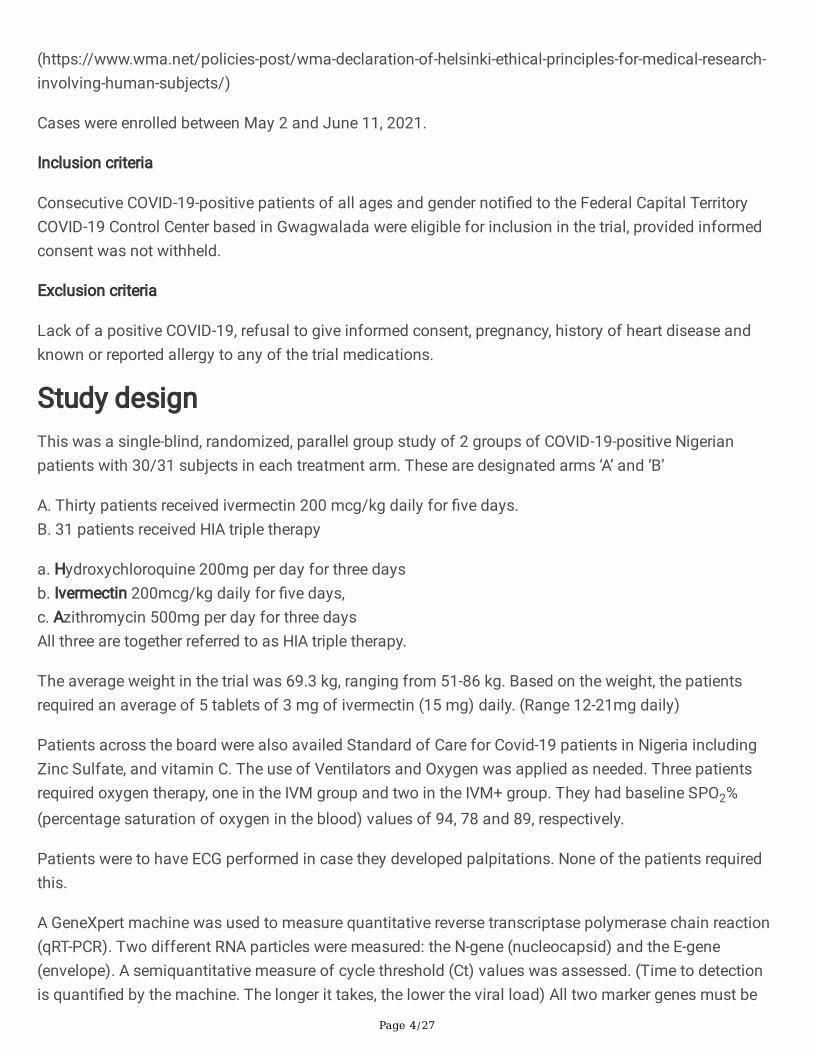
Cases were enrolled between May 2 and June 11, 2021.
Inclusion criteria
Consecutive COVID-19-positive patients of all ages and gender noti�ed to the Federal Capital TerritoryCOVID-19 Control Center based in Gwagwalada were eligible for inclusion in the trial, provided informedconsent was not withheld.
Exclusion criteria
Lack of a positive COVID-19, refusal to give informed consent, pregnancy, history of heart disease andknown or reported allergy to any of the trial medications.
Study designThis was a single-blind, randomized, parallel group study of 2 groups of COVID-19-positive Nigerianpatients with 30/31 subjects in each treatment arm. These are designated arms ‘A’ and ‘B’
A. Thirty patients received ivermectin 200 mcg/kg daily for �ve days.B. 31 patients received HIA triple therapy
a. Hydroxychloroquine 200mg per day for three daysb. Ivermectin 200mcg/kg daily for �ve days,c. Azithromycin 500mg per day for three daysAll three are together referred to as HIA triple therapy.
The average weight in the trial was 69.3 kg, ranging from 51-86 kg. Based on the weight, the patientsrequired an average of 5 tablets of 3 mg of ivermectin (15 mg) daily. (Range 12-21mg daily)
Patients across the board were also availed Standard of Care for Covid-19 patients in Nigeria includingZinc Sulfate, and vitamin C. The use of Ventilators and Oxygen was applied as needed. Three patientsrequired oxygen therapy, one in the IVM group and two in the IVM+ group. They had baseline SPO2%(percentage saturation of oxygen in the blood) values of 94, 78 and 89, respectively.
Patients were to have ECG performed in case they developed palpitations. None of the patients requiredthis.
A GeneXpert machine was used to measure quantitative reverse transcriptase polymerase chain reaction(qRT-PCR). Two different RNA particles were measured: the N-gene (nucleocapsid) and the E-gene(envelope). A semiquantitative measure of cycle threshold (Ct) values was assessed. (Time to detectionis quanti�ed by the machine. The longer it takes, the lower the viral load) All two marker genes must be
Page 5/27
negative before a patient is deemed negative for SARS-CoV-2. A Ct of 38 or more is regarded as negativefor the E-gene, while a Ct of 40 or more is regarded as negative for the N-gene.
Sample size determination:The study was designed to detect a difference of 15% in the negativity rate by day 5 after dosing betweenthe two arms4 using the Wang and Chow formula,20 giving a total of 58 patients who were rounded up to60. However, 65 patients were recruited in the end, of whom 4 were dropped as a result of allergy to HCQ.
Randomization
A standard clinical pharmacological randomization tool was applied. Sequential patients were assignedby chance to one of 2 treatments, A, B. Patients were asked to select from a pot of rolled papers labelledA or B. The numbers of A = B. This sequence was followed until the sample of 30/31 was attained ineach of the 2 groups.
Blinding
This was designed as a single-blind trial. The study was unmasked at the end of the trial after theanalysis. However, arrangement was in place to unmask the trial in the event of a very serious adverseevent.
Parameters measured
1. Viral load was assessed at enrolment (baseline) day 0, day 5, day 14 and day 21 after dosing.The proportions with negative PCR outcomes at days 5, 14 and 21 were assessed for the two groups.
2. SPO2% was assessed using a pulse oximeter on a daily basis at the same time of the day.3. Symptom check list was assessed at baseline. These included the following:Respiratory symptoms: Cough.
GIT symptoms: Nausea, vomiting, diarrhea, abdominal pain.
CVS: Tiredness, lassitude, dyspnea
CNS: Headache, Anosmia, Ageusia.
MSS: Myalgia
The following serious adverse events were monitored: dizziness, diarrhea, vomiting, nausea, appetite loss,stomach pain, tiredness, others (to be speci�ed)
4. In�ammatory markers were measured at baseline and day 7. These were erythrocyte sedimentationrate (ESR), C-reactive protein (CRP), and D-dimer.

Page 6/27
5. Hematological variables were measured at baseline and day 7, including hemoglobin, white blood cells,neutrophils, lymphocytes and platelet count. The neutrophil/lymphocyte ratio (NLR) was assessed as ameasure of systemic in�ammation.
Statistical analysesData were gathered into Android tablets on the JotForm platform and uploaded in real time to the internetcloud, making it accessible by all researchers on the team. The data were ultimately translated into Exceland cleaned. Data were subsequently updated into the STATA analysis package Stata/IC 16.1 for Mac(Intel 64-bit) and prepared for analysis.
Descriptive and inferential statistics (both parametric and nonparametric) were performed. Analysis ofvariance/Student’s t-test and the chi-squared test were performed to assess the effects of treatment on
1. Change in Viral load over time2. Change in Oxygen saturation over time3. Proportion negative at �xed end points.4. Change in the levels of in�ammatory markers and hematological variables.5. Change in clinical status over time using Likert scale: 1 Much worse/Very Bad; 2 Worse/Bad; 3 Nochange/average; 4 Improved/Good; 5 much improved/Very good.6. Disposition of patients was assessed on a daily basis with regards to whether 1. treatment ismaintained, 2. patient is well enough to be discharged from active care, 3. patient is referred for furthertreatment in intensive care, or 4. the patient is deceased.Repeated measures analysis of variance (RAMOVA) was carried out to simultaneously measuretreatment (A v B) differences as the treatment effect and changes over time as the TIME effect. Time ×treatment interaction (whether treatment effects vary with time) was measured simultaneously on all testsubjects at once for parameters indicated.
Statistical rejection of the null hypothesis was p < 0.05, and the 95% con�dence intervals were quoted.
A serious adverse event form was designed and completed for every case enrolled in the trial. A detailedclinical description of such adverse events was captured and evaluated. Immediate steps were taken toameliorate such incidents.
ResultsThe baseline values for both arms of the study were compared to assess the adequacy of randomization.(Table 1). The �ndings suggest that there were no signi�cant differences in the two groups (ivermectin-only IVM and the HIA triple therapy (IVM+) group) with regard to all the variables. Age and sex weresimilar, as were dose of ivermectin based on weight, need for supplemental oxygen, and need forventilator. None of the patients had been vaccinated. Hematological indices such as hemoglobin, whiteblood count, lymphocyte and neutrophil count, neutrophil/lymphocyte ratio, and platelet count werecomparable for both groups. There was also no difference with regard to viral load at baseline for either
Page 7/27
the N-gene or E-gene. In�ammatory markers such as ESR, C-reactive protein, and D-dimer values werealso similar in both groups. SPO2 was slightly higher for the ivermectin only (IVM) group (93.8% versus92.0%), but the difference was not statistically signi�cant (P=0.09). Clinical symptoms at baseline, suchas diarrhea (23.7%), anosmia (20%), ageusia (18%), dyspnea (25%), headache (50%) and cough (72.1%),were similar in both groups. Therefore, cough was the most common symptom with which patientspresented but was slightly less common in the IVM group.
Description of the study population (Table 1)
Considering the two groups together, the average age of participants was 40.4 years, with more males(63%) than females. Figure 1 depicts the age distribution of the study participants. This indicates that themodal age group is between 25-30 years.
Based on the weight, the patients required an average of 5 tablets of 3 mg each (15 mg) daily. Thehematological indices were within normal limits at baseline. These included hemoglobin Hb, white bloodcell WBC count, lymphocyte count, neutrophil count, neutrophil to lymphocyte ratio NLR, and plateletcount. Viral loads at baseline were moderately high, with mean CT counts of 26.5 and 21 for the N and Egenes, respectively. All these indices were similar in both groups.
With regard to the in�ammatory markers, erythrocyte sedimentation rate ESR was within the normalrange, but the C-reactive protein CRP was higher than normal at 14.6 mg/l compared with a normal rangeof less than 10 mg/l.
D-dimer is the degradation product of factor XIII crosslinked �brin. It re�ects ongoing activation of thehemostatic system. The reference concentration of D-dimer was < 250 ng/mL.
A mean study D-dimer level of 222.2 ng/ml was thus within normal limits.
Mean entry SPO2% was low at 92.9%. Three of the patients had entry values of less than 80.
In the federal capital territory where this study took place, there were six area councils (localgovernments). The most urbanized local governments are the Abuja Municipal Area Council (AMAC) andGwagwalada Area Council, where the teaching hospital and the main COVID isolation center are located.The majority of the patients come from these two urbanized area councils (local governments). (Figure2).
Differential change in parameters with time over the two arms.
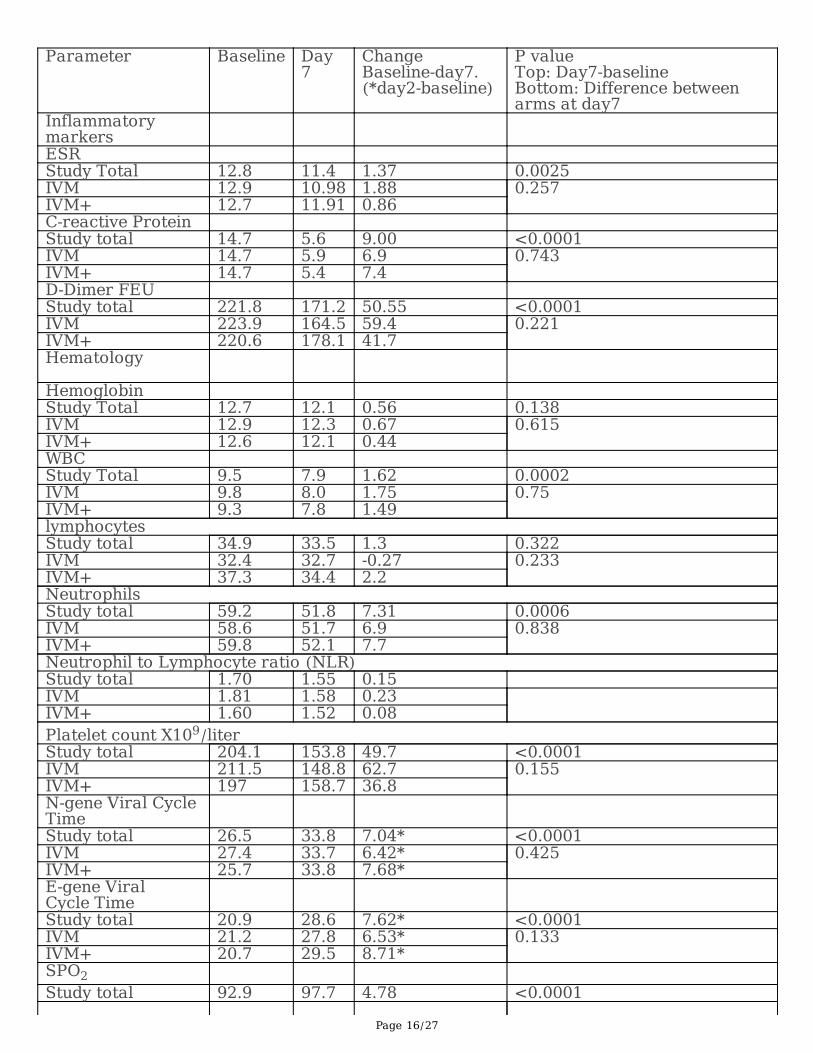
Table 3 quanti�es changes over time, particularly between baseline and day 7. (Except for viral gene CT,which compares baseline and day 2).
A repeated measures analysis of variance (RAMOVA) was carried out on the cycle threshold times for theN- and E-genes, taking into account baseline (day 0), day 2, day 5 and day 14. There was a steady

Page 8/27
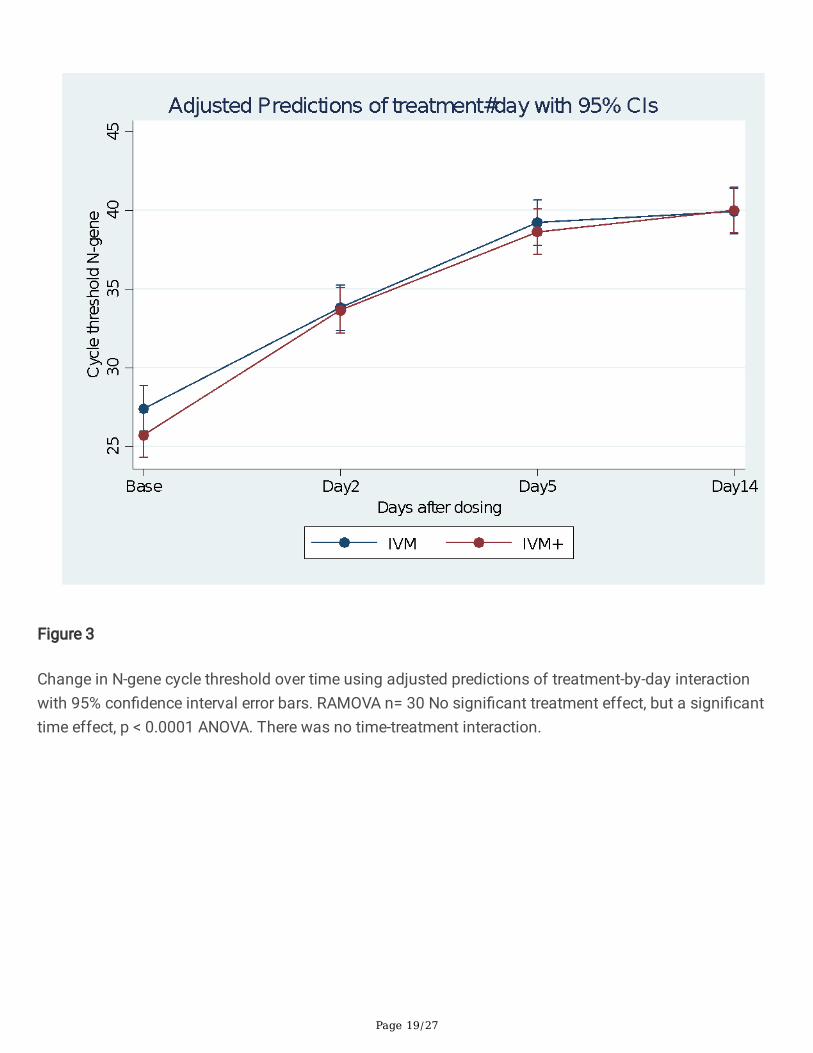
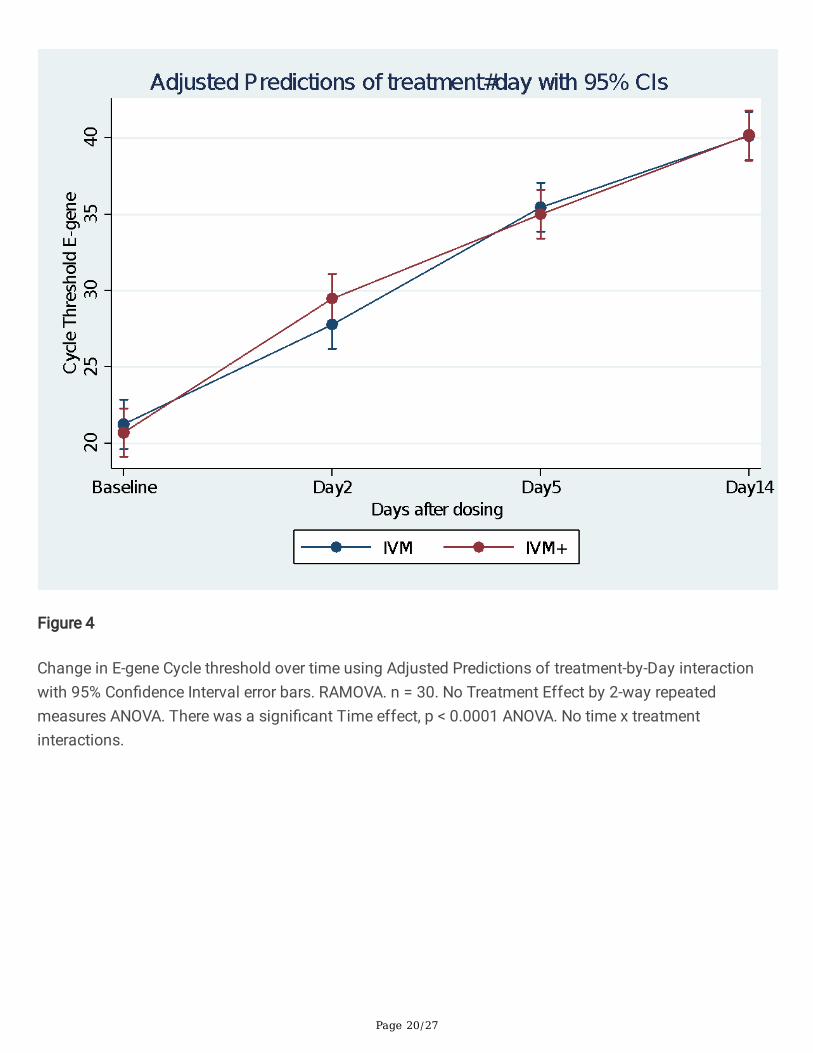
increase in CT values in both arms of the study. This increase was already signi�cant by day 2.(P<0.0001). Figures 3 and 4 indicate changes in the N-gene and E-gene cycle thresholds, respectively, overtime using adjusted predictions of treatment-by-day interactions with 95% con�dence interval error bars.In both situations, there was no treatment difference between the IVM and IVM+ groups. However, there isa signi�cant time effect P<0.0001.
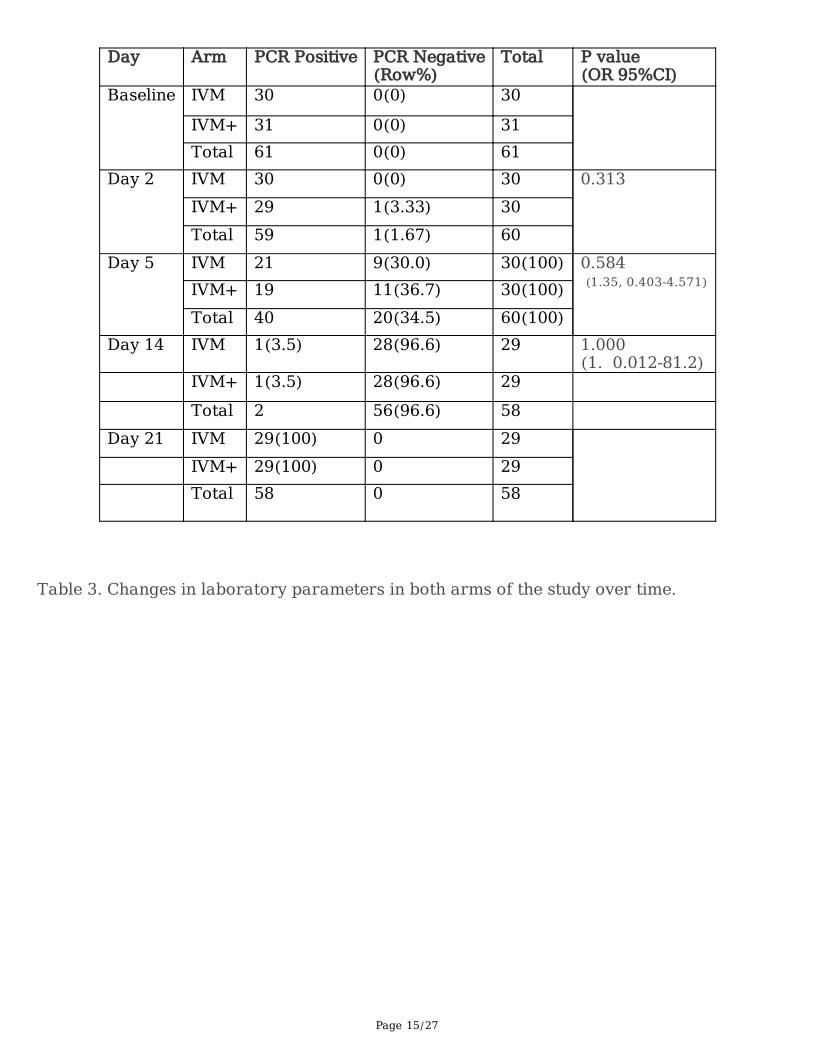
Table 2 indicates the progression of the PCR test change from ‘positive’ to ‘negative’ as the days went by.This assumes a cutoff of N-Ct > 38 and E-Ct > 40. negative, one in each arm. (Other authors use a cutoffpoint of >35 Ct as negative) RAMOVA of the N-Ct and E-Ct genes time-treatment interactions suggestedthat there was no treatment difference between the two arms, but there was a time effect in both arms,P<0.0001. There was also minimal time x treatment interaction. See �gures 3 and 4
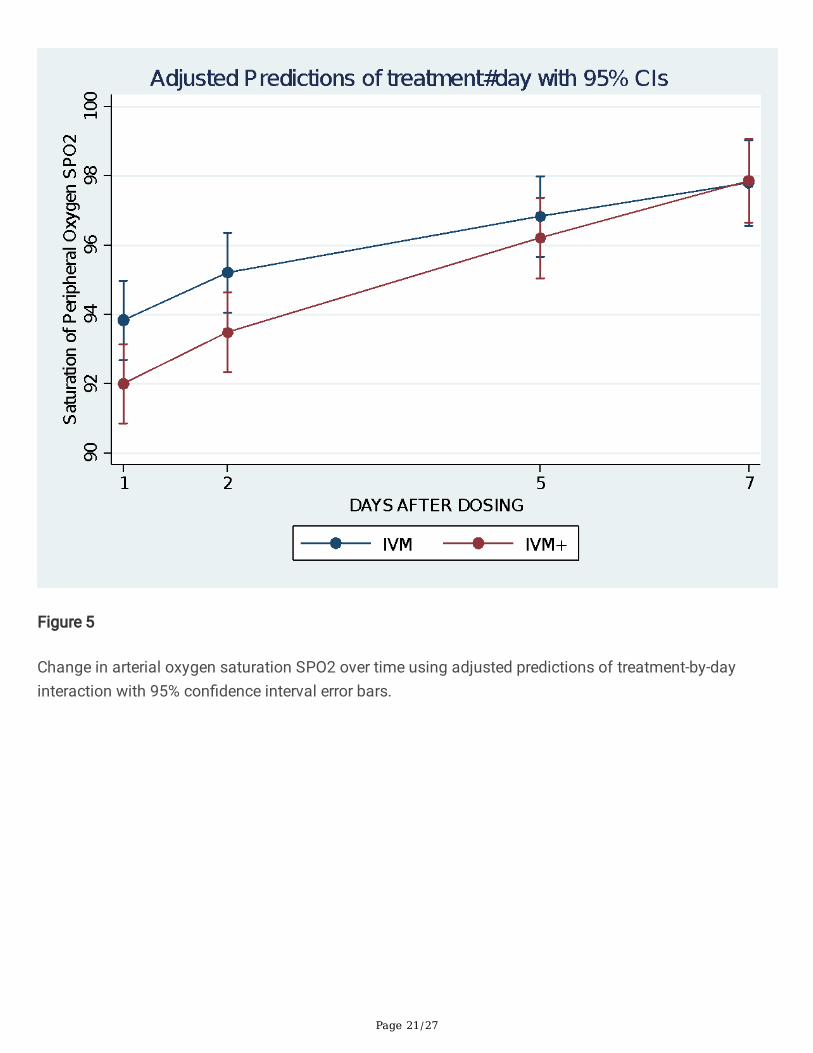
Changes in SPO2%: RAMOVA analysis suggested that there was a signi�cant time effect in both armswith a steady increase in SPO2%, P<0.0001. There was a weak treatment x time interaction (P=0.10) fromthe likelihood ratio test. However, there was no signi�cant treatment difference between the two arms(P=0.797). See �gure 5.
Changes in laboratory parameters (Table 3).
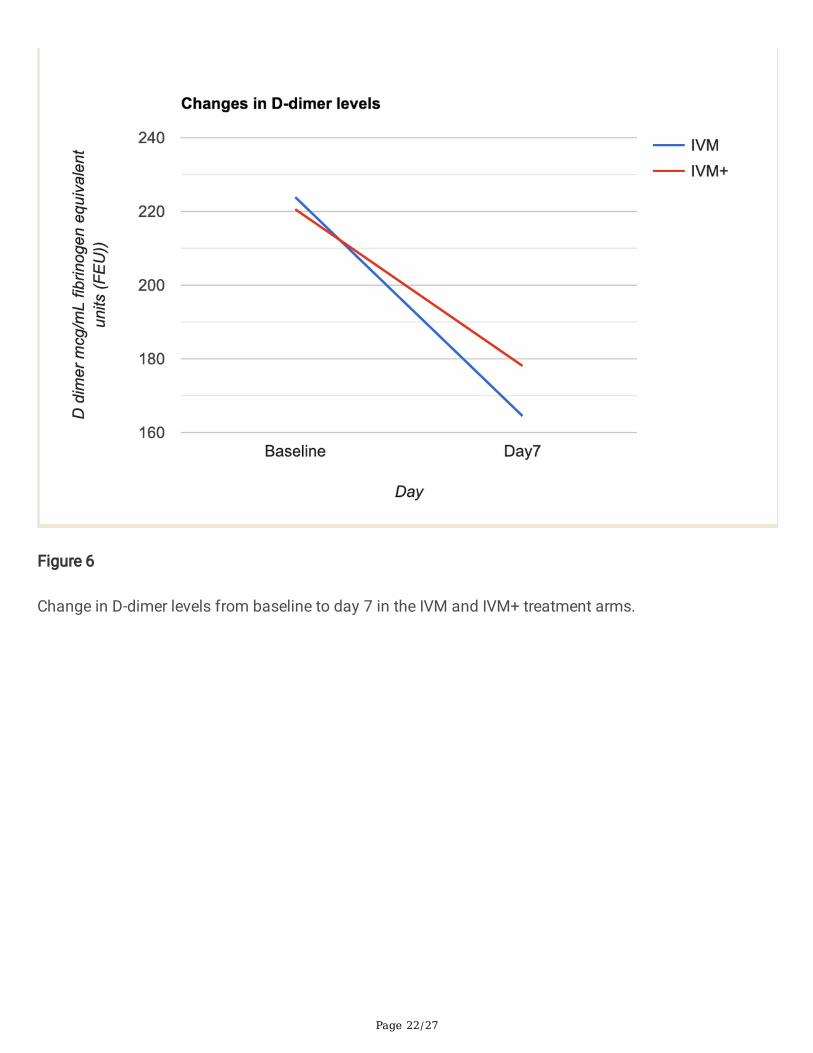
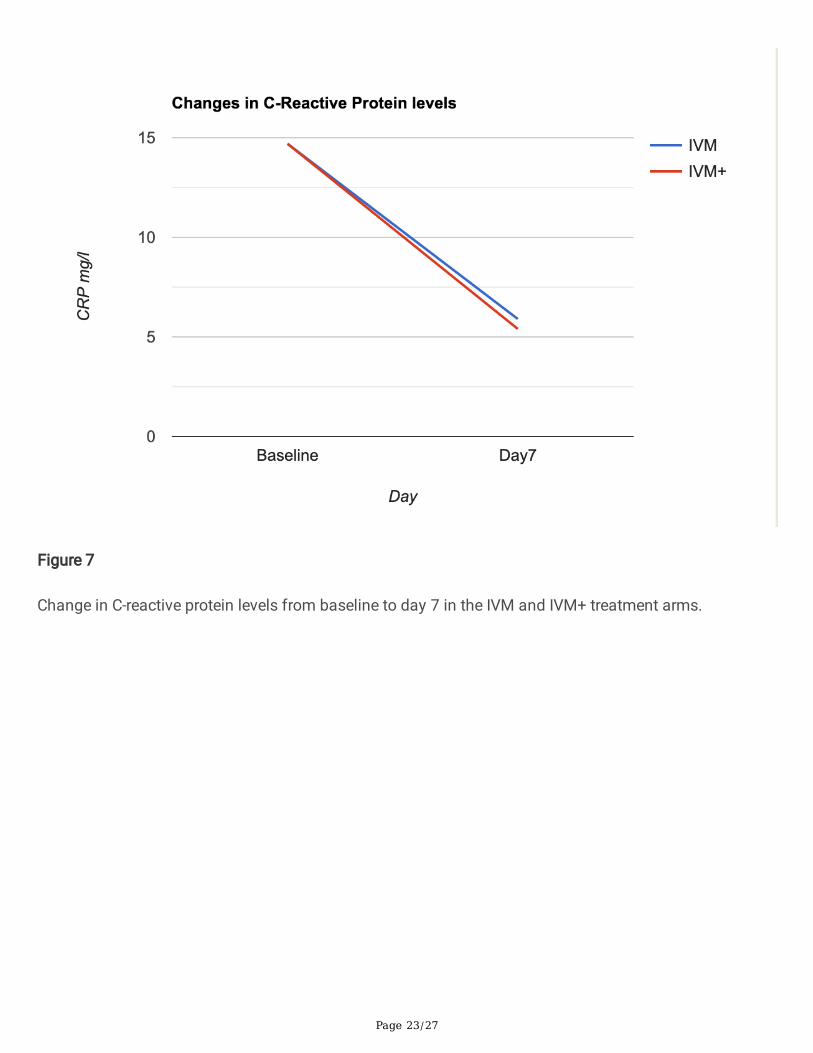
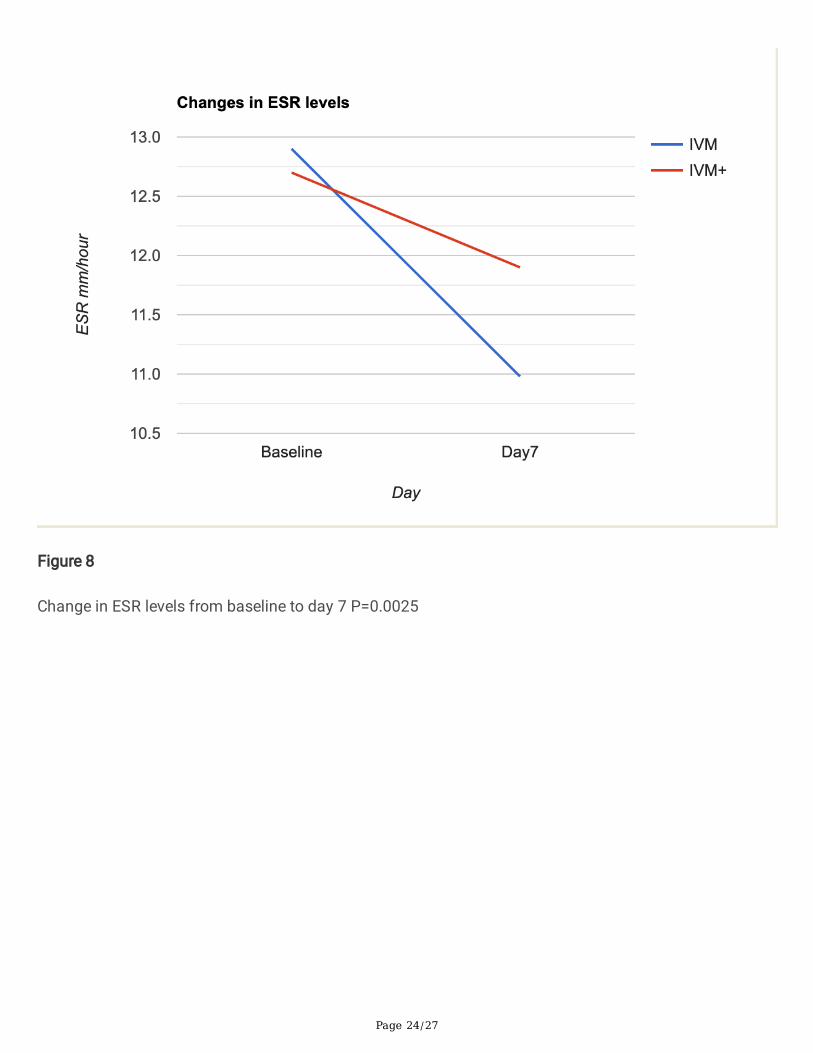
In�ammatory markers: For the two arms of the study, there was a statistically signi�cant drop in thelevels of all in�ammatory markers by day 7 relative to baseline. (ESR P<0.0025, D-dimer P<0.0001andCRP, P<0.0001). (Figures 6,7,8). The drop was steeper in the IVM arm (except for CRP, where the drop wasparallel), but the difference between the two groups was not statistically signi�cant at baseline or by day7.
Hematological variables were assessed. There was an insigni�cant drop in hemoglobin levels by day 7 inboth arms (P= 0.138). However, there was a signi�cant drop in the WBC count overall (P<0.0002), with asimilar degree of drop in both arms.
Overall, there was no statistically signi�cant decrease in the lymphocyte count. However, there was aslight increase in the IVM arm of 0.27 X 10⁹ cells/l as opposed to a decrease in the IVM+ arm (2.2 X 10⁹).This difference in direction did not achieve statistical signi�cance (P=0.233). Difference -3.16, 95% CI-8.42-2.49
There was, however, a signi�cant decrease in the neutrophil count across both arms compared tobaseline (P=0.0006), with a consequent decrease in the neutrophil to lymphocyte ratios, more so in theIVM arm. 0.23 versus 0.08.
There was also a signi�cant drop in the platelet counts across arms (P<0.0001) more so in the IVM arm(47% drop) than in the IVM+ arm (18.7% drop). However, the difference in percentage drop did not achievestatistical signi�cance. (p=0.155). See Figure 9. (Actual difference was 25.8 95% CI -10.0-61.8)
Page 9/27
Change in Clinical status with time. Figure 10. The clinical status was reported by the patients on a Likertscale in response to the question ‘How do you feel today?’ ranging from 1 (much worse) to 5 (muchimproved). Figure 10 indicates that in both arms, there was steady progress in mean wellness scores.Assuming no time treatment/interaction, there was no difference between the two groups (P=0.760).However, there was a signi�cant improvement with time in both arms. P= 0.102 by day 2 and P=0.000 byday 5. By day 11, the average Likert score was over 4.5 in both arms and marginally higher in the IVM+arm (P=0.0731).
The likelihood of being discharged by day 7 in either arm of the study: Patients were discharged after anegative PCR test, their perception of wellness, and the absence of concerning signs and symptoms suchas fever, cough, myalgia and malaise. Sixty-three percent of patients in the IVM arm were discharged,compared to 44% in the IVM+ arm by day 7. OR 2.13 (95% CI 0.63-7.27) p=0.172. Thus, there is a weaksuggestion that patients are more likely to be discharged by day 7 in the IVM arm, but this did not achievesigni�cance. (Table 4)
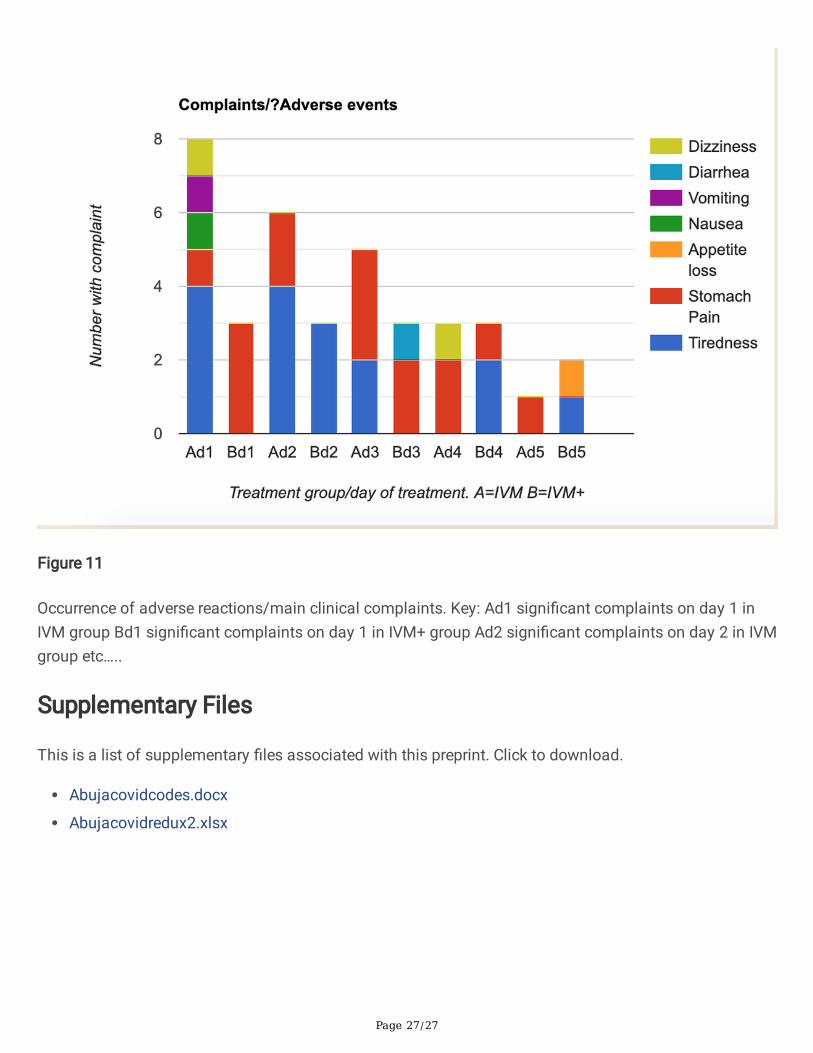
Complaints/adverse events were recorded on a daily basis and are depicted in Figure 11. It is di�cult toknow which complaints are due to the disease and which are due to the drug, but all are assessedtogether. A total of 11 patients had complaints of one form or the other on the �rst day of treatment, 8 inthe IVM group and 3 in the IVM+ group. Complaints in the IVM group included tiredness (4) and stomachpain, nausea, vomiting and dizziness. Only 3 people had complaints of stomach pain in the IVM+ group.By day 2, 4 people still complained of tiredness, and two of stomach pain in the IVM arm, while 3 peoplecomplained of tiredness in the IVM+ arm. There was an overall decrease in the number of complaints byday 5, by which time only 3 people complained.
Overall, there were 23 complaint events in the IVM group compared to 14 in the IVM+ group. However,four subjects in the IVM+ group had been dropped from the study because of reaction to HCQ and did notform part of this analysis. Their reaction, mainly consisting of itchiness, had not responded to loratadine.Two other subjects developed severe itching around the armpits attributable to HCQ but weresuccessfully treated with Loratadine and so continued in the study and formed part of this analysis.
DiscussionThe clinical, virological, in�ammatory, and respiratory (SPO2%) comparative assessments, which are hardend points of our randomized controlled study, did not show a signi�cant difference between IVMmonotherapy and HIA triple therapy in RT-PCR-positive COVID-19 patients. This �nding indicates that acombination of AZT + HCQ did not confer any additive bene�t to IVM in virucidal action against SARS-Cov-2. The results, however, con�rm and extend our earlier results on the anti-SARS-CoV-2 e�cacy ofivermectin alone4.
In this study, we demonstrate further that ivermectin alone or with HIA rapidly increased the cycle time(Ct) of the N-gene (nucleocapsid) and the E-gene (envelope) of SARS-CoV-2 and achieved signi�cant
Page 10/27
COVID negativity on day 7 on RAMOVA (see Figures 3 and 4).
The possible explanation of the lack of additional or superior e�cacy of HIA over IVM is not clear. First, itcan be postulated that IVM, with its multiple mechanisms of anti-SARS-CoV-2 actions4,5, whichincidentally includes the modes of action of both AZT and HCQ6,7,8,9,14,15, early onset pharmacodynamicsand near maximal e�cacy, leaves no opportunity for enhanced e�cacy for azithromycin and HCQ, whichhave a higher IC50 for SARS-CoV-2 inhibition12,13. It is likely that drugs with divergent mechanisms ofanti-SARS-CoV-2, such as molnupiravir5, may exhibit synergism in virucidal activity when combined withIVM.
Although some studies indicated the bene�t of AZT + HCQ in COVID 196,21, this is not a universal�nding22. HCQ was discontinued in the RECOVERY study because of lack of e�cacy and cardiac adverseeffects19
Additionally, it has been reported that HCQ/CQ does not inhibit SARS-CoV-2 in human lung cells/Calu-2cells23.
HCQ is also less e�cient in blocking viral cell entry in Vero-6 cells and in inhibiting viral replication in thelungs24, 25.
It is thus plausible that AZT + HCQ was effectively a placebo in the combination and did not exert anyindependent virucidal activity.
CQ/HCQ exerted no cardiac adverse effects that had been reported in other populations, as no patienthad any cardiac dysrhythmic symptoms. This safe cardiac trend is compatible with experience withchloroquine treatment of malaria in this hyperendemic zone for more than half a century. Interethnicdifferences in QT elongation response to chloroquine have also been noted by Shah et al, 26 whosuggested that Africans may not be as prone as Caucasians to CQ-induced cardiotoxicity.
IVM and HIA were associated with improved SPO2 % over 7 days by RAMOVA (see Figure 5). Although notreatment difference was discernible, the time effect of p < 0.0001 was likely due to treatment withivermectin in both arms, as it was shown to increase SPO2% in our earlier study4. This is highlysuggestive of the prevention or reversal of any respiratory vascular damage, which is a hallmark ofCOVID-19.
IVM and HIA were both associated with signi�cantly reduced pro-in�ammatory markers CRP, ESR and D-dimer (Figures 6-8), indicative of antithrombotic and cytokine reduction effects of ivermectin via STAT-3inhibition, as we have previously suggested4.
Possible side effects of ivermectin: As noted above, there was an overall decrease in the number ofcomplaints by day 5. This suggests that the dose of ivermectin used in this study is safe and e�cacious.
Page 11/27
In conclusion, there was no signi�cant treatment difference between IVM monotherapy and HIA tripletherapy, thus suggesting that AZT + HCQ may be a redundant adjuvant in COVID-19 therapy in Nigeriansand elsewhere. There was a highly signi�cant time effect (P< 0.0001 RAMOVA), indicating that theimprovements in SARS-CoV-2 N and E-gene Ct, as well as the SPO2%, are likely due in large part toivermectin virucidal and anti-in�ammatory actions.
DeclarationsTrial ID: PACTR202108891693522
Acknowledgments: Tobi Babalola for work on the data collection platform.
Funding: Central Bank of Nigeria. Healthcare Sector Research and Development Intervention Scheme(HSRDIS)
References1. WHO Statement on the second meeting of the International Health Regulations (2005) Emergency
Committee regarding the outbreak of novel coronavirus (2019-nCoV). 2020.https://www.who.int/news-room/detail/30-01-2020-statement-on-the-second-meeting-of-the-international-health-regulations-(2005)-emergency-committee-regarding-the-outbreak-of-novel-coronavirus-(2019-ncov). Accessed 2nd 2020.
2. WHO Coronavirus (COVID-19) Dashboard. Covid19.who.int. Accessed 11th September 2020.
3. Centers for Disease Control and Prevention. Delta variant: What we know about the science. August26.2021. https://www.cdc.gov/coronavirus/2019-ncov/variants/delta-variant.html.
4. Babalola OE, Bode CO, Ajayi AA, Alakaloko FM, Akase IE, Otrofanowei E, Salu OB, Adeyemo WL,Ademuyiwa AO, Omilabu S. Ivermectin shows clinical bene�ts in mild to moderate COVID19: arandomized controlled double-blind, dose-response study in Lagos, QJM: An International Journal ofMedicine, 2021;, hcab035, https://doi.org/10.1093/qjmed/hcab035
5. Ajayi AA. Drugs Shown to Inhibit SARS-CoV-2 in COVID-19 Disease: Comparative Basic and ClinicalPharmacology of Molnupiravir and Ivermectin. Austin J Pharmacol Ther. 2021; 9(5).1149.
�. Gautret, P. et al. Hydroxychloroquine and azithromycin as a treatment of COVID-19: results of anopen-label non-randomized clinical trial. Int. J.
7. Raoult D et al. COVID-19 Therapeutic and Prevention. doi: 10.1016/j.ijantimicag.2020.105937. Epub2020 Mar 7
�. Boulware DR, Pullen MF, Bangdiwala AS, et al. A randomized trial of hydroxychloroquine aspostexposure prophylaxis for covid-19. NEJM. June 2020. .
9. Hooks M, Bart B, Vardeny O, Westanmo A and Adabaq S. Effects of hydroxychloroquine treatment onQT interval. Published:June 28,2020DOI:https://doi.org/10.1016/j.hrthm.2020.06.029 21.
Page 12/27
10. Caly L, Druce JD, Catton MG, Jans DA, Wagstaff KM. The FDA-approved drug Ivermectin inhibits thereplication of SARS-CoV-2 in vitro. Antiviral Research. Volume 178, June 2020, 104787
11. Portmann-Baracco A, Bryce-Alberti M, and Accinelli RA. Antiviral and anti-in�ammatory properties ofIvermectin and its potential use in Covid 19. Arch Bronconeumol. 2020 Dec; 56(12): 831.doi:10.1016/j.arbr.2020.06.006
12. Weston S, Coleman CM, Sisk JM, Haupt R, Logue J, Matthews K, Frieman MB. Broad anti-coronaviralactivity of FDA approved drugs against SARS-CoV-2 in vitro and SARS-CoV in vivo. bioRxiv. 2020 doi:10.1101/2020.03.25.008482.
13. Hoffmann M, Mösbauer K, Hofmann-Winkler, H. et al. Chloroquine does not inhibit infection ofhuman lung cells with SARS-CoV-2. Nature 585, 588–590 (2020). https://doi.org/10.1038/s41586-020-2575-3
14. Li X, Wang, Y, Agostinis P. et al. Is hydroxychloroquine bene�cial for COVID-19 patients? Cell DeathDis 11, 512 (2020). https://doi.org/10.1038/s41419-020-2721-8
15. Poschet JF, Perkett EA, Timmins GS. Azithromycin and cipro�oxacin have a chloroquine-like effecton respiratory epithelial cells. BioRxiv, p. 01-21, Mar. 2020
1�. Touret F, Gilles M, Barral K. et al. In vitro screening of a FDA approved chemical library revealspotential inhibitors of SARS-CoV-2 replication. Sci Rep 10, 13093 (2020).https://doi.org/10.1038/s41598-020-70143-6
17. Damle B, Vourvahis M, Wang E, Leaney J, Corrigan B. Clinical Pharmacology Perspectives on theAntiviral Activity of Azithromycin and Use in COVID-19. Clin Pharmacol Ther. 2020 Aug;108(2):201–211. doi: 10.1002/cpt.1857. Epub 2020 May 12. PMID: 32302411; PMCID: PMC7262099.
1�. Gautret P. et al. Hydroxychloroquine and azithromycin as a treatment of COVID-19: results of anopen-label non-randomized clinical trial. Int. J.)Antimicrob.Agents 105949.https://doi.org/10.1016/j.ijantimicag (2020)
19. RECOVERY Collaborative Group, Horby P, Mafham M, Linsell L, et al. Effect of Hydroxychloroquine inHospitalized Patients with Covid-19. N Engl J Med. 2020 Nov 19;383(21):2030-2040. doi:10.1056/NEJMoa2022926. Epub 2020 Oct 8. PMID: 33031652; PMCID: PMC7556338.
20. Wang H and Chow SC. 2007. Sample Size Calculation for Comparing Proportions. WileyEncyclopedia of Clinical Trials.https://onlinelibrary.wiley.com/doi/abs/10.1002/9780471462422.eoct005
21. Andreani J, Le Bideau M, Du�ot I, Jardot P, Rolland C, Boxberger M, Wurtz N, Rolain JM, Colson P, LaScola B, Raoult D. In vitro testing of combined hydroxychloroquine and azithromycin on SARS-CoV-2shows synergistic effect. Microb Pathog. 2020 Aug;145:104228. doi:10.1016/j.micpath.2020.104228. Epub 2020 Apr 25. PMID: 32344177; PMCID: PMC7182748.
22. Maisonnasse P, Guedj J, Contreras V. et al. Hydroxychloroquine use against SARS-CoV-2 infection innon-human primates. Nature 585, 584–587 (2020). https://doi.org/10.1038/s41586-020-2558-4
23. Hoffmann M, Mösbauer K, Hofmann-Winkler H, Kaul A, Kleine-Weber H, Krüger N, Gassen NC, MüllerMA, Drosten C, Pöhlmann S. Chloroquine does not inhibit infection of human lung cells with SARS-

Page 13/27
CoV-2. Nature. 2020 Sep;585(7826):588–590. doi: 10.1038/s41586-020-2575-3. Epub 2020 Jul
24. Weston S, Coleman CM, Haupt R, Logue J, Matthews K, Li Y, Reyes HM, Weiss SR, Frieman MB. BroadAnti-coronavirus Activity of Food and Drug Administration-Approved Drugs against SARS-CoV-2 InVitro and SARS-CoV In Vivo. J Virol. 2020 Oct 14;94(21):e01218-20. doi: 10.1128/JVI.01218-20.PMID: 32817221; PMCID: PMC7565640.
25. Kashour Z, Riaz M, Garbati MA, AlDosary O, Tlayjeh H, Gerberi D, Murad MH, Sohail MR, Kashour T,Tleyjeh IM. E�cacy of chloroquine or hydroxychloroquine in COVID-19 patients: a systematic reviewand meta-analysis. J Antimicrob Chemother. 2021 Jan 1;76(1):30-42. doi: 10.1093/jac/dkaa403.PMID: 33031488; PMCID: PMC7665543.
2�. Shah RR. Drug-induced QT interval prolongation: does ethnicity of the thorough QT study populationmatter? Br J Clin Pharmacol. 2013 Feb;75(2):347–58. doi: 10.1111/j.1365-2125.2012.04415.x.PMID: 22882246; PMCID: PMC3579250.
TablesTable 1. Baseline variables

Page 14/27
Variable IVM onlyGroup A
HCQ+ IVM+AZM (HIA)Group B
Overall P value (test)
Total Numbers 30 31 61 Mean Age (SD)years. 41.6 (2.6) 39.2(2.9) 40.4(1.9) 0.558 (ttest)Sex (Male %) 20(66) 19(61) 39(63) 0.662 (chi2)Dose of Ivermectin(number of 3mg tablets)
5.07(0.12) 5.07(0.13) 5.07(0.69) 0.98 (ttest)
Oxygen use 1 2 3 0.573 (chi2)Ventilator 2 0 2 0.144(Pearson
Chi)Vaccination 0 0 0 Hematology Hemoglobin g/dl 12.9(2.4) 12.6(2.4) 12.7(2.4) 0.577WBC X109cells/liter 9.76(2.84) 9.33(2.13) 9.53(2.49) 0.501Lymphocyte X109 cells/liter 32.4(13.0) 37.4(13.6) 34.9(13.5) 0.150NeutrophilsX109 cells/liter
58.6(15.3) 59.8(12.5) 59.2(13.9) 0.723
Neutrophil to Lymphocyteratio(NLR)
2.49 2.05 2.27 0.443
Platelet countX109 cells/liter
211.5(62.3) 196.9(55.5) 204.1(58.9) 0.341
Viral Load Cycle Threshold Ct.N-gene CT 27.4 (1.03) 25.7(1.14) 26.5(6.02) 0.27(ttest)E-gene CT 21.2(0.75) 20.7(20.9) 21 0.654Inflammatory markersESR ml/h Westergren 12.8 (0.51) 12.7(0.43) 12.78(0.33) 0.816(ttest)C-reactive Protein mg/l 14.7(1.01) 14.7(1.01) 14.67(0.71) 0.995 (ttest)D-dimer ng/ml FEU(Fibrinogen equivalent Unit)
223.9(18.8)
220.5(21.6) 222.2(28.2) 0.525 (ttest)
SPO2% 93.8(3.5) 92.0(4.7) 92.9(4.2) 0.09 (ttest)Symptoms at baseline (%)Diarrhea 6(20) 8(27.6) 14(23.7) 0.493(chi2)Anosmia 6(20) 6(20) 12(20) 1.000(chi2)Ageusia 5(16.7) 6(19.3) 11(18.0) 0.785
(Fisher’sexact)
Dyspnea 8(26.7) 7(23.3) 15(25) 0.766(Fisher’sexact)
Headache 14(46.7) 16(53.3) 30(50) 0.606Fisher’sexact)
Cough 20(66.7) 24(77.4) 44(72.1) 0.349
Table 2. PCR results (positive/negative) by day in the study by treatment arm.
Page 15/27
Day Arm PCR Positive PCR Negative(Row%)
Total P value(OR 95%CI)
Baseline IVM 30 0(0) 30
IVM+ 31 0(0) 31Total 61 0(0) 61
Day 2 IVM 30 0(0) 30 0.313IVM+ 29 1(3.33) 30Total 59 1(1.67) 60
Day 5 IVM 21 9(30.0) 30(100) 0.584 (1.35, 0.403-4.571)IVM+ 19 11(36.7) 30(100)
Total 40 20(34.5) 60(100)Day 14 IVM 1(3.5) 28(96.6) 29 1.000
(1. 0.012-81.2) IVM+ 1(3.5) 28(96.6) 29 Total 2 56(96.6) 58 Day 21 IVM 29(100) 0 29 IVM+ 29(100) 0 29 Total 58
0 58
Table 3. Changes in laboratory parameters in both arms of the study over time.
Page 16/27
Parameter Baseline Day7
ChangeBaseline-day7.(*day2-baseline)
P valueTop: Day7-baselineBottom: Difference betweenarms at day7
Inflammatorymarkers
ESR Study Total 12.8 11.4 1.37 0.0025IVM 12.9 10.98 1.88 0.257IVM+ 12.7 11.91 0.86C-reactive Protein Study total 14.7 5.6 9.00 <0.0001IVM 14.7 5.9 6.9 0.743IVM+ 14.7 5.4 7.4D-Dimer FEU Study total 221.8 171.2 50.55 <0.0001IVM 223.9 164.5 59.4 0.221IVM+ 220.6 178.1 41.7Hematology
Hemoglobin Study Total 12.7 12.1 0.56 0.138IVM 12.9 12.3 0.67 0.615IVM+ 12.6 12.1 0.44WBC Study Total 9.5 7.9 1.62 0.0002IVM 9.8 8.0 1.75 0.75IVM+ 9.3 7.8 1.49lymphocytesStudy total 34.9 33.5 1.3 0.322IVM 32.4 32.7 -0.27 0.233IVM+ 37.3 34.4 2.2NeutrophilsStudy total 59.2 51.8 7.31 0.0006IVM 58.6 51.7 6.9 0.838IVM+ 59.8 52.1 7.7Neutrophil to Lymphocyte ratio (NLR)Study total 1.70 1.55 0.15 IVM 1.81 1.58 0.23 IVM+ 1.60 1.52 0.08Platelet count X109/literStudy total 204.1 153.8 49.7 <0.0001IVM 211.5 148.8 62.7 0.155IVM+ 197 158.7 36.8N-gene Viral CycleTime
Study total 26.5 33.8 7.04* <0.0001IVM 27.4 33.7 6.42* 0.425IVM+ 25.7 33.8 7.68*E-gene ViralCycle Time
Study total 20.9 28.6 7.62* <0.0001IVM 21.2 27.8 6.53* 0.133IVM+ 20.7 29.5 8.71*SPO2 Study total 92.9 97.7 4.78 <0.0001

Page 17/27
IVM 93.8 97.8 3.5 0.0189IVM+ 92 97.5 6
Figures
Figure 1
Histogram depicting age distribution of the patients

Page 18/27
Figure 2
Distribution of patients by Area Council within the Federal Capital Territory
Page 19/27
Figure 3
Change in N-gene cycle threshold over time using adjusted predictions of treatment-by-day interactionwith 95% con�dence interval error bars. RAMOVA n= 30 No signi�cant treatment effect, but a signi�canttime effect, p < 0.0001 ANOVA. There was no time-treatment interaction.
Page 20/27
Figure 4
Change in E-gene Cycle threshold over time using Adjusted Predictions of treatment-by-Day interactionwith 95% Con�dence Interval error bars. RAMOVA. n = 30. No Treatment Effect by 2-way repeatedmeasures ANOVA. There was a signi�cant Time effect, p < 0.0001 ANOVA. No time x treatmentinteractions.
Page 21/27
Figure 5
Change in arterial oxygen saturation SPO2 over time using adjusted predictions of treatment-by-dayinteraction with 95% con�dence interval error bars.
Page 22/27
Figure 6
Change in D-dimer levels from baseline to day 7 in the IVM and IVM+ treatment arms.
Page 23/27
Figure 7
Change in C-reactive protein levels from baseline to day 7 in the IVM and IVM+ treatment arms.
Page 24/27
Figure 8
Change in ESR levels from baseline to day 7 P=0.0025

Page 25/27
Figure 9
Legend not available with this version of the manuscript.

Page 26/27
Figure 10
Self-reported clinical status of patients over time using adjusted predictions of treatment-by-dayinteraction with 95% con�dence interval error bars. 1-much worse/very bad; 5-Much improved/Very good.
Page 27/27
Figure 11
Occurrence of adverse reactions/main clinical complaints. Key: Ad1 signi�cant complaints on day 1 inIVM group Bd1 signi�cant complaints on day 1 in IVM+ group Ad2 signi�cant complaints on day 2 in IVMgroup etc…..
Supplementary Files
This is a list of supplementary �les associated with this preprint. Click to download.
Abujacovidcodes.docx
Abujacovidredux2.xlsx