
A quantitative high-throughput screen for modulators of IL6 signaling: a model for interrogating...
26
A Quantitative High-Throughput Screen for Modulators of IL-6 Signaling: A Model for Interrogating Biological Networks using Chemical Libraries Ronald L. Johnson 1,3 , Ruili Huang 1 , Ajit Jadhav 1 , Noel Southall 1 , Jennifer Wichterman 1 , Ryan MacArthur 1 , Menghang Xia 1 , Kun Bi 2 , John Printen 2 , Christopher P. Austin 1 , and James Inglese 1 1 NIH Chemical Genomics Center, National Institutes of Health, Bethesda, MD 20892 2 Invitrogen Discovery Sciences Madison, WI 53719 Abstract Small molecule modulators are critical for dissecting and understanding signaling pathways at the molecular level. Interleukin 6 (IL-6) is a cytokine that signals via the JAK/STAT pathway and is implicated in cancer and inflammation. To identify modulators of this pathway, we screened a chemical collection against an IL-6 responsive cell line stably expressing a beta-lactamase reporter gene fused to a sis-inducible element (SIE-bla cells). This assay was optimized for a 1536-well microplate format and screened against 11,693 small molecules using quantitative high-throughput screening (qHTS), a method that assays a chemical library at multiple concentrations to generate titration-response profiles for each compound. The qHTS recovered 564 actives with well-fit curves that clustered into 32 distinct chemical series of 13 activators and 19 inhibitors. A retrospective analysis of the qHTS data indicated that single concentration data at 1.5 and 7.7 uM scored 35 and 71% of qHTS actives, respectively, as inactive and were therefore false negatives. Following counter screens to identify fluorescent and nonselective series, we found four activator and one inhibitor series that modulated SIE-bla cells but did not show similar activity in reporter gene assays induced by EGF and hypoxia. Small molecules within these series will make useful tool compounds to investigate IL-6 signaling mediated by JAK/STAT activation. Keywords IL-6; small molecule; HTS; STAT; assay Introduction Exploration of the interface between chemistry and biology has been greatly augmented with the implementation of automated methodologies 1 . High throughput screening (HTS) of small molecule libraries has enabled rapid identification of chemical modulators of biological activity, principally for enzymes. Engineered cellular assays designed for HTS, which are both sensitive and scalable to highly miniaturized formats, offer a rich source of targets and activities for compound library screening. There are however, particular challenges to successfully identifying small molecule modulators of a cellular pathway that are exacerbated by traditional screening methods. For example, cell-based assays have relatively high backgrounds arising in part from heterogeneity of the cell population, low amounts of target components within 3Address correspondence to Ron Johnson, [email protected]. NIH Public Access Author Manuscript Mol Biosyst. Author manuscript; available in PMC 2010 August 1. Published in final edited form as: Mol Biosyst. 2009 September ; 5(9): 1039–1050. doi:10.1039/b902021g. NIH-PA Author Manuscript NIH-PA Author Manuscript NIH-PA Author Manuscript
Transcript of A quantitative high-throughput screen for modulators of IL6 signaling: a model for interrogating...

A Quantitative High-Throughput Screen for Modulators of IL-6Signaling: A Model for Interrogating Biological Networks usingChemical Libraries
Ronald L. Johnson1,3, Ruili Huang1, Ajit Jadhav1, Noel Southall1, Jennifer Wichterman1,Ryan MacArthur1, Menghang Xia1, Kun Bi2, John Printen2, Christopher P. Austin1, andJames Inglese11 NIH Chemical Genomics Center, National Institutes of Health, Bethesda, MD 208922 Invitrogen Discovery Sciences Madison, WI 53719
AbstractSmall molecule modulators are critical for dissecting and understanding signaling pathways at themolecular level. Interleukin 6 (IL-6) is a cytokine that signals via the JAK/STAT pathway and isimplicated in cancer and inflammation. To identify modulators of this pathway, we screened achemical collection against an IL-6 responsive cell line stably expressing a beta-lactamase reportergene fused to a sis-inducible element (SIE-bla cells). This assay was optimized for a 1536-wellmicroplate format and screened against 11,693 small molecules using quantitative high-throughputscreening (qHTS), a method that assays a chemical library at multiple concentrations to generatetitration-response profiles for each compound. The qHTS recovered 564 actives with well-fit curvesthat clustered into 32 distinct chemical series of 13 activators and 19 inhibitors. A retrospectiveanalysis of the qHTS data indicated that single concentration data at 1.5 and 7.7 uM scored 35 and71% of qHTS actives, respectively, as inactive and were therefore false negatives. Following counterscreens to identify fluorescent and nonselective series, we found four activator and one inhibitorseries that modulated SIE-bla cells but did not show similar activity in reporter gene assays inducedby EGF and hypoxia. Small molecules within these series will make useful tool compounds toinvestigate IL-6 signaling mediated by JAK/STAT activation.
KeywordsIL-6; small molecule; HTS; STAT; assay
IntroductionExploration of the interface between chemistry and biology has been greatly augmented withthe implementation of automated methodologies 1. High throughput screening (HTS) of smallmolecule libraries has enabled rapid identification of chemical modulators of biologicalactivity, principally for enzymes. Engineered cellular assays designed for HTS, which are bothsensitive and scalable to highly miniaturized formats, offer a rich source of targets and activitiesfor compound library screening. There are however, particular challenges to successfullyidentifying small molecule modulators of a cellular pathway that are exacerbated by traditionalscreening methods. For example, cell-based assays have relatively high backgrounds arisingin part from heterogeneity of the cell population, low amounts of target components within
3Address correspondence to Ron Johnson, [email protected].
NIH Public AccessAuthor ManuscriptMol Biosyst. Author manuscript; available in PMC 2010 August 1.
Published in final edited form as:Mol Biosyst. 2009 September ; 5(9): 1039–1050. doi:10.1039/b902021g.
NIH
-PA Author Manuscript
NIH
-PA Author Manuscript
NIH
-PA Author Manuscript

cells, and signal amplification of biological cascades and networks 2. In addition, biologicallyactive molecules can display complex pharmacology brought about by cytotoxic effects orinteractions with multiple cellular targets. In many cases, the cellular components targeted byactive compounds are not known.
Quantitative high-throughput screening (qHTS) is a method where chemical libraries arescreened at multiple concentrations to generate titration-response curves for all librarycompounds 3. qHTS enables pharmacological assessment of each library member’s potencyand efficacy as well as nascent structure-activity relationships (SAR) among analogs.Application of qHTS to cell-based screens can greatly improve the efficiency of recoveringbiologically active compounds and delineate pharmacologically complex responses 4. Theassembly of data generated from multiple qHTS experiments across numerous cellular assayswill provide an unprecedented opportunity to interpret the chemical activity of compoundlibraries, assign mechanism of action, and establish novel relationships among biologicalpathways.
The collection and analysis of data from large-scale chemical screens of cellular assays willrequire an efficient and automated process for qHTS and subsequent data processing.Identifying the appropriate cellular assay formats that will maximize the information content,screening efficiency and data quality is a key practical consideration in developing thischemical biology paradigm. The reporter gene technology using the beta-lactamase enzymeand fluorescent substrates 5 has been widely employed in HTS 6–10. In this study, we haveexamined the activity of a cytokine signaling pathway against a compound library includingbiologically annotated small molecules and uncharacterized combinatorial and syntheticmolecules selected for chemotype diversity.
The interleukin-6 (IL-6) signaling pathway is important for mobilizing the immune responseagainst foreign agents and when aberrantly activated, contributing to inflammation and cancer11. IL-6 signals by binding to the IL-6 receptor and recruiting the transmembrane protein gp130into a signaling complex 12, 13. Formation of this receptor complex activates Janus kinase(JAK) family members to phosphorylate tyrosines in the gp130 cytoplasmic domain that inturn, recruit signaling components such as signal transducer and activator of transcription(STAT) proteins. Phosphorylation of STAT proteins causes dimerization and subsequenttranslocation to the nucleus where they bind interferon-gamma activation sequences (GAS) orGAS-like elements to control gene expression 14.
To identify small molecule modulators of the IL-6 signaling pathway, we assayed ME-180cervical carcinoma cells stably expressing a beta-lactamase reporter under the control of a sis-inducible element (SIE), a GAS-like sequence that recruits certain STAT proteins after IL-6stimulation 15. ME-180 cells respond to IL-6 by activating STAT1 and STAT3 16 and inducingproliferation 17. IL-6 has a role in cervical biology, as normal and neoplastic cervical cellsexpress IL-6 in vitro 18 and in situ 19 as well as proliferate in response to IL-6 stimulation 17,18. Here we screened this IL-6 signaling assay in a qHTS of 11,693 compounds and identified32 distinct chemical series comprising known and novel bioactive molecules. In followingcounter screens to eliminate fluorescent and nonselective compounds, we found four activatorand one inhibitor series that modulate IL-6-stimulated signaling but do not show similar activityin cell-based beta-lactamase reporter assays for EGF- or hypoxia-stimulated pathways.
ResultsAssay optimization and qHTS
To screen for small molecule modulators of IL-6 signaling, we assayed SIE-bla cells, a ME-180line stably expressing a SIE beta-lactamase reporter fusion 20. This cell line likely reports
Johnson et al. Page 2
Mol Biosyst. Author manuscript; available in PMC 2010 August 1.
NIH
-PA Author Manuscript
NIH
-PA Author Manuscript
NIH
-PA Author Manuscript
signaling through STAT1 and STAT 3 as these transcription factors bind the SIE upon IL-6stimulation 15 and ME-180 cells respond to IL-6 by transiently activating STAT1 and STAT3hetero- and homodimers 16. Treatment of SIE-bla cells with increasing concentrations of IL-6resulted in a dose-dependent, saturable increase of beta-lactamase activity with a half-maximalconcentration of activity (AC50) of about 50 pM (0.9 ng/mL, Fig. 1A), similar to previously-reported values for IL-6-induced gene expression 21, 22. This response was inhibited by a smallmolecule pan-JAK antagonist with an AC50 of 20 nM (Fig. 1A), a value similar to that reportedfor JAK1 inhibition 23.
he SIE-bla cells were screened in 1536-well plate format against a collection of 11,693 smallmolecules that included known bioactives, natural products, and synthetic combinatorial anddiversity compounds (Fig. 1B). To identify both activators and inhibitors, the cells werestimulated at 40 pM IL-6, near the AC50 level of activity for the SIE reporter. Using qHTS,each compound was assayed at seven or more concentrations 3, the highest concentrationstarting at 9 uM for most compounds (17 uM for the LOPAC and Prestwick collections, Figure1). The 132 plate qHTS performed well with an average signal to background of 5.3 and Z′ of0.76 for the AC50 IL-6 and inhibitor control wells (Fig. 1C).
Classification of ActivesBeta-lactamase activity in the SIE-bla assay was detected by CCF4-AM 20, a substrate thatcontains coumarin and fluorescein coupled by a cephalosporin moiety 24. Excitation of thecoumarin donor at 405 nm results in fluorescein acceptor emission at 530 nm via fluorescenceresonant energy transfer (FRET). Following uptake of CCF4-AM by cells and hydrolysis ofthe AM ester, cleavage of the CCF4 cephalosporin ring by beta-lactamase results in liberationof fluorescein and direct detection of the resultant coumarin derivative emission at 460 nm.Fluorescence detection at 530 nm measures the amount of uncleaved CCF4 substrate withincells. While beta-lactamase enzymatic activity is detected by 460 nm emission, the ratio ofcleaved (460 nm) to uncleaved (530 nm) substrate is frequently used, as this ratiometricapproach helps normalize the well-to-well variation in volume and cell number 5.
To determine compound activity in the SIE-bla qHTS, the titration-response data from the 460nm emission (460), 530 nm emission (530) and the 460/530 ratio (Ratio) measurements foreach sample was plotted and modeled by a four parameter logistic fit. Curve-fits were thenclassified by the criteria described in 3. In brief, Class 1.1 and 1.2 were full curves containingupper and lower asymptotes with efficacy ≥ 80% and <80%, respectively. Class 2.1 and 2.2were incomplete curves having only one asymptote with efficacy ≥ 80% and <80%,respectively. Class 3 curves showed activity at only the highest concentration or were poorlyfit. Class 4 curves were inactive having a curve-fit of insufficient efficacy or lacking a fitaltogether.
Fluorescence from the uncleaved beta-lactamase substrate can be used as a measure of viabilitybecause living cells are required to de-esterify and retain the substrate within cells. A decreasein the 530 nm reading may indicate cell cytotoxicity, or alternately, may denote a high levelof beta-lactamase enzyme that has consumed much of the substrate within cells. In the SIE-bla qHTS, only 19 of 1,330 actives showed decreases at 530 nm. This very low incidence ofactivity suggests the five-hour incubation time is insufficient for cytotoxic molecules tomanifest substantial cell killing. Increases in the 530 nm reading suggest compoundfluorescence. Indeed, of the 64 activators at 530 nm, 55 were tested on parental ME-180 cells(see below) and all were positive, indicating fluorescence. Overall, of the 83 compounds thatshowed activity 530 nm, 78 showed activity at 460 nm as well. Hence, few compoundsdisplayed effects solely by decreasing cell viability or fluorescing only at 530 nm.
Johnson et al. Page 3
Mol Biosyst. Author manuscript; available in PMC 2010 August 1.
NIH
-PA Author Manuscript
NIH
-PA Author Manuscript
NIH
-PA Author Manuscript

To identify active compounds, the 460 and Ratio measurements were used. The qHTSidentified 907 compounds (Class 1-3) active in both the 460 and Ratio determinations (Table2). However, 211 additional compounds were active only at 460 while another 120 compoundswere active only by the Ratio determination. Examination of Class 1 and 2 curves from thesetwo subsets indicated well-fit titration curves (r2>0.8, P ≤0.05). However, the efficacies werenear the 30% threshold defined for activity which led to their inconsistent classification asactive or inactive between the 460 and Ratio determinations (Fig. 2). As most of these Class1 and 2 curves comprised acceptable curve fits, they were considered as active. Likewise, Class3 curves from these groups were included as actives, though the curve fits were of lower qualityand in some cases, spurious (data not shown), as was expected for this class. An additional 92Class 4 compounds were reassigned as Class 3, because these curves had good curve fit metrics(P ≤ 0.05, ≤ 5% zero activity and ≤ 2 masked data points) in both 460 and Ratio readings butthe efficacies were within the range considered as background (Fig. 2). For compounds thatwere Class 1-3 in both 460 and Ratio determinations, the Ratio curve class was used andAC50s were averaged. From this process, 1,330 compounds were identified as active (Table2).
The qHTS indicated that 11% of the screened compounds displayed some level of activity,composed of an almost equal number of activators and inhibitors (Table 3, Fig. 3). Class 1.1and 1.2 curves each comprised 0.5% of the screened collection, totaling 55 and 63 compounds,respectively. Class 2 curves totaled almost 4% of the screened library and 91% had AC50sbetween 1 and 10 uM. Of the 171 Class 2.1 samples, 139 were activators and only 32 wereinhibitors, while of the 275 Class 2.2 compounds, 121 were activators and 154 were inhibitors.Compounds associated with Class 3 curves constituted 6.5% of the library and 58% of theidentified actives with 339 activators and 427 inhibitors. As this category of actives had lowerquality curve-fits based on fewer points of activity, the biological activity of these compoundsin this qHTS was less certain. While the potencies of the actives spanned over three orders ofmagnitude, most actives displayed uM potencies; 73% were 1–10 uM AC50 and 19% were0.1–1 uM AC50, while 3% <0.1 uM AC50 and 5% >10 uM AC50.
Derivation of structure-activity relationshipsTo identify chemical series for further characterization, structure-activity relationships (SAR)were derived from the qHTS data. Selected compounds (Class 1 and 2 by Ratio determination,Class 1-3 at 460 nm and Class 4 at 530 nm) were grouped using Leadscope to yield clustersof three or more actives. For each cluster, maximal common substructures (MCS) wereextracted and used to search the entire screening collection to find all analogs includinginactives. From each MCS, scaffolds were extracted, each containing 2 or more actives, toform a SAR series. This process was applied separately for activators and inhibitors. For theSAR analysis of activators, 209 actives were grouped yielding 14 clusters and 13 series (SuppTable 1 and Fig. 4A) while for inhibitors, 209 actives were grouped yielding 35 clusters and19 series (Supp Table 2 and Fig. 4B).
Counter screen of selected actives to find fluorescent artifactsBecause detection of the beta-lactamase substrate and the cleavage product is fluorescencebased, fluorescent compounds that penetrate cells may be incorrectly scored as positive. Asmany fluorescent compounds that populate typical heterocyclic collections emit in the blue-green spectrum of light 25–27, such molecules may emit light in the 460 nm and 530 nm rangesand be identified as active in the SIE-bla assay. To find fluorescent artifacts, the 3,000-membercombinatorial library and selected follow-up compounds were counter screened on parentalME-180 cells, which do not contain the beta-lactamase reporter gene. The library was screenedas a qHTS of seven five-fold dilutions beginning at 8 uM while the follow-up compounds weretested at 24 two-fold dilutions in duplicate beginning at 40 uM. Compounds were considered
Johnson et al. Page 4
Mol Biosyst. Author manuscript; available in PMC 2010 August 1.
NIH
-PA Author Manuscript
NIH
-PA Author Manuscript
NIH
-PA Author Manuscript

fluorescent if they were Class 1-3 activators by the 460, 530 or Ratio determination whereasinhibitory Class 1-3 curves in either the 460 nm or 530 nm reading were scored as inactive.Though molecules fluorescent only at 530 nm would appear as inhibitors by the Ratiodetermination, none were observed. Of the 663 qHTS actives counter screened, 374 scored aspositive by virtue of compound fluorescence. This result indicated the activity of thesecompounds arose from fluorescence instead of induction of the SIE beta-lactamase reporter.Therefore, these compounds were considered artifacts.
Each of the 32 SAR series was examined for fluorescence as determined by activity in parentalcells. The counter screen of parental cells indicated activator series 4, 8, 11 and 12 as fluorescentbecause ≥50% of the actives within each series scored were positive (Table 4). A 6,8-dimethylpteridinone series (8) from the combinatorial library contained 322 positives,accounting for 82% of the positives recovered from the ME-180 counter screen. Activatorseries 2, 3, 5, 6 and 10 contained ≤ 40% actives that scored positive in ME-180 cells, indicatingas inconclusive whether the activity of the series arose from fluorescence, induction of thereporter, or a combination of both. Only 10 compounds from the inhibitor series were positivein the parental cells (Table 4) and none was active at 530 nm (data not shown). This ruled outthe possibility of artifact compounds showing strong fluorescence at 530 nm and scoring asinhibitory by the Ratio determination. Two inhibitor series, methylquinazolinamine (18) and2-(methylamino)pteridinone (30), each contained five actives that were positive in the parentalcells and comprised 8% and 38%, respectively, of actives tested (Table 4). The fluorescentcompounds in these series may have caused underestimation of actual biological potency andefficacy because compound fluorescence at 460 nm would offset the decrease in 460 nmfluorescence brought about by lowered production of the beta-lactamase reporter enzyme.
Retest of selected compounds to confirm activityTo confirm the action of selected qHTS actives, 55 activators and 58 inhibitors were chosenfor retesting (113 total retests). These compounds were tested on SIE-bla cells as a titrationseries of 24 two-fold dilutions in duplicate beginning at 38 uM in two independent experiments.The activity of 13 qHTS actives did not confirm upon retest; seven were inactive while sixshowed opposite activity between the qHTS and follow-up or between the two follow upexperiments. Mass spectrometry of these compounds indicated that ten had the expectedmolecular weight (MW) while for three samples the MW could not be determined. For mostof these apparent non-confirmations, the qHTS or follow-up titration-response curves wereeither poorly fit or of low efficacy, thus calling into question the initial curve classificationassignment, for example (see below). One hundred of the 113 (88%) compounds confirmedactivity upon retest on SIE-bla cells (47 activators and 53 inhibitors, Table 4, Supp Table 1and 2). Of the retested activators, 16 were positive in the parental cell counter screen and werelikely fluorescent artifacts. Thus, 84 samples showed confirmed biological activity.
Plotting of the qHTS and follow-up AC50s of all confirmed actives but two indicated that theqHTS derived potencies correlated but were lower overall in the follow-up assay (Fig. 5). Thetwo excluded actives were outliers where the discrepancy in potency were explained by theautomated curve-fit of the qHTS titration data, whereby incorrect masking of a data pointresulted in a higher potency curve.
Identification of chemical series selective for IL-6 signalingTo identify series that were selective or biased toward modulation of IL-6 signaling, weexamined the activity of each series in two other cell-based assays: AP-1-bla, which detectedEGF signaling via an AP-1 reporter gene 28, and HRE-bla, which measured cobalt chloride-induced hypoxia by a hypoxia response element (HRE) reporter 20. Like SIE-bla cells, bothassays use stably transfected ME-180 cells and a beta-lactamase reporter gene, thereby
Johnson et al. Page 5
Mol Biosyst. Author manuscript; available in PMC 2010 August 1.
NIH
-PA Author Manuscript
NIH
-PA Author Manuscript
NIH
-PA Author Manuscript

controlling for differences in activity that might arise from use of different cell types or reporterenzymes. Of the two assays, AP-1-bla was more closely comparable to SIE-bla, as both assayswere incubated with ligand and compounds for five hours before assaying, while for HRE,inducer and compounds were incubated overnight. The AP-1-bla and HRE-bla assays werescreened using qHTS 3 (PubChem AIDs 257, 914 and 915).
Several series that were selective for SIE-bla showed little or no activity in AP-1-bla andHRE-bla assays. Of the activators, three spirocycle series (2, 6 and 7, Fig. 4A), which share adiazaspiropropanone core, were active in SIE-bla at submicromolar concentrations (Table 4).Of the 29 compounds in series 2 that were activators in SIE-bla, five compounds were inhibitorsin AP-1-bla and four other compounds were activators of lower potency in HRE-bla. For theSIE-bla actives in series 6 and 7, none was active in AP-1-bla and only one activated HRE-bla cells with a 10 uM AC50 (Table 4, data not shown). Six of seven anthracycline actives inseries 13 behaved as activators in SIE-bla but were inhibitors or inactive in both AP-1-bla andHRE-bla indicating these compounds were selective in their directionality of action. Forinhibitors, all four SIE-bla actives in series 24, which contained a xanthene-4,5,6-triol core,were inactive in AP-1-bla and HRE-bla.
Known bioactive compounds modulate IL-6-stimulated activity in SIE-bla cellsThe qHTS identified a number of compounds with known biological activity that targetcomponents involved in IL-6-mediated signaling thereby biologically validating the SIE-blaassay. Of note were actives that modulate protein kinases or phosphatases. The tyrosine kinaseinhibitor emodin, which blocks IL-6-stimulated JAK2 activation in multiple myeloma cells29, inhibited SIE-bla at 10 uM IC50, as did ZM 39923, a naphthyl ketone that inhibits invitro JAK1 kinase activity at 20 uM IC50 30, and SD1008, a JAK2 inhibitor 31, blocked SIE-bla expression with a 3 uM IC50. The tyrosine phosphatases SHP2 and CD45 are important inIL-6 signal transduction; IL-6 can mobilize the MAP kinase pathway via JAK phosphorylationof SHP2 13 and CD45, a JAK phosphatase 32, is required for IL-6-induced proliferation ofmultiple myeloma cells 33. Indeed, dephostatin and Me-3,4-dephostatin, small moleculeinhibitors of tyrosine phosphatases including CD45 34, 35, antagonized IL-6 signaling in SIE-bla cells at ~5 uM AC50 (Supp Table 2, data not shown). SU6656, U0126, and SB 202190 areinhibitors of the IL-6-activated kinases Src 36, MEK 37 and p38 38, respectively and these wereidentified in the qHTS as antagonists of 1–5 uM AC50. These inhibitors may block transcriptionof the SIE-bla reporter gene by preventing STAT3 phosphorylation, as IL-6 requires MEK orSrc activity to activate STAT3 in some cell types 36, 37.
Several SAR series identified from the qHTS contained known bioactives and displayedselectivity for SIE-bla. Series 13, which contained the anthracycline antibiotics idarubicin,doxorubicin and daunomycin, activated SIE-bla but inhibited AP-1- and HRE-bla cells (Table4). This selective modulation suggested that anthracyclines were specifically activating theIL-6 pathway. Indeed, in the absence of IL-6, these compounds did not induce the SIE-blareporter (data not shown), indicating they were IL-6-dependent potentiators. While IL-6 hasbeen implicated in conferring drug resistance in breast carcinoma and osteosarcoma cells 39,40, addition of exogenous IL-6 did not increase resistance of ME-180 cells to cell killing bydoxorubicin, daunomycin, paclitaxel, or camptothecin, among others (data not shown). Na, K-ATPase inhibitors (series 21) and retinoic acids (series 32) inhibited SIE- and HRE-blareporters but not AP-1-bla (Table 4). This inhibition of SIE-bla is not likely caused bycytoxicity because AP-1-bla activity was not affected, even though both lines were incubatedwith compound for five hours. However, the inhibition of HRE-bla by series 21 and 32 couldarise from cytotoxicity because compounds were incubated with cells overnight in this assay.
Johnson et al. Page 6
Mol Biosyst. Author manuscript; available in PMC 2010 August 1.
NIH
-PA Author Manuscript
NIH
-PA Author Manuscript
NIH
-PA Author Manuscript

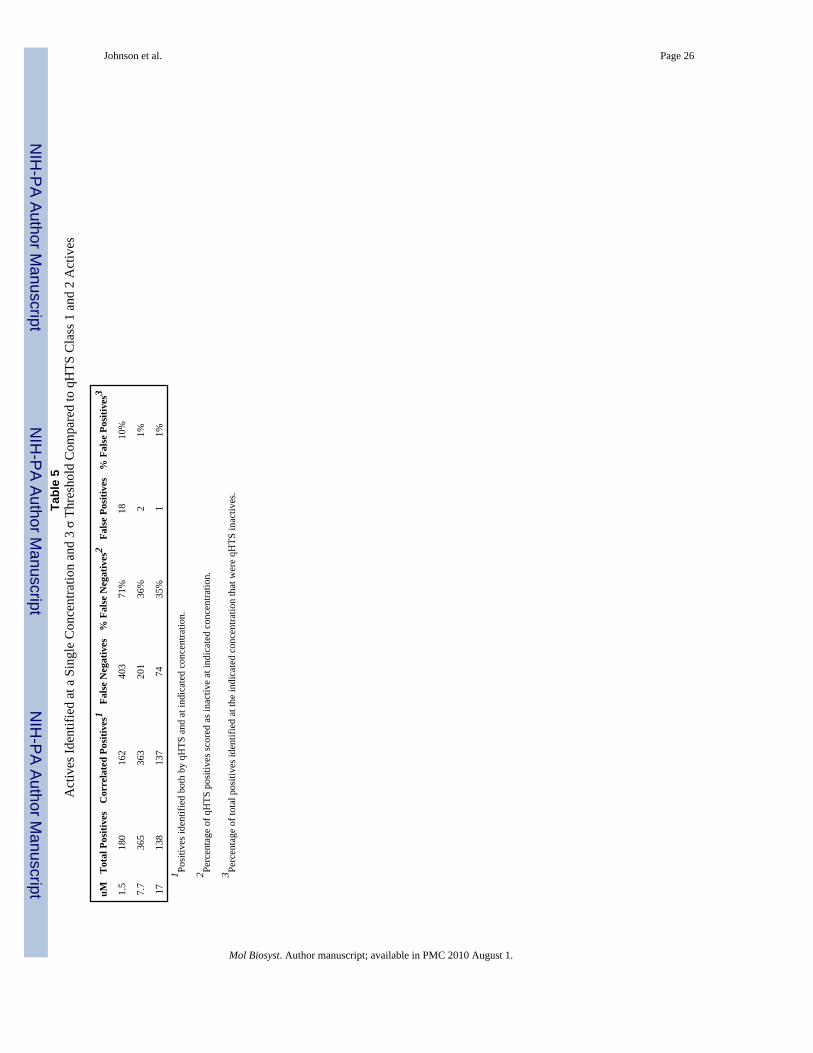
Retrospective comparison of actives identified by qHTS and at single concentrationsTraditional HTS involves assaying the library at one concentration and scoring compoundsthat exceed a threshold of activity as active, typically 3 σ above the background activity of theassay 41. To compare how well traditional single-concentration screening would identifyactives in the SIE-bla qHTS, we conducted a retrospective analysis of the qHTS data usingcompound activities at individual concentrations to identify actives. The qHTS recovered 564compounds associated with Class 1 or 2 curves and these compounds were considered high-quality actives for use in the retrospective analysis. The 766 compounds associated with Class3 curves, that were poorly-fit or showed activity at only the highest concentration, wereexcluded from the comparison because their activity could not be ascertained reliably. Usingthe 1.5 uM screening concentration and applying a 3 σ threshold (40% activity), 180 positiveswere identified, of which 10% were qHTS inactives and therefore false positives (Table 5).This concentration failed to identify 403 qHTS actives as positive, indicating 71% falsenegatives. At 7.7 uM, the highest concentration where all compounds were tested, and a 3 σcutoff, 365 positives were recovered, of which all but 2 were qHTS actives, demonstrating 1%false positives. False negatives were 36% where 201 qHTS actives were not scored as active.The 17 uM concentration showed false positive and false negative percentages similar to 7.7uM. Examination of the fitted curves of these false negatives indicates that though the percentactivity at 7.7 uM was within the cutoff thresholds, the percent activities at 1.5 and/or 17 uMconcentrations exceeded the thresholds (Fig. 6). These results indicate for the SIE-bla assay,use of a single concentration yielded a low percentage of false positives but a significantpercentage of false negatives, ranging from 35% to 71% at the three highest concentrationsassayed.
DiscussionWe took several approaches to identify actives in the SIE-bla qHTS. Use of both the 460 andRatio readings were instrumental in determining active compounds. About 70% of the 1330declared actives displayed Class 1-3 curves in both the measurements. An additional 25%showed activity in either reading (Table 2). In many of these cases, particularly for Class 1 and2 curves, the discrepant activity assignments corresponded to compounds of low efficacy, nearthe threshold level assigned for background (Fig. 2). Having two means to measure activityallowed us to recover actives that would not have been possible using either measurementalone. Furthermore, 92 samples (7% of actives) were originally scored as inactive by ourautomated curve-fit program but showed high-quality curve fits of low efficacy and weretherefore reassigned as Class 3 actives. While these approaches helped ensure recovery of manybiological actives, some declared actives, especially compounds associated with Class 3curves, may be false positives.
While qHTS is well suited to determine comprehensively the activity of a chemical library, itis critical to consider how, and with what level of confidence, activity is scored. This isimportant when profiling a compound’s activity across many assays as inaccurate assignmentsmay lead to incorrect assessment of target selectivity. As shown here, the scoring of compoundsas inactive can be less certain in cell assays because compounds of insufficient efficacy butwell-fit titration-response curves may not be scored as active (Fig. 2). We found that acombination of curve-fit parameters (P value <0.05, x-intercept between −5 and 5 % activityand ≤2 masked points) applied to both 460 and Ratio readings were useful in recovering someof these low efficacy compounds.
The SIE-bla qHTS identified 11% of the screened compounds having some degree of activity.However, this percentage falls to ~2.5 % when only actives associated with high confidencecurve classes (Class 1 and 2.1) are counted (Table 3). Because our screen was configured torecover actives in two modes, agonist and antagonist, the high confidence percentage decreases
Johnson et al. Page 7
Mol Biosyst. Author manuscript; available in PMC 2010 August 1.
NIH
-PA Author Manuscript
NIH
-PA Author Manuscript
NIH
-PA Author Manuscript
to 1.6% and 0.9% of the library for the agonist and antagonist modes, respectively. A substantialcomponent of library activity was derived from compounds displaying lower potency and lowercurve classes. The low potency actives were recovered because our qHTS included 9 uM and17 uM library concentrations. Such actives are valuable for evaluating nascent SAR of chemicalseries. An additional factor contributing to the overall yield of actives was the occurrencefluorescent compounds within the library. The follow up counterscreen identified 374 asfluorescent, thus indicating that at least 28% of library actives were fluorescent artefacts.
Having identified these compounds as active, what level of confidence should be applied tothe activity assignments? Curve Classes 1 and 2 provide reasonable confidence of indicatinga compound as active. Such curves show activity above background at two or moreconcentrations and have goodness of fit values (r2) of at least 0.8. Indeed, the highest qualitycurves, Class 1, 2.1 and sometimes Class 2.2, are all used for the initial clustering of activesfor our SAR analysis 3, 4. Class 3 curves are less certain indicators of an assay response, asthese curves display activity at only one concentration, typically the highest tested, or havetwo or more points of activity but poor curve-fits (r2<0.8). As well, the reclassified inactivesmentioned above were categorized as Class 3. For the SIE-bla qHTS, 24 Class 3 compounds,all of which showed two or more points of activity, were retested and 83% confirmed as activecompared to 90% of Class 1 and 2 actives. This result indicated that this category of Class 3was a reliable predictor of activity, though not as well as Class 1 and 2. For profiling purposes,compounds associated with Class 3 curves are conservatively viewed as inconclusive untilsubsequent retesting confirms the initial result and/or the activity is supported by SAR derivedfrom Class 1-2.1 actives.
Our retrospective analyses have shown that titration-based screening identifies more activesthan by use of a single concentration and therefore decreases the number of false positives andfalse negatives 3, 42. Indeed, the retrospective analysis of the SIE-bla qHTS indicated that 35%to 71% of Class 1 and 2 qHTS actives were scored as false negatives when the 1.5, 7.7 or 17uM concentration and a 3 σ threshold of activity were used (Table 5).
Several factors contributed to the high percentage of false negatives. First, while sub-thresholdactivity may be detected at one concentration, other concentrations can show activity thatexceed the threshold, particularly when multiple concentrations are fit to a curve (Fig. 6).Second, qHTS data can use activity thresholds lower than 3 σ and generate well-fit curves; forthis assay, 30% was used as the activity threshold whereas 3 σ of background activity was 40%.Importantly, the qHTS method can make use of titration curves derived from the 460 and 530readings in addition to ratiometric determination. This allowed us to identify compounds thatshowed sub threshold titration-response curves in the Ratio determination but exceededthreshold activity in the 460 measurement as well as assess potential cytotoxicity. In contrast,the individual 460 and 530 readings are difficult to use with single concentration data becauseof well-to-well variations in cell number and reagent dispenses, leaving only the ratiometricdata to assess activity.
The SIE-bla qHTS did not identify two reported JAK inhibitors as active; Tyrphostin AG 49043 and SD-1029 44 were screened but determined as inactive. However, the SD-1029 samplethat was screened failed QC, having an incorrect mass, indicating it was likely degraded or adifferent compound. While it is difficult to estimate what percentage of SIE-bla qHTS wasfalse negative without rescreening the collection, we expect a value of less than one percent.Indeed, if the 92 ‘rescued actives’ are considered as false negatives, the percentage of falsenegatives from the screen is about 0.8%.
A general degree of connectivity among the STAT, AP-1 and hypoxia signalling pathways canbe estimated by comparing the number of SIE-bla actives shared with or distinct from AP-1-
Johnson et al. Page 8
Mol Biosyst. Author manuscript; available in PMC 2010 August 1.
NIH
-PA Author Manuscript
NIH
-PA Author Manuscript
NIH
-PA Author Manuscript

bla and/or HRE-bla actives. Actives were defined as having curve class 1, 2.1 or 2.2 (with>50% efficacy) in the ratio reading and class 1-3 in the 460 nm reading. Using these criteria,20% of the SIE-bla actives were active in both AP-1-bla and HRE-bla assays, 45% were activein either the AP-1-bla or HRE-bla assay, and 35% were active in neither. This result indicatessignificant overlap between the three assays, possibly because of the commonality in the assaytechnology used (beta-lactamase gene reporter), common components utilized in the pathways,or cross-talk among signalling components between pathways. In addition, many of the smallmolecule actives likely modulate multiple targets, whether closely related members within aprotein family (for example, kinases) or structurally unrelated targets.
The SIE-bla qHTS found a number of selective compounds that will provide useful reagentsfor studying STAT signaling mediated by IL-6 and perhaps the biology of cervical cancer aswell. Of the 32 active series identified from the qHTS, six were selective for SIE-bla, showingopposite or no activity in AP-1-bla and HRE-bla assays. Three other series were active inSIE-bla and AP-1-bla assays while five were active in SIE-bla and HRE-bla assays. While ourcomparative approach identified these series as STAT-selective, this interpretation should beheld with some caution. Some selective actives may in fact be nonselective, because thepromoter-gene reporters in the AP1-bla and HRE-bla may be less sensitive or efficient inrecording transcriptional activation. Additional evidence of STAT selectivity can be soughtusing secondary assays involving JAK or STAT activation such as those described in 45. Themolecules reported here are likely to be important tool compounds for investigating thisimportant pathway.
ConclusionIn a qHTS of SIE-bla cells, we identified small molecule modulators that enhance or inhibitan IL-6-activated reporter gene. From the primary screening data, we found 564 samplesassociated with high-quality Class 1 or 2 curves. SAR analysis partitioned these actives into13 activator and 19 inhibitor series. Counter screens for activity in parental cells and activityin other beta-lactamase gene reporter assays indicated five series as selective for IL-6-stimulated STAT activity.
ExperimentalReagents
CellSensor® SIE-bla ME-180, CellSensor® AP-1-bla ME-180 and CellSensor® HRE-blaME-180 cells were provided by Invitrogen. ME-180 cells were purchased from ATCC, panJak inhibitor (2-(1,1-Dimethylethyl)-9-fluoro-3,6-dihydro-7H-benz[h]-imidaz[4,5-f]isoquinolin-7-one, 23 was obtained from Calbiochem, and recombinant human IL-6 wasobtained from R & D Systems.
Cell cultureSIE-bla, AP-1-bla and HRE-bla cells were cultured in DMEM medium with 10% dialyzedfetal bovine serum (FBS), 2 mM L-glutamine, 0.1 mM non-essential amino acids (NEAA),1mM sodium pyruvate, 25 mM HEPES pH 7.3, 100 U/ml penicillin,100 ug/ml streptomycin,and 5 ug/ml of blasticidin at 37°C and 5% CO2. ME-180 cells were cultured in McCoy’s 5aMedium with 1.5 mM L-glutamine, 2.2 g/L sodium bicarbonate supplemented with 10% FBS,1 mM sodium pyruvate, 100 U/ml penicillin, and 100 ug/ml streptomycin at 37°C and 5%CO2.
Johnson et al. Page 9
Mol Biosyst. Author manuscript; available in PMC 2010 August 1.
NIH
-PA Author Manuscript
NIH
-PA Author Manuscript
NIH
-PA Author Manuscript

Assay and qHTSThe protocol is detailed in Table 1. Cells were dissociated with 0.05% trypsin/EDTA and thenwashed and suspended in assay medium (OPTI-MEM® medium with 0.5% FBS, 0.1 mMnonessential amino acids, 1 mM sodium pyruvate, 10 mM HEPES pH 7.3, 100U/ml penicillin,and 100 ug/ml streptomycin). Cells were dispensed into 1536-well black clear bottom plates(Grenier Bio-One) at 5 ul/well using a Flying Reagent Dispenser (Beckman Coulter) 46 at either2500 (AP-1-bla and HRE-bla) or 3000 cells/well (SIE-bla). Approximately 23 nL ofcompounds in DMSO were transferred to columns 5 to 48 of each 1536 well plate by a pin tool(Kalypsys) 47 either immediately (HRE-bla) or after overnight incubation (AP1-bla and SIE-bla) at 37 C. Following transfer, 1 uL of medium with or without agonist or agonist plusinhibitor was dispensed in the following format. Column 1, AC90 of agonist- 100 uM CoCl2(HRE-bla), 160 pM EGF (AP1-bla), 300 pM IL-6 (SIE-bla). Column 2, AC50 of agonist aloneor with AC90 of inhibitor: 50 uM CoCl2 (HRE-bla), 30 pM EGF plus 100 nM PD153035, anEGF receptor antagonist, (AP1-bla), 40 pM IL-6 plus 125 nM pan JAK inhibitor (SIE-bla).Column 3, Medium only. Columns 4 to 48, AC50 of agonist: 50 uM CoCl2 (HRE-bla), 30 pMEGF (AP1-bla), 40 pM IL-6 (SIE-bla). The cells were centrifuged at 1000 rpm for 1 minuteand incubated at 37 C for 5 hr (AP-1-bla, SIE-bla) or 17 hr (HRE-bla). One uL ofLiveBLAzer™ FRET B/G detection mix (Invitrogen) was then added, the plates incubated atambient temperature for 2.5 hrs, and fluorescence intensity was measured at 405 nm excitationand 460 and 530 nm emission using an Envision (Perkin Elmer) or Safire II (Tecan) detector.Screening was performed over several days in batches of 20 to 35 plates a day. To control forchanges in activity during a run, each screen included several interspersed control plates whereDMSO was transferred to the compound area of the plate (columns 5 to 48) by a pin tool.
For the pan-JAK inhibitor titration, sixteen 2-fold dilutions starting at 19 uM were made induplicate, transferred to 1536 well plates by pin tool, stimulated with 27 pM IL-6 and assayedas above. For the IL-6 titration, 10,000 cells per well in 20 uL were dispensed in a 384-wellblack clear plate and treated with different concentrations of ligand in 20 uL and assayed asabove. Il-6 was titered in ten 3-fold dilutions beginning at 15 nM in 8 replicates.
Preparation of compoundsThe assays were screened against 11,693 compounds collected from the following sources:Sigma-Aldrich LOPAC collection (1,280), Prestwick Chemical (1,117), TimTec (280),Pharmacopeia (3,000), Boston University Center for Chemical Methodology and LibraryDevelopment (718), the NIH Molecular Libraries Small Molecule Repository (3,319), and theNational Cancer Institute (1,979). Preparation and titration-response screening of compoundlibraries was performed as described 48. Follow-up compounds were plated as 24 two-folddilutions beginning at 10 mM.
Data AnalysisRaw plate reads were normalized to the median values of the AC50 agonist and AC100antagonist controls (460 nm/530 nm ratio and 460 nm readings) and the DMSO only wells(530 nm reading) present on each plate, and then corrected by applying a pattern correctionalgorithm using DMSO-only control plates at the beginning and end of each plate stack. Foreach compound, a titration response series was generated, curve-fit, and categorized asdescribed 3. Data were deposited in Pubchem (AID 446 and 357)
Derivation of SARCompounds with Class 4 curves in the 530 nm reading, Class 1-3 in the 460 nm reading, andClass 1 and 2 in the ratio determination were selected for SAR analysis. To identify activescaffolds, selected compounds were clustered using Leadscope® fingerprints and subjected to
Johnson et al. Page 10
Mol Biosyst. Author manuscript; available in PMC 2010 August 1.
NIH
-PA Author Manuscript
NIH
-PA Author Manuscript
NIH
-PA Author Manuscript

hierarchical clustering using an average linkage method with a similarity threshold of 0.7.Maximal common substructures were then extracted from each cluster containing at least threecompounds, which were used to search the entire screening collection to find all analogsincluding inactives. Compounds sharing a common scaffold formed a series. For SAR ofactivators, 209 actives were grouped yielding 14 clusters, 13 series and 25 singletons. For SARof inhibitors, 209 actives were grouped yielding 35 clusters, 19 series and 72 singletons withAC50 < 5 uM.
Supplementary MaterialRefer to Web version on PubMed Central for supplementary material.
AcknowledgmentsWe gratefully acknowledge Sam Michael and Carleen Klumpp for automation assistance, Paul Shinn and Adam Yasgarfor compound management, Anton Simeonov for critical reading of the manuscript and Dr. Craig Thomas for helpfuldiscussions. This research was supported by the NIH Roadmap for Medical Research and the Intramural ResearchProgram of the National Human Genome Research Institute, National Institutes of Health.
References1. Inglese, J.; Auld, DS. High Throughput Screening Techniques: Overview of Applications in Chemical
Biology. In: Begley, TP., editor. Wiley Encyclopedia of Chemical Biology. Vol. 4. John Wiley &Sons, Inc; Hoboken, NJ: 2008.
2. Inglese J, Johnson RL, Simeonov A, Xia M, Zheng W, Austin CP, Auld DS. Nat Chem Biol2007;3:466–479. [PubMed: 17637779]
3. Inglese J, Auld DS, Jadhav A, Johnson RL, Simeonov A, Yasgar A, Zheng W, Austin CP. Proc NatlAcad Sci U S A 2006;103:11473–11478. [PubMed: 16864780]
4. Davis RE, Zhang YQ, Southall N, Staudt LM, Austin CP, Inglese J, Auld DS. Assay Drug Dev Technol2007;5:85–103. [PubMed: 17355202]
5. Zlokarnik G. Methods Enzymol 2000;326:221–244. [PubMed: 11036645]6. Chin J, Adams AD, Bouffard A, Green A, Lacson RG, Smith T, Fischer PA, Menke JG, Sparrow CP,
Mitnaul LJ. Assay Drug Dev Technol 2003;1:777–787. [PubMed: 15090224]7. Kunapuli P, Zheng W, Weber M, Solly K, Mull R, Platchek M, Cong M, Zhong Z, Strulovici B. Assay
Drug Dev Technol 2005;3:17–26. [PubMed: 15798392]8. Peekhaus NT, Ferrer M, Chang T, Kornienko O, Schneeweis JE, Smith TS, Hoffman I, Mitnaul LJ,
Chin J, Fischer PA, Blizzard TA, Birzin ET, Chan W, Inglese J, Strulovici B, et al. Assay Drug DevTechnol 2003;1:789–800. [PubMed: 15090225]
9. Zuck P, Murray EM, Stec E, Grobler JA, Simon AJ, Strulovici B, Inglese J, Flores OA, Ferrer M. AnalBiochem 2004;334:344–355. [PubMed: 15494142]
10. Schurer SC, Brown SJ, Gonzalez-Cabrera PJ, Schaeffer MT, Chapman J, Jo E, Chase P, Spicer T,Hodder P, Rosen H. ACS Chem Biol 2008;3:486–498. [PubMed: 18590333]
11. Rose-John S, Waetzig GH, Scheller J, Grotzinger J, Seegert D. Expert Opin Ther Targets2007;11:613–624. [PubMed: 17465721]
12. Aaronson DS, Horvath CM. Science 2002;296:1653–1655. [PubMed: 12040185]13. Heinrich PC, Behrmann I, Haan S, Hermanns HM, Muller-Newen G, Schaper F. Biochem J
2003;374:1–20. [PubMed: 12773095]14. Horvath CM. Trends Biochem Sci 2000;25:496–502. [PubMed: 11050435]15. Darnell JE Jr, Kerr IM, Stark GR. Science 1994;264:1415–1421. [PubMed: 8197455]16. Shen Y, Devgan G, Darnell JE Jr, Bromberg JF. Proc Natl Acad Sci U S A 2001;98:1543–1548.
[PubMed: 11171987]17. Castrilli G, Tatone D, Diodoro MG, Rosini S, Piantelli M, Musiani P. Br J Cancer 1997;75:855–859.
[PubMed: 9062407]18. Iglesias M, Plowman GD, Woodworth CD. Am J Pathol 1995;146:944–952. [PubMed: 7717461]
Johnson et al. Page 11
Mol Biosyst. Author manuscript; available in PMC 2010 August 1.
NIH
-PA Author Manuscript
NIH
-PA Author Manuscript
NIH
-PA Author Manuscript

19. Hess S, Smola H, Sandaradura De Silva U, Hadaschik D, Kube D, Baldus SE, Flucke U, Pfister H.J Immunol 2000;165:1939–1948. [PubMed: 10925276]
20. Hallis TM, Kopp AL, Gibson J, Lebakken CS, Hancock M, Vandenheuvel-Kramer K, Turek-EtienneT. J Biomol Screen 2007;12:635–644. [PubMed: 17517902]
21. Andus T, Geiger T, Hirano T, Kishimoto T, Heinrich PC. Eur J Immunol 1988;18:739–746. [PubMed:2454192]
22. Lai CF, Ripperger J, Morella KK, Jurlander J, Hawley TS, Carson WE, Kordula T, Caligiuri MA,Hawley RG, Fey GH, Baumann H. J Biol Chem 1996;271:13968–13975. [PubMed: 8662928]
23. Thompson JE, Cubbon RM, Cummings RT, Wicker LS, Frankshun R, Cunningham BR, CameronPM, Meinke PT, Liverton N, Weng Y, DeMartino JA. Bioorg Med Chem Lett 2002;12:1219–1223.[PubMed: 11934592]
24. Zlokarnik G, Negulescu PA, Knapp TE, Mere L, Burres N, Feng L, Whitney M, Roemer K, TsienRY. Science 1998;279:84–88. [PubMed: 9417030]
25. Comley J. Drug Discovery World 2003;4:91–98.26. Swift, K.; Anderson, SN.; Matayoshi, ED. Dual-laser fluorescence correlation spectroscopy as a
biophysical probe of binding interactions: evaluation of new red fluorescent dyes. In: Lakowicz, JR.;Thompson, RB., editors. Advances in Fluorescence Sensing Technology V. SPIE; Bellingham, WA:2001. p. 47-58.
27. Simeonov A, Jadhav A, Thomas CJ, Wang Y, Huang R, Southall NT, Shinn P, Smith J, Austin CP,Auld DS, Inglese J. J Med Chem 2008;51:2363–2371. [PubMed: 18363325]
28. Wilkinson JM, Machleidt T, Echeverria VM, Vandenheuvel-Kramer K, Honer J, Zhong Z, Bi K.Assay Drug Dev Technol 2008;6:351–359. [PubMed: 18593376]
29. Muto A, Hori M, Sasaki Y, Saitoh A, Yasuda I, Maekawa T, Uchida T, Asakura K, Nakazato T,Kaneda T, Kizaki M, Ikeda Y, Yoshida T. Mol Cancer Ther 2007;6:987–994. [PubMed: 17363492]
30. Brown GR, Bamford AM, Bowyer J, James DS, Rankine N, Tang E, Torr V, Culbert EJ. Bioorg MedChem Lett 2000;10:575–579. [PubMed: 10741557]
31. Duan Z, Bradner J, Greenberg E, Mazitschek R, Foster R, Mahoney J, Seiden MV. Mol Pharmacol2007;72:1137–1145. [PubMed: 17675586]
32. Irie-Sasaki J, Sasaki T, Matsumoto W, Opavsky A, Cheng M, Welstead G, Griffiths E, Krawczyk C,Richardson CD, Aitken K, Iscove N, Koretzky G, Johnson P, Liu P, Rothstein DM, et al. Nature2001;409:349–354. [PubMed: 11201744]
33. Ishikawa H, Tsuyama N, Abroun S, Liu S, Li FJ, Taniguchi O, Kawano MM. Blood 2002;99:2172–2178. [PubMed: 11877294]
34. Watanabe T, Takeuchi T, Otsuka M, Tanaka S, Umezawa K. J Antibiot (Tokyo) 1995;48:1460–1466.[PubMed: 8557604]
35. Liu G. Curr Med Chem 2003;10:1407–1421. [PubMed: 12871138]36. Song L, Turkson J, Karras JG, Jove R, Haura EB. Oncogene 2003;22:4150–4165. [PubMed:
12833138]37. Kopantzev Y, Heller M, Swaminathan N, Rudikoff S. Oncogene 2002;21:6791–6800. [PubMed:
12360405]38. Lin DL, Whitney MC, Yao Z, Keller ET. Clin Cancer Res 2001;7:1773–1781. [PubMed: 11410519]39. Conze D, Weiss L, Regen PS, Bhushan A, Weaver D, Johnson P, Rincon M. Cancer Res
2001;61:8851–8858. [PubMed: 11751408]40. Duan Z, Lamendola DE, Penson RT, Kronish KM, Seiden MV. Cytokine 2002;17:234–242.
[PubMed: 12027404]41. Zhang JH, Chung TD, Oldenburg KR. J Biomol Screen 1999;4:67–73. [PubMed: 10838414]42. Zhu PJ, Zheng W, Auld DS, Jadhav A, Macarthur R, Olson KR, Peng K, Dotimas H, Austin CP,
Inglese J. Comb Chem High Throughput Screen 2008;11:545–559. [PubMed: 18694391]43. Meydan N, Grunberger T, Dadi H, Shahar M, Arpaia E, Lapidot Z, Leeder JS, Freedman M, Cohen
A, Gazit A, Levitzki A, Roifman CM. Nature 1996;379:645–648. [PubMed: 8628398]44. Duan Z, Bradner JE, Greenberg E, Levine R, Foster R, Mahoney J, Seiden MV. Clin Cancer Res
2006;12:6844–6852. [PubMed: 17121906]
Johnson et al. Page 12
Mol Biosyst. Author manuscript; available in PMC 2010 August 1.
NIH
-PA Author Manuscript
NIH
-PA Author Manuscript
NIH
-PA Author Manuscript

45. Robers MB, Machleidt T, Carlson CB, Bi K. Assay Drug Dev Technol 2008;6:519–529. [PubMed:18694336]
46. Niles WD, Coassin PJ. Assay Drug Dev Technol 2005;3:189–202. [PubMed: 15871693]47. Cleveland PH, Koutz PJ. Assay Drug Dev Technol 2005;3:213–225. [PubMed: 15871695]48. Yasgar A, Shinn P, Jadhav A, Auld D, Michael S, Zheng W, Austin CP, Inglese J, Simeonov A. J
Assoc Lab Automation 2008;13:79–89.
Johnson et al. Page 13
Mol Biosyst. Author manuscript; available in PMC 2010 August 1.
NIH
-PA Author Manuscript
NIH
-PA Author Manuscript
NIH
-PA Author Manuscript

Fig. 1. SIE-bla assay response and qHTS performanceA) Dose-response of IL-6 and JAK inhibitor in SIE-bla cells. Cells were treated with shownconcentrations of IL-6 (filled circles) or with 27 pM IL-6 with indicated concentrations of JAKinhibitor (unfilled circles) for 5 hrs at 37 C, loaded with detector dye for 2.5 hrs at ambienttemperature, and fluorescence measured. The measured AC50s of IL-6 and JAK inhibitor were38 pM and 20 nM, respectively. B) Titration-response data for actives (red) and inactive (blue)samples from the qHTS. C) Signal to background ratio (S/B, filled circles) and Z′ factor(unfilled circles) are shown for each plate of the qHTS.
Johnson et al. Page 14
Mol Biosyst. Author manuscript; available in PMC 2010 August 1.
NIH
-PA Author Manuscript
NIH
-PA Author Manuscript
NIH
-PA Author Manuscript

Fig. 2. Determination of SIE-bla activesTitration-response plots for 460 (upper graphs) or Ratio determinations (lower graphs) forcompounds scored active in the 460 (left) or Ratio determinations (center), or originally scoredinactive (right). Light blue planes indicate the threshold of activity, 30% above or belowAC50 IL-6 stimulation. Dark blue lines indicate the curve fit of activity data (black) for eachsample. Outlier data points (light grey) were masked and excluded from the curve-fitdeterminations.
Johnson et al. Page 15
Mol Biosyst. Author manuscript; available in PMC 2010 August 1.
NIH
-PA Author Manuscript
NIH
-PA Author Manuscript
NIH
-PA Author Manuscript

Fig. 3. Titration-response plots of SIE-bla qHTS activesTitration-response plots for Class 1 (A, D), Class 2 (B, E), and Class 3 (C, F) activators (A–C) and inhibitors (D–F) from the SIE-bla qHTS are shown. Blue lines indicate the curve fit ofactivity data (black) for each sample. Outlier data points (light grey) were masked and excludedfrom the curve-fit determinations.
Johnson et al. Page 16
Mol Biosyst. Author manuscript; available in PMC 2010 August 1.
NIH
-PA Author Manuscript
NIH
-PA Author Manuscript
NIH
-PA Author Manuscript

Johnson et al. Page 17
Mol Biosyst. Author manuscript; available in PMC 2010 August 1.
NIH
-PA Author Manuscript
NIH
-PA Author Manuscript
NIH
-PA Author Manuscript

Fig. 4. Structural classes of SIE-bla activesScaffolds for series of SIE-bla activators (A) and inhibitors (B) are shown. Grey shadingindicate series that are likely fluorescent artifacts as detected by activity in parental cells lackingthe beta-lactamase reporter.
Johnson et al. Page 18
Mol Biosyst. Author manuscript; available in PMC 2010 August 1.
NIH
-PA Author Manuscript
NIH
-PA Author Manuscript
NIH
-PA Author Manuscript

Fig. 5. Comparison of qHTS and follow up potenciesShown is a correlation plot of qHTS and follow up Log AC50s of confirmed actives (filledcircles) excluding two outliers (unfilled circles) marked 1 and 2 (top panel). The solid lineindicates the fit calculated using linear regression while the dashed line indicates the axis ofcomplete correlation. Graphs 1 and 2 (middle and bottom panels) indicate outlier compoundswhere inappropriate masking of qHTS data (circled filled squares) caused incorrect curve-fitsof higher potencies compared to the follow up data (unfilled circles). Grey symbols are maskeddata excluded from the curve-fits.
Johnson et al. Page 19
Mol Biosyst. Author manuscript; available in PMC 2010 August 1.
NIH
-PA Author Manuscript
NIH
-PA Author Manuscript
NIH
-PA Author Manuscript

Fig. 6. Titration response curves of qHTS actives scored as inactive at the 7.7 uM concentrationShown are fitted titration response curves (dark blue lines) of the qHTS actives (black filledcircles) indicated as inactive using the 7.7 uM data (light blue filled circles) and a 3 σ activitythreshold of 40% (red bars). Grey symbols are masked data excluded from the curve-fits.
Johnson et al. Page 20
Mol Biosyst. Author manuscript; available in PMC 2010 August 1.
NIH
-PA Author Manuscript
NIH
-PA Author Manuscript
NIH
-PA Author Manuscript

NIH
-PA Author Manuscript
NIH
-PA Author Manuscript
NIH
-PA Author Manuscript
Johnson et al. Page 21
Table 1qHTS protocol for SIE-bla, AP-1-bla and HRE-bla assays.
Step Parameter Value Description
1 Reagent 5 uL Cells
2 Incubation 18 hrs Cells adhere and acclimate
3 Library Compounds 23 nL 17 uM to 0.4 nM titration series
4 Reagent 1 uL Medium +/− agonist +/− inhibitor
5 Incubation 5 hrs Induce SIE reporter
6 Reagent 1 uL Beta lactamase detection mix
7 Incubation 2.5 hrs Cells load and cleave dye
8 Assay Readout 405/8 nm EnVision
Notes
1 Black clear bottom plates, single tip dispense of 2500 (AP-1-bla and HRE-bla) or 3000 cells/well (SIE-bla) into all wells
2 37°C, 5% CO2 incubator
3 Pintool transfer of library to columns 5–48
4 Single tip dispense for each reagent, Column 1, AC90 of agonist- 100 uM CoCl2 (HRE-bla), 160 pM EGF (AP1-bla), 300 pM IL-6 (SIE-bla). Column2, AC50 of agonist alone or with AC90 of inhibitor: 50 uM CoCl2 (HRE-bla), 30 pM EGF plus 100 nM PD153035 (AP1-bla), 40 pM IL-6 plus 125 nMpan JAK inhibitor (SIE-bla). Column 3, Medium only. Columns 4 to 48, AC50 of agonist: 50 uM CoCl2 (HRE-bla), 30 pM EGF (AP1-bla), 40 pM IL-6(SIE-bla)
5 37°C, 5% CO2 incubator
6 Single tip dispense of 0.6 uM CCF4-AM, 1 mg/ml Pluronic F127 surfactant, 3.5 % PEG 400, 2.6 % TR40, 2 mM probenecid, 0.1 % DMSO
7 Ambient temperature in the dark
8 460/25 nm and 530/20 nm emission filters
Mol Biosyst. Author manuscript; available in PMC 2010 August 1.

NIH
-PA Author Manuscript
NIH
-PA Author Manuscript
NIH
-PA Author Manuscript
Johnson et al. Page 22Ta
ble
2C
urve
cla
ss d
istri
butio
n of
qH
TS a
ctiv
es id
entif
ied
by 4
60 a
nd ra
tiom
etric
det
erm
inat
ions
.
Cla
ss46
0 &
Rat
io A
ctiv
e46
0 O
nly
Act
ive
Rat
io O
nly
Act
ive
Rec
over
ed In
activ
eT
otal
Inhi
bito
r
322
579
5667
427
2.2
116
2612
154
2.1
302
32
1.2
324
137
1.1
3434
Act
ivat
or
1.1
2121
1.2
211
426
2.1
138
113
9
2.2
8531
512
1
320
567
4225
339
Tota
l90
721
112
092
1330
Mol Biosyst. Author manuscript; available in PMC 2010 August 1.

NIH
-PA Author Manuscript
NIH
-PA Author Manuscript
NIH
-PA Author Manuscript
Johnson et al. Page 23Ta
ble
3Po
tenc
y an
d cu
rve
clas
s of q
HTS
act
ives
.
Cur
ve C
lass
AC
50 (u
M)
Act
ivity
1.1
1.2
2.1
2.2
3T
otal
<0.1
Act
ivat
or0
20
111
14
Inhi
bito
r0
31
418
26
>0.1
to 1
Act
ivat
or17
174
1698
152
Inhi
bito
r14
61
1264
97
>1 to
10
Act
ivat
or4
713
410
420
645
5
Inhi
bito
r20
2830
138
302
518
>10
to 1
00A
ctiv
ator
00
10
2425
Inhi
bito
r0
00
043
43
Subt
otal
Act
ivat
or21
2613
912
133
964
6
% li
brar
y0.
2%0.
2%1.
2%1.
0%2.
9%5.
5%
Inhi
bito
r34
3732
154
427
684
% li
brar
y0.
3%0.
3%0.
3%1.
3%3.
7%5.
8%
Tota
l55
6317
127
576
613
30
% li
brar
y0.
5%0.
5%1.
5%2.
4%6.
6%11
%
Mol Biosyst. Author manuscript; available in PMC 2010 August 1.

NIH
-PA Author Manuscript
NIH
-PA Author Manuscript
NIH
-PA Author Manuscript
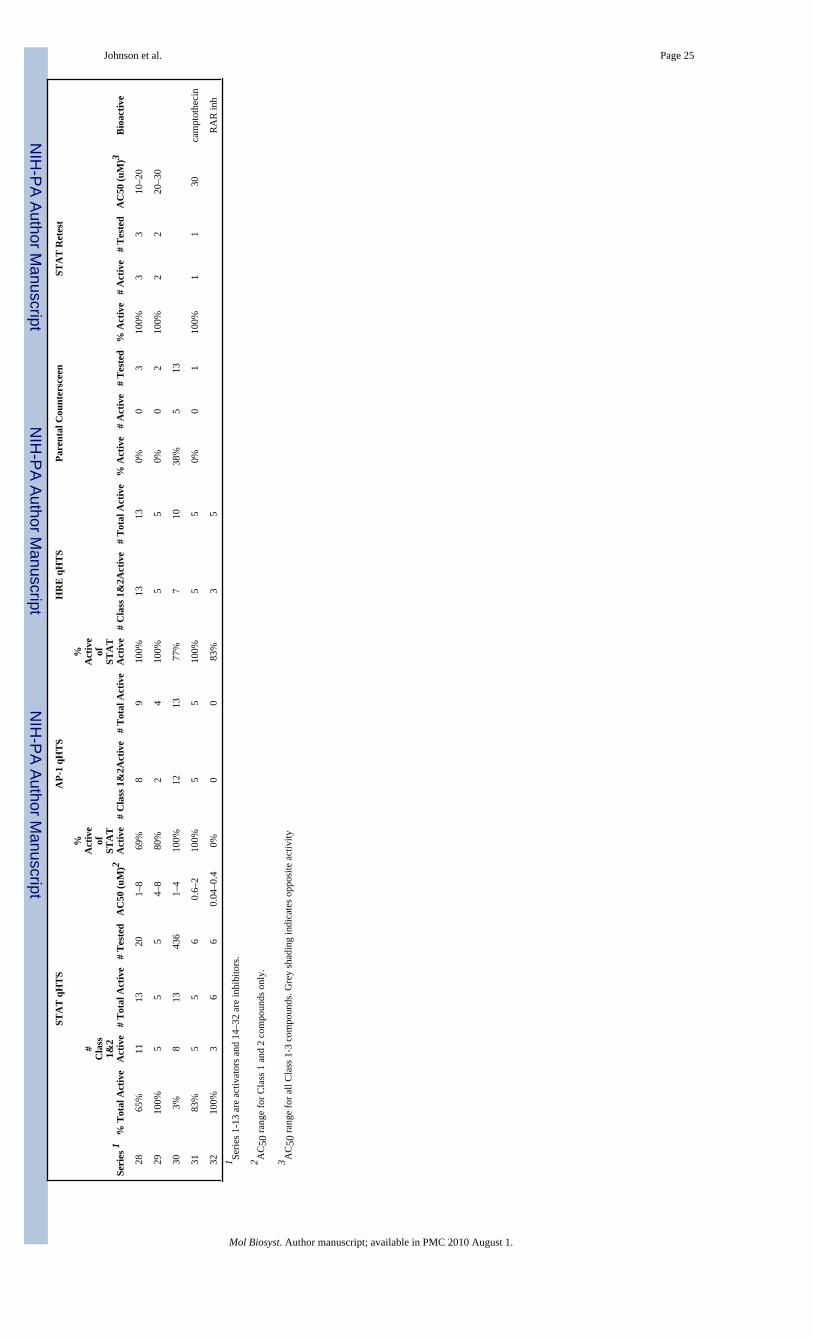
Johnson et al. Page 24Ta
ble
4C
urve
cla
ss a
nd p
oten
cies
of S
TAT
SAR
serie
s for
qH
TS a
nd fo
llow
-up
stud
ies.
STA
T q
HT
SA
P-1
qHT
SH
RE
qH
TS
Pare
ntal
Cou
nter
scee
nST
AT
Ret
est
Seri
es 1
% T
otal
Act
ive
#C
lass
1&2
Act
ive
# T
otal
Act
ive
# T
este
dA
C50
(uM
)2
%A
ctiv
eof
STA
TA
ctiv
e#
Cla
ss 1
&2A
ctiv
e#
Tot
al A
ctiv
e
%A
ctiv
eof
STA
TA
ctiv
e#
Cla
ss 1
&2A
ctiv
e#
Tot
al A
ctiv
e%
Act
ive
# A
ctiv
e#
Tes
ted
% A
ctiv
e#
Act
ive
# T
este
dA
C50
(uM
)3B
ioac
tive
114
%3
858
3–4
75%
46
50%
34
0%0
410
0%4
45–
30ad
enos
ine
220
%7
2914
20.
01–1
17%
15
17%
35
17%
529
326
%5
935
3–6
44%
34
67%
56
25%
14
100%
44
6–40
423
%3
313
4–10
33%
11
100%
33
100%
33
100%
33
10–2
0
521
%5
733
1–10
57%
44
57%
24
25%
14
100%
44
4–20
69%
37
740.
1–3
0%0
00%
10
14%
17
710
%2
548
0.2–
0.3
0%0
00%
00
0%0
5
838
%21
933
588
70.
03–4
83%
226
277
73%
225
245
96%
322
335
924
%4
417
6–10
100%
44
100%
44
1063
%5
58
1–6
80%
14
60%
33
40%
25
100%
55
3–10
ellip
ticin
e
1150
%4
816
2–7
50%
04
75%
36
63%
58
1210
0%3
33
5–10
100%
33
33%
01
100%
11
100%
11
30
1378
%7
79
2–5
57%
34
100%
67
0%0
510
0%5
53–
10do
xo/d
auno
1410
0%2
22
0.6–
350
%0
110
0%1
2pr
otea
se in
h
1510
0%2
22
4–8
100%
22
100%
22
0%0
210
0%2
25–
6C
DK
inh
1610
0%2
22
410
0%1
210
0%2
20%
01
100%
11
10pi
perlo
ngum
ine
1756
%3
59
320
%0
160
%1
3
1813
%26
6850
90.
3–9
50%
1834
56%
2538
8%5
6110
0%1
120
1910
0%2
22
4–8
100%
22
50%
11
2010
0%5
55
0.2–
110
0%5
510
0%5
50%
02
50%
12
0.6
emet
ine
2167
%3
69
0.09
–10%
00
83%
55
ouab
ain
2245
%3
511
3–10
40%
22
60%
33
0%0
110
0%1
16
men
adio
ne
2336
%11
2466
1–10
83%
1020
46%
611
0%0
110
0%1
110
PK in
h
2410
0%4
44
30%
00
0%0
00%
01
100%
11
10
2550
%3
48
1–10
50%
02
100%
24
2610
0%5
1010
0.1–
360
%1
610
0%5
10
2767
%3
46
8–10
50%
22
50%
12
0%0
110
0%1
120
Mol Biosyst. Author manuscript; available in PMC 2010 August 1.
NIH
-PA Author Manuscript
NIH
-PA Author Manuscript
NIH
-PA Author Manuscript
Johnson et al. Page 25ST
AT
qH
TS
AP-
1 qH
TS
HR
E q
HT
SPa
rent
al C
ount
ersc
een
STA
T R
etes
t
Seri
es 1
% T
otal
Act
ive
#C
lass
1&2
Act
ive
# T
otal
Act
ive
# T
este
dA
C50
(uM
)2
%A
ctiv
eof
STA
TA
ctiv
e#
Cla
ss 1
&2A
ctiv
e#
Tot
al A
ctiv
e
%A
ctiv
eof
STA
TA
ctiv
e#
Cla
ss 1
&2A
ctiv
e#
Tot
al A
ctiv
e%
Act
ive
# A
ctiv
e#
Tes
ted
% A
ctiv
e#
Act
ive
# T
este
dA
C50
(uM
)3B
ioac
tive
2865
%11
1320
1–8
69%
89
100%
1313
0%0
310
0%3
310
–20
2910
0%5
55
4–8
80%
24
100%
55
0%0
210
0%2
220
–30
303%
813
436
1–4
100%
1213
77%
710
38%
513
3183
%5
56
0.6–
210
0%5
510
0%5
50%
01
100%
11
30ca
mpt
othe
cin
3210
0%3
66
0.04
–0.4
0%0
083
%3
5R
AR
inh
1 Serie
s 1-1
3 ar
e ac
tivat
ors a
nd 1
4–32
are
inhi
bito
rs.
2 AC
50 ra
nge
for C
lass
1 a
nd 2
com
poun
ds o
nly.
3 AC
50 ra
nge
for a
ll C
lass
1-3
com
poun
ds. G
rey
shad
ing
indi
cate
s opp
osite
act
ivity
Mol Biosyst. Author manuscript; available in PMC 2010 August 1.
NIH
-PA Author Manuscript
NIH
-PA Author Manuscript
NIH
-PA Author Manuscript
Johnson et al. Page 26Ta
ble
5A
ctiv
es Id
entif
ied
at a
Sin
gle
Con
cent
ratio
n an
d 3 σ
Thre
shol
d C
ompa
red
to q
HTS
Cla
ss 1
and
2 A
ctiv
es
uMT
otal
Pos
itive
sC
orre
late
d Po
sitiv
es1
Fals
e N
egat
ives
% F
alse
Neg
ativ
es2
Fals
e Po
sitiv
es%
Fal
se P
ositi
ves3
1.5
180
162
403
71%
1810
%
7.7
365
363
201
36%
21%
1713
813
774
35%
11%
1 Posi
tives
iden
tifie
d bo
th b
y qH
TS a
nd a
t ind
icat
ed c
once
ntra
tion.
2 Perc
enta
ge o
f qH
TS p
ositi
ves s
core
d as
inac
tive
at in
dica
ted
conc
entra
tion.
3 Perc
enta
ge o
f tot
al p
ositi
ves i
dent
ified
at t
he in
dica
ted
conc
entra
tion
that
wer
e qH
TS in
activ
es.
Mol Biosyst. Author manuscript; available in PMC 2010 August 1.